
Table of Contents
THE 1927 issue of the “New Zealand Official Year-book“ represents the thirty-fifth number of the volume, and the sixth of the present royal octavo series. The current issue will be found to maintain the consistent improvement and expansion of each issue over its immediate predecessor which has been a feature of the Year-book since the present series was instituted, and which is also a reflex of the continued extension of the activities of the Census and Statistics Office.
The growth of the Year-book will be realized from the following figures showing the number of pages in recent issues:—
| 1921–22 | 616 |
| 1923 | 695 |
| 1924 | 782 |
| 1925 | 896 |
| 1926 | 989 |
| 1927 | 1,056 |
The present issue contains three more sections than the 1926 number. The new section on Roads incorporates the article on Main Highways which has hitherto appeared in the Miscellaneous section; a section has been devoted to Legislation specially affecting Labour; and the former Wealth and Income section has been largely extended, and has been divided into two sections. The new Wealth section not only deals with Private Wealth, but also contains such information as is available concerning Public Wealth, together with figures re Value of Land Holdings as compiled from the returns of land furnished annually to the Commissioner of Taxes.
A special article by Mr. L. S. Polden, A.I.A., of the Government Actuary's Department, gives the results of a recent actuarial investigation by himself into the Dominion's mortality rates; while a reprint of Mr. J. C. Andersen's article on the Mission of the “Britomart“ at Akaroa in 1840 should help to remove the misconception which still clings to this early event in the history of New Zealand.
In addition to the new sections, several other sections contain considerable additional matter, while the subsections dealing with State Indebtedness and with Hospitals and Charitable Institutions have been almost entirely rewritten. All statistical, legislative, and other matter has been brought up to date, and the early prorogation of Parliament has enabled a synopsis of the legislation of the 1926 session to be included in this issue.
MALCOLM FRASER,
Government Statistician.
Census and Statistics Office,
Wellington, 15th December, 1926.
Table of Contents
THE Dominion, of New Zealand consists of two large and several small islands in the South Pacific. These may be classified as follows:—
Islands forming the Dominion proper, for statistical and general practical purposes:—
North Island and adjacent islets.
South Island and adjacent islets.
Stewart Island and adjacent islets.
Chatham Islands.
Outlying islands included within the geographical boundaries of New Zealand as proclaimed in 1847:—
Three Kings Islands.
Auckland Islands.
Campbell Island.
Antipodes Islands.
Bounty Islands.
Snares Islands.
Islands annexed to New Zealand:—
Kermadec Islands.
Cook Islands.
Niue (or Savage) Island.
Palmerston Island.
Penrhyn (or Tongareva) Island.
Manahiki Island.
Rakaanga Island.
Pukapuka (or Danger) Island.
Nassau Island.
Suwarrow Island.
The Proclamation of British sovereignty over New Zealand, dated the 30th January, 1840, gave as the boundaries of what was then the colony the following degrees of latitude and longitude: On the north, 34° 30' S. lat.; on the south, 47° 10' S. lat.; on the east, 179° 0' F. long.; on the west, 166° 5' E. long. These limits excluded small portions of the extreme north of the North Island and of the extreme south of Stewart Island
In April, 1842, by Royal Letters Patent, and again by the Imperial Act 26 and 27 Vict., c. 23 (1863), the boundaries were altered so as to extend from 33° to 53° of south latitude and from 162° of east longitude to 173° of west longitude. By Proclamation bearing date the 21st July, 1887, the Kermadec Islands, lying between the 29th and 32nd degrees of south latitude and the 177th and 180th degrees of west longitude, were declared to be annexed to and to become part of the then Colony of New Zealand.
By Proclamation bearing date the 10th June, 1901, the Cook Group of islands, and all the other islands and territories situate within the boundary-lines mentioned in the following schedule, were included as from the 11th June, 1901:—
A line commencing at a point at the intersection of the 23rd degree of south latitude and the 156th degree of longitude west of Greenwich, and proceeding due north to the point of intersection of the 8th degree of south latitude and the 156th degree of longitude west of Greenwich; thence due west to the point of intersection of the 1—Ybk. 8th degree of south latitude and the 167th degree of longitude west of Greenwich; thence due south to the point of intersection of the 17th degree of south latitude and the 167th degree of longitude west of Greenwich; thence due west to the point of intersection of the 17th degree of south latitude and the 170th degree of longitude west of Greenwich; thence due south to the point of intersection of the 23rd degree of south latitude and the 170th degree of longitude west of Greenwich; and thence due east to the point of intersection of the 23rd degree of south latitude and the 156th degree of longitude west of Greenwich.
By mandate of the League of Nations the New Zealand Government also now administers the former German possession of Western Samoa; and, jointly with the Imperial Government and the Government of Australia, holds the League's mandate over the Island of Nauru.
By Imperial Order in Council of the 30th July, 1923, the coasts of the Ross Sea, with the adjacent islands and territories, were declared a British settlement within the meaning of the British Settlements Act, 1887, and named the Ross Dependency. The Governor-General of New Zealand is Governor of the Ross Dependency, and is vested with the administration of the dependency.
By Imperial Orders in Council of the 4th November, 1925, the Union Islands (consisting of the islands of Fakaofu, Nukunono, and Atafu, and the small islands, islets, rocks, and reefs depending on them) were excluded from the Gilbert and Ellice Islands Colony, and placed under the administration of the Governor-General of New Zealand. In accordance with a provision of the second of these Orders in Council, the Governor - General's authority and powers in connection with the administration of the islands were, by New Zealand Order in Council of the 8th March, 1926, delegated to the Administrator of Western Samoa.
The total area of the Dominion of New Zealand, which does not include the territories administered under mandate, the Ross Dependency, and the Union Islands, is 103,862 square miles. The areas of the principal islands are as follows:—
| Square Miles. | |
|---|---|
| North Island and adjacent islets | 44,131 |
| South Island and adjacent islets | 58,120 |
| Stewart Island and adjacent islets | 662 |
| Chatham Islands | 372 |
| Total Dominion proper | 103,285 |
| “Outlying” islands | 284 |
| “Annexed” islands | 293 |
| Grand total | 103,862 |
The mountainous character of New Zealand is one of its most striking physical characteristics. In the North Island mountains occupy approximately one-tenth of the surface; but, with the exception of the four volcanic peaks of Egmont (8,260 ft.), Ruapehu (9,175 ft.), Ngauruhoe (7,515 ft.), and Tongariro (6,458 ft.), they do not exceed an altitude of 6,000 ft. Of these four volcanoes only the first-named can be classed as extinct. Other dormant volcanoes include Mount Tarawera and White Island, both of which have, in recent years, erupted with disastrous consequences. Closely connected with the volcanic system are the multitudinous hot springs and geysers.
The South Island contains much more mountainous country than is to be found in the North. Along almost its entire length runs the mighty chain known as the Southern Alps, rising to its culmination in Mount Cook (12,349 ft.). No fewer than sixteen peaks of the Southern Alps attain a height of over 10,000 ft. Owing to the snow-line being low in New Zealand, many large and beautiful glaciers exist. The Tasman Glacier (Southern Alps), which has a total length of over eighteen miles and an average width of one mile and a quarter, is the largest. On the west coast the terminal face of the Franz Josef Glacier is but a few hundred feet above sea-level.
The following list of named peaks over 7,000 ft. in height has been compiled from various sources. It does not purport to cover all such peaks, nor is exactitude claimed in respect of the elevations shown, many of which are known to be only approximate.
| Mountain or Peak. | Height (Feet). |
|---|---|
| * Not available. | |
| North Island— | |
| Ruapehu | 9,175 |
| Egmont | 8,260 |
| Ngauruhoe | 7,515 |
| Kaikoura Ranges— | |
| Tapuaenuku | 9,460 |
| Kaitarau | 8,700 |
| Mitre Peak | 8,532 |
| Whakari | 8,500 |
| St. Bernard | 7,416 |
| Dillon | 7,132 |
| St. Arnaud Range— | |
| Travers | 7,666 |
| Spenser Range— | |
| Franklyn | 7,671 |
| Una | 7,540 |
| Ella | 7,438 |
| Faerie Queen | 7,332 |
| Paske | 7,260 |
| Humboldt | 7,240 |
| Dora | 7,100 |
| Southern Alps— | |
| Cook | 12,349 |
| Tasman | 11,475 |
| Dampier | 11,287 |
| Silberhorn | 10,757 |
| Lendenfeldt | 10,456 |
| David's Dome | 10,443 |
| Malte Brun | 10,421 |
| Teiohelmann | 10,370 |
| Sefton | 10,354 |
| Haast | 10,294 |
| Elie de Beaumont | 10,200 |
| Douglas Peak | 10,107 |
| La Perouse | 10,101 |
| Haidinger | 10,059 |
| De la Beche | 10,058 |
| The Minarets | 10,058 |
| Aspiring | 9,975 |
| Hamilton | 9,915 |
| Glacier Peak | 9,865 |
| Grey Peak | 9,800 |
| Aiguilles Rouges | 9,731 |
| Nazomi | 9,716 |
| Darwin | 9,715 |
| Chudleigh | 9,686 |
| Annan | 9,667 |
| Low | 9,653 |
| Haeckel | 9,649 |
| Goldsmith | 9,532 |
| Conway Peak | 9,519 |
| Walter | 9,507 |
| Green | 9,305 |
| D'Archiac | 9,279 |
| Hochstetter Dome | 9,258 |
| Earnslaw | 9,250 |
| Hutton | 9,200 |
| Nathan | 9,200 |
| Sibbald | 9,180 |
| Arrowsmith | 9,171 |
| Bristol Top | 9,167 |
| Spencer | 9,167 |
| The Footstool | 9,073 |
| Rudolf | 9,039 |
| The Dwarf | 9,025 |
| Burns | 8,984 |
| Nun's Veil | 8,975 |
| Bell Peak | 8,950 |
| Johnson | 8,858 |
| Aylmer | 8,819 |
| Hopkins | 8,800 |
| Brodrick | 8,777 |
| Priest's Cap | 8,761 |
| Halcombe | 8,743 |
| Aurora Peak | 8,733 |
| Meeson | 8,704 |
| Meteor Peak | 8,701 |
| Mannering | 8,700 |
| Ward | 8,681 |
| Brunner | 8,678 |
| Jervois | 8,675 |
| Couloir Peak | 8,675 |
| Whitcombe | 8,656 |
| Sealy | 8,651 |
| Moffatt | 8,647 |
| Thomson | 8,646 |
| Hooker | 8,644 |
| Vampire Peak | 8,600 |
| Aigrette Peak | 8,594 |
| Dilemma Peak | 8,592 |
| Evans | 8,580 |
| Bismarck | 8,575 |
| Glenmary | 8,524 |
| Isabel | 8,518 |
| Dechen | 8,500 |
| Loughnan | 8,495 |
| Pibrac | 8,472 |
| Wolseley | 8,438 |
| Unicorn Peak | 8,394 |
| Forbes | 8,385 |
| Anderegg | 8,360 |
| Strachan | 8,359 |
| Beatrice | 8,350 |
| Jackson | 8,349 |
| Maunga Ma | 8,335 |
| Livingstone | 8,334 |
| Baker Peak | 8,330 |
| Bannie | 8,300 |
| Eagle Peak | 8,300 |
| Conrad | 8,300 |
| Richmond | 8,300 |
| Acland | 8,294 |
| Jukes | 8,289 |
| Darby | 8,287 |
| Centaur | 8,284 |
| Tyndall | 8,282 |
| Macfarlane | 8,278 |
| Victoire | 8,269 |
| Alba | 8,268 |
| Coronet Peak | 8,265 |
| Percy Smith | 8,254 |
| Williams | 8,249 |
| Roberts | 8,239 |
| Malcolm Peak | 8,236 |
| Cumine | 8,223 |
| Huxley | 8,201 |
| Kim | 8,200 |
| Drummond | 8,197 |
| McClure | 8,192 |
| Blair Peak | 8,185 |
| Huss | 8,165 |
| Louper Peak | 8,165 |
| The Anthill | 8,160 |
| Ansted | 8,157 |
| Dennistoun | 8,150 |
| Dun Fiunary | 8,147 |
| Tyndall | 8,116 |
| Fettes | 8,092 |
| Trent | 8,076 |
| King | 8,064 |
| Glacier Dome | 8,047 |
| Humphries | 8,028 |
| Lucia | 8,015 |
| Graceful Peak | 8,000 |
| Lean Peak | 8,000 |
| Raureka Peak | 8,000 |
| Fletcher | 7,995 |
| Farrar | 7,982 |
| Radove | 7,914 |
| Cooper | 7,897 |
| Ramsay | 7,880 |
| Frances | 7,876 |
| Cloudy Peak | 7,870 |
| Observation Peak | 7,862 |
| Cadogan Peak | 7,850 |
| Blackburn | 7,835 |
| Strauchon | 7,815 |
| Da Faur Peak | 7,800 |
| Turret Peak | 7,800 |
| Dobson | 7,799 |
| Westland | 7,762 |
| Dark | 7,753 |
| Hulka | 7,721 |
| Copland | 7,695 |
| Park Dome | 7,688 |
| Turner's Peak | 7,679 |
| Edison | 7,669 |
| Petermann | 7,664 |
| Montgomery | 7,661 |
| St. Mary | 7,656 |
| Fraser | 7,654 |
| Taylor | 7,641 |
| Sibyl Peak | 7,625 |
| Edith Peak | 7,600 |
| Madonna Peak | 7,600 |
| McKenzie | 7,563 |
| Onslow | 7,561 |
| Novara Peak | 7,542 |
| Proud Peak | 7,540 |
| Nicholson | 7,500 |
| Pyramus | 7,500 |
| Howitt | 7,490 |
| Erebus | 7,488 |
| Eros | 7,452 |
| Rolleston | 7,447 |
| Turnbull | 7,400 |
| Annette | 7,351 |
| Neave | 7,350 |
| Roon | 7,344 |
| Maitland | 7,291 |
| Adams | 7,247 |
| Jollie | 7,232 |
| Enys | 7,202 |
| Potts | 7,197 |
| German | 7,184 |
| Hutt | 7,180 |
| Kinkel | 7,121 |
| Marshman | 7,116 |
| Murray | 7,065 |
| Artist Dome | 7,061 |
| McFettrick Peak | 7,061 |
| Beaumont | 7,035 |
| Ballance | 7,008 |
| Burnett | 7,003 |
| Spence | * |
| Two Thumbs Range— | |
| Thumbs | 8,338 |
| Alma | 8,204 |
| Fox | 7,604 |
| Musgrave | 7,379 |
| Chevalier | 7,339 |
| Sinclair | 7,022 |
| Darran Range— | |
| Tutoko | 9,042 |
| Christina | 8,675 |
| Barrier Range— | |
| Edward | 8,459 |
| Pollux | 8,341 |
| Brewster | 8,264 |
| Castor | 8,256 |
| Liverpool | 8,040 |
| Islington | 7,700 |
| Goethe | 7,680 |
| Cosmos | 7,640 |
| Oblong Peak | 7,600 |
| Somnus | 7,599 |
| Joffre | 7,500 |
| French | 7,400 |
| Head | 7,400 |
| Moira | 7,300 |
| Clarke | 7,300 |
| Plunket | 7,220 |
| Ark | 7,190 |
| Balloon | * |
| The Remarkables— | |
| Double Cone | 7,688 |
| Ben Nevis | 7,650 |
The nos springs of the North Island form one of the most remarkable features of New Zealand. They are found over a large area, extending from Tongariro, south of Lake Taupo, to Ohaeawai, in the extreme north—a distance of some three hundred miles; but the principal seat of hydrothermal action appears to be in the neighbourhood of Lake Rotorua, about forty miles north-north-east from Lake Taupo. By the destruction of the famed Pink and White Terraces at Lake Rotomahana during the eruption of Mount Tarawera on the 10th June, 1886, the neighbourhood was deprived of attractions unique in character and of unrivalled beauty; but the natural features of the country—the numerous lakes, geysers, and hot springs, some of which possess remarkable curative properties in certain complaints—are still very attractive to tourists and invalids. The vast importance of conserving this region as a sanatorium for all time has been recognized by the Government, and it is dedicated by Act of Parliament to that purpose.
There are also several small hot springs in the South Island, the best-known being those at Hanmer.
The following article on the mineral waters and spas of New Zealand is by the Government Balneologist, Dr. J. D, C. Duncan, M.B., Ch.B. (Edin.), Member of the International Society of Medical Hydrology, Fellow of the Royal Society of Medicine, and Fellow of the Royal Geographical Society:—
It has been acknowledged by the leading hydrologists in Europe that New Zealand possesses the most valuable mineral waters in existence. Not only are these mineral waters interesting from a tourist's point of view, but they are, because of their medicinal value, of great therapeutic importance, and, as a Dominion asset, worthy of the deepest scientific consideration.
From the spectacular aspect only a brief mention need be made in this article, as a full description of springs, geysers, and mud-pools has been given in Dr. Herbert's book, “The Hot Springs of New Zealand”—a book that presents a comprehensive and vivid picture of the main manifestations of thermal activity in New Zealand.
Dealing with the medical-scientific aspect of the mineral waters, the space of this article will permit only the shortest account of the treatments; and, as the Rotorua Spa is of premier importance, the article will be confined almost entirely to its operations.
Since and as the result of experience gained during the war the subject of hydrotherapy has been recreated on modern scientific lines, and the actions of thermal mineral waters have been investigated, both chemically and physiologically, in determining their therapeutic value in the treatment of disease.
The mineral waters which have been harnessed for therapeutic use at the Rotorua Spa are of two main varieties—viz., the “Rachel,” which is an alkaline, sulphuretted water, emollient to the skin, and sedative in reaction; and the “Priest,” or free-acid water, which, due to the presence of free sulphuric acid, is mainly stimulating and tonic in reaction. There is, in addition to the foregoing, a valuable silicious mud similar to that found in Pistany, in Czecho-Slovakia, which, in its own sphere in hydrotherapy, exerts its influence as a curative agent.
However, it is in the “Priest” waters that one finds one's most valuable ally in the treatment of arthritis, fibrositis (the so-called rheumatic affections), and cases of nervous debility. The “Rachel” and mud baths are used mostly in those cases of fibrositis where the condition requires a softening effect; and in the types where pain is a manifest symptom these baths are invaluable as soothing and sedative agents.
In these natural acid baths the reactions are mainly stimulating, with increased hyperæmia in the parts submerged, and marked lessening of pain and swelling in the affected joints and tissues. Those waters containing free carbonic-acid gas are used for the cases of fibrositis in which the circulation requires the stimulating action of gaseous baths.
The “New Priest” waters, containing approximately 16.80 grains per gallon of free sulphuric acid, are utilized in the form of open pools, deep step-down baths, and slipper baths. They are prescribed at a suitable temperature for the individual case.
The “Old Priest” waters, containing a much lower degree of free acid (3.77 grains to the gallon), and of varying temperatures (from 84° F. to 102° F.), are used for treatment at their source. The waters, percolating through their pumice - bed, are confined in pools, and contain free carbonic-acid gas bubbling through the water.
The very strong “Postmaster” waters are also confined within pools on the natural pumice - bed, and, by a primitive arrangement of wooden sluice-valves, maintained at three ranges of temperature—viz., 104°, 106°, and 108° P. They contain 22.29 grains of free sulphuric acid to the gallon, and are strongly counter-irritant in their reactions.
In such a brief account as this one can only deal in generalizations, and the forms of treatment mentioned must necessarily be subject to wide variations. In any form of hydro-therapeutic treatment the regime must be adapted to the individual manifestations of the disease, and no routine rules or regulations can be laid down in spa operations.
The “New Priest” waters are, for the most part, prescribed for patients suffering from subacute or chronic fibrositis, subacute or chronic gout, and the various forms of arthritis. Except in cases of marked debility, those patients are given graduated baths, at temperatures ranging from 102° to 104° F., from ten to fifteen minutes daily. Most of the baths are fitted with a subaqueous douche having a pressure of 25 lb., which is directed under water on the affected tissues. The bath is usually followed by a light or hot pack, according to the needs of the case.
The subthermal “Old Priest” waters (temperature 84° F.), containing a high degree of free carbonic-acid gas, are particularly valuable in the treatment of functional nervous disease, and the methods of administration are similar to those obtaining at Nauheim. The reactions are markedly stimulating through the sympathetic nervous system, and bring about, by reflex action, a tonic effect on the heart.
The “Postmaster” baths are used in the treatment of the more chronic forms of fibrositis, arthritis deformans, and gout, requiring a more or less heroic type of procedure. They are usually prescribed in combination—i.e., a certain time in each pool, commencing with the lowest temperature. The hyperæmic reaction is most marked, and in many of the cases where pain is a predominant symptom there is a temporary paralysis of the surface nerves, as well as a strong reflex excitation of the heart. For this reason these baths are not given to patients suffering from cardiac weakness.
The mud baths being highly impregnated with silica, which has a bland, sedative effect on the tissues, are particularly indicated in cases of acute or subacute neuritis, gout, and certain skin conditions. The action of these baths is to induce an active hyperæmia in the patient with an actual absorption of free sulphur, which is present in considerable quantity. Also, the radio-activity of this medium (0.185 per c.c.) is possibly an active factor in the therapeutic action of these baths. In some of the cases undergoing mud-bath treatment the effect has been almost miraculous—instant relief from pain; reduction of swelling caused by inflammatory exudates—and such patients have been able to discard crutches or other adventitious aids and walk with more or less normal comfort.
Perhaps, of more recent date, the most efficacious effects of mud treatments have been manifested in cases of skin conditions—notably psoriasis: cases which have resisted all forms of drug treatment have cleared up in an almost magical manner; and so frequently have such cures been effected that one believes that the silicious mud of Rotorua has some markedly specific action as a therapeutic agent.
The treatment of gout depends entirely on the individual manifestations. In certain subacute and chronic types fairly high temperatures (104° to 106° F., with hot packs) of “Priest” water are employed, in order to hasten the absorption of exudates and the elimination of uric acid. In acute cases of acute gout more sedative measures are pursued, such as “Rachel” baths at neutral temperatures, local mud packs, and rest. As soon as the conditions permit, these patients are changed over to acid water baths. Cases of chronic gout exhibiting metabolic stagnation sometimes receive considerable benefit from the counter-irritant effects of the strongly acid “Postmaster” waters.
Separate establishments, containing the most modern apparatus of sprays, douches, hot steam, &c., are available for wet massage and treatments of the Aix-Vichy type.
The massage-rooms are fitted with the latest installations of electrical equipment—Bristowe tables, diathermy, high frequency, Bergonie chair, X-ray, Schnée baths, Greville hot air, and other apparatus for carrying out the most up-to-date methods of electrical-therapeutic treatments.
The baths are administered by a trained staff of attendants, and the massage, electrical-therapy, and douches carried out by a qualified staff of operators.
In every respect the hydrotherapy treatments aim at a restoration of function, and the measures employed are, for the most part, re-educative.
In connection with the Rotorua Spa is a sanatorium of seventy beds, where patients whose finances are restricted can receive treatment at an exceedingly moderate cost. The institution consists of cubicles and open wards. Thermal baths and massage-rooms in the building provide for the more helpless type of invalid.
From sixty thousand to eighty thousand baths are given annually, and an average of thirty thousand special treatments—massage, electrical therapy, &c.—is administered at the Rotorua Spa.
The usual course of treatment lasts from four to six weeks, and the high percentage of cures and improvements testifies to the value of the thermal mineral waters and the hydro-therapeutic treatments obtaining in this Dominion.
The following account of the rivers of New Zealand has been written by Professor R. Speight, M.Sc., F.G.S., Curator of the Canterbury Museum:—
In a country like New Zealand, with marked variations in topographic relief and with a plentiful and well-distributed rainfall, the rivers must necessarily form characteristic features of the landscape. Mountains, however, exert an important influence on their adaptability to the necessities of commerce, reducing their value on the one hand while increasing it on the other. Owing to the steep grades of their channels few of the rivers are fitted for navigation except near their months, but to compensate for this disability they furnish in many places ideal sites for power plants, which will in all probability be so utilized in the near future that New Zealand may become the manufacturing centre of the Southern Hemisphere. No country south of the Equator, except Chile and Patagonia, possesses such stores of energy conveniently placed, which cannot become exhausted until the sun fails to raise vapour from the neighbouring seas—a contingency to be realized only when life on the earth is becoming extinct.
The only part of the country which possesses rivers capable of being used for navigation is the North Island. The relief is not so marked as in the South, and many streams flow in deep beds, with somewhat sluggish current. There are flowing into the Tasman Sea rivers like the Waikato, Wairoa, Mokau, and Wanganui, which served the Maoris as important means of communication, and which are decidedly useful for the purposes of modern transport. The first-mentioned of these is by far the most important. Rising in the snows of Ruapehu, and receiving numerous affluents from the western slopes of the Kaimanawa Range, it pursues a northerly course for twenty miles with all the features of a mountain torrent till it enters Lake Taupo. Almost immediately on leaving this it plunges over the Huka Falls, formed by a hard ledge of volcanic rock, and then runs first north-east and then north-west till it reaches the sea, the amount of water discharged exceeding 800,000 cubic feet per minute. In certain parts of its course the valley is gorgelike in character and picturesque rapids obstruct its navigation, but in its lower reaches it widens out and flows for long distances through marshes and shallow lakes, and empties into the sea by a wide estuary, which is unfortunately blocked by a bad bar. It receives on the west a large tributary, the Waipa—itself also navigable for small steamers, and a river which may ultimately play no small part-in the development of the south-western portion of the Auckland Province.
The Northern Wairoa shows features which resemble those of the Waikato. It rises in the hilly land of the North Auckland Peninsula, and flows south as a noble-stream till it enters Kaipara Harbour, a magnificent sheet of water with many winding and far-reaching arms, but with its utility greatly discounted by the presence of a bar which, though with sufficient depth of water for vessels of mode rate size, is frequently impracticable. The total estimated discharge from the streams running into the Kaipara Harbour is about 500,000 cubic feet per minute, of which the Wairoa certainly contributes one-half.
The Mokau River, which enters the sea about sixty miles north-east of New Plymouth, is navigable for a considerable distance in its lower reaches. Here it is flanked by limestone bluffs, clad with a wealth of ferns and other native vegetation, forming one of the most picturesque rivers of the country. Higher up, as in the Waikato, there are fine falls, which may ultimately be used for power purposes owing to their proximity to one of the important agricultural districts of the North Island.
The last of the four principal navigable rivers on the west coast is the Wanganui. This river gathers its initial supplies from the western flanks of the volcanic ridge of the centre of the Island, from which numerous streams run west over the Waimarino Plain in somewhat open channels till they coalesce and form the main river. Other tributaries, such as the Tangarakau and the Maunganui-te-ao, subsequently add their quota, and the river then flows in a southerly direction in loops and windings depressed far below the level of the coastal plain, between high papa bluffs clad with rich vegetation, till it reaches the sea as a deep tidal stream, the amount of its discharge being estimated at over 500,000 cubic feet per minute. Through the greater part of its course it has a characteristic trench-like channel, with a fairly even gradient, and with only slight interruptions from rapids. At low water these are most troublesome, but at times of high river-level they are passed without serious difficulty. This fine stream affords communication into a country difficult of access by road or railway, and it may be taken as typical of other smaller streams to the west, such as the Waitotara, the Patea, and the Waitara, which are navigable to a less extent, principally owing to the obstructions of timber in their channels; while the rivers lying more to the east and with courses parallel to the Wanganui—e.g., the Rangitikei and the Wangaehu—are more rapid and have little adaptability to the needs of transport. Further east still, in the neighbourhood of the Ruahine Mountains, the rivers become true mountain torrents, with steep grades and rapid currents.
On the other coast of the North Island the only streams capable of being used for navigation except just at their mouths are those running into the Firth of Thames—the Piako and the Waihou. But no account of our navigable rivers would be complete without a reference to the “drowned rivers” which characterize the northern parts of the Island. The Kaipara may be taken as a typical case of such, for the harbour merely represents the depressed and sunken lower reaches of the Wairoa and other streams. A further notable case is the Hokianga River, which runs for twenty miles between wooded hills and receives numerous tributaries from them, tidal for a considerable part of their courses, and allowing water communication to be used for at least fifteen miles from the point where actual discharge into the open sea takes place.
The remaining rivers of the North Island of any importance rise in the mountain axis that stretches from near Wellington towards the eastern margin of the Bay of Plenty. Towards the southern end, where it lies close to the shore of Cook Strait, the rivers from it are short and swift, the only exception being the Manawatu, which has cut a deep gorge in the mountain barrier and drains an extensive basin lying on the eastern flanks of the Ruahine Range to the north, and of the Tararua Range to the south, as well as a considerable area of country on the slopes of the Puketoi Range, its headwaters in this direction reaching nearly to the east coast of the Island. The Manawatu has an estimated discharge of over 600,000 cubic feet per minute, and judging by this it must be considered the second-largest river in the North Island. Although the Manawatu is the only stream which has succeeded up to the present in cutting through the range at its head, several of the rivers flowing west have eaten their way far back, and in future ages will no doubt struggle with the Manawatu for the supremacy of that tract of land lying to the east of the range. Remarkable changes are likely to occur in the direction of drainage, especially if the earth-movements now in progress in the neighbourhood of Cook Strait continue for any lengthy period.
The central and southern parts of the Tararua and Rimutaka Ranges are drained by the Ohau, Otaki, Waikanae, and other streams flowing into Cook Strait; by the Hutt River, which flows into Wellington Harbour; and by the Ruamahanga and its tributaries, flowing through the Wairarapa Plain. These last include within their basins some amount of papa-country as well as steep mountain-slopes. While in the former they run in deep narrow channels, but when free from it they spread at times over wide shingly beds in a manner more characteristic of the streams of the South Island.
Several large rivers rise in the Ruahine Mountains and their northerly extensions. The chief of these flowing into Hawke Bay are the Ngaururoro, Tukituki, Mohaka, and Wairoa, the first being noteworthy for the enormous amount of shingle it has brought down; while farther north the Waipaoa runs into Poverty Bay and the Waiapu into the open sea, both draining an extensive area of rich papa land. From the north-western side of the range the Whakatane and the Rangitaiki, two considerable streams, flow into the Bay of Plenty.
The chief factor which determines the characters of the rivers of the South Island is the great mountain mass of the Southern Alps, with its extensions and semi-detached fragments. Its general direction is parallel to the west coast of the Island, and nearer to this coast than to the eastern one; it also lies right athwart the path of the wet westerly winds which prevail in these latitudes. The moisture collected during their passage across the Tasman Sea is precipitated in the form of rain on the coastal plain and the hills behind it, while the mountain-tops intercept it chiefly in the form of snow, the amount of annual rainfall varying from about 100 in. at sea-level up to over 200 in. near the main divide. The eastern slopes of the range receive less rain, and are increasingly drier as the coast is approached, but there the amount is slightly augmented by moist winds coming from the open ocean to the east. In the higher mountain valleys on both sides of the range lie numerous glaciers, either of the small cliff type or large ones of the first order, the most notable being the Tasman, Hooker, Mueller, Godley, Rangitata, Lyell, and Ramsay on the east, and the Franz Josef and Fox on the west. The chief large rivers of the central district of the Island rise from the terminals of the glaciers and issue from the ice as streams of considerable volume. They reach their highest level in spring and summer, for not only does the heavier rainfall of that time of the year serve to swell them inordinately, but the snow and ice are melted under the combined influence of the rain itself and of the strong sun-heat. Although they are almost always more or less turbulent and dangerous to the traveller who attempts to ford them—in the warm months of the year they are liable to sudden and serious floods, and formerly they frequently blocked communication for weeks at a stretch—now, however, many of the worst streams have been bridged, and communication is thus easier and less precarious.
The general form of these valleys is of a fairly uniform type. Their heads are usually amphitheatre-like in shape, and for some distance they are occasionally covered by old moraines, and the course of the stream is impeded by huge angular blocks washed out of these or shed from the steep slopes; at times, too, the rivers flow through deep and somewhat narrow gorges. Lower down the valleys open out, with even steep sides, nearly perpendicular at times, and with flat floors covered by a waste of shingle, over which the rivers wander in braided streams. The sides are clad with dense bush for a height of approximately 2,500 ft., that merges into a tangle of subalpine scrub, to be succeeded after another 1,000 ft. by open alpine meadow, gradually passing upward into bare rook and perpetual snow.
After leaving the mountains the streams cross the narrow fringe of aggraded coastal plain, and cut down their channels through old glacial drifts which furnished in former times rich leads of alluvial gold. The mouths of these rivers are usually blocked by shallow bars, but after heavy floods a channel may be scoured out, only to be closed, when the river falls, by the vast quantities of drift material moved along the beach by the heavy seas and the strong shore currents which sweep the open coast. It is only where it is possible to confine the river-mouths and direct their scour that open channels can be permanently maintained, and even these entrances to the river are at times extremely dangerous to shipping.
The chief rivers which flow from the central portion of the Southern Alps to the Tasman Sea are the Taramakau, Hokitika, Wanganui, Wataroa, Waihao, Karangarua, Haast, and Arawata. All rise in glaciers, and their valleys are remarkable for their magnificently diversified bush and mountain scenery. Occasionally lakes, ponded back behind old moraines or lying in rock-bound basins and fringed with primeval forest, lend charm to the landscape, and make a journey along the Westland Plain one of the most delightful in New Zealand from the scenic point of view.
Farther north glaciers are absent, but the heavy rain feeds numerous large streams and rivers, the most notable being the Grey and the Buller, the last being in all probability the largest on the west coast, the amount of its discharge being estimated at nearly 1,000,000 cubic feet per minute.
The general features of the rivers which flow into the West Coast Sounds are somewhat similar, except that few rise in glaciers, and there is no fringe of plain to the mountains. The valleys have steeper sides, waterfalls and lakes are more common, and are ideally situated for power installations. One of the large rivers of this area is the Hollyford, which flows into Martin's Bay; but the largest of all is the Waiau, which drains the eastern side of the Sounds region, receives the waters of Lakes Te Anau, Manapouri, and Monowai, and enters the sea on the south coast of the Island.
The rivers on the eastern slope of the Alps present features similar to those of the west coast in their upper courses, but the valleys are broader and flatter, floored from wall to wall with shingle and frequently containing large lakes of glacial origin. In those cases where lakes do not now exist there are undoubted signs that they occurred formerly, having been emptied by the erosion of the rock-bars across their lower extremities and filled at the same time by detrital matter poured in at their heads.
The largest of all these rivers is the Clutha; in fact, it discharges the greatest volume of water of any river in New Zealand, the amount being estimated at over 2,000,000 cubic feet per minute. The main streams which give rise to this river flow into Lakes Wanaka and Hawea, and have their sources in the main divide to the north of the ice-clad peak of Mount Aspiring and in the neighbourhood of the Haast Pass. After flowing as a united stream for nearly thirty miles it receives from the west a tributary nearly as large as itself called the Kawarau, whose dis charge has been accurately gauged by Professor Park at 800,000 cubic feet per minute. This great volume of water is due to the fact that the Kawarau drains Lake Wakatipu, which serves as a vast reservoir for the drainage of a considerable area of mountain country, including snow-clad peaks at the head of the lake. The united streams continue in a south-easterly direction, and their volume is substantially increased by the Manuherikia on the east bank as well as by the Pomahaka on the west. The course of the Clutha lies through the somewhat arid schist region of Central Otago, gorge alternating with open valley and river-flats; but some ten miles or so before it reaches the sea it divides, only to reunite lower down and thus include the island known as Inch-Clutha. It almost immediately afterwards enters the sea, but its outlet is of little use as a harbour owing to a shifting and dangerous bar. Portions of its course are navigable to a very limited extent, but it is more important commercially, since it has yielded by means of dredging operations great quantities of gold; in fact, it may be regarded as a huge natural sluice-box, in which the gold disseminated through the schists of Central Otago has been concentrated through geological ages into highly payable alluvial leads.
The following large rivers belong to the Southland and Otago District, but do not reach back to the main divide—the Jacobs, Oreti, Mataura, and Taieri; and forming the northern boundary of the Otago Provincial District is the Waitaki, which drains a great area of alpine country, and includes in its basin Lakes Tekapo, Pukaki, and Ohau. Its main affluents are the Tasman and the Godley, rising in glaciers of the same names near the axis of the range where it is at its highest. As the river approaches the sea it crosses shingle-plains, through which it has out a deep channel flanked by terraces, which rise bench-like for some hundreds of feet above the present level of the river. Its general features are similar to those of the rivers of Canterbury farther north, except that a larger proportion of the course of the latter lies across the plains and uninterfered-with in any way by the underlying harder and more consolidated rocks. The four principal rivers which rise in glaciers are the Rangitata, Ashburton, Rakaia, and Waimakariri; while farther north are the Hurunui and Waiau, snow- and rain-fed rivers rising in the main range beyond the northerly limit of glaciers; and there are other streams—such as the Waihao, Pareora, Opihi, Selwyn, Ashley, and Waipara—which do not reach beyond the outer flanking ranges, and are almost entirely rain-supplied.
According to recent investigations the low-water discharge of the Waimakariri is approximately 80,000 cubic feet per minute, but it frequently rises in normal flood to 500,000 cubic feet per minute.
All these rivers carry down enormous quantities of shingle, but in former times they carried down even more, and built up the wide expanse of the Canterbury Plains by the coalescing and overlapping of their fans of detritus, the depth of shingle certainly exceeding 1,000 ft. Subsequently, when conditions, climatic or otherwise, slightly altered, they cut down deep through this incoherent mass of material, forming high and continuous terraces. Nowhere is the terrace system more completely developed than at the point where the rivers enter on the plains, for there the solid rock that underlies the gravels is exposed, and by the protection that it affords to the bases of old river flood-plains or former terraces it contributes materially to their preservation in a comparatively uninjured condition. The valleys of all these rivers are now almost treeless except in their higher parts, but there the mixed bush of Westland is replaced by the sombre beech forest; it is only in exceptional cases that the totara, which forms an important element of the bush on the hills to the west, crosses the range and covers portions of the sides of the valleys on the east.
Both the Hurunui and the Waiau have cut down gorges through semi-detached mountain masses of older Mesozoic rock, a result probably accelerated by the movements of the earth's crust; and farther north, in the Province of Marlborough, the Clarence, Awatere, and Wairau have their directions almost entirely determined by a system of huge parallel earth-fractures, running north-east and south-west, and the rivers are walled in on either side by steep mountains for the greater part of their length. The Clarence Valley is the most gorge-like, since it lies between the great ridges known as the Seaward and Inland Kaikouras, which reach a height of about 9,000 ft. The last river of the three, the Wairau, flows for a considerable distance through a rich alluvial plain, and enters Cloudy Bay by an estuary which is practicable for small steamers as far as the Town of Blenheim. The most important of the streams on the southern shores of Cook Strait are the Pelorus, Motueka, Takaka, and Aorere, great structural faults being chiefly responsible for the position and characteristic features of the valleys of the last two.
An important commercial aspect of our rivers is their use not only as drainage channels, but as a source of water for pastoral purposes. Hardly any area is without water for stock or with a subsoil wanting in moisture necessary for successful cultivation. Only in Central Otago and on the Canterbury Plains were there formerly wide stretches of arid country, but the deficiency in the water-supply has been remedied by well-engineered systems of races, tapping unfailing streams at higher levels, and distributing a portion of their contents far and wide, so that the districts mentioned are rendered highly productive and absolutely protected from the serious effects of drought. It is, however, the rich alluvial flats and well-drained terrace lands bordering on the rivers that contribute specially to the high average yield per acre year after year for which this country has such a world-wide reputation.
From the brief summary given above it will be evident also that the country possesses enormous stores of energy awaiting exploitation. A beginning has been made in some places, such as at Waipori in Otago, at Lake Coleridge in Canterbury, at the Horohoro Falls and at Arapuni on the Waikato River in Auckland, at Mangahao in Wellington Province, and at a few other places where there are minor installations. These owe their development to their comparative nearness to centres of industry; but they represent an infinitesimal portion of the energy available, and the value of our vast store will be more truly appreciated when our somewhat limited reserves of coal show signs of failure or become difficult to work —unless, indeed, some new form of power is disclosed by the researches of science in the near future.
A list of the more important rivers of New Zealand is given, with their approximate lengths, the latter being supplied by the Department of Land and Survey.
| NORTH ISLAND. | |
| Flowing into the Pacific Ocean— | Miles. |
| Piako | 60 |
| Waihou (or Thames) | 90 |
| Rangitaiki | 95 |
| Whakatane | 60 |
| Waiapu | 55 |
| Waipaoa | 50 |
| Wairoa | 50 |
| Mohaka | 80 |
| Ngaururoro | 85 |
| Tukituki | 65 |
| Flowing into Cook Strait— | |
| Ruamahanga | 70 |
| Hutt | 35 |
| Otaki | 30 |
| Manawatu (tributaries: Tiraumea and Pohangina) | 100 |
| Rangitikei | 115 |
| Turakina | 65 |
| Wangaehu | 85 |
| Wanganui (tributaries: Ohura, Tangarakau, and Maunganui-te-ao) | 140 |
| Waitotara | 50 |
| Patea | 65 |
| Flowing into Tasman Sea— | |
| Waitara (tributary: Maunganui) | 65 |
| Mokau | 75 |
| Waikato (tributary: Waipa) | 220 |
| Wairoa | 95 |
| Hokianga | 40 |
| SOUTH ISLAND. | |
| Flowing into Cook Strait— | Miles. |
| Aorere | 45 |
| Takaka | 45 |
| Motueka | 75 |
| Wai-iti | 30 |
| Pelorus | 40 |
| Wairau (tributary: Waihopai) | 105 |
| Awatere | 70 |
| Flowing into the Pacific Ocean— | |
| Clarence (tributary: Acheron) | 125 |
| Conway | 30 |
| Waiau (tributary: Hope) | 110 |
| Hurunui | 90 |
| Waipara | 40 |
| Ashley | 55 |
| Waimakariri (tributaries: Bealey, Poulter, Esk, and Broken River) | 93 |
| Selwyn | 55 |
| Rakaia (tributaries: Mathias, Wilberforce, Acheron, and Cameron) | 95 |
| Ashburton | 67 |
| Rangitata | 75 |
| Opihi | 50 |
| Pareora | 35 |
| Waihao | 45 |
| Waitaki (tributaries: Tasman, Tekapo, Ohau, Ahuriri, and Hakataramea) | 135 |
| Kakanui | 40 |
| Shag | 45 |
| Taieri | 125 |
| Clutha (tributaries: Kawarau, Makarora, Hunter, Manuherikia, and Pomahaka) | 210 |
| Flowing into Foveaux Strait— | |
| Mataura | 120 |
| Oreti | 105 |
| Aparima | 65 |
| Waiau (tributaries: Maraioa, Clinton, and Monowai) | 115 |
| Flowing into the Tasman Sea— | |
| Cleddau and Arthur | 20 |
| Hollyford | 50 |
| Cascade | 40 |
| Arawata | 45 |
| Haast (tributary: Landsborough) | 60 |
| Karangarua | 30 |
| Fox | 25 |
| Waiho | 20 |
| Wataroa | 35 |
| Wanganui | 35 |
| Waitaha | 25 |
| Hokitika (tributary: Kokatahi) | 40 |
| Arahura | 35 |
| Taramakau (tributaries: Otira and Taipo) | 45 |
| Grey (tributaries: Ahaura, Arnold, and Mawhera-iti) | 75 |
| Buller (tributaries: Matakitaki, Maruia, and Inangahua) | 105 |
| Mokihinui | 30 |
| Karamea | 45 |
| Heaphy | 25 |
The following article on the lakes of New Zealand is also by Professor R. Speight:—
Lakes are features of the landscape which are usually attributable to the filling-up of hollows formed by faulting or warping, or by volcanic explosions, or by the irregular accumulation of material round volcanic vents, or to the interference with river-valleys by glaciers. Seeing that all these agencies have operated on an extensive scale in New Zealand in comparatively recent geological times, it is not surprising that its lake systems are well developed. The remarkable group of lakes lying in the middle of the North Island, as well as isolated enclosed sheets of water in other parts of the Auckland Province, are due to volcanic action in its various forms, while those in the South Island are to be credited to the operations of glaciers. We have therefore two distinct types of lake scenery, one for each Island. The relief of the land near the volcanic lakes is not by any means marked, and they therefore rarely have bold and precipitous shores, and their scenic interest depends partly on the patches of subtropical bush which grows luxuriantly in places on the weathered igneous material, and partly on their desolate and forbidding surroundings, everywhere reminiscent of volcanic action, where the softening hand of time has not reduced the outpourings of the eruptive centres to a condition favourable for the establishment of vegetation. The thermal activity which is manifested in numerous places on their shores adds to their interest. In the South Island the lakes lie in the midst of splendid mountain scenery, with amphitheatres of noble peaks at their heads, crowned with perpetual snow, and clad at lower levels with dark primeval beech forest, which affords an appropriate setting for the waters at their base, rendered milky-white at times with the finest of sediment worn from solid rocks by powerful glaciers, and swept down to the quiet waters of the lake by turbulent glacial torrents.
The largest sheet of fresh water in New Zealand is Lake Taupo, which is situated in the very heart of the North Island, at an elevation of 1,211 ft. above the sea. Its greatest length in a S.W.-N.E. direction is twenty-five miles, and its greatest breadth is about seventeen miles, but its shape is somewhat irregular owing to a large indentation on its western side. Its area is 238 square miles, its greatest depth 534 ft., and it has a catchment area of about 1,250 square miles. About 60 per cent. of its water-supply comes from the Upper Waikato River, which drains the northern and eastern flanks of the central volcanoes as well as the western slopes of the Kaimanawa Range and its northern extensions. The lake discharges at its northeastern corner and forms the main Waikato River, which falls within a short distance over the Huka Falls, where the volume of water which passes over is estimated to reach an average of 5,000 cubic feet per second. The surroundings of the lake are picturesque, on the western side especially. Here it is bounded by cliffs of volcanic rock, generally between 100 ft. and 800 ft. in height, but at the Karangahape Bluffs they rise to over 1,000 ft. sheer. The northern shore is bold with promontories terminated with bluffs and intervening bays with gentler slope. The south side is generally fringed with alluvial flats, while the east is bordered in places with pumice cliffs, and is somewhat uninteresting, but relieved from absolute monotony by the graceful extinct cone of Tauhara. About twenty miles to the south rise the great volcanic peaks of Tongariro, Ngauruhoe, and Ruapehu, with their bush-clad foothills, forming a splendid panorama when seen from the northern shore of the lake.
To the south-east of the middle of the lake lies the Island of Motutaiko, in all probability the summit of a volcanic cone on the line of igneous activity which stretches north-east from the central volcanoes towards Tarawera, White Island, Tonga, and Samoa. The formation of the lake itself is attributable either to a great subsidence after volcanic activity waned, or to a great explosion which tore a vast cavity in the earth's crust and scattered the fragments far and wide over the middle of the Island; and evidence of declining igneous action is furnished by hot springs in the lake itself and near its shore, especially at the north-east corner near Wairakei and on the southern shore near Tokaanu. Earth-movements have in all probability continued down to recent times, for an old shore platform or wave-cut terrace surrounds the lake, indicating that its waters were formerly at a higher level, and changes in level of the ground on the northern shore of the lake, attended by local earthquakes, occurred during the year 1922.
The lake forms an enormous reservoir of power conveniently placed for exploitation; it is estimated that the Huka Falls would develop up to 38,000 horse-power, and its central position renders it peculiarly suitable for supplying a wide district. Although the immediate vicinity does not hold out much hope for its utilization, the rich agricultural districts which lie at some distance will no doubt rely on it in the near future as a convenient source of mechanical energy.
To the south of Taupo, nestling in the hills between the great lake and the northern slopes of Tongariro, lies Roto-Aira, a beautiful sheet of water, three miles in length and with an area of five square miles. It discharges by the Poutu River into the Upper Waikato. The other lakes of this region are small in size and usually occupy small explosion craters on the line of igneous activity mentioned above.
A most interesting group of lakes lies in the midst of the thermal region to the north-east of Taupo. These comprise the following: Rotorua, Roto-iti, Roto-ehu, and Rotoma, which belong to a system lying to the north-west of the area, and Tarawera, Rotokakahi, Tikitapu, Okareka, Rotomahana, Okataina, Rotomakariri, and Herewhakaitu, which lie to the south-east. The former group is connected either directly or indirectly with the Kaituna River basin, and the latter with the Tarawera River basin, both of which discharge their waters into the Bay of Plenty. All these lakes occupy either explosion craters or depressions due to subsidences of the crust or hollows formed by irregular volcanic accumulations. They lie at an elevation of about 1,000 ft. above the sea. The largest is Rotorua, which is nearly circular in shape, except for a marked indentation on the southern shore. It is 32 square miles in area, and 84 ft. deep, with flat shores; but in the middle, rather towards the eastern side, the picturesque and historical Island of Mokoia rises to a height of 400 ft. The lake discharges at its north-eastern corner by the Ohau Creek into Lake Roto-iti, a shallow and irregular depression, which runs in turn into the Okere River. To the north-east lies the small lake of Roto-ehu, separated from it by low ground, and farther on lies the picturesque Rotoma, of still smaller size.
The largest lake of the south-eastern group is Tarawera, lying to the north and west of the mountain of the same name; discharging directly into it are Rotokakahi, Okareka, and Okataina, the last two by subterranean channels, while Tikitapu and Rotomahana are separated from it by comparatively narrow ridges.
All these lakes owe their interest to the thermal manifestations which occur in their vicinity, and to the remnants of beautiful bush which have survived the eruption of Tarawera in 1886. They are also noted for their fishing, being well stocked with trout. Their water is available for power purposes to a limited extent, and a small installation is placed near the low fall where the Okere River discharges from Lake Roto-iti.
Two small lakes of volcanic origin are situated on the peninsula north of Auckland: these are Takapuna and Omapere. The former lies close to the City of Auckland, and occupies a small explosion crater near the sea; while Omapere is between the Bay of Islands and Hokianga, in a shallow depression, which owes its origin to the obstruction of the Waitangi River by a lava-flow. It is three miles long by two wide, and is placed at a height of 790 ft. above the sea.
About forty miles from the east coast, in the Hawke's Bay District, lies the most important lake of Waikaremoana, twelve miles in length by about six miles and a quarter in breadth at its widest part, but with an extremely irregular outline; it has an area of twenty-one square miles. Its surface is 2,015 ft. above the sea, and it has a maximum depth of 846 ft. It discharges by the Wairoa River to the northern shore of Hawke Bay. This lake is most favourably situated for the development of water-power, and it is estimated that it would generate, owing to its admirable position, as much as 136,000 horse-power. A few miles to the northeast lies the small lake called Waikare-iti, which discharges into the large lake.
The only other inland lakes of any importance in this Island are those situated in the lower course of the Waikato River, the most noteworthy being Waikare and Whangape. The former has an area of nearly eleven square miles and has a depth of 12 ft.; the latter is smaller, with an area of only four square miles and a depth of 9 ft. These owe their origin to flooding of low-lying land alongside the river—in all probability attributable to a slight lowering of the land in this part of the country, with the consequent inability of the river to discharge its surplus water without a proper channel being maintained.
Along the coast-line, especially behind the fringe of dunes, numerous small lakes are found, such as Rotokawa, near Kaipara, and Horowhenua, near Levin; and a large sheet of water occurs near the mouth of the Wairarapa Valley, called the Wairarapa Lake. The lake is very shallow, and is liable to remarkable variations in size owing to heavy floods from the neighbouring ranges. Between it and the sea is a considerable area of swampy ground in which are several small lakes, the largest of which, Lake Onoke, is separated from Palliser Bay by a narrow shingle-spit.
By far the great majority of the lakes of the South Island are dependent for their formation either directly or indirectly on the action of glaciers. They may be either small tarns high on the mountains or large lakes occupying considerable lengths of old stream-valleys which have been overdeepened by the excavating-power of ice during the Pleistocene glaciation, or lakes formed by the filling of hollows in the irregular heaps of debris laid down on a plain at the base of the mountains or in a wide open valley. Accumulations of debris may also assist the first two causes in the formation of lakes, and some may owe the initial formation of their basins to tectonic causes, but these have been modified profoundly by other influences.
Included in the first class are numerous sheets of water from the size of small ponds upwards, found in all parts of the mountain region, but especially in the high plateau regions of western Otago, and to a limited extent in north-west Nelson. To the second group belong the large lakes of the eastern watershed of the Alps and a small number which drain west, such as Rotoroa and Rotoiti in the Buller Basin, while to the last must be assigned the majority of the lakes of Westland; but Branner and Kanieri should perhaps be assigned to the second class.
Seeing that glaciation was not so intense in the northern portion of the Island, it is not surprising that the lakes of that region are small and few in number. Attention has, however, been drawn to Boulder Lake, in the valley of the Aorere River, since it might be used for power purposes in connection with the great deposit of iron-ore at Parapara. It is only 151 acres in extent, but it lies at an elevation of 3,224 ft., and is conveniently placed for the establishment of an electric-power plant. Farther south, near the head of the Buller, are two larger lakes—Rotoroa and Rotoiti—occupying ice-eroded valleys dammed at their lower ends by moraine. The former has an area of eight square miles, and the latter two and three-quarter square miles; their heights above the sea being respectively 1,470 ft. and 1,997 ft., and the latter being 228 ft. deep.
In the valley of the Grey River are two lakes of considerable size—viz., Brunner and Poerua. These are shrunken and separated parts of a former extensive sheet of water which was ponded back behind a great glacier moraine. Lake Brunner is five miles long by four broad, has an area of 15.9 square miles, is 280 ft. above sea-level, and 357 ft. deep. It is surrounded on two sides by high wooded granite peaks, and on the other two by low ground. It discharges by the Arnold River to the Grey, but a very slight change of level would turn it into the Taramakau.
Lake Kanieri, which lies in the basin of the Hokitika River at the base of Mount Tuhua, is a beautiful sheet of water. It is five miles long by one and three-quarters wide, has an area of eight square miles, is 422 ft. above sea-level, and 646 ft. deep. It owes its origin partly to the hollow formed behind an immense morainic dam, and partly to the erosive action of the valley glacier. Farther south on the coastal plain of Westland are numerous small and picturesque lakes, wooded to the water's edge, lying behind heaps of glacial debris or in ice-eroded basins. The most notable of these are Ianthe and Mapourika, both of small size, the former with an area of only two square miles, at a height of 80 ft. above sea-level, and with a depth of 105 ft., and the latter remarkable for the fine panorama of mountain scenery, with Mount Cook in the background, which can be obtained from the shore of the lake. Along this strip of coast-line there are numerous lagoon-like expanses of water, cut off from the sea by areas of dune or of moraine, the chief of which is Mahinapua, which lies close to the Town of Hokitika. This is but 6 ft. above tide water, and has an area of one and a half square miles. The creek discharging from it is noted for the perfect reflections to be seen in the dark, peat-stained water.
On the eastern side of the main divide lie the great valley lakes which belong to the following river-basins: Hurunui—Lake Sumner; Rakaia—Lakes Coleridge and Heron; Waitaki—Lakes Tekapo, Pukaki, and Ohau; Clutha—Lakes Wanaka, Hawea, and Wakatipu; Waiau—Lakes Te Anau, Manapouri, and Monowai; Wairaurahiri—Lake Hauroko; Waitutu—Lake Poteriteri. These are all formed on the same plan; great glaciers have excavated the floor of a river-valley and have piled the debris across its lower portion, leaving a great hollow which was filled with water when the ice retreated. Even in those river-basins where no lakes now exist the traces of their former presence are evident; especially is this the case with the Waimakariri, Rakaia, and Rangitata Valleys. Besides these large lakes each valley has its quota of small ones, usually hidden away among the piles of moraine or ponded back behind shingle-fans. Among these small lakes should be noted the following: Tennyson, in the valley of the Clarence; Taylor, Sheppard, Katrine, and Mason, in the Hurunui; Pearson, Grassmere, and Letitia, in the valley of the Waimakariri; Evelyn, Selfe, Catherine, Ida, and Lyndon, in that of the Rakaia; Clearwater (or Tripp), Howard, and Acland, in the Ashburton; Alexandrina, in the Waitaki; Lochnagar, Hayes, and Moke, in the Clutha. In the valley of the Waiau there are numerous lakes of small size hidden away in bush-clad valleys, the chief of which is Mavora, which discharges into the main Waiau by way of its large tributary, the Mararoa. On the west coast of this region are also many insignificant lakes as far as size is concerned, such as Lake Ada, a well-known beauty-spot on the Milford Sound track, while farther north McKerrow, a lake of larger size, discharges into Martin's Bay.
The only other lakes in this Island that are worthy of mention are Waihola, Forsyth, and Ellesmere. The first mentioned occupies the lower portion of the Taieri Plain, and drains to the sea by a deep winding gorge cut through a ridge of rock-covered hills, the gorge being tidal for the greater part of its length. Lakes Forsyth and Ellesmere lie on the coast immediately south of Banks Peninsula, both ponded back behind a great shingle-spit formed by the drift of material brought down by the rivers and carried north under the influence of a strong shore current. Both are very shallow and liable at times to be invaded by the sea. Ellesmere is sixteen miles long by about ten broad, and Forsyth is about six miles long by one in breadth.
Among all these lakes three stand pre-eminent for their scenic interest—Wakatipu, Te Anau, and Manapouri. The first-named is walled in on both sides by steep mountains which rise at the head of the lake to over 8,000 ft. in the Humboldt Range, and to over 9,000 ft. in Mount Earnslaw. Te Anau has an uninteresting eastern shore, but its western shore is broken into three great arms, whose impressive scenery is strongly reminiscent of that of Milford Sound and George Sound; while Manapouri, with its many bush-clad islets and its indented shore-line with innumerable sheltered coves and pebbly beaches, belongs to the same type as Dusky Sound, the most beautiful of all in the fiord region.
The lakes of Canterbury lie in a treeless area and owe their scenic interest principally to the background of snowy peaks, while Wanaka and Hawea are intermediate in character between them and the more southern lakes of Otago.
These lakes are enormous reserves of energy awaiting development. Estimates of the amount available are somewhat uncertain in their upward limits, seeing that modifications of proposed schemes may increase the possible power to a marked extent. The only one, however, which has been utilized in an adequate manner up to the present is Lake Coleridge. This yields at present 16,000 horse-power (approximately), and if the scheme be developed to its full capacity the amount will probably reach 90,000. Lake Tekapo would furnish at least 400,000 horse-power; Pukaki, 70,000; Ohau, 100,000; Hawea, 90,000; Wakatipu, 100,000; Te Anau, 90,000; Manapouri, 420,000; and Hauroko, 80,000; and there are many lakes which could very easily be adapted for smaller installations. Especially is this the case in the fiord country, where the heavy and well-distributed rainfall produces an unfailing supply of water, where lakes are placed in ideal situations as reservoirs, and deep and secure harbours provide ample facilities for the transport of manufactured products. When these are properly utilized the now wild and deserted region will become the home of industry in the Dominion, and one of the main centres of manufacture in the Southern Hemisphere. One of these lakes—viz., Monowai, in Southland—is actually being utilized at the present time as a source of energy, and it is estimated to yield a minimum of 10,000 horse-power, with a maximum of 20,000.
The following is a summary of the statistics of the chief lakes of New Zealand:-
| Lake | Length, in Miles. | Greatest Breadth, in Miles. | Area, in Square Miles. | Drainage Area, in Square Miles. | Approximate Volume of Discharge, in Cubic Feet per Second. | Height above Sea-level, in Feet. | Greatest Depth, in Feet. |
|---|---|---|---|---|---|---|---|
| North Island. | |||||||
| Taupo | 25 | 17 | 238 | 1,250 | 5,000 | 1,211 | 534 |
| Rotorua | 7 ½ | 6 | 32 | 158 | 420 | 915 | 84 |
| Rotoiti | 10 3/2 | 2 ¼ | 14 | 26 | 500 | 913 | 230 |
| Tarawera | 6 ½ | 6 ½ | 15 | 75 | .. | 1,032 | 285 |
| Waikaremoana | 12 | 6 ¼ | 21 | 128 | 772 | 2,015 | 846 |
| Wairarapa | 10 | 4 | 27 | 1,250 | .. | .. | 64 |
| South Island. | |||||||
| Rotoiti | 5 | 2 | 2 ¾ | 86 | .. | 1,997 | 228 |
| Rotoroa | 7 | 2 ½ | 8 | 146 | .. | 1,470 | .. |
| Brunner | 5 | 4 | 16 | 145 | .. | 280 | 357 |
| Kanieri | 5 | 1 | 8 | 11 | .. | 422 | 646 |
| Coleridge | 11 | 3 | 18 | 70 | .. | 1,667 | 680 |
| Tekapo | 12 | 4 | 32 | 580 | 5,000 | 2,323 | 620 |
| Pukaki | 10 | 5 | 31 | 515 | 6,000 | 1,588 | .. |
| Ohau | 10 | 3 | 23 | 424 | 5,000 | 1,720 | .. |
| Hawea | 20 | 5 | 48 | 518 | 5,700 | 1,062 | .. |
| Wanaka | 30 | 4 | 75 | 960 | .. | 922 | .. |
| Wakatipu | 52 | 3 | 112 | 1,162 | 13,000 | 1,016 | 1,242 |
| Te Anau | 33 | 6 | 132 | 1,320 | 12,660 | 684 | 906 |
| Manapouri | 12 | 6 | 56 | 416 | .. | 596 | 1,458 |
| Monowai | 12 | 1 | 12 | 51 | 700 | 600 | .. |
| Hauroko | 20 | 3 | 25 | 195 | 1,800 | 611 | .. |
| Poteriteri | 17 | 2 | 17 | 162 | .. | 96 | .. |
| Waihola | 4 ½ | 1 ⅛ | 3 ⅓ | 2,200 | .. | (Tidal) | 52 |
| Ellesmere | 16 | 10 | 107 ½ | 745 | .. | (Tidal) | 45 |
The following article on the geology of New Zealand has been prepared by Mr. P. G. Morgan, M.A., F.G.S. (Director), and other members of the Geological Survey:—
The geological history of New Zealand is long and complicated, and is as yet by no means clearly deciphered. Since the beginning of the Palæozoic era that portion of the earth's crust where New Zealand is shown on the map has many times been elevated and depressed. Sometimes the land and the neighbouring ocean-floor as a whole have risen or fallen; at other times movement has been more or less local. Thus from age to age the land has greatly varied in outline, and whilst in one period it becomes a continent, in another it nearly or quite disappears beneath the ocean. The actual surface has been almost equally variable, for the mountain-chains of early periods have been planed down by denudation, and new mountains have risen to take their places. In short, the story of the land has been one of incessant, though as a rule slow-moving, change, and if the student would rightly interpret that story he must ever bear in mind that New Zealand in the past has never been quite or even nearly the same as we see it now. With the scanty materials at hand he must endeavour to reconstruct the land as it existed during past ages. A rich field for original research is open to the New Zealand geologist. Little has yet been accomplished in comparison with what remains to be done. There are many absorbing problems—some of great economic importance, some of world-wide interest—awaiting solution by the patient scientific worker.
Professor James Park writes: “Though so isolated, New Zealand contains within its narrow borders representatives of most of the Palæozoic, Mesozoic, and Cainozoic formations. Moreover, its structure is that usually associated with areas of continental dimensions; and for that reason it is often spoken of as an island of the continental type. It is a miniature continent; and the occurrence in its frame-work of thinogenic shore or shallow-water] rocks, ranging from the earliest geological epochs to the present day, is undeniable evidence that it stands on a subcrustal foundation of great stability.” (N.Z. Geological Survey Bulletin No. 23, p. 24, 1921.)
The oldest rooks in New Zealand appear to be those of western Otago, where over a large area is exposed a complex of gneisses and schists, intruded by granite and other igneous rocks. The gneisses in the main are altered granites and diorites, but some of the schists, at any rate, are of sedimentary origin. A pre-Cambrian age was assigned to these rocks by Professor F. W. Hutton, but Professor James Park considers them to be probably of Cambrian age, and includes them in his Dusky Sound Series, the lower part of the Manapouri System.
Perhaps next in age to the western Otago gneisses and schists are the mica, chlorite, and quartz schists of Central Otago. In the absence of fossils, however, the age of these rocks is uncertain. Professor Hutton regarded them as pre-Cambrian, Professor Park assigns a Cambrian age, whilst Dr. P. Marshall considers them to be little, if at all, older than the Triassic. Recent field-work by the Geological Survey, however, strongly suggests that an unconformity separates the Triassic rocks of the Nugget Point district from the greywackes of the Balclutha district, which overlie the Otago schists. In December, 1924, fossils of Permian (if not older) age were discovered near Clinton in greywacke and associated rocks. The horizon of these fossils is far above the schists, and therefore a pre-Permian age for the schists is undeniable. Some schistose rocks in north, central, and western Nelson may be as old as, or even older than, the Otago mica-schists. The gneisses and schists on the western side of the Southern Alps may for the present be classed with the Nelson schists.
The oldest known fossiliferous rocks in New Zealand are the Ordovician argillites (“slates”), greywackes, and quartzites occurring near Collingwood (Nelson), in the Mount Arthur district, and near Preservation Inlet in south-west Otago. Ordovicion rocks probably have a considerable development in other parts of Nelson and in Westland, but no recognizable fossils have been found in those areas.
Rocks containing Silurian fossils occur in the Mount Arthur, Baton River, and Reefton districts, Nelson. They are principally altered limestone, calcareous shale or argillite, sandstone, and quartzite.
Considerable areas have been assigned to the Devonian period by Mr. Alexander McKay, but owing to the non-discovery of recognizable fossils definite proof of age is wanting. For a similar reason the age of most of the rocks placed in the Carboniferous period (“Maitai Series”) by McKay is uncertain. At Reefton the supposed Carboniferous rocks, which here contain many auriferous quartz-veins, are almost certainly of Ordovician age. In the typical locality near Nelson the fossils found in the Maitai rocks, according to Dr. C. T. Trechmann, indicate a Permo-Carboniferous age.
So far Permian rocks have not been satisfactorily identified in New Zealand, but, as previously stated, fossiliferous strata of this age, or slightly older, have been found near Clinton, Otago. The Maitai rocks near Nelson ought probably to be classified as Permian rather than as Permo-Carboniferous. Park considers his Aorangi Series to be of Permian age.
During some of the Palæozoic periods it is conjectured that New Zealand formed part of or was the foreland of a large land-mass that extended far to the west. This land-mass possibly persisted to late Palæozoic times, and may have been the now dismembered and all-but-lost continent known to geologists as Gondwanaland.
Triassic and Jurassic rocks have been known to exist in New Zealand since Hochstetter's visit (1859), but the fossils were not extensively and accurately identified until the last decade, when Newell Arber and Trechmann published their valuable papers.
Newell Arber (1917) described an Upper Triassic flora from Mount Potts and Clent Hills (North Canterbury), and Hokonui Hills (Southland); Jurassic floras from North Canterbury and Southland; and a Lower Cretaceous flora from the neighbourhood of Oruarangi Point, south of Waikato South Head. Trechmann (1918 and 1923) examining marine molluscs and brachiopods from several localities, found that they ranged in age from Upper Triassic to Upper Jurassic, and correlated the different beds with European stages. The most fossiliferous localities are Hokonui Hills (Southland), near Nugget Point (Otago), Wairoa Valley (Nelson), Mokau watershed, Kawhia Harbour, and Waikato South Head, the three last-mentioned on or near the west coast of Auckland.
A broad belt of largely unfossiliferous but probable Trias-Jura rocks extends through western Canterbury and Marlborough, and is continued as a somewhat narrower belt on the north side of Cook Strait from Wellington to northern Hawke's Bay. Rocks of much the same appearance occur in the Lower Waikato Valley, in the Coromandel Peninsula, and in North Auckland. Some of these rocks may be of pre-Mesozoic age, but fossils to settle the point have not yet been found.
-No angular unconformity has been found between the Triassic and Jurassic, and the rocks have marked lithological similarity. Consequently the mapping of the boundary between these two systems is difficult, and, with our present knowledge, its extension into the great areas of unfossiliferous greywackes is impossible.
Cretaceous rocks occur at several points on the east coast of Otago and in central Canterbury. They extend in a not-quite-continuous belt from Cape Campbell in Marlborough to the neighbourhood of Waipara in North Canterbury. At Amuri Bluff they are richly fossiliferous. To the Cretaceous belongs a somewhat extensive belt of rocks near the east coast of Wellington and southern Hawke's Bay. A continuation of this belt extends from a point north-west of Gisborne to the East Cape district. In North Auckland Cretaceous rocks cover considerable areas.
The oldest known workable coal-seams in New Zealand occur in Cretaceous rocks. Much controversy, however, concerning the age of our coalfields has arisen. The late Sir James Hector, and with him Mr. Alexander McKay, considered that the coal-measures belonged to a Cretaceo-Tertiary system that extended from the Upper Cretaceous to the Middle Tertiary. For many years Mr. McKay was practically the sole exponent of this theory, but since 1911 Dr. Marshall has advocated a very similar view. The truth, however, seams to be that the coal-measures concerning which there is a dispute are of two different ages. The Kaitangata, Green Island, Shag Point, Malvern Hills, and Broken River (Canterbury) coalfields are probably of Upper Cretaceous age. The other coalfields, as mentioned below, are Tertiary.
To the Eocene may be assigned the coal-measures of the Taratu-Milton, Grey, Buller, and Collingwood districts, and some of the coal-bearing patches of central Nelson. In various other localities possible Eocene coal-measures occur. The Wangaloa beds, near Kaitangata, contain an Early Eocene fauna, which has also been identified at Boulder Hill, North Taieri, near Dunedin, and are underlain by the Taratu-Milton coal-measures.
During the Early Eocene, as some geologists and biologists believe, New Zealand was again part of a continental area that extended far to the north, and was joined, or all but joined, to New Guinea and northern Australia. This continent may have included much of the area in the Pacific now studded with coral islands. Its former existence is inferred mainly from various features in our plant and animal life. According to the late Mr. T. F. Cheeseman, no fewer than 366 New Zealand plants are found also in Australia, but recent botanical work tends to reduce the number. More significant, perhaps, is the occurrence of many closely related species and genera in the two regions, for comparatively few of the 366 species are likely to have persisted since the Eocene. Many of our birds show marked affinities to Australian and Malayan species. In this connection an interesting line of support for a Tertiary extension of New Zealand to the north is afforded by the annual migrations of the New Zealand cuckoos and of the godwit.
During the Oligocene and Miocene periods New Zealand subsided until little of the present land-surface was above water. Consequently, notwithstanding extensive denudation in later periods, Middle-Tertiary strata are well represented in almost all parts of the country. They are typically developed in the Oamaru district (northeast Otago), and hence Hutton's name of “Oamaru Series” is generally applied to the Oligocene-Miocene strata of New Zealand. There is reason to think, however, that the lowest part of the Oamaru Series is of pre-Oligocene age, but until patæonto-logical work now in progress is completed a definite opinion cannot be expressed. Oamaru rocks are well represented in South Canterbury, in North Westland, in North Auckland, and in many other localities. Brown coal usually occurs at the base of the Oamaru Series, and about its middle a fairly thick fossiliferous limestone is usually developed. This marks the time when the Middle Tertiary sea was deepest. Some of the finest agricultural districts in New Zealand are in areas where Middle-Tertiary rocks predominate.
The present tendency of the Geological Survey is to separate, under various local names, the uppermost Miocene strata from the Oamaru Series, even though this be held to include the Awamoa or Pareora beds. Strata high in the Miocene cover large areas in the North Taranaki, upper Wanganui, and Gisborne-East Cape districts, and are found also in Marlborough, North Canterbury, &c. In North Taranaki they contain valuable seams of brown coal.
In many localities the Miocene rocks pass without detectable angular unconformity into strata considered to be of Pliocene age. In the Hawke's Bay and Wanganui districts these are marine and highly fossiliferous. They give rise to much good agricultural and more especially pastoral land adapted to sheep-farming or dairying. In Nelson and north Westland the Pliocene strata are largely composed of river-transported material, and are known as the Moutere Gravels. These in places are poorly auriferous. In Nelson they form a poor pastoral soil, but one well adapted for apple-culture.
Towards the close of the Miocene and during the Pliocene period many parts of New Zealand, more particularly in the South Island, underwent elevation. As a result the North and South Islands (then quite different in outline from their present configuration), together with most of the outlying islands now in existence, such as the Chathams, Auckland Islands, &c., probably formed one large land-mass, which was united to, or almost reached, an Antarctic continent. Since many New Zealand plants* are identical with, or closely allied to, South American forms, and there are also some striking resemblances in bird and other forms of animal life, some geologists and biologists believe that this Antarctic continent formed a bridge, though probably at no time quite complete, between New Zealand and South America. At the time of this continental extension the Southern Alps rose far above their present heights, and were covered with one vast snowfield that fed immense glaciers spreading far and wide over the lowlands to the east and the west. According to Park, during the Pleistocene a great sheet of ice spread over the whole of the present South Island and over part of the North Island. Moreover, this ice-sheet was joined to the Antarctic ice. The extreme views of Professor Park are not shared by other New Zealand geologists, who, however, unanimously agree that a large area in the South Island was glaciated. The great ice-streams of Pleistocene times gave rise to rivers that carried enormous quantities of gravel and finer material derived from the mountains beyond the ice-front, and in great measure built up the lowlands of Canterbury and Westland. In the latter district the gravels sorted by these streams-are in many places richly auriferous, but a greater and more permanent source of wealth is furnished by the fertile soil of the Canterbury Plains.
* According to T. F. Cheeseman's “Manual of the New Zealand Flora” (Preface, page xiv), 112 New Zealand plants extend to South America.
In many parts of Otago, Canterbury, Westland, and Nelson evidences of past glacial action are afforded by huge moraines, perched blocks, ice-worn surfaces (roches moutonnées), rock-benches, rock-basins, and other tokens of glaciation. To ice-action we owe some of the most magnificent features of the western Otago sounds. Some evidence of interglacial periods has been found, and doubtless more will be obtained by future investigations.
At or before the end of the Pleistocene period the mountains lessened in height, through both denudation and a well-marked subsidence of the land. The climate grew milder, and the lowland ice melted away. The mighty glaciers rapidly retreated, geologically speaking, and are to-day represented only by the comparatively modest valley and mountain glaciers of north-west Otago, Canterbury, and Westland, with which may be included the small but permanent snowfield and glacier on Mount Ruapehu. While the glaciers were retreating, the rivers of Canterbury and Westland, swollen by the melting ice, were unusually active in transporting debris to the lowlands and the sea-coast. At this time, too, as well as at somewhat earlier periods, the volcanoes of the North Island furnished an abundant supply of fragmentary material, much of which was transported by the streams and used in building plains and river-flats. Many of these are fertile, but in those districts where pumice abounded a poor soil, difficult of utilization, has resulted. Thus the land gradually became much as we see it now. In recent times geological changes, such as the lowering of heights by denudation, the filling of lakes by sediment, the outward growth of coastal plains in some places, and the wearing-away of the shores in other places, have slowly proceeded, and are to-day, of course, still going on. Slow movements of the land are probably in progress, but these have not been certainly detected. In 1855, however, as the result of a violent earthquake, the northern shore of Cook Strait, near Wellington Harbour, was raised on the average at least 5 ft., whilst the southern shore near Tory Channel and towards the mouth of the Wairau River was almost correspondingly depressed. The Taupo earthquakes of 1922 also caused a measurable movement of the land surface near Taupo.
In the preceding paragraphs little notice has been given to igneous rocks or to-volcanic action. The oldest igneous rocks of New Zealand are probably represented by the gneisses of western Otago, which, as previously stated, are mainly metamorphosed granites and diorites. Plutonic rocks intrude many of the Palæozoic and Mesozoic strata, and some of the formations also show evidence of contemporaneous volcanic action. Of the more ancient plutonic rocks granite is the most prominent. It occurs in many localities in Stewart Island, western Otago, Westland, and Nelson. It has, however, not been found in situ in the North Island, though in many localities boulders of granite and allied rocks, probably derived in all cases from ancient conglomerates, have been discovered. Ultra-basic igneous rocks, now largely altered to serpentine, occur in north-west Otago, Westland, Nelson, and to a minor extent in North Auckland.
Throughout the greater part of the Tertiary periods volcanic action in New Zealand was probably more intense than in any former age. During the Late Eocene or Early Miocene period eruptions, at first principally of andesitic rocks and later of rhyolite, began in the Coromandel Peninsula, and with brief intermissions-continued throughout Miocene and Pliocene times. These volcanic rocks contain the gold-silver veins which have been extensively worked at Coromandel, Thames, Waitekauri, Karangahake, and Waihi.
There are many areas of Miocene and later volcanic rocks in North Auckland, and near the City of Auckland numerous small volcanoes were in action during the Pleistocene, or even later. Some of these—for example, Mount Rangitoto—have possibly been active within the last few thousand years. In Taranaki the beautiful cone of Mount Egmont was built up during Pliocene and Pleistocene times. It is in the central part of the North Island, however, that the most intense volcanic activity has been displayed. Volcanic rocks, more especially the rhyolitic pumice ejected during the Pliocene and Pleistocene, cover large areas. Vulcanism has not yet ceased, for minor eruptions of fragmentary material still take place from Ngauruhoe, a typical volcanic cone near Mount Ruapehu. The most striking evidence of volcanic action, however, is afforded by the numerous steam-vents, hot springs, and geysers found in a belt extending from Ruapehu to White Island (in the Bay of Plenty), itself a volcano in the solfataric stage. It is more than a coincidence that this belt is in line with the Southern Alps. Solfataric action is generally regarded as a sign of dying vulcanism, but that the subterranean forces are still capable of mischief was shown by the eruption of Tarawera, an apparently extinct volcano, on the 10th June, 1886. On that occasion over a hundred lives were lost.
In the South Island vulcanism is apparently quite dead, for the hot springs of Hanmer Plains and the western side of the Alps are due to other causes. During the Miocene, however, volcanic outbursts took place in many localities, in some on a grand scale. Banks Peninsula is formed mainly of basaltic and andesitic rocks. Lyttelton and Akaroa Harbours are believed to represent ancient craters or centres of eruption. In the neighbourhood of Dunedin occurs a very interesting series of alkaline volcanic rocks. These were first described by the late Professor G. H. F. Ulrich, and in later years Dr. Marshall has given them much study. Recently alkaline volcanic rocks have been discovered in the outlying Chatham Islands.
In the course of a short article it is impossible to give any adequate idea of what has been accomplished by geological workers in New Zealand, or what remains yet to be done before even the foundation for future work shall be securely laid. The important applications of geology to agriculture and mining have hardly been mentioned, but elsewhere in this volume will be found descriptions of the agricultural and mineral resources of the Dominion. For detailed information the reader is referred to the bulletins of the New Zealand Geological Survey; to Professor Park's “The Geology of New Zealand,” which contains an excellent bibliography; and to the treatises on “Geology of New Zealand,” by Dr. P. Marshall, as well as to many other publications too numerous to be here named. Yet the “Transactions of the New Zealand Institute,” of which fifty-six volumes have been issued, must be mentioned, more especially since they contain many articles dealing with the palæontology and geology of New Zealand, as well as numerous papers on other branches of natural science. Finally it may be stated that in each of the University Colleges at Auckland, Wellington, Christchurch, and Dunedin excellent instruction in geology is being given by capable and enthusiastic teachers, so that progress in solving the many knotty problems of New Zealand geology is now being made, and may be expected to continue.
The following article on earthquakes in New Zealand has been prepared by Dr. C. E. Adams, D.Sc., F.R.A.S., Government Astronomer and Seismologist, with the assistance of Dr. J. Henderson, D.Sc., Mining Geologist:—
The Wellington earthquake of 23rd January, 1855, received a full notice in Sir Charles Lyell's classic work “The Principles of Geology,”* and probably largely on that account the attention of the scientific world was attracted to this feature of the natural phenomena of New Zealand. But since that earthquake, during which the level of the land in the neighbourhood of Wellington Harbour was raised about 5 ft., there has been no shock in the New Zealand region proper which has at all approached the destructive phase. Indeed, of about 2,100 earthquakes recorded as having origins in or near New Zealand, that of 1848† is the only other earthquake comparable in intensity to that of 1855; and the average intensity of all the earthquakes thus recorded is between III and IV on the Rossi-Forel scale—or, in other words, just sufficient to make pictures hung on walls move a little, and to cause doors and windows to creak or rattle slightly. In about twenty instances the force has been sufficient near the origin to overturn some chimneys (for the most part badly constructed ones), and in a very few buildings to crack walls or ceilings of faulty design. In about fifty other earthquakes such phenomena have been noted as the stopping of clocks, without any damage. The great majority of shocks have passed unperceived by the ordinary observer, and have been recorded only by means of instruments.
* Tenth edition, 1868, vol. 2, p. 82. London: John Murray; New Zealand Government Gazette, Wellington, vol. 2, No. 14, 17th October. 1855, p. 116.
† Westminster Review, vol. 51, 1849; Mr. Justice H. S. Chapman, “Earthquakes in New Zealand,” Trans. Aust. Assoc. Adv. Science vol. 3, 1891; G. Hogben, “The Earthquakes of New Zealand,” p. 37; “Report of Seismological Committee,” p. 505; New Zealand Government Gazette, Auckland, vol. 1, No. 27, 13th November, 1848. and vol. 1, No. 29, 20th November, 1848.
Earthquakes are usually divided into the two classes of volcanic and tectonic earthquakes. The former are those that precede, accompany, or follow a volcanic eruption, whereas tectonic earthquakes are caused by deformation of the earth's crust. The latter are of far greater general importance than those due to volcanic action, which may, indeed, be considered an effect of the same stresses that produce tectonic earthquakes.
A volcanic eruption is in almost all cases preceded by earthquakes, which, although they may be extremely violent, are characterized by the sharpness and brevity of the shock and by the smallness of the disturbed area. The after-shocks of a severe earthquake of the so-called volcanic type continue for a relatively short period. Successive earthquakes of a series have nearly the same place of origin.
Volcanic earthquakes in the past were usually considered to be due to explosions within the mass of the mountain. This hypothesis has been discarded, or at least much modified, by most modern authorities. They are considered rather to arise from the formation of new fractures, from the reopening or extension of old fractures, from the sudden injection of lava into cavities or fissures, and from the displacement of rock-masses adjoining a fracture. Thus they are essentially of the same nature as “tectonic” earthquakes.
Tectonic earthquakes are caused by the deformations of the earth's crust, to which surface features are ultimately due. These deformations arise from the gradual shrinking of the central core or from changes in the load on the crust through denudation and sedimentation. Stresses accumulate in the solid rock until relieved by the formation of fissures, along which movements of adjacent earth-blocks take place. These earth-blocks may be of vast size, and fractures or faults separating them are rarely single planes of rupture, but consist of numerous subparallel breaks extending more or less continuously along elongated belts. Such fault-zones may be hundreds of miles long and many miles wide.
The connection between earthquakes and the formation, extension, or growth of faults is evident in the somewhat rare cases in which the displacement reaches the surface. It is also indicated by the elongated form of the area over which the shock is equally felt, and by the association of these areas with faults traceable on the surface by geological and topographical data. When movement occurs considerable areas of the fracture-plane must be affected, and, since shocks may originate from any part of this area, the seismic focus may be of large size. Again, the foci of successive shocks of a series may migrate to and fro along the fracture or shift to adjacent fractures. Similarly, earthquake series may migrate along a fault-zone.
In New Zealand many great faults and fault-zones have been traced for long distances on geological and topographical evidence, but of these a few only have been active since European occupation. A notable zone extends north-east through the centre of the North Island from Mount Ruapehu to White Island. South of Ruapehu it has not been definitely traced on the surface, although from the positions of the foci of the groups of earthquakes it probably extends past Wanganui, across-Cook Strait, and along the south-east shore of Tasman Bay to the South Island. The volcanic phenomena of the Rotorua-Taupo region, together with the recent. remarkable earthquakes at Taupo, indicate that earth-stresses are still accumulating along this great fracture-zone.
Another important fault-system extends through North Canterbury, Marlborough, East Wellington, and Hawke's Bay. Its general course is north-east, parallel with the Taupo belt and the principal mountain-ranges of New Zealand. The Marlborough valleys, as well as the lowlands of the Hutt and Wairarapa districts, are directly controlled by fractures of this great system. In addition to many less severe shocks, the Wellington earthquake of 1855 was due to displacement along one of the major fissures. The southern end of the known active portion of the great fracture-belt is crossed by several important east-and-west faults; and the Hanmer earthquake of 1888 was due to the reopening of a fault extending in this direction along the upper valley of the Waiau-ua River.
The edge of the submarine plateau of which New Zealand is the most elevated portion lies about two hundred miles east of the North Island. Thence it extends north-eastward for hundreds of miles in a nearly straight line. The sea-floor to the east is several thousand feet lower, and the precipitous edge of the plateau probably is the scarp of a great fracture-belt. The most active seismic region of New Zealand is at or near the southern end of this submarine scarp, and here have originated several severe earthquakes.
Another submarine earthquake-zone, presumably also a fracture-zone, extends parallel with and some fifty miles from the east coast of the South Island, from opposite Christchurch to south-east of Dunedin. Numerous unimportant earthquakes have originated from this zone.
Another group of earthquake-foci occurs off the west coast of the North Island, opposite Raglan and Kawhia. This, like the other seismic zones, extends in a northeasterly direction parallel with the main mountain-axis of the Dominion. Few earthquakes have been recorded from this locality, the principal being in 1882 and 1891.
The origins of the New Zealand seismic region will be seen to arrange themselves in groups as follows:—
Group I.—Earthquakes felt most strongly on south-east coast of North Island; the origins form a strip 180 miles from the coast, parallel to the axis of New Zealand, and to axis of folding of older rocks in Hawke's Bay. Chief shocks: 17th August, 1868; 7th March, 1890; 23rd and 29th July, 1904; 9th August, 1904 (intensity IX on R.-F. scale); 8th September. 1904; prob. 23rd February, 1863 (IX, R.-F.); &c.
According to the late Captain F. W. Hutton, F.R.S., the geological evidence shows that New Zealand rose considerably in the older Pliocene period, and was then probably joined to the Chatham Islands. At a later period subsidence occurred, followed again by elevation in the Pleistocene period, with oscillations of level since. The seismic origins of this group are at the foot of a sloping submarine plateau, about two hundred miles wide, which culminates to the east-south-east in the Chatham Islands. This elevation is separated from the New Zealand coast by a trough from 1,000 to 2,000 fathoms in depth, which is widest and deepest between these origins and the mainland.
Group II.—
South-east of Otago Peninsula. Shocks: 20th November, 1872, &c.
A strip south-east of Oamaru. Shocks: February, 1876; April, 1876; &c.
Many short and jerky, but generally harmless, quakes felt in Christchurch, Banks Peninsula, and mid-Canterbury. Chief shocks: 31st August, 1870; 27th December, 1888 (VII, R.-F.); &c. Focus of 1888 shock, sixteen miles long, from west-south-west to east-north-east, twenty-four to twenty-five miles below surface, being the deepest ascertained origin in the New Zealand region.
These origins form a line parallel to the general axis of the land. It is possible that the loading of the sea-floor by the detritus brought down by the rivers of Canterbury and Otago is a contributing cause of the earthquakes of this group.
Group III.—Wellington earthquakes of January, 1855, and Cheviot earthquakes of 16th November, 1901, and of 25th December, 1922 (VIII, R.-F.).
The origin of the earthquake of 1855 was probably the fault that forms the eastern boundary of the Rimutaka Range and the western boundary of the Wairarapa Valley.
The origin of the Cheviot earthquake of 1901 was probably in or near the southern continuation of this fault.
The great earthquakes of October, 1848, probably came from the same region as those of January, 1855. The chief shocks of both series did extensive damage to property, and caused the formation of large rifts in the earth's surface; they are the only seismic disturbances since the settlement of the Dominion that can be assigned to degree X on the Rossi-Forel scale.
Group IV.—
Region about twenty-five to thirty miles in length, and ten miles or less in width, running nearly north north-east from middle of Lake Sumner, about twenty miles below the surface, whence proceed most of the severer shocks felt from Christchurch to the Amuri, and a large number of minor shocks. Chief earthquakes: 1st February, 1868; 27th August to 1st September, 1871; 14th September and 21st October, 1878; 11th April, 1884; 5th December, 1881 (VIII, R.-F.), when Christchurch Cathedral spire was slightly injured; 1st September, 1888 (IX, R.-F.), when upper part of same spire fell, and still more severe damage was done in the Amuri district.
A small shallow origin not more than five to ten miles below the surface, a few miles south of Nelson. Earthquake: 12th February, 1893 (VIII to IX, R.-F.); chimneys thrown down and buildings injured.
Origin in Cook Strait, north-north-east of Stephen Island, about ten miles wide, and apparently traceable with few interruptions nearly to mouth of Wanganui River; depth, fifteen miles or more. More than half the earthquakes recorded in New Zealand belong to this region; earthquake of 8th December, 1897 (VIII to IX, R.-F.), and other severer ones came from south-south-west end. Probably the first recorded New Zealand earthquake, felt by Captain Furneaux on the 11th May, 1773, belonged to this region.
Taupo Earthquakes.—During June and July, 1922, earthquakes were almost continuous in the Taupo district. The shocks reached intensity VIII on the Rossi-Forel scale, and then gradually subsided. Conditions were practically normal by the end of the year. The shocks were restricted to a small area of country, and were felt most strongly at Taupo, Wairakei, and Oruanui. The disturbances were accompanied by loud rumblings. No effect appears to have been produced on the thermal activities of the region. Considerable subsidence was reported along the north side of Lake Taupo in a general north-easterly direction.*
Former smart shocks in this region were reported in September-October, 1897.
An origin near Mount Tarawera, with a large number of moderate or slight shocks, most, but not all, volcanic and local in character—e.g., those of September, 1866, and those of June, 1886, which accompanied and followed the well-known eruption of Mount Tarawera.
These origins of Group IV, (a), (b.), (c), (d), (e), are nearly in a straight line on the map; on or near the same line are the origins of earthquakes felt in the Southern Lake District (15th December, 1883, &c.), the volcanoes Ruapehu, Ngauruhoe, Tongariro, Tarawera, and White Island. It is evident that this line, which, like the rest, is parallel or nearly so to the general axis, is a line of weakness or of unstable equilibrium. Hence the adjusting movements that have caused earthquakes may have from time to time relieved the pressure of the rocks that restrained overheated steam and other volcanic agents from bursting out, and so may have led to volcanic eruptions; just as the series of earthquakes in Guatemala and in the Caribbean Sea in April and May, 1902, were the signs of movements in the great folds of that part of the earth's crust, in the course of which, the pressure in the Antillean Ridge being relieved, the volcanic forces below Mount Pelée in Martinique, and Mount Souffrière in St. Vincent, caused the disastrous eruptions of that year.
Group V.—Off the west coast of the North Island near Raglan and Kawhia. Chief shock: 24th June, 1891 (VII to VIII, R.-F.). The line joining this origin to that of the earthquake of 1st February, 1882, is parallel to the other lines of origins (Groups I to IV); but we have no data to establish any connection between them.
Since 1888 there has been established in New Zealand a system of observing local earthquakes at selected telegraph-stations—about eighty in number—distributed throughout the extent of the Dominion.
Whenever a shock occurs and is felt by an officer in charge of one of these stations he fills up a form giving the New Zealand mean time of the beginning of the shock, its apparent duration and direction, and the principal effects observed by him. Some of the officers exhibit considerable care and skill in making up these returns, and the data have been used to determine principal origins of earthquakes within the New Zealand region.
* P. G. Morgan: N.Z. Geological Survey Annual Report for the year 1923, p. 10.
All observers of earthquakes are cordially invited to forward their reports to the Government Seismologist, Dominion Observatory, Wellington, giving all or any of the following particulars:—
Time of beginning of shock (if possible, New Zealand time to nearest quarter-minute).
Whether clock was verified by New Zealand time.*
Apparent direction— e.g., S.E. to N.W., then N.E. to S.W.
Apparent duration of shock.
Effects in terms of the Rossi-Forel scale as under.
Remarks: e.g., previous or subsequent tremors; spilling of liquids, with direction of overflow; rumbling before, during, or after shock.
The Rossi-Forel scale of earthquake intensities is as follows:—
The shock felt by an experienced observer.
Extremely feeble shock: Felt by a small number of persons at rest.
Very feeble shock: Felt by several persons at rest; strong enough for the direction or duration to be appreciable.
Feeble shock: Felt by several persons in motion; disturbances of movable objects, doors, windows; creaking of floors.
Shock of moderate intensity: Felt generally by every one; disturbance of furniture, beds, &c.; ringing of some bells.
Fairly strong shock: General awakening of those asleep; general ringing of bells; oscillation of chandeliers; stopping of clocks; visible disturbance of trees and shrubs; some startled persons leave their dwellings.
Strong shock: Overthrow of movable objects; fall of plaster; ringing of church bells; general panic, without damage to buildings.
Very strong shock: Fall of chimneys; cracks in walls of buildings.
Extremely strong shock: Partial or total destruction of some buildings.
Shock of extreme intensity: Great disaster; buildings ruined; disturbance of strata; fissures in the ground; rock-falls from mountains.
Four seismographs, all with photographic registration, are installed in New Zealand: two are Milne horizontal pendulums, and two the new Milne-Shaw horizontal pendulums. One Milne and two Milne-Shaw seismographs are installed at the Dominion Observatory, Wellington, with their booms placed at right angles; and the other Milne seismograph is installed at the Magnetic Observatory, Christchurch.
A set of Wiechert seismographs with mechanical registration is installed at the Observatory at Apia, Samoa. By the courtesy of the Administrator copies of the records are forwarded to the Dominion Observatory.
One twin-boom Milne seismograph is installed at Suva, Fiji, and by the courtesy of the Government of Fiji the seismograms are forwarded to the Dominion Observatory. The Fiji records are useful in supplementing those of New Zealand.
The records of the New Zealand stations are sent to the General Secretary of the Seismological Committee of the British Association, to the Station Centrale Sismologique, Strasbourg, France, and to the principal observatories of the world, and thus form part of the general system of earthquake-observation being conducted throughout the world since 1890.
The accompanying diagram illustrates graphically the number and intensities of the earthquakes reported to the Seismologist in the years 1923, 1924, and 1925. These reports were supplied by officers of the Post and Telegraph Department, by private observers, and by the newspapers. Each vertical line represents the maximum effect of an earthquake, with the intensities according to the Rossi-Forel scale shown at the sides of the figure. It will be seen that one earthquake in 1925 reached intensity VIII on this scale, while two others in 1925 and one in 1924 reached intensity VII. The figure also shows the distribution in time of the earthquakes.
* A convenient means of verifying the time is provided by the wireless time-signals sent out every day, at 10.30 a.m. N.Z. time, by the Dominion Observatory on a wave-length of 600 metres.
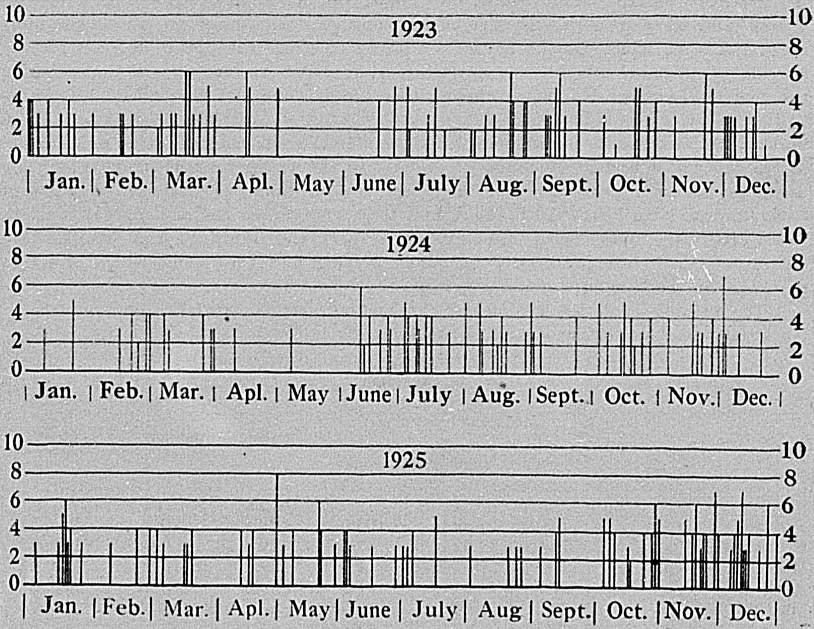
Deaths due to earthquakes in New Zealand are fortunately very few. In the last seventy-five years seven have been recorded.
The shock of October, 1848, throw down a wall in Wellington, and three people were killed.
On the 24th January, 1855, a death occurred at Wellington recorded as “accidental death from the falling of a chimney.” The large earthquake took place during the night of the 23rd January, 1855.
On the 16th November, 1901, a child was killed by the Cheviot earthquake.
On the 12th April, 1913, a Maori was killed at Masterton by material falling from the post-office, due to an earthquake.
On the 7th October, 1914, a shepherd was killed by the Gisborne earthquake.
The following article on the climate of New Zealand has been prepared by the Dominion Meteorologist, Mr D. C. Bates:—
The climate of New Zealand is spoken of in popular and general terms as equable, mild, and salubrious; but such a summary does not convey an adequate idea of variations that exist in a country stretching, as it does, north and south for nearly a thousand miles, and distinctly differentiated by lofty mountain-chains. Another fact which must also be borne in mind is that the greater part of the North Island is controlled by a different system of circulation from that which dominates conditions in the parts about Cook Strait and in the South Island. The former is subject to ex-tropical disturbances, and the latter more to westerly or antarctic “lows,” which travel along the latitudes of the “forties,” with their prevailing westerly winds.
The climate of the Auckland Provincial District, speaking generally, combines degrees of warmth and humidity agreeable by day and comfortable by night. North of Auckland City conditions are almost subtropical, and in summer balmy easterly breezes prevail, and are responsible for delightful conditions. In winter the winds are more north and west, while changes to the south-west or south-east mostly account for the rainfall. Cumulus clouds are frequently formed in the afternoons, and, while tempering the heat of the day, also cut down sunshine records somewhat, but add considerably to the beauty of the land- and sea-scape. Southward of Auckland the climate is more varied, the west coast experiencing more rain, while the central parts are warmer in the day and considerably colder at night. In the winter months frosts, which are unknown farther north, now and then occur in the hours of darkness. Eastward from Rotorua (the great health resort and the centre of the thermal region) is to be found one of the most genial climates in the world, and Tauranga and Opotiki have charms all their own, especially for their weather and the fruits which ripen to perfection in these regions.
The monthly and annual means of the temperature, rainfall, and sunshine of Auckland and Rotorua are shown in the following tables:—
| Auckland. | ||||||
|---|---|---|---|---|---|---|
| Month. | Mean Temperatures. | Mean Rainfall for 73 Years. | Mean Sunshine. | |||
| Maximum. | Minimum. | Mean. | ||||
| °F. | °F. | °F. | Inches. | Days. | Hr. min. | |
| January | 73.6 | 59.0 | 66.5 | 2.66 | 10.4 | 220 31 |
| February | 74.1 | 62.6 | 67.0 | 3.06 | 9.6 | 182 30 |
| March | 71.9 | 57.7 | 64.9 | 3.03 | 11.2 | 174 54 |
| April | 67.7 | 54.6 | 61.2 | 3.46 | 13.9 | 141 56 |
| May | 62.6 | 50.7 | 56.8 | 4.50 | 18.5 | 127 40 |
| June | 59.1 | 47.8 | 53.5 | 4.91 | 19.4 | 114 43 |
| July | 57.5 | 46.0 | 51.7 | 4.98 | 20.8 | 119 47 |
| August | 58.1 | 46.1 | 52.2 | 4.19 | 19.5 | 148 36 |
| September | 60.7 | 48.5 | 54.6 | 3.65 | 17.5 | 146 40 |
| October | 6.5 | 50.9 | 57.2 | 3.64 | 16.5 | 167 51 |
| November | 65.9 | 53.5 | 60.3 | 3.26 | 16.0 | 192 13 |
| December | 70.8 | 56.9 | 63.9 | 2.84 | 11.6 | 206 34 |
| Year | 65.5 | 52.9 | 59.1 | 44.18 | 184.9 | 1,943 55 |
| Rotorua. | ||||||
|---|---|---|---|---|---|---|
| Month. | Mean Temperatures. | Mean Rainfall for 39 Years. | Mean Sunshine. | |||
| Maximum. | Minimum. | Mean. | ||||
| °F. | °F. | °F. | Inches. | Days. | Hr. min. | |
| January | 75.1 | 52.4 | 63.7 | 4.24 | 9.9 | 236 39 |
| February | 74.9 | 52.6 | 63.6 | 3.82 | 8.7 | 188 36 |
| March | 71.7 | 49.6 | 60.6 | 3.54 | 9.8 | 185 4 |
| April | 66.1 | 45.4 | 55.7 | 4.38 | 10.8 | 155 57 |
| May | 60.4 | 40.9 | 50.6 | 5.62 | 12.7 | 137 29 |
| June | 55.9 | 38.5 | 47.1 | 5.29 | 13.2 | 115 34 |
| July | 54.5 | 37.0 | 45.6 | 4.93 | 13.7 | 128 18 |
| August | 56.3 | 37.6 | 46.9 | 4.89 | 13.3 | 143 23 |
| September | 60.0 | 40.9 | 50.4 | 5.22 | 14.2 | 154 25 |
| October | 64.0 | 44.3 | 54.2 | 5.10 | 14.1 | 178 21 |
| November | 68.4 | 46.9 | 57.7 | 4.02 | 12.7 | 209 58 |
| December | 72.8 | 49.9 | 61.2 | 3.67 | 10.1 | 218 26 |
| Year | 65.0 | 44.7 | 54.8 | 54.72 | 143.2 | 2,052 10 |
Hawke's Bay is one of the richest districts in New Zealand, and is favoured with a pleasant climate, being sheltered from westerly winds, though occasionally they are of the warm and dry (Foehn) type. It is rather dry, but ex-tropical disturbances are occasionally responsible for heavy downpours. Though the number of days with rain is less than, and sunshine above, that of other parts, the rainfall is still a good one, and fairly regular throughout the year, though some seasons have been notably dry. The meteorological records of Napier show reliable normals for the coastal districts. Inland the country is rather mountainous and less mild
| Napier. | ||||||
|---|---|---|---|---|---|---|
| Month. | Mean Temperatures. | Mean Rainfall for 47 Years. | Mean Sunshine. | |||
| Maximum. | Minimum. | Mean. | ||||
| °F. | °F. | °F. | Inches. | Days. | Hr. min. | |
| January | 75.5 | 56.8 | 66.1 | 3.18 | 7.2 | 261 27 |
| February | 74.3 | 56.7 | 65.5 | 2.92 | 7.2 | 207 25 |
| March | 71.3 | 54.7 | 63.0 | 3.29 | 7.4 | 217 46 |
| April | 67.2 | 50.2 | 58.7 | 2.92 | 7.6 | 193 18 |
| May | 61.5 | 46.1 | 53.8 | 3.74 | 9.4 | 155 56 |
| June | 57.9 | 42.3 | 50.1 | 3.59 | 10.5 | 155 13 |
| July | 56.4 | 41.5 | 48.9 | 3.90 | 11.3 | 148 17 |
| August | 57.8 | 42.0 | 49.9 | 3.57 | 11.6 | 186 42 |
| September | 62.2 | 45.1 | 53.6 | 2.19 | 9.5 | 215 33 |
| October | 66.3 | 45.7 | 57.5 | 2.30 | 8.5 | 234 1 |
| November | 69.7 | 51.8 | 60.7 | 2.51 | 8.5 | 245 3 |
| December | 73.1 | 55.3 | 64.1 | 2.30 | 7.2 | 270 52 |
| Year | 66.1 | 49.0 | 57.7 | 36.41 | 105.9 | 2,491 33 |
As disclosed by its meteorological records, Wellington, the capital city, has a mean climate for the whole Dominion. Wellington occupies a central position, and is situated near Cook Strait, which divides the two main Islands. It has a somewhat changeable but temperate climate, and, though occasionally subject to disturbances from warmer regions, is usually controlled by the terrestrial wind-currents which have a westerly direction round the world in the latitude of the “forties.” It is popularly regarded as a rather windy spot, for high winds are frequently experienced, although they hardly ever reach hurricane force. Its windiness is largely owing to local configuration, for places quite near Wellington experience very little wind; and to compensate for this rather disagreeable element is a bountiful sunshine, averaging 2,017 hours per annum. There is a plentiful rainfall, amounting to nearly 50 in.
The region between Wellington and Taranaki, following the Taranaki Bight, is probably as fertile and agreeable as any in Australia or New Zealand; but inland, though very productive, conditions are not so favourable.
Taranaki has a rather heavy rainfall, and in most parts of this region the grass is always green. Its climate is mild, and cattle winter in the open. Wanganui and Manawatu districts (which lie between Wellington and Taranaki) have less rainfall than either Wellington or Taranaki.
| Wellington. | ||||||
|---|---|---|---|---|---|---|
| Month. | Mean Temperatures. | Mean Rainfall for 68 Years. | Mean Sunshine. | |||
| Maximum. | Minimum. | Mean. | ||||
| °F. | °F. | °F. | Inches. | Days. | Hr. min. | |
| January | 69.4 | 55.7 | 62.5 | 3.31 | 10.5 | 223 25 |
| February | 69.3 | 55.8 | 62.5 | 3.20 | 9.0 | 208 10 |
| March | 66.9 | 54.2 | 60.5 | 3.28 | 11.3 | 180 35 |
| April | 62.8 | 51.2 | 57.0 | 3.84 | 13.0 | 153 37 |
| May | 58.3 | 47.2 | 52.7 | 4.76 | 16.6 | 125 52 |
| June | 54.7 | 44.2 | 49.4 | 4.90 | 17.2 | 106 3 |
| July | 53.1 | 42.3 | 47.7 | 5.59 | 18.1 | 105 54 |
| August | 54.4 | 42.8 | 48.6 | 4.45 | 16.9 | 145 20 |
| September | 57.5 | 45.7 | 51.6 | 4.02 | 14.9 | 161 51 |
| October | 60.4 | 48.4 | 54.4 | 4.15 | 14.2 | 173 45 |
| November | 63.4 | 50.5 | 56.9 | 3.42 | 12.8 | 202 20 |
| December | 66.9 | 53.9 | 60.4 | 3.29 | 12.1 | 229 57 |
| Year | 61.4 | 49.3 | 55.4 | 48.21 | 166.6 | 2,016 49 |
It may be useful to make a comparison between the records of Wellington and those of Camden Square, London.
| Camden Square, London. | |||
|---|---|---|---|
| Month. | Mean Temperatures. | ||
| Maximum. | Minimum. | Mean. | |
| °F. | °F. | °F. | |
| January | 43.5 | 34.0 | 38.8 |
| February | 45.6 | 34.4 | 40.0 |
| March | 501 | 35.6 | 42.9 |
| April | 57.4 | 39.4 | 48.4 |
| May | 64.9 | 45.2 | 55.1 |
| June | 70.9 | 51.0 | 61.0 |
| July | 74.1 | 54.4 | 64.3 |
| August | 72.6 | 53.7 | 63.2 |
| September | 67.4 | 49.8 | 58.6 |
| October | 57.5 | 43.9 | 50.7 |
| November | 49.7 | 38.9 | 44.3 |
| December | 45.1 | 35.8 | 40.5 |
| Year | 58.2 | 43.0 | 50.6 |
| Moumahaki. | ||||||
|---|---|---|---|---|---|---|
| Month. | Mean Temperatures. | Mean Rainfall for 68 Years. | Mean Sunshine. | |||
| Maximum. | Minimum. | Mean. | ||||
| °F. | °F. | °F. | Inches. | Days. | Hr. min. | |
| January | 70.5 | 52.9 | 61.7 | 3.55 | 10.0 | 233 26 |
| February | 71.1 | 53.0 | 62.1 | 2.89 | 7.7 | 190 52 |
| March | 69.6 | 52.0 | 60.8 | 3.60 | 10.0 | 177 14 |
| April | 64.6 | 47.6 | 56.1 | 3.90 | 13.0 | 150 6 |
| May | 58.7 | 43.9 | 51.3 | 4.22 | 14.9 | 114 59 |
| June | 54.9 | 41.8 | 48.3 | 4.23 | 14.6 | 99 42 |
| July. | 53.3 | 40.0 | 46.7 | 4.19 | 15.7 | 108 27 |
| August | 55.3 | 41.0 | 48.1 | 3.93 | 14.6 | 142 10 |
| September | 59.1 | 44.2 | 51.6 | 3.81 | 13.5 | 148 59 |
| October | 62.1 | 46.7 | 54.4 | 4.67 | 14.9 | 157 56 |
| November | 65.1 | 48.8 | 56.9 | 3.53 | 12.4 | 180 7 |
| December | 68.6 | 50.9 | 59.7 | 3.63 | 12.0 | 227 44 |
| Year | 62.7 | 46.9 | 54.8 | 46.15 | 153.3 | 1,931 42 |
Nelson and Marlborough are highly favoured regions with regard to sunshine and shelter from marine winds. Long ago Bishop Selwyn said, “No one knows what the climate is till he has basked in the almost perpetual sunshine of Tasman's Gulf, with a frame braced and invigorated to the full enjoyment of heat by the wholesome frost or cool snowy breeze of the night before.”
Pastoral and agricultural industries are thriving, and Nelson is also famous for its fruit cultures—apples especially being celebrated for their variety, colour, and flavour. The rainfall about Nelson is very reliable, and averages from 35 in. to 45 in. per annum. Marlborough is also a sunny district, and its rainfall averages from 25 in. to 30 in.
| Nelson. | ||||||
|---|---|---|---|---|---|---|
| Month. | Mean Temperatures. | Mean Rainfall for 68 Years. | Mean Sunshine. | |||
| Maximum. | Minimum. | Mean. | ||||
| °F. | °F. | °F. | Inches. | Days. | Hr. min. | |
| January | 74.9 | 53.9 | 64.3 | 2.82 | 8.4 | 273 23 |
| February | 74.2 | 54.0 | 64.0 | 2.77 | 9.3 | 236 45 |
| March | 71.0 | 51.4 | 61.1 | 308 | 9.0 | 197 53 |
| April | 66.2 | 47.5 | 56.9 | 293 | 9.5 | 194 38 |
| May | 60.0 | 42.5 | 51.2 | 3.08 | 10.5 | 165 1 |
| June | 56.1 | 38.8 | 47.4 | 3.69 | 10.1 | 146 13 |
| July | 54.6 | 37.6 | 46.1 | 349 | 10.8 | 151 47 |
| August | 56.5 | 38.5 | 47.5 | 3.02 | 10.6 | 199 45 |
| September | 60.6 | 42.3 | 51.4 | 3.75 | 12.0 | 199 44 |
| October | 64.7 | 45.4 | 55.0 | 3.59 | 12.0 | 212 39 |
| November | 68.6 | 48.4 | 58.5 | 2.93 | 11.3 | 244 42 |
| December | 71.9 | 51.6 | 61.7 | 2.09 | 8.8 | 259 16 |
| Year | 64.9 | 46.0 | 55.4 | 37.84 | 122.3 | 2,481 46 |
Following are the rainfall and sunshine records for Blenheim:—
| Blenheim. | ||
|---|---|---|
| Month. | Mean Rainfall for 17 Years. | Mean Sunshine. |
| Inches. | Hr. min. | |
| January | 2.32 | 232 3 |
| February | 2.21 | 200 53 |
| March | 2.12 | 180 14 |
| April | 1.85 | 152 36 |
| May | 2.94 | 153 46 |
| June | 3.00 | 135 23 |
| July | 3.51 | 142 23 |
| August | 2.64 | 177 46 |
| September | 2.72 | 181 5 |
| October | 2.62 | 186 17 |
| November | 2.42 | 222 15 |
| December | 1.96 | 190 10 |
| Year | 30.31 | 2,154 51 |
The climate of Westland is influenced by its position with regard to the prevailing westerly winds, its proximity to the sea from which these winds blow, and the mountainous character of its eastern half. The rainfall, as might be expected, is heavy, and ranges from about 70 in. per annum in the north on the coast to as much as 200 in. in the mountainous country. The weather-changes are chiefly due to atmospheric depressions, with lowest pressures passing south of the Dominion. Cyclones centred in the north, while bringing heavy rains to the North Island and the east-coast portions of the South, do not, as a rule, affect Westland, as easterly winds, which then prevail, are not conducive to cloud - formation in this district. Sunshine at Hokitika averages 1,925 hours a year, and, though not so abundant as in east-coast districts, this is a good average amount considering the rainfall. Westland is noted for a clear, beautiful atmosphere during fair-weather periods.
| Hokitika. | ||||||
|---|---|---|---|---|---|---|
| Month. | Mean Temperatures. | Mean Rainfall for 47 Years. | Mean Sunshine. | |||
| Maximum. | Minimum. | Mean. | ||||
| °F. | °F. | °F. | Inches. | Days. | Hr. min. | |
| January | 67.4 | 53.2 | 60.3 | 9.87 | 13.0 | 208 11 |
| February | 68.0 | 53.1 | 60.6 | 7.31 | 11.2 | 190 27 |
| March | 66.0 | 51.1 | 53.5 | 9.70 | 14.3 | 175 1 |
| April | 62.4 | 47.2 | 54.7 | 9.38 | 15.1 | 141 39 |
| May | 57.9 | 42.1 | 49.9 | 9.71 | 15.6 | 134 48 |
| June | 54.4 | 38.7 | 46.4 | 9.60 | 15.4 | 109 48 |
| July | 53.0 | 36.7 | 44.8 | 9.08 | 16.0 | 127 9 |
| August | 54.5 | 38.0 | 46.3 | 9.34 | 160 | 156 6 |
| September | 57.6 | 42.5 | 50.0 | 933 | 16.5 | 142 33 |
| October | 59.6 | 45.7 | 52.7 | 11.84 | 19.1 | 156 35 |
| November | 61.7 | 48.1 | 54.9 | 10.73 | 17.5 | 175 29 |
| December | 65.3 | 51.4 | 58.4 | 10.70 | 16.2 | 207 8 |
| Year | 60.7 | 45.7 | 531 | 116.59 | 185.9 | 1,924 54 |
The chief health resort of the South Island, Hanmer Spa, is situated on a small plateau in the northern portion of the Canterbury Land District. On account of its altitude, 1,120 ft., it enjoys an invigorating climate, with a mean annual temperature of only about one degree below that of Christchurch. Owing to its elevated position and nearness to the mountains Hanmer is in some winter seasons subject to rather severe snowstorms, such as are never experienced on the Canterbury Plains. The mean annual rainfall is 40.82 in., and the mean total sunshine 1,990 hours
The district of Canterbury comprises a variety of topographical features. A plain stretches over a hundred miles from north-east to south-west, with a maximum width of about forty miles from the east coast to the foothills to the westward. The latter merge into the mountainous country culminating in the main range of the Southern Alps, which divides the provincial districts of Canterbury and Westland, and affords a protection from the heavily moisture-laden north-westerly winds. The rainfall of the Canterbury Plains is in consequence much restricted, the average being about 26 in. There is, however, a remarkable progressive increase from east to west, as is shown by the records. At Christchurch the mean is 25.30 in.; at Mount Torlesse Station (near Springfield), 40.24 in. The climate of Canterbury might almost be described as Con in type, with largo extremes of temperature between summer and winter and between day and night. Except in the three summer months frosts are numerous, and even in the early spring and late autumn they are at times severe enough to damage vegetation of a tender nature. In summer, day temperatures of over 90° in the shade are sometimes experienced. With regard to both climate and soil, the Plains have proved most suitable for agricultural farming, and much of the district is capable of growing splendid cereal and root crops. The prevailing winds in Canterbury are north-east and south-west, while north-westerlies are not as often supposed, of frequent occurrence. They are most common in the springtime, and, being dry and warm, they have a somewhat enervating effect, though in winter-time they come as a welcome change from the keen temperatures then generally ruling. The bright sunshine, as recorded at Lincoln, shows a daily average for the year of 5.7 hours.
| Lincoln. | ||||||
|---|---|---|---|---|---|---|
| Month. | Mean Temperatures. | Mean Rainfall for 45 Years. | Mean Sunshine. | |||
| Maximum. | Minimum. | Mean. | ||||
| °F. | °F. | °F. | Inches. | Days. | Hr. min. | |
| January | 71.9 | 51.3 | 61.6 | 2.21 | 9.5 | 212 24 |
| February | 71.3 | 51.7 | 61.5 | 1.65 | 7.7 | 201 13 |
| March | 68.4 | 49.0 | 58.7 | 2.28 | 10.0 | 181 46 |
| April | 63.6 | 44.3 | 54.0 | 2.01 | 9.6 | 158 47 |
| May | 57.4 | 39.8 | 48.5 | 2.33 | 11.3 | 135 49 |
| June | 52.9 | 36.3 | 44.6 | 2.45 | 11.6 | 118 10 |
| July | 511 | 35.2 | 43.1 | 2.75 | 13.2 | 116 41 |
| August | 53.5 | 36.5 | 45.0 | 2.04 | 11.1 | 153 8 |
| September | 58.4 | 40.3 | 49.4 | 1.93 | 9.7 | 178 2 |
| October | 63.2 | 43.9 | 53.6 | 1.68 | 9.3 | 204 16 |
| November | 66.2 | 46.2 | 56.2 | 1.94 | 104 | 218 27 |
| December | 70.1 | 49.3 | 59.7 | 2.12 | 100 | 209 11 |
| Year | 62.3 | 43.7 | 53.0 | 25.39 | 123.4 | 2,087 54 |
Otago, the southernmost part of New Zealand, is very diversified as regards both its physical features and its climate. Inland, in Central and North Otago, the climate is dry and clear—hot in summer and cold in winter. The rainfall for this district averages from 13 in. to 20 in. Near the coast, in the Dunedin district, the rainfall in more plentiful, averaging from 30 in. to 40 in. per annum, a good deal of which falls in light drizzling rains.
There are continuous rainfall records from various parts of Dunedin for seventy years, of which the median rainfall is 33.5 in., and the mean in the table following may be regarded as too high.
| Dunedin. | ||||||
|---|---|---|---|---|---|---|
| Month. | Mean Temperatures. | Mean Rainfall for 69 Years. | Mean Sunshine. | |||
| Maximum. | Minimum. | Mean. | ||||
| °F. | °F. | °F. | Inches. | Days. | Hr. min. | |
| January | 66.3 | 49.6 | 58.0 | 3.36 | 14.3 | 184 26 |
| February | 65.8 | 49.5 | 57.7 | 2.69 | 11.2 | 165 4 |
| March | 63.0 | 47.9 | 55.4 | 2.98 | 13.0 | 137 8 |
| April | 58.7 | 44.8 | 51.7 | 2.82 | 12.7 | 111 23 |
| May | 53.2 | 41.1 | 47.1 | 3.23 | 13.6 | 97 19 |
| June | 49.4 | 38.4 | 43.8 | 3.15 | 12.8 | 87 44 |
| July | 47.7 | 37.1 | 42.4 | 3.01 | 13.0 | 95 33 |
| August | 50.2 | 37.9 | 44.0 | 3.14 | 12.8 | 125 36 |
| September | 55.0 | 40.9 | 47.9 | 2.74 | 12.7 | 144 29 |
| October | 59.2 | 42.9 | 51.0 | 3.09 | 14.3 | 159 26 |
| November | 61.6 | 45.0 | 53.3 | 3.27 | 14.1 | 168 42 |
| December | 64.6 | 48.0 | 56.3 | 3.48 | 14.4 | 186 19 |
| Year | 57.9 | 43.6 | 50.7 | 36.96 | 158.9 | 1,663 9 |
Queenstown, on Lake Wakatipu, amongst the mountains, at an elevation of over 1,000 ft., furnishes the following averages:—
| Month. | Mean Temperatures. | Mean Rainfall for 34 Years. | |||
|---|---|---|---|---|---|
| Maximum. | Minimum. | Mean. | |||
| °F. | °F. | °F. | Inches. | Days. | |
| January | 70.4 | 49.9 | 60.1 | 2.73 | 8.9 |
| February | 70.2 | 49.6 | 59.9 | 1.91 | 5.7 |
| March | 66.4 | 47.9 | 57.1 | 2.64 | 7.6 |
| April | 59.1 | 43.8 | 51.5 | 3.01 | 8.0 |
| May | 51.8 | 38.6 | 45.2 | 2.62 | 7.6 |
| Jane | 45.9 | 33.7 | 39.7 | 2.44 | 6.9 |
| July | 43.3 | 31.8 | 37.5 | 2.03 | 6.1 |
| August | 47.3 | 33.8 | 40.6 | 1.92 | 6.4 |
| September | 54.3 | 38.7 | 46.5 | 2.45 | 7.5 |
| October | 59.8 | 42.1 | 50.9 | 3..46 | 9.2 |
| November | 63.2 | 44.5 | 53.8 | 2.73 | 8.8 |
| December | 68.0 | 49.2 | 58.6 | 2.59 | 8.1 |
| Year | 58.3 | 42.0 | 50.1 | 30.53 | 90.8 |
At Invercargill, the chief town of Southland, the averages are as follow:—
| Month. | Mean Temperatures. | Mean Rainfall for 32 Years. | Mean Sunshine. | |||
|---|---|---|---|---|---|---|
| Maximum. | Minimum. | Mean. | ||||
| °F. | °F. | °F. | Inches. | Days. | Hr. min. | |
| January | 66.5 | 48.0 | 57.2 | 4.01 | 15.5 | 203 8 |
| February | 66.1 | 47.4 | 56.8 | 2.85 | 12.0 | 161 10 |
| March | 63.8 | 45.7 | 54.7 | 3.90 | 14.7 | 120 57 |
| April | 59.2 | 42.4 | 50.8 | 4.36 | 16.8 | 107 12 |
| May | 53.7 | 37.7 | 45.8 | 4.46 | 17.8 | 88 42 |
| June | 49.8 | 35.4 | 42.7 | 3.60 | 16.3 | 91 16 |
| July | 48.8 | 33.9 | 41.4 | 3.28 | 16.0 | 81 26 |
| August | 52.0 | 35.5 | 43.8 | 3.31 | 15.1 | 120 33 |
| September | 57.0 | 39.0 | 48.1 | 3.11 | 13.9 | 138 32 |
| October | 60.0 | 42.5 | 51.3 | 4.44 | 17.3 | 151 6 |
| November | 61.6 | 43.9 | 52.8 | 4.40 | 17.8 | 175 16 |
| December | 64.1 | 46.1 | 55.2 | 4.26 | 16.1 | 161 17 |
| Year | 58.6 | 41.5 | 50.0 | 45.98 | 189.3 | 1,600 35 |
The average rainfall of Southland is between 40 in. and 50 in., but towards Queenstown the rainfall is between 30 in. and 40 in. The rainfall is well distributed throughout the year, and there is less wind in winter than in summer.
Stewart Island has a wonderfully mild and moist climate, especially on its eastern side, with an average rainfall of 65.18 in.
The total rainfall for the year was below the average over most of the North Island and in the West Coast district northward of Greymouth and the extreme south of the South Island, while elsewhere it was above the average.
Following is a brief summary for each month of the weather and the chief atmospheric systems which were in evidence:—
January.—Several ex-tropical disturbances accounted for unsettled conditions from the 20th to the close of the month, and between the 25th and 27th some heavy rains occurred.
Rain also fell generally about the 12th, but the weather during the remainder of the month was, on the whole, warm and fair, and in the first half some high temperatures were recorded, particularly in the East Coast districts.
The rain about the 26th proved most beneficial to farmers and graziers in most parts of the Dominion.
Except in the East Coast districts of the North Island and parts of the Nelson and North Canterbury districts in the South, the total month's rainfall was below the average, and remarkably so in Otago.
Mean temperatures were mostly higher than usual, but there were cold snaps about the 11th, 17th, and 26th.
February.—During the first half of February most parts of the Dominion experienced fair weather, but the last half was dominated chiefly by westerly low-pressure areas which accounted for the prevalence of high westerly winds, unsettled, and, at times, stormy conditions.
Heavy rains occurred, especially in all the western districts and southern portion of the South Island. These parts recorded a total rainfall considerably above the average, while the east coast districts of both Islands experienced a deficiency, a reversal of the position in the previous month.
Conditions were particularly stormy about the 18th and 22nd, on both of which days the barometer fell very low in the South. The high winds caused much damage to fruit crops in various parts of the Dominion.
March.—In marked contrast to the same month last year, March proved one of the driest ever recorded, particularly in the East Coast districts. Rainfall was considerably below the average in all parts of the Dominion, with the exception of the high country and South Westland and Otago in the South Island and New Plymouth in the North Island.
During the first fortnight the weather was changeable, with squally and showery conditions, especially in the West Coast and southern districts. An anticyclone then ruled until the 25th with fair weather generally. The latter part of the month was somewhat unsettled, but, on the whole, the weather during the month was dry and sunny, with warm days and cool nights.
On the last two days sharp frosts occurred in many places.
April.—April proved a fine, dry, and sunny month on the whole, with rainfall generally below the average. In parts of Canterbury, however, the total was in excess, and considerably so at places about Bank's Peninsula. This is accounted for by a particularly heavy downpour on the 16th, which resulted from a cyclonic disturbance passing between the 15th and 19th and which intensified when located off the east coast. The east coast of the North Island was not affected by this storm, the aggregate rainfall in that district showing the greatest percentage below normal for the whole of the Dominion during April, Napier having only 8 per cent. of its mean precipitation.
Except during the period when the above-mentioned cyclone ruled, and also between the 5th and 8th when a rather intense westerly low-pressure area was in evidence, atmospheric pressure was usually above normal.
May.—During May the most remarkable meteorological feature was the number of cyclonic disturbances which passed in the North. On this account rainfall was greatly in excess of the average over the North Island and in the east-coast portions of the South Island, and deficient in the western and southernmost districts of the South.
There were two periods when fair weather prevailed over the Dominion as a whole —viz., between the 7th and 11th and the 24th and 28th; but during the remainder of the month, except in Westland and Otago, unsettled and wet weather predominated.
Heavy rains and floods occurred in the northern districts about the 12th, 14th, and 15th, and very stormy conditions were experienced over the Dominion on the 22nd and 23rd, with further floods in the North. Both these stormy periods resulted from ex-tropical cyclones, and an intense cyclone also made the close of the month extremely unpleasant for the northern districts.
June.—The weather in June was dominated by similar conditions to those experienced in May, there being again a remarkable prevalence of ex-tropical disturbances. The latter chiefly affected the North Island and the north-east districts of the South, and, in consequence, these parts received a rainfall considerably above the average, while in South Canterbury, Otago, and Westland fair weather predominated, with a low rainfall.
Except for a period of anticyclonic conditions and fine weather between the 11th and 22nd, the weather was extremely unsettled and, at times, stormy. During the last week, owing to abnormal rains large areas of country in the northern districts were flooded, and on the last three days snow fell in many parts of the South Island.
July.—The stormy conditions which were prevalent during the last week of June continued into July until the 10th, heavy rains and floods being experienced in the northern and East Coast districts. The Canterbury rivers also flooded, owing to the warm rains melting the recently fallen snow in the higher country.
Unsettled and wet weather also ruled between the 13th and 16th and the 21st and 25th. During the latter period an extensive disturbance held sway, with very low pressure in the South, and beneficial rains fell in Otago, where extremely dry weather had been experienced for some time.
Anticyclonic conditions and fair weather prevailed generally between the 10th and 13th, the 17th and 19th, and from the 26th to the close of the month.
The total rainfall was above the mean in the Bay of Plenty, Hawke's Bay, and Taranaki districts in the North Island, and in Westland and Canterbury in the South Island. Auckland and Wellington districts, as well as parts of Otago and the central portion of the South Island, recorded a deficiency.
On the whole, the weather proved dull, mild, and humid, and in most parts of the Dominion there was more than the usual growth of grass for the time of the year.
August.—August proved a dull and wet month in most parts of the country, the East Coast districts especially having a total rainfall considerably in excess of the average. The Auckland and Taranaki Provinces in the North Island, and the country about Westport, Greymouth, and Foveaux Strait in the South, had a deficiency. Westland, owing to a prevalence of east to south-east winds, appears to have experienced the greatest number of fine days.
A storm of somewhat local character occurred in Canterbury on the 6th and 7th, with heavy rain, snow, and bleak weather. A cyclone passed in the North between the 12th and 15th, accounting for high east to south-east winds and some heavy downpours. Anticyclonic conditions followed, and the highest reading of the barometer, 30.675 inches, was registered at Wellington on the morning of the 17th.
An intense westerly disturbance passed in the South, with a barometer reading of 28.95 inches, at the Bluff, on the 23rd, and was preceded and followed by very unsettled weather. Snow, hail, and thunderstorms were reported at various times on high country of the South, and some sleet at lower levels.
The wet weather was a great hindrance to farming operations in Canterbury, and growth of grass was delayed by several frosts and dull weather in many other parts of the country.
September.—The weather during September was, on the whole, unsettled, bleak, and squally. Westerly disturbances predominated, and were usually of considerable extent and intensity. Rainfall was therefore above the average in districts having a westerly aspect, and deficient at most places on the east coast of both islands.
Stormy weather prevailed generally between the 3rd and 8th, and during this period some heavy snowfalls were experienced in the South Island. Conditions were also severe from the 19th to the 27th, very heavy rains accounting for flooded rivers in Westland about this time.
The month was an extremely unfavourable one for agricultural and pastoral pursuits, and vegetable growth was very backward on account of the cold and lack of sunshine.
October.—October's weather was an improvement on that experienced in the preceding spring and winter months, less wind and more continued warmth being favourable to vegetable growth and stock.
Although westerly disturbances predominated, only one, which passed in the South between the 13th and 15th, was of marked intensity, causing strong northerly to westerly winds and considerable rain, especially in the South and about Cook Strait.
Anticyclonic conditions ruled during the last week, when fine sunny days and cold nights were experienced generally.
The total month's rainfall was below the average in all districts, except Nelson and parts of Otago in the South Island, and about the Bay of Islands in the North.
November.—As in the preceding month, weather conditions during November were chiefly affected by westerly disturbances, with lowest pressure southward of New Zealand, and northerly to westerly winds predominated. Southerly changes, however, occurred on several occasions, and, though of brief duration, they were very marked, and were in parts accompanied by hail and sleet, and followed by frosts.
Two disturbances intensified considerably after passing to the eastward, and accounted for severe southerly gales on the 16th and 26th, with cold squally conditions, particularly along the east coast.
The aggregate rainfall for the month was mostly below the mean of previous years, but above along the east coast of the South Island southward of Kaikoura and in Westland.
On the whole, the weather, though somewhat changeable, was warm, dry, and windy.
December.—Warm, dry, and windy weather was experienced during December in most parts of the Dominion and, except in Westland and the high country of the South Island, the aggregate month's rainfall was everywhere below the mean. The latter districts had more than their average precipitation, chiefly owing to two severe westerly storms, one which ruled on the 3rd and 4th, and the other between the 9th and 11th. The heavy rains during these two periods caused floods in the West Coast rivers, and also, at the same time, some of the Canterbury rivers flooded, owing to the melting of the snow on the eastern slopes of the Southern Alps.
There were several other minor westerly disturbances during the month, and only one ex-tropical “low,” which passed too far north to benefit Hawke's Bay. A thunderstorm there, however, on. New Year's Eve, brought some temporary relief from an extended period of drought.
The following tables show the difference, above or below the mean, for each month in the year:—
| NORTH ISLAND RAINFALL, 1925. Monthly Means compared with the Averages for Twenty Previous Years. | ||||||||||||
|---|---|---|---|---|---|---|---|---|---|---|---|---|
| Jan. | Feb. | March. | April. | May. | June. | July. | Aug. | Sept. | Oct. | Nov. | Dec. | |
| + | .. | .. | .. | .. | 6.40 | 8.23 | .. | 4.44 | 4.73 | .. | .. | .. |
| Av. | 3.58 | 3.12 | 4.16 | 4.05 | 4.68 | 4.55 | 4.80 | 4.16 | 3.68 | 4.39 | 3.57 | 3.50 |
| – | 3.16 | 2.56 | 1.85 | 1.74 | .. | .. | 4.75 | .. | .. | 3.34 | 2.07 | 1.46 |
| Mean Number of Days with Rain, compared with the Averages for Twenty Previous Years. | ||||||||||||
|---|---|---|---|---|---|---|---|---|---|---|---|---|
| Jan. | Feb. | March. | April. | May. | Jane. | July. | Aug. | Sept. | Oct. | Nov. | Dec. | |
+ Above the average. - Below the average. | ||||||||||||
| + | .. | 11.0 | .. | .. | 17.0 | 17.8 | 16.5 | 17.0 | 20.0 | 16.5 | 13.7 | .. |
| Av. | 10.6 | 8.6 | 11.3 | 12.4 | 14.8 | 15.6 | 16.1 | 14.7 | 13.8 | 15.1 | 13.3 | 11.3 |
| – | 9.7 | 8.0 | 11.0 | .. | .. | .. | .. | .. | .. | .. | .. | 8.1 |
| SOUTH ISLAND RAINFALL, 1925. Monthly Means compared with the Averages for Twenty Previous Years. | ||||||||||||
|---|---|---|---|---|---|---|---|---|---|---|---|---|
| Jan. | Feb. | March. | April. | May. | June. | July. | Aug. | Sept. | Oct. | Nov. | Dec. | |
| + | .. | .. | .. | 3.52 | .. | .. | 4.58 | 4.73 | 4.26 | .. | .. | .. |
| Av. | 3.76 | 2.64 | 3.37 | 3.38 | 3.62 | 3.68 | 3.50 | 3.02 | 3.61 | 3.88 | 3.40 | 3.59 |
| – | 2.02 | 2.50 | 2.63 | .. | 2.84 | 3.19 | .. | .. | .. | 3.24 | 3.04 | 2.46 |
| Mean Number of Days with Rain, compared with the Averages for Twenty Previous Years. | ||||||||||||
|---|---|---|---|---|---|---|---|---|---|---|---|---|
| Jan. | Feb. | March. | April. | May. | June. | July. | Aug. | Sept. | Oct. | Nov. | Dec. | |
+ Above the average. - Below the average. | ||||||||||||
| + | .. | 12.5 | .. | .. | .. | .. | .. | 14.0 | 15.0 | .. | .. | .. |
| Av. | 12.4 | 9.1 | 11.4 | 11.7 | 12.5 | 12.8 | 12.7 | 12.1 | 12.7 | 14.0 | 13.3 | 12.3 |
| – | 8.6 | .. | 9.0 | 9.0 | 11.0 | 12.3 | 12.0 | .. | .. | 11.9 | 12.4 | 11.1 |
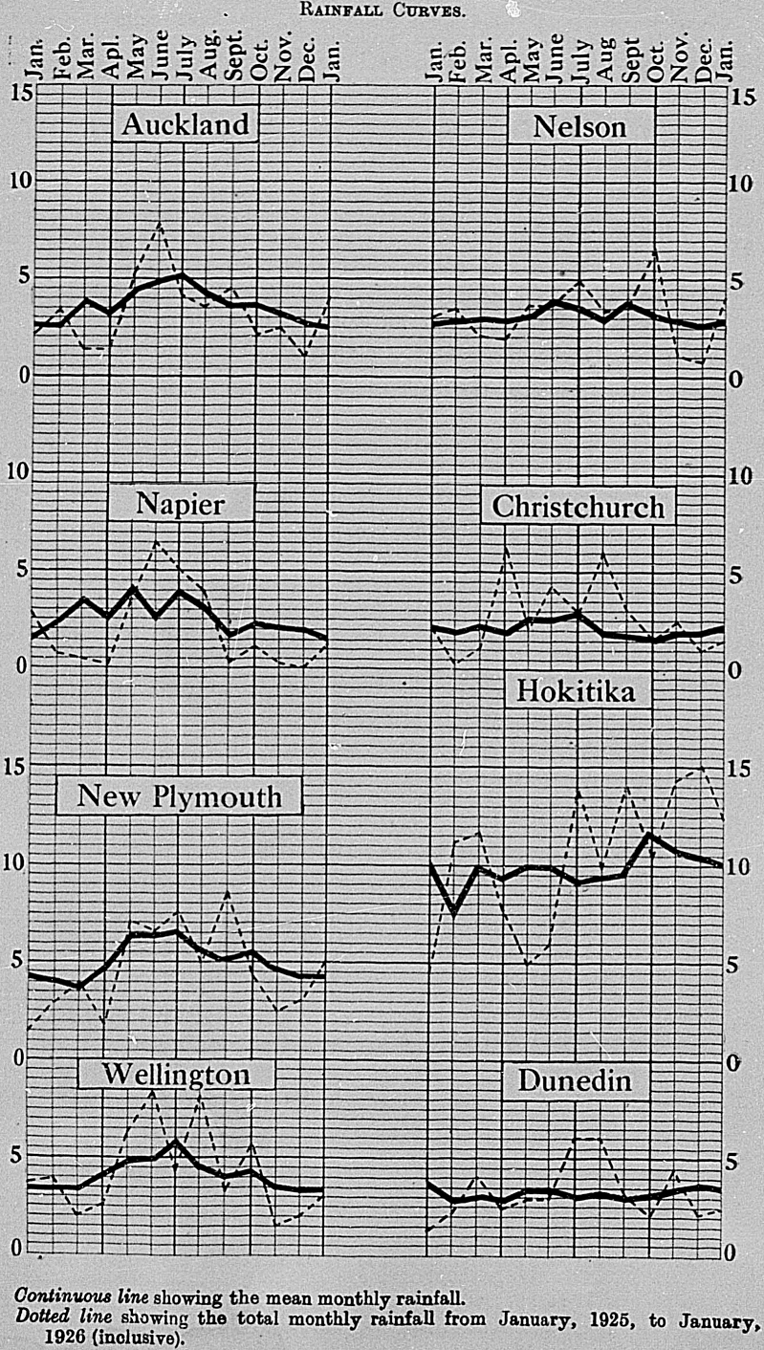
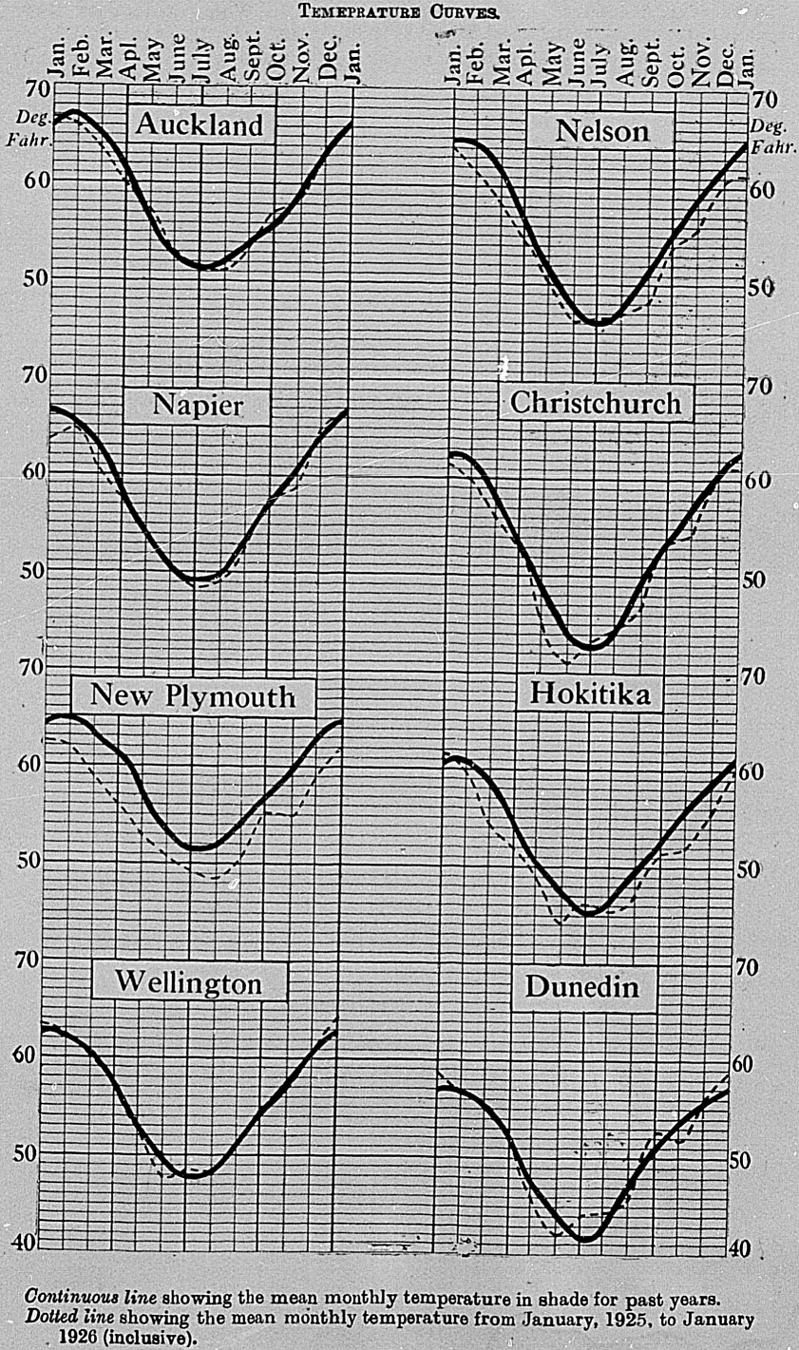
| TEMPERATURE, RAINFALL, ATMOSPHERIC PRESSURE, AND WIND THROUGHOUT NEW ZEALAND, ASOBSERVEDAT TWENTY-SIX STATIONS, FORTHE YEAR 1925.The observations were taken at 9 a.m. | ||||||||||
|---|---|---|---|---|---|---|---|---|---|---|
| Stations. | Months. | Temperature in Shade. | Rainfall. | Mean Height of Barometer. | Prevailing Winds. | |||||
| Highest. | Lowest. | Mean Max. Temp. | Mean Min. Temp. | Mean Temp. for Month. | Wet Days. | Fall. | ||||
| Auckland (lat. 36° 50' S.; long. 174° 50' 4' E.; alt. 125 ft.)— | °Fahr. | °Fahr. | °Fahr. | °Fahr. | °Fahr. | No. | Inches. | Inches. | ||
| January | 77.2 | 55.0 | 73.1 | 60.5 | 66.8 | 10 | 2.12 | 29.973 | NE, SW. | |
| February | 77.0 | 55.0 | 72.6 | 59.3 | 66.0 | 14 | 3.37 | 29.901 | W, E. | |
| March | 75.0 | 50.0 | 69.9 | 57.3 | 63.6 | 8 | 1.30 | 30.050 | SW, NW. | |
| April | 710 | 46.0 | 66.2 | 53.8 | 60.0 | 13 | 1.28 | 30.209 | E, SW. | |
| May | 68.0 | 44.0 | 62.4 | 52.2 | 57.3 | 24 | 5.25 | 30.073 | E, W. | |
| June | 63.0 | 38.0 | 57.9 | 48.0 | 53.0 | 21 | 7.85 | 29.927 | S, E. | |
| July | 650 | 380 | 57.2 | 46.0 | 51.6 | 20 | 4.17 | 29.900 | E,W. | |
| August | 640 | 38.0 | 57.1 | 450 | 51.1 | 17 | 3.68 | 29.935 | SW, N. | |
| September | 67.0 | 40.0 | 59.0 | 47.9 | 53.5 | 25 | 4.60 | 29.830 | W, NW. | |
| October | 690 | 45.4 | 62.7 | 51.6 | 57.2 | 19 | 2.03 | 29.997 | NW, S. | |
| November | 72.0 | 43.0 | 64.4 | 52.0 | 58.2 | 15 | 2.44 | 30.016 | W, NW. | |
| December | 79.0 | 52.0 | 69.0 | 57.0 | 63.0 | 11 | 1.12 | 30.005 | SW, W. | |
| Ruakura Farm of Instruction, Hamilton E. (lat. 37° 47' S.; long, 175° 20' E.; alt. 131 ft.)— | January | 84.2 | 41.4 | 78.3 | 50.6 | 64.5 | 10 | 3.30 | .. | NE, SW. |
| February | 82.8 | 40.2 | 76.0 | 50.0 | 63.0 | 13 | 2.55 | .. | W, E. | |
| March | 79.0 | 32.0 | 74.1 | 44.8 | 59.4 | 10 | 2.01 | .. | W. | |
| April | 75.8 | 26.2 | 68.5 | 41.2 | 54.9 | 12 | 0.96 | .. | W, NE. | |
| May | 70.0 | 28.8 | 64.0 | 43.4 | 53.7 | 19 | 5.59 | .. | NE, NW. | |
| June | 68.6 | 25.0 | 59.8 | 39.7 | 49.8 | 16 | 7.87 | .. | SE, SW. | |
| July | 64.4 | 24.0 | 58.9 | 36.4 | 47.7 | 16 | 5.99 | .. | SW, SE. | |
| August | 66.0 | 27.8 | 59.7 | 35.4 | 47.5 | 13 | 2.50 | .. | SW, SE. | |
| September | 66.0 | 29.8 | 60.3 | 40.4 | 50.3 | 23 | 508 | .. | W, NE. | |
| October | 73.6 | 32.0 | 66.2 | 45.3 | 55.7 | 17 | 2.93 | .. | W, NE. | |
| November | 74.0 | 310 | 67.4 | 44.9 | 56.2 | 18 | 3.36 | .. | W. | |
| December | 82.6 | 39.0 | 73.5 | 50.3 | 61.9 | 10 | 2.10 | .. | W. | |
| Te Aroha (lat. 37° 32' S.; long, 175° 42' E.; alt. 46 ft.)— | January | 85.0 | 46.0 | 79.7 | 56.3 | 68.0 | 9 | 3.82 | .. | SE, NW. |
| February | 85.0 | 43.0 | 78.4 | 53.9 | 66.1 | 11 | 1.63 | .. | W, SE. | |
| March | 80.0 | 35.0 | 76.1 | 50.1 | 63.1 | 8 | 1.81 | S, NW. | ||
| April | 75.6 | 38.0 | 70.6 | 46.7 | 58.6 | 14 | 1.19 | .. | S, NE, NW. | |
| May | 76.0 | 32.0 | 66.5 | 45.2 | 55.8 | 15 | 5.52 | .. | S, NW, N. | |
| June | 68.0 | 25.0 | 60.6 | 41.7 | 511 | 16 | 9.50 | .. | S, W. | |
| July | 66.0 | 25.0 | 60.8 | 39.3 | 50.0 | 17 | 6.61 | .. | N, W. | |
| August | 66.0 | 26.0 | 62.4 | 36.5 | 49.4 | 14 | 7.67 | .. | N, S. | |
| September | 65.0 | 33.0 | 61.6 | 44.1 | 52.8 | 19 | 4.35 | .. | NW, W. | |
| October | 75.0 | 35.0 | 68.2 | 49.0 | 58.6 | 18 | 5.21 | .. | NW, S. | |
| November | 78.0 | 30.0 | 72.3 | 46.0 | 59.1 | 14 | 3.57 | .. | NW, W. | |
| December | 84.0 | 32.0 | 77.5 | 51.0 | 64.2 | 8 | 1.10 | .. | W, NW. | |
| waihi (lat. 37° 28' S.; long, 330 ft.— | January | 84.2 | 44.3 | 77.4 | 55.5 | 66.4 | 10 | 3.42 | 29.996 | W, SE. |
| February | 81.5 | 41.9 | 74.6 | 52.3 | 63.4 | 13 | 4.63 | 29.941 | W, SE. | |
| March | 80.3 | 34.0 | 73.4 | 49.0 | 61.2 | 9 | 1.76 | 30.078 | W, SW. | |
| April | 73.7 | 27.5 | 67.4 | 45.7 | 56.5 | 13 | 1.36 | 30.221 | W, E. | |
| May | 70.3 | 28.4 | 63.3 | 45.6 | 54.4 | 21 | 10.94 | 30.131 | NW, E. | |
| June | 65.4 | 25.2 | 58.3 | 41.9 | 50.1 | 15 | 15.86 | 29.976 | E, NW. | |
| July | 64.7 | 24.6 | 57.7 | 37.9 | 47.8 | 17 | 9.10 | 29.955 | NW, W. | |
| August | 66.2 | 24.8 | 58.4 | 37.2 | 47.8 | 15 | 15.86 | 29.972 | SW, E. | |
| September | 67.6 | 28.5 | 60.2 | 43.4 | 51.8 | 24 | 7.38 | 29.846 | W, SW. | |
| October | 74.2 | 35.1 | 66.2 | 47.7 | 56.9 | 16 | 5.36 | 30.021 | NW, E. | |
| November | 76.4 | 29. | 68.1 | 48.3 | 58.2 | 15 | 2.95 | 30.011 | W, SW. | |
| December | 86.7 | 42.3 | 74.4 | 54.5 | 64.4 | 6 | 1.07 | 29.994 | W, SW. | |
| Tauranga (lat. 37° 42' S.; long. 176° 22' E.; alt. 100ft.) | January | 84.0 | 45.0 | 72.4 | 56.1 | 64.2 | 10 | 2.70 | .. | SW, NE. |
| February | 78.0 | 45.0 | 72.8 | 53.7 | 63.2 | 10 | 2.54 | .. | SW, SE. | |
| March | 76.0 | 41.0 | 70.9 | 50.4 | 60.6 | 8 | 1.74 | .. | SW, NW. | |
| April | 72.0 | 36.0 | 64.3 | 47.4 | 56.1 | 15 | 1.68 | .. | S, NE. | |
| May | 70.0 | 38.0 | 63.4 | 47.3 | 55.3 | 15 | 8.46 | .. | SW, S. | |
| June | 64.0 | 33.0 | 59.3 | 43.5 | 51.4 | 15 | 15.01 | .. | S, SE. | |
| July | 65.0 | 31.0 | 58.8 | 40.6 | 49.7 | 16 | 5.40 | .. | S, SW. | |
| August | 66.0 | 31.0 | 58.9 | 39.1 | 49.5 | 15 | 3.20 | .. | S, NW. | |
| September | 68.0 | 34.0 | 60.5 | 43.5 | 52.0 | 20 | 3.87 | .. | SW, NW. | |
| October | 78.0 | 36.0 | 64.8 | 48.2 | 56.5 | 1.9 | 3.93 | .. | SW, NE. | |
| November | 77.0 | 34.0 | 68.9 | 46.7 | 57.8 | 11 | 2.30 | .. | SW, W. | |
| December | 83.0 | 47.0 | 74.0 | 53.4 | 63.7 | 1.90 | SW. | |||
| Rotorua (lat. 38° 9' S.; long. 176° 15' E.; alt. 932ft.)— | January | 82.0 | 44.0 | 74.4 | 55.4 | 64.9 | 14 | 6.76 | .. | NE, W. |
| February | 78.0 | 43.0 | 71.5 | 51.0 | 61.2 | 11 | 3.40 | .. | W, SE. | |
| March | 78.0 | 38.0 | 71.0 | 47.6 | 59.3 | 8 | 2.51 | .. | SW, S. | |
| April | 70.0 | 33.0 | 64.7 | 44.0 | 54.3 | 11 | 2.56 | .. | SW, NW. | |
| May | 67.0 | 34.0 | 60.5 | 44.6 | 52.5 | 14 | 7.20 | .. | SW, NE. | |
| June | 63.0 | 31.0 | 56.1 | 40.3 | 48.2 | 14 | 12.64 | .. | SW, SE. | |
| July | 61.0 | 28.0 | 55.3 | 37.0 | 46.1 | 11 | 5.38 | .. | SE, S. | |
| August | 63.0 | 28.0 | 55.9 | 36.8 | 46.3 | 16 | 4.09 | .. | S, NE. | |
| September | 63.0 | 32.0 | 56.7 | 41.1 | 48.9 | 21 | 6.20 | .. | NE, W. | |
| October | 74.0 | 35.0 | 62.9 | 46.4 | 54.6 | 21 | 6.66 | .. | NE, SE. | |
| November | 76.0 | 31.0 | 65.7 | 44.8 | 55.2 | 9 | 2.39 | .. | W, SW. | |
| December | 84.5 | 44.0 | 72.7 | 51.7 | 62.2 | 6 | 1.90 | .. | W, SW, NE. | |
| New Plymouth (lat. 39° 3' 35' S.; long. 174° 4' 58' E.; alt. 60 ft.)— | January | 75.0 | 46.2 | 70.9 | 53.9 | 62.4 | 6 | 1.48 | .. | N, SE. |
| February | 75.0 | 44.2 | 69.8 | 54.3 | 62.0 | 11 | 2.91 | .. | SE, W. | |
| March | 69.3 | 40.5 | 66.3 | 51.1 | 58.7 | 11 | 3.90 | .. | SE, W. | |
| April | 68.0 | 39.8 | 63.9 | 48.6 | 56.2 | 11 | 1.83 | .. | SE, W. | |
| May | 64.0 | 38.0 | 59.1 | 47.1 | 53.1 | 17 | 7.14 | .. | SE, SW. | |
| June | 62.0 | 32.2 | 56.4 | 45.2 | 50.8 | 17 | 6.64 | .. | SE, SW. | |
| July | 60.2 | 32.6 | 55.3 | 43.5 | 49.4 | 19 | 7.53 | .. | SE. | |
| August | 62.2 | 32.5 | 56.3 | 40.8 | 48.6 | 18 | 5.06 | .. | SE. | |
| September | 60.4 | 34.6 | 56.6 | 44.4 | 50.5 | 27 | 8.66 | .. | NW, SE. | |
| October | 69.3 | 34.2 | 61.6 | 48.9 | 55.2 | 20 | 4.39 | .. | SE, N. | |
| November | 65.4 | 34.3 | 61.2 | 48.6 | 54.9 | 21 | 2.49 | .. | NW, W. | |
| December | 71.1 | 47.0 | 64.6 | 52.8 | 58.7 | 14 | 3.02 | .. | NW, W. | |
| Napier (lat. 39° 29' S.; long. 176° 55' E.; alt. 5ft.)— | January | 84.5 | 45.5 | 71.40 | 56.2 | 63.6 | 13 | 2.87 | .. | E, W. |
| February | 82.5 | 49.5 | 72.5 | 56.9 | 64.7 | 8 | 0.72 | .. | S, NE, W. | |
| March | 81.0 | 40.5 | 70.1 | 51.6 | 60.8 | 5 | 0.53 | .. | W, N, E. | |
| April | 79.5 | 35.5 | 67.4 | 48.1 | 57.7 | 0.18 | .. | W. | ||
| May | 75.0 | 36.5 | 61.6 | 46.8 | 54.2 | 15 | 3.59 | .. | w. | |
| June | 65.0 | 33.5 | 55.0 | 45.4 | 50.2 | 23 | 6.57 | .. | W, SW. | |
| July | 64.0 | 31.5 | 55.9 | 41.0 | 48.4 | 16 | 5.15 | .. | SW, NW. | |
| August | 65.5 | 31.5 | 56.3 | 42.0 | 49.1 | 20 | 4.10 | .. | SW, W. | |
| September | 72.5 | 33.0 | 60.8 | 41.1 | 52.6 | 6 | 0.34 | .. | W, NW. | |
| October | 75.5 | 37.5 | 64.9 | 50.6 | 57.7 | 10 | 1.17 | .. | SW, E. | |
| November | 77.0 | 37.0 | 67.8 | 49.7 | 58.7 | 7 | 0.28 | .. | W, E. | |
| December | 84.0 | 47.5 | 74.1 | 56.0 | 65.0 | 1 | 0.01 | .. | NW, W, E. | |
| Taihape (lat. 39° 40' S.; long. 175° 49' E.; alt. 2,080 ft.)— | January | 79.4 | 40.7 | 70.1 | 50.7 | 60.4 | 13 | 3.60 | .. | W, E. |
| February | 74.0 | 42.2 | 66.2 | 49.3 | 57.7 | 13 | 1.41 | .. | W, NE. | |
| March | 72.4 | 35.0 | 64.5 | 46.5 | 55.5 | 8 | 1.81 | .. | W, NE. | |
| April | 68.0 | 32.0 | 59.8 | 43.0 | 51.4 | 10 | 0.93 | .. | W, SW. | |
| May | 64.8 | 32.8 | 54.2 | 41.3 | 47.7 | 18 | 5.76 | .. | W, NE, NW. | |
| June | 62.2 | 30.0 | 49.0 | 38.7 | 43.8 | 21 | 4.46 | .. | N, S. | |
| July | 57.8 | 27.0 | 48.3 | 36.5 | 42.4 | 18 | 2.43 | .. | NE, NW. | |
| August | 57.0 | 29.2 | 48.0 | 35.8 | 41.9 | 20 | 3.32 | .. | S, NE. | |
| September | 56.0 | 29.0 | 49.3 | 37.7 | 43.5 | 21 | 4.74 | .. | NW, SW. | |
| October | 68.0 | 33.0 | 57.4 | 42.5 | 49.9 | 13 | 2.57 | .. | NW, W. | |
| November | 68.0 | 31.4 | 57.9 | 42.3 | 50.1 | 17 | 2.29 | .. | W, SW. | |
| December | 75.2 | 40.0 | 65.4 | 47.3 | 56.3 | 7 | 1.56 | .. | SW, W, NW. | |
| Palmerston North (lat. 40° 21' S.; long, 175° 37' E.; alt. 100 ft.— | January | 83.5 | 45.0 | 74.6 | 54.7 | 64.6 | 7 | 4.01 | .. | W, E. |
| February | 81.5 | 43.0 | 71.8 | 52.0 | 61.9 | 8 | 2.44 | .. | W, E. | |
| March | 76.0 | 34.0 | 69.3 | 47.3 | 58.3 | 9 | 4.11 | .. | W. | |
| April | 74.0 | 32.0 | 65.8 | 44.6 | 55.2 | 10 | 2.37 | .. | W, E. | |
| May | 66.0 | 32.0 | 58.1 | 45.6 | 51.8 | 17 | 4.94 | .. | W, E. | |
| June | 65.0 | 29.0 | 54.8 | 41.8 | 48.3 | 18 | 3.83 | .. | E, W. | |
| July | 63.0 | 25.0 | 55.0 | 40.8 | 47.9 | 16 | 2.16 | .. | W, E. | |
| August | 67.0 | 28.0 | 56.1 | 38.7 | 47.4 | 18 | 2.81 | .. | E, W. | |
| September | 64.0 | 30.0 | 56.4 | 43.0 | 49.7 | 19 | 4.52 | .. | W. | |
| October | 73.0 | 35.0 | 63.8 | 47.2 | 55.5 | 15 | 1.59 | .. | W, E. | |
| November | 70.0 | 33.0 | 63.4 | 47.7 | 55.5 | 16 | 1.72 | .. | W. | |
| December | 76.0 | 45.0 | 69.7 | 52.5 | 61.1 | 8 | 1.04 | .. | W. | |
| Tangimoana (lat. 40° 20' S.; long. 175° 18' E.; alt. 8 fg.)— | January | 81.0 | 44.0 | 73.6 | 51.6 | 62.6 | 7 | 3.15 | .. | NW, SE. |
| February | 80.0 | 42.0 | 71.3 | 50.8 | 61.0 | 10 | 1.98 | .. | NW, SE. | |
| March | 74.5 | 39.0 | 68.4 | 48.0 | 58.2 | 8 | 1.36 | .. | NW, E. | |
| April | 70.0 | 31.5 | 64.8 | 42.7 | 53.7 | 12 | 1.51 | .. | N, NW. | |
| May | 69.0 | 31.0 | 59.4 | 41.3 | 50.3 | 14 | 5.88 | .. | E, NW. | |
| June | 64.0 | 31.0 | 56.1 | 37.8 | 46.9 | 12 | 3.86 | .. | E, SE. | |
| July | 65.5 | 31.0 | 56.8 | 37.2 | 47.0 | 11 | 2.47 | .. | E, SE. | |
| August | 72.5 | 27.0 | 58.5 | 33.1 | 45.8 | 13 | 1.60 | .. | E, NE. | |
| September | 64.5 | 31.0 | 58.4 | 41.5 | 50.0 | 23 | 4.11 | .. | NW, NE. | |
| October | 74.0 | 32.0 | 64.0 | 44.9 | 54.5 | 17 | 1.32 | .. | W, NW. | |
| November | 70.0 | 32.0 | 65.5 | 47.5 | 56.5 | 15 | 1.18 | .. | W, SW. | |
| December | 76.0 | 42.0 | 69.9 | 52.7 | 61.3 | 11 | 1.65 | .. | W. | |
| Central Development Farm Weraroa (lat. 17' 38' S.' long, 175° 17' E.; alt. 119 ft.)— | January | 78.0 | 39.0 | 69.5 | 53.0 | 61.2 | 9 | 2.20 | .. | W, NW. |
| February | 80.0 | 44.0 | 70.8 | 53.0 | 61.9 | 11 | 3.02 | .. | W, NW. | |
| March | 75.0 | 33.0 | 67.4 | 48.2 | 57.8 | 6 | 0.68 | .. | W, NW. | |
| April | 71.0 | 32.0 | 63.7 | 46.8 | 55.2 | 14 | 2.71 | .. | NW, W. | |
| May | 68.0 | 32.0 | 58.7 | 44.2 | 51.5 | 15 | 8.19 | .. | E, NE. | |
| June | 65.0 | 31.0 | 55.8 | 40.0 | 47.9 | 15 | 4.55 | .. | SE, SW. | |
| July | 62.0 | 30.0 | 55.4 | 39.3 | 47.3 | 14 | 3.37 | .. | NW, SW. | |
| August | 65.0 | 28.0 | 56.0 | 38.8 | 47.4 | 18 | 40.2 | .. | W, E. | |
| September | 64.0 | 31.0 | 56.5 | 42.6 | 49.5 | 20 | 4.82 | .. | W, NW. | |
| October | 73.0 | 32.0 | 62.8 | 45.8 | 54.3 | 13 | 1.99 | .. | W, NW. | |
| November | 68.0 | 35.0 | 61.7 | 49.4 | 55.5 | 12 | 1.56 | .. | W, NW. | |
| December | 70.0 | 47.0 | 64.9 | 54.4 | 59.5 | 9 | 1.56 | .. | NW, W. | |
| Masterton (lat. 40° 57' S.; long. 175° 40' E.; alt. 377 ft.)— | January | 86.4 | 39.8 | 73.7 | 52.6 | 63.4 | 10 | 2.86 | .. | SW, N. |
| February | 80.6 | 38.6 | 71.5 | 50.3 | 60.9 | 10 | 1.58 | .. | NW, SW. | |
| March | 78.6 | 32.6 | 71.5 | 44.4 | 57.9 | 7 | 0.45 | .. | NW, N. | |
| April | 77.0 | 32.4 | 66.8 | 41.7 | 54.2 | 9 | 1.60 | .. | SW, N. | |
| May | 71.6 | 31.4 | 57.8 | 43.0 | 50.4 | 23 | 5.42 | .. | NW, SW. | |
| June | 64.8 | 28.6 | 53.3 | 39.4 | 46.2 | 22 | 7.39 | .. | SW. | |
| July | 61.8 | 26.2 | 53.9 | 38.2 | 46.0 | 20 | 4.19 | .. | SW, N. | |
| August | 61.8 | 27.6 | 54.0 | 38.0 | 46.0 | 21 | 5.51 | .. | N, SW. | |
| September | 64.6 | 29.4 | 57.7 | 39.7 | 48.7 | 17 | 4.28 | .. | NW. | |
| October | 74.2 | 25.0 | 63.8 | 45.0 | 54.4 | 19 | 1.69 | .. | SW, N. | |
| November | 80.0 | 31.4 | 67.2 | 44.2 | 55.7 | 11 | 1.42 | .. | W, NW. | |
| December | 84.4 | 42.6 | 74.4 | 51.1 | 62.7 | 6 | 0.55 | .. | NW, W. | |
| Wellington (lat. 41° 16' S.; long, 174° 46' E.; alt. 10 ft.)— | January | 78.2 | 46.1 | 70.2 | 56.5 | 63.3 | 9 | 3.74 | 29.989 | SE, N. |
| February | 75.0 | 46.0 | 69.3 | 55.6 | 62.4 | 10 | 3.90 | 29.846 | NW, N. | |
| March | 75.4 | 41.4 | 67.3 | 53.2 | 60.2 | 5 | 2.08 | 29.982 | NW, NE. | |
| April | 72.0 | 39.6 | 63.6 | 50.6 | 57.4 | 10 | 2.62 | 30.126 | N, NE. | |
| May | 69.0 | 36.0 | 58.2 | 47.2 | 52.7 | 17 | 6.30 | 30.079 | SE, NW. | |
| June | 62.0 | 32.3 | 52.8 | 42.6 | 47.7 | 21 | 8.33 | 29.990 | SE, S. | |
| July | 60.8 | 32.3 | 53.4 | 43.9 | 48.6 | 19 | 4.37 | 29.889 | NW, SE. | |
| August | 63.2 | 29.9 | 54.0 | 42.7 | 48.3 | 21 | 84.7 | 29.944 | S,NE. | |
| September | 64.8 | 32.2 | 57.3 | 44.6 | 50.9 | 19 | 3.32 | 29.644 | NW. | |
| October | 72.7 | 35.2 | 61.0 | 48.9 | 54.9 | 18 | 5.65 | 29.933 | NW, SE. | |
| November | 69.3 | 39.9 | 63.4 | 50.9 | 57.4 | 15 | 1.56 | 29.857 | NW, N. | |
| December | 71.4 | 48.2 | 66.6 | 54.4 | 60.5 | 11 | 2.13 | 29.849 | NW. | |
| Brightwater (lat. 41° 23' S.; long. 173° 9' E.; alt. 89 ft.)— | January | 78.0 | 45.0 | 72.6 | 54.5 | 63.5 | 14 | 3.44 | .. | N. |
| February | 76.0 | 41.0 | 70.7 | 51.3 | 61.0 | 12 | 2.47 | .. | N. | |
| March | 76.0 | 37.0 | 69.1 | 45.7 | 57.4 | 6 | 1.09 | .. | SW, S. | |
| April | 72.0 | 30.0 | 64.6 | 42.0 | 53.3 | 5 | 1.14 | .. | SW, S. | |
| May | 70.0 | 32.0 | 59.3 | 38.9 | 49.1 | 14 | 3.58 | .. | SW, SE. | |
| June | 62.0 | 27.0 | 56.5 | 35.6 | 46.0 | 10 | 2.72 | .. | SW, SE. | |
| July | 61.0 | 28.0 | 54.5 | 37.2 | 45.8 | 13 | 4.04 | .. | SW. | |
| August | 62.0 | 26.0 | 55.7 | 35.5 | 45.6 | 12 | 3.54 | .. | S, SW. | |
| September | 62.0 | 29.0 | 56.2 | 37.3 | 46.7 | 18 | 5.46 | .. | SW. | |
| October | 68.0 | 33.0 | 61.7 | 43.2 | 52.4 | 17 | 5.40 | .. | NE, SW. | |
| November | 74.0 | 34.0 | 66.7 | 44.5 | 55.6 | 9 | 19.0 | SW, N. | ||
| December | 83.0 | 39.0 | 73.0 | 50.0 | 61.5 | 7 | 1.20 | .. | SW. | |
| Nelson (lat. 41° 16' 17' S.; long. 173° 18' 46' E.; alt. 13 ft.— | January | 76.1 | 49.8 | 71.2 | 56.9 | 64.0 | 9 | 3.14 | 29.952 | N. |
| February | 74.3 | 43.0 | 69.6 | 53.3 | 61.4 | 13 | 3.49 | 29.832 | N, SW. | |
| March | 75.1 | 38.2 | 67.6 | 48.6 | 58.1 | 6 | 2.16 | 29.969 | SW, N. | |
| April | 70.9 | 36.5 | 63.9 | 45.0 | 54.4 | 7 | 1.90 | 30.113 | N, S. | |
| May | 66.9 | 34.7 | 58.5 | 41.7 | 50.1 | 10 | 3.70 | 30.062 | SE, S. | |
| June | 61.5 | 27.9 | 55.1 | 37.4 | 46.2 | 11 | 3.68 | 29.965 | SE, S. | |
| July | 60.8 | 30.0 | 54.7 | 38.3 | 46.5 | 17 | 4.94 | 29.874 | S. | |
| August | 65.9 | 28.4 | 55.9 | 38.2 | 47.0 | 11 | 3.27 | 29.4931 | N, S. | |
| September | 61.7 | 30.1 | 57.0 | 39.3 | 48.1 | 20 | 8.60 | 29.644 | W,N. | |
| October | 68.0 | 35.9 | 61.5 | 46.0 | 53.7 | 17 | 6.61 | 29.914 | N, SW. | |
| November | 75.1 | 35.2 | 65.1 | 46.4 | 55.7 | 10 | 1.25 | 29.847 | N, W. | |
| December | 82.5 | 39.8 | 70.1 | 50.9 | 60.5 | 8 | 0.75 | 29.843 | N, SW. | |
| Hokitika (lat. 42° 41' S.; long. 170° 49' 30' E.; alt. 12 ft.)— | January | 73.0 | 47.0 | 68.8 | 54.2 | 61.5 | 7 | 4.73 | 29.948 | SW, NW. |
| February | 76.0 | 44.0 | 66.5 | 53.1 | 59.8 | 17 | 11.23 | 29.798 | NW, SW. | |
| March | 68.5 | 38.0 | 61.7 | 46.9 | 54.3 | 18 | 11.71 | 29.968 | NW, SE. | |
| April | 67.5 | 35.5 | 59.2 | 44.6 | 51.9 | 13 | 7.73 | 30.112 | SW, NW. | |
| May | 62.0 | 34.0 | 57.1 | 40.6 | 48.8 | 14 | 4.94 | 30.039 | SE, E. | |
| June | 62.0 | 28.0 | 53.3 | 35.1 | 44.2 | 13 | 6.07 | 29.980 | E, SE. | |
| July | 60.0 | 30.0 | 54.2 | 3. | 46.2 | 19 | 13.80 | 29.862 | NE, E. | |
| August | 59.0 | 29.5 | 53.9 | 36.9 | 45.4 | 12 | 9.80 | 29.949 | NE, E. | |
| September | 66.0 | 30.0 | 53.8 | 40.0 | 46.9 | 27 | 14.01 | 29.645 | NE, SW. | |
| October | 65.0 | 36.5 | 58.7 | 44.2 | 51.4 | 16 | 10.56 | 29.948 | SW, NW. | |
| November | 62.0 | 34.0 | 57.5 | 46.2 | 51.8 | 24 | 14.33 | 29.912 | SW, NW. | |
| December | 66.0 | 41.0 | 60.2 | 50.3 | 55.2 | 27 | 14.98 | 29.923 | SW, NW. | |
| Hanmer Springs (lat. 42° 23' S.; long. 172° 47' E.; alt. 1,225 ft.)— | January | 85.0 | 36.0 | 71.9 | 48.0 | 59.9 | 13 | 3.88 | .. | NW. |
| February | 79.0 | 38.0 | 65.5 | 48.7 | 57.1 | 14 | 3.73 | .. | NW, SE. | |
| March | 76.0 | 31.0 | 67.3 | 43.5 | 55.4 | 6 | 1.43 | .. | NW. | |
| April | 76.0 | 29.0 | 63.3 | 40.3 | 51.8 | 7 | 2.68 | .. | NW. | |
| May | 70.0 | 22.0 | 53.6 | 33.9 | 43.7 | 14 | 7.71 | .. | NW. | |
| June | 58.0 | 18.0 | 45.8 | 29.4 | 37.6 | 15 | 8.21 | .. | NW. | |
| July | 59.0 | 21.0 | 48.4 | 32.1 | 40.2 | 9 | 5.95 | .. | NW. | |
| August | 68.0 | 20.0 | 49.6 | 33.2 | 41.4 | 17 | 7.08 | .. | NW. | |
| September | 59.0 | 26.0 | 51.8 | 35.6 | 43.7 | 15 | 6.98 | .. | NW, N. | |
| October | 74.0 | 28.0 | 61.3 | 40.8 | 51.0 | 15 | 2.50 | .. | NW, S. | |
| November | 72.0 | 29.0 | 64.2 | 42.6 | 53.4 | 9 | 2.24 | .. | NW, SW. | |
| December | 78.0 | 35.0 | 70.7 | 49.1 | 59.9 | 4 | 0.63 | .. | NW. | |
| Christchurch (lat. 43° 31' 30' S.; long. 172° 38' 50' E.; alt. 25 ft.) | January | 83.3 | 45.4 | 69.5 | 53.4 | 61.4 | 7 | 2.18 | 29.958 | SW, NE. |
| February | 77.4 | 40.0 | 67.8 | 51.8 | 59.8 | 8 | 0.27 | 29.781 | NE, SW. | |
| March | 79.6 | 34.8 | 66.4 | 46.0 | 56.2 | 6 | 1.13 | 29.904 | NE, SW. | |
| April | 76.5 | 32.5 | 62.1 | 44.0 | 53.1 | 9 | 6.25 | 30.037 | NE, SW. | |
| May | 67.6 | 28.3 | 54.1 | 37.0 | 45.6 | 14 | 2.12 | 30.083 | SW, NE. | |
| June | 53.6 | 24.0 | 47.7 | 34.4 | 41.0 | 21 | 4.32 | 30.028 | SW, NE. | |
| July | 61.5 | 28.9 | 50.5 | 36.3 | 43.4 | 15 | 2.98 | 29.880 | SW, NE. | |
| August | 61.7 | 25.5 | 51.4 | 37.3 | 44.4 | 19 | 5.97 | 29.936 | SW, N. | |
| September | 66.8 | 28.0 | 55.3 | 38.0 | 46.6 | 13 | 3.08 | 29.548 | SW, NE. | |
| October | 77.4 | 32.2 | 62.1 | 44.7 | 53.4 | 7 | 1.67 | 29.870 | NE, SW. | |
| November | 76.5 | 30.9 | 63.9 | 44.5 | 54.2 | 12 | 2.42 | 29.773 | SW, NE. | |
| December | 84.7 | 39.0 | 71.1 | 49.7 | 60.4 | 7 | 1.03 | 29.732 | NE, NW, E. | |
| Kisselton, Lake Coleridge (lat. 43° 22' S.; long. 171° 33' E.; alt. 1,200 ft.)— | January | 83.0 | 45.0 | 73.1 | 50.8 | 61.9 | 6 | 1.19 | .. | SE, NW. |
| February | 78.0 | 40.0 | 69.0 | 49.4 | 59.2 | 14 | 2.85 | .. | NW, SW. | |
| March | 79.0 | 34.0 | 67.9 | 44.8 | 56.3 | 7 | 2.30 | .. | NW, SW. | |
| April | 81.0 | 34.0 | 66.8 | 43.1 | 54.9 | 6 | 2.35 | .. | NW. | |
| May | 75.0 | 28.0 | 54.0 | 36.1 | 45.0 | 9 | 1.79 | .. | NW, SW. | |
| June | 64.0 | 27.0 | 49.7 | 33.1 | 41.4 | 10 | 2.81 | .. | SE, NW. | |
| July | 71.0 | 29.0 | 51.5 | 38.1 | 44.8 | 14 | 4.89 | .. | NW, SW. | |
| August | 74.0 | 28.0 | 55.9 | 38.8 | 47.3 | 18 | 6.84 | .. | NW, SE. | |
| September | 83.0 | 35.0 | 56.9 | 42.6 | 49.7 | 17 | 8.67 | .. | NW. | |
| October | 86.0 | 38.0 | 69.1 | 47.8 | 58.4 | 8 | 1.91 | .. | NW, SW. | |
| November | 85.0 | 30.0 | 68.2 | 42.1 | 55.1 | 10 | 2.55 | .. | NW, SW. | |
| December | 85.0 | 33.0 | 71.4 | 47.1 | 59.2 | 7 | 3.03 | .. | NW, SW. | |
| Timaru (lat. 44° 25' S.; long. 71° 171° 18' E.; alt. 56ft.)— | January | 84.4 | 45.0 | 71.2 | 52.4 | 61.8 | 9 | 1.09 | .. | NE, E. |
| February | 78.2 | 39.2 | 69.6 | 51.9 | 60.7 | 15 | 1.57 | .. | NE, SE, KW. | |
| March | 82.0 | 34.8 | 69.5 | 46.0 | 57.7 | 8 | 0.57 | .. | NE, SW. | |
| April | 76.6 | 32.0 | 62.5 | 43.5 | 53.0 | 7 | 2.10 | .. | NE, SW. | |
| May | 69.2 | 30.0 | 54.5 | 36.8 | 45.6 | 10 | 2.01 | .. | SW, NE. | |
| June | 58.6 | 26.2 | 49.2 | 32.6 | 40.9 | 12 | 1.33 | .. | SW, NE. | |
| July | 69.4 | 29.0 | 49.3 | 35.9 | 42.6 | 11 | 4.23 | .. | SW, NE. | |
| August | 62.0 | 26.4 | 50.6 | 35.0 | 42.8 | 15 | 2.21 | .. | SW, NE. | |
| September | 63.6 | 29.0 | 54.7 | 38.4 | 46.6 | 11 | 2.09 | .. | SE, SW. NW. NE, SW. | |
| October | 76.0 | 36.0 | 61.9 | 430 | 52.4 | 11 | 0.91 | .. | NE, SW. | |
| November | 75.8 | 33.0 | 65.3 | 44.2 | 547 | 10 | 2.27 | .. | SW, SE. | |
| December | 83.6 | 38.0 | 68.4 | 48.8 | 58.6 | 12 | 1.25 | .. | SE, E. | |
| Waimate (lat. 44° 44' S.; long. 171° 14' E.; alt. 200ft.)— | January | 85.0 | 42.0 | 68.3 | 50.9 | 59.6 | 8 | 1.22 | .. | NE, SW. |
| February | 75.0 | 38.0 | 66.4 | 50.3 | 58.3 | 16 | 1.07 | .. | NE, SW. | |
| March | 80.0 | 35.0 | 66.4 | 45.9 | 56.1 | 7 | 1.27 | .. | NE, SW. | |
| April | 76.0 | 33.0 | 62.0 | 42.8 | 52.4 | 9 | 1.84 | .. | NE, SW. | |
| May | 71.0 | 28.0 | 54.6 | 35.3 | 45.0 | 10 | 2.05 | SW | ||
| June | 61.0 | 27.0 | 49.6 | 31.3 | 40.5 | 1 | 0.96 | .. | SW | |
| July | 61.0 | 29.0 | 50.4 | 35.2 | 42.8 | 14 | 5.98 | .. | NE, SE, SW. | |
| August | 60.0 | 27.0 | 50.0 | 34.2 | 42.1 | 17 | 2.44 | .. | SE, SW. | |
| September | 65.0 | 28.0 | 54.0 | 37.0 | 45.5 | 11 | 2.48 | .. | NE, SW. | |
| October | 75.0 | 32.0 | 60.8 | 41.2 | 51.0 | 8 | 1.18 | .. | NE, SW. | |
| November | 73.0 | 34.0 | 62.1 | 43.7 | 52.9 | 12 | 2.53 | .. | NE, SW. | |
| December | 80.0 | 37.0 | 65.5 | 47.4 | 56.4 | 13 | 2.47 | .. | NE, SE. | |
| Waipiata (lat. 45° 10' S.; long. 171° 12' E.; alt. 1,550ft.)— | January | 84.0 | 38.0 | 72.0 | 46.6 | 59.3 | 8 | 1.45 | .. | W, NW. |
| February | 78.0 | 38.0 | 65.5 | 45.0 | 55.2 | 11 | 1.31 | .. | SW, NW. | |
| March | 73.0 | 32.0 | 63.4 | 41.8 | 52.6 | 10 | 1.69 | .. | W, SW. | |
| April | 72.0 | 31.0 | 59.4 | 39.3 | 49.3 | 9 | 1.36 | .. | W, SW. | |
| May | 66.0 | 23.0 | 49.2 | 30.7 | 39.9 | 8 | 1.56 | .. | SW, N. | |
| June | 56.0 | 18.0 | 43.6 | 26.1 | 34.8 | 10 | 0.74 | .. | SW, SE. | |
| July | 56.0 | 22.0 | 45.3 | 30.3 | 37.8 | 9 | 1.18 | .. | SE, W. | |
| August | 59.0 | 22.0 | 46.0 | 30.2 | 38.1 | 11 | 2.77 | .. | SE, SW. | |
| September | 56.0 | 25.0 | 49.1 | 32.9 | 41.0 | 12 | 1.13 | .. | NW, W. | |
| October | 70.0 | 29.0 | 58.9 | 38.9 | 48.9 | 11 | 2.06 | .. | NW, SW. | |
| November | 78.6 | 29.8 | 60.6 | 39.7 | 50.1 | 14 | 1.14 | .. | NW, SW. | |
| December | 77.2 | 35.0 | 66.5 | 44.0 | 55.2 | 12 | 1.55 | .. | NW, W. | |
| Dunedin (lat. 45° 52' S.; long. 170° 31' E.; alt. 300 ft.)— | January | 81.0 | 41.0 | 67.7 | 50.0 | 58.8 | 6 | 1.31 | 29.951 | NE, SW. |
| February | 77.0 | 40.0 | 64.1 | 49.5 | 53.8 | 13 | 2.22 | 29.757 | NE, SW. | |
| March | 73.0 | 38.0 | 63.5 | 47.3 | 55.4 | 13 | 4.00 | 29.893 | SW, NE. | |
| April | 71.0 | 35.0 | 60.4 | 43.7 | 52.0 | 16 | 2.43 | 30.052 | SW, NE. | |
| May | 61.0 | 32.0 | 53.8 | 38.6 | 46.2 | 9 | 2.79 | 30.105 | SW, NE. | |
| June | 60.0 | 31.0 | 49.0 | 35.5 | 42.2 | 14 | 2.97 | 30.021 | SW, NE. | |
| July | 57.0 | 32.0 | 49.9 | 38.3 | 44.1 | 15 | 5.99 | 29.874 | NE, SW. | |
| August | 60.0 | 33.0 | 50.2 | 38.2 | 44.2 | 13 | 5.91 | 29.946 | NE, SW. | |
| September | 64.0 | 30..0 | 52.7 | 39.0 | 45.8 | 22 | 3.24 | 29.504 | SW, NE. | |
| October | 77.0 | 36.0 | 61.2 | 43.8 | 52.5 | 13 | 2.22 | 29.835 | NE, SW. | |
| November | 73.0 | 36.0 | 59.8 | 43.5 | 51.6 | 20 | 4.51 | 29.761 | SW, NE. | |
| December | 76.0 | 41.0 | 64.3 | 47..2 | 55.7 | 18 | 2.24 | 29.725 | SW, NE. | |
| Gore (lat. 46° 6' S.; long. 168° 57' E.; alt. 245 ft.) | January | 89.0 | 31.0 | 71.3 | 46.3 | 58.8 | 6 | 0.48 | .. | SW, E. |
| February | 84.0 | 30.0 | 66.7 | 44.4 | 55.5 | 12 | 1.87 | .. | E, SW. | |
| March | 750 | 31.0 | 64.6 | 44.2 | 54.4 | 16 | 3.65 | .. | SW. | |
| April | 71.0 | 28.0 | 59.9 | 39.3 | 49.6 | 14 | 3.35 | .. | SW,NE,NW. | |
| May | 68.0 | 24.0 | 52.0 | 31.5 | 41.7 | 10 | 1.20 | .. | NE, E. | |
| June | 55.0 | 18.0 | 46.0 | 28.1 | 37.0 | 14 | 1.50 | .. | NE, NW. | |
| July | 57.0 | 24.0 | 47.6 | 81.8 | 39.7 | 13 | 1.55 | .. | E, NE. | |
| August | 61.0 | 24.0 | 51.2 | 32.8 | 42.0 | 17 | 2.78 | .. | E, NE. | |
| September | 62.0 | 28.0 | 52.3 | 35.2 | 43.7 | 21 | 4.26 | .. | SW, E. | |
| October | 72.0 | 31.0 | 62.7 | 39.5 | 51.1 | 11 | 2.32 | .. | E. SW, NW. | |
| November | 77.0 | 31.0 | 61.1 | 40.4 | 50.7 | 23 | 4.06 | .. | SW, NE. | |
| December | 79.0 | 33.0 | 64.8 | 43.3 | 54.0 | 20 | 2.61 | .. | SW, NE. | |
| Invercargill (lat. 46° 25' S.; long. 168° 21' E.; alt. 12 ft.)— | January | 87.0 | 32.0 | 68.5 | 47.6 | 58.0 | 12 | 1.01 | .. | E, SW. |
| February | 82.0 | 32.0 | 65.5 | 47.0 | 56.2 | 21 | 2.63 | .. | SW, E. | |
| March | 72.0 | 30.0 | 64.3 | 45.8 | 55.0 | 20 | 4.64 | .. | SW. | |
| April | 71.0 | 31.0 | 61.3 | 40..3 | 50.8 | 20 | 4.72 | .. | SW, W. | |
| May | 62.0 | 22.0 | 52.5 | 34.5 | 43.5 | 15 | 2.49 | .. | SW, NE. | |
| June | 55.0 | 19.0 | 47.8 | 26.6 | 37.2 | 12 | 2.03 | .. | NE, NW, E. | |
| July | 58.0 | 25.0 | 49.5 | 31.5 | 40.5 | 8 | 1.32 | .. | NE, E. | |
| August. | 61.0 | 23.0 | 51.8 | 30.9 | 41.3 | 17 | 3.24 | .. | NE, E, SW. | |
| September | 62.0 | 29.0 | 53.2 | 36.8 | 45.0 | 25 | 7.26 | .. | W, SW. | |
| October | 71.0 | 33.0 | 59.9 | 42.1 | 51.0 | 14 | 3.24 | .. | NW, SE. | |
| November | 71.0 | 36.0 | 57.5 | 43.1 | 50.3 | 24 | 4.02 | .. | SW, W. | |
| December | 74.0 | 40.0 | 62.2 | 45.7 | 53.9 | 19 | 2.64 | SW. W. | ||
| COMPARATIVE TABLE, 1925. | |||||||||
|---|---|---|---|---|---|---|---|---|---|
| Stations. | Temperature in Shade. | Rainfall. | Mean Height of Barometer. | Prevailing Winds. | |||||
| Highest and Date. | Lowest and Date. | Mean Max. Temp for Year. | Mean Min. Temp for Year. | Mean Temp. for Year. | Days on which Rain fell. | Total Fall. | |||
| °Fahr. | °Fahr. | °Fahr. | °Fahr. | °Fahr. | No. | Inches. | Inches. | ||
| Auckland | 79.0 Dec. 31 | 38.0 June 20, July 12, Aug. 16 | 64.3 | 52.6 | 58.4 | 197 | 39.21 | 29.985 | W, SW, NW. |
| Hamilton East | 84.2 Jan. 24 | 24.0 July 12 | 67.2 | 43.5 | 55.4 | 177 | 44.24 | .. | W, NE, SW. |
| Te Aroha | 85.0 Jan. 16, Feb. 16 | 25.0 June 21, 22, July 12 | 69.6 | 46.6 | 58.1 | 163 | 51.98 | .. | W, NW. |
| Waihi | 86.7 Dec. 31 | 24.6 July 19 | 66.6 | 46.6 | 56.6 | 174 | 69.46 | 30.012 | W, SW. |
| Tauranga | 84.0 Jan. 22 | 31.0 July 12, Aug. 31 | 65.8 | 47.5 | 56.6 | 162 | 52.73 | .. | SW, S. |
| Rotorua | 84.5 Dec. 9 | 28.0 July 11, 19, Aug. 9, 19 | 64.0 | 45.1 | 54.5 | 156 | 61.69 | .. | SW, NE. |
| New Plymouth | 75.0 Jan 29, Feb. 7 | 32.2 | 61.8 | 48.3 | 55.0 | 192 | 55.05 | .. | SW, W. |
| Napier | 84.5 Jan. 10 | 31.5 July 20, Aug. 12 | 64.8 | 49.1 | 56.9 | 127 | 25.51 | .. | W, SW. |
| Taihape | 79.4 Jan.24 | 27.0 July 11 | 57.5 | 42.6 | 50.0 | 179 | 34.88 | .. | W, NW. |
| Palmerston N. | 83.5 Jan. 24 | 25.0 July 5 | 63.2 | 46.3 | 54.8 | 161 | 35.54 | .. | W, E. |
| Tangimoana | 81.0 Jan. 25, 27 | 27.0 Aug. 17 | 63.9 | 44.1 | 54.0 | 153 | 30.07 | NW, E. | |
| Weraroa | 80.0 Feb. 15, 17 | 28.0 Aug. 11 | 61.9 | 46.2 | 54.1 | 156 | 55.67 | W, NW | |
| Masterton | 86.4 Jan. 24 | 25.0 Oct. 29 | 63.8 | 43.9 | 53.8 | 175 | 36.94 | SW, NW | |
| Wellington | 78.2 Jan. 30 | 29.9 Aug. 17 | 61.4 | 49.2 | 55.3 | 175 | 52.17 | 29.927 | NW, N, SE. |
| Brightwater | 83.0 Dec. 8 | 26.0 Aug. 18 | 63.4 | 43.0 | 53.2 | 137 | 35.08 | .. | SW, N. |
| Nelson | 82.5 Dec. 7 | 27.9 June 13 | 62.5 | 45.2 | 53.8 | 139 | 38.49 | 29.912 | N, SW. |
| Hokitika | 76.0 Feb. 16 | 28.0 June 13 | 58.7 | 44.2 | 51.5 | 207 | 123.89 | 29.924 | SW,NW. |
| Hamner Springs | 85.0 Jan. 24 | 18.0 June 17 | 59.5 | 39.8 | 49.6 | 138 | 53.02 | .. | NW. |
| Christchurch | 84.7 Dec. 21 | 24.0 June 18 | 60.2 | 43.1 | 51.6 | 138 | 33.42 | 29.878 | SW, NE. |
| Kisselton, Lake Coleridge | 86.0 Oct. 13 | 27.0 June 16,17,26 | 62.8 | 42.8 | 52.8 | 126 | 41.18 | .. | NW, SW. |
| Timaru | 84.4 Jan. 31 | 26.2 June 27 | 60.6 | 42.4 | 51.5 | 131 | 21.63 | .. | SW, NE. |
| Waimate | 85.0 Jan. 22 | 27.0 June 17, 18, Aug. 11,16 | 59.2 | 41.3 | 50.2 | 136 | 25.49 | NE, SW. | |
| Waipiata | 84.0 Jan.16 | 18.0 June 1, 27 | 56.6 | 37.1 | 46.8 | 125 | 17.94 | .. | NW.SW. |
| Dunedin | 81.0 Jan. 30 | 30.0 Sept. 4, 5 | 58.0 | 42.9 | 50.4 | 172 | 39.83 | 29.869 | SW, NE. |
| Gore | 89.0 Jan. 30 | 18.0 June 27 | 58.4 | 38.1 | 48.2 | 177 | 29.63 | .. | SW, E. |
| Invercargill | 87.0 Jan. 30 | 19 0 June 27, 28 | 57.8 | 39.3 | 48.6 | 207 | 39.24 | .. | SW, NE. |
The following article on the flora and vegetation of New Zealand has been prepared by Dr. L. Cockayne, F.R.S.:—
Owing to its long isolation and diverse elements (Malayan, Australian, Subantarctic, and endemic), the flora of New Zealand is of special interest. Ferns, fern-allies, and seed-plants number, so far as is at present known, about 1,800 species, of which more than three-fourths are endemic. Many hundreds of algæ, fungi, mosses, and liverworts have been described, but these certainly do not represent the total number of such. With regard to the seed-plants, one family (the daisy) contains more than 250 species, three (sedge, figwort, and grass) each more than a hundred, and nine (carrot, orchid, buttercup, madder, epacrid, willowherb, pea, rush, and forget-me-not) between thirty and seventy. The ferns and fern-allies, though not of the overwhelming importance in the flora that many think, still number 162 species. The genera Veronica (Hebe), Carex, Celmisia, Coprosma, Ranunculus, Olearia, Senecio, Epilobium, Myosolis, Poa, Dracophyllum, and Aciphylla contain many species, no few of which are difficult to exactly define. This is especially the case with Veronica, which embraces more than a hundred species. Such uncertainty in their delimiting lies in what is usually called their “variability,” which is due partly to more than one distinct true-breeding entity being joined together as one species, partly to the frequent occurrence of hybrids, and to some extent to differences in appearance and form caused by different environments.
Variability is not concerned merely with adult plants, but often there are species with juvenile forms quite distinct from the adults which may persist for many years. This strange procedure is seen, more or less, in a hundred species. Familiar examples amongst trees are the lacebark, lowland-ribbonwood, lancewood, kowhai, pokaka, and kaikomako.
Many of the growth-forms of New Zealand plants are characteristic of the life-conditions. These are, for example — climbing-plants with long, woody, ropelike stems; shrubs with stiff, wiry, interlaced branches forming close masses; cushion-plants sometimes of immense proportions, as in the vegetable sheep (species of Haastia and Raoulia); leafless shrubs with round or flattened stems (species of Carmichaelia and Notospartium); species of Veronica looking exactly like cypresses; trees with leaves bunched on long trunks; grasses and sedges forming tussocks. The ligneous plants are almost all evergreen, only some twenty being deciduous or semi-deciduous. Herbs that die to the ground in winter and bulbous plants are rare.
The plant associations are of quite as great interest as the species; indeed, to find an equal variety a continent extending to the tropics would have to be visited The northern rivers and estuaries contain a true mangrove association, an unexpected occurrence outside the tropics. Lowland and montane forests are generally of the subtropical rain-forest type. They are distinguished by their wealth of tree-ferns, filmy ferns, woody climbing-plants, massive perching-plants, deep carpets of mosses and liverworts, and trees provided at times with plank-like buttresses. The kauri forest in the North, the dicotylous broad-leaved forests, and the assemblages of taxads (rimu, miro, totara, and matai) are different rain-forest associations. Another forest is that where species of the southern-beech (Nothofagus), incorrectly termed “birch,” are dominant. Such are subantarctic rain-forests, and constitute the greater part of the high-mountain forests, though in Wellington, Marlborough, and Nelson they are common in the lowlands. Shrubland in which the manuka is dominant is common in the North, South, and Stewart Islands, but is specially abundant on the Auckland gumfields, where it is an obstacle to agriculture. Fern heath of tall bracken is also widespread. Swamp characterized by Phormium, raupo, toetoe, and niggerhead was once common, but draining has greatly reduced its area, though where the association is not burned or the ground ploughed Phormium has greatly increased. Bogs and moorland support a peculiar vegetation. Here hummocks of bog-moss are abundant, and a small wiry umbrella-fern may cover wide areas. Grassland with brownish-leaved tussock-grasses is a great feature of parts of the volcanic plateau of the North Island, and especially of the east of the South Island. Species of Poa and Festuca form the principal tussocks of the lowlands and lower hills, but at higher altitudes and in Southland at low levels tall species of Danthonia dominate. This name is not to be confused with the turf-making species (D. pilosa) of the same genus used in artificial pastures.
The alpine vegetation is of great scientific importance. It contains, exclusive of lowland plants which ascend to the mountains, about 500 species, most of which never descend below 1,500 ft. altitude, while some are confined altogether to the highest elevations. The most beautiful of the New Zealand flowers, with but few exceptions, belong to this mountain-flora. Here are the great buttercups, white and yellow; the charming ourisias; the marguerite-flowered celmisias; the dainty eyebrights; forget-me-nots, yellow, bronze, and white; and many other delightful plants. The growth-forms, too, are often striking or quaint. Cushion-plants, rosette-plants, stiff-branched shrubs, and mat-forming plants are much in evidence. Hairiness, leathery texture, and great rigidity, perhaps accompanied by needle-like points, as in the spaniard (Aciphylla Colensoi), are common characters of leaves.
The floras of the following groups of islands, far distant from the mainland, are distinctly part of that of New Zealand. The Kermadecs contain 115 species of ferns, fern-allies, and seed-plants, only twelve of which are endemic, while eighty-nine belong also to New Zealand proper. The largest island (Sunday Island) is covered with forest in which Meirosideros villosa, a near relation of the pohutukawa, is the principal tree. The Chatham Islands possess 240 species, thirty-two of which are endemic, though several of the latter are trivial varieties merely, while the remainder of the flora is, with one exception, found on the mainland. Forest, moor, and heath are the principal plant associations. The leading tree is the karaka, but by the Moriori called kopi. On the moors are great thickets of a lovely purple-flowered shrub, Olearia semidentata. There are two remarkable endemic genera, Coxella and Myosotidium, the former belonging to the carrot family, and the latter a huge forget-me-not, now nearly extinct. The subantarctic islands (Snares, Auckland, Campbell, Antipodes, Macquarie) have a dense vegetation made up of 189 species, no fewer than fifty-six of which are endemic, the remainder being found in New Zealand, but chiefly in the mountains. Forest is found only on the Snares and the Aucklands, with a species of Olearia and the southern-rata as the dominant trees respectively. Extremely dense scrubs occur on the Auckland and Campbell Islands, and moors, sometimes with huge tussocks, are a characteristic feature of all the islands, thanks to the enormous peat-deposit and the frequent rain. Several herbaceous plants of stately form (species of Pleurophyllum, Anisotome, and Stilbocarpa) and with beautiful flowers occur in great profusion.
The Cook Islands, though a part of the Dominion, possess a Polynesian flora quite distinct from that of New Zealand, and are excluded from this notice, while, on the contrary, the flora of the Macquarie Islands (belonging to Tasmania) is a portion of that of New Zealand.
Besides the indigenous, an important introduced element, consisting of about 560 species, mostly European, has followed in the wake of settlement. These aliens are in active competition with the true natives. There is a widespread but quite erroneous opinion that the latter are being eradicated in the struggle. This is not the case. Where the vegetation has never been disturbed by man there are no foreign plants; but where man, with his farming operations, stock, and burning, has brought about European conditions, then certainly the indigenous plants have frequently given way before artificial meadows, with their economic plants and accompanying weeds. But in many places associations not present in primitive New Zealand have appeared, owing to man's influence, composed principally, or altogether, of indigenous species. On the tussock-grassland invader and aboriginal have met, and though the original vegetation is changed there is no reason to consider the one class or the other as the conqueror. Finally, in course of time, a state of stability will be reached, and a new flora, composed partly of introduced plants and partly of those indigenous to the soil, will occupy the land, and, save in the national parks and scenic reserves, if these are kept strictly in their natural condition, this new flora will build up a vegetation different from that of primeval New Zealand.
The above brief sketch of the flora and vegetation is obviously most incomplete. Those wishing to dive deeper into the fascinating matter can consult the following works: “The Manual of the New Zealand Flora,” by T. F. Cheeseman; “Plants of New Zealand,” by R. M. Laing and E. W. Blackwell; “The Vegetation of New Zealand,” “New Zealand Plants and Their Story,” and “The Cultivation of New Zealand Plants”—the last three by L. Cockayne.
The fauna of New Zealand is briefly described in the following article by Mr. James Drummond, F.L.S., F.Z.S.:—
New Zealand's native fauna has attracted the attention of investigators in nearly all parts of the world. Its special interest lies in its manifold peculiarities, in the incongruous characters possessed by some of its members, and in the ancient types found in different classes of its animals.
Beginning with the mammalia, the Dominion is surprisingly inadequately represented. Its only land-mammals, except seals, are two bats. One of these, the long-tailed bat, belongs to a genus (Chalinolobus) which is found in the Australian and Ethiopian zoological regions, and to a species (morio) found in the south-east of Australia as well as in New Zealand; but the other, the short-tailed bat (Mystacops tuberculatus), belongs to a genus peculiar to this Dominion. At one time it was believed that the Maori dog (Canis familiaris, variety maorium, the “kuri” of the Maoris) and the Maori rat (Mus exulans, the Maoris' “kiore”) were indigenous to New Zealand, but it is now generally believed that these two animals were introduced by the Maoris when they made their notable migrations from their legendary Hawaiki (probably Tahiti, in the Society Group). The dog was highly prized as a domestic pet, and the rat as an article of diet. Both could easily be taken across the sea in the large canoes used in those days. The dog, without doubt, is extinct. Statements by Captain Cook, J. R. and G. Forster, Sydney Parkinson (the artist), the Rev. W. Colenso, and early visitors to New Zealand show that the Maori dog was a very ordinary animal. It was small, with a pointed nose, pricked ears, and very small eyes. In colour it was white, black, brown, or parti-coloured, and it had long hair, short legs, a short bushy tail, and no loud bark, but only a whine. The Maoris lavished upon it an abundance of affection. When dead its flesh was used for food, its skin for clothing, and its hair for ornaments. Opinions differ in regard to the approximate date of its extinction, and investigations in this respect are made somewhat difficult by the fact that for some years “wild dogs,” as they were called—probably a cross between the Maori dog and dogs brought by Europeans —infested several districts in both the North Island and the South Island, and were confused with the Maori dog. It is probable that the pure Maori dog became extinct about 1885. The Maori rat, a forest-dweller, is not as plentiful as it was when Europeans first came to New Zealand, but it still lives in the forests.
The long-tailed species of bat was once fairly plentiful, especially in the forests, where it makes its home in hollow trees. Large numbers also at one time were found under old bridges across streams, notably at the River Avon, in Christchurch. It is not very rare now, and specimens sometimes are found in the forests and in caves. The short-tailed species is not extinct, but rare. Most bats are exceptionally well adapted for life in the air, feeding on flying insects, and even drinking on the wing. But the short-tailed species of New Zealand possesses peculiarities of structure which enable it to creep and crawl with ease on the branches and leaves of trees, and probably it seeks its food there as well as in the air. Few naturalists, however, have had opportunities to observe it, and little is known of its habits.
The sea-lion, the sea-elephant, the sea-leopard, and the fur-seal are found on islands in the Dominion's boundaries. In the early days of colonization sealing was a great industry, and yielded large profits to some of the adventurous men who took part in it.
Amongst the sea-mammals whales are the most important. For some years New Zealand held the record for the largest known mammal in the world, living or extinct. This was the Okarito whale, whose skeleton is in Canterbury Museum. It was found dead on the sea-beach near Okarito, a small village in South Westland, in February, 1908. A very careful and conscientious measurement showed that its length, in the flesh, was 87 ft., or 99 ft. measured over the curves of its back. It held the record until September, 1918, when a whale was found stranded at Corvisart Bay, near Streaky Bay, at the eastern extremity of the Australian Bight, South Australia, which measured in a straight line 87 ft. 4 in Both competitors for the record were females, and both were blue whales, which usually are known as Balaenoptera sibbaldi, but which now bear the name Balaenoptera musculus.
At one time extensive whaling was carried on in New Zealand waters, three hundred vessels, chiefly from America, sometimes visiting the country in one year. The industry began about 1795, reached the height of its prosperity between 1830 and 1840, and then began to dwindle. In recent years there has been an effort to revive the industry, but it will never attain the position it held in former years. Porpoises are plentiful, and the dolphin (Delphinus delphis) also is found in these waters. Mention should be made here of “Pelorus Jack,” a solitary whale which for some years met vessels near Pelorus Sound, and which was protected by an Order in Council under the name of Risso's dolphin (Grampus griseus). He was the only member of the species reported from New Zealand waters.
In contrast with the species of land-mammals, the members of the next class, Aves, were remarkably plentiful when settlement began. Bush and grass fires, cats, stoats and weasels, and the ruthless use of the gun have reduced their numbers, but they still stand as probably the most interesting avifauna in the world. They include a comparatively large number of absolutely flightless birds. No living birds in New Zealand are wingless, but the kiwi (Apteryx), the weka (Gallirallus), the kakapo parrot (Strigops), and the takahe (Notornis hochstetteri)* cannot use their wings for flight, while a duck belonging to the Auckland Islands (Nesonetta) is practically in the same plight. There, are also several species of birds whose wings are so weak that they can make only short flights. Other notable birds are the kea (Nestor notabilis), which is accused of killing sheep on stations in the South Island; the tui (Prosthemadera novae-zealandiae), which affords one of the most beautiful sights in the New Zealand forests, and charms visitors with its silvery notes; the huia (Heteralocha acutirostris), the only species known in which there is a wide divergence in the shape of the bills in the two sexes, the male's being short and straight, while the female's is curved, pliant, and long; and the wry-billed plover (Anarhynchus frontalis), the only bird known to possess a bill turned to one side. Cormorants or shags (Phalacrocorax) and penguins (Impennes) are exceptionally well represented in the avifauna. New Zealand, indeed, may be regarded as the headquarters of the penguins, as all the genera except one are found within the boundaries of this Dominion. The oldest fossil penguin known is from the Eocene and Oligocene rocks of New Zealand. New Zealand probably was the centre from which penguins were dispersed to other countries.
Several species of birds make notable migrations to New Zealand. The godwit (Vetola lapponica baueri) breeds in the tundras of Eastern Siberia and in Kamchatka and Western Alaska, and spends the summer months in New Zealand, arriving about October, and leaving in March or April. The knot (Canutus canutus) breeds in circum-polar regions and migrates to New Zealand; and two cuckoos—the shining-cuckoo (Lamprococcyx lucidus) and the long-tailed cuckoo (Urodynamis taitensis)—come from Pacific islands in the spring, and leave for their northern homes about April. Both, like most members of the Cuculidæ family, are parasitical, and impose upon small native birds the duty of hatching and rearing young cuckoos. The kiwi, already mentioned, belongs to the same subclass as the ostrich, the emu, and the cassowary, all struthious birds, and has several peculiarities besides its flightlessness. One of these is the position of its nostrils at the tip of its bill, instead of at the base as in all other birds. Its plumage is peculiarly hair-like in appearance. It possesses a very generalized structure; as Sir Richard Owen once suggested, it seems to have borrowed its head from one group of birds, its legs from another, and its wings from a third. It was once believed to be almost extinct, but in recent years has been shown to be fairly plentiful in some districts where there is little settlement.
The takahe (Notornis) is one of the world's very rare birds. Only four specimens have been found. Two of the skins are in the British Museum, one is in the Dresden Museum, and one in the Otago Museum, in Dunedin. The fourth specimen was caught by two guides (Messrs. D. and J. Ross) at Notornis Bay, Lake Te Anau, in 1898. Although at the present time (1924) it is twenty-six years since the Notornis was last seen, there is reason to believe that individuals still exist in the wild districts of the southern sounds.
The interest of the living avifauna is surpassed by the interest of the extinct birds. These include the great flightless moa (Dinornis), a goose (Cnemiornis minor), a gigantic rail (Aptornis otidiformis), and an eagle (Harpagornis moorei).
* This bird is better known as Notornis mantelli. That name was first given by Sir Richard Owen to an extinct bird, represented by a fossil found at Waingongoro, in the North Island, by Mr. W. Mantell in 1847. When the first living specimen of the Notornis was found in 1849 scientists concluded that it was identical with the fossil, and it bore the same name; but when Dr. Meyer, of Dresden, examined the skeleton of the third specimen he found that it was different from the fossil, and he changed the specific name from Mantelli to Hochstetteri, thus honouring Dr. Hochstetter, a naturalist who visited New Zealand in the early days. Messrs. G. M. Mathews and T. Iredale, in their “Reference List” of 1913, give Mantellornis hochstetteri as the name of this interesting rail.
Reptilian life is restricted to about fifteen species of lizards, and to the tuatara (Sphenodon punctatus). This is a lizard-like creature, the only surviving representative of the order Rhynchocephalia, otherwise extinct. The tuatara is found in no other country. Its nearest ally is Homœosaurus, whose remains have been found in Jurassic rocks in Germany. It has been destroyed to a large extent by wild pigs, cats, and dogs, and is now seldom found except on a few islands off the coast of the mainland.
The amphibians are represented by two species of frogs. One, Liopelma hochstetteri, has been recorded from only a few districts in the Auckland Province. The other, Liopelma hamiltoni, has been recorded from only Stephen Island, a small island in Cook Strait, notable as one of the refuges of the tuatara.
About 250 species of fish have been found in New Zealand waters. Many of these are used for food. Several species, notably the mudfish (Neochanna apoda), which is sometimes discovered buried 4 ft. deep in clay in places where rivers have overflowed in flood, and in swampy places, are interesting. Some of the genera are peculiar to New Zealand, but some also occur in Australian and South American waters.
Amongst the invertebrates one of the peculiarities is the fact that the Dominion has few butterflies, although it is well supplied with moths. It has a red admiral butterfly (Vanessa), named after the European species, which it resembles, and a copper butterfly (Chrysophanus), which is very plentiful. In the forests there is that strange growth the “vegetable caterpillar.” The Dominion has native bees and ants, dragon-flies, sober-coloured beetles, and representatives of other orders of insects. The katipo spider (Latrodectes katipo), which lives mostly on or near the sea-beach, is well known locally. Amongst the mollusca there is a large and handsome land-snail (Paryphanta), and Amphibola, an air-breathing snail, peculiar to the Dominion, which lives in brackish water, mainly in estuaries. There are about twenty species of univalves and twelve of bivalves in the fresh-water shells, and about four hundred species in the marine shells, including the paper nautilus (Argonauta). Perhaps the most interesting of all the invertebrates is the Peripatus, an ancient type of creature which survives in New Zealand and in parts of Australia, Africa, South America, the West Indies, New Britain, the Malay Peninsula, and Sumatra. Zoologically, it belongs to the air-breathing division of the phylum Arthropoda, and has been placed in a special class, Prototracheata or Onychophora. It is about 3 in, long, has many feet, loves moisture, shuns light, and moves slowly. Two genera have been found in New Zealand. One genus, Peripatoides, contains two species, novae-zealandiae and suteri, and the other, OÖperipatus, contains only one species, viridimaculatus. The Peripatus is viviparous. It is claimed that one New Zealand genus, OÖperipatus, is oviparous, but that has not been fully proved.* Professor A. Dendy, F.R.S., has made special investigations in regard to the New Zealand species.
With the arrival of Europeans the whole face of the fauna was changed. The first European animal introduced was the pig, liberated by Captain Cook in Queen Charlotte Sound in 1773. With settlement, sheep, cattle, horses, and other domestic animals were brought, some for utility, some for pleasure, such as song-birds, and some for sport, such as deer, trout, pheasants, and quail. In the work of acclimatization several great and irretrievable blunders were made. The worst of these was the introduction of rabbits, stoats, and weasels.
* Professor Adam Sedgwick, F.R.S., late Professor of Zoology at the Imperial College of Science and Technology, London, in the new Encyclopaedia Britannica.
Table of Contents
THE history of New Zealand prior to the seventeenth century is shrouded in mythology and tradition. When the country was discovered by Europeans in 1642 it was found to be inhabited by a race of Polynesians called Maoris, who had discovered these islands many centuries previously. At what time the discovery of New Zealand was made by the Maoris, and from what place they came, are matters of tradition only, much having been lost in the obscurity enveloping the history of a people without letters. Nor is there anything on record respecting the origin of the Maori people themselves, beyond the general tradition of the Polynesian race, which seems to show a series of successive migrations from west to east, probably by way of Malaysia to the Pacific. Little more can now be gathered from their traditions than that they were immigrants, and that they probably found inhabitants on the east coast of the North Island belonging to the same race as themselves—the descendants of a prior migration whose history is lost. The tradition runs that, generations ago, the Maoris dwelt in a country named Hawaiki, and that one of their chiefs, after a long voyage, reached the northern island of New Zealand. Returning to his home with a flattering description of the country he had discovered, this chief, it is said, persuaded a number of his kinsfolk and friends to set out with a fleet of double canoes for the new land. The names of most of the canoes are still remembered, and each tribe agrees in its account of the doings of the people of the principal canoes after their arrival in New Zealand; and from these traditional accounts the descent of the numerous tribes has been traced. The position of the legendary Hawaiki is unknown, but many places in the South Seas have been thus named in memory of the motherland. The Maoris speak a very pure dialect of the Polynesian language, the common tongue, with more or less variation, in all the eastern Pacific islands.
It was on the 13th December, 1642, that Abel Jansen Tasman, a Dutch navigator, discovered New Zealand. Tasman left Batavia on the 14th August, 1642, in the yacht “Heemskercq,” accompanied by the “Zeehaen” (or “Sea-hen”) fly-boat. After having visited Mauritius and discovered Tasmania, named by him “Van Diemen's Land,” in honour of Anthony van Diemen, Governor of the Dutch possessions in the East Indies, he steered eastward, and sighted the west coast of the South Island of New Zealand, described by him as “a high mountainous country.”
Tasman, under the belief that the land he saw belonged to a great polar continent, and was part of the country discovered some years before by Schouten and Le Maire, to which the name “Staten Land” had been given, gave the same name “Staten Land” to New Zealand; but within about three months afterwards Schouten's “Staten Land” was found to be merely an inconsiderable island. Upon this discovery being announced, the country that Tasman had called “Staten Land” received the name of “New Zealand,” by which it has ever since been known. Tasman sailed along the coast and anchored in Golden Bay, called by him “Murderers' Bay” on account of an unprovoked attack on a boat's crew by the Natives and the massacre of four white men. Thence he steered along the west coast of the North Island, and gave the name “Cape Maria van Diemen” to the north-western extremity thereof. After sighting the islands of the Three Kings he finally departed without having set foot in the country.
There is no record of any visit to New Zealand after Tasman's departure until the time of Captain Cook, who, after leaving the Society Islands, sailed in search of a southern continent then believed to exist. He sighted land on the 6th October, 1769, at Young Nick's Head, and on the 8th of that month cast anchor in Poverty Bay. After having coasted round the North Island and the South and Stewart Islands—which last he mistook for part of the South Island—he took his departure from Cape Farewell on the 31st March, 1770, for Australia. He visited New Zealand again in 1773, in 1774, and in 1777.
Several other explorers also visited New Zealand during the latter portion of the eighteenth century, amongst whom may be mentioned—
M. de Surville, in command of the “Saint Jean Baptiste,” who sighted the north-east coast on the 12th December, 1769, only two months after Cook's arrival at Poverty Bay.
M. Marion du Fresne—1772.
Captains Vancouver and Broughton—1791.
Captain Raven—1792 and 1793.
Alejandro Malaspina and José de Bustamente y Guerra—1793.
Lieutenant Hanson—1793.
So far as is known, the first instance of Europeans being left in New Zealand to their own resources occurred in 1792, when Captain Raven, of the “Britannia,” landed a sealing-party at Facile Harbour, on the west coast of the South Island, where they remained a little over twelve months before being called for by the “Britannia.”
The next few years saw the establishment of whaling-stations at several points on the coast, and in 1814 the first missionaries—Messrs. Hall and Kendall—arrived in New Zealand. After a short stay they returned to New South Wales, and on the 19th November of that year again embarked in company with Mr. Samuel Marsden, chaplain to the New South Wales Government, who preached his first sermon in New Zealand on Christmas Day, 1814. He returned to Sydney on the 23rd March, 1815, leaving Messrs. Hall, Kendall, and King, who formed the first mission station at Rangihoua, Bay of Islands.
In 1825 three separate attempts were made to found colonies in various parts of New Zealand, but none of these was successful, and for some years the only settlements were those round the principal whaling-stations. A number of Europeans gradually settled in different parts of the country, and married Native women.
The first body of immigrants under a definite scheme of colonization arrived in Port Nicholson on the 22nd January, 1840, and founded the town of Wellington. During the few succeeding years the settlements of Nelson, Taranaki, Otago, and Canterbury were formed by immigrants sent out by associations in the United Kingdom.
As early as 1833 a British Resident (Mr. Busby) was appointed, with headquarters at Kororareka (now called Russell), on the Bay of Islands. Seven years later—namely, on the 29th January, 1840—Captain William Hobson, R.N., arrived at the Bay of Islands, empowered, with the consent of the Natives, to proclaim the sovereignty of Queen Victoria over the Islands of New Zealand, and to assume the government thereof. A compact called the Treaty of Waitangi, to which in less than six months 512 names were affixed, was entered into, whereby all rights and powers of sovereignty were ceded to the Queen, all territorial rights being secured to the chiefs and their tribes. The seat of Government was established at Waite-mata (Auckland), and a settlement formed there.
The record of formal Government of New Zealand under the British Crown begins with the following Proclamation issued by Captain Hobson on the 21st May, 1840:—
In the name of Her Majesty VICTORIA, Queen of the United Kingdom of Great Britain and Ireland. By WILLIAM HOBSON, Esquire, a Captain in the Royal Navy, Lieutenant-Governor of New Zealand.
WHEREAS by a treaty bearing date the sixth day of February, in the year of our Lord one thousand eight hundred and forty, made and executed by me, William Hobson, a Captain in the Royal Navy, Consul and Lieutenant-Governor in New Zealand, vested for this purpose with full powers by Her Britannic Majesty of the one part, and the Chiefs of the Confederation of the United Tribes of New Zealand, and the separate and independent Chiefs of New Zealand not members of the Confederation, of the other, and further ratified and confirmed by the adherence of the principal Chiefs of this Island of New Zealand (commonly called the “Northern Island”), all rights and powers of sovereignty over the said Northern Island were ceded to Her Majesty the Queen of Great Britain and Ireland absolutely and without reservation:
Now, therefore, I, William Hobson, Lieutenant-Governor of New Zealand, in the name and on behalf of Her Majesty, do hereby proclaim and declare to all men that from and after the date of the above-mentioned treaty the full sovereignty of the Northern Island of New Zealand vests in Her Majesty Queen Victoria, her heirs and successors for ever.
Given under my hand, at Government House. Russell, Bay of Islands, this twenty-first day of May, in the year of our Lord one thousand eight hundred and forty.
WILLIAM HOBSON,
Lieutenant-Governor.
By His Excellency's command.
WILLOUGHBY SHORTLAND, Colonial Secretary.
British sovereignty over the South Island was formally proclaimed at Cloudy Bay on the 17th June, 1840, by Major Bunbury, H.M. 80th Regiment, and Captain Nias, R.N.
From the date of Hobson's Proclamation until the 3rd May, 1841, New Zealand remained a dependency of New South Wales, and on the latter date it was created a separate colony by Royal Charter dated the 16th November, 1840.
The Government of the colony was first vested in a Governor, who was responsible only to the Crown; there was an Executive Council, with advisory powers only, as well as a Legislative Council.
On the 30th June, 1852, an Act granting representative institutions was passed by the Imperial Parliament, and published in New Zealand by Proclamation on the 17th January, 1853. Under it the constitution of a General Assembly was provided for, to consist of a Legislative Council and a House of Representatives.
The first session of the General Assembly was opened on the 27th May, 1854, but the members of the Executive were not responsible to Parliament. During the session of that year there were associated with the permanent members of the Executive Council certain members of the House of Representatives, who, however, held no portfolios. The first Ministers under a system of responsible government were appointed in the year 1856.
On addresses from both Houses of the General Assembly, His Majesty the King, by Order in Council dated 9th September, 1907, and by Proclamation issued 10th September, 1907, was graciously pleased to change the style and designation of the Colony of New Zealand to “The Dominion of New Zealand”; the change taking effect from Thursday, the 26th September, 1907.
By Letters Patent dated 11th May, 1917, the designation of Governor and Commander-in-Chief which had hitherto been held by the Royal representative in New Zealand was altered to “Governor-General and Commander-in-Chief.”
Prior to the establishment of responsible government the Executive Council for New Zealand consisted, in addition to the Governor, of the Colonial Secretary, the Attorney-General, and the Colonial Treasurer, seniority being in the order named. The Governor, or in his absence the senior member present, was to preside, and two members exclusive of the Governor or member presiding were to form a quorum. The Governor was commanded to in all things consult and advise with the Executive Council, and not to exercise the powers and authorities vested in him except by and with the concurrence and advice of the Executive Council, unless in cases of an urgent and pressing nature which would not admit of delay. In such cases he was, with all convenient speed, to bring the measures so adopted by him before the Executive Council for its revision and sanction. Nothing in these instructions, however, was to prevent the Governor exercising any or all of the powers and authorities vested in him, without the advice and concurrence of the Executive Council, in cases not considered of sufficient importance to require their assistance or advice, or in cases which were of such a nature that in his judgment material prejudice might be sustained by consulting the Executive Council thereupon. No questions were to be brought before the Council except those proposed by the Governor, who in any case in which he saw sufficient cause to dissent from the opinion of the major part or the whole of the Council was further empowered to exercise the powers vested in him in opposition to such opinion.
The powers, duties, and responsibilities of the Governor-General and the Executive Council under the present system of responsible government are set out in Royal Letters Patent and Instructions thereunder of the 11th May, 1917, published in the New Zealand Gazette of the 24th April, 1919 (p. 1213). The relationship between the powers of the Governor-General and the Executive Council is indicated in paragraphs V and VII of the Instructions, which read as follows:—
In the execution of the powers and authorities vested in him the Governor-General shall be guided by the advice of the Executive Council, but, if in any case he shall see sufficient cause to dissent from the opinion of the said Council, he may act in the exercise of his said powers and authorities in opposition to the opinion of the Council, reporting the matter to Us without delay, with the reasons for his so acting.
In any such case it shall be competent to any member of the said Council to require that there be recorded upon the minutes of the Council the grounds of any advice or opinion that he may give upon the question.
The Governor-General shall not pardon or reprieve any offender without first receiving in capital cases the advice of the Executive Council, and in other cases the advice of one at least of his Ministers; and in any case in which such pardon or reprieve might directly affect the interests of Our Empire, or of any country or place beyond the jurisdiction of the Government of the Dominion, the Governor-General shall, before deciding as to either pardon or reprieve, take those interests specially into his own personal consideration in conjunction with such advice as aforesaid.
The present Executive Council consists of fifteen members in addition to the Governor-General. Two members, exclusive of His Excellency or the presiding member, constitute a quorum.
Prior to the establishment of responsible government the Legislative Council of New Zealand consisted of the Colonial Secretary, the Attorney-General, the Colonial Treasurer, and the three senior Justices of the Peace. The Governor, or in his absence the senior member present, was to preside at all meetings of the Council; four members in addition to the Governor or the member presiding to form a quorum. No law or Ordinance was to be enacted by the Legislative Council which was not first proposed by the Governor, and no question was to be debated unless submitted by him for that purpose. The laws and Ordinances of the Council were to be designated “Ordinances enacted by the Governor of New Zealand with the advice and consent of the Legislative Council thereof.” No laws were to be made to continue for less than two years except only in cases of unforeseen emergency requiring provision for temporary service, and the Governor was specially enjoined not to propose or assent to Ordinances or laws dealing with certain matters, some of which were,—
Restricting public worship, although not conducted according to the Church of England.
Reducing revenue or infringing prerogative or affecting the salaries or allowances of public officers without special leave.
Issuing bills of credit or other negotiable securities in lieu of money on the credit of the colony, or paper currency, or any coin save the legal coin of the realm.
By which persons not of European birth or descent might be subjected or liable to disabilities or restrictions to which persons of European birth or descent would not also be subjected.
Raising money by public or private lotteries.
Naturalizing aliens without leave.
Divorcing persons joined together in holy matrimony.
Granting money, land, or other donation or gratuity to the Governor.
The Legislative Council assembled for its first session at Auckland on the 24th May, 1854, and comprised fourteen members.
The Councillors had been designated a year earlier by the Governor, and their names submitted for the Royal approval; and they were gazetted in New Zealand in December, 1853. Until 1868 the rule was that the appointment of members should be made by an instrument under the Royal Sign-manual, but the rule was not strictly observed after 1861. An Act of the Imperial Parliament in 1868 validated any appointments of Councillors that might have been made irregularly in the past, and provided that future appointments should be made by the Governor (not by the Sovereign).
Until 1891 members were appointed for life, but since that year appointments have been made for seven years only, members, however, being eligible for reappointment. The last remaining life appointee, the late Hon. W. D. H. Baillie, died on the 24th February, 1922, after holding office for nearly sixty-one years. Prior to 1891 the Speaker was appointed by the Governor, but the Council now elects its own Speaker, who holds office for five years. A Chairman of Committees is elected every session, and holds office till the election of his successor. Speaker and Chairman are both eligible for re-election. The Imperial Act under which the earliest appointments were made did not fix a minimum number of members, though it provided that the first appointees should be not less than ten in number. The number actually summoned was sixteen, of whom only fourteen attended and were enrolled. The number increased irregularly for thirty years. In 1885 and 1886 it stood at fifty-three, but has not since reached that limit. The number on the roll at present is forty-two.
Provision for an elective Legislative Council is contained in the Legislative Council Act, 1914, which was originally intended to come into operation at the first general election of members of the Lower House after the end of 1915. The introduction of the new system has, however, been postponed from time to time, and at present the position is that the Act is to be brought into operation at a date to be specified by Proclamation. Under the system outlined in the Act the Dominion is to be divided into four electoral divisions, two in the North Island and two in the South, and the number of members is to be forty, divided between the two Islands on a population basis. The Governor-General is empowered to appoint not more than three Maori members to the Council.
The qualifications for membership of the Legislative Council are the same as for the House of Representatives, referred to below, with the proviso that a person may not at the same time be a member of both Houses.
Before the year 1892 the honorarium of Councillors was understood to be for the session, not for the year, and formed the subject of a special vote every session, the amount varying in different sessions. By the Payment of Members Act, 1892, the honorarium was made annual, not sessional, and was fixed at £150 a year. The amount was raised in 1904 to £200, and in 1920 to £350, but was reduced in 1922 to £315. Besides the honorarium, members are allowed travelling-expenses actually incurred in going to and from Parliament.
Subject to certain exemptions, members not attending the Council are liable to be fined.
The number of members constituting the House of Representatives is eighty—seventy-six Europeans and four Maoris. They are now designated “Members of Parliament.” The number was originally fixed by the Constitution Act as not more than forty-two and not less than twenty-four, and the first Parliament called together in 1854 consisted of forty members. Legislation passed in 1858 fixed the number of European members at forty-one; in 1860, at fifty-three; in 1862, at fifty-seven; in 1865, at seventy; in 1867, at seventy-two; in 1870, at seventy-four; in 1875, at eighty-four; in 1881, at ninety-one; in 1887, at seventy; and in 1900, at seventy-six. By the Maori Representation Act, 1867, which is still in force, as embodied in the Legislature Act, 1908, four Maori members were added, three for the North Island and one for the South.
The North Island at present returns forty-six European members, and the South Island thirty. Quinquennial Parliaments, instituted under the Constitution Act, were abolished by the Triennial Parliaments Act, 1879, which fixed the term at three years. General elections have been held at three-yearly intervals since 1881, with the exception that the term of the nineteenth Parliament was extended to five years by special legislation.
Every registered elector of either sex who is free from any of the disqualifications mentioned in the Legislature Act, 1908, is eligible for membership. All contractors to the public service of New Zealand to whom any public money above the sum of £50 is payable, directly or indirectly, in any one financial year, as well as the public servants of the Dominion, are incapable of being elected as, or of sitting or voting as, members.
The payment made to members of the House of Representatives is £450 per annum, subject to certain deductions for absence not due to sickness or other unavoidable cause. Travelling-expenses to and from Wellington are also allowed. The rate of payment for several years prior to 1920 was £300 per annum, but was increased in that year to £500, a 10-per-cent. reduction, however, being made in 1922 by the Public Expenditure Adjustment Act, 1921–22.
The election of a Speaker is the first business of a new House after the members have been sworn. A Chairman of Committees is elected as soon after as is convenient. Both Speaker and Chairman of Committees hold office until a dissolution, and receive payment until the first meeting of a now Parliament.
Twenty members, inclusive of the Speaker, constitute a quorum.
The three cardinal principles of the franchise in New Zealand are (1) one man one vote, (2) female suffrage, and (3) adult suffrage.
There are, of course, slight exceptions to the last-mentioned, the following classes of persons not being entitled to register as electors or to vote:—
An alien;
A person of unsound mind;
A person convicted of an offence punishable by death or by imprisonment for one year or upwards within any part of His Majesty's dominions, or convicted in New Zealand as a public defaulter, or under the Police Offences Act, 1908, as an idle and disorderly person or as a rogue and vagabond, unless such offender has received a free pardon, or has undergone the sentence or punishment to which he was adjudged for such offence.
To be registered as an elector a person must have resided for one year in the Dominion, and for three months in the electoral district for which he claims to vote. A system of compulsory registration of electors was introduced at the end of 1924.
The system of “one man one vote” has been in operation since 1889, and women's suffrage since 1893. The qualifications for registration are the same for both sexes.
Side by side with the general government of the country, but subordinate to it, there has existed a system of local government since the early years of New Zealand's annexation as a British colony. The history of local government divides naturally into two periods representing two distinct systems—viz., the provincial, which was in operation up to 1876, and the county, which superseded the provincial in that year.
On the 23rd December, 1847, a Charter was signed dividing the colony into two provinces—New Ulster and New Munster—and this was proclaimed in New Zealand on the 10th March, 1848. The Province of New Ulster consisted of the whole of the North Island with the exception of that portion adjacent to Cook Strait and lying to the south of a line commencing at the centre of the mouth of the Patea River and running thence due east to the east coast. The Province of New Munster consisted of the South and Stewart Islands and of the portion of the North Island excluded from New Ulster. Each province had a Lieutenant - Governor, an Executive Council, and a Legislative Council, while the Governor-in-Chief for the whole colony was also Governor of each province. Provision had also been made for a House of Representatives in each province, but this portion of the Charter was suspended for five years, and before it came into operation a new Constitution was obtained.
Under the new Constitution the Provinces of New Ulster and New Munster were abolished and the colony was divided into six provinces—Auckland, New Plymouth (later altered to Taranaki), Wellington, Nelson, Canterbury, and Otago. Each province was to be presided over by an elective Superintendent, and to have an elective Provincial Council empowered to legislate, except on certain specified subjects. The franchise amounted practically to household suffrage. In each case the election was for four years, but a dissolution of the Provincial Council by the Governor could take place at any time, necessitating a fresh election both of the Council and of the Superintendent. The Superintendent was chosen by the whole body of the electors of the province, and each member of the Provincial Council by the electors of a district. The boundaries of the new provinces were gazetted on the 2nd April, 1853, and the boundaries of the electoral districts on the 14th May following, the first general elections for the House of Representatives and the Provincial Councils being held during 1853 and the beginning of 1854. The Provincial Governments, afterwards increased to nine by the formation of Hawke's Bay, Marlborough, and Southland, later reduced to eight by the merging of Southland with Otago, and again increased to nine by the formation of Westland, remained as integral parts of the Constitution of the colony until the 1st November, 1876, when they were abolished by an Act of the General Assembly, that body having been vested with the power of altering the Constitution Act.
Even before the division of New Zealand into the two provinces of New Ulster and New Munster, local government had its inception, Wellington having been created a borough in 1842 under the authority of the Municipal Corporations-Ordinance of that year. The Ordinance was disallowed by the Home Government, but was re-enacted, with necessary alterations, in 1844. Wellington, which lost its status on the original Ordinance being disallowed, did not become a borough again. until 1870, Auckland (constituted in 1851) remaining the only borough in New Zealand for several years.
Wellington, which had been the first borough in the country, also became the first town district, with a form of government not differing greatly from that of a municipality. Gradually the more important towns adopted the status of boroughs, while the less important remained town districts. In Otago, however, between 1865 and 1875, several small towns were created boroughs under the authority of an Ordinance of the Otago Provincial Council, nineteen of the thirty-six boroughs in existence at the date of the abolition of the provinces being in Otago, all formed under the provisions of the Ordinance referred to.
Another form of local government which came into existence in the provincial days was that of the road districts, or, as they were called in certain parts of the country, highway districts. As the names imply, the road and highway districts were formed for the purpose of extending and maintaining roads. Each district was controlled by an elected Board, which had power to levy rates. The first Road Boards were formed in 1863, and by 1875 their number had risen to 314.
Among the instructions given Captain Hobson on his appointment as the first Governor of New Zealand was one directing that the colony was to be divided into counties, hundreds, and parishes. In accordance with this instruction, the boundaries of the County of Eden, in which Auckland—the then capital—is situated, were proclaimed in 1842, and some years later the county was divided into hundreds. Very little further was done towards giving effect to the instructions, and the first administrative county was Westland, separated from Canterbury Province in 1867, and granted a system of local government in the following year.
It was not until the abolition of the provinces in 1876 that a scheme of division of the whole country into counties was introduced. The Counties Act, 1876, which, in conjunction with the Municipal Corporations Act of the same year, provided a comprehensive scheme of local government in lieu of the provincial governments, divided New Zealand into sixty-three counties. With the exception of six, which were exempted from the operations of the Act, each county was placed under the control of an elected Chairman and Council, possessed of fairly full powers of local government—considerably less, however, than those formerly enjoyed by the Provincial Councils. The Counties Act specially excluded boroughs from the counties within which they geographically lie, and a similar provision has since been made in the case of town districts having a population of over 500.
Since the abolition of the provinces and the passing of the Counties and Municipal Corporations Acts of 1876 there has been considerable extension of local government. Many of the road districts have merged with the counties within which they lie, while others have become boroughs and town districts. On the other hand, counties, boroughs, and town districts have increased in numbers, while several entirely new classes of local districts, formed for definite purposes—as, for instance, land drainage or electric-power supply—have come into existence. In most cases the Boards of these districts have borrowing and rating powers.
The numbers of local districts of each class in the Dominion at present are as follow:—
| Counties | 129 |
|---|---|
| Boroughs | 119 |
| Town districts— | |
| Not forming parts of counties | 40 |
| Forming parts of counties | 29 |
| Road districts | 35 |
| River districts | 48 |
| Land-drainage districts | 64 |
| Harbour districts | 41 |
| Hospital districts. | 46 |
| Electric-power districts | 41 |
| City and suburban drainage districts | 3 |
| Tramway district | 1 |
| local railway districts | 5 |
| Water-supply districts | 6 |
| Main-highway districts | 18 |
| Fire districts | 37 |
| Rabbit districts | 54 |
| Gas-lighting district | 1 |
Much fuller information concerning the origin, development, constitution, functions, &c., of local governing bodies than can be given here will be found in the Local Authorities Handbook of New Zealand. The reader is also referred to the section of this book dealing with Local Government.
Table of Contents
Captain William Hobson, R.N., Lieutenant-Governor of New Zealand under Sir George Gipps, Governor of New South Wales, from January, 1840, to 3rd May, 1841, and Governor of New Zealand from 3rd May, 1841, until date of death, 10th September, 1842.
Lieutenant Willoughby Shortland, Administrator from 10th September, 1842, to 26th December, 1843.
Captain Robert Fitzroy, R.N., Governor from 26th December, 1843, to 17th November, 1845.
Captain George Grey, who became Sir George Grey, K.C.B., in 1848, Governor from 18th November, 1845, to 1st January, 1848; Governor-in-Chief over the Islands of New Zealand, Governor of the Province of New Ulster, and Governor of the Province of New Munster from 1st January, 1848, to 7th March, 1853; Governor of New Zealand from 7th March, 1853, to 31st December, 1853.
Edward John Eyre, Esquire, Lieutenant-Governor of New Munster from 28th January, 1848, until duties of Lieutenant-Governor ceased on 7th March, 1853.
Major-General George Dean Pitt, Lieutenant-Governor of New Ulster from 14th February, 1848, until date of death, 8th January, 1851.
Lieutenant-Colonel Robert Henry Wynyard, C.B., Lieutenant-Governor of New Ulster from 26th April, 1851, until duties of Lieutenant-Governor ceased on 7th March, 1853.
Lieutenant-Colonel Robert Henry Wynyard, C.B., Administrator from 3rd January, 1854, to 6th September, 1855.
Colonel Thomas Gore Browne, C.B., Governor from 6th September, 1855, to 2nd October, 1861.
Sir George Grey, K.C.B., Administrator from 3rd October, 1861; Governor from 4th December, 1861, to 5th February, 1868.
Sir George Ferguson Bowen, G.C.M.G., Governor from 5th February, 1868, to 19th March, 1873.
Sir George Alfred Arney, Chief Justice, Administrator from 21st March to 14th June, 1873.
Sir James Fergusson, Baronet, P.C., Governor from 14th June, 1873, to 3rd December, 1874.
The Marquis of Normanby, P.C., G.C.M.G., Administrator from 3rd December, 1874; Governor from 9th January, 1875, to 21st February, 1879.
James Prendergast, Esquire, Chief Justice, Administrator from 21st February to 27th March, 1879.
Sir Hercules George Robert Robinson, G.C.M.G., Administrator from 27th March, 1879; Governor from 17th April, 1879, to 8th September, 1880.
James Prendergast, Esquire, Chief Justice, Administrator from 9th September to 29th November, 1880.
The Honourable Sir Arthur Hamilton Gordon, G.C.M.G., Governor from 29th November, 1880, to 23rd June, 1882.
Sir James Prendergast, Chief Justice, Administrator from 24th June, 1882, to 20th January, 1883.
Lieutenant-General Sir William Francis Drummond Jervois, G.C.M.G., C.B., Governor from 20th January, 1883, to 22nd March, 1889.
Sir James Prendergast, Chief Justice, Administrator from 23rd March to 2nd May, 1889.
The Earl of Onslow, G.C.M.G., Governor from 2nd May, 1889, to 24th February, 1892.
Sir James Prendergast, Chief Justice, Administrator from 25th February to 6th June, 1892.
The Earl of Glasgow, G.C.M.G., Governor from 7th June, 1892, to 6th February, 1897.
Sir James Prendergast, Chief Justice, Administrator from 8th February to 9th August, 1897.
The Earl of Ranfurly, G.C.M.G., Governor from 10th August, 1897, to 19th June, 1904.
The Right Honourable William Lee, Baron Plunket, K.C.M.G., K.C.V.O., Governor from 20th June, 1904, to 8th June, 1910.
Hon. Sir Robert Stout, K.C.M.G., Chief Justice, Administrator from 8th June to 22nd June, 1910.
The Right Honourable John Poynder Dickson-Poynder, K.C.M.G., Baron Islington, D.S.O., Governor from 22nd June, 1910, to 2nd December, 1912.
Hon. Sir Robert Stout, K.C.M.G., Chief Justice, Administrator from 3rd December to 19th December, 1912.
The Earl of Liverpool, P.C., G.C.M.G., G.B.E., M.V.O., Governor from 19th December, 1912; Governor-General from 28th June. 1917, to 7th July, 1920.
Right Hon. Sir Robert Stout, P.C., K.C.M.G., Chief Justice, Administrator from 8th July, 1920, to 26th September, 1920.
Viscount Jellicoe of Scapa, G.C.B., O.M., G.C.V.O., Governor-General from 27th September, 1920, to 25th November, 1924.
Right Hon. Sir Robert Stout, P.C., K.C.M.G., Chief Justice, Administrator from 26th November, 1924, to 12th December, 1924.
General Sir Charles Fergusson, Baronet, LL.D., G.C.M.G., K.C.B., D.S.O., M.V.O., Governor-General from 13th December, 1924.
His Excellency, General Sir Charles Fergusson, Baronet, LL.D., G.C.M.G., K.C.B., D.S.O., M.V.O.
Private Secretary—George J. Little.
Official Secretary—A. Cecil Day, C.M.G., C.B.E.
Military Secretary and Aide-de-Camp—(Vacant).
Aide-de-Camp—Captain C. J. Vernon-Wentworth.
Assistant Private Secretary—David J. Keswick.
Honorary Aides-de-Camp—Colonel J. Findlay, C.B., D.S.O.; Colonel M. M. Gard'ner. D.S.O.; Lieutenant-Colonel F. Symon, C.M.G., D.S.O.; Lieutenant-Colonel N. S. Falla, C.M.G., D.S.O.; Lieutenant-Colonel S. S. Allen, C.M.G., D.S.O.; Lieutenant-Colonel J. Hargest, D.S.O., M.C.
Honorary Physician—Colonel R. Tracy-Inglis, C.B.E., M.B.
Honorary Surgeon—Colonel P. C. Fenwick, C.M.G., M.D.
| SINCE THE ESTABLISHMENT OF RESPONSIBLE GOVERNMENT IN NEW ZEALAND IN 1856. | |||
|---|---|---|---|
| Name of Ministry. | Name of Premier. | Assumed Office. | Retired. |
| 1. Bell-Sewell | Henry Sewell | 7 May, 1856 | 20 May, 1856. |
| 2. Fox | William Fox | 20 May, 1856 | 2 June, 1856. |
| 3. Stafford | Edward William Stafford | 2 June, 1856 | 12 July, 1861. |
| 4. Fox | William Fox | 12 July, 1861 | 6 Aug., 1862. |
| 5. Domett | Alfred Domett | 6 Aug., 1862 | 30 Oct., 1863. |
| 6. Whitaker-Fox | Frederick Whitaker | 30 Oct., 1863 | 24 Nov., 1864. |
| 7. Weld | Frederick Aloysius Weld | 24 Nov., 1864 | 16 Oct., 1865. |
| 8. Stafford | Edward William Stafford | 16 Oct., 1865 | 28 June, 1869. |
| 9. Fox | William Fox | 28 June, 1869 | 10 Sept., 1872. |
| 10. Stafford | Edward William Stafford | 10 Sept., 1872 | 11 Oct., 1872. |
| 11. Waterhouse | George Marsden Waterhouse | 11 Oct., 1872 | 3 Mar., 1873. |
| 12. Fox | William Fox | 3 Mar., 1873 | 8 April, 1873. |
| 13. Vogel | Julius Vogel, C.M.G. | 8 April, 1873 | 6 July, 1875. |
| 14. Pollen | Daniel Pollen, M.L.C. | 6 July, 1875 | 15 Feb., 1876. |
| 15. Vogel | Sir Julius Vogel, K.C.M.G. | 15 Feb., 1876 | 1 Sept 1876. |
| 16. Atkinson | Harry Albert Atkinson | 1 Sept., 1876 | 13 Sept., 1876. |
| 17. Atkinson (reconstituted) | Harry Albert Atkinson | 13 Sept., 1876 | 13 Oct., 1877. |
| 18. Grey | Sir George Grey, K.C.B. | 15 Oct., 1877 | 8 Oct., 1879. |
| 19. Hall | John Hall | 8 Oct., 1879 | 21 April, 1882. |
| 20. Whitaker | Frederick Whitaker, M.L.C. | 21 April, 1882 | 25 Sept., 1883. |
| 21. Atkinson | Harry Albert Atkinson | 25 Sept., 1883 | 16 Aug., 1884. |
| 22. Stout-Vogel | Robert Stout | 16 Aug., 1884 | 28 Aug., 1884. |
| 23 Atkinson | Harry Albert Atkinson | 28 Aug., 1884 | 3 Sept., 1884. |
| 24. Stout-Vogel | Sir Robert Stout, K.C.M.G. | 3 Sept., 1884 | 8 Oct., 1887. |
| 25. Atkinson | Sir Harry Albert Atkinson, K.C.M.G. | 8 Oct., 1887 | 24 Jan., 1891. |
| 26. Ballance | John Ballance | 24 Jan., 1891 | 1 May, 1893. |
| 27. Seddon | Rt. Hon. Richard John Seddon, P.C. | 1 May, 1893 | 21 June, 1906. |
| 28. Hall-Jones | William Hall-Jones | 21 June, 1906 | 6 Aug., 1906. |
| 29. Ward | Rt. Hon. Sir Joseph George Ward, Bart., P.C., K.C.M.G. | 6 Aug., 1906 | 28 Mar., 1912. |
| 30. Mackenzie | Thomas Mackenzie | 28 Mar., 1912 | 10 July, 1912. |
| 31. Massey | Rt. Hon. William Ferguson Massey, P.C. | 10 July, 1912 | 12 Aug., 1915. |
| 32. National | Rt. Hon. William Ferguson Massey, P.C. | 12 Aug., 1915 | 25 Aug., 1919. |
| 33. Massey | Rt. Hon. William Ferguson Massey, P.C. | 25 Aug., 1919 | 14 May, 1925. |
| 34. Bell | Hon. Sir Francis Henry Dillon Bell, G.C.M.G., K.C. | 14 May, 1925 | 30 May, 1925. |
| 35. Coates | Rt. Hon. Joseph Gordon Coates, P.C., M.C. | 30 May, 1925 | .. |
1925, May 10.—Right Hon. William Ferguson Massey, P.C., Prime Minister, Minister of Finance, and Minister of Stamp Duties, died at Wellington.
1925, May 14.—Hon. Sir Francis Henry Hon Bell, G.C.M.G., K.C., appointed Prime Minister; and Hon. William Nosworthy appointed Minister of Finance and Minister of Stamp Duties. In other respects all Ministers confirmed in their then existing offices and as members of the Executive Council.
1925, May 30.—All Ministers, with exception of Hon. William Downie Stewart (absent in America), resigned their offices and their seats in the Executive Council. All Ministers, with the exception of Hon. William Downie Stewart and Hon. Sir Maui Pomare K.B.E., C.M.G., reappointed to Executive Council with same offices as before, except for following changes:—
Hon. Joseph Gordon Coates, M.C., succeeded Hon. Sir Francis Henry Dillon Bell, G.C.M.G., K.C., as Prime Minister.
Hon. Sir Christopher James Parr, K.C.M.G., succeeded Hon. Joseph Gordon Coates, M.C., as Postmaster-General and Minister of Telegraphs.
Hon. William Downie Stewart confirmed as a member of the Executive Council and in office as Minister of Customs and Minister of Industries and Commerce.
1925, June 1.—Hon. Sir Maui Pomare, K.B.E., C.M.G., appointed a member of the Executive Council and Minister of Health and Minister for the Cook Islands.
1926, January 18.—Hons. Oswald James Hawken. Francis Joseph Rolleston, and James Alexander Young appointed members of the Executive Council. Hon. William Downie Stewart succeeded Right Hon. Sir Francis Henry Dillon Bell, P.C., G.C.M.G., K.C., as Attorney-General; Hon. Oswald James Hawken succeeded Hon. William Nosworthy as Minister of Agriculture, and Hon. Sir Robert Heaton Rhodes, K.B.E., as Commissioner of State Forests; Hon. Francis Joseph Rolleston succeeded Hon. Sir Christopher James Parr, K.C.M.G., as Minister of Justice, and Hon. Sir Robert Heaton Rhodes, K.B.E., as Minister of Defence; Hon. James Alexander Young succeeded Hon. Sir Maui Pomare as Minister of Health. Hon. Sir Robert Heaton Rhodes, K.B.E., remained a member of the Executive Council without portfolio.
1926, April 24.—Hon. Sir Christopher James Parr, K.C.M.G., resigned seat in Executive Council and offices of Minister of Education, Postmaster-General, and Minister of Telegraphs, consequent on appointment as High Commissioner.
1926, May 24.—Hon. Robert Alexander Wright appointed a member of the Executive Council and Minister of Education. Hon. William Downie Stewart succeeded Hon. William Nosworthy as Minister of Finance and Minister of Stamp Duties; Hon. William Nosworthy succeeded Hon. Sir Christopher James Parr, K.C.M.G., as Postmaster-General and Minister of Telegraphs, and Right Hon. Sir Francis Henry Dillon Bell, P.C., G.C.M.G., K.C., as Minister of External Affairs; Hon. Alexander Donald McLeod succeeded Hon. William Downie Stewart as Minister of Industries and Commerce; Hon. Francis Joseph Rolleston succeeded Hon. William Downie Stewart as Attorney-General; Right Hon. Sir Francis Henry Dillon Bell, P.C., G.C.M.G., K.C., remained a member of the Executive Council without portfolio.
1926, June 12.—Hon. Kenneth Stuart Williams appointed a member of the Executive Council and Minister of Public Works, succeeding the Right Hon. Joseph Gordon Coates, P.C., M.C., in respect of latter.
| LIST OF MEMBERS SINCE MINISTRY ASSUMED OFFICE ON 30TH MAY, 1925, SHOWING OFFICES HELD AND PERIODS DURING WHICH SUCH OFFICES OCCUPIED. | ||||
|---|---|---|---|---|
| Name. | Office. | From | To | Remarks. |
| * Confirmed in offices previously held. | ||||
| Right Hon. Joseph Gordon Coates, P.C.,M.C. | Prime Minister | 30 May, 1925 | 12 June, 1926 | Succeeded by Mr. Williams. |
| Minister of Public Works | 30 May, 1925 | |||
| Minister of Railways | 30 May, 1925 | |||
| Minister of Native Affairs | 30 May, 1925 | |||
| Right Hon. Sir Francis Henry Dillon Bell, P.C., G.C.M.G., K.C. | Attorney-General | 30 May, 1925 | 18 Jan., 1926 | Succeeded by Mr. Stewart. |
| Minister of External Affairs | 30 May, 1925 | 24 May, 1926 | Succeeded by Mr. Nosworthy. | |
| Member of Executive Council without portfolio | 24 May, 1926 | |||
| David Henry Guthrie | Member of Executive Council without portfolio | 30 May, | 1925 | |
| William Downie Stewart | Minister of Customs | 30 May, 1925* | ||
| Minister of Industries and Commerce | 30 May, 1925* | 24 May, 1926 | Succeeded by Mr. McLeod. | |
| Attorney-General | 18 Jan., 1926 | 24 May, 1926 | Succeeded by Mr. Rolleston. | |
| Minister of Finance | 24 May, 1926 | |||
| Minister of Stamp Duties | 24 May, 1926 | |||
| William Nosworthy | Minister of Finance | 30 May, 1925 | 24 May, 1926 | Succeeded by Mr. Stewart. |
| Minister of Stamp Duties | 30 May, 1925 | 24 May, 1926 | Succeeded by Mr. Stewart. | |
| Minister of Agriculture | 30 May, 1925 | 18 Jan., 1926 | Succeeded by Mr. Hawken. | |
| Minister of Immigration | 30 May, 1925 | |||
| Postmaster-General | 24 May, 1926 | |||
| Minister of Telegraphs | 24 May, 1926 | |||
| Minister of External Affairs | 24 May, 1926 | |||
| Sir Christopher James Parr, K.C.M.G. | Minister of Education | 30 May, 1925 | 24 April, 1926 | Succeeded by Mr. Wright. |
| Minister of Justice | 30 May, 1925 | 18 Jan., 1926 | Succeeded by Mr. Rolleston. | |
| Postmaster-General | 30 May, 1925 | 24 April, 1926 | Succeeded by Mr. Nosworthy. | |
| Minister of Telegraphs | 30 May, 1925 | 24 April, 1926 | Succeeded by Mr. Nosworthy. | |
| George James Anderson | Minister of Labour | 30 May, 1925 | ||
| Minister of Mines | 30 May, 1925 | |||
| Minister of Marine | 30 May, 1925 | |||
| Alexander Donald McLeod | Minister of Lands | 30 May, 1925 | ||
| Minister of Industries and Commerce | 24 May, 1926 | |||
| Sir Robert Heaton Rhodes, K.B.E. | Minister of Defence | 30 May, 1925 | 18 Jan., 1926 | Succeeded by Mr. Rolleston. |
| Commissioner of State Forests | 30 May, 1925 | 18 Jan., 1926 | Succeeded by Mr. Hawken. | |
| Member of Executive Council without portfolio | 24 May, 1926 | |||
| Sir Maui Pomare, K.B.E., C.M.G. | Minister of Health | 1 June, 1925 | 18 Jan., 1926 | Succeeded by Mr. Young. |
| Minister of Cook Islands | 1 June, 1925 | |||
| Richard Francis Bollard | Minister of Internal Affairs | 30 May, 1925 | ||
| Oswald James Hawken | Minister of Agriculture | 18 Jan., 1926 | ||
| Commissioner of State Forests | 18 Jan., 1926 | |||
| Francis Joseph Rolleston | Minister of Justice | 18 Jan., 1926 | ||
| Minister of Defence | 18 Jan., 1926 | |||
| Attorney-General | 24 May, 1926 | |||
| James Alexander Young | Minister of Health | 18 Jan., 1926 | ||
| Robert Alexander Wright | Minister of Education | 24 May, 1926 | ||
| Kenneth Stuart Williams | Minister of Public Works | 12 June, 1926 | ||
Right Hon. J. G. Coates, P.C., M.C., Prime Minister, Minister of Railways, Minister of Native Affairs, Minister in Charge of Public Trust and Native Trust Departments.
Right Hon. Sir F. H. D. Bell, P.C., G.C.M.G., K.C., Member of the Executive Council without portfolio.
Hon. W. Downie Stewart. Minister of Finance, Minister of Stamp Duties, Minister of Customs, Minister in Charge of Land and Income Tax and State Advances Departments.
Hon. W. Nosworthy, Postmaster-General, Minister of Telegraphs, Minister of External Affairs, Minister of Immigration, Minister in Charge of Legislative, Tourist, and Health Resorts, Government Life Insurance, State Fire and Accident Insurance, and Public Service Superannuation Departments.
Hon. G. J. Anderson, Minister of Labour, Minister of Mines, Minister of Marine, Minister in Charge of Pensions, Printing and Stationery, Publicity, and Inspection of Machinery Departments.
Hon. Sir R. Heaton Rhodes, K.B.E., Member of the Executive Council without portfolio, and Leader of the Legislative Council.
Hon. D. H. Guthrie. Member of the Executive Council without portfolio.
Hon. A. D. McLeod, Minister of Lands, Minister of Industries and Commerce, Minister in Charge of Electoral, Valuation, Land for Settlements, Discharged Soldiers' Settlement, and Scenery Preservation Departments.
Hon. Sir Maui Pomare, K.B.E., C.M.G., Minister for Cook Islands, and Member of the Executive Council representing the Native Race.
Hon. R. F. Bollard, Minister of Internal Affairs, Minister in Charge of High Commissioner's Office, Audit, Museum, Registrar-General's, Census and Statistics, Laboratory, and Advertising Departments.
Hon. O. J. Hawken, Minister of Agriculture, Commissioner of State Forests.
Hon. F. J. Rolleston, Attorney-General, Minister of Justice, Minister of Defence, Minister in Charge of Police, Prisons, and War Pensions Departments.
Hon. J. A. Young, Minister of Health, Minister in Charge of Mental Hospitals Department.
Hon. R. A. Wright, Minister of Education, Minister in Charge of Friendly Societies and National Provident Fund Departments.
Hon. K. S. Williams, Minister of Public Works, Minister in Charge of Roads and Public Buildings.
Clerk of the Executive Council—F. D. Thomson, B.A., C.M.G.
| SUCCESSIVE PARLIAMENTS SINCE THE PASSING OF THE CONSTITUTION ACT CONFERRING REPRESENTATIVE INSTITUTIONS UPON NEW ZEALAND, WITH THE DATES OF OPENING OF SESSIONS AND DATES OF PROROGATION AND OF DISSOLUTION. | |||
|---|---|---|---|
| Parliament. | Dates of Opening of Sessions. | Dates of Prorogation | Dates of Dissolution. |
| First | 27 May, 1854 | 9 Aug., 1854 | 15 Sept., 1855. |
| 31 Aug., 1854 | 16 Sept., 1854 | ||
| 8 Aug., 1855 | 15 Sept., 1855 | ||
| Second | 15 April, 1856 (No sess., 1857) | 16 Aug., 1856 | 5 Nov., 1860. |
| 10 April, 1858 (No sess., 1859) | 21 Aug., 1858 | ||
| 30 July, 1860 | 5 Nov., 1860 | ||
| Third | 3 June, 1861 | 7 Sept., 1861 | 27 Jan., 1866. |
| 7 July, 1862 | 15 Sept., 1862 | ||
| 19 Oct., 1863 | 14 Dec., 1863 | ||
| 24 Nov., 1864 | 13 Dec., 1864 | ||
| 26 July, 1865 | 30 Oct., 1865 | ||
| Fourth | 30 June, 1866 | 8 Oct., 1866 | 30 Dec., 1870. |
| 9 July, 1867 | 10 Oct., 1867 | ||
| 9 July, 1868 | 20 Oct., 1868 | ||
| 1 June, 1869 | 3 Sept., 1869 | ||
| 14 June, 1870 | 13 Sept., 1870 | ||
| Fifth | 14 Aug., 1871 | 16 Nov., 1871 | 6 Dec., 1875. |
| 16 July, 1872 | 25 Oct., 1872 | ||
| 15 July, 1873 | 3 Oct., 1873 | ||
| 3 July, 1874 | 31 Aug., 1874 | ||
| 20 July, 1875 | 21 Oct., 1875 | ||
| Sixth | 15 June, 1876 | 31 Oct., 1876 | 15 Aug., 1879. |
| 19 July, 1877 | 10 Dec., 1877 | ||
| 26 July, 1878 | 2 Nov., 1878 | ||
| 11 July, 1879 | 11 Aug., 1879 | ||
| Seventh | 24 Sept., 1879 | 19 Dec., 1879 | 8 Nov., 1881. |
| 28 May, 1880 | 1 Sept., 1880 | ||
| 9 June, 1881 | 24 Sept., 1881 | ||
| Eighth | 18 May, 1882 | 15 Sept., 1882 | 27 June, 1884. |
| 14 June, 1883 | 8 Sept., 1883 | ||
| 5 June, 1884 | 24 June, 1884 | ||
| Ninth | 7 Aug., 1884 | 10 Nov., 1884 | 15 July, 1887. |
| 11 June, 1885 | 22 Sept., 1885 | ||
| 13 May, 1886 | 18 Aug., 1886 | ||
| 26 April, 1887 | 10 June, 1887 | ||
| Tenth | 6 Oct., 1887 | 23 Dec., 1887 | 3 Oct., 1890. |
| 10 May, 1888 | 31 Aug., 1888 | ||
| 20 June, 1889 | 19 Sept., 1889 | ||
| 19 June, 1890 | 18 Sept., 1890 | ||
| Eleventh | 23 Jan., 1891 | 31 Jan., 1891 | 8 Nov., 1893. |
| 11 June, 1891 | 25 Sept., 1891 | ||
| 23 June, 1892 | 12 Oct., 1892 | ||
| 22 June, 1893 | 7 Oct., 1893 | ||
| Twelfth | 21 June, 1894 | 24 Oct., 1894 | 14 Nov., 1896. |
| 20 June, 1895 | 2 Nov., 1895 | ||
| 11 June, 1896 | 19 Oct., 1896 | ||
| Thirteenth | 7 April, 1897 | 12 April, 1897 | 15 Nov., 1899. |
| 23 Sept., 1897 | 22 Dec., 1897 | ||
| 24 June, 1898 | 5 Nov., 1898 | ||
| 23 June, 1899 | 24 Oct., 1899 | ||
| Fourteenth | 22 June, 1900 | 22 Oct., 1900 | 5 Nov., 1902. |
| 1 July, 1901 | 8 Nov., 1901 | ||
| 1 July, 1902 | 4 Oct., 1902 | ||
| Fifteenth | 29 June, 1903 | 25 Nov., 1903 | 15 Nov., 1905. |
| 28 June, 1904 | 8 Nov., 1904 | ||
| 27 June, 1905 | 31 Oct., 1905 | ||
| Sixteenth | 27 June, 1906 | 3 July, 1906 | 29 Oct., 1908. |
| 21 Aug., 1906 | 29 Oct., 1906 | ||
| 27 June, 1907 | 25 Nov., 1907 | ||
| 29 June, 1908 | 12 Oct., 1908 | ||
| Seventeenth | 10 June, 1909 | 17 June, 1909 | 20 Nov., 1911. |
| 7 Oct., 1909 | 29 Dec., 1909 | ||
| 28 June, 1910 | 5 Dec., 1910 | ||
| 27 July, 1911 | 30 Oct., 1911 | ||
| Eighteenth | 15 Feb., 1912 | 1 Mar., 1912 | 20 Nov., 1914. |
| 27 June, 1912 | 8 Nov., 1912 | ||
| 26 June, 1913 | 16 Dec., 1913 | ||
| 25 June, 1914 | 6 Nov., 1914 | ||
| Nineteenth | 24 June, 1915 | 15 Oct., 1915 | 27 Nov., 1919. |
| 9 May, 1916 | 9 Aug., 1916 | ||
| 28 June, 1917 | 2 Nov., 1917 | ||
| 9 April, 1918 | 17 April, 1918 | ||
| 24 Oct., 1918 | 12 Dec., 1918 | ||
| 28 Aug., 1919 | 7 Nov., 1919 | ||
| Twentieth | 24 June, 1920 | 12 Nov., 1920 | 15 Nov., 1922. |
| 10 Mar., 1921 | 24 Mar., 1921 | ||
| 22 Sept., 1921 | 13 Feb., 1922 | ||
| 28 June, 1922 | 1 Nov., 1922 | ||
| Twenty-first | 8 Feb., 1923 | 19 Feb., 1923 | 14 Oct., 1925. |
| 14 June, 1923 | 30 Aug., 1923 | ||
| 26 June, 1924 | 7 Nov., 1924 | ||
| 25 June, 1925 | 3 Oct., 1925 | ||
| Twenty-second | 16 June, 1926 | 14 Sept., 1926 | .. |
| ROLL OF MEMBERS OF THE LEGISLATIVE COUNCIL OF NEW ZEALAND, SEPTEMBER, 1926.Speaker—Hon. Sir W. C. F. CARNCROSS, Kt.Chairman of Committees—Hon. John Barr.Clerk of the Legislative Council—A. F. LOWE, C.M.G. | ||
|---|---|---|
| Name. | Provincial District. | Date of Appointment. |
| Alison, Hon. Ewen William | Auckland | 7 May, 1925. |
| Barr, Hon. John | Canterbury | 22 January, 1921. |
| Bell, Right Hon. Sir Francis Henry Dillon, P.C., G.C.M.G., K.C. | Wellington | 21 May, 1926. |
| Carncross, Hon. Sir Walter Charles Frederick, Kt. | Taranaki | 17 March, 1924. |
| Carrington, Hon. Carey John | Auckland | 17 June, 1926. |
| Carroll, Hon. Sir James, K.C.M.G. | Auckland | 2 September, 1921. |
| Clark, Hon. Edward Henry | Otago | 25 June, 1920. |
| Cohen, Hon. Mark | Otago | 25 June, 1920. |
| Collins, Hon. Colonel William Edward, C.M.G. | Wellington | 14 July, 1921. |
| Craigie, Hon. James | Canterbury | 1 June, 1923. |
| Earnshaw, Hon. William | Wellington | 25 June, 1920. |
| Fleming, Hon. David Thomas | Otago | 7 May, 1925. |
| Garland, Hon. George Joseph | Auckland | 7 May, 1925. |
| Gow, Hon. James Burman | Auckland | 7 May, 1925. |
| Guthrie, Hon. David Henry | Wellington | 28 October, 1925. |
| Hall-Jones, Hon. Sir William, K.C.M.G. | Wellington | 15 October, 1920. |
| Hanan, Hon. Josiah Alfred | Otago | 17 June, 1926. |
| Hawke, Hon. Archibald Fotheringham | Otago | 7 May, 1925. |
| Isitt, Hon. Leonard Monk | Canterbury | 28 October, 1925. |
| Lang, Hon. Sir Frederic William, Kt. | Auckland | 22 February, 1924. |
| MacGregor, Hon. John | Otago | 14 July, 1921. |
| McIntyre, Hon. William Henderson | Nelson | 2 September, 1921. |
| Mackenzie, Hon. Sir Thomas, G.C.M.G. | Otago | 12 March, 1921. |
| Malcolm, Hon. Alexander Scott | Otago | 16 June, 1924. |
| Mander, Hon. Francis | Auckland | 1 June, 1923. |
| Michel, Hon. Henry Leslie | Westland | 7 May, 1925. |
| Mitchelson, Hon. Sir Edwin, K.C.M.G. | Auckland | 25 June, 1920. |
| Moore, Hon. Richard | Canterbury | 14 July, 1921. |
| Newman, Hon. Edward, C.M.G. | Wellington | 1 June, 1923. |
| Reed, Hon. Vernon Herbert | Auckland | 16 June, 1924. |
| Rhodes, Hon. Sir Robert Heaton. K.B.E. | Canterbury | 28 October, 1925. |
| Rikihana, Hon, Wiremu | Auckland | 1 June, 1923. |
| Scott, Hon. Robert | Otago | 25 June, 1920. |
| Sinclair, Hon. Sir John Robert, Kt. | Otago | 7 May, 1925. |
| Smith, Hon. Colonel George John, C.B.E. | Canterbury | 25 June, 1920. |
| Snodgrass, Hon. William Wallace, M.B.E. | Nelson | 2 September, 1921, |
| Stewart, Hon William | Auckland | 7 May, 1925. |
| Stout, Right Hon. Sir Robert, P.C., K.C.M.G. | Wellington | 3 August, 1926. |
| Thomson, Hon. George Malcolm | Otago | 7 May, 1925. |
| Triggs, Hon. William Henry | Canterbury | 7 May, 1925. |
| Weston, Hon. Thomas Shailer | Wellington | 17 June, 1926. |
| Witty, Hon. George | Canterbury | 28 October, 1925. |
| ROLL OF MEMBERS OF THE HOUSE OF REPRESENTATIVES, SEPTEMBER, 1926.Speaker—Hon. Sir C. E. STATHAM., Kt.Chairman of Committees—F. F. Hockly, M.P.Clerk of the House—E. W. KANE. | |
|---|---|
| Name. | Electoral District. |
| For European Electorates. | |
| Anderson, Hon. George James | Mataura. |
| Armstrong, Hubert Thomas | Christchurch East. |
| Atmore, Harry | Nelson. |
| Bartram, Frederick Notley Bell, Allen | Grey Lynn. Bay of Islands. |
| Bellringer, Charlie Emanuel | Taranaki. |
| Bitchener, John | Waitaki. |
| Bollard, Hon. Richard Francis | Raglan. |
| Buddo, Hon. David | Kaiapoi. |
| Burnett, Thomas David | Temuka. |
| Campbell, Hugh McLean | Hawke's Bay. |
| Coates, Right Hon. Joseph Gordon, P.C., M.C. | Kaipara. |
| Dickie, Harold Galt | Patea. |
| Dickson, James McColl | Chalmers. |
| Dickson, James Samuel | Parnell. |
| Eliott, John Gordon | Oroua. |
| Field, William Hughes | Otaki. |
| Forbes, George William | Hurunui. |
| Forsyth, Thomas | Wellington East. |
| Fraser, Peter | Wellington Central. |
| Girling, William James | Wairau. |
| Glenn, William Spiers | Rangitikei. |
| Hamilton, Adam | Wallace. |
| Hamilton, John Ronald | Awarua. |
| Harris, Alexander | Waitemata. |
| Hawken, Hon, Oswald James | Egmont. |
| Hockly, Frank Franklin | Rotorua. |
| Holland, Henry | Christchurch North. |
| Holland, Henry Edmund | Buller. |
| Horn, James | Wakatipu. |
| Howard, Edwin John | Christchurch South. |
| Hudson, Richard Phineas | Motueka. |
| Hunter, Sir George, Kt. | Waipawa. |
| Jones, David | Ellesmere. |
| Jones, William | Marsden. |
| Jordan, William Joseph | Manukau. |
| Kyle, Herbert Seton Stewart | Riccarton. |
| Lee, Ernest Page | Oamaru. |
| Lee, John Alexander | Auckland East. |
| Linklater, Joseph | Manawatu. |
| Luke, Sir John Pearce, Kt., C.M.G. | Wellington North. |
| Lysnar, William Douglas | Gisborne. |
| McCombs, James | Lyttelton. |
| McKeen, Robert | Wellington South. |
| McLennan, Ewen Donald | Franklin. |
| McLeod, Hon. Alexander Donald | Wairarapa. |
| Macmillan, Charles Edward de la Barca | Tauranga. |
| Mason, Henry Greathead Rex | Eden. |
| Mason, John | Napier. |
| Nash, James Alfred | Palmerston. |
| Nosworthy, Hon. William | Ashburton. |
| Parry, William Edward | Auckland Central. |
| Potter, Vivian Harold | Roskill. |
| Hansom, Ethelbert Alfred | Hahiatua. |
| Reid, Daniel Stewart | Waikato. |
| Rhodes, Thomas William | Thames. |
| Rolleston, Hon. Francis Joseph | Timaru. |
| Rolleston, John Christopher | Waitomo. |
| Samuel, Albert Moeller | Ohinemuri. |
| Savage, Michael Joseph | Auckland West. |
| Seddon, Thomas Edward Youd | Westland. |
| Sidey, Thomas Kay | Dunedin South. |
| Smith, Robert William | Waimarino. |
| Statham, Hon. Sir Charles Ernest, Kt. | Dunedin Central. |
| Stewart, Hon. William Downie | Dunedin West. |
| Sullivan, Daniel Giles | Avon. |
| Sykes, George Robert | Masterton. |
| Tapley, Harold Livingstone, C.M.G. | Dunedin North. |
| Veitch, William Andrew | Wanganui. |
| Waite, Fred | Clutha. |
| Walter, Edward | Stratford. |
| Ward, Right Hon. Sir Joseph George, Bart., P.C., K.C.M.G. | Invercargill. |
| Wilford, Thomas Mason | Hutt. |
| Williams, Hon. Keneth Stuart | Bay of Plenty. |
| Wright, Hon. Robert Alexander | Wellington Suburbs. |
| Young, Hon. James Alexander | Hamilton. |
| For Maori Electorates. | |
| Tau Henare | Northern Maori |
| Ngata, Hon. Apirana Turupa | Eastern Maori. |
| Pomare, Hon. Sir Maui Ngatata, K.B.E., C.M.G. | Western Maori. |
| Uru, Henare Whakatau. | Southern Maori. |
| LIST OF PRINCIPAL DEPARTMENTS OF THE NEW ZEALAND GOVERNMENT, WITH TITLES AND NAMES OF PERMANENT HEADS. | ||
|---|---|---|
| Department. | Permanent Head. | |
| Title. | Name. | |
| Agriculture | Director-General | C. J. Reakes, C.B.E., M.R.C.V.S., D.V.Sc. Melb. |
| Audit | Controller and Auditor-General | G. F. C. Campbell, C.M.G. |
| Crown Law | Solicitor-General | A. Fair, LL.B., K.C. |
| Customs | Comptroller | G. Craig, LL.M. |
| Defence | General Officer Commanding N.Z. Military Forces | Major - General R. Young, C.B., C.M.G., D.S.O. |
| Education | Director | J. Caughley, M.A. |
| External Affairs and Cook Islands | Secretary | J. D. Gray. |
| Government Insurance | Commissioner | A. T. Traversi, F.I.A., Lond. |
| National Provident Fund | Superintendent | |
| Friendly Societies | Registrar | W. M. Wright. |
| Public Service Superannuation | Secretary | |
| Health | Director-General | T. H. A. Valintine, C.B.E., M.R.C.S.,L.R.C.P.,D.P.H. |
| Industries and Commerce | Secretary | J. W. Collins. |
| Immigration | Under-Secretary | H. D. Thomson. |
| Internal Affairs | Under-Secretary and Chief Electoral Officer | J. Hislop, M.V.O., O.B.E. |
| Registrar-General's | Registrar-General | W. W. Cook |
| Census and Statistics | Government Statistician | M. Fraser, O.B.E. |
| Government Actuary's | Government Actuary | C Gostelow, F.I.A., Lond. |
| Justice (including Patents) | Under-Secretary | R. P. Ward. |
| Labour | Secretary | F. W. T. Rowley. |
| Land and Deeds and Stamp Duties | Registrar-General of Land, Secretary for Land and Deeds, and Commissioner of Stamp Duties | C. E. Nalder. |
| Land and Income Tax | Commissioner | A. E. Fowler. |
| Land for Settlements | Land Purchase Controller | J. D. Ritchie. |
| Lands and Survey | Under-Secretary | J. B. Thompson, M.N.Z. Soc.C.E. |
| Marine | Secretary | G. C. Godfrey. |
| Mental Hospitals | Inspector-General | Dr. Sir F. Truby King, Kt., C.M.G. |
| Mines | Under-Secretary | A. H. Kimbell. |
| Native | Under-Secretary | R. N. Jones. |
| Native Trust | Native Trustee | W. E. Rawson. |
| Naval | Naval Adviser | Commodore G. T. C. P. Swabey, D.S.O., R.N. |
| Pensions | Commissioner | G. C. Fache, O.B.E. |
| Police | Commissioner | W. B. McIlveney. |
| Post and Telegraph | Secretary | A. T. Markman. |
| Prime Minister's | Permanent Head | F. D. Thomson, B.A., C.M.G. |
| Printing and Stationery | Government Printer | W. A. G. Skinner. |
| Prisons | Controller-General of Prisons | (Vacant.) |
| Public Trust | Public Trustee | J. W. Macdonald. |
| Public Works | Under-Secretary and Engineer-in-Chief | F. W. Furkert, C.M.G., A.M.I.C.E., A.M.I.M.E. |
| Railways | Chairman of Railways Board | F. J. Jones. |
| Scientific and Industrial Research | Secretary | E. Marsden, D.Sc. |
| State Advances | Superintendent | W. Waddel. |
| State Fire and Accident Insurance | General Manager | J. H. Jerram. |
| State Forest Service | Director | L. McIntosh Ellis, B.Sc. (F.), C.S.F.E. |
| Tourist and Health Resorts | General Manager | B.M.Wilson. |
| Treasury | Secretary | R. E. Hayes, I.S.O. |
| Valuation | Valuer-General | T. Brook. |
By an Act passed during the year 1912 and intituled the Public Service Act, 1912, the Public Service of New Zealand was placed under the direct and sole control of a Commissioner and two Assistant Commissioners, who are appointed for a term of seven years, are responsible only to Parliament, and can be dismissed from office only for misbehaviour or incompetence.
The Act, which became operative on the 1st April, 1913, applies to all members of the Public Service with the exception of the Controller and Auditor-General, officers of the Railway Department, members of the Police and Defence Forces, Judges and Magistrates, officers of the House, certain officers of the Legislative Departments, and persona paid only by fees or commission, as well as any officer to whom the Governor-General in Council declares the Act shall not apply.
By the Post and Telegraph Act of 1918 the Post and Telegraph Department was exempted from the control of the Commissioner, with the exception that the Commissioner makes all appointments.
Public Service Commissioner: P. D. N. VERSCHAFFRLT.
High Commissioner for New Zealand in London—Hon. Sir Christopher James Parr, K.C.M.G., New Zealand Offices, 415 Strand, London W.C. 2.
Official Representative of Customs Department in United Kingdom—F. W. Lawrence, New Zealand Offices, 415 Strand, London W.C. 2.
New Zealand Trade Commissioner for Australia and Government Agent, Melbourne—H. J. Manson, Dominion Chambers, 59 William Street, Melbourne.
New Zealand Government Agent, Sydney—W. R. Blow, London Bank Chambers, corner of Pitt and Moore Streets, Sydney.
Honorary New Zealand Tourist Agent, Brisbane—T. G. Dewar, King's Building, 79 Queen Street, Brisbane.
Honorary New Zealand Tourist Agent, Adelaide—D. T. Lawes, Pirie Street, Adelaide.
Honorary New Zealand Tourist Agent, Perth—A. S. McClintock, 285 Queen's Buildings, Murray Street, Perth.
Honorary New Zealand Representative in India—R. L. B. Gall, 11 Clive Street, Calcutta.
Honorary New Zealand Representative. Johannesburg—B. R. Avery, 8 Natal Bank Chambers, Market Street, Market Square (P.O. Box 1378), Johannesburg.
Honorary New Zealand Tourist Agent, Durban — H. Middlebrook, 20 Union Castle Buildings (P.O. Box 1822), Durban.
New Zealand Government Agent, Vancouver—W. A. James, 1,017 Metropolitan Building, 837 Hastings Street West, Vancouver.
Resident Agent for New Zealand, San Francisco—H. Stephenson Smith, 311 California Street, San Francisco.
Official Representative of Customs Department in Canada and United States—W. J. Stevenson, 44 Whitehall Street, New York.
Honorary New Zealand Government Agent, Honolulu—H. C. Tennant, care of Messrs. Henry Davies Audit Company (Limited), Honolulu.
Honorary New Zealand Representative, Marseilles—The Secretary, British Chamber of Commerce, 2 Rue Beauvau, Marseilles.
Honorary Commercial Correspondent for New Zealand, Antwerp—J. P. H. Mertens, 32 Rue Oudaen, Antwerp.
United Kingdom.—H.M. Trade Commissioner: L. B. Beale, 11 Grey Street, Wellington.
Canada.—Trade Commissioner: C. M. Croft, Customs Street, Auckland.
Argentine Republic.—Consul-General: Humberto Bidone, Wellington. Vice-Consuls: F. S. Battley, Auckland; E. S. Baldwin, Wellington; J. A. Johnstone, Dunedin.
Belgium.—Consul-General (with jurisdiction over. New Zealand): H. Segaert, Sydney. Consuls: A. M. Ferguson, Auckland; G. F. Johnston, Wellington; Sir J. J. Kinsey, Christchurch; G. L. Denniston, Dunedin. Vice-Consuls: C. R. J. Ward, Christchurch; W. A. Moore, Dunedin; R. A. Anderson, Invercargill.
Brazil.—Vice-Consul: George Robertson, Wellington.
Chile.—Consul-General for Australia and New Zealand: Senor Don Manuel Gundelach, Sydney. Consul: E. A, Craig, Auckland. Hon. Consul: J. Montgomery, Christchurch.
China.—Consuls: Li Kwang Heng, Wellington; Chuh Chih-Ching, Samoa.
Czecho-slovakia.—Consul-General (with jurisdiction over New Zealand): Dr. Rudolph Svetlik, Sydney. Consul: E. J. Hyams, Wellington.
Denmark.—Consul-General for Australia and New Zealand: Ove Lunn, Melbourne. Consul for North Island: S. A. Longuet, Wellington. Consul for South Island: H. D. Acland (acting), Christchurch. Vice-Consuls: S. P. Anderson, Auckland; W. Perry, Hokitika; O. H. MÖller, Dunedin; Charles Dahl, Palmerston North.
Finland.—Consul (with jurisdiction over New Zealand): Harald Tanner, Sydney. Vice-Consuls (honorary); Robert Burns, Auckland; Vaino Sarelius, Christchurch.
France.—Consul: Paul A. Serre, Auckland. Consular Agents: George Humphreys, Christchurch; O. R Bendall, Wellington; S. E. D. Neill. Dunedin.
Germany.—Consul-General (with jurisdiction over New Zealand): Dr. Hans Busing, Melbourne. Consul (with jurisdiction over New Zealand and Dependencies, and Western Samoa): W. Penseler, Wellington.
Greece.—Honorary Consul for New Zealand: J. F. Dyer, Wellington.
Honduras.—Consul-General for Australia and New Zealand: Frederic Walsh. Sydney.
Italy.—Consul-General for Australia, New Zealand, Fiji, and New Guinea: Commendatore A. Grossardi, Melbourne. Consular Agents: Joseph Wallace, Christ-church; L. O. H. Tripp, O.B.E., Wellington; J. A. Roberts, Dunedin; Geraldo Perotti, Greymouth; Giovanni (J. H.) Pagni, Auckland.
Japan.—Consul-General (with jurisdiction over New Zealand): Izemasa Tokugawa, Sydney. Honorary Consuls: A. B. Roberton, Auckland; A. Young, Wellington.
Jugo-Slavia (Kingdom of Serbs, Croats, and Slovenes).—Consul: (Vacant).
Latvia.—Consul-General (with jurisdiction over New Zealand): Edward Birin, London.
Liberia.—Consul: Dr. A. W. Izard, Wellington.
Mexico.—Consul: (Vacant).
Netherlands. — Consul - General for Australia and New Zealand: P. E. Teppema, Sydney. Consul (with jurisdiction over New Zealand): W. G. Johnston, Wellington. Vice-Consuls: George Ritchie, Dunedin; M. Copeland, Auckland; C. J. Cooper, Christchurch.
Norway.—Consul-General for Australia and New Zealand: E. K. B. Arentz, Melbourne. Consul: A. W. Newton, Wellington. Vice-Consuls: Robert Millar, Auckland; George Jameson, Christchurch; M. E. Wiig, Invercargill; J. H. Enright, Westport; W. F. Edmond, Dunedin (honorary).
Paraguay.—Consul: A. E. Kernot, Auckland.
Peru.—Consul-General for Australia and New Zealand: J. M. Paxton, Sydney. Consul: G. H. Baker, Auckland.
Poland.—Consul-General (with jurisdiction over New Zealand): Hon. George Earp, Sydney.
Portugal.—Consul: David L. Nathan, Auckland. Hon. Vice-Consul: Alfred Nathan, Auckland. Vice-Consuls: A. D. S. Duncan, Wellington; C. W. Rattray, Dunedin.
Spain.—Consul-in-Chief (with jurisdiction over Australia and New Zealand): Sen Don Gustavo do Sastoa, Melbourne. Hon. Vice-Consul: C. W. D. Bell, Wellington.
Sweden.—Consul-General for Australia, New Zealand, and Fiji: E. H. Lindquist, Sydney. Consul: J. T. Martin, Wellington. Vice-Consuls: C. I. Nathan, Auckland; W. Machin, Christchurch; J. S. Ross, Dunedin.
Switzerland.—Consul (with jurisdiction over New Zealand): M. Stahel, Melbourne.
United States of America.—Consul-General: W. L. Lowrie, Wellington. Consul: W. F. Boyle, Auckland. Vice-Consuls: M. I. Mays, Wellington: J. C. Hudson, Wellington; A. R. Preston, jun., Auckland. Consular Agents: H. P. Bridge, Christchurch; H. Reeves, Dunedin. Consul at large: Robert Frazer, jun.
Uruguay.—Vice-Consul (Acting-Consul): W. J. Prouse, Wellington
Table of Contents
NEW Zealand was proclaimed a British Crown colony in 1840. Official statistical records of the country commenced with the following year, 1841, in the shape of reports compiled for the information of the Colonial Office, and known by immemorial custom as “blue-books.” These reports, which continued until 1852, were prepared in manuscript form in triplicate, and several copies repose to this day in the custody of the Registrar-General, their careful penmanship still legible despite the faded ink. A collection of tables, compiled by various Government authorities and illustrating the work of their Departments, composed the annual blue-book.
Two factors retarded the development of the statistics of the blue-books: in the first place, they were not intended for general publication; secondly, there appeared a lack of co-ordination between the Departments furnishing the returns and the office collating and ultimately issuing them.
It was not long, however, before the need of authoritative statistics was felt, both for present use and also as a record of the development of the country and its various provinces and settlements. Accordingly we find that, in 1849, “Statistics of New Munster,” compiled under the superintendence of Alfred Domett, were printed by order of the Legislative Council. Again, “Statistics of Nelson” covering the period 1843–54 were issued in 1855. Various other publications were issued dealing with some individual province or settlement. In the year 1853 a Constitution granted by the Imperial Parliament came into force, and from this date the fragmentary and inchoate statistical works find a new complexion. Five years later the Registrar-General, who had been entrusted with the task of compiling annually statistics of the whole colony, produced a volume dealing with the years 1853, 1854, 1855, 1856.
One of the many ways in which statistics may be classified is as to source from which obtained, and in this respect they naturally divide into two classes—i.e., as to whether they are compiled from the records (obtained primarily for some other purpose) of a Government Department or other similar authority, or whether the data require to be specially collected from individual persons, &c.
As has been indicated above, the statistics included in the early blue-books belong in the main to the first of these two categories. Certain items, however, notably population figures, would be more correctly placed in the second category, though the system of collection was exceedingly crude and the scope of inquiry very limited. As a matter of fact, the population figures prior to 1851 appear to have been compiled in each settlement by the local Resident Magistrate by the simple method of ascertaining from the head of each house the number of persons in the household. From such small beginnings, however, has grown the Dominion's present comprehensive system of collection of statistical data.
The proper collection of statistics from the public on the voluntary basis which appeared to exist in the “forties” could be maintained only with a very small population, and with the simplest of inquiries. With the increase of population and the desire to obtain fuller information than in the past it was found advisable as early as 1851 to pass an Ordinance providing for the collection of statistics in the form of recurrent censuses.
Following on the passing of the Census Ordinance of 1851 by the General Government several of the provinces into which New Zealand was divided passed Census Ordinances of their own, the necessity for which is not apparent, as other provinces took censuses under the authority of the 1851 Ordinance.
This Ordinance gave way in 1858 to the Census Act of that year, which was amended in 1860, 1867, 1873, and 1876, and was in its turn repealed in 1877, when a new Act was passed, consolidating and extending the law relating to census-taking. The Act of 1877 was amended in 1880 and again in 1890; also, in effect, in 1895, when the Agricultural and Pastoral Statistics Act was passed, making provision for the annual collection of agricultural and pastoral statistics, which had formerly been collected quinquennially under the Census Act. In 1908 the Census Act and amendments and the Agricultural and Pastoral Statistics Act were consolidated in the Statistics Act, 1908, as part of the general consolidation of statutes. The Statistics Act, 1908, was replaced two years later by the Census and Statistics Act, 1910, which was amended in 1915 by the Census and Statistics Amendment Act of that year. The Act of 1910 was superseded by the Census and Statistics Act, 1926, which contains the present law on the subject of statistical inquiry.
It would be out of place here to recapitulate the various alterations and extensions involved in the successive enactments referred to. Suffice it to say that they reflect the growth of the world-wide realization of the importance and value of statistics.
The Census and Statistics Act, 1926, provides not only for the taking of the quinquennial population census, but also for the collection of statistical information under numerous specific heads, and contains a general authority to the Governor-General to extend the system of collection to cover any other items in respect of which statistical information may be found necessary or advisable.
The early “blue-books” appear to have been compiled by the Colonial Secretary. After the granting of responsible government the Registrar-General was entrusted with the collection of statistics, a function which he retained until 1910. The Census and Statistics Act, 1910, provided for the appointment of a Government Statistician, who has since been the authority charged with the administration of the Act. The 1910 Act laid down that the Government Statistician was to be an officer of the Registrar-General's Department, but this proviso was cancelled in 1915 by the amending Act of that year, whereupon the Census and Statistics Office came into existence as a separate branch of the Department of Internal Affairs.
Until quite recent years there was very little statistical collection apart from the quinquennial census, the annual collection (on legislative authority) of the agricultural and pastoral statistics, the collection on a voluntary basis of returns of private schools, savings-banks, &c., and the obtaining of statistical information from other Government Departments. It should be noted, however, that the census was formerly the means used for the collection of certain data (as, for instance, concerning factory production), now obtained independently of the census.
Since the passing of the Census and Statistics Act in 1910, and more especially since the formation of the Census and Statistics Office in 1915, the system of statistical collection has expanded considerably, not only in regard to the regular activities of the Office, but also for the obtaining of data required for some special purpose. During the war and post-war periods, for instance, the provisions of the Census and Statistics Act were utilized for the collection of information as to stocks, consumption, requirements, &c., of numerous commodities, including flour, wheat, oats, coal, oils, wire, iron, steel, copper, twine, turnip-seed, and medical requisites.
Branches of statistical inquiries now regularly pursued by the Census and Statistical Office include the following:—
From private sources: Agricultural and pastoral statistics (main collection); areas sown in wheat and oats; threshings of wheat and oats;. stocks of wheat, flour, and oats; sheep returns; detailed statistics of live-stock; stocks of wool; detailed statistics of commercial orchards; eggs and egg-pulp in cool store; factory production; fire insurance; life insurance; accident insurance; finances of local governing bodies; loans of local governing bodies (quarterly); building permits; building operations; forestation and plantation operations; building societies; port cargo statistics; private savings-banks; prices; wages; unemployment; sports bodies; consumption and stocks of coal; hospital patients; benevolent institutions.
From Government Departments in the form of individual cards, &c.: Births; marriages; deaths; orphanhood; migration; naturalization; inquests; civil and criminal cases in Court; prisons; divorce: bankruptcy; port shipping returns; deceased persons' estates; State advances to local bodies; incomes and income-tax; land-tax; industrial disturbances; industrial accidents.
The above refers only to statistical compilation from the original data. In many other branches of statistics, as, for instance, trade and public finance, detailed figures compiled by the Departments concerned are utilized in the Census and Statistics Office for the further compilation of statistics.
When New Zealand ceased to be a Crown colony in 1853 the annual despatch of the blue-books to the Colonial Office in London was discontinued. During the next few years several volumes of statistical tables appeared, compiled by various Provincial Governments, and in 1858 the Registrar-General published a volume for the colony as a whole, covering the years 1853, 1854, 1855, and 1856. This volume was the first of a regular annual series which, developed and expanded, were issued, formerly by the Registrar-General's Department, and from 1915 to 1920 by the Census and Statistics Office. As indicating the expansion of the country and of its statistical organization it may be mentioned that while the statistics of the four years 1853–56 were contained in a single small volume, the statistics for 1920, the last year of publication in the old form, occupied four volumes aggregating nearly 1,200 pages.
Closely allied to the annual volumes of Statistics were the volumes of Census Statistics which were regularly compiled and published after each census of New Zealand from 1858 to 1916, for the first four occasions as part of the Statistics, but later (commencing with 1871) as separate publications.
With each volume of Statistics, commencing with that for 1853–56, went a brief report on the statistics presented. Developing slowly at first, the ultimate result was a fairly comprehensive report on the statistics—not only those presented, but the whole statistics (so far as compiled) of the colony. A similar report on census matters was included in each volume of Census Statistics.
Parallel with the statistical reports came, in 1875, an issue of another type—“The Official Handbook of New Zealand, a Collection of Papers by Experienced Colonists on the Colony as a Whole, and on the Several Provinces,” edited by Julius Vogel, C.M.G. (afterwards Sir Julius Vogel, K.C.M.G.), at that time Premier of the colony. The purpose of this book differed from that of the statistical reports. Its aim was to give “a New Zealand view of New Zealand to those who may think of making the colony their home or the theatre of business operations.” Its well-written articles, generously illustrated with woodcuts and photographs, make this early volume interesting reading. Printed in London, it was circulated largely in England.
In 1884 a new and revised edition of this Handbook was compiled by Mr. William Gisborne, and edited by the Agent-General of the day (Mr. F. D. Bell, afterwards Sir Francis Bell). The purpose of this edition was similar to that of its predecessor, although in form it approximated more closely to the modern type.
Another example of a handbook composed for some special purpose was that of Dr. Hector, issued for the Melbourne International Exhibition of 1880.
By the year 1889 the annual report on the statistics had reached considerable proportions, and it was decided by the Registrar-General to issue it as a separate publication. He remarks in the preface to the 1889 volume of Statistics as follows: “The report has now reached about the size of the original Victorian Year-book, and it has been deemed desirable to publish it in octavo size to make it more convenient for general reference.” A similar decision, it may be added, was come to in regard to the quinquennial Census Report.
For 1889 and 1890 the Report on the Statistics was accordingly issued as a separate publication with several new features. The following year (1891) was a census year, and the place of the usual statistical report for that year was taken by a separate “Report on the Results of a Census of the Colony of New Zealand taken for the Night of the 5th April, 1891,” the first of a series of reports which have been published after each census since.
In 1892 the Report on the Statistics reppeared, remodelled and considerably enlarged, and under the title of the “New Zealand Official Handbook.” The Handbook achieved a very considerable success, and the Government gave instructions for the preparation annually of a similar volume, to be called the “New Zealand Official Year-book.” The compilation remained in the hands of the Registrar-General until 1910, when on the passing of the Census and Statistics Act of that year the Year-book and other statistical publications came under the control of the Government Statistician.
The demy octavo size adopted in 1889, when the Report on the Statistics was first issued as a separate publication, was retained for the Official Handbook, and, up to the 1920 number, for the Year-book. This size, however, was not altogether satisfactory from the point of view of economy of space or for the display of tabular matter, and in the next issue gave way to the royal octavo size.
A change was also made at the same time in the year-number of the book. Formerly the book had been designated by the year of compilation, though in recent years it had not appeared until early in the following year. The book now bears the year of publication.
It has been shown above how the annual volume of Statistics included in each year up to 1888 a prefatory report, which gradually grew in bulk until it was deemed advisable in 1889 to publish it as a separate volume, which shortly afterwards developed into the “New Zealand Official Year-book.” From 1889 to 1920 the Statistics were accordingly issued without any accompanying letterpress.
A new policy adopted in 1921 in regard to the publication of the Annual Statistics involved the reintroduction of the report to accompany the tabular matter. In lieu of presenting the statistics in one comprehensive publication, these now form the tabular matter for nine separate annual reports, each covering a definite branch of statistical inquiry, and including explanatory letterpress in addition to the tables.
A similar policy is being followed in the case of the census results. In addition to the complete report published separately after the completion of the census tabulation, each volume of tables contains also an introductory discussion of the results disclosed.
The full list of the regular statistical publications of the Census and Statistics Office is as follows:—
| PUBLICATIONS OF THE CENSUS AND STATISTICS OFFICE. | |
|---|---|
| Title. | Periodicity of Issue. |
| New Zealand Official Year-book | Annual. |
| Local Authorities Handbook | Annual. |
| Annual Statistical Reports— | |
| Population and Buildings | Annual. |
| Migration | |
| Vital Statistics | |
| Justice | |
| Trade and Shipping | |
| Agricultural and Pastoral Production | |
| Factory Production | |
| Insurance | |
| Miscellaneous (Prices, Wages and Hours of Labour, Labour Department's Employment Bureaux, Factory Accidents, Building Societies, Bankruptcy, Incomes and Income-tax, Land and Land-tax, Meteorology, Statistical Summary) | |
| Monthly Abstract of Statistics | Monthly. |
| Census Statistics— | |
| Vol. I. Population | Quinquennially. |
| Vol. II. Ages | |
| Vol. III. Birthplaces | |
| Vol. IV. Allegiance | |
| Vol. V. Length of Residence | |
| Vol. VI. Race Aliens | |
| Vol. VII. Religions | |
| Vol. VIII. Industries, Occupations, and Unemployment | |
| Vol. IX. Conjugal Condition | |
| Vol. X. Fertility | |
| Vol. XI. Orphanhood | |
| Vol. XII. Dependency | |
| Vol. XIII. Life Insurance | |
| Vol. XIV. Households | |
| Vol. XV. Dwellings | |
| Appendices: (a.) Maori Census | |
| (b.) Census of Cook and other Pacific Islands | |
| (c.) Census of Western Samoa | |
| (d.) Libraries | |
| (e.) Religious Denominations | |
| (f.) Poultry and Bees | |
| General Report on the Census | |
| Published in New Zealand Gazette, and also as extracts:— | |
| Vital Statistics of Urban Areas | Monthly and annual. |
| Estimated Population of New Zealand | Quarterly. |
| Agricultural and Pastoral Statistics— | |
| Estimated Yields of Wheat and Oats | Annual. |
| Estimated Spring Areas under Wheat and Oats | |
| Stocks—Flour, Wheat, and Oats | |
The principal publication of the Census and Statistics Office is the “New Zealand Official Year-book,” which, as its title implies, is the official book of general reference on the various branches of the Dominion's activities and the various aspects of her social and economic characteristics and progress. Necessarily, however, much of the information given in the Year-book is of a condensed character, owing to the wide range of subjects covered. The Local Authorities Handbook, the annual Statistical Reports, and the census publications contain much more detailed information on the particular subjects they deal with, while the Monthly Abstract of Statistics contains the latest statistical information available on a variety of subjects, giving monthly or quarterly figures in most cases.
In addition to the publications of the Census and Statistics Office, many parliamentary reports contain statistical information, often of a detailed nature. The full list cannot be given here, but the principal of these annual reports are mentioned below, arranged in the order of subjects followed in the Year-book:—
| Subject. | Report. | |
|---|---|---|
| Number. | Title. | |
| Public health, hospitals, &c. | H.-31 | Report on Public Health, Hospitals, and Charitable Aid. |
| H.-7 | Report of Inspector-General of Mental Hospitals. | |
| Education | E.-1 | Report of Minister of Education. |
| E.-2 | Report on Primary Education. | |
| E.-3 | Report on Education of Native Children. | |
| E.-4 | Report on Stare Care of Children, Special Schools, and Infant-life Protection. | |
| E.-5 | Report on Technical Education. | |
| E.-6 | Report on Secondary Education. | |
| E.-7 | Report on Higher Education. | |
| Justice | H.-16 | Report of Commissioner of Police. |
| H.-20 | Prisons Report. | |
| H.-20A | Report of Prisons Board. | |
| Defence | H.-19 | Report of General Officer Commanding Defence Forces. |
| H.-5 | Report on New Zealand Naval Forces. | |
| Shipping | H.-15 | Report of Marine and Inspection of Machinery Department. |
| Railways | D.-2 | Railways Statement. |
| D.-1 | Public Works Statement. | |
| Roads | D.-1 | Public Works Statement. |
| Postal and telegraphic | F.-1 | Report of Post and Telegraph Department. |
| Lands | H.-3 | Report of Land Transfer and Deeds Registration Department. |
| Crown lands | C.-1 | Report on Settlement of Crown Lands. |
| C.-5 | Report on Land for Settlements Act. | |
| C.-9 | Report on Discharged Soldiers' Settlement. | |
| Native lands | G.-9 | Report on Native Land Courts, Maori Land Boards, and Native Land Purchase Board. |
| Agricultural and pastoral production | H.-29 | Report of Department of Agriculture. |
| H.-23 | Sheep Returns. | |
| Forestry | C.-3 | Report of State Forest Service. |
| Fisheries | H.-15 | Report of Marine and Inspection of Machinery Department. |
| H.-22 | Report of Internal Affairs Department. | |
| Mining | C.-2 | Mines Statement. |
| C.-2A | Report on State Coal-mines. | |
| Water-power | D.-1 | Public Works Statement. |
| Public finance | B.-1 | Public Accounts. |
| B.-6 | Financial Statement. | |
| D.-1 | Public Works Statement. | |
| State Advances | B.-13 | Report of State Advances Office. |
| Pensions | H.-18 | Report of Pensions Department. |
| Superannuation | H.-26 | Report of Public Service Superannuation Board. |
| E.-9 | Report on Teachers' Superannuation Fund. | |
| D.-5 | Report on Government Railways Superannuation Fund. | |
| National Provident Fund | H.-17 | Report of National Provident Fund Board. |
| Banking | F.-4 | Report on Post Office Savings-bank. |
| Insurance | H.-8 | Report of Government Insurance Commissioner. |
| H.-6 | Report of General Manager of State Fire Insurance Office. | |
| Friendly societies | H.-1 | Report of Registrar of Friendly Societies. |
| Industrial disputes Public Trust Office | H.-11 | Report of Labour Department. |
| B.-9 | Report of the Public Trust Office. | |
| B.-9A | Accounts of the Public Trust Office. | |
| Patents, designs, and trademarks | H.-10 | Report of Registrar of Patents. |
| Inspection of machinery | H.-15 | Report of Marine and Inspection of Machinery Department. |
| Islands attached to New | A.-3 | Report on Cook and other Islands. |
| Zealand | A.-4 | Report on Western Samoa. |
Table of Contents
IN common with almost all countries, the chief instrument in compiling population data in New Zealand is the census, which in this country is taken quinquennially. Preliminary figures for the latest enumeration (1926) are quoted herein, while fuller details of the previous enumeration (1921) will be found in the 1924 number of the Year-book and in the special publications devoted to the census; here it is sufficient to refer to the following aspects. In the first place, the comparative shortness of the interval between census enumerations mitigates the danger of serious intercensal error. Secondly, owing to the high standard of intelligence of the population, and to the political, geographical, and social conditions prevailing in the Dominion, the data compiled as a result of the census are both remarkably free from error and unusually complete.
The basis adopted for the census—and indeed, practically universally throughout population statistics in New Zealand—is that of the population de fait, as opposed to the population de sejour habituel, the population de droit, and other bases adopted in various countries. For the benefit of those not conversant with the terms current in statistical usage, it may be explained that the population de fait is the basis perhaps most common in international use, and comprises simply all persons present at the place of enumeration at the time of enumeration, irrespective of habitual residence, legal domicil, and so forth.
Intercensal figures of total population are based on the customary equation:—
Population = Population (census) + Births and immigration — Deaths and emigration.
Compulsory registration of births and deaths was instituted throughout the Dominion in 1855, and the present system of recording such particulars may be confidently asserted to afford statistics exceptionally complete. A point of minor importance which may be noted is that births and deaths registered during a year are considered as actually occurring during that year.
The fact that all migration to and from the Dominion must be waterborne over lengthy distances, and that it centres in a few ports, facilitates the compilation of accurate statistics of external migration. Records of migration between the North and South Islands are also maintained. Population statistics of lesser internal divisions and of towns are based upon a variety of data collected annually.
Residents of the Cook Islands, Niue, Western Samoa, and the Tokelau Group are not included in the population statistics quoted throughout this section, except in the first table on the next page and in the paragraphs devoted to these islands at the end of the section. A similar course was formerly followed in regard to Maoris, but figures are now given both inclusive and exclusive of Maoris where possible, in accordance with a decision of Cabinet. In tables covering a long period of years, however, and in the part of the section dealing with distribution of population in areas smaller than provincial districts, Maoris have of necessity been omitted, on account of lack or insufficiency of data.
For the 1926 census all half-caste European-Maoris were included with the Native population in lieu of the previous practice of treating such half-castes as were living in European fashion as Europeans. Numbers so treated were as follows: 1921, 4,236; 1916,3,221; 1911,2,879; 1906,2,578; 1901,2,407.
Separate statistics of the Maori population are given towards the end of the section.
The population of the Dominion of New Zealand and its dependencies and the mandated territory of Western Samoa at the census of 1926, is quoted:—
| — | Males. | Females. | Total. |
|---|---|---|---|
| Population (exclusive of Maoris) of New Zealand proper | 686,947 | 657,437 | 1,344,384 |
| Maori population of New Zealand proper | 32,730 | 30,051 | 62,781 |
| Population (inclusive of Maoris) of New Zealand proper | 719,677 | 687,488 | 1,407,165 |
| Population of Cook Islands and Niue | 7,023 | 6,810 | 13,833 |
| Population of Tokelau Islands | 523 | 510 | 1,033 |
| Population of the mandated territory of Western Samoa | 20,985 | 19,246 | 40,231 |
| Totals | 748,208 | 714,054 | 1,462,262 |
The outstanding note of the history of population movement in New Zealand is that of unbroken growth. That it has not been invariably regular is well attested by the accompanying table setting forth the increase at successive census enumerations from 1858 onwards. To carry the investigation farther back were at once unnecessary and unprofitable, for prior to the census of 1858 we have only one New Zealand census, together with divers provincial enumerations of earlier dates, few of the records of which are now available.
| Date of Enumeration. | Population (excluding Maoris). | Numerical increase. | Percentage Increase. | Equivalent Annual Percentage Increase. |
|---|---|---|---|---|
* Based on population excluding half-castes living as Europeans, who are included in population totals in 1921, but not in 1926. | ||||
| December 1858 | 59,413 | |||
| ,, 1861 | 99,021 | 73,137 | 73.86 | 24.97 |
| ,, 1864 | 172,158 | 46,510 | 27.01 | 8.86 |
| ,, 1867 | 218,668 | 37,725 | 17.25 | 5.40 |
| February, 1871 | 256,393 | 43,121 | 16.82 | 5.60 |
| March 1874 | 299,514 | 114,898 | 38.36 | 9.58 |
| ,, 1878 | 414,412 | 75,521 | 18.22 | 5.91 |
| April 1881 | 489,933 | 88,549 | 18.07 | 3.63 |
| March, 1886 | 578,482 | 48,176 | 8.33 | 1.66 |
| April, 1891 | 626,658 | 76,702 | 12.24 | 2.44 |
| ,, 1896 | 703,360 | 69,359 | 9.86 | 1.99 |
| March, 1901 | 772,719 | 115,859 | 14.99 | 2.95 |
| April, 1906 | 888,578 | 119,890 | 13.49 | 2.74 |
| ,, 1911 | 1,008,468 | 90,981 | 9.02 | 1.63 |
| October, 1916 | 1,099,449 | 119.464 | 10.87 | 2.42 |
| April, 1921 | 1,218,913 | 129,707* | 10.68 | 2.13 |
| ,, 1926 | 1,344,384 | |||
As might be expected, the rate of increase in the earlier years was exceedingly high compared with the experience of later years, for a young country, endowed with fertile soil and moderate climate, and in the opening stages of development, presented glowing attractions sufficient to overcome the less alluring considerations of pioneering in a distant country more or less occupied by a race of warlike Natives.
In the “sixties” the gold rushes brought large numbers of people to New Zealand, many of whom stayed to become permanent citizens. This source of increase, however, was eclipsed during the vigorous immigration policy of the “seventies,” when in one year alone (1874) 32,118 assisted immigrants were brought into the country.
The rate of increase gradually subsided as the country became settled and the land available for settlement became less. At the present time the annual increment of population is less than 2 ½ per cent. The respective annual increases during the five years ended March, 1922, to 1926, inclusive, may be stated as 30,476 (2.50 per cent.), 23,543 (1.89 per cent.), 22,162 (1.74 per cent.), 31,134 (241 per cent.), and 29,255 (2.21 per cent.).
Subjoined is a diagram which illustrates the population movement of the past and permits a speculative glimpse at the future. The arithmetic average of the percentage increases of population, as ascertained by census enumerations during four decades (1881–1921), has been approximately 12.11 per cent. per quinquennium. Plotting this constant - ratio as a logarithmic “curve,” and producing it both forward and backward in point of time, it is contrasted with the logarithmic “curve” expressing the actual populations. The two “curves” coincide greatly of recent years, thus indicating the steadying of the rate of growth and giving some confidence to the projection of the constant ratio as supplying an approximation of the probable population in the future.
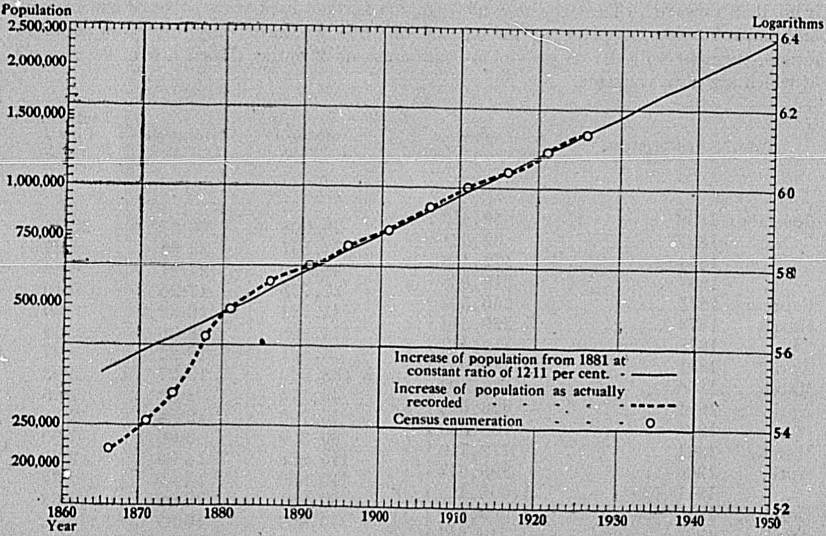
The final criterion of the Dominion's growth in respect of population is supplied by a comparison of the rates of increase of other portions of the British Empire and of various foreign countries. In the table appended are shown the intercensal ratios of increase for such countries. In all cases the movements shown are those for the intercensal periods approximating as closely as possible to the decades chosen. Contrasted with the European countries shown, the Dominion is experiencing a rapid growth, for they are “emigration” countries, while New Zealand is an “immigration” country. Contrasted on the other hand with Canada and Australia, the comparison is not altogether favourable to New Zealand, although the former countries are much older in point of settlement. Canada is, of course, comparatively close to the sources of immigrant population, while both Canada and Australia still have vast areas undeveloped.
| Country. | Population (latest Census). | Intercensal Increase per Cent. in Decennial Periods approximating to | ||||||
|---|---|---|---|---|---|---|---|---|
| Numbers. | Year. | 1910–1920. | 1900–1910. | 1890–1900. | 1880–1890. | 1870–1880. | 1860–1870. | |
* Excluding Maoris. † Decrease. | ||||||||
| New. Zealand* | 1,344,384 | 1926 | 20.87 | 30.51 | 23.31 | 25.87 | 91.09 | 158.93 |
| Great Britain | 42,767,530 | 1921 | 4.74 | 10.36 | 12.03 | 11.17 | 13.95 | 12.73 |
| Australia | 5,436,794 | 1921 | 22.04 | 18.08 | 18.88 | 41.07 | 32.30 | 45.61 |
| Canada | 8,788,341 | 1921 | 21.95 | 34.17 | 11.13 | 11.76 | 17.23 | 19.37 |
| Cape of Good Hope | 2,782,719 | 1921 | 8.49 | 6.44 | 57.79 | 111.82 | 45.25 | |
| Norway | 2,649,775 | 1920 | 12.38 | 6.14 | 11.02 | .. | .. | 6.22 |
| Sweden | 5,904,489 | 1920 | 6.92 | 7.51 | 7.35 | 4.78 | 9.53 | 8.00 |
| Netherlands | 6,865,314 | 1920 | 17.19 | 14.77 | 13.14 | 12.43 | 12.10 | 7.87 |
| France | 39,209,518 | 1921 | 0.03 | 1.93 | 0.83 | 1.95 | 3.61 | †-3.43 |
| Germany | 59,858,284 | 1919 | †7.81 | 15.01 | 14.04 | 9.28 | 10.17 | .. |
| Italy | 38,835,941 | 1921 | 12.01 | 6.45 | .. | .. | 6.19 | 7.20 |
| United States of America | 105,710,620 | 1920 | 14.94 | 21.02 | 20.73 | 25.50 | 30.08 | 22.63 |
Up to the “seventies” New Zealand was dependent on migration for the greater portion of her increase of population, but since then natural increase—i.e., excess of births over deaths—has been the principal factor. For a few years, indeed (1888–91), there was actually an excess of departures over arrivals.
During the fifty years that have elapsed since 1875 natural increase has accounted for 72 per cent. of the total increase of population, as against only 32 per cent. during the fifteen years preceding 1875.
A table is appended showing for each five-yearly period since 1860 the excess of births over deaths and of immigration over emigration.
| Quinquennium. | Excess of Births over Deaths. | Excess of Arrivals over Departures. | Total Increase. | ||||||
|---|---|---|---|---|---|---|---|---|---|
| Males. | Females. | Both, Sexes. | Males. | Females. | Both Sexes. | Males. | Females. | Both Sexes. | |
* Decrease. † Departure and return of troops of Expeditionary Force not included in migration figures. | |||||||||
| 1861–65 | 7,625 | 8,985 | 16,610 | 63,285 | 29,884 | 93,169 | 70,910 | 38,869 | 109,779 |
| 1866–70 | 15,663 | 17,779 | 33,442 | 11,167 | 9,369 | 20,536 | 26,830 | 27,148 | 53,978 |
| 1971–75 | 19,409 | 21,129 | 40,538 | 46,501 | 35,445 | 81,946 | 65,910 | 56,574 | 122,484 |
| 1876–80 | 30,143 | 32,808 | 62,951 | 31,870 | 22,917 | 54,787 | 62,013 | 55,725 | 117,738 |
| 1881–85 | 32,362 | 35,046 | 67,408 | 15,958 | 13,001 | 28,959 | 48,320 | 48,047 | 96,367 |
| 1886–90 | 30,781 | 33,544 | 64,325 | -4,911* | -3,791* | -8,702* | 25,870 | 29,753 | 55,623 |
| 1891–95 | 27,255 | 30,630 | 57,885 | 9,917 | 5,403 | 19,320 | 37,172 | 36,033 | 73,205 |
| 1896–1900 | 28,097 | 31,437 | 59,534 | 7,320 | 3,318 | 10,638 | 35,417 | 34,755 | 70,172 |
| 1901–05 | 32,515 | 36,223 | 68,738 | 31,223 | 14,223 | 45,446 | 63,738 | 50,446 | 114,184 |
| 1906–10 | 38,681 | 43,067 | 81,748 | 25,454 | 15,512 | 40,966 | 64,135 | 58,579 | 122,714 |
| 1911–15† | 42,323 | 46,682 | 89,005 | 17,656 | 17,905 | 39,561 | 59,979 | 64,587 | 124,566 |
| 1916–20† | 35,248 | 41,359 | 76,607 | 6,979 | 7,875 | 14,854 | 42,227 | 49,234 | 91,461 |
| 1921–25 | 41,876 | 44,868 | 86,744 | 26,732 | 23,256 | 49,988 | 68,608 | 68,124 | 136,732 |
| Totals, 1861–1925 | 381,978 | 423,557 | 805,535 | 289,151 | 194,317 | 488,468 | 671,129 | 617,874 | 1,289,003 |
The diagram which follows shows much more clearly the irregularity of the migration increase and the steadiness of the natural increase, the latter, however, broken by a sharp fall on account of the low birth-rate of the late war years and the influenza epidemic of 1918. The curves represent five-yearly moving averages.
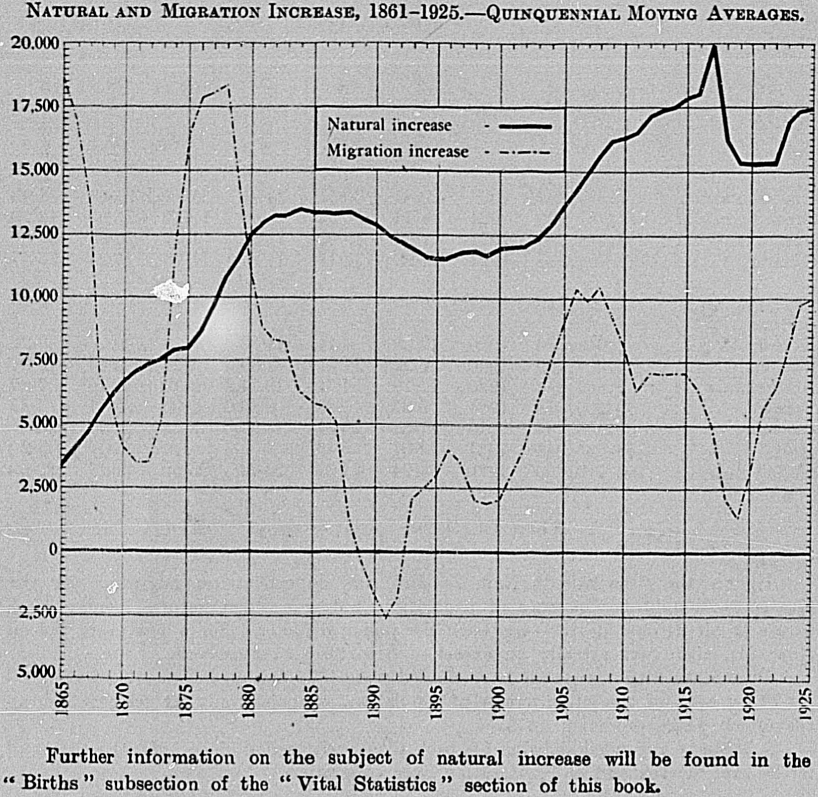
Further information on the subject of natural increase will be found in the “Births” subsection of the “Vital Statistics” section of this book.
In respect of the relative proportions of the sexes in the population, New Zealand has since the first settlement of the Islands differed materially from the older countries of the world. Although in the latter the composition of the populations has been no doubt to some extent affected by migration, yet, in general, natural increase would appear to be the main determining factor, the numbers of males and females being in most of these countries approximately equal, with a more or less marked tendency, however, for the females slightly to exceed the males. The excess of females in such older countries arises from a variety of causes, amongst which the most potent are probably (a) higher rate of mortality amongst males, (b) the fact that males tend to emigrate to a greater extent than females.
Very different is the case with newer countries such as New Zealand, where the rule is (in the early years of colonization especially) for the male population to outnumber the female.
The following table is interesting as showing the early excess of males and the gradual equalization of the sexes in New Zealand, the number of females to 1,000 males having risen from 622 in 1861 to 896 in 1911. The proportion rose to 993 in 1916, mainly on account of the absence of so many men at the war, and fell again in 1921 to 956, only to show a slight rise in 1926 to 957, a figure appreciably higher than in pre-war years. The figures quoted are exclusive of Maoris.
| Census Year. | Males. | Females. | Females to 1,000 Males. |
|---|---|---|---|
| 1861 | 61,062 | 37,959 | 622 |
| 1871 | 150,356 | 106,037 | 705 |
| 1881 | 269,605 | 220,328 | 817 |
| 1891 | 332,877 | 293,781 | 883 |
| 1901 | 405,992 | 366,727 | 903 |
| 1906 | 471,008 | 417,570 | 887 |
| 1911 | 531,910 | 476,558 | 896 |
| 1916 | 551,775 | 547,674 | 993 |
| 1921 | 623,243 | 595,670 | 956 |
| 1926 | 686,947 | 657,437 | 957 |
The preponderance of males in the early years of New Zealand was doubtless due to the fact that the difficulties of pioneering and the remoteness of the country from Europe were such as to deter female immigration to a greater extent than male. This was accentuated by the character of the early industries. Gold-mining and coal-mining, for instance, would attract large numbers of men, but few women. The effect of this early preponderance of males no doubt still exists, but in an ever-diminishing degree, its gradual elimination being effected by the dying-off of the earlier settlers.
Of the two sources from which the Dominion's population has been recruited—viz., migration and natural increase—the effect of the former has hitherto been to give in the aggregate a considerable preponderance of males, and of the latter to give a regular preponderance of females. Between 1860 and 1925 the gain of males by migration totalled 94.800 more than that of females. This excess was only partly offset numerically by a female surplus of 41,500 in the figures of natural increase, but the net excess of approximately 53,300 males is not nearly sufficient to maintain the former high ratio of males to females in the population. It is highly probable that within two or three decades the female population will outnumber the male, unless considerable changes occur in the character of immigration.
As already noted, the intercensal estimates of population prepared from the records of vital statistics and of migration are, by virtue of the favourable position of the Dominion in this respect, remarkably accurate. Indeed, as regards the statistics of total population the term “estimate” is scarcely correct, for the system in use should give, and to a great extent does give, the actual figures. With the exception of the years of the Great War, when the movement of troops was not ascertained exactly, the census totals invariably showed the quarterly returns of population to be highly accurate. There is always a difference in date between the census enumeration and the nearest quarterly statement, for no two of the seventeen general census enumerations in the history of the Dominion have been taken on the same day of the year, and this in itself usually accounts for the greater part of what disparity actually is shown.
The population at the end of each of the last ten years is quoted in the appended table, together with the movement in each year and the mean population for the year:—
| Calendar Year. | Estimated Population (excluding Maoris) at End of Year. | Increase during Year. | Mean Population for Year. | |||
|---|---|---|---|---|---|---|
| Males. | Females. | Total. | Numerical. | Per Cent. | ||
* Decrease. † Census population. | ||||||
| 1916 | 549,895 | 550,668 | 1,100,563 | -2,231* | -0.20* | 1,099,449† |
| 1917 | 537,380 | 560,312 | 1,097,672 | -2,891* | -0.26* | 1,099,117 |
| 1918 | 542,046 | 566,327 | 1,108,373 | 10,701 | 0.97 | 1,103,022 |
| 1919 | 601,888 | 575,517 | 1,177,405 | 69,032 | 6.23 | 1,142,889 |
| 1920 | 617,756 | 590,079 | 1,207,835 | 30,430 | 2.58 | 1,192,620 |
| 1921 | 633,040 | 606,926 | 1,239,966 | 32,131 | 2.66 | 1,223,901 |
| 1922 | 645,524 | 619,873 | 1,265,397 | 25,431 | 2.05 | 1,251,895 |
| 1923 | 657,561 | 631,660 | 1,289,221 | 23,824 | 1.88 | 1,274,551 |
| 1924 | 671,452 | 644,722 | 1,316,174 | 26,953 | 2.09 | 1,298,635 |
| 1925 | 687,287 | 658,789 | 1,346,076 | 29,902 | 2.27 | 1,329,759 |
As the year ended 31st March is for most of the administrative functions of the Government the period most in use, similar figures are given for March years:—
| Year ended 31st March. | Estimated Population (excluding Maoris) at End of Year. | Increase during Year. | Mean Population for Year. | |||
|---|---|---|---|---|---|---|
| Males. | Females. | Total. | Numerical. | Per Cent. | ||
| 1917 | 547,629 | 553,533 | 1,101,162 | 756 | 0.07 | 1,099,449 |
| 1918 | 542,096 | 562,687 | 1,104,783 | 3,621 | 0.33 | 1,102,972 |
| 1919 | 559,887 | 568,743 | 1,128,630 | 23,847 | 2.16 | 1,116,706 |
| 1920 | 607,555 | 579,584 | 1,187,139 | 58,509 | 5.18 | 1,157,884 |
| 1921 | 622,719 | 595,003 | 1,217,722 | 30,583 | 2.58 | 1,202,430 |
| 1922 | 636,956 | 611,242 | 1,248,198 | 30,476 | 2.50 | 1,232,960 |
| 1923 | 648,545 | 623,196 | 1,271,741 | 23,543 | 1.89 | 1,258,017 |
| 1924 | 659,570 | 634,333 | 1,293,903 | 22,162 | 1.74 | 1,280,299 |
| 1925 | 676,477 | 648,560 | 1,325,037 | 31,134 | 2.41 | 1,305,896 |
| 1926 | 691,910 | 662,382 | 1,354,292 | 29,255 | 2.21 | 1,337,155 |
The figures given in the two preceding tables show the population exclusive of Maoris. The following table shows the population inclusive of Maoris at 31st December and at 31st March of the last ten years, with the means for the various twelve-monthly periods:—
| — | Estimated Population (including Maoris) at End of Year. | Mean Population for Year. | ||
|---|---|---|---|---|
| Males. | Females. | Total. | ||
| Years ended 31st December. | ||||
| 1916 | 575,835 | 574,504 | 1,150,339 | 1,149,225 |
| 1917 | 563,300 | 584,148 | 1,147,448 | 1,148,893 |
| 1918 | 567,986 | 590,163 | 1,158,149 | 1,152,798 |
| 1919 | 627,828 | 599,353 | 1,227,181 | 1,192,665 |
| 1920 | 643,696 | 613,915 | 1,257,611 | 1,242,396 |
| 1921 | 660,948 | 631,769 | 1,292,717 | 1,276,652 |
| 1922 | 673,772 | 645,112 | 1,318,884 | 1,305,126 |
| 1923 | 685,951 | 657,070 | 1,343,021 | 1,328,193 |
| 1924 | 700,033 | 670,370 | 1,370,403 | 1,352,618 |
| 1925 | 716,371 | 684,859 | 1,401,230 | 1,384,428 |
| Tears ended 31 st March. | ||||
| 1917 | 573,569 | 577,369 | 1,150,938 | 1,149,225 |
| 1918 | 568,036 | 586,523 | 1,154,559 | 1,152,748 |
| 1919 | 585,827 | 592,579 | 1,178,406 | 1,166,482 |
| 1920 | 633,495 | 603,420 | 1,236,915 | 1,207,660 |
| 1921 | 648,659 | 618,839 | 1,267,498 | 1,252,206 |
| 1922 | 664,979 | 636,272 | 1,301,251 | 1,285,711 |
| 1923 | 676,825 | 648,476 | 1,325,301 | 1,311,381 |
| 1924 | 688,020 | 659,833 | 1,347,853 | 1,334,029 |
| 1925 | 705,161 | 674,326 | 1,379,487 | 1,359,995 |
| 1926 | 721,173 | 688,639 | 1,409,812 | 1,392,058 |
Records of external migration have been kept in New Zealand since 1860. Prior to the 1st April, 1921, the statistics were compiled from returns furnished monthly by Collectors of Customs, but since that date they have been compiled from individual statements obtained from each person entering or leaving the Dominion, and much detailed and important information is consequently now available. The year 1925 is the fourth complete twelve months for which figures under the new system are available, and direct comparisons are therefore possible with the three previous periods.
Including crews of vessels, 90,069 persona from overseas arrived in New Zealand during the year 1925, which, compared with 1924, shows an increase of 442. During the same period 77,267 persons departed. This figure is 2,685 less than the corresponding one for 1924. The gain by migration to the Dominion's population during 1925 was thus 12,802, as compared with 9,675 in 1924.
The numbers of arrivals and departures during the last ten years are given in the table following. The figures for the four years 1916–19 do not include members of the Expeditionary Force, nor have crews of vessels been taken into account.
| ARRIVALS AND DEPARTURES, 1916–25. | ||||||
|---|---|---|---|---|---|---|
| Year. | Arrivals. | Departures. | ||||
| Mules. | Females. | Total. | Males. | Females. | Total. | |
| 1916 | 11,959 | 9,840 | 21,799 | 11,932 | 9,231 | 21,163 |
| 1917 | 9,159 | 6,490 | 15,649 | 7,597 | 6,272 | 13,869 |
| 1918 | 6,356 | 5,550 | 11,906 | 6,097 | 5,563 | 11,660 |
| 1919 | 10,772 | 10,159 | 20,931 | 11,377 | 8,500 | 19,877 |
| 1920 | 23,687 | 20,375 | 44,062 | 17,951 | 14,973 | 32,924 |
| 1921 | 22,446 | 19,436 | 41,882 | 16,019 | 12,540 | 28,559 |
| 1922 | 18,811 | 16,422 | 35,233 | 15,643 | 12,746 | 28,389 |
| 1923 | 19,445 | 17,043 | 36,488 | 16,037 | 13,631 | 29,668 |
| 1924 | 21,719 | 18,096 | 39,815 | 16,489 | 14,104 | 30,593 |
| 1925 | 23,328 | 18,518 | 41,846 | 15,907 | 13,265 | 29,172 |
The monthly figures for 1924 and 1925 are as follows, the excess of arrivals or of departures for each month being also shown:—
| Month. | Arrivals. | Departures. | Excess of Arrivals. | Excess of Departures. | ||||
|---|---|---|---|---|---|---|---|---|
| 1924. | 1925. | 1924. | 1925. | 1924. | 1925. | 1924. | 1925. | |
| January | 3,432 | 4,032 | 2,207 | 2,177 | 1,225 | 1,855 | .. | .. |
| February | 4,145 | 4,334 | 3,273 | 2,850 | 872 | 1,484 | .. | .. |
| March | 2,385 | 3,993 | 3,765 | 3,445 | .. | 548 | 1,330 | .. |
| April | 2,897 | 2,900 | 3,431 | 3,379 | .. | .. | 534 | 479 |
| May | 2,438 | 2,590 | 3,311 | 3,491 | .. | .. | 873 | 901 |
| June | 2,381 | 2,573 | 2,765 | 2,349 | .. | 224 | 384 | .. |
| July | 2,506 | 2,754 | 2,337 | 2,074 | 169 | 680 | .. | .. |
| August | 2,273 | 3,291 | 1,849 | 1,799 | 424 | 1,492 | .. | .. |
| September | 3,347 | 3,046 | 1,929 | 1,728 | 1,418 | 1,313 | .. | .. |
| October | 3,358 | 3,859 | 1,713 | 2,007 | 1,645 | 1,852 | .. | .. |
| November | 4,798 | 4,199 | 1,731 | 1,582 | 3,067 | 2,617 | .. | .. |
| December | 5,855 | 4,275 | 2,282 | 2,291 | 3,573 | 1,984 | .. | .. |
| Totals | 39,815 | 41,846 | 30,593 | 29,172 | 9,222 12,674 | .. | .. | |
The statistics for the twelve months ended 31st December, 1925, show that during that period 41,846 persons, excluding members of crews of vessels, arrived in the Dominion. Of these 15,704 were immigrants intending permanent residence in the country, as compared with 14,314 of a similar class in 1924. The remainder of the arrivals, 26,142 in number, as compared with 25,501 in 1924, were classified as shown below. Corresponding figures for 1924 are also given with percentages in each case.
| — | 1924. | 1925. | ||
|---|---|---|---|---|
| Total (both Sexes). | Per Cent. of Total. | Total (both Sexes). | Per Cent. of Total. | |
* Includes 19 naval ratings. † Includes 156 naval ratings. | ||||
| Immigrants intending permanent residence | 14,314 | 36 | 15,704 | 38 |
| New Zealand residents returning from abroad | 14,076* | 35 | 14,024 | 34 |
| Tourists | 7,425 | 19 | 7,898 | 19 |
| Persons on commercial business | 2,080 | 5 | 2,241 | 5 |
| Persons visiting the Dominion in connection with entertainments, sport, &c. | 1,009 | 3 | 1,193 | 3 |
| Persons in transit | 483 | 1 | 520 | 1 |
| Others (officials, &c., of other countries) | 328† | 1 | 194 | .. |
| Not stated | 100 | .. | 72 | .. |
| 25,501 | 64 | 26,142 | 62 | |
| Grand totals (excluding crews) | 39,813 | 100 | 41,846 | 100 |
The departures recorded during 1925 numbered 29,172, as compared with 30,593 in 1924. Of these, 1,946 were shown to be New Zealand residents departing permanently, as against 2,256 in 1924. The figures which follow show the different classes of emigrants for 1924 and 1925, with percentages in each case:—
| — | 1924. | 1925. | ||
|---|---|---|---|---|
| Total (both Sexes). | Per Cent. of Total. | Total (both Sexes). | Per Cent. of Total. | |
| New Zealand residents departing permanently | 2,256 | 7 | 1,946 | 7 |
| New Zealand residents departing temporarily | 15,006 | 49 | 13,758 | 47 |
| Visitors to the Dominion departing | 13,320 | 44 | 13,462 | 46 |
| Persons regarding whom no information is available | 11 | .. | 6 | .. |
| 28,337 | 93 | 27,226 | 93 | |
| 30,593 | 100 | 29,172 | 100 | |
New Zealand residents going abroad temporarily on business or pleasure represented 47 per cent. of the total departures, as against 49 per cent. in 1924, while of the arrivals 34 per cent. were New-Zealanders returning to their homes after temporary absence, compared with 35 per cent. in 1924. The elimination of this class of migrant reduces the arrivals during 1925 to 27,822, and during 1924 to 25,739, and the departures respectively to 15,414 and 15,587.
Tourists and other temporary visitors comprised 28 per cent. of the arrivals and 46 per cent. of the departures, as compared with 29 and 44 per cent. respectively in 1924. The bulk of the temporary visitors each year came from Australia, the British Isles, and the United States of America. The following table shows for the years 1924 and 1925 the principal countries of residence of temporary visitors, classified according to their purpose in coming to the Dominion:—
| Country of last Permanent Residence. | Purpose in coming to Dominion. | |||||||||
|---|---|---|---|---|---|---|---|---|---|---|
| Tourists. | On Business. | Theatrical, &c. | Official, &c. | In Transit, &c. | ||||||
| 1924, | 1925. | 1924. | 1925. | 1924. | 1925. | 1924. | 1925. | 1924. | 1925. | |
* Includes 156 naval ratings. | ||||||||||
| Australia | 4,972 | 1,805 | 1,342 | 1,443 | 693 | 878 | 57 | 57 | 224 | 198 |
| British Isles | 1,003 | 1,430 | 358 | 400 | 197 | 216 | 271* | 93 | 102 | 102 |
| United States | 389 | 503 | 158 | 166 | 74 | 66 | 4 | 7 | 12 | 57 |
| Fiji | 247 | 322 | 59 | 22 | .. | .. | 18 | 30 | 67 | 45 |
| Canada | 99 | 134 | 25 | 46 | 3 | 2 | 2 | 16 | 7 | 8 |
| South Africa | 90 | 81 | 6 | 14 | 1 | 4 | 3 | .. | 4 | 4 |
| China | 82 | 128 | 10 | 5 | 5 | .. | 2 | 1 | 8 | 37 |
| India | 99 | 77 | 9 | 13 | .. | 1 | .. | 5 | 1 | .. |
| Tonga | 78 | 31 | 14 | 7 | .. | .. | 10 | 14 | 13 | 7 |
| Samoa 72 | 60 | 9 | 10 | .. | 1 | .. | 15 | 13 | 3 | |
| Other countries | 294 | 327 | 90 | 115 | 26 | 26 | 42 | 28 | 32 | 59 |
| Totals | 7,425 | 7,898 | 2,080 | 2,241 | 1,009 | 1,193 | 428 | 266 | 483 | 520 |
Having eliminated the two classes of migrants whose movements only temporarily affect the population of the Dominion, there remains the important residue which represents the permanent additions and losses of population. During the year 1925 15,704 persons landed in the Dominion with the intention of making their future homes here, compared with 14,314 in 1924, while during the same period 1,946 permanent residents of New Zealand were attracted to other countries, as against 2,256 in 1924. These figures are based on statements of intention only, and a certain percentage of immigrants, finding the conditions in the Dominion unsuited to their particular requirements may, after a short stay, depart elsewhere. Such persons on arrival would state their intention of becoming permanent residents, but on departure might not be classified as permanent residents departing permanently. For this reason it is not possible to state what the actual net gain to the permanent population of the Dominion through migration may be. The percentage referred to above, however, is known to be practically negligible, and by comparing the foregoing figures an idea of the permanent gain in population, sufficiently accurate for practical purposes, may be gauged.
In a young country such as New Zealand it would not be surprising to find that the proportion of males to females among the new immigrants was considerably in favour of the former, but the figures for the years 1925 and 1924 show that the male preponderance is not as great as might be expected. As a matter of fact, females comprised 41 and 47 per cent. of the total immigrants in the respective years. No doubt the propaganda work carried out by the New Zealand and Imperial Governments in connection with the scheme for assisting domestic servants and also the wives and families of immigrants from Great Britain to the Dominion is largely responsible for this comparatively high proportion of females. An examination of the figures supports this contention, for whereas during 1925 44 per cent. of immigrants from the British Isles were females, the corresponding percentage for immigrants from all other countries was 33 only.
Of the New-Zealanders who transferred their homes to other countries during the years 1924 and 1925 1,126 and 924 respectively were females and 1,130 and 1,022 males.
Of the total arrivals recorded during the year 1925 13.7 per cent. were under fifteen years of age Among the immigrants intending permanent residence, however, the proportion was much higher—viz., 22.7 per cent. The corresponding percentages for all departures and for New Zealand residents departing permanently were 9.6 and 23.4 respectively. The higher percentages under fifteen years of age in the case of permanent settlers and emigrants is, of course, due to the fact that this class of person brings or takes his family, if any, with him, whereas the remainder of persons coming to and going from the Dominion, consisting for the most part of tourists and persons on business, travel almost exclusively without at least the younger members of their families. The higher percentage of persons of forty-five years and over amongst the departures would appear to confirm to a certain extent the general impression that many immigrants return to their native land later in life. The following table shows the percentage of new permanent immigrants who arrived during 1924 and 1925, and the New Zealand residents who departed during the same period, by age-groups, and also for the same period the permanent gain through migration in the population of the Dominion:—
| — | Under 15 Years. | 15 and under 45 Years. | 45 Years and over, and Age not stated. | |||
|---|---|---|---|---|---|---|
| 1924. | 1925. | 1924. | 1925. | 1924. | 1925. | |
| Per Cent. | Per Cent. | Per Cent. | Per Cent. | Per Cent. | Per Cent. | |
| Immigrants intending permanent residence | 23.73 | 22.67 | 65.04 | 67.13 | 11.23 | 10.20 |
| Permanent departures | 24.83 | 23.36 | 54.56 | 55.85 | 20.61 | 20.79 |
| Permanent gain to population of Dominion | 23.53 | 22.57 | 66.99 | 68.73 | 9.48 | 8.70 |
From the foregoing it will be seen that approximately 90 per cent. of the permanent gain in population through migration consists of persons under forty-five years of age. Under the system in force, children under fifteen years of age accompanying parents or guardians are included in the statement furnished by such parent or guardian. Of the 3,560 children under fifteen years of age 3,368 were so returned. The number of parents or guardians concerned was 1,674, and it is interesting to note that 776 were accompanied by one child, 466 by two children, 221 by three, 121 by four, 52 by five, 20 by six, 15 by seven, 1 by eight, 1 by nine, and 1 by eleven. These figures convey a fairly accurate indication of the sizes of the families which comprise the recent addition to our population, for although, as mentioned above, children accompanying guardians are also included, such cases are not very numerous.
Of the 15,704 new immigrants during 1925 intending to settle in the Dominion the vast majority, 14,729, or 93.8 per cent., came from British countries, mainly from the British Isles, Australia, Canada, South Africa, and India. The majority of immigrants from foreign countries came from Jugo-Slavia, Italy, the United States of America, and China. The following table shows for the years 1924 and 1925 the principal countries whence arrived new immigrants who intended permanent residence in the Dominion: —
| Country whence arrived. | 1924. | 1925. | ||||
|---|---|---|---|---|---|---|
| Males. | Females. | Total. | Males. | Females. | Total. | |
| British Isles | 5,819 | 5,263 | 11,082 | 6,597 | 5,246 | 11,843 |
| India | 80 | 31 | 111 | 89 | 47 | 136 |
| South Africa | 68 | 42 | 110 | 75 | 61 | 136 |
| Canada | 229 | 132 | 361 | 337 | 142 | 479 |
| Australia | 954 | 622 | 1,576 | 1,169 | 712 | 1,881 |
| Other British countries | 82 | 64 | 146 | 150 | 104 | 254 |
| Italy | 38 | 12 | 50 | 216 | 11 | 227 |
| Switzerland | 21 | 13 | 34 | 4 | 2 | 6 |
| Jugo-Slavia | 393 | 74 | 467 | 288 | 40 | 338 |
| China | 96 | 16 | 112 | 54 | 9 | 63 |
| United States | 55 | 31 | 86 | 99 | 66 | 165 |
| Other foreign countries | 122 | 57 | 179 | 107 | 69 | 176 |
| Totals | 7,957 | 6,357 | 14,314 | 9,195 | 6,509 | 15,704 |
With the exception of 148 persons (of whom 97 departed for the United States, 25 for China, 13 for European countries, 5 for South American countries, 6 for foreign islands of the Pacific, and 2 for other foreign countries), the whole of the New Zealand residents who permanently left the Dominion during 1925 went to British countries. The figures for the principal countries for 1924 and 1925 are as follows:—
| — | 1924. | 1925. | ||||
|---|---|---|---|---|---|---|
| Males. | Females. | Total. | Males. | Females. | Total. | |
| British Isles | 221 | 249 | 470 | 252 | 243 | 495 |
| South Africa | 13 | 12 | 25 | 15 | 14 | 29 |
| Canada | 64 | 56 | 120 | 26 | 18 | 44 |
| Australia | 730 | 740 | 1,470 | 618 | 553 | 1,171 |
| Fiji | 21 | 17 | 38 | 13 | 10 | 23 |
| Other British countries | 8 | 8 | 16 | 17 | 19 | 36 |
| China | 17 | 2 | 19 | 21 | 4 | 25 |
| United States | 22 | 31 | 53 | 46 | 51 | 97 |
| Other foreign countries | 34 | 11 | 45 | 14 | 12 | 26 |
| Totals | 1,130 | 1,126 | 2,256 | 1,022 | 924 | 1,946 |
During 1925 some 894 persons (males 761, females 133) of foreign nationality, out of the total of 15,704, arrived as new immigrants intending permanent residence in the Dominion, as compared with 833 (669 males, 164 females) out of a total of 14,314 in 1924, the remaining persons (14,810 in 1925 and 13,481 in 1924) being British subjects. This reveals a very considerable increase over the year 1923, and it is worthy of note that 71 per cent. in 1925 and 62 per cent. in 1924 of these foreign nationals were subjects of the Southern European countries of Jugo-Slavia, Italy, and Greece. The figures for subjects of these countries arriving to take up permanent residence in New Zealand during 1925 were: Jugo-Slavia, 350; Italy, 262; and Greece, 22—compared with 447, 52, and 19 respectively in 1924. The chief nationalities represented among the alien immigrants for the last two years were as follows: —
| Nationals of | 1924. | 1925. | ||||
|---|---|---|---|---|---|---|
| Males. | Females | Total. | Males. | Females. | Total. | |
| China | 81 | 7 | 88 | 51 | 2 | 53 |
| Italy | 42 | 10 | 52 | 250 | 12 | 262 |
| Denmark | 16 | 2 | 18 | 16 | 4 | 20 |
| Russia | 10 | 8 | 18 | 14 | 13 | 27 |
| United States | 13 | 11 | 24 | 24 | 20 | 44 |
| Greece | 13 | 6 | 19 | 15 | 7 | 22 |
| Jugo-Slavia | 381 | 66 | 447 | 317 | 33 | 350 |
| Other countries | 101 | 51 | 152 | 74 | 42 | 116 |
There are comparatively few females among foreign nationals intending permanent residence. Whereas 43 per cent. of the British immigrants are females, the corresponding percentage for foreign nationals is slightly under 15. The proportion of young people is also relatively low in the case of foreign nationals; the percentage under twenty-one years of age for British and foreign respectively being 38 and 24.
Foreign nationals constituted a very small proportion of the total number of New Zealand residents who departed permanently during 1925. The following table shows, in regard to permanent residents departing permanently for the years 1924 and 1925, the principal nationalities represented, classified according to age-groups.
| Nationality. | 1924. | 1925. | ||||
|---|---|---|---|---|---|---|
| Under 15 Years. | 15 and under 45 Years. | 45 Years and over. | Under 15 Years. | 15 and under 45 Years. | 45 Years and over. | |
| British | 548 | 1,188 | 434 | 455 | 1,077 | 375 |
| Switzerland | .. | .. | .. | .. | .. | 2 |
| Germany | .. | 1 | 3 | .. | 2 | .. |
| France | 2 | 5 | 1 | .. | 1 | 1 |
| Norway | .. | .. | .. | .. | .. | 1 |
| Sweden | .. | 2 | .. | .. | .. | 1 |
| Denmark | 6 | 13 | .. | .. | 2 | 2 |
| Italy | .. | 3 | 1 | .. | 4 | .. |
| China | .. | .. | 17 | .. | 1 | 22 |
| Other foreign countries | 2 | 18 | 12 | .. | .. | .. |
| Total foreign | 10 | 42 | 34 | .. | 10 | 29 |
| Grand totals | 558 | 1,230 | 468 | 455 | 1,087 | 404 |
Information pertaining to the occupations of immigrants intending permanent residence is of general interest. It should be clearly understood, however, that the occupations stated are those followed by such immigrants prior to their arrival in the Dominion, and the figures do not necessarily indicate even approximately the occupations that will be followed in New Zealand. The following table shows for the years 1924 and 1925 the number of male and female immigrants, fifteen years of age and over, intending permanent residence and the principal classes of occupations followed prior to arrival: —
| Occupation. | 1924. | 1925. | ||
|---|---|---|---|---|
| Males. | Females. | Males. | Females. | |
| Fishing and trapping | 29 | 1 | 45 | .. |
| Agricultural and pastoral | 1,549 | 20 | 2,188 | 30 |
| Mining and quarrying | 385 | .. | 468 | .. |
| Industrial | 1,663 | 257 | 1,718 | 278 |
| Transport and communication | 401 | 5 | 436 | 6 |
| Commerce and finance | 497 | 149 | 585 | 140 |
| Public administration, clerical, and professional | 468 | 351 | 521 | 399 |
| Personal and domestic service | 116 | 1,032 | 137 | 930 |
| Other | 1,024 | 246 | 1,078 | 193 |
| Dependants | 65 | 2,661 | 132 | 2,860 |
| Children under fifteen years of age | 1,760 | 1,635 | 1,887 | 1,673 |
| Totals | 7,957 | 6,357 | 9,195 | 6,509 |
Persons claiming occupations connected with agricultural and pastoral pursuits comprised a considerable proportion of the total male immigrants under discussion, representing 30 per cent. in 1925 and 25 per cent. in 1924. Of the female immigrants, “personal and domestic service” claims the majority of the breadwinners. If dependants are eliminated women with occupations coming within this class comprise 47 per cent. of the total in 1925 and 50 per cent. in 1924. No doubt the special concessions granted to “farm workers” and “domestics” under the assisted immigration scheme largely account for the figures quoted.
Although race aliens comprise comparatively small proportions of the total arrivals and departures, they are by no means unimportant. The principal race aliens with whom New Zealand is concerned are the Chinese and Indians, and these are shown separately from other race aliens. The definition of the term “race alien,” as used in connection with these statistics, is “a person of other than European race.”
The following table shows the number of race aliens who arrived as immigrants intending permanent residence, the number who were permanent New Zealand residents departing permanently, and the permanent increase in each case to the population of New Zealand through migration for the years 1924 and 1925:—
| — | 1924. | 1925. | ||||||
|---|---|---|---|---|---|---|---|---|
| Chinese. | Indians. | Others. | Total. | Chinese. | Indians. | Others. | Total. | |
| Immigrants intending permanent residence | 93 | 44 | 67 | 204 | 58 | 73 | 60 | 191 |
| New Zealand residents departing permanently | 17 | 1 | 17 | 35 | 24 | 4 | .. | 28 |
| Permanent increase of race aliens in New Zealand through migration | 76 | 43 | 50 | 169 | 34 | 69 | 60 | 163 |
It should be noted that the figures quoted above include half-castes. There is a substantial decrease in the number of Chinese immigrants compared with 1924, and this, coupled with an increase in the number departing permanently, shows a reduction in the addition to the Chinese population through migration of from 76 in 1924 to 34 in 1925. The increase in the number of Indian immigrants over that of the previous year consisted for the main part of half-castes, of whom there were 24. The “other” race-alien immigrants intending permanent residence were made up mainly of 26 Syrians and 17 Polynesians.
The total arrivals and departures of race aliens during each of the last ten years are as follows:—
| Year. | Arrivals. | Departures. | ||||||
|---|---|---|---|---|---|---|---|---|
| Chinese. | Indians. | Others. | Total. | Chinese. | Indians. | Others. | Total. | |
| 1916 | 327 | 92 | 594 | 1,013 | 216 | 39 | 314 | 569 |
| 1917 | 272 | 92 | 360 | 724 | 313 | 12 | 383 | 708 |
| 1918 | 256 | 138 | 523 | 917 | 214 | 19 | 171 | 404 |
| 1919 | 418 | 193 | 97 | 708 | 238 | 18 | 66 | 322 |
| 1920 | 1,477 | 225 | 32 | 1,734 | 380 | 54 | 9 | 443 |
| 1921 | 255 | 137 | 249 | 641 | 368 | 100 | 239 | 707 |
| 1922 | 345 | 32 | 172 | 549 | 362 | 125 | 213 | 700 |
| 1923 | 365 | 115 | 249 | 729 | 378 | 66 | 188 | 632 |
| 1924 | 548 | 123 | 341 | 1,017 | 451 | 128 | 332 | 911 |
| 1925 | 517 | 216 | 323 | 1,056 | 524 | 165 | 216 | 905 |
The pending alteration of the law was the cause of a huge influx of Chinese in 1920, with a view to anticipating the tightening of the restrictions, which actually came into operation on the passing of the Immigration Restriction Amendment Act of that year. A limit on the number of Chinese permitted to enter the Dominion is now imposed, and an announcement has been made that no further permits will be issued during 1926.
During the war years the number of race-alien arrivals was swelled by the unavoidable inclusion of natives of the British and French Pacific islands who came to New Zealand to embark for the seat of war.
Estimates of the number of race aliens in the Dominion at 31st March, 1925, are as follows: Chinese, 3,229; Syrians, 698; Indians, 642; other races, 957; total, 5,526.
At the census of 1881, the year in which taxation was first imposed on Chinese landing in New Zealand, the Chinese population numbered 5,004 persons, which fell to 4,542 in 1886, and further to 3,711 in 1896. During the period 1881–96 the poll-tax was £10 per head, and this seemed sufficient for the purpose of preventing a large influx of Chinese. During the years 1894 and 1895, however, the arrivals shown by the Customs returns were found to be somewhat greater than the departures, and in 1896 an Act was passed raising the poll-tax on Chinese immigrants to £100 per head, and limiting the number of Chinese passengers that may be carried by vessels to New Zealand to one for every 200 tons burthen. According to the census of 1901, the Chinese population was 2,857; in 1906 it was 2,570; in 1911, 2,630; in 1916, 2,147; and in 1921, 3,266, of whom 156 were half-castes.
Permanent residents of the Dominion and bona fide New-Zealanders visiting the United Kingdom may nominate any person, not a prohibited immigrant within the meaning of the Immigration Restriction Act, 1908 (N.Z.), and its amendments, or of the Undesirable Immigrants Exclusion Act, 1919 (N.Z.), residing in the United Kingdom, for an assisted passage to New Zealand under the following conditions:—
The person nominated must be under the age of fifty years. Although assisted passages cannot be granted to persons who have attained the age of fifty years, the Immigration Department can arrange full-fare passages for any such persons proceeding as members of a family or of a party the remainder of which is travelling at assisted rates. Full fares (subject to alteration by the shipping companies) are as follows: Third-class six-berth, £37; four-berth, £39; two-berth, £43 per adult.
The person nominated must not have resided in the Dominion or in Australia for a period of at least five years immediately preceding nomination.
He must supply to the High Commissioner for New Zealand in London satisfactory medical certificate and certificate of character.
In the case of a married person, nomination must, include husband, wife, and family (if any), except where a judicial separation exists or desertion is proved.
The nominator must undertake to make provision for maintenance and employment for the nominee after arrival in the Dominion, and must also guarantee that the nominee will reside in the Dominion for at least five years.
All questions as to suitability of any person nominated for an assisted passage are decided by the High Commissioner for New Zealand in London.
Provided that the above conditions are complied with, an assisted passage will be granted at the following rates, which are subject to revision:—
| Third Class. | |||
|---|---|---|---|
| Six-berth. | Four-berth. | Two-berth. | |
| Married or widowed adults, 19 and under 50 years | £11 | 13 | £17 |
| Single adults, 19 and under 50— | |||
| Males | £13 15s. | £15 15s. | £19 15s. |
| Females | £11 | £13 | £17 |
| Farm labourers, 19 and under 45 | £11 | £13 | £17 |
| Domestics, 19 and under 40 | Free | Free | Free |
| Boys, 17 and under 19, not travelling with parents | £5 10s. | 7 10s. | £11 10s. |
| Children, 12 and under 19 (other than boys 17 to 19 not travelling with parents) | Free | £2 | 6 |
| Children, 3 and under 12 | Free | £1 | £3 |
| Children, under 3, if not more than one | Free | Free | Free |
The full amount of passage-money must be paid before a passage is booked. The money can be paid in New Zealand by the nominator, or in London by the nominee, or partly by both.
In any case where nominees are unable to pay the cost of six-berth passages the Imperial and New Zealand Governments, acting in concert, will, on the approval of the High Commissioner, advance the necessary amount by way of loan, repayable within a reasonable time after their arrival in the Dominion.
Nomination forms are obtainable at Post-offices throughout the Dominion, or at the Department of Immigration; Wellingtons Nominations can be cabled at an extra cost of £1. Remittances can be forwarded to nominees at time of nomination without fee.
Passages are granted on vessels belonging to the Shaw-Savill and Albion Company, the New Zealand Shipping Company from London or Southampton, and the Federal Steam Navigation Company from Liverpool. Passages can be booked to the following ports in New Zealand: Auckland, Gisborne, Napier, Wellington, Lyttelton, Timaru, Oamaru, and Port Chalmers. Nominated passages are granted by direct route only.
In addition to the conditions set out as governing the general nominated passages, the following apply to single men nominated as farm labourers.
The person nominated must be a bona fide farm labourer employed as such at the time of nomination, and a written undertaking to follow such calling for at least twelve months after arrival in the Dominion is required. He must also be under forty-five years of age.
The following special conditions apply to nominated domestics: —
The person nominated must be a bona fide domestic and employed as such at the time of nomination, and a written undertaking is required that such calling will be followed for at least twelve months after arrival in the Dominion, and that marriage will not be contracted during that period.
A person nominated as a domestic must be under the age of forty years.
“Domestic” means general servant, cook, housemaid, parlourmaid, waitress, laundress, or nursemaid.
Passages at reduced rates will not be granted to unhealthy persons. When cases of lung, chest, or other like complaints are discovered in any member of a family by the Medical Officer at London, Liverpool, or Southampton, the whole family will be prevented from sailing.
In the case of immigrants under twenty-one years of age special arrangements have to be entered into for their protection on the voyage where deemed necessary or advisable.
The High Commissioner is authorized to grant to suitable and healthy farmers, farm labourers, and domestic servants, who apply to him in London, a third-class passage to New Zealand at the same rates as nominated migrants.
As their respective Governments do not subscribe to the provisions of the Empire Settlement Act, 1922, residents of the Irish Free State or the Channel Islands (except Guernsey) are not eligible for nomination. As far as Ireland is concerned only residents of the following counties are eligible for nomination, viz.: Antrim, Armagh, Down, Fermanagh, Londonderry, and Tyrone.
Various systems of assisted immigration have been in force since 1871, with the exception of the period 1892 to 1903 (inclusive). Up to 1884, free passages were granted in the majority of cases. The numbers of assisted immigrants during each year are as follows: —
| Year. | Number. |
|---|---|
| 1871 | 303 |
| 1872 | 4,736 |
| 1873 | 8,754 |
| 1874 | 32,118 |
| 1875 | 20,370 |
| 1876 | 9,677 |
| 1877 | 5,344 |
| 1878 | 6,618 |
| 1879 | 10,311 |
| 1880 | 2,689 |
| 1881 | 103 |
| 1882 | 726 |
| 1884 | 5,902 |
| 1885 | 1,072 |
| 1886 | 917 |
| 1887 | 1,286 |
| 1888 | 485 |
| 1889 | 91 |
| 1890 | 144 |
| 1891 | 44 |
| 1904 | 1,058 |
| 1905 | 2,191 |
| 1906 | 3,682 |
| 1907 | 2,959 |
| 1908 | 4,667 |
| 1909 | 3,299 |
| 1910 | 2,341 |
| 1911 | 3,070 |
| 1912 | 3,535 |
| 1913 | 5,151 |
| 1914 | 3,716 |
| 1915 | 1,300 |
| 1916 | 695 |
| 1917 | 231 |
| 1918 | 421 |
| 1919 | 3,569 |
| 1920 | 7,615 |
| 1921 | 8,085 |
| 1922 | 7,773 |
| 1923 | 6,181 |
| 1924 | 8,091 |
| 1925 | 8,277 |
The total to 31st December, 1925, is 203,485, of which number all have come from the United Kingdom, with the exception of 3,909 from the Continent of Europe spread over the five years 1874 to 1878 (inclusive).
On arrival in New Zealand the immigrants are met on board by officers of the Immigration Department, who accompany the Port Health Officer to the ship. Whilst the vessel is in the stream it is the special duty of such officers to afford to the assisted immigrants all necessary information as regards transhipment, &c. Arrangements are made for the safety and transhipment of luggage.
Each immigrant is seen as he passes towards the doctor for examination, and is handed an official letter containing information as to where his ticket will be arranged for, and the place and time of departure of his connecting train or boat (if any). It is the practice of the Department to send out advices, by wire if necessary, to friends and relatives of immigrants about to arrive, and to get back information as to where the newcomers will be met. These messages, often together with private letters, &c., are given out on board to those to whom they are addressed.
As regards the female assisted domestic workers who are sent to New Zealand under the supervision of one or more responsible matrons, the Government advertises the fact that the books of the Department are open to record the names of those people in the Dominion desirous of securing the services of an assisted girl. Such advertisements bring in many applications, especially pending the arrival of the ship.
Each matron in charge on board is instructed to classify the girls under two heads: (a) Those with work already arranged or friends to go to; (b) those without either friends or work. On arrival they are met by the Girls' Superintendent of the Immigration Department. Arrangements are made for sending to their destinations those girls who are going to friends or to definite positions. Those requiring accommodation are directed to homes or hostels approved by the Minister of Immigration for this purpose. The Superintendent then separately considers the case of each girl, and arranges to place her with an applicant for a Government-assisted girl. After a girl has been placed the Department endeavours to keep in touch with her by correspondence.
With certain specified exceptions, no person over the age of fifteen years may land in New Zealand unless in possession of a passport or some other document satisfactorily establishing his or her nationality and identity. Exemption from this requirement (which is additional to the requirements of the Immigration Restriction and Undesirable Immigrants Exclusion Acts), may be granted by the Minister of Internal Affairs.
In the case of a person coming from a foreign country the passport must, with certain exceptions, have been issued or viséd by the British Ambassador or a British Consul in that country, and in the case of a person coming from any part of the British dominions the issue or visé must have been by some public official duly authorized in that behalf.
Certain exceptions are made with respect to persons coming to New Zealand from the Cook Islands and Samoa. In their case the only requirement is the possession of a permit to visit New Zealand granted by the Resident Commissioner of the Cook Islands or the Administrator of Samoa, as the case may be. The regulations, further, do not apply to a British subject arriving in New Zealand as the master or a member of the crew of the vessel in which he arrives, or to a British subject arriving from the Commonwealth of Australia.
With the exception of British subjects travelling to the Commonwealth of Australia, Cook Islands, and Samoa, all persons travelling to places beyond the seas are required to be in possession of a passport or similar document to facilitate landing thereat. British passports are issued, under the direction of His Excellency the Governor-General, by the Department of Internal Affairs. They are valid for five years and may be renewed for any number of years not exceeding five. Subject to the Immigration Regulations in force in the various countries of the Empire, they are valid for travelling anywhere within the British Empire.
The legislation respecting the restriction of immigration into New Zealand is contained in the Immigration Restriction Act, 1908, and its amendments, and the Undesirable Immigrants Exclusion Act, 1919. It is administered by the Customs Department. In general the provisions outlined hereunder do not apply to (a) His Majesty's land and sea forces, (b) the officers and crew of any ship-of-war of any Government, (c) persons duly accredited to the Government of New Zealand by any other Government, (d) the officers and crew of any mercantile vessel who leave New Zealand with the vessel, (e) persons domiciled in New Zealand, (f) any persons who may be exempted in special cases (at the discretion of the proper authority).
The following classes of persons are prohibited from landing in New Zealand:—
Persons not of British birth and parentage, unless in possession of permits issued by the Customs Department.
NOTE.—A person is not deemed to be of British birth and parentage by reason that he or his parents or either of them is a naturalized British subject, or by reason that he is an aboriginal Native or the descendant of an aboriginal Native of any dominion (other than New Zealand), colony, possession, or protectorate of His Majesty.
Aliens of the age of fifteen years or over who refuse or neglect to take an oath (or make an affirmation) of obedience to the laws of New Zealand.
Idiots or insane persons.
Persons suffering from contagious diseases which are loathsome or dangerous.
Persons arriving in New Zealand within two years after the termination of a period of imprisonment for a serious offence.
Persons who are considered by the Attorney-General to be disaffected or disloyal, or of such a character that their presence in New Zealand would be injurious to the peace, order, and good government of the Dominion.
Provision is made in the law to permit persons covered by clause (1) above to pay temporary visits to New Zealand. Temporary permits are normally restricted to a period of six months, but may be extended if the proper authorities consider that the circumstances warrant such action. A deposit of $£10 is required in respect of such temporary permits, and is returned on departure if the conditions of the temporary permit are complied with.
In addition to the necessity for being in possession of the permit indicated in clause (1) above, Chinese entering New Zealand to become permanent residents are required to pay £100 poll-tax.
“When persons arrive in New Zealand who are lunatic, idiotic, deaf, dumb, blind, or infirm, and axe likely to become a charge upon the public or upon any public or charitable institution, the master, owner, or charterer of the ship by which such persons come to New Zealand may be called on to enter into a bond for £100 for each such person, guaranteeing payment of any expenses which may be incurred for his support and maintenance by or in any such institution within a period of five years.
Every person of and over the age of fifteen years who lands in New Zealand must, unless exempted by the Minister of Customs, make and deliver to an officer of Customs a declaration giving the following particulars: Name, age, nationality, race or people to which he belongs, occupation and residence, and places of birth of himself and parents.
The British Nationality and Status of Aliens (in New Zealand) Act of 1923, which came into operation on the 13th May, 1924, and the regulations made thereunder, provide that an alien friend residing in New Zealand may apply to the Minister of Internal Affairs setting forth—
His name, age, birthplace, residence, occupation, and nationality;
The length of his residence in New Zealand, and his desire to settle therein, either permanently or for a limited period, stating such limited period (if any);
A request that a certificate of naturalization may be granted to him.
If the Minister is satisfied—
That the applicant has either resided within New Zealand for a period of not less than three years, or has been in the service of the Crown in any part of His Majesty's dominions for not less than five years within the last eight years; and
That the applicant is of good character and has an adequate knowledge of the English language; and
That the applicant intends; if his application is granted, to continue to reside in His Majesty's dominions, or to enter, or continue in, the service of the Crown; and
That in all other respects the applicant is a person fit to hold and exercise the rights of a British subject in New Zealand— he may, in his absolute discretion, give or withhold the certificate as he thinks most conducive to the public good, and no appeal shall lie from his decision.
The Act also applies to the Cook Islands and to Western Samoa in the same manner in all respects as if those territories were for all purposes part of New Zealand, but the power to grant certificates of naturalization in these cases is vested in the
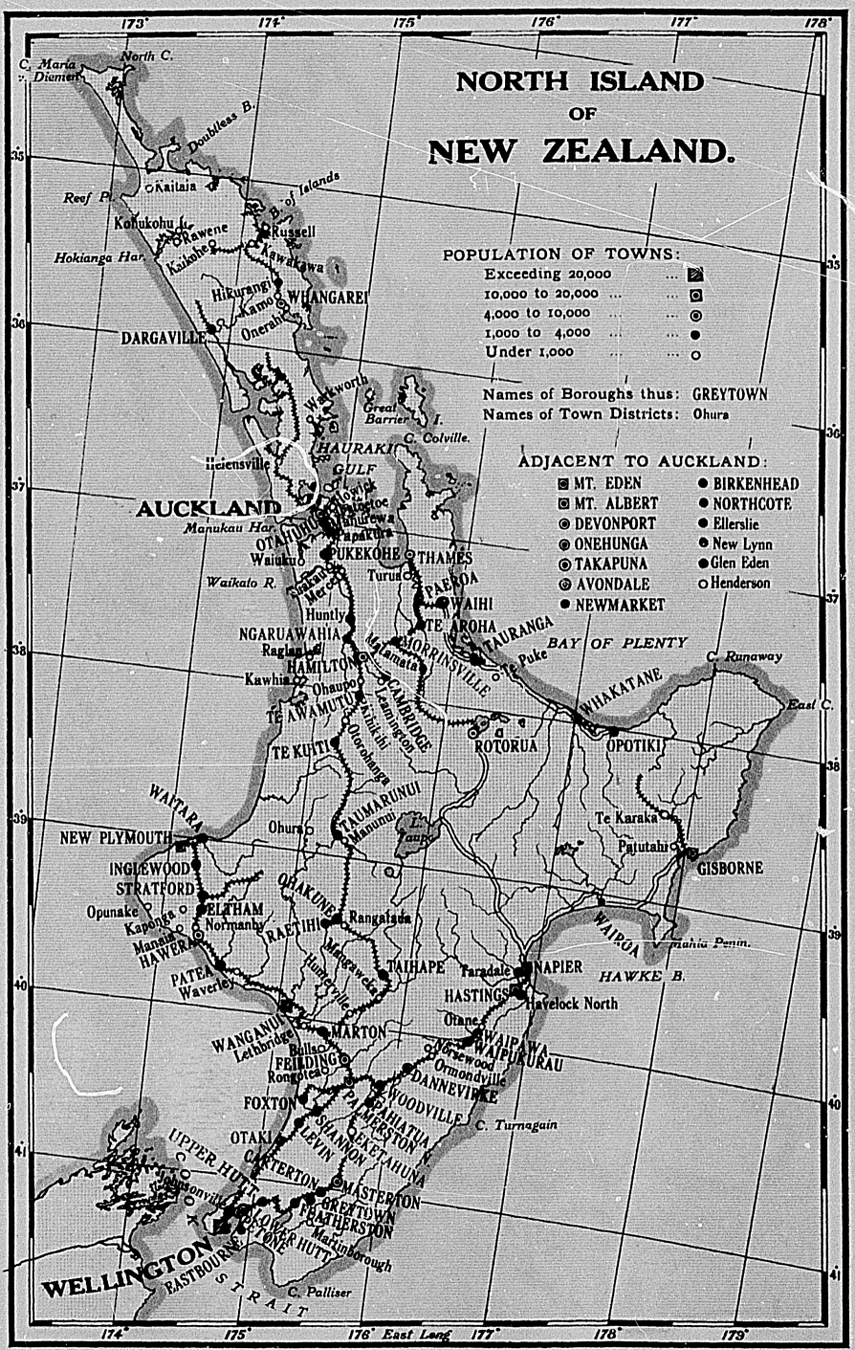
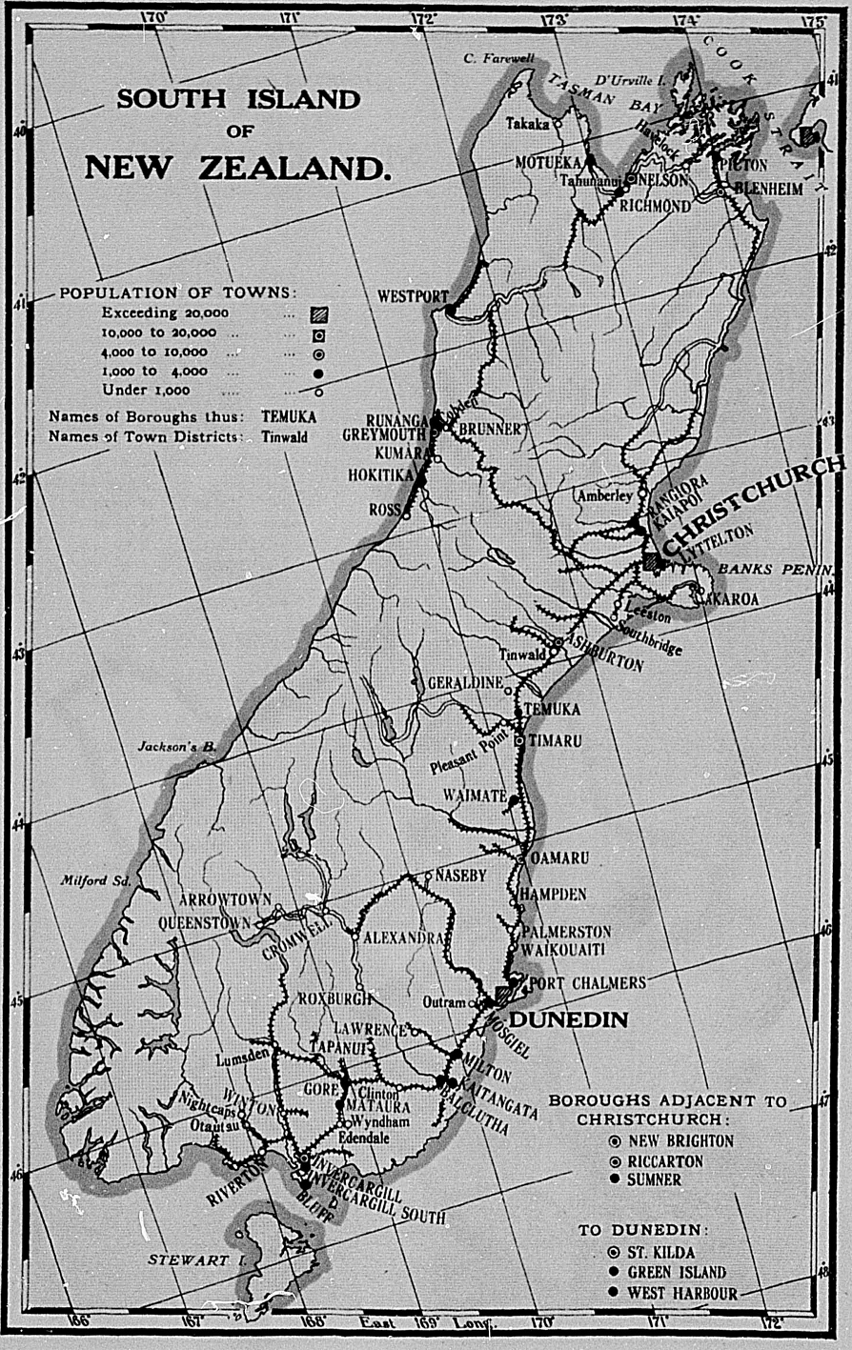
The Minister of Internal Affairs is required to enrol for safe custody a duplicate of all of naturalization issued under the Act.
Acquisition by any person of the status of a British subject by naturalization granted in the United Kingdom, or in any of the dominions, colonies, possessions, or territories of His Majesty other than New Zealand, shall not be deemed to have conferred, and shall not confer upon such person the status of a British subject in New Zealand.
The regulations made by Order in Council dated 13th May, 1924, prescribe the following fees:—
| £ | s. | d. | |
|---|---|---|---|
| Certificate of naturalization issued to a woman who was a British subject previous to her marriage with an alien | 0 | 5 | 0 |
| Certificate of naturalization granted to any person who served with any New Zealand Expeditionary Force or with any Imperial Force or Allied Force in the Great War | 0 | 5 | 0 |
| Certificate of naturalization granted to a native of the islands of Western Samoa | 0 | 2 | 6 |
| Certificate of naturalization granted in other cases, provided that in any case of indigence (to be determined by the Minister of Internal Affairs) the fee shall be 5s. | 2 | 0 | 0 |
| The registration of a declaration of alienage | 0 | 10 | 0 |
| Certified copy of any declaration or certificate | 0 | 10 | 0 |
The Minister of Internal Affairs is empowered to revoke a certificate of naturalization that has been obtained by false representation or fraud, or by concealment of material circumstances, or where the person to whom a certificate is granted has shown himself by act or speech to be disaffected or disloyal to His Majesty. The Governor-General in Council is also empowered to revoke a certificate of naturalization where he is satisfied that this course is advisable, either generally in the public interest or for special reasons affecting the person to whom such certificate has been granted. The duty and discretion imposed and conferred upon the Minister and upon the Governor-General in Council are declared to be absolute, and no order of the Minister or Order in Council therein shall be questioned in any Court or by any proceeding on any ground whatsoever.
During the year 1925, letters of naturalization in New Zealand were granted to 355 persons of the following birthplaces: —
| Country of Birth. | Males. | Females. | Totals. |
|---|---|---|---|
| England | 1 | .. | 1 |
| Norway | 18 | 2 | 20 |
| Sweden | 18 | 2 | 20 |
| Denmark | 40 | 3 | 43 |
| Russia | 8 | .. | 9 |
| Finland | 8 | .. | 8 |
| Netherlands | 3 | .. | 3 |
| Poland | 16 | .. | 17 |
| Belgium | 1 | .. | 1 |
| Germany | 55 | 7 | 62 |
| France | 5 | .. | 5 |
| Switzerland | 15 | 1 | 16 |
| Austria | 4 | 1 | 5 |
| Bulgaria | 1 | .. | 1 |
| Roumania | 1 | .. | 1 |
| Lithuania | 1 | .. | 1 |
| Jugo-Slavia:— | |||
| Dalmatia | 62 | .. | 62 |
| Serbia | 1 | .. | 1 |
| Czecho-Slovakia | 1 | .. | 1 |
| Hungary | 2 | .. | 2 |
| Italy | 28 | 2 | 30 |
| Greece | 4 | .. | 4 |
| Chile | 1 | .. | 1 |
| Syria | 8 | 1 | 9 |
| Palestine | 1 | .. | 1 |
| United States of America | 12 | 1 | 13 |
| South America | 1 | .. | 1 |
| Samoa | 14 | .. | 14 |
| At Sea | 3 | .. | 3 |
| Totals, all countries | 333 | 22 | 355 |
In 1858 the North Island had a larger population than the South, this position being reversed at the succeeding enumerations until 1901, in which year the North Island was found to have slightly the larger total, a position which it has since considerably improved upon. The Maori War which broke out in 1860 retarded settlement in the North, while a large area of land reserved for the Maoris was for many years a serious hindrance to the development of this portion of the Dominion. The South Island was practically free from Maori troubles, and settlement was more rapid, though much of the land was disposed of in large areas. The discovery of gold in Otago in 1861 and on the West Coast in 1864 attracted to these localities considerable numbers of miners.
The population of the two Islands at successive censuses is given in the table following, together with the percentage that each Island bears to the total The figures are exclusive of Maoris.
| Population of the North and South Islands, 1858–1926. | |||||
|---|---|---|---|---|---|
| Census Year. | Population (excluding Maoris). | Proportions per Cent. | |||
| North Island. | South Island.* | Total. | North Island. | South Island.* | |
*Including Stewart Island and Chatham Islands. | |||||
| 1858 | 34,094 | 25,319 | 59,413 | 57.38 | 42.62 |
| 1861 | 41,641 | 57,380 | 99,021 | 42.05 | 57.95 |
| 1864 | 65,263 | 106,895 | 172,158 | 37.91 | 62.09 |
| 1867 | 79,913 | 138,755 | 218,668 | 36.55 | 63.45 |
| 1871 | 96,875 | 159,518 | 256,393 | 37.78 | 62.22 |
| 1874 | 111,934 | 187,580 | 299,514 | 37.37 | 62.63 |
| 1878 | 158,208 | 256,204 | 414,412 | 38.18 | 61.82 |
| 1881 | 193,047 | 296,886 | 489,933 | 39.40 | 60.60 |
| 1886 | 250,482 | 328,000 | 578,482 | 43.30 | 56.70 |
| 1891 | 281,474 | 345,184 | 626,658 | 44.92 | 55.08 |
| 1896 | 340,638 | 362,722 | 703,360 | 48.43 | 51.57 |
| 1901 | 390,579 | 382,140 | 772,719 | 50.54 | 49.45 |
| 1906 | 476,737 | 411,841 | 888,578 | 53.65 | 46.35 |
| 1911 | 563,733 | 444,735 | 1,008,468 | 55.90 | 44.10 |
| 1916 | 651,072 | 448,377 | 1,099,449 | 59.22 | 40.78 |
| 1921 | 741,255 | 477,658 | 1,218,913 | 60.81 | 3919 |
| 1926 | 831,748 | 512,636 | 1,344,384 | 61.87 | 38.13 |
A feature of recent years has been the steady movement of population to the North Island.
The populations of the various provincial districts, as disclosed by the censuses of 1891, 1901, 1911, 1921, and 1926 are as follows: —
| Provincial District. | Census Population (excluding Maoris). | ||||
|---|---|---|---|---|---|
| 1891. | 1901. | 1811. | 1921. | 1926. | |
| Auckland | 133,178 | 175,946 | 264,524 | 369,618 | 424,925 |
| Hawke's Bay | 28,506 | 35,424 | 48,546 | 60,925 | 65,569 |
| Taranaki | 22,065 | 37,855 | 51,569 | 61,911 | 67,653 |
| Wellington | 97,725 | 141,354 | 199,094 | 248,801 | 273,601 |
| Marlborough | 12,767 | 13,326 | 15,985 | 17,788 | 18,568 |
| Nelson | 34,770 | 37,915 | 48,463 | 47,628 | 50,545 |
| Westland | 15,887 | 14,506 | 15,714 | 14,181 | 15,025 |
| Canterbury | 128,663 | 143,248 | 173,443 | 199,034 | 213,746 |
| Otago— | |||||
| Otago portion | 116,088 | 125,341 | 132,402 | 136,880 | 149.579 |
| Southland portion | 37,009 | 47,804 | 58,728 | 62,147 | 65,173 |
| Totals | 626,658 | 772,719 | 1,008,468 | 1,218,913 | 1,344,384 |
During the thirty-five years from 1891 to 1926 the population of the Dominion increased by 99 per cent., and each of the four North Island provinces showed a higher rate of increase—viz., Auckland, 219 per cent.; Taranaki, 207 per cent.; Wellington, 180 per cent.; and Hawke's Bay, 130 per cent. Among the South Island provinces Southland led with a percentage increase of 76, followed by Canterbury (66), Marlborough (45), Nelson (45), and Otago (29), while Westland showed a decrease of 6 per cent.
On 20th April, 1926, somewhat over one-third (38 per cent.) of the population of the Dominion (excluding Maoris), was included in the four principal urban areas—Auckland, Wellington, Christchurch, and Dunedin—and over one-half (51.53 per cent.) in these and in the ten secondary urban areas. The urban areas, which are of quite recent origin, have no legal status, but were formed for statistical purposes, with a view to obviating difficulties formerly experienced through alterations of boundaries of cities and boroughs. Each urban area contains, in addition to the central city or borough and any suburban boroughs or town districts, a considerable non-municipalized area adjacent to and contingent on the centre. The boundaries, which will remain unaltered for a long period, thus allowing of definite comparisons being made over a series of years, have been fixed with a view to providing for probable expansion.
Including those cities and boroughs which form parts of urban areas, the borough population at the census of 1926 aggregated 785,316, or 58 per cent. of the total population of the Dominion. Prior to 1900 there was no statutory limitation to the number of inhabitants necessary to constitute a borough, and consequently many small centres became municipalities. The Municipal Corporations Act now imposes a limit as to area, and provides that no new borough may be constituted unless the proposed area contains at least 1,000 inhabitants.
The counties contain what is generally regarded as the rural population, though this is only approximately correct, some of the boroughs, as stated above, having small populations mainly engaged in rural occupations. On the other hand, some of the non-municipalized towns, which include town districts suburban to the cities and principal boroughs and lying within the urban areas referred to above, have populations more urban than rural.
The town districts are of two classes, which may be referred to as “dependent” and “independent,” the former being in some matters under the jurisdiction of the Council of the county within which it lies, while the latter is entirely independent of county control. A town district may attain its independence of the county when its population exceeds 500, and may become a borough on reaching a population of 1,000.
For population purposes dependent town districts have their figures included in the totals of the counties within which they lie, while independent town districts are excluded, as is also the case with boroughs. Under the old method of computing urban and rural population, however, both classes of town districts are included in the county totals, as in the following table showing the urban and rural population at each census since 1881:—
| Census Year. | Counties. | Boroughs. | Percentage. | ||
|---|---|---|---|---|---|
| Counties. | Boroughs. | Shipboard, &c. | |||
| 1881 | 291,238 | 194,981 | 59.44 | 39.80 | 0.76 |
| 1886 | 327,328 | 245,612 | 56.58 | 42.46 | 0.96 |
| 1891 | 352,097 | 270,343 | 56.18 | 43.14 | 0.68 |
| 1896 | 391,735 | 307,294 | 55.69 | 43.69 | 0.62 |
| 1901 | 417,596 | 350,202 | 54.04 | 45.32 | 0.64 |
| 1906 | 458,797 | 424,614 | 51.63 | 47.79 | 0.58 |
| 1911 | 496,779 | 505,598 | 49.26 | 50.14 | 0.60 |
| 1916 | 501,259 | 585,306 | 45.59 | 53.24 | 1.17 |
| 1921 | 530,852 | 681,988 | 43.55 | 55.95 | 0.50 |
| 1926 | 551,250 | 785,316 | 41.00 | 58.42 | 0.58 |
In view of the public attention which has recently been bestowed upon the question of urban drift, the subject merits some further discussion. In the first place, although most references to this phenomenon are couched in condemnatory terms, it is far from certain that the weight of evidence supports this view. The many arguments both pro and con are outside the scope of the present subject, which proposes merely a brief measurement of the extent of urban drift in New Zealand.
A measure of very fair accuracy is provided by the proportion of “county” and “borough” population in the table immediately preceding. Its drawback is perhaps that it slightly overstates the proportion of urban inhabitants and recent movements of the urban drift. A better criterion is contained in the next table, although perhaps the effects are here slightly understated.
For reasons indicated above, it is not altogether correct to regard the county population as rural and the borough population as urban. It is perhaps preferable to consider the question in the light of the following figures, in the computation of which the urban population is considered as that living in cities, boroughs, or town districts of over 1,000 inhabitants in 1881, 1,200 in 1886, 1,300 in 1891, 1,450 in 1896, 1,600 in 1901, 1,800 in 1906, 2,050 in 1911, 2,250 in 1916, and 2,500 in 1921 and 1926. Here the basic town has been given a rate of increase approximately equivalent to that of the country as a whole, it being assumed that a town of 2,500 bears much the same relationship in the present day as one of 1,000 inhabitants did in 1881. The results are as under:—
| Census. | Rural Population: Per Cent. | Urban Population: Per Cent. |
|---|---|---|
| 1881 | 62.34 | 37.66 |
| 1886 | 60.47 | 39.53 |
| 1891 | 61.16 | 38.84 |
| 1896 | 61.95 | 38.05 |
| 1901 | 60.87 | 39.13 |
| 1906 | 57.96 | 42.04 |
| 1911 | 57.07 | 42.93 |
| 1916 | 54.18 | 45.82 |
| 1921 | 51.23 | 48.77 |
| 1926 | 48.39 | 51.61 |
The increasing proportion of urban population in recent years is plainly manifest. It is noteworthy that the “urban drift,” either non-existent or quiescent up to 1906, in that year commenced a swift rise, which is rapidly gaining in momentum.
Consideration of urban population would be incomplete without a reference to the size of the towns dealt with. To that end a table has been compiled which shows the grouping of the residents of cities, boroughs, and town districts according to the size of their municipality. The total may be taken as corresponding sufficiently well to the urban population. The table shows some very interesting movements in urban distribution, but it is necessary to utter a caution against comparisons made without due consideration. Adjoining boroughs frequently amalgamate, and thus a large borough or city is at once in existence, although there may well be little or no change otherwise. Again, boroughs or town districts are often created out of what prior to such creation is considered rural territory, and the change in status automatically places them within the number of the urban population without any corresponding change in the industries, &c., characteristic of the respective towns. Furthermore, the number of alterations in the boundaries of local districts is most marked.
| Boroughs and Town Districts with Populations of | 1926. | 1901 | ||||||
|---|---|---|---|---|---|---|---|---|
| Number of Boroughs, &c. | Population. | Per Cent. of | Number of Boroughs, &c. | Population. | Per Cent. of | |||
| Urban Population. | Total Population. | Urban Population. | Total Population. | |||||
| Over 50,000 | 4 | 337,148 | 40.54 | 25.08 | .. | .. | .. | .. |
| 25,000–50,000 | .. | .. | .. | .. | 2 | 77,851 | 21.19 | 10.08 |
| 10,000–25,000 | 12 | 185,704 | 22.33 | 13.82 | 3 | 53,821 | 14.65 | 6.96 |
| 5,000–10,000 | 11 | 82,170 | 9.88 | 6.11 | 10 | 66,259 | 18.03 | 8.58 |
| 2,500–5,000 | 23 | 85,491 | 10.28 | 6.36 | 20 | 74,489 | 20.27 | 9.64 |
| 1,000–2,500 | 63 | 102,358 | 12.31 | 7.61 | 38 | 59,117 | 16.09 | 7.65 |
| Under 1,000 | 75 | 38,725 | 4.66 | 2.88 | 63 | 35,882 | 9.77 | 4.64 |
| Totals | 188 | 831,596 | 100.00 | 61.86 | 136 | 367,419 | 100.00 | 47.55 |
An important characteristic of the distribution of urban population in New Zealand is what may be termed its decentralization. In place of one great metropolis-containing a huge proportion of the population, as in the case of the Australian-States—e.g., Victoria, whose capital city, Melbourne, contains over 50 per cent. of the total population of the State—the more highly urbanized portion of the community is localized in four widely separated centres. These four centres have always existed more or less on the same plane, a fact which has played no small part in the development of the country.
Urban and rural communities are not evenly distributed. The South Island, for example, contains proportionately more rural population than does the North Island. Of the Northern provinces Taranaki is the only one in which rural population predominates. The distribution as at the census of 1926 is set forth in the accompanying table:—
| Provincial District. | Boroughs, &c., of over 10,000. | Boroughs, &c., of 2,500–10,000. | Boroughs, &c., of under 2,500. | Total Population of Boroughs, &c. | Remainder of Population. | |||
|---|---|---|---|---|---|---|---|---|
| Number. | Population. | Number. | Population. | Number. | Population. | |||
| Auckland | 5 | 150,223 | 13 | 63,762 | 47 | 48,340 | 262,325 | 162,600 |
| Hawke's Bay | 2 | 25,076 | 1 | 4,244 | 9 | 9,135 | 38,455 | 27,114 |
| Taranaki | 1 | 13,915 | 2 | 7,833 | 9 | 8,677 | 30,425 | 37,228 |
| Wellington | 3 | 140,486 | 6 | 34,998 | 21 | 24,512 | 199,996 | 73,605 |
| Marlborough | .. | .. | 1 | 4,986 | 2 | 1,492 | 6,478 | 12,090 |
| Nelson | 1 | 10,161 | 1 | 3,866 | 6 | 6,096 | 20,123 | 30,422 |
| Westland | .. | .. | 1 | 5,621 | 4 | 4,031 | 9,652 | 5,373 |
| Canterbury | 2 | 98,277 | 5 | 20,922 | 11 | 12,049 | 131,248 | 82,498 |
| Otago— | ||||||||
| Otago portion | 1 | 67,544 | 3 | 17,514 | 19 | 16,997 | 102,055 | 47,524 |
| Southland portion | 1 | 17,170 | 1 | 3,915 | 10 | 9,754 | 30,839 | 34,33,4 |
New Zealand is not alone in experiencing the modern tendency towards urban aggregation: it is, in fact, occurring in almost all countries. Accurate data on this point are not readily available, but the next table, which gives a comparison with England and the United-States, removes this deficiency to some extent. Neither of these two countries, however, represents the same stage of development as the Dominion, so that the comparison suffers to that extent. The urban population quoted for England is that of the total of “urban districts”: that for the United States is the total population in towns of over 2,500 inhabitants.
| Census nearest to | New Zealand. | England and Wales. | United States of America. | |||
|---|---|---|---|---|---|---|
| Urban. | Rural. | Urban. | Rural. | Urban. | Rural. | |
| 1880 | 37.7 | 62.3 | 67.9 | 32.1 | 28.6 | 71.4 |
| 1890 | 38.8 | 61.2 | 72.0 | 28.0 | 35.4 | 64.6 |
| 1900 | 39.1 | 60.9 | 77.0 | 23.0 | 40.0 | 60.0 |
| 1910 | 42.9 | 57.1 | 78.1 | 21.9 | 45.8 | 54.2 |
| 1920 | 48.8 | 51.2 | 79.4 | 20.6 | 51.4 | 48.6 |
| URBAN AREAS.—POPULATION (EXCLUDING MAORIS), CENSUS, 1926. | |
|---|---|
| Urban Area. | Population (excluding Maoris). |
| Auckland. | |
| Auckland City | 87,829 |
| Birkenhead Borough | 3,023 |
| Northcote Borough | 2,357 |
| Takapuna Borough | 6,044 |
| Devonport Borough | 9,831 |
| Avondale Borough | ,559 |
| Newmarket Borough | 9,189 |
| Mount Eden Borough | 18,014 |
| Mount Albert Borough | 17,497 |
| Onehunga Borough | 9,195 |
| Otahuhu Borough | 4,092 |
| New Lynn Town District | 2,535 |
| Ellerslie Town District | 2,410 |
| Remainder of urban area (including portions of Henderson and Glen Eden Town Districts) | 21,601 |
| Total | 192,176 |
| Wellington. | |
| Wellington City | 98,661 |
| Lower Hutt Borough | 7,847 |
| Petone Borough | 9,216 |
| Eastbourne Borough | 1,843 |
| Johnsonville Town District | 1,188 |
| Remainder of urban area | 2,569 |
| Total | 121,324 |
| Christchurch. | |
| Christchurch City | 83,114 |
| Riccarton Borough | 4,575 |
| New Brighton Borough | 4,485 |
| Sumner Borough | 3,099 |
| Lyttelton Borough | 3,682 |
| Remainder of urban area | 19,453 |
| Total | 118,408 |
| Dunedin. | |
| Dunedin City | 67,544 |
| St. Kilda Borough | 7,947 |
| Green Island Borough | 2,145 |
| West Harbour Borough | 1,991 |
| Port Chalmers Borough | 2,572 |
| Remainder of urban area | 2,904 |
| Total | 85,103 |
| Hamilton. | |
| Hamilton Borough | 13,994 |
| Remainder of urban area | 2,076 |
| Total | 16,070 |
| Gisborne. | |
| Gisborne Borough | 12,889 |
| Remainder of urban area | 1,945 |
| Total | 14,834 |
| Napier. | |
| Napier Borough | 14,980 |
| Taradale Town District | 1,086 |
| Remainder of urban area | 1,867 |
| Total | 17,933 |
| Hastings. | |
| Hastings Borough | 10,096 |
| Havelock North Town District | 1,048 |
| Remainder of urban area | 3,494 |
| Total | 14,638 |
| New Plymouth. | |
| New Plymouth Borough | 13,915 |
| Remainder of urban area | 2,023 |
| Total | 15,938 |
| Wanganui. | |
| Wanganui City | 23,691 |
| Remainder of urban area | 2,439 |
| Total | 26,130 |
| Palmerston North. | |
| Palmerston North Borough | 18,134 |
| Remainder of urban area | 1,620 |
| Total | 19,754 |
| Nelson. | |
| Nelson City | 10,161 |
| Tahunanui Town District | 630 |
| Remainder of urban area | 971 |
| Total | 11,762 |
| Timaru. | |
| Timaru Borough | 15,163 |
| Remainder of urban area | 1,654 |
| Total | 16,817 |
| Invercargill. | |
| Invercargill Borough | 17,170 |
| South Invercargill Borough | 2,268 |
| Remainder of urban area | 2,424 |
| Total | 21,862 |
| COUNTIES.—POPULATION (EXCLUSIVE OF MAORIS), CENSUS 1926.(NOTE.—The column headed “Administrative” does not include boroughs or town districts independent of county control, but includes dependent town districts. The heading “Geographic” includes all cities, boroughs, or town districts geographically situated in a county.) | ||
|---|---|---|
| County. | Population (excluding Maoris). | |
| Administrative. | Geographic. | |
| North Island— | ||
| Mongonui | 3,753 | 4,266 |
| Whangaroa | 922 | 922 |
| Hokianga | 2,849 | 2,849 |
| Bay of Islands | 4,437 | 4,437 |
| Whangarei | 9,347 | 16,713 |
| Hobson | 4,948 | 6,870 |
| Otamatea | 3,716 | 3,716 |
| Rodney | 3,594 | 4,029 |
| Waitemata | 9,402 | 36,156 |
| Eden | 17,407 | 160,100 |
| Great Barrier | 271 | 271 |
| Manukau | 7,092 | 16,315 |
| Franklin | 10,315 | 14,045 |
| Raglan | 5,767 | 5,767 |
| Waikato | 8,844 | 26,574 |
| Waipa | 9,344 | 12,644 |
| Otorohanga | 3,055 | 3,596 |
| Kawhia | 927 | 927 |
| Waitomo | 5,159 | 7,481 |
| Taumarunui | 1,944 | 4,231 |
| Matamata | 7,443 | 8,455 |
| Piako | 7,213 | 11,015 |
| Ohinemuri | 2,574 | 8,024 |
| Hauraki Plains | 3,817 | 3,817 |
| Thames | 1,997 | 6,655 |
| Coromandel | 1,809 | 1,809 |
| Tauranga | 5,759 | 9,212 |
| Rotorua | 2,193 | 6,332 |
| Taupo | 1,085 | 1,085 |
| Whakatane | 3,038 | 4,358 |
| Opotiki | 2,094 | 3,148 |
| Matakaoa | 503 | 503 |
| Waiapu | 1,786 | 1,786 |
| Uawa | 1,075 | 1,075 |
| Waikohu | 2,930 | 2,930 |
| Cook | 5,790 | 18,679 |
| Wairoa | 2,661 | 4,829 |
| Hawke's Bay | 12,777 | 39,987 |
| Waipawa | 3,227 | 4,380 |
| Waipukurau | 984 | 2,730 |
| Patangata | 2,477 | 2,477 |
| Dannevirke | 4,696 | 8,940 |
| Woodville | 1,830 | 2,934 |
| Weber | 420 | 420 |
| Ohura | 2,437 | 2,437 |
| Whangamomona | 1,334 | 1,334 |
| Clifton | 2,291 | 2,291 |
| Taranaki | 5,802 | 21,432 |
| Inglewood | 3,067 | 4,311 |
| Egmont | 3,064 | 3,962 |
| Stratford | 5,119 | 8,451 |
| Eltham | 3,488 | 5,526 |
| Waimate West | 2,476 | 3,145 |
| Hawera | 4,816 | 9,317 |
| Patea | 3,238 | 4,958 |
| Kaitieke | 2,891 | 3,777 |
| Waimarino | 3,306 | 6,375 |
| Waitotara | 3,041 | 26,732 |
| Wanganui | 2,834 | 2,834 |
| Rangitikei | 8,485 | 15,074 |
| Kiwitea | 2,383 | 2,383 |
| Pohangina | 1,305 | 1,305 |
| Oroua | 3,516 | 7,774 |
| Manawatu | 4,691 | 6,387 |
| Kairanga | 4,918 | 23,052 |
| Horowhenua | 5,701 | 10,477 |
| Pahiatua | 2,999 | 4,468 |
| Akitio | 1,168 | 1,168 |
| Eketahuna | 2,039 | 2,832 |
| Mauriceville | 753 | 753 |
| Masterton | 3,194 | 11,321 |
| Castlepoint | 584 | 584 |
| Wairarapa South | 3,096 | 4,841 |
| Featherston | 3,566 | 6,695 |
| Hutt | 6,681 | 28,427 |
| Makara | 3,758 | 103,607 |
| Total | 301,312 | 825,519 |
| South Island— | ||
| Sounds | 989 | 989 |
| Marlborough | 7,398 | 13,630 |
| Awatere | 1,696 | 1,696 |
| Kaikoura | 2,204 | 2,204 |
| Amuri | 2,192 | 2,192 |
| Cheviot | 1,289 | 1,289 |
| Waimea | 9,117 | 22,473 |
| Takaka | 1,914 | 1,914 |
| Collingwood | 1,090 | 1,090 |
| Buller | 6,318 | 10,184 |
| Murchison | 1,395 | 1,395 |
| Inangahua | 3,527 | 3,527 |
| Grey | 5,023 | 13,782 |
| Westland | 4,095 | 7,508 |
| Waipara | 2,439 | 2,439 |
| Kowai | 1,964 | 1,964 |
| Ashley | 729 | 729 |
| Rangiora | 2,864 | 4,950 |
| Eyre | 1,870 | 3,576 |
| Oxford | 1,669 | 1,669 |
| Tawera | 785 | 785 |
| Malvern | 2,865 | 2,865 |
| Paparua | 5,161 | 5,161 |
| Waimairi | 12,044 | 16,619 |
| Heathcote | 4,857 | 99,237 |
| Halswell | 1,819 | 1,819 |
| Mount Herbert | 397 | 397 |
| Akaroa | 1,752 | 2,367 |
| Chatham Islands | 268 | 268 |
| Wairewa | 942 | 942 |
| Springs | 1,881 | 1,881 |
| Ellesmere | 3,241 | 3,838 |
| Selwyn | 1,722 | 1,722 |
| Ashburton | 12,225 | 17,975 |
| Geraldine | 5,638 | 8,477 |
| Levels | 5,140 | 20,873 |
| Mackenzie | 3,154 | 3,154 |
| Waimate | 7,211 | 9,414 |
| Waitaki | 9,356 | 16,636 |
| Waihemo | 1,432 | 2,233 |
| Waikouaiti | 4,267 | 9,423 |
| Peninsula | 2,424 | 2 424 |
| Taieri | 5,975 | 85,544 |
| Bruce | 4,526 | 7,576 |
| Clutha | 7,085 | 8,627 |
| Tuapeka | 4,856 | 6,236 |
| Maniototo | 2,664 | 2,881 |
| Vincent | 3,692 | 4,908 |
| Lake | 1,673 | 2,785 |
| Southland | 24,902 | 53,131 |
| Wallace | 9,007 | 11,180 |
| Fiord | 22 | 22 |
| Stewart Island | 447 | 447 |
| Total | 213,212 | 511,047 |
| Grand total | 514,524 | 1,336,566 |
| BOROUGHS.—POPULATION (EXCLUSIVE OF MAORIS), CENSUS, 1926. | |
|---|---|
| Borough. | Population (excluding Maoris). |
| North Island— | |
| Whangarei | 6,266 |
| Dargaville | 1,922 |
| Birkenhead | 3,023 |
| Northcote | 2,357 |
| Takapuna | 6,044 |
| Devonport | 9,831 |
| Auckland (City) | 87,829 |
| Avondale | 4,559 |
| Newmarket | 3,189 |
| Mount Eden | 18,014 |
| Mount Albert | 17,497 |
| Onehunga | 9,195 |
| Otahuhu | 4,092 |
| Pukekohe | 2,307 |
| Ngaruawahia | 1,118 |
| Hamilton | 13,994 |
| Cambridge | 2,021 |
| Te Awamutu | 1,629 |
| Te Kuiti | 2,322 |
| Taumarunui | 2,287 |
| Morrinsville | 1,528 |
| Te Aroha | 2,274 |
| Paeroa | 1,733 |
| Waihi | 3,717 |
| Thames | 4,658 |
| Tauranga | 2,514 |
| Rotorua | 4,139 |
| Whakatane | 1,320 |
| Opotiki | 1,054 |
| Gisborne | 12,889 |
| Wairoa | 2,168 |
| Napier | 14,980 |
| Hastings | 10,096 |
| Waipawa | 1,153 |
| Waipukurau | 1,746 |
| Dannevirke | 4,244 |
| Woodville | 1,104 |
| Waitara | 1,715 |
| New Plymouth | 13,915 |
| Inglewood | 1,244 |
| Stratford | 3,332 |
| Eltham | 2,038 |
| Hawera | 4,501 |
| Patea | 1,087 |
| Ohakune | 1,519 |
| Raetihi | 1,068 |
| Taihape | 2,398 |
| Wanganui (City) | 23,691 |
| Marton | 2,710 |
| Feilding | 4,258 |
| Palmerston North | 18,134 |
| Foxton | 1,696 |
| Shannon | 1,109 |
| Levin | 2,362 |
| Otaki | 1,305 |
| Pahiatua | 1,469 |
| Eketahuna | 793 |
| Masterton | 8,127 |
| Carterton | 1,745 |
| Greytown | 1,137 |
| Featherston | 1,043 |
| Upper Hutt | 2,840 |
| Lower Hutt | 7,847 |
| Petone | 9,216 |
| Eastbourne | 1,843 |
| Wellington (City) | 98,661 |
| Total | 493,616 |
| South Island— | |
| Picton | 1,246 |
| Blenheim | 4,986 |
| Nelson (City) | 10,161 |
| Richmond | 1,087 |
| Motueka | 1,478 |
| Westport | 3,866 |
| Brunner | 618 |
| Runanga | 1,365 |
| Greymouth | 5,621 |
| Kumara | 529 |
| Hokitika | 2,389 |
| Ross | 495 |
| Rangiora | 2,086 |
| Kaiapoi | 1,706 |
| Christchurch (City) | 83,114 |
| Riccarton | 4,575 |
| New Brighton | 4,485 |
| Sumner | 3,099 |
| Lyttelton | 3,682 |
| Akaroa | 615 |
| Ashburton | 5,081 |
| Geraldine | 990 |
| Temuka | 1,849 |
| Timaru | 15,163 |
| Waimate | 2,203 |
| Oamaru | 6,995 |
| Hampden | 285 |
| Palmerston | 801 |
| Waikouaiti | 593 |
| Port Chalmers | 2,572 |
| West Harbour | 1,991 |
| Dunedin (City) | 67,544 |
| St. Kilda | 7,947 |
| Green Island | 2,145 |
| Mosgiel | 1,933 |
| Milton | 1,503 |
| Kaitangata | 1,547 |
| Balclutha | 1,542 |
| Tapanui | 312 |
| Lawrence | 663 |
| Roxburgh | 405 |
| Naseby | 217 |
| Alexandra | 610 |
| Cromwell | 606 |
| Arrowtown | 308 |
| Queenstown | 804 |
| Gore | 3,915 |
| Mataura | 1,236 |
| Winton | 858 |
| Invercargill | 17,170 |
| South Invercargill | 2,268 |
| Bluff | 1,573 |
| Riverton | 868 |
| Total | 291,700 |
| Grand total | 785,316 |
| TOWN DISTRICTS.—POPULATION (EXCLUSIVE OF MAORIS), CENSUS, 1926. | |
|---|---|
| Town District. | Population (excluding Maoris). |
| (a.) Town Districts not forming Parts of Counties. | |
| North Island— | |
| Kaitaia | 513 |
| Hikurangi | 1,100 |
| Warkworth | 435 |
| Helensville | 036 |
| Henderson | 961 |
| Glen Eden | 1,067 |
| New Lynn | 2,535 |
| Ellerslie | 2,410 |
| Howick | 522 |
| Papatoetoe | 1,606 |
| Manurewa | 1,361 |
| Papakura | 1,642 |
| Waiuku | 812 |
| Tuakau | 611 |
| Huntly | 1,715 |
| Leamington | 553 |
| Otorohanga | 541 |
| Manunui | 886 |
| Matamata | 1,012 |
| Te Puke | 939 |
| Taradale | 1,086 |
| Havelock North | 1,048 |
| Opunake | 898 |
| Manaia | 669 |
| Rangataua | 482 |
| Mangaweka | 347 |
| Hunterville | 624 |
| Waverley | 633 |
| Bull's | 510 |
| Martinborough | 949 |
| Johnsonville | 1,188 |
| Total | 30,591 |
| South Island— | |
| Tahunanui | 630 |
| Cobden | 1,155 |
| Leeston | 597 |
| Tinwald | 669 |
| Pleasant Point | 570 |
| Lumsden | 534 |
| Wyndham | 675 |
| Otautau | 658 |
| Nightcaps | 647 |
| Total | 6,135 |
| Grand total | 36,726 |
| (b.) Town Districts forming Parts of Counties. | |
| North Island— | |
| Kohukohu | 386 |
| Rawene | 325 |
| Russell | 314 |
| Kawakawa | 360 |
| Kaikohe | 363 |
| Kamo | 497 |
| Onerahi | 448 |
| Mercer | 305 |
| Raglan | 268 |
| Ohaupo | 237 |
| Kihikihi | 293 |
| Kawhia | 177 |
| Turua | 265 |
| Patutahi | 287 |
| Te Karaka | 321 |
| Otane | 348 |
| Norsewood | 185 |
| Ormondville | 297 |
| Ohura | 266 |
| Kaponga | 414 |
| Normanby | 346 |
| Rongotea | 292 |
| Total | 6,994 |
| South Island— | |
| Havelock | 246 |
| Takaka | 381 |
| Amberley | 346 |
| Southbridge | 418 |
| Outram | 348 |
| Clinton | 384 |
| Edendale | 437 |
| Total | 2,560 |
| Grand total | 9,554 |
New Zealand has numerous townships and more or less closely settled rural localities with considerable population, but without local self-government as boroughs or town districts. A list of such townships,, &c. (other than those included in urban areas), with more than 500 inhabitants, as at the census of 17th April, 1921, is here given. In each case the population quoted covers not only the township proper or the centre of the locality but also the immediate vicinity.
| Aorangi | 522 |
| Ashhurst | 762 |
| Auroa | 513 |
| Blackball | 804 |
| Bunnythorpe | 754 |
| Clevedon | 546 |
| Clive | 648 |
| Coromandel | 801 |
| Denniston | 566 |
| Dunsandel | 539 |
| Flat Creek | 538 |
| Granity | 641 |
| Halcombe | 639 |
| Kaikoura | 619 |
| Kakahi | 579 |
| Kimbolton | 576 |
| Lincoln | 500 |
| Makarewa | 611 |
| Mamaku | 569 |
| Manawaru | 525 |
| Mangatainoka | 552 |
| Matangi | 561 |
| Maungaturoto | 504 |
| Methven | 1,141 |
| Midhirst | 674 |
| Millerton | 672 |
| Morven | 536 |
| Nolantown | 541 |
| Okaiawa | 618 |
| Orepuki | 721 |
| Ormond | 537 |
| Owaka | 600 |
| Owhango | 703 |
| Oxford | 1,022 |
| Porirua | 1,613 |
| Prebbleton | 534 |
| Putaruru | 654 |
| Rakaia | 966 |
| Reefton | 1,603 |
| Riwaka | 737 |
| Seacliff | 1,433 |
| Springston | 560 |
| Tariki | 514 |
| Taupiri | 542 |
| Te Kopuru | 667 |
| Templeton | 781 |
| Te Rapa | 517 |
| Toko | 524 |
| Tokomaru | 547 |
| Trentham | 1,051 |
| Tuatapere | 723 |
| Waihou | 709 |
| Waikari | 520 |
| Waikino | 560 |
| Waipu | 518 |
| Waitati | 634 |
| Wakefield | 787 |
| Weraroa | 528 |
Adjacent to the main Islands are many smaller islands, some of which are of considerable area, and are under cultivation; others are but islets used as sites for lighthouses, while others again are barren and unfitted for human habitation. Some of these islands are included within the boundaries of counties, and their populations are included in the county figures. The following adjacent islands not attached to any county were inhabited at the census of 1921:—
| Island. | Population (excluding Maoris). | ||
|---|---|---|---|
| M. | F. | Total. | |
| Pakatoa | 1 | 23 | 24 |
| Rotoroa | 71 | 14 | 85 |
| Little Barrier | 1 | 3 | 4 |
| Tiritiri | 7 | 8 | 15 |
| Rakino | 2 | 3 | 5 |
| Brown's | 1 | 2 | 3 |
| Pahiki | 10 | 2 | 12 |
| Mokohinau | 4 | 3 | 7 |
| Ponui | 9 | 16 | 25 |
| Waiheke | 119 | 123 | 242 |
| Rangitoto | 53 | 28 | 81 |
| Motutapu | 8 | 5 | 13 |
| Motuihi | 16 | 3 | 19 |
| Kawau | 21 | 17 | 38 |
| Motuhora | 3 | 2 | 5 |
| Moturekareka | 2 | .. | 2 |
| Motuketekete | 1 | .. | 1 |
| Rangiahua | 2 | 1 | 3 |
| Puketutu | 9 | 12 | 21 |
| Slipper | 2 | .. | 2 |
| Cuvier | 5 | 5 | 10 |
| Great Mercury | 2 | .. | 2 |
| Motiti | 6 | 5 | 11 |
| East Cape | 5 | 5 | 10 |
| Kapiti | 4 | 1 | 5 |
| Somes | 4 | 2 | 6 |
| Arapawa | 32 | 30 | 62 |
| Long Island | 2 | .. | 2 |
| Maud | 2 | .. | 9 |
| Forsyth | 10 | 5 | 15 |
| Blumine | 1 | 2 | 3 |
| Motuanauru | 1 | .. | 1 |
| Brothers | 3 | .. | 3 |
| D'Urville | 47 | 25 | 72 |
| Stephen | 8 | 3 | 11 |
| Quarantine | 2 | 4 | 6 |
| Dog | 3 | 1 | 4 |
| Centre | 6 | 4 | 10 |
| Totals | 485 | 357 | 842 |
The total area of the Dominion of New Zealand, including Cook and other annexed islands, is 103,861 square miles. Omitting the annexed islands and certain uninhabited outlying islands, the area of the land-mass remaining is 103,285 square miles. This calculation, it should be explained, includes all inland waters.
Using the latter figure as a base, the density of population may be quoted as 13.02 persons to the square mile, or, if Maoris be included, 13.62 persona to the square mile.
A truer statement of average density can be ascertained by applying not the total area as used above, but subtracting the area occupied by rivers, lakes, roads, State forests, higher portions of mountain-ranges, &c. The remaining area, amounting to about 84,500 square miles, which may be considered as the total inhabitable or usable land, carries a population of 16.65 persons to the square mile.
Reverting to the area first-used above, as being the one in common use for this purpose, the progress of development is illustrated in the appended statement:—
| — | Persons to Square Mile. | |
|---|---|---|
| Excluding Maoris. | Including Maoris. | |
| 1881 | 4.74 | 5.17 |
| 1886 | 5.60 | 6.01 |
| 1891 | 6.07 | 6.47 |
| 1896 | 6.81 | 7.20 |
| 1901 | 7.48 | 7.90 |
| 1906 | 8.60 | 9.07 |
| 1911 | 9.76 | 10.25 |
| 1916 | 10.64 | 11.13 |
| 1921 | 11.80 | 12.31 |
| 1926 | 13.02 | 13.62 |
Of interest also is the relative distribution of the population, and to this end the density is quoted for provincial districts as at the Census of 1926: —
| Provincial District. | Area in Square Miles | Persona per Square Mile. | |
|---|---|---|---|
| Excluding Maoris. | Including Maoris. | ||
| Auckland | 25,351 | 16.76 | 18.53 |
| Taranaki | 3,732 | 18.13 | 19.08 |
| Hawke's Bay | 4,241 | 15.46 | 16.56 |
| Wellington | 10,807 | 25.32 | 25.97 |
| Marlborough | 4,225 | 4.39 | 4.1 |
| Nelson | 10,875 | 4.65 | 4.66 |
| Westland | 4,881 | 3.08 | 3.10 |
| Canterbury | 13,858 | 15.42 | 15.50 |
| Otago—Otago portion | 13,957 | 10.72 | 10.74 |
| Southland portion | 11,358 | 5.74 | 5.77 |
| Dominion | 103,285 | 13.02 | 13.62 |
The South Island provinces, it should be noted, contain on an average much more mountainous country than those of the North Island.
The various cities, boroughs, and town districts in New Zealand occupy a total of approximately 510 square miles. Considering their population as “urban,” the urban population has a density of 1,630.6 per square mile, and the rural population a density of 5.0 per square mile.
A useful comparison is possible with various countries from the succeeding table. Inasmuch, however, as the geographical character of countries varies, the real density may differ largely from the nominal.
| Persons per Square Mile. | |
|---|---|
* Inclusive of Maoris. | |
| Newfoundland (1923) | 1.53 |
| Australia (1924) | 1.96 |
| Canada (1924) | 2.47 |
| New Zealand (1926) | 13.62* |
| Union of South Africa (1924) | 14.67 |
| Norway (1920) | 21.20 |
| Sweden (1923) | 34.70 |
| United States (1920) | 34.93 |
| China (1923) | 101.91 |
| Spain (1923) | 111.70 |
| France (1921) | 184.38 |
| Denmark (1921) | 196.81 |
| India (1921) | 225.72 |
| Switzerland (1920) | 242.90 |
| Japan (1923) | 309.52 |
| Germany (1919) | 328.48 |
| Italy (1924) | 331.54 |
| Great Britain (1924) | 489.98 |
| Netherlands (1923) | 573.00 |
| Belgium (1923) | 652.32 |
While not directly constituting a division of population statistics, the subject of buildings, and in particular housing, is so closely cognate to it that it must be treated under the same head. Fuller statistical treatment of building operations from various aspects is presented in the Census volume on “Dwellings,” and in the “Annual Statistical Report on Population and Buildings.”
According to the census enumerations of 1916 and of 1921 the number of inhabited dwellings, exclusive of those occupied by Maoris, was—
| Census, 1916. | Census, 1921. | |
|---|---|---|
| Private dwelling | 229,423 | 250,074 |
| Tenement in private dwelling | 8,643 | 9,973 |
| Hotel | 1,220 | 1,222 |
| Boardinghouse | 3,009 | 3,846 |
| Religious institution | 118 | 127 |
| Educational institution | 147 | 144 |
| Charitable institution | 95 | 119 |
| Hospital | 298 | 437 |
| Prison | 27 | 50 |
| Other | 106 | 443 |
| Totals | 243,086 | 266,535 |
The number of persons per inhabited building in 1916 was 4.52, and in 1921 was 4.57. Considering only inhabited private dwellings and tenements, the figures are—1916, 4.25; 1921, 4.27.
Building statistics are now collected annually for all cities, boroughs, and town districts. A summary of building permits issued for the last three years is quoted.
| BUILDING PERMITS ISSUED: CITIES, BOROUGHS, AND TOWN DISTRICTS, 1923–24, 1924–25, AND 1925–26. | |||
|---|---|---|---|
| 1923–24. | 1924–25. | 1925–26. | |
| Private dwellings,— | |||
| New buildings— | |||
| Number | 6,245 | 5,805 | 6,850 |
| Value | £5,046,893 | £4,916,425 | £5,897,264 |
| Value of alterations and additions | £783,864 | £755,126 | £681,950 |
| Business premises,— | |||
| New buildings— | |||
| Number | 1,042 | 907 | 909 |
| Value | £1,884,859 | £1,876,696 | £2,107,638 |
| Value of alterations and additions | £456,229 | £583,266 | £621,593 |
| Total, including other buildings,— | |||
| New buildings— | |||
| Number | 7,804 | 6,907 | 7,917 |
| Value | £7,708,933 | £7,823,331 | £8,613,549 |
| Value of alterations and additions | £1,437,546 | £1,480,829 | £1,555,981 |
The average value of private dwellings erected was £725 in 1921–22, £788 in 1922–23, £811 in 1923–24, £847 in 1924–25, and £861 in 1925–26. For business premises corresponding figures are £987 (1921–22), £1,546 (1922–23), £1,818 (1923–24), £2,069 (1924–25). and £2,319 (1925–26). The total value of building permits issued in 1925–26 (£10,169,530) constituted a record for the five years for which figures have been compiled. The number of new buildings also showed an increase on previous years.
Of the £5,897,264 representing the cost of new dwellings contemplated in 1925–26, £4,362,727 was designed for wooden residences and £540,065 for houses in other materials. This excludes cases where the material was unspecified.
The following figures show the total value of all buildings or alterations for which permits were issued (including also Government operations) in towns where a level of £100,000 was exceeded:—
| £ | |
|---|---|
| Wellington City | 1,926,832 |
| Auckland City | 1,567,958 |
| Christchurch City | 748,451 |
| Dunedin City | 525,121 |
| Mount Albert Borough | 435,777 |
| Wanganui City | 373,313 |
| Palmerston North Borough | 298,495 |
| New Plymouth Borough | 226,388 |
| Mount Eden Borough | 224,861 |
| Invercargill Borough | 219,739 |
| Lower Hutt Borough | 205,917 |
| Timaru Borough | 191,911 |
| Petone Borough | 174,103 |
| Onehunga Borough | 154,744 |
| Hamilton Borough | 140,809 |
| Hastings Borough | 136,615 |
| Napier Borough | 132,712 |
| Gisborne Borough | 127,071 |
| Takapuna Borough | 115,191 |
| Nelson City | 108,311 |
| Whangarei Borough | 106,813 |
A census of the Maori population is taken every five years, the information being obtained by the collectors either directly or through the chief or head of the tribe or hapu. The name, sex, and age, so far as can be ascertained, of each Maori are entered; but, owing to the nomadic habits of the race and lack of definite knowledge in some particulars, it has been a difficult task in the past. The results of the last eight enumerations are as follows:—
| Census Year. | Males. | Females. | Total. |
|---|---|---|---|
* Includes all half-castes, vide “Method of Compilation,” at beginning of section. | |||
| 1911 | 26,475 | 23,309 | 49,844 |
| 1916 | 25,933 | 23,843 | 49,776 |
| 1921 | 27,908 | 24,843 | 52,751 |
| 1926 | 32,730 | 30,061 | 62,781* |
| 1891 | 22,861 | 19,132 | 41,993 |
| 1896 | 21,673 | 18,181 | 39,854 |
| 1901 | 23,112 | 20,031 | 43,143 |
| 1906 | 25,538 | 22,193 | 47,731 |
While it is probable that in the earlier years covered by the table there was a slight understatement of numbers, yet a comparison of the figures for the last three or four censuses establishes the fact that the Maori race retains its virility and is on the increase. The position is the more satisfactory in that it presents an almost unique spectacle of a Native race living with a white race of overwhelmingly superior numbers and yet able to preserve in no little degree its own individuality and strength.
Further evidence on the subject is borne by the following table, which shows the increasing proportion of children under fifteen years of age: —
| Census Year. | Males. | Females. | ||
|---|---|---|---|---|
| Under 15. | Over 15. | Under 15. | Over 15. | |
| 1891 | 33.22 | 66.78 | 35.22 | 64.78 |
| 1896 | 35.28 | 64.72 | 36.82 | 63.18 |
| 1901 | 35.75 | 64.25 | 37.89 | 62.11 |
| 1906 | 38.26 | 61.74 | 39.20 | 60.80 |
| 1911 | 39.10 | 60.90 | 40.97 | 59.03 |
| 1916 | 41.35 | 58.65 | 41.43 | 58.57 |
| 1921 | 39.48 | 60.52 | 40.56 | 59.44 |
The number of half-castes is given in the next table for seven census periods. Those under the first heading are included in the Maori totals, the others being classed among the European population. It is a matter of some difficulty to ascertain the number of half-castes living as Maoris. There has been no definite rule to guide collectors in deciding when a half-caste should be classified as living as a Maori—indeed, it might be said that all the half-castes and a large proportion of the Maoris in the South Island live in European fashion. They mostly have separate holdings of land and separate homes, and have adopted the habits of the Europeans. At the censuses of 1916 and 1921 the old method of enumerating the South Island Maoris was discarded, the same methods and forms being utilized as for the European population. In the early part of this section mention is made of a change in the classification of those intermediate in blood between European and Maori.
| HALF-CASTES. | |||
|---|---|---|---|
| Census Year. | Half-castes. | Total. | |
| Living as Members of Maori Tribes. | Living as and among Europeans. | ||
| 1891 | 2,681 | 2,184 | 4,865 |
| 1896 | 3,503 | 2,259 | 5,762 |
| 1901 | 3,133 | 2,406 | 5,539 |
| 1906 | 3,938 | 2,578 | 6,516 |
| 1911 | 4,181 | 2,879 | 7,060 |
| 1916 | 3,529 | 3.221 | 6,750 |
| 1921 | 3,116 | 4,236 | 7,352 |
During the year 1901 the boundaries of the Dominion were extended to include the Cook Group and certain other of the South Pacific islands. No record of the population of these islands was then obtainable, but at each subsequent census a record of various particulars was obtained. In April, 1926, the population was 13,833. The figures for each census from 1906 onwards are as follows: —
| Census Year. | Males. | Females. | Total. |
|---|---|---|---|
| 1906 | 6,224 | 6,116 | 12,340 |
| 1911 | 6,449 | 6,149 | 12,598 |
| 1916 | 6,553 | 6,244 | 12,797 |
| 1921 | 6,692 | 6,517 | 13,209 |
| 1926 | 7,023 | 6,810 | 13,833 |
At the census of 1st January, 1926, the population of the mandated territory of Western Samoa was 40,231, made up as follows:—
| — | Males. | Females. | Total. |
|---|---|---|---|
| European and half-caste population | 1,300 | 1,198 | 2,498 |
| Native Samoan population | 18,641 | 18,047 | 36,688 |
| Chinese indentured-contract labour | 862 | .. | 862 |
| Chinese (non-indentured) | 28 | .. | 28 |
| Melanesian and Polynesian indentured-contract labour | 154 | 1 | 155 |
| Totals | 20,985 | 19,246 | 40,231 |
The population at the census of 1926 was 3,888 in excess of that disclosed by the census of 1921 (36,343). A proper comparison with enumerations prior to 1921 is not possible, owing to indentured-contract labour not having been included in these. A census taken in July, 1917, showed the European population to then number 1,927, and the native Samoans 35,404. The latter are now recovering from the losses of the disastrous influenza epidemic of 1918–19.
Table of Contents
REGISTRATION of births in New Zealand dates as far back as 1847, in which year was passed a Registration Ordinance which made provision for a record of births and deaths being kept by the State. Under this Ordinance many registrations were effected, some of births as far back as 1840. Compulsory registration did not, however, come into force until 1855.
The earlier Registration Acts and their amendments provided for very little information being given in the case of births, the register containing merely date and place of birth, name and sex of child, names of father and mother, and occupation of father. In 1875, however, a more comprehensive Registration Act was passed, under which information was recorded as to ages and birthplaces of parents, and in 1912 the sexes and ages of previous issue of the marriage were added to the items required to be shown in the birth entry.
The law as to registration of births is now embodied in the Births and Deaths Registration Act, 1924, a consolidation of the then existing legislation. The provisions generally as to registration are that a birth may be registered within sixty-two days without fee. After sixty-two days and within six months a birth is egistrable only after solemn declaration made before the Registrar by the parent or some person present at birth, and on payment of a late fee of 5s., which may, however, be remitted at the discretion of the Registrar-General. When six months have elapsed a birth may be registered with a Registrar of Births within one month after conviction of one of the responsible parties for neglect, but an information for such neglect must be laid within two years of date of birth. Power is given by the Act of 1924 for the Registrar-General to register an unregistered birth which occurred in New Zealand, irrespective of the time that may have elapsed, a fee of five shillings being payable and satisfactory evidence on oath and such other proof as the Registrar-General may deem necessary being required.
There is also provision in the Births and Deaths Registration Act for the re-registration of the births of adopted children, with particulars of the adopting parents in place of those of the natural parents.
Registration of still-births, previously not provided for, was made compulsory from the 1st March, 1913.
Although sixty-two days are allowed for the registration of a birth, it is compulsory to notify the birth to the Registrar within a much shorter interval—viz., forty-eight hours if in a city or borough, and twenty-one days in every other case.
In the successive Registration Acts special provision was made for exemption from the necessity of registration in the case of births and deaths of Maoris, though registration could be effected if desired. Section 20 of the Births and Deaths Registration Amendment Act, 1912 (now section 60 of the Births and Deaths Registration Act, 1924), empowered the making of regulations to provide for the registration of births and deaths of Maoris. Regulations were made accordingly, and Maori births and deaths became registrable as from the 1st March, 1913. The number of Registrars of Maori Births and Deaths in the Dominion is over 200, most of these being in the North Island, where the great majority of the Maori population is located. Every Native settlement of any size is within easy reach of one of these Registrars. Maori registrations are entered in a separate register, and the figures of births given in the following pages do not include those of Maoris, which are dealt with towards the end of this subsection.
The number of births registered in 1925 (28,153) is 139 more than the total for 1924, but 185 less than the figure for 1914, in spite of an increase of over 200,000 in population during the ten years. The rate per 1,000 of mean population (21.17) is the lowest ever recorded in the Dominion.
The numbers and rates of births in each of the last twenty years are as follows:—
| Year. | Number. | Rate per 1,000. |
|---|---|---|
| 1906 | 24,252 | 27.08 |
| 1907 | 25,094 | 27.30 |
| 1908 | 25,940 | 27.45 |
| 1909 | 26,524 | 27.29 |
| 1910 | 25,984 | 26.17 |
| 1911 | 26,354 | 25.97 |
| 1912 | 27,508 | 26.48 |
| 1913 | 27,935 | 26.14 |
| 1914 | 28,338 | 25.99 |
| 1915 | 27,850 | 25.33 |
| 1916 | 28,509 | 25.94 |
| 1917 | 28,239 | 25.69 |
| 1918 | 25,860 | 23.44 |
| 1919 | 24,483 | 21.42 |
| 1920 | 29,921 | 25.09 |
| 1921 | 28,567 | 23.34 |
| 1922 | 29,006 | 23.17 |
| 1923 | 27,967 | 21.94 |
| 1924 | 28,014 | 21.57 |
| 1925 | 28,153 | 21.17 |
There is a noticeable fall in the rate in the later years of the period covered by the table, as compared with the earlier. This fall, however, is small when compared with the tremendous decline between the “seventies” and “nineties” disclosed by the following diagram, which shows also the course of the rates of deaths, natural increase, and marriages from 1855 to 1925:—
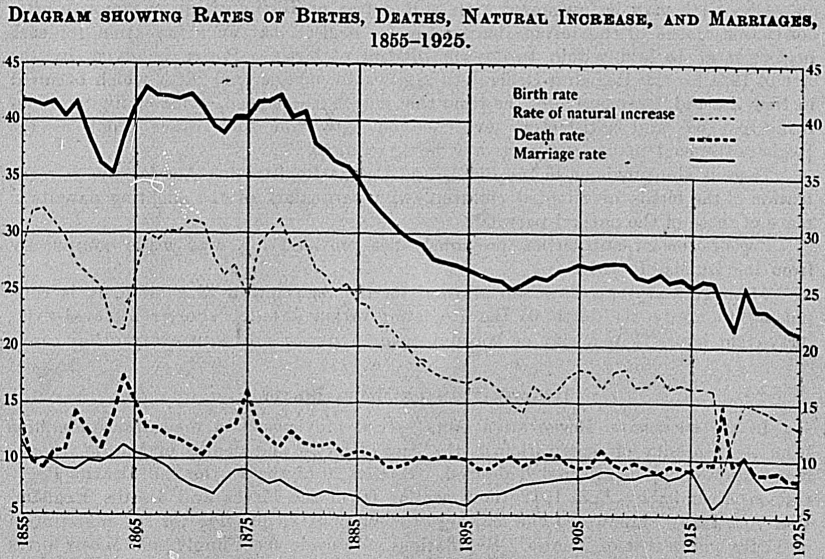
Comparisons of birth-rates over a series of years or between different countries are usually made on the basis of the crude rates—i.e., the number of births per 1,000 of the mean population, irrespective of sex or age.
The crude rates do not permit of allowance being made for variations in the proportion of women of the child-bearing ages, and it is advisable and of interest to supplement the table of crude rates with a computation of the legitimate birth-rate per 1,000 married women between 15 and 45 years of age, or the total birth-rate per 1,000 of all women of these ages. The following table gives both rates for New Zealand in each census year from 1878 to 1921.
| Year. | Number of Women 15 and under 45. | Number of Births. | Birth-rate per 1,000 Women 15 and under 45. | |||
|---|---|---|---|---|---|---|
| Married. | Total. | Legitimate. | Total. | Legitimate. | Total. | |
| 1878 | 50,999 | 80,313 | 17,341 | 17,770 | 340.0 | 221.3 |
| 1881 | 57,461 | 96,144 | 18,198 | 18,732 | 315.0 | 194.8 |
| 1886 | 62,709 | 117,895 | 18,697 | 19,299 | 298.2 | 163.7 |
| 1891 | 63,172 | 131,271 | 17,635 | 18,273 | 279.2 | 139.2 |
| 1896 | 69,816 | 158,214 | 17,778 | 18,612 | 254.6 | 117.6 |
| 1901 | 79,420 | 183,387 | 19,554 | 20,491 | 246.2 | 111.7 |
| 1906 | 98,249 | 212,598 | 23,120 | 24,252 | 235.3 | 114.1 |
| 1911 | 119,390 | 240,714 | 25,276 | 26,354 | 211.7 | 109.5 |
| 1916 | 141,322 | 267,300 | 27,363 | 28,509 | 193.6 | 106.7 |
| 1921 | 150,400 | 288,477 | 27,309 | 28,567 | 181.6 | 99.0 |
The legitimate rate per 1,000 married women between the ages of 15 and 45 is seen to have fallen by nearly 50 per cent. between 1878 and 1921, while an even greater fall is shown for the total rate on the basis of all women of the ages mentioned. The greater fall in the latter rate than in the former is due to the fact that among women of the child-bearing ages, the proportion of married women is considerably lower nowadays than in the earlier years covered.
Women formerly married at younger ages in general than they do at present, and a study of the figures for successive censuses reveals considerable changes in the age-constitution of married women within the child-bearing ages. As the birth-rate varies with age, the change in age-constitution over the period is a factor which should be taken into account. For recent years statistics are available from which to calculate the birth-rate for women of different ages, and by applying the 1921 rate for each quinquennial age-group to the numbers of women in the corresponding groups in earlier years, it is possible to ascertain the total births that would have been recorded in these years on the basis of the rates ruling in 1921. From a comparison of the resultant figures with the numbers of births actually recorded in the respective years weighted index numbers can be compiled, taking the year 1921 as base. Index numbers are given below, together with the corresponding unweighted index numbers and those representing the crude rates.
| INDEX NUMBERS OF BIRTH-RATES, 1878–1921. (Base: 1921 = 1,000.) | |||||
|---|---|---|---|---|---|
| Year. | Crude Rate | Legitimate Rate on Basis of Married Women 15 and under 45. | Total Rate on Basis of all Women 15 and under 45. | ||
| Unweighted. | Weighted. | Unweighted. | Weighted. | ||
| 1878 | 1797 | 1872 | 1588 | 2235 | 2204 |
| 1881 | 1626 | 1735 | 1510 | 1968 | 1990 |
| 1886 | 1420 | 1642 | 1448 | 1654 | 1722 |
| 1891 | 1243 | 1537 | 1385 | 1406 | 1442 |
| 1896 | 1128 | 1402 | 1284 | 1188 | 1211 |
| 1901 | 1129 | 1356 | 1245 | 1128 | 1120 |
| 1906 | 1160 | 1296 | 1179 | 1153 | 1104 |
| 1911 | 1113 | 1166 | 1091 | 1106 | 1050 |
| 1916 | 1111 | 1066 | 1037 | 1078 | 1041 |
| 1921 | 1000 | 1000 | 1000 | 1000 | 1000 |
A comparison of the five sets of index numbers shows that the fall in the rate is somewhat overstated by the crude-rate figures when compared with the rates for married women corrected for age-distribution. Even on this latter basis, however, the figures for which show the least fall, the birth-rate was over 50 per cent. higher forty years ago than it is now. The fall disclosed by the rates for all women between 15 and 45 is much greater than that shown for married women.
The effect of correcting the figures for age-distribution is seen to be very substantial in the case of the legitimate rate for married women, but insignificant in the case of the general rate for all women of the child-bearing ages. It is apparent that, while there have been considerable changes in the sex-constitution of the population and in the age-distribution of married women, there has been little movement in the age-distribution of women in general at the child-bearing ages.
Reference is made farther on in this subsection to the effect on the birth-rate in recent years of changes in the age-distribution of the male population since the war.
The effect of the declining birth-rate is shown in the following table giving the numbers of children under one year of age and the proportions which those numbers represent in the total population as recorded in past census years:—
| Total Population (all Ages). | Children under One Year. | Children under One Year per 1,000 of Population. | |
|---|---|---|---|
| Census 1886 | 578,482 | 18,355 | 31.73 |
| ,, 1891 | 626,658 | 16,443 | 26.24 |
| ,, 1896 | 703,360 | 17,070 | 24.27 |
| ,, 1901 | 772,719 | 18,381 | 23.79 |
| ,, 1906 | 888,578 | 22,289 | 25.08 |
| ,, 1911 | 1,008,468 | 24,340 | 24.14 |
| ,, 1916 | 1,099,449 | 27,021 | 24.57 |
| ,, 1921 | 1,218,913 | 27,264 | 22.37 |
The decline of the birth-rate in New Zealand has been partially compensated for by a decrease in the death-rate. Nevertheless the rate of natural increase of population has fallen from 31.19 per 1,000 of mean population in 1870 to 12.88 in 1925. The following table shows the fall in all three rates:—
| Period. | Annual Rates per 1,000 living. | ||
|---|---|---|---|
| Births. | Deaths. | Natural Increase. | |
| 1871–1875 | 39.88 | 12.67 | 27.21 |
| 1876–1880 | 41.21 | 11.80 | 29.41 |
| 1881–1885 | 36.36 | 10.95 | 25.41 |
| 1886–1890 | 31.15 | 9.85 | 21.30 |
| 1891–1895 | 27.68 | 10.15 | 17.53 |
| 1896–1900 | 25.75 | 9.55 | 16.20 |
| 1901–1905 | 26.60 | 9.91 | 16.69 |
| 1906–1910 | 27.06 | 9.75 | 17.31 |
| 1911–1915 | 25.98 | 9.22 | 16.76 |
| 1916–1920 | 24.32 | 10.73 | 13.69 |
| 1921–1925 | 22.24 | 8.62 | 13.62 |
In spite of the fact that the birth-rate in New Zealand is low compared with other countries, yet so low is the Dominion's death-rate that New Zealand ranks high among the nations as regards the rate of natural increase. Only 7 of the 35 countries shown in the following list have lower birth-rates than New Zealand, but only 8 have higher rates of natural increase.
| BIRTH AND NATURAL-INCREASE RATES. | |||
|---|---|---|---|
| Country. | Quinquennium. | Annual Rates per 1,000. | |
| Births. | Natural Increase. | ||
* Exclusive of Quebec. † Registration area. | |||
| Quebec | 1919–23 | 35.4 | 20.6 |
| South Africa | 1920–24 | 27.6 | 17.5 |
| Egypt | 1920–24 | 42.9 | 17.1 |
| Netherlands | 1920–24 | 26.5 | 15.7 |
| Australia | 1921–25 | 23.9 | 14.4 |
| Uruguay | 1919–23 | 26.3 | 143 |
| Canada* | 1920–24 | 25.0 | 14.2 |
| Costa Rica | 1919–23 | 36.7 | 14.0 |
| New Zealand | 1921–25 | 22.2 | 13.6 |
| Jamaica | 1920–24 | 37.6 | 13.4 |
| Iceland | 1919–23 | 26.8 | 13.0 |
| Japan | 1920–24 | 34.9 | 12.0 |
| Norway | 1920–24 | 23.6 | 11.8 |
| Denmark | 1919–23 | 23.3 | 11.3 |
| Italy | 1919–23 | 28.6 | 10.8 |
| Czecho-Slovakia | 1920–24 | 27.4 | 10.5 |
| United States† | 1918–22 | 23.5 | 10.0 |
| Trinidad | 1920–24 | 32.2 | 10.0 |
| Ceylon | 1920–24 | 38.6 | 9.6 |
| Scotland | 1921–25 | 22.9 | 91 |
| Finland | 1920–24 | 23.8 | 91 |
| Germany | 1920–24 | 235 | 90 |
| Hungary | 1919–23 | 28.8 | 8.8 |
| Spain | 1919–23 | 29.9 | 8.0 |
| England & Wales | 1921–25 | 19.9 | 7.7 |
| Northern Ireland | 1920–24 | 22.8 | 7.4 |
| Sweden | 1921–25 | 19.1 | 7.1 |
| Switzerland | 1920–24 | 19.9 | 7.1 |
| Chile | 1919–23 | 391 | 6.6 |
| Belgium | 1919–23 | 20.2 | 6.2 |
| Irish Free State | 1920–24 | 19.6 | 5.7 |
| Portugal | 1917–21 | 29.7 | 4.1 |
| Austria | 1919–23 | 217 | 3.9 |
| British Guiana | 1920–24 | 31.4 | 3.5 |
| France | 1921–25 | 19.7 | 2.1 |
For twenty years prior to 1885 the New Zealand birth-rate was higher than that of Australia, but in that year the positions were reversed, and except for the seven years 1903–9 the Australian rate has been somewhat higher than that of New Zealand. It is interesting to note that the rates of the two countries have shown practically the same movement, New Zealand, however, reaching in 1899, and Australia not till four years later, the temporary limit of the rapid fall which had been steadily in progress since the “seventies.” In each country the check in the decline of the birth-rate was succeeded by a moderate but steady rise for ten years, followed by a fall commencing in New Zealand in 1909 and in Australia in 1913, an interval of four years again separating the movements of the two countries. The movement over the last ten years is as follows:—
| BIRTH-RATES PER 1,000 OF POPULATION. | ||||||||||
|---|---|---|---|---|---|---|---|---|---|---|
| State. | 1916. | 1917. | 1918. | 1919. | 1920. | 1921. | 1922. | 1923. | 1924. | 1925. |
| Queensland | 27.59 | 28.96 | 28.00 | 25.85 | 27.15 | 26.64 | 25.59 | 24.89 | 23.87 | 23.82 |
| New South Wales | 27.53 | 27.55 | 26.11 | 24.27 | 26.09 | 25.93 | 25.67 | 24.68 | 24.11 | 24.01 |
| Victoria | 24.20 | 23.40 | 22.19 | 21.47 | 23.95 | 23.16 | 23.10 | 22.31 | 22.01 | 21.49 |
| South Australia | 26.84 | 25.62 | 25.16 | 23.62 | 24.72 | 24.08 | 23.71 | 22.60 | 21.88 | 21.06 |
| Western Australia | 27.37 | 25.76 | 23.06 | 21.68 | 24.69 | 23.39 | 23.94 | 22.55 | 23.09 | 22.23 |
| Tasmania | 29.03 | 27.68 | 26.64 | 25.91 | 27.29 | 26.98 | 27.08 | 26.27 | 25.07 | 24.24 |
| Commonwealth | 26.56 | 26.27 | 25.00 | 23.53 | 25.45 | 24.95 | 24.69 | 23.77 | 23.24 | 22.89 |
| New Zealand | 25.94 | 25.69 | 23.44 | 21.42 | 25.09 | 23.34 | 23.17 | 21.94 | 21.57 | 21.17 |
It is of interest to note the quarterly fluctuations in the numbers of births registered. Some fairly sharp movements are disclosed by the figures for the last ten years, the most noticeable being the suddon increase (consequent on the termination of the war) from 5,832 in the third quarter of 1919 to 6,454 in the fourth quarter of that year and 7,522 in the first quarter of the next year. The quarterly figures for each of the last ten years are—
| Year. | Quarter ended | |||
|---|---|---|---|---|
| 31st March. | 30th June. | 30th September. | 31st December. | |
| 1916 | 6,837 | 7,064 | 7,431 | 7,177 |
| 1917 | 7,282 | 7,093 | 7,043 | 6,821 |
| 1918 | 6,354 | 6,647 | 6,526 | 6,333 |
| 1919 | 6,061 | 6,136 | 5,832 | 6,454 |
| 1920 | 7,522 | 7,405 | 7,684 | 7,310 |
| 1921 | 6,829 | 7,051 | 7,304 | 7,383 |
| 1922 | 7,444 | 7,220 | 7,318 | 7,024 |
| 1923 | 6,823 | 0,951 | 7,105 | 7,088 |
| 1924 | 7,081 | 6,583 | 7,159 | 7,191 |
| 1925 | 7,155 | 6.999 | 7,021 | 6,978 |
The extreme range of quarterly totals over the ten years is from 5,832 in the third quarter of 1919 to 7,684 in the third-quarter of 1920. The first-mentioned figure represented an annual rate of 20.15 per 1,000, and the second an annual rate of 25.56.
Urban areas have been created at each of the four chief centres and at ten of the more important secondary centres, each area including in addition to the central borough and any suburban boroughs a considerable non-municipalized area adjacent to and contingent on the centre. The creation of these areas allows of vital and other statistics being compiled over a series of years for a definite area with fixed boundaries, and obviates the disabilities formerly arising from frequent alterations of boundaries of boroughs. The birth statistics of urban areas for each of the last five years are as follows:—
| BIRTHSTATISTICS OF URBAN AREAS, 1921–25. | ||||||||||
|---|---|---|---|---|---|---|---|---|---|---|
| Urban Area. | Number of Births. | Rate per 1,000 of Mean Population. | ||||||||
| 1921. | 1922. | 1923. | 1924. | 1925. | 1921. | 1922. | 1923. | 1924. | 1925. | |
* Not available. † Excluding Hamilton and Hastings. | ||||||||||
| Auckland | 3,178 | 3,162 | 3,205 | 3,387 | 3,451 | 20.15 | 19.23 | 19.10 | 19.58 | 19.09 |
| Wellington | 2,249 | 2,353 | 2,155 | 2,155 | 2,106 | 20.92 | 21.26 | 19.23 | 18.82 | 17.77 |
| Christchurch | 2,144 | 2,173 | 2,132 | 2,186 | 2,147 | 20.29 | 19.73 | 18.80 | 18.95 | 18.15 |
| Dunedin | 1,472 | 1,374 | 1,336 | 1,307 | 1,370 | 20.37 | 18.70 | 17.80 | 17.25 | 17.68 |
| Totals of principal areas | 9,043 | 9,062 | 8,828 | 9,035 | 9,074 | 20.41 | 19.74 | 18.85 | 18.88 | 18.33 |
| Hamilton | * | 384 | 412 | 443 | 399 | * | 25.69 | 26.84 | 27.48 | 23.37 |
| Gisborne | 369 | 358 | 343 | 338 | 294 | 25.54 | 23.99 | 22.69 | 22.00 | 18.73 |
| Napier | 372 | 351 | 348 | 388 | 354 | 21.64 | 19.86 | 19.47 | 21.31 | 18.72 |
| Hastings | * | 353 | 279 | 298 | 311 | * | 26.09 | 20.32 | 21.23 | 21.32 |
| New Plymouth | 320 | 339 | 312 | 362 | 345 | 25.31 | 25.09 | 22.40 | 25.12 | 22.46 |
| Wanganui | 586 | 528 | 527 | 522 | 555 | 24.91 | 21.85 | 21.55 | 20.89 | 21.40 |
| Palmerston North | 405 | 403 | 385 | 358 | 386 | 23.99 | 23.02 | 21.62 | 19.55 | 20.06 |
| Nelson | 224 | 216 | 242 | 206 | 212 | 21.07 | 19.85 | 21.53 | 18.07 | 18.20 |
| Timaru | 328 | 348 | 289 | 280 | 306 | 21.15 | 21.70 | 17.57 | 16.76 | 17.88 |
| Invercargill | 414 | 473 | 455 | 469 | 492 | 21.55 | 24.14 | 22.55 | 22.85 | 23.44 |
| Totals of secondary areas | 3,018 † | 3,753 | 3,592 | 3,664 | 3,654 | 23.21 † | 23.10 | 21.62 | 21.55 | 20.70 |
| Grand totals | 12,061 † | 12,815 | 12,420 | 12,699 | 12,728 | 21.04 † | 20.62 | 19.58 | 19.58 | 18.95 |
In most countries it is found that the cities and larger towns have a somewhat higher birth-rate than the general average of the country, owing largely if not entirely to the natural tendency for people in the country districts to avail themselves of the better medical and nursing facilities provided in the population centres. In New Zealand, however, the effect of this on the birth-rates of the urban areas is obviated by information as to the domicile of the parents being obtained in the case of all births registered in the areas, and the births allocated accordingly. The result is to give for each of the four principal areas a birth-rate somewhat lower than the Dominion average. The average rate for the ten secondary areas, however, varies little from that of the Dominion as a whole.
An examination of the figures shows that, with the exception of one year, there has always been a preponderance of males in the number of children born in New Zealand. The proportions are usually shown by stating the number of births of male children to every 1,000 female births. This number has been as high as 1,113 (in 1859), and as low as 991 (in 1860).
But little significance can be attached to any figures prior to 1870, on account of the comparatively small number of births. The period preceding 1870 exhibits violent fluctuations in the proportion of males, which tend to disappear as the total of births grows larger. The extreme range since 1870 has been from 1,016 male per 1,000 female births in 1878 to 1,081 in 1923.
The number of births and their sex-proportion for twenty years are given below:—
| Year. | Number of Births of | Male Births per 1,000 Female Births. | |
|---|---|---|---|
| Males. | Females. | ||
| 1906 | 12,397 | 11,855 | 1,046 |
| 1907 | 12,835 | 12,259 | 1,047 |
| 1908 | 13,369 | 12,571 | 1,063 |
| 1909 | 13,502 | 13,022 | 1,037 |
| 1910 | 13,442 | 12,542 | 1,072 |
| 1911 | 13,532 | 12,822 | 1,055 |
| 1912 | 13,996 | 13,512 | 1,036 |
| 1913 | 14,433 | 13,502 | 1,069 |
| 1914 | 14,535 | 13,803 | 1,053 |
| 1915 | 14,415 | 13,435 | 1,073 |
| 1916 | 14,669 | 13,840 | 1,060 |
| 1917 | 14,329 | 13,910 | 1,030 |
| 1918 | 13,124 | 12,736 | 1,030 |
| 1919 | 12,587 | 11,896 | 1,058 |
| 1920 | 15,434 | 14,487 | 1,065 |
| 1921 | 14,576 | 13,991 | 1,042 |
| 1922 | 14,897 | 14,109 | 1,056 |
| 1923 | 14,531 | 13,436 | 1,081 |
| 1924 | 14,295 | 13,719 | 1,042 |
| 1925 | 14,518 | 13,635 | 1,064 |
The gradual increase in the proportion of males born is illustrated by taking the average ratios of successive decennial periods. The apparent cessation in the increase, as shown by the figures for the period 1916–25, as compared with the preceding decenniur is due to the low masculinity recorded in the last two war years, when (it may be remarked in passing) the proportion of first births to total births was abnormally low.
| Period. | Male Births to 1,000 Females. |
|---|---|
| 1856–1865 | 1,062 |
| 1866–1875 | 1,043 |
| 1876–1885 | 1,045 |
| 1886–1895 | 1,045 |
| 1896–1905 | 1,054 |
| 1906–1915 | 1,055 |
| 1916–1925 | 1,053 |
It would appear that the proportion of males is somewhat higher for first births than for the general average of all children. Of 50,852 legitimate first births registered during the six years 1920–25 (excluding plural births), 26,376 were of males and 24,476 of females, the proportion of males per 1,000 females being 1,078. The high proportion does not appear to be due to the youth of the mothers, there being a lower rate in cases where the mother was between the ages of twenty and twenty-five than where the mother was between twenty-five and thirty-five. It should be added that in some of the groups the results for the six years, taken separately, do not altogether coincide.
The figures for various age-groups for the six years in conjunction are as follows: —
| SEXES OF FIRST-BORN, 1920–25. | |||
|---|---|---|---|
| Age of Mother, in Years. | Males. | Females. | Males per 1,000 Females. |
| Under 20 | 1,745 | 1,633 | 1,069 |
| 20 and under 25 | 9,940 | 9,357 | 1,062 |
| 25 ,, 30 | 8,866 | 8,133 | 1,090 |
| 30 ,, 35 | 3,979 | 3,603 | 1,104 |
| 35 ,, 40 | 1,444 | 1,386 | 1,042 |
| 40 and over | 402 | 364 | 1,104 |
| Totals | 26.376 | 24,476 | 1,078 |
In the six years covered there were 474 plural first births, and in 173 cases the children were both males, in 145 both females, and in the remaining 156 of opposite sex. Triplets (all females) were recorded for one first birth during the period.
Further light on the question of sexes of children may be thrown by some figures extracted from the records of births registered in the seven years 1919–25 in cases where the child was shown to be the fourth-born of a family in which the three previously born children were still living. In New Zealand the birth entries give particulars of numbers and sexes of previous issue of the parents, with the ages of the living issue, and the following interesting statement showing the sex-nativity order up to the fourth child has been compiled. Families in which plural births occurred among the first four children have been excluded.
| First-born. | Second-born. | Third-born. | Fourth-born. | Number of Cases. |
|---|---|---|---|---|
| Male | Male | Male | Male | 1,159 |
| ,, | ,, | ,, | Female | 1,095 |
| ,, | ,, | Female | Male | 1,038 |
| ,, | ,, | ,, | Female | 1,017 |
| ,, | Female | Male | Male | 986 |
| ,, | ,, | ,, | Female | 873 |
| ,, | ,, | Female | Male | 994 |
| ,, | ,, | ,, | Female | 959 |
| Female | Female | Female | Female | 893 |
| ,, | ,, | ,, | Male | 912 |
| ,, | ,, | Male | Female | 942 |
| ,, | ,, | ,, | Male | 971 |
| Male | Female | Female | 855 | |
| ,, | ,, | ,, | Male | 926 |
| ,, | ,, | Male | Female | 966 |
| ,, | ,, | ,, | Male | 1,012 |
Of the 15,598 families covered, in 8,121 the child was a male and in 7,477 a female, the number of males per 1,000 females being thus 1,086. This proportion is considerably reduced for subsequent births, the figures being as follows:—
| Child. | Males. | Females. | Males per 1,000 Females. |
|---|---|---|---|
| First | 8,121 | 7,477 | 1,086 |
| Second | 8,068 | 7,530 | 1,071 |
| Third | 8,004 | 7,594 | 1,054 |
| Fourth | 7,998 | 7,600 | 1,052 |
It is interesting to note that not only are males in preponderance among firstborn children, but also that in cases where the first-born is a male there appears to be a greater probability of the second child being a male also. Where the firstborn is a female, however, the second child appears to have a more even prospect as to sex.
The figures of first-borns registered in the six years 1920–25, and those of firstborns in cases where the fourth child of the family was registered in the last seven years, give similar results, and the two sets of figures taken in conjunction show that there is a higher masculinity rate among first-born children than among later issue. This conclusion serves to explain the increasing masculinity of births in successive decennia referred to previously, when it is remembered that the average number of children to a family has fallen heavily during the period, and the proportion of firstborn children correspondingly increased.
The sex-proportions of illegitimate births are generally supposed to be more nearly equal than those of legitimate births. Although little reliance can be placed on the figures for New Zealand by reason of the small numbers represented, it may be stated that the average for the period 1916–25 was 1,025 males per 1,000 females—a rate considerably lower than that for all births (1,053) for the same period. In 1916, 1917, 1918, and 1920 females actually exceeded males among illegitimate births.
Counting only cases where both children were born alive, there were 301 cases of twin births (602 children) registered in 1925. There were also two cases of triplets.
The number of children born alive was 28,153; the number of mothers was 27,848: thus, on an average, one mother in every 92 gave birth to twins (or triplets), against one in 93 in 1924, one in 95 in 1923, one in 87 in 1922, and one in 80 in 1921.
The number of cases of multiple births and the proportion per 1,000 of the total cases of births during the last ten years were—
| Year. | Total Births. | Total Cases. | Cases of Twins. | Cases of Triplets. | Multiple Cases per 1,000 of Total Cases. |
|---|---|---|---|---|---|
* Including one case of quadruplets. | |||||
| 1916 | 28,509 | 28,184 | 323 | 1 | 11.50 |
| 1917 | 28,239 | 27,927 | 312 | .. | 11.17 |
| 1918 | 25,860 | 25,560 | 294 | 3 | 11.62 |
| 1919 | 24,483 | 24,206 | 270 | 3* | 11.15 |
| 1920 | 29,921 | 29,552 | 365 | 2 | 12.42 |
| 1921 | 28,567 | 28,210 | 347 | 5 | 12.48 |
| 1922 | 29,006 | 28,678 | 328 | 11.44 | |
| 1923 | 27,967 | 27,672 | 289 | 3 | 10.55 |
| 1924 | 28,014 | 27,712 | 296 | 3 | 10.79 |
| 1925 | 28,153 | 27,848 | 301 | 2 | 10.88 |
The following table shows the sexes in individual cases of twin births for the last ten years: —
| Year. | Total Cases. | Both Males. | Both Females. | Opposite Sexes. |
|---|---|---|---|---|
| 1916 | 323 | 99 | 98 | 126 |
| 1917 | 312 | 90 | 105 | 117 |
| 1918 | 294 | 87 | 95 | 112 |
| 1919 | 270 | 81 | 79 | 110 |
| 1920 | 365 | 128 | 105 | 132 |
| 1921 | 347 | 125 | 90 | 132 |
| 1922 | 328 | 114 | 90 | 124 |
| 1923 | 289 | 110 | 90 | 89 |
| 1924 | 296 | 77 | 108 | 111 |
| 1925 | 301 | 83 | 86 | 132 |
During the ten years 1916–25 there were twenty-one cases of triplets. In three cases all three children were males, in five cases all were females, in four cases there were two males and one female, and in each of the remaining nine cases two of the three children were females. There occurred in 1919 one case of quadruplets, all male children.
Information as to the relative ages of parents of legitimate living children whose births were registered in 1925 is shown in the following table:—
| RELATIVE AGES OF PARENTS. | |||||||||||
|---|---|---|---|---|---|---|---|---|---|---|---|
| Age of Mother, in Years. | Age of Father, in Years. | ||||||||||
| Under 21. | 21 and under 25. | 25 and under 30. | 30 and under 35. | 35 and under 40. | 40 and under 45. | 45 and under 50. | 50 and under 55. | 55 and under 65. | 65 and over. | Total. | |
* Including twenty-six cases where plural births would have been registered bad not one child been still-born. | |||||||||||
| Single Births. | |||||||||||
| 15 and under 16 | 1 | .. | 1 | .. | .. | .. | .. | .. | .. | .. | 2 |
| 16 ,, 17 | 4 | 10 | 1 | 1 | .. | 1 | .. | .. | .. | .. | 17 |
| 17 ,, 18 | 13 | 36 | 17 | 10 | 2 | .. | .. | 1 | 1 | .. | 80 |
| 18 ,, 19 | 42 | 129 | 48 | 10 | 5 | .. | .. | .. | .. | .. | 234 |
| 19 ,, 20 | 49 | 171 | 115 | 35 | 14 | 4 | 1 | 1 | 1 | .. | 391 |
| 20 ,, 21 | 26 | 275 | 221 | 63 | 20 | 6 | 4 | 2 | .. | .. | 617 |
| 21 ,, 25 | 53 | 1,236 | 2,112 | 904 | 347 | 93 | 23 | 7 | 2 | 1 | 4,778 |
| 25 ,, 30 | 5 | 400 | 3,055 | 2,668 | 1,277 | 434 | 138 | 43 | 11 | .. | 8,031 |
| 30 ,, 35 | 2 | 38 | 573 | 2,296 | 2,041 | 925 | 283 | 92 | 27 | 2 | 6,279 |
| 35 ,, 40 | .. | 6 | 76 | 381 | 1,584 | 1,303 | 533 | 165 | 64 | 5 | 4,117 |
| 40 ,, 45 | .. | 1 | 4 | 37 | 191 | 602 | 479 | 181 | 53 | 10 | 1,558 |
| 45 ,, 46 | .. | .. | .. | .. | 5 | 15 | 30 | 14 | 5 | 1 | 70 |
| 46 ,, 47 | .. | .. | .. | 1 | 1 | 9 | 17 | 8 | 3 | 2 | 41 |
| 47 ,, 48 | .. | .. | .. | .. | .. | 3 | 7 | 6 | 2 | .. | 18 |
| 48 ,, 49 | .. | .. | .. | .. | .. | 1 | 1 | 1 | 2 | .. | 5 |
| 50 ,, 51 | .. | .. | .. | .. | .. | .. | .. | 1 | .. | .. | 1 |
| Totals | 195 | 2,302 | 6,223 | 6,406 | 5,487 | 3,396 | 1,517 | 523 | 171 | 21 | 26,241* |
| Multiple Births. | |||||||||||
| 18 and under 19 | 1 | .. | .. | .. | .. | .. | .. | .. | .. | .. | 1 |
| 19 ,, 20 | .. | 1 | .. | .. | .. | .. | .. | .. | .. | .. | 1 |
| 20 ,, 21 | 1 | 3 | 1 | 1 | .. | .. | .. | .. | .. | .. | 6 |
| 21 ,, 25 | .. | 8 | 18 | 9 | 2 | 1 | .. | .. | .. | .. | 38 |
| 25 ,, 30 | 2 | 4 | 30 | 27 | 12 | 3 | .. | .. | 1 | .. | 79 |
| 30 ,, 35 | .. | .. | 9 | 30 | 31 | 12 | .. | 2 | .. | .. | 84 |
| 35 ,, 40 | .. | .. | 1 | 9 | 19 | 21 | 6 | 4 | .. | .. | 60 |
| Totals | 4 | 16 | 59 | 77 | 66 | 44 | 13 | 8 | 2 | .. | 289 |
| Grand totals | 199 | 2,318 | 6,282 | 6,483 | 5,553 | 3,440 | 1,530 | 531 | 173 | 21 | 26,530* |
An indication of the direct effect on the birth-rate caused by the loss of men in the war is obtained by a comparison of the above figures with similarly compiled figures for 1912, the first year for which such statistics are available. A summary is here given, showing for the two years the age-groups of the fathers and mothers of legitimate children whose births were registered in the respective years. Multiple births are counted once only.
| Age-group. | Fathers. | Mothers. | ||
|---|---|---|---|---|
| 1912. | 1925. | 1912. | 1925. | |
| Under 21 | 81 | 199 | 1,107 | 1,349 |
| 21 and under 25 | 1,606 | 2,318 | 4,547 | 4,816 |
| 25 ,, 30 | 6,452 | 6,282 | 8,166 | 8,110 |
| 30 ,, 35 | 7,510 | 6,483 | 6,820 | 6,363 |
| 35 ,, 40 | 5,457 | 5,553 | 3,888 | 4,177 |
| 40 and over | 4,900 | 5,695 | 1,478 | 1,715 |
| Totals | 26,006 | 26,530 | 26,006 | 26,530 |
A study of the individual age-groups shows in the case of the fathers a considerable decrease at ages 30 to 35, the group which at - present is more particularly affected by the loss of men in the war. The age-groups 25 to 30 and 35 to 40, which also had their present numbers materially affected by the war, show a slight decrease and a slight increase respectively. For ages under 25 and over 40, however, very substantial increases are recorded.
It would appear that the considerable decrease in the birth-rate in the later year as compared with the earlier is largely accounted for by the loss of young men in the war, and to a less extent in the influenza epidemic. It should be added that even in the age-groups which show increases war and epidemic losses have tended to restrict these increases, while, on the other hand, the post-war tendency (referred to in the next subsection) for men to marry younger would normally act in the opposite direction.
Information as to the previous issue of the parents, which is required in connection with the registration of births in New Zealand, is useful not only for record purposes but also as providing valuable data for statistical purposes. Tables are given in the Annual Report on Vital Statistics containing detailed information as to number of previous issue in connection with (1) age of mother, and (2) duration of marriage. The former table is here summarized.
| LEGITIMATE BIRTHS, 1925.—NUMBER OF PREVIOUS ISSUE. | ||||||||||
|---|---|---|---|---|---|---|---|---|---|---|
| Age of Mother. | Number of Previous Issue. | Total. | ||||||||
| 0. | 1. | 2. | 3. | 4. | 5. | 6 and under 10. | 10 and under 15. | 15 and over. | ||
* This number represents 26,241 single cases and 289 multiple cases. | ||||||||||
| 15 and under 16 | 2 | .. | .. | .. | .. | .. | .. | .. | .. | 2 |
| 16 ,, 17 | 16 | 1 | .. | .. | .. | .. | .. | .. | .. | 17 |
| 17 ,, 18 | 74 | 5 | .. | 1 | .. | .. | .. | .. | .. | 80 |
| 18 ,, 19 | 215 | 18 | 2 | .. | .. | .. | .. | .. | .. | 235 |
| 19 ,, 20 | 227 | 53 | 12 | .. | .. | .. | .. | .. | .. | 392 |
| 20 ,, 21 | 444 | 153 | 20 | 6 | .. | .. | .. | .. | .. | 623 |
| 21 ,, 25 | 2,726 | 1,348 | 542 | 158 | 37 | 5 | .. | .. | .. | 4,816 |
| 25 ,, 30 | 2,688 | 2,333 | 1,673 | 832 | 356 | 132 | 96 | .. | .. | 8,110 |
| 30 ,, 35 | 1,148 | 1,547 | 1,297 | 974 | 618 | 349 | 421 | 9 | .. | 6,363 |
| 35 ,, 40 | 437 | 609 | 706 | 617 | 544 | 394 | 772 | 95 | 3 | 4,177 |
| 40 ,, 45 | 110 | 143 | 167 | 179 | 173 | 187 | 477 | 138 | 4 | 1,578 |
| 45 and over | 7 | 8 | 8 | 9 | 11 | 16 | 50 | 27 | 1 | 137 |
| Totals | 8,194 | 6,218 | 4,427 | 2,776 | 1,739 | 1,083 | 1,816 | 269 | 8 | 26,530* |
The next table shows the total and average issue of mothers of legitimate children whose births were registered in 1925, classified according to the ages of the mothers. In computing total and average issue multiple births have been given their full significance, the numbers relating to children born alive, and not merely to accouchements as in the preceding table.
| LIVING LEGITIMATE BIRTHS, 1925.—ISSUE ACCORDING TO AGE OF MOTHER. | |||
|---|---|---|---|
| Age of Mother, in Years. | Total Mothers. | Total Issue. | Average Issue. |
| 15 | 2 | 2 | 1.00 |
| 16 | 17 | 18 | 1.06 |
| 17 | 80 | 88 | 1.10 |
| 18 | 235 | 258 | 1.10 |
| 19 | 392 | 470 | 1.20 |
| 20 | 623 | 840 | 1.35 |
| 21 | 939 | 1,341 | 1.43 |
| 22 | 1,089 | 1,655 | 1.52 |
| 23 | 1,343 | 2,253 | 1.68 |
| 24 | 1,445 | 2,684 | 1.86 |
| 25 | 1,680 | 3,439 | 2.05 |
| 26 | 1,569 | 3,353 | 2.14 |
| 27 | 1,649 | 3,870 | 2.35 |
| 28 | 1,603 | 4,079 | 2.55 |
| 29 | 1,609 | 4,329 | 2.69 |
| 30 | 1,502 | 4,259 | 2.84 |
| 31 | 1,353 | 4,168 | 3.08 |
| 32 | 1,281 | 4,107 | 3.21 |
| 33 | 1,154 | 4,083 | 3.54 |
| 34 | 1,073 | 4,038 | 3.76 |
| 35 | 1,018 | 4,096 | 4.02 |
| 36 | 933 | 4,022 | 4.31 |
| 37 | 807 | 3,561 | 4.46 |
| 38 | 758 | 3,540 | 4.67 |
| 39 | 661 | 3,498 | 5.29 |
| 40 | 533 | 2,857 | 5.36 |
| 41 | 355 | 2,062 | 5.81 |
| 42 | 321 | 1,953 | 6.08 |
| 43 | 213 | 1,399 | 6.57 |
| 44 | 156 | 1,082 | 6.94 |
| 45 | 70 | 498 | 7.11 |
| 46 | 41 | 327 | 7.98 |
| 47 | 18 | 112 | 6.22 |
| 48 | 5 | 41 | 8.20 |
| 49 | 2 | 13 | 6.50 |
| 50 | 1 | 15 | 15.00 |
| Totals | 26,530 | 78,410 | 2.96 |
It should be stressed that the averages are no more than they purport to be—viz., the average number of children (including those registered in 1925) born to the present time to those mothers of legitimate children whose births were registered during the year. They do not purport to represent, nor do they represent, the average issue of all women of the ages shown.
A table is next given containing similar information according to duration of marriage.
| LIVING LEGITIMATE BIRTHS, 1925.—ISSUE ACCORDING TO DURATION OF MARRIAGE. | |||
|---|---|---|---|
| Duration of Marriage, in Years. | Total Mothers. | Total Issue. | Average Issue. |
| 0 | 4,041 | 4,083 | 1.01 |
| 1 | 3,001 | 3,738 | 1.25 |
| 2 | 2,722 | 4,838 | 1.77 |
| 3 | 2,356 | 5,084 | 2.16 |
| 4 | 2,451 | 6,241 | 2.54 |
| 5 | 2,098 | 6,036 | 2.88 |
| 6 | 1,349 | 4,284 | 3.18 |
| 7 | 984 | 3,463 | 3.52 |
| 8 | 910 | 3,470 | 3.81 |
| 9 | 1,022 | 4,208 | 412 |
| 10 | 938 | 4,071 | 4.34 |
| 11 | 794 | 3,839 | 4.84 |
| 12 | 717 | 3,686 | 5.14 |
| 13 | 586 | 3,254 | 5.55 |
| 14 | 507 | 2,981 | 5.88 |
| 15 | 391 | 2,469 | 6.31 |
| 16 | 386 | 2,521 | 6.53 |
| 17 | 335 | 2,370 | 7.07 |
| 18 | 256 | 1,905 | 7.44 |
| 19 | 208 | 1,636 | 7.86 |
| 20 | 156 | 1,294 | 8.29 |
| 21 | 108 | 896 | 8.30 |
| 22 | 70 | 662 | 9.46 |
| 23 | 64 | 602 | 9.41 |
| 24 | 39 | 364 | 9.33 |
| 25 | 20 | 188 | 9.40 |
| 26 | 9 | 92 | 10.22 |
| 27 | 5 | 49 | 9.80 |
| 28 | 4 | 40 | 10.00 |
| 29 | 1 | 14 | 14.00 |
| 30 | 1 | 17 | 17.00 |
| 31 | 1 | 15 | 15.00 |
| Totals | 26,530 | 78,410 | 2.96 |
The next table gives information as to the number of previous issue of parents of living legitimate children whose births were registered during each of the last eight years:—
| Number of Previous Issue. | 1918. | 1919. | 1920. | 1921. | 1922. | 1923. | 1924. | 1925. |
|---|---|---|---|---|---|---|---|---|
| 0 | 5,328 | 5,439 | 9,244 | 9,387 | 8,549 | 7,969 | 7,984 | 8,194 |
| 1 | 5,289 | 4,536 | 5,641 | 5,541 | 6,545 | 6,513 | 6,262 | 6,218 |
| 2 | 4,707 | 4,247 | 4,258 | 3,827 | 4,052 | 4,245 | 4,443 | 4,427 |
| 3 | 3,146 | 3,084 | 3,077 | 2,830 | 2,739 | 2,633 | 2,711 | 2,776 |
| 4 | 2,207 | 2,146 | 2,074 | 1,952 | 1,943 | 1,745 | 1,703 | 1,739 |
| 5 | 1,344 | 1,286 | 1,418 | 1,269 | 1,333 | 1,166 | 1,163 | 1,083 |
| 6 | 940 | 886 | 915 | 812 | 840 | 791 | 775 | 764 |
| 7 | 548 | 588 | 605 | 521 | 571 | 531 | 511 | 513 |
| 8 | 397 | 383 | 377 | 337 | 367 | 354 | 366 | 319 |
| 9 | 217 | 216 | 214 | 230 | 234 | 219 | 192 | 220 |
| 10 | 119 | 116 | 150 | 120 | 128 | 131 | 128 | 121 |
| 11 | 74 | 61 | 86 | 67 | 74 | 59 | 62 | 63 |
| 12 | 29 | 40 | 45 | 40 | 53 | 34 | 46 | 34 |
| 13 | 22 | 19 | 23 | 15 | 17 | 16 | 30 | 35 |
| 14 | 13 | 14 | 5 | 9 | 8 | 9 | 7 | 16 |
| 15 | 6 | 4 | 5 | 2 | 9 | 3 | 3 | 7 |
| 16 | 2 | 3 | 3 | 2 | 1 | 1 | 1 | |
| 17 | 1 | 1 | 1 | 3 | 1 | 1 | 2 | .. |
| 18 | 2 | .. | .. | .. | 1 | .. | .. | .. |
| 19 | .. | 1 | .. | .. | .. | .. | .. | .. |
| Totals | 24,391 | 23,070 | 28,138 | 26,965 | 27,466 | 26,420 | 26,389 | 26,530 |
Of a total of 133,770 legitimate births registered during the five years 1921–25, no fewer than 42,083, or 31 ½ per cent., were of first-born children, and of these 21,013, or 50 per cent., were born within twelve months, and 33,005, or 78 ½ per cent. within two years after the marriage of the parents. In the remaining 21 ½ per cent. of cases where there was any issue to the marriage two years elapsed before the birth of the first child.
The number of first births and the proportion of these to total births vary considerably from year to year in sympathy with variations in the annual number of marriages. The proportions of first births occurring within the first and second years after marriage, however, show remarkably little variation in recent years. The figures for each of the last five years are—
| Year. | Total Legitimate Cases. | Total Legitimate First Cases. | Proportion of First Cases to Total Cases. | First Cases within One Year after Marriage. | First Cases within Two Years after Marriage. | ||
|---|---|---|---|---|---|---|---|
| Number. | Proportion to Total First Cases. | Number. | Proportion to Total First Cases. | ||||
| Per Cent. | Per Cent. | Per Cent. | |||||
| 1921 | 26,965 | 9,387 | 34.81 | 4,880 | 52.00 | 7,753 | 82.59 |
| 1922 | 27,466 | 8,549 | 31.13 | 4,206 | 49.20 | 6,705 | 78.43 |
| 1923 | 26,420 | 7,969 | 3016 | 3,892 | 48.84 | 6,087 | 76.38 |
| 1924 | 26,389 | 7,984 | 30.26 | 3,997 | 50.06 | 6,124 | 76.70 |
| 1925 | 26,530 | 8,194 | 30.89 | 4,038 | 49.28 | 6,336 | 77.32 |
| Total for five years | 133,770 | 42,083 | 31.46 | 21,013 | 49.93 | 33,005 | 78.43 |
In the next table the figures of first births within one year after the marriage of the parents are dissected into monthly periods:—
| Duration of Marriage. | 1921. | 1922. | 1923. | 1924. | 1925. |
|---|---|---|---|---|---|
| Under 1 month | 82 | 78 | 86 | 77 | 94 |
| 1 month and under 2 months | 140 | 104 | 93 | 120 | 116 |
| 2 months and under 3 months | 177 | 144 | 171 | 188 | 160 |
| 3 ,, 4 ,, | 228 | 244 | 227 | 220 | 232 |
| 4 ,, 5 ,, | 253 | 255 | 266 | 262 | 266 |
| 5 ,, 6 ,, | 341 | 319 | 374 | 383 | 335 |
| 6 ,, 7 ,, | 456 | 413 | 401 | 414 | 454 |
| 7 ,, 8 ,, | 370 | 364 | 317 | 328 | 377 |
| 8 ,, 9 ,, | 382 | 340 | 277 | 296 | 349 |
| 9 ,, 10 ,, | 979 | 762 | 674 | 682 | 670 |
| 10 ,, 11 ,, | 804 | 654 | 568 | 537 | 538 |
| 11 ,, 12 ,, | 668 | 529 | 438 | 490 | 447 |
| Total under 12 months | 4,880 | 4,206 | 3,892 | 3,997 | 4,038 |
| Total 12 months and over | 4,507 | 4,343 | 4,077 | 3,987 | 4,156 |
| Grand totals | 9,387 | 8,549 | 7,969 | 7,984 | 8,194 |
The great majority of the children born between the seventh and ninth month of marriage are obviously prematurely-born infants. Omitting these, and assuming that all infants born alive within seven months after marriage have been extra-maritally conceived, it would appear that during the five years, out of a total of 42,083 first-born children, 8,173, or 19 ½ per cent., were extra-maritally conceived.
During the five years 6,350 cases of illegitimate births were registered, and if these are all regarded as first births (which is not the case) a total of 14,523-extra-marital conceptions is recorded, which represents 30 per cent. of the total of legitimate first births, plus illegitimate births. The figures for each of the last five years are—
| Year. | Total Legitimate First Births. | Illegitimate Births. | Legitimate Births within Seven Months after Marriage. | Proportion of Legitimate First Births within Seven Months after Marriage. | Proportion of Extra-marital Conceptions to Total of Legitimate First Births and Illegitimate Births. |
|---|---|---|---|---|---|
| Per Cent. | Per Cent. | ||||
| 1921 | 9,387 | 1,245 | 1,677 | 17.87 | 27.48 |
| 1922 | 8,549 | 1,212 | 1,557 | 18.21 | 28.37 |
| 1923 | 7,969 | 1,252 | 1,618 | 20.30 | 31.12 |
| 1924 | 7,984 | 1,323 | 1,664 | 20.84 | 32.09 |
| 1925 | 8,194 | 1,318 | 1,657 | 20.22 | 31.28 |
| Totals for 5 years | 42,083 | 6,350 | 8,173 | 19.42 | 29.99 |
The corresponding percentages for Australia in the year 1924 corresponded very closely with those for New Zealand, 20.11 per cent. of legitimate first births occurring within seven months after marriage, and 31.61 per cent. of all first births being either illegitimate or within seven months after marriage.
The births of 1,332 children (685 males, 647 females) registered in 1925 were illegitimate: thus 47 in every 1,000 children registered were born out of wedlock, a proportion slightly higher than the average of the preceding ten years.
The numbers for each of the last ten years, with the percentages they bear to the total births registered, are as follows:—
| Year. | Number. | Percentage to Total Births. |
|---|---|---|
| 1916 | 1,146 | 4.10 |
| 1917 | 1,159 | 4.56 |
| 1918 | 1,179 | 4.65 |
| 1919 | 1,138 | 4.65 |
| 1920 | 1,424 | 4.76 |
| 1921 | 1,258 | 4.40 |
| 1922 | 1,224 | 4.22 |
| 1923 | 1,260 | 4.51 |
| 1924 | 1,338 | 4.77 |
| 1925 | 1,332 | 4.73 |
Of the 12,458 illegitimate births registered during the decennium, 6,307 were of males and 6,151 of females.
Included in the total of 1,332 illegitimate births in 1925 were 14 cases of twins, the number of accouchements being thus 1,318. From the following table it will be seen that of the 1,318 mothers, 452, or 34 per cent., were under twenty-one years of age.
| ILLEGITIMATE BIRTHS, 1925.—AGES OF MOTHERS. | |
|---|---|
| Age. | Cases. |
| Years. | |
| 14 | 2 |
| 15 | 6 |
| 16 | 28 |
| 17 | 63 |
| 18 | 95 |
| 19 | 116 |
| 20 | 142 |
| 21 | 105 |
| 22 | 95 |
| 23 | 84 |
| 24 | 67 |
| 25 | 68 |
| 26 | 45 |
| 27 | 54 |
| 28 | 37 |
| 29 | 30 |
| 30 | 34 |
| 31 | 33 |
| 32 | 28 |
| 33 | 36 |
| 34 | 23 |
| 35 | 23 |
| 36 | 27 |
| 37 | 18 |
| 38 | 19 |
| 39 | 12 |
| 40 | 8 |
| 41 | 8 |
| 42 | 7 |
| 43 | 1 |
| 44 | 4 |
| Total | 1,318 |
The proportion of illegitimate births per 1,000 unmarried women—i.e., spinsters, widows, and divorced women —at the reproductive ages, covering a period of thirty years, is shown in the following table:—
| Year. | Unmarried Women aged 15–45 Years. | Illegitimate Births. | Illegitimate-birth Rate per 1,000 Unmarried Women. |
|---|---|---|---|
| 1891 | 68,990 | 638 | 9.25 |
| 1896 | 89,722 | 834 | 9.30 |
| 1901 | 105,420 | 937 | 8.89 |
| 1908 | 116,506 | 1,132 | 9.72 |
| 1911 | 116,726 | 1,078 | 9.24 |
| 1916 | 125,461 | 1,159 | 9.24 |
| 1921 | 136,539 | 1,258 | 9.21 |
The rates of illegitimacy in Australia and New Zealand are quoted. The average rate for New Zealand for the ten years (4.48 per 100 of all births) is somewhat lower than that of the Commonwealth (4.87 per 100).
| PROPORTION OF ILLEGITIMATE BIRTHS IN EVERY 100 BIRTHS. | ||||||||
|---|---|---|---|---|---|---|---|---|
| Year. | Queensland. | New South Wales. | Victoria. | South Australia. | Western Australia. | Tasmania. | Commonwealth. | New Zealand. |
| 1915 | 5.36 | 4.97 | 5.74 | 4.00 | 4.24 | 5.32 | 5.12 | 4.14 |
| 1916 | 5.11 | 4.73 | 5.15 | 3.80 | 3.75 | 5.05 | 4.77 | 4.10 |
| 1917 | 5.01 | 4.74 | 5.53 | 3.96 | 4.15 | 5.28 | 4.91 | 4.56 |
| 1918 | 5.46 | 5.18 | 5.85 | 4.02 | 4.02 | 5.28 | 5.23 | 4.65 |
| 1919 | 5.76 | 5.14 | 5.77 | 3.92 | 4.21 | 6.14 | 5.30 | 4.65 |
| 1920 | 5.10 | 4.79 | 5.25 | 3.74 | 3.89 | 5.28 | 4.84 | 4.76 |
| 1921 | 5.22 | 4.83 | 4.85 | 3.15 | 4.03 | 5.53 | 4.75 | 4.40 |
| 1922 | 4.66 | 4.83 | 4.41 | 2.97 | 4.14 | 4.56 | 4.49 | 4.22 |
| 1923 | 5.40 | 4.95 | 4.45 | 3.08 | 3.63 | 4.44 | 4.64 | 4.51 |
| 1924 | 5.34 | 4.82 | 4.62 | 3.06 | 3.94 | 4.24 | 4.62 | 4.77 |
An important Act was passed in 1894 and re-enacted in 1908, intituled the Legitimation Act. Under this Act any child born out of wedlock, whose parents afterwards intermarry, is deemed to be legitimized by such marriage on the birth being registered in the manner prescribed by the Act. For legitimation purposes Registrars must register a birth when called upon to do so by any person claiming to be the father of an illegitimate child; but such person is required to make a solemn declaration that he is the father, and must also produce evidence of marriage between himself and the mother of the child. Registration thus becomes the test of legitimacy.
Prior to the passing, on the 6th February, 1922, of the Legitimation Amendment Act, 1921–22, legitimation could be effected only if at the time of the birth of the child there existed no legal impediment to the intermarriage of the father and mother, but the legal-impediment proviso was repealed by that amendment.
The amendment of 1921–22 also provides for legitimation by the mother in the event of the death of the father after the intermarriage of the parents. In such a case the application for legitimation is heard by a Magistrate, and upon his certifying that it has been proved to his satisfaction that the husband of the applicant was the father of the child, the child is registered as the lawful issue of the applicant and her husband.
The following is the number of legitimations in each year, and the total to 1925, since the Act of 1894 came into force:—
| Number of Children legitimized. | |||
|---|---|---|---|
| Year. | Previously registered. | Not previously registered. | Total. |
| 1894 | 9 | 2 | 11 |
| 1895 | 55 | 13 | 58 |
| 1896 | 45 | 11 | 56 |
| 1897 | 34 | 14 | 48 |
| 1893 | 32 | 27 | 59 |
| 1899 | 28 | 13 | 41 |
| 1900 | 30 | 32 | 62 |
| 1901 | 28 | 19 | 47 |
| 1902 | 55 | 41 | 96 |
| 1903 | 41 | 24 | 65 |
| 1904 | 44 | 43 | 87 |
| 1905 | 48 | 36 | 84 |
| 1906 | 73 | 52 | 125 |
| 1907 | 75 | 39 | 114 |
| 1908 | 84 | 35 | 119 |
| 1909 | 67 | 62 | 129 |
| 1910 | 75 | 46 | 121 |
| 1911 | 76 | 46 | 122 |
| 1912 | 86 | 51 | 137 |
| 1913 | 89 | 72 | 161 |
| 1914 | 99 | 66 | 165 |
| 1915 | 100 | 67 | 167 |
| 1916 | 190 | 91 | 281 |
| 1917 | 213 | 96 | 309 |
| 1918 | 128 | 76 | 204 |
| 1919 | 100 | 66 | 166 |
| 1920 | 109 | 85 | 194 |
| 1921 | 74 | 95 | 169 |
| 1922 | 193 | 106 | 299 |
| 1923 | 211 | 99 | 310 |
| 1924 | 194 | 81 | 275 |
| 1925 | 172 | 97 | 269 |
| Totals | 2,857 | 1,703 | 4,560 |
The comparatively high total of legitimation entries in 1916 and 1917, was no doubt due almost entirely to the continued duration of the war and the passing of the Military Service Act. The prospect of a prolonged absence abroad, and the uncertainty as to whether he would ever return, naturally caused many a reservist to make proper provision for his illegitimate issue. The effect of the Legitimation Amendment Act, 1921–22, is seen in the high figures for the last four years.
The Births and Deaths Registration Act contains provision for the registration of adopted children. The Clerk of the Court by which any adoption order is made is required to furnish to the Registrar-General particulars of the order, including the full name and place of birth of the child, as well as the full names and addresses of both the natural and the adopting parents. If the child's birth has been registered in New Zealand a note of the adoption order is made on it. In any case a new entry is made in the prescribed form in the register of births, particulars of the adopting parents being substituted for those of the natural parents.
During the year 1925 the registration of 558 adopted children (274 males and 284 females) was effected, as compared with 185 in 1924, 398 in 1923, 379 in 1922, and 584 in 1921.
The registration of still-births was made compulsory in New Zealand as from the 1st March, 1913. A still-born child is defined as one “which has issued from its mother after the expiration of the twenty-eighth week of pregnancy and which was not alive at the time of such issue.” Still-births are not included either as births or as deaths in the various numbers and rates shown in this subsection and in that relating to deaths.
The registrations of still-births during each of the last ten years are as follows:—
| Year. | Male. | Female. | Not stated. | Total. | Percentage of Still-births to Living Births. |
|---|---|---|---|---|---|
| 1916 | 383 | 295 | 4 | 682 | 2.39 |
| 1917 | 375 | 305 | 14 | 694 | 2.46 |
| 1918 | 396 | 300 | 5 | 701 | 2.71 |
| 1919 | 377 | 288 | 15 | 680 | 2.78 |
| 1920 | 467 | 363 | 10 | 840 | 2.81 |
| 1921 | 493 | 402 | 8 | 903 | 3.16 |
| 1922 | 469 | 364 | 9 | 842 | 2.90 |
| 1923 | 487 | 400 | 7 | 894 | 3.19 |
| 1924 | 495 | 348 | 12 | 855 | 3.05 |
| 1925 | 481 | 378 | 2 | 861 | 3.06 |
An unsatisfactory feature of the statistics for the ten years is the definite tendency towards an increase in the percentage of still-births to living births.
It is a well-known fact that masculinity is much higher among still-births than among living births. The figures for the ten years covered by the above table show the rate for still-births to have been 1,285 males per 1,000 females. The rate for individual years has ranged between 1,726 (in 1914) and 1,124 (in 1915).
A table i added, showing relative ages of parents in cases of still-births registered in 1925.
| STILL-BIRTHS, 1925.—AGES OF PARENTS. | |||||||||||
|---|---|---|---|---|---|---|---|---|---|---|---|
| Age of Mother, in Years. | Age of Father, in Years. | Illegitimate Cases. | Total. | ||||||||
| Under 21. | 21 and under 25. | 25 and under 30. | 30 and under 35. | 35 and under 40. | 40 and under 45. | 45 and under 50. | 50 and under 65. | 65 and over | |||
* This number represents 841 single cases and 10 plural cases. The total number of still-born children was 861. | |||||||||||
| 14 and under 15 | .. | .. | .. | .. | .. | .. | .. | .. | .. | 1 | |
| 17 ,, 18 | .. | 1 | 1 | 1 | .. | .. | .. | .. | .. | 3 | 6 |
| 18 ,, 19 | 2 | .. | .. | 1 | .. | .. | .. | .. | .. | 4 | 7 |
| 19 ,, 20 | 2 | 3 | 4 | .. | 1 | .. | .. | .. | .. | 4 | 14 |
| 20 ,, 21 | .. | 4 | 5 | 3 | 1 | .. | .. | .. | .. | 2 | 15 |
| 21 ,, 25 | 5 | 28 | 47 | 14 | 9 | .. | 1 | .. | .. | 11 | 115 |
| 25 ,, 30 | .. | 21 | 69 | 68 | 35 | 13 | 3 | 2 | 8 | 219 | |
| 30 ,, 35 | .. | 3 | 21 | 71 | 53 | 25 | 10 | 4 | 4 | 191 | |
| 35 ,, 40 | .. | .. | 3 | 19 | 74 | 42 | 22 | 15 | 6 | 181 | |
| 40 ,, 45 | .. | .. | 3 | 2 | 8 | 36 | 22 | 12 | 2 | 2 | 87 |
| 45 and over | .. | .. | .. | .. | .. | .. | 8 | 6 | 1 | .. | 15 |
| Totals | 9 | 60 | 153 | 179 | 181 | 116 | 66 | 39 | 3 45 | 851* | |
The median age of mothers of still-born children in 1925 was 31, as compared with 29 in the case of living births. The percentage of illegitimates among stillborn infants (5.23) was somewhat higher than among infants horn alive (4.73)
In the next table the 806 cases of legitimate still-births registered in 1925 are classified according to number of previous issue in conjunction with age of mother:—
| LEGITIMATE STILL-BIRTHS, 1925.—AGE OF MOTHER AND NUMBER OF PREVIOUS ISSUE. | |||||||
|---|---|---|---|---|---|---|---|
| Number of Previous Issue. | Age of Mother, in Years. | Total. | |||||
| Under 20. | 20 and under 25. | 25 and under 30. | 30 and under 35. | 35 and under 40. | 40 and over. | ||
| 0 | 15 | 86 | 98 | 56 | 32 | 15 | 302 |
| 1 | 1 | 26 | 46 | 38 | 19 | 8 | 138 |
| 2 | .. | 5 | 27 | 28 | 24 | 9 | 93 |
| 3 | .. | .. | 21 | 23 | 28 | 11 | 83 |
| 4 | .. | .. | 12 | 15 | 23 | 8 | 58 |
| 5 | .. | .. | 4 | 12 | 20 | 10 | 46 |
| 6 | .. | .. | 3 | 6 | 4 | 13 | 26 |
| 7 | .. | .. | .. | 4 | 8 | 8 | 20 |
| 8 | .. | .. | .. | 5 | 7 | 4 | 16 |
| 9 | .. | .. | .. | .. | 3 | 5 | 8 |
| 10 | .. | .. | .. | .. | 4 | 3 | 7 |
| 11 | .. | .. | .. | .. | 2 | 1 | 3 |
| 12 | .. | .. | .. | .. | 1 | 2 | 3 |
| 13 | .. | .. | .. | .. | .. | 1 | 1 |
| 14 | .. | .. | .. | .. | .. | 1 | 1 |
| 16 | .. | .. | .. | .. | .. | 1 | 1 |
| Totals | 16 | 117 211 | 187 | 175 | 100 | 806 | |
Of the living legitimate births registered in 1925, 31 per cent. were first births, while of legitimate still-births no less than 37 per cent. were first births. It would thus appear that there is a considerably greater probability of still-birth occurring at the first accouchement than at the average of subsequent accouchements.
The following table, based on the figures for the three years 1923–25, indicates that this is so, and further demonstrates the effect of the increasing age of the mother in the causation of still-births. While for women between 20 and 25 the proportion of still-births to living births was only a little over 2 per cent., for women over forty it was nearly 5 ¾ per cent.
| LEGITIMATE BIRTHS, 1923–25.—PERCENTAGE OF STILL TO LIVING. | ||||||
|---|---|---|---|---|---|---|
| Age of Mother, in Years. | All Births. | First Births. | Percentage of Still to Living. | |||
| Living. | Still. | living. | Still. | All Births. | First Births. | |
| Under 20 | 2,095 | 37 | 1,805 | 35 | 1.80 | 1.94 |
| 20 and under 25 | 16,282 | 355 | 9,242 | 2.47 | 2.18 | 2.67 |
| 25 ,, 30 | 24,088 | 613 | 7,896 | 318 | 2.54 | 4.03 |
| 30 ,, 35 | 19,206 | 610 | 3,490 | 223 | 3.18 | 6.40 |
| 35 ,, 40 | 12,485 | 542 | 1,344 | 100 | 4.34 | 7.44 |
| 40 and over | 5,183 | 297 | 370 | 43 | 5.73 | 11.62 |
| Totals | 79,339 | 2,454 | 24,147 | 966 | 3.09 | 4.00 |
The next table shows the percentage of still-births to living births according to nativity order of legitimate births registered in the three years 1923–25. The column for mothers of all ages shows a definite gradation, the second child having the best chance of being born alive, and the probability of a still-birth ncreasing thereafter. Whether this is due only to the greater age of the mother or in part to the effects of continued child-bearing it is impossible to say from the small numbers considered, but the column for women between 35 and 40 years of age would appear to suggest that the number of previous issue is a comparatively unimportant factor.
| LEGITIMATE BIRTHS, 1923–25.—PERCENTAGE OF STILL TO LIVING. | ||||||
|---|---|---|---|---|---|---|
| Nativity Order. | Living Births. | Still Births. | Percentage of Still to Living. | |||
| Mothers of All Ages. | Mothers aged 35–40. | Mothers of All Ages. | Mothers aged 35–40. | Mothers of All Ages. | Mothers aged 35–40. | |
| First | 24,147 | 1,344 | 966 | 100 | 4.00 | 7.44 |
| Second | 18,993 | 1,796 | 394 | 66 | 2.07 | 3.67 |
| Third | 13,115 | 2,066 | 285 | 67 | 2.17 | 3.24 |
| Fourth | 8,120 | 1,853 | 211 | 67 | 2.60 | 3.62 |
| Fifth | 5,187 | 1,546 | 179 | 63 | 3.45 | 4.08 |
| Sixth | 3,412 | 1,240 | 130 | 54 | 3.81 | 4.35 |
| Seventh | 2,330 | 951 | 92 | 41 | 3.95 | 4.31 |
| Eighth | 1,555 | 696 | 63 | 27 | 4.05 | 3.88 |
| Ninth | 1,039 | 430 | 47 | 26 | 4.52 | 6.05 |
| Tenth | 631 | 263 | 31 | 13 | 4.91 | 4.94 |
There can be no doubt that age of the mother is the principal factor in the case of accouchements subsequent to the first. This being so, it is of some significance that even when no allowance is made for the younger age-constitution in general of mothers of first-born, the first-born child has a greater probability of being still-born than any subsequent child up to and including the seventh.
The number of births of Maoris registered with Registrars of Maori Births and Deaths during 1925 was 1,692 (899 males, 793 females). The births of seventeen males and seven females were registered under the main Act, and the total of 1,716 represents a rate of 31.20 per 1,000 of Maori population, a rate 47 per cent. higher than the general birth-rate for the year.
The number of Maori births recorded in 1925 is much higher than in any previous year. It is impossible to say to what extent this is due to births which occurred in previous years not being registered until 1925. Registrations in each of the five years, 1921–25, were as follows: —
| MAORI BIRTHS, 1921–1925. | |||
|---|---|---|---|
| Year. | Number of Births. | ||
| Males. | Females. | Total. | |
| 1921 | 571 | 485 | 1,056 |
| 1922 | 748 | 694 | 1,442 |
| 1923 | 607 | 574 | 1,181 |
| 1924 | 629 | 617 | 1,240 |
| 1925 | 916 | 800 | 1,716 |
Regulations under the Cook Islands Act, 1915, providing for compulsory registration of births and deaths in the Cook Islands and Niue from the 1st July, 1916, were gazetted on the 29th June, 1916.
In the case of a birth a month is allowed in which to furnish the following particulars to a Registrar: The place and date of birth; the Christian name and sex of the child; the names and residence of both father and mother, and also (if Natives) whether of full blood, or quarter-, half-, or three-quarter-caste.
Duplicates of all entries are kept by the Registrars of the High Court at Rarotonga and Nine respectively. A fine not exceeding £5 is imposed on persons supplying false information. No fees are payable for registration.
The following are the figures of birth-registrations in each Island during the twelve months ended 31st December, 1925, or 31st March, 1926:—
| BIRTHS IN COOK ISLANDS, 1925–26. | |
|---|---|
| Island. | Number of Births. |
| Rarotonga | 130 |
| Aitutaki | 43 |
| Mangaia | 34 |
| Atiu | 36 |
| Pukapuka | 20 |
| Manihiki | 10 |
| Rakaanga | 11 |
| Mauke | 17 |
| Penrhyn | 7 |
| Niue | 106 |
| Total | 414 |
Regulations providing for the registration of births and deaths of Samoans in Western Samoa were brought into force on the 1st January, 1923.
Within seven days after the birth of any Samoan child the following particulars must be furnished to the Registrar the village and also to the Registrar of the district in which the child was born: The place and date of birth; the Christian or first name and sex of the child; and the names and residence of both father and mother. The father and the mother are jointly responsible for the registration of birth.
Duplicate entries of all births are taken and are kept on record by the Secretary of Native Affairs at Apia. A fine not to exceed £5 is imposed on persons not complying with the regulations, and a fine not exceeding £20 for persons who knowingly furnish false particulars. No fees are payable for registration.
The births of 2,033 living children were registered during the twelve months ended 31st December. 1925, as compared with 1,900 in 1924 and 1,701 in 1923. On only one other occasion, in 1912, has the number of births exceeded 1,700. The birth rate for 1925 per 1,000 of mean population was 56.30 as against 55.38 in 1924 and 50.49 in 1923.
The following table shows the numbers and rates for the last three years:—
| BIRTHS IN WESTERN SAMOA, 1923–25. | ||||
|---|---|---|---|---|
| Year. | Number of Native Samoan Births registered. | Rate per 1,000 of Native Samoan Population. | ||
| Males. | Females. | Total. | ||
| 1923 | 858 | 843 | 1,701 | 50.49 |
| 1924 | 964 | 936 | 1,900 | 55.38 |
| 1925 | 1,045 | 988 | 2,033 | 56.30 |
During the year 1925, 119 children were born to Europeans and 1 to a Melanesian.
MARRIAGE may be solemnized in New Zealand only on the authority of a Registrar's certificate, either by a person whose name is on the list of officiating ministers under the Marriage Act, or before a duly appointed Registrar or Deputy Registrar of Marriages. Marriage by an officiating minister can be solemnized only between 8 o'clock in the forenoon and 8 o'clock in the evening. Marriage before a Registrar can be celebrated at any time during the hours the office of the Registrar is open for the transaction of public business. Prior to the passing of the Marriage Amendment Act, 1920, the limits in all cases were 8 a.m. and 4 p.m.
Notice of intended marriage must be given to a Registrar of Marriages by one of the parties to the proposed marriage, and one of the parties must have resided for three full days in the district within which the marriage is to be solemnized. In the case of a person under twenty-one, not being a widow or widower, the consent of parent or guardian is necessary before the Registrar's certificate can be issued Provision exists for application to a Judge of the Supreme Court in cases where a parent or guardian is non compos mentis, or unreasonably or from undue motives refuses or withholds consent.
If a declaration is made in any case that there is no parent or lawful guardian resident in the Dominion, then a certificate may be issued after the expiration of fourteen days following the date on which the notice of intended marriage was given.
The ages at which persons may contract binding marriages are the same as in England—twelve years for females and fourteen for males. Marriage may be contracted at earlier ages than those stated, but would be voidable at the discretion of either of the parties upon reaching the age of twelve or fourteen, as the case may be, and without the necessity of proceedings in Court.
The system of notice and certificate has obtained in New Zealand since 1855. By this system it is ensured not only that marriages are in order, but that no legally solemnized marriage escapes registration. Officiating ministers and Registrars are required to send to the Registrar-General returns of all marriages solemnized, and as the returns come in they are checked off with the entries in the Registrars' lists of notices received and certificates issued. In case of the non-arrival of a marriage return corresponding to any entry in the list of notices, inquiries are made as to whether solemnization has been effected.
The marriage of a man with his deceased wife's sister was legalized in New Zealand in the year 1881, and the marriage of a woman with her deceased husband's brother in 1901.
An important provision is contained in section 7 of the Marriage Amendment Act, 1920, which reads as follows:—
Every person commits an offence against this Act, and is liable on summary conviction to a fine of one hundred pounds, who—
Alleges, expressly or by implication, that any persons lawfully married are not truly and sufficiently married; or
Alleges, expressly or by implication, that the issue of any lawful marriage is illegitimate or born out of true wedlock.
“Alleges” in this section means making any verbal statement, or publishing or issuing any printed or written statement, or in any manner authorizing the making of any verbal statement, or in any manner authorizing or being party to the publication or issue of any printed or written statement.
A person shall not be deemed to make an allegation contrary to the provisions of this section by reason only of using in the solemnization of a marriage a form of marriage service which at the commencement of this Act was in use by the religious denomination to which such person belongs, or by reason only of the printing or issue of any book containing a copy of a form of marriage service in use at the commencement of this Act by any religious denomination.
The movement of the marriage-rate since 1855 is shown by the diagram on p. 114. The numbers and rates of marriages during each of the last twenty years are here given: —
| Year. | Number. | Rate per 1,000 of Population. |
|---|---|---|
| 1906 | 7,592 | 8.48 |
| 1907 | 8,192 | 8.91 |
| 1908 | 8,339 | 8.82 |
| 1909 | 8,094 | 8.33 |
| 1910 | 8,236 | 8.30 |
| 1911 | 8,825 | 8.70 |
| 1912 | 9,149 | 8.81 |
| 1913 | 8,813 | 8.25 |
| 1914 | 9,280 | 8.51 |
| 1915 | 10,028 | 9.12 |
| 1916 | 8,213 | 7.47 |
| 1917 | 6,417 | 5.84 |
| 1918 | 6,227 | 5.65 |
| 1919 | 9,519 | 8.33 |
| 1920 | 12,175 | 10.21 |
| 1921 | 10,635 | 8.69 |
| 1922 | 9,556 | 7.63 |
| 1923 | 10,070 | 7.90 |
| 1924 | 10,259 | 7.90 |
| 1925 | 10,419 | 7.84 |
The normal tendency towards a gradual increase in the marriage-rate was disturbed by the war. Taking the years seriatim, 1914 is little affected, the influences being of a counterbalancing nature. The succeeding year, 1915, in spite of the increasing diminution in the number of males of marriageable age, established a new record in point of number of marriages and—by comparison with the previous half-century—of rate also. This may be regarded as resulting almost wholly from the passing of the National Registration Act in 1915, and the desire of many men to be shown in the register as married, with a view to obtaining certain advantages or escaping certain obligations. Many marriages which would ordinarily have taken place in later years were thus celebrated in 1915. The result was to adversely affect the marriage-rate in 1916. The Military Service Act of 1916, which took into account only marriages taking place before May, 1915, had a further depressing influence. The absence of a large and increasing proportion of the men of marriageable age was felt 3till more severely in 1917 and 1918. In 1917 the rate descended to a level never previously reached, and in 1918 reached an even lower position.
With the cessation of hostilities at the end of 1918, and the return of the troops in 1919, a great increase in the marriage-rate set in. Many of the Dominion's soldiers had married while abroad, and apparently thousands more married shortly after their return to New Zealand, the marriages in 1919 being over 50 per cent. in excess of those for 1918, with a further huge increase in 1920, which year easily holds the record for number of marriages, and has the highest rate since 1864.
The high numbers and rates experienced in 1920 continued into the early months of 1921, but a falling-off then occurred, presumably due in the main to adverse economic conditions. A slight improvement was shown for the latter half of 1922 and continued during 1923 and 1924, but there was a further slight decline in 1925. The rates for all four years are low by comparison with the decennium immediately preceding the war.
In a country like New Zealand, where the age-constitution of the population has altered considerably, the crude marriage-rate based on the total population does not disclose the true position over a period of years. Even if only the unmarried (including widowed and divorced) population over twenty in the case of men and over fifteen in the case of women be taken into account, the rates so ascertained would still not be entirely satisfactory for comparative purposes, owing to differences in sex and age constitution, divergences between rates for different age-groups, and variations in the proportions of marriageable persons in the community. A better plan is to ascertain the rate among unmarried females in each age-group and to standardize the results on the basis of the distribution of the unmarried female population in a basic year.
This has been done for each census year from 1881 to 1921, the year 1911 being taken as the standard. The course of the standardized rates as shown in the following table varies materially from that of the crude rates:—
| Year | Marriage-rate per 1,000. | Index Numbers of Marriage-rates taking 1911 as base = 100. | ||||
|---|---|---|---|---|---|---|
| Total Population. | Unmarried Female Population 15 and over. | Total Population. | Unmarried Female Population 15 and over. | |||
| Crude. | Standardized. | Crude. | Standardized. | |||
| 1881 | 6.6 | 73.9 | 80.7 | 76 | 125 | 137 |
| 1886 | 6.0 | 55.1 | 60.4 | 69 | 93 | 102 |
| 1891 | 6.0 | 48.3 | 50.3 | 69 | 82 | 85 |
| 1896 | 6.8 | 47.3 | 48.0 | 78 | 80 | 81 |
| 1901 | 7.8 | 50.2 | 49.0 | 90 | 85 | 83 |
| 1906 | 8.5 | 55.6 | 53.7 | 98 | 94 | 91 |
| 1911 | 8.7 | 59.1 | 59.1 | 100 | 100 | 100 |
| 1916 | 7.5 | 50.7 | 54.3 | 86 | 86 | 92 |
| 1921 | 8.7 | 59.7 | 63.9 | 100 | 101 | 108 |
The index numbers of the three classes of rates over the series of years enable the effect of standardization to be shown at a glance. Comparing, for instance, the years 1881 and 1911, it is seen that whereas the crude rate per 1,000 of total population was nearly one-fourth less in 1881 than in 1911, the crude rate when only the unmarried female population of fifteen or over is considered was one-fourth greater, and the standardized rate more than one-third greater. Similar though less noticeable results are recorded for years subsequent to 1881.
Taking the standardized rates as a test, the true marriage-rate is shown to have fallen heavily between 1881 and 1896, and to have risen thereafter, the tendency to rise, however, being temporarily disturbed by the war.
A comparison of the marriage-rate for each State of the Australian Commonwealth with New Zealand for the ten years 1916–25 is given. For several years prior to 1919 the Commonwealth rate had been higher than that of this country, but was lower than the New Zealand rate in four of the next five years. The rates for the two countries have corresponded very closely in each of the last three years, during which there has been very little movement.
| MARRIAGES PER 1,000 OF MEAN POPULATION IN AUSTRALIA AND NEW ZEALAND. | ||||||||
|---|---|---|---|---|---|---|---|---|
| Year. | Queensland. | New South Wales. | Victoria. | South Australia. | Western Australia. | Tasmania. | Commonwealth. | New Zealand. |
| 1916 | 7.60 | 8.62 | 8.02 | 8.45 | 7 56 | 7.37 | 8.14 | 7.47 |
| 1917 | 7.13 | 6.96 | 6.73 | 7.36 | 5.30 | 5.86 | 6.80 | 5.84 |
| 1918 | 6.88 | 6.79 | 6.43 | 7.07 | 5.23 | 5.71 | 6.59 | 5.65 |
| 1919 | 7.51 | 7.91 | 7.95 | 8.23 | 6.86 | 7.38 | 7.80 | 8.38 |
| 1920 | 8.94 | 9.75 | 9.85 | 10.03 | 8.88 | 9.50 | 9.62 | 10.21 |
| 1921 | 7.82 | 8.78 | 8.90 | 8.82 | 7.96 | 7.82 | 8.59 | 8.69 |
| 1922 | 7.52 | 8.18 | 8.27 | 8.19 | 7.20 | 7.79 | 8.03 | 7.63 |
| 1923 | 7.24 | 8.00 | 8.16 | 7.92 | 6.82 | 7.39 | 7.83 | 7.90 |
| 1924 | 7.55 | 8.11 | 8.10 | 7.78 | 7.22 | 7.12 | 7.90 | 7.90 |
| 1925 | 7.60 | 8.14 | 8.00 | 7.82 | 7.46 | 7.05 | 7.91 | 7.84 |
A comparison of the latest available rates in various countries is given in the next table. During the war, probably owing to their distance from the scene of operations, Australia and New Zealand had their rates more seriously interfered with than was the case even with other combatant countries, but have now regained the high positions in the list which they held in pre-war years. The rates of some of the principal European countries are inflated as a result of the large number of belated marriages that were solemnized in 1919 and 1920.
| MARRIAGE-RATES OF VARIOUS COUNTRIES. | ||
|---|---|---|
| Country. | Quinquennium. | Average Yearly Rate. |
* Excluding Quebec. | ||
| Hungary | 1919–23 | 12.7 |
| Belgium | 1919–23 | 12.1 |
| Austria | 1919–23 | 11.7 |
| Germany | 1920–24 | 10.8 |
| Czecho-Slovakia | 1920–24 | 10.7 |
| Italy | 1919–23 | 10.5 |
| France | 1921–25 | 9.7 |
| Japan | 1920–24 | 9.1 |
| Netherlands | 1920–24 | 8.6 |
| South Africa | 1919–23 | 8.6 |
| Denmark | 1919–23 | 8.2 |
| Australia | 1921–25 | 8.1 |
| New Zealand | 1921–25 | 8.0 |
| Switzerland | 1920–24 | 8.0 |
| England and Wales | 1921–25 | 7.9 |
| Canada* | 1920–24 | 7.8 |
| Spain | 1919–23 | 7.8 |
| Scotland | 1921–25 | 7.1 |
| Portugal | 1917–21 | 7.0 |
| Finland | 1920–24 | 6.8 |
| Sweden | 1920–24 | 6.6 |
| Norway | 1920–24 | 6.5 |
| Chile | 1919–23 | 6.5 |
| Northern Ireland | 1920–24 | 6.5 |
| British Guiana | 1920–24 | 6.2 |
| Iceland | 1919–23 | 6.0 |
| Ceylon | 1920–24 | 5.6 |
| Uruguay | 1919–23 | 5.2 |
| Trinidad | 1920–24 | 5.2 |
| Costa Rica | 1919–23 | 5.0 |
| Irish Free State | 1920–24 | 4.9 |
| Jamaica | 1920–24 | 3.9 |
It is interesting to dissect the year into shorter periods and to notice the fluctuations of the marriage totals. The following table shows the number of marriages solemnized during each quarter of the last ten years:—
| MARRIAGES IN EACH QUARTER, 1916–25. | ||||
|---|---|---|---|---|
| Year. | March Quarter. | June Quarter. | September Quarter. | December Quarter. |
| 1916 | 2,214 | 2,393 | 1,773 | 1,833 |
| 1917 | 1,511 | 1,805 | 1,505 | 1,596 |
| 1918 | 1,457 | 1,756 | 1,593 | 1,421 |
| 1919 | 1,631 | 2,432 | 2,450 | 3,006 |
| 1920 | 2,981 | 3,329 | 2,843 | 3,022 |
| 1921 | 2,872 | 2,849 | 2,330 | 2,584 |
| 1922 | 2,249 | 2,555 | 2,214 | 2,538 |
| 1923 | 2,406 | 2,760 | 2,224 | 2,680 |
| 1924 | 2,348 | 2,976 | 2,283 | 2,652 |
| 1925 | 2,526 | 2,822 | 2,363 | 2,708 |
| Decennial average | 2,219 | 2,568 | 2,158 | 2,404 |
It will be seen that the June quarter is apparently considered the most propitious for the solemnization of marriage. The two years exceptional in this respect are 1919 and 1921. The high figure for the December quarter, 1919, is explained by the celebration of many marriages postponed until the return of soldiers from abroad; while in 1921 the results for the March quarter showed promise of a continuation of the standard set in 1920, but the adverse financial and economic conditions evidently caused a falling-off in marriages after Easter.
The Easter and Christmas seasons are apparently regarded as the most suitable times of the year for entering the matrimonial state, and, judging by the quarterly figures for an average year, Easter would appear to slightly predominate. In 1919 however, 1,282 marriages were celebrated in December, as against only 932 in April, the explanation of this being, of course, the fact that it was not until the latter portion of 1919 that the effect of the return of men from the war was felt. In each of the last three years April has led by a small margin over December.
The marriages contracted in each month of 1923, 1924, and 1925 were as follows:—
| 1923. | 1924. | 1925. | |
|---|---|---|---|
| January | 810 | 800 | 784 |
| February | 772 | 757 | 787 |
| March | 824 | 791 | 790 |
| April | 1,150 | 1,333 | 1,294 |
| May | 646 | 640 | 565 |
| June | 964 | 1,003 | 998 |
| July | 743 | 788 | 798 |
| August | 768 | 731 | 804 |
| September | 713 | 764 | 797 |
| October | 814 | 742 | 804 |
| November | 771 | 720 | 767 |
| December | 1,095 | ,190 | 1,231 |
| Totals | 10,095 | 10,259 | 10,419 |
Wednesday claims three-sevenths of the total marriages, as will be seen from the following figures:—
| 1923. | 1924. | 1925. | |
|---|---|---|---|
| Sunday | 48 | 57 | 46 |
| Monday | 1,220 | 1,226 | 1,143 |
| Tuesday | 1,530 | 1,690 | 1,643 |
| Wednesday | 4,266 | 4,446 | 4,500 |
| Thursday | 1,484 | 1,310 | 1,459 |
| Friday | 478 | 454 | 436 |
| Saturday | 1,044 | 1,076 | 1,192 |
| Totals | 10,070 | 10,259 | 10,419 |
Sunday marriages are rare, and Friday is evidently regarded as unlucky, as only 4 par cont. of the total marriages were celebrated on that day.
The 13th of the month also appears to be treated with respect, the average number of marriages on that day during 1925 being only 18, as against a general average of 29. The average given for 1925 may be taken as being considerably higher than usual, owing to Easter Monday falling on the 13th April and thereby raising the average by at least 6 points. As further evidence it may be mentioned that whereas Easter Monday usually ranks among the first three as regards number of marriages celebrated, the before-mentioned fact was responsible for it dropping to the eleventh position. The days of the year 1925 on which 100 marriages or over were performed were—
| 15th April | 164 |
|---|---|
| 23rd December | 158 |
| 8th April | 134 |
| 3rd June | 125 |
| 30th December | 124 |
| 29th April | 117 |
| 10th June | 116 |
| 17th June | 112 |
| 24th June | 104 |
| 25th March | 104 |
| 13th April | 103 |
| 22nd April | 103 |
| 26th August | 103 |
| 14th October | 102 |
| 14th January | 100 |
All the days on which more than 80 marriages were celebrated were Wednesdays, with the exception of Easter Monday (mentioned above) and of Tuesday, the 24th February, and Thursday, the 9th March, which had 89 and 91 marriages respectively.
The table which follows gives information as to the conjugal condition of persons married in each of the last ten years.
| Year. | Marriages between Bachelors and | Marriages between Divorced Men and | Marriages between Widowers and | ||||||
|---|---|---|---|---|---|---|---|---|---|
| Spinsters. | Divorced Women. | Widows. | Spinsters | Divorced Women. | Widows. | Spinsters | Divorced Women. | Widows. | |
| 1916 | 7,138 | 102 | 316 | 73 | 10 | 13 | 386 | 22 | 153 |
| 1917 | 5,439 | 100 | 268 | 64 | 10 | 16 | 351 | 18 | 151 |
| 1918 | 5,157 | 86 | 268 | 118 | 9 | 16 | 404 | 23 | 146 |
| 1919 | 8,079 | 154 | 372 | 88 | 16 | 31 | 532 | 40 | 207 |
| 1920 | 10,328 | 208 | 529 | 181 | 19 | 48 | 591 | 58 | 213 |
| 1921 | 9,000 | 196 | 421 | 178 | 26 | 36 | 538 | 58 | 182 |
| 1922 | 8,018 | 199 | 364 | 170 | 54 | 37 | 474 | 43 | 197 |
| 1923 | 8,479 | 208 | 381 | 180 | 40 | 40 | 489 | 53 | 200 |
| 1924 | 8,708 | 217 | 337 | 199 | 27 | 39 | 473 | 60 | 199 |
| 1925 | 8,813 | 234 | 336 | 205 | 38 | 60 | 471 | 57 | 205 |
The figures reveal considerable increases in the numbers of widowed and divorced persons remarrying. Out of every 1,000 persons married in 1915, 11 were divorced and 54 widowed, the corresponding figures for 1925 being 30 and 64 respectively. The increase in the one case is a reflex of the large number of divorce cases since the war, while as regards widowers and widows the obvious explanation lies in the war and the influenza epidemic.
Taking the whole period covered by the table it is found that while 2,041 divorced men remarried, the corresponding number for women was 2,385. In the case of widowed persons, however, in spite of the fact that the number of widows caused by the war and the epidemic must greatly have exceeded the widowers caused by the latter, only 5,781 widows remarried, as compared with 6,994 widowers. It would appear that in the case of divorced persons women are more likely to remarry than men, while in the case of widowers and widows the converse holds.
Included amongst widows in 1925 were eleven women and amongst the widowers nine men, who elected to go through the form of marriage with other persons under the protection of the provisions of section 224, subsection (5), of the Crimes Act, which reads: “No one commits bigamy by going through a form of marriage if he or she has been continually absent from his or her wife or husband for seven years then last past, and is not proved to have known that his wife or her husband was alive at any time during those seven years.”
The numbers of persons married under the protection of the above subsection during the last ten years are as shown in the following table:—
| Year. | Hales. | Females. | Total. |
|---|---|---|---|
| 1916 | 2 | 11 | 13 |
| 1917 | 8 | 21 | 29 |
| 1918 | 3 | 11 | 14 |
| 1919 | 17 | 18 | 29 |
| 1920 | 5 | 15 | 20 |
| 1921 | 7 | 16 | 23 |
| 1922 | 5 | 9 | 14 |
| 1923 | 4 | 9 | 13 |
| 1924 | 8 | 18 | 26 |
| 1925 | 9 | 11 | 20 |
Of the persons married in 1925, 366 bridegrooms and 1,831 brides were under Twenty-one years of age. Of the bridegrooms, 10 were between seventeen and eighteen, a between eighteen and nineteen. Of the brides, 3 were between fourteen and fifteen, 10 between fifteen and sixteen, and 64 between sixteen and seventeen years of age. A table is given showing relative ages of bridegrooms and brides in groups of years.
| AGES OF PERSONS MARRIED, 1925. | ||||||||
|---|---|---|---|---|---|---|---|---|
| Age of Bridegroom, in Years. | Age of Bride, in Years. | Total Bride-grooms. | ||||||
| Under 21. | 21 and under 25. | 25 and under 30. | 30 and under 35. | 35 and under 40. | 40 and under 45. | 45 and over. | ||
| Under 21 | 251 | 101 | 12 | 2 | .. | .. | .. | 366 |
| 21 and under 25 | 373 | 1,470 | 381 | 49 | 4 | 1 | .. | 2,778 |
| 25 ,, 30 | 497 | 1,521 | 1,127 | 217 | 34 | 7 | .. | 3,403 |
| 30 ,, 35 | 134 | 496 | 553 | 315 | 83 | 32 | 1 | 1,614 |
| 35 ,, 40 | 51 | 164 | 245 | 215 | 143 | 54 | 14 | 886 |
| 40 ,, 45 | 16 | 60 | 99 | 120 | 124 | 88 | 36 | 543 |
| 45 and over | 9 | 31 | 66 | 112 | 137 | 170 | 304 | 829 |
| Total brides | 1,831 | 3,843 | 2,483 | 1,030 | 525 | 352 | 355 | 10,419 |
The following are the proportions of men and women married at each age-period to every 100 marriages in the years 1905, 1915, and 1925: —
| Age, in Years. | 1905. | 1915. | 1925. | |||
|---|---|---|---|---|---|---|
| Males. | Females. | Males. | Females. | Males. | Females. | |
| Under 21 | 1.85 | 16.86 | 2.08 | 15.08 | 3.51 | 17.57 |
| 21 and under 25 | 23.89 | 38.43 | 23.33 | 35.99 | 26.66 | 36.88 |
| 25 ,, 30 | 40.04 | 27.93 | 37.43 | 27.56 | 32.66 | 23.83 |
| 30 ,, 35 | 17.64 | 9.85 | 19.38 | 10.96 | 15.49 | 9.89 |
| 35 ,, 40 | 8.90 | 3.61 | 8.84 | 5.53 | 8.51 | 5.04 |
| 40 ,, 45 | 3.18 | 1.49 | 3.79 | 2.35 | 5.21 | 3.38 |
| 45 and over | 4.50 | 1.83 | 5.15 | 2.53 | 7.96 | 3.41 |
| 100.00 | 100.00 | 100.00 | 100.00 | 100.00 | 100.00 | |
Taking the brides first, the figures reveal a tendency for women to marry somewhat later in life now than formerly, a tendency, however, much more noticeable in the ten years 1905–15 than in the next decennium. Probably the most noticeable feature in regard to the bridegrooms is the heavy fall between 1915 and 1925 in the percentage for the age-groups 25–30 and 30–35, a direct result of war losses, which were mainly among men who would now have been in these age-groups. The group 21–25, which fell between 1905 and 1915, has risen substantially above its former level.
In the years immediately preceding the war 62 per cent. of the bridegrooms were under thirty years of age, a proportion which declined rapidly during the period 1916–19. A glance at the figures for 1924 and 1925 shows that this proportion has now been regained mainly owing to the great improvement in the number of marriages under twenty-five years.
| PERCENTAGES OF BRIDEGROOMS UNDER THIRTY YEARS OF AGE, 1916–25. | ||||
|---|---|---|---|---|
| Year. | Under 21. | 21 and under 25. | 25 and under 30. | Total under 30. |
| 1916 | 1.96 | 23.07 | 34.51 | 59.54 |
| 1917 | 3.58 | 21.63 | 31.17 | 56.38 |
| 1918 | 5.06 | 19.50 | 30.62 | 55.18 |
| 1919 | 3.62 | 19.49 | 31.45 | 54.56 |
| 1920 | 2.64 | 21.61 | 32.67 | 56.92 |
| 1921 | 3.00 | 24.40 | 32.43 | 59.83 |
| 1922 | 3.06 | 25.02 | 31.86 | 59.94 |
| 1923 | 3.23 | 25.48 | 32.13 | 60.84 |
| 1924 | 3.74 | 26.78 | 31.94 | 62.46 |
| 1925 | 3.51 | 26.66 | 32.66 | 62.83 |
For many years the average age at marriage for both males and females, more particularly the latter, showed a tendency to increase. After, however, reaching its maximum in the three years 1917, 1918, and 1919, the average age has since decreased considerably, in spite of the effect of the increase in the proportion of widowed and divorced persons among the brides and grooms. The figures for each of the last twenty years are given.
| MEAN AGE AT MARRIAGE. | ||
|---|---|---|
| Year. | Mean Age of Bridegrooms. | Mean Age of Brides. |
| 1906 | 29.76 | 25.97 |
| 1907 | 29.83 | 26.07 |
| 1908 | 29.86 | 26.11 |
| 1909 | 30.11 | 26.40 |
| 1910 | 29.91 | 26.32 |
| 1911 | 30.12 | 26.48 |
| 1912 | 29.95 | 26.39 |
| 1913 | 30.15 | 26.42 |
| 1914 | 30.09 | 26.69 |
| 1915 | 30.03 | 26.56 |
| 1916 | 30.64 | 26.77 |
| 1917 | 31.19 | 27.07 |
| 1918 | 31.57 | 27.16 |
| 1919 | 31.21 | 27.11 |
| 1920 | 30.73 | 26.89 |
| 1921 | 30.69 | 26.72 |
| 1922 | 30.49 | 26.83 |
| 1923 | 30.49 | 26.74 |
| 1924 | 30.24 | 26.56 |
| 1925 | 30.39 | 26.56 |
The average ages of bachelors and spinsters at marriage are considerably lower than those shown above, which cover all parties and are adversely affected by the inclusion of remarriages of widowed and divorced persons. The average ages of grooms and brides of the various conditions in 1924 and 1925 were—
| Bridegrooms. | Years. | |
|---|---|---|
| 1924. | 1925. | |
| Bachelors | 28.64 | 28.70 |
| Divorced | 40.92 | 41.67 |
| Widowers | 46.49 | 47.39 |
| Spinsters | 25.37 | 25.26 |
| Divorced | 35.37 | 36.42 |
| Widows | 41.35 | 41.68 |
The foregoing figures give the average age at marriage, but these do not correspond with the popular age, if the age at which the most marriages are celebrated may be so termed. For several years prior to 1918 age 26 held pride of place for bridegrooms and age 21 for brides. The latter has continued right through to 1925 without alteration, but in the case of bridegrooms an alteration to age 28 occurred in 1918, followed by a return to 26 and 27 (equal) in 1919. In 1920 the most popular age for bridegrooms fell to 25, and in 1921 to 24, where it remained until 1925, when the figure rose once more to 25. The median age for all bridegrooms in 1925 was 27—bachelors 26—while for all brides the figure was 24—spinsters 23.
Of every 1,000 men married in 1925, thirty-five were under twenty-one years of age, while 176 in every 1,000 brides were under twenty-one. The proportion of bridegrooms under twenty-one was in normal pre-war years 2 per cent. of the total number. The proportions from 1917 onwards, particularly 1918 (5.06 per cent.), shown in the following table, therefore represent a high increase in marriages of male minors.
| BRIDEGROOMS AND BRIDES UNDER AND OVER TWENTY-ONE, 1916–25. | ||||||
|---|---|---|---|---|---|---|
| Year. | Bridegrooms. | Brides. | Minors, per 100 Marriages. | |||
| Adults. | Minors. | Adults. | Minors. | Bridegrooms. | Brides. | |
| 1916 | 8,052 | 161 | 6,943 | 1,270 | 1.96 | 15.46 |
| 1917 | 6,187 | 230 | 5,343 | 1,074 | 3.58 | 16.74 |
| 1918 | 5,912 | 315 | 5,266 | 961 | 5.06 | 15.43 |
| 1919 | 9,175 | 344 | 8,247 | 1,272 | 3.61 | 13.36 |
| 1920 | 11,854 | 321 | 10,497 | 1,678 | 2.64 | 13.78 |
| 1921 | 10,316 | 319 | 8,951 | 1,684 | 3.00 | 15.84 |
| 1922 | 9,264 | 292 | 8,028 | 1,528 | 3.06 | 15.99 |
| 1923 | 9,745 | 325 | 8,417 | 1,653 | 3.23 | 16.42 |
| 1924 | 9,875 | 384 | 8,422 | 1,837 | 3.74 | 17.91 |
| 1925 | 10,053 | 366 | 8,588 | 1,831 | 3.51 | 17.57 |
Of the 10,419 marriages registered in 1925, Church of England clergymen officiated at 2,840, Presbyterians at 2,729, Methodists at 1,031, and Roman Catholics at 1,181, while 2,156 marriages were celebrated before Registrars.
The following table shows the proportions of marriages by ministers of the principal denominations in the last eight years: —
| Denomination. | Percentage of Marriages. | |||||||
|---|---|---|---|---|---|---|---|---|
| 1918. | 1919. | 1920. | 1921. | 1922. | 1923. | 1924. | 1925. | |
| Church of England | 25.36 | 27.26 | 28.57 | 28.58 | 27.36 | 28.33 | 27.68 | 27.26 |
| Presbyterian | 24.09 | 25.87 | 27.06 | 26.00 | 25.81 | 25.77 | 25.81 | 26.19 |
| Methodist | 11.22 | 11.70 | 10.35 | 10.97 | 10.82 | 10.79 | 11.03 | 9.90 |
| Roman Catholic | 11.19 | 11.08 | 11.08 | 11.30 | 12.04 | 10.93 | 10.79 | 11.33 |
| Other denominations | 5.06 | 5.17 | 5.33 | 5.41 | 4.98 | 4.91 | 4.96 | 4.63 |
| Before Registrars | 23.08 | 18.92 | 17.61 | 17.74 | 18.99 | 19.27 | 19.73 | 20.69 |
| 100.00 | 100.00 | 100.00 | 10000 | 100.00 | 100.00 | 100.00 | 100.00 | |
The foregoing figures must not be taken as a true indication of the religions of the parties married, as it does not necessarily follow that both parties are members of the Church whose officiating minister performed the ceremony, and persons married before Registrars may belong, in greater or lesser proportion, to any of the denominations. It will be noted that the proportion of marriages by Registrars rose to a high level in 1917 and 1918, but fell sharply in 1919, gradually rising, however, after 1920.
The number of names on the list of officiating ministers under the Marriage Act is (June, 1926) 1,929, and the denominations to which they belong are shown hereunder:—
| Denomination. | Number. |
|---|---|
| Church of England | 470 |
| Presbyterian Church of New Zealand | 399 |
| Roman Catholic Church | 296 |
| Methodist Church of New Zealand | 285 |
| Salvation Army | 158 |
| Baptists | 68 |
| Congregational Independents | 34 |
| Lutheran Church | 3 |
| Evangelical Lutheran Concordia Conference | 3 |
| Hebrew Congregations | 6 |
| Church of Christ | 29 |
| Catholic Apostolic Church | 3 |
| Liberal Catholic Church | 7 |
| Unitarians | 4 |
| United Evangelical Church | 4 |
| Seventh-day Adventists | 11 |
| Latter-day Saints | 10 |
| Spiritualist Church of New Zealand | 6 |
| Ringatu Church | 6 |
| Church of the Seven Rules of Jehovah | 6 |
| Ratana Church of New Zealand | 103 |
| Others | 18 |
| Total | 1,929 |
The Ringatu Church, the Church of the Seven Rules of Jehovah, and the Ratana Church of New Zealand are Maori denominations.
In cases where both parties to a marriage are of the Native race there is no necessity under the Marriage Act to comply with the provisions of that Act, though the parties are at liberty to take advantage thereof. Considerable inconvenience, however, was found to exist on account of the non-registration of Maori marriages, and a section was inserted in the Native Land Act, 1909, whereby it was laid down that Maori marriages must be celebrated either under the provisions of the Marriage Act or in the presence of a registered officiating minister, but without complying with the other requirements of the Marriage Act. Ministers solemnizing the latter class of marriages must send returns to the Registrar-General.
Returns of 398 marriages in which both parties were of the Native race were received during the year 1925. Of these, 42 were in accordance with the provisions of the Marriage Act. The figures for each of the last ten years are as follows: —
| MAORI MARRIAGES, 1916–25. | |||
|---|---|---|---|
| Year. | Under Native Land Act. | Under Marriage Act. | Total. |
| 1916 | 172 | 9 | 181 |
| 1917 | 205 | 48 | 253 |
| 1918 | 197 | 26 | 223 |
| 1919 | 181 | 40 | 221 |
| 1920 | 198 | 55 | 253 |
| 1921 | 212 | 36 | 248 |
| 1922 | 248 | 30 | 278 |
| 1923 | 262 | 20 | 282 |
| 1924 | 195 | 48 | 243 |
| 1925 | 356 | 42 | 398 |
The large increase in the number of marriages registered in 1925 in comparison with preceding years is probably due less to an actual increase in the number celebrated than to a greater recognition among Maori ministers of the importance of furnishing returns. Even with the large apparent increase the rate for 1925 is only 7.28 per 1,000 of Maori population, as compared with a rate of 7.84 per 1,000 among the non-Maori population. Maori marriages are not included in the numbers shown elsewhere in this subsection, nor are they taken into account in the computation of marriage-rates.
According to the annual report of the Cook Islands Department, the following are the figures of marriages solemnized in the Cook Islands during the twelve months ended 31st December, 1925, or 31st March, 1926: —
| MARRIAGES IN COOK ISLANDS, 1925–26. | |
|---|---|
| Island. | Number of Marriages. |
| Rarotonga | 54 |
| Aitutaki | 13 |
| Mangaia | 7 |
| Mauke | 4 |
| Atiu | 3 |
| Manihiki | 3 |
| Penrhyn | 4 |
| Rakaanga | 5 |
| Pukapuka | 5 |
| Niue | 41 |
| Total | 139 |
The remaining islands of the group either had no marriages or did not furnish returns.
During the twelve months ended 31st December, 1925, 888 marriages were recorded in the mandated territory of Western Samoa. Of these, 34 were between members of the European population, and in one case the bridegroom was a Melanesian labourer, the balance of the marriages being between native Samoans.
COMPULSORY registration of deaths was instituted in New Zealand in 1855. As in the case of births, a system of non-compulsory registration had obtained since 1848.
Until the year 1876 the only information provided for in the death-registration entry was as to date, place, and cause of death, and name, sex, age, and occupation of deceased. The Registration of Births and Deaths Act, 1875, required information to be recorded as regards parentage, conjugal condition, and issue of deceased. Particulars as to burial had also to be entered, as well as more detailed information regarding cause of death. Subsequent amendments to the Act have made it requisite to give additional information concerning issue, and, in the case of married males, age of widow.
Every death occurring in New Zealand should be registered within three days after the day of the death if in a city or borough, or seven days in any other case. There is a penalty up to £10 for neglect, the undertaker in charge of the funeral being solely responsible for registration. Prior to 1913 the undertaker was primarily looked to for registration, but, in addition, the occupier of the house and every other person present at death were also responsible parties.
The law does not impose any limit of time after which a death may not be registered as it does in the case of a birth. It is not necessary to effect a death-registration entry in the case of a still-born child.
Any person burying or permitting or taking part in the burial of the body of any deceased person without a certificate of cause of death signed by a duly registered medical practitioner, a Coroner's order to bury the body, or a Registrar's certificate of registration of the death, renders himself liable to a fine of £10.
The following table shows the number of deaths and the death-rate per 1,000 of the mean population during each of the last twenty years:—
| Year. | Number. | Rate per 1,000 |
|---|---|---|
| 1906 | 8,339 | 9.31 |
| 1907 | 10,066 | 10.95 |
| 1908 | 9,043 | 9.57 |
| 1909 | 8,989 | 9.22 |
| 1910 | 9,630 | 9.71 |
| 1911 | 9,534 | 9.39 |
| 1912 | 9,214 | 8.87 |
| 1913 | 10,119 | 9.47 |
| 1914 | 10,148 | 9.31 |
| 1915 | 9,965 | 9.06 |
| 1916 | 10.596 | 9.64 |
| 1917 | 10,528 | 9.58 |
| 1918 | 16,364 | 14.84 |
| 1919 | 10,808 | 9.46 |
| 1920 | 12,109 | 10.15 |
| 1921 | 10,682 | 8.73 |
| 1922 | 10,977 | 8.77 |
| 1923 | 11,511 | 9.03 |
| 1924 | 10,767 | 8.29 |
| 1925 | 11,026 | 8.29 |
The death-rate for the year 1925 is identical with that for 1924, the rate for these two years (8.29 per 1,000 of population) being the lowest ever recorded in the Dominion. The succession of extremely low rates year by year since 1920 would appear to indicate that a new level has been reached, lower than would a few years ago have been considered possible, with the age-constitution of the population ever increasing.
The fall in the birth-rate (resulting in there being less infants at risk relatively to total population) combined with the fall in the rate of infantile mortality, is largely responsible for the position disclosed by the crude death-rate figures. As will be seen farther on, however, there has been an actual fall in the already low standardized rate, which is not affected by the fall in the birth-rate, though it is very materially affected by the decline in the rate of infantile mortality.
The death-rates of males and females for the last ten years are shown separately in the next table, also the number of male deaths to every 100 female deaths, and the death-rate of males expressed as an index number of the female rate, taking the latter as equal to 100.
| Year. | Deaths per 1,000 of the Total Population. | Male Deaths to every 100 Female Deaths. | Male Rate expressed as Index Number of Female Rate ( = 100). | ||
|---|---|---|---|---|---|
| Males. | Females. | Total. | |||
| 1916 | 11.14 | 8.13 | 9.64 | 138 | 138 |
| 1917 | 11.09 | 8.09 | 9.58 | 134 | 137 |
| 1918 | 18.03 | 11.77 | 14.84 | 147 | 153 |
| 1919 | 10.85 | 8.06 | 9.46 | 148 | 149 |
| 1920 | 11.11 | 9.15 | 10.15 | 127 | 121 |
| 1921 | 9.75 | 7.66 | 8.73 | 133 | 127 |
| 1922 | 9.60 | 7.90 | 8.77 | 127 | 122 |
| 1923 | 9.91 | 8.12 | 9.03 | 127 | 122 |
| 1924 | 9.22 | 7.32 | 8.29 | 131 | 126 |
| 1925 | 9.09 | 7.46 | 8.29 | 127 | 122 |
In normal times the excess of male over female population has the effect of showing a smaller variation between the death-rates for the two sexes than is indicated by a comparison of numbers of deaths. The withdrawal of a large number of males between the ages of 20 and 45 for military service overseas, however, reduced the male population without proportionately reducing the total of male deaths, the death-rate among persons of those ages being considerably less than for the whole population. Consequently there was during the war period an increase in the percentage of the male rate to the female, a position accentuated in 1918, and to a less extent in 1919, by the influenza epidemic, which exacted a heavier toll among males than among females.
An examination of the total number of deaths registered in each quarter of the years 1916–25 gives the following results:—
| Year. | March Quarter. | June Quarter. | September Quarter. | December Quarter. |
|---|---|---|---|---|
| 1916 | 2,542 | 2,585 | 2,959 | 2,510 |
| 1917 | 2,514 | 2,508 | 2,885 | 2,621 |
| 1918 | 2,118 | 2,447 | 3,265 | 8,534 |
| 1919 | 2,388 | 2,645 | 3,116 | 2,659 |
| 1920 | 2,466 | 2,923 | 3,600 | 3,120 |
| 1921 | 2,480 | 2,528 | 3,094 | 2,580 |
| 1922 | 2,398 | 2,686 | 3,278 | 2,615 |
| 1923 | 2,371 | 2,635 | 3,846 | 2,659 |
| 1924 | 2,385 | 2,572 | 3,032 | 2,778 |
| 1925 | 2,454 | 2,625 | 3,181 | 2,766 |
The huge total for December quarter, 1918, was due to the disastrous influenza epidemic which raged during that quarter. The large increase in September quarter of the year 1923 was also owing to influenza, a slight epidemic occurring during that period. The third quarter of the year invariably ranks highest in point of number, on account of the toll that the winter months take of people in advanced ages. March quarter has in recent years claimed the lowest number of deaths.
A classification according to date of death shows that in 1925 the most deaths occurred during the months of July, August, and September, with totals of 1,095, 1,064, and 1,021 respectively. Excluding December (the figures for which are incomplete on account of a proportion of deaths occurring in that month not being registered till January), February had the least number of deaths (758), followed by April and March with 802 and 806 respectively.
The least number of deaths on any one day, again excluding December, was 13 on the 21st March. The greatest number (52) occurred on the 27th August.
The deaths occurring during 1925 are tabulated below in single ages up to five years, and thereafter in groups, showing males and females separately:—
| Ages. | Males. | Females. | Total. |
|---|---|---|---|
| Under 1 month 434 | 310 | 744 | |
| 1–3 months 87 | 69 | 156 | |
| 3–6 ,, | 54 | 35 | 89 |
| 6–12 ,, | 64 | 72 | 136 |
| 1–2 years | 94 | 80 | 174 |
| 2–3 ,, | 68 | 56 | 124 |
| 3–4 ,, | 37 | 45 | 82 |
| 4–5 ,, | 33 | 26 | 59 |
| 5–10 ,, | 114 | 102 | 216 |
| 10–15 ,, | 85 | 73 | 158 |
| 15–20 ,, | 103 | 100 | 203 |
| 20–25 ,, | 149 | 120 | 269 |
| 25–30 ,, | 148 | 136 | 284 |
| 30–35 ,, | 154 | 163 | 317 |
| 35–40 ,, | 213 | 187 | 400 |
| 40–45 years | 269 | 201 | 470 |
| 45–50 ,, | 342 | 279 | 621 |
| 50–55 ,, | 333 | 270 | 603 |
| 55–60 ,, | 403 | 282 | 685 |
| 60–65 ,, | 398 | 332 | 730 |
| 65–70 ,, | 557 | 380 | 937 |
| 70–75 ,, | 576 | 401 | 977 |
| 75–80 ,, | 524 | 434 | 958 |
| 80–85 ,, | 500 | 380 | 880 |
| 85–90 ,, | 310 | 244 | 554 |
| 90–95 ,, | 90 | 63 | 153 |
| 95–100 ,, | 25 | 16 | 41 |
| 100 ,, | 1 | 2 | 3 |
| 101 ,, | 2 | .. | 2 |
| 104 ,, | .. | 1 | 1 |
| Totals | 6,167 | 4,859 | 11,026 |
A preponderance of males occurs in all quinquennial ape-groups, with the solitary exception of that covering ages 30 to 35. The male excess is also considerably diminished at other ages between 20 and 40, a period at which the effects of child-bearing are felt in the female numbers. The greatest excess of males occurs at ages 60 and over, in sympathy with the greater disparity between the numbers of male and female population at those ages.
Some remarkable changes in the age-distribution of persons dying have occurred during the last fifty years. The total deaths in 1925 were approximately twice as numerous as in 1875, but the number of deaths under one year in 1925 was only three-fifths of the corresponding number recorded in 1875. This is an eloquent tribute to the efficacy of the steps taken to preserve infant life (a subject which is dealt with later on in this subsection), as during the fifty years the annual number of births practically doubled itself.
Turning now to deaths at ages 80 and over, a remarkable difference between the earlier and later years covered by the figures is apparent. In 1875, deaths in this group numbered only 58, or just over 1 per cent. of the total of 5,712, while in 1925, 1,634 deaths over 80 years of age were recorded, this number representing nearly 15 per cent. of the total deaths in that year. In 1905 the corresponding percentage was only 7. The figures are a reflex of the changes in the age-constitution of the population, combined with the great improvement in the death-rate at the earlier ages.
Similar, though less pronounced, changes have occurred in the age-groups between 60 and 80 years, while the groups up to age 40 show results very similar to those for deaths under one year of age. The following table indicates the changes that have occurred over a period of fifty years in the numbers and proportions of deaths contributed by the various age-groups:—
| DEATHS BY AGE-GROUPS, 1875–1925. | ||||||||||
|---|---|---|---|---|---|---|---|---|---|---|
| Ages, in Years. | Number of Deaths. | Percentage to Total. | ||||||||
| 1875. | 1885. | 1895. | 1905. | 1925. | 1875. | 1885. | 1895. | 1905. | 1925. | |
| Under 1 | 1,816 | 1,756 | 1,637 | 1,599 | 1,125 | 32.05 | 28.90 | 23.88 | 19.84 | 10.20 |
| 1 and under 5 | 961 | 589 | 502 | 380 | 439 | 16.96 | 9.69 | 7.32 | 4.71 | 3.98 |
| 5 ,, 10 | 283 | 254 | 203 | 168 | 216 | 5.00 | 4.18 | 2.96 | 2.08 | 1.96 |
| 10 ,, 15 | 127 | 155 | 167 | 130 | 158 | 2.24 | 2.55 | 2.44 | 1.61 | 1.43 |
| 15 ,, 20 | 156 | 216 | 256 | 189 | 203 | 2.75 | 3.56 | 3.73 | 2.34 | 1.84 |
| 20 ,, 25 | 238 | 252 | 288 | 340 | 269 | 4.20 | 4.15 | 4.20 | 4.22 | 2.44 |
| 25 ,, 30 | 247 | 292 | 304 | 350 | 284 | 4.36 | 4.81 | 4.44 | 4.34 | 2.58 |
| 30 ,, 35 | 282 | 283 | 210 | 285 | 317 | 4.98 | 4.66 | 3.06 | 3.54 | 2.88 |
| 35 ,, 40 | 332 | 237 | 274 | 267 | 400 | 5.86 | 3.90 | 4.00 | 3.31 | 3.63 |
| 40 ,, 45 | 267 | 301 | 253 | 260 | 470 | 4.71 | 4.95 | 3.68 | 3.23 | 4.26 |
| 45 ,, 50 | 216 | 338 | 301 | 317 | 621 | 3.81 | 5.56 | 4.39 | 3.93 | 5.63 |
| 50 ,, 55 | 174 | 297 | 368 | 308 | 603 | 3.07 | 4.89 | 5.37 | 3.82 | 5.47 |
| 55 ,, 60 | 129 | 214 | 384 | 386 | 685 | 2.28 | 3.52 | 5.60 | 4.79 | 6.21 |
| 60 ,, 65 | 122 | 239 | 426 | 501 | 730 | 2.15 | 3.93 | 6.21 | 6.22 | 6.62 |
| 65 ,, 70 | 111 | 230 | 379 | 666 | 937 | 1.96 | 3.79 | 5.53 | 8.26 | 8.50 |
| 70 ,, 75 | 83 | 160 | 336 | 757 | 977 | 1.47 | 2.63 | 4.90 | 9.39 | 8.86 |
| 75 ,, 80 | 64 | 122 | 289 | 577 | 958 | 1.13 | 2.01 | 4.22 | 7.16 | 8.69 |
| 80 and over | 58 | 141 | 279 | 581 | 1,634 | 1.02 | 2.32 | 407 | 7.21 | 14.82 |
| Totals for specified ages | 5,666 | 6,076 | 6,856 | 8,061 | 11,026 | 100.00 | 100.00 | 100.00 | 100.00 | 100.00 |
| Unspecified | 46 | 5 | 7 | .. | .. | .. | .. | .. | .. | .. |
| Grand totals | 5,712 | 6,081 | 6,863 | 8,061 | 11,026 | .. | .. | .. | .. | .. |
The next table shows that, with one or two exceptions, the fall in the death-rate during recent years has been common to all ages up to 75, and to both sexes.
| DEATH-RATES PER 1,000 BY AGE-GROUPS. | |||||||||||
|---|---|---|---|---|---|---|---|---|---|---|---|
| Year. | Under 1 | 1 and under 5. | 5 and under 15. | 15 and under and 25. | 25 and under 35. | 35 and under 45. | 45 and under 55. | 55 and under 65. | 65 and under 75. | 75 and under 85. | 85 and over. |
| Males. | |||||||||||
| 1901 | 78.60 | 6.81 | 1.89 | 3.52 | 3.97 | 6.16 | 11.94 | 23.12 | 50.59 | 126.26 | 280.00 |
| 1911 | 63.48 | 5.36 | 1.91 | 2.42 | 3.87 | 6.27 | 11.02 | 20.83 | 53.22 | 116.21 | 281.21 |
| 1921 | 53.10 | 4.78 | 1.85 | 2.44 | 3.56 | 5.55 | 9.61 | 19.96 | 46.17 | 102.84 | 257.70 |
| 1924 | 45.05 | 4.08 | 1.33 | 2.46 | 3.57 | 4.79 | 9.23 | 19.04 | 47.01 | 110.05 | 243.05 |
| 1925 | 44.01 | 4.21 | 1.48 | 2.12 | 3.15 | 4.85 | 8.51 | 17.37 | 45.85 | 115.67 | 293.75 |
| Females. | |||||||||||
| 1901 | 63.87 | 5.50 | 1.64 | 3.58 | 4.72 | 6.70 | 10.62 | 19.44 | 43.32 | 107.02 | 285.30 |
| 1911 | 48.74 | 5.37 | 1.48 | 2.76 | 4.34 | 4.92 | 8.38 | 17.89 | 40.44 | 104.84 | 221.90 |
| 1921 | 42.31 | 4.49 | 1.31 | 2.34 | 3.38 | 4.46 | 8.00 | 14.88 | 36.81 | 94.42 | 230.05 |
| 1924 | 35.21 | 4.01 | 1.10 | 2.04 | 2.90 | 4.08 | 7.14 | 15.17 | 40.07 | 93.31 | 235.77 |
| 1925 | 35.64 | 3.92 | 1.35 | 1.94 | 2.92 | 4.01 | 7.70 | 15.18 | 36.17 | 101.55 | 255.49 |
| Both Sexes. | |||||||||||
| 1901 | 71.40 | 6.17 | 1.77 | 3.55 | 4.33 | 6.40 | 11.37 | 21.63 | 47.87 | 117.97 | 282.52 |
| 1911 | 56.31 | 5.36 | 1.70 | 2.58 | 4.09 | 5.64 | 9.82 | 19.55 | 47.74 | 111.73 | 251.81 |
| 1921 | 47.82 | 4.64 | 1.58 | 2.39 | 3.47 | 5.10 | 8.85 | 17.59 | 41.90 | 99.00 | 245.21 |
| 1924 | 40.23 | 4.05 | 1.22 | 2.25 | 3.22 | 4.44 | 8.24 | 17.23 | 43.80 | 102.20 | 239.69 |
| 1925 | 39.96 | 4.07 | 1.41 | 2.04 | 3.03 | 4.44 | 8.13 | 16.35 | 41.34 | 108.96 | 275.89 |
The table is further of interest as showing that the female rate at all except the highest ages is consistently lower than the male rate. The rapid increase in the death-rate at successive age-groups is well exemplified.
The average age at (Heath of persons of either sex in each of the ten years 1916–25 was as follows:—
| Year. | Males. | Females. |
|---|---|---|
| 1916 | 46.06 | 44.01 |
| 1917 | 48.33 | 45.51 |
| 1918 | 44.56 | 44.29 |
| 1919 | 50.73 | 48.47 |
| 1920 | 48.74 | 45.92 |
| 1921 | 48.45 | 46.97 |
| 1922 | 50.16 | 49.69 |
| 1923 | 50.06 | 50.33 |
| 1924 | 51.05 | 49.87 |
| 1925 | 51.44 | 50.15 |
The drop in the average age at death in 1918 is the result of the influenza epidemic the average age of those succumbing to influenza being below the normal average age at death, especially in the case of males. The year1923 is remarkable in that it is the only occasion on which the average age at death has been higher for females than for males.
The following figures showing the expectation of life at various ages are based on the experience of the quinquennium 1911–15:—
| EXPECTATION OF LIFE OR AVERAGE AFTER-LIFETIME IN NEW ZEALAND. | ||
|---|---|---|
| Age. | Males. | Females. |
| Years. | Years. | |
| 0 | 50.960 | 63.482 |
| 1 | 63.853 | 65.591 |
| 2 | 63.342 | 65.107 |
| 3 | 62.638 | 64.390 |
| 4 | 61.842 | 63.572 |
| 5 | 61.006 | 62.721 |
| 10 | 56.533 | 58.258 |
| 15 | 51.983 | 53.639 |
| 20 | 47.611 | 49.138 |
| 25 | 43.315 | 44.784 |
| 30 | 39.034 | 40.527 |
| 35 | 34.811 | 36.363 |
| 40 | 30.686 | 32.255 |
| 45 | 26.660 | 28.483 |
| 50 | 22.779 | 24.187 |
| 55 | 19.046 | 20.341 |
| 60 | 15.538 | 16.715 |
| 65 | 12.276 | 13.241 |
| 70 | 9.310 | 10.110 |
| 75 | 6.836 | 7.674 |
| 80 | 4.963 | 5.876 |
| 85 | 3.574 | 4.345 |
| 90 | 2.450 | 2.949 |
| 95 | 1.576 | 1.822 |
| 100 | 0.919 | 1.017 |
It will be noted that while the expectation or average after-lifetime of males at age 0 is given as 60.96 years, the average age at death of males in 1925 is only 51.44 years. The reason for the difference in these figures is that the average age at death in 1925 is nothing more than the average of the ages of those dying in that year; and if the population be one with a preponderance of young people, as is the case in New Zealand, that preponderance of young ages must also be reflected among those dying in a particular year, who, after all, are largely a sample of the living. The average age at death in one particular year is therefore evidence of the age-constitution of the population in that year, rather than of the vitality of the people, though it in affected by both factors. In New Zealand the average ago at death is on the whole constantly increasing, mainly because the population is gradually getting a due proportion of old people; but a large immigration of young people or a sufficient increase in the birth-rate could send it down again by furnishing a greater number of deaths at low ages, even without any change in the vitality.
The expectation of life is independent of these factors, being based upon the scientifically determined rates of mortality at every successive year of age, and could be said to represent the average age at death of, say, 100,000 people followed from birth to their final extinction by death.
A table is given showing the death-rates of the Australian States and Commonwealth and of New Zealand in each of the ten years 1916–25.
| DEATH-RATES PER 1,000 OF MEAN POPULATION, 1916–25. | ||||||||||
|---|---|---|---|---|---|---|---|---|---|---|
| Country. | 1916. | 1917. | 1918. | 1919. | 1920. | 1921. | 1922 | 1923. | 1924. | 1925. |
| Queensland | 10.96 | 9.60 | 10.23 | 12.22 | 10.65 | 9.36 | 9.16 | 9.83 | 8.87 | 8.86 |
| New South Wales | 10.49 | 9.43 | 9.69 | 13.18 | 10.12 | 9.50 | 8.92 | 9.61 | 9.35 | 9.16 |
| Victoria | 11.66 | 10.31 | 10.66 | 13.15 | 11.13 | 10.52 | 9.65 | 10.71 | 10.05 | 9.47 |
| South Australia | 11.49 | 9.87 | 9.72 | 11.69 | 10.45 | 10.02 | 9.11 | 9.59 | 9.19 | 9.15 |
| Western Australia | 9.86 | 9.05 | 9.20 | 11.24 | 10.27 | 10.43 | 9.32 | 8.41 | 9.08 | 9.00 |
| Tasmania | 10.58 | 9.10 | 9.09 | 10.69 | 9.68 | 10.30 | 9.30 | 9.92 | 9.89 | 9.35 |
| Commonwealth | 10.95 | 9.71 | 9.99 | 12.69 | 10.50 | 9.91 | 9.22 | 9.89 | 9.47 | 9.20 |
| New Zealand | 9.64 | 9.58 | 14.84 | 9.48 | 10.15 | 8.73 | 8.77 | 9.03 | 8.29 | 8.29 |
New Zealand has ordinarily a lower death-rate than any of the Australian States, which, again, have considerably lower rates than other countries. The apparently disadvantageous position of New Zealand in the matter of the rate for 1918 is explained by the fact that the Dominion experienced the widespread influenza epidemic during 1918, while in the Commonwealth the outbreak did not occur till 1919.
The death-rates of certain of the principal European and other countries are also given. The rates for New Zealand and Australia compare very favourably with these.
| Country. | Quinquennium. | Average Rate per 1,000. |
|---|---|---|
* Exclusive of Quebec. † Registration area. | ||
| Union of South Africa | 1920–24 | 10.1 |
| Canada* | 1920–24 | 10.8 |
| Netherlands | 1920–24 | 10.8 |
| Denmark | 1920–24 | 11.7 |
| Norway | 1920–24 | 11.8 |
| Sweden | 1921–25 | 12.0 |
| Uruguay | 1919–23 | 12.0 |
| England and Wales | 1921–25 | 12.2 |
| United States† | 1919–23 | 12.3 |
| Switzerland | 1920–24 | 12.8 |
| Iceland | 1919–23 | 13.8 |
| Scotland | 1.921–25 | 13.8 |
| Irish Free State | 1920–24 | 13.9 |
| Belgium | 1919–23 | 14.0 |
| Germany | 1920–24 | 14.5 |
| Finland | 1920–24 | 14.7 |
| Quebec | 1919–23 | 14.7 |
| Northern Ireland | 1921–25 | 15.4 |
| Czecho-Slovakia | 1920–24 | 16.9 |
| France | 1921–25 | 17.6 |
| Italy | 1919–23 | 17.8 |
| Austria | 1919–23 | 17.8 |
| Hungary | 1919–23 | 20.0 |
| Spain | 1919–23 | 21.9 |
| Trinidad | 1920–24 | 22.2 |
| Costa Rica | 1919–23 | 22.7 |
| Hong Kong | 1920–24 | 22.9 |
| Japan | 1920–24 | 22.9 |
| Jamaica | 1920–24 | 24.2 |
| Portugal | 1917–21 | 25.6 |
| Egypt | 1920–24 | 25.8 |
| British Guiana | 1920–24 | 27.9 |
| Ceylon | 1920–24 | 29.0 |
| Chile | 1919–23 | 32.5 |
All rates quoted in the preceding portion of this subsection are crude rates—i.e. those ascertained by applying the total deaths during the year to the total mean population for the year, regardless of the age- or sex-constitution of the population. Crude rates are convenient, and are those generally used even for purposes of international comparison, as in the last table given above.
As a means of comparison between different countries, and—in the case of a young country such as New Zealand—between recent and earlier years, it is desirable to take into account differences in the age-constitution and also in the sex-constitution, where the latter is a factor of importance. Death-rates vary widely between different age-groups, and the male rate is at most age-groups somewhat higher than the female.
For the purpose of ascertaining the true movement of the death-rate in New Zealand, a system of standardization was introduced some years ago, the age- and sex-constitution of the population as disclosed at the census of 1911 being taken as the basis. The population and deaths of each year are divided, each sex separately, into five-yearly groups of ages (with one group only for ages 80 and over), and the rates for the various age-groups ascertained and weighted according to the proportion which the respective groups bore to the total population at the census of 1911. Standardized rates have been computed on this basis for each year since 1872, prior to which statistics of ages at death do not exist, and the following table gives the rates for each fifth year from 1875 onwards, the crude rates being also given for purposes of comparison.
| CRUDE AND STANDARDIZED DEATH-RATES, 1875–1925. | ||||||
|---|---|---|---|---|---|---|
| Year. | Crude Rates. | Standardized Rates. | ||||
| Males. | Females. | Total. | Males. | Females. | Total. | |
| 1875 | 16.56 | 15.07 | 15.92 | 19.03 | 15.36 | 17.30 |
| 1880 | 12.05 | 10.73 | 11.46 | 13.81 | 11.47 | 12.70 |
| 1885 | 11.51 | 9.67 | 10.67 | 13.38 | 10.06 | 12.36 |
| 1890 | 10.51 | 8.68 | 9.66 | 12.26 | 10.11 | 11.25 |
| 1895 | 10.81 | 8.89 | 9.91 | 12.26 | 10.07 | 11.22 |
| 1900 | 10.33 | 8.43 | 9.43 | 11.04 | 9.29 | 10.21 |
| 1905 | 10.18 | 8.24 | 9.27 | 10.49 | 8.61 | 9.60 |
| 1910 | 10.67 | 8.63 | 9.71 | 10.67 | 8.46 | 9.62 |
| 1915 | 10.19 | 7.87 | 9.06 | 10.19 | 7.87 | 9.09 |
| 1920 | 11.11 | 9.15 | 10.15 | 10.83 | 8.84 | 9.89 |
| 1925 | 9.09 | 7.46 | 8.29 | 8.68 | 6.77 | 7.78 |
Remarkable though the fall in the crude death-rate during the fifty years has been, the actual fall has been even more substantial, the standardized rate for 1925 being only 45 per cent. as high as for 1875, and 76 per cent. as high as for 1900. A comparison of the two sets of figures emphasizes the fact that the very low rates of the last few years have been achieved in spite of an upward movement in the age-constitution. The fall in the birth-rate, with the consequent decrease in the relative number of infants dying, does not affect the standardized rates, though the fall in the rate of infantile mortality is an important factor in the decrease in both crude and standardized rates.
For purposes of international comparisons it is desirable to compile standardized rates on the basis of an international standard population. The standard population used by many countries for a considerable period was that of Sweden for the year 1890. This standard was adopted for Australia and New Zealand in 1902 and remained in use until 1924, when it was discarded in favour of the standard population compiled and used by the International Institute of Statistics, which is referred to below. The standardized rate, or international index of mortality, for New Zealand. on the basis of the Swedish population distribution in 1890, was as follows for each of the last ten years.
| STANDARDIZED DEATH-RATES (SWEDEN, 1890, STANDARD), 1916–25. | |
|---|---|
| Year. | Rate |
| 1916 | 11.88 |
| 1917 | 11.66 |
| 1918 | 16.80 |
| 1919 | 11.72 |
| 1920 | 12.76 |
| 1921 | 10.93 |
| 1922 | 10.72 |
| 1923 | 11.12 |
| 1924 | 10.15 |
| 1925 | 10.09 |
A serious defect of the system based on the Swedish standard was that the population and deaths were divided into five age-groups only, viz.: Under 1 year, and under 20, 20 and under 40, 40 and under 60, 60 and over. As the death-rates in the various quinquennia of a 20-years age-group show wide variations, and as in New Zealand more than 50 per cent. of deaths occur in recent years after age 60, the Swedish standard has for some years been regarded as obsolete and unsatisfactory. Another objection to it is that the distribution of the Swedish population in 1890 has ceased to be representative, or at all approaching a present-day international average.
Some years ago the International Institute of Statistics compiled a standard population, based on the age-distribution of the population of 19 European countries at their censuses nearest to the year 1900, and used it in the computation of international death-rates. Under this standard, population and deaths are divided into 11 age-groups; but, while separate standardized rates are compiled for each sex as well as for the two sexes in conjunction, no account of differences in sex-constitution is taken by the International Institute in computing the general rate. Commencing with the year 1925, Australia and New Zealand have adopted the International Institute's standard, making, however, allowance for sex-constitution as well as age-constitution. While variations in the sex-constitution are not now of prime importance as far as New Zealand is concerned, the position is not quite the same in some of the Australian States.
The following table gives the standardized rates for New Zealand on the new system for the years 1901, 1911, 1921, 1924, and 1925, the corresponding crude rates being also included.
| CRUDE AND INTERNATIONAL STANDARDIZED DEATH-RATES. | |||||||
|---|---|---|---|---|---|---|---|
| Year. | Crude Rates. | International Standardized Rates. | |||||
| Males. | Females. | Both Sexes. | Males | Females. | Both Sexes. | ||
| Without Distinction between Hexes. | With Distinction between Sexes. | ||||||
| 1901 | 10.80 | 8.71 | 9.81 | 11.81 | 11.21 | 11.64 | 11.51 |
| 1911 | 10.46 | 8.21 | 9.39 | 10.79 | 9.74 | 10.40 | 10.26 |
| 1921 | 9.75 | 7.66 | 8.73 | 9.65 | 8.63 | 9.23 | 9.14 |
| 1924 | 9.22 | 7.32 | 8.29 | 9.18 | 8.26 | 8.79 | 8.72 |
| 1925 | 9.09 | 7.46 | 8.29 | 8.99 | 8.35 | 8.75 | 8.67 |
A comparison between the standard rates in this table and those computed on the former obsolete method shows that under the new system New Zealand has a considerably lower international index of mortality than was apparent from the former set of rates, low though they were. An interesting point brought out by the use of the new standard in New Zealand is that the male standardized rate is actually lower than the corresponding crude rate, thus indicating that the age-constitution of the male population of the Dominion has now reached a level corresponding to that obtaining in Europe at the beginning of the present century.
The occupations of males who died during 1925, arranged according to classification groups, are shown in the following table. Further details may be obtained from the “Annual Report on the Vital Statistics for the Year 1925.”
| Nature of Occupation. | Age-group (in Years). | Totals. | |||||
|---|---|---|---|---|---|---|---|
| Under 15. | 15 and under 20. | 20 and under 25. | 25 and under 45. | 45 and under 65. | 65 and over. | ||
| Fishing and trapping | .. | .. | .. | 2 | 3 | 10 | 15 |
| Agricultural and pastoral | 2 | 17 | 28 | 147 | 329 | 842 | 1,365 |
| Forestry | .. | .. | .. | 15. | 21 | 23 | 59 |
| Mining and quarrying | .. | .. | 4 | 15 | 48 | 103 | 170 |
| Processes relating to minerals | .. | .. | 2 | 4 | .. | 5 | 11 |
| Processes relating to chemicals, animal and vegetable products | .. | .. | .. | 2 | 16 | 23 | 41 |
| Processes relating to metals, machines, tools, conveyances, jewellery, &c. | .. | 3 | 13 | 41 | 65 | 108 | 230 |
| Processes relating to fibrous material, textiles, and dress | .. | 2 | 2 | 19 | 45 | 53 | 121 |
| Processes relating to food, drink, and tobacco | .. | 1 | 3 | 9 | 22 | 20 | 55 |
| Processes relating to wood, basket-ware, furniture, &c. | .. | 1 | 2 | 7 | 18 | 38 | 66 |
| Processes relating to paper, stationery, printing, and photography | .. | 2 | 3 | 9 | 10 | 25 | 49 |
| Construction or repair of buildings, roads, railways, canals, &c. | .. | 9 | 14 | 76 | 107 | 191 | 397 |
| Transport and communication | 1 | 4 | 10 | 86 | 126 | 145 | 372 |
| Commerce and finance | .. | 5 | 7 | 72 | 161 | 181 | 426 |
| Public administration, clerical, and professional | .. | 12 | 17 | 82 | 141 | 202 | 454 |
| Entertainment, sport, and recreation | .. | 1 | 1 | 11 | 10 | 8 | 31 |
| Personal and domestic service | .. | 1 | 3 | 32 | 58 | 51 | 145 |
| Dependent on public or private support | 1,065 | 28 | 13 | 7 | 2 | 27 | 1,142 |
| Other or indefinite | 2 | 17 | 27 | 148 | 294 | 530 | 1,018 |
| Totals | 1,070 | 103 | 149 | 784 | 1,476 | 2,585 | 6,167 |
Of the 11,026 persons whose deaths were registered in 1925, 5,059, or 46 per cent., were born in New Zealand, and 4,830, or 44 per cent., in the United Kingdom. The figures for the principal countries are—
| Number. | |
|---|---|
| British countries— | |
| New Zealand | 5,059 |
| England and Wales | 2,677 |
| Scotland | 1,167 |
| Ireland | 986 |
| Australia | 427 |
| Canada | 34 |
| India | 27 |
| South Africa | 18 |
| Other British countries | 12 |
| 10,407 | |
| Foreign countries— | |
| Germany | 64 |
| Denmark | 45 |
| Sweden | 34 |
| United States | 34 |
| China | 32 |
| Norway | 21 |
| Poland | 19 |
| Switzerland | 13 |
| France | 11 |
| Other foreign countries | 52 |
| 325 | |
| Total British countries | 10,407 |
| Total foreign countries | 325 |
| At sea | 18 |
| Unspecified or unknown | 276 |
| Grand total | 11.026 |
The number and rate of deaths for each of the fourteen urban areas during the last five years are as shown in the following statement:—
| URBAN AREAS.—DEATHS AND DEATH-RATES, 1921–25. | ||||||||||
|---|---|---|---|---|---|---|---|---|---|---|
| Urban Areas. | Number of Deaths. | Rate per 1,000 of Mean Population. | ||||||||
| 1921. | 1922. | 1923. | 1924. | 1925. | 1921. | 1922. | 1923. | 1924. | 1925. | |
* Not available. † Excluding Hamilton and Hastings urban areas. | ||||||||||
| Auckland | 1,504 | 1,591 | 1,554 | 1,616 | 1,644 | 9.53 | 9.67 | 9.26 | 9.34 | 9.09 |
| Wellington | 967 | 966 | 962 | 917 | 961 | 900 | 8.73 | 8.58 | 8.01 | 8.11 |
| Christchurch | 1,014 | 1,063 | 1,158 | 1,023 | 1,062 | 9.60 | 9.65 | 10.21 | 8.87 | 8.98 |
| Dunedin | 742 | 784 | 857 | 742 | 788 | 10.27 | 10.67 | 11.42 | 9.79 | 10.17 |
| Totals of principal areas | 4,227 | 4,404 | 4,531 | 4,298 | 4,455 | 9.54 | 9.59 | 9.68 | 8.98 | 9.00 |
| Hamilton | * | 126 | 125 | 111 | 126 | * | 8.43 | 8.14 | 6.89 | 7.38 |
| Gisborne | 113 | 110 | 117 | 119 | 123 | 7.82 | 7.37 | 7.74 | 7.74 | 7.83 |
| Napier | 167 | 159 | 186 | 173 | 163 | 9.72 | 9.00 | 10.41 | 9.50 | 8.62 |
| Hastings | * | 71 | 95 | 96 | 117 | * | 5.25 | 6.92 | 6.84 | 8.02 |
| New Plymouth | 127 | 126 | 134 | 141 | 150 | 10.04 | 9.33 | 9.62 | 9.78 | 9.77 |
| Wanganui | 178 | 193 | 221 | 203 | 182 | 7.57 | 7.99 | 9.04 | 8.12 | 7.02 |
| Palmerston North | 136 | 128 | 158 | 147 | 172 | 8.05 | 7.31 | 8.97 | 8.03 | 8.94 |
| Nelson | 105 | 117 | 137 | 126 | 136 | 9.88 | 10.75 | 12.27 | 11.05 | 11.67 |
| Timaru | 139 | 167 | 153 | 146 | 147 | 896 | 10.41 | 9.30 | 8.74 | 8.59 |
| Invercargill | 158 | 154 | 212 | 178 | 173 | 8.22 | 7.86 | 10.51 | 8.67 | 8.24 |
| Totals of secondary areas | 1,123† | 1,351 | 1,538 | 1,440 | 1,489 | 8.64† | 8.31 | 9.03 | 8.47 | 8.43 |
| Grand totals | 5,350† | 5,755 | 6,0695,738 | 5,944 | 9.33† | 9.26 | 9.57 | 8.85 | 8.85 | |
In compiling the statistics of deaths for the urban areas the rule is followed of carefully excluding deaths of persons who do not belong to the areas but have come from elsewhere for the purpose of obtaining better medical and nursing attention. Nevertheless, the rates for the principal urban areas, in spite of the omission of this class, are in general somewhat above the average for the Dominion as a whole. It is noteworthy, however, that the average for the secondary areas is not only considerably lower than that for the principal areas, but is also in some years smaller than the Dominion figure.
The table following shows the number of living issue left by married is en whose deaths were registered during the ten years 1916–25, the information being given according to age of father and of issue. It will be seen that during the period under review 30,722 fathers left issue to the number of 139,023, an average of 4.53. There were also 5,537 married men or widowers who died without leaving issue.
| NUMBER AND AGES OF ISSUE LEFT BY MARRIED MEN, 1916–25. | |||||||||
|---|---|---|---|---|---|---|---|---|---|
| Age of Issue, in Years. | Number of Issue left by Fathers dying within the Age-groups shown at Head of Column. | ||||||||
| Under 30 | 30 and Under 40. | 40 and under 50. | 50 and under 60. | 60 and under 65. | 65 and under 70. | 70 and under 80. | 80 and over. | Totals. | |
| 0 | 186 | 390 | 241 | 64 | 6 | 2 | 1 | .. | 890 |
| 1 | 177 | 550 | 314 | 74 | 10 | 8 | 4 | .. | 1,137 |
| 2 | 186 | 605 | 360 | 116 | 18 | 14 | 5 | 1 | 1,305 |
| 3 | 131 | 652 | 443 | 139 | 27 | 12 | 7 | 2 | 1,413 |
| 4 | 99 | 617 | 492 | 170 | 23 | 7 | 5 | 2 | 1,416 |
| 5 | 81 | 603 | 538 | 207 | 24 | 20 | 10 | 1 | 1,484 |
| 6 | 45 | 598 | 571 | 223 | 39 | 23 | 12 | 5 | 1,516 |
| 7 | 22 | 565 | 649 | 299 | 34 | 30 | 19 | 4 | 1,622 |
| 8 | 11 | 462 | 593 | 356 | 61 | 35 | 19 | 5 | 1,542 |
| 9 | 10 | 398 | 692 | 381 | 60 | 42 | 32 | 4 | 1,619 |
| 10 | 4 | 391 | 697 | 416 | 99 | 62 | 40 | 3 | 1,712 |
| 11 | 1 | 278 | 741 | 460 | 102 | 72 | 43 | 3 | 1,700 |
| 12 | .. | 215 | 731 | 511 | 130 | 87 | 53 | 10 | 1,737 |
| 13 | .. | 176 | 687 | 576 | 147 | 94 | 70 | 9 | 1,759 |
| 14 | .. | 102 | 680 | 638 | 182 | 128 | 93 | 10 | 1,833 |
| 15 | .. | 82 | 646 | 642 | 214 | 130 | 99 | 17 | 1,830 |
| 16 | .. | 43 | 627 | 714 | 237 | 180 | 149 | 31 | 1,981 |
| 17 | .. | 24 | 519 | 730 | 286 | 199 | 171 | 13 | 1,942 |
| 18 | .. | 12 | 544 | 796 | 351 | 266 | 213 | 37 | 2,219 |
| 19 | .. | 4 | 437 | 822 | 376 | 300 | 269 | 53 | 2,261 |
| 20 | .. | .. | 343 | 833 | 378 | 307 | 298 | 49 | 2,208 |
| 21 and over | .. | 5 | 1,007 | 8.028 | 9,406 | 14,551 | 39,471 | 30,772 | 103,240 |
| Unspecified | 5 | 17 | 83 | 138 | 98 | 92 | 155 | 69 | 657 |
| Totals | 958 | 6,789 | 12,636 | 17,333 | 12,308 | 16,661 | 41,238 | 31,100 | 139,023 |
| Married men who died— | |||||||||
| (a) Without leaving issue | 295 | 673 | 747 | 885 | 466 | 502 | 1.105 | 864 | 5,537 |
| (b) Leaving issue | 565 | 2,660 | 3,706 | 4,313 | 2,675 | 3,348 | 7,595 | 5,860 | 30,722 |
| Totals | 860 | 3,333 | 4,453 | 5,198 | 3,141 | 3,850 | 8,700 | 6,724 | 36,259 |
Taking all deaths of married men or widowers, whether leaving issue or not, it is found that the average living issue is 3.83, as compared with 4.20 for the period 1906–15. The following table shows the average issue for various age-groups in the two decennial periods:—
| Age-group, in Years. | Deaths of Married Men or Widowers. | Total Number of Issue left. | Average Number of Issue left. | |||
|---|---|---|---|---|---|---|
| 1906–15. | 1916–25. | 1906–15. | 1916–25. | 1906–15. | 1916–25. | |
| Under 30 | 540 | 860 | 578 | 958 | 1.07 | 1.11 |
| 30 and under 40 | 2,167 | 3,333 | 4,613 | 6,789 | 2.13 | 2.04 |
| 40 ,, 50 | 2,745 | 4,453 | 8,653 | 12,636 | 3.15 | 2.84 |
| 50 ,, 60 | 3,767 | 5,198 | 16.096 | 17,333 | 4.27 | 3.33 |
| 60 ,, 65 | 2,416 | 3,141 | 11,553 | 12,308 | 4.78 | 3.92 |
| 65 ,, 70 | 3,245 | 3,850 | 15,740 | 16,661 | 4.85 | 4.33 |
| 70 ,, 80 | 7,359 | 8,700 | 34,953 | 41,238 | 4.75 | 4.74 |
| 80 and over | 3,714 | 6,724 | 16,824 | 31,100 | 4.53 | 4.63 |
| Totals | 25,953 | 36,259 | 109,010 | 139,023 | 4.20 | 3.83 |
Several tables dealing with orphanhood are given in full in the “Annual Report on Vital Statistics.” One of these, showing the number of issue under 16 left by deceased married men, is summarized and given in the next table.
| ISSUE UNDER AGE 16 LEFT BY MARRIED MEN OR WIDOWERS, YEAR 1925. | ||||||||||
|---|---|---|---|---|---|---|---|---|---|---|
| Age at Death, in Years. | Total Number of Cases where Issue left under Age 16. | Cases leaving Number of Issue under 16 Years of Age shown at Head of Column. | Total Number of Children left under Age 16. | |||||||
| 1 | 2 | 3 | 4 | 5 | 6 | 7 | 8 | |||
| 20 and under 25 | 4 | 3 | 1 | .. | .. | .. | .. | .. | .. | 5 |
| 25 ,, 30 | 31 | 13 | 13 | 4 | 1 | .. | .. | .. | .. | 55 |
| 30 ,, 35 | 57 | 18 | 16 | 15 | 3 | 2 | 1 | 2 | .. | 137 |
| 35 ,, 40 | 129 | 37 | 34 | 31 | 15 | 7 | 3 | .. | 326 | |
| 40 ,, 45 | 141 | 37 | 36 | 32 | 23 | 8 | 4 | .. | 1 | 369 |
| 45 ,, 50 | 168 | 55 | 44 | 22 | 27 | 8 | 9 | .. | 3 | 435 |
| 50 ,, 55 | 134 | 58 | 31 | 25 | 7 | 5 | 6 | 2 | .. | 298 |
| 55 ,, 60 | 103 | 50 | 28 | 13 | 4 | 4 | 2 | 1 | 1 | 208 |
| 60 ,, 65 | 44 | 27 | 10 | 4 | 1 | 1 | 1 | .. | .. | 74 |
| 65 ,, 70 | 30 | 14 | 8 | 5 | 2 | .. | .. | .. | 1 | 61 |
| 70 ,, 75 | 18 | 13 | 3 | 1 | 1 | .. | .. | .. | .. | 26 |
| 75 ,, 80 | 9 | 3 | 3 | 1 | 1 | .. | 1 | .. | .. | 22 |
| 80 and over | 5 | 3 | 1 | 1 | .. | .. | .. | .. | .. | 8 |
| Totals | 873 | 331 | 228 | 154 | 85 | 35 | 26 | 8 | 6 | 2,024 |
Among men who left any issue under age 16, the average number of such issue was 2.32. The average for all married men or widowers who died during the year was, however, only 0.56.
Of 873 cases where issue under 16 years of age was left by married men or widowers during 1925, a widow was also left in 799 eases, the aggregate children under 16 in these 799 cases being 1,891, and the average per widow 2.37. By the deaths of their fathers, children under 16 to the number of 117 Were left without either parent, and for 16 children there was no information as to whether the mother was alive or dead.
Of the 36,259 married men or widowers whose deaths were registered during the ten years 1916–25, 8,612 were shown to have been widowers, and 26,884 to have left widows; while in the remaining 763 cases there was no information on the point. Of the married men leaving widows, 23,096 had living issue also at time of death, and 3,788 had no living issue. In 7,311 cases widowers left issue, and in 1,301 cases no issue. In 315 of the 763 cases where no information was given as to whether a widow was left there was living issue, in 288 cases no living issue, and in 160 cases no information as to issue was given. A table is given showing the relative ages of married men who died during the period 1916–25 and of their widows.
| DEATHS, 1916–25.—AGES OF MARRIED MEN WHO DIED, AND OF THEIR WIDOWS. | |||||||||
|---|---|---|---|---|---|---|---|---|---|
| Age of Widow, in Years. | Age of Deceased, in Years. | ||||||||
| Under 30. | 30 and under 40. | 40 and under 50. | 50 and under 60. | 60 and under 70. | 70 and under 80. | 80 and under 90. | 90 and over. | Totals. | |
| Under 20 | 25 | 6 | 1 | .. | .. | .. | .. | .. | 32 |
| 20 and under 25 | 278 | 168 | 24 | 6 | 3 | .. | .. | .. | 479 |
| 25 ,, 30 | 378 | 707 | 120 | 18 | 4 | .. | .. | .. | 1,227 |
| 30 ,, 35 | 71 | 1,135 | 437 | 80 | 22 | 6 | 1 | .. | 1,752 |
| 35 ,, 40 | 5 | 759 | 968 | 295 | 62 | 24 | 7 | .. | 2,120 |
| 40 ,, 45 | 9 | 180 | 1,410 | 606 | 177 | 51 | 14 | .. | 2,447 |
| 45 ,, 50 | 1 | 26 | 871 | 1,182 | 385 | 122 | 30 | 2 | 2,619 |
| 50 ,, 55 | .. | 8 | 145 | 1,433 | 831 | 282 | 66 | 3 | 2,768 |
| 55 ,, 60 | .. | 1 | 29 | 725 | 1,433 | 486 | 114 | 7 | 2,795 |
| 60 ,, 65 | .. | .. | 10 | 130 | 1,516 | 979 | 264 | 12 | 2,941 |
| 65 ,, 70 | .. | .. | 5 | 27 | 772 | 1,376 | 390 | 18 | 2,588 |
| 70 ,, 75 | .. | .. | 1 | 4 | 155 | 1,237 | 495 | 28 | 1,920 |
| 75 ,, 80 | .. | .. | .. | 2 | 29 | 592 | 617 | 32 | 1,272 |
| 80 ,, 85 | .. | .. | .. | .. | 3 | 106 | 389 | 35 | 533 |
| 85 ,, 90 | .. | .. | .. | .. | 1 | 11 | 91 | 20 | 123 |
| 90 and over | .. | .. | .. | .. | .. | .. | 10 | 7 | 17 |
| Ages not specified | 56 | 152 | 111 | 111 | 11 | 320 | 287 | 43 | 1,251 |
| Totals | 823 | 3,142 | 4,132 | 4,619 | 5,594 | 5,592 | 2,775 | 207 | 26,884 |
New Zealand has the lowest rate of infantile mortality in the world, a fact attributable partly to such matters as climate, virility of the race, comparative absence of large industrial undertakings, &c., and partly to legislative and educative measures, the latter both by the State and by various organizations.
The following table, giving infantile-mortality rates in various countries for the latest available quinquennial period, clearly shows the favourable position occupied by New Zealand: —
| Country. | Quinquennium. | Deaths under One Year per 1,000 Births. |
|---|---|---|
* Registration area. † Exclusive of Quebec. | ||
| New Zealand | 1921–25 | 43 |
| Australia | 1921–25 | 58 |
| Norway | 1918–22 | 58 |
| Sweden | 1920–24 | 61 |
| Netherlands | 1920–24 | 67 |
| Irish Free State | 1920–24 | 72 |
| Switzerland | 1919–23 | 74 |
| England and Wales | 1921–25 | 76 |
| South Africa | 1920–24 | 78 |
| United States* | 1919–23 | 81 |
| Denmark | 1919–23 | 83 |
| Northern Ireland | 1920–24 | 84 |
| Canada† | 1920–24 | 88 |
| Scotland | 1920–24 | 92 |
| France | 1921–25 | 94 |
| Finland | 1920–24 | 98 |
| Uruguay | 1919–23 | 105 |
| Belgium | 1919–23 | 107 |
| Germany | 1920–24 | 127 |
| Egypt | 1919–23 | 131 |
| Trinidad | 1920–24 | 142 |
| Austria | 1919–23 | 150 |
| Spain | 1919–23 | 151 |
| Japan | 1920–24 | 163 |
| British Guiana | 1920–24 | 174 |
| Jamaica | 1920–24 | 176 |
| Hungary | 1919–23 | 187 |
| Ceylon | 1920–24 | 192 |
| Chile | 1919–23 | 274 |
Not only has New Zealand had for many years the lowest rate of infantile mortality in the world, but the rate for the Dominion has shown steady and rapid improvement, more particularly during the last twenty years.
The number of deaths of infants under one year of age for each of the ten years 1916–25 and the rate per 1,000 births registered are shown in the following table: —
| DEATHS OF CHILDREN UNDER ONE YEAR OF AGE, 1916–25. | ||||||
|---|---|---|---|---|---|---|
| Year. | Number. | Rate per 1,000 Births. | ||||
| Males. | Females. | Total. | Males. | Females. | Total. | |
| 1916 | 830 | 616 | 1,446 | 56.58 | 44.51 | 50.70 |
| 1917 | 767 | 593 | 1,360 | 53.53 | 42.63 | 48.16 |
| 1918 | 704 | 548 | 1,252 | 53.64 | 43.03 | 48.41 |
| 1919 | 636 | 472 | 1,108 | 50.53 | 39.68 | 45.26 |
| 1920 | 848 | 665 | 1,513 | 54.94 | 45.90 | 50.57 |
| 1921 | 774 | 592 | 1,366 | 53.10 | 42.31 | 47.82 |
| 1922 | 718 | 497 | 1,215 | 48.20 | 35.23 | 41.89 |
| 1923 | 720 | 505 | 1,225 | 49.55 | 37.59 | 43.80 |
| 1924 | 644 | 483 | 1,127 | 45.05 | 35.21 | 40.23 |
| 1925 | 639 | 486 | 1,125 | 44.01 | 35.64 | 39.96 |
The rate for 1925 is the lowest ever recorded, not only for the two sexes in conjunction, but also for males. The female rate is slightly higher than in 1924 and 1922. The rate is invariably somewhat higher among males than among females.
Since 1921 a distinction has been made between legitimate and illegitimate children in the New Zealand statistics of infantile mortality. The proportion of illegitimate infants among those dying within the first year of life has been found to be considerably greater than the proportion of illegitimate births to total births. The figures for the last five years are—
| Year. | Total Deaths under One Year. | Deaths of Illegitimate Infants under One Year. | Proportion of Illegitimates in Total Deaths under One Year. | Proportion of Illegitimates in Total Births. |
|---|---|---|---|---|
| Per Cent. | Per Cent. | |||
| 1921 | 1,366 | 118 | 8.64 | 4.40 |
| 1922 | 1,215 | 86 | 7.08 | 4.22 |
| 1923 | 1,225 | 82 | 6.69 | 4.51 |
| 1924 | 1,127 | 96 | 8.52 | 4.78 |
| 1925 | 1,125 | 58 | 5.16 | 4.73 |
The excess of the male over the female rate of infantile mortality holds for each of the four divisions of the first year of life shown in the next table. The discrepancy is, however, somewhat greater in the first half of the year than in the second.
| DEATHS AT AGE-PERIODS UNDER ONE YEAR PER 1,000 BIRTHS. | ||||||||
|---|---|---|---|---|---|---|---|---|
| Year. | Male Deaths per 1,000 Male Births. | Female Deaths per 1,000 Female Births. | ||||||
| Under 1 Month. | 1 and under 3 Months. | 3 and under 6 Months. | 6 and under 12 Months. | Under 1 Month. | 1 and under 3 Months. | 3 and under 6 Months. | 6 and under 12 Months. | |
| 1916 | 29.58 | 8.93 | 9.34 | 8.73 | 24.28 | 5.85 | 6.58 | 7.80 |
| 1917 | 31.68 | 7.40 | 6.42 | 8.03 | 23.94 | 5.75 | 5.68 | 7.26 |
| 1918 | 29.18 | 9.98 | 5.72 | 8.76 | 24.18 | 7.46 | 3.46 | 7.93 |
| 1919 | 33.13 | 6.91 | 4.37 | 6.12 | 23.37 | 5.97 | 4.54 | 5.80 |
| 1920 | 34.40 | 8.10 | 5.96 | 6.48 | 26.99 | 6.76 | 4.76 | 7.39 |
| 1921 | 33.21 | 8.16 | 5.69 | 6.04 | 28.02 | 5.43 | 3.86 | 5.00 |
| 1922 | 31.55 | 7.52 | 3.63 | 5.50 | 22.68 | 4.68 | 2.98 | 4.89 |
| 1923 | 33.03 | 7.23 | 3.10 | 6.19 | 24.78 | 5.96 | 2.76 | 4.09 |
| 1924 | 26.37 | 6.72 | 5.11 | 6.85 | 21.43 | 3.86 | 4.23 | 5.69 |
| 1925 | 29.89 | 5.99 | 3.72 | 4.41 | 22.73 | 5.06 | 2.57 | 5.28 |
Even when the effect of the male excess among infants born is eliminated, the number of male deaths per 100 female deaths in the first month of life during the ten years 1916–25 is found to be 129; between one and three months, 136; between three and six months, 128; and between six and twelve months, 110.
The actual number of male and female deaths during these periods of life are next shown for the last ten years. Taking the whole decennium it is found that of every 100 males who died under one year of age, 61 lived less than one month, 76 less than three months, and 87 less than six months. The corresponding figures for females are 60, 74, and 85 respectively.
| NUMBER OF DEATHS AT AGE-PERIODS UNDER ONE YEAR. | ||||||||
|---|---|---|---|---|---|---|---|---|
| Year. | Males. | Females. | ||||||
| Under 1 Month. | 1 and under 3 Months. | 3 and under 6 Months. | 6 and under 12 Months. | Under 1 Month. | 1 and under 3 Months. | 3 and under 6 Months. | 6 and under 12 Months. | |
| 1916 | 434 | 131 | 137 | 128 | 336 | 81 | 91 | 108 |
| 1917 | 454 | 106 | 92 | 115 | 333 | 80 | 79 | 101 |
| 1918 | 383 | 131 | 75 | 115 | 308 | 95 | 44 | 101 |
| 1919 | 417 | 87 | 55 | 77 | 278 | 71 | 54 | 69 |
| 1920 | 531 | 125 | 92 | 100 | 391 | 98 | 69 | 107 |
| 1921 | 484 | 119 | 83 | 88 | 392 | 76 | 54 | 70 |
| 1922 | 470 | 112 | 54 | 82 | 320 | 66 | 42 | 69 |
| 1923 | 480 | 105 | 45 | 90 | 333 | 80 | 37 | 55 |
| 1924 | 377 | 96 | 73 | 98 | 294 | 53 | 58 | 78 |
| 1925 | 434 | 87 | 54 | 64 | 310 | 69 | 35 | 72 |
If the deaths under one year of age are divided into two groups—viz., those occurring during the first month of life and those during the remainder of the twelve months—it is found that the decrease disclosed for recent years when compared with earlier is almost entirely confined to the latter class; the explanation being, no doubt, that with premature birth, congenital debility, and other causes of death due to pre-natal influences (which are responsible for the great majority of deaths during the first month), it has not hitherto been found possible to effect the great improvements which have been brought about in regard to complaints arising from post-natal causes. It is gratifying, however, to note that a definite improvement has been recorded in the last few years, particularly in 1924, when the rate for the first mouth was only 23.95 per 1,000.
The next table shows that whereas in the average of the five years 1921–25 the death-rate under one month of age was only slightly lower than in the quinquennium 1881–85, the rate for children who have survived the first month of life was only one-fourth as high as in the “eighties.” In other words, where the Dominion formerly lost, between the ages of one month and one year, sixty children out of every thousand, it lost only sixteen in the five years 1921–25.
| Period. | Deaths per 1,000 Births. | Deaths between 1 and 12 Months per 1,000 Children who survive 1 Month. | ||
|---|---|---|---|---|
| Under 1 Year. | Under 1 Month. | Between 1 and 12 Months. | ||
| 1881–1885 | 90.60 | 29.77 | 60.83 | 62.70 |
| 1886–1890 | 84.09 | 27.57 | 56.52 | 58.13 |
| 1891–1895 | 87.60 | 30.34 | 57.26 | 58.93 |
| 1896–1900 | 80.06 | 30.38 | 49.68 | 51.24 |
| 1901–1905 | 74.77 | 30.64 | 44.13 | 45.54 |
| 1906–1910 | 69.62 | 30.28 | 39.34 | 40.57 |
| 1911–1915 | 53.63 | 29.28 | 24.35 | 25.05 |
| 1916–1920 | 48.62 | 28.16 | 20.46 | 21.05 |
| 1921–1925 | 42.74 | 27.48 | 15.27 | 15.70 |
The decrease by half in the general rate, and three-quarters in the rate between one and twelve months, and the practically stationary nature of the rate under one month, are well indicated in the accompanying diagram.
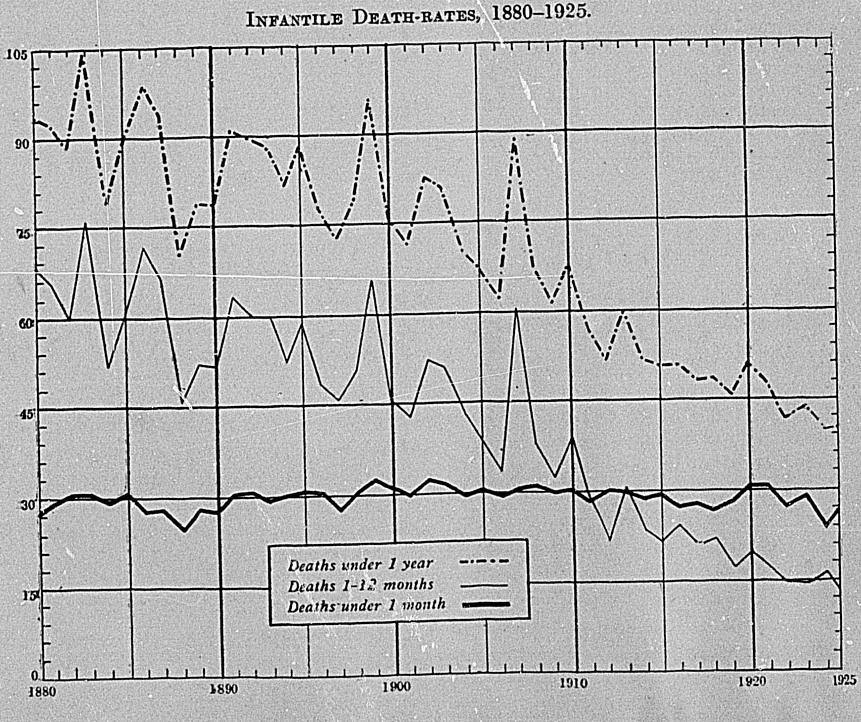
If the deaths under one month for the year 1925 are subjected to a more detailed analysis as to age it is found that of the total of 744 nearly a third (235) occurred within twenty-four hours of birth, and over three-quarters (571) within one week. The following table gives information as to the principal causes. of death at various periods of the first year of life:—
| INFANTILE MORTALITY, 1925.—CAUSES AND AGES. | |||||||||||
|---|---|---|---|---|---|---|---|---|---|---|---|
| Cause of Death. | Under 1 Day. | 1 Day and under 1 Week. | 1 Week and under 2 Weeks. | 2 Weeks and under 3 Weeks. | 3 Weeks and under 1 Month. | 1 Month and under 2 Months. | 2 Months and under 3 Months. | 3 Months and under 6 Months. | 6 Months and under 9 Months. | 9 Months and under 12 Months. | Total. |
| Measles | .. | .. | .. | .. | .. | .. | .. | .. | 2 | 1 | 3 |
| Whooping-cough | .. | .. | .. | .. | .. | 1 | 2 | 1 | 2 | 2 | 8 |
| Influenza | .. | .. | .. | 1 | 1 | 6 | 2 | 4 | 14 | ||
| Infantile paralysis | .. | .. | .. | .. | .. | .. | .. | 3 | 3 | 2 | 8 |
| Tuberculosis (all forms) | .. | .. | .. | .. | .. | 2 | 2 | 4 | 3 | 8 | 19 |
| Syphilis | 1 | .. | .. | 1 | .. | 4 | .. | 1 | .. | .. | 7 |
| Meningitis | .. | .. | 1 | .. | 1 | 1 | .. | 3 | 1 | 6 | 13 |
| Convulsions | .. | 26 | 5 | .. | .. | 2 | .. | 5 | 5 | 1 | 44 |
| Bronchitis | .. | 1 | 1 | 1 | .. | 3 | 2 | 4 | 4 | 3 | 19 |
| Broncho-pneumonia | .. | 3 | 1 | 3 | 3 | 10 | 15 | 18 | 9 | 13 | 75 |
| Pneumonia | .. | 2 | 6 | 1 | 1 | 7 | 2 | 6 | 4 | 1 | 30 |
| Diarrhœa and enteritis | .. | .. | 2 | 1 | 2 | 14 | 3 | 7 | 15 | 7 | 51 |
| Hernia, intestinal obstruction | .. | .. | .. | .. | .. | 1 | .. | 1 | 4 | 2 | 8 |
| Congenital malformations | 24 | 51 | 14 | 6 | 5 | 16 | 8 | 8 | 5 | 5 | 142 |
| Congenital debility, icterus, sclerema | 15 | 40 | 7 | 9 | 11 | 8 | 9 | 11 | .. | .. | 110 |
| Injury at birth | 18 | 42 | 3 | 1 | .. | 2 | .. | .. | .. | .. | 66 |
| Premature birth | 152 | 123 | 34 | 16 | 12 | 13 | 2 | 2 | .. | .. | 354 |
| Other causes peculiar to early infancy | 19 | 37 | 5 | 3 | 1 | 4 | 1 | .. | .. | .. | 70 |
| Accidental mechanical suffocation (overlain, &c.) | .. | 1 | .. | 1 | .. | 3 | 1 | .. | .. | .. | 6 |
| Other causes | 6 | 10 | 6 | 5 | 2 | 9 | 3 | 13 | 13 | 11 | 78 |
| Totals, both sexes | 235 | 336 | 85 | 49 | 39 | 106 | 50 | 89 | 74 | 62 | 1,125 |
| Totals, males | 135 | 207 | 44 | 27 | 21 | 64 | 23 | 54 | 37 | 27 | 639 |
| Totals, females | 100 | 129 | 41 | 22 | 18 | 42 | 27 | 35 | 37 | 35 | 486 |
Some remarkable changes are disclosed by the next table, which gives the infantile-mortality rates for various groups of causes in quinquennial groups over a period of fifty-four years. If a comparison be made between the averages of the first and last quinquennia covered—1872–76 and 1917–21—it is found that the general infantile-mortality rate shows a decline of 56 per cent., while even greater decreases are recorded for tuberculosis (91 per cent.), gastric and intestinal diseases (81 per cent.), convulsions (80 per cent.), epidemic diseases (76 per cent.), and respiratory diseases (64 per cent.). On the other hand, an actual increase of 17 per cent. is disclosed by the figures for the two classes of pre-natal causes—malformations and diseases of early infancy—taken in conjunction.
The decrease shown for tuberculosis and the increase for malformations are probably somewhat less than is indicated by the figures. In the earlier years covered by the table the former heading included all deaths from hydrocephalus, many of which were no doubt due to congenital hydrocephalus, which is now included among the malformations. A proportion of the deaths from hydrocephalus in the earlier years would also probably be due to meningitis.
| INFANTILE-MORTALITY RATES FOR PRINCIPAL CAUSES, 1872–1925. | |||||||||
|---|---|---|---|---|---|---|---|---|---|
| Period. | Epidemic Diseases. | Tuberculosis. | Infantile Convulsions. | Respiratory Diseases. | Gastric and Intestinal Diseases. | Malformations. | Early Infancy. | Other Causes. | Totals. |
| 1872–1876 | 13.5 | 5.5 | 9.7 | 12.9 | 24.2 | 1.2 | 25.0 | 17.3 | 109.3 |
| 1877–1881 | 10.2 | 5.2 | 7.5 | 12.3 | 19.8 | 1.4 | 21.9 | 15.3 | 93.6 |
| 1882–1886 | 9.3 | 4.7 | 7.9 | 11.8 | 19.1 | 1.2 | 25.5 | 12.3 | 91.8 |
| 1887–1891 | 8.9 | 3.7 | 6.3 | 10.5 | 18.5 | 1.3 | 24.7 | 8.8 | 82.7 |
| 1892–1896 | 9.8 | 3.3 | 6.6 | 11.0 | 16.6 | 1.4 | 24.9 | 11.2 | 84.8 |
| 1897–1901 | 6.1 | 2.6 | 5.6 | 10.0 | 17.2 | 1.5 | 26.2 | 9.7 | 78.9 |
| 1902–1906 | 5.5 | 1.5 | 4.1 | 9.7 | 15.3 | 1.3 | 27.6 | 7.9 | 72.9 |
| 1907–1911 | 5.9 | 1.3 | 3.3 | 7.6 | 15.5 | 1.9 | 26.7 | 6.3 | 68.5 |
| 1912–1916 | 3.6 | 0.6 | 2.2 | 5.1 | 7.4 | 3.9 | 26.2 | 3.5 | 52.5 |
| 1917–1921 | 3.2 | 0.5 | 1.9 | 4.7 | 4.5 | 4.3 | 26.1 | 2.9 | 48.1 |
| 1922 | 1.2 | 0.3 | 1.4 | 3.7 | 3.3 | 4.7 | 24.8 | 2.5 | 41.9 |
| 1923 | 1.8 | 0.4 | 1.4 | 4.0 | 2.7 | 5.6 | 24.5 | 3.4 | 43.8 |
| 1924 | 1.7 | 0.2 | 0.9 | 4.5 | 4.0 | 4.6 | 20.6 | 3.7 | 40.2 |
| 1925 | 1.4 | 0.7 | 1.6 | 4.5 | 2.2 | 5.0 | 21.5 | 3.1 | 40.0 |
The classification of causes of death was made in 1908 for the first time in New Zealand according to the international classification of diseases initiated by Dr. Jacques Bertillon and used by the Commonwealth of Australia and the principal European and American countries. Provision has been made by the International Commission for a regular decennial revision of the index, in order that the classification may be kept abreast of scientific progress. It is highly desirable for comparative purposes that uniformity of statistical method should obtain.
The international classification differs materially from that in use prior to 1908, and comparisons of certain causes of mortality between years prior and subsequent to 1908 are impossible owing to changes in the classification. Most of the more important diseases, however, remain unaffected and retain their comparative value.
The third decennial revision of the international classification of diseases and causes of death was used for the first time in computing the statistics of causes of death for 1923. Although there has been quite a number of important changes in the placing of some of the diseases, the classification in general follows much the same form as before. The most striking change is the establishment of a new group of diseases, known as the “epidemic, endemic, and infectious diseases.” This group comprises all the epidemic diseases which were formerly covered by the first nineteen orders in the class known as “general diseases,” also all infectious diseases, including all forms of tuberculosis and syphilis. In addition, acute poliomyelitis, lethargic encephalitis, and meningococcus meningitis, all of which were previously placed in “diseases of the nervous system,” are now included under this heading. Several new titles have been added, in order to provide for the separate listing of diseases which are now deemed to be of sufficient importance. There are also numerous oases where diseases have been transferred from one class to another, the most important being the grouping. of cerebral embolism and thrombosis along with cerebral hæmorrhage and apoplexy, instead of under the circulatory system with embolism and thrombosis. The net result is that, as it now stands, the classification list contains fifteen class headings, which are further subdivided into 205 orders, instead of the fourteen classes and 189 orders appearing in the second revision.
A comparison of the causes of deaths in 1925, arranged according to an abridged classification, the percentage of each group to the total deaths, and the proportion per 10,000 of population of each sex, are given in the following table:—
| Class. | Number of Deaths. | Proportion to Total Deaths. | Proportion per 10,000 of Mean Population. | |||
|---|---|---|---|---|---|---|
| M. | F. | M. | F. | M. | F. | |
| Per Cent. | Per Cent. | |||||
| I. Epidemic, endemic, and infectious diseases | 635 | 507 | 10.30 | 10.43 | 9.36 | 7.79 |
| II. General diseases, not included above | 816 | 870 | 13.23 | 17.90 | 12.02 | 13.36 |
| III. Diseases of the nervous system and of the organs of special sense | 600 | 596 | 9.73 | 12.27 | 8.84 | 9.16 |
| IV. Diseases of the circulatory system | 1,198 | 921 | 19.43 | 18.95 | 17.65 | 14.15 |
| V. Diseases of the respiratory system | 557 | 448 | 9.03 | 9.22 | 8.21 | 6.88 |
| VI. Diseases of the digestive system | 369 | 295 | 5.98 | 6.07 | 5.44 | 4.53 |
| VII. Non-venereal diseases of the genito - urinary system and annexa | 364 | 226 | 5.90 | 4.65 | 5.36 | 3.47 |
| VIII. Puerperal state | .. | 131 | .. | 2.70 | .. | 2.01 |
| IX. Diseases of the skin and of the cellular tissue | 32 | 17 | 0.52 | 0.35 | 0.47 | 0.26 |
| X. Diseases of the bones and of the organs of locomotion | 22 | 14 | 0.36 | 0.29 | 0.32 | 0.22 |
| XI. Malformations | 97 | 73 | 1.57 | 1.50 | 1.42 | 1.12 |
| XII. Early infancy | 348 | 255 | 5.64 | 5.25 | 5.13 | 3.92 |
| XIII. Old age | 454 | 325 | 7.36 | 6.69 | 6.69 | 4.99 |
| XIV. External causes | 640 | 169 | 10.38 | 3.48 | 9.43 | 2.60 |
| XV. III-defined causes | 35 | 12 | 0.57 | 0.25 | 0.52 | 0.18 |
| Totals | 6,167 | 4,859 | 100.00 | 100.00 | 90.86 | 74.64 |
Class IV, diseases of the circulatory system, the principal of which—organic heart-disease—ranks easily first among individual causes of death in New Zealand, is the most important as regards numerical strength. Next in order comes Class II (which includes cancer), closely followed by Classes III, I, and V. Classes IX and X are-responsible for very few deaths.
The next table shows the number of deaths from certain principal causes for the five years 1921–25, and the proportion per 10,000 of the population:—
| Cause. | Number of Deaths. | Proportion per 10,000 of Mean Population. | ||||||||
|---|---|---|---|---|---|---|---|---|---|---|
| 1921. | 1922. | 1923. | 1924. | 1925. | 1921. | 1922. | 1923. | 1924. | 1925. | |
| Typhoid fever | 24 | 67 | 23 | 19 | 16 | 0.20 | 0.54 | 0.18 | 0.15 | 0.12 |
| Measles | 47 | 1 | 7 | 52 | 11 | 0.38 | 0.01 | 0.05 | 0.40 | 0.08 |
| Scarlet fever | 24 | 10 | 13 | 13 | 7 | 0.20 | 0.08 | 0.10 | 0.10 | 0.05 |
| Whooping-cough | 49 | 4 | 39 | 47 | 16 | 0.40 | 0.03 | 0.31 | 0.36 | 0.12 |
| Diphtheria | 103 | 78 | 66 | 80 | 52 | 0.84 | 0.62 | 0.52 | 0.62 | 0.39 |
| Influenza | 105 | 66 | 403 | 90 | 86 | 0.86 | 0.53 | 3.16 | 0.69 | 0.65 |
| Infantile paralysis | 9 | 9 | 2 | 22 | 173 | 0.07 | 0.07 | 0.02 | 0.17 | 1.30 |
| Tuberculosis of respiratory system | 640 | 626 | 619 | 573 | 560 | 5.23 | 5.00 | 4.86 | 4.41 | 4.21 |
| Other forms of tuberculosis | 153 | 177 | 173 | 163 | 124 | 1.25 | 1.41 | 1.36 | 1.26 | 0.93 |
| Cancer | 1,044 | 1,066 | 1,115 | 1,245 | 1,207 | 8.53 | 8.52 | 8.75 | 9.59 | 9.08 |
| Diabetes | 165 | 159 | 181 | 173 | 162 | 1.35 | 1.27 | 1.42 | 1.33 | 1.22 |
| Anæmia, chlorosis | 97 | 79 | 76 | 106 | 86 | 0.79 | 0.63 | 0.60 | 0.82 | 0.65 |
| Exophthalmic goitre | 38 | 29 | 35 | 45 | 63 | 0.30 | 0.23 | 0.27 | 0.35 | 0.47 |
| Meningitis (all forms) | 114 | 114 | 108 | 68 | 68 | 0.92 | 0.91 | 0.85 | 0.52 | 0.51 |
| Apoplexy, cerebral hæmorrhage | 514 | 565 | 677 | 722 | 683 | 4.20 | 4.51 | 5.31 | 5.56 | 5.14 |
| Epilepsy | 48 | 43 | 59 | 48 | 77 | 039 | 0.34 | 0.46 | 0.37 | 0.58 |
| Convulsions of children under 5 years of age | 70 | 56 | 52 | 31 | 51 | 0.56 | 0.45 | 0.41 | 0.24 | 0.38 |
| Heart-disease (all forms) | 1,699 | 1,889 | 2,023 | 1,858 | 1,931 | 13.88 | 15.09 | 15.87 | 14.31 | 14.52 |
| Arterio-sclerosis | 83 | 103 | 98 | 72 | 110 | 0.68 | 0.82 | 0.77 | 0.55 | 0.83 |
| Bronchitis | 288 | 341 | 366 | 224 | 316 | 2.35 | 2.72 | 2.87 | 1.72 | 2.38 |
| Broncho-pneumonia | 194 | 177 | 277 | 200 | 215 | 1.58 | 1.41 | 2.17 | 1.54 | 1.61 |
| Pneumonia | 427 | 407 | 339 | 306 | 292 | 349 | 3.25 | 2.66 | 2.36 | 2.19 |
| Gastritis | 22 | 25 | 19 | 31 | 21 | 0.18 | 0.20 | 0.15 | 0.24 | 0.16 |
| Diarrhœa and enteritis | 221 | 187 | 129 | 180 | 107 | 1.80 | 1.49 | 1.01 | 1.39 | 0.80 |
| Appendicitis and typhlitis | 85 | 107 | 97 | 94 | 122 | 0.70 | 0.86 | 0.76 | 0.72 | 0.92 |
| Hernia, intestinal obstruction | 79 | 102 | 50 | 82 | 110 | 0.69 | 0.81 | 0.71 | 0.63 | 0.83 |
| Cirrhosis of liver | 28 | 37 | 42 | 43 | 45 | 0.23 | 0.30 | 0.33 | 0.33 | 0.34 |
| Simple peritonitis | 40 | 52 | 52 | 36 | 41 | 0.33 | 0.42 | 0.41 | 0.28 | 0.31 |
| Nephritis, Bright's disease | 377 | 310 | 358 | 342 | 396 | 3.08 | 2.48 | 2.81 | 2.63 | 2.98 |
| Cystitis | 23 | 26 | 23 | 15 | 16 | 0.19 | 0.21 | 0.18 | 0.12 | 0.12 |
| Diseases and accidents of puerperal condition | 145 | 149 | 143 | 140 | 131 | 1.19 | 1.19 | 1.12 | 1.08 | 0.98 |
| Malformations | 159 | 156 | 172 | 147 | 170 | 1.30 | 1.25 | 1.35 | 1.13 | 1.28 |
| Congenital debility | 191 | 165 | 151 | 136 | 110 | 1.56 | 1.32 | 1.18 | 1.05 | 0.83 |
| Premature birth | 403 | 423 | 384 | 325 | 354 | 3.29 | 3.38 | 3.01 | 2.50 | 2.66 |
| Senility | 791 | 891 | 901 | 767 | 779 | 6.46 | 7.12 | 7.07 | 5.90 | 5.86 |
| Violence (1) suicide | 157 | 164 | 133 | 159 | 173 | 1.28 | 1.31 | 1.04 | 1.22 | 1.30 |
| (2) accident | 562 | 541 | 588 | 621 | 621 | 4.59 | 4.32 | 4.61 | 4.78 | 4.67 |
| (3) homicide | 15 | 14 | 11 | 11 | 15 | 0.12 | 0.11 | 0.09 | 0.08 | 0.11 |
| Other causes | 1,449 | 1,562 | 1,467 | 1,481 | 1,509 | 11.84 | 12.47 | 11.51 | 11.41 | 11.36 |
| Totals | 10682 | 10977 | 11511 | 10767 | 11026 | 87.28 | 87.68 | 90.31 | 82.91 | 82.92 |
During the latter part of 1918 the Dominion was visited by a most virulent epidemic of influenza of a character similar to that experienced in most countries of the world in 1918 or 1919. The disease was more properly pneumonic influenza, and many deaths in the earlier stages of the outbreak were registered as caused by pneumonia, broncho-pneumonia, &c., which in the light of later knowledge would probably have been ascribed to influenza.
The deaths from influenza alone during 1918 reached a total of 5,516, a number greatly in excess of the grand total for the preceding forty-six years, prior to which statistics of causes of death are not available. This figure does not include Maori deaths—approximately 1,200—due to influenza.
Although, fortunately, the epidemic of 1918 was short lived, a perusal of the table following shows that the disease still remained and exerted its influence on the death-rates of the two following years.
A recrudescence of the influenza epidemic of 1918, and to a lesser extent of 1919 and 1920, was very apparent in the death statistics for 1923. Unlike its predecessor, the epidemic was of a mild form, and first made its presence felt in the month of July, and continued through the months of August and September. The chief cause of the heavy mortality in the late winter and early spring months of the year was the exceedingly fatal complicating cause—pneumonia. In 219 cases, out of a total of 403 deaths from influenza during 1923, pneumonia was either jointly responsible with influenza for death or was associated therewith. A peculiar feature of the latter epidemic was that it was less fatal in the North Island than in the South, the corresponding rates per 10,000 of mean population being 2.49 and 4.21 respectively.
| DEATHS FROM INFLUENZA, 1872–1925. | |
|---|---|
| Year. | Deaths. |
| 1872 | 8 |
| 1893 | 106 |
| 1894 | 233 |
| 1895 | 125 |
| 1886 | 11 |
| 1877 | 9 |
| 1878 | 3 |
| 1879 | 15 |
| 1880 | 11 |
| 1881 | 10 |
| 1882 | 13 |
| 1883 | 11 |
| 1884 | 6 |
| 1885 | 5 |
| 1886 | 11 |
| 1887 | 9 |
| 1888 | 9 |
| 1889 | 9 |
| 1890 | 70 |
| 1891 | 210 |
| 1892 | 144 |
| 1893 | 106 |
| 1894 | 233 |
| 1895 | 125 |
| 1896 | 89 |
| 1897 | 120 |
| 1898 | 219 |
| 1899 | 135 |
| 1900 | 181 |
| 1901 | 219 |
| 1902 | 117 |
| 1903 | 56 |
| 1904 | 113 |
| 1905 | 70 |
| 1906 | 132 |
| 1907 | 223 |
| 1908 | 64 |
| 1909 | 47 |
| 1910 | 141 |
| 1911 | 63 |
| 1912 | 65 |
| 1913 | 56 |
| 1914 | 63 |
| 1915 | 110 |
| 1916 | 73 |
| 1917 | 38 |
| 1918 | 5,516 |
| 1919 | 346 |
| 1920 | 540 |
| 1921 | 105 |
| 1922 | 66 |
| 1923 | 403 |
| 1924 | 90 |
| 1925 | 86 |
The invasion of 1918 was very decidedly concentrated on the young adult ages, while that of 1923 was mainly confined in its activities to the more advanced ages. In 1918 the maximum percentage (18.33) was recorded for the age-group 30 to 35, with the next highest percentage (16.15) at the preceding age-group. Age-groups 35 to 40 and 40 to 45 accounted for 14.99 and 9.85 per cent. respectively. Altogether 68.20 per cent. of the total deaths from influenza in 1918 occurred between the ages of 20 and 45. The equivalent figure for 1923 aggregated only 27.79 per cent. Forty-two per cent. of the deaths in 1923 were at ages 60 and over, against a corresponding percentage in 1918 of 6.89.
Tuberculosis of the respiratory system takes sixth place in point of the number of deaths resulting therefrom during 1925, ranking after heart-disease, cancer, senility, cerebral hæmorrhage and apoplexy, and accidents, in that order. Each of the last four years has in its turn established a new record in low rates of mortality from this form of tuberculosis, the continuation of the downward trend in the incidence of this disease being extremely gratifying. The 1925 rate was 4.21 per 10,000, which is an improvement of 28 per cent. over the figure for 1920. The average death-rate from tuberculosis of the respiratory system during the last ten years has been 5.16 per 10,000 of mean population.
| Year. | Deaths from Tuberculosis of Respiratory System. | Rate per 10,000. |
|---|---|---|
| 1916 | 591 | 5.38 |
| 1917 | 597 | 5.43 |
| 1918 | 664 | 6 02 |
| 1919 | 602 | 5.27 |
| 1920 | 695 | 5.83 |
| 1921 | 640 | 5.23 |
| 1922 | 626 | 5.00 |
| 1923 | 619 | 4.86 |
| 1924 | 573 | 4.41 |
| 1925 | 560 | 4.21 |
Of the 560 persons who died from tuberculosis of the respiratory system in 1925, 386, or 69 per cent., were known to have been born in the Dominion. In 18 eases the country of birth was not known or not stated, and in the remaining 156 oases the deceased person had been born outside New Zealand. Three of the last-mentioned had been in New Zealand less than one year, and 17 less than five years.
In addition to the 560 deaths from tuberculosis of the respiratory system during 1925, there were 124 deaths from other forms of tuberculosis, made up as follows: —
| Tuberculosis of meninges and central nervous system | 61 |
|---|---|
| Tuberculosis of intestines and peritoneum | 17 |
| Tuberculosis of vertebral column | 13 |
| Tuberculosis of joints | 3 |
| Tuberculosis of other organs | 14 |
| Disseminated tuberculosis | 16 |
The following table gives the number and rate of deaths from all forms of tuberculosis during the last ten years, with the percentage that deaths from tuberculosis bear to all deaths:—
| Year. | Mean Population. | Number of Deaths from Tubercular Diseases. | Rate per 10,000. | Percentage of Total Deaths from all Causes. |
|---|---|---|---|---|
(a) All deaths; (b) excluding deaths from Influenza, October-December, 1918. | ||||
| 1916 | 1,099,449 | 742 | 6.74 | 7.00 |
| 1917 | 1,099,117 | 755 | 6.87 | 7.17 |
| 1918 | 1,103,022 | 832 | 7.54 | 5.08 (a) |
| 7.64 (b) | ||||
| 1919 | 1,142,889 | 762 | 6.67 | 7.05 |
| 1920 | 1,192,620 | 851 | 7.14 | 7.03 |
| 1921 | 1,223,901 | 793 | 6.48 | 7.42 |
| 1922 | 1,251,895 | 803 | 6.41 | 7.32 |
| 1923 | 1,274,551 | 792 | 6.21 | 6.88 |
| 1924 | 1,298,635 | 736 | 5.67 | 6.84 |
| 1925 | 1,329,759 | 684 | 5.14 | 6.20 |
Tuberculosis claims its victims at comparatively early age. Of those dying from this cause in 1925, persons under the age of twenty years formed 17 ½ per cent., and those under forty-five years 73 per cent. The figures for the various age-groups are as follows:—
| AGES OF PERSONS WHO DIED FROM TUBERCULAR DISEASES, 1925. | |||
|---|---|---|---|
| Ages, in Years. | Males. | Females. | Total. |
| Under 5 | 32 | 12 | 44 |
| 5 and under 10 | 4 | 7 | 11 |
| 10 ,, 15 | 4 | 12 | 16 |
| 15 ,, 20 | 16 | 33 | 49 |
| 20 ,, 25 | 29 | 45 | 74 |
| 25 ,, 30 | 38 | 44 | 82 |
| 30 ,, 35 | 45 | 29 | 74 |
| 35 ,, 40 | 52 | 29 | 81 |
| 40 ,, 45 | 38 | 30 | 68 |
| 45 and under 50 | 38 | 21 | 59 |
| 50 ,, 55 | 19 | 22 | 41 |
| 55 ,, 60 | 29 | 9 | 38 |
| 60 ,, 65 | 7 | 9 | 16 |
| 65 ,, 70 | 11 | 3 | 14 |
| 70 ,, 75 | 3 | 4 | 7 |
| 75 ,, 80 | 4 | 5 | 9 |
| 80 and upwards | 1 | .. | 1 |
| Total deaths | 370 | 314 | 684 |
The proportions for the two sexes vary considerably over the different age-groups, females generally being in the majority in the earlier ages, and males thereafter.
The latest available death-rate from tubercular diseases in most of the principal countries of the world is next shown.
| DEATH-RATES FROM TUBERCULOSIS. | ||
|---|---|---|
| Country. | Year. | Death-rates (per 10,000). |
* Registration area. | ||
| New Zealand | 1925 | 5.1 |
| Australia | 1924 | 6.1 |
| Canada (excluding Quebec) | 1924 | 6.8 |
| Ceylon | 1924 | 7.4 |
| United States* | 1923 | 9.4 |
| Denmark | 1924 | 10.0 |
| Netherlands | 1923 | 10.5 |
| Belgium | 1923 | 10.5 |
| England and Wales | 1924 | 10.6 |
| British Guiana | 1924 | 11.4 |
| Egypt | 1924 | 11.4 |
| Scotland | 1924 | 11.6 |
| Greece | 1921 | 12.3 |
| Trinidad | 1924 | 136 |
| Uruguay | 1923 | 13.9 |
| Italy | 1923 | 14.2 |
| Irish Free State | 1924 | 14.5 |
| Sweden | 1924 | 14.6 |
| Jamaica | 1924 | 15.0 |
| Germany | 1923 | 15.5 |
| Switzerland | 1922 | 15.7 |
| Spain | 1923 | 15.7 |
| France | 1919 | 16.0 |
| Northern Ireland | 1924 | 16.1 |
| Japan | 1924 | 19.2 |
| Czecho-Slovakia | 1923 | 19.6 |
| Austria | 1923 | 204 |
| Norway | 1920 | 20.9 |
| Chile | 1923 | 23.8 |
| Finland | 1922 | 23.9 |
| Hong Kong | 1924 | 29.5 |
| Hungary | 1923 | 29.9 |
Cancer is annually responsible for more deaths in New Zealand than can be assigned to any cause other than organic disease of the heart. The increasing prevalence of cancer is causing no little concern in the Dominion, as indeed it is throughout the civilized world. The three years immediately preceding 1923 showed a slight decline in the cancer death-rate, but the total gain in those years was more than accounted for by the large increase in 1923. The rate for 1924, 9.59 per 10,000 of mean population, again showed a considerable increase, being the highest ever recorded in the history of the country, while that for 1925 (9.08) is the second highest
In 1925 there were 1,207 deaths from cancer in the Dominion, a proportion of 9.08 per 10,000 persons. The average number of cancer deaths and the average cancer death-rate for the years 1916–25 were 1,054 and 8.76 respectively Deaths of males during 1925 numbered 612, and of females 595.
| NUMBER OF PERSONS WHO DIED FROM CANCER, THE PROPORTION PER 10,000 OF POPULATION, AND THE PERCENTAGE OF ALL DEATHS, 1916–25. | ||||
|---|---|---|---|---|
| Year. | Deaths from Cancer. | Total Deaths, all Causes. | Deaths from Cancer per 10,000 of Mean Population. | Deaths from Cancer per 100 of all Deaths. |
(a) All deaths; (b) excluding deaths from influenza, October-December, 1918. | ||||
| 1916 | 909 | 10,596 | 8.27 | 8.50 |
| 1917 | 957 | 10,528 | 8.71 | 9.09 |
| 1918 | 936 | 16,364 | 8.49 | 5.72 (a) |
| 8.59 (b) | ||||
| 1919 | 1,031 | 10,808 | 902 | 9.54 |
| 1920 | 1,029 | 12,109 | 8.63 | 8.50 |
| 1921 | 1,044 | 10,682 | 8.53 | 9.77 |
| 1922 | 1,066 | 10,977 | 8.52 | 9.71 |
| 1923 | 1,115 | 11,511 | 8.75 | 9.69 |
| 1924 | 1,245 | 10,767 | 9.59 | 11.56 |
| 1925 | 1,207 | 11,026 | 9.08 | 10.95 |
The following diagram illustrates, on the one hand, the increase in the cancer death-rate, and, on the other, the decrease in the rate of deaths from tuberculosis: —
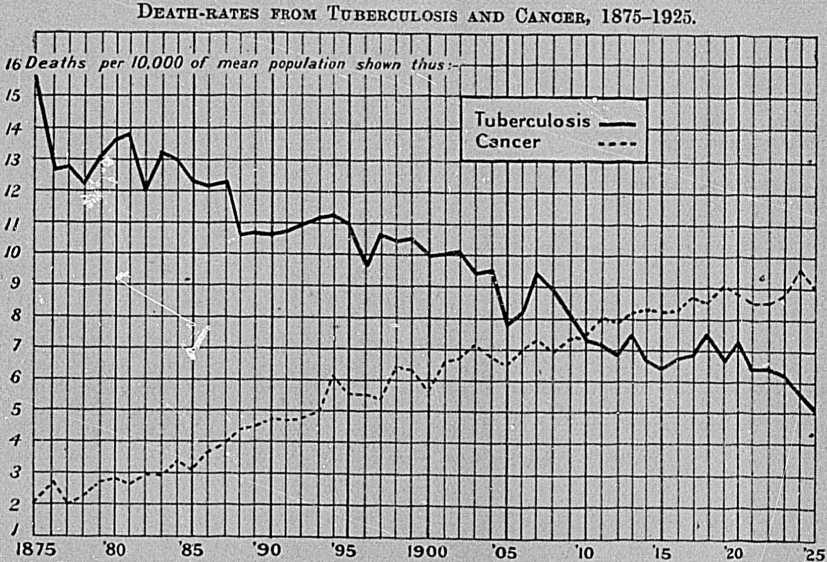
The next table shows the proportion of deaths from cancer to the 10,000 of mean population in some of the principal countries of the world. The rates are an average of the latest available period of from three to five years. Of the countries covered by the table, nine had higher rates than New Zealand.
| CANCER DEATH-RATES PER 10,000 LIVING IN CERTAIN COUNTRIES. | ||
|---|---|---|
| Country. | Period. | Death-rate per 10,000 of Population. |
* Exclusive of Quebec. † Registration area. | ||
| Ceylon | 1920–24 | 1.0 |
| British Guiana | 1922–24 | 1.2 |
| Jamaica | 1920–24 | 1.9 |
| Chile | 1919–23 | 3.8 |
| Spain | 1919–23 | 6.1 |
| Hungary | 1918–22 | 6.6 |
| Italy | 1919–23 | 6.8 |
| Japan | 1920–24 | 7.0 |
| Uruguay | 1919–23 | 7.2 |
| Belgium | 1919–23 | 7.5 |
| Canada* | 1921–24 | 7.8 |
| United States† | 1919–23 | 8.5 |
| Australia | 1920–24 | 8.9 |
| New Zealand | 1921–25 | 8.9 |
| Germany | 1919–23 | 10.0 |
| Northern Ireland | 1920–24 | 10.3 |
| Sweden | 1918–20 | 10.6 |
| Netherlands | 1919–23 | 11.2 |
| England and Wales | 1920–24 | 12.3 |
| Scotland | 1920–24 | 12.6 |
| Austria | 1919–23 | 12.8 |
| Switzerland | 1918–22 | 12.9 |
| Denmark | 1920–24 | 13.7 |
The international table shows very clearly the comparative immunity of the coloured races to cancer, and the much smaller liability of Southern than Northern Europeans to the disease.
The following summary shows the types of cancer returned in the death entries for the year 1925:—
| Type. | Deaths. | ||
|---|---|---|---|
| Males. | Females. | Total. | |
| Carcinoma | 425 | 422 | 847 |
| Sarcoma | 22 | 28 | 50 |
| Melanotic sarcoma | .. | 3 | 3 |
| Fibro-sarcoma | .. | 1 | 1 |
| Lympho-sarcoma | 2 | 1 | 3 |
| Epithelioma | 23 | 8 | 31 |
| Endothelioma | 1 | .. | 1 |
| Rodent ulcer | 5 | 2 | 7 |
| Paget's disease | 1 | 1 | 2 |
| Scirrhus | .. | 6 | 6 |
| Malignant tumour | 1 | 5 | 6 |
| Malignant papilloma | 1 | .. | 1 |
| Malignant ulceration | 1 | .. | 1 |
| Malignant growth | 2 | 3 | 5 |
| Malignant disease | 15 | 11 | 26 |
| Cancer | 113 | 104 | 217 |
| Totals | 612 | 595 | 1,207 |
The parts of the body most commonly affected in New Zealand are the stomach and liver. Among females the generative and mammary organs are frequently the seat of the disease. Full details of location are published in the “Annual Report on the Vital Statistics.”
| CANCER: SEAT OF DISEASE, 1925. | |||
|---|---|---|---|
| Seat of Disease. | Males. | Females. | Total. |
| Buccal cavity | 52 | 6 | 58 |
| Stomach and liver | 277 | 154 | 431 |
| Peritoneum, intestines, rectum | 105 | 104 | 209 |
| Female genital organs | .. | 126 | 126 |
| Breast | .. | 114 | 114 |
| Skin | 20 | 8 | 28 |
| Other organs or organs not specified | 158 | 83 | 241 |
| Totals | 612 | 595 | 1,207 |
Eighty-nine per cent. of the deaths from cancer during 1925 were at ages 45 years and upwards, and 58 per cent. at ages 60 years and upwards. Females predominate up to age 55, and males thereafter, as is evidenced by the following table, which shows by age-groups the number of persons of each sex who died of cancer during 1925.
| AGES OF PERSONS WHO DIED FROM CANCER, 1925. | |||
|---|---|---|---|
| Ages, in Years. | Males. | Females. | Total. |
| Under 5 | 1 | .. | 1 |
| 5 and under 10 | .. | 4 | 4 |
| 10 ,, 15 | 1 | .. | 1 |
| 15 ,, 20 | 1 | 1 | 2 |
| 20 ,, 25 | 0 | 2 | 4 |
| 25 ,, 30 | 3 | 3 | 6 |
| 30 ,, 35 | 4 | 15 | 19 |
| 35 ,, 40 | 11 | 18 | 29 |
| 40 ,, 45 | 16 | 52 | 68 |
| 45 and under 50 | 38 | 72 | 110 |
| 50 ,, 55 | 48 | 75 | 121 |
| 55 ,, 60 | 77 | 68 | 145 |
| 60 ,, 65 | 88 | 75 | 163 |
| 65 ,, 70 | 109 | 65 | 174 |
| 70 ,, 75 | 93 | 58 | 151 |
| 75 ,, 80 | 65 | 40 | 105 |
| 80 and upwards | 57 | 47 | 104 |
| Totals | 612 | 595 | 1,207 |
Exhaustive statistical inquiry covering the period from 1872 to date has shown that in New Zealand death from cancer is, on the average, now occurring later in life than formerly. It would seem that this is the case even if allowance be made for the fact that the age-constitution of the Dominion is increasing—i.e., that the average citizen of New Zealand is now older than the average citizen of ten, twenty, or fifty years ago.
In point of numbers of deaths puerperal accidents and diseases do not rank high among causes of death. Nevertheless, owing to the association between the maternal death-rate and the all-important matter of the birth-rate, deaths from puerperal causes are of special importance and significance.
In recent years New Zealand has had a comparatively high death-rate from puerperal causes when considered in relation to the number of births rather than on a population basis. The rate for each year since 1872 is as follows:—
| Year. | Proportion per 1,000 Children born. |
|---|---|
| 1872 | 4.26 |
| 1873 | 4.63 |
| 1874 | 5.76 |
| 1875 | 6.44 |
| 1876 | 4.58 |
| 1877 | 4.39 |
| 1878 | 4.78 |
| 1879 | 4.48 |
| 1880 | 3.93 |
| 1881 | 4.91 |
| 1882 | 5.31 |
| 1883 | 4.95 |
| 1884 | 6.90 |
| 1885 | 7.31 |
| 1886 | 5.75 |
| 1887 | 4.96 |
| 1888 | 5.87 |
| 1889 | 4.23 |
| 1890 | 5.42 |
| 1891 | 5.20 |
| 1892 | 4.53 |
| 1893 | 4.29 |
| 1894 | 5.99 |
| 1895 | 5.45 |
| 1896 | 4.67 |
| 1897 | 4.38 |
| 1898 | 4.80 |
| 1899 | 4.57 |
| 1900 | 3.84 |
| 1901 | 4.39 |
| 1902 | 5.33 |
| 1903 | 5.86 |
| 1904 | 4.66 |
| 1905 | 4.22 |
| 1906 | 3.88 |
| 1907 | 4.62 |
| 1908 | 4.59 |
| 1909 | 5.09 |
| 1910 | 4.50 |
| 1911 | 4.33 |
| 1912 | 3.64 |
| 1913 | 3.58 |
| 1914 | 4.16 |
| 1915 | 4.70 |
| 1916 | 5.86 |
| 1917 | 5.98 |
| 1918 | 5.18 |
| 1919 | 5.06 |
| 1920 | 6.48 |
| 1921 | 5.08 |
| 1922 | 5.14 |
| 1923 | 5.11 |
| 1924 | 5.00 |
| 1925 | 4.65 |
During the fifty-odd years covered by the table the rate has ranged between 3.58 and 7.31 per 1,000 live births registered, the lowest rate being in 1913 and the highest in 1885. It is noticeable that in the cases of both lowest and highest rates neighbouring years rank first and second on the list. The rate for 1920 (when the proportion of first births was high) was the third highest on record, having been exceeded only in 1884 and 1885, but it is gratifying to see that this high rate was not maintained, the four years following remaining fairly stationary at a comparatively low proportion, and 1925 showing a further fall.
The figures for years subsequent to 1915 are somewhat disadvantageously placed for purposes of comparison with earlier years. Commencing with 1916, special inquiry has been made in all cases where a woman of child-bearing age has been returned as having died of such causes as septicæmia, peritonitis, nephritis, &c. (without qualification), with the result that in each year, several of such cases are found to be puerperal, and are now so classed. Possibly this factor also affects to a certain extent comparison with other countries, and in any case the possibility of different treatment between one country and another as regards puerperal accidents and diseases and associated causes should not be overlooked when comparing New Zealand with other countries.
The considerable increase which occurred in the years immediately following 1915 in the figures for puerperal septicæmia would suggest that the alteration in the system referred to was entirely responsible for the corresponding increases in the total maternal deaths. The indications, however, are that the change was only partly responsible. During the five years 1911–15 deaths shown as being due to puerperal septicæmia averaged 26 per annum, and during the next five years 55 per annum, an increase of 29. The corresponding figures for non-puerperal or undefined septicæmia of women of the child-bearing ages were 16 and 4 for the respective quinquennia, a decrease of only 12.
The next table shows the number of deaths from puerperal causes during each of the last ten years, classified in the eight groups into which such causes are divided in the international classification.
| DEATHS FROM PUERPERAL CAUSES, BY GROUPS, 1916–25. | ||||||||||
|---|---|---|---|---|---|---|---|---|---|---|
| Group. | 1916. | 1917 | 1918. | 1910. | 1920. | 1921. | 1922. | 1923. | 1924. | 1925. |
* Mainly deaths from puerperal mania. | ||||||||||
| Accidents of pregnancy | 27 | 27 | 15 | 9 | 26 | 9 | 13 | 17 | 15 | 10 |
| Puerperal hæmorrhage | 20 | 18 | 11 | 10 | 40 | 18 | 22 | 26 | 19 | 24 |
| Other accidents of labour | 26 | 16 | 19 | 11 | 12 | 10 | 13 | 4 | 6 | 7 |
| Puerperal septicæmia | 60 | 59 | 48 | 52 | 67 | 48 | 52 | 52 | 52 | 42 |
| Puerperal phlegmasia alba dolens, embolus, sudden death | 5 | 8 | 10 | 4 | 9 | 18 | 12 | 8 | 11 | 14 |
| Puerperal albuminuria and convulsions | 24 | 37 | 30 | 36 | 37 | 41 | 35 | 34 | 36 | 32 |
| Following childbirth (not otherwise defined)* | 5 | 4 | 1 | 1 | 3 | 1 | 2 | 2 | 1 | 2 |
| Puerperal diseases of the breast.. | .. | .. | 1 | .. | .. | .. | .. | .. | .. | |
| Totals | 167 | 169 | 134 | 124 | 194 | 145 | 149 | 143 | 140 | 131 |
A table showing the number and the rate per 1,000 births of deaths from puerperal septicæmia and other puerperal causes separately in some of the principal countries of the world is given below. As a consequence of the comparatively low rates that have been experienced in the Dominion during the last five years, New Zealand now occupies a much more favourable position in the international comparison than was the case a few years since.
| DEATHS FROM PUERPERAL CAUSES IN VARIOUS COUNTRIES. | ||||
|---|---|---|---|---|
| Country. | Period. | Death-rate per 1,000 Births from | ||
| Puerperal Septicaemia. | Other Puerperal Causes. | All Puerperal Causes. | ||
* Exclusive of Quebec. † Registration Area. | ||||
| Denmark | 1919–23 | 1.07 | 0.99 | 2.06 |
| Netherlands | 1919–23 | 0.82 | 1.76 | 2.58 |
| Italy | 1919–23 | 1.04 | 1.71 | 2.75 |
| Uruguay | 1919–23 | 1.75 | 1.13 | 2.88 |
| Japan | 1920–24 | 1.28 | 211 | 3.39 |
| England and Wales | 1920–24 | 1.45 | 2.50 | 3.95 |
| Australia | 1920–24 | 1.69 | 3.27 | 4.96 |
| New Zealand | 1921–25 | 1.74 | 3.28 | 5.00 |
| Irish Free State | 1920–24 | 2.11 | 2.91 | 502 |
| Germany | 1919–23 | 2.78 | 2.26 | 504 |
| Jamaica | 1920–24 | 1.09 | 4.08 | 5.17 |
| Northern Ireland | 1920–24 | 1.95 | 3.30 | 5.25 |
| Spain | 1918–22 | 3.38 | 1.96 | 5.34 |
| Switzerland | 1918–22 | 2.82 | 2.60 | 5.42 |
| Canada* | 1921–24 | 1.41 | 4.12 | 5.53 |
| Belgium | 1919–23 | 2.52 | 3.16 | 5.68 |
| Scotland | 1920–24 | 1.89 | 4.38 | 6.27 |
| United States† | 1919–23 | 2.56 | 4.52 | 7.08 |
| Chile | 1919–23 | 2.24 | 6.00 | 8.24 |
| British Guiana | 1922–24 | 2.85 | 11.48 | 14.33 |
| Ceylon | 1920–24 | 8.23 | 11.69 | 19.92 |
Deaths from violence,, apart from suicide, claim approximately 6 per cent. of the total deaths. The number of deaths and the rate per 1,000,000 of mean population of persons dying from the various forms of violent deaths in 1911, 1915, 1920, and 1925 are given in the next table. The year 1911 was chosen in preference to 1910 on account of the latter year not being for all purposes strictly comparable with recent years.
| Causes of Death. | Number of Deaths. | Rate per 1,000,000 of Mean Population. | ||||||
|---|---|---|---|---|---|---|---|---|
| 1911. | 1915. | 1920. | 1925. | 1911. | 1915. | 1920. | 1925. | |
| Accidents— | ||||||||
| Poisoning | 17 | 10 | 12 | 14 | 17 | 9 | 10 | 10 |
| Conflagration | .. | 13 | 5 | 18 | .. | 12 | 4 | 13 |
| Burns and scalds | 69 | 41 | 35 | 31 | 68 | 37 | 29 | 23 |
| Died under anæsthetic, asphyxia, &c. | 27 | 29 | 18 | 29 | 27 | 26 | 15 | 22 |
| Drowning | 162 | 150 | 150 | 131 | 160 | 136 | 126 | 99 |
| Firearms | 18 | 13 | 24 | 20 | 18 | 13 | 20 | 15 |
| Falls | 22 | 68 | 45 | 70 | 21 | 62 | 38 | 53 |
| Mines and quarries | 25 | 21 | 3 | 17 | 25 | 19 | 3 | 13 |
| Crushing | 99 | 173 | 165 | 218 | 98 | 157 | 138 | 164 |
| Injuries by animals | 26 | 8 | 4 | 8 | 25 | 8 | 4 | 6 |
| Homicide | 5 | 15 | 16 | 15 | 4 | 14 | 13 | 11 |
| Fractures (causes not specified) | 41 | 32 | 26 | 22 | 40 | 29 | 22 | 17 |
| Other | 79 | 50 | 62 | 43 | 78 | 45 | 52 | 32 |
| Totals | 590 | 623 | 565 | 636 | 581 | 567 | 474 | 478 |
Deaths from violence show a decided downward trend, the total decrease in the rate since 1911 being 18 per cent. This is all the more remarkable when it is seen that the death-rate from accidents arising from the use of railways, motor-cars, and other vehicles rose during the same period from 98 to 164 per 1,000,000 living. This equals a percentage of 65. There is no doubt that the rise in the rate of deaths from this class is due to the increasing congestion of the public streets and the increased use of motor-cars and other motor-vehicles. On the other hand, noticeable decreases are shown for drowning, burns and scalds, injuries by animals, and fractures (cause not specified). Traumatism in mines and quarries also records a considerable decrease.
The suicidal deaths in 1925 were 173—males 138, and females 35—the death-rate per 10,000 of mean population being 1.30. The figures for each of the last five years are as follows:—
| Year. | Number of Deaths. | Rate per 10,000 of Population. | ||||
|---|---|---|---|---|---|---|
| Males. | Females. | Both Sexes. | Males. | Females. | Both Sexes. | |
| 1921 | 127 | 30 | 157 | 2.06 | 0.49 | 1.28 |
| 1922 | 130 | 34 | 164 | 2.04 | 0.55 | 1.31 |
| 1923 | 110 | 23 | 133 | 1.69 | 0.37 | 1.04 |
| 1924 | 127 | 32 | 159 | 1.92 | 0.50 | 1.22 |
| 1925 | 138 | 35 | 173 | 2.03 | 0.54 | 1.30 |
The rate for 1925 is somewhat higher than the average of the five preceding years—1.20 per 10,000.
The next table shows the means of self-destruction employed in New Zealand in each of the years 1921–25:—
| Mode of Death. | 1921. | 1922. | 1923. | 1924. | 1925. |
|---|---|---|---|---|---|
| Suicide by solid or liquid poisons | 21 | 19 | 7 | 14 | 17 |
| Suicide by corrosive substances | 16 | 13 | 5 | ||
| Suicide by poisonous gas | 6 | 12 | 7 | 24 | 17 |
| Suicide by hanging or strangulation | 32 | 40 | 28 | 30 | 41 |
| Suicide by drowning | 25 | 23 | 19 | 20 | 30 |
| Suicide by firearms | 36 | 38 | 23 | 32 | 31 |
| Suicide by cutting or piercing instruments | 24 | 22 | 24 | 24 | 25 |
| Suicide by jumping from high places | 1 | 3 | 4 | .. | 1 |
| Suicide by crushing | 1 | .. | 9 | .. | 1 |
| Suicide by other means | 11 | 164 | 3 | 2 | 5 |
| Totals | 157 | 133 | 159 | 173 |
The greatest number of deaths from suicide over the period covered was from hanging or strangulation (171), closely followed by firearms (160), while cutting or piercing instruments (119), drowning (117), and poison (112) were next in the order given.
A comparison of the average rates for the latest quinquennial periods available for the undermentioned countries is as follows:—
| Country. | Quinquennium. | Rate per 10,000 of Population. |
|---|---|---|
* Registration area. | ||
| Jamaica | 1920–24 | 0.14 |
| Chile | 1919–23 | 0.32 |
| Northern Ireland | 1820–24 | 0.37 |
| Spain | 1919–23 | 0.39 |
| Ceylon | 1920–24 | 0.51 |
| Scotland | 1920–24 | 0.60 |
| Netherlands | 1919–23 | 0.67 |
| Italy | 1919–23 | 0.78 |
| England and Wales | 1920–24 | 0.97 |
| Finland | 1918–22 | 1.04 |
| Australia | 1920–24 | 1.09 |
| United States* | 1919–23 | 1.15 |
| New Zealand | 1921–25 | 1.23 |
| Uruguay | 1919–23 | 1.29 |
| Denmark | 1919–23 | 1.39 |
| Sweden | 1920–24 | 1.40 |
| Japan | 1920–24 | 1.93 |
| Austria | 1918 22 | 2.12 |
| Germany | 1919–23 | 2.14 |
| Switzerland | 1918–22 | 2.19 |
| Hungary | 1918–22 | 2.28 |
New Zealand compares favourably with most of the foreign countries shown in the above table, but unfavourably with other British countries.
In quite 50 per cent. of death entries, more than one definite disease is recorded, without taking into account indefinite conditions such as debility, coma, heart - failure, syncope, &c. In such cases it is necessary to decide which of the two or more diseases is to be assigned as the cause of death.
Certain general rules of procedure, applicable in the great majority of cases, are laid down by the international classification of causes of death. The United States Bureau of Vital Statistics has compiled a Manual of Joint Causes of Death, which follows the lines of the international classification, but gives very full details and thus permits of a much greater degree of uniformity in the use of the classification. The United States Manual has been adopted in New Zealand.
Beginning with the year 1924, a detailed tabulation of assigned and associated causes of death has been instituted, and the details are published in the Annual Report on Vital Statistics. The following table gives for 1925 a summary of the principal contributory causes, shown in juxtaposition to the totals for the same diseases when treated as assigned causes:—
| Disease. | Assigned Causes of Death of | Contributory Causes of Death of | ||||
|---|---|---|---|---|---|---|
| Males. | Females. | Total. | Males. | Females. | Total. | |
| Influenza | 51 | 35 | 86 | 7 | 21 | 28 |
| Septicæmia (non-puerperal) | 24 | 10 | 34 | 46 | 32 | 78 |
| Rheumatism | 28 | 21 | 49 | 15 | 22 | 37 |
| Anæmia | 43 | 43 | 86 | 14 | 22 | 36 |
| Diseases of thyroid | 12 | 62 | 74 | 1 | 9 | 10 |
| Alcoholism | 17 | .. | 17 | 15 | 4 | 19 |
| Meningitis | 40 | 28 | 68 | 21 | 15 | 36 |
| Cerebral hæmorrhage, apoplexy | 302 | 381 | 683 | 71 | 70 | 141 |
| Paralysis | 34 | 33 | 67 | 40 | 28 | 68 |
| Mental alienation | 43 | 21 | 64 | 5 | 8 | 13 |
| Infantile convulsions | 31 | 20 | 51 | 30 | 20 | 50 |
| Diseases of the heart | 1,066 | 865 | 1,931 | 109 | 113 | 222 |
| Diseases of arteries | 110 | 41 | 151 | 91 | 63 | 154 |
| Embolism and thrombosis | 15 | 12 | 27 | 18 | 14 | 32 |
| Bronchitis | 155 | 161 | 316 | 97 | 84 | 181 |
| Broncho-pneumonia | 115 | 100 | 215 | 48 | 31 | 79 |
| Pneumonia | 165 | 127 | 292 | 64 | 44 | 108 |
| Pleurisy | 26 | 14 | 40 | 26 | 16 | 42 |
| Pulmonary congestion | 30 | 22 | 52 | 74 | 85 | 159 |
| Asthma | 16 | 14 | 30 | 34 | 32 | 66 |
| Other diseases of respiratory system | 43 | 7 | 50 | 52 | 36 | 88 |
| Diseases of the stomach | 75 | 32 | 107 | 23 | 19 | 42 |
| Diarrhœa and enteritis | 61 | 46 | 107 | 16 | 16 | 32 |
| Hernia, intestinal obstruction | 63 | 47 | 110 | 31 | 30 | 61 |
| Other diseases of intestines | 12 | 13 | 25 | 6 | 8 | 14 |
| Biliary calculi | 6 | 22 | 28 | 9 | 6 | 15 |
| Other diseases of the liver | 50 | 43 | 93 | 18 | 27 | 45 |
| Peritonitis | 15 | 26 | 41 | 73 | 50 | 123 |
| Nephritis | 233 | 163 | 396 | 21 | 21 | 42 |
| Other diseases of the kidneys | 39 | 26 | 65 | 29 | 19 | 48 |
| Diseases of the bladder | 17 | 4 | 21 | 38 | 11 | 49 |
| Diseases of the prostate | 67 | .. | 67 | 26 | .. | 26 |
| Gangrene | 15 | 6 | 21 | 32 | 13 | 45 |
| Acute abscess | 11 | 7 | 18 | 12 | 10 | 22 |
| Senility | 454 | 325 | 779 | 203 | 175 | 378 |
It will be noticed that diseases of the respiratory system rank very high among the contributory causes, mainly on account of their frequent occurrence as complications of heart-disease and of influenza and other epidemic diseases.
The following indicates for 1925 the principal assigned causes with which certain contributory causes were associated.
| CONTRIBUTORY CAUSES.—PRINCIPAL ASSOCIATIONS, 1925. | ||
|---|---|---|
| Contributory Cause. | Assigned Cause with which associated. | Number of Cases in which associated. |
| Influenza | Diseases of the heart | 13 |
| Septicæmia (non-puerperal) | Diseases of bones | 11 |
| Rheumatism | Diseases of the heart | 24 |
| Anæmia | Cancer | 10 |
| Meningitis | Influenza | 12 |
| Cerebral hæmorrhage, apoplexy | Diseases of the heart | 71 |
| Nephritis | 37 | |
| Paralysis | Cerebral hæmorrhage, apoplexy | 33 |
| Diseases of the heart | 16 | |
| Infantile convulsions | Premature birth | 11 |
| Diarrhœa and enteritis | 10 | |
| Diseases of the heart | Chronic nephritis | 54 |
| Cancer | 25 | |
| Acute rheumatic fever | 16 | |
| Tuberculosis | 16 | |
| Diabetes mellitus | 15 | |
| Exophthalmic goitre | 15 | |
| Diseases of arteries | Cerebral hæmorrhage, apoplexy | 62 |
| Diseases of the heart | 49 | |
| Nephritis | 19 | |
| Bronchitis | Diseases of the heart | 94 |
| Influenza | 13 | |
| Broncho-pneumonia | 13 | |
| Cerebral hæmorrhage, apoplexy | 11 | |
| Broncho-pneumonia | Whooping-cough | 11 |
| Pneumonia | Influenza | 27 |
| Diseases of the heart | 12 | |
| Pleurisy | Pneumonia | 12 |
| Pulmonary congestion | Diseases of the heart | 51 |
| Bronchitis | 16 | |
| Cerebral hæmorrhage, apoplexy | 15 | |
| Nephritis | 10 | |
| Asthma | Diseases of the heart | 29 |
| Bronchitis | 23 | |
| Other diseases of respiratory system | Tuberculosis of respiratory system | 38 |
| Acute anterior poliomyelitis | 17 | |
| Intestinal obstruction | Cancer | 34 |
| Appendicitis | 11 | |
| Peritonitis | Appendicitis | 54 |
| Ulcer of stomach and duodenum | 18 | |
| Cancer | 15 | |
| Gall-stones | Diseases of the heart | 10 |
| Other diseases of the liver | Diseases of the heart | 12 |
| Nephritis | Diseases of the heart | 19 |
| Other diseases of the kidneys | Diseases of the heart | 16 |
| Diseases of the prostate | 10 | |
| Diseases of the bladder | Diseases of the kidneys | 17 |
| Diseases of the prostate | 13 | |
| Gangrene | Diseases of arteries | 12 |
| Senility | Diseases of the heart | 127 |
| Bronchitis | 63 | |
| Cerebral hæmorrhage, apoplexy | 41 | |
| Pulmonary congestion | 22 | |
| Gangrene | 19 | |
| Diseases of the arteries | 13 | |
| Nephritis | 10 | |
Deaths of Maoris are not included in the statistics quoted throughout this subsection, their omission being due to the fact that a considerably lower standard of accuracy and completeness of data exists in the case of Maori registrations than in the general death records. Registrations of Maori deaths during each of the last five years have been as follows: —
| MAORI DEATHS, 1921–25. | ||||||
|---|---|---|---|---|---|---|
| Year. | Numbers. | Rates per 1,000 of Maori Population. | ||||
| Males. | Females. | Total. | Males. | Females. | Total. | |
| 1921 | 463 | 379 | 842 | 16.59 | 15.26 | 15.96 |
| 1922 | 474 | 439 | 913 | 16.86 | 17.48 | 17.15 |
| 1923 | 421 | 341 | 762 | 14.87 | 13.46 | 14.21 |
| 1924 | 406 | 367 | 773 | 14.26 | 14.38 | 14.32 |
| 1925 | 437 | 381 | 818 | 15.13 | 14.70 | 14.96 |
The average rate over the period was 15 per 1,000, as compared with less than 9 per 1,000 in the case of the general population. The rates for the two sexes are much more nearly equal for Maoris than for the rest of the population, the female rate being indeed higher than the male in two of the five years covered. Over the average of the five years the male rate among Maoris was only 3 per cent. higher than the female, as compared with a corresponding percentage excess of 24 among the general population.
Formerly the only statistics available concerning Maori deaths were mere numbers of deaths according to sex. A tabulation was, however, made in 1925 for the five years 1920–24 on the basis of age and cause of death, and similar tabulations will be made quinquennially in future. The ages of Maoris whose deaths were registered during the five years 1920–24 are as follows:—
| MAORI DEATHS, 1920–24.—AGES AT DEATH. | |||
|---|---|---|---|
| Age, in Years. | Males. | Females. | Total. |
| Under 1 | 452 | 325 | 777 |
| 1 and under 5 | 255 | 229 | 484 |
| 5 ,, 10 | 126 | 108 | 234 |
| 10 ,, 15 | 117 | 129 | 246 |
| 15 ,, 20 | 119 | 150 | 269 |
| 20 ,, 25 | 102 | 144 | 246 |
| 25 ,, 30 | 101 | 96 | 197 |
| 80 ,, 35 | 57 | 72 | 129 |
| 35 ,, 40 | 77 | 73 | 150 |
| 40 ,, 45 | 48 | 69 | 117 |
| 45 ,, 50 | 83 | 59 | 142 |
| 50 ,, 55 | 75 | 61 | 136 |
| 55 ,, 60 | 84 | 56 | 140 |
| 60 and under 65 | 102 | 46 | 148 |
| 65 ,, 70 | 91 | 58 | 149 |
| 70 ,, 75 | 125 | 61 | 186 |
| 75 ,, 80 | 75 | 50 | 125 |
| 80 ,, 85 | 65 | 60 | 125 |
| 85 ,, 90 | 32 | 27 | 59 |
| 90 ,, 95 | 20 | 42 | 62 |
| 95 ,, 100 | 8 | 14 | 22 |
| 100 and over | 14 | 3 | 17 |
| Unspecified | 20 | 25 | 45 |
| Totals | 2,248 | 1,957 | 4,205 |
A summary is also given showing the number of deaths from the principal causes and groups of causes, the corresponding figures for the general population also being shown, together with the proportions borne by the two sets of figures to each other. For every Maori in the Dominion there are 21 Europeans, so that distance below or above this number in the last column indicates the extent to which the various causes show higher or lower rates for Maoris than for the genéral population.
| Cause of Death. | Maoris. | Others. | Deaths of others per Maori Death. | ||
|---|---|---|---|---|---|
| Males. | Females | Total. | |||
| Typhoid fever | 64 | 57 | 121 | 173 | 1 ½ |
| Measles | 14 | 16 | 30 | 229 | 7 ½ |
| Whooping-cough | 22 | 36 | 58 | 246 | 4 |
| Diphtheria | 6 | 5 | 11 | 418 | 38 |
| Influenza | 128 | 110 | 238 | 1,144 | 5 |
| Dysentery | 10 | 5 | 15 | 24 | 1 ½ |
| Other epidemic and endemic diseases | 10 | 10 | 20 | 329 | 16 ½ |
| Tuberculosis of the respiratory system | 400 | 457 | 857 | 3,153 | 3 ½ |
| Other forms of tuberculosis | 60 | 43 | 103 | 822 | 8 |
| Other infectious diseases | 14 | 9 | 23 | 310 | 13 ½ |
| Cancer | 41 | 29 | 70 | 5,499 | 78 ½ |
| Rheumatism and gout | 19 | 8 | 27 | 338 | 12 ½ |
| Other general diseases | 17 | 16 | 33 | 1,972 | 60 |
| Simple meningitis | 19 | 11 | 30 | 449 | 15 |
| Infantile convulsions | 33 | 20 | 53 | 273 | 5 |
| Other diseases of nervous system, &c. | 48 | 26 | 74 | 4,848 | 65 ½ |
| Diseases of the heart | 63 | 67 | 130 | 9,263 | 71 |
| Other diseases of circulatory system | 5 | 14 | 19 | 1,056 | 55 ½ |
| Bronchitis | 53 | 48 | 101 | 1,608 | 16 |
| Broncho-pneumonia | 60 | 31 | 91 | 1,079 | 12 |
| Pneumonia | 189 | 146 | 335 | 2,007 | 6 |
| Asthma | 24 | 12 | 36 | 132 | 3 ½ |
| Other diseases of respiratory system | 58 | 56 | 114 | 800 | 7 |
| Diseases of the stomach | 25 | 24 | 49 | 455 | 9 |
| Diarrhœa and enteritis | 68 | 63 | 131 | 905 | 7 |
| Appendicitis | 13 | 3 | 16 | 472 | 29 ½ |
| Hernia, intestinal obstruction | 16 | 5 | 21 | 480 | 23 |
| Diseases of the liver | 13 | 1 | 14 | 518 | 37 |
| Other diseases of digestive system | 15 | 17 | 32 | 468 | 14 ½ |
| Nephritis | 16 | 7 | 23 | 1,743 | 76 |
| Other diseases of genito-urinary system | 13 | 17 | 30 | 923 | 31 |
| Puerperal state | .. | 71 | 71 | 771 | 11 |
| Diseases of skin and of cellular tissue | 6 | 3 | 9 | 255 | 28 ½ |
| Diseases of bones and of organs of locomotion | 5 | 5 | 10 | 181 | 18 |
| Malformations | 12 | 8 | 20 | 799 | 40 |
| Premature birth | 22 | 23 | 45 | 1,971 | 44 |
| Other diseases peculiar to early infancy | 71 | 44 | 115 | 1,577 | 14 |
| Old age | 210 | 198 | 408 | 4,367 | 10 ½ |
| Suicide | 16 | 4 | 20 | 746 | 37 |
| Homicide | 2 | 1 | 3 | 67 | 22 ½ |
| Accident | 173 | 55 | 228 | 2,859 | 12 ½ |
| Ill-defined or not stated | 195 | 176 | 371 | 317 | 1 |
| Totals | 2,248 | 1,957 | 4,205 | 56,046 | 13 ½ |
A wide range is disclosed between the proportions for the various diseases, the number of deaths of Europeans to every Maori death varying between 1 ½ in the case of typhoid fever and dysentery and 78 ½ in the case of cancer. With the exception of diphtheria, epidemic and infectious diseases generally exact a much heavier toll proportionately among Maoris than among the general population, the most noteworthy example being tuberculosis, particularly of the respiratory system. Other diseases of the respiratory system also show much higher rates for Maoris than for Europeans, and the same state of affairs is disclosed for diarrhœal diseases and stomach complaints.
On the other hand, there is a much lower mortality among Maoris from certain diseases which rank high as causes of death among the European population. Principal among these are cancer, heart-disease and other diseases of the circulatory system, nephritis, the group of general diseases which includes diabetes and exophthalmic goitre, and the group of diseases of the nervous system which includes apoplexy and cerebral hæmorrhage. Malformations and premature births show lower rates for Maoris than for Europeans, but the indefinite nature of the data in the registration entries covering the deaths of many infants may be partly responsible. The proportion between Europeans and Maori deaths from malformations and the group “early infancy” taken in conjunction (the pre-natal causes) works out at 24 to 1, which, after allowing for the factor referred to, agrees fairly closely with the population proportions quoted above.
As regards infantile mortality in general, however, the Maori rate is much higher than the European, principally owing to the ravages of epidemic diseases, tuberculosis, respiratory diseases, and diarrhœal diseases. The infantile-mortality rate for the first year of life was, for the five years 1920–24, 131 per 1,000 births in the case of Maoris, as compared with 45 per 1,000 among European infants, and this in spite of the fact that for the first month of life the Maori rate was actually lower than the European (27 as against 28). Among Maori infants who survived the first month, the death-rate during the succeeding eleven months was 90 per 1,000, as compared with only 16 per 1,000 in the case of Europeans.
A table is given showing principal causes of deaths of Maori infants under one year, classified according to age.
| MAORI INFANTILE MORTALITY, 1920–24.—CAUSES AND AGES. | ||||||||||||
|---|---|---|---|---|---|---|---|---|---|---|---|---|
| Cause of Death. | Under 1 Day. | Day and under 2 Days. | 2 Days and under 1 Week. | 1 Week and under 2 Weeks. | 2 Weeks and under 3 Weeks. | 3Weeks and under 1 Months. | 1 Month and under 2 Months. | 2 Months and under 3 Months. | 3 Months and under 6 Months. | 6 Months and under 9 Months. | 9 Months and under 12 Months. | Total. |
| Typhoid fever | .. | .. | .. | .. | .. | .. | .. | .. | .. | 2 | 1 | 3 |
| Measles | .. | .. | .. | .. | .. | .. | 1 | 1 | .. | 4 | 10 | 16 |
| Whooping-cough | .. | .. | .. | .. | .. | 2 | 2 | 3 | 16 | 6 | 3 | 32 |
| Diphtheria | .. | .. | .. | .. | .. | .. | .. | .. | .. | 4 | .. | 4 |
| Influenza | .. | 1 | .. | .. | 2 | .. | 2 | 2 | 9 | 8 | 6 | 30 |
| Dysentery | .. | .. | .. | 1 | .. | .. | .. | 1 | .. | 2 | 1 | 5 |
| Tuberculosis | .. | .. | .. | .. | .. | .. | .. | 1 | 6 | 10 | 13 | 30 |
| Venereal disease | .. | .. | .. | 1 | .. | 2 | .. | .. | .. | .. | .. | 3 |
| Infantile convulsions | .. | .. | 2 | .. | .. | 1 | 4 | 3 | 6 | 10 | 9 | 35 |
| Bronchitis | .. | .. | .. | 2 | 2 | 2 | 4 | 4 | 6 | 13 | 5 | 38 |
| Broncho-pneumonia | .. | .. | 1 | .. | 1 | .. | 2 | 1 | 11 | 11 | 9 | 36 |
| Pneumonia | .. | .. | .. | .. | 2 | 2 | 7 | 9 | 24 | 19 | 28 | 91 |
| Other respiratory diseases | .. | 1 | .. | 1 | 2 | 2 | 6 | 9 | 13 | 11 | 10 | 55 |
| Diseases of stomach | .. | .. | .. | .. | 1 | 1 | 3 | 2 | 4 | 7 | 4 | 22 |
| Diarrhoea and enteritis | .. | .. | .. | .. | 2 | 2 | 5 | 4 | 19 | 18 | 15 | 65 |
| Hernia, intestinal obstruction | .. | .. | .. | .. | .. | .. | 1 | .. | 3 | 2 | 2 | 8 |
| Congenital malformations | .. | 2 | 5 | .. | 2 | .. | 4 | .. | 2 | .. | 1 | 16 |
| Congenital debility, &c. | 11 | 11 | 10 | 9 | 8 | 6 | 9 | 9 | 13 | 14 | 5 | 105 |
| Injury at birth | 1 | .. | 1 | 1 | .. | 1 | .. | .. | .. | .. | .. | 4 |
| Premature birth | 5 | 10 | 12 | 5 | 7 | 1 | 3 | 2 | .. | .. | .. | 45 |
| Other causes peculiar to early infancy | 2 | .. | 3 | .. | .. | .. | .. | .. | .. | .. | .. | 5 |
| Accident | .. | .. | 1 | .. | .. | 3 | 2 | 2 | 2 | .. | 6 | 16 |
| Other defined causes | 1 | .. | .. | 1 | 2 | .. | 3 | 2 | 5 | 5 | 5 | 24 |
| Unspecified or ill-defined | .. | .. | 1 | .. | .. | .. | 6 | 8 | 28 | 29 | 17 | 89 |
| Totals | 20 | 25 | 36 | 21 | 31 | 25 | 64 | 63 | 167 | 175 | 150 | 777 |
As explained in the Births subsection of this book, a system of compulsory registration of deaths is now in force in the Cook Islands.
Particulars required are much the same as in New Zealand proper, but the onus of registering is thrown on the occupier of the house where the death took place, or on any person present at the time of death. If the deceased in his or her last illness was attended by a medical practitioner, a medical certificate must be supplied to the Registrar. Any person conducting a burial or a religious service thereat must notify the nearest Registrar in writing within one week.
The following are the figures of death-registrations in each island during the twelve months ended the 31st December, 1925, or the 31st March, 1926:—
| DEATHS IN COOK ISLANDS, 1925–26. | |
|---|---|
| Island. | Number of Deaths. |
| Rarotonga | 76 |
| Aitutaki | 20 |
| Mangaia | 43 |
| Atiu | 21 |
| Manihiki | 5 |
| Mauke | 15 |
| Rakaanga | 5 |
| Penrhyn | 8 |
| Pukapuka | 11 |
| Niue | 63 |
| Total | 267 |
From the 1st January, 1923, the registration of deaths in Western Samoa was made compulsory, and the regulations issued provided for very complete particulars being furnished to the Registrars. Accurate information of the total deaths, and also the deaths under one year of age, is now available for each of the three years 1923–25, and a table is appended hereunder.
The number of deaths registered during the year 1925 was 857, as compared with 766 in 1924. The death-rate was 23.7 per 1,000 of mean population, as against a rate of 22.5 in the preceding year.
| DEATHS IN WESTERN SAMOA, 1923–25. | ||||
|---|---|---|---|---|
| Year. | Number of Deaths. | Deaths under One Year of Age. | Deaths per 1,000 of Population. | Infantile Mortality Rate. (per 1,000 Births.) |
| 1923 | 1,398 | 349 | 41.5 | 200 |
| 1924 | 766 | 295 | 22.5 | 155 |
| 1925 | 857 | 379 | 23.7 | 186 |
The very high rate shown for the year 19.23 was due to a severe epidemic of dysentery.
DEATH-RATES are of great value as indicating the relative healthiness of different countries or for different years. The statistics of causes of registered deaths are of further use as showing the incidence of fatal diseases or accidents, and as indicating in a general way the relative rise or fall of diseases over a series of years. For instance, the fall in the incidence of tuberculosis and the increase in cancer (discussed in Subsection C of this section) can be readily traced from the records of deaths attributed to these causes in different years.
In comparisons of healthiness based on death-rates, however, the effect of the advance of medical science in recent years is not taken into account. It is common knowledge that many diseases regarded a few decades ago as incurable now give a fair percentage of recoveries. Similarly, the death-rates in epidemics are in general much lower now than formerly, owing partly to the steps taken to prevent the spread of the disease, partly to the necessity of early notification in most countries, and partly to increased medical knowledge. Again, many diseases seldom or never result fatally.
Of recent years much attention has been devoted in different countries to the possibility or otherwise of obtaining reliable statistics of sickness. In certain of the American States an attempt has been made to obtain from medical men returns of all patients dealt with, giving the nature and duration of illness, and similar systems have been inaugurated or proposed in other countries.
In New Zealand certain diseases are notifiable, but beyond this the only record other than that of fatality is the information ascertainable from the returns of discharges from public hospitals. In the absence of full statistics of sickness, how-ever, information from the two sources mentioned is of considerable value, and gives a fair indication of the prevalence of the more important diseases.
The system of notification of certain diseases has been in force in New Zealand for many years, and the list of notifiable diseases has undergone several alterations. The list at present is as follows:—
| A. Notifiable infectious diseases mentioned in Part I of First Schedule of Health Act, 1920:— | |
|---|---|
* In certain circumstances. (Sec letterpress post.) | |
| Anthrax. | Plague (bubonic or pneumonic). |
| Cerebro-spinal fever (cerebro-spinal meningitis). | Puerperal fever (puerperal septicæmia and puerperal sapræmia). |
| Cholera. | Scarlet fever (scarlatina). |
| Dengue. | Smallpox (variola, including varioloid, alastrim, amaas, Cuban itch, and Philippine itch). |
| Diphtheria. | |
| Erysipelas. | |
| Enteric fever (typhoid fever, paratyphoid fever). | Typhus. |
| Leprosy. | Yellow fever. |
| B. Notifiable infectious diseases declared | by Gazette notice: — |
| Dysentery (amœbic and bacillary). | Trachoma (granular conjunctivitis, granular ophthalmia, granular eyelids). |
| Encephalitis lethargica. | |
| Fulminant influenza. | Tuberculosis (pulmonary). |
| Pneumonic influenza. | Septicæmia consequent on abortion or miscarriage. |
| Septicæmic influenza. | |
| Ophthalmia neonatorum. | Syphilis.* |
| Acute primary pneumonia. | Gonorrhœa.* |
| Acute poliomyelitis (infantile paralysis). | Soft chancre.* |
| C. Notifiable diseases, other than infectious, mentioned in Second Schedule:— | |
| Actinomycosis. | Food poisoning (botulismus, ptomaine poisoning). |
| Ankylostomiasis (hookworm disease). | |
| Bilharziosis (endemic hæmaturia, Egyptian hæmaturia). | Chronic lead poisoning. Phosphorus poisoning. |
| Beriberi. | Tetanus. |
| Hydatids. | |
| D. Notifiable disease, other than infectious, declared by Gazette notice:—Eclampsia. | |
Notifications of diseases during 1925 are shown for each month of the year in the following table:—
| Disease. | January. | February. | March. | April | May. | June. | July. | August. | September | October. | November. | December. | Total. |
|---|---|---|---|---|---|---|---|---|---|---|---|---|---|
| Scarlet fever | 90 | 66 | 76 | 78 | 109 | 102 | 118 | 74 | 80 | 71 | 72 | 89 | 1,025 |
| Diphtheria | 121 | 117 | 127 | 97 | 124 | 168 | 185 | 172 | 106 | 99 | 108 | 94 | 1,518 |
| Enteric fever | 24 | 82 | 39 | 23 | 19 | 25 | 18 | 21 | 21 | 26 | 4 | 26 | 278 |
| Tuberculosis | 106 | 114 | 97 | 77 | 87 | 71 | 117 | 109 | 123 | 126 | 131 | 89 | 1,247 |
| Cerebro-spinal meningitis | 5 | 1 | 1 | 3 | 1 | 3 | 1 | 1 | 5 | 2 | 3 | 1 | 27 |
| Poliomyelitis | 224 | 340 | 366 | 120 | 54 | 22 | 10 | 9 | 6 | 5 | 3 | .. | 1,159 |
| Puerperal fever | 19 | 12 | 17 | 18 | 20 | 18 | 30 | 18 | 23 | 27 | 13 | 10 | 225 |
| Influenza (pneumonic) | 6 | 2 | 2 | 6 | 2 | 6 | 6 | 13 | 12 | 8 | 5 | 1 | 69 |
| Pneumonia | 33 | 18 | 21 | 17 | 33 | 38 | 63 | 78 | 93 | 87 | 54 | 44 | 579 |
| Erysipelas | 13 | 18 | 15 | 12 | 15 | 19 | 20 | 17 | 15 | 16 | 13 | 8 | 181 |
| Tetanus | 2 | 1 | 2 | 2 | 3 | 4 | 1 | 1 | 1 | .. | 3 | .. | 20 |
| Lethargic encephalitis | 1 | .. | 1 | 2 | 2 | .. | .. | 3 | 3 | 2 | 2 | 5 | 21 |
| Hydatids | 3 | 1 | 3 | 3 | 1 | .. | 2 | 5 | 2 | 7 | 5 | 3 | 35 |
| Trachoma | .. | 6 | 4 | 2 | 2 | 1 | 1 | .. | 3 | 3 | 4 | 3 | 29 |
| Ophthalmia neonatorum | 3 | 2 | 3 | 2 | 3 | 1 | 2 | 5 | 2 | 3 | 4 | 6 | 36 |
| Actinomycosis | .. | .. | 1 | .. | .. | .. | .. | .. | 1 | 2 | .. | .. | 4 |
| Eclampsia | 6 | 3 | 7 | 6 | 3 | 3 | 13 | 7 | 9 | 10 | 3 | 4 | 74 |
| Food poisoning | 2 | 2 | 1 | 5 | 2 | .. | 1 | .. | .. | .. | 1 | 3 | 18 |
| Lead poisoning | .. | .. | .. | .. | .. | 1 | .. | .. | .. | 1 | .. | .. | 2 |
| Septic abortion | 8 | 9 | 9 | 9 | 3 | 11 | 12 | 9 | 9 | 12 | 11 | 9 | 111 |
| Leprosy | .. | .. | .. | .. | .. | .. | 1 | 1 | .. | .. | .. | .. | 2 |
| Smallpox | .. | .. | 1 | .. | .. | .. | .. | .. | .. | .. | .. | .. | 1 |
| Totals | 666 | 744 | 793 | 482 | 483 | 493 | 601 | 543 | 514 | 507 | 440 | 395 | 6,661 |
A quinquennial summary of notifications of certain principal diseases is as follows:—
| PRINCIPAL INFECTIOUS DISEASES NOTIFIED, 1921–25. | |||||
|---|---|---|---|---|---|
| Disease. | 1921. | 1922. | 1923. | 1924. | 1925. |
| Scarlet fever | 1,845 | 1,449 | 1,201 | 1,176 | 1,025 |
| Diphtheria | 2,611 | 1,989 | 1,951 | 2,717 | 1,518 |
| Enteric fever | 451 | 539 | 276 | 354 | 278 |
| Tuberculosis | 1,207 | 1,129 | 1,002 | 1,072 | 1,247 |
| Cerebro-spinal meningitis | 56 | 42 | 36 | 31 | 27 |
| Poliomyelitis | 267 | 98 | 17 | 73 | 1,159 |
| Puerperal fever | 178 | 262 | 176 | 308 | 225 |
| Erysipelas | 228 | 271 | 213 | 210 | 181 |
Information as to case-fatality in regard to the three first-mentioned diseases above is given in the next table for each of the last ten years:—
| Year. | Diphtheria. | Scarlet Fever. | Enteric Fever. | ||||||
|---|---|---|---|---|---|---|---|---|---|
| Cases notified. | Deaths. | Case-fatality. Per Cent. | Cases notified. | Deaths. | Case-fatality. Per Cent. | Cases notified. | Deaths. | Case-fatality. Per Cent. | |
| 1916 | 2,376 | 1 | 6.86 | 4,278 | 52 | 1.22 | 806 | 37 | 3.72 |
| 1917 | 5,458 | 237 | 4.34 | 2,755 | 30 | 1.09 | 653 | 41 | 6.28 |
| 1918 | 5,539 | 189 | 3.41 | 1,654 | 30 | 1.81 | 423 | 33 | 7.80 |
| 1919 | 3,499 | 157 | 4.49 | 1,521 | 23 | 1.51 | 477 | 34 | 7.13 |
| 1920 | 2,442 | 95 | 3.89 | 1,248 | 15 | 1.20 | 389 | 40 | 10.28 |
| 1921 | 2,611 | 107 | 4.10 | 1,845 | 24 | 1.30 | 451 | 24 | 5.32 |
| 1922 | 1,989 | 78 | 3.92 | 1,449 | 10 | 0.69 | 539 | 67 | 12.43 |
| 1923 | 1,951 | 68 | 3.49 | 1,201 | 13 | 1.08 | 276 | 23 | 8.24 |
| 1924 | 2,717 | 82 | 3.69 | 1,176 | 13 | 1.11 | 354 | 19 | 5.37 |
| 1925 | 1,518 | 45 | 2.96 | 1,025 | 3 | 0.19 | 278 | 21 | 7.55 |
By Gazette notice dated the 29th November, 1924, syphilis, gonorrhœa, and soft chancre were declared to be infectious diseases within the meaning of the. Health Act, 1920. On the 9th July, 1925, regulations were made under the Health Act, 1920, and the Social Hygiene Act, 1917, providing for the compulsory notification of these diseases in certain circumstances, and for the treatment of those affected by venereal disease in a communicable form.
Under these regulations it is incumbent upon a medical practitioner, or a medical officer of a hospital, who has been treating any person suffering from venereal disease in a communicable form to notify the Director-General of Health if such person fails for more than two weeks (after the date fixed in that behalf by the medical practitioner or medical officer) to attend for treatment, unless he is known in the meantime to have placed himself under treatment by some other qualified person.
If the Director-General of Health has reason to believe (either from a notification, as provided for above, or otherwise) that any person is suffering from venereal disease in a communicable form, he may require such person to submit himself for examination to some medical practitioner, and to supply a medical certificate as to the state of his health in relation to venereal disease. If a medical certificate is not supplied within the time specified, or if the certificate does not definitely disclose whether or not the person to whom it relates is suffering from venereal disease in a communicable form, the Director-General of Health may authorize two medical practitioners to examine such person.
In cases where a medical certificate is not obtainable, or where the certificate shows the person to be suffering from venereal disease in a communicable form, the Director-General of Health may, if he thinks such a course necessary or expedient in the public interest, authorize a Medical Officer of Health to make an order, under section 84 of the Health Act, 1920, for the removal of such person to a hospital or other place whore he may be effectively isolated, A detention order holds good for six weeks only, though it may be renewed from time to time until the person detained is no longer suffering from the disease in a communicable form. On the other hand, on application being made to a Magistrate, an order for examination by two medical practitioners (to be named in the order) is made, and if their report shows that the person is free from venereal disease in a communicable form, the Magistrate then makes an order for his release.
Where treatment is not conveniently obtainable at a public hospital or public clinic, the Director-General of Health may authorize a registered medical practitioner to administer free treatment if the patient is unable to pay. In such cases fees for service are paid by the State according to a scale laid down.
It is an offence for any person, while suffering from venereal disease in a communicable form, to engage in any employment, or to act in any capacity, in or about any factory, shop, hotel, restaurant, house, or other place, if by reason thereof any food intended for consumption by any other person is exposed to infection from venereal disease or is likely to be so affected.
It is the duty of every medical practitioner who is consulted by any person, sixteen years of age and over, suffering from venereal disease in a communicable form, to give such person a notice in the following form:—
Take notice that you are suffering from an infectious venereal disease—namely [Specify disease]. By virtue of the Social Hygiene Act, 1917, and the Social Hygiene Regulations, 1925,—
You are required to continue to receive medical treatment until cured.
If at any time you change your medical adviser you should notify your former adviser; otherwise your name, address, occupation, and condition of health are required to be notified to the Director-General of Health. If you continue treatment, no such notice is required to be given.
Until further notice, you are required to attend for further treatment as follows [Insert directions].
[In cases where patient is not married] You are hereby expressly warned against marrying until you have been medically certified as cured.
If you knowingly infect any other person, or do or suffer any act likely to infect any other person, you are liable to imprisonment for twelve months, together with a fine of £100.
If while continuing to suffer from the disease in a communicable form you are employed or act in any capacity where you are likely to infect any food intended for human consumption, you commit an offence punishable by fine or imprisonment.
If you do not adopt satisfactory means to effect a cure you may be forcibly detained in a public hospital or other place available for the treatment of persons suffering from venereal disease.
If you fail to carry out faithfully the directions of your medical adviser with respect to the treatment of your disease you render yourself liable to a fine of £10.
Every precaution is taken for the maintenance of secrecy and the avoidance of publicity in the carrying-out of the regulations. Every person concerned in the administration of the regulations is liable to a penalty of £50 if he divulges any information which comes to his knowledge in respect of any person suffering, or suspected to be suffering, from venereal disease.
The total admissions to public hospitals in New Zealand during 1925 numbered 57,684. There were 3,910 patients in hospital at the beginning of the year, the total cases dealt with during the year being thus 61,594, equal to 445 per 10,000 of mean population, including Maoris. The total number of persons treated is somewhat loss than the number of cases, each admission being counted a separate case.
Of the 61,594 cases, 36,285 were discharged as recovered, in 15,181 cases the patient was discharged relieved, and in 2,438 cases as unrelieved. Deaths in hospital numbered 3,483, or 5.65 per cent. of cases dealt with, and 4,207 patients were still in hospital at the end of the year. The figures of admissions, discharges, and deaths for each of the public hospitals in the Dominion, other than Maternity Hospitals, are given in the table following, together with the numbers of patients in hospital at the beginning and end of the year. There are ninety-four public hospitals, this number including four fever or infectious-diseases hospitals, seven sanatoria for consumptives, and two other institutions for special classes of cases
| PUBLIC HOSPITALS.—ADMISSIONS, DISCHARGES, ETC., 1925. | |||||||
|---|---|---|---|---|---|---|---|
| Hospital. | Patients remaining on 1st January, 1925. | Admissions during 1925. | Discharges during 1925. | Deaths in Hospital during 1925. | Patients remaining on 31st December, 1925. | ||
| Recovered. | Relieved. | Unrelieved. | |||||
| Mangonui | 16 | 271 | 201 | 48 | 14 | 12 | 12 |
| Whangaroa | 3 | 115 | 87 | 26 | .. | 1 | 4 |
| Bay of Islands | 11 | 413 | 265 | 126 | 3 | 14 | 16 |
| Hokianga | 14 | 425 | 343 | 47 | 7 | 19 | 23 |
| Northern Wairoa | 9 | 290 | 231 | 36 | 6 | 15 | 11 |
| Otamatea | 2 | 76 | 56 | 13 | 5 | 1 | 3 |
| Whangarei | 86 | 1,204 | 1,036 | 95 | 16 | 69 | 74 |
| Auckland | 387 | 6,864 | 2,717 | 3,369 | 192 | 536 | 417 |
| Franklin Memorial, Waiuku | 7 | 172 | 140 | 26 | 3 | 3 | 7 |
| Waikato | 132 | 2,379 | 884 | 1,150 | 162 | 163 | 152 |
| Kawhia | .. | 46 | 32 | 6 | 5 | 2 | 1 |
| Taumarunui | 28 | 413 | 303 | 73 | 9 | 31 | 25 |
| Waihi | 29 | 402 | 224 | 140 | 15 | 28 | 24 |
| Thames | 54 | 921 | 731 | 134 | 17 | 50 | 43 |
| Coromandel | 11 | 83 | 51 | 25 | 2 | 8 | 8 |
| Mercury Bay | 3 | 27 | 16 | 14 | .. | .. | .. |
| Tauranga | 10 | 397 | 324 | 37 | 5 | 24 | 17 |
| Te Puke | 1 | 99 | 87 | 8 | 2 | 1 | 2 |
| King George V, Rotorua | 110 | 1,021 | 567 | 315 | 77 | 41 | 131 |
| Whakatane | 17 | 403 | 313 | 60 | 21 | 8 | 18 |
| Opotiki | 12 | 276 | 214 | 40 | 9 | 10 | 15 |
| Waiapu | 3 | 109 | 60 | 31 | 7 | 5 | 9 |
| Tolaga Bay | .. | 19 | 12 | 5 | 1 | .. | 1 |
| Cook | 96 | 1,429 | 1,184 | 146 | 36 | 84 | 75 |
| Wairoa | 9 | 291 | 222 | 38 | 11 | 17 | 12 |
| Napier | 174 | 2,606 | 1,686 | 540 | 233 | 140 | 181 |
| Waipawa | 63 | 451 | 367 | 53 | 7 | 25 | 62 |
| Pukeora Sanatorium | 123 | 198 | 2 | 189 | 19 | 10 | 101 |
| Dannevirke | 41 | 541 | 425 | 74 | 8 | 26 | 49 |
| New Plymouth | 64 | 1,340 | 1,051 | 159 | 28 | 94 | 72 |
| Stratford | 31 | 476 | 429 | 30 | 3 | 18 | 27 |
| Hawera | 37 | 746 | 577 | 106 | 15 | 50 | 35 |
| Patea | 14 | 260 | 194 | 46 | 5 | 15 | 14 |
| Wanganui | 129 | 2,026 | 1,470 | 352 | 104 | 102 | 127 |
| Waimarino | 2 | 163 | 56 | 97 | 3 | 7 | 2 |
| Taihape | 37 | 681 | 478 | 161 | 20 | 22 | 37 |
| Palmerston North | 88 | 2,272 | 1,576 | 386 | 156 | 120 | 122 |
| Otaki | 5 | 156 | 79 | 48 | 17 | 9 | 8 |
| Otaki Sanatorium | 41 | 67 | .. | 53 | 13 | 1 | 41 |
| Pahiatua | 7 | 208 | 176 | 12 | 1 | 12 | 14 |
| Masterton | 37 | 817 | 659 | 83 | 8 | 42 | 62 |
| Greytown | 19 | 256 | 194 | 43 | 11 | 11 | 16 |
| Wellington | 389 | 5,545 | 2,922 | 1,986 | 217 | 383 | 426 |
| Wairau | 54 | 600 | 427 | 125 | 17 | 32 | 53 |
| Havelock | 15 | 12 | 2 | 2 | 1 | .. | |
| Picton | 18 | 125 | 106 | 7 | .. | 12 | 16 |
| Nelson | 41 | 739 | 462 | 161 | 52 | 61 | 44 |
| Motueka | .. | 75 | 67 | 4 | 1 | 3 | .. |
| Westport | 23 | 398 | 337 | 22 | 1 | 38 | 23 |
| Denniston | 164 | 134 | 12 | 10 | 5 | 3 | |
| Reefton | 26 | 161 | 132 | 11 | 2 | 14 | 28 |
| Waiuta Nurses' Home | 1 | 44 | 25 | 19 | 1 | .. | .. |
| Grey River | 82 | 568 | 355 | 137 | 9 | 52 | 97 |
| Westland | 39 | 316 | 263 | 30 | .. | 28 | 34 |
| Kaikoura | 12 | 260 | 231 | 22 | 3 | 7 | 9 |
| Queen Mary, Hanmer | 93 | 297 | 95 | 183 | 24 | 2 | 86 |
| Amuri | 2 | 64 | 43 | 13 | 5 | 2 | 3 |
| Waikari | 3 | 114 | 99 | 7 | 3 | 3 | 5 |
| Oxford | 6 | 64 | 48 | 15 | 2 | 1 | 4 |
| Christchurch | 257 | 5,531 | 3,568 | 1,330 | 258 | 327 | 305 |
| Burwood Infectious Diseases | 55 | 442 | 429 | 11 | 19 | 4 | 34 |
| Cashmere Hills Sanatorium | 75 | 88 | 45 | 37 | 3 | 2 | 76 |
| Coronation Hospital for Consumptives | 63 | 62 | 7 | 22 | 11 | 23 | 62 |
| Lyttelton | 1 | 67 | 60 | 1 | 4 | .. | 3 |
| Akaroa | 3 | 115 | 96 | 4 | .. | 10 | 8 |
| Ashburton | 40 | 720 | 549 | 113 | 16 | 27 | 55 |
| Fairlie | 1 | 150 | 121 | 21 | 2 | 5 | 2 |
| Timaru | 60 | 976 | 689 | 200 | 12 | 71 | 64 |
| Talbot Infectious Diseases | 6 | 29 | 31 | .. | 1 | .. | 3 |
| Waimate | 31 | 550 | 420 | 113 | 6 | 17 | 25 |
| Oamaru | 41 | 534 | 353 | 125 | 38 | 30 | 29 |
| Pleasant Valley Sanatorium | 51 | 67 | 15 | 45 | 9 | 5 | 44 |
| Port Chalmers | .. | 35 | 20 | 6 | 4 | 2 | 3 |
| Logan Point Infectious Diseases | 2 | 31 | 28 | 1 | .. | .. | 4 |
| Dunedin | 186 | 4,114 | 2,352 | 1,248 | 253 | 244 | 203 |
| Chronic Hospital, Caversham | 50 | 69 | .. | 29 | 13 | 27 | 50 |
| Wakari | 27 | 79 | 14 | 27 | 7 | 21 | 37 |
| Prince Edward Convalescent Home | 13 | 82 | 50 | 28 | 8 | .. | 9 |
| Louisa Roberts, Middlemarch | .. | 45 | 39 | 3 | .. | .. | 3 |
| Waipiata Sanatorium | is | 63 | 18 | 3 | 1 | .. | 59 |
| Tuapeka | 6 | 99 | 67 | 22 | 8 | 4 | 4 |
| Roxburgh | 3 | 28 | 26 | 3 | .. | 1 | 1 |
| Milton | 1 | 119 | 17 | 87 | 10 | 3 | 3 |
| Owaka | 5 | 106 | 47 | 43 | 5 | 5 | 11 |
| Kaitangata | 1 | 49 | 42 | 5 | .. | 1 | 2 |
| Tapanui | 1 | 82 | 48 | 24 | 3 | 8 | .. |
| Naseby | 5 | 176 | 131 | 25 | 9 | 7 | 9 |
| Dunstan | 7 | 83 | 58 | 14 | 4 | 6 | 8 |
| Cromwell | 12 | 273 | 227 | 35 | 6 | 5 | 12 |
| Lake County | 8 | 55 | 48 | 8 | .. | 3 | 4 |
| Seddon Memorial, Gore | 25 | 386 | 308 | 43 | 17 | 24 | 19 |
| Southland | 85 | 1,032 | 603 | 245 | 80 | 78 | 111 |
| Kew Infectious Diseases | 14 | 22 | 8 | 7 | 2 | 8 | 11 |
| Wallace and Fiord | 26 | 367 | 274 | 57 | 4 | 25 | 33 |
| Totals | 3,910 | 57,684 | 36,285 | 15,181 | 2,438 | 3,483 | 4,207 |
The figures of admissions, discharges, and deaths for all public hospitals for each of the last five years are—
| PUBLIC HOSPITALS.—ADMISSIONS, DISCHARGES, AND DEATHS, 1921–25. | ||||||
|---|---|---|---|---|---|---|
| Year. | Admissions. | Discharges. | Deaths. | Total Discharges and Deaths. | ||
| Recovered. | Relieved. | Unrelieved. | ||||
| 1921 | 45,107 | 26,302 | 13,712 | 1,925 | 2,974 | 44,913 |
| 1922 | 47,549 | 26,983 | 14,987 | 2,407 | 2,984 | 47,361 |
| 1923 | 50,040 | 29,108 | 15,642 | 2,144 | 3,300 | 50,194 |
| 1924 | 55,034 | 34,088 | 14,854 | 2,585 | 3,260 | 54,787 |
| 1925 | 57,684 | 36,285 | 15,181 | 2,438 | 3,483 | 5,387 |
From the following table it will be seen that males considerably outnumber females among hospital patients. During the last ten years the number of males to every 100 females has ranged from 121 in 1924 and 1925 to 160 in 1919. The death-rate is also invariably higher among male than among female patients.
| Year. | Discharges and Deaths. | Deaths. | Death-rate per 1,000 Cases. | |||||
|---|---|---|---|---|---|---|---|---|
| Males. | Females. | Males per 100 Females. | Males. | Females. | Males per 100 Females. | Males. | Females. | |
| 1916 | 22,620 | 14,965 | 151 | 1,744 | 995 | 175 | 77 | 66 |
| 1917 | 22,239 | 16,492 | 135 | 1,812 | 981 | 185 | 81 | 59 |
| 1918 | 27,119 | 19,377 | 140 | 2,955 | 1,513 | 195 | 109 | 78 |
| 1919 | 26,164 | 16,312 | 160 | 1,884 | 980 | 192 | 72 | 60 |
| 1920 | 26,627 | 19,661 | 135 | 2,177 | 1,222 | 178 | 82 | 62 |
| 1921 | 25,365 | 19,548 | 130 | 1,909 | 1,065 | 179 | 75 | 54 |
| 1922 | 26,519 | 20,842 | 127 | 1,861 | 1,123 | 166 | 70 | 54 |
| 1923 | 28,038 | 22,156 | 127 | 2,046 | 1,254 | 163 | 73 | 57 |
| 1924 | 30,015 | 24,772 | 121 | 2,039 | 1,221 | 167 | 68 | 49 |
| 1925 | 31,365 | 26,022 | 121 | 2,168 | 1,315 | 165 | 64 | 47 |
The ages of patients discharged from or dying in public hospitals during 1924 and 1925 are as shown in the following summary:—
| PUBLIC HOSPITALS.—AGES OF PATIENTS DISCHARGED OR DYING. | ||||||
|---|---|---|---|---|---|---|
| Ages of Patients, in Years. | 1924. | 1925. | ||||
| Males. | Females. | Total. | Males. | Females. | Total. | |
| Under 5 | 3,102 | 2,233 | 5,335 | 3,314 | 2,434 | 5,748 |
| 5 and under 10 | 3,224 | 2,746 | 5,970 | 3,023 | 2,440 | 5,463 |
| 10 ,, 15 | 2,412 | 1,881 | 4,293 | 2,170 | 1,758 | 3,928 |
| 15 ,, 25 | 5,040 | 5,352 | 10,392 | 5,663 | 5,659 | 11,322 |
| 25 ,, 35 | 4,498 | 4,997 | 9,495 | 4,681 | 5,554 | 10,235 |
| 35 ,, 45 | 3,996 | 3,584 | 7,580 | 4,073 | 3,789 | 7,862 |
| 45 ,, 55 | 3,118 | 1,930 | 5,048 | 3,373 | 2,161 | 5,534 |
| 55 ,, 65 | 2,006 | 1,024 | 3,030 | 2,245 | 1,117 | 3,362 |
| 65 and over | 2,576 | 970 | 3,546 | 2,726 | 1,028 | 3,754 |
| Unspecified | 43 | 55 | 98 | 97 | 82 | 179 |
| Totals | 30,015 | 24,772 | 54,787 | 31,365 | 26,022 | 57,387 |
As explained in the preceding subsection, the revised international classification of diseases and causes of death came into operation in New Zealand from 1st January, 1923. Under the revised classification diseases are divided into fifteen well-defined classes, which are further subdivided into 205 orders.
The following table shows that Class VI, “Diseases of the digestive system,” comes first on the list as regards the total cases treated, followed by “Epidemic, endemic, and infectious diseases,” “External causes,” and “Diseases of the genitourinary system,” in that order. Classes I and II come first and second respectively as regards deaths, the next on the list being Class TV, “Diseases of the circulatory system.”
| PUBLIC HOSPITALS.—CLASSIFICATION OF DISEASES, 1925. | |||||||
|---|---|---|---|---|---|---|---|
| Class. | Discharges. | Deaths. | Total Discharges and Deaths. | ||||
| Recovered. | Relieved. | Unrelieved. | Males. | Females. | Males. | Females. | |
| I. Epidemic, endemic, and infectious diseases | 4,301 | 2,441 | 417 | 403 | 269 | 4,475 | 3,356 |
| II. Other general diseases | 1,596 | 1,605 | 482 | 354 | 232 | 2,335 | 1,934 |
| III. Diseases of nervous system and of organs of special sense | 1,193 | 1,621 | 467 | 185 | 117 | 2,074 | 1,509 |
| IV. Diseases of circulatory system | 890 | 883 | 73 | 292 | 127 | 1,468 | 797 |
| V. Diseases of respiratory system | 2,187 | 915 | 70 | 216 | 119 | 2,267 | 1,240 |
| VI. Diseases of digestive system | 11,005 | 2,020 | 277 | 203 | 151 | 7,051 | 6,605 |
| VII. Diseases of the genito-urinary system and annexa | 3,094 | 1,486 | 197 | 160 | 90 | 1,636 | 3,391 |
| VIII. Puerperal state | 3,242 | 348 | 60 | .. | 72 | .. | 3,722 |
| IX. Diseases of the skin and of the cellular tissue | 1,890 | 522 | 32 | 31 | 14 | 1,621 | 868 |
| X. Diseases of the organs of locomotion | 913 | 673 | 64 | 17 | 13 | 1,216 | 464 |
| XI. Malformations | 81 | 111 | 31 | 12 | 18 | 139 | 114 |
| XII. Diseases of early infancy | 54 | 19 | 2 | 30 | 15 | 71 | 49 |
| XIII. Old age (senile debility, &c.) | 24 | 135 | 71 | 87 | 27 | 246 | 98 |
| XIV. External causes | 5,209 | 2,138 | 91 | 174 | 47 | 6,252 | 1,407 |
| XV. Ill-defined causes | 606 | 264 | 104 | 4 | 4 | 514 | 468 |
| Totals | 36,285 | 15,181 | 2,438 | 2,168 | 1,315 | 31,365 | 26,022 |
Figures of total cases and of deaths for each of the fifteen classes are given in the next table for each of the last five years. So far as possible the figures for the years 1921 and 1922 have been adjusted to agree with the revised classification used from 1923 onwards, and the figures for the five years may be regarded as comparable enough for practical purposes.
The figures for total cases relate to the total discharges and deaths, and not to admissions, and do not cover persons still in hospital at the end of the year.
| Class. | Total Cases. | Deaths. | ||||||||
|---|---|---|---|---|---|---|---|---|---|---|
| 1921. | 1922. | 1923. | 1924. | 1925. | 1921. | 1922. | 1923. | 1924. | 1925. | |
| I | 7,302 | 7,138 | 8,140 | 7,869 | 7,831 | 549 | 580 | 682 | 574 | 672 |
| II | 2,719 | 2,983 | 3,161 | 3,877 | 4,269 | 443 | 442 | 473 | 550 | 586 |
| III | 2,838 | 3,523 | 3,461 | 3,532 | 3,583 | 291 | 274 | 328 | 331 | 302 |
| IV | 1,922 | 1,872 | 1,891 | 2,040 | 2,265 | 380 | 358 | 311 | 351 | 419 |
| V | 3,206 | 3,616 | 3,633 | 3,581 | 3,507 | 310 | 328 | 364 | 334 | 335 |
| VI | 10,933 | 11,239 | 11,699 | 13,296 | 13,656 | 270 | 295 | 330 | 334 | 354 |
| VII | 3,744 | 3,902 | 4,187 | 4,643 | 5,027 | 234 | 199 | 241 | 231 | 250 |
| VIII | 2,026 | 2,399 | 2,545 | 3,227 | 3,722 | 65 | 57 | 69 | 61 | 72 |
| IX | 2,024 | 2,162 | 2,266 | 2,616 | 2,489 | 41 | 37 | 30 | 30 | 45 |
| X | 1,516 | 1,705 | 1,744 | 1,620 | 1,680 | 26 | 39 | 40 | 31 | 30 |
| XI | 171 | 176 | 198 | 255 | 253 | 16 | 22 | 25 | 32 | 30 |
| XII | 107 | 126 | 121 | 126 | 120 | 48 | 47 | 41 | 40 | 45 |
| XIII | 209 | 283 | 406 | 347 | 344 | 88 | 136 | 168 | 128 | 114 |
| XIV | 5,723 | 5,589 | 6,097 | 6,933 | 7,659 | 199 | 159 | 191 | 222 | 221 |
| XV | 473 | 648 | 645 | 825 | 982 | 14 | 11 | 7 | 11 | 8 |
| Totals | 44,913 | 47,361 | 50,194 | 54,787 | 57,387 | 2,974 | 2,984 | 3,300 | 3,260 | 3,483 |
The greatest increase in the number of cases dealt with during the period is shown by Class VI, “Diseases of the digestive system,” largely through a continued increase in the number of cases of tonsils and adenoids. Class VIII, “Puerperal state,” also shows a substantial rise, this being mainly due to the increasing use of public hospitals for accouchements. The excess shown in 1923 in the case of Class I is due to the influenza epidemic of that year.
The following table gives the case-fatality or percentage of deaths to total cases treated in each class for each of the last five years. As in the preceding table, the term “total cases” relates only to total discharges and deaths.
| PUBLIC HOSPITALS.—PERCENTAGE OF DEATHS TO TOTAL CASES TREATED, 1921–25. | |||||
|---|---|---|---|---|---|
| Class. | Percentage of Deaths to Total Cases. | ||||
| 1921. | 1922. | 1923. | 1924. | 1925. | |
| I. Epidemic, endemic, and infectious diseases | 7.52 | 8.13 | 8.38 | 7.29 | 8.58 |
| II. Other general diseases | 16.29 | 14.82 | 14.96 | 14.19 | 13.73 |
| III. Diseases of nervous system and organs of special sense | 10.25 | 7.78 | 9.48 | 9.37 | 8.43 |
| IV. Diseases of the circulatory system | 19.77 | 19.12 | 16.45 | 17.21 | 18.50 |
| V. Diseases of the respiratory system | 9.67 | 9.07 | 10.02 | 9.33 | 9.55 |
| VI. Diseases of the digestive system | 2.47 | 262 | 2.82 | 2.51 | 2.59 |
| VII. Diseases of the genito-urinary system and annexa | 6.25 | 5.10 | 5.76 | 4.98 | 4.97 |
| VIII. Puerperal state | 3.21 | 2.38 | 2.71 | 1.89 | 1.93 |
| IX. Diseases of the skin and of the cellular tissue | 2.03 | 1.71 | 1.32 | 115 | 1.81 |
| X. Diseases of the organs of locomotion | 1.72 | 2.29 | 2.29 | 1.91 | 1.79 |
| XI. Malformations | 9.36 | 12.50 | 12.63 | 12.55 | 11.86 |
| XII. Diseases of early infancy | 44.86 | 37.30 | 33.88 | 31.75 | 37.50 |
| XIII. Old age (senile debility, &c.) | 42.11 | 48.06 | 41.38 | 36.89 | 33.13 |
| XIV. External causes | 3.48 | 2.84 | 3.13 | 3.20 | 2.89 |
| XV. Ill-defined causes | 0.30 | 0.17 | 1.09 | 1.33 | 0.81 |
| Totals | 6.62 | 6.30 | 6.57 | 5.95 | 6.07 |
The above table provides a more satisfactory basis for determining the relative fatality of the various classes of diseases than does a simple comparison of numbers of deaths.
As might be expected, Classes XII and XIII record the highest percentage of deaths. These two classes cover those causes of deaths peculiar to the two extremities of the human span, and naturally are not so amenable to treatment as the majority of diseases in the remaining thirteen classes.
A cursory perusal of the table divulges the information that over the period of five years ten out of the fifteen classes have experienced a decrease in case-fatality. So various, however, are the factors contributing to this that it is essential to study each class separately in order to arrive at a satisfactory conclusion as to any progress or retrogression in the treatment of hospital cases.
Class I, “Epidemic, endemic, and infectious diseases,” is one for which the figures show an increase over the period covered. The information revealed in this case, however, is an indication of the occurrence of more or less fatal epidemic diseases, rather than any variation in the alleviation of such diseases. For example, the epidemic of influenza in 1923 was of a type sufficiently severe to cause a rise in the case-fatality for epidemic diseases in that year, while the epidemic of infantile paralysis produced a similar effect in 1925.
A distinct reduction in the case-fatality for diseases in Class II is apparent, and, as the diseases of this class generally are not subject to outside influences, it is fairly safe to assume that this reduction is duo primarily to advanced knowledge of methods employed to combat these diseases. Particularly is this illustrated in the case of diabetes, when, consequent upon the introduction of insulin treatment for this disease, the number of cases treated has greatly increased since 1923, with very little alteration in the number of deaths.
The improvement shown for Class III, “Diseases of the nervous system,” may be attributed to the fact that there has been a continuous increase in the number of patients admitted to hospital suffering from neuralgia, neuritis, neurasthenia, and mental alienation, diseases from which the number of deaths in hospital has remained practically stationary.
The next class, “Diseases of the circulatory system,” shows comparatively little fluctuation with the exception of a substantial drop in 1923, when, under the revised international classification of diseases introduced that year, cerebral embolism and thrombosis (which are the most fatal forms of embolism and thrombosis) were transferred to Class HI.
Classes V, VI, IX, X, XI, XIII, XIV, and XV show little movement worthy of comment.
Diseases of the genito-urinary system and annexa, Class VII, show a continued decline throughout the period in the fatality rate, this decline being spread over most of the diseases in the class. Class VIII, the puerperal state, probably reveals a position more interesting and gratifying than any other class. Excluding the number of cases of normal childbirth, the percentage of deaths to total cases treated for these diseases has fallen from 4.87 in 1921 to 3.19 in 1925, an improvement which is a reflex of the concentrated efforts of the Department of Health in recent years to reduce the maternal death-rate to a standard more compatible with the successes attained in other directions.
More detailed information concerning the principal diseases and groups of diseases is given in the following pages.
The first class of diseases in the international classification is devoted to “epidemic, endemic, and infectious,” the first twenty-five orders of which cover epidemic diseases. The principal epidemic diseases dealt with in public hospitals are scarlet fever and diphtheria. There are four special hospitals for the treatment of these and similar infectious diseases, all situated in the South Island. Several hospitals have fever wings attached.
Information concerning the various epidemic diseases for each of the last five years is given in the following table: —
| Disease. | Total Gases. | Deaths. | ||||||||
|---|---|---|---|---|---|---|---|---|---|---|
| 1921. | 1922. | 1923. | 1924. | 1925. | 1921. | 1922. | 1923. | 1924. | 1925. | |
* New heading, 1928—no figures for previous years. | ||||||||||
| Typhoid fever | 242 | 335 | 147 | 224 | 183 | 27 | 42 | 23 | 29 | 23 |
| Paratyphoid | 3 | 6 | 4 | .. | 1 | .. | ||||
| Malaria | 19 | 14 | 8 | 17 | 8 | .. | .. | .. | .. | .. |
| Smallpox | .. | .. | 2 | .. | 1 | .. | .. | .. | .. | .. |
| Measles | 352 | 229 | 49 | 395 | 132 | 10 | .. | 2 | 13 | 3 |
| Scarlet fever | 1,117 | 1,107 | 843 | 935 | 731 | 13 | 10 | 13 | 8 | 6 |
| Whooping-cough | 71 | 11 | 86 | 68 | 74 | 5 | 2 | 7 | 6 | 6 |
| Diphtheria | 1,722 | 1,377 | 1,487 | 2,175 | 1,182 | 76 | 64 | 54 | 57 | 41 |
| Influenza | 508 | 448 | 1,923 | 494 | 361 | 33 | 14 | 143 | 16 | 25 |
| Mumps | 48 | 15 | 9 | 4 | 13 | .. | .. | .. | .. | 1 |
| Dysentery | 23 | 18 | 25 | 23 | 25 | 1 | 1 | 2 | 2 | 2 |
| Epidemic jaundice* | .. | .. | 1 | 6 | 3 | .. | .. | .. | .. | .. |
| Erysipelas | 117 | 137 | 140 | 96 | 90 | 3 | 6 | 8 | 5 | 1 |
| Infantile paralysis | 231 | 349 | 197 | 99 | 1,252 | 9 | 8 | .. | 16 | 149 |
| Lethargic encephalitis | 10 | 25 | 24 | 25 | 23 | 9 | 11 | 9 | 7 | 6 |
| Meningococcus meningitis* | .. | .. | 2 | 1 | 5 | .. | .. | 1 | 1 | 4 |
| Chicken-pox | 39 | 47 | 25 | 24 | 84 | .. | 1 | .. | .. | 1 |
| Gorman measles | 35 | 37 | 24 | 8 | 4 | .. | .. | .. | .. | .. |
| Others | 2 | 8 | 1 | .. | 6 | .. | .. | .. | .. | .. |
| Totals | 4,536 | 4,157 | 4,996 | 4,600 | 4,181 | 186 | 159 | 262 | 161 | 268 |
The occurrence of epidemics can readily be traced from these figures—influenza in 1923, diphtheria in 1924, chicken-pox in 1925, and infantile paralysis in 1922 and 1925. In normal years diphtheria is responsible for more admissions and more deaths than any other epidemic disease-It is interesting to note that while males preponderate in influenza cases, girls appear to be more susceptible than boys to diphtheria, scarlet fever, and measles. The figures for the two sexes for these four diseases are—
| Year. | Influenza. | Diphtheria. | Scarlet Fever. | Measles. | ||||
|---|---|---|---|---|---|---|---|---|
| Males. | Females. | Males. | Females. | Males. | Females. | Males. | Females. | |
| 1921 | 333 | 175 | 762 | 960 | 399 | 718 | 174 | 178 |
| 1922 | 268 | 180 | 612 | 765 | 376 | 731 | 61 | 168 |
| 1923 | 1,032 | 891 | 692 | 795 | 306 | 537 | 21 | 28 |
| 1924 | 286 | 208 | 990 | 1,185 | 338 | 597 | 190 | 205 |
| 1925 | 212 | 149 | 578 | 604 | 252 | 479 | 80 | 52 |
| Totals for 5 years | 2,131 | 1,603 | 3,634 | 4,309 | 1,671 | 3,062 | 526 | 631 |
In view of the disastrous epidemic which swept over the land during the last few weeks of 1924 and the first six months of 1925, infantile paralysis is worthy of special attention.
At times of epidemic there is always a tendency to overlook the fact that infantile paralysis is always present in the Dominion in a more or less virulent form, though it is only occasionally that an epidemic occurs. There was a comparatively severe outbreak in 1916, and again during the period 1921 to 1923 the disease assumed an epidemic form, though of a mild type.
The figures of public hospital cases for the last five years, classified according to ages of patients, are as follows:—
| INFANTILE PARALYSIS IN PUBLIC HOSPITALS, 1921 5. | ||||||||||
|---|---|---|---|---|---|---|---|---|---|---|
| Age, in Years. | 1921. | 1922. | 1923. | 1924. | 1925. | |||||
| M. | F. | M. | F. | M. | F. | M | F. | M. | F. | |
| Under 5 years. | 59 | 38 | 40 | 25 | 21 | 11 | 11 | 12 | 352 | 294 |
| 5 and under 10 | 50 | 45 | 93 | 70 | 34 | 42 | 24 | 18 | 167 | 136 |
| 10 and under 15 | 13 | 13 | 52 | 34 | 37 | 19 | 11 | 10 | 95 | 66 |
| 15 and under 25 | 6 | 1 | 16 | 10 | 17 | 8 | 3 | 6 | 62 | 41 |
| 25 and over | 5 | .. | 8 | 1 | 3 | 5 | 3 | 1 | 24 | 14 |
| Age not specified | 1 | .. | .. | .. | .. | .. | .. | .. | .. | 1 |
| Totals | 134 | 97 | 209 | 140 | 112 | 85 | 52 | 47 | 700 | 552 |
It will be seen from the above that infantile paralysis is by no means a new affliction in New Zealand, and that throughout the quinquennium numerous patients have been received into hospitals suffering from this disease, particularly in 1922. A special feature disclosed by the table is that in every year the number of male patients substantially exceeds the number of female patients. A rather noteworthy point in connection with the epidemic of 1925 is that the great majority of cases treated were under five years of ago, an experience which is contrary to that of every other year covered by the table, when the age-group “5 and under 10 years” invariably claimed the greater number of oases.
A better conception of the annual incidence and degree of fatality of infantile paralysis in New Zealand as divulged by public-hospital returns may be obtained from the following table, which shows, for males and females separately and for both sexes in conjunction, the total cases treated—i.e., total discharges and deaths, the number of deaths, and the percentage of deaths to total cases, for each year from 1916 to 1925. This decennial period is of especial value in that it covers the three epidemic years—viz., 1916, 1922, and 1925.
| INFANTILE PARALYSIS IN PUBLIC HOSPITALS, 1916–25. | |||||||||
|---|---|---|---|---|---|---|---|---|---|
| Year. | Total Cases. | Deaths. | Percentage of Deaths to Total Cases. | ||||||
| Males. | Females. | Total. | Males. | Females. | Total. | Males. | Females. | Total. | |
| 1916 | 323 | 196 | 519 | 34 | 23 | 57 | 10.52 | 11.73 | 10.98 |
| 1917 | 27 | 30 | 57 | 2 | 2 | 4 | 7.41 | 6.67 | 7.02 |
| 1918 | 22 | 25 | 47 | .. | .. | .. | .. | .. | .. |
| 1919 | 10 | 7 | 17 | .. | .. | .. | .. | .. | .. |
| 1920 | 30 | 28 | 58 | 2 | 7 | 9 | 6.67 | 25.00 | 15.51 |
| 1921 | 134 | 97 | 231 | 4 | 5 | 9 | 2.98 | 5.15 | 3.90 |
| 1922 | 209 | 140 | 349 | 6 | 2 | 8 | 2.87 | 1.43 | 2.29 |
| 1923 | 112 | 85 | 197 | .. | .. | .. | .. | .. | .. |
| 1924 | 52 | 47 | 99 | 6 | 10 | 16 | 11.54 | 21.28 | 1616 |
| 1925 | 700 | 552 | 1,252 | 79 | 70 | 149 | 11.29 | 12.68 | 11.90 |
Although the fluctuations in the total number of cases treated are clearly shown in epidemic periods, it is interesting to note that, on the other hand, the number of deaths shows very little movement between the two extremities of the period covered. This is amply illustrated in the accompanying diagram, which traces the course of the disease over the last ten years according to total cases treated and number of deaths.
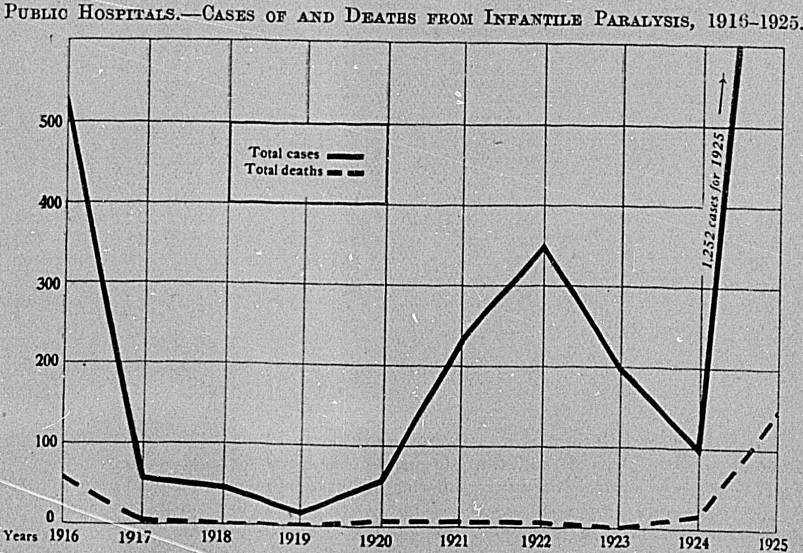
Turning now to the section of the table dealing with the percentage of deaths to total cases treated, it is found that two outstanding features are revealed: First that the case-fatality rate is by no means dependent upon periods of epidemic, and, second, that although males almost invariably exceed females as regards total cases, yet exactly the contrary is experienced as regards case-fatality. The next diagram shows that in 1920. which had the normal number of cases of infantile paralysis, the case-fatality rate rose rapidly, whereas in 1922, an epidemic year, it returned to comparatively normal. Furthermore, with the exception of 1917 and 1922, the female fatality rate greatly exceeded the male rate.
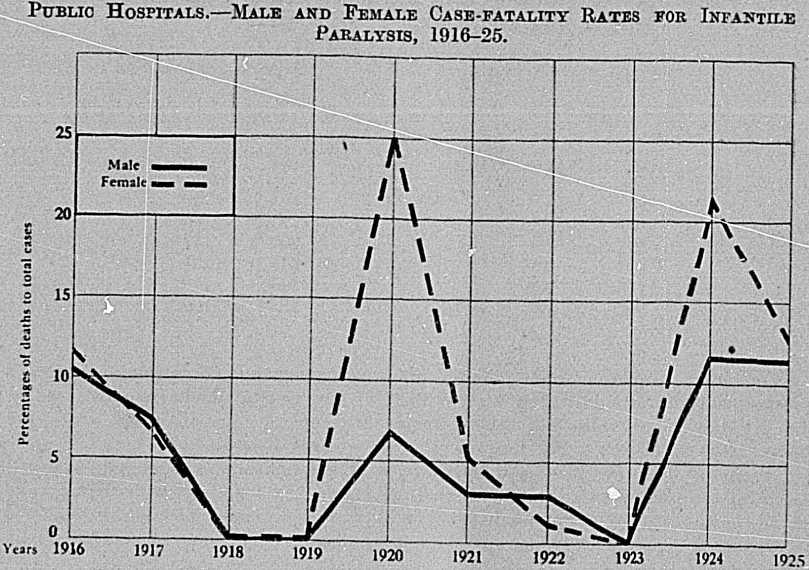
Tuberculosis occupies seven orders in the classification of diseases, but is usually divided into two groups—viz., tuberculosis of the respiratory system, and other forms of tuberculosis. The former covers three-fifths of the cases of tubercular disease dealt with in hospitals, and a somewhat higher proportion of the deaths. A large percentage of the tubercular cases is dealt with at seven sanatoria for consumptives.
Tuberculosis cases in public hospitals and sanatoria during the last five years are as follows:—
| Location. | Cases. | Deaths | ||||||||
|---|---|---|---|---|---|---|---|---|---|---|
| 1921. | 1922. | 1923. | 1924. | 1925. | 1921. | 1922. | 1923. | 1924. | 1925. | |
| Respiratory system. | 1,112 | 1,293 | 1,326 | 1,315 | 1,458 | 233 | 277 | 243 | 250 | 253 |
| Meninges and central nervous system | 55 | 52 | 49 | 64 | 57 | 53 | 45 | 43 | 57 | 51 |
| Intestines and peritoneum | 71 | 60 | 78 | 54 | 81 | 17 | 22 | 21 | 12 | 11 |
| Vertebral column | 105 | 155 | 162 | 151 | 172 | 5 | 7 | 16 | 16 | 5 |
| Joints | 208 | 177 | 190 | 186 | 217 | 4 | 7 | 7 | 5 | 2 |
| Other organs | 272 | 231 | 233 | 284 | 294 | 5 | 13 | 14 | 8 | 4 |
| Disseminated | 18 | 11 | 33 | 36 | 25 | 9 | 8 | 22 | 24 | 17 |
| Totals | 1,841 | 1,979 | 2,071 | 2,090 | 2,304 | 326 | 379 | 366 | 372 | 343 |
The revised classification includes “acute miliary tuberculosis,” unless stated to be pulmonary, under the heading of “disseminated tuberculosis.” This accounts for the increase in the 1923, 1924, and 1925 figures for the latter disease.
Fuller details as to location are given in the “Annual Report on Vital Statistics,” which also contains figures for each individual hospital.
The death-rate is exceedingly high in the case of tuberculous meningitis, averaging 90 per cent. over the five years. Males greatly preponderate among patients treated for tuberculosis, the figures for 1925 being—males 1,395, females 909.
In connection with the following table of venereal-disease cases it should be noted that the figures relate to in-patients only, and do not include out-patients, who represent the great majority of cases treated at the public hospitals.
| Year. | Syphilis. | Gonococcus or Chancroid Infection. | ||||||
|---|---|---|---|---|---|---|---|---|
| Cases. | Deaths. | Cases. | Deaths. | |||||
| Males. | Females. | Males. | Females. | Males. | Females. | Males. | Females. | |
| 1921 | 96 | 38 | 10 | 3 | 221 | 60 | 1 | 1 |
| 1922 | 134 | 53 | 7 | 7 | 205 | 51 | 6 | 1 |
| 1923 | 106 | 49 | 7 | 3 | 248 | 91 | 6 | .. |
| 1924 | 111 | 39 | 7 | 2 | 244 | 120 | 1 | 2 |
| 1925 | 142 | 67 | 16 | 5 | 281 | 109 | 4 | .. |
In order to obtain some definite information regarding venereal disease, a questionnaire was attached from 1919 to 1923 to the hospital discharge-cards used in the preparation of statistical tables, requiring completion in all cases where the disease treated was due to one form or other of venereal disease.
From 1st January, 1924, a different form of questionnaire was brought into use. requiring completion in all cases where the patient was found to be suffering from or showing evidence of recent or distant syphilitic or gonorrhœal infection, irrespective of whether the disease for which the patient was being treated was of venereal origin or not.
Of 57,387 patients discharged from or dying in public hospitals during 1925 it was found that 332 showed evidence of syphilitic infection and 487 of gonorrhœal infection. The following table gives a summary of these cases by age-groups:—
| — | Under 15. | 15 and under 25. | 25 and under 45. | 45 and over. | Totals. | ||||||
|---|---|---|---|---|---|---|---|---|---|---|---|
| M. | F. | M. | F. | M. | F. | M. | F. | M. | F. | Both Sexes. | |
| Syphilitic Infection. | |||||||||||
| Recent | 12 | 8 | 7 | 6 | 30 | 3 | 6 | .. | 55 | 17 | 72 |
| Distant | 4 | 7 | 5 | 9 | 59 | 32 | 105 | 39 | 173 | 87 | 260 |
| Acquired | .. | .. | 10 | 9 | 67 | 26 | 85 | 36 | 162 | 71 | 233 |
| Congenital | 16 | 15 | 2 | 4 | 3 | 1 | .. | .. | 21 | 20 | 41 |
| Not stated | .. | .. | .. | 2 | 19 | 8 | 26 | 3 | 45 | 13 | 58 |
| Totals | 16 | 15 | 12 | 15 | 89 | 35 | 111 | 39 | 228 | 104 | 332 |
| Gonorrhœal Infection. | |||||||||||
| Recent | 19 | 40 | 80 | 41 | 114 | 25 | 22 | 1 | 235 | 107 | 342 |
| Distant | 1 | .. | 9 | 14 | 56 | 17 | 46 | 2 | 112 | 33 | 145 |
| Totals | 20 | 40 | 89 | 55 | 170 | 42 | 68 | 3 | 347 | 140 | 487 |
| Grand totals | 36 | 55 | 101 | 70 | 259 | 77 | 179 | 42 | 575 | 244 | 819 |
Included in the total for syphilitic infection (332) are 26 cases (22 males, 6 females) who were also suffering from gonorrhœal infection. These cases are not included in the total for gonorrhœal infection.
Non-puerperal septicæmia is the principal of the remaining infectious diseases, the figures for which for the last five years are—
| Disease. | Cases. | Deaths. | ||||||||
|---|---|---|---|---|---|---|---|---|---|---|
| 1921. | 1922 | 1923. | 1924. | 1925. | 1921. | 1922. | 1923. | 1924. | 1925. | |
| Septicæmia | 488 | 536 | 549 | 638 | 713 | 11 | 13 | 29 | 21 | 25 |
| Tetanus | 16 | 18 | 19 | 16 | 26 | 10 | 7 | 7 | 7 | 10 |
| Mycoses | 5 | 3 | 6 | 5 | 5 | 1 | .. | 2 | 1 | 1 |
| Anthrax | 1 | 2 | 1 | .. | .. | .. | 1 | .. | .. | .. |
| Cow-pox | .. | .. | .. | 1 | 3 | .. | .. | .. | .. | .. |
| Frambœsia | .. | .. | .. | 1 | .. | .. | .. | .. | .. | .. |
| Rat-bite fever. | .. | .. | .. | 2 | .. | .. | .. | .. | .. | .. |
| Trench fever | 2 | 2 | 4 | 1 | .. | .. | .. | .. | .. | .. |
| Trench mouth. | .. | .. | .. | 1 | .. | .. | .. | .. | .. | .. |
Three-fourths of the total patients treated for non-puerperal septicæmia are males, and it would appear that most of the cases coming under this head are due to septic infection of wounds. Tetanus has a very high death-rate, though the numbers treated for this disease are small.
Of recent years cancer has come into great prominence amongst causes of death, now ranking in New Zealand second only to heart-disease in point of number of deaths. Information as to deaths and death-rates from cancer is given in Subsection C of this section.
The total number of deaths in public hospitals in 1925 where cancer was assigned as the cause was 403 (males 264, females 139). In addition, 199 patients treated for cancer were discharged as recovered, 483 as relieved, and 312 as unrelieved. Very few of the recoveries were in cases of internal cancer, and but a small proportion of the deaths in cases of surface cancer. It is noticeable that with but few exceptions cancer of the mouth and its annexa is confined to males.
Of the 403 patients who died in hospital from cancer during 1925, 210, or 52 per cent., had been in hospital less than one month, and of these 66 died within one week of admission.
Tables published in the “Annual Report on Vital Statistics” give detailed information as to condition on discharge and part of body affected, in conjunction with age of patient and also with period in hospital. The following table gives a summary of cancer cases during the last five years, following the international classification as to region affected:—
| CANCER CASKS IN PUBLIC HOSPITALS, 1921–25. | ||||||||||
|---|---|---|---|---|---|---|---|---|---|---|
| Region. | Cases. | Deaths. | ||||||||
| 1921. | 1922. | 1923. | 1924. | 1925. | 1921. | 1922. | 1923. | 1924. | 1925. | |
| Buccal cavity | 135 | 136 | 125 | 161 | 191 | 26 | 18 | 21 | 25 | 31 |
| Stomach and liver | 185 | 206 | 254 | 313 | 308 | 93 | 93 | 111 | 127 | 141 |
| Peritoneum, intestines, and rectum | 109 | 124 | 116 | 152 | 154 | 50 | 56 | 49 | 70 | 64 |
| Female genital organs | 81 | 113 | 126 | 160 | 170 | 9 | 22 | 35 | 35 | 34 |
| Breast | 101 | 113 | 112 | 137 | 123 | 15 | 18 | 18 | 20 | 18 |
| Skin | 62 | 84 | 105 | 101 | 126 | 4 | 12 | 8 | 15 | 11 |
| Other and undefined organs | 202 | 218 | 185 | 261 | 325 | 78 | 75 | 70 | 93 | 104 |
| Totals | 875 | 994 | 1,023 | 1,285 | 1,397 | 275 | 294 | 312 | 385 | 403 |
The percentages of deaths to total cases for the period covered by the above table are given in the following table. It may be mentioned that the two classes with the highest death-rates have also the highest proportion of cases where the patient was discharged unrelieved, and the lowest percentage of recoveries. These two classes are composed entirely of cases of internal cancer, and the “other and undefined” class, which comes third in order of percentage of deaths, also consists mainly of internal cancer cases.
| Region. | Total Cases, 1921–25. | Total Deaths, 1921–25. | Percentage of Deaths to Cases. |
|---|---|---|---|
| Buccal cavity | 743 | 121 | 16 |
| Stomach and liver | 1,266 | 565 | 46 |
| Peritoneum, intestines, and rectum | 655 | 289 | 44 |
| Female genital organs | 650 | 135 | 21 |
| Breast | 586 | 89 | 15 |
| Skin | 478 | 50 | 10 |
| Other and undefined organs | 1,191 | 420 | 35 |
| Totals | 5,574 | 1,669 | 30 |
Under the revised classification all benign tumours and tumours not actually returned as malignant or hydatid are placed under the one heading, with the exception of tumours of the brain, eye, thyroid and pituitary glands, heart, spleen, stomach, prostate, ovary, and uterus.
Formerly many other kinds of tumours, in addition to those specified above, were classed with the part of the body affected, notably tumours of the ear, nose, and breast. The inclusion of these under the one heading for 1924 and 1925 has had the effect of doubling the figures for non-malignant tumours in previous years.
Tumour cases included in the general class numbered 575 during 1925, and of these 531 were discharged either “recovered” or “relieved,” there being only 3 deaths. Following is a summary showing the various locations of the tumours:—
| Benign Tumours of | Number of Cases. | |
|---|---|---|
| Males. | Females. | |
| Head, face | 23 | 14 |
| Mouth, jaw | 19 | 30 |
| Nose | 53 | 30 |
| Ears | 8 | 2 |
| Neck | 18 | 4 |
| Spinal cord | 5 | 3 |
| Breast | 3 | 53 |
| Lungs, mediastinum | 4 | 1 |
| Liver, pancreas | 4 | 1 |
| Intestines, rectum | 8 | 6 |
| Kidneys | 2 | 2 |
| Bladder, urethra | 12 | 1 |
| Abdomen, peritoneum | 6 | 9 |
| Male genital organs | 8 | |
| Bones (except jaw) | 10 | 7 |
| Nerve tissues | 17 | 2 |
| Other sites | 89 | 54 |
| Site not slated | 39 | 28 |
| Totals | 328 | 247 |
The principal of the remaining general diseases, with their figures for each of the last five years, are given in the next table.
Males considerably outnumber females in rheumatism cases, and represent nine-tenths of the alcoholism cases. Females are in the majority in anæmia cases, and more so in cases of exophthalmic goitre and other diseases of the thyroid gland. Large increases throughout the period are recorded for goitre in general, this disease being particularly prevalent amongst school-children. Another noticeable feature of this table is the rapid decline in the number of cases of rickets treated in public hospitals, the figure for 1925 being 5 only, as against a general average of 39 during the three years 1921–23. Consequent on the introduction of the insulin treatment for diabetes, the number of patients treated for this disease shows high increases during the last three years, with, however, little increase in the number of deaths. Next to leucæmia, the numbers for which are small, diabetes has the highest death-rate of any of the diseases included in this group. Most of the deaths from anæmia are due to the pernicious type of the disease.
Only 8 cases of chronic lead poisoning, 2 of phosphorous poisoning, and 1 of arsenical poisoning are included in the total of 26 cases of chronic poisonings for 1925, the remaining 15 (9 males and 6 females) being due to the use of drugs and tobacco.
| Disease. | Total Cases. | Deaths. | ||||||||
|---|---|---|---|---|---|---|---|---|---|---|
| 1921. | 1922. | 1923. | 1924. | 1925. | 1921. | 1922. | 1923. | 1924. | 1925. | |
| Acute rheumatism | 467 | 546 | 504 | 411 | 471 | 13 | 24 | 12 | 10 | 13 |
| Chronic rheumatism and gout | 155 | 202 | 241 | 326 | 361 | 9 | 10 | 7 | 13 | 10 |
| Rickets | 36 | 38 | 42 | 10 | 5 | 2 | 1 | 1 | 2 | .. |
| Diabetes mellitus | 161 | 158 | 249 | 366 | 329 | 53 | 38 | 52 | 51 | 54 |
| Anæmia and chlorosis | 92 | 108 | 106 | 123 | 157 | 28 | 18 | 31 | 29 | 32 |
| Exophthalmic goitre | 102 | 82 | 93 | 104 | 145 | 12 | 8 | 14 | 12 | 22 |
| Other diseases of the thyroid gland | 194 | 230 | 255 | 268 | 358 | 8 | 11 | 12 | 10 | 10 |
| Leucæmia, Hodgkin's disease Alcoholism | 33 | 37 | 30 | 34 | 47 | 14 | 11 | 9 | 12 | 17 |
| Alcoholism | 336 | 268 | 303 | 307 | 319 | 19 | 15 | 10 | 13 | 9 |
| Chronic poisonings | 24 | 15 | 37 | 28 | 26 | .. | .. | .. | 1 | 2 |
| Other | 56 | 67 | 64 | 46 | 79 | 6 | 8 | 12 | 3 | 11 |
| Totals | 1,656 | 1,751 | 1,924 | 2,023 | 2,297 | 164 | 144 | 160 | 156 | 180 |
The diseases of the nervous system, following the international classification, are as follows:—
| Disease. | Total Cases. | Deaths. | ||||||||
|---|---|---|---|---|---|---|---|---|---|---|
| 1921. | 1922. | 1923. | 1924. | 1925. | 1921. | 1922. | 1923. | 1924. | 1925. | |
* New heading, 1923—figures for earlier years not available. | ||||||||||
| Encephalitis | 8 | 13 | 30 | 16 | 13 | 5 | 11 | 17 | 8 | 9 |
| Meningitis | 95 | 88 | 73 | 58 | 74 | 64 | 62 | 51 | 34 | 48 |
| Locomotor ataxia | 46 | 39 | 81 | 39 | 39 | 5 | 5 | 4 | 2 | 4 |
| Other diseases of the spinal cord | 95 | 99 | 79 | 57 | 61 | 23 | 16 | 13 | 8 | 10 |
| Apoplexy, cerebral haemorrhage | 179 | 191 | 181 | 228 | 195 | 118 | 116 | 118 | 163 | 122 |
| Cerebral thrombosis and embolism* | .. | .. | 41 | 39 | 43 | .. | .. | 17 | 22 | 23 |
| Paralysis without specified cause | 135 | 129 | 158 | 176 | 191 | 34 | 22 | 32 | 39 | 37 |
| General paralysis of the insane | 9 | 12 | 14 | 15 | 7 | 1 | .. | .. | .. | .. |
| Other forms of mental alienation | 130 | 251 | 215 | 273 | 242 | 3 | 4 | 4 | 6 | 1 |
| Epilepsy | 148 | 162 | 174 | 188 | 195 | 2 | 3 | 5 | 4 | 6 |
| Convulsions | 11 | 32 | 21 | 25 | 34 | 1 | 7 | 3 | 1 | 1 |
| Convulsions of infants | 35 | 30 | 47 | 55 | 61 | 3 | 1 | 10 | 5 | 4 |
| Chorea | 43 | 65 | 77 | 57 | 66 | .. | 1 | 1 | .. | 1 |
| Neuralgia, neuritis. | 328 | 481 | 418 | 514 | 502 | 4 | 3 | 2 | 4 | 2 |
| Softening of the brain | 3 | 2 | 6 | 3 | 2 | 1 | 2 | 5 | 2 | .. |
| Other nervous diseases | 473 | 708 | 700 | 688 | 714 | 21 | 12 | 29 | 27 | 30 |
| Totals | 1,738 | 2,302 | 2,315 | 2,431 | 2,439 | 285 | 265 | 311 | 325 | 298 |
Very high death-rates are shown for encephalitis, meningitis, apoplexy, and cerebral embolism and thrombosis, but the general rate for the class is low, owing to the large number of cases of neuralgia, neuritis, neurasthenia, and mental alienation, for all of which the death-rate in. hospitals is negligible. Mental cases are not retained in hospital for any length of time, being generally transferred to the mental hospitals as soon as possible.
Eye troubles are responsible for a considerable number of hospital cases, but very few deaths. Out of 3,425 cases during the five years 1921–25 only 5 deaths were recorded. The figures for the principal affections of the eyes during the five years are—
| Disease. | Total Cases. | ||||
|---|---|---|---|---|---|
| 1921. | 1922. | 1923. | 1924. | 1925. | |
| Cataract | 184 | 159 | 132 | 136 | 145 |
| Conjunctivitis | 69 | 75 | 65 | 61 | 80 |
| Iritis | 64 | 56 | 47 | 46 | 65 |
| Strabismus | 32 | 24 | 29 | 29 | 18 |
| Glaucoma | 37 | 18 | 24 | 30 | 44 |
| Dacryocystitis | 18 | 18 | 10 | 22 | 31 |
| Keratitis | 18 | 27 | 20 | 23 | 17 |
| Trachoma | 12 | 5 | 10 | 9 | 18 |
| Ulcers of eye | 101 | 98 | 77 | 97 | 107 |
| Foreign body in eye | 23 | 29 | 31 | 27 | 36 |
| Other diseases of eyes | 148 | 150 | 204 | 171 | 199 |
| Totals | 706 | 659 | 649 | 651 | 760 |
Injuries to the eyes, other than those due to the presence of some foreign body, are included in the “accident” class.
Diseases of the ears and diseases of the mastoid process are placed under the same heading in the classification. The figures for each of the last five years are—
| Year. | Diseases of Ears. | Diseases of Mastoid Process. | ||||||
|---|---|---|---|---|---|---|---|---|
| Total Cases. | Deaths. | Total Cases. | Deaths. | |||||
| Males. | Females. | Males. | Females. | Males. | Females. | Males. | Females. | |
| 1921 | 177 | 136 | 1 | 1 | 44 | 37 | 2 | |
| 1922 | 221 | 173 | 2 | 1 | 94 | 74 | 3 | 3 |
| 1923 | 188 | 151 | 8 | 3 | 88 | 70 | 2 | 1 |
| 1924 | 151 | 154 | 4 | .. | 83 | 62 | 2 | .. |
| 1925 | 141 | 125 | 2 | 2 | 70 | 48 | .. | .. |
Otitis media is the principal disease of the ears, representing 234 of the 266 cases, and all of the deaths, in 1925.
Mastoiditis was the trouble in 93 out of the 118 cases of disease of the mastoid process in 1925.
Diseased of the heart, which occupy the first four orders under Class IV, are responsible for nearly half of the total admissions for diseases of the circulatory system and for nine-tenths of the deaths. The figures for the principal diseases of the circulatory system for the last five years are—
| Disease. | Total Cases. | Deaths. | ||||||||
|---|---|---|---|---|---|---|---|---|---|---|
| 1921. | 1922. | 1923. | 1924. | 1925. | 1921. | 1922. | 1923. | 1924. | 1925. | |
* Excluding cerebral embolism and thrombosis from 1923 onwards. | ||||||||||
| Pericarditis | 14 | 16 | 9 | 21 | 22 | 5 | 1 | 3 | 6 | 13 |
| Acute endocarditis | 102 | 111 | 68 | 81 | 78 | 41 | 43 | 22 | 34 | 34 |
| Angina pectoris | 17 | 8 | 22 | 34 | 34 | 5 | 2 | 2 | 6 | 5 |
| Other diseases of heart | 883 | 795 | 814 | 830 | 994 | 295 | 262 | 268 | 254 | 330 |
| Diseases of arteries | 48 | 58 | 72 | 97 | 95 | 16 | 23 | 14 | 37 | 30 |
| Embolism and thrombosis* | 36 | 62 | 26 | 44 | 46 | 12 | 22 | 1 | 10 | 3 |
| Varicose veins and ulcers | 287 | 204 | 245 | 258 | 265 | .. | .. | .. | .. | 2 |
| Hæmorrhoids | 165 | 171 | 197 | 182 | 239 | .. | 1 | .. | .. | 2 |
| Phlebitis | 37 | 31 | 34 | 41 | 35 | 2 | .. | 1 | 4 | .. |
| Adenitis | 109 | 130 | 124 | 152 | 174 | 1 | 1 | .. | .. | .. |
| Abscess of groin | 49 | 75 | 86 | 87 | 51 | 1 | .. | .. | .. | .. |
| Abscess of axilla | 53 | 54 | 60 | 54 | 67 | .. | 1 | .. | .. | .. |
| Other diseases of lymphatic system | 93 | 122 | 95 | 116 | 93 | 1 | .. | .. | .. | .. |
| Epistaxis and other haemorrhage | 28 | 31 | 35 | 35 | 45 | 1 | 2 | .. | .. | .. |
| Other diseases of circulatory system | 1 | 4 | 4 | 8 | 27 | .. | .. | .. | .. | .. |
| Totals | 1,922 | 1,872 | 1,891 | 2,040 | 2,265 | 380 | 358 | 311 | 351 | 419 |
The principal diseases under the heading “Other diseases of heart” in 1925 were—
| Disease. | Cases. | Deaths. |
|---|---|---|
| Auricular fibrillation | 79 | 14 |
| Tachycardia | 19 | .. |
| Chronic endocarditis | 11 | 3 |
| Chronic myocarditis | 281 | 123 |
| Myocardial degeneration, &c. | 63 | 29 |
| Valvular disease | 53 | 19 |
| Heart-disease (so returned) | 288 | 89 |
| Other diseases | 200 | 53 |
| Totals | 994 | 330 |
The total cases of respiratory disease dealt with in public hospitals daring 1925 were 3,507, resulting in 335 deaths. The figures for the various headings of the classification are as follows for the last five years:—
| Disease. | Total Cages. | Deaths. | ||||||||
|---|---|---|---|---|---|---|---|---|---|---|
| 1921. | 1922. | 1923. | 1924. | 1925. | 1921. | 1922. | 1923. | 1924. | 1925. | |
| Diseases of nasal fossæ and annexa | 338 | 420 | 467 | 644 | 647 | .. | 1 | 1 | 6 | 1 |
| Diseases of larynx | 101 | 66 | 132 | 75 | 71 | 4 | 2 | 7 | 5 | 5 |
| Bronchitis | 718 | 821 | 896 | 740 | 886 | 49 | 72 | 67 | 57 | 65 |
| Broncho-pneumonia | 353 | 308 | 516 | 397 | 401 | 72 | 42 | 122 | 80 | 83 |
| Pneumonia | 995 | 1,191 | 808 | 919 | 733 | 146 | 163 | 125 | 138 | 131 |
| Pleurisy | 457 | 470 | 453 | 418 | 387 | 16 | 22 | 17 | 25 | 15 |
| Pulmonary congestion | 22 | 32 | 26 | 16 | 28 | 8 | 11 | 7 | 5 | 11 |
| Gangrene of lung | 1 | .. | 2 | 3 | 3 | .. | .. | 1 | 2 | 2 |
| Asthma | 157 | 223 | 228 | 268 | 262 | 7 | 6 | 8 | 10 | 8 |
| Pulmonary emphysema | .. | 10 | 7 | 1 | .. | .. | 1 | 1 | .. | .. |
| Pneumoconiosis | 3 | 8 | 14 | 14 | 14 | 2 | 3 | 2 | 9 | |
| Other diseases of respiratory system | 41 | 57 | 66 | 86 | 75 | 6 | 3 | 4 | 4 | 5 |
| Totals | 3,186 | 3,606 | 3,615 | 3,581 | 3,507 | 308 | 325 | 363 | 334 | 335 |
Bronchitis, broncho-pneumonia, and pneumonia were responsible in 1925 for nearly three-fifths of the total cases in this class, and five-sixths of the deaths. Males represent the majority of the cases of respiratory disease. The sudden increase in 1924 of diseases of the nasal fossæ and annexa is due to the inclusion under that heading, in the revised classification of diseases, of the maxillary, frontal, and ethmoidal sinuses, which were formerly treated as diseases of the bones.
Dental caries (including teeth-extractions, undefined) is the principal disease of the month dealt with in public hospitals, representing 305 out of a total of 555 cases in 1925. Other complaints contributing to the total were: Stomatitis, 37; alveolar abscess, 41; pyorrhœa, 39; and hæmorrhage from tooth-socket, 39. The death-rate in this group is negligible, as will be seen from the figures for the last five years.
| Year. | Total Cases. | Deaths. |
|---|---|---|
| 1921 | 376 | 5 |
| 1922 | 339 | 3 |
| 1923 | 409 | 2 |
| 1924 | 497 | 2 |
| 1925 | 555 | 1 |
Formerly diseases of the tonsils were classed among diseases of the digestive system, while adenoids appeared as a disease of the respiratory system. Under the revised classification the two complaints are included in diseases of the digestive system, under the title “Diseases of pharynx and tonsils (including adenoid vegetations).” The death-rate for the group is exceedingly low.
| Disease. | Total Cases. | Deaths. | ||||||||
|---|---|---|---|---|---|---|---|---|---|---|
| 1921. | 1922. | 1923. | 1924. | 1925. | 1921. | 1922. | 1923. | 1924. | 1925. | |
| Adenoids and tonsils | 2,749 | 2,776 | 2,573 | 2,875 | 2,709 | 3 | 2 | .. | .. | 1 |
| Adenoids | 250 | 217 | 150 | 208 | 156 | .. | .. | .. | .. | .. |
| Enlarged or diseased tonsils | 153 | 212 | 299 | 418 | 453 | .. | .. | .. | .. | .. |
| Tonsillitis, tonsillar abscess | 806 | 868 | 864 | 1,093 | 983 | 1 | 2 | 4 | 1 | 1 |
| Septic throat | 94 | 91 | 65 | 76 | 65 | .. | 1 | .. | .. | 1 |
| Pharyngitis | 34 | 35 | 42 | 49 | 35 | 1 | 1 | 2 | .. | .. |
| Vincent's angina | 12 | 18 | 9 | 17 | 22 | .. | 1 | .. | .. | .. |
| Other | 36 | 28 | 28 | 32 | 4 | 3 | 2 | 3 | 1 | 1 |
| Totals | 4,134 | 4,245 | 4,030 | 4,768 | 4,427 | 8 | 9 | 9 | 2 | 4 |
There were 1,192 cases of and 44 deaths from diseases of the stomach during the year 1925, the principal of which were ulcer of stomach and duodenum 499 cases, gastritis 372, and dyspepsia and indigestion 150. Of the 44 deaths, gastric nicer or duodenal ulcer was the complaint in 37 cases.
A comparison of the discharges and deaths for the principal diseases in each of the five years 1921–25 is given.
| Disease. | Total Cases. | Deaths. | ||||||||
|---|---|---|---|---|---|---|---|---|---|---|
| 1921. | 1922. | 1923. | 1924. | 1925. | 1921. | 1922. | 1923. | 1924. | 1925. | |
* Figures for years prior to 1923 not available. | ||||||||||
| Ulcer of stomach | 203 | 237 | 212 | 241 | 271 | 25 | 15 | 15 | 23 | 21 |
| Ulcer of duodenum* | 163 | 168 | 228 | .. | .. | 17 | 15 | 16 | ||
| Gastritis | 425 | 360 | 379 | 382 | 372 | 5 | 2 | 3 | .. | 1 |
| Dyspepsia, indigestion | 109 | 145 | 120 | 98 | 150 | .. | 1 | .. | .. | .. |
| Vomiting | 14 | 12 | 22 | 25 | 29 | 2 | .. | .. | .. | 1 |
| Haematemesis | 18 | 16 | 19 | 32 | 32 | 1 | 1 | .. | 2 | 1 |
| Other diseases | 73 | 100 | 143 | 103 | 110 | 4 | 4 | 8 | 2 | 4 |
| Totals | 842 | 870 | 1,058 | 1,049 | 1,192 | 37 | 23 | 43 | 42 | 44 |
The total cases of diarrhœa and enteritis included in the returns for 1925 were 663, including 35 deaths. Twenty-two of the deaths were of children under two years of age.
The total numbers of cases and of deaths in each of the last five years are—
| Year. | Total Cases. | Total Deaths. | ||||
|---|---|---|---|---|---|---|
| Under 2 Years of Age. | 2 Years and over. | Total. | Under 2 Years of Age. | 2 Years and over. | Total. | |
| 1921 | 204 | 549 | 753 | 40 | 25 | 65 |
| 1922 | 200 | 536 | 736 | 29 | 27 | 56 |
| 1923 | 140 | 437 | 577 | 22 | 21 | 43 |
| 1924 | 230 | 585 | 815 | 37 | 18 | 55 |
| 1925 | 155 | 508 | 663 | 22 | 13 | 35 |
Infants under two years of age represent 26 per cent. of the total cases for the last five years, and 59 per cent. of the deaths.
Appendicitis ranks high among hospital cases, but the death-rate is exceedingly low. During the five years 1921–25 only 366 deaths occurred out of a total of 16,149 cases dealt with, representing a percentage of 2.27. The figures for the last five years are as stated in the next table.
| Year. | Total Cases. | Deaths. | ||||
|---|---|---|---|---|---|---|
| Males. | Females. | Total. | Males. | Females. | Total. | |
| 1921 | 1,372 | 1,378 | 2,750 | 34 | 17 | 51 |
| 1922 | 1,331 | 1,491 | 2,822 | 39 | 24 | 63 |
| 1923 | 1,543 | 1,604 | 3,147 | 55 | 29 | 84 |
| 1924 | 1,676 | 1,822 | 3,498 | 46 | 31 | 77 |
| 1925 | 1,895 | 2,037 | 3,932 | 63 | 28 | 91 |
Males represent somewhat less than one-half of the total cases dealt with, but two-thirds of the deaths were of males. In other words, the male death-rate is double the female rate.
Hernia and intestinal-obstruction cases included in the returns for 1925 numbered 1,209, including 62 deaths. A table showing for the different varieties of hernia and for intestinal obstruction, the number of cases and of deaths during the last five years is given below:—
| Disease. | Total Cases. | Deaths. | ||||||||
|---|---|---|---|---|---|---|---|---|---|---|
| 1921. | 1922. | 1923. | 1924. | 1925. | 1921. | 1922. | 1923. | 1924. | 1925. | |
| Inguinal hernia | 624 | 614 | 640 | 715 | 710 | 6 | 3 | 11 | 6 | 5 |
| Ventral hernia | 100 | 81 | 90 | 90 | 95 | 2 | 1 | 3 | 3 | 4 |
| Umbilical hernia | 32 | 32 | 48 | 47 | 40 | .. | 2 | 3 | 3 | 2 |
| Femoral hernia | 29 | 31 | 31 | 46 | 50 | 4 | 1 | 1 | 1 | 2 |
| Hernia (class undefined) | 91 | 85 | 76 | 98 | 116 | 5 | 4 | 9 | 5 | 4 |
| Intestinal obstruction | 126 | 127 | 135 | 187 | 198 | 34 | 35 | 27 | 38 | 45 |
| Totals | 1,002 | 970 | 1,020 | 1,183 | 1,209 | 51 | 46 | 54 | 56 | 62 |
There is very little movement over the period, the most noticeable points being increases in the number of oases of inguinal hernia and intestinal obstruction. Although the cases of hernia outnumber the intestinal-obstruction cases by five to one, the number of deaths from the former is small. Deaths from intestinal obstruction, however, are comparatively numerous and normally one-fifth of the total cases treated prove to be fatal. Females largely outnumber males in the figures for ventral, umbilical, and femoral hernia.
Non-cancerous diseases of the liver were responsible for 66 deaths during the year 1925. Of the total of 713 discharges and deaths of patients treated for liver-diseases, those suffering from cholecystitis contributed 256, and those treated for biliary calculi 253 (including 221 females).
The following table gives a brief summary of the principal diseases:—
| Disease. | Total Cases. | Deaths. | ||||||||
|---|---|---|---|---|---|---|---|---|---|---|
| 1921. | 1922. | 1928. | 1924. | 1925. | 1921. | 1922. | 1923. | 1924. | 1925. | |
| Acute yellow atrophy | 1 | 3 | 3 | 3 | .. | 1 | 2 | 3 | 2 | .. |
| Hydatids | 45 | 53 | 56 | 55 | 44 | .. | 1 | 2 | 6 | 7 |
| Cirrhosis | 29 | 37 | 45 | 40 | 39 | 6 | 12 | 12 | 13 | 12 |
| Biliary calculi | 218 | 238 | 244 | 315 | 253 | 9 | 14 | 14 | 14 | 11 |
| Cholecystitis | 111 | 109 | 138 | 135 | 256 | 3 | 8 | 7 | 8 | 20 |
| Jaundice | 46 | 47 | 116 | 70 | 85 | 3 | 1 | 2 | 1 | 8 |
| Other diseases | 33 | 27 | 43 | 24 | 36 | 7 | 4 | 6 | 3 | 8 |
| Totals | 483 | 514 | 645 | 642 | 713 | 29 | 42 | 46 | 47 | 66 |
In 217 cases in 1925 the disease treated was entered as peritonitis, without the actual cause of the condition being indicated. Peritonitis is a frequent complication of appendicitis and other diseases of the digestive system, and also of the puerperal state. Females predominate among peritonitis cases, as will be seen from the following table covering the last five years:—
| Year. | Total Cases. | Deaths. | ||||
|---|---|---|---|---|---|---|
| Males. | Females. | Total. | Males. | Females. | Total. | |
| 1921 | 34 | 81 | 115 | 5 | 13 | 18 |
| 1922 | 62 | 94 | 156 | 16 | 20 | 36 |
| 1923 | 67 | 95 | 162 | 15 | 21 | 36 |
| 1924 | 73 | 119 | 192 | 10 | 22 | 32 |
| 1925 | 76 | 141 | 217 | 7 | 19 | 26 |
The great majority of the remaining diseases of the digestive system come under the somewhat indefinite heading “Other diseases of the intestines,” which covers a considerable number of important items in the study of morbidity. The death-rate for the group is exceedingly low, as is also the rate for the group “Diseases of the œsophagus.” The figures for the principal diseases of the digestive system not already dealt with are—
| Disease. | Total Cases. | Deaths. | ||||||||
|---|---|---|---|---|---|---|---|---|---|---|
| 1921. | 1922. | 1923. | 1924. | 1925. | 1921. | 1922. | 1923. | 1924. | 1925. | |
* Included in figures for “Other diseases of intestines.” | ||||||||||
| Diseases of the œsophagus | 28 | 42 | 61 | 40 | 15 | 3 | 1 | 1 | 1 | .. |
| Worms and other intestinal parasites | 7 | 13 | 18 | 51 | 73 | .. | .. | .. | 2 | 7 |
| Constipation | 119 | 132 | 136 | 164 | 211 | .. | .. | .. | .. | .. |
| Ischio-rectal abscess | 59 | 61 | 85 | 55 | 93 | 1 | 1 | .. | .. | 2 |
| Anal fistula | 36 | 42 | 47 | 43 | 29 | .. | 1 | .. | .. | .. |
| Anal fissure | 13 | 15 | 16 | 17 | 29 | .. | .. | .. | .. | .. |
| Anal abscess | * | 12 | 13 | 15 | 25 | * | .. | .. | .. | .. |
| Visceroptosis | 9 | 19 | 38 | 50 | 28 | .. | .. | 1 | .. | .. |
| Enteroptosis | * | 11 | 10 | 7 | 16 | * | .. | 1 | .. | 1 |
| Other diseases of intestines | 135 | 162 | 142 | 125 | 122 | 1 | 9 | 6 | 9 | 7 |
| Diseases of the pancreas | 12 | 7 | 7 | 15 | 17 | 1 | 4 | 3 | 9 | 8 |
| Abdominal pains | 43 | 63 | 78 | 70 | 90 | .. | .. | 1 | .. | .. |
| Other diseases of digestive system | 7 | 8 | .. | .. | .. | .. | 1 | .. | .. | .. |
| Totals | 468 | 587 | 651 | 652 | 748 | 6 | 17 | 13 | 21 | 25 |
The increase in the number of cases treated for worms and other intestinal parasites is due mainly to the fact that the revised classification includes under this heading all cases of hydatids other than hydatids of the liver.
Of the 73 cases shown above for 1925, 39 were hydatid cases. The following table shows the 1925 figures for hydatids (except of the liver), with parts of the body affected:—
| Hydatids of | Cases. | Deaths. |
|---|---|---|
| Cerebrum | 1 | 1 |
| Neck | 1 | .. |
| Spine | 3 | 1 |
| Lung | 20 | 3 |
| Kidney | 3 | 1 |
| Bladder | 1 | .. |
| Abdomen | 3 | .. |
| Spleen | 3 | 1 |
| Mesentery | 1 | .. |
| Pelvis | 1 | .. |
| Peritoneum | 1 | .. |
| Thigh | 1 | .. |
| Totals | 39 | 7 |
The figures for the various diseases of the urinary system dealt with in public hospitals during the last five years are—
| Disease. | Total Cases. | Deaths. | ||||||||
|---|---|---|---|---|---|---|---|---|---|---|
| 1921. | 1922. | 1923. | 1924. | 1925. | 1921. | 1922. | 1923. | 1924. | 1925. | |
| Acute nephritis | 130 | 104 | 95 | 78 | 84 | 22 | 10 | 18 | 11 | 27 |
| Chronic nephritis | 267 | 275 | 276 | 261 | 262 | 111 | 84 | 91 | 106 | 108 |
| Pyelitis | 142 | 238 | 298 | 392 | 384 | 3 | 2 | .. | 3 | 4 |
| Hæmaturia | 36 | 36 | 28 | 31 | 50 | .. | .. | 1 | 1 | 1 |
| Movable kidney | 24 | 15 | 22 | 12 | 20 | .. | .. | .. | .. | .. |
| Pyelonephritis | 14 | 8 | 29 | 22 | 56 | 6 | 2 | 8 | 8 | 16 |
| Pyonephrosis | .. | 10 | 15 | 13 | 15 | .. | 3 | 5 | 4 | 6 |
| Hydronephrosis | 7 | 11 | 8 | 15 | 10 | 1 | 1 | 1 | 1 | .. |
| Abscess of kidney | 12 | 7 | 9 | 8 | 17 | 1 | .. | .. | .. | 2 |
| Other kidney-diseases | 36 | 33 | 36 | 38 | 48 | 4 | 2 | 4 | 3 | 2 |
| Renal colic | 37 | 38 | 55 | 53 | 42 | .. | .. | .. | .. | .. |
| Renal stone | 43 | 64 | 64 | 59 | 71 | 1 | 3 | 2 | 1 | 4 |
| Stone in bladder or urethra | 45 | 21 | 35 | 45 | 49 | 1 | .. | 1 | .. | .. |
| Retention of urine | 55 | 45 | 58 | 53 | 52 | 5 | 1 | 5 | 4 | 3 |
| Enuresis | 12 | 23 | 15 | 19 | 26 | .. | .. | .. | .. | 1 |
| Cystitis | 196 | 181 | 190 | 190 | 174 | 14 | 7 | 14 | 11 | 6 |
| Cystocele | 13 | 13 | 14 | 28 | 28 | .. | .. | .. | .. | .. |
| Other diseases of bladder | 24 | 27 | 32 | 28 | 24 | 2 | 5 | 1 | .. | .. |
| Stricture, &c., of urethra | 137 | 1 | 126 | 165 | 191 | 8 | 8 | 8 | 3 | 6 |
| Enlargement, &c., of prostate | 150 | 1 | 202 | 239 | 261 | 34 | 47 | 55 | 59 | 41 |
| Totals | 1,380 | 1,4 | 1,607 | 1,749 | 1,864 | 213 | 175 | 214 | 215 | 227 |
Chronic nephritis is responsible for nearly half of the total deaths in this group, though it represents only about one-seventh of the cases. Diseases of the prostate, principally cases of enlargement, have also a comparatively high death-rate. Females comprise the majority of the cases of pyelitis, movable kidney, and cystitis, though in the case of the last-mentioned males invariably exceed females among the fatal cases.
Phimosis is responsible for more admissions to public hospitals than all other non-venereal diseases of the male genital organs taken together. Under the classification in force up to the end of 1922, children under five years of age treated for phimosis were placed in the malformation class, but under the revised classification all phimosis cases are regarded as diseases of the genital organs. A table showing the figures for the years 1921–25 follows:—
| Disease, &c. | Total Cases. | ||||
|---|---|---|---|---|---|
| 1921. | 1922. | 1923. | 1924. | 1925. | |
| Phimosis | 309 | 359 | 378 | 421 | 400 |
| Paraphimosis | 10 | 11 | 16 | 10 | 22 |
| Epididymitis | 11 | 7 | 15 | 15 | 16 |
| Orchitis | 29 | 25 | 22 | 24 | 18 |
| Hydrocele | 69 | 61 | 63 | 61 | 65 |
| Undescended testicle | 18 | 30 | 16 | 34 | 21 |
| Other | 22 | 38 | 39 | 33 | 31 |
| Totals | 468 | 531 | 549 | 598 | 573 |
Only 2 deaths were recorded during the period covered by the table, both in 1921.
Diseases of the female genital organs, other than cancer or those diseases shown to be venereal or puerperal, are an important group in hospital cases, though the death-rate is exceedingly low. The total cases passing through public hospitals in 1925 were 2,380, involving only 23 deaths. The list follows:—
| Disease. | Total Cases. | Deaths. | ||||||||
|---|---|---|---|---|---|---|---|---|---|---|
| 1921. | 1922. | 1923. | 1924. | 1925. | 1921. | 1922. | 1923. | 1924. | 1925. | |
| Ovarian cysts | 132 | 104 | 114 | 170 | 169 | 3 | 2 | 5 | 2 | 8 |
| Salpingitis and pelvic abscess | 258 | 240 | 257 | 221 | 288 | 2 | 11 | 8 | 3 | 6 |
| Uterine tumour | 150 | 163 | 190 | 234 | 250 | 4 | 3 | 7 | 7 | 4 |
| Uterine hæmorrhage | 152 | 160 | 163 | 157 | 241 | .. | .. | 2 | .. | 2 |
| Metritis | 19 | 25 | 17 | 29 | 25 | 1 | .. | .. | .. | .. |
| Endometritis | 157 | 172 | 164 | 185 | 245 | 1 | .. | 1 | 1 | .. |
| Cervicitis | 12 | 11 | 15 | 22 | 20 | .. | .. | .. | .. | .. |
| Endocervicitis | 10 | 10 | 11 | 12 | 16 | .. | .. | .. | .. | .. |
| Erosion of cervix uteri | 10 | 21 | 22 | 29 | 24 | .. | .. | .. | .. | .. |
| Retroversion of uterus | 274 | 297 | 328 | 382 | 381 | 2 | 1 | 1 | 1 | 2 |
| Anteflexion of uterus | 12 | 7 | 7 | 4 | .. | .. | .. | .. | .. | .. |
| Retroflexion of uterus | 20 | 20 | 26 | 15 | 22 | .. | .. | .. | .. | .. |
| Prolapse of uterus | 219 | 189 | 217 | 213 | 282 | 4 | 3 | 3 | 2 | 1 |
| Dysmenorrhœa | 74 | 68 | 71 | 96 | 97 | .. | .. | .. | .. | .. |
| Leucorrhœa | 19 | 40 | 15 | 33 | 38 | .. | .. | .. | .. | .. |
| Amenorrhœa | 8 | 11 | 5 | 8 | .. | .. | .. | .. | .. | .. |
| Other diseases of uterus | 101 | 113 | 47 | 114 | 113 | 1 | 3 | .. | .. | .. |
| Oophoritis | 22 | 12 | 23 | 25 | 29 | .. | .. | .. | .. | .. |
| Vaginitis | 21 | 25 | 22 | 29 | 23 | .. | .. | .. | .. | .. |
| Other diseases | 59 | 60 | 105 | 140 | 117 | .. | 1 | .. | .. | .. |
| Totals | 1,729 | 1,748 | 1,819 | 2,118 | 2,380 | 18 | 24 | 27 | 16 | 23 |
The following table gives figures for the principal non-puerperal and non-cancerous diseases of the female breast dealt with at public hospitals during the last five years. No deaths were recorded.
Tumours of the breast, which were removed from this group in 1923 by the revised classification, are not included in the figures for 1921 and 1922 given in the table.
| Disease. | Total Cases. | ||||
|---|---|---|---|---|---|
| 1921. | 1922. | 1923. | 1924. | 1925. | |
| Abscess of breast | 88 | 106 | 110 | 115 | 136 |
| Mastitis | 52 | 49 | 67 | 63 | 72 |
| Other | 1 | 2 | 5 | .. | 2 |
| Totals | 141 | 157 | 182 | 178 | 210 |
A total of 3,722 cases comes under the heading of puerperal in 1925. This number includes 1,467 cases of normal childbirth dealt with at public general hospitals, but does not cover maternity cases in St. Helens Hospitals.
There have been substantial increases in the number of puerperal cases treated during the last five years. This increase can justly be put down to the huge advance that has taken place in the matter of providing maternity wards at the various public hospitals. Whereas in 1921 there were only 690 cases of normal labour, this figure has rapidly risen until in 1925 it reached the comparatively high total of 1,467. Accidents of pregnancy accounted for the greater part of the remainder of the increase. Puerperal septicæmia cases also show a fairly substantial increase over the period, but without any corresponding rise in the number of deaths.
The totals given in the following table for miscarriage do not include threatened miscarriage (34 in 1925); nor do those for abortion include threatened abortion (72 in 1925). These, together with hyperemesis gravidarum (102 in 1925), are the principal diseases included in “Other accidents of pregnancy.”
| PUERPERAL DISEASESAND ACCIDENTS. | ||||||||||
|---|---|---|---|---|---|---|---|---|---|---|
| Disease. | Total Cases. | Deaths. | ||||||||
| 1921. | 1922. | 1923. | 1924. | 1925. | 1921. | 1922. | 1923. | 1924. | 1925. | |
| Normal labour | 690 | 841 | 1,000 | 1,323 | 1,467 | .. | .. | .. | .. | .. |
| Miscarriage | 310 | 378 | 308 | 287 | 331 | 1 | 4 | .. | 1 | 1 |
| Incomplete miscarriage | 33 | 78 | 95 | 115 | 87 | 1 | .. | 1 | 1 | .. |
| Abortion | 106 | 139 | 151 | 260 | 264 | .. | 1 | 2 | 3 | 1 |
| Incomplete abortion | 220 | 214 | 239 | 345 | 438 | 1 | .. | .. | .. | .. |
| Ectopic gestation | 76 | 80 | 93 | 105 | 89 | 3 | .. | 2 | 3 | 1 |
| Other accidents of pregnancy. | 189 | 209 | 239 | 355 | 391 | 2 | 2 | 2 | 2 | 3 |
| Puerperal hæmorrhage | 26 | 54 | 48 | 48 | 68 | 5 | 5 | 3 | 3 | 5 |
| Laceration, &c., of perinæum and cervix | 91 | 57 | 63 | 28 | 92 | .. | .. | .. | .. | 2 |
| Other accidents of labour | 44 | 47 | 43 | 49 | 73 | 2 | 1 | 5 | .. | 5 |
| Puerperal septicæmia | 139 | 226 | 152 | 204 | 249 | 33 | 38 | 38 | 33 | 34 |
| Puerperal albuminuria, convulsions | 74 | 52 | 82 | 89 | 153 | 14 | 4 | 11 | 14 | 17 |
| Puerperal phlebitis and phlegmasia alba dolens | 14 | 12 | 13 | 10 | 9 | 3 | 1 | 3 | 1 | 2 |
| Puerperal mania, &c. | 13 | 10 | 12 | 6 | 11 | .. | 1 | 2 | .. | 1 |
| Puerperal diseases of breast | 1 | 2 | 7 | 3 | .. | .. | .. | .. | .. | .. |
| Totals | 2,026 | 2,399 | 2,545 | 3,227 | 3,722 | 65 | 57 | 69 | 61 | 72 |
Cases of non-tuberculous diseases of the bones and of the organs of locomotion dealt with in 1925 numbered 1,680, including 30 deaths. Twenty-six deaths were due to osteomyelitis. The principal diseases in this class, following the order of the classification, for the years 1921-25 were—
| Disease. | 1921. | 1922. | 1923. | 1924. | 1925. |
|---|---|---|---|---|---|
* Only acute arthritis in 1924 and 1925. Arthritis (undefined) is now included with chronic rheumatism. | |||||
| Osteomyelitis | 219 | 245 | 292 | 295 | 345 |
| Periostitis | 67 | 82 | 57 | 72 | 66 |
| Necrosis | 57 | 50 | 47 | 67 | 49 |
| Osteitis | 13 | 16 | 22 | 19 | 14 |
| Other diseases of bones | 233 | 207 | 218 | 208 | 183 |
| Synovitis | 129 | 152 | 118 | 160 | 153 |
| Arthritis* | 105 | 112 | 154 | 45 | 42 |
| Ankylosis | 16 | 22 | 23 | 17 | 22 |
| Other diseases of joints | 79 | 93 | 120 | 117 | 114 |
| Amputations | 26 | 46 | 8 | 7 | 19 |
| Bursitis | 88 | 128 | 108 | 115 | 123 |
| Lumbago | 66 | 51 | 62 | 61 | 80 |
| Myalgia | 60 | 72 | 77 | 84 | 63 |
| Talipes | 77 | 82 | 78 | 90 | 109 |
| Tenosynovitis | 16 | 21 | 22 | 14 | 22 |
| Ganglion | 14 | 18 | 20 | 24 | 26 |
| Bunion | 14 | 9 | 9 | 17 | 15 |
| Other diseases of organs of locomotion | 176 | 159 | 201 | 208 | 235 |
| Totals | 1,455 | 1,565 | 1,636 | 1,620 | 1,680 |
Diseases of the skin and of the cellular tissue, which comprise four orders in the international classification, are an important group in morbidity statistics, though the death-rate is very low. Abscesses, cellulitis, and ulcers are responsible for approximately half of the total cases dealt with under this heading, eczema and furuncle ranking highest among other skin-diseases.
The figures for the principal diseases of the skin and annexa during the last five years are—
| Disease. | 1921. | 1922. | 1923. | 1924. | 1925. |
|---|---|---|---|---|---|
| Gangrene | 36 | 35 | 34 | 33 | 27 |
| Carbuncle | 91 | 64 | 76 | 89 | 109 |
| Furuncle | 69 | 99 | 94 | 152 | 157 |
| Abscess | 478 | 543 | 655 | 712 | 727 |
| Cellulitis | 247 | 336 | 316 | 410 | 376 |
| Whitlow | 79 | 80 | 84 | 89 | 97 |
| Ulcers | 228 | 219 | 191 | 231 | 184 |
| Eczema | 129 | 147 | 177 | 149 | 151 |
| Scabies | 96 | 83 | 86 | 101 | 74 |
| Dermatitis | 90 | 105 | 120 | 133 | 120 |
| Erythema | 50 | 42 | 39 | 56 | 43 |
| Impetigo | 48 | 66 | 73 | 81 | 90 |
| Ingrown nails | 35 | 49 | 42 | 64 | 52 |
| Herpes | 27 | 31 | 28 | 37 | 35 |
| Psoriasis | 17 | 18 | 13 | 22 | 23 |
| Seborrhœa | 20 | 14 | 19 | 12 | 21 |
| Urticaria | 17 | 12 | 8 | 23 | 25 |
| Ringworm | 11 | 14 | 20 | 25 | 21 |
| Pruritus | 7 | 9 | 8 | 10 | 5 |
| Onychia | 6 | 12 | 14 | 14 | 10 |
| Pemphigus | 2 | 4 | 7 | 3 | 7 |
| Other diseases | 241 | 180 | 162 | 170 | 135 |
| Totals | 2,024 | 2,162 | 2,266 | 2,616 | 2,489 |
Deaths from these diseases during the year 1925 numbered 45, as compared with 30 in 1924, 30 in 1923, and 37 in 1922. The deaths include, in 1925, 8 ascribed to gangrene and 19 to cellulitis.
Congenital malformations do not bulk very largely among hospital cases, but appear to be on the increase. The figures for the last five years are given.
| Disease. | Total Cases. | Deaths. | ||||||||
|---|---|---|---|---|---|---|---|---|---|---|
| 1921. | 1922. | 1923. | 1924. | 1925. | 1921. | 1922. | 1923. | 1924. | 1925. | |
| Cleft palate | 26 | 32 | 31 | 38 | 34 | .. | 4 | .. | 3 | 3 |
| Nævus | 19 | 22 | 24 | 17 | 20 | .. | .. | .. | 1 | .. |
| Hare-lip | 17 | 8 | 17 | 22 | 14 | 2 | .. | 1 | .. | .. |
| Hydrocephalus | 8 | 6 | 5 | 7 | 6 | .. | 2 | 2 | 5 | 1 |
| Spina bifida | 9 | 7 | 7 | 6 | 10 | 5 | 3 | 4 | 2 | 5 |
| Congenital dislocation of hip | 20 | 14 | 28 | 42 | 36 | .. | .. | .. | .. | .. |
| Congenital talipes | 22 | 33 | 38 | 52 | 49 | .. | .. | .. | .. | .. |
| Heart-disease | 9 | 6 | 11 | 11 | 11 | 3 | 3 | 6 | 3 | 9 |
| Other malformations | 41 | 48 | 37 | 60 | 73 | 6 | 10 | 12 | 18 | 12 |
| Totals | 171 | 176 | 198 | 255 | 253 | 16 | 22 | 25 | 32 | 30 |
Forty-five deaths in public hospitals during 1925 are recorded as having been due to diseases of early infancy, which is 5 more than in the previous year. The chief items in this class are congenital debility, &c. (16 deaths), and premature birth (19 deaths). The total discharges and deaths in 1925 amounted to only 120; thus the deaths amounted to the very high percentage of 37.50 of the total cases treated, against 31.75 in 1924, 33.88 in 1923, and 37.30 in 1922.
Hospital returns show a total of 87 male deaths and 27 female deaths from old age daring 1925. These totals include the returns of three hospitals which are also old people's homes. The numbers for the five years 1921-25 are as follows:—
| Year. | Total Cases. | Deaths. | ||
|---|---|---|---|---|
| Hales. | Females. | Males. | Females. | |
| 1921 | 150 | 59 | 64 | 24 |
| 1922 | 203 | 80 | 94 | 42 |
| 1923 | 291 | 115 | 116 | 52 |
| 1924 | 242 | 105 | 80 | 48 |
| 1925 | 246 | 98 | 87 | 27 |
The principal headings included in this class in hospital cases are fractures and injuries in regard to which no specified cause is shown. In death-registrations the cause of death is asked for, and in cases of deaths resulting from fractures and other injuries the actual cause is obtained, and the death classified under one or other of the thirty definite headings provided. The Medical Superintendents are, however, concerned not with causes but with nature of injuries, and the returns in the great majority of cases are classed under the headings “fractures” and “injuries,” which in death statistics would be regarded as somewhat indefinite, but which in morbidity statistics are invaluable on account of the fact that the part of the body affected is given in most of the cases.
The following table shows as far as possible the classification of the various external causes dealt with during the five years 1921–25.
| — | Total Cases. | Deaths. | ||||||||
|---|---|---|---|---|---|---|---|---|---|---|
| 1921. | 1922. | 1923. | 1924. | 1925. | 1921. | 1922. | 1923. | 1924. | 1925. | |
| Self-inflicted injuries | 22 | 39 | 44 | 35 | 37 | 4 | 5 | 14 | 8 | 5 |
| Homicidal injuries | .. | 1 | 10 | 3 | 1 | .. | .. | .. | 1 | .. |
| War injuries | 176 | 276 | 226 | 153 | 81 | 2 | 3 | 2 | .. | |
| Accidental poisoning | 82 | 71 | 98 | 77 | 84 | 9 | 11 | 2 | 5 | 7 |
| Accidental immersion in water | 14 | 5 | 9 | 5 | 5 | 2 | .. | 1 | .. | .. |
| Burns and scalds | 269 | 252 | 307 | 338 | 346 | 30 | 19 | 25 | 27 | 24 |
| Suffocation and gas poisoning | 8 | 9 | 5 | 10 | 4 | 1 | .. | .. | .. | 2 |
| Traumatism by firearms | 104 | 104 | 69 | 95 | 108 | 3 | 8 | 7 | 9 | 10 |
| Injuries by animals | 5 | 15 | 20 | 17 | 11 | .. | 1 | .. | 1 | 1 |
| Starvation | 1 | 1 | 4 | 1 | 4 | 1 | .. | 2 | .. | .. |
| Frostbite, excessive cold | 6 | 2 | 8 | 3 | 5 | 1 | .. | .. | .. | .. |
| Exposure | .. | 4 | 2 | .. | .. | .. | .. | .. | .. | .. |
| Effects of heat | 8 | 6 | 11 | 5 | 13 | 1 | .. | .. | .. | 1 |
| Electric shook | 2 | .. | 6 | 3 | 8 | .. | .. | 1 | .. | .. |
| Fractures, dislocations, &c. | 2,255 | 2,246 | 2,353 | 2,700 | 3,019 | 89 | 84 | 101 | 119 | 100 |
| Miscellaneous injuries | 2,771 | 2,558 | 2,925 | 3,488 | 3,933 | 56 | 28 | 36 | 52 | 71 |
| Totals | 5,723 | 5,589 | 6,097 | 6,933 | 7,659 | 199 | 159 | 191 | 222 | 221 |
In a few instances cases included in the fractures and miscellaneous injuries in the above table could have been definitely allocated to one of the following five headings of the classification, but on account of such cases obviously representing only a small proportion of the total for the respective headings it has been considered advisable to omit these headings altogether and to include the cases in the two general headings. The five headings referred to are; Traumatism by cutting or piercing instruments; traumatism by fall; traumatism in mines and quarries; traumatism by machines; traumatism by other crushing (vehicles, railways, landslides, &c).
The location of the 3,933 miscellaneous injuries, as well as of the 3,019 fractures, dislocations, &c., for 1925 is shown in the following table:—
| Region. | Fractures, Dislocations, &c. | Miscellaneous Injuries. |
|---|---|---|
| Head | 198 | 694 |
| Face | 106 | 470 |
| Neck | 3 | 24 |
| Back | 37 | 151 |
| Thorax and contents | 140 | 143 |
| Abdomen and contents | .. | 151 |
| External genital organs | .. | 42 |
| Upper limbs | 1,003 | 914 |
| Lower limbs | 1,510 | 1,119 |
| Undefined | 22 | 225 |
| Totals | 3,019 | 3,933 |
The patient's discharge-card in use provides for information being given as to operations performed. This information was utilized statistically for the first time in 1925, when detailed statistics of operations in conjunction with disease, &c., were compiled. Operations were returned in no fewer than 25,063 of the 51,387 cases dealt with during the year, and of the 3,483 patients who died 811 were shown to have been operated on in hospital.
The great bulk of the operations returned were of a simple or more or less indefinite nature, the total including, for instance, 2,637 cases of incision of abscesses, &c., 1,717 cases of excision of growths or of affected parts, and 1,391 of curettement. Suturing, repair, &c., of cuts, lacerations, &c., accounted for 1,303 cases, excluding 226 cases of perineorrhaphy, colporrhaphy, and other sutures of female genital organs. There were 945 cases of reduction of fractures, 498 of extractions of teeth, 330 of application of radium, X-rays, or diathermy, 285 of application of plaster, 276 of removal of foreign bodies, 160 of drainage of uterus, 148 of dilatation of organs, 144 of breaking-down of adhesions, 99 of avulsion of nails, 83 of paracentesis, 62 of cauterization, 53 of resection of ribs, and 47 of arthrodesis. In 83 cases lumbar puncture was returned; in 82 cases the operation was given as removal of placenta; in 79 cases exploratory operations, not further defined, were returned; 51 patients were shown to have been examined under anæsthetic, and 93 examined with the cystoscope.
Among the more definite operations, the following were the most important numerically:—
| Appendicectomy | 3,684 |
|---|---|
| Tonsillectomy | 812 |
| Amputation of limb, &c. | 590 |
| Ventrosuspension | 494 |
| Circumcision | 433 |
| Laparotomy | 422 |
| Sub-mucous resection (nasal) | 403 |
| Thyroidectomy | 292 |
| Cholecystectomy | 241 |
| Hysterectomy | 217 |
| Salpingectomy | 203 |
| Gastro-enterostomy | 142 |
| Prostatectomy | 126 |
| Antrotomy | 94 |
| Osteotomy | 85 |
| Oophorectomy | 85 |
| Sequestrotomy | 85 |
| Cholecystostomy | 81 |
| Arthrotomy | 75 |
| Perineorrhaphy | 67 |
| Trachelorrhaphy | 65 |
| Trephining | 64 |
| Caesarean Section | 57 |
| Tracheotomy | 57 |
| Colpoperineorrhaphy | 54 |
| Turbinectomy | 53 |
| Skin Graft | 51 |
| Nephrectomy | 47 |
| Osteectomy | 43 |
| Cholecystotomy | 40 |
| Colostomy | 40 |
| Cystostomy | 39 |
| Tenotomy | 38 |
| Colporrhaphy | 34 |
| Gastro-jejunostomy | 30 |
| Gastrectomy | 29 |
| Bone-graft | 29 |
| Iridectomy | 27 |
| Mastoidotomy | 26 |
| Thoracotomy | 26 |
The full details of operations in conjunction with diseases, &c., are given in the Annual Report on Vital Statistics for the year 1925.
Table of Contents
THE Health Act, 1920, repealed the consolidated Public Health Act, 1908, and its amendments. A résumé of the present Act is here given.
This Part of the Act deals with the constitution of the Department of Health. The chief administrative officer is the Director-General of Health, whose powers and functions, daring his absence from duty, are delegated to a Deputy Director-General. The Department comprises the Divisions of Public Hygiene, Hospitals, Nursing, School Hygiene, Dental Hygiene, Child Welfare, and Maori Hygiene, each of which is under the supervision of a divisional head called the Director.
The Dominion is divided into health districts, each of which is under the charge of a Medical Officer of Health, who must be a medical practitioner with special qualifications in sanitary science. Power is also given to appoint such number of Inspectors of Health, medical practitioners, nurses, and other professional officers as may from time to time be required.
A Board of Health is constituted under the chairmanship of the Minister of Health. It consists, in addition to the Minister, of the Director-General, three medical practitioners, a person appointed on the recommendation of the New Zealand Municipal Association, another appointed on the recommendation of the New Zealand Counties Association, a member of a recognized association of civil engineers, a Chairman of a Hospital Board, a lady member representative of the interests of women and children, and a person appointed on the recommendation of the Minister. The Board in the main is advisory in function, but in certain circumstances it may exercise mandatory powers. Commissions of inquiry may be appointed in assistance of the Board.
The initial sections of this Part of the Act empower and direct every local authority to appoint sanitary inspectors; to cause regular inspection to be made of its district; to secure the abatement of nuisances; to enforce all regulations in force in the district; to make by-laws; to furnish to the Medical Officer of Health such reports as may be required In certain cases, on the recommendation of the Board of Health, the Governor-General, by Order in Council, may exempt any local authority, not being a Borough Council, from any or all of the duties set out above. In these circumstances it shall be the duty of the Health Department to do all such things as it considers necessary for the promotion and conservation of public health within the district concerned, all expenses incurred by the Department being recoverable from the local authority in question as a debt due to the Crown.
The Board of Health may require any local authority to provide sanitary works within its district. However, a local authority, if dissatisfied with such requisition, has the right of appeal to a Board of Appeal consisting of a Stipendiary Magistrate and two assessors representing respectively the Board of Health and the local authority.
Every local authority must appoint its own sanitary inspectors or subscribe to the salary of an Inspector of the Department of Health. No person can now be appointed as a sanitary inspector unless he is the holder of a certificate from the Royal Sanitary Institute, or in lieu thereof such certificate as may be prescribed by regulation.
Other sections define nuisances and the various steps to be taken for their abatement; provide for the establishing on the part of the local authority of efficient refuse, nightsoil, and sanitary services; lay down certain requirements in regard to water-supply and sanitary conveniences for buildings; detail the procedure with regard to closing orders and demolition orders for insanitary buildings; govern the registration and regulation of cattle - saleyards for the keeping of animals; the protection and purification of water-supplies; the sanitation of Maori settlements; the making and application of by-laws; the duties and powers of Harbour Boards with respect to the sanitary condition of wharves and tidal lands.
The initial sections of this Part of the Act give the Medical Officer of Health, if authorized on that behalf by the Minister, very extensive powers in the event of an outbreak of any infectious disease. Thus he may take possession of lands and buildings for the purpose of providing accommodation for patients; he may commandeer vehicles for their conveyance; he may demand drugs, articles of food or drink, &c., for their treatment. Penalties are laid down for refusal or failure to comply with any such requisition, while provision is made for compensating persons who suffer any loss or damage thereby. Very wide power is also given a Medical Officer of Health in the direction of controlling the movements of cases and contacts of any infectious disease, of prohibiting public gatherings, of prohibiting the admission to schools, theatres, &c., of children under the age of sixteen. These emergency powers were given as the result of the experience of the influenza epidemic of 1918.
Infectious diseases are divided into two classes—the non-notifiable and the detail in the First. Schedule of the Act With reference to the former group, certain general provisions are applicable, protecting the public against carelessness on the part of the case or the person in charge thereof.
The medical practitioner who attends any person suffering from a notifiable infections diseases must forthwith report the case to the local authority and the Medical Officer of Health. If no medical practitioner is in charge of the case the occupier of the premises must notify. In the case of any vessel in port the master must notify the case to the Port Health Officer.
Provision is also made in this Part of the Act for the notification of certain non-communicable diseases of public-health importance, such as hydatids, tetanus, chronic lead poisoning, &c.
Other sections deal with the ordering to hospital of persons suffering from infectious diseases, the disinfection of premises and articles, the destruction of infected articles, the establishing by local authorities of mortuaries and disinfecting-stations, the notification by undertakers of deaths from infectious disease, and the duties of local authorities with respect to burials.
A comprehensive set of regulations has been gazetted detailing more exactly the powers with regard to infectious disease.
Power is given the Governor-General to proclaim places of inspection, quarantine grounds, and quarantine stations. Ships, persons, and goods liable to quarantine are fully defined. The whole procedure with regard to the inspection of ships, the granting of pratique, the ordering into quarantine and the release from quarantine is set out. Power is given to detain, or to release under medical surveillance, persons liable to quarantine, without quarantining the whole ship's company.
Medical practitioners and nurses may be appointed by the Director-General to take charge of passengers and crew of a ship undergoing quarantine, and the owners or agents are liable for any cost incurred under this head. It is the duty of the owners or agents of the ship to supply persons undergoing quarantine with such provisions, medicines, fuel, &c., as the medical officer in charge may require. All expenses incurred in connection with disinfection are a charge against the ship.
Comprehensive regulations have been made under this Part of the Act governing the whole matter of quarantine.
Extensive powers have been given the Governor-General in this Part of the Act to make regulations for the conservation or promotion of public health. Included therein is provision whereby regulations may be made for any matter affecting the public health in respect of which any local authority is empowered to make by-laws. Where any local authority has failed to make by-laws, or, having made them, has failed effectively to enforce them, regulations may be made and enforced in the district concerned at the cost of the local authority.
Medical practitioners authorized by the Minister may enter public schools and examine the children and notify parents of defects found in the children. Infirm and neglected persons found to be living in unsatisfactory conditions or without proper care or attention may be removed to institutions available for their reception. The Board of Health is empowered, in default of a local authority, to carry out sanitary works and exercise powers under the Act at the cost of such authority.
Since 1920 steady progress in sanitary law and practice has been made by local authorities throughout the Dominion by the passing and application of by-laws under the appropriate Local Governing Acts and the Health Act, and by the enforcement of regulations gazetted under the Health Act.
The New Zealand University Amendment Act, 1912, conferred on the Senate of the New Zealand University the power to grant diplomas in public health, and to make regulations for the examination of candidates for such diplomas. The examination is held in two parts, which may be taken separately or at the same time. Since 1912 fifteen diplomas have been conferred.
Under the Medical Practitioners Act, 1914, as amended by the Medical Practitioners Amendment Act, 1924, is constituted the Medical Council of New Zealand, consisting of the Director-General of Health and six other registered medical practitioners, who are appointed to the Council by the Governor-General, the term of appointment being a three-yearly one.
The Council deals with all applications for registration under the Act, which enacts that every person shall be entitled to registration who satisfies the Council that he is a graduate in medicine and surgery of the University of New Zealand; or registered on the register kept in accordance with the provisions of the Acts regulating the registration of medical practitioners in the United Kingdom, or eligible for registration on such last-mentioned register; or the holder of a foreign diploma approved by the Council, and granted by any university or institution other than the University of New Zealand or a university or institution situated in the United Kingdom, after a course of not less than five years' study of the subjects pertaining to a medical and surgical degree or license. The Council may, however, refuse to approve any diploma (even in the case of persons registered or eligible for registration in the United Kingdom) unless it appears that New Zealand graduates are, without further examination, entitled to registration in the country granting the diploma. It may also require the holder of a foreign diploma to pass an examination in medicine and surgery to be prescribed and conducted by the Senate of the New Zealand University.
No person is entitled to be registered if he has been at any time convicted of an offence punishable by imprisonment with hard labour for a term of two years or upwards, or is otherwise not of good fame or character. Applicants who are refused registration have the right of appeal to the Supreme Court.
Applications for registration are received in the first place by the Medical Officers of Health at Auckland, Christchurch, and Dunedin, and the Secretary of the Medical Council at Wellington One month's notice of intended application is required, such notice to be advertise once in the New Zealand Gazette and also in a newspaper circulating in the district in which the applicant intends to practise.
The fee for registration is £5, payable on deposit of evidence of qualification.
The Medical Council is vested with disciplinary powers, including the removal of a name from the register on the grounds of misconduct, or the suspension of a medical practitioner from practice. Right of appeal to the Supreme Court is provided.
A table is appended showing the additions to and removals from the Medical Register during the last five years, with the numbers on the register on the 1st January and 31st December of each year.
| MEDICAL REGISTER.—ADDITIONS AND REMOVALS. | |||||
|---|---|---|---|---|---|
| — | 1921. | 1922. | 1923. | 1924. | 1925. |
| Number on register on 1st January | 1,064 | 1,071 | 1,073 | 1,138 | 1,204 |
| Number added during year by registration— | |||||
| With New Zealand qualifications | 28 | 21 | 59 | 67 | 59 |
| With other qualifications | 32 | 12 | 17 | 17 | 19 |
| Number added during year by restoration | 4 | 1 | 1 | 1 | .. |
| Number removed during year | 57 | 32 | 12 | 19 | 71 |
| Number on register on 31st December | 1,071 | 1,073 | 1,138 | 1,201 | 1,211 |
Every adult person is entitled to be registered as a dentist in New Zealand who is the holder of a degree in dental surgery of the University of New Zealand, or a certificate of proficiency in dentistry obtained from the Senate of the University, or is the holder of a degree or diploma in dental surgery approved by the Senate and conferred by a University or dental college in the United Kingdom, or is the holder of a degree in dentistry granted in a British possession or a foreign country and recognized by the Senate. Evidence of good character is required in every case.
Application for registration is made to the Registrar-General, Wellington, the fee for registration being £1.
A table is appended showing the additions to and removals from the Dentists Register during the last five years, with the numbers on the register on the 1st January and 31st December of each year.
| DENTISTS REGISTER,—ADDITIONS AND REMOVALS. | |||||
|---|---|---|---|---|---|
| — | 1921. | 1922. | 1923. | 1924. | 1925. |
| Number on register on 1st January | 747 | 746 | 749 | 765 | 802 |
| Number added during year by registration | 6 | 5 | 17 | 47 | 25 |
| Number removed during year on evidence of death | 7 | 2 | 1 | 10 | 7 |
| Number on register on 31st December | 746 | 749 | 765 | 802 | 820 |
The Nurses and Midwives Registration Act, 1925, provides for a Nurses and Midwives Registration Board, consisting of the Director-General of Health or his Deputy, the Director of the Division of Nursing (who is Registrar of the Board), a registered medical practitioner, a registered nurse, and a registered midwife, the last two to be appointed by the New Zealand Trained Nurses Association or a similar body.
Every person who has attained the age of twenty-two years and is certified as having undergone not less than three years' training in a general hospital “approved” by the Board as a training-school under the Act, and who has passed the prescribed hospital and State examinations, is entitled to registration. During the year ended 31st March, 1926, there were 289 candidates for the final examination in medical and surgical nursing, and of this number 248 successfully negotiated the examination. There are now 4,322 nurses on the register.
This Act also provides for the registration of midwives and maternity nurses.
General trained nurses who desire to become maternity nurses must enter an “approved” maternity training-school for a period of four months, and assist at not less than twenty cases of labour and nurse not less than twenty lying-in women.
Untrained women entering for training have to undergo twelve months' training, and assist at not less than forty cases of labour and nurse not less than forty lying-in women.
General trained nurses who are also registered as maternity nurses have to undergo a further four months' training, which may be taken immediately following the training in maternity nursing, during which time they must conduct not less than twenty cases of labour.
Women other than general nurses who have qualified as maternity nurses after twelve months' training have to carry on private practice as such for a period of twelve months, and may then enter for the further training, which is the same as that given to the general trained nurse.
The number of registered midwives on the 31st March, 1926, was 2,110, and the number of registered maternity nurses 189.
Under the Masseurs Registration Act, 1920, and the Masseurs Registration Amendment Act, 1924, there is constituted the Masseurs Registration Board of New Zealand, consisting of the Director-General of Health, a registered medical practitioner, and two persons engaged in the practice of massage in New Zealand, who are appointed to the Board by the Governor-General, the term of appointment being a three-yearly one.
The Board deals with all applications for registration under the Act, which enacts that every person shall be entitled to registration who holds the qualifications required by the Act and regulations thereunder, and satisfies the Board that he or she is a person of good reputation and character. It is necessary for applicants to be in possession of certificates for the three branches of massage:—
Massage.
Medical electricity.
Remedial exercises and other branches of physiotherapy.
The certificates accepted are set forth by regulation, and are as follows:—
Complete certificate of the Chartered Society of Massage and Medical Gymnastics (England).
Complete certificate of the Incorporated Society of Trained Masseurs (England).
Australian Massage Association certificate.
Swedish Government certificate.
New Zealand Defence Department certificate in massage and medical electricity (with further course at the Massage Training-school and subsequent passing of examination in remedial exercises).
New Zealand State certificate granted after training at massage training-school and passing of subsequent State examination.
The fee for registration is £1, payable on advice of registration being granted. The Board is vested with disciplinary powers, including the removal of a name from the register on the ground of the person concerned having been convicted for an offence punishable by imprisonment or having been guilty of such improper conduct as renders him, in the opinion of the Board, unfit to be registered under the Act. Right of appeal is provided.
The Plumbers Registration Act, passed during the session of 1912, provided for the setting-up of a Board, to be called the Plumbers Board of New Zealand This Board consists of five members—viz., the Director-General of Health or his deputy, (Chairman); the Director of Education; a city or borough engineer nominated by the cities and boroughs which have a population of over 5,000 inhabitants, and appointed by the Governor-General; a master plumber and a journeyman plumber elected by their respective associations.
The functions of the Board are to decide what persons may be registered under the Act, in what districts sanitary plumbing shall be performed only by registered plumbers, and what shall be the scope of the examinations to be held as a part of the process of securing registration.
The main principle underlying the Act is that of securing trained and certificated sanitary plumbers, and that such registered plumbers shall not be required to pay any license fee or pass any examination under any local authorities controlling sanitary-plumbing works.
At the examination held under the Act in November, 1925, 221 candidates presented themselves, the results being as follows: Fifty-five qualified in the theoretical part, 63 in the practical part, and 61 qualified or completed in both parts of the examination and were duly granted registration. The total of names entered in the register to date is 1,700.
In order to make better provision for the sale of food and drugs in a pure state, the Sale of Food and Drugs Act was passed by the Legislature, and came into force on the let January, 1908. Considerable progress has been made in following out the purposes of the Act, all the commonly used foodstuffs being standardized, and the labelling of packages being controlled by regulations, which are revised and added to as the necessity arises. However, it was found that the efforts made to ensure pure quality and truthful labelling as a guide to purchasers were being negatived to a considerable extent by the reputation given to or assumed for an article as a result of advertising. Suggestive references to fruit and orchards and the like would have considerable effect, for instance, in creating a desire for a certain beverage, but would make no reference to the fact that, judged by regulation standards, the beverage may require to be labelled “artificial.” Coffee and chicory mixtures invariably have been described as “Coffee,” with free use of superlatives to indicate a pure and high-class article.
This was met by an amendment of the Act in 1924, which marks a noteworthy advance in legislation of this kind, and has already been used to good effect in controlling all kinds of publicity concerning any food or drug whereby a purchaser is likely to be deceived in regard to the properties of such food or drug whether it is dealt with by a regulation or not.
The definition of “drug” includes medicines used externally or internally by man, anæsthetics, soaps, ointments, disinfectants, and tobacco.
The Act, with the amendment, is administered by the officers of the Health Department, and provides for the analysis, by public analysts, of any article of food or drink, or of any drug, which may be sold, offered for sale, or exposed for sale, and for the inspection of any place where there is any food or drug intended for sale. If any such article be proved to be unfit for human consumption, or likely to cause injury to health if consumed, heavy penalties may be inflicted on the person or persons responsible.
Stringent measures are provided for the prevention of adulteration of food, drink, or drugs, and for the inspection of places where such things are manufactured or packed. The selling of light-weight bread is an offence under the Act, as is also the taking back of bread after it has been in the possession of the purchaser for more than an hour.
Any person may, on payment of the prescribed fee, together with the cost of the sample, require any authorized officer to purchase a sample of any food or drug and submit it for analysis.
Statistics compiled by the Department of Health show that during the year 1925 139 convictions under the Sale of Food and Drugs Act were secured in Magistrates' Courts, the total fines imposed equalling £941. Of the 139 convictions, 97 were for selling adulterated milk, the fines in these cases totalling £752. Short-weight bread convictions, 11 in number, secured fines amounting to ££65; improper labelling of foodstuffs resulted in 5 convictions, with fines of £33.
Section 2 of the Quackery Prevention Act, 1908, enacts that every person commits an offence who publishes or causes to be published any statement which is intended by the defendant or any other person to promote the sale of any article as a medicine, preparation, or appliance for the prevention, alleviation, or cure of any human ailment or physical defect, and which is false in any material particular relating to the ingredients, composition, structure, nature, or operation of that article, or to the effects which have followed or may follow the use thereof.
The penalty inflicted is a fine not exceeding £100 in the cat a of a first conviction, and not exceeding £200 for every subsequent conviction. The object of the Act is to prevent the exploitation of the public by means of medicines or treatment alleged to cure all and sundry complaints and ailments.
The Pharmaceutical Society of New Zealand, constituted by the Pharmacy Act, 1908, consists of 674 members, whose names were published in the Gazette of 28th January, 1926. These are known as “registered chemists,” and no chemist-shop may be opened in the Dominion except under the charge of one of these.
The society is governed by the Pharmacy Board, set up by Act, consisting of ten members elected by members of the society; four representing Wellington, Hawke's Bay, Nelson, and Marlborough, two representing Auckland and Taranaki, two Canterbury and Westland, two Otago and Southland. The Board meets monthly at Wellington. Once annually a conference of all members meets for discussion of business, in different towns, as may be decided upon. The main function of the Pharmacy Board is to administer the Pharmacy Act and its amendments in the interests of the public and of the members of the society; also to watch such other legal provisions generally as may have a bearing upon pharmacy.
The society has reciprocity agreements with the societies of Great Britain and all the Australian States: that is to say, a member registered after passing the full examination of a reciprocating country can be registered in any other on payment of the fees.”
The New Zealand society is a member of the International Federation of Pharmacy, a world-wide organization for dealing with matters of general interest, having its headquarters at The Hague, Holland. There are “divisions” of the society in all centres, consisting of groups of members having their own officers, and holding regular meetings for the transaction of local affairs.
The Pharmacy Board holds examinations twice annually for those who wish to obtain the necessary qualifications entitling them to registration, who also have to serve four years' apprenticeship. Approximately forty new members, on the average, are admitted to the register annually, about six of whom are admitted on the strength of British or Australian certificates. The examinations consist of—(a) The Preliminary, being Matriculation of the New Zealand University or of any other university recognized by the Board; (b) examinations set by University professors in botany and chemistry—three papers and practical work; (c) examinations set by examiners appointed by the Board in materia medica and pharmacy—two papers and practical work. An average number of 370 candidates sit for these examinations annually.
The Board is in constant communication with the British and Australian societies, and as far as possible keeps its standard of examination on a level with theirs: but the laws of each State or country vary to some extent, and this has its influence on the examinations.
The Board has a Benevolent Fund, which is used for the relief of members who may be in needy circumstances, or of their relatives who may be unprovided for.
In addition to the statutory organization set up by the Pharmacy Act, members of the Pharmaceutical Society have another organization known as the Chemists' Defence Association (Limited), which provides insurance for its members, deals with matters of general interest of a business nature not covered by the Act, and governs ethical questions as between pharmacists and medical men and the public generally. It may be said that the profession of pharmacy in New Zealand is at least on as high a level and as well administered as in any other part of the British Empire.
The medical inspection of schools in New Zealand is carried out by the Division of School Hygiene, Health Department, with a permanent staff consisting of a Director, twelve School Medical Officers, and thirty-one nurses. The Health Act, 1920, gives the necessary authority for the medical examination of children attending the primary State schools.
During the year 1925, schools to the number of 1,222 were inspected. Statistical reports were compiled relating to the complete examination of 47,511 children, and in addition 50,050 children were examined for the more important defects.
Of the children examined 90 per cent. were returned as having some defect, 60 per cent. showing defects other than dental. These percentages are not of much value for comparison with results recorded in other countries, as there is no recognized international standard as to what constitutes a defect. In the Dominion it is customary to regard as such very slight deviations from the normal. Approximately some 60 per cent. of those recommended received medical treatment, the percentage varying widely according to the facilities available in the different districts. The School Medical Service has, with the co-operation of the Professor of Public Health, Otago Medical School, completed the work by which endemic areas for goitre have been determined. Preventive and curative treatment for goitre is now established in the majority of schools throughout the Dominion, approximately some 12,000 children at present receiving treatment. Treatment as given in the schools consists of the administration of 1 grain of potassium iodide once weekly for three periods of ten weeks in the year. The results of this treatment have been definitely beneficial, and it is interesting to note that there is on record no case of a child showing ill effects from it. Preventive treatment for diphtheria was carried out in several schools during 1925, approximately 1,100 children being immunized.
With the exception of the school dental clinics provided by the Division of Dental Hygiene, there are no school clinics for the treatment of children, this being carried out either by private practitioners or at the public hospitals. The educational aspect of the work of the School Medical Officers is considered to be especially important, emphasis being placed upon the prevalence of preventable defects in school-children, and the great improvement to be obtained from the application of modern knowledge of child welfare. For this purpose, pamphlets and literature giving information on health topics are freely distributed throughout the Dominion.
The Dental Division of the Health Department has at present, besides the Director, the Deputy Director, and other administrative and training staff, fourteen dental surgeons and forty dental nurses, stationed at various centres throughout the Dominion. Forty-five dental clinics have been established to date. There are at present sixty probationers undergoing training, twenty-eight of whom have already completed one year of their course and will be ready to take up duty about April, 1927.
The following is a summary of operations performed by the Dental Officers and dental nurses from the 1st April, 1925, to the 31st March, 1926: Fillings, 66,576; extractions, 45,099; other operations, 54,874: total operations, 166,549.
The total number of children at present under treatment at the various clinics is approximately 28,000.
Besides these, many children have been examined and their teeth charted. Duplicate charts have been sent to parents, resulting in the treatment of many cases by private practitioners or at hospitals.
Leaflets have been printed for circulation to parents, embodying short terse rules to be followed for the prevention of dental disease. Every opportunity is being taken to bring this phase of the question before the parents and the public.
Prior to the abolition of the provinces in 1875 hospital maintenance was left to the care of the several Provincial Councils, each of which had a system of its own. On the change-over to the county form of government in the following year all of these diverse systems came under the charge of the Central Government, and many difficulties and incongruities occurred. Gradually there grew up a system of excessive demands upon the Government, and in 1885 an attempt to reduce a somewhat chaotic state of affaire to some semblance of order and uniformity took shape in the Hospitals Act of that year, which provided for the constitution of special hospital districts and Boards. Several amendments, based on the result of experience, were passed in later years, and the present law relating to the subject is embodied in the Hospitals and Charitable Institutions Act, 1926, which is a consolidation of the Hospitals and Charitable Institutions Act, 1909, and its amendments
The management of affairs in each hospital district is entrusted to a Hospital Board, consisting of one or more representatives of each of the districts comprising the hospital area, the total membership of the Board being not less than eight nor more than twenty. Members are elected at the ordinary general election of the contributory authorities.
A Hospital Board has power to establish, control, and manage any of the following institutions: Hospitals, charitable institutions, maternity homes, convalescent homes, sanatoria, habitual inebriates' homes, reformatory institutions for the reception of women and girls, and any other institutions for any purpose which the Governor-General, by Order in Council, may declare to be a public charitable purpose. It may grant charitable aid to indigent, sick, or infirm persons; may provide medical, surgical, and nursing attention for persons not inmates of an institution; and may grant financial assistance to medical and nursing associations and private philanthropic institutions approved by the Minister. It may also make by-laws, subject to the approval of the Minister of Health, regarding all matters affecting the management, care, control, and superintendence of any institution under its jurisdiction, and generally to enable the Board to carry out its functions.
It is the duty of every Hospital Board to provide and maintain such hospitals as the Inspector-General of Hospitals considers necessary in any part of the district for (a) the reception, relief, &c., of any persons suffering from infectious diseases; (b) the reception, &c., of persons suffering from other than infectious diseases.
No rating-powers are given to Hospital Boards, but under the Hospital and Charitable Institutions Act the estimated net expenditure of a Board is apportioned by the Board among the contributory local authorities within its district in proportion to the capital value of the rateable property in each contributory district.
At the beginning of each financial year the Hospital Board prepares an estimate of its payments for the year, deducting therefrom all estimated receipts by way of patients' fees, voluntary contributions, bequests, and subsidy on the last two mentioned items (at £1 for £1), income from endowments, and, generally, deducting all other estimated receipts except the amount to be raised by levy on the contributory local authorities and Government subsidy on such levies. The levies on contributory local authorities are apportioned in relation to the rateable capital value of each local district. On levies for maintenance purposes a scale is in operation ranging from 14s. to 26s. per £1, and averaging throughout the Dominion £1 for £1. The principle of the scale is to give relatively greater assistance where the requirements are high in proportion to the rateable capital value of the hospital district. To this end the levy of each Board for maintenance purposes is determined as sixteen-fortieths of its estimated maintenance requirements (referred to above) plus the amount bearing to four-fortieths of the net estimated requirements of all Boards the same proportion as the rateable capital value of the hospital district bears to the aggregate rateable-capital value of all hospital districts. After the levy of each Board is thus determined, the remainder of the Board's requirements is met by Government subsidy, with the limitation of fourteen thirty-fourths as the minimum subsidy and twenty-six forty-sixths as the maximum subsidy.
Levies on contributory local authorities and Government subsidy each form about one-third of the total receipts of Hospital Boards, the remainder being chiefly patients' fees and other recoveries on account of relief.
The above remarks apply to levies for maintenance purposes. As regards capital works, the net requirements are met by levy and by subsidy in equal amounts; . the subsidy, in other words, being at the rate of £1 for £1. Where the expenditure is very heavy, Boards may have recourse to loans; but, generally speaking, loans for long periods are discouraged, even the largest works being often arranged by the spreading of the expenditure over two or three years with the assistance of bank overdraft if necessary.
The following is a summary of the receipts and payments of Hospital Boards for the year ended 31st March, 1925.
| £ | |
|---|---|
| Receipts. | |
| Cash in hand (being difference between cash in hand and overdrafts of the various Boards) | 230,270 |
| Levies— | |
| Maintenance | 397,285 |
| Capital | 107,193 |
| 504,478 | |
| Voluntary contributions and bequests | 49,272 |
| Subsidies on— | |
| Maintenance levies. | 406,542 |
| Capital levies | 101,805 |
| Voluntary contributions | 50,870 |
| 559,217 | |
| Recoveries from persons relieved— | |
| Hospital patients' payments | 267,157 |
| Charitable-aid recoveries | 40,109 |
| 307,266 | |
| Rent, interest, and dividends | 20,785 |
| Loans | 204,501 |
| Sale of capital assets | 12,892 |
| Miscellaneous receipts | 51,368 |
| £1,940,049 | |
| Payments. | |
| Hospital maintenance | 834,334 |
| Charitable aid— | |
| Indoor | 89,130 |
| Outdoor | 84,143 |
| 173,273 | |
| Medical associations or medical men in outlying district | 7,766 |
| District nursing | 10,875 |
| Administration | 57,546 |
| Amounts paid to other Boards or separate institutions | 37,510 |
| Rents, rates, and taxes | 2,576 |
| Interest on loans for— | |
| Capital | 36,722 |
| Maintenance | 1,738 |
| 38,460 | |
| Capital works | 464,019 |
| Loans repayment of principal or sinking funds | 27,889 |
| Miscellaneous payments | 42,178 |
| Amounts invested on account of funds for special purposes | 15,784 |
| Cash and bank balances | 227,839 |
| £1,940,049 | |
Although the figures in the last preceding statement relate to receipts and payments, the official statistics of Hospital Boards have since 1916-17 been prepared on the basis of an Income and Expenditure Account and balance-sheet. The figures of income and expenditure given below cover not only Hospital Boards, but also Government institutions and separate institutions, the last mentioned being the Mercury Bay and Oamaru Hospitals. The latter came under the jurisdiction of the Waitaki Hospital Board at the close of the financial year 1924-25, but the former is still administered by a separate board of trustees.
The total gross income of Hospital Boards, separate institutions, and Government institutions for 1924-25 was £1,786,918, and of Hospital Boards alone £1,633,604, as compared with £1,663,455 and £1,484,531 respectively for the previous year. The sources of income for the last three years have been as follows:—
| Source. | 1922–23. | 1923–24. | 1924–25. |
|---|---|---|---|
| £ | £ | £ | |
| Contributable by Government | 481,617 | 477,391 | 550,274 |
| Levies on local authorities | 428,954 | 427,699 | 393,797 |
| Hospital fees payable by those assisted | 590,151 | 619,170 | 696,037 |
| Charitable-aid recoveries | 49,092 | 41,222 | 45,697 |
| Voluntary contributions | 24,743 | 26,931 | 27,626 |
| Rents, interest, and dividends | 25,804 | 28,389 | 28,349 |
| Fees receivable from other Boards and separate institutions | .. | 15,527 | 16,018 |
| Midwifery and other training fees | .. | 635 | 56 |
| Miscellaneous income | 32,830 | 26,491 | 29,064 |
| Totals | 1,633,191 | 1,663,455 | 1,786,918 |
Income from the first two sources must be viewed in conjunction with the amounts written off in respect of fees receivable as disclosed by the expenditure summary hereunder.
As regards the item “Contributable by the Government,” it must be remembered that beside subsidy on levies the amount shown (£550,274 in 1924-25) includes the net cost of Government institutions. The total amount of subsidy contributable by the Government on maintenance levies was naturally the same amount as the levies themselves, an average of £1 for £1 being paid for the Dominion. The amount raised by levies was less in 1924-25 than in the preceding year, in which, under the then existing scale of subsidies, the average subsidy was 14s. 9d.
The total gross expenditure of Hospital Boards, separate institutions, and Government institutions for 1924-25 amounted to £1,742,912, the expenditure of Hospital Boards alone being £1,584,361. The main items of expenditure are as follows, comparisons for the last three years being set out:—
| — | 1922–23. | 1923–24. | 1924–25. |
|---|---|---|---|
| £ | £ | £ | |
| Hospital maintenance | 863,931 | 911,272 | 964,183 |
| Charitable aid— | |||
| (a.) Indoor relief | 97,742 | 107,400 | 105,619 |
| (b.) Outdoor relief | 76,596 | 76,658 | 76,508 |
| (c.) Hospital relief (i.e., reductions in patients' fees and amounts written off) | 324,789 | 364,945 | 387,344 |
| Administration | 51,851 | 59,870 | 65,845 |
| Interest on loans | 26,132 | 30,352 | 38,845 |
The average annual cost of maintenance of general hospitals per occupied bed was as follows in the years shown:—
| HOSPITAL MAINTENANCE EXPENDITURE. | ||||||
|---|---|---|---|---|---|---|
| Year. | Provisions. | Surgery and Dispensary. | Domestic and, Establishment. Salaries and . Wages. | Miscellaneous and Special | Departments. | Total Maintenance. |
| £ | £ | £ | £ | £ | £ | |
| 1910–11 | 22.7 | 8.7 | 26.7 | 38.8 | 2.7 | 99.6 |
| 1914–15 | 25.0 | 10.7 | 27.0 | 43.5 | 1.9 | 108.1 |
| 1919–20 | 40.4 | 15.4 | 43.2 | 52.4 | 0.3 | 151.7 |
| 1920–21 | 47.4 | 17.1 | 55.9 | 68.5 | 0.4 | 189.3 |
| 1921–22 | 45.0 | 15.6 | 54.8 | 69.8 | 5.3 | 190.5 |
| 1922–23 | 40.3 | 14.5 | 50.6 | 72.4 | 6.7 | 184.5 |
| 1923–24 | 39.4 | 14.8 | 50.3 | 75.4 | 7.5 | 187.4 |
| 1924–25 | 40.9 | 14.9 | 50.4 | 77.0 | 8.4 | 191.6 |
Charitable-aid expenditure has been as follows:—
| CHARITABLE-AID EXPENDITURE. | |||
|---|---|---|---|
| Year. | Indoor Relief. | Outdoor Relief. | Total. |
| £ | £ | £ | |
| 1910–11 | 55,686 | 32,405 | 88,091 |
| 1914–15 | 66,557 | 36,019 | 102,576 |
| 1919–20 | 91,974 | 82,423 | 174,397 |
| 1920–21 | 101,695 | 88,346 | 190,041 |
| 1921–22 | 111,107 | 81,566 | 192,673 |
| 1922–23 | 97,742 | 76,596 | 174,338 |
| 1923–24 | 107,400 | 76,658 | 184,058 |
| 1924–25 | 105,619 | 76,508 | 182,127 |
It must be pointed out that prior to 1922-23 indoor relief included amounts paid by each Board for maintenance of persons in institutions not under the Board's control. Amounts so expended totalled £29,987 for 1922-23, £38,288 for 1923-24, and £50,221 for 1924–25.
A summary of hospital and charitable-aid expenditure is set out below:—
| Year. | Hospital and Charitable-aid Cash Expenditure. | Cost per Head of Population. | |
|---|---|---|---|
| £ | s. | d. | |
| 1910–11 | 416,384 | 7 | 11 ½ |
| 1914–15 | 578,838 | 10 | 1 ½ |
| 1919–20 | 937,167 | 15 | 6 ¼ |
| 1920–21 | 1,053,013 | 16 | 9 ¾ |
| 1921–22 | 1,077,479 | 16 | 9 ¼ |
| 1922–23 | 1,199,731 | 18 | 3 ½ |
| 1923–24 | 1,282,274 | 19 | 2 ¾ |
| 1924–25 | 1,355,568 | 19 | 11 |
The expenditure of the years 1910-11 and 1914-15 is represented by cash payments. For subsequent years the expenditure proper is stated exclusive of expenditure not requiring to be met by cash—e.g., patients' fees written off and reduced. Capital expenditure is excluded throughout.
Several important factors contribute to the considerable increase in the cost per head of the population. Firstly, there is the increase in the cost of commodities, which has evidenced itself particularly during the last decade; secondly, there is the improvement in the hospital service as regards staff conditions, and also generally in keeping with modern advancements in the methods of treatment; thirdly, there is the increasing use made of hospitals by the people.
The expenditure per head of the population as shown in the preceding table is, however, not a measure of the burden of hospitals and charitable aid on the public funds. Below is set out the amounts contributable for maintenance purposes by way of levies from local authorities, by Government subsidy on such levies, and on voluntary contributions and towards the maintenance cost of Government institutions.
| Year. | Contribution to Hospital Boards by Public Funds. | Proportion per Head of Population. | |
|---|---|---|---|
| £ | s. | d. | |
| 1910–11 | 298,120 | 5 | 8 ½ |
| 1914–15 | 319,382 | 5 | 7 |
| 1919–20 | 580,595 | 9 | 7 ½ |
| 1920–21 | 802,394 | 12 | 9 ¾ |
| 1921–22 | 808,303 | 12 | 7 |
| 1922–23 | 835,046 | 12 | 8 ¾ |
| 1923–24 | 828,954 | 12 | 5 |
| 1924–25 | 876,627 | 12 | 10 ¾ |
It is satisfactory to note that in spite of the increased services undertaken the annual contributions by the public funds has remained practically stationary for the last five years.
Subsection D of the preceding section contains full statistics of patients treated at public hospitals other than maternity hospitals. In the following table the figures are inclusive of maternity hospitals, and relate to the financial year instead of to the calendar year:—
| Year. | Persons under Treatment. | Average Number of Occupied Beds. | Beds available. | |||
|---|---|---|---|---|---|---|
| Total Number. | Proportion per 1,000 of Population. | Number. | Proportion per 1,000 of Population. | Number. | Proportion per 1,000 of Population. | |
| 1910–11 | 25,191 | 24.09 | 2,025 | 1.94 | 3,222 | 3.08 |
| 1914–15 | 33,375 | 29.15 | 2,652 | 2.32 | 3,956 | 3.46 |
| 1919–20 | 50,785 | 42.05 | 4,025 | 3.33 | 5,743 | 4.76 |
| 1920–21 | 50,912 | 40.63 | 3,744 | 2.99 | 5,898 | 4.71 |
| 1921–22 | 51,213 | 39.83 | 3,933 | 3.06 | 5,989 | 4.66 |
| 1922–23 | 55,927 | 42.65 | 4,481 | 3.42 | 6,671 | 5.09 |
| 1923–24 | 59,256 | 44.42 | 4,564 | 3.42 | 6,853 | 5.14 |
| 1924–25 | 63,068 | 46.37 | 4,886 | 3.59 | 7,220 | 5.31 |
The number of institutions coming under the head of public hospitals at 31st March, 1925, was 120. Included in this total were 82 general hospitals (3 of which were also old people's homes), 4 convalescent hospitals, 21 maternity hospitals, 8 tuberculosis sanatoria, 4 infectious-diseases hospitals, and 1 sanatorium for general cases. A comparison of beds and patients between the years 1923-24 and 1924-25 is given:—
| 1923–24. | 1924–25. | |
|---|---|---|
| Number of institutions | 114 | 120 |
| Number of beds— | ||
| General— | ||
| For males | 2,253 | 2,326 |
| For females | 1,528 | 1,628 |
| Children's cots | 723 | 770 |
| Maternity | 341 | 397 |
| Tuberculosis | 799 | 959 |
| Infectious disease | 1,093 | 1,140 |
| Total | 6,737 | 7,220 |
| Average number of occupied beds per diem | 4,564 | 4,886 |
| Patients under treatment during year | 59,256 | 63,068 |
| Deaths during year | 3,312 | 3,312 |
| Out-patients— | ||
| Number | 41,110 | 39,796 |
| Attendances | 222,226 | 219,231 |
In the next table information as to staff of public hospitals is given for the last two years:—
| 1923–24. | 1924–25. | |
|---|---|---|
| Medical— | ||
| Honorary | 142 | 151 |
| Stipendiary | 197 | 213 |
| Nursing— | ||
| Trained nurses | 539 | 602 |
| Probationers | 1,397 | 1,440 |
| Masseuses | 58 | 61 |
| Domestic— | ||
| Indoor | 962 | 1,047 |
| Outdoor | 419 | 524 |
The Private Hospitals Act, which came into force on the 1st January, 1907, is now embodied in the Hospitals and Charitable Institutions Act, 1926, which provides for the licensing, management, and inspection of private hospitals. All such institutions must be licensed, and every application for a license must be accompanied by a statement giving full description of the house proposed to be used, number of patients, and class of cases proposed to be received. The license shall state whether it is in respect of a lying-in private hospital or a surgical and medical private hospital, or if for both classes of cases; and no private hospital may be used for any purpose other than that in respect of which the license is granted and purposes reasonably incidental thereto.
For every private hospital there must be a resident manager, either the licensee or some person appointed by the licensee, and in every case the manager must be a legally qualified medical practitioner or a registered nurse in the case of a surgical and medical hospital, or a registered midwife in the case of a lying-in hospital, or a registered nurse and midwife, or a registered nurse having as resident assistant a registered midwife, in the case of a hospital licensed for both purposes. No license shall be granted in respect of a house not previously licensed until such house and annexed buildings have been approved by the Director-General of Health, and no addition shall be made to any private hospital until it has been so approved. No license shall be granted until the character and fitness of the applicant have been proved satisfactory, and the license must be renewed on the 1st January of each year.
In every private hospital there must be kept a register of patients showing particulars as to name, age, abode, and date of reception of each patient, date when such patient left, or, in the event of death, the date thereof, name of medical practitioner attending, and such other details as may be prescribed. Inquiry may be made at any time as to the management and conduct of any such private hospital, and if such inquiry prove unsatisfactory the license may be revoked, and, for a period of five years, no new license shall be granted to the person whose license is so revoked.
Provision is made for the inspection of private hospitals in the same manner as for public institutions of the like nature, a specially qualified medical practitioner and trained nurses with midwifery certificates being appointed for the purpose.
The Governor-General may from time to time make such regulations as are necessary for carrying the Act into effect, and substantial penalties are provided for breaches of its provisions.
The total number of private hospitals licensed in the Dominion is 313, of which 213 are either exclusively maternity hospitals or take both maternity and general cases.
There are seven State maternity hospitals now open for the use of the public. The St. Helens Hospital at Wellington was opened in June, 1905, and a new and up-to-date building in July, 1912; that at Dunedin was opened in October, 1905; that at Auckland in June, 1906, and a new building in February, 1923; that at Christchurch in April, 1907. State institutions have also been opened at Gisborne, Wanganui, and Invercargill.
During the year ended 31st March, 1926, a total of 2,060 confinements took place in the seven hospitals mentioned, and 644 confinements were attended by the institution nurses outside these hospitals, as compared with 2,015 and 702 confinements respectively during the previous twelve months.
Tables are given showing information as to births and deaths in each of these institutions during the year ended 31st March, 1926, and the totals for each of the last ten years. Births in cases dealt with outside St. Helens Hospitals by nurses attached to institutional staffs are also shown.
| ST. HELENS HOSPITALS, 1925–26. | ||||
|---|---|---|---|---|
| Hospital. | Confinements in Institution. | Confinements attended outside. | ||
| Live Births. | Deaths of Mothers. | Deaths of Infants. | ||
| Auckland | 654 | 2 | 12 | 249 |
| Gisborne | 136 | .. | 1 | 6 |
| Wanganui | 150 | .. | 1 | 21 |
| Wellington | 460 | 3 | 8 | 93 |
| Christchurch | 316 | 2 | 8 | 192 |
| Dunedin | 162 | .. | 4 | 70 |
| Invercargill | 182 | .. | 2 | 13 |
| Totals | 2,060 | 7 | 36 | 644 |
| ST. HELENS HOSPITALS, 1916–17 TO 1925–26. | ||||
|---|---|---|---|---|
| Year ended 31st March, | Confinements in Institution. | Confinements attended outside. | ||
| Live Births. | Deaths of Mothers. | Deaths of Infants. | ||
| 1917 | 1,071 | 8 | 28 | 523 |
| 1918 | 1,248 | 7 | 27 | 530 |
| 1919 | 1,123 | 18 | 26 | 521 |
| 1920 | 1,139 | 5 | 25 | 552 |
| 1921 | 1,246 | 6 | 25 | 579 |
| 1922 | 1,392 | 5 | 25 | 572 |
| 1923 | 1,531 | 3 | 18 | 570 |
| 1924 | 1,724 | 7 | 37 | 600 |
| 1925 | 2,015 | 5 | 25 | 702 |
| 1926 | 2,060 | 7 | 36 | 644 |
There is a maternity hospital attached to the Medical School at Dunedin, which also serves as a training-school for medical students and midwives.
Maternity homes and wards under the control of Hospital Boards and associations are established at—
Mangonui
Whangaroa
Kawakawa
Rawene
Whangarei
Otahuhu
Waiuku
Matamata
Kawhia
Taumarunui
Thames
Te Puke
Whakatane
Napier
Stratford
Opunake
Raetihi
Masterton
Wellington
Blenheim
Havelock
Picton
Motueka
Denniston
Waiuta
Kaikoura
Amuri
Waikari
Rangiora
Oxford
Christchurch
Linwood
Akaroa
Leeston
Rakaia
Methven
Ashburton
Geraldine
Timaru
Roxburgh
Lawrence
Naseby
Cromwell
For the reception of single girls there are special charitable institutions at Auckland, Wellington, Christchurch, and Invercargill, in addition to those established by the Salvation Army at the four chief centres and at Napier, Gisborne, and Russell.
Free ante-natal clinics are established in the four centres of New Zealand in connection with the State maternity hospitals, other maternity hospitals, and societies such as the Plunket Society and St. John Ambulance.
A specially qualified Medical Officer in Charge of Ante-natal Clinics has been appointed by the Department of Health to establish clinics, to supervise all clinical work, and to train nurses in this branch of midwifery.
The main clinics at the State maternity hospitals are staffed by Medical Officers who are assisted by ante-natal-clinic nurses with special training in the work and who have qualified for ante-natal-clinic diplomas.
The clinics established in connection with maternity hospitals, the Plunket Society, and St. John Ambulance are staffed by nurses who have taken their antenatal-clinic training, and each nurse acts as an assistant to the patient's medical attendant.
A nurse instructor in the work has been appointed in each centre, and is responsible for the training of maternity nurses in ante-natal work.
The aims and objects of the work are—
To maintain the health of the expectant mother:
To instruct the mother in her bodily hygiene and habits during pregnancy:
To preserve pregnancy till full time:
To secure a normal labour, resulting in a healthy breast-fed baby and an undamaged mother.
Clinics have been established—in the Auckland District, at the St. Helens Hospital; Salvation Army Maternity Hospital; St. John Ambulance; and St. Mary's Home, Otahuhu: in the Wellington District, at the St. Helens Hospital; Salvation Army Maternity Hospital; Alexandra Home; Plunket Society, Wellington; Plunket Society, Petone; and Plunket Society, Lower Hutt: in the Christchurch District, at the St. Helens Hospital; Salvation Army Maternity Hospital; Essex Home; Plunket Society, Christchurch; and Plunket Society, New Brighton: in the Dunedin District, at the St. Helens Hospital. Clinics have also been opened at Rotorua and Opunake.
The total number of attendances at the various clinics during the year 1925 was 7,912. Wellington District came first with 3,541 attendances, Christchurch second with 2,682, Auckland next with 1,603, followed by Rotorua 78 and Opunake 18.
The chief conditions diagnosed and requiring prompt treatment were—Albuminuria (nephritis, pyelitis, cystitis); toxæmias of pregnancy; malpositions; contracted pelvis; septic infections (including otitis media, tonsillitis, pharyngitis, pyorrhœa, dental caries, septic vaginal discharge, skin-diseases); goitre; diabetes; and venereal diseases.
The following table summarizes for the year 1925 the work performed by the various ante-natal clinics established and in working order at the end of the year:—
| — | Auckland. | Wellington. | Christchurch. | Rotorua. | Opunake. | Total. |
|---|---|---|---|---|---|---|
| First visit of primiparæ | 208 | 459 | 289 | 13 | 3 | 972 |
| First visit of multiparæ | 309 | 516 | 508 | 15 | 8 | 1,356 |
| Return visits | 1,086 | 2,556 | 1,885 | 50 | 7 | 5,584 |
| Totals | 1,603 | 3,541 | 2,682 | 78 | 18 | 7,912 |
| Number of visits paid to homes | 127 | 23 | 78 | 24 | .. | 252 |
| Number of maternity outfits sterilized | 19 | 67 | 101 | 9 | .. | 196 |
| Conditions diagnosed— | ||||||
| Accidental hæmorrhage | 1 | 7 | 13 | .. | .. | 21 |
| Abortions | .. | 1 | 1 | .. | 2 | |
| Miscarriages | .. | 5 | .. | .. | 5 | |
| Premature labours | 4 | 18 | 19 | 1 | .. | 42 |
| Still-births | 9 | 35 | 14 | .. | 58 | |
| Puerperal septicæmia | 2 | 1 | .. | .. | 3 | |
| Maternal mortality | .. | 3 | .. | .. | 3 | |
| Eclampsia | 6 | 4 | .. | .. | 10 | |
| Albuminuria | 77 | 45 | 104 | 1 | 227 | |
| Hyperemesis | 2 | 2 | 6 | .. | 10 | |
| Hydramnios | 8 | 4 | .. | .. | 1 | 13 |
| Multiple pregnancy | 8 | 5 | 4 | .. | .. | 17 |
| Malpositions | 37 | 32 | 73 | .. | .. | 142 |
| Contracted pelvis | 7 | 2 | 22 | .. | .. | 31 |
| Treatments— | ||||||
| X-ray | 6 | 4 | 3 | .. | .. | 13 |
| Version | 14 | 4 | 6 | .. | .. | 24 |
| Induction | 1 | 3 | 7 | .. | .. | 11 |
| Forceps | 21 | 35 | 15 | .. | .. | 71 |
| Operations | 4 | 2 | 2 | .. | .. | 8 |
| Dental treatment | 232 | 204 | 296 | 7 | 4 | 743 |
| Goitre treated | 34 | 43 | 137 | .. | .. | 214 |
| Gonorrhœa treated | 3 | 1 | 13 | .. | .. | 17 |
| Syphilis treated | .. | 1 | 2 | .. | .. | 3 |
| Skin-diseases treated | 6 | 7 | 24 | .. | .. | 37 |
| Diabetes treated | 7 | 3 | 1 | .. | .. | 11 |
| Pruritis vulvæ treated | 11 | 14 | 67 | .. | .. | 92 |
| Varicose veins treated | 159 | 159 | 259 | 5 | .. | 582 |
| Enlarged tonsils treated | 1 | 3 | 17 | .. | .. | 21 |
| Tests— | ||||||
| Wassermann tests | 15 | 4 | 6 | .. | .. | 25 |
| Cervical swabs | 3 | 11 | 8 | .. | .. | 22 |
| Urethral swabs | 3 | 11 | 8 | .. | .. | 22 |
Every effort is being made to impress the public with the national importance of parental hygiene, ante-natal care, and the principle of voluntary notification of pregnancy. Addresses and lectures are delivered by Medical Officers of the Department of Health to nurses and societies interested in this subject. So that there will be definite co-operation between the midwife and the ante-natal clinic, and in order that the midwife might be informed of the clinical methods adopted by the Health Department, a course of lectures is given for nurses on ante-natal work twice a year. Pamphlets and posters are issued in order to interest the public in this work. The following pamphlets are obtainable free of charge from the Department of Health:—
Suggestions to Expectant Mothers.
Diet for an Expectant Mother.
Dental Hygiene.
Prevention of Constipation.
Special Exercises for an Expectant Mother.
Ninety-four institutions classed under the heading of benevolent and orphan asylums furnished returns to the Census and Statistics Office for the year 1925. These institutions, which are conducted by Hospital Boards, religious bodies, and other public or semi-public organizations, are alike in that they provide free accommodation on a benevolent or charitable basis, but differ largely in the classes of persons to whom they afford assistance. The generic name covers old people's homes, maternity and refuge homes for unfortunate women and girls, orphanages, homes for the infirm or afflicted, “prison gate” homes, and an institute for the blind. Some of the orphanages deal with cases similar to those dealt with by the special schools under the control of the Education Department, and a few of the women's institutions receive offenders committed to them by the Court.
The 94 institutions which furnished returns for 1925 had a total of 9,662 inmates during the year, of whom 5,193 were males and 4,469 females. They commenced the year with a total of 5,275, and had 5,230 at the end of the year. Admissions during the year totalled 3,736, and in addition 651 infants were born in the institutions. Discharges numbered 4,099, and deaths of inmates 333. The figures for institutions under the various classes of controlling authorities are as follows:—
| ADMISSIONS, DISCHARGES, ETC., 1925. | ||||||||
|---|---|---|---|---|---|---|---|---|
| Controlling Authorities. | Number of Institutions. | Inmates at 1st January | Admissions during Year. | Births in Institutions during Year. | Discharges during Year. | Deaths in Institutions during Year. | Inmates at 31st December. | Total Inmates during Year. |
| Hospital Boards | 21 | 1,292 | 1,029 | 138 | 946 | 248 | 1,265 | 2,459 |
| Church of England | 14 | 734 | 303 | 24 | 283 | 4 | 774 | 1,061 |
| Roman Catholic Church | 11 | 1,413 | 576 | .. | 602 | 46 | 1,341 | 1,989 |
| Presbyterian Church | 12 | 483 | 101 | .. | 143 | .. | 441 | 584 |
| Methodist Church | 3 | 146 | 32 | .. | 27 | .. | 151 | 178 |
| Baptist Church | 1 | 74 | 13 | .. | 11 | 1 | 75 | 87 |
| Salvation Army | 18 | 700 | 1,262 | 309 | 1,554 | 19 | 698 | 2,271 |
| Undenominational associations, &c. | 14 | 433 | 420 | 180 | 533 | 15 | 485 | 1,033 |
| Totals | 94 | 5,275 | 3,736 | 651 | 4,099 | 333 | 5,230 | 9,662 |
The ages of all inmates in the institutions at any time during the year were as follows:—
| Age-group. | Males. | Females. | Total. |
|---|---|---|---|
| Under 5 | 778 | 708 | 1,486 |
| 5 and under 10 | 717 | 726 | 1,443 |
| 10 ,, 15 | 926 | 820 | 1,746 |
| 15 ,, 25 | 204 | 922 | 1,126 |
| 25 ,, 35 | 146 | 440 | 586 |
| 35 ,, 45 | 262 | 132 | 394 |
| 45 ,, 55 | 355 | 126 | 481 |
| 55 ,, 65 | 455 | 100 | 555 |
| 65 and over | 1,346 | 450 | 1,796 |
| Unspecified | 4 | 45 | 49 |
| Totals | 5,193 | 4,469 | 9,662 |
The next table contains interesting information concerning inmates of orphanages and of a few other institutions which provide for both children and older people. The figures relate to inmates under the age of twenty-one who were remaining in the institutions at 31st December, 1925.
| ORPHAN ASYLUMS—AGE, LEGITIMACY, AND ORPHANHOOD OF INMATES AT 31ST DECEMBER, 1925. | ||||||||
|---|---|---|---|---|---|---|---|---|
| Age, in Years. | Legitimate. | No Information as to Legitimacy. | Illegitimate. | Total. | ||||
| Father and Mother both Alive. | Father Dead, Mother Alive. | Father Alive, Mother Dead. | Father and Mother Both Dead. | No Information as to Orphanhood | ||||
| 0 | 7 | .. | 2 | .. | .. | .. | 18 | 27 |
| 1 | 11 | 1 | 10 | .. | .. | .. | 29 | 51 |
| 2 | 20 | 4 | 8 | .. | .. | .. | 23 | 55 |
| 3 | 25 | 8 | 17 | .. | 1 | .. | 25 | 76 |
| 4 | 37 | 11 | 24 | 4 | 1 | 1 | 23 | 101 |
| 5 | 39 | 20 | 48 | 3 | 2 | 5 | 29 | 146 |
| 6 | 55 | 22 | 35 | 7 | 1 | 2 | 31 | 153 |
| 7 | 41 | 21 | 63 | 6 | 2 | 4 | 31 | 168 |
| 8 | 68 | 33 | 76 | 13 | 5 | 3 | 35 | 233 |
| 9 | 58 | 40 | 83 | 12 | 4 | 1 | 24 | 222 |
| 10 | 60 | 48 | 91 | 24 | 11 | 4 | 29 | 267 |
| 11 | 62 | 51 | 94 | 32 | 8 | 6 | 21 | 274 |
| 12 | 53 | 56 | 100 | 25 | 7 | 3 | 23 | 267 |
| 13 | 51 | 47 | 84 | 30 | 6 | 9 | 29 | 256 |
| 14 | 33 | 29 | 71 | 36 | 8 | 3 | 20 | 200 |
| 15 | 35 | 16 | 33 | 22 | 3 | 3 | 12 | 124 |
| 16 | 8 | 12 | 17 | 13 | 2 | 1 | 14 | 67 |
| 17 | 5 | 6 | 10 | 7 | 1 | 1 | 10 | 40 |
| 18 | 3 | 4 | 5 | 3 | 1 | .. | 3 | 19 |
| 19 | .. | 1 | 2 | 3 | .. | .. | 1 | 7 |
| 20 | 1 | 3 | 2 | 1 | .. | 1 | 1 | 9 |
| Not known | 1 | .. | 2 | .. | .. | 1 | 4 | 8 |
| Totals | 673 | 433 | 877 | 241 | 63 | 48 | 435 | 2,770 |
Of the total of 2,770, 1,499 were males and 1,271 females, the sex distribution in the various groups being as follows:—
| Legitimate— | Males. | Females. |
|---|---|---|
| Father and mother both alive | 331 | 342 |
| Father dead, mother alive | 259 | 174 |
| Father alive, mother dead | 456 | 421 |
| Father and mother both dead | 141 | 100 |
| No information as to orphanhood | 51 | 12 |
| No information as to legitimacy | 29 | 19 |
| Illegitimate | 232 | 203 |
| Totals | 1,499 | 1,271 |
As might naturally be expected, females exceed males at ages 15 and over.
There are seven public mental hospitals in the Dominion maintained wholly or in part out of the public revenue. There is also one private hospital licensed for the reception of the mentally afflicted.
The number of patients at the end of 1925 was 5,257, consisting of 2,921 males and 2,336 females. These numbers, and those given elsewhere throughout this subsection, are inclusive of Maoris. Figures for Maoris are given separately towards the end of the subsection.
The patients on the register at the end of 1925 were distributed as shown below:—
| Mental Hospital. | Males. | Females. | Total. |
|---|---|---|---|
| Auckland | 618 | 476 | 1,094 |
| Tokanui | 210 | 105 | 315 |
| Porirua | 684 | 577 | 1,261 |
| Nelson | 239 | 118 | 357 |
| Hokitika | 159 | 62 | 221 |
| Christchurch | 372 | 463 | 835 |
| Dunedin (Seacliff and Waitati) | 623 | 507 | 1,130 |
| Ashburn Hall (private mental hospital) | 16 | 28 | 44 |
| Totals | 2,921 | 2,336 | 5,257 |
The number of patients remaining at the close of each of the last five years, and the proportion per 10,000 of the population at the end of the year, are shown in the following table:—
| NUMBER REMAINING, 1921–25. | ||||||
|---|---|---|---|---|---|---|
| Year | Number remaining at Close of Year. | Proportion per 10,000 of Population. | ||||
| Males. | Females. | Total. | Males. | Females. | Total. | |
| 1921 | 2,772 | 2,099 | 4,871 | 41.94 | 33.22 | 37.68 |
| 1922 | 2,816 | 2,116 | 4,932 | 41.79 | 32.80 | 37.39 |
| 1923 | 2,839 | 2,157 | 4,998 | 41.39 | 32.83 | 37.20 |
| 1924 | 2,873 | 2,258 | 5,131 | 41.04 | 33.68 | 37.44 |
| 1925 | 2,921 | 2,336 | 5,257 | 40.77 | 34.11 | 37.52 |
| Means of five years. | 2,844 | 2,3 | 5,037 | 41.39 | 33.33 | 37.45 |
The total number of patients under oversight, care, or control during 1925 was 6,006 (males 3,318, females 2,688), as against 5,819 in 1924. The average number resident in mental hospitals was 4,953 in 1924, and 5,033 in 1925.
The total admissions to mental hospitals during the year 1925 were 875 (445 males and 430 females), this number not including 65 transfers from one institution to another. The causes of insanity as assigned on admission are given below:—
| Heredity | 128 |
|---|---|
| Congenital | 102 |
| Previous attack | 88 |
| Puberty and adolescence | 59 |
| Climacteric | 61 |
| Pregnancy | 1 |
| Puerperal state | 17 |
| Lactation | 5 |
| Senility | 108 |
| Mental stress, sudden | 11 |
| prolonged | 57 |
| Solitude | 1 |
| Debility | 2 |
| Alcohol | 50 |
| Drug habit | 4 |
| Syphilis | 43 |
| Traumatic | 7 |
| Post-operative | 7 |
| Epilepsy | 46 |
| Arterio-sclerosis | 1 |
| Meningitis | 2 |
| Ill health | 21 |
| Organic brain-disease | 4 |
| Tuberculosis | 1 |
| Cancer | 1 |
| Toxic | 2 |
| Graves disease | 1 |
| Bright's disease | 1 |
| Overwork | 1 |
| Cerebral hæmorrhage | 5 |
| Unknown | 38 |
| Totals, excluding transfers (65) | 875 |
Of the 875 persons admitted to mental hospitals during 1925, those admitted for the first time to any mental hospital in New Zealand numbered 752 (males 382, females 370), and those readmitted 123 (males 63, females 60).
The figures for 1925 represent one first admission for every 1,841 persons in the Dominion. The number of first admissions and the rate per 10,000 of population for each of the last five years were as follows:—
| FIRST ADMISSIONS AND RATE PER 10,000 OF MEAN POPULATION, 1921–25. | ||||||
|---|---|---|---|---|---|---|
| Year. | Number of First Admissions. | Proportion per 10,000 of Population. | ||||
| Males. | Females. | Total. | Males. | Females. | Total. | |
| 1921 | 414 | 324 | 738 | 6.35 | 5.20 | 5.78 |
| 1922 | 390 | 304 | 694 | 5.85 | 4.76 | 5.32 |
| 1923 | 365 | 302 | 667 | 5.38 | 4.65 | 5.02 |
| 1924 | 385 | 305 | 690 | 5.58 | 4.61 | 5.10 |
| 1925 | 382 | 370 | 752 | 5.40 | 5.47 | 5.44 |
| Means of five years | 387 | 321 | 708 | 5.71 | 4.94 | 5.33 |
Persons labouring under mental defect, but capable of understanding the meaning of the procedure, may seek admission to a mental hospital as voluntary boarders. At the beginning of 1925 there were 134 boarders in residence (54 males, 80 females), and during the year 172 (79 males, 93 females) were admitted. If a voluntary boarder should after admission show mental defect sufficiently pronounced and sustained to render it improper to classify him any longer as such, application for a reception order is made to a Magistrate. During the year 1925, 25 (10 males, 15 females) were transferred from the voluntary to the ordinary register, and 6 males and 3 females died, while 123 (60 males, 63 females) were discharged, leaving 149 resident at the end of the year (57 males, 92 females).
A summary is attached showing the ages of patients in mental hospitals at the close of 1925.
| AGES OF INMATES, 31ST DECEMBER, 1925. | |||
|---|---|---|---|
| Age, in Years. | Males. | Females. | Total. |
| 1 to 5 | 7 | 2 | 9 |
| 5 ,, 10 | 23 | 23 | 46 |
| 10 ,, 15 | 47 | 36 | 83 |
| 15 ,, 20 | 73 | 43 | 116 |
| 20 ,, 30 | 319 | 215 | 534 |
| 30 ,, 40 | 479 | 407 | 886 |
| 40 ,, 50 | 727 | 546 | 1,273 |
| 50 to 60 | 560 | 498 | 1,058 |
| 60 ,, 70 | 381 | 323 | 704 |
| 70 ,, 80 | 199 | 158 | 357 |
| 80 ,, 90 | 54 | 52 | 106 |
| 90 and over | 4 | 1 | 5 |
| Unknown | 48 | 32 | 80 |
| Totals | 2,921 | 2,338 | 5,257 |
The next table gives the average number resident, those who were discharged as recovered, and those who died during the period 1921-25:—
| year. | Average Number Resident. | Discharged as recovered. | Died. | ||
|---|---|---|---|---|---|
| Number. | Per Cent. of Average Number Resident. | Number. | Per Cent. of Average Number Resident. | ||
| 1921 | 4,754 | 371 | 7.80 | 318 | 6.69 |
| 1922 | 4,809 | 313 | 6.51 | 395 | 8.21 |
| 1923 | 4,868 | 319 | 6.55 | 325 | 6.87 |
| 1924 | 4,953 | 280 | 5.67 | 316 | 6.37 |
| 1925 | 5,033 | 319 | 6.34 | 324 | 6.44 |
| Means of five years | 4,883 | 320 | 6.57 | 336 | 6.88 |
Of those who died in mental hospitals during 1925, 114, or 35 per cent., had been inmates for less than one year, while 83, or 26 per cent., had been in residence for more than ten years. Of those discharged recovered, 242, or 76 per cent., had been inmates for less than one year. A table is given showing length of residence of patients who died and of patients who were discharged recovered during 1925.
| Length of Residence. | Patients who died. | Patients discharged Recovered. | ||||
|---|---|---|---|---|---|---|
| Males | Females. | Total. | Males. | Females. | Total. | |
| Under 1 month | 13 | 13 | 26 | 17 | 10 | 27 |
| 1 month and under 3 months | 19 | 12 | 31 | 29 | 43 | 72 |
| 3 months and under 6 months | 16 | 9 | 25 | 34 | 39 | 73 |
| 6 ,, 9 ,, | 18 | 3 | 21 | 21 | 23 | 44 |
| 9 ,, 1 year | 7 | 4 | 11 | 7 | 19 | 26 |
| 1 year and under 2 years | 27 | 11 | 38 | 22 | 19 | 41 |
| 2 years and under 3 years | 14 | 6 | 20 | 3 | 8 | 11 |
| 3 ,, 5 ,, | 14 | 18 | 32 | 4 | 8 | 12 |
| 5 ,, 7 ,, | 14 | 7 | 21 | 5 | 3 | 8 |
| 7 ,, 10 ,, | 7 | 5 | 12 | 1 | .. | 1 |
| 10 ,, 12 ,, | 8 | 1 | 9 | .. | 1 | 1 |
| 12 ,, 15 ,, | 12 | 5 | 17 | .. | 1 | 1 |
| 15 years and over | 30 | 27 | 57 | 1 | 1 | 2 |
| Died during absence | 2 | 2 | 4 | .. | .. | .. |
| Totals | 201 | 123 | 324 | 144 | 175 | 319 |
Old age is the principal cause of death among mental-hospital patients, and, among individual causes, epilepsy ranks second, and general paralysis of the insane third. The figures for the principal causes and groups of causes for the year 1925 are as follows:—
| DEATHS IN MENTAL HOSPITALS, 1925. | |
|---|---|
| Tuberculosis | 26 |
| Cancer | 9 |
| Other general diseases | 12 |
| General paralysis of the insane | 29 |
| Organic brain-disease | 8 |
| Epilepsy | 33 |
| Other diseases of the nervous system | 31 |
| Diseases of the circulatory system | 48 |
| Diseases of the respiratory system | 20 |
| Diseases of the digestive system | 6 |
| Diseases of the genito-urinary system | 6 |
| Diseases of the skin | 2 |
| Diseases of infancy | 1 |
| Old age | 83 |
| External causes | 6 |
| Died while on trial | 4 |
| Total | 324 |
A table is added showing for all admissions since 1876 the percentages of patients discharged (as recovered, relieved, and not improved, separately), died, and remaining.
| — | Males. | Females. | Both Sexes. |
|---|---|---|---|
| Discharged— | |||
| Recovered | 38.29 | 44.40 | 40.83 |
| Believed | 7.09 | 8.95 | 7.86 |
| Not improved | 1.91 | 1.88 | 1.90 |
| Died | 35.98 | 25.88 | 31.82 |
| Remaining at end of 1925 | 16.73 | 18.89 | 17.59 |
| 100.00 | 100.00 | 100.00 | |
A license may be granted to enable a private mental hospital to receive patients for treatment. Stringent conditions are attached to the issue of such licenses, which may be revoked at any time. The Inspector-General has wide powers in the regulation and control of private institutions, which are placed practically on the same footing as public mental hospitals in regard to inspection and other matters.
There is only one licensed private institution in the Dominion, that at Wakari, near Dunedin, established in 1882. Particulars of admissions, discharges, deaths, and patients remaining, for the last five years, are as follows. These figures are included in preceding tables.
| PRIVATE MENTAL HOSPITAL. | ||||
|---|---|---|---|---|
| Year. | Admissions. | Discharges. | Deaths. | Patients remaining at End of Year. |
| 1921 | 6 | 9 | 1 | 40 |
| 1922 | 10 | 8 | 3 | 39 |
| 1923 | 12 | 7 | 2 | 42 |
| 1924 | 9 | 4 | 3 | 44 |
| 1925 | 11 | 8 | 3 | 44 |
The number of Maoris admitted as patients to mental hospitals is small. The figures for the last five years are,—
| MENTAL HOSPITALS.—MAORIS ADMITTED AND REMAINING, 1921–25. | ||||||
|---|---|---|---|---|---|---|
| Year. | Admitted during Year. | Remaining at End of Year. | ||||
| Males. | Females. | Totals. | Males. | Females. | Totals. | |
| 1921 | 13 | 8 | 21 | 34 | 31 | 65 |
| 1922 | 16 | 4 | 20 | 40 | 32 | 72 |
| 1923 | 7 | 6 | 13 | 36 | 34 | 70 |
| 1924 | 8 | 5 | 13 | 37 | 35 | 72 |
| 1925 | 10 | 6 | 16 | 40 | 37 | 77 |
At the end of the year 1925 the mental hospitals of the Dominion had accommodation for 5,209 patients, the cubic content of the dormitories and sleeping-rooms being well over 3,000,000 cubic feet. Details of accommodation are as follows:—
| Institution. | Number of Patients for whom there is Accommodation. | |||||
|---|---|---|---|---|---|---|
| In Single Rooms. | In Dormitories. | Total. | ||||
| Males. | Females. | Males. | Females. | Males. | Females. | |
| Auckland | 171 | 122 | 474 | 358 | 645 | 480 |
| Tokanui | 38 | 20 | 134 | 80 | 172 | 100 |
| Porirua | 106 | 106 | 484 | 380 | 590 | 486 |
| Nelson | 17 | 16 | 230 | 104 | 247 | 120 |
| Hokitika | 38 | 16 | 149 | 55 | 187 | 71 |
| Christchurch | 85 | 87 | 321 | 364 | 406 | 451 |
| Seacliff | 173 | 138 | 364 | 318 | 537 | 456 |
| Totals, State institutions | 628 | 505 | 2,156 | 1,659 | 2,784 | 2,164 |
| Ashburn Hall Private Mental Hospital | 28 | 33 | .. | .. | 28 | 33 |
| Totals, all institutions | 656 | 538 | 2,156 | 1,659 | 2,812 | 2,197 |
The total expenditure on maintenance of mental hospitals (not including the cost of new buildings and additions), and receipts from patients and for sale of produce, &c., during the last five years were as follows:—
| Year. | Total Expenditure. | Receipts from Patients, Sale of Produce, &c. | Net Expenditure. |
|---|---|---|---|
* Fifteen months. | |||
| £ | £ | £ | |
| 1921–22* | 384,615 | 115,416 | 269,199 |
| 1922–23 | 357,510 | 112,304 | 245,206 |
| 1923–24 | 368,231 | 114,369 | 253,862 |
| 1924–25 | 368,138 | 123,807 | 244,331 |
| 1925–26 | 400,463 | 128,259 | 272,204 |
Table of Contents
THE inception and establishment of educational facilities in New Zealand is the history of civilization and progress in this part of the British dominions. As might be expected, it was immediately after the advent of the first missionaries that schools for the instruction of the Native youth were established. Later, as a European population settled in the country, the need for a means of educating the white children arose, and finally the necessity for some co-ordinated scheme for the whole colony asserted itself. This latter was consummated in the Education Act of 1877, which Act is the basis of the system of education obtaining in the Dominion at the present day.
The system of education which was pursued from the foundation of the colony—and, indeed, from 1816, when the first mission school was established at Rangihoua, in the Bay of Islands—was that of imparting instruction to the Natives in their own language in establishments where great numbers of all ages were congregated, and where they were not only educated, but were also housed, fed, and clothed. The first legislative action in this connection was an Ordinance passed by the Legislative Council at Auckland in 1847. This provided for the education of the youths of New Zealand, and recognized none but religious schools. Its administration, including the appointment and removal of teachers, was almost wholly in the hands of the religious bodies. The Ordinance declared that religious education (with a conscience clause), industrial training, and instruction in the English language should find a part in the curriculum of all schools which received financial assistance under the Ordinance. The aggregate amount of aid to be given was not to exceed one-twentieth of the estimated revenue of the colony. The provisions of the Ordinance actually applied to both races, but the greater part of the money appropriated in succeeding years was for Native schools and institutions. The amount of aid was set down annually on the Civil List, and the distribution for the year ended 30th September, 1854, well illustrates the apportionment among the religious bodies, viz: Church of England, £3,500; Wesleyan, £1,600; Roman Catholic, £800: total, £5,900.
The desirability of the subsidy to schools being removed from the Civil List and provided for by vote of the House of Representatives resulted in the passing of the Native Schools Act, 1858. This embodied much the same provisions as the Ordinance of 1847, with the exception that the sum of £7,000 was appropriated annually to be distributed as capitation.
Despite these attempts to set up a satisfactory scheme for the education of the Native children, little success attended the efforts of the Government, and in 1863 barely five hundred scholars were being taught in the various institutions for Native education. This was due primarily to the unsettled state of the country as a result of the hostilities that had broken out, but no doubt the scheme of education itself was unsound in many respects, particularly as it allowed the children to drift back to the demoralizing influence of their own kaingas. These combined causes practically led to the utter collapse during the next few years of a system which had been pursued since the education of Natives had been first attempted.
In 1867 the Native Schools Act was passed, but before it could be brought into effective operation the North Island, where the bulk of the schools were situated, again became involved in war, and it was not until 1871, when an amending Act was passed, that any real effort could be made to introduce a workable system of Native education. The main provisions of the new scheme were, firstly, the establishment of village schools wherever a sufficient Native population and other circumstances rendered it possible; secondly, the instruction to be in the English language only, except where the location of an English teacher might be found impossible; - thirdly, the working of the village schools through the agency of the Natives themselves, associated with and aided by such Europeans as might be willing to work with them on School Committees; fourthly, the contribution by the Natives of part of the expenses of salaries and inspection, together with grants of land for buildings. Provision was also made for a continuance of capitation to schools already established (mainly denominational) which fulfilled conditions that were laid down.
That the new legislation was eminently successful is seen from the statistics of the year 1874. Forty-one new schools had been formed, with an attendance of 875 boys and 370 girls. There were also twenty-three other schools which were receiving a capitation allowance, with a total of 142 boys and 100 girls in attendance. In 1879 the control of Native schools passed from the Native Department to the Education Department, which has since been responsible for their administration. As the district in which a Native school is established becomes populated and the Native population europeanized in its mode of living, the school is handed over to the control of the Education Board for the district.
The Ordinance of 1847, referred to earlier, was practically a nullity in so far as the education of children other than Natives was concerned. Indeed, it was not until the establishment of provincial institutions in 1853 that any legislative action was taken in the direction of providing facilities for the education of white children. Up to that time colonists were dependent upon small private schools, mainly, though by no means exclusively, of a denominational character. Until their abolition in 1876 the various provinces conducted their own education systems. The result was that, instead of a methodical scheme of school organization for the whole of New Zealand, there came into existence systems varying widely both in the principles upon which they were established and in the results attained. This is well illustrated by the following account of the more important features of the various legislative provisions with respect to education made by the Provincial Governments:—
It was in this district that the bulk of the money appropriated on the Civil List for Maori education was expended, and the Legislative Council Ordinance of 1847, already referred to, was of more effect in Auckland than in any other part of the colony. The first attempt of the Provincial Council, however, to provide for the education of the children in its sphere of jurisdiction was the Education Act of 1857. The Superintendent of the Province was empowered to appoint a Board of Education consisting of from five to nine Commissioners, to hold office for three years. The Superintendent made grants, out of the funds which were voted, to all schools which fulfilled the requirements of the Act. Religious instruction was at the option of the local School Committee, but exemption was to be granted to all scholars whose parents did not desire their attendance. In 1867, however, this provision was abolished and secular instruction alone obtained,, Schools which received aid from the Board could not charge pupils more than 1s. per week. Further legislation enabled a school rate, additional to fees, to be levied in 1867.
A change in administration was made in 1868. The Board on this occasion was formed of the Superintendent of the Province, the Executive and Speaker of the Council, and three members elected annually by the Council This Board's function was to form districts in suitable areas, and it was also vested with the powers of distributing the annual vote of the Council and the income from reserves that had been set aside for educational purposes. The Board was also the authority in which the schools were vested. Teaching continued to be secular in character. It appears that little success attended this Act, for at the end of 1872 there were no common public schools (as opposed to private or denominational) either in the City of Auckland or its suburbs, or in the goldfield townships or the pensioner settlements.
Accordingly it is not surprising to find all existing education legislation scrapped in 1872 and a fresh Act passed. The Board on this occasion still retained its political members, and to these were added four further members appointed by the Council, and three appointed by a Judge of the Supreme Court. Thus constituted, the Board proceeded with the formation of school districts. It also fixed rates and controlled all available funds. A householder's rate of £1 and a rate of 5s. on each child (raised to 10s. in 1874) were levied throughout the province by the Superintendent. These rates were subsequently supplemented by a poll-tax of 10s. per annum on each male adult. No fees were charged in the schools themselves, all expenses being met from these rates and other income of the Board. Secular instruction still obtained, and the Act seems to have been a considerable improvement upon its predecessors in so far as the results obtained were concerned.
This province made a start in 1857 by empowering the Superintendent to appoint a Commission of four to see what scheme should be adopted, but nothing further was done until the lapse of a decade. In 1867 a Board of Education was established, having the same personnel as the Board of Trustees of Public Reserves, and from the middle of 1868 all revenue from education reserves was diverted to the purposes of the Education Ordinance. Appropriations were also made annually by the Provincial Council for education. Denominational schools were eligible for assistance from the funds available. The Board had power to establish separate education districts if agreed to by the householders. Local Committees were to be elected, consisting of either three or six members, of whom one or two were to retire in rotation each year. To supplement the funds from education reserves the Committees were empowered to impose a household rate not exceeding £1. Religious instruction (with a conscience clause) was allowed either before or after school hours, but the Irish Board of Education's selected Scripture portions could be read as part of the regular curriculum.
A further Ordinance was passed in 1874. This repealed the existing legislation and established the Patea and the New Plymouth Educational Boards, each consisting of seven elected members. The two Boards exercised full control over the educational activities of the province, levied a household rate as under the repealed Ordinance, and imposed a charge of 6s. 6d. per annum on each scholar in attendance at school. Provision was made, however, for fees and rates to be remitted in necessitous cases.
Early in 1855 the Wellington Provincial Council passed an Ordinance (the outcome of a Commission set up in 1853) for the establishment of common schools. It provided for the proclamation of school districts by the Superintendent of the Province; for an annual election of School Committees: and for the levying of a uniform rate where necessary upon every house in the school district, but not exceeding £1 per year for each house. The Committees' powers gave them practically complete control in then respective districts. Religious instruction was prohibited in the original Ordinance, but an amendment of 1857 gave power to the Committees to allow Bible-reading without note or comment. The operation of the Ordinance was not as effective as its originators anticipated, the chief difficulty being the lack of funds. It continued in force, however, until 1871, without further change except in regard to a few machinery clauses.
In this latter year existing legislation was repealed and the Education Act, 1871, passed. Under this the province was divided into ten school districts. Each district elected a member to a Board, which had complete charge of education in the province. The schools were supported by a capitation fee of 5s. per child per annum, together with an annual rate on all rateable property, limited to ½d. in the pound. Four amending Acts were passed in the four succeeding years, the principal alteration made being contained in that of 1874, which abolished capitation and rates and levied a school fee of 5s. per quarter for each child actually attending school.
Immediately after the formation of the Hawke's Bay Province an Education Act (1859) was passed. This repealed the earlier Education Acts of the Wellington Provincial Council. Denominational schools were excluded from participation in grants for buildings or repairs, but in the case of common schools a pound-for-pound subsidy was granted to any district raising at least £40 for these purposes, with a limit of £100 subsidy over three successive years. Monetary aid apart from that required for buildings was given to both classes of school in proportion to the number of children educated, at the rate of 7s. per quarter, subject, however, to the provision that the weekly charge to parents did not exceed 2s. per child. Government aid was drawn from appropriations and the proceeds of education land reserves. In 1868 this was supplemented by a school rate of £1 per annum levied on every householder. The scheme in Hawke's Bay seems to have worked with a degree of success. No religious instruction was permitted in the common schools during ordinary hours.
This province early made a start in providing means of education, and the year 1853 saw a Commission set up to consider the best scheme to be established in the province. In 1856 an Act followed. The Superintendent of the Province was empowered to constitute districts and a Central Board of Education. Rates were to be levied for the provision of funds. Amending legislation followed in 1858 and 1862, and in 1863 a fresh Act was passed. Under this latter Act the existing education districts which had been constituted were continued. They were to be controlled by local Committees of six persons. Annual rates in these districts were levied to the extent of £1 on every householder, plus 5s. for each child. Religious instruction was permitted, but was to be of a non-controversial character, and parents had opportunity to object if they so desired.
Marlborough, on its separation from Nelson and its elevation to provincial status, started its educational activities by repealing the existing legislation and passing the Education Act, 1861, which virtually re-enacted the system formerly in force in Marlborough as part of the Province of Nelson. Four years later the Superintendent with a Central Board of Education was replaced by the Superintendent and Executive of the Province.
The year 1871 saw a fresh start made, and the Town and Road Boards were constituted the authorities for managing the schools. Rating-powers were given to provide funds, and compulsory fees were payable on account of all children between the ages of seven and twelve within three miles of the school. The curriculum was maintained on a secular basis, religious teaching being forbidden.
An Ordinance of the Canterbury Provincial Council in 1855 carried to a conclusion a compact made with the original colonists, and the following year saw Christ's College founded, it being placed under the control of the Church of England Bishop and Wardens. The next year a sum of £2,500 was voted for the assistance of primary schools, and this was placed in the control of the Anglican, Wesleyan, and Presbyterian Church authorities for distribution. The limitations imposed included a clause for exemption from religious teaching where objected to by parents, and fees were to be the same in all schools. A similar appropriation for education was made during the next five or six years, when, as a result of a Commission which brought down its report in 1863, legislation in the direction of ensuring a more effective system was introduced. A first step was taken in the same year, when the administration of the annual appropriation was withdrawn from the churches, though denominational grants were not themselves cut off. An Education Board responsible to the Provincial Government was set up. All applications for aid came within its jurisdiction, as did also the regulation of salaries and the appointment of Inspectors.
A further Ordinance in 1864 did not change the Board. Districts were, however, to be proclaimed on a requisition for such. A Committee in each district managed the schools, seeing to their establishment, fixing salaries and fees, and selecting teachers— all, however, subject to the Board. No child was to be absent from Bible-reading, but might be exempted from further religious instruction if the Committee was assured the child received instruction elsewhere. Amendments to the above Ordinance were made in 1868 and 1870, and in 1871 all existing legislation was repealed and a new Ordinance passed. Under this latter the appointment of the Education Board was in the hands of the Provincial Superintendent and the Executive. The Board itself became responsible for the examination and classification of its teachers, and on its recommendation school districts were proclaimed, with or without the local requisition required before. Each district paid one-sixth of the cost of building schools, land, failing to do so, was liable to a rate of 6d. in the pound, to be levied by the Superintendent. The management of the school, the fixation of salaries, and the appointment and removal of teachers, came within the jurisdiction of the district Committee. All teachers were required to have a certificate from the Board.
The financial matters connected with the various districts were assisted by a tax of £1 levied on each householder within three miles of a school, with an additional 5s. for each child. These levies were made by the Superintendent of the Province, and paid to the Committees of the respective districts. Bible-reading was prescribed, but teachers themselves gave no instruction. Provision was, however, made for the admission of ministers of religion. In the year 1873 the provisions regarding Bible-reading were withdrawn, and at the same time grants to denominational schools ceased.
A further change in regard to administration was made in 1875. The Board was abolished, and a department and permanent secretary were appointed. The districts, which were retained, had to raise half the cost of buildings, and to do so a rate of 1s. in the pound might be levied. It is of interest to note that towards the end of the same year an attempt made to secure the assent of the General Assembly to a Bill for the restoration of a Board to be appointed by the Superintendent for the control of education in Canterbury was defeated.
An Ordinance of 1874 prescribed a scheme for Westland, and a farther amending Ordinance was passed in the following year. The operation of this legislation, however, was of a limited nature, it being finally repealed, in common with other provincial Ordinances, by the Education Act, 1877.
There is no doubt that the initial attempts in propounding a scheme of education were eminently more successful in Otago than in any other province. The subject was dealt with at the first sitting of the Provincial Council, when a Committee was appointed to report on the question. At the close of 1854 the recommendations of this Committee were adopted, and a Grammar School was formed at Dunedin. Certificated teachers were sent for from Scotland, and provision was made for expenses being met from the provincial funds and from rates to be levied for the purpose. This measure of 1854 was merely provisional, and a complete Ordinance in 1856 replaced it. This Ordinance provided for a Board of Education consisting of the Superintendent and the Executive of the Province, with the Rector of the Grammar School and two members from each School Committee. The functions of the Board consisted of promoting school districts and establishing schools therein. Each district elected a Committee annually, which consulted with the controlling Board as to buildings, but carried out the selection of its own teachers. The allocation of the moneys available was made so that land and school buildings came from the provincial funds, while the teachers were to be paid from school funds and a poll-tax on adult males of not more than £1. Religious instruction was given at stated hours, and exemption could be obtained on objection by parents. Six years later this Ordinance was repealed, and at that time the rate mentioned above had not been levied and the poll-tax never attempted.
The Education Ordinance of 1862. vested all school properties in the Superintendent of the Province instead of the Board, and the Board was made entirely political, the representatives of the Committees being dispensed with. The Board defined districts on requisition, and to the local Committees was left the determination of questions relating to buildings, character of the schools, salaries paid to teachers, and the fees. All the Board's determinations, however, came within the purview of the Superintendent. The scheme does not appear to have been a practical success, and was repealed two years later.
The next and final attempt of the Provincial Council was the Education Ordinance of 1864. The chief alterations were in the matter of finance and the responsibilities of the Board and Committees. The Board provided a large share of the cost of buildings and enlargements, but the districts were responsible for repairs and also fixed the minimum school fees to be paid by those attending. Rates were imposed, but were withdrawn the next year, apparently causing some dissatisfaction. Some minor amendments were also made in the matter of salaries of teachers and repairs of buildings. No further changes were made subsequent to this, although two rating Bills were tabled in the Provincial Council.
Of interest are the available figures which relate to a period ten years before the passing of the Act of 1877, with its consequent nationalization of the education system. The five main provinces only are dealt with in detail, certain figures for the minor provinces—Taranaki, Hawke's Bay, Marlborough, and Westland—not being available.
| TABLE SHOWING PROVINCIAL APPROPRIATIONS AND NUMBER OF SCHOLARS IN 1867. | |||||
|---|---|---|---|---|---|
| Province | Population. | Revenue. | Number of Scholars. | ||
| Total. | Appropriated to Education. | Attending Public Schools. | Attending Private Schools. | ||
* 1866. † Not available. | |||||
| £ | £ | ||||
| Auckland | 48,521 | 196,667 | 3,000 | 2,686* | 3,258 |
| Wellington | 21,950 | 166,444 | 2,714 | 970 | 1,793 |
| Nelson | 23,814 | 170,634 | 5,680 | 1,668 | 650 |
| Canterbury | 53,866 | 562,807 | 6,751 | 2,178 | 2,297 |
| Otago | 48,577 | 503,755 | 11,698 | 3,298 | 1,546 |
| Others | 22,160 | 263,848 | 3,727 | † | † |
| Totals | 218,688 | 1,864,155 | 33,570 | † | † |
The desirability of introducing some connected scheme to replace the heterogeneous systems in operation was affirmed by the House of Representatives in 1869, but considerable differences of opinion as to the form which legislation should take prevented a measure being passed for several years. It is evident, however, from the crop of provincial enactments in 1871 and subsequent years that the fear of a national system led most of the Provincial Councils to put their educational houses in order in the attempt to retain control of education.
Whether religious teaching of a non-sectarian character was to be provided for, and the question of grants to denominational and private schools, were the reasons for the dropping of a Bill which was introduced into the General Assembly in 1871. A further effort was made in 1873, but, although the Bill then introduced passed through all stages in both Houses, it did not actually reach the statute-book. Nothing further was done until 1876, when, with the abolition of the provincial institutions, it was necessary to provide machinery to keep the existing public schools in operation. This was done by the passing of the Education Boards Act, 1876, which made temporary provision for the administration of education. The education districts thus created were coterminous with the provincial districts of the same names. By the Act all taxes and rates previously authorized by the provincial Legislatures were abolished with the exception of school fees and capitation rates on account of children. A vote was made out of the Land Fund in aid of the maintenance of schools.
Parliament in 1877 was in the position of requiring to make provision for a national system. The Bill which was presented underwent considerable modification. Provision for a capitation-tax of 10s. on every child of school age was deleted, and instruction was to be of an entirely secular character. It will be seen accordingly that with the passing of this Act the foundation of the present system of free, compulsory, and secular education was well laid. The outstanding features of the Education Act, 1877, were the provisions for a central Department of Education controlled by a Minister of the Crown; the establishment of twelve education districts—viz., Auckland, Taranaki, Wanganui, Wellington, Hawke's Bay, Marlborough, Nelson, North Canterbury, South Canterbury, Westland, Otago, and Southland—governed by Boards; and the establishment of school districts, which came under the jurisdiction of School Committees. On the Department was the onus of administering the annual appropriations by distributing to the Boards funds for the erection and maintenance of schools and the establishment of training or normal schools, and also the payment of capitation to the Boards at the rate of £3 15s. for each scholar in average daily attendance.
Education Boards were to be elected by School Committees, and to consist of nine members, three of whom were to retire annually. In the Boards were vested all property and endowments, and rents from these became part of the Board funds. The Boards were required to administer funds in carrying out the building arrangements for which grants were provided by the Department; in paying the salaries of teachers; and in granting to School Committees money for general educational purposes. The appointment and removal of teachers were in their hands, and the Act also gave the Boards power to establish scholarships, and to provide for secondary education in district high schools. Fees were, however, payable to Education Boards by pupils receiving secondary instruction. School Committees of seven members were to be elected annually. Generally the Committee had the management of educational matters within its own district, and out of the money received from the Board made payments incidental to the administration of the Committee's functions. In addition to these provisions the Act of 1877 specified the course of instruction to be given in the schools throughout the colony. Inspectors, who were officers of the Education Boards, were to be appointed to examine and report on the school-work.
In the main the principles of the Act of 1877 are operative to-day. Several amendments made in succeeding years necessitated a consolidating measure in 1904. Among the principal alterations and additions that had been made up to that date were: The creation of the Grey District by a subdivision of Westland in 1884, thus bringing the total number of education districts up to thirteen; the provision in 1900 for a comprehensive scheme of manual and technical instruction; the introduction of physical drill into the curriculum in 1901; and, in 1903, the institution of National Scholarships to be awarded by the Department, and the introduction of a system of free places in secondary schools and district high schools for scholars completing the primary course. Up to the year 1901 also each Board had its own scale of staffs and salaries, but an Act of 1901 fixed the relation of the number and the remuneration of teachers in a school to the number of pupils in attendance. In 1905 each education district was divided into three wards, each returning three members, one of whom in each ward retired annually.
No outstanding changes beyond the consolidation of education legislation in 1908 were made until 1914. By the Education Act of that year the whole of the law relating not only to public but also to secondary, technical, and special schools was recast. The principal changes involved the reorganization of the Department of Education, and the Inspector-General of Schools became Director of Education. Inspectors of Schools, who had hitherto been officers of the several Education Boards, became officers of the central Department, a provision, it may be noted, that had been deleted from the Bill of 1877. Provision was made for the constitution of fewer education districts in lieu of the thirteen then existing, and by an Act of 1915 nine were created. Every education district is divided into urban areas and a rural area. An urban area consists of a borough or a group of boroughs having more than eight thousand inhabitants; and the rural area, which comprises the rest of the district, is divided into three wards. The members for each ward of the rural area and for all urban areas are, as formerly, to be elected by the members of the several School Committees. The number of members of an Education Board for the rural area is six—two for each ward. The number of members for each urban area is two for each sixty thousand or part of sixty thousand inhabitants. School Committees continue to be elected by the householders, and hold office for one year.
A Council of Education is established whose statutory duty it is to report to the Minister and advise upon any matters in connection with education referred to it by the Minister, or which it may consider advisable to introduce into New Zealand. The Council has, however, no administrative or executive functions. To obviate the necessity for frequent meetings of the Council the Minister is given power to constitute from time to time District Advisory Committees, to afford assistance and to advise with regard to matters concerning one district only.
Under the Act, provision is made for an annual graded list of certificated teachers. The first grading was completed and published in 1916, and has since been made annually. Except in special cases, all teaching appointments are governed by the position of the applicants on the list, and it is also to some extent the basis for the determination of the rate of salary payable.
Amending legislation, mainly of an administrative character, has been enacted at various times since 1914. By the Education Amendment Act, 1921-22, the registration of all private schools is made compulsory, and teachers in both public and private schools are required to take the oath of allegiance.
The Education Amendment Act, 1924, contained inter alia, provisions for the establishment of junior high schools, for the amalgamation of the governing bodies of secondary and technical schools, and for the creation of a Teachers' Register.
Important alterations in regard to Junior and Senior National Scholarships were made by the Education Amendment Act, 1926, which also discontinued the system of issuing licenses to teach.
The programme of primary instruction at present provided by the Act includes English, arithmetic, geography, history and civics, drawing and handwork (including needlework), nature-study and elementary science, physical instruction, moral instruction and health, and singing.
The number of scholars and students receiving instruction in the educational institutions of the Dominion is shown in the following summary, classified according as to whether they receive primary, secondary, technical, or higher education. The table refers to roll numbers as at the end of the year in each case.
| TABLE SHOWING SCHOLARS AND STUDENTS AS AT 31ST DECEMBER, 1923, 1924, AND 1925. | |||
|---|---|---|---|
| Class of Institution. | 1923. | 1924. | 1925. |
| Primary Education. | |||
| Public (State) schools | 211,960 | 213,290 | 214,724 |
| Native village schools | 6,186 | 6,310 | 6,386 |
| Native mission schools | 367 | 343 | 366 |
| Registered private primary schools | 26,010 | 26,302 | 25,933 |
| Lower departments of secondary schools | 500 | 478 | 339 |
| Correspondence classes | 365 | 504 | 500 |
| Total primary | 245,388 | 247,227 | 248,248 |
| Secondary Education. | |||
| Secondary schools | 11,619 | 12,010 | 12,514 |
| Secondary departments of district high schools | 2,818 | 2,900 | 3,136 |
| Technical high schools | 5,054 | 5,369 | 5,132 |
| Maori secondary (boarding) schools | 493 | 524 | 536 |
| Registered private secondary schools | 2,134 | 2,473 | 2,511 |
| Total secondary | 22,118 | 23,276 | 23,829 |
| Technical Classes (excluding Technical High Schools). | |||
| Conducted by Education or High School Boards | 2,292 | 2,687 | 1,641 |
| Conducted by Technical School Boards or Managers | 9,503 | 10,288 | 10,708 |
| Conducted by University colleges | 1,268 | 1,288 | 617 |
| Total technical | 13,063 | 14,243 | 12,966 |
| University Education. | |||
| University colleges | 3,858 | 3,808 | 3,949 |
| University students exempt from lectures | 344 | 428 | 493 |
| Lincoln Agricultural College | 53 | 51 | 52 |
| Total University | 4,255 | 4,287 | 4,494 |
| Total scholars and students | 284,824 | 289,033 | 289,537 |
Public primary schools, including district high schools, numbered 2,580 in 1925, against 2,574 in 1924. The number of registered private primary schools from which returns were received by the Education Department was 285. Aided or endowed colleges, grammar and high schools in operation numbered 38, technical high schools 15, registered private secondary schools 29, and University colleges 4. The number of primary and secondary schools established for the education of the Native or Maori race was 147.
From the table which follows an indication is given of the growth of the education system since the creation of a central administrative Department in 1877. At that time the number of schools in proportion to the population of the colony was relatively small, but during the following twenty years the number increased rapidly. Since 1900, however, the closer settlement of the country districts and, more recently, the drift of population to the larger centres have to some extent counteracted this tendency to multiply the number of schools. At present there is one school to approximately each five hundred members of the European community.
Compared with 1924, there was in 1925 an increase of 1,670 in the number of pupils belonging to the public schools as at the end of the year, and the average attendance shows an increase of 3,506 for the whole year. The figures tabulated below include pupils attending the secondary departments of district high schools.
| TABLE SHOWING NUMBER OF SCHOOLS AND SCHOLARS, 1878 TO 1925. | ||||||
|---|---|---|---|---|---|---|
| Year. | Population at 31st December (excluding Maoris). | Number of Schools. | Pupils at End of Year. | Mean of Average Weekly Roll. | Average Attendance, Whole Year. | Average Attendance as Percentage of Weekly Roll. |
| 1878 | 432,519 | 748 | 65,040 | .. | 48,773 | .. |
| 1888 | 607,380 | 1,158 | 112,685 | 113,636 | 90,108 | 79.3 |
| 1898 | 743,463 | 1,655 | 131,621 | 133,782 | 111,636 | 83.4 |
| 1908 | 960,642 | 1,998 | 147,428 | 145,974 | 127,160 | 87.1 |
| 1913 | 1,084,662 | 2,255 | 172,168 | 169,530 | 151,242 | 89.2 |
| 1918 | 1,108,373 | 2,365 | 194,934 | 191,382 | 169,836 | 88.7 |
| 1921 | 1,239,966 | 2,498 | 207,357 | 202,944 | 182,306 | 89.8 |
| 1922 | 1,265,397 | 2,550 | 213,097 | 209,251 | 190,012 | 90.8 |
| 1923 | 1,289,221 | 2,566 | 214,778 | 211,624 | 190,449 | 90.0 |
| 1924 | 1,316,174 | 2,574 | 216,190 | 213,140 | 193,253 | 90.7 |
| 1925 | 1,346,076 | 2,580 | 217,860 | 215,401 | 196,759 | 91.3 |
Of the 2,580 schools shown above for 1925, 2,082 had average attendances of between one and eighty, and of these 1,003 had averages ranging from one to twenty.
The relative activities of the nine Education Boards administering primary education may be gauged from the following figures as at 31st December, 1925; they are exclusive of the secondary departments of district high schools.
| Teachers and Schools, by Education Districts, as at 31st December, 1925. | |||||||||||
|---|---|---|---|---|---|---|---|---|---|---|---|
| Education District. | Number of Schools. | Adult Teachers. | Total Number of Adult teachers and Pupil-teachers. | Percentage of Male to Female Adult Teachers. | |||||||
| Sole Teachers. | Heads of Schools. | Assistant Teachers. | Pupil-teachers. | ||||||||
| M. | F. | M. | F. | M. | F. | M. | F. | ||||
| Auckland | 757 | 187 | 202 | 277 | 38 | 213 | 883 | 33 | 62 | 1,895 | 60.3 |
| Taranaki | 171 | 31 | 62 | 46 | 31 | 19 | 152 | 7 | 15 | 363 | 39.2 |
| Wanganui | 211 | 41 | 70 | 79 | 15 | 40 | 232 | 12 | 24 | 513 | 50.5 |
| Hawke's Bay | 191 | 34 | 79 | 67 | 8 | 47 | 221 | 6 | 6 | 468 | 48.0 |
| Wellington | 258 | 34 | 112 | 75 | 20 | 86 | 398 | 15 | 41 | 781 | 36.8 |
| Nelson | 143 | 38 | 60 | 33 | 7 | 13 | 92 | 5 | 7 | 255 | 52.8 |
| Canterbury | 394 | 38 | 173 | 153 | 19 | 113 | 483 | 30 | 44 | 1,053 | 45.0 |
| Otago | 257 | 38 | 111 | 100 | 3 | 69 | 287 | 13 | 16 | 637 | 51.6 |
| Southland | 198 | 46 | 69 | 70 | 11 | 21 | 156 | 8 | 16 | 397 | 58.1 |
| Totals | 2,580 | 487 | 938 | 900 | 152 | 621 | 2,904 | 129 | 231 | 6,362 | 50.3 |
A table is now given which shows by education districts the total roll of scholars as at the end of each year for the last five years. The figures indicate in a general way that the rate of increase has been more pronounced in the North Island districts than in the South. They also indicate, more clearly perhaps than the preceding table. the relative size and responsibilities of the nine Boards. The figures are exclusive of the secondary departments of district high schools.
| Scholars, by Education Districts, 1921 to 1925. | |||||
|---|---|---|---|---|---|
| District. | 1921. | 1922. | 1923. | 1924. | 1925. |
| Auckland | 59,816 | 62,248 | 63,598 | 64,689 | 65,070 |
| Taranaki | 10,834 | 11,121 | 11,341 | 11,310 | 11,474 |
| Wanganui | 16,310 | 16,673 | 16,499 | 16,983 | 17,218 |
| Hawke's Bay | 15,117 | 15,593 | 15,849 | 15,865 | 16,277 |
| Wellington | 25,699 | 26,367 | 26,311 | 26,533 | 26,972 |
| Nelson | 7,028 | 7,052 | 7,072 | 7,074 | 7,143 |
| Canterbury | 35,761 | 36,885 | 37,131 | 36,853 | 36,887 |
| Otago | 22,192 | 22,084 | 21,845 | 21,749 | 21,360 |
| Southland | 12,424 | 12,468 | 12,314 | 12,234 | 12,323 |
| Totals | 205,181 | 210,491 | 211,960 | 213,290 | 214,724 |
In each of the education districts are located the Inspectors of Schools, who form part of the staff of the Department of Education. The total number of primary-school Inspectors on the 31st December, 1925, was 45, allocated as follows: Auckland, 12; Taranaki, 3; Wanganui, 4; Hawke's Bay, 3; Wellington, 6; Nelson, 2; Canterbury, 7; Otago, 5; Southland, 3.
The following table shows the age and sex of the pupils on the rolls of the public schools of the Dominion at the end of 1925, and the percentage of the roll for each age:—
| Age. | 1925. | Percentages for Five Years. | ||||||
|---|---|---|---|---|---|---|---|---|
| Boys. | Girls. | Total. | 1921. | 1922. | 1923. | 1924. | 1925. | |
| 5 and under 6 years | 8,790 | 8,332 | 17,122 | 7.4 | 7.3 | 7.3 | 6.8 | 8.0 |
| 6 ,, 7 ,, | 10,463 | 9,655 | 20,118 | 10.2 | 10.3 | 10.0 | 9.9 | 9.4 |
| 7 ,, 8 ,, | 11,588 | 11,028 | 22,616 | 11.6 | 11.0 | 11.2 | 11.0 | 10.5 |
| 8 ,, 9 ,, | 12,098 | 11,698 | 23,796 | 11.2 | 11.3 | 11.4 | 11.5 | 11.2 |
| 9 ,, 10 ,, | 12,802 | 11,932 | 24,734 | 11.4 | 11.4 | 11.3 | 11.1 | 11.5 |
| 10 ,, 11 ,, | 12,549 | 11,513 | 24,062 | 11.0 | 11.2 | 11.1 | 11.4 | 11.2 |
| 11 ,, 12 ,, | 12,499 | 11,907 | 24,406 | 10.7 | 10.7 | 11.0 | 11.1 | 11.4 |
| 12 ,, 13 ,, | 12,035 | 11,175 | 23,210 | 10.6 | 10.3 | 10.4 | 11.0 | 10.8 |
| 13 ,, 14 ,, | 10,665 | 9,739 | 20,404 | 9.2 | 9.3 | 9.2 | 9.3 | 9.5 |
| 14 ,, 15 ,, | 5,972 | 4,694 | 10,666 | 5.0 | 5.2 | 5.2 | 5.1 | 5.0 |
| 15 and over | 2,186 | 1,404 | 3,590 | 1.7 | 2.0 | 1.9 | 1.8 | 1.5 |
| Totals | 111,647 | 103,077 | 214,724 | 100.0 | 100.0 | 100.0 | 100.0 | 100.0 |
Elementary handwork in such subjects as modelling, paper and cardboard work, and brushwork is taught by the ordinary staff in practically every school of any size in the Dominion. The boys of Standards V and VI in 627 schools receive instruction from special teachers in woodwork or ironwork. The girls of similar standards from 635 schools also receive instruction from special instructors in domestic subjects, including a comprehensive course in cookery and domestic hygiene. Subjects relating to agriculture or dairy-work are taught in 1,802 schools. These subjects are generally taught by the regular staff under the supervision of itinerant instructors specially qualified in the work. Different branches of elementary science are taught in 125 schools.
The payments made by the Department on account of salaries, capitation, and material for manual instruction for the year ended 31st March, 1926, amounted to £75,234.
A capitation grant at the rate of 3d. per head on the average attendance is paid to Boards for the purpose of supplying schools with supplementary continuous readers for class-reading, and also for the free supply of class-books in certain cases.
Provision has been made for the payment of subsidies of £1 for £1 on moneys raised by voluntary contributions for school libraries. In addition, a subsidy is payable by the Education Board not exceeding £5 for any one school.
Since 1922, correspondence classes have been conducted for the education of children in particularly isolated areas who would otherwise not be able to obtain any schooling. The number on the roll at the end of 1925 was 500, and remarkable progress has been shown by the pupils in their work.
Since May, 1907, an illustrated paper, called the School Journal, has been published by the Department monthly for use as a supplementary reader in primary schools, and is regarded as a useful and popular publication. In many cases it is being used as the chief reader. It is issued in three parts, suited to the varying capacities of the pupils in Standards I to VI inclusive, and is supplied free to all public schools, Native schools, special schools, and other institutions more or less under the Department's control or supervision. To a very large number of private schools it is supplied at cost price, with the result that over 17,000 copies of the School Journal are purchased monthly. Of the last issue of the School Journal for the year 1925 the number of copies printed was—Part I, 77,000; Part DI, 76,500; Part III, 64,000: total, 217,500. These numbers show an increase of 7,500 over those of the previous year. The price to purchasers is at present 1d. for each of Parts I and II, and 1 ½d. for Part III, the minimum charge for one of each part being 4s. 6d. per annum.
A monthly Gazette is published by the Department. In addition to containing articles by leading educationists it is a medium for the prompt dissemination of official information and for the advertisement of vacancies, and arrangements obtain whereby copies are available for perusal by every teacher in the Dominion.
Free passes on the railway to the nearest public or private school are granted to children living near a railway-line but out of reach of a primary school, and the same privilege is enjoyed by pupils having to travel to attend secondary schools, district high schools, and technical high schools, and also by free-place holders travelling to attend technical schools or classes other than technical high schools.
Education Boards are also authorized to make provision when necessary for the conveyance of pupils to primary schools by road or water, and to contribute towards the payment for board of children compelled to live away from home in order to attend school. The expenditure on these services for the last five years is shown in the following table:—
| Conveyance and Board.—Expenditure for 1921 to 1925. | |||||||
|---|---|---|---|---|---|---|---|
| Year. | Railway Fares. | Other Conveyance and Boarding Allowances. | Total. | ||||
| Primary. | Secondary. | Technical. | Primary. | Secondary. | Technical. | ||
| £ | £ | £ | £ | £ | £ | £ | |
| 1921 | 13,470 | 6,113 | 4,386 | 22,089 | .. | .. | 46,058 |
| 1922 | 11,942 | 6,789 | 4,742 | 22,839 | .. | .. | 46,312 |
| 1923 | 11,589 | 7,376 | 5,621 | 23,184 | .. | 47,770 | |
| 1924 | 12,972 | 7,647 | 5,590 | 25,049 | .. | 51,258 | |
| 1925 | 12,918 | 8,619 | 6,679 | 30,045 | 450 | 58,711 | |
Physical education is recognized as part of the primary-school curriculum, and by regulation it is compulsory on the part of head teachers to devote a minimum time of fifteen minutes a day to the subject. Its administration is in the hands of a Chief Physical Instructor and a staff of twelve itinerant instructors. Schools are visited by the instructors for the purpose of both instructing and inspecting. Corrective classes are held in the larger schools for the purpose of remedying physical defects of the children, and exercises for this purpose are prescribed by the physical instructor after the child has been examined by a School Medical Officer. The Department uses its own syllabus of physical training, which was published in 1920, and is based on that of the London Board of Education, modified to suit New Zealand conditions.
The medical and dental inspection of school-children and the scheme of school dentistry were transferred from the jurisdiction of the Education Department to that of the Department of Health at the end of 1920, and reference to these matters is dealt with in Section VII of this publication.
The number of teachers in the public schools, exclusive of those employed in the secondary departments of district high schools, is shown for a number of years. The figures are as in December of the years given, and in the case of pupil-teachers exclude probationers from 1913 onwards.
| TEACHERS IN PUBLIC SCHOOLS, 1878 TO 1925. | ||||||
|---|---|---|---|---|---|---|
| Year. | Adults. | Pupil-teachers. | ||||
| Males. | Females. | Total. | Males. | Females. | Total. | |
| 1878 | 707 | 454 | 1,161 | 118 | 332 | 450 |
| 1888 | 1,039 | 887 | 1,926 | 219 | 694 | 913 |
| 1898 | 1,234 | 1,370 | 2,604 | 229 | 831 | 1,060 |
| 1908 | 1,331 | 2,021 | 3,352 | 161 | 476 | 637 |
| 1913 | 1,603 | 2,659 | 4,262 | 142 | 474 | 616 |
| 1918 | 1,366 | 3,452 | 4,818 | 123 | 523 | 646 |
| 1921 | 1,772 | 3,488 | 5,260 | 141 | 415 | 556 |
| 1922 | 1,842 | 3,623 | 5,465 | 182 | 405 | 587 |
| 1923 | 1,865 | 3,791 | 5,656 | 188 | 323 | 511 |
| 1924 | 1,919 | 3,873 | 5,822 | 180 | 333 | 513 |
| 1925 | 2,008 | 3,994 | 6,002 | 129 | 231 | 360 |
The total number of teachers employed in primary schools, excluding probationers and including 360 pupil-teachers, in 1925 was 6,362 (2,137 males and 4,225 females); of the adult teachers 88 per cent. held teachers' certificates. The number of probationers was 641 (166 males and 475 females). Taking all schools with two or more teachers, the average number of pupils per teacher was thirty-three; in schools with six or more teachers the average number was thirty-six; and in all schools the average number was twenty-nine. The table given earlier in discussing the relative activities of the various Education Boards shows the number of male and female teachers respectively in each education district for the year 1925.
Omitting schools with less than twenty-one pupils, the ratio of adult men teachers to adult women teachers in 1925 was 100 to 193, The proportion of men to women in charge of schools with one to twenty scholars was 100 to 236. If the adult teachers of all public schools are taken it is found that the ratio of men teachers to women teachers was 100 to 199 in 1925. The ratio of male pupil-teachers was 100 to 179 in 1925. This information over a period of five successive years shows in a striking way the reduction in the disparity evident in the earlier years. A proportion of one male to three female teachers is regarded by educationists as satisfactory.
| PUBLIC PRIMARY SCHOOL-TEACHERS (FEMALES PER 100 MALES), 1921 TO 1925. | |||||
|---|---|---|---|---|---|
| Ratio of | 1921. | 1922. | 1923. | 1924. | 1925. |
| Adult teachers— | |||||
| Schools with one to twenty scholars | 318 | 299 | 293 | 249 | 236 |
| Schools with more than twenty scholars | 182 | 182 | 191 | 191 | 193 |
| All schools | 197 | 197 | 203 | 199 | 199 |
| Pupil-teachers | 294 | 223 | 172 | 185 | 179 |
| Probationers | 445 | 349 | 279 | 286 | 286 |
| Students in training colleges | 324 | 256 | 244 | 224 | 186 |
The average salaries paid to teachers in 1925, including house allowance or value of residence, were—Male head teachers, £442; female head teachers, £359; male assistants, £329; female assistants, £231; sole male teachers, £264; sole female teachers, £240. The movement over a period during which considerable salary adjustments have been made to meet the variation in the cost of living is now shown. The figures include both certificated and uncertificated teachers.
| AVERAGE SALARY OF PRIMARY-SCHOOL TEACHERS. | |||||
|---|---|---|---|---|---|
| Class of Teacher. | 1920. | 1922. | 1923. | 1921. | 1925. |
| £ | £ | £ | £ | £ | |
| Male head teachers | 432 | 420 | 422 | 436 | 442 |
| Female head teachers | 373 | 360 | 365 | 365 | 359 |
| Male sole teachers | 266 | 246 | 247 | 251 | 264 |
| Female sole teachers | 221 | 216 | 218 | 226 | 240 |
| Male assistants | 336 | 326 | 321 | 326 | 329 |
| Female assistants | 229 | 224 | 224 | 230 | 231 |
The following table shows the number of certificated teachers receiving salaries of the various grades during the year 1925:—
| SALARIES OF CERTIFICATED TEACHERS, 1925. | ||||
|---|---|---|---|---|
| Salaries (including Allowances and Value of Residences). | Certificated Male Teachers. | Certificated Female Teachers. | ||
| Sole and Head Teachers. | Assistants. | Sole and Head Teachers. | Assistants. | |
| Not exceeding £180 | 3 | 5 | 9 | 467 |
| £181 to £250 | 92 | 145 | 161 | 1,508 |
| £251 ,, £300 | 182 | 70 | 279 | 363 |
| £301 ,, £350 | 121 | 101 | 130 | 277 |
| £351 ,, £400 | 255 | 168 | 105 | 111 |
| Over £400 | 602 | 122 | 33 | 5 |
| Totals | 1,255 | 611 | 777 | 2,731 |
Information as to the Teachers' Superannuation Fund will be found in the section of this book dealing with Pensions, Superannuation, &c.
Training colleges are situated in the four principal centres of the Dominion. The management of the training colleges is entrusted to the local Education Boards. subject to general regulations. The amount expended by the Department during the financial year 1925-26 for the training of teachers was £203,860.
The numbers of students attending the training colleges for the last three years are as follows:—
| Training College. | 1923. | 1924. | 1925. | ||||||
|---|---|---|---|---|---|---|---|---|---|
| Males. | Females. | Total. | Males. | Females. | Total. | Males. | Females. | Total. | |
| Auckland | 122 | 247 | 369 | 125 | 243 | 368 | 124 | 216 | 340 |
| Wellington | 66 | 224 | 290 | 100 | 224 | 324 | 120 | 225 | 345 |
| Christchurch | 78 | 183 | 261 | 82 | 200 | 282 | 94 | 198 | 292 |
| Dunedin | 83 | 199 | 282 | 86 | 214 | 300 | 107 | 187 | 294 |
| Totals | 349 | 853 | 1,202 | 393 | 881 | 1,274 | 445 | 826 | 1,271 |
The number attending in each of the earlier years of the last decade has been— 1916, 442; 1917, 451; 1918, 500; 1919, 582; 1920, 680: 1921, 904; and 1922, 1,151.
The ordinary course of training is for two years, and the output of trained teachers from the colleges in 1925 was 775. There is also provision for a one-year course, which under certain conditions may be taken by University students or matriculated students who have completed a two-years course at an agricultural college or a school of home science recognized by the University of New Zealand. In addition there are short-period studentships, of not less than three months' nor more than one year's duration, for the benefit of teachers who have already been employed in teaching and are deemed worthy of further training in professional work.
By the Education Amendment Act, 1921-22, every private school was required to apply for registration before the 13th July, 1922, and no private school can now be established unless application is first made to the Department of Education for registration. Application, however, does not of necessity carry registration, as certain precedent conditions of efficiency and suitability of staff, premises, equipment, and curriculum are required to be fulfilled. By the principal Act of 1914 every child between the ages of seven and fourteen is required to be enrolled as a pupil of either a public or a registered school. It follows accordingly that the parents of a child of school age are liable to the penalty of £2 provided for in the principal Act if such child is improperly enrolled at other than a public or registered school.
At the end of the year 1925 the number of registered private primary schools was 285, with a total roll number of 25,933 and an average attendance of 22,816 for the year.
| REGISTERED PRIVATE SCHOOLS, 1921 TO 1925. | ||||||||
|---|---|---|---|---|---|---|---|---|
| Year. | Number of Schools. | Roll at End of Year. | Average Yearly Attendance. | Teachers. | ||||
| Males. | Females. | Total. | Males. | Females. | Total. | |||
| 1921 | 235 | 10,967 | 12,957 | 23,924 | 20,941 | 76 | 682 | 758 |
| 1922 | 263 | 11,234 | 13,627 | 24,861 | 21,246 | 74 | 726 | 800 |
| 1923 | 294 | 11,758 | 14,252 | 26,010 | 23,874 | 94 | 813 | 907 |
| 1924 | 295 | 11,895 | 14,407 | 26,302 | 23,397 | 118 | 804 | 922 |
| 1925 | 285 | 11,808 | 14,125 | 25,933 | 22,816 | 119 | 788 | 907 |
The following particulars show that the bulk of the scholars concerned attend Roman Catholic schools, the proportion based on roll numbers being 82 per cent. in 1921, 81 per cent. in 1922, 80 per cent. in 1923, 78 per cent. in 1924, and 79 per cent. in 1925.
| ROMAN CATHOLIC REGISTERED PRIVATE SCHOOLS, 1921 TO 1925. (Included in preceding table.) | ||||||||
|---|---|---|---|---|---|---|---|---|
| Year. | Number of Schools. | Roll at End of Year. | Average Yearly Attendance. | Teachers. | ||||
| Males. | Females. | Total. | Males. | Females. | Total. | |||
| 1921 | 168 | 9,096 | 10,551 | 19,647 | 17,117 | 40 | 520 | 560 |
| 1922 | 178 | 9,506 | 10,747 | 20,253 | 17,076 | 36 | 533 | 569 |
| 1923 | 183 | 9,591 | 11,158 | 20,749 | 19,048 | 39 | 587 | 626 |
| 1924 | 187 | 9,585 | 11,013 | 20,598 | 18,330 | 48 | 581 | 629 |
| 1925 | 186 | 9,590 | 10,992 | 20,582 | 18,008 | 44 | 576 | 620 |
In addition to the 285 registered primary private schools there were 29 private secondary schools on the register at the end of 1925, with a total roll number of 2,511.
The number of Native village schools in operation at the end of 1925 was 128. In addition there are nineteen private schools at which education for Maori boys and girls is provided. Of these, ten are maintained from the incomes arising out of lands held in trust for educational purposes by various denominational bodies; the others are supported by private resources. Instruction is imparted by means of the English language only.
On the rolls of the 128 village schools at the 31st December, 1925, there were 6,386 children (including 797 Europeans). The average attendance for the year was 5,628, the percentage of regularity being 88.4, and the average weekly roll number 6,366. The total number of pupils on the rolls of the Native mission schools was 366, and on those of the secondary schools 536. At the end of the year, therefore, the total roll number of all the Native schools inspected by officers of the Education Department was 7,288.
The total net expenditure on Native schools during the year ended the 31st March, 1926, was £79,382. Included in this is the sum of £58,279 expended on teachers' and inspectors' salaries, £8,278 expended on new buildings and additions, £2,456 on maintenance of buildings, repairs, &c., and £4,936 on secondary education.
The staffs of the village schools included seventy-nine male and forty-seven. female head or sole teachers, and 154 assistants.
The following table records the development of the Native village schools since the year 1881, when they were transferred from the Native Department to the control of the Education Department. No account is taken of schools which, as the European element in them has become predominant, have been handed over to the various Education Boards.
| NATIVE VILLAGE SCHOOLS.—NUMBER, ATTENDANCE, AND TEACHERS, 1881 TO 1925. | ||||||
|---|---|---|---|---|---|---|
| Year. | Number of Schools at End of Year. | Mean of Average Weekly Roll. | Average Attendance, Whole Year. | Average Attendance as Percentage of Weekly Roll. | Number of Teachers. | |
| Males. | Females. | |||||
| 1881 | 60 | .. | 1,406 | .. | 54 | 10 |
| 1886 | 69 | 2,343 | 2,020 | 86.2 | 60 | 35 |
| 1891 | 66 | 2,395 | 1,837 | 76.7 | 60 | 34 |
| 1896 | 74 | 2,874 | 2,220 | 77.3 | 64 | 72 |
| 1902 | 98 | 3,650 | 3,005 | 82.3 | 77 | 103 |
| 1907 | 99 | 4,321 | 3,561 | 82.4 | 84 | 123 |
| 1912 | 108 | 4,644 | 4,042 | 87.0 | 90 | 144 |
| 1917 | 118 | 5,191 | 4,507 | 86.8 | 80 | 167 |
| 1922 | 127 | 6,119 | 5,436 | 88.8 | 86 | 184 |
| 1923 | 124 | 6,268 | 5,586 | 89.0 | 92 | 181 |
| 1924 | 125 | 6,346 | 5,610 | 88.4 | 91 | 181 |
| 1925 | 128 | 6,366 | 5,628 | 88.4 | 92 | 188 |
Besides the children of the Maori race who are receiving instruction in the Native schools there is a large number (6,576) attending public schools, so that the total number of primary pupils of Maori race (including those in the mission schools) is 12,531.
Until 1904, secondary schools were established by special (local) Acts of the General Assembly, and the bulk of schools giving secondary education have been so constituted. At the present time the provisions of the Education Act, 1914, allow of the Minister of Education establishing such schools, and in general the minimum number of prospective pupils must be sixty pupils in the case of secondary schools. twenty pupils in the case of the secondary department of a district high school, and forty pupils in the case of a technical high school. Secondary schools are controlled by a Board of Governors, district high schools by the Education Board of the district, and technical high schools either by a Board of Managers or by the Education Board of the district acting in a similar capacity. Free places are granted to suitably qualified pupils. A junior free place at a secondary school or a technical high school is tenable for two years, with a possible extension to three years. When hold at a district high school it is tenable for three years, provided that in any case a junior free place may not be held after the 31st December of the year in which the holder reaches seventeen years of age. Senior free places are tenable up to the age of nineteen. The Act provides for the award of Junior and Senior National Scholarships of a monetary value of £5 or £10 respectively, supplemented if necessary by a boarding-allowance of £35.
In addition to the three classes of institutions referred to above there is also a small number of registered private secondary schools and of Maori secondary schools which provide for post-primary education. The total number of the five classes of schools providing secondary education during the last five years is set out in the accompanying table.
| NUMBER OF INSTITUTIONS PROVIDING SECONDARY EDUCATION, 1921 TO 1925. | ||||||
|---|---|---|---|---|---|---|
| Year. | Secondary Schools. | Secondary Departments of District High Schools. | Technical High Schools. | Maori Secondary Schools. | Private Secondary Schools. | Total. |
| 1921 | 35 | 57 | 9 | 10 | 20 | 135 |
| 1922 | 36 | 61 | 13 | 10 | 27 | 147 |
| 1923 | 37 | 68 | 13 | 11 | 27 | 157 |
| 1924 | 37 | 73 | 14 | 11 | 30 | 165 |
| 1925 | 38 | 80 | 15 | 11 | 29 | 173 |
Pupils on the roll at the end of the year for the five classes of schools providing secondary instruction numbered 23,829 in 1925, as compared with 23,276 in 1924. The number of pupils in each year of the last decade is shown in the following table; no account is taken of lower departments of secondary schools, and in the case of district high schools only the secondary department is included.
| PUPILS RECEIVING SECONDARY INSTRUCTION AT END OF EACH YEAR, 1916 TO 1925. | ||||||
|---|---|---|---|---|---|---|
| Year. | Secondary Schools. | District High Schools. | Technical High Schools. | Native Secondary Schools. | Registered Private Secondary Schools. | Total. |
| 1916 | 7,052 | 2,115 | 2,105 | 457 | 1,004 | 12,733 |
| 1917 | 7,590 | 2,180 | 2,347 | 487 | 1,206 | 13,810 |
| 1918 | 8,384 | 2,283 | 2,747 | 471 | 1,366 | 15,251 |
| 1919 | 9,068 | 2,159 | 2,926 | 434 | 1,497 | 16,084 |
| 1920 | 9,196 | 2,157 | 2,766 | 474 | 1,439 | 16,032 |
| 1921 | 10,030 | 2,176 | 3,349 | 488 | 1,634 | 17,677 |
| 1922 | 10,736 | 2,606 | 4,202 | 413 | 1,998 | 19,955 |
| 1923 | 11,619 | 2,818 | 5,054 | 493 | 2,134 | 22,118 |
| 1924 | 12,010 | 2,900 | 5,369 | 524 | 2,473 | 23,276 |
| 1925 | 12,514 | 3,136 | 5,132 | 536 | 2,511 | 23,829 |
It should be pointed out that the foregoing figures give the total scholars enrolled as at the end of the year. In the class of institution under review, however, a number of pupils leave before the close of the school year, and the figures shown are therefore on that account a little below the total number of scholars who have received instruction during the year. On the other hand, the total given is somewhat in excess of the total of pupils in average attendance over the whole year.
At the end of 1925, of the total scholars attending secondary schools 6,903 were boys and 5,611 girls; secondary departments of district high schools, 1,499 and 1,637; technical high schools, 2,710 and 2,422; registered private schools 1,006 boys and 1,505 girls; and in the case of Maori secondary schools the total roll consisted of 311 boys and 225 girls.
Not all of the pupils receiving secondary education hold free places, but of the scholars attending Government schools no less than 96 per cent. were receiving free tuition in 1925. The following table gives a summary of the various secondary free places at the end of each of the last three years for which payment was made by Government:—
| Free Places in December, 1923, 1924, and 1925. | |||||||||
|---|---|---|---|---|---|---|---|---|---|
| Class of Free Place. | 1923. | 1924. | 1925. | ||||||
| Boys. | Girls. | Total. | Boys. | Girls. | Total. | Boys. | Girls. | Total. | |
| Secondary schools— | |||||||||
| Junior free pupils | 3,583 | 3,609 | 7,192 | 3,866 | 3,630 | 7,496 | 4,091 | 3,747 | 7,479 |
| Senior free pupils | 1,860 | 1,426 | 3,286 | 1,856 | 1,532 | 3,388 | 1,969 | 1,657 | 3,985 |
| District high schools— | |||||||||
| Junior free pupils | 1,081 | 1,175 | 2,256 | 1,128 | 1,171 | 2,299 | 1,140 | 1,208 | 2,348 |
| Senior free pupils | 192 | 258 | 450 | 196 | 298 | 494 | 295 | 372 | 667 |
| Maori secondary schools | 54 | 70 | 124 | 57 | 73 | 130 | 59 | 81 | 140 |
| Technical high schools— | |||||||||
| Junior free pupils | 2,326 | 1,730 | 4,056 | 2,378 | 1,958 | 4,336 | 2,193 | 1,937 | 4,130 |
| Senior free pupils | 399 | 340 | 739 | 411 | 339 | 750 | 407 | 354 | 761 |
| Totals | 9,495 | 8,608 | 18,103 | 9,892 | 9,001 | 18,893 | 10,154 | 9,356 | 19,510 |
The figures below indicate the number and value of national scholarships current in December, 1923, 1924, and 1925 respectively. The number of scholarship-holders is, of course, included in the number of free-place holders already shown under the heading of “Free Secondary Education.”
| Number of scholarship-holders— | 1923. | 1924. | 1925. |
|---|---|---|---|
| Boys | 444 | 451 | 469 |
| Girls | 271 | 295 | 322 |
| Totals | 715 | 746 | 791 |
| Number receiving boarding-allowance (included in the above total) | 156 | 158 | 171 |
| Number receiving travelling-allowance (similarly included) | 54 | 49 | 56 |
| Number held at secondary schools | 599 | 630 | 656 |
| Number held at district high schools | 76 | 80 | 87 |
| Number held at technical high schools | 40 | 36 | 48 |
Regulations which came into force in January, 1918, provided for the award of bursaries to dependants of killed or disabled members of the New Zealand Expeditionary Force. To qualify for a war bursary a child must be eligible for—
Free education at technical classes; or
A free place at a secondary school, district high school, or technical high school; or
A University or educational bursary at a University college.
Twenty-nine bursaries were in operation in 1925.
Complete details of the staffs and salaries of the five classes of schools providing secondary education are not available. The following figures are therefore confined to full-time teachers of secondary schools proper and the secondary departments of district high schools:—
| Teaching Staffs of Secondary Institutions, 1921 to 1925. | ||||||
|---|---|---|---|---|---|---|
| Year. | Secondary Schools. | District High Schools. | ||||
| Males. | Females. | Total. | Males. | Females. | Total. | |
| 1921 | 211 | 194 | 405 | 33 | 70 | 103 |
| 1922 | 235 | 207 | 442 | 47 | 70 | 117 |
| 1923 | 256 | 218 | 474 | 50 | 80 | 130 |
| 1924 | 272 | 221 | 493 | 58 | 33 | 141 |
| 1925 | 279 | 233 | 512 | 70 | 72 | 142 |
The average rate of salary paid for each of the last five years is shown in the next table. Under the provisions of the Education Amendment Act of 1920, regulations have been made prescribing definitely the salaries of secondary-school teachers which are paid by the Government. The range of salaries payable is as follows: Principals—Men, £570 to £860; women, £430 to £670. Assistants—Men, £200 to £520; women, £168 to £408. In addition, a married Principal receives house allowance of £60 if a residence is not provided, a head of a department may receive £30, and a married assistant receives £40 per annum. The salaries of Principals are graded according to the size of the school, and the salaries of assistants according to the classification of the position held.
| Average Salaries paid to Teachers of Secondary Institutions, 1921 to 1925. | ||||||
|---|---|---|---|---|---|---|
| Year. | Secondary-school Principals. | Secondary-school Assistants. | District High School Secondary Assistants. | |||
| Males. | Females. | Males. | Females. | Males. | Females. | |
| £ | £ | £ | £ | £ | £ | |
| 1921 | 734 | 542 | 383 | 284 | 345 | 307 |
| 1922 | 703 | 529 | 359 | 267 | 302 | 289 |
| 1923 | 713 | 546 | 370 | 271 | 307 | 269 |
| 1924 | 720 | 553 | 374 | 287 | 327 | 275 |
| 1925 | 749 | 561 | 384 | 283 | 332 | 289 |
Somewhat analogous to private schools, but on a different basis, are the lower departments of secondary schools. These departments may be held in connection with secondary schools for pupils who have not passed Standard VI, provided that no part of the cost of instruction or of the maintenance of the department is met out of the income from the endowments of the school or from government grants. Eight secondary schools have lower departments attached to them. Many of the pupils board at the school hostels, indicating that these departments are used by the children of country residents able to afford to send their children away from home to attend school.
The figures relating to the last five years reveal the following particulars regarding the number of pupils and teachers at the end of each year:—
| Lower Departments of Secondary Schools, 1921 to 1925. | |||||||
|---|---|---|---|---|---|---|---|
| Year. | Number of Schools. | Scholars. | Teachers. | ||||
| Males. | Females. | Total. | Mules. | Females. | Total. | ||
| 1921 | 14 | 433 | 341 | 774 | 7 | 22 | 29 |
| 1922 | 12 | 344 | 246 | 590 | 8 | 15 | 23 |
| 1923 | 11 | 257 | 243 | 500 | 7 | 14 | 21 |
| 1924 | 11 | 216 | 262 | 478 | 5 | 15 | 20 |
| 1925 | 8 | 172 | 167 | 339 | 3 | 10 | 13 |
The Education Act provides for public instruction in such subjects of art, science, and technology as are set forth in regulations. Up to the end of 1919 the greater part of the revenue of technical schools and classes was derived from capitation payments made by the Government on the attendances of pupils, and each Board of Managers or controlling authority was responsible for the fixing of the salaries of its instructors, and the conditions of employment. In 1920, however, capitation payments were to a great extent abolished, and there was substituted a Dominion system of classification of technical-school teachers and manual-training instructors, and a corresponding system of payment of salaries. The abolition of capitation payments also involved making direct provision for the incidental expenses incurred by Technical School Boards and controlling authorities in connection with the schools, and the allowance for these for any school or class was made proportional to the total salaries paid by the Department for that school or class.
Classes were held at forty-three centres during 1825, as compared with fifty-six in the previous year. The number of individual students was as follows:—
| 1924. | 1925. | |
|---|---|---|
| Classes conducted by Education or High School Boards | 2,667 | 1,641 |
| Classes conducted by Technical School Boards or by Managers | 10,288 | 10,708 |
| Classes conducted by University colleges | 1,288 | 617 |
| Totals | 14,243 | 12,966 |
Students receiving free education during 1925 at technical classes other than technical high schools numbered 5,377 (3,304 males and 2,073 females). This compares with a total of 5,343 (3,178 males and 2,165 females) in the preceding year.
These schools (fifteen in 1925) are of secondary grade, and provide industrial, domestic, agricultural, commercial, and art courses. The number of pupils in attendance was 5,132, compared with 5,369 in 1924. The courses of instruction taken up by pupils were as follows:—
| Courses of Instruction at Technical High Schools, 1921 to 1925. | |||||
|---|---|---|---|---|---|
| Course. | 1921. | 1922. | 1923. | 1924. | 1925. |
| Industrial | 951 | 1,234 | 1,501 | 1,349 | 1,331 |
| Commercial and general | 1,746 | 2,054 | 2,558 | 2,865 | 2,731 |
| Domestic | 385 | 611 | 663 | 778 | 744 |
| Agriculture | 263 | 288 | 296 | 332 | 280 |
| Art | 4 | 15 | 36 | 45 | 46 |
| Totals | 3,349 | 4,202 | 5,054 | 5,369 | 5,132 |
Some indication of the growth of technical education and of the expenditure thereon is apparent from the following table. The figures relating to expenditure refer in each case to the financial year ending 31st March following.
| Particulars relating to Technical Education for the fears 1921 to 1925 inclusive. | |||||
|---|---|---|---|---|---|
| — | 1921. | 1922. | 1923. | 1924. | 1925.* |
* Excludes University college classes. † Year ended 31st March following. | |||||
| Classes. | |||||
| Number of centres at which classes were held | 94 | 63 | 55 | 56 | 45 |
| Number of technical high schools | 13 | 13 | 14 | 14 | 14 |
| Number of students— | |||||
| (a.) Technical high schools | 3,349 | 4,202 | 5,054 | 5,369 | 5,132 |
| (b.) Other classes | 16,832 | 12,262 | 13,063 | 14,243 | 12,966 |
| Number of free pupils at (a) and (b) above | 6,975 | 8,384 | 9,653 | 10,429 | 10,268 |
| Number of students attending under compulsory regulations | 1,585 | 324 | 269 | 289 | 182 |
| Chief Items of Expenditure.† | £ | £ | £ | £ | £ |
| Capitation and salaries | 119,289 | 119,464 | 126,795 | 142,173 | 151,295 |
| Grants for buildings and equipment | 101,198 | 66,308 | 34,970 | 31,677 | 37,892 |
| Subsidies on voluntary contributions | 3,991 | 4,207 | 2,561 | 4,152 | 2,542 |
| Conveyance of instructors and pupils | 5,065 | 5,550 | 6,148 | 6,074 | 6,967 |
| Total expenditure† by Government | 244,627 | 207,628 | 177,501 | 194,494 | 209,183 |
Technological examinations were conducted by the Department in 1925 on behalf of the City and Guilds of London Institute at twelve centres. The total number of entries was 464, and the number of passes was 215.
Further information in regard to free places in technical high schools is given under the heading of “Secondary Education.”
During 1925 the Child Welfare Act was passed by the Legislature. The Act provides for the creation of a special branch of the Education Department to be known as the Child Welfare Branch, and is designed to make better provision with respect to the maintenance, care, and control of children who are specially under the protection of the State, and to provide generally for the protection and training of indigent, neglected, or delinquent children.
An important section of the Act provides for the establishment of Children's Courts, to be presided over by Stipendiary Magistrates or Justices specially authorized to exercise jurisdiction in these Courts. Provision is made for the appointment of honorary associates of either sex, whose function it will be to consider all the facts concerning children brought before the Courts and to advise the presiding Magistrate or Justice as to what action should be taken. The appointment of Child Welfare Officers for the investigation of all cases coming before the Courts has also been provided for. The functions of such officers will be carried out mainly by the regular officers already employed by the Department, but in outlying districts it is hoped to utilize the services of voluntary social service agents for this important work.
The principle of dealing with children in the privacy of the Magistrate's room has been followed for many years past throughout the Dominion, and the Child Welfare Act was designed to give legality to such a practice. In addition, the Act gives very wide discretionary powers to the Magistrates of these special Courts in dealing with children. The ordinary procedure of requiring the child to plead, of taking evidence on oath, and, in fact, of hearing the particular charge may be dispensed with altogether. Wherever practicable the Children's Court is to be held in premises apart from the ordinary Police Court, and no newspaper is permitted to publish either the names of children appearing before these Courts or any particulars that are likely to identify a child.
Another important provision contained in the Act authorizes the Children's Court to exercise jurisdiction over any person under eighteen years of age charged with any offence. Such case would be referred, of course, by a Stipendiary Magistrate or a Judge of the Supreme Court.
In order to provide for the greater protection of infants of unmarried mothers and for the assistance and guidance of the mothers themselves, there is provision for Child Welfare Officers, on being notified of such births, to investigate each case and to render such assistance as is required, either in placing the child in a suitable foster-home or in advising the mother in the matter of affiliation proceedings, or in assisting her in obtaining employment, &c.
In addition to the work in connection with the maintenance and education of destitute, neglected, and delinquent children committed by the Courts, the Child Welfare Branch (I) supervises all infants and young children under the age of six years who are living apart from their parents; (2) makes inquiry through its field officers, for the information of Magistrates, of all applications for the adoption of children and for widows' pensions; (3) supervises all children and young persons placed under the field officers by order of the Court; and (4) provides for the maintenance, education, and training of all afflicted children who are deaf, blind, or feeble-minded, or have speech-defects.
The following figures indicate the numbers under control during each year from 1921 to 1925 inclusive:—
| 1921. | 1922. | 1923. | 1924. | 1925. | |
|---|---|---|---|---|---|
| Boarded out, industrial schools, and receiving-homes | 3,830 | 3,798 | 3,692 | 3,7,84 | 3,859 |
| Juvenile probation | 272 | 277 | 227 | 376 | 323 |
| Infant-life protection | 706 | 742 | 684 | 704 | 771 |
| Deaf children | 148 | 135 | 106 | 97 | 116 |
| Feeble-minded children | 201 | 230 | 216 | 233 | 283 |
| Totals | 5,157 | 5,182 | 4,925 | 5,194 | 5,352 |
The Child Welfare Act authorizes Children's Courts to place children under the supervision of Child Welfare Officers in cases where it appears undesirable or unnecessary to remove them from their own homes, and generally in all cases where friendly contact with the parents as well as the children is sufficient to bring about a readjustment of the home conditions or the correction of incipient anti-social traits in the children. In this important work the Department has had valuable assistance from certain of the private social service organizations, notably the Y.M.C.A. through its Big Brother movement commenced in Auckland a few years ago, and now extended to most of the centres of population throughout the Dominion.
The number of cases dealt with by the Courts last year was 1,316, and of these 323 were placed under supervision and dealt with as indicated in the foregoing paragraph.
The number actually admitted to institutions, such as receiving homes, special schools training-farms, &c., was 423, but all these, with the exception of 85 who required long periods of training or were regarded as unfit for placing-out, were suitably provided for in the community before the close of the year. The remainder of the children were dealt with in a summary manner not calling for supervision by a Child Welfare Officer.
At the end of the year 1925 the number of children boarded out in foster-homes was 1,819, as compared with 1,767 at the end of the preceding year. On account of the increased cost of living, the boarding-out rate has been raised at various times, and in April, 1920, was increased from 15s. to 17s. 6d. per week for infants under twelve months, and from 12s. 6d. to 15s. for children over that age still attending school. The Department provides free medical and dental treatment and medicines, also school books and stationery.
The Boys' Training Farm at Weraroa provides for boys of all ages who require a period of reformative detention in an institution.
An institution at Otekaike is available for the education of feeble-minded boys. Older lads, under capable supervision, are employed in farm-work, garden and orchard work, and in the bootmaking, basketmaking, matmaking, and carpentering shops. Girls are provided for at the Special School at Richmond, and employed in house-work and laundry-work, in the workroom sewing, knitting, &c., and in outside occupations, such as gardening and flower-growing.
This work is carried out under the supervision of trained nurses who are fully qualified in the care and feeding of infants and young children. A great many infants dealt with under this system are illegitimate.
A residential school at Sumner exists for the teaching of deaf children and special classes are established in the main centres for the education of the hard-of-hearing children and for the correction of defective speech among children. Classes are also conducted for adults.
Control of higher education in New Zealand is vested in the New Zealand University, founded by the New Zealand University Acts of 1870, 1874, and 1875. In 1876 the University was recognized by Royal charter as entitled to grant the degrees of Bachelor and Master of Arts, and Bachelor and Doctor of Laws, of Medicine, and of Music. The Amendment Act of 1883, and the supplementary charter issued in December of the same year, added the degrees of Bachelor and Doctor of Science. Further additions have been made from time to time, and the Council of the University now has power to confer the following degrees:—
| Bachelor and Master of Agricultural Science. |
|---|
| Bachelor and Master of Architectural Science. |
| Bachelor and Master of Forestry Science. |
| Bachelor and Master of Home Science. |
| Bachelor and Master of Medical Science. |
| Bachelor and Master of Veterinary Science. |
| Bachelor and Master of Arts. |
| Bachelor and Master of Commerce. |
| Bachelor and Master of Engineering. |
| Bachelor and Master of Surgery. |
| Doctor of Literature. |
| Doctor of Philosophy. |
| Bachelor and Doctor of Dental Surgery. |
| Bachelor and Doctor of Medicine. |
| Bachelor and Doctor of Music. |
| Bachelor, Master, and Doctor of Laws. |
| Bachelor, Master, and Doctor of Science. |
The Council also has power to confer diplomas in public health and education, also such other diplomas as may be provided for in any statute made by the Council pursuant to law. The University was formerly an examining, not a teaching, body, with four teaching institutions affiliated to it—the Auckland University College, founded in 1882; Victoria University College, founded in 1897 at Wellington; Canterbury University College, founded in 1873 at Christchurch; and Otago University, founded in 1869 at Dunedin. By the New Zealand University Amendment Act, 1926, the constitution of the University has been altered, so that it now actually consists of the four University Colleges. Each of the colleges, besides providing the usual University courses, specializes in certain directions: Otago University has medical and dental schools, a school of mining and metallurgical engineering, and a school of home science; Canterbury University College has a school of engineering (mechanical, electrical, and civil); Auckland University College has a school of mines and a school of commerce; and Victoria University College specializes in law and science.
The constituent colleges receive annual statutory Government grants towards meeting the expenses of their general maintenance. These grants are now as follows: Auckland University College, £10,600; Victoria University College, £10,600; Canterbury College, £3,600; Otago University, £8,200. The colleges are also in receipt of rents from endowments, Canterbury College and Otago University being the most richly endowed.
The growth of University education is seen from the annexed table. In 1925 there were 3,949 students actually in attendance at the four University colleges. Of these, 261 were graduates, 3,008 undergraduates, and 680 unmatriculated students. In addition there were 493 students attached to the various University colleges, but exempt from lectures. There were also 52 students taking an agricultural course of University grade at the Lincoln Agricultural College.
| STUDENTS ON BOOKS OF AFFILIATED COLLEGES, 1916 TO 1925. | |||||
|---|---|---|---|---|---|
| Year. | Attending Lectures. | Exempt Students. | Total. | ||
| Males. | Females. | Males. | Females. | ||
| 1916 | 1,092 | 798 | 64 | 31 | 1,985 |
| 1917 | 1,007 | 895 | 50 | 25 | 1,977 |
| 1918 | 1,122 | 1,018 | 59 | 27 | 2,226 |
| 1919 | 1,831 | 1,130 | 83 | 16 | 3,060 |
| 1920 | 2,327 | 1,345 | 122 | 28 | 3,822 |
| 1921 | 2,524 | 1,400 | 157 | 42 | 4,123 |
| 1922 | 2,591 | 1,092 | 231 | 44 | 3,958 |
| 1923 | 2,745 | 1,113 | 281 | 63 | 4,202 |
| 1924 | 2,723 | 1,085 | 348 | 80 | 4,236 |
| 1925 | 2,844 | 1,105 | 386 | 107 | 4,442 |
It will be noted that a very considerable increase has taken place in the total number of students over the decennium. A falling-off occurred in the war years, but this was almost exclusively due to the absence of male students on active service.
University Junior Scholarships are of the value of £20 per annum plus tuition fees, and are tenable for three years. In the case of holders living away from home a further sum of £30 per annum is allowed. The University National Scholarships are of equal monetary value. The number of junior and national scholarships gained in 1925 was thirty. Taranaki Scholarships are of the annual value of £60, and the Senate may, at its discretion, extend the tenure from three to four years. There are also some thirty or forty local and privately endowed scholarships awarded on the results of the same entrance examination.
Scholarships awarded during the degree course are the Senior University, Sir George Grey, and John Tinline Scholarships. The various colleges have also private scholarships for which their own students may compete. The chief scholarships awarded at the end of the University course are the Rhodes Scholarship, the 1851 Exhibition Scholarship, the Medical Travelling Scholarship, the Engineering Travelling Scholarship, the Post-graduate Travelling Scholarship, the French Travelling Scholarship, and the National Research Scholarships. All excepting the last-named are tenable abroad. The Research Scholarships are each of the value of £100 per annum, with laboratory fees and expenses.
So far twenty-six Rhodes Scholarships have been granted, of which seven have been gained by students of Auckland University College, seven by students of Otago University, six by students of Victoria University College, and six by students of Canterbury College.
University bursaries entitle the holders to the payment of tuition and examination fees (not exceeding £20 per annum) during a three (or possibly four) years' course at a University college or at a school of agriculture recognized by the University. The number of University bursaries held in 1925 was 804. The number of educational bursaries under the Education Act, 1914, held in 1925 was eighty-one. Domestic-science bursaries, tenable at the Otago University, may be awarded under the regulations for technical instruction. Bursaries of this kind were awarded to nineteen students in 1925, making thirty-nine bursars in attendance at classes. Training-college studentships also carry tuition at University classes, and the completion of a training-college course is one of the grounds on which an educational bursary may be awarded for further University study.
Agricultural bursaries may be awarded to qualified candidates in order to enable them to obtain the necessary practical training for positions as teachers or instructors of agriculture. During 1925 six bursars were in attendance at Lincoln Agricultural College, Canterbury, and six bursars were attending a University college.
From the table given below will be seen the number of students who received free University education during each of the last ten years:—
| Students receiving Free Higher Education, 1916 to 1925. | ||||||
|---|---|---|---|---|---|---|
| Year. | Junior University, University National, and Taranaki Scholarships. | Senior University Scholarships. | University and Educational Bursaries. | Training-college Studentships. | Other. | Total. |
| 1916 | 76 | 12 | 305 | 437 | 27 | 857 |
| 1917 | 81 | 13 | 283 | 456 | 40 | 873 |
| 1918 | 80 | 10 | 333 | 483 | 69 | 975 |
| 1919 | 100 | 19 | 507 | 586 | 136 | 1,348 |
| 1920 | 99 | 18 | 631 | 735 | 116 | 1,599 |
| 1921 | 99 | 13 | 705 | 774 | 65 | 1,656 |
| 1922 | 88 | 12 | 616 | 771 | 91 | 1,578 |
| 1923 | 89 | 14 | 694 | 650 | 64 | 1,511 |
| 1924 | 91 | 13 | 828 | 564 | 81 | 1,577 |
| 1925 | 90 | 13 | 885 | 574 | 106 | 1,668 |
The outstanding feature of the above table is the number of University and educational bursaries which are now awarded as compared with a period of ten years ago. This is due to a marked widening of the bursary regulations. The courses of an increasing number of secondary-school pupils are now continued to comply with the conditions under which bursaries may be awarded.
A Royal Commission, consisting of Sir H. R. Reichel, M.A., LL.D., K.B., and F. Tate, Esq., M.A., C.M.G., I.S.O., was appointed in April, 1925, to inquire into and report upon the question of university education in New Zealand. The order of reference covered the following subjects:—
The present facilities for university education in New Zealand.
The working of the present organization of the University of New Zealand, its affiliated colleges and recognized professional schools. (3.) The constitution of the University Senate, together with the question of whether special interests such as agriculture, industry, and commerce should be represented on the Senate.
The question of whether the present system of four colleges federated under the New Zealand University is satisfactory or is capable of improvement. In particular, whether each of the present four University colleges should become a separate University; and, if so, under what conditions.
The standard and scope of the degree and other examinations conducted by the University.
The question of whether University examinations should be conducted by internal or external examiners, or by a combination of both. (7.) The question of accrediting students for entrance to the University in lieu of the Matriculation Examination.
The relation of university education to that provided in secondary and technical schools.
The provision that should be made in New Zealand for university teaching and research.
Any other matters concerning higher education which the Commissioners would feel worthy of report to the Government.
The Commission commenced its inquiries in June, 1925, and visited each of the four University centres, taking evidence from members of the governing bodies of the New Zealand University and its affiliated colleges, University professors and teachers, University students, representatives of commerce and industry, and public men. The Commission furnished a comprehensive report containing much valuable information, and made numerous recommendations, among which may be mentioned those favouring the following:—
The reconstitution of the New Zealand University as a federal teaching University, with constituent colleges enjoying a large measure of autonomy in regard to curriculum and examinations.
The University to be governed by a University Council of twenty-one members, constituted differently to the present Senate.
The appointment of a Principal of the University, to be the academic head of the University.
The formation of an Academic Board of twenty professors of the University to advise the Council on all academic matters, and to have such administrative duties in regard to academic matters as the Council may from time to time delegate to it.
Representation of special interests—e.g., agriculture, industry, commerce—on the Councils of the constituent colleges.
The formation of a Professorial Board in each constituent college, with duties in regard to the college similar to those of the suggested Academic Board in regard to the University.
The formation of the senior teaching staff of the constituent colleges into faculties, each faculty having the right to submit for approval courses of study in subjects prescribed for degrees or diplomas.
The raising of the standard of the B.A. and B.Sc. degrees, and the strengthening of the courses for solicitors and barristers.
Efforts in the direction of reducing the number of students who devote only part time to University study or who have exemption from attending lectures.
The abolition of the present Matriculation Examination, and the substitution for it of an “intermediate examination” and a “school leaving examination.”
The appointment of a Secondary-schools Board to advise the University Council on all matters relating to the two examinations mentioned, and to have such administrative duties in regard to them as might from time to time be delegated to it.
The appointment of a Technical-schools Board to advise the Education Department in matters relating to courses of technical study and to examinations.
The acceptance of extra-mural work as an essential part of the normal work of the University.
The empowering of the University to grant degrees in Divinity, with the proviso that the colleges should not undertake the teaching of the theological subjects included in the degree.
In addition, special recommendations were made with regard to the training of teachers, and the question of university education in agriculture, law, engineering, and special subjects, also in regard to research work.
Certain of the recommendations, notably those relating to the constitution of the University and of the University Council, and the formation of an Academic Board, were given effect to, wholly or in part, by the New Zealand University Amendment Act, 1926.
The Workers' Educational Association, which works in conjunction with the four University colleges, conducts tutorial and preliminary classes for working men and women in such subjects as economics, sociology, psychology, industrial history, English literature, English composition, modern history, electricity, and hygiene, &c. Members of the staffs of the University colleges and other educationists act as tutors of the classes. The classes are held for the most part in the large cities, although to an increasing extent classes are being arranged in the smaller towns. The Government in 1925 contributed directly £3,500 per annum to the movement, in addition to which £1,250 paid by the Government out of the National Endowment Fund to the University of New Zealand is devoted to the same object, making a total of £4,750. Voluntary contributions received by the University colleges on account of the association's classes are also subsidized by the Government.
Examinations are conducted by the Education Department for the various purposes of Junior and Senior National Scholarships, of junior and senior free places in secondary schools, district high schools, and technical schools, and of teachers' certificates. Also, by arrangement with the Public Service Commissioner, examinations are held for admission to and promotion in the Public Service.
The number of candidates who actually presented themselves for the various examinations conducted by the Education Department during the last five years is given below:—
| Examination. | 1921-22. | 1922-23. | 1928-24. | 1924-25. | 1925-26. |
|---|---|---|---|---|---|
| Junior National Scholarships and junior free places | 2,500 | 2,564 | 2,481 | 2,687 | |
| Public Service Entrance, Senior National Scholarships, and Intermediate | 3,419 | 3,544 | 4,222 | 5,192 | 5,097 |
| Teachers' D and C | 2,921 | 3,227 | 3,319 | 3,353 | 3,393 |
| Public Service Senior | 28 | .. | .. | .. | .. |
| Kindergarten Certificate Examination | 2 | 5 | 6 | 3 | 3 |
| Special Public Service Entrance Examination in June | 248 | .. | .. | 162 | 121 |
| London University Examinations | 2 | .. | 1 | 1 | 2 |
| Qualifying Examination, Railway Engineering Cadets | .. | 9 | 4 | 1 | .. |
| Handicraft Teachers' Certificate | .. | .. | .. | 14 | |
| Totals | 8,902 | 9,285 | 10,116 | 11,193 | 11,317 |
The University conducted examinations in 1925 in the faculties of arts, science, medicine, public health, dentistry, home science, law, engineering, commerce, agriculture, and music, and for admission to the legal and accountants' professions. The number of candidates for examination is increasing each year; there were 5,972 entrants for the degree examinations in 1925, compared with 5,740 in 1924. The number of candidates for matriculation in the last five years has been: 1921, 3,643; 1922, 4,143; 1923, 4,517; 1924, 4,932; 1925, 5,338.
Expenditure on education has increased rapidly of recent years, and out of public funds no less a sum than £3,814,434 was spent for the financial year ended 31st March, 1926. The public funds referred to above, however, include not only the amount appropriated by parliamentary vote, but also sums paid from primary-education reserves revenue. Nor does this represent the whole amount expended on education in the Dominion. In the case of certain secondary schools and University colleges a considerable revenue from endowments, fees, &c., is received and becomes available for educational purposes. The figures given below relate only to direct expenditure on education from the public purse. Figures for the last five years, analysed according to the various branches of expenditure, are—
| SUMMARY OF EDUCATION EXPENDITURE FOR FINANCIAL YEARS ENDED 31ST MARCH, 1922 TO 1926. | |||||
|---|---|---|---|---|---|
| Service. | 1921–22. | 1922–23. | 1923–24. | 1921–25. | 1925–26. |
| £ | £ | £ | £ | £ | |
| General administration | 38,620 | 34,629 | 33,760 | 34,522 | 37,328 |
| Elementary education | 2,377,797 | 2,165,200 | 2,255,392 | 2,432,880 | 2,486,374 |
| Secondary education | 310,878 | 272,907 | 280,541 | 363,836 | 407,915 |
| Technical instruction | 244,627 | 207,628 | 177,501 | 194,494 | 209,183 |
| Training colleges, &c. | 158,158 | 158,473 | 160,420 | 204,869 | 203,860 |
| Higher education | 117,434 | 128,974 | 121,661 | 149,429 | 183,434 |
| Native schools | 77,603 | 69,631 | 72,495 | 72,490 | 79,382 |
| School for the deaf | 6,036 | 6,423 | 5,755 | 5,629 | 5,936 |
| Education of the blind | 101 | 88 | 45 | 15,128 | 10,177 |
| Schools for the feeble-minded | 11,190 | 8,261 | 7,933 | 8,886 | 12,363 |
| Industrial schools and probation system | 108,622 | 93,914 | 84,770 | 85,247 | 87,387 |
| Material and stores | Cr. 4,345 | Or. 10,785 | Cr. 4,242 | Cr. 5,759 | Cr. 1,451 |
| Miscellaneous services | 50,852 | 51,949 | 51,099 | 81,132 | 92,546 |
| Totals | 3,497,373 | 3,187,292 | 3,247,130 | 3,642,783 | 3,814,434 |
There is now given a series of comparative figures which show the increase in the cost of education since the beginning of the present century. The table following shows the expenditure in thousands of pounds, and the rate per unit of mean population:—
| COST OF EDUCATION, 1898-99 TO 1925-26. | |||
|---|---|---|---|
| Year ended 31st March | Expenditure from Public Funds. | Expenditure per Head of Mean Population. | |
| (£1,000) | s. | d. | |
| 1899 | 519 | 13 | 4 |
| 1904 | 679 | 15 | 7 |
| 1909 | 980 | 19 | 7 |
| 1914 | 1,301 | 23 | 1 |
| 1915 | 1,378 | 24 | 1 |
| 1916 | 1,493 | 25 | 11 |
| 1917 | 1,694 | 29 | 6 |
| 1918 | 1,809 | 31 | 5 |
| 1919 | 1,986 | 34 | 1 |
| 1920 | 2,544 | 42 | 2 |
| 1921 | 3,224 | 51 | 6 |
| 1922 | 3,497 | 54 | 5 |
| 1923 | 3,187 | 48 | 7 |
| 1924 | 3,247 | 48 | 8 |
| 1925 | 3,643 | 53 | 7 |
| 1926 | 3,814 | 54 | 10 |
The exceptionally marked increase of recent years in the total cost of education is in a large measure due to the increase in the numbers receiving instruction, this being particularly marked in the case of post-primary schools. In the last decade the school population has increased by 22 per cent. Combined with this factor, rendering increased expenditure inevitable, the purchasing-power of money has, of course, decreased enormously, so that much of the increase in cost is more apparent than real.
Table of Contents
THE ordinary civil jurisdiction of Magistrates' Courts is limited generally to claims not exceeding £200. Justices of the Peace may hear and decide certain civil cases when the sum in dispute does not exceed £20. The numbers of plaints entered and of cases tried, and the amounts sued for and for which judgment was recorded, in the lower Courts during the ten years 1916-25 are shown in the following table:—
| Year. | Plaints entered. | Cases tried. | |||
|---|---|---|---|---|---|
| Number. | Total Amount claimed. | Number. | Total Amount sued for. | Total Amount for which Judgment entered. | |
| £ | £ | £ | |||
| 1916 | 49,806 | 639,922 | 31,064 | 395,779 | 339,847 |
| 1917 | 46,004 | 624,693 | 29,412 | 401,568 | 340,958 |
| 1918 | 39,176 | 563,358 | 25,594 | 378,025 | 308,429 |
| 1919 | 38,775 | 619,576 | 24,680 | 385,020 | 319,135 |
| 1920 | 46,601 | 787,524 | 28,999 | 467,665 | 399,219 |
| 1921 | 59,339 | 1,169,286 | 39,013 | 762,605 | 654,863 |
| 1922 | 65,629 | 1,279,890 | 44,296 | 936,673 | 786,373 |
| 1923 | 66,659 | 1,236,160 | 45,837 | 857,903 | 717,516 |
| 1924 | 74,435 | 1,255,754 | 50,778 | 879,945 | 737,045 |
| 1925 | 73,192 | 1,172,167 | 48,436 | 821,093 | 666,721 |
It would appear that the practice of using the Courts as media for the collection of small debts is growing. For instance, the number of cases tried in Magistrates' Courts in 1900 was 19,816, the aggregate sum sued for being £286,719. Although the population of the Dominion increased between 1900 and 1913 by little more than 40 per cent., the number of cases tried in 1913 (39,965) represents an increase of over 100 per cent. in the thirteen years. From 1914 to 1919 successive declines, probably occasioned by war causes,- were recorded; in 1920 increases are shown, both in the number of cases tried and the amounts concerned; while the figures for each of the years 1921-1925 show an abnormally large increase in litigation by comparison with any year prior to 1921.
The numbers of actions commenced, cases tried, and judgments entered, together with the total amount for which judgments were recorded, in the Supreme Court of New Zealand during each of the ten years 1916-25 were as follows:—
| SUPREME COURT: CIVIL JURISDICTION. | |||||
|---|---|---|---|---|---|
| Year. | Number of Actions commenced. | Cases tried. | Judgments recorded. | ||
| With Jury. | Without Jury. | Number. | Amount.£ | ||
| 1916 | 673 | 48 | 193 | 254 | 78,877 |
| 1917 | 581 | 70 | 172 | 234 | 100,447 |
| 1918 | 611 | 47 | 188 | 226 | 104,927 |
| 1919 | 783 | 72 | 227 | 238 | 88,144 |
| 1920 | 915 | 91 | 329 | 262 | 96,017 |
| 1921 | 1,536 | 126 | 334 | 557 | 244,942 |
| 1922 | 1,431 | 115 | 408 | 748 | 316,533 |
| 1923 | 1,172 | 92 | 320 | 654 | 300,698 |
| 1924 | 1,780 | 93 | 429 | 853 | 358,880 |
| 1925 | 1,724 | 60 | 407 | 776 | 303,319 |
The provisions as to dissolution of marriage are contained in the Divorce and Matrimonial Causes Act, 1908, and its amendments.
Divorce was first made the subject of judicial proceedings by the Divorce and Matrimonial Causes Act, 1867—substantially a paraphrase of the English Act of 1857 and its earlier amendments. Prior to that date a divorce was a subject with which it was competent for the Legislature to deal by means of ad hoc legislation; but it does not appear that this was ever done.
By section 17 of the 1867 Act adultery on the part of the wife was the only ground for a husband's petition for divorce, whilst the grounds for a petition on the part of the wife were the cases of aggravated adultery and adultery coupled with cruelty or with desertion, which now appear in section 22 of the Divorce and Matrimonial Causes Act, 1908.
The first divergence from the English law was the Divorce Act, 1898, which repealed section 17 of the 1867 Act. The grounds then introduced instituted an equality between the sexes, and comprised—
Adultery.
Wilful desertion for five years (amended in 1919 to three years).
Habitual drunkenness for four years coupled (in case of wife's petition) with cruelty to or failure to support the wife, or coupled (in case of husband's petition) with neglect of and unfitness to discharge domestic duties.
Sentence of seven years' imprisonment for attempting to take the life of the petitioner or a child of petitioner or respondent (altered in 1920 to attempting to murder or wounding or doing actual bodily harm to the petitioner or a child).
A further ground of divorce was also created by section 17 of the 1898 Act, enacting that failure to comply with a decree for the restitution of conjugal rights should be deemed desertion without reasonable cause, and should enable the institution of a suit for dissolution of marriage on the ground of desertion. Inasmuch as decrees for restitution of conjugal rights were sometimes obtained by applicants who did not genuinely desire such restitution, but merely with the intent that the decree should be disobeyed and should become the foundation of a suit for dissolution, this ground became in effect a means of obtaining a consensual divorce without the existence of any matrimonial offence in the stricter sense. Such a condition being regarded as contrary to the views relating to divorce then held by the Legislature, this ground of divorce was repealed by the Divorce and Matrimonial Causes Act Amendment Act, 1907, accrued rights being protected. It was afterwards thought desirable to restore it by section 3 of the Divorce and Matrimonial Causes Amendment Act, 1920.
In 1907 the following further grounds were introduced:—
M urder of a child of petitioner or respondent.
Insanity and confinement as a lunatic for ten out of twelve years preceding the petition.
Section 6 of the Divorce and Matrimonial Causes Amendment Act, 1913, introduced the principle of “constructive desertion” on the part of a husband, which had already to some extent been recognized by judicial decisions.
Section 3 of the Divorce and Matrimonial Causes Amendment Act, 1919, made special provision facilitating the divorce of women, being natural-born British subjects, from husbands of enemy origin absent from New Zealand.
The Divorce and Matrimonial Causes Amendment Act, 1920, introduced the important new principle of a consensual divorce, separation for not less than three years under (a) a decree of judicial separation, (b) a summary separation order, (c) a deed or agreement of separation, or (d) separation by mutual consent, being a ground for dissolution of marriage.
The period of unsoundness of mind necessary as a ground of divorce was reduced to seven years, subject to certain limitations.
By the Divorce and Matrimonial Causes Amendment Act, 1921-22, the power of granting a divorce consequent upon a separation was taken away where the petition is opposed by the respondent and the Court is satisfied that the separation was due to the wrongful act or conduct of the petitioner.
During the year 1925, 723 petitions for dissolution of marriage (including 5 for nullity) were filed. This number was 45 less than in 1924, and has been exceeded on three occasions—viz., in 1921 (796), 1924 (768), and 1920 (748).
In 424 of the eases in 1925 decrees nisi were granted, 200 of these being made absolute during the year. In addition, decrees nisi were granted in respect of 181 petitions filed in previous years, 137 of these being made absolute before the end of the year, and 275 decrees nisi of previous years became absolute. The total number of decrees nisi for the year 1925 was thus 605, which includes 3 decrees for nullity of marriage.
In addition, 12 petitions for judicial separation and 73 for restitution of conjugal rights were filed. Four decrees were granted in the former class, and 59 in the latter.
Figures showing the operations of the Supreme Court in its divorce jurisdiction during each of the last ten years are as follows:—
| Year. | Dissolution or Nullity of Marriage. | Judicial Separation. | Restitution of Conjugal Rights. | ||||
|---|---|---|---|---|---|---|---|
| Petitions filed. | Decrees Absolute. | Decrees Nisi. | Petitions filed. | Decrees for Separation. | Petitions filed. | Decrees for Restituton. | |
| 1916 | 289 | 198 | 247 | 4 | .. | .. | .. |
| 1917 | 282 | 219 | 221 | 5 | 2 | .. | .. |
| 1918 | 380 | 199 | 279 | 4 | 4 | 2 | .. |
| 1919 | 675 | 336 | 479 | 5 | 1 | 2 | .. |
| 1920 | 748 | 469 | 574 | 9 | 2 | 4 | .. |
| 1921 | 796 | 511 | 660 | 5 | 2 | 68 | 43 |
| 1922 | 643 | 522 | 543 | 4 | 1 | 88 | 57 |
| 1923 | 666 | 522 | 603 | 5 | 2 | 77 | 56 |
| 1924 | 768 | 526 | 651 | 11 | 4 | 94 | 65 |
| 1925 | 723 | 612 | 605 | 12 | 4 | 73 | 59 |
The number of decrees nisi during 1925 (605) has been exceeded on two occasions, the greatest number recorded in a single year being 660 in 1921, followed by 651 in 1924. The number of decrees absolute (612) is, however, 86 in excess of the total for 1924, which held the record previously, and is further unique in that it outnumbers the decrees nisi for the year. It would appear from the following table that a greater proportion than usual of cases left over from previous years was disposed of or advanced a stage further during 1925:—
| — | 1921. | 1922. | 1923. | 1924. | 1925. |
|---|---|---|---|---|---|
| Petitions filed during year | 796 | 643 | 666 | 768 | 723 |
| Decrees on petitions filed during year— | |||||
| Absolute | 200 | 149 | 183 | 199 | 200 |
| Nisi, not made absolute during year | 286 | 237 | 229 | 283 | 224 |
| Decrees on petitions filed in previous years— | |||||
| Absolute, following on nisi in previous years | 196 | 262 | 222 | 211 | 275 |
| Absolute, following on nisi during year | 115 | 111 | 117 | 116 | 137 |
| Nisi, not made absolute during year | 59 | 46 | 74 | 53 | 44 |
| Total decrees during year— | |||||
| Absolute | 511 | 522 | 522 | 526 | 612 |
| Nisi | 660 | 543 | 603 | 651 | 605 |
| Petitions dismissed or withdrawn— | |||||
| Filed during year | 21 | 6 | 12 | 14 | 14 |
| Filed in previous years | 13 | 14 | 5 | 6 | 10 |
| Petitions, filed during year, not heard | 289 | 251 | 242 | 274 | 285 |
The table which follows shows the duration of marriage in all cases for which petitions for dissolution were filed in the last five years:—
| Duration of Marriage, in Years. | Husbands' Petitions. | Wives' Petitions. | ||||||||
|---|---|---|---|---|---|---|---|---|---|---|
| 1921. | 1922. | 1923. | 1924. | 1925. | 1921. | 1922. | 1923. | 1924. | 1925. | |
| Under 5 | 41 | 53 | 60 | 42 | 59 | 35 | 37 | 50 | 41 | 45 |
| 5 and under 10 | 93 | 66 | 93 | 97 | 95 | 119 | 92 | 102 | 104 | 107 |
| 10 ,, 15 | 83 | 71 | 68 | 62 | 80 | 101 | 80 | 97 | 108 | 97 |
| 15 ,, 20 | 57 | 50 | 38 | 49 | 48 | 56 | 57 | 39 | 80 | 61 |
| 20 ,, 30 | 81 | 35 | 37 | 72 | 41 | 67 | 72 | 52 | 71 | 65 |
| 30 and over | 44 | 19 | 16 | 21 | 13 | 16 | 9 | 13 | 21 | 12 |
| Not stated | 2 | .. | .. | .. | .. | 1 | 2 | 1 | .. | .. |
| Totals | 401 | 294 | 312 | 343 | 336 | 395 | 349 | 354 | 425 | 387 |
A table is also given showing for the year 1925 the grounds of petitions, in combination with particulars as to the number of living issue.
| Grounds. | Number of Cases in which Number of Living Issue was | Total Number of Cases. | |||||||
|---|---|---|---|---|---|---|---|---|---|
| 0 | 1 | 2 | 3 | 4 | 5 | 6 | 7 or over. | ||
| Adultery | 48 | 36 | 41 | 22 | 8 | 5 | 4 | 4 | 168 |
| Adultery and desertion | 1 | .. | .. | .. | .. | .. | .. | .. | 1 |
| Bigamy | 2 | 1 | .. | .. | .. | .. | .. | .. | 3 |
| Cruelty | .. | 1 | .. | .. | .. | .. | .. | .. | 1 |
| Cruelty and desertion | 1 | .. | .. | .. | .. | .. | .. | .. | 1 |
| Desertion | 79 | 65 | 30 | 22 | 10 | 4 | 1 | 5 | 216 |
| Desertion and drunkenness | .. | .. | 1 | .. | .. | .. | .. | .. | 1 |
| Drunkenness | 1 | 4 | 1 | 2 | .. | .. | .. | .. | 8 |
| Drunkenness and cruelty | 3 | 4 | 1 | 1 | 2 | .. | 1 | .. | 12 |
| Drunkenness, cruelty, and failure to maintain | 1 | .. | 2 | .. | .. | .. | .. | .. | 3 |
| Drunkenness and failure to maintain | 1 | 1 | 1 | .. | .. | .. | .. | .. | 3 |
| Failure to maintain | .. | 2 | .. | .. | .. | .. | .. | .. | 2 |
| Insanity | 1 | 1 | 2 | 3 | 3 | 1 | .. | .. | 11 |
| Malformation | 2 | .. | .. | .. | .. | .. | .. | .. | 2 |
| Non-compliance with order for restitution of conjugal rights | 25 | 1 | 8 | 5 | 2 | .. | .. | 1 | 54 |
| Separation for not less than three years | 71 | 56 | 49 | 29 | 16 | 11 | 1 | 2 | 235 |
| Separation and desertion | .. | .. | .. | 1 | .. | .. | .. | .. | 1 |
| Unnatural offence | .. | 1 | .. | .. | .. | .. | .. | .. | 1 |
| Totals | 236 | 185 | 136 | 85 | 41 | 21 | 7 | 12 | 723 |
In four cases the number of living issue was 7, in three cases 8, in two cases 9, in one case 10, and in two cases 11.
The above table refers to cases where the petition was filed during the year. Information is next given showing the sex of petitioner and the number of living issue regarding petitions (whether filed during 1925 or previously) in respect of which decrees absolute were granted during the year.
| Number of Living Issue. | Husbands' Petitions. | Wives' Petitions. | Total. |
|---|---|---|---|
| 0 | 103 | 87 | 190 |
| 1 | 57 | 92 | 149 |
| 2 | 64 | 62 | 126 |
| 3 | 19 | 43 | 62 |
| 4 | 20 | 20 | 40 |
| 5 or over | 12 | 33 | 45 |
| Totals | 275 | 337 | 612 |
The next table given information as to grounds of petition not only in respect of petitions filed during 1925, but also for petitions where decrees were granted during the year:—
| Grounds. | Petitions filed in 1925. | Petitions where Decree Nisi granted in 1925. | Petitions where Decree Absolute granted in 1925. | |||
|---|---|---|---|---|---|---|
| Husbands' Petitions. | Wives' Petitions. | Husbands' Petitions. | Wives' Petitions. | Husbands' Petitions. | Wives' Petitions. | |
| Adultery | 108 | 60 | 80 | 48 | 87 | 57 |
| Adultery and desertion | 1 | .. | 4 | 2 | 3 | 4 |
| Bigamy | 1 | 2 | 2 | .. | 2 | 1 |
| Cruelty | .. | 1 | .. | 1 | .. | |
| Cruelty and desertion | .. | 1 | .. | 1 | .. | 2 |
| Desertion | 80 | 136 | 71 | 115 | 74 | 120 |
| Desertion and drunkenness | .. | 1 | .. | 1 | .. | 3 |
| Drunkenness | .. | 8 | 1 | 9 | 1 | 1 |
| Drunkenness and cruelty | .. | 12 | .. | 9 | .. | 4 |
| Drunkenness, cruelty, and failure to maintain | .. | 3 | .. | .. | .. | .. |
| Drunkenness and failure to maintain | .. | 3 | .. | 3 | .. | 6 |
| Failure to maintain | .. | 2 | .. | 1 | .. | .. |
| Insanity | 9 | 2 | 9 | 2 | 10 | 2 |
| Malformation | 1 | 1 | 1 | .. | 1 | .. |
| Non-compliance with order for restitution of conjugal rights | 42 | 12 | 27 | 13 | 16 | 11 |
| Separation for not less than three years | 94 | 141 | 72 | 130 | 81 | 125 |
| Separation and desertion | .. | 1 | .. | 2 | .. | .. |
| Unnatural offence | .. | 1 | .. | 1 | .. | 1 |
| Totals | 336 | 387 | 267 | 338 | 275 | 337 |
The figures shown for decrees nisi include cases where both nisi and absolute decrees were granted during the year, and those for decrees absolute cover all such granted during the year, whether the antecedent decree nisi was granted in 1925 or in a previous year.
In 630 of the cases covered by petitions filed during 1925 the parties were married in New Zealand. In 488 cases the marriage had been solemnized by a clergyman, and in 235 cases (32.50 per cent.) by a Registrar of Marriages or other civil official. Civil marriages constituted 20.69 per cent. of those solemnized in New Zealand in 1925.
The following table gives information as to class and place of marriage in respect of divorce petitions filed in each of the last ten years:—
| Year. | Husbands' Petitions. | Wives' Petitions. | Totals. | ||||||
|---|---|---|---|---|---|---|---|---|---|
| Married by a Clergyman. | Married before a Registrar or other Civil Official. | Married by a Clergyman | Married before a Registrar or other civil Official. | ||||||
| In New Zealand. | Outside New Zealand. | In New Zealand. | Outside New Zetland. | In New Zealand. | Outside New Zealand. | In New Zealand. | Outside New Zealand. | ||
* Including one petition (by wife) for which no particulars available. | |||||||||
| 1916 | 77 | 15 | 37 | 6 | 107 | 11 | 32 | 4 | 289 |
| 1917 | 71 | 9 | 42 | 3 | 107 | 14 | 34 | 2 | 282 |
| 1918 | 89 | 13 | 77 | 6 | 116 | 13 | 62 | 4 | 380 |
| 1919 | 175 | 29 | 109 | 13 | 222 | 19 | 101 | 7 | 675 |
| 1920 | 193 | 30 | 94 | 12 | 268 | 35 | 108 | 8 | 748 |
| 1921 | 242 | 50 | 103 | 6 | 249 | 23 | 118 | 5 | 796 |
| 1922 | 173 | 43 | 63 | 15 | 215 | 27 | 100 | 7 | 643 |
| 1923 | 179 | 36 | 88 | 9 | 200 | 35 | 112 | 6 | 666* |
| 1924 | 208 | 54 | 71 | 10 | 267 | 34 | 113 | 11 | 768 |
| 1925 | 178 | 42 | 103 | 13 | 238 | 30 | 111 | 8 | 723 |
The number of bodies on which inquests were held in 1925 was 1,382, including 61 Maoris. In 1,031 cases the bodies were of males, and in 351 of females.
The verdicts given at the inquests held in 1925 may be classified as under:—
| Nature of Verdict. | Inquests on Persons. | ||
|---|---|---|---|
| Males. | Females. | Total. | |
| Disease and natural causes | 415 | 204 | 619 |
| Accident | 470 | 108 | 578 |
| Homicide | 6 | 6 | 12 |
| Suicide | 140 | 33 | 173 |
| Totals | 1,031 | 351 | 1,382 |
Of the accidental deaths the most common forms are crushing and drowning. The verdicts show that in 1925 212 deaths, or 37 per cent. of the total fatal accidents, were due to the former cause, while to the latter 131 deaths, or 23 per cent., were due.
The inquests on suicidal deaths in 1925 show an increase of 7 on the number for the previous year. The figures for each of the last ten years are—
| Year. | Inquests on Suicides. | ||
|---|---|---|---|
| Males. | Females. | Total. | |
| 1916 | 122 | 28 | 150 |
| 1917 | 104 | 30 | 134 |
| 1918 | 99 | 22 | 121 |
| 1919 | 112 | 30 | 142 |
| 1920 | 113 | 20 | 133 |
| 1921 | 133 | 33 | 166 |
| 1922 | 131 | 33 | 164 |
| 1923 | 123 | 20 | 143 |
| 1924 | 133 | 33 | 166 |
| 1925 | 140 | 33 | 173 |
In case of fire causing the destruction of any building, ship, or merchandise, or any stack of grain, pulse, or hay, or any growing crop, a Coroner may hold an inquiry into the cause of such fire, the procedure being similar to that of inquests into cause of death.
During 1925 three inquests were held on fires. In one case the verdict was arson, in another the cause was returned as accidental, and in the remaining case there was insufficient evidence.
The figures for each of the last five years are—
| Year. | Number of Fire Inquests. | Verdicts returned. | ||
|---|---|---|---|---|
| Accidental. | Arson. | No Evidence. | ||
| 1921 | 5 | 1 | 4 | |
| 1922 | 4 | .. | 1 | 3 |
| 1923 | 10 | 2 | 3 | 5 |
| 1924 | 11 | 3 | 3 | 5 |
| 1925 | 3 | 1 | 1 | 1 |
On the 31st March, 1926, the number of permanent members of the Police Force in New Zealand was 1,070 of all ranks, being an increase of 64 during the year. The total is made up as follows: 7 superintendents, 13 inspectors, 4 sub-inspectors, 29 senior sergeants, 92 sergeants, 873 constables, 7 senior detectives, 7 detective-sergeants, and 38 detectives. There were also 15 temporary constables, 12 police surgeons, 8 matrons. 6 district constables, and 4 Native constables.
The following table shows the number of stations and of police in each police district. Temporary constables are included, but not district or Native constables.
| Police District. | No. of Stations. | No. of Police. |
|---|---|---|
| Whangarei | 17 | 30 |
| Auckland | 37 | 201 |
| Hamilton | 31 | 72 |
| Gisborne | 15 | 32 |
| Napier | 19 | 50 |
| New Plymouth | 15 | 34 |
| Wanganui | 20 | 42 |
| Palmerston North | 17 | 43 |
| Wellington | 35 | 189 |
| Greymouth | 22 | 44 |
| Christchurch | 36 | 126 |
| Timaru | 13 | 41 |
| Dunedin | 35 | 123 |
| Invercargill | 23 | 47 |
There were also 8 officers attached to headquarters, 1 was on loan to the Cook Islands Administration, and 2 were on leave prior to retirement.
The proportion of police to population is 1 to every 1,299 persons, and the expenditure (exclusive of the cost of buildings) on the whole Police Force for the year ended the 31st March, 1926, was 5s. 9 ½d. per head of population.
The following table shows the growth of the Police Force since 1878, prior to which each province had its own Police Force, and reliable data are not available:—
| Year ended 31st March, | Officers. | Non-commissioned Officers. | Detectives. | Constables. | Total. | Police to Population (including Maoris). | Cost per Inhabitant. | |
|---|---|---|---|---|---|---|---|---|
| s. | d. | |||||||
| 1878 | 25 | 90 | 14 | 329 | 458 | 1 to 1,020 | .. | |
| 1885 | 20 | 65 | 17 | 372 | 474 | 1 to 1,295 | 3 | 0 ¾ |
| 1890 | 12 | 66 | 13 | 403 | 494 | 1 to 1,337 | 2 | 10 ¾ |
| 1895 | 7 | 51 | 13 | 416 | 487 | 1 to 1,502 | 2 | 6 ¾ |
| 1900 | 11 | 56 | 20 | 499 | 586 | 1 to 1,363 | 2 | 0 ¼ |
| 1905 | 12 | 65 | 25 | 553 | 655 | 1 to 1,386 | 2 | 10 ¼ |
| 1910 | 16 | 86 | 34 | 639 | 775 | 1 to 1,336 | 3 | 3 ½ |
| 1915 | 19 | 100 | 37 | 755 | 911 | 1 to 1,263 | 4 | 1 |
| 1920 | 21 | 114 | 38 | 743 | 916 | 1 to 1,350 | 4 | 11 ¾ |
| 1922 | 22 | 118 | 43 | 826 | 1,009 | 1 to 1,289 | 6 | 3 ¾ |
| 1923 | 23 | 118 | 44 | 818 | 1,003 | 1 to 1,321 | 5 | 8 ¼ |
| 1924 | 23 | 120 | 47 | 837 | 1,027 | 1 to 1,312 | 5 | 8 5/4 |
| 1925 | 23 | 121 | 51 | 831 | 1,026 | 1 to 1,344 | 5 | 9 ½ |
| 1926 | 24 | 121 | 52 | 888 | 1,085 | 1 to 1,299 | 5 | 9 ½ |
The gross total of criminal cases in Magistrates' Courts during the year 1925 was 53,619, males being charged in 51,135 cases and females in 2,484. The number of cases during each of the last ten years is as follows:—
| MAGISTRATES' COURTS.—TOTAL CASES, 1916–25. | ||||||
|---|---|---|---|---|---|---|
| Year. | Number. | Per 1,000 of Mean Population. | ||||
| Against Males. | Against Females. | Totals. | Against Males. | Against Females. | Totals. | |
| 1916 | 39,623 | 2,934 | 42,557 | 68.59 | 5.13 | 37.03 |
| 1917 | 38,537 | 2,912 | 41,449 | 67.66 | 5.03 | 36.08 |
| 1918 | 33,466 | 2,933 | 36,399 | 59.16 | 5.00 | 31.57 |
| 1919 | 37,872 | 2,575 | 40,447 | 63.34 | 4.33 | 33.91 |
| 1920 | 41,092 | 2,399 | 43,491 | 64.63 | 3.95 | 35.01 |
| 1921 | 43,335 | 2,462 | 45,797 | 66.33 | 3.95 | 35.87 |
| 1922 | 40,594 | 2,306 | 42,900 | 60.88 | 3.61 | 32.87 |
| 1923 | 43,498 | 2,487 | 45,985 | 64.15 | 3.83 | 34.62 |
| 1924 | 46,100 | 2,456 | 48,556 | 66.77 | 3.71 | 35.90 |
| 1925 | 51,135 | 2,484 | 53,619 | 72.27 | 3.67 | 35.07 |
The foregoing figures include charges against Maoris. Maoris are also included in the statistics relating to Magistrates' Courts in the following pages, as well as those relating to Supreme Courts. Separate figures relating to crime amongst Maoris are given towards the end of this section.
The 53,619 cases dealt with in 1925 resulted in 44,017 summary convictions, and in 873 committals to the Supreme Court for sentence after conviction in Magistrates' Courts. In 640 cases the accused person was committed to the Supreme Court for trial, and in 838 the Magistrate admonished and discharged the offender under a provision enabling him to do so in the case of a. trivial offence, without a conviction being recorded. In 2,463 cases the charge was dismissed on the merits of the case, and in the remaining 4,815 cases the accused person was discharged for want of prosecution or want of evidence.
The summary convictions for the year 1925 represent a rate of 31.79 per 1,000 of mean population. The figures for the last ten years are—
| SUMMARY CONVICTIONS, 1916–25. | ||
|---|---|---|
| Year. | Number. | Per 1,000 of Mean Population. |
| 1916 | 35,459 | 30.85 |
| 1917 | 34,189 | 29.76 |
| 1918 | 29,252 | 25.37 |
| 1919 | 32,692 | 27.41 |
| 1920 | 35,517 | 28.59 |
| 1921 | 37,124 | 29.08 |
| 1922 | 34,513 | 26.44 |
| 1923 | 37,104 | 27.94 |
| 1924 | 39,594 | 29.27 |
| 1925 | 44,017 | 31.79 |
In comparing one year with another it should be remembered that the number of convictions may be considerably affected by alterations in the law or changes in its administration. As an example of the former may be mentioned the introduction in New Zealand of a system of compulsory military training. Convictions for breaches of the Defence Act rose from 13 in 1911 to 1,943 in 1912 and 4,849 in 1913, this being responsible for practically the whole of the increase of 3,500 in 1913 as compared with 1912. More recently, consequent on the passing of the Arms Act, 1920, convictions for offences relating to the sale and use of firearms increased from 35 in 1920 to 1,224 in 1922. Breaches of traffic regulations have also increased enormously during the last two years, the full extent of the increase, however, not being determinable, owing to the fact that prior to 1924 the great majority of these cases were dealt with under by-laws, and were so classified. On the other hand, convictions during recent years have been somewhat reduced by the introduction of the system referred to previously, where in the case of a trivial offence the offender may be admonished and discharged without a conviction being recorded
For similar reasons to those referred to in the foregoing paragraph it is inadvisable to base comparisons of quasi criminal offences between different countries on the statistics of summary convictions for the various countries. This, of course, does not apply in the case of serious crimes which are dealt with by the Supreme Court.
The figures for breaches of the Shipping and Seamen Act during 1925 were affected to some extent by the shipping strike that year, as in many cases where British ships were held up in New Zealand waters by the striking seamen, whole crews were tried on charges of “deserting” or “refusing to obey lawful commands.” In some of these cases almost the entire crews on conviction were sentenced to periods of up to three months detention in the local prisons. Breaches of the Shipping and Seamen Act by members of crews accounted for 1,331 cases, with 1,010 convictions, in 1925, as against 320 cases, with 291 convictions, during the previous year. Of the 1,010 convictions during 1925, peremptory imprisonment was inflicted in 812 cases, and imprisonment in lieu of fine in 10 cases. Fines were imposed in 130 cases, an order was made in 9 cases, and in the remaining 49 cases the offender was either discharged or ordered to come up for sentence.
A great proportion of the cases dealt with in New Zealand are in respect of comparatively insignificant offences—as, for instance, drunkenness, offences against by-laws, &c.
A classification of convictions during the last five years according to principal offences and groups of offences is next given.
| — | 1921. | 1922. | 1923. | 1924. | 1925. |
|---|---|---|---|---|---|
* Not including convictions (74 in 1925) for selling liquor without a license, an Offence Against the revenue laws. | |||||
| Offences against the person | 774 | 659 | 774 | 605 | 766 |
| Offences against property (including forgery) | 3,502 | 3,455 | 3,315 | 3,698 | 3,870 |
| Drunkenness (including issue of prohibition orders) | 10,643 | 7,790 | 8,448 | 8,691 | 9,652 |
| Offensive conduct or language, and obstruction, &c., of police | 1,972 | 1,508 | 1,502 | 1,669 | 1,835 |
| Breaches of traffic regulations | 1,512 | 1,478 | 1,521 | 7,059 | 9,993 |
| Breaches of by-laws | 5,374 | 6,518 | 7,761 | 2,412 | 2,716 |
| Other offences against good order | 1,218 | 1,334 | 1,376 | 1,511 | 1,303 |
| Breaches of Licensing Act* | 2,902 | 2,509 | 2,577 | 2,999 | 3,190 |
| Breaches of Destitute Persons Act | 2,194 | 2,282 | 2,490 | 2,796 | 3,001 |
| Breaches of Impounding Act | 1,743 | 1,265 | 1,264 | 1,683 | 1,234 |
| Breaches of Defence Act | 2,078 | 1,912 | 2,140 | 1,893 | 1,694 |
| Offences relating to the sale and use of firearms | 261 | 1,224 | 924 | 807 | 626 |
| Other offences | 2,951 | 2,579 | 3,012 | 3,771 | 4,137 |
| Totals | 37,124 | 34,513 | 37,104 | 39,594 | 44,017 |
Of the 766 summary convictions for offences against the person in 1925, no fewer than 706 were for common assault. Attempted suicide was responsible for 49 convictions, indecent assault for 7, and aggravated assault 4. In the more serious classes of offences against the person the cases are referred to the Supreme Court for trial or sentence.
The 3,870 summary convictions for offences against property during 1925 are in the main made up of various forms of theft. Theft (not otherwise described) was responsible for 2,432 convictions, embezzlement for 34, housebreaking and stealing 30, theft from the person 2, sheep and cattle stealing 8, and receiving stolen property 53. In addition, there were 473 convictions for fraud and false pretences, 1 for forgery, 2 for arson, 243 for unlawfully converting property to own use, and 592 for mischief. The more serious cases of offences against the property laws are also sent on to the Supreme Court to be dealt with. Details of these will be found under “Criminal Cases in Supreme Courts.”
The principal of the “Other offences against good order” is vagrancy, which represented 482 of the 1,303 summary convictions under this heading in 1925. Offences relating to gambling (372), Sunday-trading (220), and cruelty to animals (173) ranked next in 1925.
Of “Other offences” (4,137 convictions in 1925), Breaches of the Shipping and Seamen Act by crews (1,010) and offences against the revenue laws (418) were the principal. Miscellaneous offences under the following Acts also contributed materially to the total:—
| Education | 187 |
|---|---|
| Health | 170 |
| Noxious Weeds | 211 |
| Offenders Probation | 155 |
| Rabbit Nuisance | 138 |
| Sale of Food and Drugs | 170 |
| Shops and Offices | 398 |
| Stock | 331 |
Of a total of 44,017 summary convictions in 1925, peremptory imprisonment was imposed in only 3,174 cases, in addition to which the convicted person went to gaol in 1,430 cases in lieu of paying a fine. A summary of punishments for the year 1925 is next given.
| MAGISTRATES' COURTS.—PUNISHMENTS ON SUMMARY CONVICTION, 1925. | |||||
|---|---|---|---|---|---|
| Punishments. | Offences against the Person. | Offences against Property. | Offences against Good Order. | Other Offences. | Totals. |
| Released under Offenders Probation Act | 14 | 729 | 33 | 23 | 799 |
| Convicted and discharged | 96 | 847 | 2,790 | 811 | 4,544 |
| Convicted and ordered to come up for sentence | 59 | 369 | 232 | 122 | 782 |
| Committed to an industrial school | 2 | 164 | 2 | 12 | 180 |
| Committed to Borstal Institution, Salvation Army Home, &c. | .. | 63 | 59 | 22 | 144 |
| Pined | 468 | 860 | 19,145 | 8,792 | 29,265 |
| Imprisonment in lieu of fine | 35 | 101 | 1,026 | 268 | 1,430 |
| Peremptory imprisonment | 75 | 681 | 579 | 1,839 | 3,174 |
| Whipping | .. | 21 | .. | .. | 21 |
| Bound over | 14 | .. | 12 | 1 | 27 |
| Order made | 3 | 35 | 1,621 | 1,992 | 3,651 |
| Totals | 766 | 3,870 | 25,499 | 13,882 | 44,017 |
The statistics given above refer, as stated, to all cases dealt with in Magistrates' Courts, including those in which a person is charged with two or more offences committed simultaneously or in the same connection—as, for instance, drunkenness, damaging property, and resisting the police. If only one (the most serious) offence is counted in each instance the number of cases in 1925 is reduced from 53,619 to 44,961. A summary is given for the years 1924 and 1925 comparing total and distinct cases, classified according to the results of the hearing.
| MAGISTRATES' COURTS.—TOTAL AND DISTINCT CASES, 1924 AND 1925. | ||||
|---|---|---|---|---|
| — | 1924. | 1925. | ||
| Total Cases. | Distinct Cases. | Total Cases. | Distinct Cases. | |
| Discharged for want of prosecution or want of evidence | 4,189 | 3,030 | 4,815 | 3,392 |
| Dismissed on the merits | 2,337 | 1,714 | 2,436 | 1,843 |
| Admonished and discharged | 845 | 612 | 838 | 702 |
| Committed for sentence | 944 | 399 | 873 | 327 |
| Committed for trial | 647 | 361 | 640 | 304 |
| Summarily convicted | 39,594 | 34,287 | 44,017 | 38,393 |
| Totals | 48,556 | 40,403 | 53,619 | 44,961 |
Persons charged in the Magistrates' Courts may be brought before the Court either on summons or after arrest, according to the nature of the offence and to other circumstances. Of the total of 53,619 cases in 1925, 16,232 were “arrest” and 37,387 “summons” cases. A summary is here given.
| Class of Offence. | Arrest Cases. | Summons Cases. | ||||||
|---|---|---|---|---|---|---|---|---|
| Cases. | Summary Convictions. | Cases. | Summary Convictions. | |||||
| Males. | Females. | Males. | Females. | Males. | Females. | Males. | Females. | |
| Against the person | 682 | 30 | 388 | 11 | 578 | 39 | 357 | 10 |
| Against property | 4,099 | 233 | 2,604 | 190 | 1,921 | 155 | 980 | 96 |
| Against good order | 9,412 | 481 | 9,171 | 469 | 17,085 | 832 | 15,183 | 676 |
| Other | 1,254 | 41 | 979 | 36 | 16,104 | 673 | 12,367 | 500 |
| Totals | 15,447 | 785 | 13,142 | 706 | 35,688 | 1,699 | 28,887 | 1,282 |
Information in connection with both arrest and summons cases is obtained on cards, which, however, give considerably more particulars concerning the offender in regard to the former class than are available for the latter. From the information given in arrest cases it is possible to ascertain the number of distinct persons arrested, and to compile statistics as to their ages, birthplaces, &c.
The total number of convictions of arrested persons during 1925 was 13,848, which is reduced to 11,719 if multiple charges—i.e., those in respect of offences committed by the same person at the same time—are excluded. If only the principal offence for which each person was convicted during the year is taken into account the number of distinct persons convicted after arrest is found to be 8,444, a number equal to only 62 per cent. of the gross total of convictions of arrested persons.
The next three tables give the offences and ages, offences and birthplaces, and birthplaces and ages of the distinct persons arrested and convicted during 1925
| CONVICTIONS IN ARREST CASES, 1925.Offences and Ages. | ||||||
|---|---|---|---|---|---|---|
| Offences against | Under 20. | 20 and under 25. | 25 and under 80. | 30 and under 40. | 40 and over.* | Totals. |
* Including unspecified. | ||||||
| The person | 12 | 57 | 65 | 97 | 122 | 353 |
| Property | 233 | 266 | 212 | 267 | 413 | 1,391 |
| Good order | 67 | 454 | 593 | 1,491 | 3,454 | 6,059 |
| Other offences | 40 | 114 | 104 | 161 | 222 | 641 |
| Totals | 352 | 891 | 974 | 2,016 | 4,211 | 8,444 |
| Offences and Birthplaces. | |||||||
|---|---|---|---|---|---|---|---|
| Offences against | New Zealand. | England and Wales. | Scotland. | Ireland. | Australia. | Elsewhere.* | Totals. |
* Including unspecified. | |||||||
| The person | 157 | 85 | 18 | 19 | 16 | 58 | 353 |
| Property | 866 | 193 | 52 | 56 | 76 | 148 | 1,391 |
| Good order | 2,818 | 1,107 | 546 | 607 | 368 | 613 | 6,059 |
| Other offences | 203 | 232 | 33 | 32 | 28 | 108 | 641 |
| Totals | 4,044 | 1,617 | 654 | 714 | 488 | 927 | 8,444 |
| Birthplaces and Ages. | ||||||
|---|---|---|---|---|---|---|
| Birthplace. | Under 20. | 20 and under 25. | 25 and under 30. | 30 and under 40. | 40 and over.* | Totals. |
* Including unspecified. | ||||||
| New Zealand | 297 | 573 | 553 | 1,088 | 1,533 | 4,044 |
| England and Wales | 29 | 166 | 197 | 375 | 850 | 1,617 |
| Scotland | 5 | 31 | 67 | 148 | 403 | 654 |
| Ireland | 1 | 24 | 40 | 140 | 509 | 714 |
| Australia | 7 | 43 | 56 | 131 | 251 | 488 |
| Elsewhere* | 13 | 54 | 61 | 134 | 665 | 927 |
| Totals | 352 | 891 | 974 | 2,016 | 4,211 | 8,444 |
Of the 8,444 distinct persons arrested and convicted during 1925 no fewer than 6,059 were convicted for offences against good order, and of these 4,783 were for drunkenness (including 159 drunk and disorderly, and 9 habitual). In addition, 6 were convicted in respect of prohibition orders; 407 for indecent, riotous, or offensive conduct; 289 for using obscene, threatening, or abusive language; 322 for vagrancy; 81 for assaulting, resisting, or obstructing the police; 8 for soliciting prostitution; 3 for soliciting alms; 10 for cruelty to animals; 117 for offences relating to gambling; 12 for breaches of by-laws; 19 for breaches of traffic regulations (Lights on Vehicles and Motor-vehicles Acts); and 2 for aiding and abetting the commission of an offence.
Of the 353 distinct persons arrested and convicted during 1925 for offences against the person, 305 were convicted for common assault and 43 for attempted suicide; and of the 1,391 distinct persons arrested and convicted for offences against property, 980 were guilty of theft of various classes, 137 of fraud and false pretences, 19 of receiving stolen property, 198 of wilful damage, and 57 of unlawfully converting property to own use.
Criminal cases in Supreme Courts are divisible into two classes—viz., those in which the accused person has pleaded guilty in the Magistrate's Court and has been committed to the Supreme Court for sentence, and those actually tried in the Supreme Court.
The following table gives a summary of criminal cases dealt with in Supreme Courts during each of the last five years. Maoris are included in this and following tables, except where the contrary is specifically stated.
| SUPREME COURT.—TOTAL CRIMINAL CASES, 1921–25. | |||||||||
|---|---|---|---|---|---|---|---|---|---|
| Year. | Cases tried In Supreme Court. | Sentences in Case of Committal for Sentence. | Total Sentences. | ||||||
| Indictments and Informations. | Convictions. | ||||||||
| M. | F. | M. | F. | M. | F. | M. | F. | Total. | |
| 1921 | 680 | 39 | 407 | 17 | 1,033 | 18 | 1,440 | 35 | 1,475 |
| 1922 | 912 | 16 | 510 | 3 | 873 | 31 | 1,383 | 34 | 1,417 |
| 1923 | 829 | 30 | 452 | 11 | 1,154 | 46 | 1,606 | 57 | 1,663 |
| 1924 | 808 | 30 | 435 | 13 | 885 | 55 | 1,320 | 68 | 1,388 |
| 1925 | 843 | 34 | 503 | 19 | 920 | 23 | 1,423 | 42 | 1,465 |
The above table relates to the total criminal charges dealt with, each offence being taken into account. A similar table is next given, showing the number of distinct persons concerned, only the principal offence being taken into account where the same person was tried in respect of two or more offences during the year.
| SUPREME COURT.—DISTINCT PERSONS, 1921–25. | |||||||||
|---|---|---|---|---|---|---|---|---|---|
| Year. | Persons tried in Supreme Court. | Persons sentenced after Committal for Sentence. | Total Persons sentenced. | ||||||
| Indicted. | Convicted and sentenced. | ||||||||
| M. | F. | M. | F. | M. | F. | M. | F. | Total. | |
| 1921 | 323 | 24 | 201 | 10 | 391 | 14 | 592 | 24 | 616 |
| 1922 | 386 | 11 | 250 | 3 | 330 | 18 | 580 | 21 | 601 |
| 1923 | 333 | 25 | 207 | 9 | 387 | 22 | 594 | 31 | 625 |
| 1924 | 336 | 17 | 210 | 6 | 318 | 21 | 528 | 27 | 555 |
| 1925 | 292 | 19 | 181 | 11 | 306 | 13 | 487 | 24 | 511 |
Of the 311 distinct persons indicted during 1925, 192 were convicted and 94 acquitted. In the case of 19 persons no bill was returned or the prosecution otherwise not proceeded with, 2 persons were found insane, and 4 were awaiting trial at the end of the year.
The next table summarizes the offences of persons convicted or sentenced in Supreme Courts during the last five years:—
| SUPREME COURT.—SUMMARY OF OFFENCES, 1921–25. | ||||||||||
|---|---|---|---|---|---|---|---|---|---|---|
| Year. | Total Convictions or Sentences. | Distinct Persons. | Totals. | |||||||
| Offences against the Person. | Offences against Property. | Forgery and Offences against the Currency. | Other Offences | Totals. | Offences against the Person. | Offences against Property. | Forgery and Offences against the Currency. | Other Offences | ||
| 1921 | 196 | 1,022 | 189 | 68 | 1,475 | 113 | 393 | 71 | 39 | 616 |
| 1922 | 218 | 1,017 | 113 | 69 | 1,417 | 125 | 399 | 50 | 27 | 601 |
| 1923 | 218 | 1,078 | 262 | 105 | 1,663 | 144 | 357 | 72 | 52 | 625 |
| 1924 | 248 | 822 | 233 | 86 | 1,389 | 140 | 301 | 70 | 44 | 555 |
| 1925 | 242 | 952 | 207 | 64 | 1,465 | 142 | 265 | 75 | 29 | 511 |
As might be expected from the nature of the offences, the number of charges per 100 persons concerned is much lower in the case of offences against the person than for other offences. The figures for the average of the five years covered by the table at the foot of the previous page are—
| Class of Offence. | Total Convictions or Sentences per 100 Distinct Persons convicted or sentenced. |
|---|---|
| Offences against the person | 171 |
| Offences against property | 291 |
| Forgery and offences against the currency | 296 |
| Other offences | 211 |
| Total | 257 |
From their more serious nature in general, it might be expected that a much higher proportion of charges dealing with offences against the person would actually be tried in Supreme Courts than would be the case with other offences, and the following table, covering the year 1925, shows that this is so:—
| SUPREME COURT.—TRIAL AND SENTENCE CASES, BY CLASS OF OFFENCE, 1925. | ||||||||
|---|---|---|---|---|---|---|---|---|
| Class of Offence. | Total Convictions (or Sentences). | Distinct Persons convicted (or sentenced). | ||||||
| Numbers. | Percentages. | Numbers. | Percentages. | |||||
| After Trial. | After Committal for Sentence. | After Trial. | After Committal for Sentence. | After Trial. | After Committal for Sentence. | After Trial. | After Committal for Sentence. | |
| Offences against the person | 148 | 94 | 61 | 39 | 78 | 64 | 55 | 45 |
| Offences against property | 260 | 692 | 27 | 73 | 84 | 181 | 32 | 68 |
| Forgery and offences against the currency | 81 | 126 | 39 | 61 | 15 | 60 | 20 | 80 |
| Other offences | 33 | 31 | 52 | 48 | 15 | 14 | 52 | 48 |
| Totals | 522 | 943 | 36 | 64 | 192 | 319 | 38 | 62 |
Dealing now only with distinct persons, and counting only the most serious offence in respect of which sentence was passed, it is found that of the 142 persons sentenced for offences against the person in 1925 no fewer than 99 were guilty of sexual offences, as follows: Indecent assaults on females, 27; indecent assaults on males, 12; rape and attempts, 10; unlawful carnal knowledge and attempts, 35; incest, 6; and unnatural offences, 9. Included in these figures is one female convicted on a charge of conspiring to procure rape. Attempted murder was the offence in 3 cases, manslaughter in 9, negligently endangering the lives of persons in 1, aggravated assault in 9, common assault in 6, assault and robbery in 1, procuring or attempting to procure abortion in 2, concealment of birth in 2, and bigamy in 10.
Of the 265 offences against property, breaking and entering (with or without theft) was the principal offence for which 118 persons were convicted or sentenced, while 67 were guilty of theft (including horse-, cattle-, and sheep-stealing), 14 of receiving stolen property, 28 of fraud or false pretences, 25 of embezzlement, 9 of arson or attempted arson, 3 of extortion, and 1 of mischief.
Of the 75 persons shown under the heading of “Forgery and Offences against the Currency,” 49 were convicted or sentenced for forgery alone, 1 for uttering alone, and the remaining 25 for forgery and uttering.
The principal of “Other offences” in 1925 were: Breaches of the Bankruptcy Act, 7; false declaration under the Marriage Act, 6; false declaration under the Births and Deaths Registration Act, 3; breaches of the Post and Telegraph Act, 3: and indecent, riotous, or offensive conduct, 3.
The next table shows punishments inflicted on offenders by the Supreme Court during 1925, classified according to nature of principal offence. Of the 511 persons dealt with, no fewer than 129 were released under the provisions of the Offenders Probation Act, 23 ordered to come up for sentence when called on, and 3 held to bail or awaiting the pleasure of the Court, while the offence was met by the imposition of a fine in 23 cases. Of the remainder 1 was declared an habitual criminal and 1 ordered to be flogged without further sentence, 1 was committed to an Habitual Inebriates' Home, and the balance (330) were sentenced to detention in reformative or Borstal institutions or in prisons.
| SUPREME COURT—OFFENCES AND PUNISHMENTS OF DISTINCT PERSONS, 1925 | |||||
|---|---|---|---|---|---|
| Punishment. | Offence against the Person. | Offence against Property. | Forgery and Offences against the Currency. | Other Offences. | Totals. |
| Death | .. | .. | .. | .. | .. |
| Imprisonment only, with or without hard labour— | |||||
| 15 years and upwards | 3 | .. | .. | .. | 3 |
| 10 and under 15 years | 4 | .. | .. | .. | 4 |
| 7 ,, 10 ,, | 4 | .. | .. | .. | 4 |
| 5 ,, 7 ,, | 18 | 2 | .. | .. | 20 |
| 3 ,, 5 ,, | 6 | 15 | 5 | .. | 26 |
| 2 ,, 3 ,, | 8 | 19 | 3 | .. | 30 |
| 1 ,, 2 | 6 | 23 | 10 | 1 | 40 |
| 6 months and under 1 year | 9 | 12 | 3 | 4 | 28 |
| Under 6 months | 4 | 9 | 2 | 2 | 17 |
| Imprisonment and reformative treatment | 1 | .. | .. | .. | 1 |
| Reformative treatment only | 20 | 68 | 21 | 5 | 114 |
| Imprisonment and declared habitual criminal | .. | 13 | 3 | .. | 16 |
| Declared habitual criminal only | .. | 1 | .. | .. | 1 |
| Flogged only | 1 | .. | .. | .. | 1 |
| Committed to a Borstal institution | 7 | 16 | 4 | .. | 27 |
| Committed to habitual inebriates' home | .. | 1 | .. | .. | 1 |
| Fined | 9 | 3 | 3 | 8 | 23 |
| Released under Offenders Probation Act | 31 | 75 | 19 | 4 | 129 |
| Ordered to come up for sentence | 9 | 7 | 2 | 5 | 23 |
| Held to bail or awaiting pleasure of Court | 2 | 1 | .. | .. | 3 |
| Totals | 142 | 265 | 75 | 29 | 511 |
Forty-one Maoris were included in the 511 distinct offenders sentenced in the Supreme Court in 1925, and 329 others (including 18 women) were born in New Zealand. In 68 cases the birthplace was England, in 17 Scotland, in JO Ireland, and in 26 Australia.
No fewer than 80 of the offenders were under twenty years of age, 111 between twenty and twenty-five, 97 between twenty-five and thirty, 115 between thirty and forty, 68 between forty and fifty, 23 between fifty and sixty, and 12 over sixty. In 5 cases the age was unspecified.
Under the provisions of the Judicature Amendment Act, 1913, the Court of Appeal consists of two divisions, called the First Division and the Second Division, each division consisting of five Judges of the Supreme Court, who are appointed as members of either division by the Governor-General in Council on the recommendation of three Judges of the Supreme Court, including the Chief Justice. The same division does not exercise the jurisdiction of the Court of Appeal at two successive sittings, but exercises its jurisdiction separately, except that in cases of importance involving special difficulty any two Judges (of whom the Chief Justice shall be one) may recommend, for the approval of the Governor-General in Council, that a joint sitting of both divisions may be held. The Chief Justice or, in his absence, the senior Judge presides. The decision of the Court must be in accordance with the majority of the Judges present, but if the Judges present are equally divided in opinion the judgment, &c., appealed from shall be deemed to be affirmed.
In addition to the ordinary appeals from the Supreme Court, certain other proceedings arising in inferior Courts may, on an order of the Supreme Court, be removed into the Court of Appeal for argument. All decisions of the Court of Appeal are final unless leave is granted to appeal to His Majesty in Council.
In criminal cases questions of law may be reserved by the Supreme Court for the Court of Appeal, and upon a refusal by the Court to reserve any question the person aggrieved may move the Court of Appeal for leave to appeal. Any person aggrieved may also (after conviction) apply to the Court of Appeal for a new trial upon leave being granted by the Supreme Court. Any person has now the right to apply to the Court of Appeal against a sentence passed in the Supreme Court where such person has been convicted upon an indictment or sentenced for any crime on a plea of “Guilty.”
The number of civil and Crown criminal cases brought before the Appeal Court and the judgments thereon for the last ten years are as follow:—
| Year. | Crown Criminal Cases. | Civil. | |||||
|---|---|---|---|---|---|---|---|
| Number. | Convictions affirmed. | Appeals. | Cases removed. | ||||
| Number. | Allowed. | Number. | Judgments for Plaintiffs. | Judgments for Defendants. | |||
| 1916 | 4 | 1 | 16 | 6 | 6 | 3 | 3 |
| 1917 | 4 | 4 | 11 | 4 | 12 | 8 | 4 |
| 1918 | 5 | 3 | 11 | 5 | 7 | 5 | 2 |
| 1919 | 6 | 2 | 13 | 9 | 6 | 2 | 4 |
| 1920 | 4 | 2 | 16 | 10 | 11 | 7 | 4 |
| 1921 | 3 | 1 | 18 | 9 | 7 | 3 | 4 |
| 1922 | 4 | 4 | 28 | 14 | 10 | 4 | 5 |
| 1923 | 5 | 5 | 20 | 13 | 2 | 2 | .. |
| 1924 | 2 | 2 | 15 | 7 | 12 | 6 | 6 |
| 1925 | 4 | .. | 23 | 13 | 13 | 12 | 1 |
Particulars concerning applications for leave to appeal against sentences under the provisions of the Crimes Amendment Act, 1920, are given in the following table for each of the five years since the passing of the amendment:—
| Year. | Applications filed. | Results of Appeals in Cases where Leave to Appeal granted. | |||
|---|---|---|---|---|---|
| Number. | Granted. | Refused. | Sentence varied. | Appeal dismissed. | |
| 1921 | 7 | 4 | 3 | 4 | .. |
| 1922 | 32 | 4 | 27 | 1 | 3 |
| 1923 | 18 | .. | 18 | .. | .. |
| 1924 | 8 | 2 | 6 | .. | 2 |
| 1925 | 10 | .. | 10 | .. | .. |
The following table gives for the year 1925 the prison accommodation, the number of prisoners received, the number in prison at end of year, and the daily average number in confinement:—
| Name of Prison. | Number for whom there is Accommodation. | Number received during Year. | Number in Confinement at End of Year. | Daily Average Number in Confinement. |
|---|---|---|---|---|
* Deemed to be prisons under section 17 of the Statute Law Amendment Act, 1917. | ||||
| Addington (Women's Reformatory) | 32 | 55 | 17 | 15.23 |
| Auckland | 395 | 2,183 | 436 | 424.80 |
| Hautu (Tokaanu) | 39 | 33 | 22 | 27.99 |
| Invercargill | 176 | 137 | 8 | 114.12 |
| Invercargill Borstal Institution | 176 | 156 | 153 | 54.06 |
| Napier | 47 | 207 | 16 | 1701 |
| New Plymouth | 68 | 175 | 63 | 61.63 |
| Paparua (Templeton) | 146 | 494 | 133 | 122.18 |
| Point Halswell (Women's Reformatory) | 44 | 61 | 12 | 24.78 |
| Point Halswell Borstal Institution | 44 | 55 | 42 | 15.80 |
| Rangipo | 26 | 21 | 21 | 1500 |
| Waikeria (Reformatory) | 128 | 100 | 108 | 96.76 |
| Waikune (Erua) | 92 | 86 | 92 | 92.30 |
| Wanganui | 48 | 128 | 29 | 3117 |
| Wellington | 109 | 889 | 93 | 118.38 |
| Wi Tako (Trentham) | 67 | 99 | 68 | 6749 |
| Minor prisons | 179 | 695 | 20 | 25.55 |
| Police lockups* | .. | 110 | .. | .. |
| Totals | 1,596 | 5,684 | 1,333 | 1,324.25 |
The number of persons in gaol at the end of each of the last ten years, and the proportion per 10,000 of population as at the 31st December, is given in the next table:—
| PRISONERS IN GAOL (31ST DECEMBER). | |||||
|---|---|---|---|---|---|
| Year. | Number of Prisoners. | Proportion per 10,000 of Population. | |||
| Undergoing Sentence. | On Remand and awaiting Trial, &c. | Total. | Undergoing Sentence. | Total in Confinement. | |
| 1916 | 834 | 56 | 890 | 7.25 | 7.74 |
| 1917 | 954 | 53 | 1,007 | 8.31 | 8.78 |
| 1918 | 1,005 | 42 | 1,047 | 8.68 | 9.04 |
| 1919 | 852 | 68 | 920 | 6.94 | 7.50 |
| 1920 | 996 | 64 | 1,060 | 7.92 | 843 |
| 1921 | 1,044 | 55 | 1,099 | 8.08 | 8.50 |
| 1922 | 1,052 | 62 | 1,114 | 8.32 | 8.90 |
| 1923 | 1,141 | 54 | 1,195 | 8.50 | 8.90 |
| 1924 | 1,197 | 50 | 1,247 | 8.85 | 9.22 |
| 1925 | 1,285 | 48 | 1,333 | 9.17 | 9.51 |
In the following table prisoners in confinement at the end of each of the last ten years are classified according to nature of sentence:—
| Year. | Simple Imprisonment. | Hard Labour, under Three Months. | Hard Labour, Three Months and under One Year. | Hard Labour, One Year and over. | Habitual Criminals. | Receiving Reformative Treatment. | On Remand, awaiting Trial, &c. | Totals. |
|---|---|---|---|---|---|---|---|---|
*Including 203 detained in Borstal institutions. | ||||||||
| 1916 | 8 | 68 | 127 | 346 | 59 | 226 | 56 | 890 |
| 1917 | 29 | 48 | 210 | 423 | 48 | 196 | 53 | 1,007 |
| 1918 | 15 | 45 | 128 | 566 | 42 | 209 | 42 | 1,047 |
| 1919 | 8 | 60 | 106 | 339 | 38 | 301 | 68 | 920 |
| 1920 | 21 | 97 | 149 | 281 | 63 | 385 | 64 | 1,060 |
| 1921 | 14 | 70 | 170 | 392 | 52 | 346 | 55 | 1,099 |
| 1922 | 9 | 77 | 145 | 363 | 45 | 413 | 62 | 1,114 |
| 1923 | 11 | 102 | 171 | 361 | 44 | 452 | 54 | 1,195 |
| 1924 | 19 | 102 | 147 | 424 | 51 | 454 | 50 | 1,247 |
| 1925 | 7 | 128 | 159 | 426 | 61 | 504* | 48 | 1,333 |
The total number of prisoners received in the different gaols during the year 1925 was 5,684 (males 5,356, females 328), as compared with 4,743 (males 4,472, females 271) in 1924, counting each admission as a distinct person.
If to the total of 5,684 receptions during the year be added 43 persons in gaol awaiting trial or sentence at the beginning of the year, an aggregate of 5,727 is obtained. This number includes 137 debtors and 2 lunatics, the gross total of receptions of prisoners sentenced for, or persons charged with, criminal offences being 5,588. From this gross total must be deducted 971 as representing receptions on transfer or in transitu, leaving a net total of 4,617 receptions. In 937 cases the accused person was not returned to prison after trial, and 63 persons were in prison awaiting trial or sentence at the end of the year. The net total receptions of prisoners under sentence reduces to 3,617, and, after making a further deduction of 727 on account of more than one term of imprisonment being undergone by the same person during the year, the number of distinct prisoners received under sentence for criminal offences is found to be 2,890 (males 2,761, females 129). This number includes 129 Maoris (122 males, 7 females).
The number of distinct persons received into prison under sentence of imprisonment during the last eight years, with the proportion per 10,000 of mean population, is given in the next table. Similar information for previous years is not available, owing to the fact that, prior to 1918, persons lodged in prison to await trial and subsequently found guilty but not sentenced to imprisonment (being fined, released on probation, &c.) were included in the totals. The figures from 1918 onwards relate only to those actually sentenced to a term of imprisonment or of detention in a Borstal institution.
| DISTINCT PRISONERSRECEIVEDUNDER SENTENCE, 1918–25. | ||
|---|---|---|
| Year. | Number of Distinct Prisoners received under Sentence. | Proportion per 10,000 of Mean Population. |
| 1918 | 1,783 | 15.47 |
| 1919 | 1,833 | 15.37 |
| 1920 | 1,955 | 15.74 |
| 1921 | 2,120 | 16.61 |
| 1922 | 2,249 | 17.23 |
| 1923 | 2,358 | 17.75 |
| 1924 | 2,405 | 17.78 |
| 1925 | 2,890 | 20.88 |
In classifying the offences a prisoner convicted of more than one offence during the year is reckoned once only, under the heading of the principal offence—e.g., a prisoner convicted three times of drunkenness, twice of vagrancy, and once of theft is counted once only, under the heading “Offences against Property,” theft being the principal offence. Debtors and lunatics received into gaol are omitted.
The following table shows the sexes and ages of distinct prisoners received into prison under sentence during the year 1925, and distinguishes between Maoris and others:—
| AGESAND SEXES OF DISTINCT PRISONERSRECEIVEDINTO PRISON UNDER SENTENCE DURING 1925. | |||||||||
|---|---|---|---|---|---|---|---|---|---|
| Age, in Years. | Excluding Maoris. | Maoris. | Including Maoris. | ||||||
| Males. | Females. | Total. | Males. | Females. | Total. | Males. | Females. Total. | ||
| Under 20 | 107 | 23 | 130 | 14 | .. | 14 | 121 | 23 | 144 |
| 20 and under 25. | 423 | 8 | 431 | 34 | 2 | 36 | 457 | 10 | 467 |
| 25 ,, 30 | 414 | 12 | 426 | 25 | 2 | 27 | 439 | 14 | 453 |
| 30 ,, 35 | 316 | 8 | 324 | 21 | 1 | 22 | 337 | 9 | 346 |
| 35 ,, 40 | 312 | 10 | 322 | 6 | 1 | 7 | 318 | 11 | 329 |
| 40 ,, 45 | 330 | 25 | 355 | 7 | .. | 7 | 337 | 25 | 362 |
| 45 ,, 50 | 276 | 11 | 287 | 6 | .. | 6 | 282 | 11 | 293 |
| 50,55 | 208 | 11 | 219 | 3 | 1 | 4 | 211 | 12 | 223 |
| 55 ,, 60 | 121 | 8 | 129 | 2 | .. | 2 | 123 | 8 | 131 |
| 60 ,, 65 | 61 | 3 | 64 | 1 | .. | 1 | 62 | 3 | 65 |
| 65 ,, 70 | 38 | 2 | 40 | .. | .. | .. | 38 | 2 | 40 |
| 70 ,, 75 | 21 | .. | 21 | .. | .. | .. | 21 | .. | 21 |
| 75 ,, 80 | 5 | 1 | 6 | 2 | .. | 2 | 7 | 1 | 8 |
| 80 and over | 3 | .. | 3 | .. | .. | .. | 3 | .. | 3 |
| Not stated | 4 | .. | 4 | 1 | .. | 1 | 5 | .. | 5 |
| Totals. | 2,639 | 122 | 2,761 | 122 | 7 | 129 | 2,761 | 129 | 2,890 |
Under the system in force up to and including 1923 Maoris were excluded from the main compilation of statistics of prisoners, only the bare totals of Maori prisoners being available, classified according to sex and age, as in the foregoing table. The following tables, however, relate to all prisoners (including Maoris) received under sentence during the year. The tables show the number of distinct persons received into prison under sentence during 1925, classified according to (1) birthplaces and offences, (2) ages and offences, and (3) ages and previous convictions.
| BIRTHPLACESAND OFFENCESOF DISTINCT PRISONERS RECEIVEDINTO PRISONUNDER SENTENCEDURING 1925. | |||||
|---|---|---|---|---|---|
| Birthplace. | Nature of Offence. | Totals. | |||
| Against the Person. | Against Property. | Drunkenness. | Other Offences. | ||
| New Zealand | 97 | 458 | 224 | 497 | 1,276 |
| Australia | 8 | 55 | 40 | 51 | 154 |
| England and Wales | 43 | 123 | 92 | 630 | 888 |
| Scotland | 7 | 27 | 60 | 121 | 215 |
| Ireland | 7 | 34 | 63 | 90 | 194 |
| Other British countries | 3 | 10 | 6 | 21 | 40 |
| China | .. | 5 | .. | 14 | 19 |
| Other foreign countries | 8 | 8 | 21 | 56 | 93 |
| At sea | .. | .. | 1 | 2 | 3 |
| Not stated | .. | 1 | 2 | 5 | 8 |
| Totals | 173 | 721 | 509 | 1,487 | 2,890 |
| AGESAND OFFENCESOF DISTINCT PRISONERSRECEIVEDINTO PRISONUNDER SENTENCEDURING 1925. | ||||||||
|---|---|---|---|---|---|---|---|---|
| Age, in Years. | Offences against the Person. | Theft and other Offences against Property. | Offences not included previously. | Totals. | ||||
| Sexual Offences. | Assaults. | Other. | Vagrancy. | Drunkenness. | Other. | |||
| Under 21 | 9 | 4 | 2 | 101 | 12 | 2 | 74 | 204 |
| 21 and under 25 | 7 | 14 | 1 | 134 | 9 | 12 | 230 | 407 |
| 25 ,, 30 | 10 | 27 | 1 | 130 | 13 | 37 | 235 | 453 |
| 30 ,, 35 | 4 | 15 | 2 | 84 | 13 | 53 | 175 | 346 |
| 35 ,, 40 | 7 | 16 | 2 | 72 | 21 | 59 | 152 | 329 |
| 40 ,, 45 | 8 | 10 | 1 | 72 | 33 | 90 | 148 | 362 |
| 45 ,, 50 | 3 | 11 | 4 | 53 | 32 | 83 | 107 | 293 |
| 50 ,, 55 | 3 | 2 | .. | 41 | 39 | 58 | 80 | 223 |
| 55 ,, 60 | 2 | 2 | .. | 19 | 9 | 58 | 41 | 131 |
| 60 ,, 65 | 1 | 1 | 1 | 3 | 15 | 25 | 19 | 65 |
| 65 and over | .. | 2 | 1 | 9 | 19 | 30 | 11 | 72 |
| Not stated | .. | .. | .. | 3 | .. | 2 | .. | 5 |
| Totals | 54 | 104 | 15 | 721 | 215 | 509 | 1,272 | 2,890 |
| AGES AND PREVIOUS CONVICTIONS OF DISTINCT PRISONERS RECEIVED INTO PRISON UNDER SENTENCE DURING 1925. | ||||||||
|---|---|---|---|---|---|---|---|---|
| Age, in Years. | Not previously convicted. | Previous Convictions. | Total Distinct Prisoners. | |||||
| Once. | Twice. | Three Times. | Four Times. | Over Four Times. | Totals. | |||
| Under 21 | 134 | 37 | 18 | 5 | 1 | 9 | 70 | 204 |
| 21 and under 25 | 264 | 55 | 21 | 21 | 13 | 33 | 143 | 407 |
| 25 ,, 30 | 275 | 57 | 28 | 11 | 6 | 76 | 178 | 453 |
| 30 ,, 35 | 184 | 44 | 28 | 18 | 15 | 57 | 162 | 346 |
| 35 ,, 40 | 143 | 41 | 29 | 20 | 11 | 85 | 186 | 329 |
| 40 ,, 45 | 150 | 49 | 29 | 18 | 11 | 105 | 212 | 362 |
| 45 ,, 50 | 109 | 30 | 18 | 15 | 11 | 110 | 184 | 293 |
| 50 ,, 55 | 79 | 16 | 10 | 3 | 5 | 110 | 144 | 223 |
| 55 ,, 60 | 36 | 11 | 12 | 6 | 3 | 63 | 95 | 131 |
| 60 ,, 65 | 23 | 6 | 1 | 2 | 1 | 32 | 42 | 65 |
| 65 and over | 26 | 4 | 1 | 2 | 1 | 38 | 46 | 72 |
| Not stated | 2 | .. | 2 | .. | .. | 1 | 3 | 5 |
| Totals | 1,425 | 350 | 197 | 121 | 78 | 719 | 1,465 | 2,890 |
The next table gives the offences and gravest previous offences of the distinct persons received into prison under sentence during 1925:—
| OFFENCES AND GRAVEST PREVIOUS OFFENCES OF DISTINCT PRISONERS RECEIVED INTO PRISON UNDER SENTENCE, 1925. | ||||||||
|---|---|---|---|---|---|---|---|---|
| Offences. | Gravest Previous Offence. | |||||||
| Against the Person. | Theft and Other Offences against Property. | Offences not included previously. | Totals. | |||||
| Sexual Offences. | Assault. | Other. | Vagrancy. | Drunkeness. | Other. | |||
| Against the person— | ||||||||
| Sexual offences | 6 | 2 | .. | 7 | .. | 1 | 2 | 18 |
| Assaults | .. | 17 | .. | 16 | .. | 4 | 11 | 48 |
| Other | .. | 1 | 1 | .. | .. | .. | .. | 2 |
| Against property | 5 | 15 | 5 | 411 | 16 | 16 | 39 | 507 |
| Offences not included above— | ||||||||
| Vagrancy | 2 | 7 | 1 | 70 | 74 | 6 | 19 | 179 |
| Drunkenness | 2 | 15 | 1 | 104 | 29 | 125 | 62 | 338 |
| Other | 4 | 17 | 4 | 133 | 19 | 33 | 163 | 373 |
| Totals | 19 | 74 | 12 | 741 | 138 | 185 | 296 | 1,465 |
Included among the 1,285 prisoners undergoing sentence at the 31st December, 1925, were 262 persons (220 males, 42 females) detained in Borstal institutions under the provisions of the Prevention of Crime (Borstal Institutions Establishment) Act, 1924. This Act, which is an adaptation of Part I of the Prevention of Crime Act, 1908 (Imperial), as amended by the Criminal -Justice Administration Act, 1914, is designed to prevent crime, and provides for the detention of young offenders in a special class of reformative institution. An offender between the ages of fifteen and twenty-one (twenty-three in certain cases), who would otherwise be liable to sentence of imprisonment by the Supreme Court or sentence of imprisonment of not less than one month by a Magistrate, may be made the subject of an order of detention of from two to five years by a Judge of the Supreme Court, and from one to three years by a Magistrate, without a conviction being recorded in the latter case. Provision is also made for the transfer of inmates from prisons, reformatory homes, State reformatory institutions, and industrial schools, to Borstal institutions, and from Borstal institutions to prisons. Power is given the Minister of Justice to release an offender undergoing detention on condition that he is placed under the supervision or authority of a probation officer, or of a society or person (to be specified) who may be willing to take charge of the case.
The following table shows the distinct prisoners received in prison during 1925 after being sentenced to reformative treatment or having been declared. habitual criminals, classified according to sentences:—
| Original Sentence. | Sentenced to Reformative Treatment for a Period of | Declared Habitual Criminals. | Totals. | ||
|---|---|---|---|---|---|
| Under Two Years. | Two and under Five Years. | Five Years and over. | |||
| Reformative treatment only | 61 | 112 | 4 | .. | 177 |
| Declared habitual criminal | .. | .. | .. | .. | .. |
| Under 1 year | 4 | 5 | .. | 4 | 13 |
| 1 year and under 2 | .. | 2 | .. | 1 | 3 |
| 2 years and under 3 | .. | .. | .. | 4 | 4 |
| 3 ,, 4 | .. | .. | .. | 3 | 3 |
| 4 ,, 5 | .. | .. | .. | 2 | 2 |
| 5 ,, 7 | .. | .. | .. | 3 | 3 |
| 7 years and over | .. | .. | .. | .. | .. |
| Totals | 65 | 119 | 4 | 17 | 205 |
For the purposes of the Crimes Amendment Act of 1910 there is constituted a Prisons Board, the members of which are appointed by the Governor-General in Council for a period of three years, and may be reappointed. As at present constituted, the Board consists of the Chief Justice, as President, and six other members. The Board meets at such times as the President determines, and subject to the provisions of the Act and regulations, may determine its own procedure.
It is the duty of the Board to make, inquiry from time to time as to whether there is reasonable cause for belief that any habitual criminal undergoing sentence or reformative detention is sufficiently reformed to be released on probation or discharged, or for granting discharge to any person who has been released on probation; and to make recommendations as to the release or discharge of any habitual criminal, habitual offender, or person under sentence of reformative detention, and as to the conditions which may be imposed on any such release or probation. The Board is required to take into consideration the case of every habitual criminal, &c., at least once a year, and to make a report to the Minister of Justice annually as to the operations of the Board, numbers dealt with, and the operation and effect of the Act.
Under the provisions of section 14 of the Statute Law Amendment Act, 1917, the Board was empowered to consider, at the request of the Minister of Justice, the cases of prisoners who had been sentenced to imprisonment with or without hard labour for periods exceeding two years, after half of the full term of imprisonment had expired, and to make recommendations to the Governor-General as to the release on probation of any such prisoner.
The following table shows the number of cases considered by the Board during each of the last ten years:—
| Year. | Habitual Criminals and Offenders. | Reformative Detention. | Hard Labour. | Habitual Criminals for Remission, Hard Labour. | Probationers for Discharge from Probation. | Totals. | |
|---|---|---|---|---|---|---|---|
| Crimes Amendment Act. | Offender Probationers. | ||||||
| 1916 | 102 | 322 | .. | .. | .. | .. | 424 |
| 1917 | 95 | 329 | 14 | .. | .. | .. | 438 |
| 1918 | 87 | 201 | 92 | .. | .. | .. | 380 |
| 1919 | 97 | 471 | 115 | .. | 18 | .. | 701 |
| 1920 | 74 | 467 | 75 | .. | 32 | .. | 648 |
| 1921 | 75 | 564 | 167 | .. | 18 | 17 | 841 |
| 1922 | 93 | 594 | 271 | .. | 19 | 30 | 1,007 |
| 1923 | 74 | 671 | 304 | 4 | 16 | 24 | 1,093 |
| 1924 | 80 | 683 | 302 | 3 | 13 | 21 | 1,102 |
| 1925 | 70 | 747 | 295 | 1 | 12 | 9 | 1,134 |
Of the cases considered in 1925, recommendations were made for release on probation in 197 cases, for discharge from prison or from probation in 125 cases, and for remission of sentence in 1 case, while 8 probationers under the Offenders Probation Act were ordered discharge. In 23 cases petitions were declined, and in the remaining 780 cases deferred.
An Act styled the First Offenders' Probation Act was passed in 1886 to provide, at the discretion of the Court, for conditional release on probation in the case of first offenders, in lieu of imprisonment This Act, with its amendment of 1903, was consolidated in 1908, the consolidated Act being repealed in 1920 by the Offenders Probation Act of that year, under which the system of probation is no longer confined to first offenders.
Under the Act of 1886 an “offence” for which probation could be granted was defined as—
“Any indictable offence, not being one for murder, attempted murder, burglary, coining, corrosive-fluid throwing, demanding money with menaces, extortion of money under threats of accusation of crime, placing an explosive substance to endanger life or property, rape, robbery with violence, or an offence attended by irreparable or serious consequences, and either endangering life, or indicating, in the opinion of the Court, an established criminal intention on the part of the accused, and includes any indictable offence which may be dealt with and disposed of by a Court of summary jurisdiction.”
The Act of 1920 widens the definition to cover “any offence punishable by imprisonment, whether on indictment or otherwise.”
The maximum period of probation was originally fixed as not exceeding the longest term of imprisonment to which the offender might be sentenced for his offence; in 1903 the maximum was altered to three years, and in 1920 to five years.
Probation Officers are appointed, whose duties are defined by section 5 of the 1920 Act, which reads as follows:—
It shall be the duty of a Probation Officer, when so required by the Court,—
” To make inquiries as to the character and personal history of any person accused or convicted of an offence, and as to such other matters in relation to such person as the Court may direct, and to report fully thereon to the Court in writing; and
“ To keep a full record of such inquiries and of the results thereof.
It shall be the special duty of the Probation Officer, it satisfied in any case that the best interests of the public and of the offender would be served by the release of the offender on probation, to recommend to the Court that he be so released.”
The conditions of release on probation are set out as follows:—
” That the offender shall report himself in person where directed within twenty-four hours after his release on probation:
” That he shall report himself in person between the hours of nine in the morning and nine in the evening of such day or days (being not less than once in every month) as may be specified in that behalf in the order, or as may be required by the Probation Officer, and at such place or places as may be directed: Provided that the Probation Officer may, if he thinks fit, authorize him to report in writing in lieu of in person on any occasion:
” That he shall reside at an address notified to the Probation Officer, and that he shall sleep at such address unless the Probation Officer otherwise approves in writing:
” That if he removes from such address he shall give to the Probation Officer at least forty-eight hours' notice of his intention so to do; and if he removes to any place within the district of another Probation Officer he shall, within twenty-four hours after such removal, notify the fact of his removal, and his address and employment, to the Probation Officer in that district:
” That the nature and place of his employment shall be made known to and be approved by the Probation Officer:
” That he shall not associate with any person or persons or with any class of persons with whom the Probation Officer has in writing warned him not to associate:
” That he shall be of good behaviour, and shall commit no offence against the law:
” Such other special conditions as the Court may, in its discretion, impose.”
A breach of the conditions of the probationary license renders the offender liable to imprisonment or fine, and in addition he may, in respect of the original offence, be either committed to prison or again released on probation.
The effect of the legislation of 1920 has been to greatly increase the number of cases in which probation is extended to an offender. According to a return prepared by the Chief Probation Officer, 658 persons were placed on probation in the year 1925, as against 586 in 1924, 572 in 1923, 508 in 1922, and 575 in 1921.
The following table gives the ages and terms of probation of offenders dealt with under the provisions of the Act during the year 1925:—
| Age In Years. | 6 Months or under. | 1 Year. | 18 Months. | 2 Years. | 3 Years. | 4 Years. | 5 Years. | Totals. |
|---|---|---|---|---|---|---|---|---|
| 10 and under 15 | 6 | .. | 3 | 2 | .. | .. | 11 | |
| 15 ,, 20 | 12 | 72 | 6 | 71 | 46 | 3 | 2 | 212 |
| 20 ,, 25 | 2 | 57 | 3 | 66 | 26 | 2 | 3 | 159 |
| 25 ,, 30 | 3 | 31 | 1 | 45 | 16 | .. | 2 | 98 |
| 30 ,, 40 | 5 | 48 | 1 | 31 | 19 | 1 | 1 | 106 |
| 40 ,, 50 | 4 | 14 | 1 | 21 | 5 | .. | 2 | 47 |
| 50 ,, 60 | .. | 5 | 11 | 1 | .. | .. | 17 | |
| 60 ,, 70 | 3 | 2 | .. | 2 | .. | .. | .. | 7 |
| 70 and over | .. | .. | .. | .. | 1 | .. | .. | 1 |
| Totals | 29 | 235 | 12 | 250 | 116 | 6 | 10 | 658 |
Offences committed by juvenile offenders—i.e., persons under, or apparently under the age of sixteen—constitute a class worthy of special consideration. Figures of juvenile cases in Magistrates' Courts during each of the last ten years are as follows:—
| MAGISTRATES' COURTS.—JUVENILE CASES, 1916–25. | ||||||
|---|---|---|---|---|---|---|
| Year. | Total Cases. | Discharged for want of Prosecution or Evidence. | Dismissed on the Merits. | Admonished and discharged. | Committed for Trial or Sentence. | Summarily convicted. |
* New heading, 1917. | ||||||
| 1916 | 1,687 | 464 | 83 | * | 5 | 1,135 |
| 1917 | 1,585 | 99 | 87 | 503 | 9 | 887 |
| 1918 | 1,552 | 122 | 44 | 552 | 3 | 831 |
| 1919 | 1,759 | 115 | 55 | 643 | 20 | 926 |
| 1920 | 1,579 | 80 | 59 | 646 | 17 | 777 |
| 1921 | 1,391 | 66 | 44 | 637 | 12 | 632 |
| 1922 | 1,254 | 50 | 59 | 627 | .. | 518 |
| 1923 | 1,149 | 59 | 57 | 618 | 12 | 403 |
| 1924 | 1,475 | 48 | 56 | 754 | 5 | 612 |
| 1925 | 1,461 | 71 | 58 | 716 | 6 | 610 |
The increasing utilization of the provision which enables a Magistrate to admonish and discharge an offender without a conviction being recorded renders comparisons on the basis of summary convictions inadvisable, as it is obvious from a glance at the figures for 1916 and 1917 that many who in 1917 and subsequent years have been admonished and discharged would prior to that year have been included among the convicted, though a considerable proportion would have been included in the totals of “discharged for want of evidence” and “dismissed on the merits,” especially as the form of return then in use did not provide for “admonished and discharged” cases. Probably the best comparison between one year and another is obtained by taking the total number of juvenile cases, as in the following:—
| Year. | Number. | Per 1,000 of Mean Population. |
|---|---|---|
| 1916 | 1,687 | 1.53 |
| 1917 | 1,585 | 1.44 |
| 1918 | 1,552 | 1.40 |
| 1919 | 1,759 | 1.54 |
| 1920 | 1,579 | 1.32 |
| 1921 | 1,391 | 1.14 |
| 1922 | 1,254 | 1.00 |
| 1923 | 1,149 | 0.87 |
| 1924 | 1,475 | 1.09 |
| 1925 | 1,461 | 1.06 |
In the next table cases dealing with juveniles in 1925 are classified according to nature of offence and result of hearing. A high percentage of charges against juveniles is in respect of offences against property.
| Class of Offence. | Total. | Dismissed or withdrawn for Want of Prosecution or of Evidence. | Dismissed on the Merits. | Admonished and discharged. | Committed for Trial or Sentence. | Summarily convicted. |
|---|---|---|---|---|---|---|
| Against the person | 29 | 7 | 5 | 10 | 1 | 6 |
| Against property (including forgery) | 1,147 | 42 | 43 | 621 | 5 | 436 |
| Against good order | 197 | 6 | 8 | 53 | .. | 130 |
| Other | 88 | 16 | 2 | 32 | .. | 38 |
| Totals | 1,461 | 71 | 58 | 716 | 6 | 610 |
The principal of the offences against the person in 1925 was common assault, which was responsible for 21 cases, resulting in the offender being convicted in 4 cases and admonished and discharged in 9. Indecent assault resulted in 1 juvenile offender being committed to the Supreme Court for sentence, and 1 admonished and discharged, while 2 were summarily convicted, the remaining 3 being dismissed.
Theft was the principal offence against property, 748 charges being dealt with in 1925. The case was dismissed in 55 instances, 307 offenders were summarily convicted, and no fewer than 385 admonished and discharged. These figures do not include housebreaking and stealing, which was the offence in 66 cases. There were also 4 charges of receiving stolen property.
Wilful damage, mischief, &c., is also an important class of offence in juvenile cases, being responsible for 232 charges in 1925. Forty-seven offenders were convicted, and 166 admonished and discharged.
Of the 197 cases under the heading of “Offences against good order,” breaches of by-laws accounted for 78 (35 admonished and discharged and 41 convicted) and breaches of traffic regulations and of Lights on Vehicles and Motor Regulations Acts for 73 (67 convicted), while in 29 cases (10 admonished and discharged and 11 convicted) the offence was indecent, riotous, or offensive conduct.
Breaches of the Arms Act, with 38 cases, was the principal of the “other offences” in 1925, 18 resulting in the offenders being admonished and discharged and 17 in conviction. The only other offence under this heading with more than 10 cases was breaches of the Health Act with 11 cases dismissed, 10 admonished and discharged, and only 4 convictions. The number of cases of this offence brought before Juvenile Courts is unusually large, but may be accounted for by the strict regulations in force during the infantile-paralysis epidemic early in the year when children were prohibited from attending theatres and other public gatherings.
Offences by juveniles are seldom of a very serious nature, and even when a conviction is recorded Magistrates frequently adopt the course of discharging the offender or of ordering him to come up for sentence when called upon. In the latter case it rests almost entirely with the offender himself as to whether any farther steps will be taken, and it is found that in very few cases does the future conduct of the convicted person render it necessary for him to be brought before the Magistrate again for sentence.
The punishments meted out to juvenile offenders in 1925 were as follows:—
| MAGISTRATES' COURTS.—CONVICTIONS OF JUVENILE OFFENDERS, 1925.Class of Offence and Punishment. | |||||
|---|---|---|---|---|---|
| Punishment. | Against the Person. | Against Property. | Against Good Order. | Other. | Totals. |
| Released on probation | 3 | 112 | .. | .. | 115 |
| Convicted and discharged | 1 | 83 | 12 | 12 | 108 |
| Convicted and ordered to come up for sentence | .. | 61 | 8 | 3 | 72 |
| Committed to industrial school | 2 | 119 | 1 | 2 | 124 |
| Committed to Borstal institution or to non-Government institutions | .. | 6 | .. | .. | 6 |
| Fined | .. | 22 | 102 | 13 | 137 |
| Imprisoned | .. | 1 | .. | 1 | 2 |
| Whipped | .. | 21 | .. | .. | 21 |
| Bound over with or without sureties | .. | .. | 1 | .. | 1 |
| Order made | .. | 11 | 6 | 7 | 24 |
| Total summary convictions | 6 | 436 | 130 | 38 | 610 |
Information concerning the Child Welfare Act, under which Children's Courts are constituted to deal with cases affecting children, is contained in Section VIII of this volume.
Beyond the information disclosed by the Magistrates' Court returns as to committals for sentence or trial, no statistics of juvenile cases in Supreme Courts are available. From the table on the previous page, however, it is obvious that very few such cases find their way to the higher Court.
Similarly, juvenile prisoners are almost non-existent, it being the custom where restraint is necessary to commit offenders to industrial schools rather than to prisons or Borstal institutions. The prison statistics show that only eight persons under the age of sixteen were received into gaol during 1925. Of these, 2 males were sentenced to reformative detention and 1 to imprisonment for less than one week, while 2 females were sentenced to reformative detention and 3 to detention in a Borstal institution.
Crime amongst women in New Zealand is not extensive. Of 44,017 summary convictions in Magistrates' Courts in 1925 only 1,988, or 4.52 per cent., were of females. Drunkenness, including the issue of prohibition orders, was responsible for 494 convictions, theft 215, fraud and false pretences 49, wilful damage 15, common assault 10, attempted suicide 11, offensive conduct or language 36, vagrancy 62, and offences against the revenue laws 20. A large proportion of the convictions was in respect of minor breaches of the law, including 73 cases of Sunday-trading; 150 breaches of by laws; 304 breaches of traffic regulations, Lights on Vehicles Act, and Motor-vehicles Act; 120 of Licensing Act; 97 of Impounding Act; 76 of Destitute Persons Act; 27 of Health Act; and 52 of Shops and Offices Act.
The exclusion of multiple charges in respect of offences committed in conjunction reduces the number of summary convictions of females to 1,684, including 534 arrest cases, which represent only 413 distinct persons. The number of distinct persons concerned in the 1,150 summons cases cannot be ascertained.
In addition to the 1,988 summary convictions of women in Magistrates' Courts during the year there were 57 committals to the Supreme Court—19 for sentence and 38 for trial. The Supreme Court statistics show that 34 charges against females were dealt with during the year, resulting in 19 convictions, representing 11 distinct persons. In addition, 13 women were sentenced after committal for sentence in respect of 23 offences.
The number of distinct female prisoners received into prison during 1925 was 129, the principal offences of these being—vagrancy, 38; drunkenness, 26; and theft, 30. The actual number of receptions of female prisoners during the year was 328, this number including Maoris, and the daily average number of women prisoners in gaol was 75.26. Two reformatories (at Addington and Point Halswell) house women prisoners only. There is also a Borstal institution at Point Halswell for women only.
The statistics available on the subject indicate that crime among the New-Zealand-born is less than among the rest of the population of the Dominion. As explained previously, information as to birthplace and age is available in arrest cases, and the figures for 1925 show that of 8,444 persons convicted in Magistrates' Courts after arrest, 4,044, or 48 per cent., were New-Zealand-born (including 352 Maoris). While New-Zealand-born males formed 59 per cent. of the total male population at ages 20 and over at the Census of 1921, they formed in 1925 only 44 per cent. of males of those ages convicted in Magistrates' Courts after arrest.
A summary of offences and ages of distinct New-Zealand-born persons convicted during 1925 is given (females are included).
| OFFENCES AND AGES.—NEW ZEALAND-BORN ONLY (INCLUDING MAORIS). | |||||||
|---|---|---|---|---|---|---|---|
| Offences against | Under 20. | 20 and under 25. | 25 and under 30. | 30 and under 43. | 40 and over. | Not stated. | Totals. |
| The person | 10 | 36 | 28 | 47 | 35 | 1 | 157 |
| Property | 205 | 204 | 147 | 161 | 143 | 6 | 866 |
| Good order | 57 | 307 | 344 | 819 | 1,277 | 14 | 2,818 |
| Other offences | 25 | 26 | 34 | 61 | 57 | .. | 203 |
| Totals | 297 | 573 | 553 | 1,088 | 1,512 | 21 | 4,044 |
During the year 1925, 1,190 male and 86 female distinct New-Zealand-born prisoners were received into prison under sentence.
The following table shows the ages of distinct New-Zealand-born prisoners received into gaol during the last five years. The proportion of New-Zealand-born to total male prisoners at ages 20 and over was in 1925 44 per cent., as compared with the 59 per cent. shown previously as being the corresponding proportion in the population.
| AGES OF DISTINCT NEW-ZEALAND-BORN CONVICTED PRISONERS RECEIVED INTO PRISON, 1921–25. | ||||||||
|---|---|---|---|---|---|---|---|---|
| Year. | Under 15. | 15 and under 20. | 20 and under 25. | 25 and under 30. | 30 and under 40. | 40 and over. | Not stated. | Totals. |
| 1921 | .. | 90 | 165 | 142 | 289 | 300 | 3 | 989 |
| 1922 | .. | 146 | 259 | 171 | 304 | 312 | .. | 1,192 |
| 1923 | 1 | 115 | 216 | 207 | 354 | 379 | 1 | 1,273 |
| 1924 | .. | 99 | 215 | 192 | 328 | 415 | 1 | 1,250 |
| 1925 | .. | 99 | 217 | 194 | 292 | 471 | 3 | 1,276 |
The number of convictions of Maoris brought before Magistrates' Courts for the last ten years is shown in the following table:—
| SUMMARY CONVICTIONS OF MAORIS (MAGISTRATES' COURTS), 1916–25. | ||||||
|---|---|---|---|---|---|---|
| Year. | Offences. | |||||
| Against the Person. | Against Property. | Against Good Order. | Other Offences. | Totals. | ||
| Drunkenness.* | Other. | |||||
* Excluding prohibition-order cases. | ||||||
| 1916 | 44 | 152 | 296 | 393 | 378 | 1,263 |
| 1917 | 50 | 185 | 320 | 373 | 490 | 1,418 |
| 1918 | 66 | 190 | 297 | 407 | 458 | 1,418 |
| 1919 | 150 | 272 | 411 | 620 | 482 | 1,935 |
| 1920 | 100 | 275 | 390 | 472 | 614 | 1,851 |
| 1921 | 75 | 297 | 314 | 444 | 548 | 1,678 |
| 1922 | 67 | 238 | 216 | 327 | 520 | 1,368 |
| 1923 | 83 | 276 | 244 | 404 | 499 | 1,506 |
| 1924 | 55 | 297 | 264 | 362 | 513 | 1,491 |
| 1925 | 73 | 344 | 310 | 469 | 458 | 1,654 |
Distinct Maoris convicted after arrest in 1925 numbered 352. The ages of these are given in the following table, in combination with information as to the class of offence:—
| AGES AND OFFENCES OF DISTINCT MAORIS CONVICTED (ARRESTS ONLY), 1925. | |||||||
|---|---|---|---|---|---|---|---|
| Offences against | Under 20. | 20 and under 25. | 25 and under 30. | 80 and under 40. | 40 and over. | Unspecified. | Totals. |
| The person | .. | 3 | 4 | 7 | 3 | 1 | 23 |
| Property | 45 | 31 | 14 | 9 | 8 | 5 | 112 |
| Good order | 10 | 30 | 47 | 45 | 66 | 14 | 212 |
| Other offences | 3 | 2 | .. | .. | .. | .. | 5 |
| Totals | 58 | 71 | 65 | 61 | 77 | 20 | 352 |
The number of Maoris convicted in the higher Courts exhibits the extent of serious crime amongst the Native race. Those sentenced in the Supreme Court after pleading guilty in the lower Court have been included.
| Year. | Maoris convicted or sentenced in Supreme Court for | Totals. | |||
|---|---|---|---|---|---|
| Offences against the Person. | Offences against Property. | Forgery and Offences against the Currency. | Miscellaneous Offences. | ||
| 1921 | 10 | 20 | 6 | 4 | 40 |
| 1922 | 9 | 11 | 2 | 1 | 23 |
| 1923 | 8 | 9 | 5 | 1 | 23 |
| 1924 | 7 | 9 | 3 | 1 | 20 |
| 1925 | 17 | 16 | 6 | 2 | 41 |
Thirty-seven of the number for 1925 had been sent up from Magistrates' Courts for sentence.
The number of distinct Maori prisoners received into gaol under sentence during 1925 was 129 (including 7 women), as compared with 105 in 1924.
The extent to which convictions for drunkenness swell the total of convictions is obvious from the information given throughout this section. Drunkenness is a peculiar class of offence, and one to which considerable attention is paid in New Zealand and elsewhere, and some further particulars concerning statistics of drunkenness are accordingly given below.
The number of convictions for drunkenness, including drunkenness with disorderly conduct, during 1925 totalled 7,702 against males and 404 against females. In addition, there were 1,546 technical convictions in cases of applications for the issue of prohibition orders. Prohibition-order cases are not included in the following table, which shows the number of convictions for drunkenness recorded, and the proportion per 1,000 of the mean population of each sex, during the last ten years:—
| CONVICTIONS FOR DRUNKENNESS, 1916–25. | ||||||
|---|---|---|---|---|---|---|
| Year. | Convictions. | Per 1,000 of Mean Population. | ||||
| Males. | Females. | Totals. | Males. | Females. | Totals. | |
| 1916 | 10,228 | 770 | 10,998 | 17.70 | 1.35 | 9.57 |
| 1917 | 8,278 | 619 | 8,897 | 14.53 | 1.07 | 7.74 |
| 1918 | 6,761 | 535 | 7,296 | 11.95 | 0.91 | 6.33 |
| 1919 | 7,579 | 488 | 8,067 | 12.68 | 0.82 | 6.76 |
| 1920 | 8,374 | 519 | 8,893 | 13.17 | 0.86 | 7.16 |
| 1921 | 8,341 | 463 | 8,804 | 12.77 | 0.74 | 6.90 |
| 1922 | 5,982 | 331 | 6,313 | 8.97 | 0.52 | 4.84 |
| 1923 | 6,543 | 392 | 6,935 | 9.65 | 0.60 | 5.22 |
| 1924 | 6,729 | 394 | 7,123 | 9.75 | 0.59 | 5.27 |
| 1925 | 7,702 | 404 | 8,106 | 10.89 | 0.60 | 5.86 |
Of the total convictions for drunkenness during 1925, 7,744 (7,350 males and 394 females) were arrest cases, while 362 (352 males and 10 females) were cases brought before the Magistrate by summons. The following table shows the birthplaces and ages of all persona arrested and convicted for drunkenness during the year. Birthplaces and ages in summons cases are not obtainable.
| BIRTHPLACES AND AGES OF PERSONS CONVICTED FOR DRUNKENNESS (ARRESTS ONLY), 1925. | |||||||
|---|---|---|---|---|---|---|---|
| Birthplace. | Under 20 | 20 and under 25. | 25 and under 30. | 30 and under | 40 and, under 60. | 60 and over, and Unspecified. | Totals. |
| New Zealand— | |||||||
| Maoris | 3 | 31 | 41 | 47 | 60 | 29 | 211 |
| Others | 29 | 265 | 369 | 1,021 | 1,527 | 119 | 3,330 |
| Australia | 2 | 23 | 36 | 127 | 255 | 43 | 486 |
| England and Wales | 4 | 64 | 103 | 343 | 749 | 178 | 1,441 |
| Scotland | 2 | 25 | 54 | 145 | 386 | 127 | 739 |
| Ireland | 16 | 37 | 177 | 454 | 186 | 870 | |
| Other European countries | .. | 12 | 21 | 59 | 120 | 40 | 252 |
| Asia | .. | 2 | 3 | 5 | 14 | 2 | 26 |
| Africa | .. | 1 | 1 | 8 | .. | 2 | 12 |
| America | .. | 18 | 12 | 25 | 36 | 15 | 106 |
| Other (including unspecified) | .. | .. | .. | 3 | 10 | 258 | 271 |
| Totals | 40 | 457 | 677 | 1,960 | 3,611 | 999 | 7,744 |
Among the New-Zealand-born population (including Maoris) there is evidence of less drunkenness than among persons who have come from abroad. It will be seen that in all but one of the age-groups given in the following table the percentage of convictions of New-Zealand-born males is lower than the corresponding percentage of population, while the reverse is, of course, true in respect of males born outside the Dominion—
| Age, in Years. | Percentage of Male Population, Census 1921. | Percentage of Convictions for Drunkenness, 1925 (Arrest Cases) | ||
|---|---|---|---|---|
| New-Zealand-born. | Others. | New-Zealand-born. | Others | |
| 20 and under 25 | 82.61 | 17.39 | 82.91 | 17.09 |
| 25 ,, 30 | 75.62 | 24.38 | 60.56 | 39.44 |
| 30 ,, 40 | 68.02 | 31.98 | 54.49 | 45.51 |
| 40 ,, 50 | 59.26 | 40.74 | 47.65 | 52.35 |
| 50 ,, 60 | 45.20 | 54.80 | 36.81 | 63.19 |
| 60 ,, 70 | 19.76 | 80.24 | 17.34 | 82.66 |
| 70 ,, 80 | 10.97 | 89.03 | 14.38 | 85.62 |
Repeated charges against the came person are included in the totals shown in the preceding tables. Dealing with arrests only (males, 7,350; females, 394: total 7,744), it is found that the number of distinct persons convicted of this offence was 4,783 (4,561 males and 222 females), or 62 per cent. of the total “arrest” convictions for drunkenness.
The total convictions for all offences (arrests only) in 1925 were 13,848, but the distinct convictions amounted to only 11,719, the former total including 2,129 convictions for multiple charges against the same person at the same time. Of the latter, 1,119 were in respect of charges dealt with at the same time as the offender was convicted of drunkenness, the principal associated offences being—
| Offence. | Number of Convictions. |
|---|---|
| Common assault | 75 |
| Theft | 46 |
| Wilful damage | 113 |
| Assaulting, resisting, or obstructing police | 105 |
| Indecent, riotous, or offensive conduct | 168 |
| Obscene, threatening, or abusive language | 215 |
| Vagrancy | 87 |
| Breaches of Licensing Act | 235 |
In addition, there were 56 eases where a prohibition order was issued against a person convicted at the same time of drunkenness.
Any person who has been three times convicted for drunkenness within the nine months immediately preceding any conviction for drunkenness may be declared an habitual drunkard. A Magistrate may, in addition to or in lieu of a penalty, commit an habitual drunkard to any institution authorized by the Governor-General to receive and detain such persons for any period not being less than twelve months. The law makes provision in respect of the discharge of inmates, their good conduct, discipline, and punishment for offences during detention, and for the proper inspection of such institutions.
Drunkenness is usually punished by a fine, the returns for 1925 showing that of the 8,106 persons convicted of drunkenness as many as 4,972 were fined, while 850 went to gaol in preference to paying the fine, 198 were peremptorily imprisoned, and 37 (including 19 habitual drunkards) committed to a Salvation Army Home or other such institution. No fewer than 1,985 were convicted and discharged, 34 were ordered to come up for sentence, 2 were placed on probation, and an order was made in 28 cases.
A calculation of the amount of alcoholic liquor consumed per head of mean population during the last five years is given below:—
| CONSUMPTION OF BEER, WINE, AND SPIRITS PER HEAD OF MEAN POPULATION. | ||||||
|---|---|---|---|---|---|---|
| Including Maoris. | Excluding Maoris. | |||||
| Beer. Gal. | Wine. Gal. | Spirits. Gal. | Beer. Gal. | Wine. Gal. | Spirits. Gal. | |
| 1921 | 11.238 | 0.177 | 0.790 | 11.722 | 0185 | 0.824 |
| 1922 | 9.596 | 0.088 | 0.285 | 10.004 | 0.092 | 0.297 |
| 1923 | 9.790 | 0.118 | 0.465 | 10.195 | 0.123 | 0.485 |
| 1924 | 10.028 | 0.144 | 0.474 | 10.445 | 0.150 | 0.493 |
| 1925 | 9.560 | 0.163 | 0.518 | 9.953 | 0.169 | 0.539 |
The quantity of each kind of alcoholic liquor entered at the Customs for consumption (including beer on which excise duty was paid) was as follows during the same period:—
| Beer. Gal. | Wine. Gal. | Spirits. Gal. | |
|---|---|---|---|
| 1921 | 14,347,111 | 225,987 | 1,008,875 |
| 1922 | 12,524,191 | 115,180 | 371,857 |
| 1923 | 12,994,243 | 157,774 | 618,142 |
| 1924 | 13,565,071 | 194,928 | 641,236 |
| 1925 | 13,234,918 | 225,136 | 717,119 |
Table of Contents
THE New Zealand Military Forces consist of the Permanent Forces, the Territorial Force, and the Senior Cadets.
The units of the Permanent Forces are the New Zealand Staff Corps, the Royal New Zealand Artillery, the New Zealand Permanent Air Force, the New Zealand Permanent Staff, the New Zealand Army Ordnance Corps, the New Zealand Army Pay Corps, the New Zealand Permanent Army Service Corps, the New Zealand Army Medical Corps, and the General Duty Section of the New Zealand Permanent Forces.
The establishment of the New Zealand Permanent Forces provides for 106 professional officers, who are charged with the training of the Forces and the administration of all matters connected therewith.
The Royal New Zealand Artillery has an establishment of 100 “other ranks,” with provision for 12 extra as supernumerary to the establishment. It supplies the necessary instructors for the Territorial Artillery, provides cadres for the Field Artillery units, and maintains the harbour-defences and artillery equipment throughout the Dominion.
The New Zealand Permanent Air Force has an establishment of 6 officers (included in the 106 above-mentioned) and 22 “other ranks.”
The New Zealand Permanent Staff, with a strength of 127, provides drill instructors and custodians of Defence property and equipment, and also carries out administrative functions.
The New Zealand Army Ordnance Corps comprises 6 officers (included in the 106 for the New Zealand Permanent Forces) and 110 “other ranks,” who are in charge of the mobilization equipment and bulk depots of the Forces.
The New Zealand Army Pay Corps comprises 5 officers (included in the 106 above-mentioned) and 11 “other ranks.”
The New Zealand Permanent Army Service Corps has an establishment of 10 “other ranks.”
The establishment for the New Zealand Army Medical Corps is 1 officer and 1 “other rank.”
The General Duty Section consists of 22 “other ranks,” who are employed as firemasters, caretakers, range wardens, night-watchmen, &c.
For purposes of defence the Dominion is divided into three commands—the Northern Command comprising roughly the northern half of the North Island, the Central Command comprising the remainder of the North Island, and the Southern Command comprising the South Island, Stewart Island, and the Chatham Islands.
These commands are each divided into four regimental districts, and each command contains the following units of the New Zealand Territorial Force:—
Three regiments of Mounted Rifles, seven batteries of Artillery, one Engineer Depot, one Signals Depot, four battalions of Infantry, one Army Service Corps Depot, and one Medical Depot.
This organization on mobilization produces one complete division and three brigades of Mounted Rifles, and provides the machinery by which this force could be duplicated and kept up to strength.
The present strength of the Territorial Force is 739 officers and 19,657 “other ranks.”
The Senior Cadets are organized in battalions, and receive physical and elementary military training. The strength of the Senior Cadets is 444 officers and 31,972 “other ranks.”
Rifle clubs exist throughout the Dominion for the encouragement of rifle shooting, and, in addition to minor fixtures, a Dominion rifle meeting is held at Trentham annually when practicable.
All male inhabitants of New Zealand who have resided therein for six months and are British subjects are liable to be trained as follows:—
In the Senior Cadets—from fourteen years of age, or date of leaving school (if later), to eighteen years of age (or in the case of those who at the age of eighteen are attending a secondary school, then to the date of their leaving school).
In the Territorial Force—from eighteen years (or from any later date on which they cease to attend a secondary school as aforesaid) to twenty-five.
The full period of service in the Territorial Force to which trainees are liable is not, however, carried out at present, all men who have fulfilled their obligations being transferred to the Reserve in June of the year they reach the age of twenty-one years.
New Zealand supplied ten contingents for service during the South African War. These comprised a total of 6,500 officers and men.
Immediately the Great European War broke out an Expeditionary Force was despatched to Western Samoa and occupied those islands, while a larger force in the form of a mixed brigade was despatched to Europe. The latter force was, however, landed in Egypt, and took part in the defence of the Suez Canal. It gave a good account of itself in the desperate campaign on Gallipoli, and after being withdrawn to Egypt was expanded into a Division and a Mounted Brigade. The Division then went to the western front, while the Mounted Brigade continued to operate against the Turks in Palestine. Both forces became famous for their military qualities, and took part in practically all the great actions of their respective theatres up to the Armistice.
A total of 100,000 troops left New Zealand for service with the New Zealand Expeditionary Force, and nearly 17,000 lost their lives on active service.
On the Armistice, being declared in November, 1918, New Zealand had 52,000 troops in the field, while 10,000 more were ready to embark or were under training.
The tremendous amount of transport work involved in the conveyance of these forces to Egypt, France, Britain, Gallipoli, and Samoa was carried out with extraordinary success, not one New Zealand transport having been lost while conveying troops.
The troops provided for foreign service represented nearly 10 per cent. of the total population of the Dominion in 1914, and over 40 per cent. of the male population between the ages of twenty and forty-five years, while it is known that a very large number of other New-Zealander3 served in the British or Australian Naval or Military Forces.
The Headquarters of the New Zealand Military Forces is at Wellington.
By the Australasian Defence Act, 1887, provision was made for the payment by New Zealand of a proportional part of the cost of the establishment and maintenance of a British. Naval Force to be employed for the protection of trade in Australian and New Zealand waters. Under this Act a sum of approximately £20,000 per annum was paid by the New Zealand Government to the Imperial Government.
In 1903, consequent on the passing of the Australian and New Zealand Naval Defence Act, the annual contribution payable by New Zealand was raised to “a sum not exceeding £40,000.”
By the Naval Subsidy Act, 1908, the contribution of the Dominion was again increased, this time to a sum of £100,000 payable annually for ten years from the 12th May, 1909.
In 1909 New Zealand presented the battle-cruiser “New Zealand” to the Imperial Government. Full information concerning this vessel and her visit to New Zealand in 1913 appears in the 1913 issue of this book (pages 932–941). This ship was scrapped as a result of the Washington Conference, 1921–22.
The Naval Defence Act, 1913, provided for the establishment of a New Zealand Naval Force by voluntary enlistment for a prescribed period; the period of first engagement was by Order in Council fixed at twelve years, or until the age of thirty is reached, with subsequent re-engagement periods of five years. Members on discharge are drafted into the New Zealand Royal Naval Reserve for a further prescribed period—i.e., for ten years or until the age of forty—for service only in time of war. The ships and personnel forming the Force pass under the control and disposal of the Government of Great Britain in time of war.
A New Zealand Division was inaugurated in 1914, immediately prior to the war, when H.M.S. “Philomel” was commissioned with ranks and ratings lent from the Royal Navy to serve as a training-ship. The “Philomel” was employed under the orders of the British Admiralty throughout the war, and thus no opportunity was afforded for the commencement of a scheme of training. After her service during the war the ship was refitted as a training-ship, and was commissioned on the 1st March, 1921, at Wellington. She received her first batch of recruits in May, 1921.
In 1919 Admiral of the Fleet Viscount Jellicoe of Scapa, G.C.B., O.M., G.C.V.O., visited New Zealand in H.M.S. “New Zealand,” and presented his report making recommendations and suggestions for the naval defence of the Dominion.
In 1920, H.M.S. “Chatham” was loaned free of charge to New Zealand by the British Government, and was commissioned on the 1st October of that year with officers and men of the Royal Navy: the officers on loan therefrom for three years, the men partly on loan, but mainly transferred to the New Zealand Division of the Royal Navy for a period of three years. Owing to an oil-burning vessel not being available, H.M.S. “Chatham” remained on the New Zealand Station until the 10th May, 1924, when she was replaced by H.M.S. “Dunedin,” the Commodore Commanding New Zealand Station transferring his broad pendant and the ship assuming the duties of flagship. On 21st October, 1925, H.M.S. “Diomede” was commissioned at Portsmouth for service as a second cruiser in the New Zealand Division. The “Dunedin” and “Diomede” are sister ships and are loaned free of charge in the same manner as H.M.S. “Chatham,” the New Zealand Government being responsible for all payments for the ships and their personnel during the period of loan. Commodore George T. C. P. Swabey, D.S.O., relieved Commodore Alister Beal, C.M.G., A.D.C., in command of the New Zealand Station in August, 1926.
During 1925 arrangements were made for the purchase of a trawler for the purpose of training reservists on the station, &c. This vessel, which has been named “Wakakura,” was commissioned on 8th April, 1926, and is due to arrive in New Zealand in October, 1926.
A Naval Board was constituted by Order in Council of the 14th March, 1921, charged with the control of all matters relating to the Naval Forces, upon the policy directed by the Minister, and vested with the executive command of the Naval Forces. The Board is composed of the Minister of Defence (President) and the following members: the Commodore Commanding New Zealand Station (First Naval Member), the Chief Staff Officer to the Commodore (Second Naval Member), the Secretary to the Commodore Commanding (Secretary to the Board).
By Order in Council of the 20th June, 1921, it was provided that the ships and personnel comprising the New Zealand Naval Forces should be described respectively as forming and belonging to “The New Zealand Division of the Royal Navy,” which is the official designation of the Force.
Legislation was passed in February, 1922, authorizing the formation of a New Zealand Royal Naval Reserve by voluntary enlistment therein, in addition to the drafting thereto of ratings discharged from the seagoing forces. An Order in Council of the 10th July, 1922, prescribes the conditions of service in the various classes of the Reserve. All Reservists, other than those of the inactive Reserve, are required to perform specified periods of training in ships of the New Zealand Division. The Reserve will provide a nucleus for local defence. A small Reserve of Officers was approved by Order in Council dated 17th November, 1924, and commissions have been granted to officers enrolled. Two companies of the RN.T.V.R. Division (Class D) have been formed at Auckland, and it is proposed to form a third company during the current year. The number of all ratings enrolled in the New Zealand Royal Naval Reserve to the 31st March, 1926, is 378.
There is a small naval base at Devonport, Auckland, where H.M.S. “Philomel” acts as a depot-ship. Refits of H.M. ships are carried out at Devonport, where provision for oil-fuel storage has been made; two tanks have been erected. A naval oil-tank vessel (R.F.A. “Nucula”) is maintained by the New Zealand Government.
Up to 31st March, 1926, 420 New Zealand boys and youths have been entered for service in the division, principally in seaman and stoker ratings. All New Zealand ratings showing special aptitude in their respective branches are sent to England to undergo specialist courses in gunnery, torpedo, mechanical training, and other schools, and to gain some knowledge of the work in a large squadron. Every encouragement is given to younger ratings to undertake these courses, and it is gratifying to find that the first and second batches, which have now returned to New Zealand, obtained most satisfactory results.
Officers, are in the majority of cases, lent from the Imperial Navy, and receive pay at Imperial rates. The pay of man of the New Zealand Division is approximately 20 per cent. higher than that of similar ratings in the Imperial Navy, and they are credited with deferred pay in lieu of pension. The deferred pay amounts to approximately £500 at the end of twelve years' service, or £1,200 after completing twenty-two years' service, and such a sum is invaluable in enabling men to start life ashore.
The amounts expended in respect of naval defence during the year 1925-26 were—
| £ | |
|---|---|
| Upkeep of New Zealand Division of Royal Navy | 441,203 |
| Debt charges (interest, sinking fund and repayments) on loan-money raised £ building battle-cruiser “New Zealand” | 57,788 |
| £498,991 |
H.M.S. “Veronica,” which has been on the New Zealand Station since 1920, was recommissioned in May. 1924, for further service on the station. H.M.S. “Laburnum” arrived in New Zealand waters from England in March, 1922, and was recommissioned in March, 1924. These two sloops are provided and maintained by the British Government, their duties consisting mainly of policing the South Pacific islands within the limits of the New Zealand Station.
Table of Contents
FROM the very earliest times New Zealand has inevitably been dependent upon foreign intercourse for its development and progress. The first European residents in New Zealand seem to have been the small party of sealers from Sydney who settled at Dusky Sound for ten months in 1792–93, and built there the first vessel made from local timber. The seals and whales of the South Seas attracted attention to the Islands as a convenient depot, and by 1800 there were established many little settlements where the blubber was tried out. In 1794 the timber trade was inaugurated by the visit of the “Fancy,” and the export of timber, mainly kahikatea (white-pine), rapidly grew to goodly proportions. The native flax (Phormium tenax) was also early recognized as a source of wealth, and a considerable export arose.
Thus, irregularly, the settlement of New Zealand went hand-in-hand with external trade, and was, indeed, promoted by the hope of commercial gain. The early exports were all local products as enumerated above, with the gruesome addition of tattooed Maori heads, while the imports were mainly muskets and powder.
The arrival of the New Zealand Company's expedition in 1840 stimulated the development of a more stable trade—wool had been exported to Hobart in 1839—and gradually the exports and imports of New Zealand took on their modern form. In 1852 the young colony was granted representative government, and from that date there is an accurate record of the external trade of the country. By 1856 full responsible or cabinet government was established.
By 1853 the export of flax had been practically ruined owing to increased competition from other sources, and the amount exported in that year was negligible. Timber, however, retained its place as a principal export, supplying 31 per cent. (£93,000) of the total exports; while wool had increased to 22 per cent. (£66,507). The value of grain exported was small, only £19,000 (6 per cent.); whale-oil amounted to £22,000, and potatoes to £30,000. The total exports in 1853 were £303,282, and the total imports £597,828.
A low and fluctuating level of trade was turned in 1860–63 into a rapidly increasing volume by the effect of the gold-discoveries which occurred in the early “sixties.” Both imports and exports were stimulated, the former to feed and clothe an ever-increasing population, the latter by the export of gold.
After the increase in the early “sixties,” trade remained stationary till the expenditure of borrowed money brought the land-boom of the early “seventies.” A great temporary increase of trade was succeeded by violent fluctuations and but slowly increasing trade as the effects of the bubble were slowly worked off. From 1873 till 1895 the world level of prices was falling continuously, and this factor contributed not a little to the depression of New Zealand. Little headway could be made against a falling price of wool and a decreasing production of gold, which were the main features of those twenty years.
But in 1895 world prices began to rise, and the effect is seen immediately in the upward shoot of the external trade. On only four occasions has this upward tendency been checked—in 1908, when the commercial crisis which was felt in the Old World a year previously affected New Zealand; in 1913, on the occasion of another depression of trade; in 1917–18, as a result of shortage of shipping; and again after 1920, in which year the colossal total of £108,037,774 was reached, due principally to heavy importations, which could not be maintained.
The following table shows the increase in the total trade since the year 1853:—
| TOTAL TRADE, IMPORTS, AND EXPORTS OF NEW ZEALAND, 1853–1925. | |||
|---|---|---|---|
| Year. | Total Trade. | Imports. | Exports. |
| £ | £ | £ | |
| 1853 | 901,110 | 597,828 | 303,282 |
| 1863 | 10,510,079 | 7,024,674 | 3,485,405 |
| 1873 | 12,075,058 | 6,464,687 | 5,610,371 |
| 1883 | 15,070,037 | 7,974,038 | 7,095,999 |
| 1893 | 15,896,879 | 6,911,515 | 8,985,364 |
| 1903 | 27,799,053 | 12,788,675 | 15,010,378 |
| 1906 | 33,306,540 | 15,211,403 | 18,095,137 |
| 1907 | 37,371,818 | 17,302,861 | 20,068,957 |
| 1908 | 33,788,778 | 17,471,284 | 16,317,494 |
| 1909 | 35,336,715 | 15,674,719 | 19,661,996 |
| 1910 | 39,231,792 | 17,051,583 | 22,180,209 |
| 1911 | 38,574,369 | 19,545,879 | 19,028,490 |
| 1912 | 42,747,155 | 20,976,574 | 21,770,581 |
| 1913 | 45,275,024 | 22,288,302 | 22,986,722 |
| 1914 | 48,117,543 | 21,856,096 | 26,261,447 |
| 1915 | 53,477,746 | 21,728,834 | 31,748,912 |
| 1916 | 59,626,220 | 26,339,283 | 33,286,937 |
| 1917 | 52,516,812 | 20,919,265 | 31,587,547 |
| 1918 | 52,750,195 | 24,234,007 | 28,516,188 |
| 1919 | 84,641,773 | 30,671,698 | 53,970,075 |
| 1920 | 108,037,774 | 61,595,828 | 46,441,946 |
| 1921 | 87,771,270 | 42,942,443 | 44,828,827 |
| 1922 | 77,738,810 | 35,012,561 | 42,726,249 |
| 1923 | 89,345,658 | 43,378,493 | 45,967,165 |
| 1924 | 101,140,314 | 48,527,603 | 52,612,711 |
| 1925 | 107,718,679 | 52,456,407 | 55,262,272 |
For the twelve months ended 31st December, 1925, the total overseas trade of the Dominion amounted to £107,718,679, a figure which has been surpassed once only in the history of the Dominion—in 1920, when phenomenal imports of £61,595,828 were instrumental in registering a total of £108,037,774. For 1925 the imports were £52,456,407, and exports £55,262,272. Disregarding “invisible” items, such as interest payments due abroad, the balance in favour of the Dominion was £2,805,865, as against £4,085,108 in 1924 and £2,588,672 in 1923.
Exports show an advance of £2,649,561 over the previous year, and are the highest yet recorded. An increase in the value of wool exported is mainly responsible for the increase. The value of wool exported during the year was £17,739,736, which compares with the 1924 value of £15,267,544. This increase of £2,472,192, considered in conjunction with the fact that the quantity shipped in 1925 (596,985 bales) was practically the same as for 1924 (593,033 bales), gives some indication of the record prices obtained. Butter shows a decline from £11,641,668 to £10,240,132, although the quantity shipped was very little less than during the previous year. Cheese fell from £7,023,297 to £5,800,808. Frozen meat shows an advance all round, which is due not so much to increased quantities exported as to better prices obtained. Figures under this heading are as follows (1924 values in parentheses): Frozen beef, £1,043,871 (£802,157); frozen lamb, £6,761,890 (£5,941,746); frozen mutton, £3,069,763 (£2,539,233). Additional items which showed an appreciable advance during the year are: Cattle hides, £702,236 (£597,743); rabbit-skins, £843,416 (£740,975); sheep-skins, £1,989,289 (£1,513,477); opossum-skins, £86,358 (£56,289); phormium fibre, £516,466 (£388,324); tow, £58,845 (£36,402); tallow, £895,061 (£799,230); sausage-casings, £675,848 (£563,887); honey, £53,156 (£29,721); coal, £235,047 (£161,432); timber, £573,882 (£472,120); potatoes, £39,948 (£5,147); onions, £8,594 (£1,233); beans and peas, £102,611 (£85,329); whale-oil, £10,541 (£6,515); manures, £15,184 (£4,982).
Noteworthy decreases, other than those already indicated, are as follows: Gold, £472,364 (£551,788); silver, £60,773 (£71,981); kauri-gum, £414,901 (£443,576); dried milk, £390,045 (£460,217); preserved milk and cream, £35,693 (£44,881); hops, £20,153 (£41,619); linseed, £6,684 (£12,552).
Imports aggregated £52,456,407, as compared with £48,527,603 in 1924, and with the exception of the boom year of 1920 are the highest on record. The most notable increases are again associated with the motor trade, and are as below: Motor-vehicles, £4,146,432 (£3,541,635); tires, covers, and tubes, £1,148,075 (£595,825); motor-spirit, n.e.i., £1,840,347 (£1,600,053,); and gasolene, £337,303 (£249,489). Benzine, on the other hand, dropped from £353,647 to £171,827. Substantial increases are also evident in: Apparel and ready-made clothing, n.e.i., £2,259,558 (£2,056,861); boots, shoes, and slippers, £981,709 (£891,234); hosiery, £541,609 (£466,896); drapery, n.e.i., £618,224 (£506,096); cotton piece-goods, £2,468,155 (£2,118,539); silks, satins, and velvets, £839,288 (£720,448); jute and hessian piecegoods, £202,825 (£133,218); bags and sacks, £455,109 (£317,751); sawn timber, £748,074 (£535,432); crude residual oil, £278,575 (£142,238); phosphates, £359,352 (£288,193); musical instruments, £608,961 (£478,967); flour, £124,229 (£22); confectionery, £313,727 (£269,676); whisky, £734,111 (£607,816); tobacco, £959,779 (£923,352); cigarettes, £800,927 (£696,283). Railway and tramway plant increased from £448,346 to £532,224. Continued activity in hydroelectric schemes is reflected in the imports of electrical machinery and equipment, amounted to £2,218,380, as against £2,056,454 in 1924.
A decline was recorded in the importation of the following items: Wheat, £798,090 (£1,039,774); oats, £20,209 (£179,540); sugar, £1,250,343 (£1,594,342); potatoes, £1,804 (£36,125); seeds, £202,242 (£274,371); coal, £682,711 (£779,510); arms, ammunition, and explosives, £219,699 (£327,518).
The following table shows the monthly movements of imports and exports during 1924, 1925, and the first six months of 1926:—
| ACTUAL MONTHLY FIGURESOF IMPORTSAND EXPORTS, 1924–26. | ||||||
|---|---|---|---|---|---|---|
| Month. | 1924. | 1925. | 1926. | |||
| Exports. | Imports. | Exports. | Imports. | Exports. | Imports. | |
| £ | £ | £ | £ | £ | £ | |
| January | 7,064,644 | 4,349,318 | 6,696,059 | 4,808,442 | 5,037,981 | 4,660,816 |
| February | 6,662,184 | 3,830,222 | 8,336,263 | 4,037,824 | 4,331,287 | 4,290,431 |
| March | 6,943,680 | 3,650,291 | 7,796,633 | 4,277,057 | 6,895,002 | 4,741,525 |
| April | 6,271,621 | 3,095,183 | 6,994,639 | 4,166,494 | 5,153,765 | 3,850,096 |
| May | 3,868,218 | 3,836,413 | 5,174,043 | 3,930,480 | 4,081,908 | 3,457,037 |
| June | 2,750,647 | 3,882,976 | 3,400,622 | 3,794,988 | 3,972,891 | 3,716,580 |
| July | 2,802,079 | 4,157,600 | 2,077,566 | 4,326,039 | ||
| August | 2,384,505 | 4,653,091 | 2,479,888 | 4,675,602 | ||
| September | 2,309,630 | 4,682,662 | 1,235,541 | 4,217,881 | ||
| October | 2,927,098 | 4,082,671 | 1,958,691 | 4,745,369 | ||
| November | 2,716,956 | 3,797,360 | 4,498,839 | 4,834,480 | ||
| December | 5,911,449 | 4,509,816 | 4,613,488 | 4,641,751 | ||
The figures are now given grouped on the basis of a three-monthly moving average, the values shown for each month representing an average of that month and the months immediately preceding and following. The three-monthly moving averages present the more accurate view in that they smooth out undue fluctuations in the figures due to monthly shipping and other local conditions.
| THREE-MONTHLY MOVING AVERAGEOF IMPORTSAND EXPORTS, 1924–26. | ||||||
|---|---|---|---|---|---|---|
| Month. | 1924. | 1925. | 1926. | |||
| Exports. | Imports. | Exports. | Imports. | Exports. | Imports. | |
| £ | £ | £ | £ | £ | £ | |
| January | 5,817,315 | 3,863,286 | 6,981,256 | 4,452,027 | 4,660,919 | 4,530,999 |
| February | 6,890,109 | 3,943,277 | 7,609,651 | 4,374,441 | 5,421,423 | 4,564,257 |
| March | 6,625,828 | 3,525,232 | 7,709,178 | 4,160,458 | 5,460,018 | 4,294,017 |
| April | 5,694,506 | 3,527,295 | 6,655,105 | 4,124,677 | 5,376,892 | 4,016,219 |
| May | 4,296,828 | 3,604,857 | 5,189,768 | 3,963,987 | 4,402,854 | 3,674,571 |
| June | 3,140,314 | 3,958,996 | 3,550,744 | 4,017,169 | ||
| July | 2,645,743 | 4,231,222 | 2,652,692 | 4,265,543 | ||
| August | 2,498,738 | 4,497,784 | 1,930,998 | 4,406,507 | ||
| September | 2,540,411 | 4,472,808 | 1,134,824 | 4,546,284 | ||
| October | 2,651,228 | 4,187,564 | 2,564,357 | 4,599,243 | ||
| November | 3,851,834 | 4,129,949 | 3,690,339 | 4,740,533 | ||
| December | 5,108,154 | 4,371,872 | 4,716,769 | 4,712,349 | ||
From the commencement of 1924 imports maintained a uniformly high level, with, however, a gradual upward trend until the second quarter of 1926, when a falling-off occurred as a natural sequence to the decline in the value of exports, which had set in some months earlier. In the case of exports the seasonal nature of the trade is well distinguished. From January to April usually occur the heaviest shipments of the year, after which the volume falls away until towards the close of the year, when the exportation of butter commences.
The three-monthly averages of imports and exports during the period are shown graphically in the appended diagram.
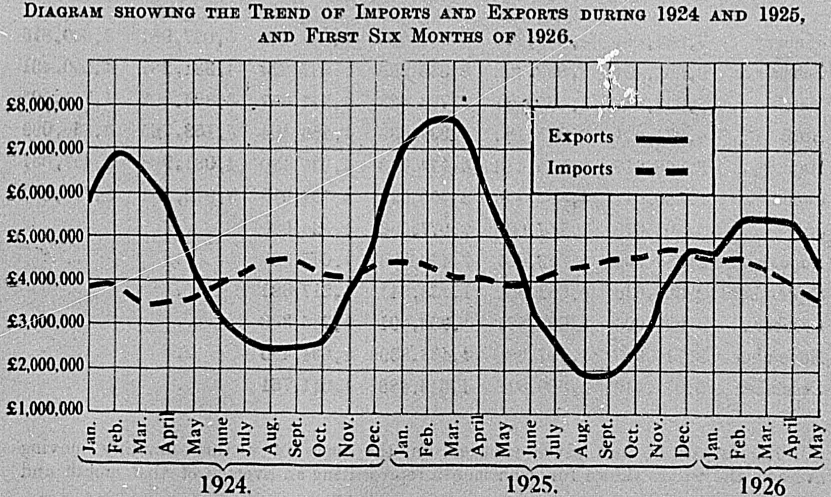
The dotted line, following a slightly upward course up to the end of 1925 well illustrates the gradual rise in the level of imports, while what has been said in regard to the seasonal nature of exports is well brought out by the heavy line with its annually recurring peak.
By reason of the seasonal nature of the principal commodities exported from the Dominion, well over half the exports are made during the first six months of each year. Thus during 1924 and 1925, when the yearly exports amounted to £52,612,711 and £55,262,272, the figures for the first half-year in each case were £33,560,994 and £38,398,259, representing 64 per cent. and 69 per cent. of the yearly figures. The fact that exports for the first half of the year 1926 have dropped to £29,472,834, points to the probability that the yearly figures also will be considerably less than for the two preceding years.
A further illustration of the fluctuating nature of the export trade is evident from the wide range in the monthly figures, which, taking the figures in the preceding table, vary from £1,235,541 in September, 1925, to £8,336,263 in February of the same year.
That the influx of imports is fairly constant throughout the whole year is evident from the fact that the largest monthly total in the table is £4,834,480 (November, 1925); and the smallest, £3,095,183 (April, 1924). In the three-monthly average the ranges in both imports and exports are, of course, not so great.
The next table shows the total trade, imports, and exports per head of the population for each of the years 1906–25:—
| TOTAL TRADE, IMPORTS, AND EXPORTSPER HEAD, 1906–25. | |||||||||
|---|---|---|---|---|---|---|---|---|---|
| Year. | Total Trade. | Imports. | Exports. | ||||||
| £ | s. | d. | £ | s. | d. | £ | s. | d. | |
| 1906 | 35 | 6 | 2 | 16 | 2 | 6 | 19 | 3 | 8 |
| 1907 | 38 | 13 | 1 | 17 | 17 | 11 | 20 | 15 | 2 |
| 1908 | 34 | 0 | 9 | 17 | 12 | 0 | 16 | 8 | 9 |
| 1909 | 34 | 13 | 3 | 15 | 7 | 6 | 19 | 5 | 9 |
| 1910 | 37 | 14 | 1 | 16 | 7 | 9 | 21 | 6 | 4 |
| 1911 | 36 | 5 | 2 | 18 | 7 | 5 | 17 | 17 | 9 |
| 1912 | 39 | 5 | 3 | 19 | 5 | 4 | 19 | 19 | 11 |
| 1913 | 40 | 9 | 7 | 19 | 18 | 7 | 20 | 11 | 0 |
| 1914 | 42 | 4 | 1 | 19 | 3 | 5 | 23 | 0 | 8 |
| 1915 | 46 | 10 | 8 | 18 | 18 | 2 | 27 | 12 | 6 |
| 1916 | 51 | 17 | 9 | 22 | 18 | 5 | 28 | 19 | 4 |
| 1917 | 45 | 14 | 1 | 18 | 4 | 2 | 27 | 9 | 11 |
| 1918 | 45 | 15 | 2 | 21 | 0 | 5 | 24 | 14 | 9 |
| 1919 | 70 | 19 | 4 | 25 | 14 | 4 | 45 | 5 | 0 |
| 1920 | 86 | 19 | 2 | 49 | 11 | 7 | 37 | 7 | 7 |
| 1921 | 68 | 15 | 0 | 33 | 12 | 9 | 35 | 2 | 3 |
| 1922 | 59 | 11 | 3 | 26 | 16 | 6 | 32 | 14 | 9 |
| 1923 | 67 | 5 | 4 | 32 | 13 | 2 | 34 | 12 | 2 |
| 1924 | 74 | 15 | 4 | 35 | 17 | 6 | 38 | 17 | 10 |
| 1925 | 77 | 16 | 2 | 37 | 17 | 10 | 39 | 18 | 4 |
Within the last twenty years the total trade per head of the population has increased from £31 3s. 11d. in 1905 to £77 16s. 2d. in 1925. The latter rate has been exceeded once only—in 1920, when abnormally high imports were responsible for the record of £86 19s. 2d. Within the same period the import rate has ranged from £14 1s. in 1905 to £49 11s. 7d. in 1920. The export rate was at its highest in 1919, when £45 5s. was recorded, while 1908 claimed the lower limit of £16 8s. 9d. High rates were experienced in the “sixties,” when, however, the population was comparatively small, while important gold-mining operations resulted in huge exports of gold and correspondingly high imports—factors which combined to give the earlier years of New Zealand's external trade a somewhat artificially high per capita rate.
The latest available comparative statistics show the Dominion's external trade per head to be greater than that of any other country. This favoured position is due, on the one hand, to the fact that the country is able to raise huge£ quantities of primary produce greatly in excess of local requirements, and, on the other hand, to the comparatively backward state of New Zealand's secondary industries, which necessitates the importation of considerable quantities of manufactured goods from abroad.
The diagram which follows shows graphically the imports, exports, and total trade per head of population during the last twenty years.
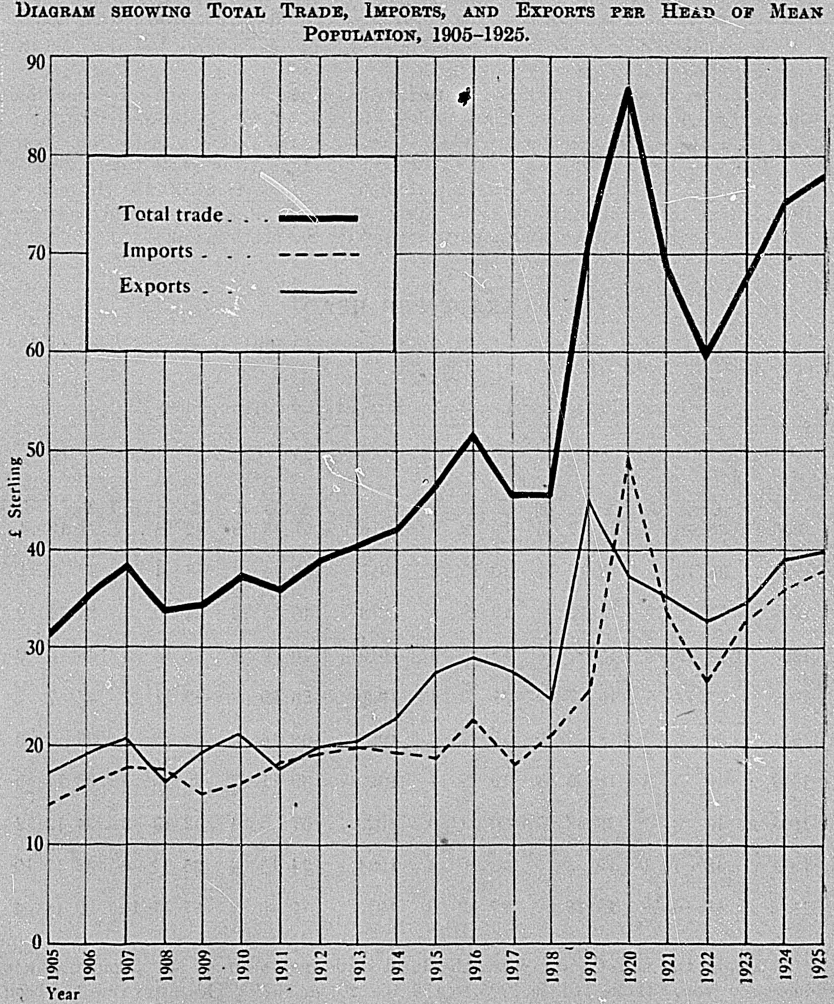
The most striking feature of the diagram is the sharp upward trend from 1918. The years 1919 and 1920, which represent the peak of the diagram, were distinctly abnormal, while the effect of higher prices in recent years has been to accentuate the upward movement. Reference to the next subsection will show that, in the case of exports at least, the whole of the great increase over the period is not due to higher prices, there having been a definite advance in the actual volume of exports per head. The same state of affairs no doubt holds in the case of imports, the volume of which, however, cannot be accurately measured.
The relation between imports and exports is of the greatest importance to a young country like New Zealand. In the very earliest years of occupation by Europeans the exports of phormium, timber, and skins were greatly in excess of the few imports, mainly muskets and gunpowder, a fact which is explained partly by the temporary residence of the traders and more by the weaker bargaining-power of the Maori. With the settlement of the regular colony in 1840 there was evident an inflation of imports, occasioned by the amount of capital the new colonists brought in for the development of the country. From 1853 to 1870 there was an excess of imports, which, however, was tending to decrease.
A temporary excess of exports gave place in the early “seventies” to another great increase of imports, due to the borrowing policy inaugurated in that period. Except for a big decrease in 1880, the value of imports continued to be greater than exports until 1886. From that year onward there has been a continued excess of exports, except for the three years 1908, 1911, and 1920. The year 1886 is worthy of note as marking an outstanding period in the history of New Zealand's trade. A more or less fluctuating excess of imports had obtained prior to that time, but from 1886 the exports began to form a preponderating feature of the total trade. The consequent balance of trade in favour of the Dominion has since remained remarkably unbroken. Indeed, on the basis of a quinquennial average, the figures relating to the three more recent years referred to earlier as showing an excess of imports recede into and form part of a continuous favourable balance of trade which has existed since 1886.
The balance of trade is intimately bound up, in later years especially, with the large imports of capital which have been brought in to assist in the development of the country. This has already been made evident in discussing the balance of trade in early years. The excess of imports from 1853 to 1870, and again from 1872 to 1886, can definitely be traced to the importation of capital in those periods.
On that portion of the public debt held outside New Zealand at the 31st March, 1926, the annual interest charge aggregated approximately £5,900,000, and there was a further annual charge of £350,074 in respect of repayment of funded debt to the Imperial Government At the 31st March, 1925, local bodies' debts held outside the Dominion involved an annual interest charge of £828,213, the total payments outside the Dominion on the public and semi-public debt being thus over seven millions.
Against this outgoing must be set the amount of new importations of capital in the shape of loans. While the expenditure on interest is fairly constant from year to year, the amount raised by new loans varies, and these variations are a big factor in the fluctuations of the balance of trade.
Debt charges and loan receipts are not the only invisible trade items. Money brought into the country by immigrants, expenditure by tourists and travellers, port receipts from overseas shipping, interest and dividends on New Zealand capital invested in Australia or the Pacific islands, and miscellaneous Government receipts from abroad are other items on the credit side; while on the debit side the following principal items, other than interest on Government and local-body loans, should be taken into account: Interest and dividends on overseas capital invested privately in the Dominion; shipping freights, charter-money, passage-money, &c., earned by overseas vessels for the carriage of New Zealand passengers and produce; expenditure abroad by New Zealand tourists and travellers; and miscellaneous Government expenditure abroad.
Sufficient data do not exist to enable a reliable official computation to be made in respect of New Zealand's balance of trade and international payments.
There is no Mint in New Zealand, whilst there is a fairly considerable production of gold bullion. Gold, therefore, ranks as an ordinary export of the Dominion, along with, wool, frozen meat, and dairy-produce. In earlier days this export of gold was much more important than now, amounting in 1863 to 70 per cent. of the total exports, from which figure it shrank steadily to 6 per cent. in 1913. During each of the last five years the proportion has been less than 2 per cent.
The amount of gold bullion exported during the last ten years, with the principal destinations, is shown in the following table:—
| EXPORTS OF GOLDFROM NEW ZEALAND, 1916–25. | |||||||
|---|---|---|---|---|---|---|---|
| Year. | Exports. | Percentage of Total Exports. | |||||
| To United Kingdom. | To Australia. | To India. | To United States. | To other Countries. | Total. | ||
| £ | £ | £ | £ | £ | £ | £ | |
| 1916 | 134,827 | 510,499 | 16,926 | 536,960 | 1,199,212 | 6.01 | |
| 1917 | 690,025 | 213,863 | 903,888 | 2.86 | |||
| 1918 | 275 | 42,116 | 42,391 | 0.15 | |||
| 1919 | 339,533 | 558,656 | 169,817 | 234,998 | 31,398 | 1,334,402 | 2.47 |
| 1920 | 103,353 | 12,167 | 23,884 | 718,899 | 25,445 | 883,748 | 1.90 |
| 1921 | 2,760 | 6,966 | 602,308 | 134 | 612,168 | 1.36 | |
| 1922 | 13,367 | 5,731 | 166,104 | 354,944 | 36 | 540,182 | 1.26 |
| 1923 | 890 | 37,715 | 332,238 | 327,740 | 698,583 | 1.52 | |
| 1924 | 3,189 | 2,278 | 323,921 | 222,400 | 551,788 | 1.05 | |
| 1925 | 1,735 | 383,338 | 47,301 | 39,895 | 95 | 472,364 | 0.85 |
A table is also given showing imports and exports of specie, during the ten years 1916–25.
| VALUEOF SPECIEIMPORTEDANDEXPORTED, 1916–25. | |||
|---|---|---|---|
| Year. | Total Specie. | Excess of Specie Imports over Exports. | |
| Imported. | Exported. | ||
*Excess of exports. | |||
| £ | £ | £ | |
| 1916 | 1,293,880 | 5,880 | 1,288,000 |
| 1917 | 177,135 | 70,475 | 106,660 |
| 1918 | 102,215 | 35,610 | 66,605 |
| 1919 | 362,531 | 62,150 | 300,381 |
| 1920 | 41,975 | 36,580 | 5,395 |
| 1921 | 198,321 | 367 | 197,954 |
| 1922 | 186,487 | 300 | 186,187 |
| 1923 | 14,510 | 27,372 | -12,862* |
| 1924 | 103,488 | -103,488* | |
| 1935 | 30,650 | 19,225 | 11,425 |
It is customary to classify the trade of a country as “special” and “entrepôt,” according as to whether it represents the exchange of domestic productions for imports for home consumption, or a more transit trade. In many countries, such as Belgium, France, and the United Kingdom, the transit trade attains considerable importance, but New Zealand, owing to its geographical position, is precluded from, developing in that direction. Her imports, except for a small forwarding trade to the Pacific islands, are for her own consumption, and the great bulk of her exports are commodities of domestic production.
The following table, which excludes specie, shows for the last ten years the very small proportion which re-exports bear to the total trade of the Dominion:—
| PROPORTIONOF RE-EXPORTSTO TOTAL TRADE (EXCLUDING SPECIE), 1916–25. | ||||||
|---|---|---|---|---|---|---|
| Year. | Trade. | Re-exports (included in two preceding Columns). | Percentage of Re-exports | |||
| Imports. | Exports. | Total. | To Imports. | To Exports. | ||
| £ | £ | £ | £ | |||
| 1916 | 25,045,403 | 33,281,057 | 58,326,460 | 305,150 | 1.22 | 0.92 |
| 1917 | 20,742,130 | 31,517,072 | 52,259,202 | 429,115 | 2.07 | 1.36 |
| 1918 | 24,131,792 | 28,480,578 | 52,612,370 | 543,568 | 2.25 | 1.91 |
| 1919 | 30,309,167 | 53,907,925 | 84,217,092 | 603,541 | 1.99 | 112 |
| 1920 | 61,553,853 | 46,405,366 | 107,959,219 | 813,072 | 1.32 | 1.75 |
| 1921 | 42,744,122 | 44,828,460 | 87,572,582 | 1,213,002 | 2.84 | 2.73 |
| 1922 | 34,826,074 | 42,725,949 | 77,552,023 | 1,026,801 | 2.94 | 2.40 |
| 1923 | 43,363,983 | 45,939,793 | 89,303,776 | 567,885 | 1.31 | 1.23 |
| 1924 | 48,527,603 | 52,509,223 | 101,036,826 | 588,395 | 1.21 | 1.12 |
| 1925 | 52,425,757 | 55,243,047 | 107,668,804 | 722,016 | 1.38 | 1.30 |
Before comparisons may properly be made with the trade of other countries care must he taken to ensure that the statistics are comparable in their methods of compilation and definition.
The value of imports into New Zealand is reckoned at the current domestic value in the country of export at the time of exportation, plus 10 per cent.; exports are valued f.o.b. In the United States and Canada, however, the value of imports also are calculated f.o.b., and the difference, representing freight, insurance, and charges, amounts to about 10 per cent. of the total value.
Again, in the United Kingdom the values of both imports and exports are obtained by assessment at current market prices in the United Kingdom.
A comparison of the “special” trade of various countries is shown in the table given below, the information being taken from the Commonwealth Official Year-book. Such a comparison (which covers in most cases the latest available year) necessarily ignores many of the elements considered above, but gives a sufficiently accurate idea of the relative trade of the various countries. The figures for Australia and the United States relate to the year ended 30th June, 1924, for Canada to the year ended 31st March, 1924, and for Italy to the year ended 31st March, 1922.
| TRADEOF VARIOUS COUNTRIES.—IMPORTSFOR HOME CONSUMPTIONAND EXPORTS OF DOMESTIC PRODUCE , INCLUDING BULLION AND SPECIE. | |||||||||||||
|---|---|---|---|---|---|---|---|---|---|---|---|---|---|
| Country. | Year. | Trade.* | Trade per Inhabitant. | ||||||||||
| Imports. | Exports. | Total. | Imports. | Exports. | Total. | ||||||||
| £ | £ | £ | £ | s. | d. | £ | s. | d. | £ | s. | d. | ||
* In thousands of pounds. † Excluding bullion and specie. | |||||||||||||
| New Zealand | 1925 | 51,734 | 54,540 | 106,274 | 37 | 7 | 5 | 39 | 7 | 11 | 76 | 15 | 4 |
| Canada† | 1923–24 | 200,757 | 234,910 | 435,667 | 22 | 16 | 10 | 26 | 14 | 7 | 49 | 11 | 5 |
| Australia | 1923–24 | 137,294 | 116,163 | 253,457 | 23 | 17 | 6 | 20 | 4 | 1 | 44 | 1 | 7 |
| Denmark† | 1923 | 78,526 | 63,343 | 141,869 | 23 | 17 | 6 | 19 | 5 | 2 | 43 | 2 | 8 |
| Netherlands | 1922 | 175,927 | 108,712 | 284,639 | 25 | 4 | 3 | 15 | 11 | 7 | 40 | 15 | 10 |
| United Kingdom† | 1924 | 1,139,696 | 795,365 | 1,935,061 | 23 | 17 | 11 | 16 | 13 | 6 | 40 | 11 | 5 |
| Switzerland† | 1922 | 81,841 | 73,382 | 155,223 | 21 | 1 | 10 | 18 | 18 | 3 | 40 | 0 | 1 |
| Belgium | 1923 | 154,063 | 113,465 | 267,528 | 20 | 8 | 8 | 15 | 1 | 0 | 35 | 9 | 8 |
| Norway | 1922 | 52,557 | 31,496 | 84,053 | 19 | 16 | 8 | 11 | 17 | 9 | 31 | 14 | 5 |
| Argentine | 1922 | 125,390 | 122,911 | 248,301 | 14 | 6 | 8 | 14 | 1 | 0 | 28 | 7 | 8 |
| Sweden† | 1923 | 75,852 | 66,886 | 142,738 | 12 | 13 | 4 | 11 | 3 | 5 | 23 | 16 | 9 |
| France | 1923 | 465,829 | 434,736 | 900,565 | 11 | 17 | 7 | 11 | 1 | 9 | 22 | 19 | 4 |
| South Africa | 1924 | 63,725 | 75,847 | 139,572 | 9 | 3 | 11 | 10 | 18 | 11 | 20 | 2 | 10 |
| United States† | 1923–24 | 784,287 | 955,587 | 1,739,874 | 7 | 8 | 5 | 9 | 0 | 9 | 16 | 9 | 2 |
| Spain† | 1922 | 106,428 | 50,848 | 157,276 | 4 | 19 | 8 | 2 | 7 | 8 | 7 | 7 | 4 |
| Japan† | 1922 | 211,670 | 183,338 | 395,008 | 3 | 15 | 8 | 3 | 5 | 6 | 7 | 1 | 2 |
| Italy | 1921–22 | 141,530 | 82,239 | 223,769 | 3 | 10 | 7 | 2 | 1 | 1 | 5 | 11 | 8 |
New Zealand is seen to head the list easily as regards both imports and exports per head, Australia and Canada coming next in order for total trade. The Netherlands, which formerly headed the list on account of its large transit trade, now ranks only fifth.
By themselves statistics of foreign trade are not a sure test of a country's prosperity, and they must always be interpreted with a knowledge of local conditions. An increase of imports may not be the result of increased purchasing-power, but may merely represent loans from another country, or even a failure of the home supply of certain commodities. Similarly, increased exports may mean greater productivity and increased purchasing-power, but they may also denote the payments on greatly increased liabilities.
In all countries the home trade is greatly in excess of the external trade, and in larger countries, which are more self-contained, a decrease in foreign trade may be due to development within the country itself. But New Zealand is far from self-contained, and from her position must attach a great importance to external trade. Under present conditions, only by export can a sufficient market be obtained for her rich resources, and only from abroad can be obtained the manufactures which are needed for common use. The development of the external trade since 1895 has been accompanied by increasing prosperity, and every advance in exports, followed by larger imports, represents an increase in the wealth of the Dominion.
IN New Zealand the Department of H.M. Customs requires for every package exported a declared statement of the contents, value, and destination.
In all cases exports are valued “free on board at the port of shipment.” In many cases, however, the goods are not sold till arrival at their destination, and in such cases values must be assessed in New Zealand with reference to current prices.
The exports of New Zealand produce are shown separately from re-exports of imported goods.
The ultimate destination of the goods is distinguished as far as is practicable, but it is impossible to discover what proportion of the exports is intended for home consumption in the country of destination.
The table on the next page gives a summary of the main exports from New Zealand during the last twenty years. The main commodities are shown separately, and the progress of the Dominion during the last two decades is strikingly illustrated.
The main feature of the table is the prominence given to the primary products of the soil. The extractive industries of New Zealand have always supplied the overwhelming bulk of the exports, and, though the proportion of the different classes has varied from time to time, there has never been any considerable or even noticeable export of manufactured goods.
Until 1914 the statistical tables included a heading “Manufactures,” which showed a considerable total value in each year, reaching £987,072 in 1913. Included in this group, however, was phormium, the value of which (excluding tow) was in 1913 £721,924; and though the phormium is stripped and prepared in, New Zealand it leaves the Dominion as a raw fibre, which can hardly be termed a “manufacture,” Similarly, leather in 1913 amounted to £31,945, and copra was also included in this heading. There are soma genuine manufactures exported, such as ale and beer, cordage, twine, soap, and woollens, but their value is insignificant compared with the primary products.
All the items of pastoral products considered show great increases over the twenty years, and the total exports show a threefold increase in the period. There was a slight fall in 1904, and two more serious decreases were recorded in 1908 and 1911. Since that year progress has been rapid, and a sharp rise brought the 1919 total to over £48,000,000, a figure which remained a record until it was superseded in 1924, and again in 1925, when over £55,000,000 was recorded.
In the last twenty years the proportions of the principal exports have changed a good deal. Wool, which reached its maximum percentage (47.9) in 1897, showed a tendency to decline till 1902, then partially regained its position, once more showing a marked fall in 1918, owing to a considerable portion of the clip being retained in the Dominion until the next year, when wool to the value of £19,559,537 was exported. The wool exported during the year 1925 was valued at £17,739,736, which, with the exception of the abnormal figure for 1919, is the highest on record. The total exports of wool during the six years 1920–25 aggregated nearly 73 millions sterling.
Frozen meat in recent years has supplied approximately 20 per cent. of the total exports, a proportion considerably exceeded in 1920 and 1921, when the value of this important item of export reached £11,673,696 and £11,164,345 respectively, but owing to a recovery in wool-values this proportion has again declined to its old level.
| EXPORTS OF PRINCIPAL ITEMS OF NEW ZEALAND PRODUCE, 1906–25. | |||||||
|---|---|---|---|---|---|---|---|
| Year. | Wool. | Frozen Meat. | Butter. | Cheese. | Tallow. | Skins, Hides and Pelts. | Other Pastoral Produce.* |
| £ | £ | £ | £ | £ | £ | £ | |
| 1906 | 6,765,655 | 2,877,031 | 1,560,235 | 341,002 | 455,026 | 894,518 | 57,313 |
| 1907 | 7,657,278 | 3,420,664 | 1,615,345 | 662,355 | 560,965 | 1,055,650 | 273,447 |
| 1908 | 5,332,781 | 3,188,515 | 1,171,182 | 783,419 | 481,335 | 767,692 | 231,142 |
| 1909 | 6,305,888 | 3,601,093 | 1,639,380 | 1,105,390 | 648,452 | 1,018,103 | 316,959 |
| 1910 | 8,308,410 | 3,850,777 | 1,811,975 | 1,195,373 | 756,841 | 1,129,041 | 468,298 |
| 1911 | 6,491,707 | 3,503,406 | 1,576,917 | 1,192,057 | 607,257 | 911,519 | 467,695 |
| 1912 | 7,105,483 | 3,909,569 | 2,088,809 | 1,680,393 | 684,739 | 1,091,871 | 370,616 |
| 1913 | 8,057,620 | 4,449,933 | 2,061,651 | 1,770,297 | 663,088 | 1,199,375 | 317,181 |
| 1914 | 9,318,114 | 5,863,062 | 2,338,576 | 2,564,125 | 694,348 | 1,317,593 | 433,331 |
| 1915 | 10,387,875 | 7,794,395 | 2,700,625 | 2,730,211 | 780,828 | 1,450,276 | 690,398 |
| 1916 | 12,386,074 | 7,271,318 | 2,632,293 | 3,514,310 | 785,339 | 1,667,679 | 637,409 |
| 1917 | 12,175,366 | 5,982,404 | 2,031,551 | 3,949,251 | 553,016 | 1,861,817 | 776,194 |
| 1918 | 7,527,266 | 4,957,576 | 3,402,223 | 4,087,278 | 847,618 | 2,645,864 | 1,170,011 |
| 1919 | 19,559,537 | 9,628,292 | 3,080,128 | 7,790,990 | 2,680,006 | 3,439,468 | 2,432,819 |
| 1920 | 11,863,827 | 11,673,696 | 3,022,335 | 6,160,840 | 1,748,773 | 5,032,242 | 2,058,463 |
| 1921 | 5,221,479 | 11,164,345 | 11,169,530 | 8,199,183 | 867,298 | 1,995,518 | 2,081,514 |
| 1922 | 11,882,463 | 8,387,461 | 9,041,554 | 4,686,850 | 750,574 | 2,053,761 | 1,380,130 |
| 1923 | 10,904,658 | 9,012,627 | 10,689,200 | 6,870,397 | 785,668 | 2,379,536 | 1,486,209 |
| 1924 | 15,267,544 | 9,499,877 | 11,641,668 | 7,023,297 | 799,230 | 3,144,106 | 1,569,106 |
| 1925 | 17,739,736 | 11,174,567 | 10,240,132 | 5,800,808 | 895,061 | 3,861,215 | 1,658,960 |
| Year. | Wheat. | Oats. | Other Agricultural Produce.† | Gold. | Coal. | Kaurigum. | Phormium Fibre and Tow. | Timber. |
|---|---|---|---|---|---|---|---|---|
* The main items in this heading are bacon and hams, beef and pork (salted), live-stock, preserved meats, sausage-skins, and preserved milk. † The main items in this heading are bran and sharps, chaff, flour, fruits, barley, beans and peas, maize, malt, hops, oatmeal, potatoes, and seeds. | ||||||||
| £ | £ | £ | £ | £ | £ | £ | £ | |
| 1906 | 9,915 | 76,981 | 183,646 | 2,270,904 | 122,614 | 522,486 | 812,712 | 304,941 |
| 1907 | 326 | 4,656 | 157,985 | 2,027,490 | 114,737 | 579,888 | 897,718 | 311,862 |
| 1908 | 344 | 108,997 | 156,389 | 2,004,799 | 85,846 | 372,798 | 420,520 | 375,235 |
| 1900 | 305,902 | 453,314 | 216,954 | 2,006,900 | 183,961 | 552,698 | 324,458 | 337,740 |
| 1910 | 216,657 | 44,299 | 220,566 | 1,896,318 | 259,562 | 465,044 | 480,519 | 407,658 |
| 1911 | 219,196 | 9,211 | 184,408 | 1,815,251 | 204,379 | 395,707 | 325,130 | 439,353 |
| 1912 | 95,702 | 483,756 | 481,147 | 1,345,131 | 216,170 | 401,305 | 407,903 | 490,508 |
| 1913 | 11,816 | 29,252 | 238,908 | 1,459,499 | 205,010 | 549,106 | 797,062 | 319,055 |
| 1914 | 3,580 | 165,930 | 278,894 | 895,367 | 282,163 | 497,444 | 492,230 | 422,864 |
| 1915 | 128 | 132,827 | 541,318 | 1,694,553 | 329,731 | 279,133 | 610,059 | 383,883 |
| 1916 | 17,835 | 30,200 | 135,680 | 1,199,212 | 326,553 | 339,882 | 1,078,632 | 381,488 |
| 1917 | 509 | 1,306 | 178,087 | 903,888 | 236,063 | 291,917 | 1,232,608 | 408,121 |
| 1918 | 460 | 872 | 194,422 | 42,391 | 227,228 | 157,313 | 1,408,147 | 556,309 |
| 1919 | 679 | 33,671 | 753,837 | 1,334,405 | 201,383 | 255,812 | 907,584 | 439,935 |
| 1920 | 388 | 52,502 | 477,166 | 883,748 | 128,509 | 556,756 | 688,972 | 697,608 |
| 1921 | 243 | 84,434 | 405,417 | 612,168 | 109,510 | 367,197 | 319,604 | 503,785 |
| 1922 | 316,528 | 91,991 | 560,425 | 540,182 | 253,762 | 563,270 | 295,530 | 479,447 |
| 1923 | 968 | 78,775 | 488,613 | 698,583 | 173,833 | 596,222 | 314,324 | 473,752 |
| 1924 | 406 | 1,104 | 429,815 | 551,788 | 161,432 | 443,576 | 424,726 | 472,120 |
| 1925 | 299 | 1,877 | 465,721 | 472,364 | 235,047 | 414,901 | 575,311 | 573,882 |
The main feature of the period has been the great advance, relatively and absolutely, of butter and cheese, the export of which has increased beyond all expectations—viz., from £1,901,237 in 1906 to £16,040,940 in 1925. The growth of the dairying industry is brought more into prominence by a comparison of the quantities as well as the values. Whereas in 1906 the total exports of butter and cheese from New Zealand reached only 451,431 cwt., the total quantity shipped in 1925 aggregated 2,622,078 cwt. Although exports of dairy-produce have during recent years shown a fluctuating tendency, this has been credited to the varying prices realized in the Home markets and not to any appreciable extent to a, diminution in the quantities exported. Other classes of pastoral produce have also increased to several times their total for 1906, and timber shows a substantial increase. The value of coal and phormium, however, has shown a growing tendency to decrease. In the case of gold, the value in 1925 was considerably less than in 1906, the figures showing over the twenty years a decline from £2,270,904 to £472,364. Agricultural produce shows a fluctuating export, with a tendency to decrease, the comparatively large amount for 1922 being due to a considerable carry-over from the previous season.
The relative importance of the main commodities is shown in the diagram given below.
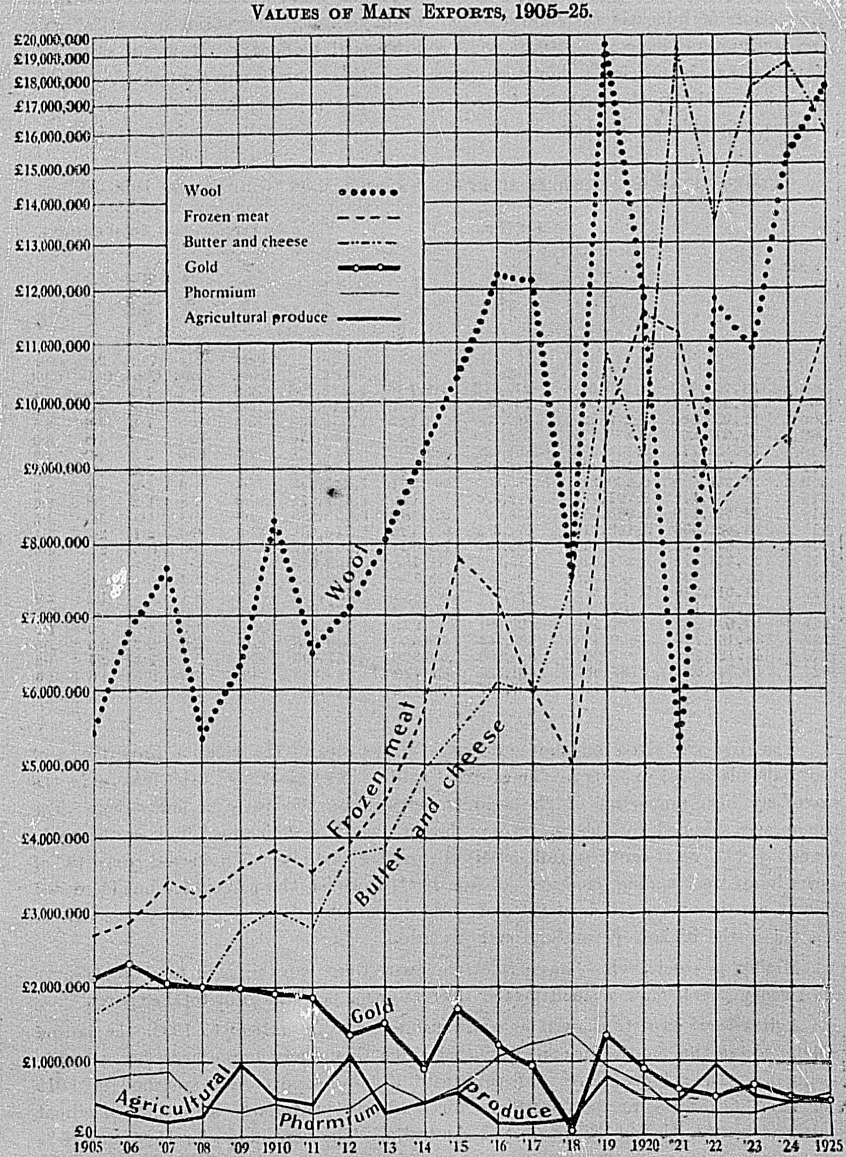
In the following table the exports are classified under the main industries, according to a broad division, to illustrate the relative importance of the pastoral, agricultural, mining, forestry, and other industries as far as the export trade is concerned. It must be remembered that in a particular industry the home trade may be relatively more important than the external trade.
The table indicates a tendency for the Dominion to rely more and more upon the pastoral industry for her main exports. The four main products of that industry—wool, frozen meat, butter, and cheese—provide an ever-increasing proportion of the total quantity of goods shipped overseas. On the other hand, the proportion of minerals has tended to fall, mainly through decreasing exports of gold, and agricultural exports fluctuate with a downward tendency. It would seem that New Zealand is restricting her agriculture to a level barely sufficient to provide for her own needs in the matter of cereals, and only in exceptional years is there a surplus available for export.
| PROPORTIONSOF EXPORTS SUPPLIED BY THE MAIN INDUSTRIES, 1906–25. | ||||||||||
|---|---|---|---|---|---|---|---|---|---|---|
| Year. | Exports. | Percentage of Total Exports. | ||||||||
| Pastoral. | Mining. | Agricultural. | Forest. | Other. | Pastoral. | Mining. | Agricultural. | Forest. | Other. | |
| £ | £ | £ | £ | £ | Per Cent. | Per Cent. | Per Cent. | Per Cent. | Per Cent. | |
| 1906 | 13,150,780 | 2,555,551 | 270,542 | 841,166 | 1,277,098 | 72.6 | 141 | 1.5 | 4.6 | 7.2 |
| 1907 | 15,245,704 | 2,344,903 | 162,967 | 904,486 | 1,410,897 | 76.0 | 11.7 | 0.8 | 4.5 | 7.0 |
| 1908 | 11,956,066 | 2,279,520 | 265,780 | 758,115 | 1,058,063 | 73.3 | 14.0 | 1.6 | 4.6 | 6.5 |
| 1909 | 14,635,265 | 2,378,775 | 976,170 | 905,930 | 765,856 | 74.4 | 12.1 | 5.0 | 4.6 | 3.9 |
| 1910 | 17,520,715 | 2,344,348 | 481,522 | 889,603 | 944,021 | 79.0 | 10.6 | 2.2 | 4.0 | 4.2 |
| 1911 | 14,750,558 | 2,165,137 | 412,815 | 843,310 | 856,670 | 77.5 | 11.4 | 2.2 | 4.4 | 4.5 |
| 1912 | 16,931,480 | 1,660,280 | 1,060,605 | 900,671 | 1,217,545 | 77.8 | 7.6 | 4.9 | 41 | 5.6 |
| 1913 | 18,519,145 | 1,791,777 | 279,976 | 874,110 | 1,521,714 | 80.6 | 7.8 | 1.2 | 3.8 | 6.6 |
| 1914 | 22,529,149 | 1,263,553 | 448,404 | 927,482 | 1,092,859 | 85.8 | 4.8 | 1.7 | 3.5 | 4.2 |
| 1915 | 26,534,608 | 2,149,217 | 674,273 | 674,533 | 1,716,281 | 83.6 | 6-8 | 2.1 | 2.1 | 5.4 |
| 1916 | 28,894,422 | 1,661,650 | 183,797 | 734,034 | 1,502,004 | 87.6 | 5.0 | 0.6 | 2.2 | 4.6 |
| 1917 | 27,329,599 | 1,274,222 | 179,902 | 711,188 | 1,593,046 | 87.9 | 4.1 | 0.6 | 2.3 | 5.1 |
| 1918 | 24,638,531 | 479,017 | 196,291 | 719,538 | 1,903,633 | 88.2 | 1.7 | 0.7 | 2.6 | 6.8 |
| 1919 | 48,611,240 | 1,668,314 | 788,187 | 698,849 | 1,537,794 | 91.2 | 3.1 | 1.5 | 1.3 | 2.9 |
| 1920 | 41,560,176 | 1,103,344 | 530,056 | 1,262,894 | 1,135,824 | 91.1 | 2.4 | 1.2 | 2.8 | 2.5 |
| 1921 | 40,698,867 | 787,591 | 490,094 | 884,279 | 754,627 | 93.3 | 19 | 1.1 | 2.0 | 1.7 |
| 1922 | 38,182,793 | 850,469 | 968,944 | 1,066,054 | 630,888 | 91.6 | 2.0 | 2.3 | 2.6 | 1.5 |
| 1923 | 42,128,295 | 937,238 | 568,356 | 1,080,326 | 657,693 | 92.9 | 2.1 | 1.3 | 2.4 | 1.3 |
| 1924 | 48,944,828 | 787,664 | 431,325 | 937,178 | 819,833 | 94.2 | 1.5 | 0.9 | 1.8 | 1.6 |
| 1925 | 51,370,479 | 770,439 | 467,897 | 1,000,453 | 911,763 | 94.2 | 1.4 | 0.9 | 1.8 | 1.7 |
The diagram given on the next page shows clearly the relative importance of the main classes of exports in the external trade. The most noticeable feature is the extremely high proportion of the exports supplied by the pastoral industries. The percentage supplied by this group was high in the late “nineties,” but in the early years of the new century fell relatively, owing mainly to increased exports of agricultural and mining produce. Since 1901, however, the percentage has increased almost continuously, till in 1924 and 1925 it amounted to over 94 per cent. of the total, the highest percentage ever recorded.
Mining products, which have fallen by more than two-thirds in total value over the twenty years, show a much greater decrease as a percentage of total exports.
Agricultural exports showed an abnormal increase from 1899 to 1903, the period which covers the South African War, but since then their importance has steadily declined. Their lowest level (0.6 per cent. of total exports) was reached in 1916 and 1917. The rise in the percentage for 1922 was due to large shipments of wheat and oats to the United Kingdom and Australia. The percentage for 1924 and 1925 (0.9) is the lowest since 1918. Forest products, too, though steady, show a relative downward tendency, and therefore the strip representing them tapers towards the later years.
Exports for 1925, amounting to £55,262,272, are the highest yet recorded, the high prices received for wool being chiefly instrumental in bringing about this result. For a number of years wool has been the principal item of export, and the prices received for this commodity have more bearing on the total exports than any other single factor.
The relative importance of the various classes of exports is more strikingly illustrated in the following diagram:—
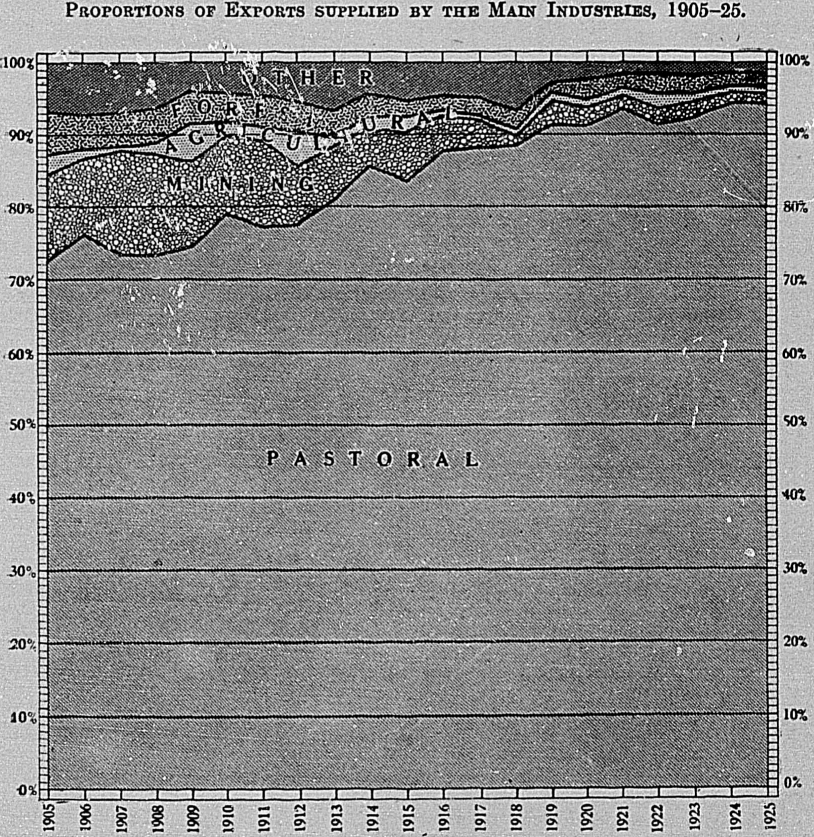
The next table compares the exports of twelve principal items during” 1924 and 1925. The outstanding feature is the increase of £2,472,192 in the value of wool exported. As indicated previously, however, the record prices of 1925 were wholly responsible in bringing about this position, and in point of fact the quantity of wool shipped in 1925 was just a trifle more than during the previous year. Substantial increases are also evident in the case of frozen meat, skins and hides, phormium timber, and tallow. The principal recessions are associated with butter and cheese.
| INCREASESOR DECREASESINTHE MAIN EXPORTS IN 1925. | ||||||
|---|---|---|---|---|---|---|
| Article. | Value. | Amount of | Percentage. | |||
| 1925. | 1924. | Increase. | Decrease. | Increase. | Decrease. | |
| £ | £ | £ | £ | |||
| Wool | 17,739,736 | 15,267,544 | 2,472,192 | 16.16 | ||
| Frozen meat | 11,174,567 | 9,499,877 | 1,674,690 | 17.63 | ||
| Butter | 10,240,132 | 11,641,668 | 1,401,536 | 12.04 | ||
| Cheese | 5,800,808 | 7,023,297 | 1,222,489 | 17.40 | ||
| Preserved milk | 425,738 | 505,098 | 79,360 | 15.71 | ||
| Tallow | 895,061 | 799,230 | 95,831 | 11.99 | ||
| Skins, hides, and pelts | 3,861,215 | 3,144,106 | 717,109 | 22.81 | ||
| Gold | 472,364 | 551,788 | 79,424 | 14.39 | ||
| Coal | 235,047 | 161,432 | 73,615 | 45.60 | ||
| Kauri-gum | 414,901 | 443,576 | 28,675 | 6.46 | ||
| Phormium | 575,311 | 424,726 | 150,585 | 35.45 | ||
| Timber | 573,882 | 472,120 | 101,762 | 21.55 | ||
In the following table exports during 1925 are grouped in classes in accordance with the statistical classification adopted for both exports and imports in 1914:—
| EXPORTS BY STATISTICAL CLASSES, 1925. | |||
|---|---|---|---|
| No. | Class. | Domestic Produce. | Reexports. |
| £ | £ | ||
| I | Foodstuffs of animal origin (excluding live animals) | 28,808,663 | 8,422 |
| II | Foodstuffs of vegetable origin, and common salt | 322,010 | 8,399 |
| III | Beverages (non-alcoholic), and substances used in making up the same | 906 | 9,892 |
| IV | Spirits and alcoholic liquors | 5,153 | 6,850 |
| V | Tobacco and preparations thereof | 78 | 36,802 |
| VI | Live animals | 108,846 | 956 |
| VII | Animal substances (mainly unmanufactured), not being foodstuffs | 21,613,586 | 85 |
| VIII | Vegetable substances and non-manufactured fibres | 751,409 | 14,882 |
| IXA | Apparel | 4,488 | 37,766 |
| IXB | Textiles | 14,267 | 76,543 |
| IXC | Manufactured fibres | 10,263 | 29,357 |
| X | Oils, fats, and waxes | 922,462 | 158,214 |
| XI | Paints and varnishes | 906 | 5,765 |
| XII | Stones and minerals used industrially | 658,686 | 21,182 |
| XIII | Specie | 19,225 | |
| XIVA | Metal (unmanufactured and partly manufactured) and ores | 550,052 | 5,899 |
| XIVB | Metal manufactures other than machinery and machines | 5,632 | 33,317 |
| XV | Machinery and machines | 19,298 | 36,457 |
| XVIA | Indiarubber and manufactures thereof (not including tires) | 1,341 | |
| XVIB | Leather and manufactures thereof, including substitutes | 7,758 | 4,837 |
| XVIIA | Timber | 573,882 | 31,305 |
| XVIIB | Wood, cane, and wicker manufactures | 4,284 | 2,046 |
| XVIII | Earthenware, china, glass, stoneware, cement, and cement materials | 1,267 | 7,021 |
| XIXA | Paper | 124 | 3,893 |
| XIXB | Stationery | 17,822 | 14,979 |
| XX | Jewellery, timepieces, and fancy goods | 444 | 18,388 |
| XXI | Optical, surgical, and scientific instruments | 239 | 48,592 |
| XXIIA | Drugs, chemicals, and druggists' wares | 10,538 | 12,718 |
| XXIIB | Manures | 15,184 | 6 |
| XXIII | Miscellaneous | 15,804 | 86,102 |
| Parcels-post | 76,980 | ||
| Totals | 54,521,031 | 741,241 | |
It will be seen that the great bulk of the exports fall into two classes—I, which includes butter, cheese, and frozen meat; and VII, which includes wool, hides, skins, and pelts. Mineral products come under XII and XIVA, and timber under XVIIA; tallow is the main item in X; phormium and seeds in VIII; while the main agricultural products are included in II. The re-exports are spread mainly over various manufactured items.
The principal items of export may conveniently be grouped under six definite heads, as in the table below.
Practically all the main commodities are homogeneous articles, and it is therefore possible to give the quantities exported. For some purposes, especially for comparisons between recent and more remote years, quantities are preferable to values, since the latter contain the variable element of price.
| QUANTITIESOFTHE PRINCIPAL ARTICLESOF NEW ZEALAND PRODUCEEXPORTED, 1921–25. | |||||
|---|---|---|---|---|---|
| Article. | 1921. | 1922. | 1923. | 1924. | 1925. |
| The mine— | |||||
| Coal (tons) | 53,183 | 118,755 | 95,636 | 88,981 | 138,083 |
| Gold (oz.) | 149,595 | 131,848 | 169,512 | 133,631 | 114,696 |
| Sliver ,, | 480,023 | 443,134 | 514,655 | 578,217 | 495,268 |
| Other minerals (tons) | 15 | 48 | 79 | 67 | 31 |
| The fisheries— | |||||
| Fish (cwt.) | 9,785 | 13,456 | 20,080 | 19,059 | 15,932 |
| Oysters (doz.) | 92,340 | 163,911 | 71,680 | 52,283 | 149,821 |
| Whalebone (lb.) | 1,120 | 896 | 2,128 | 896 | |
| Whale-oil (gal.) | 54,130 | 22,365 | 55,673 | 59,479 | 96,158 |
| Ambergris (oz.) | 3 | 688 | 411 | ||
| The forest— | |||||
| Fungus (cwt.) | 1,616 | 3,236 | 1,934 | 1,706 | 1,860 |
| Kauri-gum (tons) | 3,901 | 6,391 | 6,598 | 5,261 | 5,370 |
| Timber, sawn and (sup. ft.) hewn | 45,902,627 | 44,186,848 | 47,568,490 | 42,928,726 | 49,204,676 |
| Pastoral products— | |||||
| Bacon and hams (cwt.) | 847 | 1,714 | 3,284 | 4,464 | 4,187 |
| Beef and pork, salted ,, | 4,153 | 3,995 | 12,739 | 11,931 | 7,510 |
| Butter ,, | 898,478 | 1,120,200 | 1,250,140 | 1,269,455 | 1,245,324 |
| Casein ,, | 33,071 | 29,385 | 50,288 | 46,210 | 43,908 |
| Cheese ,, | 1,368,786 | 1,161,196 | 1,441,460 | 1,594,486 | 1,376,754 |
| Hides and skins (number) | 796,025 | 723,003 | 1,053,089 | 1,303,282 | 1,376,273 |
| Honey lb. | 861,921 | 1,289,135 | 972,038 | 1,186,269 | 1,822,043 |
| Live-stock— | |||||
| Cattle (number) | 416 | 467 | 4,566 | 322 | 186 |
| Horses ,, | 203 | 225 | 206 | 152 | 223 |
| Sheep ,, | 3,048 | 3,768 | 3,799 | 3,197 | 3,895 |
| Pigs ,, | 502 | 386 | 410 | 664 | 314 |
| Preserved meats (cwt.) | 59,203 | 43,905 | 42,285 | 66,340 | 65,779 |
| Frozen meats ,, | 4,322,754 | 3,518,004 | 3,043,910 | 3,213,574 | 3,414,205 |
| Sausage-casings ,, | 23,443 | 26,280 | 21,549 | 24,963 | 28,128 |
| Rabbit-skins (number) | 13,922,446 | 15,487,225 | 14,233,417 | 20,444,390 | 19,708,586 |
| Sheep skins and pelts ,, | 8,436,398 | 10,144,853 | 8,246,800 | 8,825,666 | 8,695,312 |
| Tallow (cwt.) | 554,240 | 529,900 | 504,860 | 479,768 | 500,760 |
| Wool (lb.) | 158,714,828 | 321,533,215 | 217,566,091 | 206,189,911 | 205,726,856 |
| Agricultural products— | |||||
| Bran and sharps (tons) | 124 | 2,346 | 1,308 | 73 | 39 |
| Chaff ,, | 166 | 56 | 49 | 51 | 26 |
| Flour ,, | 111 | 22 | 10 | 10 | 11 |
| Grain and pulse— | |||||
| Barley (centals) | 19,729 | 73,796 | 3,730 | 96 | 74 |
| Beans and peas ,, | 125,485 | 112,828 | 202,187 | 113,405 | 129,325 |
| Oats ,, | 172,589 | 274,272 | 191,259 | 2,004 | 3,296 |
| Wheat ,, | 277 | 727,698 | 2,087 | 661 | 407 |
| Hops (cwt.) | 2,099 | 1,970 | 2,515 | 5,916 | 3,031 |
| Oatmeal (tons) | 9 | 39 | 32 | 40 | 69 |
| Potatoes ,, | 1,216 | 788 | 787 | 539 | 4,943 |
| Seeds (grass and clover) (cwt.) | 37,319 | 70,120 | 47,031 | 36,311 | 45,368 |
| Miscellaneous— | |||||
| Ale and beer (gal.) | 8,519 | 13,865 | 14,221 | 17,231 | 16,103 |
| Cordage (cwt.) | 6,416 | 6,709 | 5,942 | 3,172 | 3,307 |
| Leather ,, | 2,629 | 3,742 | 2,639 | 859 | 692 |
| Phormium fibre and (tons) tow | 11,167 | 11,425 | 12,306 | 15,178 | 19,923 |
The values of these principal commodities are tabulated in the following table, and the statement of exports is rendered complete by the addition of miscellaneous groups and the provision of totals for each group and for all combined:—
| VALUEOF PRINCIPAL ARTICLESEXPORTED, 1921–25. | |||||
|---|---|---|---|---|---|
| Article. | 1921. | 1922. | 1923. | 1924. | 1925. |
| £ | £ | £ | £ | £ | |
| The mine— | |||||
| Coal | 109,510 | 253,762 | 173,833 | 161,432 | 235,047 |
| Gold | 612,168 | 540,182 | 698,583 | 551,788 | 472,364 |
| Silver | 65,647 | 55,222 | 62,851 | 71,981 | 60,773 |
| Other minerals | 266 | 1,303 | 1,971 | 2,463 | 2,255 |
| Totals | 787,591 | 850,460 | 937,238 | 787,664 | 770,439 |
| The fisheries— | |||||
| Fish | 34,337 | 43,356 | 69,328 | 58,417 | 55,423 |
| Oysters | 965 | 1,713 | 762 | 571 | 1,474 |
| Whalebone | 244 | 425 | 290 | 160 | |
| Whale-oil | 7,505 | 2,310 | 6,072 | 6,515 | 10,541 |
| Ambergris | 75 | 2,000 | 1,200 | ||
| Other | 165 | 44 | 89 | 103 | 39 |
| Totals | 43,216 | 47,423 | 76,751 | 67,896 | 68,837 |
| The forest— | |||||
| Fungus | 12,852 | 22,271 | 9,202 | 9,165 | 10,547 |
| Kauri-gum | 367,197 | 563,270 | 596,222 | 443,576 | 414,901 |
| Timber | 503,785 | 479,447 | 473,752 | 472,120 | 573,882 |
| Other | 445 | 1,066 | 1,150 | 12,317 | 1,123 |
| Totals | 884,279 | 1,066,054 | 1,080,326 | 937,178 | 1,000,453 |
| Pastoral products— | |||||
| Bacon and hams | 5,795 | 8,789 | 17,367 | 26,505 | 25,398 |
| Beef and pork, salted | 12,177 | 7,359 | 19,393 | 20,599 | 14,314 |
| Butter | 11,169,530 | 9,041,554 | 10,689,200 | 11,641,668 | 10,240,132 |
| Casein | 114,511 | 77,210 | 182,112 | 129,775 | 110,171 |
| Cheese | 8,199,183 | 4,686,850 | 6,870,397 | 7,023,297 | 5,800,808 |
| Hides and skins | 575,222 | 505,708 | 785,350 | 889,654 | 1,028,510 |
| Honey | 28,428 | 46,821 | 25,588 | 29,721 | 53,156 |
| Live-stock— | |||||
| Cattle | 11,963 | 12,046 | 61,445 | 14,381 | 6,788 |
| Horses | 27,224 | 33,747 | 37,253 | 44,695 | 66,428 |
| Sheep | 25,807 | 11,152 | 12,888 | 25,900 | 33,465 |
| Pigs | 2,296 | 1,278 | 1,309 | 2,983 | 1,455 |
| Other | 1,380 | 780 | 922 | 1,128 | 715 |
| Preserved milk and cream | 1,109,331 | 529,650 | 513,495 | 303,917 | 425,738 |
| Preserved meats | 273,591 | 160,819 | 160,124 | 191,236 | 219,151 |
| Frozen meats | 11,164,345 | 8,387,461 | 9,012,627 | 9,499,877 | 11,174,567 |
| Sausage-casings | 447,873 | 467,981 | 424,387 | 563,887 | 675,848 |
| Rabbit-skins | 448,180 | 567,864 | 472,491 | 740,975 | 843,416 |
| Sheep skins and pelts | 972,116 | 980,189 | 1,121,695 | 1,513,477 | 1,989,289 |
| Tallow | 867,298 | 750,574 | 785,668 | 799,230 | 895,061 |
| Wool | 5,221,479 | 11,882,463 | 10,904,658 | 15,267,544 | 17,739,736 |
| Other | 21,138 | 22,498 | 29,926 | 214,379 | 26,338 |
| Totals | 40,698,867 | 38,182,793 | 42,128,295 | 48,944,828 | 51,370,479 |
| Agricultural products— | |||||
| Bran and sharps | 1,373 | 16,201 | 8,654 | 657 | 459 |
| Chaff | 1,532 | 495 | 607 | 521 | 309 |
| Flour | 2,784 | 526 | 235 | 204 | 267 |
| Fruits | 23,341 | 65,890 | 74,531 | 122,824 | 120,636 |
| Grain and pulse— | |||||
| Barley | 9,477 | 29,644 | 1,706 | 63 | 59 |
| Beans and peas | 120,317 | 103,370 | 159,018 | 85,329 | 102,611 |
| Oats | 84,434 | 91,991 | 78,775 | 1,104 | 1,877 |
| Wheat | 243 | 316,528 | 968 | 406 | 299 |
| Other | 1,249 | 771 | 814 | 268 | 96 |
| Hops | 19,142 | 18,455 | 17,699 | 41,619 | 20,153 |
| Oatmeal | 267 | 845 | 1,306 | 1,622 | 3,140 |
| Onions | 2,150 | 8,162 | 4,923 | 1,233 | 8,594 |
| Potatoes | 9,113 | 6,351 | 7,497 | 5,147 | 39,948 |
| Seeds (grass and clover) | 156,114 | 285,451 | 175,754 | 149,083 | 151,164 |
| Seeds (various) | 56,862 | 22,579 | 81,002 | 17,830 | 12,586 |
| Other | 1,696 | 1,685 | 4,867 | 3,415 | 5,699 |
| Totals | 490,094 | 968,944 | 568,356 | 431,325 | 467,897 |
| VALUEOF PRINCIPAL ARTICLESEXPORTED, 1921-25 | |||||
|---|---|---|---|---|---|
| Article. | 1921. | 1922. | 1923. | 1924. | 1925. |
| £ | £ | £ | £ | £ | |
| Miscellaneous (including manufactures)— | |||||
| Ale and beer | 2,050 | 2,833 | 3,783 | 5,855 | 5,105 |
| Apparel | 4,155 | 2,654 | 2,913 | 2,291 | 1,924 |
| Cement | 11,956 | 5,017 | 1,874 | 1,051 | 264 |
| Cordage and rope | 3,830 | 2,523 | 3,086 | 10,191 | 10,088 |
| Leather | 59,562 | 42,675 | 19,600 | 3,702 | 4,883 |
| Phormium fibre and tow | 319,604 | 295,530 | 314,324 | 424,726 | 575,311 |
| Soap | 11,608 | 12,921 | 11,720 | 10,939 | 8,317 |
| Sugar | 20,706 | 9,428 | 10,042 | 12,476 | 9,548 |
| Twine | 17,326 | 22,014 | 16,422 | 7,006 | 6,580 |
| Woollen manufactures | 9,088 | 14,630 | 10,132 | 15,537 | 3,815 |
| Other | 251,526 | 173,240 | 187,200 | 257,163 | 218,291 |
| Totals | 711,411 | 583,465 | 581,096 | 753,937 | 844,126 |
| Total exports (domestic produce) | 43,615,458 | 41,699,148 | 45,371,908 | 51,920,828 | 54,521,031 |
| Specie | 367 | 300 | 27,372 | 103,488 | 19,225 |
| Re-exports | 1,213,002 | 1,026,801 | 567,885 | 588,395 | 722,016 |
| Total exports | 44,828,827 | 42,726,249 | 45,967,165 | 52,612,711 | 55,262,272 |
The first exports from New Zealand went naturally to the earlier-developed sister colony, and for a considerable time Australia had a monopoly of our trade. In 1865 70 per cent., and even in 1871 44 per cent., of the total exports went to Australia. But since the establishment of direct shipping lines with the United Kingdom the Mother-land has absorbed the bulk of New Zealand exports, having taken during the forty years 1875–1914 £365,880,997 (or almost exactly 80 per cent.) of a grand total of exports amounting to £469,347,969. This percentage, prior to the war, did not vary greatly from year to year, but there have naturally been considerable variations since 1914, the most notable being the marked fall in 1918. During 1921 and 1922, the percentage rose to as high as 86 and 85 respectively. Since then, however, the United Kingdom's share has been in the vicinity of 80 per cent.
The total amount sent to Australia fluctuates considerably from year to year, rising if the products of the Commonwealth are reduced by drought. The proportion of New Zealand's exports sent to Australia has declined considerably during the twenty years covered by the table on the next page. The figure for 1925 was slightly less than during 1923, which was the highest since 1912.
Exports to Canada have increased enormously during the twenty years, rising from £29,815 in 1906 to £1,793,576 in 1918; but the figures show a great falling-off during the last five years, the amount of £423,068 for 1925 being the lowest since 1911. Even before the war Canada had become an important market for New Zealand's produce, having taken exports to the value of £606,662 in 1913, as compared with £199,587 two years earlier and only £24,051 in 1908.
Exports to the Pacific islands have risen steadily in total value, and have increased slightly as a proportion of total exports.
The value of exports to the United States fluctuated considerably up to 1912, with no definite indication of an increase. During the war, however, considerable expansion occurred, the peak year being 1920, when exports to the States totalled £7,456,041. The years 1921 and 1922 witnessed a substantial drop. Since then, however, there has been a revival, and the figure for 1925—£4,349,758—ranks second to that for 1920.
Prior to the war Germany's position in the export table was similar to that of Canada, exports having risen from £54,952 in 1906 to £205,931 in 1910 and £456,163 in 1914. The war put a stop for the time being to trade between New Zealand and Germany, and it was not until 1922 that any revival was shown. Exports in 1922 and 1923 amounted to £218,338 and £190,600 respectively. The removal of the embargo on imports of German goods as from 1st September, 1923, was responsible for the huge increase in the exports to £1,166,302 in 1924, and£1,614,090 in 1925.
The high totals for 1918 and 1919 shown for “other countries” are mainly due to temporary heavy exports to Egypt and, in the former year, to France. A considerable extension of New Zealand's trade with Prance (principally in wool) since 1922 is largely responsible for the rise in this group during the last three years, exports to Prance having totalled £600,814 in 1925, as compared with only £60,595 in 1922. Exports to India, Japan, Italy, and the Netherlands rose to a comparatively high level in 1924, but in each case declined again in 1925.
| Year. | United Kingdom. | Australia. | Canada. | Pacific Islands (other than Australia). | United States. | Germany. | Other Countries.* | Total. |
|---|---|---|---|---|---|---|---|---|
| £ | £ | £ | £ | £ | £ | £ | £ | |
* The principal other countries are Hong Kong, Straits Settlements, India, France, Egypt, Java, and Japan. | ||||||||
| 1906 | 14,047,176 | 2,882,522 | 29,815 | 188,755 | 642,792 | 54,952 | 249,125 | 18,095,137 |
| 1907 | 16,533,493 | 2,221,260 | 78,015 | 186,839 | 714,063 | 66,489 | 268,798 | 20,068,957 |
| 1908 | 13,143,780 | 2,103,161 | 24,051 | 203,581 | 326,415 | 40,191 | 476,315 | 16,317,494 |
| 1909 | 16,193,188 | 1,918,115 | 180,975 | 258,164 | 684,810 | 77,969 | 348,775 | 19,661,996 |
| 1910 | 18,633,118 | 2,010,751 | 160,842 | 296,244 | 553,603 | 205,931 | 319,720 | 22,180,209 |
| 1911 | 15,134,743 | 2,515,168 | 199,587 | 324,306 | 434,586 | 170,493 | 249,607 | 19,028,490 |
| 1912 | 16,861,256 | 2,848,664 | 542,271 | 338,621 | 620,988 | 254,703 | 304,078 | 21,770,581 |
| 1913 | 18,130,160 | 2,315,747 | 606,632 | 295,032 | 912,051 | 337,448 | 389,622 | 22,986,722 |
| 1914 | 21,383,891 | 1,928,410 | 595,611 | 326,025 | 1,028,054 | 456,163 | 543,293 | 26,261,447 |
| 1915 | 25,389,030 | 2,548,605 | 925,813 | 499,063 | 2,006,507 | 4 | 379,890 | 31,748,912 |
| 1916 | 26,869,988 | 2,191,545 | 691,986 | 368,069 | 2,493,987 | 5 | 671,357 | 33,286,937 |
| 1917 | 26,023,396 | 1,460,980 | 961,653 | 540,380 | 1,894,317 | 6 | 706,815 | 31,587,547 |
| 1918 | 18,244,250 | 1,803,739 | 1,793,576 | 511,842 | 4,045,648 | 2,117,133 | 28,516,188 | |
| 1919 | 44,312,048 | 2,249,827 | 980,190 | 548,112 | 4,200,861 | 1,679,037 | 53,970,075 | |
| 1920 | 34,354,300 | 2,351,799 | 1,357,774 | 718,283 | 7,456,041 | 23 | 203,726 | 46,441,946 |
| 1921 | 33,716,593 | 2,070,013 | 454,597 | 517,363 | 2,702,104 | 46,162 | 321,995 | 44,828,827 |
| 1922 | 36,154,174 | 2,208,280 | 446,457 | 399,378 | 2,672,775 | 218,338 | 626,847 | 42,726,249 |
| 1923 | 37,324,605 | 2,642,266 | 665,696 | 466,164 | 3,531,272 | 190,600 | 1,146,562 | 45,967,165 |
| 1924 | 42,038,386 | 2,509,322 | 716,543 | 575,880 | 3,278,135 | 1,163,302 | 2,328,143 | 52,612,711 |
| 1925 | 44,073,323 | 2,502,113 | 423,068 | 548,591 | 4,349,758 | 1,614,090 | 1,751,329 | 55,262,272 |
Included in the exports to the United Kingdom are considerable quantities of produce which are shipped to London merely as a convenient depot for subsequent reshipment to the Continent or to America. The total re-exports in normal pre-war years amounted to about £4,000,000 annually, and although the amount fell, under war conditions, to as low as £565,529 in 1918, it has shown a progressive increase during recent years. The following table shows the principal items of New Zealand produce re-exported from the United Kingdom during each of the years 1920 to 1924:—
| RE-EXPORTS OF NEW ZEALAND PRODUCE FROM UNITED KINGDOM, 1920–24. | |||||
|---|---|---|---|---|---|
| Principal Articles. | 1920. | 1921. | 1922. | 1923. | 1924. |
| £ | £ | £ | £ | £ | |
| Butter | 8,852 | 53,448 | 352,932 | 281,776 | 543,989 |
| Cheese | 15,689 | 30,772 | 34,699 | 73,080 | 36,963 |
| Milk-powder, not sweetened | 1,337 | 34,333 | 5,794 | 54,239 | 61,644 |
| Milk, preserved, other kinds, not sweetened | 96,067 | 114,604 | 90,904 | 60,454 | 67,468 |
| Oleo-margarine, oleo-oil, and refined tallow | 46,230 | 43,583 | 54,169 | 33,028 | 13,573 |
| Peas, not fresh | 36,036 | 11,857 | 14,366 | 11,784 | 4,714 |
| Beef, frozen | 613,818 | 506,653 | 485,625 | 77,924 | 70,995 |
| Beef, tinned, canned, &c. (including tongues) and extracts and essences | 50,716 | 18,750 | 12,369 | 2,843 | 17,992 |
| Mutton and lamb, frozen | 263,865 | 120,785 | 41,600 | 44,953 | 50,086 |
| Mutton and lamb (tinned or canned), including tongues | 78,091 | 33,622 | 227 | 190 | 12,829 |
| Meat, other kinds | 90,480 | 2,461 | 1,999 | 1,809 | 9,018 |
| Hides | 4,780 | 13,833 | 9,422 | 13,383 | 142,694 |
| Sheep and lamb skins | 418,164 | 187,019 | 315,722 | 288,066 | 285,993 |
| Rabbit-skins | 60,424 | 311,370 | 152,060 | 104,689 | 99,403 |
| Kauri-gum | 40,300 | 37,596 | 72,923 | 47,144 | 63,998 |
| Tallow | 131,505 | 93,774 | 104,029 | 71,829 | 121,707 |
| Hemp | 282,926 | 101,665 | 66,016 | 77,557 | 96,670 |
| Wool, raw; sheep and lambs' wool | 1,219,871 | 889,170 | 2,790,370 | 4,103,585 | 5,467,046 |
| Casein | 26,764 | 27,382 | 50,271 | 45,684 | 54,342 |
| All other articles | 92,702 | 76,572 | 44,046 | 49,675 | 79,695 |
| Totals, re-exports | 3,578,617 | 2,709,249 | 4,699,552 | 5,443,692 | 7,300,819 |
It is seen that the total amount increased from £3,578,617 in 1920 to £7,300,819 in 1924. Wool is the dominating item, and advanced from £1,219,871 to £5,467,046 during the period under consideration. The greater part of this commodity finds its way to France, Belgium, and Germany. Other items which figure prominently in the table are butter, sheep-skins, hides, tallow, rabbit-skins, and hemp (Phormium tenax).
The table below is of interest as showing changes in the course of the Dominion's exports during recent years. A comparison has been instituted showing the average percentage of exports claimed by each of the principal countries during the pre-war years 1909 to 1913, and also the actual percentages during each of the last five years. The war period and also the immediate post-war years have been disregarded on account of the abnormal conditions then ruling. In considering this table, account should be taken of remarks made earlier in this section regarding reshipments of New Zealand produce made from the United Kingdom to various continental countries.
| Country of Destination. | Average. 1909–13. | 1921. | 1922. | 1923. | 1924. | 1925. |
|---|---|---|---|---|---|---|
| Per Cent. | Per Cent. | Per Cent. | Per Cent. | Per Cent. | Per Cent. | |
| United Kingdom | 80.44 | 86.36 | 84.61 | 81.19 | 79.90 | 79.76 |
| Canada | 1.56 | 1.01 | 1.04 | 1.44 | 1.36 | 0.77 |
| India | 0.01 | 0.09 | 0.40 | 0.73 | 0.94 | 0.35 |
| Ceylon | 0.43 | 0.06 | 0.08 | 0.10 | 0.00 | 0.00 |
| South African Union | 0.34 | 0.00 | 0.40 | 0.02 | 0.06 | 0.03 |
| Australia | 11.30 | 4.62 | 5.17 | 5.74 | 4.77 | 4.53 |
| Fiji | 0.41 | 0.34 | 0.22 | 0.26 | 0.26 | 0.24 |
| Germany | 0.97 | 0.10 | 0.51 | 0.41 | 2.22 | 2.92 |
| France | 0.37 | 0.03 | 0.14 | 0.74 | 1.07 | 1.07 |
| Belgium | 0.10 | 0.01 | 0.02 | 0.02 | 0.20 | 0.35 |
| Japan | 0.00 | 0.04 | 0.49 | 0.45 | 0.63 | 0.42 |
| United States | 3.01 | 6.03 | 6.26 | 7.67 | 6.23 | 7.87 |
It is seen that while the percentage of the Dominion's products which found its way to the United Kingdom in 1925 (79.76) is practically the same as the average for 1909–13, it is considerably less than for the years 1921 and 1922. Generally speaking, four-fifths of the Dominion's exports find a market in the United Kingdom. As mentioned previously, however, a portion of this is subsequently re-exported.
Exports to Australia have declined proportionately during the period under review, the average percentage of 11.30 during 1909–13 having fallen to 4.53 per cent. in 1925. This position is due in a large measure to the fact that considerable quantities of gold which formerly went to the Commonwealth now go direct to the United States and to India. India now receives a larger share of the Dominion's exports than formerly. chiefly in the nature of gold, silver, and wool. Canada's proportion shows a slight decline. The United States, on the other hand, has shown a steady growth as an export customer of the Dominion, and has now ousted Australia from second position. The greatest development is evident in the direction of sheep-skins, rabbit-skins, wool, sausage-casings, and butter. Japan, whose imports from New Zealand were negligible in pre-war days, now receives considerable quantities of wool. France and Belgium now come in for a larger share of the Dominion's products, principally in the direction of wool, hides, skins, and butter. Large quantities of wool sent to Germany have been instrumental in placing that country fourth in magnitude among New Zealand's export customers.
The table below is of interest as showing the increasing percentage of goods being exported to foreign countries.
| EXPORTS TO FOREIGN COUNTRIES DURING 1909–13 (AVERAGE) AND 1921 TO 1925. | |
|---|---|
| Year. | Pet Cent. |
| 1909–13 (average) | 5.64 |
| 1921 | 6.64 |
| 1922 | 7.94 |
| 1923 | 9.98 |
| 1924 | 12.29 |
| 1925 | 13.87 |
The following table shows the exports for the five years ending with 1925, according to the countries of destination. British countries are stated first, according to geographical order, followed by foreign countries in the same order.
| DESTINATIONOF EXPORTS FROM NEW ZEALAND, 1921–25. | |||||
|---|---|---|---|---|---|
| Country. | 1921. | 1922. | 1923. | 1924. | 1925. |
| £ | £ | £ | £ | £ | |
* Included with United Kingdom prior to April, 1924. † Now included in Foreign Countries. | |||||
| United Kingdom | 38,716,593 | 36,154,174 | 37,324,605 | 42,038,386 | .44,073,323 |
| British Possessions, Protectorates, &c. | |||||
| Europe— | |||||
| Irish Free State* | 256 | 264 | |||
| Gibraltar | 30 | ||||
| Malta | 7 | 77 | 3 | 18 | |
| 37 | 77 | 259 | 282 | ||
| Asia— | |||||
| Ceylon | 28,019 | 34,752 | 45,780 | 1,111 | 484 |
| Hong Kong | 13,192 | 23,457 | 20,389 | 13,827 | 17,953 |
| India | 42,917 | 172,046 | 338,393 | 495,850 | 197,428 |
| Straits Settlements | 130,496 | 52,056 | 42,135 | 17,714 | 21,216 |
| Other | 197 | 166 | 57 | 604 | 200 |
| 214,821 | 282,477 | 446,754 | 529,106 | 237,281 | |
| Africa— | |||||
| Egypt | 121 | 35 | 20 | † | † |
| South African Union | 2,906 | 17,993 | 7,392 | 28,585 | 19,306 |
| Other | 164 | 74 | 213 | 360 | 433 |
| 3,191 | 18,102 | 7,625 | 28,945 | 19,739 | |
| America— | |||||
| British West Indies | 1,889 | 155 | 72 | 52 | 7 |
| Canada | 454,597 | 446,457 | 665,696 | 716,543 | 423,068 |
| Other | 8 | 8 | 32 | 19 | |
| 456,494 | 446,620 | 665,768 | 716,627 | 423,094 | |
| Pacific islands— | |||||
| Australia | 2,070,013 | 2,208,280 | 2,642,266 | 2,509,322 | 2,502,113 |
| Fiji | 151,965 | 95,044 | 120,777 | 135,768 | 133,450 |
| Solomon Islands (Protectorate) | 4,010 | 4,555 | 7,782 | 4,827 | 14,604 |
| Tonga | 103,045 | 59,012 | 92,102 | 94,095 | 94,270 |
| Western Samoa | 127,917 | 66,443 | 69,808 | 81,841 | 84,898 |
| Other | 2,267 | 2,853 | 2,355 | 7,875 | 9,578 |
| Foreign Countries and Possessions. | 2,459,217 | 2,436,187 | 2,935,090 | 2,833,728 | 2,838,913 |
| Europe— | |||||
| Belgium | 5,010 | 8,048 | 8,338 | 107,199 | 194,575 |
| France | 14,893 | 60,595 | 340,579 | 561,569 | 600,814 |
| Germany | 46,162 | 218,338 | 190,600 | 1,166,302 | 1,614,090 |
| Italy | 2,502 | 22,514 | 68,886 | 401,764 | 325,279 |
| Netherlands | 2,463 | 5,174 | 15,769 | 261,759 | 55,013 |
| Switzerland | 4,927 | 494 | 663 | 786 | 903 |
| Other | 308 | 1,486 | 167 | 5,085 | 17,373 |
| 76,265 | 316,649 | 625,002 | 2,504,464 | 2,808,047 | |
| Asia— | |||||
| China | 842 | 4,876 | 12,359 | 22,652 | 6,603 |
| Japan | 20,149 | 211,159 | 206,090 | 330,736 | 232,213 |
| Dutch East Indies | 26,474 | 2,058 | 881 | 8,085 | 8,016 |
| Other | 1,184 | 1,036 | 13,652 | 23,262 | 6,400 |
| 48,649 | 219,129 | 232,982 | 384,735 | 253,232 | |
| DESTINATIONOF EXPORTS FROM NEW ZEALAND, 1921–25 | |||||
|---|---|---|---|---|---|
| Country. | 1921. | 1922. | 1923. | 1924. | 1925. |
| £ | £ | £ | £ | £ | |
* formerly included in British possessions. | |||||
| British Possessions, &c.—ctd. | |||||
| Africa— | |||||
| Egypt | * | * | * | 961 | 73 |
| Other | 5 | 2,633 | 3,793 | 5,943 | |
| 5 | 2,633 | 4,754 | 6,016 | ||
| America— | |||||
| Argentina | 4,772 | 438 | 15,548 | 11,686 | 11,445 |
| Chile | 18,308 | 40 | 1,335 | 2,365 | 5,673 |
| United States of America | 2,702,104 | 2,672,775 | 3,531,272 | 3,278,135 | 4,349,758 |
| Other | 201 | 5,554 | 7,777 | 28,047 | 23,678 |
| 2,725,385 | 2,678,807 | 3,555,932 | 3,320,233 | 4,390,554 | |
| Pacific islands— | |||||
| Hawaii | 62,164 | 99,639 | 113,194 | 170,222 | 144,599 |
| Society Islands | 56,635 | 57,241 | 57,737 | 67,227 | 48,362 |
| Tutuila | 6,695 | 12,655 | 1,596 | 7,882 | 15,375 |
| Other | 3,163 | 1,936 | 803 | 7,143 | 3,455 |
| 128,657 | 171,471 | 173,330 | 252,474 | 211,791 | |
Eighty-six per cent. of the total exports from New Zealand went to British countries in 1925. The United States and Germany were responsible for about half of the remainder.
In the following table exports during 1925 have been grouped in accordance with the classification adopted by the British Board of Trade in many of its tables. As might be expected from the large value of butter, cheese, and frozen meat exported, food is the largest of the five divisions, raw materials (other than foodstuffs), which had up to recent years occupied first position, coming next. Many of the most important items in the former class are raw materials also, and the table is a further illustration of the fact that New Zealand is essentially a primary-producing country. Exports of articles wholly or mainly manufactured constituted in 1925 only 2.94 per cent. of the total. The corresponding percentage for 1924 was 2.76, and for 1923 3.06. A similar table given in the “Imports” subsection of this book shows that the reverse is the case in respect of imports—namely, a preponderance of manufactured goods.
| EXPORTS TO VARIOUS COUNTRIES, 1925.—ITEMSGROUPED ACCORDING TO BRITISH BOARD OF TRADE CLASSIFICATION. | ||||||
|---|---|---|---|---|---|---|
| Country. | Food, Drink, and Tobacco. | Raw Materials and Articles mainly unmanufactured. | Articles wholly or mainly manufactured. | Miscellaneous and Unclassified (Including Parcels-post). | Bullion and Specie. | Total. |
| £ | £ | £ | £ | £ | £ | |
| United Kingdom | 27,229,427 | 15,708,951 | 1,038,201 | 90,337 | 6,407 | 44,073,323 |
| British Possessions, &c. | ||||||
| Europe— | ||||||
| Irish Free State | 264 | 264 | ||||
| Malta | 7 | 11 | 18 | |||
| Asia— | ||||||
| Aden | 5 | 5 | ||||
| British North Borneo | 25 | 17 | 42 | |||
| Burma | 33 | 5 | 38 | |||
| Ceylon | 41 | 365 | 78 | 484 | ||
| Cyprus | 10 | 10 | ||||
| Hong Kong | 7,000 | 10,550 | 248 | 155 | 17,953 | |
| India | 452 | 85,076 | 4,056 | 951 | 106,893 | 197,428 |
| Malay States | 6 | 99 | 105 | |||
| Straits Settlements | 20,183 | 738 | 131 | 164 | 21,216 | |
| Africa— | ||||||
| Anglo-Egyptian Sudan | 150 | 150 | ||||
| British | ||||||
| East Africa Protectorate | 16 | 16 | ||||
| British West Africa Protectorate | 7 | 7 | ||||
| St. Helena | 188 | 188 | ||||
| South African Union | 1,329 | 4,222 | 13,009 | 746 | 19,306 | |
| Southern Rhodesia | 72 | 72 | ||||
| America— | ||||||
| British Guiana | 3 | 3 | ||||
| British West Indies | 7 | 7 | ||||
| Canada | 269,476 | 136,177 | 9,142 | 8,273 | 423,068 | |
| Falkland Islands | 16 | 16 | ||||
| Pacific islands— | ||||||
| Australia | 275,997 | 1,314,790 | 341,345 | 174,951 | 395,030 | 2,502,113 |
| Fanning Island | 181 | 113 | 33 | 327 | ||
| Fiji | 57,420 | 5,706 | 64,966 | 5,358 | 133,450 | |
| Gilbert and Ellice Islands | 53 | 20 | 27 | 100 | ||
| Nauru (Pleasant) Island | 1,600 | 1,463 | 158 | 37 | 3,258 | |
| Norfolk Island | 262 | 121 | 23 | 406 | ||
| Ocean Island | 4,874 | 179 | 80 | 10 | 5,143 | |
| Papua | 56 | 37 | 93 | |||
| Pitcairn Island | 72 | 63 | 116 | 251 | ||
| Solomon Islands Protectorate | 5,987 | 1,295 | 7,254 | 68 | 14,604 | |
| Tonga | 55,888 | 1,194 | 34,681 | 2,507 | 94,270 | |
| Western Samoa | 53,409 | 2,854 | 28,284 | 351 | 84,898 | |
| Totals, British countries | 27,983,746 | 17,273,195 | 1,542,462 | 284,899 | 508,330 | 47,592,632 |
| Foreign Countries and Possessions. | ||||||
| Europe— | ||||||
| Austria | 3,156 | 3 | 93 | 3,252 | ||
| Belgium | 41,263 | 148,893 | 4,373 | 46 | 194,575 | |
| Czechoslovakia | 31 | 31 | ||||
| Danzig | 4,050 | 4,050 | ||||
| Denmark | 1,274 | 1,665 | 2,939 | |||
| France | 29,967 | 569,529 | 406 | 912 | 600,814 | |
| Germany | 185,766 | 1,424,997 | 2,012 | 1,315 | 1,614,090 | |
| Greece | 7 | 7 | ||||
| Hungary | 24 | 24 | ||||
| Italy | 132,444 | 192,237 | 527 | 71 | 325,279 | |
| Jugo-Slavia | 29 | 29 | ||||
| Netherlands | 203 | 53,872 | 63 | 875 | 55,013 | |
| Norway | 24 | 4,746 | 17 | 4,787 | ||
| Poland | 16 | 16 | ||||
| Russia | 3 | 3 | ||||
| Spain | 6 | 6 | ||||
| Sweden | 1,855 | 355 | 8 | 2,229 | ||
| Switzerland | 327 | 576 | 903 | |||
| Asia— | ||||||
| Asiatic Turkey | 74 | 74 | ||||
| China | 5,081 | 82 | 657 | 783 | 6,603 | |
| Japan | 15,540 | 215,248 | 1,312 | 113 | 232,213 | |
| Dutch East Indies | 7,439 | 7 | 339 | 231 | 8,016 | |
| Philippine Islands | 6,213 | 85 | 21 | 6,319 | ||
| Slam | 7 | 7 | ||||
| Africa— | ||||||
| Belgian Congo | 9 | 9 | ||||
| Canary Islands | 13 | 13 | ||||
| Egypt | 73 | 73 | ||||
| Portuguese East Africa | 5,921 | 5,921 | ||||
| America— | ||||||
| Argentina | 1,362 | 10,083 | 11,445 | |||
| Bolivia | 1 | 1 | ||||
| Brazil | 1 | 1 | ||||
| Chile | 50 | 35 | 5,588 | 5,673 | ||
| Costa Rica | 75 | 75 | ||||
| Peru | 255 | 255 | ||||
| United States of America | 600,382 | 3,616,415 | 51,283 | 41,783 | 39,895 | 4,349,758 |
| Uruguay | 19,182 | 1,259 | 2,905 | 23,346 | ||
| Pacific islands— | ||||||
| Hawaii | 143,181 | 74 | 1,233 | 111 | 144,599 | |
| New Caledonia | 74 | 731 | 655 | 140 | 1,600 | |
| New Hebrides | 1,422 | 144 | 264 | 25 | 1,855 | |
| Society Islands | 34,048 | 318 | 10,867 | 3,129 | 48,362 | |
| Tutulla | 879 | 14,477 | 6 | 13 | 15,375 | |
| Totals, foreign countries | 1,223,424 | 6,252,105 | 83,344 | 70,872 | 39,895 | 7,669,640 |
| Grand totals | 29,207,170 | 23,525,300 | 1,625,806 | 355,771 | 548,225 | 55,262,272 |
More detailed information as to principal exports to the various countries during the last five years is given in the following pages:—
| PRINCIPAL ARTICLESEXPORTEDTOVARIOUS COUNTRIES, 1921–25. | |||||
|---|---|---|---|---|---|
| Article. | 1921. | 1922. | 1923. | 1924. | 1925. |
| £ | £ | £ | £ | £ | |
| United Kingdom. | |||||
| Butter | 10,953,941 | 8,758,471 | 9,597,526 | 10,772,518 | 9,738,193 |
| Casein | 108,078 | 57,766 | 80,457 | 85,835 | 75,956 |
| Cheese | 8,191,233 | 4,679,348 | 6,809,584 | 6,983,271 | 5,780,244 |
| Eggs in shell | 156 | 142 | 5,743 | 16,766 | 572 |
| Honey | 27,990 | 46,336 | 25,287 | 29,429 | 52,617 |
| Meat, poultry, and game— | |||||
| Frozen— | |||||
| Beef | 1,706,180 | 535,772 | 863,127 | 666,147 | 832,677 |
| Lamb, whole carcases | 4,597,580 | 4,966,867 | 6,029,554 | 5,926,763 | 6,756,387 |
| Mutton, whole carcases | 4,468,359 | 2,644,818 | 1,882,036 | 2,537,565 | 3,068,041 |
| Pork | 20,288 | 34,640 | 94,629 | 24,159 | 143,358 |
| Other | 176,319 | 109,147 | 82,906 | 101,294 | 89,265 |
| Potted and preserved | 150,592 | 87,275 | 43,517 | 44,211 | 71,249 |
| Sausage casings | 56,980 | 44,463 | 20,010 | 36,354 | 50,226 |
| Other | 3,235 | 5,602 | 10,026 | 21,550 | 6,587 |
| Milk, dried | 960,971 | 457,518 | 451,945 | 446,619 | 346,264 |
| Apples, fresh | 19,198 | 60,344 | 53,169 | 100,342 | 104,930 |
| Peas | 99,592 | 84,062 | 135,301 | 71,876 | 78,196 |
| Oats | 82,152 | 42,731 | 18,015 | 70 | 46 |
| Wheat | 109,976 | 531 | |||
| Hops | 1,039 | 17,593 | 4,486 | 28,243 | 2,774 |
| Hair not made up, other than human | 2,057 | 2,262 | 1,544 | 2,669 | 3,952 |
| Hides, pelts, and skins, undressed— | |||||
| Rabbit | 247,081 | 319,297 | 307,783 | 345,686 | 401,131 |
| Sheep, with wool | 10,410 | 104,797 | 157,143 | 277,030 | 142,349 |
| Sheep, without wool | 367,665 | 294,137 | 206,892 | 198,690 | 266,707 |
| Other | 82,464 | 44,003 | 72,214 | 240,703 | 209,760 |
| Wool— | |||||
| Greasy | 3,130,011 | 6,844,265 | 6,265,537 | 7,877,301 | 10,619,834 |
| Scoured | 633,118 | 1,947,752 | 1,565,074 | 1,731,838 | 1,570,967 |
| Sliped | 974,185 | 2,197,797 | 1,237,000 | 1,936,233 | 1,834,551 |
| Washed | 3,602 | 8,583 | 10,455 | 18,747 | 10,252 |
| Copra | 5,667 | 9,717 | 18,519 | 10,522 | 10,365 |
| Phormium tenax | 103,119 | 85,849 | 43,786 | 134,575 | 226,485 |
| Tow | 920 | 1,629 | 8,791 | 18,396 | |
| Seeds | 72,373 | 118,284 | 61,062 | 64,289 | 50,368 |
| Apparel | 12,746 | 8,707 | 13,193 | 13,269 | 11,551 |
| Textile piece-goods | 58,094 | 64,756 | 9,121 | 14,876 | 32,550 |
| Tallow | 821,511 | 732,266 | 678,059 | 678,706 | 843,289 |
| Oil, mineral | 310 | 287 | 224 | 21,915 | 59,649 |
| Oil, other than mineral | 665 | 1,976 | 3,022 | 2,806 | 6,714 |
| Coal | 90,728 | 202,654 | 117,819 | 134,529 | 151,582 |
| Kauri-gum | 134,502 | 123,423 | 166,535 | 160,322 | 180,916 |
| Gold | 2,760 | 13,367 | 890 | 3,189 | 1,735 |
| Electrical machinery and machines | 4,309 | 5,293 | 2,819 | 2,763 | 2,707 |
| Leather | 83,512 | 41,737 | 17,906 | 4,115 | 6,523 |
| Timber | 1,244 | 5,131 | 15,760 | 9,668 | 32,715 |
| Stationery and books | 9,831 | 8,052 | 6,195 | 25,538 | 11,935 |
| Musical instruments | 5,603 | 4,090 | 6,840 | 9,588 | 9,976 |
| Sugar of milk | 2,078 | 12,816 | 25 | 15 | |
| Motors for road traffic and materials therefor | 43,081 | 7,266 | 10,716 | 11,341 | 3,613 |
| Parcels-post | 42,300 | 35,133 | 40,575 | 35,826 | 39,375 |
| Canada. | |||||
| Butter | 82,908 | 91,777 | 233,235 | 340,582 | 26,360 |
| Cheese | 65 | 6 | 542 | 19,322 | 2,621 |
| Gelatine | 3,734 | 4,175 | 3,269 | 3,325 | 1,400 |
| frozen meat | 23,055 | 9,083 | 3,022 | 621 | |
| Meats, potted and preserved | 14,177 | 3,386 | 2,832 | 2,865 | 710 |
| Sausage casings | 66,210 | 88,199 | 141,795 | 175,455 | 231,884 |
| Hides, pelts, and skins, undressed— | |||||
| Calf | 35,403 | 14,881 | 6,597 | 6,248 | 22,478 |
| Cattle | 59,794 | 77,151 | 62,149 | 23,080 | 32,262 |
| Sheep, without wool | 43,674 | 19,324 | 27,835 | 7,476 | |
| Other | 8,879 | 10,224 | 15,678 | 42,466 | 72,069 |
| Wool— | |||||
| Greasy | 50,649 | 54,608 | 61,346 | 41,667 | 35,121 |
| Scoured | 2,106 | 22,268 | 68,572 | 16,228 | 8,284 |
| Sliped | 26,659 | 15,700 | 10,754 | 6,313 | 10,546 |
| Seeds | 1,739 | 8,408 | 3,647 | 5,676 | 6,144 |
| Apparel | 10,171 | 3,285 | 6,033 | 3,876 | 1,970 |
| Kauri-gum | 7,939 | 8,931 | 6,116 | 7,155 | 3,991 |
| Phormium lenax | 2,715 | 2,164 | 9,841 | ||
| Parcels-post | 1,404 | 1,159 | 1,532 | 2,220 | 1,986 |
| Ceylon. | |||||
| Silver | 24,614 | 34,614 | 45,115 | ||
| Hong Kong. | |||||
| Fungus | 443 | 10,598 | 3,383 | 10,547 | |
| Butter | 12,852 | 22,271 | 8,982 | 9,033 | 6,921 |
| PRINCIPAL ARTICLESEXPORTEDTOVARIOUS COUNTRIES, 1921–25 | |||||
|---|---|---|---|---|---|
| Article. | 1921. | 1922. | 1923. | 1924. | 1925. |
| India. | |||||
| £ | £ | £ | £ | £ | |
| Wool | 97,597 | 85,076 | |||
| Gold | 166,104 | 332,238 | 323,921 | 47,301 | |
| Sliver | 17,330 | 2,894 | 4,827 | 70,267 | 59,592 |
| Parcels-post | 1,184 | 723 | 1,059 | 1,258 | 951 |
| Straits Settlements. | |||||
| Butter | 6,090 | 10,771 | 18,438 | ||
| Milk and cream, preserved, condensed, &c. (other than dried) | 88,569 | 51,740 | 34,371 | 5,387 | |
| Union of South Africa | |||||
| Tallow | 1,564 | 2,737 | 1,909 | 12,869 | 10,948 |
| Australia. | |||||
| Butter | 310 | 83,847 | 372,307 | 15,336 | 2,633 |
| Casein | 4,400 | 1,492 | 4,490 | 6,383 | 3,174 |
| Cheese | 4,734 | 6,214 | 57,608 | 17,195 | 5,613 |
| Fish | 35,495 | 50,176 | 69,435 | 58,718 | 55,839 |
| Meats, potted and preserved | 18,106 | 15,779 | 31,681 | 28,262 | 34,371 |
| Fork, preserved, other than frozen | 521 | 4,506 | 11,900 | 19,080 | 18,474 |
| Pork, frozen | 13,315 | 16,784 | 63,455 | 23,070 | |
| Sausage casings | 3,452 | 7,338 | 6,845 | 7,507 | 9,552 |
| Milk, preserved | 16,716 | 1,871 | 4,003 | 30,841 | 27,319 |
| Biscuits | 94 | 4 | 26 | 5,007 | 26 |
| Peas | 17,693 | 16,731 | 20,456 | 10,185 | 20,470 |
| Oats | 1,130 | 47,465 | 54,955 | 855 | 1,410 |
| Hops | 16,499 | 17,593 | 12,552 | 18,005 | 17,531 |
| Cocoa and chocolate | ,437 | 7,505 | 11,286 | 208 | 153 |
| Tea | 5,065 | 2,766 | 5,253 | 7 | 753 |
| Ale, porter, and beer | 253 | 292 | 1,301 | 3,028 | 2,077 |
| Whisky | 7,044 | 23,387 | 1,067 | 914 | 1,190 |
| Tobacco | 6,673 | 5,729 | 8,445 | 2,356 | 5,568 |
| Cattle | 6,159 | 8,176 | 56,405 | 8,663 | 4,228 |
| Horses | 26,253 | 34,660 | 38,448 | 48,884 | 66,990 |
| Sheep | 1,416 | 1,712 | 9,396 | 5,447 | 12,721 |
| Hair, not made up | 4,051 | 3,363 | 4,782 | 3,400 | 2,948 |
| Calf-skins | 48,215 | 115,930 | 91,881 | 84,901 | 65,696 |
| Cattle-hides | 259,370 | 198,861 | 368,759 | 304,854 | 226,261 |
| Sheep-skins, without wool | 12,439 | 55,911 | 54,063 | 75,184 | 52,299 |
| Other hides and skins | 10,266 | 5,846 | 7,022 | 23,172 | 31,863 |
| Wool— | |||||
| Greasy | 19,412 | 5,190 | 71,206 | 384,018 | 153,873 |
| Other | 689 | 48,978 | 134,312 | 4,588 | |
| Phormium tenax | 161,174 | 99,700 | 67,286 | 103,128 | 101,329 |
| Tow | 25,793 | 29,426 | 2,785 | 26,754 | 35,241 |
| Seeds— | |||||
| Grass and clover | 45,221 | 28,153 | 39,245 | 46,957 | 59,493 |
| Linseed | 48,733 | 14,698 | 20,950 | 12,547 | 6,684 |
| Other | 7,825 | 7,041 | 5,795 | 5,758 | 5,673 |
| Apparel | 29,648 | 50,030 | 7,248 | 13,055 | 7,721 |
| Hosiery | 7,134 | 160,759 | 4,197 | 4,155 | 10,083 |
| Textile piece-goods | 61,884 | 113,222 | 35,870 | 16,512 | 11,624 |
| Rugs | 3,519 | 9,360 | 5,603 | 8,909 | 6,497 |
| Twine | 17,824 | 22,164 | 16,412 | 6,619 | 6,250 |
| Glycerine | 2,162 | 1,593 | 3,779 | 3,461 | |
| Whale-oil | 7,01 | 2,310 | 6,042 | 4,588 | 6,244 |
| Tallow | 29,340 | 240 | 97,780 | 97,078 | 22,121 |
| Coal | 30,810 | 27,954 | 39,550 | 33,019 | 62,297 |
| Pumice-sand | 6,961 | 8,156 | 9,493 | 4,542 | 7,092 |
| Specie—silver | 27,372 | 34,443 | 12,883 | ||
| Gold | 6,966 | 5,731 | 37,715 | 2,278 | 383,338 |
| Silver | 8,076 | 11,263 | 6,094 | 35,458 | 14,019 |
| Agricultural implements | 3,228 | 7,278 | 13,443 | 12,554 | 5,424 |
| Dairying machinery | 3,099 | 1,906 | 3,247 | 4,609 | 4,281 |
| Electrical machinery | 9,754 | 18,542 | 11,339 | 7,910 | 4,654 |
| Leather | 14,767 | 10,651 | 4,876 | 5,242 | 3,662 |
| Timber— | |||||
| White-pine | 353,460 | 363,501 | 328,205 | 360,188 | 446,221 |
| Kauri | 42,011 | 46,430 | 43,612 | 27,485 | 54,285 |
| Rimu | 66,114 | 40,560 | 59,571 | 45,369 | 32,582 |
| Other | 37,742 | 15,972 | 24,641 | 27,485 | 30,677 |
| Books, papers, and music, printed | 13,460 | 11,020 | 8,375 | 12,556 | 10,305 |
| Jewellery | 135,744 | 58,709 | 31,198 | 3,243 | 8,827 |
| Fancy-goods and toys | 1,850 12,164 | 1,376 | 3,325 | 2,755 | 694 |
| Cinematograph, bioscope, and kinetoscope films | 12,164 | 4,770 | 4,186 | 16,620 | 22,616 |
| Photographic materials and goods | 3,237 | 9,681 | 4,702 | 3,441 | 986 |
| Motors for road traffic and materials therefor | 87,432 | 66,431 | 19,471 | 14,613 | 20,126 |
| Sugar of milk | 225 | 163 | 4,358 | 10,579 | 4,701 |
| Musical instruments | 4,388 | 5,830 | 4,585 | 3,974 | 2,230 |
| Parcels-post | 23,357 | 18,060 | 17,897 | 19,497 | 18,256 |
| PRINCIPAL ARTICLESEXPORTEDTOVARIOUS COUNTRIES, 1921–25 | |||||
|---|---|---|---|---|---|
| Article. | 1921. | 1922. | 1923. | 1924. | 1925. |
| Fiji. | |||||
| £ | £ | £ | £ | £ | |
| Batter | 6,242 | 6,580 | 6,770 | 4,742 | 2,269 |
| Cheese | 1,673 | 739 | 1,092 | 1,196 | 910 |
| Bacon | 2,280 | 1,428 | 2,093 | 5,308 | 349 |
| Meats, potted and preserved | 18,201 | 8,425 | 17,266 | 22,561 | 25,196 |
| Milk and cream, preserved, condensed, &c. | 3,686 | 3,832 | 2,525 | 1,825 | 2,191 |
| Confectionery | 1,633 | 1,273 | 2,431 | 2,266 | 2,270 |
| Oats | 165 | 1,122 | 4,876 | 54 | 27 |
| Sugar | 5,080 | 3,625 | 3,325 | 3,932 | 2,674 |
| Potatoes | 6,329 | 4,161 | 4,801 | 2,991 | 4,216 |
| Tea | 3,593 | 2,426 | 3,100 | 4,569 | 5,859 |
| Ale, porter, and beer | 1,203 | 2,084 | 1,248 | 1,640 | 1,499 |
| Cattle | 353 | 180 | 1,275 | 3,370 | 617 |
| Sheep | 1,868 | 3,204 | 3,885 | 2,781 | 1,841 |
| Apparel | 1,976 | 1,029 | 1,090 | 2,348 | 2,599 |
| Textile piece-goods | 7,726 | 5,149 | 1,738 | 2,040 | 1,907 |
| Rugs | 2,992 | 2,058 | 1,568 | 1,406 | 1,688 |
| Bags and sacks | 13,746 | 8,245 | 9,193 | 13,787 | 26,434 |
| Tallow | 2,441 | 2,820 | 2,242 | 3,242 | 2,955 |
| Coal | 4,698 | 4,492 | 3,678 | 953 | 2,979 |
| Hardware, hollow-ware, and ironmongery | 1,980 | 786 | 1,054 | 998 | 1,016 |
| Timber | 1,641 | 2,817 | 5,016 | 3,288 | 2,469 |
| Cement, building | 2,284 | 1,087 | 337 | 18 | |
| Cinematograph, bioscope, and kinetoscope films | 2,720 | 6,635 | 10,053 | 11,236 | 11,468 |
| Soap | 1,062 | 821 | 1,183 | 1,176 | 1,341 |
| Parcels-post | 2,461 | 2,021 | 1,881 | 2,385 | 2,079 |
| Tonga. | |||||
| Butter | 3,879 | 1,987 | 2,821 | 4,002 | 3,260 |
| Salted beef | 3,126 | 1,730 | 4,676 | 2,332 | 5,208 |
| Meats, potted and preserved | 30,398 | 13,136 | 23,628 | 29,619 | 30,732 |
| Biscuits | 1,423 | 719 | 1,236 | 1,747 | 2,400 |
| Sugar | 5,598 | 2,606 | 3,363 | 4,635 | 3,309 |
| Apparel | 2,433 | 1,505 | 2,014 | 3,205 | 3,589 |
| Textile piece-goods | 12,603 | 6,210 | 8,926 | 6,652 | 6,375 |
| Cordage and rope | 1,661 | 1,228 | 1,567 | 1,387 | 1,755 |
| Kerosene | 1,415 | 1,881 | 2,569 | 2,719 | 1,973 |
| Hardware, hollow-ware, and ironmongery | 1,692 | 999 | 2,156 | 1,684 | 1,662 |
| Wire | 1,048 | 764 | 1,318 | 1,242 | 1,453 |
| Timber | 1,405 | 1,353 | 1,740 | 3,288 | 664 |
| Cinematograph, bioscope, and kinetoscope films | 250 | 625 | 7,370 | 1,253 | 970 |
| Parcels-post | 1,487 | 1,262 | 1,214 | 1,730 | 2,356 |
| Western Samoa. | |||||
| Butter | 5,027 | 3,482 | 4,082 | 4,332 | 4,326 |
| Salted beef | 7,762 | 5,156 | 6,756 | 5,640 | 7,850 |
| Meats, potted and preserved | 28,762 | 16,490 | 18,004 | 27,330 | 26,494 |
| Frozen meat | 1,784 | 543 | 3,218 | 1,474 | 1,420 |
| Milk and cream, preserved, condensed, &c. | 2,681 | 1,626 | 1,493 | 1,232 | 1,255 |
| Sugar | 6,135 | 1,334 | 775 | 1,585 | 2,680 |
| Apparel | 1,867 | 1,632 | 1,066 | 1,764 | 1,480 |
| Textile piece-goods | 6,570 | 3,067 | 4,397 | 4,872 | 3,815 |
| Hardware, hollow-ware, and ironmongery | 2,282 | 1,161 | 935 | 1,244 | 1,936 |
| Cement | 1,828 | 1,688 | 1,145 | 609 | 100 |
| Medicinal preparations, drugs, &c. | 1,867 | 1,093 | 1,323 | 523 | 862 |
| Soap | 3,104 | 2,522 | 1,289 | 1,289 | 1,097 |
| Belgium. | |||||
| Hides, pelts, and skins | 159 | 4,617 | 53,595 | 124,934 | |
| Wool | 4,753 | 7,971 | 2,696 | 51,095 | 17,380 |
| France. | |||||
| Butter | 82,875 | 25,732 | 17,734 | ||
| Wool | 14,386 | 58,337 | 251,394 | 516,568 | 519,300 |
| Kauri-gum | 2,673 | 7,628 | 7,903 | ||
| Germany. | |||||
| Butter | 79,011 | 117,858 | |||
| Casein | 5,888 | 17,564 | |||
| Frozen meat | 17,604 | 36,344 | 29,672 | ||
| Hides and pelts | 2,133 | 5,772 | 95,611 | ||
| Wool | 43,081 | 195,383 | 186,439 | 1,030,038 | 1,314,630 |
| Kauri-gum | 2,473 | 4,464 | 832 | 6,968 | 5,838 |
| Italy. | |||||
| Frozen meat | 64,662 | 132,444 | |||
| Hides and pelts | 19 | 210 | 12,536 | 24,598 | |
| Wool | 188 | 21,637 | 68,010 | 319,170 | 167,639 |
| Kauri-gum | 5,193 | ||||
| Netherlands. | |||||
| Wool | 1,713 | 2,339 | 11,609 | 256,599 | 17,099 |
| Kauri-gum | 2,214 | 3,749 | 950 | 2,289 | |
| China. | |||||
| Butter | 28 | 4,329 | 10,149 | 18,803 | 5,058 |
| Japan. | |||||
| Butter | 245 | 5,670 | 20,958 | 6,154 | |
| Casein | 1,490 | 20,360 | 26,509 | 9,218 | |
| Meats, potted and preserved | 4,075 | 2,436 | |||
| Wheat | 121,632 | ||||
| Wool | 15,353 | 86,038 | 172,909 | 272,927 | 214,736 |
| Philippine Islands. | |||||
| Butter | 12,418 | 18,681 | 5,600 | ||
| Argentina. | |||||
| Fresh apples | 15,168 | ||||
| Sheep | 2,579 | 400 | 8,275 | 9,247 | |
| Cattle | 2,375 | 798 | |||
| Chile. | |||||
| Sheep | 18,015 | 1,312 | 2,363 | 5,584 | |
| United States. | |||||
| Butter | 102,983 | 35,112 | 271,639 | 196,855 | 174,207 |
| Casein | 2,033 | 16,462 | 75,924 | 2,370 | 3,432 |
| Frozen meat | 120,868 | 16,718 | 14 | 776 | 72 |
| Sausage casings | 322,056 | 330,621 | 260,698 | 345,611 | 381,565 |
| Hides, pelts, and skins, undressed— | |||||
| Calf | 55,109 | 15,944 | 85,568 | 121,143 | 102,871 |
| Cattle | 29,219 | 49,448 | 88,976 | 27,911 | 59,330 |
| Rabbit | 188,295 | 245,202 | 162,310 | 356,470 | 420,018 |
| Sheep, without wool | 532,977 | 486,554 | 607,021 | 914,153 | 1,439,872 |
| Other | 4,303 | 14,313 | 50,641 | 8,348 | 58,510 |
| Wool— | |||||
| Greasy | 269,353 | 394,268 | 810,046 | 571,384 | 1,104,126- |
| Other | 32,894 | 20,737 | 62,621 | 13,187 | 44,860 |
| Phormium tenax | 26,167 | 79,524 | 173,419 | 149,020 | 157,575 |
| Seeds | 42,272 | 134,682 | 79,084 | 38,164 | 35,523 |
| Tallow | 8,843 | 8,701 | 4,793 | 36 | |
| Coal | 1,375 | 5,683 | 10,692 | 11,963 | |
| Kauri-gum | 214,383 | 416,164 | 415,075 | 252,365 | 210,790 |
| Gold | 602,308 | 354,944 | 327,740 | 222,400 | 39,895 |
| Parcels-post | 6,415 | 4,087 | 5,409 | 7,345 | 5,575 |
| Uruguay. | |||||
| Fresh apples | 750 | 1,874 | 19,590 | 8,337 | |
| Sheep | 3,874 | 3,970 | 5,937 | 2,355 | |
| Hawaii. | |||||
| Butter | 8,420 | 40,542 | 66,181 | 98,122 | 97,901 |
| Frozen meat | 43,595 | 37,227 | 35,885 | 67,393 | 40,984 |
| Dried milk | 421 | 28 | 1,394 | 953 | 1,163 |
| Fresh apples | 2,685 | 1,983 | 1,920 | 1,305 | 1,032 |
| Manures | 13,832 | 6,617 | |||
| Society Islands. | |||||
| Butter | 4,314 | 5,313 | 5,673 | 8,419 | 5,526 |
| Meats, potted and preserved | 8,634 | 10,387 | 14,169 | 23,535 | 18,643 |
| Milk and cream, condensed, preserved, &c. | 4,842 | 5,693 | 3,757 | 5,458 | 4,321 |
| Sugar | 6,627 | 2,633 | 3,085 | 1,845 | 763 |
| Potatoes | 829 | 1,001 | 1,131 | 1,035 | 882 |
| Cattle | 1,540 | 2,605 | 1,393 | 1,344 | 396 |
| Sheep | 503 | 1,123 | 1,045 | 857 | 595 |
| Textile piece-goods | 981 | 4,475 | 5,760 | 276 | 71 |
| Cinematograph, bioscope, and kinetoscope films | 5,870 | 1,206 | 2,076 | 1,045 | 2,517 |
| Soap | 5,791 | 8,638 | 7,827, | 7,679 | 5,183 |
| Tutuila. | |||||
| Meats, potted and preserved | 2,553 | 1,775 | 1,252 | 3,056 | 827 |
| Coal | 3,018 | 10,756 | 4,615 | 14,477 | |
In order to show at a glance the destinations of the main items of export, tables are appended showing the details for five years for each of the principal articles. Both New Zealand produce and re-exports are included.
| DESTINATIONOF MAIN EXPORTS, 1921–25. | |||||
|---|---|---|---|---|---|
| Country to which exported. | 1921. | 1922. | 1923. | 1924. | 1925. |
| Wool. | |||||
| lb. | lb. | lb. | lb. | lb. | |
| United Kingdom | 145,385,964 | 292,176,127 | 181,720,079 | 154,203,409 | 162,039,136 |
| Canada | 2,353,978 | 2,537,316 | 2,372,589 | 842,811 | 835,666 |
| France | 698,671 | 2,529,840 | 5,192,571 | 7,328,522 | 7,009,818 |
| Germany | 1,477,131 | 7,060,931 | 4,662,237 | 15,805,443 | 15,954,675 |
| Japan | 1,068,292 | 5,001,918 | 4,584,222 | 3,759,829 | 2,535,932 |
| United States of America | 7,241,051 | 10,775,092 | 14,243,490 | 6,995,991 | 11,692,769 |
| Other countries | 489,741 | 1,451,991 | 4,790,903 | 17,308,455 | 5,658,860 |
| Totals | 158,714,828 | 321,533,215 | 217,566,091 | 206,244,460 | 205,726,856 |
| Frozen Meat. | |||||
| Cwt. | Cwt. | Cwt. | Cwt. | Cwt. | |
| United Kingdom | 4,241,074 | 3,471,435 | 3,012,796 | 3,069,891 | 3,237,880 |
| Canada | 5,449 | 3,209 | 905 | 242 | |
| Australia | 3 | 3,412 | 4,807 | 16,908 | 7,015 |
| Pacific islands | 21,912 | 19,085 | 26,290 | 41,571 | 22,905 |
| Germany | 15,352 | 30,447 | 18,915 | ||
| United States of America | 54,316 | 5,511 | 3 | 204 | 49 |
| Other countries | 14 | 53,648 | 127,199 | ||
| Totals | 4,322,754 | 3,518,004 | 3,043,910 | 3,213,574 | 3,414,205 |
| Butler. | |||||
| Cwt. | Cwt. | Cwt. | Cwt. | Cwt. | |
| United Kingdom | 878,737 | 1,081,512 | 1,119,355 | 1,174,894 | 1,186,965 |
| Canada | 9,525 | 14,083 | 27,625 | 37,164 | 3,015 |
| Australia | 24 | 10,225 | 44,353 | 1,726 | 294 |
| Pacific islands | 2,199 | 6,933 | 9,617 | 13,545 | 12,960 |
| United States of America | 7,899 | 5,762 | 33,755 | 20,805 | 19,236 |
| Other countries | 94 | 1,685 | 15,435 | 21,321 | 22,854 |
| Totals | 898,478 | 1,120,200 | 1,250,140 | 1,269,455 | 1,245,324 |
| Cheese. | |||||
| Cwt. | Cwt. | Cwt. | Cwt. | Cwt. | |
| United Kingdom | 1,368,051 | 1,160,285 | 1,428,762 | 1,585,635 | 1,371,986 |
| Australia | 360 | 661 | 12,097 | 3,178 | 745 |
| Pacific islands | 309 | 196 | 278 | 411 | 251 |
| Other countries | 66 | 61 | 323 | 5,262 | 3,772 |
| Totals | 1,368,786 | 1,161,203 | 1,441,460 | 1,594,486 | 1,376,754 |
| Preserved Milk. | |||||
| lb. | lb. | lb. | lb. | lb. | |
| United Kingdom | 16,151,943 | 9,821,132 | 14,168,510 | 11,686,033 | 10,080,021 |
| Straits Settlements | 1,810,949 | 1,128,450 | 1,138,486 | 185,596 | 47,388 |
| Australia | 352,792 | 139,842 | 276,013 | 1,184,238 | 1,051,624 |
| Fiji | 68,109 | 71,440 | 56,013 | 48,372 | 56,645 |
| Tonga | 16,432 | 15,894 | 17,338 | 16,454 | 14,138 |
| Western Samoa | 46,488 | 30,505 | 33,122 | 30,885 | 33,372 |
| Society Islands | 88,970 | 100,884 | 75,794 | 115,596 | 91,066 |
| Other countries | 166,487 | 165,907 | 462,297 | 215,800 | 2,368,373 |
| Totals | 18,702,170 | 11,474,054 | 16,227,573 | 13,482,974 | 13,742,627 |
| Tallow. | |||||
| Tons. | Tons. | Tons. | Tons. | Tons. | |
| United Kingdom | 25,956 | 25,668 | 22,065 | 20,699 | 23,599 |
| Australia | 1,084 | 8 | 2,867 | 2,692 | 656 |
| United States of America | 415 | 500 | 140 | 1 | |
| Other countries | 257 | 319 | 183 | 597 | 782 |
| Totals | 27,712 | 26,495 | 25,255 | 23,988 | 25,038 |
| Hides (Horse and Cattle). | |||||
| Number. | Number. | Number. | Number. | Number. | |
| United Kingdom | 61,516 | 22,688 | 30,043 | 157,901 | 107,897 |
| Canada | 44,150 | 49,719 | 55,863 | 26,886 | 27,989 |
| Australia | 194,545 | 134,947 | 196,793 | 185,733 | 118,479 |
| United States of America | 29,242 | 33,549 | 53,355 | 32,780 | 52,366 |
| Other countries | 3,749 | 67,410 | 189,573 | ||
| Totals | 329,453 | 240,903 | 339,803 | 470,710 | 496,304 |
| Calf-skins. | |||||
| Number. | Number. | Number. | Number. | Number. | |
| United Kingdom | 1,552 | 1,606 | 5,678 | 40,302 | 32,049 |
| Canada | 112,375 | 51,035 | 21,990 | 17,991 | 57,639 |
| Australia | 162,465 | 357,524 | 295,193 | 258,301 | 203,629 |
| United States of America | 164,308 | 54,398 | 286,294 | 386,133 | 331,985 |
| Other countries | 12 | 4,120 | 76,727 | ||
| Totals | 440,712 | 464,563 | 609,155 | 706,847 | 702,029 |
| Rabbit-skins. | |||||
| Number. | Number. | Number. | Number. | Number. | |
| United Kingdom | 8,285,487 | 8,801,683 | 8,648,945 | 9,598,941 | 9,909,233 |
| Canada | 150,486 | 45,990 | 651,866 | 80,617 | |
| Australia | 111,682 | 60,320 | 4,528 | 214,116 | 112,486 |
| United States of America | 5,369,091 | 6,561,230 | 5,543,719 | 9,948,501 | 9,345,483 |
| Other countries | 5,700 | 18,002 | 36,225 | 30,966 | 260,767 |
| Totals | 13,922,446 | 15,487,225 | 14,233,417 | 20,444,390 | 19,708,586 |
| Sheep-skins and Pelts. | |||||
| Number. | Number. | Number. | Number. | Number. | |
| United Kingdom | 3,016,289 | 3,769,803 | 2,383,524 | 2,057,405 | 1,842,150 |
| Canada | 446,727 | 276,680 | 311,509 | 91,398 | 13,747 |
| Australia | 149,852 | 720,887 | 513,045 | 663,435 | 328,148 |
| United States of America | 4,823,323 | 5,376,226 | 5,030,717 | 5,981,164 | 6,476,674 |
| Other countries | 207 | 1,257 | 3,005 | 32,264 | 34,593 |
| Totals | 8,436,398 | 10,144,853 | 8,246,800 | 8,825,666 | 8,695,312 |
| Sausage Casings. | |||||
| lb. | lb. | lb. | lb. | lb. | |
| United Kingdom | 427,439 | 513,275 | 224,215 | 419,595 | 392,371 |
| Canada | 389,009 | 469,535 | 685,369 | 819,221 | 892,026 |
| Australia | 112,710 | 178,120 | 133,436 | 217,564 | 228,976 |
| United States of America | 1,686,925 | 1,791,735 | 1,345,058 | 1,330,620 | 1,502,515 |
| Other countries | 18,621 | 10,459 | 57,398 | 217,984 | 149,962 |
| Totals | 2,634,704 | 2,963,124 | 2,445,476 | 3,004,984 | 3,165,850 |
| Beans and Peas. | |||||
| Centals. | Centals. | Centals. | Centals. | Centals. | |
| United Kingdom | 106,344 | 95,536 | 179,651 | 101,341 | 106,116 |
| Australia | 18,607 | 16,785 | 19,270 | 9,147 | 17,869 |
| United States of America | 500 | 41 | 1,630 | 2,538 | 3,520 |
| Other countries | 108 | 593 | 1,860 | 392 | 1,822 |
| Totals | 125,559 | 112,955 | 202,401 | 113,418 | 129,327 |
| Seeds (Grass and Clover). | |||||
| Cwt. | Cwt. | Cwt. | Cwt. | Cwt. | |
| United Kingdom | 12,635 | 38,219 | 14,523 | 11,965 | 8,529 |
| Canada | 518 | 2,312 | 709 | 950 | 1,630 |
| Australia | 18,639 | 11,551 | 15,673 | 15,299 | 24,655 |
| United States of America | 6,298 | 18,557 | 16,370 | 8,997 | 10,605 |
| Other countries | 25 | 24 | 127 | 555 | 760 |
| Totals | 38,115 | 70,663 | 47,402 | 37,766 | 46,179 |
| Gold. | |||||
| Oz. | Oz. | Oz. | Oz. | Oz. | |
| United Kingdom | 618 | 3,168 | 215 | 826 | 417 |
| India | 39,545 | 78,937 | 76,891 | 11,265 | |
| Australia | 2,256 | 1,668 | 9,252 | 660 | 93,186 |
| United States | 146,690 | 87,467 | 81,108 | 55,254 | 9,805 |
| Other countries | 31 | 23 | |||
| Totals | 149,595 | 131,848 | 169,512 | 133,631 | 114,696 |
| Silver. | |||||
| Oz. | Oz. | Oz. | Oz. | Oz. | |
| United Kingdom | 92,188 | 55,781 | 54,077 | 6,218 | 315 |
| Ceylon | 197,446 | 273,572 | 372,583 | ||
| India | 128,271 | 23,248 | 38,185 | 562,163 | 484,434 |
| Australia | 62,101 | 90,533 | 49,810 | 9,836 | 10,498 |
| Other countries | 17 | 21 | |||
| Totals | 480,023 | 443,134 | 514,655 | 578,217 | 495,268 |
| Coal. | |||||
| Tons. | Tons. | Tons. | Tons. | Tons. | |
| United Kingdom | 36,015 | 87,094 | 55,065 | 67,255 | 81,400 |
| Canada | 960 | 1,398 | |||
| Australia | 19,315 | 17,442 | 31,034 | 23,918 | 35,705 |
| Fiji | 2,833 | 2,926 | 2,677 | 557 | 1,896 |
| Pacific islands (other than Fiji) | 2,364 | 8,057 | 32 | 3,221 | 12,694 |
| United States of America | 1,200 | 2,754 | 5,695 | 5,827 | |
| Other countries | 750 | 1,589 | 2,366 | 5,790 | |
| Totals | 62,377 | 119,233 | 96,092 | 97,317 | 144,710 |
| Kauri-gum. | |||||
| Tons. | Tons. | Tons. | Tons. | Tons. | |
| United Kingdom | 1,875 | 1,82 | 2,444 | 2,162 | 2,290 |
| Canada | 65 | 129 | 92 | 122 | 106 |
| United States of America | 1,872 | 4,191 | 3,909 | 2,601 | 2,616 |
| Other countries | 89 | 247 | 153 | 376 | 358 |
| Totals | 3,901 | 6,391 | 6,598 | 5,261 | 5,370 |
| Phormium Tenax. | |||||
| Tens. | Tons. | Tons. | Tons. | TONS. | |
| United Kingdom | 3,193 | 3,053 | 1,674 | 4,464 | 7,189 |
| Canada | 76 | , | 77 | 295 | |
| Australia | 5,556 | 3,803 | 2,612 | 3,447 | 3,248 |
| United States of America | 818 | 2,871 | 6,311 | 4,994 | 4,981 |
| Other countries | 15 | 695 | |||
| Totals | 9,643 | 9,727 | 10,612 | 12,982 | 16,408 |
| Timber (Sawn and Hewn). | |||||
| Sup. ft. | Sup. ft. | Sup. ft. | Sup. ft. | Sup. ft. | |
| United Kingdom | 49,454 | 147,889 | 738,997 | 489,987 | 2,276,843 |
| Australia | 46,724,992 | 43,743,950 | 47,061,318 | 42,486,514 | 48,882,252 |
| Fiji | 67,900 | 87,906 | 124,950 | 90,949 | 100,900 |
| Pacific islands (other than Fiji) | 102,887 | 219,459 | 155,245 | 200,591 | 195,237 |
| Other countries | 3,274 | 4,674 | 12,996 | 55,448 | 94,207 |
| Totals | 45,948,507 | 44,203,871 | 48,093,506 | 43,323,489 | 51,549,439 |
New Zealand's exports consist almost wholly of seasonal products, and the calendar year splits the season in the case of several of the principal commodities. The largest item of export, wool, is sheared from the sheep in the early summer, and the wool-sales are held in December and January. Exports of any season's wool-clip are therefore divided between one year and the next in varying proportion. A favourable season or a sudden demand may cause a great increase of exports in the December quarter, with the result that the March quarter of the next year shows low figures. The wool trade invariably bases its calculations on each season's clip, not on calendar years.
The same argument holds good in the case of butter and cheese, which are almost wholly exported in December and March quarters. It is desirable, therefore, for some purposes to tabulate New Zealand exports for years ending in June instead of December, since this division does not split the seasonal production of any main commodity, and more truly shows the results of each season as compared with previous seasons. The following table gives this information for the principal items of export during each of the last five “June” years:—
| PRINCIPAL EXPORTS OF DOMESTIC PRODUCE (VALUES ) FROM NEW ZEALAND FOR YEARS ENDING 30TH JUNE, 1922 TO 1926 (INCLUSIVE). | |||||
|---|---|---|---|---|---|
| Item. | 1921–22. | 1922–23. | 1923–24. | 1924–25. | 1925–26. |
| £ | £ | £ | £ | £ | |
| Butter | 8,055,828 | 11,490,844 | 9,786,485 | 11,705,541 | 8,958,036 |
| Casein | 50,537 | 151,297 | 132,218 | 133,812 | 104,060 |
| Cheese | 6,027,286 | 6,433,812 | 6,460,167 | 6,208,553 | 6,073,638 |
| Fish | 40,694 | 47,019 | 65,274 | 63,070 | 61,684 |
| Beef, frozen | 769,574 | 1,003,804 | 716,902 | 926,074 | 717,584 |
| Beef, salted | 9,899 | 14,080 | 23,747 | 13,226 | 11,891 |
| Lamb, frozen | 5,782,272 | 5,871,788 | 6,092,763 | 6,833,607 | 5,783,294 |
| Mutton, frozen | 3,575,954 | 1,888,848 | 2,030,335 | 2,945,430 | 2,422,451 |
| Meats, preserved | 211,870 | 170,284 | 168,222 | 188,418 | 244,275 |
| Sausage-casings | 501,555 | 414,603 | 511,740 | 674,757 | 745,528 |
| Milk, preserved | 808,579 | 456,221 | 417,075 | 557,245 | 384,767 |
| Apples, fresh | 63,399 | 71,399 | 124,960 | 116,062 | 362,264 |
| Beans and peas | 111,516 | 149,452 | 96,633 | 85,765 | 124,514 |
| Oats | 29,755 | 137,074 | 25,691 | 953 | 3,533 |
| Wheat | 133,365 | 184,014 | 499 | 393 | 327 |
| Hops | 15,200 | 15,084 | 39,924 | 14,214 | 21,604 |
| Potatoes | 7,709 | 5,715 | 8,345 | 7,36 | 85,433 |
| Live-stock | 65,250 | 67,071 | 102,588 | 121,196 | 117,047 |
| Calf-skins | 141,058 | 163,127 | 181,076 | 244,059 | 223,366 |
| Hides, horse and cattle | 371,225 | 502,986 | 547,366 | 711,448 | 583,911 |
| Rabbit-skins | 419,298 | 549,543 | 578,026 | 781,617 | 802,512 |
| Sheep-skins, with wool | 52,021 | 211,050 | 249,226 | 306,239 | 204,920 |
| Sheep-skins, without wool | 976,007 | 913,377 | 1,065,924 | 1,746,716 | 1,260,948 |
| Wool | 11,051,952 | 11,359,137 | 14,639,718 | 18,088,044 | 12,030,185 |
| Phormium fibre | 269,453 | 292,541 | 345,805 | 506,317 | 543,245 |
| Seeds, grass and clover | 255,252 | 212,211 | 135,983 | 134,926 | 165,994 |
| Tallow | 876,433 | 814,625 | 748,799 | 826,770 | 844,800 |
| Coal | 189,312 | 247,480 | 136,195 | 238,638 | 218,283 |
| Kauri-gum | 471,022 | 584,298 | 559,137 | 453,956 | 361,875 |
| Gold | 547,443 | 601,247 | 683,845 | 477,897 | 491,055 |
| Silver | 52,242 | 55,931 | 72,572 | 71,159 | 58,078 |
| Leather | 33,615 | 26,869 | 9,386 | 8,867 | 8,331 |
| Timber, sawn | 526,524 | 438,414 | 445,248 | 520,092 | 548,871 |
| Other New Zealand produce | 1,122,359 | 675,363 | 657,794 | 914,091 | 935,744 |
| Totals | 43,615,458 | 46,220,608 | 47,859,668 | 56,625,345 | 45,504,048 |
The following table shows by quantities the principal items of export during the same five years as in the previous table:—
| PRINCIPAL EXPORTS OF DOMESTIC PRODUCE (QUANTITIES) FROM NEW ZEALANDFOR YEARSENDED 30TH JUNE, 1922 TO 1926 (INCLUSIVE). | |||||
|---|---|---|---|---|---|
| Item. | 1921–22. | 1922–23. | 1923–24. | 1924–25. | 1925–26. |
| Butter cwt. | 937,724 | 1,332,289 | 1,123,759 | 1,362,240 | 1,090,946 |
| Casein ,, | 20,273 | 46,296 | 35,583 | 54,294 | 39,438 |
| Cheese ,, | 1,319,548 | 1,391,446 | 1,445,381 | 1,481,724 | 1,399,925 |
| Fish ,, | 12,202 | 15,167 | 18,552 | 19,865 | 16,633 |
| Beef, frozen ,, | 516,315 | 834,280 | 612,127 | 658,922 | 511,137 |
| Beef, salted ,, | 4,030 | 8,574 | 15,143 | 7,074 | 5,816 |
| Lamb, frozen ,, | 1,738,546 | 1,493,843 | 1,507,233 | 1,552,831 | 1,492,030 |
| Mutton, frozen ,, | 1,850,048 | 833,349 | 805,793 | 1,075,580 | 951,331 |
| Meats, preserved ,, | 53,334 | 45,069 | 51,824 | 62,996 | 68,646 |
| Sausage-casings lb. | 3,078,118 | 2,369,273 | 2,643,700 | 3,208,369 | 3,311,825 |
| Milk, preserved ,, | 3,611,237 | 1,192,191 | 1,512,104 | 1,458,903 | 1,098,792 |
| Milk, dried ,, | 12,202,773 | 13,232,705 | 9,391,530 | 14,811,797 | 11,089,128 |
| Apples, fresh ,, | 4,512,209 | 5,705,181 | 9,969,774 | 8,499,323 | 27,834,824 |
| Beans and peas centals ,, | 120,678 | 183,983 | 122,718 | 99,272 | 162,956 |
| Oats ,, | 66,740 | 386,835 | 57,097 | 1,502 | 5,881 |
| Wheat ,, | 301,621 | 427,869 | 841 | 578 | 464 |
| Hops lb. | 167,744 | 207,796 | 648,654 | 215,444 | 411,674 |
| Potatoes tons | 1,037 | 726 | 806 | 985 | 10,254 |
| Live-stock No. | 4,276 | 4,412 | 8,127 | 4,504 | 3,922 |
| Calf-skins ,, | 443,761 | 500,926 | 591,026 | 742,939 | 693,752 |
| Hides, horse and cattle ,, | 282,178 | 295,754 | 380,656 | 527,804 | 436,919 |
| Rabbit-skins ,, | 13,159,869 | 15,243,249 | 17,591,240 | 20,163,368 | 18,371,251 |
| Sheep-skins, with wool ,, | 305,298 | 758,507 | 698,252 | 578,285 | 507,934 |
| Sheep-skins, without wool ,, | 10,289,815 | 8,495,617 | 7,997,827 | 8,702,068 | 7,670,250 |
| Wool bales | 916,744 | 688,989 | 630,949 | 574,189 | 618,989 |
| Phormium fibre tons | 9,503 | 9,797 | 12,394 | 15,978 | 17,559 |
| Seeds, grass and clover cwt. | 60,985 | 54,921 | 35,922 | 48,074 | 45,259 |
| Tallow tons | 30,078 | 27,078 | 22,084 | 25,147 | 23,688 |
| Coal ,, | 97,124 | 130,454 | 72,420 | 136,120 | 134,452 |
| Kauri-gum ,, | 4,785 | 6,808 | 6,264 | 5,770 | 4,849 |
| Gold oz. | 131,227 | 146,763 | 165,332 | 115,925 | 119,253 |
| Silver ,, | 402,960 | 467,384 | 580,411 | 578,979 | 472,814 |
| Timber, sawn sup. ft. | 49,329,732 | 40,979,268 | 43,029,491 | 45,255,129 | 47,097,820 |
The forwarding trade of New Zealand has never at any time been of great significance, and, prior to 1914, on only one occasion (in 1907) did the amount exceed a quarter of a million sterling. After 1913, however, this amount rapidly increased until in 1921 it reached the comparatively large figure of £1,213,002. Since that year, however, there has been a considerable drop, and the value of the produce and manufactures of other countries exported from the Dominion in 1925 amounted to £722,016 only.
Items of re-exports consist partly of goods returned from New Zealand either as unsuitable or as finished with, though the bulk of the total amount is made up by various classes of machinery, hardware, metal manufactures, motor-care, and also items such as apparel, books, tobacco, and spirits.
There is, however, a genuine entrepôt trade with the islands of the Pacific, the amount of which is still comparatively small. Exports to Cook Islands, which are treated as part of the Dominion, are not included in the figures of either exports or re-exports.
The total values of re-exports from New Zealand for the last twenty years are shown in the table below:—
| RE-EXPORTS (EXCLUDING SPECIE) FROM NEW ZEALAND, 1906–25. | |
|---|---|
| £ | |
| 1906 | 152,134 |
| 1907 | 278,503 |
| 1908 | 180,675 |
| 1909 | 173,215 |
| 1910 | 208,310 |
| 1911 | 198,287 |
| 1912 | 239,221 |
| 1913 | 232,473 |
| 1914 | 269,208 |
| 1915 | 387,960 |
| 1916 | 305,150 |
| 1917 | 429,115 |
| 1918 | 543,568 |
| 1919 | 603,541 |
| 1920 | 813,072 |
| 1921 | 1,213,002 |
| 1922 | 1,026,801 |
| 1923 | 567,885 |
| 1924 | 588,395 |
| 1925 | 722,016 |
The destination of this re-export trade is shown in the following table for 1921–25:—
| Country. | 1921. | 1922. | 1923. | 1924. | 1925. |
|---|---|---|---|---|---|
| £ | £ | £ | £ | £ | |
| United Kingdom | 245,334 | 163,814 | 110,984 | 169,903 | 233,328 |
| Canada | 22,115 | 8,207 | 9,397 | 11,219 | 9,532 |
| Australia | 590,065 | 707,567 | 300,471 | 241,466 | 283,539 |
| Fiji | 56,308 | 31,486 | 35,344 | 52,850 | 55,946 |
| Tonga | 36,027 | 22,019 | 35,723 | 28,928 | 33,252 |
| Western Samoa | 43,962 | 18,099 | 18,296 | 20,308 | 22,935 |
| United States of America | 133,747 | 38,379 | 36,278 | 45,887 | 61,356 |
| Society Islands | 21,417 | 15,604 | 12,495 | 6,287 | 5,088 |
| Other countries | 64,027 | 21,626 | 8,897 | 11,547 | 17,040 |
| Totals | 1,213,002 | 1,026,801 | 567,885 | 588,395 | 722,016 |
It is widely recognized that the price of wool and of the other principal items of export has a vital bearing on the prosperity of New Zealand, and in the following pages an attempt is made to analyse the influence exerted upon the total values of exports by these changes of prices. New Zealand has always been peculiarly dependent for her prosperity upon her external trade, and the early vicissitudes of the several settlements were caused in great part by the difficulty of finding an assured market for their products. After the gold-discoveries of the “sixties,” there was a steady export of that metal; but the great development of sheep-farming caused the export of wool to outstrip and finally to overshadow gold. Before refrigeration these two commodities comprised the overwhelming bulk of New Zealand's exports—on the average from 90 to 95 per cent.
This was the position when, in the early “seventies,” the world level of prices began to fall, which it continued to do steadily till 1895. About this time the first alluvial deposits of gold began to work out, and gold exports constantly decreased. At the same time the price of wool fell lower and lower, so that the colony found both of its great sources of wealth shrinking fast. An ambitious borrowing policy, followed by a period of land speculation, precipitated the country into the severest crisis it has yet experienced, and economic conditions became rapidly worse, till a long period of depression ended in the early “nineties” in a banking crisis.
All through this period the quantities of goods exported constantly increased. Refrigeration came in 1882, and frozen meat and dairy-produce added to the country's wealth. But the depressing influence of falling prices continually minimized the effect of the strenuous efforts at increased production, and the condition of the country remained unpromising.
The years 1895–96 saw a complete change, which can be ascribed only to two facts: the world level of prices began to rise, and the beneficial effects of refrigeration began to make themselves felt; so that from this period dates the prosperity of New Zealand. Under the stimulus of rising prices, which always benefit debtors and producers, exports have increased by leaps and bounds, as will be seen by a reference to the chart in Subsection A of this section. Following the increase of exports there has been a great development of imports and of the home trade.
It is an economic axiom that rising prices tend to benefit producers, for the reason that all prices do not rise equally, and the main prices which lag behind the general level are the prices of the two biggest expenses of production—labour and capital. Hence the producer gets the benefit of rising prices for his produce, while his wages-bill and the interest on his borrowed capital do not increase so fast. It is the latter fact which is of value to New Zealand. The amount of interest which must be paid by New Zealand in each year is paid by the export of domestic produce, and is represented by a continued excess of exports over imports. In times of rising prices fewer bales of wool and carcases of mutton need be shipped each year to discharge this obligation.
At the same time New Zealand derives an extra benefit from the fact that her exports are rising faster than the average level of prices. Investigations into prices, not only in New Zealand but also in the older countries, show that raw materials and foodstuffs rise much faster than other commodities, and this feature is especially marked in animal products.
All these influences, which are the principal effects of rising prices, tend to stimulate and increase production; but their exact extent can never be separated from the other causes of increased productivity: all that may be measured is the apparent effect upon the exports as disclosed by changing values. From these data it is possible to ascertain with some accuracy what extra value has been added by the element of prices; but the important influences increasing productivity are not touched by this method.
| EXPORTSOF NEW ZEALAND PRODUCE, SHOWING VALUESASRECORDEDANDASCOMPUTEDONTHE BASISOF VALUESRULINGIN 1900. | ||||||
|---|---|---|---|---|---|---|
| Year. | Recorded Value. | Value at Rates ruling in 1900. | Index Numbers of “True” Volume of Exports. | |||
| Total. | Per Head. | Total. | Per Head. | Total. | Per Head. | |
| £ | £ | £ | £ | |||
| 1900 | 13,055,249 | 16.27 | 13,055,249 | 16.27 | 1000 | 1000 |
| 1901 | 12,690,460 | 15.46 | 13,885,227 | 16.91 | 1064 | 1039 |
| 1902 | 13,498,599 | 16.05 | 14,877,302 | 17.69 | 1140 | 1087 |
| 1903 | 14,838,192 | 17.19 | 15,148,500 | 17.55 | 1160 | 1079 |
| 1904 | 14,601,787 | 16.44 | 13,979,644 | 15.74 | 1071 | 967 |
| 1905 | 15,503,530 | 16.98 | 13,618,838 | 14.91 | 1043 | 916 |
| 1906 | 17,840,346 | 18.91 | 14,796,097 | 15.69 | 1133 | 964 |
| 1907 | 19,783,138 | 20.46 | 15,830,149 | 16.37 | 1213 | 1006 |
| 1908 | 15,894,530 | 16.01 | 14,554,754 | 14.66 | 1115 | 901 |
| 1909 | 19,462,936 | 19.09 | 17,886,541 | 17.54 | 1370 | 1078 |
| 1910 | 21,944,163 | 21.09 | 18,524,540 | 17.80 | 1419 | 1094 |
| 1911 | 18,781,898 | 17.65 | 16,131,869 | 15.16 | 1236 | 932 |
| 1912 | 21,272,405 | 19.54 | 17,754,865 | 16.31 | 1360 | 1002 |
| 1913 | 22,577,890 | 20.19 | 17,506,323 | 15.65 | 1341 | 962 |
| 1914 | 25,984,717 | 22.79 | 19,807,867 | 17.37 | 1517 | 1068 |
| 1915 | 31,042,662 | 27.01 | 20,099,592 | 17.49 | 1540 | 1075 |
| 1916 | 32,975,907 | 28.69 | 18,681,653 | 16.26 | 1431 | 999 |
| 1917 | 31,087,957 | 27.06 | 15,567,995 | 13.55 | 1192 | 833 |
| 1918 | 27,937,010 | 24.23 | 12,401,373 | 10.76 | 950 | 661 |
| 1919 | 53,304,384 | 44.69 | 24,826,912 | 20.82 | 1902 | 1280 |
| 1920 | 45,592,294 | 36.70 | 20,059,459 | 16.15 | 1537 | 993 |
| 1921 | 43,615,473 | 34.16 | 21,298,573 | 16.68 | 1631 | 1025 |
| 1922 | 41,699,148 | 31.95 | 27,013,513 | 20.70 | 2069 | 1272 |
| 1923 | 45,371,908 | 34.16 | 23,945,233 | 18.03 | 1834 | 1108 |
| 1924 | 51,920,828 | 38.38 | 23,960,922 | 17.71 | 1835 | 1089 |
| 1925 | 54,521,031 | 39.39 | 23,879,288 | 17.26 | 1830 | 1061 |
Practically all the main exports of New Zealand are primary products, either raw materials or foodstuffs. From their nature it is possible in nearly every case to obtain the quantities exported as well as the values. It is then an easy matter of computation to find what the value would have been, assessing the quantities for each year at the prices of a selected base year or period, and by comparison with the actual values recorded to estimate the effect of price-changes.
This method is used by the British Board of Trade and by the Commonwealth Statistician, and is very suitable for application to New Zealand. Of the total exports of New Zealand produce, 99 per cent. can, for the purpose of the present inquiry, be treated in this fashion, leaving only 1 per cent. to be calculated pro rata.
The effect of prices on the total value of exports is probably better seen at a glance from the accompanying diagram. The curve representing values on the basis of prices ruling in 1900 may also be taken as representing the course of the volume of trade on a quantity basis.
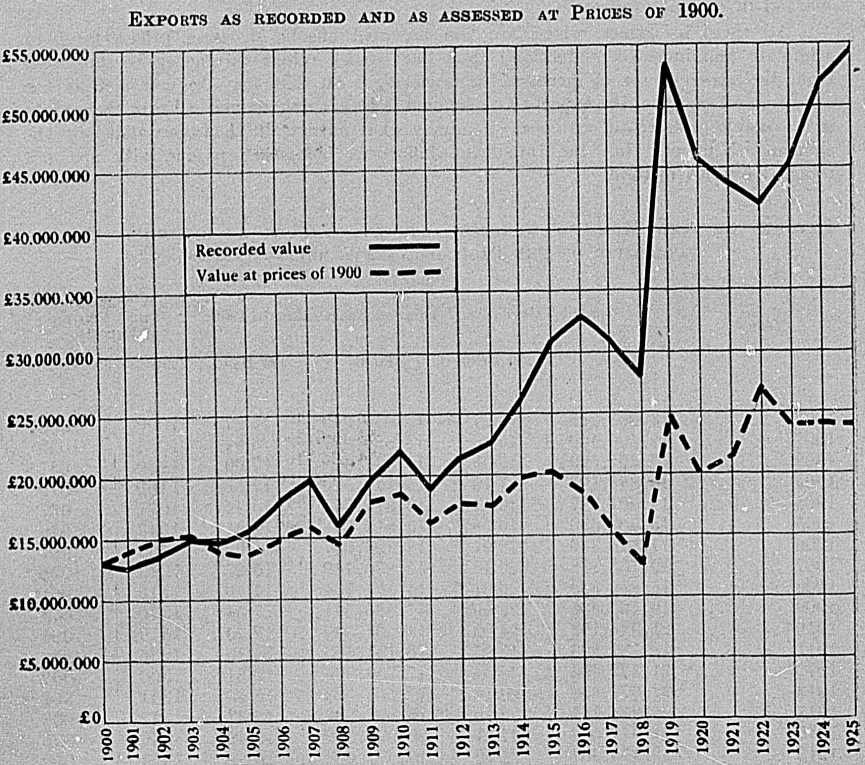
In order to show the effect of changes in price from year to year, and particularly in the latter years, it is interesting to construct a series of index numbers basing the figures for each year upon the prices of the previous year. In this way it is possible to compare succeeding years directly, instead of comparing each year with a given base. The method used is the same, except that the base is changed.
| EXPORTSOF NEW ZEALAND PRODUCEFOREACH YEAR 1900–25, SHOWING VALUESASRECORDEDANDASCOMPUTEDONTHE BASISOF VALUESRULINGINTHE PREVIOUS YEAR. | ||||
|---|---|---|---|---|
| Year. | Total Exports (Domestic Produce). | Effect of Price-changes. | ||
| Recorded Value. | Value at Prices of Previous Year. | Gain. | Loss. | |
| £ | £ | £ | £ | |
| 1900 | 13,055,249 | |||
| 1901 | 12,690,460 | 13,885,227 | 1,194,767 | |
| 1902 | 13,498,599 | 13,597,171 | 98,672 | |
| 1903 | 14,838,192 | 13,744,665 | 1,093,527 | |
| 1904 | 14,601,787 | 13,693,279 | 908,508 | |
| 1905 | 15,503,530 | 14,224,924 | 1,278,606 | |
| 1906 | 17,840,346 | 16,843,708 | 996,638 | |
| 1907 | 19,783,138 | 19,087,151 | 695,987 | |
| 1908 | 15,894,530 | 18,189,260 | 2,294,730 | |
| 1909 | 19,462,936 | 19,533,010 | 70,074 | |
| 1910 | 21,944,163 | 20,157,164 | 1,786,999 | |
| 1911 | 18,781,898 | 19,109,809 | 327,911 | |
| 1912 | 21,272,405 | 20,671,508 | 600,897 | |
| 1913 | 22,577,890 | 20,974,623 | 1,603,267 | |
| 1914 | 25,984,717 | 25,546,190 | 438,527 | |
| 1915 | 31,042,662 | 26,367,413 | 4,675,249 | |
| 1916 | 32,975,907 | 28,852,737 | 4,123,170 | |
| 1917 | 31,087,957 | 27,479,836 | 3,608,121 | |
| 1918 | 27,937,010 | 24,764,483 | 3,172,527 | |
| 1919 | 53,304,384 | 55,928,460 | 2,624,076 | |
| 1920 | 45,592,294 | 43,068,470 | 2,523,824 | |
| 1921 | 43,615,473 | 48,408,624 | 4,793,151 | |
| 1922 | 41,699,148 | 55,318,596 | 13,619,448 | |
| 1923 | 45,371,908 | 36,962,436 | 8,409,472 | |
| 1924 | 51,920,828 | 45,396,647 | 6,524,181 | |
| 1925 | 54,521,031 | 51,779,354 | 2,741,677 | |
The comparison of each year with the preceding year brings out the advantage gained by a rise in prices. The gain shown represents the surplus value added by rising prices to the exports of any year, and, similarly, the loss shows how falling prices penalize New Zealand. The gains due to the rise of prices during the four years 1915-18 and in 1923 and 1924 are remarkable. The figures for 1908, for 1911, for 1919, and especially for 1921 and 1922, are eloquent of what falling prices mean for the Dominion. The recorded total of exports in 1922 would have been over nineteen and a half millions greater had average prices of exports remained as in 1920. The figures for 1923 to 1925 reveal just the opposite, and show that prices of domestic produce were considerably higher in each year than during the preceding year.
The next table is based on June years, which, as stated previously, are preferable as giving a comparison between one season and another, and covers the four principal items of export from 1890–91 to 1925–26. Here, again, a huge increase in total values of exports on account of enhanced prices is very evident.
| EXPORTSOF WOOL, FROZEN MEAT, BUTTER, AND CHEESEFOR YEARSENDING 30TH JUNE, SHOWING VALUESAS ACTUALLYRECORDEDANDASASSESSEDATTHE AVERAGE PRICESOF 1890–99. | ||||||||
|---|---|---|---|---|---|---|---|---|
| Year. | Wool. | Frozen Meat. | Butter. | Cheese. | ||||
| Recorded Value. | Value at Average Prices, 1890–99. | Recorded Value. | Value at Average Prices, 1890–99. | Recorded Value. | Value at Average Prices, 1890–99. | Recorded Value. | Value at Average Prices, 1890–99. | |
| £ | £ | £ | £ | £ | £ | £ | £ | |
| 1890–91 | 4,216,419 | 3,641,768 | 1,188,620 | 1,136,432 | 128,306 | 143,796 | 95,866 | 93,699 |
| 1891–92 | 4,229,683 | 3,735,461 | 1,140,571 | 1,103,579 | 198,363 | 206,478 | 91,670 | 83,578 |
| 1892–93 | 4,072,342 | 3,999,329 | 1,067,780 | 1,018,744 | 208,909 | 189,978 | 95,903 | 92,232 |
| 1893–94 | 4,353,415 | 4,274,711 | 1,054,537 | 1,022,559 | 303,951 | 299,575 | 106,280 | 100,779 |
| 1894–95 | 4,028,651 | 4,329,769 | 1,322,810 | 1,337,768 | 231,700 | 242,471 | 160,061 | 163,260 |
| 1895–96 | 4,393,574 | 4,345,449 | 1,276,232 | 1,243,269 | 250,885 | 256,159 | 121,993 | 137,210 |
| 1896–97 | 4,357,244 | 4,449,230 | 1,340,169 | 1,344,449 | 357,187 | 366,728 | 151,298 | 159,899 |
| 1897–98 | 4,732,542 | 5,032,162 | 1,691,546 | 1,831,138 | 404,049 | 404,127 | 136,146 | 142,455 |
| 1898–99 | 4,241,984 | 4,847,271 | 1,776,843 | 1,804,212 | 451,269 | 452,348 | 127,209 | 126,913 |
| 1899–1900 | 4,889,101 | 4,859,806 | 2,298,140 | 2,315,097 | 693,666 | 666,625 | 224,238 | 210,638 |
| 1900–1 | 3,890,573 | 4,781,059 | 2,193,494 | 2,122,519 | 858,543 | 822,599 | 239,325 | 210,630 |
| 1901–2 | 3,079,271 | 5,094,446 | 2,526,661 | 2,367,931 | 1,044,317 | 947,782 | 171,886 | 162,912 |
| 1902–3 | 4,034,712 | 5,475,277 | 3,310,073 | 2,840,937 | 1,211,223 | 1,045,407 | 186,412 | 146,500 |
| 1903–4 | 4,313,018 | 4,779,745 | 2,846,082 | 2,318,958 | 1,445,814 | 1,345,834 | 194,779 | 175,808 |
| 1904–5 | 5,468,566 | 4,927,285 | 2,714,026 | 2,003,709 | 1,417,984 | 1,319,133 | 180,215 | 165,619 |
| 1905–6 | 6,605,790 | 5,144,559 | 2,882,387 | 2,215,618 | 1,540,327 | 1,319,385 | 300,056 | 243,318 |
| 1906–7 | 7,415,486 | 5,487,427 | 3,143,764 | 2,858,903 | 1,631,174 | 1,365,022 | 568,058 | 412,533 |
| 1907–8 | 5,649,636 | 5,314,779 | 3,165,048 | 2,453,043 | 1,133,665 | 942,588 | 761,100 | 555,439 |
| 1908–9 | 5,965,283 | 6,397,453 | 3,775,990 | 2,961,113 | 1,491,837 | 1,198,433 | 977,358 | 712,921 |
| 1909–10 | 7,962,669 | 6,594,295 | 3,631,122 | 2,952,041 | 1,712,659 | 1,393,613 | 1,275,148 | 978,653 |
| 1910–11 | 7,164,844 | 6,202,335 | 3,875,379 | 2,914,507 | 1,685,033 | 1,378,474 | 1,093,715 | 839,158 |
| 1911–12 | 6,965,416 | 6,328,167 | 3,671,948 | 2,743,477 | 1,891,235 | 1,435,884 | 1,496,730 | 1,068,174 |
| 1912–13 | 8,217,644 | 6,503,545 | 4,315,444 | 2,890,424 | 2,027,822 | 1,504,318 | 1,914,238 | 1,341,035 |
| 1913–14 | 8,262,153 | 6,673,803 | 5,079,228 | 3,323,433 | 2,197,771 | 1,681,915 | 2,317,970 | 1,594,670 |
| 1914–15 | 9,907,670 | 6,893,420 | 5,737,657 | 3,169,706 | 2,336,862 | 1,702,856 | 2,277,509 | 1,492,725 |
| 1915–16 | 12,127,697 | 6,247,718 | 7,476,637 | 3,954,744 | 2,805,152 | 1,668,157 | 3,345,314 | 1,919,876 |
| 1916–17 | 10,628,359 | 5,342,668 | 6,953,944 | 3,481,347 | 2,767,150 | 1,443,410 | 3,982,089 | 1,881,560 |
| 1917–18 | 9,519,199 | 4,497,983 | 6,414,471 | 2,943,970 | 3,232,788 | 1,684,537 | 4,010,842 | 1,787,735 |
| 1918–19 | 15,378,923 | 7,340,775 | 4,911,582 | 2,221,082 | 3,592,875 | 1,715,795 | 5,501,452 | 2,319,330 |
| 1919–20 | 13,206,083 | 6,009,883 | 10,027,656 | 4,552,992 | 2,257,145 | 1,046,813 | 6,930,178 | 2,818,278 |
| 1920–21 | 8,637,515 | 5,388,382 | 13,999,531 | 6,177,311 | 8,447,198 | 2,608,206 | 8,376,495 | 2,942,923 |
| 1921–22 | 11,051,952 | 10,500,435 | 10,333,536 | 4,793,983 | 8,055,828 | 3,877,736 | 6,027,286 | 2,691,800 |
| 1922–23 | 11,359,137 | 8,209,653 | 8,902,093 | 3,686,802 | 11,490,844 | 5,509,367 | 6,433,812 | 2,838,468 |
| 1923–24 | 14,639,718 | 7,415,903 | 9,008,698 | 3,443,735 | 9,786,485 | 4,633,974 | 6,460,167 | 2,948,492 |
| 1924–25 | 18,087,864 | 6,579,819 | 11,035,620 | 3,908,495 | 11,705,541 | 5,633,222 | 6,208,553 | 3,022,629 |
| 1925–26 | 12,030,185 | 7,028,694 | 9,228,691 | 3,509,718 | 8,958,036 | 4,511,450 | 6,073,638 | 2,876,164 |
The effect which war and post-war prices of products have exerted towards raising the Dominion's exports to an unprecedented height is best shown by the following comparison between the year ended 30th June, 1914, and the corresponding twelve-monthly periods ending in 1924, 1925, and 1926. On the recorded figures, exports for 1925–26 are just a little under twice as high as those for 1913–14. The real volume, however, has increased by 25 per cent. only, which goes to show that the greater part of the gain shown in the recorded values has been due to higher prices. The table covers only sixteen principal items, which, however, represent more than nine-tenths of the total exports.
| PRINCIPAL EXPORTSOF NEW ZEALAND PRODUCEFORTHE TWELVE MONTHSENDED 30TH JUNE, 1924, 1925, AND 1926, SHOWING VALUESASRECORDEDANDASCOMPUTEDONTHE BASISOF PRICESRULINGDURINGTHE YEARENDED 30TH JUNE, 1914. | |||||||
|---|---|---|---|---|---|---|---|
| Item. | Twelve Months ended 30th June, 1924. | Twelve Months ended 30th June, 1914. | Twelve Months ended 30th June, 1925. | Twelve Months ended 30th June, 1926. | |||
| Recorded Value. | Value at Prices of 1913–14. | Recorded Value. | Value at Prices of 1913–14. | Recorded Value. | Value at Prices of 1913–14. | ||
| £ | £ | £ | £ | £ | £ | £ | |
| Butter | 2,197,771 | 9,786,485 | 6,073,544 | 11,705,541 | 7,362,257 | 8,958,036 | 5,896,043 |
| Cheese | 2,317,970 | 6,460,167 | 4,285,848 | 6,208,553 | 4,393,612 | 6,073,638 | 4,180,714 |
| Beef, frozen | 561,817 | 716,902 | 876,158 | 926,074 | 943,137 | 717,584 | 731,607 |
| Lamb, frozen (whole carcases) | 2,545,175 | 6,092,763 | 3,292,181 | 6,833,007 | 3,391,779 | 5,783,294 | 3,258,974 |
| Mutton, frozen (whole carcases) | 1,880,583 | 2,030,335 | 1,235,506 | 2,945,430 | 1,649,164 | 2,422,451 | 1,458,656 |
| Meat, preserved | 122,078 | 168,222 | 184,073 | 188,418 | 223,754 | 244,275 | 244,735 |
| Sausage-casings | 132,038 | 511,740 | 80,172 | 674,757 | 97,332 | 745,528 | 100,471 |
| Hides | 319,995 | 547,366 | 613,255 | 711,448 | 858,230 | 583,911 | 704,369 |
| Skins, rabbit | 90,350 | 578,026 | 236,741 | 781,617 | 265,915 | 802,512 | 242,280 |
| Skins, sheep (without wool) | 545,037 | 1,065,924 | 600,629 | 1,746,716 | 658,023 | 1,260,948 | 576,028 |
| Wool | 8,262,153 | 14,639,718 | 9,274,790 | 18,088,044 | 8,229,131 | 12,030,185 | 8,790,523 |
| Phormium fibre | 576,095 | 345,805 | 297,410 | 506,317 | 383,892 | 543,245 | 421,350 |
| Tallow | 711,858 | 748,799 | 634,201 | 826,770 | 722,163 | 844,800 | 680,781 |
| Kauri-gum | 790,338 | 559,137 | 510,011 | 453,956 | 469,790 | 361,875 | 394,803 |
| Gold | 1,485,937 | 683,845 | 641,220 | 477,897 | 449,601 | 491,055 | 462,508 |
| Timber, sawn | 372,092 | 445,248 | 216,955 | 520,092 | 228,176 | 548,871 | 237,495 |
| Totals | 22,911,287 | 45,380,482 | 29,052,694 | 53,594,637 | 30,325,956 | 42,412,208 | 28,381,337 |
| Other N.Z. produce | 1,401,457 | 2,479,186 | 3,030,708 | 3,091,840 | |||
| Grand totals | 24,312,744 | 47,859,668 | 56,625,345 | 45,504,048 | |||
In 1901 a group of Pacific islands was annexed to New Zealand, and has since been administered by the Dominion. The islands are fertile and rich in tropical products, so that there is a growing trade between them and the Dominion proper. This trade is not regarded as external to New Zealand, but merely as interchange between different parts of the Dominion, and it is therefore not included in the account of the external trade. Separate returns are made of the transactions between the Dominion and the annexed islands, and these are summarized below:—
| TOTAL VALUEOF EXPORTSFROM NEW ZEALANDTO COOKANDOTHER ANNEXED ISLANDS, 1906–25. | |
|---|---|
| Year. | Exports.£ |
| 1906 | 35,452 |
| 1907 | 38,288 |
| 1908 | 39,284 |
| 1909 | 40,204 |
| 1910 | 60,647 |
| 1911 | 56,131 |
| 1912 | 75,774 |
| J913 | 72,046 |
| 1914 | 59,056 |
| 1915 | 55,459 |
| 1916 | 52,831 |
| 1917 | 53,449 |
| 1918 | 79,309 |
| 1919 | 88,902 |
| 1920 | 117,820 |
| 1921 | 82,398 |
| 1922 | 81,309 |
| 1923 | 100,670 |
| 1924 | 96,757 |
| 1925 | 80,977 |
The principal items exported to the islands in 1925 were—
| PRINCIPAL EXPORTSTO COOK ISLANDS, 1925. | ||||
|---|---|---|---|---|
| Article. | Quantity. | Value. | ||
| Produce of New Zealand. | Other. | Total. | ||
| £ | £ | £ | ||
| Batter | 75 cwt. | 754 | 754 | |
| Cheese | 20 ,, | 124 | 124 | |
| Fish, preserved | 10,127 lb. | 40 | 441 | 481 |
| Beef, salted | 476 cwt. | 1,037 | 1,037 | |
| Meats, potted and preserved | 3,025 ,, | 10,154 | 10,154 | |
| Milk and cream, preserved, &c. | 21,040 lb. | 1,065 | 1,065 | |
| Miscellaneous provisions | 2,954 | 1,485 | 4,439 | |
| Biscuits— | ||||
| Ship's | 1,127 cwt. | 3,680 | 3,680 | |
| Other | 28,448 lb. | 864 | 864 | |
| Confectionery | 11,410 ,, | 580 | 9 | 589 |
| Flour | 888 centals | 841 | 43 | 884 |
| Rice, dressed | 339 cwt. | 399 | 399 | |
| Sugar | 3,158 ,, | 4,904 | 63 | 4,967 |
| Tobacco and cigarettes | 11,523 lb. | 3,253 | 3,253 | |
| Apparel n.e.i. | 1,006 | 807 | 1,813 | |
| Boots and shoes | 95 doz. prs. | 522 | 336 | 858 |
| Drapery | 100 | 1,275 | 1,375 | |
| Cotton piece-goods | 2,297 | 2,297 | ||
| Silk piece-goods | 741 | 741 | ||
| Bags and sacks | 1,284 doz. | 24 | 1,097 | 1,121 |
| Cordage and rope | 132 cwt. | 540 | 6 | 546 |
| Kerosene | 9,390 gallons | 736 | 736 | |
| Motor spirit | 7,132 ,, | 715 | 715 | |
| Specie (silver) | 500 | 500 | ||
| Hardware and ironmongery | 131 | 1,333 | 1,464 | |
| Iron and steel, plate and sheet | 696 cwt. | 993 | 993 | |
| Timber | 1,427,133 sup. ft. | 12,543 | 509 | 13,052 |
| Cement | 3,191 cwt. | 876 | 876 | |
| Wrapping-paper | 238 ,, | 186 | 487 | 673 |
| Cinematograph-films | 858,011 lin. ft. | 3,936 | 3,936 | |
| Medicinal preparations, &c. | 300 | 260 | 560 | |
| Matches | 2,525 gr. boxes | 18 | 771 | 789 |
| Soap | 1,883 | 48 | 1,931 | |
Further particulars regarding the trade of the Cook Islands will be found in the section of this book dealing with “Islands attached to New Zealand.”
THE statistics of imports are compiled from entries passed at the Customs. Prior to 1916 the import value taken was the c.i.f. or landed value in New Zealand, freight into the Dominion being thus included. For free goods and goods liable to specific duties this landed value in New Zealand was shown, but the landed value for ad valorem goods was taken as the fair market value of the goods when sold for homo consumption in the principal markets of the country whence imported, and at the time when exported, plus 10 per cent. The value shown for all merchandise imported is now the current domestic value in the country of export at the time of exportation, plus 10 per cent.
The earliest trade in New Zealand, as in most colonies, consisted more of exploitation and appropriation by visiting traders than of regular exchange. The whalers and sealers brought with them sufficient previsions to last their season, and they were never more than passing visitors to the Islands. The first genuine import trade sprang up when the Maoris became sensible of the great wealth to be won by bartering their flax for iron and other treasures of the white man. A new element was introduced when the Maori adopted the musket in preference to the old hand weapons, for the possession of firearms became a necessary precaution against the danger of extermination. Intertribal warfare was conducted on an ever-increasing scale, and muskets were the most prized of all possessions, so that when the chief Hongi returned from his visit to England in 1821 he exchanged all his valuable presents for firearms as soon as he reached Sydney.
With the incoming of the regular colonists, trade assumed its more modern form, and the import of firearms was quickly overshadowed by the more peaceful requirements of the settlers. It was many years before the Maori finally gave up the appeal to force in order to sustain his claims or his rights; but since the second Maori War in the “sixties” the Natives have settled more and more into European habits.
Permanent settlement in 1840 rendered necessary the continued and increasing import of clothing, metals, and manufactures to sustain the colonists and to develop the colony. For many years after the first landing imports were greatly in excess of exports, and this excess represents the import of capital which was necessary to put the young colony on a firm footing. Especially in the early years New Zealand, while supplying foodstuffs from her own resources, has been dependent upon the outside world for a great proportion of the manufactures necessary for development, and also of the luxuries and amenities of modern life.
The gold rushes brought a huge increase of population and also of imports, and reference to Subsection A of this section will show the effect of the stimulus given by the gold-discoveries. In the later “sixties” imports were declining; but the borrowing policy pursued in the “seventies” resulted once more in an increase of imports for a time. Violent fluctuations succeeded, with a general tendency to diminish until, in sympathy with the increased exports, the value of imports rapidly increased from 1895. The worst check was received in 1909, following the bad year of exports in 1908. The figures for 1917 also showed a substantial fall, largely due to the shortage of shipping and the restriction of exports from Europe. Imports, however, have increased enormously during the last decade, and, as shown in the succeeding table, they advanced from £26,339,283 in 1916 to £52,456,407 in 1925, or a percentage increase of 99. The value per head of mean population was 66 per cent. greater in 1925 than in 1916.
The nature of the imports has changed little from the time of the first settlement in New Zealand, though new commodities have naturally been introduced, the principal groups of commodities being clothing and textiles, metals and machinery, sugar, tea, alcoholic liquors, tobacco, paper and stationery, oils, motor-vehicles and accessories, chemicals and drugs, and timber. The proportions of these imports have changed little for many years, except that motor-vehicles and oils (including motor - spirits) have increased very rapidly in recent years.
The following table shows the total imports for New Zealand and the rate per head of mean population during the last decade:—
| IMPORTS, 1916–25. | ||||||||
|---|---|---|---|---|---|---|---|---|
| Year | Total. | Per Head. | ||||||
| Including Specie. | Excluding Specie. | Including Specie. | Excluding Specie. | |||||
| £ | £ | £ | s. | d. | £ | s. | d. | |
| 1916 | 26,339,283 | 25,045,403 | 22 | 18 | 5 | 21 | 15 | 10 |
| 1917 | 20,919,265 | 20,742,130 | 18 | 4 | 2 | 18 | 1 | 1 |
| 1918 | 24,234,007 | 24,131,792 | 21 | 0 | 5 | 20 | 18 | 8 |
| 1919 | 30,671,698 | 30,309,167 | 25 | 14 | 4 | 25 | 8 | 3 |
| 1920 | 61,595,828 | 61,553,853 | 49 | 11 | 7 | 49 | 10 | 11 |
| 1921 | 42,942,443 | 42,744,122 | 33 | 12 | 9 | 33 | 9 | 8 |
| 1922 | 35,012,561 | 34,826,074 | 26 | 16 | 6 | 26 | 13 | 8 |
| 1923 | 43,378,493 | 43,363,983 | 32 | 13 | 2 | 32 | 13 | 0 |
| 1924 | 48,527,603 | 48,527,603 | 35 | 17 | 6 | 35 | 17 | 6 |
| 1925 | 52,456,407 | 52,425,757 | 37 | 17 | 10 | 37 | 17 | 4 |
The grand total of £52,456,407 in 1925 is decidedly heavy, and, with the exception of the boom year (1920), is the highest ever recorded. It should be remembered that part of the increase since the war is attributable to the higher prices ruling; nevertheless, it is evident that the effect of higher prices on imports could not account for the whole of the increase, but that then quantity of goods must have considerably increased. The most noticeable increase during recent years is shown by motor-vehicles and accessories. Whereas prior to 1911 the value of these never exceeded £300,000 annually, it gradually increased until in 1920 it amounted to £5,256,809. The total for 1925 (£5,882,387) is the highest ever recorded, and represents an increase of more than £1,300,000 over the previous year. As might naturally be expected, the import of oils has also increased enormously—from £471,965 in 1911 to £3,359,536 in 1925.
Since 1914 the statistics of both imports and exports have been compiled according to a statistical classification which assembles the items in well-defined classes. The advantages of a stereotyped classification of this kind over an alphabetical arrangement of items are obvious. In the preparation of the classes adopted a good deal of weight was attached to the recommendations of the Dominions Royal Commission which toured New Zealand in 1913. In a memorandum prepared for the Commission Professor A. L. Bowley submitted a scheme for uniformity of statistical work within the Empire, and suggested that New Zealand statistics should follow as closely as possible the lines laid down by Australia. The advantages of similarity of treatment in Australia and New Zealand are apparent, and in the classification of imports and exports, as in other matters, the statistics of New Zealand have been made comparable with those of Australia as far as possible.
The 1925 totals for the various classes of imports are presented below.
| IMPORTS BY CLASSES, 1925. | ||
|---|---|---|
| No. | Class. | Value in 1925. |
| £ | ||
| I | Foodstuffs of animal origin (excluding live animals) | 337,415 |
| II | Foodstuffs of vegetable origin, and common salt | 4,247,351 |
| III | Beverages (non-alcoholic) and substances used in making up the same | 1,084,957 |
| IV | Spirits and alcoholic liquors | 1,094,029 |
| V | Tobacco and preparations thereof | 1,792,063 |
| VI | Live animals | 49,571 |
| VII | Amman substances (mainly unmanufactured), not being foodstuffs | 37,740 |
| VIII | Vegetable substances and non-manufactured fibres | 606,206 |
| IXA | Apparel | 4,850,328 |
| IXB | Textiles | 6,239,084 |
| IXC | Manufactured fibres | 737,474 |
| X | Oils, fats, and waxes | 3,450,337 |
| XI | Paints and varnishes | 419,525 |
| XII | Stones and minerals used industrially | 736,156 |
| XIII | Specie | 30,650 |
| XIVA | Metal unmanufactured, partially manufactured, and ores | 310,248 |
| XIVB | Metal manufactures, other than machinery and machines | 5,602,823 |
| XV | Machinery and machines | 4,524,485 |
| XVIA | Indiarubber and manufactures thereof (not including tires) | 95,050 |
| XVIB | Leather and manufactures thereof, including substitutes | 543,601 |
| XVIIA | Timber | 1,195,350 |
| XVIIB | Wood, cane, and wicker manufactures | 258,179 |
| XVIII | Earthenware, china, glass, stoneware, cements, and cement materials | 1,018,261 |
| XIXA | Paper | 1,084,875 |
| XIXB | Stationery | 990,106 |
| XX | Jewellery, timepieces, and fancy goods | 891,050 |
| XXI | Optical, surgical, and scientific instruments | 519,288 |
| XXIIA | Drugs, chemicals, and druggists' wares | 1,165,017 |
| XXIIB | Manures | 430,618 |
| XXIII | Miscellaneous | 7,814,570 |
| Total | 52,456,407 | |
Imports as a whole show an increase of £3,928,804 over the previous year. In four only of the 30 groups given above was a decrease recorded, the most notable being a recession of £600,113 in Group II (Foodstuffs of vegetable origin) due to lower importations of wheat, oats, and sugar. The other decreases occurred in Classes VI, VIII, and XII. The Miscellaneous Class (XXIII), which is the largest of all, registered the greatest increase (£1,432,810), practically all of which occurred in motor-vehicles and parts. Other noteworthy increases were: Textiles, £627,729; apparel, £445,153; machinery and machines, £557,248; metal manufactures, £146,474; oils, fats, and waxes, £187,246; tobacco, £143,540.
A somewhat different and more detailed system of classification, which allows of information being shown not only for groups of items, but also for the principal definite items, has been adopted for the following table:—
| MAIN GROUPSOF IMPOSTS, 1921–25. | |||||
|---|---|---|---|---|---|
| Group of Principal Articles imported. | 1921. | 1922. | 1923. | 1924. | 1925. |
* Includes methylated spirits, perfumed spirits, and spirits of wine. | |||||
| £ | £ | £ | £ | £ | |
| Apparel (including hate and caps) | 2,122,061 | 1,982,915 | 2,819,297 | 2,679,505 | 2,943,284 |
| Boots and shoes | 531,135 | 729,622 | 1,200,581 | 975,95 | 1,069,820 |
| Drapery, haberdashery, linens, woollens, and other textiles | 4,854,881 | 4,425,230 | 5,231,653 | 4,550,634 | 5,027,107 |
| Hosiery | 355,702 | 641,589 | 566,991 | 466,896 | 541,609 |
| Silks | 328,960 | 589,963 | 643,131 | 719,129 | 838,668 |
| Totals | 3,192,739 | 8,369,319 | 10,461,653 | 9,392,115 | 10,420,488 |
| Iron and steel (pig, wrought, wire, &c., and galvanized) | 2,565,108 | 1,683,981 | 2,437,823 | 2,713,533 | 2,605,126 |
| Railway and tramway plant | 1,150,232 | 1,481,104 | 357,121 | 469,778 | 726,178 |
| Machinery | 2,970,394 | 2,027,197 | 2,596,422 | 3,550,579 | 3,811,368 |
| Sewing and knitting machines | 128,461 | 61,323 | 102,666 | 109,476 | 122,206 |
| Hardware and ironmongery | 922,039 | 428,709 | 613,196 | 655,682 | 676,234 |
| Tools and implements (including agricultural) | 824,109 | 379,473 | 531,229 | 636,650 | 727,538 |
| Nails | 129,014 | 95,166 | 134,025 | 91,934 | 99,935 |
| Other metals and metal manufactures | 1,967,083 | 1,254,372 | 1,802,413 | 1,801,127 | 1,968,971 |
| Totals | 10,656,440 | 7,411,325 | 8,574,895 | 10,028,759 | 10,737,556 |
| Sugar | 2,066,683 | 1,434,186 | 1,454,911 | 1,594,342 | 1,250,343 |
| Tea | 338,853 | 547,121 | 818,977 | 920,895 | 944,639 |
| Totals | 2,405,536 | 1,981,307 | 2,273,888 | 2,515,237 | 2,194,982 |
| Beer | 11,353 | 9,287 | 19,994 | 17,702 | 22,136 |
| Spirits* | 869,299 | 623,033 | 916,178 | 804,616 | 930,697 |
| Wine | 106,849 | 90,421 | 118,877 | 133,164 | 141,196 |
| Tobacco | 1,048,633 | 1,328,746 | 1,484,508 | 1,648,523 | 1,792,063 |
| Totals | 2,036,134 | 2,051,487 | 2,539,557 | 2,604,005 | 2,886,092 |
| Paper | 1,152,777 | 658,521 | 1,013,805 | 949,163 | 1,003,313 |
| Printed books | 427,318 | 454,264 | 480,410 | 502,413 | 546,952 |
| Stationery | 461,339 | 250,461 | 328,981 | 348,494 | 417,446 |
| Totals | 2,041,434 | 1,363,246 | 1,823,196 | 1,800,070 | 1,967,711 |
| Miscellaneous (specified articles)— | |||||
| Arms, ammunition, and explosives | 505,601 | 370,372 | 232,923 | 327,518 | 219,699 |
| Automobiles, motor-cars, and motor-cycles, and materials for | 2,227,030 | 1,527,326 | 3,494,402 | 4,567,496 | 5,882,387 |
| Bags and sacks | 341,370 | 234,378 | 357,888 | 317,751 | 455,109 |
| Bicycles and tricycles | 17,579 | 19,296 | 35,671 | 45,735 | 63,977 |
| Bicycle and tricycle fittings | 98,356 | 87,435 | 154,387 | 155,379 | 182,483 |
| dandles | 30,170 | 34,773 | 21,349 | 30,699 | 11,779 |
| Canvas | 90,341 | 28,235 | 40,036 | 42,096 | 48,089 |
| Carpeting, druggeting, and floorcloth | 574,852 | 376,797 | 696,004 | 658,733 | 691,189 |
| Carts, carriages, and materials for | 149,587 | 66,167 | 54,674 | 24,000 | 11,954 |
| Cement | 106,383 | 7,974 | 10,477 | 10,755 | 12,464 |
| China, porcelain, earthenware, and parian ware | 500,067 | 460,281 | 449,754 | 460,029 | 490,369 |
| Coal | 1,321,040 | 681,080 | 520,303 | 779,510 | 682,711 |
| Drugs, chemicals, and druggists wares | 1,082,436 | 1,098,024 | 1,126,785 | 1,145,354 | 1,165,017 |
| Fancy goods and toys | 505,791 | 520,404 | 639,868 | 681,710 | 767,733 |
| Fish, potted and preserved | 62,656 | 92,916 | 115,323 | 179,753 | 185,295 |
| Fruits (including fresh, preserved, bottled, and dried) | 611,271 | 703,916 | 723,827 | 772,335 | 808,989 |
| Furniture, cabinetware, and upholstery | 33,203 | 51,811 | 75,740 | 86,547 | 82,358 |
| Glass and glassware | 507,269 | 247,927 | 388,638 | 377,245 | 392,463 |
| Leather and leather manufactures | 412,896 | 466,576 | 590,205 | 515,287 | 536,375 |
| Manures | 367,074 | 248,570 | 347,330 | 334,673 | 430,618 |
| Musical instruments and materials for | 162,299 | 158,657 | 389,402 | 478,967 | 608,961 |
| Oil | 2,804,709 | 2,234,666 | 2,315,463 | 3,145,099 | 3,359,536 |
| Seeds | 204,492 | 122,277 | 231,257 | 274,371 | 202,242 |
| Timber | 813,816 | 550,682 | 638,620 | 1,043,829 | 1,195,350 |
| Woolpacks and wool-pockets | 75,505 | 55,886 | 125,873 | 123,936 | 171,476 |
| Totals: miscellaneous (specified articles) | 13,605,793 | 10,446,476 | 13,776,199 | 16,578,807 | 18,658,623 |
| Other imports (excluding specie) | 3,806,046 | 3,202,914 | 3,914,595 | 5,608,610 | 5,560,305 |
| Total imports (excluding specie) | 42,744,122 | 34,826,074 | 43,363,983 | 48,527,603 | 52,425,757 |
| Specie imported | 198,321 | 186,487 | 14,510 | 30,650 | |
| Total imports | 42,942,443 | 35,012,561 | 43,378,493 | 48,527,603 | 52,456,407 |
It is not possible to classify imports so completely as exports. There are two big groups of items, however, which are of dominating importance, and are, moreover, fairly homogeneous. The first, “Clothing and textiles,” comprises practically all woven articles; but the second, “Metals and machinery,” is not altogether complete, since there are man,- items in the “Miscellaneous” group which are metal manufactures. The other three groups are Well defined, and the value imported in each is, on the whole, steady.
The import trade of the Dominion, though spread over more countries than the export trade, is yet confined mainly to the United Kingdom, Australia, the United States, and Canada. In the days of the first settlement Australia was the source from which the young colony drew most of its supplies, and for a long period imports from Australia overshadowed imports from the United Kingdom. The proportion of imports from Australia, however, tended to decrease steadily till from 60 per cent. in 1862 it had fallen to about 15 per cent., a figure which, except for a few variations, has remained fairly constant.
Most of the goods brought to New Zealand from overseas come from the United Kingdom, which in the decade immediately preceding the war supplied about 60 per cent. of the total imports. The proportion has fallen a good deal in recent years, the percentage in 1922 and 1923 being 55; in 1924, 51; and in 1925, 52. In the “eighties” and “nineties” the figure was, on the average, nearer 70 per cent. than 60 per cent.
The cause of this decline is to be found in the development of trade with other countries in quite recent years, particularly with the United States, Japan, Canada. and in a less degree with Belgium, Italy, Sweden, and other European countries. The United States was sending goods to New Zealand practically from the foundation of the colony, and the share of the imports received from that country steadily increased till in the first decade of the present century it was 11 or 12 per cent. The adoption of Imperial preference seems to have caused a temporary drop in the figure to about 7 per cent., though the proportion has now for some years been steadily climbing again, and has, indeed, actually surpassed its old level. In 1925 nearly 17 per cent. of the total imports came from the United States.
India captured the New Zealand jute-market in the early “eighties,” and since then there has been a regular import of corn-sacks, woolpacks, &c. In former times the colony imported its sugar from Mauritius, but after 1890 Fiji supplanted Mauritius, so that the imports from the Pacific islands are swelled to nearly 3 per cent., while Mauritius practically disappears from the list of countries. Similarly, the import of tea from China gave way about the same time to imports from Ceylon.
The present position is illustrated by the tables which follow. The imports of goods from both the United Kingdom and the United States show an increase over the previous year's figures, but in the case of Australia a decrease of nearly half a million is disclosed, mainly on account of less wheat being required from that country than in 1924. In each of the last two years imports from Canada have been just under a million in excess of the total for 1923, which previously held the record. Importations from Fiji for the last three years show a substantial decrease by comparison with the previous triennium, consequent on a return towards the former level in sugar prices, and also (in 1923 and 1924) to competition from Java. Measuring the value of goods credited to each country as a percentage of total imports, Japan shows by far the greatest movement over the period 1918–24. The average importations from that country in 1918–20 were valued at over one and a quarter millions, but the average for the next five years is only slightly over half a million. The 1925 figure is the highest since 1920. Imports from Ceylon (principally tea) were higher in each of the last two years than in any previous year, and India also shows a distinct forward movement.
| IMPORTS FROM PRINCIPAL COUNTRIES, 1906–25. | ||||||||
|---|---|---|---|---|---|---|---|---|
| Year. | United Kingdom. | Australia. | Canada. | India. | Ceylon. | Fiji. | United States. | Japan. |
| £ | £ | £ | £ | £ | £ | £ | £ | |
| 1906 | 9,003,229 | 2,775,312 | 157,088 | 290,725 | 189,288 | 378,050 | 1,405,781 | 99,653 |
| 1907 | 10,278,019 | 3,127,553 | 215,232 | 370,655 | 220,102 | 625,644 | 1,425,596 | 94,298 |
| 1908 | 10,441,837 | 2,841,426 | 268,259 | 345,180 | 210,675 | 557,709 | 1,643,937 | 88,211 |
| 1909 | 9,287,786 | 2,764,210 | 198,384 | 367,999 | 230,499 | 590,214 | 1,166,063 | 86,865 |
| 1910 | 10,498,771 | 2,359,393 | 261,402 | 399,991 | 248,476 | 580,084 | 1,399,737 | 103,113 |
| 1911 | 11,787,300 | 2,944,991 | 283,410 | 326,360 | 275,672 | 728,806 | 1,682,129 | 123,248 |
| 1912 | 12,499,787 | 2,583,887 | 394,249 | 395,298 | 289,008 | 764,790 | 2,049,618 | 154,587 |
| 1913 | 13,312,193 | 2,914,848 | 452,519 | 421,209 | 275,350 | 846,493 | 2,107,990 | 151,106 |
| 1914 | 11,985,946 | 3,376,371 | 479,140 | 486,978 | 394,444 | 738,751 | 2,282,966 | 187,501 |
| 1915 | 11,141,067 | 3,554,535 | 797,816 | 527,942 | 408,697 | 1,128,959 | 2,600,248 | 304,322 |
| 1916 | 13,869,455 | 4,002,171 | 757,286 | 572,257 | 366,753 | 1,053,754 | 3,969,925 | 562,974 |
| 1917 | 8,817,513 | 3,660,931 | 757,041 | 612,063 | 353,613 | 1,203,372 | 3,900,658 | 628,822 |
| 1918 | 8,977,725 | 5,138,349 | 930,964 | 712,633 | 319,498 | 939,341 | 4,980,748 | 1,214,865 |
| 1919 | 11,839,430 | 5,081,968 | 1,622,234 | 772,838 | 383,209 | 980,186 | 7,576,314 | 1,258,016 |
| 1920 | 29,806,416 | 10,555,667 | 2,386,915 | 900,577 | 725,278 | 1,824,012 | 11,100,259 | 1,470,071 |
| 1921 | 21,448,817 | 6,486,847 | 1,687,595 | 593,151 | 316,813 | 1,909,102 | 7,746,457 | 593,343 |
| 1922 | 19,416,470 | 4,213,085 | 1,545,037 | 437,851 | 499,705 | 1,459,345 | 4,948,778 | 485,327 |
| 1923 | 24,003,671 | 4,259,323 | 2,930,626 | 732,359 | 701,665 | 859,757 | 6,696,723 | 548,632 |
| 1924 | 24,904,178 | 6,303,973 | 3,909,152 | 726,483 | 822,987 | 984,274 | 7,551,357 | 458,964 |
| 1925 | 27,263,509 | 5,855,989 | 3,906,152 | 888,787 | 836,419 | 1,251,797 | 8,626,959 | 659,146 |
As in the case of exports, a comparison has been instituted showing the average percentage of New Zealand's imports claimed by each of the principal countries during the pre-war years 1909 to 1913, and also the actual percentages during each of the last five years. The war period, and also the immediate post-bellum years, have been disregarded on account of the abnormal conditions then obtaining. Details of imports according to the country of origin not being available prior to 1914, the country of shipment has been used throughout the table in order to render the percentages strictly comparable. As a general rule about £2,000,000 worth of foreign goods enter the Dominion through British ports.
| IMPOSTS (COUNTRYOF SHIPMENT). | ||||||
|---|---|---|---|---|---|---|
| Country whence imported. | Average, 1909–13. | 1921. | 1922. | 1923. | 1924. | 1925. |
| Per Cent. | Per Cent. | Per Cent. | Per Cent. | Per Cent. | Per Cent. | |
| United Kingdom | 60.09 | 49.98 | 55.46 | 55.34 | 51.33 | 51.98 |
| Canada | 1.63 | 3.92 | 4.42 | 6.76 | 8.06 | 7.45 |
| India | 2.03 | 1.38 | 1.25 | 1.69 | 1.49 | 1.70 |
| Ceylon | 1.39 | 0.74 | 1.43 | 1.62 | 1.70 | 1.60 |
| South African Union | 0.04 | 0.08 | 0.44 | 0.19 | 0.13 | 0.20 |
| Australia | 14.39 | 15.10 | 12.03 | 9.82 | 12.99 | 11.16 |
| Fiji | 3.66 | 4.44 | 4.17 | 1.98 | 2.03 | 2.39 |
| Germany | 2.61 | 0.06 | 0.04 | 0.05 | 0.22 | 0.45 |
| France | 0.68 | 0.43 | 0.29 | 0.43 | 0.36 | 0.59 |
| Belgium | 0.67 | 0.86 | 0.38 | 0.32 | 0.26 | 0.59 |
| Japan | 0.64 | 1.38 | 1.39 | 1.26 | 0.95 | 1.25 |
| United States | 8.70 | 18.04 | 14.14 | 15.44 | 15.56 | 16.44 |
The most outstanding features brought out in the above table are the growth of trade with the United States and Canada, and the decline in the Mother-country's share of goods entering the Dominion. During the pre-war years 1909-13 the United Kingdom supplied on an average 60.09 per cent. of our imports, a figure which had fallen as low as 49.98 in 1921. Although a considerable amelioration was witnessed in 1922 and 1923, in both of which years the percentage exceeded 55, a further fall to under 52 per cent. has occurred.
The contribution of the United States to the Dominion's imports has grown from an average of 8.70 per cent. during 1909–13 to 16.44 per cent. in 1925, and in 1921 the percentage was as high as 18.04. The greatest relative increase, however, is disclosed in the figures relating to Canada, which claimed an average of only 1.63 per cent. of our imports during 1909-13, as compared with 7.45 per cent. in 1925. The firm hold established by both the United States and Canada upon the New Zealand market centres mainly around the motor trade. The last decade has seen a phenomenal development in motor traffic throughout the Dominion. The total imports of motor-vehicles and parts, which in 1914 amounted to £1,158,143, increased fivefold, to £5,882,387, in 1925. Whether or not the disorganization of British industry as the result of belligerent activities enabled America to encroach upon Great Britain's pre-war share of the New Zealand market, the fact remains that she has far outstripped the Mother country in the motor trade, and this in spite of the much higher duties imposed upon the foreign article. While imports from the United Kingdom under this heading increased from £570,079 in 1914 to £1,234,659 in 1925, the corresponding imports from the United States during the same period jumped from £287,689 to £2,042,418. Equally remarkable are the imports of motor-oils from America, which increased from £278,890 to £1,889,064 during the eleven years. The Canadian figures for motors and parts are even more impressive, having advanced from £107,336 in 1914 to £2,015,455 in 1925.
Australia's share of the market shows a slight falling-off as compared with prewar years. A similar position obtains in the case of Fiji, due to the appearance of Java on the sugar-market. India, France, Belgium, and Germany are also in a less-favourable position. In the case of the three last-mentioned countries, however, it should not be overlooked that the hulk of goods exported thence to New Zealand first pass through the United Kingdom, so that these countries actually furnish a larger proportion of the Dominion's imports than would appear from the table. Germany is rapidly recovering her pre-war trade with the Dominion, particularly in the direction of fancy-goods arid toys, drugs and chemicals, musical instruments, timepieces, glassware, machinery, paper and stationery, and manures. Japan has improved her position mainly through the increased export of silks to the Dominion. Ceylon also has now a larger share of the market as the result of exporting increased quantities of tea to the Dominion.
The following table shows the increasing proportion of imports which the Dominion is drawing from foreign countries:—
| Year. | Per Cent. |
|---|---|
| 1909–13 (average) | 16.11 |
| 1921 | 23.93 |
| 1922 | 2004 |
| 1923 | 21.98 |
| 1924 | 21.58 |
| 1925 | 22.82 |
The following table shows the total imports during the last five years from all the main countries which shipped goods to New Zealand, arranged in geographical order:—
| IMPORTS , BY COUNTRIESOF SHIPMENT, 1921–25. | |||||
|---|---|---|---|---|---|
| Country. | 1921. | 1922. | 1923. | 1924. | 1925. |
| £ | £ | £ | £ | £ | |
| United Kingdom | 21,448,817 | 19,416,476 | 24,003,671 | 24,904,178 | 27,263,509 |
| British Possessions, Protectorates, &c. | |||||
| Europe— | |||||
| Gibraltar | 2 | ||||
| Irish Free State | 689 | 635 | |||
| Malta | 246 | 1,039 | 1,614 | 780 | 89 |
| 248 | 1,039 | 1,614 | 1,469 | 724 | |
| Asia— | |||||
| British North Borneo | 19 | 515 | 18,367 | 35,773 | |
| Burma | 58,122 | 37,075 | 23,701 | 87,761 | 40,815 |
| Ceylon | 316,813 | 499,705 | 701,665 | 822,987 | 836,419 |
| Hong Kong | 18,349 | 15,382 | 22,913 | 18,091 | 17,566 |
| India | 593,151 | 437,851 | 732,359 | 726,483 | 888,787 |
| Malay States | 16 | 13 | 8,609 | 14,540 | 11,121 |
| Sarawak and Brunei | 2,292 | 14,745 | |||
| Straits Settlements | 34,627 | 67,725 | 79,162 | 76,249 | 80,003 |
| Other | 299 | 277 | 3 | 759 | 1,411 |
| 1,023,669 | 1,058,047 | 1,568,927 | 1,765,237 | 1,926,640 | |
| Africa— | |||||
| South African Union | 34,864 | 152,386 | 79,742 | 62,864 | 104,520 |
| Other | 736 | 15,743 | 3,964 | 4,102 | 9,736 |
| 35,600 | 168,129 | 83,706 | 66,966 | 114,256 | |
| America— | |||||
| British West Indies | 10,265 | 7,247 | 22,502 | 22,073 | 15,170 |
| Canada via East Coast | 1,086,829 | 1,038,912 | 2,270,580 | 2,977,731 | 3,090,576 |
| Canada via West Coast | 600,766 | 506,125 | 660,046 | 931,421 | 815,576 |
| Other | 581 | 191 | 893 | 403 | 311 |
| 1,698,441 | 1,552,475 | 2,954,021 | 3,931,628 | 3,921,633 | |
| Pacific islands— | |||||
| Australia | 6,486,847 | 4,213,085 | 4,259,323 | 6,303,073 | 5,855,989 |
| Fiji | 1,909,102 | 1,459,345 | 859,757 | 984,274 | 1,251,797 |
| Gilbert and Ellice Islands | 1,271 | 23,772 | 30,969 | 8,223 | 25,375 |
| Nauru | 46,124 | 62,307 | 46,074 | 95,828 | 105,065 |
| Tonga | 3,852 | 19,115 | 7,220 | 2,805 | 932 |
| Western Samoa | 11,486 | 18,455 | 11,050 | 10,133 | 16,811 |
| Other | 547 | 1,611 | 7 | 7 | 842 |
| 8,459,229 | 5,797,690 | 5,214,400 | 7,404,342 | 7,256,811 | |
| Foreign Countries and Possessions. | |||||
| Europe— | |||||
| Austria | 103 | 53 | 1,227 | 4,002 | |
| Belgium | 369,034 | 132,705 | 139,262 | 126,913 | 305,771 |
| Czecho-Slovakia | 786 | 5,798 | 11,322 | 10,484 | 20,693 |
| Denmark | 71,916 | 31,063 | 77,568 | 53,057 | 51,157 |
| France | 184,470 | 100,654 | 187,111 | 174,620 | 308,965 |
| Germany | 23,631 | 15,476 | 22,251 | 106,737 | 236,668 |
| Greece | 5,308 | 3,606 | 2,689 | 5,549 | 4,283 |
| Italy | 129,190 | 84,020 | 143,216 | 157,788 | 224,427 |
| Netherlands | 86,615 | 56,337 | 70,786 | 76,696 | 169,926 |
| Norway | 47,890 | 31,396 | 52,094 | 42,756 | 46,159 |
| Poland | 3 | 52 | 204 | 4,670 | |
| Portugal | 1,215 | 716 | 1,074 | 4,215 | 6,578 |
| Russia | 7,488 | 157 | 167 | 1,936 | 1,197 |
| Spain | 2,912 | 4,377 | 7,271 | 8,421 | 17,399 |
| Sweden | 197,570 | 128,520 | 125,067 | 128,126 | 261,436 |
| Switzerland | 69,284 | 41,927 | 48,903 | 60,090 | 84,516 |
| Turkey | 233 | 747 | 4,581 | 3,465 | |
| Other | 19 | 889 | 5,613 | 2,550 | 5,330 |
| 1,197,328 | 637,980 | 895,246 | 965,950 | 1,756,642 | |
| Asia— | |||||
| Asiatic Turkey | 81,540 | 35,732 | 38,252 | 42,561 | 34,951 |
| China | 136,590 | 112,052 | 98,793 | 90,320 | 97,596 |
| Dutch East Indies | 416,264 | 740,247 | 1,121,970 | 1,014,411 | 589,691 |
| Japan | 593,343 | 485,327 | 548,632 | 458,964 | 659,146 |
| Philippine Islands | 22,946 | 17,983 | 23,860 | 30,237 | 49,302 |
| Other | 740 | 1,506 | 2,569 | 2,143 | 2,343 |
| 1,251,423 | 1,392,847 | 1,834,076 | 1,638,636 | 1,433,029 | |
| Africa— | |||||
| Egypt | 1,041 | 495 | 19,371 | 18,861 | 40,866 |
| Other | 1,278 | 378 | 942 | 1,265 | 1,030 |
| 2,319 | 873 | 20,313 | 20,126 | 41,896 | |
| America— | |||||
| Brazil | 1,743 | 441 | 9,157 | 6,327 | 4,776 |
| Chile | 2 | 3,492 | 7,819 | 9,615 | 15,610 |
| Cuba | 3,821 | 2,212 | 5,126 | 6,683 | 9,982 |
| Ecuador | 327 | 377 | 2,866 | 2,972 | 4,116 |
| Mexico | 400 | 5,183 | 8,512 | 30,138 | |
| Peru | 197,996 | 269 | |||
| America | |||||
| United States of America— | |||||
| Via East Coast | 5,789,016 | 3,494,449 | 4,982,335 | 5,424,130 | 5,881,019 |
| Via West Coast | 1,957,441 | 1,454,329 | 1,714,388 | 2,127,227 | 2,745,940 |
| Other | 751 | 2,330 | 4,971 | 4,739 | 5,812 |
| 7,753,501 | 4,957,630 | 6,731,845 | 7,788,201 | 8,697,662 | |
| Pacific islands— | |||||
| Hawaii | 1,890 | 5,005 | 5,029 | 2,345 | 6,089 |
| New Caledonia | 11,269 | 10,409 | 18,902 | 21,601 | 16,096 |
| New Hebrides | 83 | 4,398 | 6,500 | 8,951 | |
| Society Islands | 5,958 | 5,837 | 15,933 | 9,745 | 12,469 |
| Tuamotu Archipelago | 52,739 | 8,041 | 26,412 | 665 | |
| Tutuila | 12 | 14 | |||
| 71,868 | 29,375 | 70,674 | 40,870 | 43,605 | |
| Grand totals | 42,942,443 | 35,012,561 | 43,378,493 | 48,527,603 | 52,456,407 |
In 1914 a change was made in the system of compilation of trade statistics, and for the first time statistics of imports were obtained for countries of origin. as well as countries of shipment. Before 1914 it was the practice to credit imports to the country from which the goods were shipped to the Dominion, and considerable care was taken to ensure that the original port of shipment. was ascertained. But there was no means of discovering where the goods were actually produced. Importers are now required to declare the country of origin as well as the country of shipment of all goods imported. The following table permits the study of imports under both headings:—
| IMPORTS , BY COUNTRIESOF SHIPMENTAND ORIGIN, 1925. | ||||
|---|---|---|---|---|
| Country. | Imports according to | |||
| Country of Shipment. | Country of Origin. | |||
| Value. | Per Cent. of Total. | Value. | Per Cent. of Total. | |
* Including £26,994 of returned New Zealand produce. | ||||
| £ | £ | |||
| United Kingdom | 27,263,509 | 51.98 | 25,572,802 | 48.75 |
| British Possessions, Protectorates, &c. | ||||
| Europe— | ||||
| Irish Free State | 635 | 4,397 | 0.01 | |
| Malta | 89 | 219 | ||
| 724 | 4,616 | 0.01 | ||
| Asia— | ||||
| British North Borneo | 35,773 | 007 | 36,349 | 0.07 |
| Burma | 40,815 | 0.07 | 42,299 | 0.08 |
| Ceylon | 836,419 | 1.60 | 844,596 | 1.62 |
| Hong Kong | 17,566 | 003 | 17,819 | 003 |
| India | 888,787 | 1.70 | 912,741 | 1.74 |
| Malay States | 11,121 | 0.02 | 11,283 | 0.02 |
| Sarawak and Brunei | 14,745 | 0.03 | 14,745 | 0.03 |
| Straits Settlements | 80,003 | 015 | 75,744 | 0.14 |
| Other | 1,411 | 1,524 | ||
| 1,926,640 | 3.67 | 1,957,100 | 3.73 | |
| British Possessions, &c. | ||||
| Africa— | ||||
| South African Union | 104,520 | 0.20 | 113,950 | 022 |
| Other | 9,736 | 0.02 | 14,573 | 003 |
| 114,256 | 0.22 | 128,523 | 0.25 | |
| America— | ||||
| British West Indies | 15,170 | 003 | 24,546 | 0.05 |
| Canada via East Coast | 3,090,576 | 5.90 | 3,916,237 | 7.47 |
| Canada via West Coast | 815,576 | 1.55 | ||
| Other | 311 | 1,674 | ||
| 3,921,633 | 7.48 | 3,942,457 | 7.52 | |
| Pacific islands— | ||||
| Australia | 5,855,989 | 1116 | 5,249,493 | 1001 |
| Fiji | 1,251,797 | 2.39 | 1,239,456 | 2.37 |
| Gilbert and Ellice Islands | 25,375 | 0.05 | 25,374 | 0.05 |
| Nauru (Pleasant Island) | 105,065 | 0.20 | 105,063 | 0.20 |
| Tonga | 932 | 421 | ||
| Western Samoa | 16,811 | 003 | 9,109 | 0.02 |
| Other | 842 | 27,862* | 005 | |
| 7,256,811 | 1383 | 6,656,778 | 12.70 | |
| Foreign Countries and Possessions. | ||||
| Europe— | ||||
| Austria | 4,002 | 0.01 | 40,243 | 0.08 |
| Belgium | 305,771 | 0.59 | 439,289 | 0.84 |
| Czecho-Slovakia | 20,693 | 0.04 | 93,763 | 0.18 |
| Denmark | 51,157 | 0.10 | 78,443 | 0.15 |
| Finland | 3,311 | 0.01 | 6,305 | 001 |
| France | 308,965 | 0.59 | 918,572 | 1.75 |
| Germany | 236,668 | 0.45 | 500,475 | 0.95 |
| Greece | 4,283 | 001 | 16,783 | 0.03 |
| Italy | 224,427 | 0.43 | 318,693 | 0.61 |
| Jugo-Slavia | 1,181 | 2,093 | ||
| Luxemburg | 447 | |||
| Netherlands | 169,926 | 032 | 272,786 | 0.52 |
| Norway | 46,159 | 009 | 48,241 | 0.11 |
| Poland | 4,670 | 0.01 | 14,175 | 0.03 |
| Portugal | 6,578 | 001 | 17,117 | 0.03 |
| Roumania | 3,135 | |||
| Russia | 1,197 | 10,818 | 0.02 | |
| Spain | 17,399 | 0.03 | 40,103 | 0.08 |
| Sweden | 261,436 | 0.50 | 309,770 | 0.59 |
| Switzerland | 84,516 | 0.16 | 441,892 | 0.85 |
| Turkey | 3,465 | 6,566 | 0.01 | |
| Other | 838 | 4,489 | 0.01 | |
| 1,756,642 | 3 35 | 3,594,198 | 6.85 | |
| Asia— | ||||
| Asiatic Turkey | 34,951 | 0.06 | 58,911 | 0.11 |
| China | 97,596 | 0.19 | 121,043 | 0.23 |
| Dutch East Indies | 589,691 | 1.13 | 610,686 | 1.17 |
| Japan | 659,146 | 1.25 | 693,632 | 1.32 |
| Philippine Islands | 49,302 | 0.10 | 51,508 | 0.10 |
| Other | 2,343 | 3,525 | 0.01 | |
| 1,433,029 | 2.73 | 1,539,305 | 2.94 | |
| Foreign Countries, &c. | ||||
| Africa— | ||||
| Egypt | 40,866 | 0.08 | 41,821 | 0.08 |
| Other | 1,030 | 8,522 | 0.01 | |
| 41,896 | 0.08 | 50,343 | 0.09 | |
| America— | ||||
| Alaska | 1,460 | 1,460 | ||
| Brazil | 4,776 | 0.01 | 14,325 | 0.03 |
| Chile | 15,610 | 0.03 | 16,676 | 0.03 |
| Cuba | 9,932 | 0.02 | 10,568 | 0.02 |
| Ecuador | 4,116 | 0.01 | 4,132 | 0.01 |
| Mexico | 30,138 | 0.06 | 30,534 | 0.05 |
| United States of America— | ||||
| Via East Coast | 5,881,019 | 11.21 | 8,885,265 | 16.94 |
| Via West Coast | 2,745,940 | 5.23 | ||
| Other | 4,621 | 0.01 | 6,152 | 0.01 |
| 8,697,662 | 16.58 | 8,969,112 | 17.09 | |
| Pacific islands— | ||||
| Hawaii | 6,089 | 0.01 | 6,081 | 0.01 |
| New Caledonia | 16,096 | 0.03 | 16,098 | 0.03 |
| New Hebrides | 8,951 | 0.02 | 9,853 | 0.02 |
| Society Islands | 12,469 | 0.02 | 9,141 | 0.01 |
| 43,605 | 0.08 | 41,173 | 0.07 | |
| Grand totals | 52,456,407 | 100.00 | 52,456,407 | 100.00 |
Only 50 per cent. of imports produced on the Continent of Europe are received direct, the balance coming mainly through the United Kingdom. Direct shipments from the United Kingdom in 1925 exceeded by £1,690,707 the imports of goods produced in that country. In view, however, of the considerable quantity of British goods that enter New Zealand by way of Australia it would not be correct to take that figure as fully measuring the re-export trade done by Great Britain in goods from abroad intended for the Dominion.
Australia acts as a re-exporting centre for a certain proportion of goods received from India and Ceylon. The South African Union and the British West Indies both produce more of the imports than they ship direct. The figures for Canada are practically level, the 1925 imports showing a small balance in favour of goods of Canadian origin. In the case of the United States, goods to the value of approximately a quarter of a million pounds annually are imported indirectly.
In the “Exports” subsection it has been shown that New Zealand is a primary-producing country—i.e., her exports consist principally of raw materials. It was also pointed out that the largest proportion of imports consisted of manufactures. The following table, grouped in the same manner as the export table referred to, illustrates this statement. Manufactured articles imported amounted to £40,544,096, of which the Mother-country supplied £22,329,495, or 55 per cent. The, figures given refer to countries of origin.
| Country. | Food, Drink, and Tobacco. | Raw Materials and Articles mainly unmanufactured. | Articles wholly or mainly manufactured. | Miscellaneous and Unclassified. | Bullion and Specie. | Total. |
|---|---|---|---|---|---|---|
* Returned produce. | ||||||
| £ | £ | £ | £ | £ | £ | |
| United Kingdom | 2,566,196 | 487,154 | 22,329,495 | 152,105 | 37,852 | 25,572,802 |
| British Possessions, Protectorates, &c. | ||||||
| Europe— | ||||||
| Irish Free State | 2,243 | 2,152 | 2 | 4,397 | ||
| Malta | 219 | 219 | ||||
| Asia— | ||||||
| Aden | 1,187 | 3 | 1,190 | |||
| British North Borneo Protectorate | 574 | 376 | 35,399 | 36,349 | ||
| Burma | 18,589 | 187 | 23,523 | 42,299 | ||
| Ceylon | 834,884 | 2,698 | 6,704 | 310 | 844,596 | |
| Cyprus | 61 | 61 | ||||
| Hong Kong | 12,167 | 2,530 | 3,121 | 1 | 17,819 | |
| India | 130,538 | 18,563 | 749,219 | 14,421 | 912,741 | |
| Malay States | 10,030 | 691 | 560 | 2 | 11,283 | |
| Palestine | 184 | 49 | 233 | |||
| Sarawak and Brunei | 692 | 14,053 | 14,745 | |||
| Straits Settlements | 72,373 | 1,876 | 1,256 | 239 | 75,744 | |
| Weihaiwei | 40 | 40 | ||||
| Africa— | ||||||
| Anglo-Egyptian Sudan | 2,647 | 2,647 | ||||
| British East Africa Protectorate | 400 | 281 | 31 | 712 | ||
| British West Africa | 1,357 | 2,061 | 3,418 | |||
| Seychelles | 6,161 | 6,161 | ||||
| South African Union | 64,293 | 21,725 | 19,578 | 8,354 | 113,950 | |
| Zanzibar | 1,621 | 14 | 1,635 | |||
| America— | ||||||
| British Guiana | 1,033 | 1,033 | ||||
| British Honduras | 330 | 330 | ||||
| British West Indies | 20,787 | 3,710 | 49 | 24,546 | ||
| Canada | 232,867 | 242,202 | 3,431,746 | 9,422 | 3,916,237 | |
| Newfoundland | 67 | 244 | 311 | |||
| Pacific islands— | ||||||
| Australia | 2,251,383 | 1,613,683 | 1,333,484 | 46,703 | 4,240 | 5,249,493 |
| Fiji | 1,231,159 | 252 | 8,013 | 32 | 1,239,456 | |
| Gilbert and Ellice Islands | 25,374 | 25,374 | ||||
| Nauru (Pleasant) Island | 105,063 | 105,063 | ||||
| New Zealand* | 1,194 | 4,657 | 5,779 | 15,364 | 26,994 | |
| Norfolk Island | 653 | 14 | 667 | |||
| Papua | 132 | 64 | 196 | |||
| Pitcairn Island | 4 | 4 | ||||
| Solomon Islands | 1 | 1 | ||||
| Tonga | 420 | 1 | 421 | |||
| Western Samoa | 8,918 | 63 | 128 | 9,109 | ||
| Totals, British countries | 7,465,874 | 2,397,400 | 28,109,892 | 247,018 | 42,092 | 38,262,276 |
| Foreign Countries and Possessions. | ||||||
| Europe— | ||||||
| Austria | 7 | 443 | 39,605 | 188 | 40,243 | |
| Belgium | 1,638 | 11,934 | 425,590 | 127 | 439,289 | |
| Bulgaria | 56 | 56 | ||||
| Crete | 36 | 36 | ||||
| Czecho-Slovakia | 94 | 13 | 92,961 | 695 | 93,763 | |
| Danzig | 33 | 33 | ||||
| Denmark | 13,087 | 54 | 22,811 | 42,491 | 78,443 | |
| Estonia | 1,221 | 1,221 | ||||
| Finland | 14 | 5,312 | 979 | 6,305 | ||
| France | 107,426 | 6,925 | 797,806 | 6,415 | 918,572 | |
| Germany | 12,404 | 1,051 | 480,533 | 6,487 | 500,475 | |
| Greece | 15,038 | 1,745 | 16,783 | |||
| Hungary | 28 | 1,260 | 1,288 | |||
| Iceland | 23 | 23 | ||||
| Italy | 67,151 | 3,637 | 247,683 | 222 | 318,693 | |
| Jugo-Slavia | 22 | 919 | 1,152 | 2,093 | ||
| Latvia | 707 | 905 | 1,612 | |||
| Lithuania | 220 | 220 | ||||
| Luxemburg | 447 | 447 | ||||
| Netherlands | 118,878 | 239 | 145,247 | 8,422 | 272,786 | |
| Norway | 29,418 | 447 | 28,370 | 6 | 58,241 | |
| Poland | 3,886 | 10,289 | 14,175 | |||
| Portugal | 12,765 | 2,299 | 525 | 1,528 | 17,117 | |
| Roumania | 2,924 | 159 | 52 | 3,135 | ||
| Russia | 137 | 648 | 9,915 | 118 | 10,818 | |
| Spain | 29,854 | 5,847 | 3,913 | 489 | 40,103 | |
| Sweden | 526 | 90,261 | 217,405 | 1,571 | 7 | 309,770 |
| Switzerland | 14,013 | 92 | 426,385 | 1,394 | 8 | 441,892 |
| Turkey | 4,300 | 222 | 1,021 | 1,023 | 6,566 | |
| Asia— | ||||||
| Asiatic Turkey | 57,485 | 546 | 729 | 151 | 58,911 | |
| China | 54,012 | 3,876 | 62,594 | 561 | 121,043 | |
| Cochin-China | 45 | 45 | ||||
| Dutch East Indies | 26,404 | 88,566 | 495,638 | 78 | 610,686 | |
| French Indo - Chinese Protectorate | 48 | 46 | 94 | |||
| Japan | 16,288 | 72,383 | 603,677 | 1,284 | 693,632 | |
| Persia | 340 | 2 | 1,071 | 1,413 | ||
| Philippine Islands | 3,169 | 48,109 | 230 | 51,508 | ||
| Siam | 1,830 | 68 | 1,898 | |||
| Siberia | 69 | 6 | 75 | |||
| Africa— | ||||||
| Abyssinia | 625 | 3 | 628 | |||
| Algeria | 10 | 10 | ||||
| Canary Islands | 203 | 314 | 517 | |||
| Egypt | 714 | 41,107 | 41,821 | |||
| French West Africa | 44 | 44 | ||||
| Madagascar | 1,232 | 328 | 112 | 1,672 | ||
| Madeira | 4,588 | 4,588 | ||||
| Morocco | 196 | 80 | 782 | 1,058 | ||
| Tripoli | 5 | 5 | ||||
| America— | ||||||
| Alaska | 1,460 | 1,460 | ||||
| Argentina | 612 | 34 | 646 | |||
| Bolivia | 7 | 7 | ||||
| Brazil | 12,409 | 1,910 | 6 | 14,325 | ||
| Chile | 16,676 | 16,676 | ||||
| Colombia | 19 | 19 | ||||
| Costa Rica | 1,588 | 1,588 | ||||
| Cuba | 10,556 | 11 | 1 | 10,568 | ||
| Dutch West Indies | 2 | 2 | ||||
| Ecuador | 4,116 | 16 | 4,132 | |||
| French West Indies | 21 | 21 | ||||
| Guatemala | 620 | 620 | ||||
| Mexico | 474 | 29,954 | 106 | 30,534 | ||
| Paraguay | 14 | 14 | ||||
| Panama Canal Zone | 687 | 540 | 1,227 | |||
| Peru | 59 | 456 | 515 | |||
| Salvador | 1 | 1 | ||||
| United States | 448,091 | 201,171 | 8,193,640 | 40,348 | 2,015 | 8,885,265 |
| Venezuela | 1,478 | 14 | 1,492 | |||
| Pacific islands— | ||||||
| Hawaii | 5,333 | 747 | 1 | 6,081 | ||
| New Caledonia | 67 | 16,031 | 16,098 | |||
| New Hebrides | 9,787 | 66 | 9,853 | |||
| Society Islands | 1,673 | 7,468 | 9,141 | |||
| Totals, foreign countries | 1,089,943 | 541,653 | 12,434,204 | 126,301 | 2,030 | 14,194,131 |
| Totals, all countries | 8,555,817 | 2,939,053 | 40,544,096 | 373,319 | 44,122 | 52,456,407 |
In order to give more detailed information concerning the trade of New Zealand with other countries the following tables have been compiled, giving for each of the last three years the main items of import from all the principal countries with which New Zealand trades. The information is shown both according to country of shipment and for country of origin.
In the principal countries account has been taken only of those items of a minimum total value of approximately £10,000, and in the smaller countries the main items only, so that the tables are not made too voluminous by the inclusion of great numbers of small items. The full details for the respective years covered will be found in the corresponding numbers of the “Annual Statistical Report on Trade and Shipping.”
| PRINCIPAL IMPORTS. | ||||||
|---|---|---|---|---|---|---|
| Article. | Country of Shipment. | Country of Origin. | ||||
| 1923. | 1924. | 1925. | 1923. | 1924. | 1925. | |
| £ | £ | £ | £ | £ | £ | |
| United Kingdom. | ||||||
| Cocoa-butter, &c. | 55,194 | 41,855 | 51,833 | 15,427 | 17,341 | 13,848 |
| Confectionery | 156,011 | 108,423 | 120,242 | 147,298 | 101,700 | 115,329 |
| Dried fruits | 26,041 | 29,871 | 34,921 | |||
| Maizena and cornflour | 40,995 | 43,721 | 42,127 | 40,975 | 43,681 | 42,116 |
| Infants' and invalids' foods | 16,595 | 17,343 | 20,404 | 16,599 | 17,361 | 20,704 |
| Mustard | 31,215 | 34,530 | 33,235 | 31,214 | 34,530 | 33,221 |
| Nuts, edible | 26,231 | 29,829 | 44,947 | 2,663 | 2,529 | 3,929 |
| Oilmen's stares | 24,152 | 30,095 | 31,214 | 23,436 | 29,298 | 29,517 |
| Pickles and sauces | 13,967 | 18,238 | 15,267 | 14,840 | 19,358 | 15,516 |
| Salt | 103,997 | 98,597 | 109,104 | 103,918 | 98,613 | 109,259 |
| Cocoa and chocolate | 44,361 | 45,544 | 48,171 | 35,646 | 38,420 | 45,376 |
| Ale, porter, and beer | 19,590 | 16,806 | 21,090 | 19,457 | 15,173 | 20,129 |
| Brandy | 20,705 | ,26,351 | 14,696 | |||
| Gin, geneva, and schnapps | 45,884 | 46,844 | 45,921 | 23,116 | 32,134 | 37,616 |
| Whisky | 717,100 | 579,501 | 705,779 | 746,604 | 603,946 | 730,492 |
| Spirits (other than beverages) | 30,531 | 41,849 | 35,041 | 29,433 | 39,905 | 31,442 |
| Wine | 32,366 | 35,483 | 35,442 | 13,191 | 9,571 | 10,191 |
| Cigarettes | 591,331 | 690,232 | 789,625 | 591,717 | 690,264 | 789,594 |
| Tobacco | 327,047 | 346,103 | 376,864 | 326,991 | 342,565 | 375,739 |
| PRINCIPAL IMPORTS | ||||||
|---|---|---|---|---|---|---|
| Article. | Country of Shipment. | Country of Origin. | ||||
| 1923. | 1924. | 1925. | 1923. | 1924. | 1925. | |
| £ | £ | £ | £ | £ | £ | |
| United Kingdom | ||||||
| Horses | 17,386 | 12,478 | 11,846 | 17,386 | 13,333 | 11,846 |
| Cork, cut | 13,859 | 7,250 | 5,101 | 8,631 | 3,674 | 2,304 |
| Engineers' waste | 16,804 | 23,363 | 22,921 | 16,804 | 23,407 | 22,921 |
| Seeds— | ||||||
| Grass and clover | 35,031 | 50,075 | 33,442 | 10,629 | 28,597 | 17,153 |
| Other | 77,240 | 70,043 | 61,253 | 69,839 | 62,986 | 57,220 |
| Starch | 11,699 | 12,177 | 10,816 | 11,396 | 11,913 | 10,755 |
| Tanning-materials, crude | 13,962 | 15,078 | 12,227 | 11,910 | 13,823 | 11,303 |
| Yarns | 149,696 | 111,926 | 104,105 | 152,775 | 113,896 | 104,379 |
| Apparel and ready-made clothing | 1,821,714 | 1,844,098 | 2,036,225 | 1,685,238 | 1,670,968 | 1,792,717 |
| Boots and shoes and parts thereof | 1,005,056 | 802,223 | 866,520 | 998,816 | 788,527 | 854,074 |
| Furs and fur trimmings | 59,896 | 61,115 | 60,140 | 44,318 | 43,505 | 38,593 |
| Haberdashery | 109,339 | 85,048 | 90,278 | 86,372 | 68,593 | 65,728 |
| Hats and caps | 105,620 | 106,900 | 114,640 | 95,914 | 98,582 | 108,471 |
| Hatmakers' materials | 91,809 | 80,623 | 92,212 | 459,471 | 49,646 | 56,831 |
| Hosiery | 432,760 | 332,626 | 415,794 | 31,033 | 328,755 | 409,520 |
| Lace and laces | 56,729 | 53,751 | 49,072 | 134,123 | 31,054 | 27,410 |
| Millinery | 145,012 | 144,498 | 158,126 | 14,134 | 111,891 | 128,169 |
| Ribbons | 134,948 | 96,317 | 84,112 | 2,257 | 2,200 | 1,828 |
| Umbrellas and materials for making | 15,244 | 20,338 | 25,760 | 612,753 | 17,291 | 22,442 |
| Carpets, carpeting, and floorcloth | 638,762 | 613,810 | 638,449 | 435,911 | 606,833 | 632,489 |
| Drapery | 518,528 | 480,993 | 580,334 | 50,754 | 420,638 | 513,431 |
| Felt sheathing | 21,636 | 24,946 | 27,455 | 21,624 | 24,945 | 27,629 |
| Textile piece-goods— | ||||||
| Canvas, sailcloth | 37,743 | 39,909 | 45,956 | 38,514 | 41,211 | 46,144 |
| Cotton | 2,242,247 | 1,993,271 | 2,148,273 | 2,221,417 | 1,974,053 | 2,127,190 |
| Hessians and scrim | 75,062 | 69,765 | 103,242 | 75,421 | 69,954 | 103,649 |
| Leather cloth | 15,255 | 15,303 | 16,838 | 15,524 | 15,332 | 17,221 |
| Linen | 23,014 | 31,293 | 37,286 | 28,733 | 31,041 | 37,337 |
| Silk (including artificial and imitation) | 347,788 | 422,310 | 492,695 | 113,336 | 129,657 | 202,795 |
| Woollen | 1,139,623 | 913,474 | 870,222 | 1,116,354 | 863,155 | 830,534 |
| Other | 31,638 | 40,907 | 35,560 | 31,762 | 41,170 | 35,628 |
| Sewing silks and cottons | 222,365 | 201,513 | 212,556 | 224,840 | 204,623 | 230,261 |
| Cordage and rope | 102,248 | 103,782 | 103,975 | 108,056 | 107,428 | 105,428 |
| Twine | 65,830 | 62,505 | 73,148 | 65,967 | 62,315 | 73,011 |
| Mineral oils | 13,370 | 22,145 | 29,594 | 10,771 | 19,549 | 25,691 |
| Vegetable oils | 102,283 | 95,045 | 98,319 | 99,207 | 92,566 | 96,598 |
| Faints and colours— | ||||||
| Paints ground in liquid | 33,005 | 34,486 | 40,253 | 31,380 | 32,801 | 38,319 |
| White-lead ground in oil | 146,121 | 134,573 | 135,072 | 146,142 | 134,573 | 135,129 |
| Mixed ready for use | 67,635 | 72,787 | 79,130 | 63,789 | 69,740 | 75,894 |
| Other | 27,894 | 27,726 | 29,511 | 27,227 | 25,698 | 28,344 |
| Varnishes, lacquers, and goldsize | 25,574 | 27,128 | 31,319 | 25,542 | 26,797 | 31,201 |
| Stone | 17,860 | 17,954 | 25,147 | 17,438 | 15,730 | 23,955 |
| Silver specie | 11,600 | 30,150 | 13,600 | 30,150 | ||
| Iron and steel (unmanufactured) | 312,193 | 320,450 | 265,5878 | 313,714 | 325,031 | 266,750 |
| Bolts and nuts | 78,378 | 103,549 | 99,025 | 78,441 | 103,618 | 99,077 |
| Brass manufactures | 21,315 | 23,335 | 18,234 | 21,335 | 23,336 | 18,234 |
| Chains and chain cables | 16,546 | 21,284 | 19,133 | 16,531 | 21,644 | 19,495 |
| Copper manufactures | 56,988 | 51,108 | 51,084 | 56,993 | 51,213 | 51,083 |
| Cutlery | 35,512 | 32,138 | 26,244 | 35,597 | 31,714 | 25,410 |
| Hardware and ironmongery | 418,622 | 468,619 | 493,020 | 409,371 | 448,296 | 465,104 |
| Iron and steel— | ||||||
| Hoop | 34,693 | 35,419 | 31,375 | 34,735 | 35,422 | 31,491 |
| Plate and sheet | 629,862 | 804,051 | 719,902 | 630,847 | 804,723 | 720,324 |
| Tubes, pipes, and fittings | 383,198 | 452,787 | 520,348 | 383,283 | 452,947 | 419,665 |
| Other | 106,219 | 190,673 | 187,616 | 107,449 | 197,917 | 190,664 |
| Lamps (not electric), lanterns, and lamp-wick | 21,148 | 25,504 | 18,058 | 19,193 | 23,995 | 17,332 |
| Meters | 102,544 | 124,634 | 144,930 | 102,370 | 122,820 | 141,405 |
| Nails | 28,290 | 40,030 | 48,650 | 27,923 | 39,460 | 47,273 |
| Plate and plated ware | 132,231 | 99,232 | 103,28 | 133,137 | 98,581 | 102,208 |
| Printing-materials | 17,653 | 17,881 | 16,831 | 18,848 | 18,387 | 18,351 |
| Railway and tramway plant | 255,382 | 411,149 | 496,961 | 257,411 | 410,177 | 497,895 |
| Rivets and washers | 20,419 | 20,355 | 23,462 | 20,270 | 20,193 | 23,378 |
| Stoves and ranges | 34,636 | 49,734 | 62,880 | 34,464 | 49,488 | 62,877 |
| Telephones and accessories therefor | 91,956 | 52,712 | 35,497 | 56,567 | 28,387 | 25,711 |
| Tinware and tin manufactures | 179,094 | 160,382 | 186,577 | 183,692 | 162,724 | 190,713 |
| Tools, implements, &c. | 133,121 | 169,647 | 174,395 | 130,439 | 164,573 | 165,744 |
| Wire— | ||||||
| Copper | 119,000 | 218,530 | 194,732 | 118,897 | 218,741 | 195,204 |
| Fencing | 166,458 | 175,274 | 159,068 | 166,516 | 176,145 | 158,513 |
| Netting | 122,786 | 121,180 | 100,623 | 122,786 | 121,233 | 100,000 |
| Other | 69,877 | 45,621 | 79,317 | 70,519 | 45,705 | 79,530 |
| Other metal manufactures | 395,708 | 426,168 | 509,549 | 387,829 | 419,900 | 495,921 |
| Agricultural Implements, &c. | 32,463 | 47,236 | 67,749 | 33,709 | 46,782 | 68,271 |
| Dairying machinery | 67,051 | 71,756 | 35,298 | 13,160 | 36,004 | 25,811 |
| PRINCIPAL IMPOSTS | ||||||
|---|---|---|---|---|---|---|
| Article. | Country of Shipment. | Country of Origin. | ||||
| 1923. | 1924. | 1925. | 1923. | 1924. | 1925. | |
| £ | £ | £ | £ | £ | £ | |
| Untied Kingdom | ||||||
| Dredging machinery | 9,420 | 22,195 | 21,779 | 9,420 | 22,195 | 22,264 |
| Electrical machinery | 986,998 | 1,489,464 | 1,458,514 | 963,722 | 1,431,048 | 1,415,387 |
| Engines, including materials for and parts of— | ||||||
| Gas and oil | 39,324 | 61,105 | 62,570 | 38,269 | 56,746 | 60,940 |
| Steam | 61,610 | 35,635 | 41,268 | 60,333 | 35,048 | 39,175 |
| Gas-making machinery | 965 | 561 | 27,785 | 965 | 561 | 27,785 |
| Locomotives | 80,177 | 16,318 | 182,290 | 60,177 | 16,318 | 182,290 |
| Mining machinery | 14,070 | 12,945 | 24,246 | 13,997 | 12,879 | 24,283 |
| Printing machinery | 66,768 | 94,480 | 124,947 | 69,298 | 94,430 | 127,091 |
| Sewing-machines | 73,747 | 30,205 | 81,657 | 73,660 | 80,300 | 82,019 |
| Tools—Engineers' and metal-and woodworkers', &c. | 64,040 | 77,607 | 122,999 | 63,484 | 75,106 | 120,048 |
| Turbines, steam and water, and Pelton wheels | 87,816 | 32,678 | 15,744 | 83,802 | 30,138 | 15,721 |
| Winches, cranes, capstans, and windlasses | 20,208 | 31,065 | 62,366 | 20,208 | 31,065 | 62,129 |
| Woollen-mill machinery | 53,700 | 59,114 | 14,665 | 54,496 | 59,332 | 14,625 |
| Other classes of machinery and machines | 227,700 | 341,368 | 386,227 | 223,443 | 327,058 | 371,081 |
| Indiarubber hose, tubing, and piping | 10,662 | 10,720 | 13,470 | 10,949 | 10,732 | 13,538 |
| Belting, leather and other | 58,887 | 52,034 | 61,101 | 58,856 | 52,340 | 61,099 |
| Leather | 208,196 | 153,079 | 184,238 | 200,868 | 146,745 | 177,815 |
| Saddlery and harness | 31,256 | 35,250 | 30,534 | 31,263 | 35,242 | 30,691 |
| Furniture, cabinetware, and upholstery | 19,608 | 32,248 | 35,697 | 17,586 | 28,360 | 30,314 |
| China, porcelain, and parian ware | 82,071 | 73,578 | 80,114 | 78,762 | 71,554 | 75,210 |
| Earthenware | 224,035 | 241,094 | 253,290 | 219,925 | 237,575 | 248,770 |
| Glass and glassware | 236,651 | 263,900 | 252,240 | 199,736 | 230,996 | 216,994 |
| Tiles | 51,596 | 78,399 | 75,950 | 51,459 | 78,045 | 75,391 |
| Butter-paper, &c. | 21,746 | 14,049 | 8,545 | 2,439 | 2,516 | 3,398 |
| Cardboard boxes, materials for | 37,849 | 34,404 | 33,223 | 26,115 | 24,454 | 25,987 |
| Paperhangings | 67,320 | 81,754 | 85,147 | 67,052 | 81,059 | 84,311 |
| Printing-paper | 272,814 | 273,898 | 303,763 | 274,838 | 275,295 | 308,180 |
| Writing-paper | 139,941 | 95,066 | 92,994 | 140,375 | 95,494 | 93,292 |
| Books, papers, and music, printed | 346,294 | 366,130 | 413,027 | 366,982 | 377,907 | 423,728 |
| Calendars and showcards | 15,048 | 20,493 | 25,996 | 14,895 | 20,398 | 25,808 |
| Envelopes | 31,871 | 25,879 | 33,811 | 31,738 | 25,872 | 32,803 |
| Ink | 14,557 | 17,138 | 15,922 | 14,332 | 16,870 | 15,922 |
| Manufactured stationery | 74,404 | 70,454 | 95,163 | 74,350 | 70,043 | 94,826 |
| Fancy goods and toys | 267,671 | 283,502 | 298,422 | 189,849 | 187,910 | 207,369 |
| Jewellery | 65,744 | 68,158 | 77,627 | 52,431 | 64,372 | 65,774 |
| Sporting, gaming, and athletic requisites | 102,280 | 95,996 | 106,826 | 100,551 | 95,192 | 106,771 |
| Timepieces | 29,357 | 56,430 | 72,048 | 8,147 | 8,326 | 8,970 |
| Tobacco-pipes and smokers' requisites | 71,455 | 52,021 | 64,824 | 36,984 | 32,859 | 51,546 |
| Cinematograph, bioscope, and kineto-scope films | 6,698 | 7,146 | 8,089 | 7,248 | 9,290 | 9,663 |
| Photographic materials and goods | 37,421 | 56,712 | 48,085 | 38,484 | 58,058 | 48,049 |
| Surgical and dental instruments | 48,880 | 58,378 | 68,788 | 45,001 | 52,523 | 59,812 |
| Acids | 25,711 | 24,200 | 16,408 | 27,465 | 24,022 | 16,652 |
| Cream of tartar | 17,190 | 41,309 | 21,563 | 16,910 | 41,570 | 21,666 |
| Cyanide of potassium and of sodium | 19,114 | 14,834 | 21,548 | 19,114 | 14,827 | 21,516 |
| Dyes | 46,672 | 32,021 | 20,668 | 49,921 | 31,931 | 22,221 |
| Disinfectants | 22,628 | 28,828 | 28,173 | 22,578 | 28,459 | 28,211 |
| Insecticides and tree-washes | 99,682 | 94,761 | 105,572 | 99,507 | 94,990 | 105,591 |
| Medicinal preparations, drugs, and druggists' sundries | 177,435 | 182,804 | 181,804 | 176,433 | 181,347 | 174,288 |
| Perfumery | 69,139 | 70,277 | 81,819 | 65,234 | 66,950 | 75,272 |
| Soda | 87,368 | 77,116 | 79,626 | 87,704 | 77,543 | 79,600 |
| Manures | 46,025 | 80,020 | 64,674 | 36,771 | 61,177 | 53,468 |
| Arms, ammunition, and explosives | 163,307 | 263,949 | 141,758 | 167,317 | 263,378 | 139,834 |
| Asbestos | 16,677 | 18,065 | 15,026 | 14,734 | 15,998 | 13,796 |
| Blue, laundry | 29,174 | 31,273 | 23,119 | 29,175 | 31,281 | 23,142 |
| Brushes, brushware, and brooms | 90,899 | 84,197 | 85,843 | 85,350 | 79,257 | 81,849 |
| Brushmakers' materials | 15,739 | 16,188 | 15,611 | 5,835 | 5,987 | 6,909 |
| Candles | 18,010 | 17,540 | 3,404 | 18,002 | 17,418 | 3,356 |
| Educational apparatus and materials | 18,643 | 17,637 | 18,584 | 18,728 | 15,896 | 17,891 |
| Musical instruments— | ||||||
| Pianos | 170,139 | 174,308 | 170,641 | 167,872 | 169,064 | 165,771 |
| Other | 97,861 | 168,835 | 273,022 | 92,035 | 159,896 | 257,404 |
| Matches and vestas | 46,484 | 39,574 | 25,189 | 37,618 | 23,121 | 16,586 |
| Packing, engine | 16,272 | 13,737 | 15,979 | 16,393 | 13,284 | 15,075 |
| Polishes and dressings | 38,297 | 39,363 | 42,686 | 38,553 | 39,644 | 42,630 |
| Soap | 42,433 | 49,589 | 45,489 | 40,333 | 46,464 | 41,221 |
| Vehicles— | ||||||
| Bicycles and materials for | 178,541 | 239,742 | 340,904 | 175,162 | 235,393 | 337,788 |
| Motors for road traffic and materials for | 447,424 | 659,745 | 1,234,659 | 408,027 | 648,194 | 1,200,061 |
| British North Borneo (Protectorate). | ||||||
| Mineral oils | 273 | 18,330 | 32,810 | 273 | 18,375 | 32,810 |
| PRINCIPAL IMPOSTS | ||||||
|---|---|---|---|---|---|---|
| Article. | Country of Shipment. | Country of Origin. | ||||
| 1923. | 1924. | 1925. | 1923. | 1924. | 1925. | |
| £ | £ | £ | £ | £ | £ | |
| Burma. | ||||||
| Rice | 14,641 | 19,048 | 15,012 | 15,223 | 19,991 | 16,106 |
| Mineral oils | 33,599 | 33,599 | ||||
| Waxes | 7,198 | 22,300 | 20,306 | 7,318 | 22,604 | 20,372 |
| Candles | 1,237 | 10,433 | 3,028 | 1,237 | 10,578 | 3,028 |
| Ceylon. | ||||||
| Coconut, desiccated | 11,085 | 14,803 | 15,193 | 11,651 | 14,874 | 15,328 |
| Tea | 681,198 | 801,070 | 811,302 | 683,201 | 814,088 | 818,375 |
| Hong Kong. | ||||||
| Jams, jellies, &c. | 13,451 | 10,713 | 10,051 | 13,557 | 10,770 | 10,053 |
| India. | ||||||
| Coffee and chicory | 6,876 | 9,444 | 8,989 | 8,328 | 10,015 | 9,141 |
| Tea | 72,723 | 81,801 | 100,696 | 72,723 | 81,927 | 100,811 |
| Shellac | 13,571 | 11,575 | 13,370 | 13,845 | 11,957 | 13,859 |
| Carpets, carpeting, and floorcloth | 23,215 | 15,701 | 18,570 | 23,597 | 16,422 | 20,855 |
| Hessians and scrim | 63,796 | 62,358 | 97,446 | 65,949 | 62,843 | 98,986 |
| Bags and sacks— | ||||||
| Corn-sacks | 231,461 | 198,705 | 227,651 | 232,136 | 200,458 | 229,080 |
| Jute and hessian bags | 113,708 | 102,213 | 159,329 | 113,708 | 104,806 | 169,237 |
| Woolpacks | 125,271 | 123,153 | 170,880 | 125,271 | 123,153 | 171,258 |
| Vegetable oils | 9,753 | 15,182 | 16,571 | 9,753 | 15,207 | 16,571 |
| Bonedust | 6,669 | 11,587 | 18,555 | 6,669 | 11,587 | 18,555 |
| Sarawak and Brunei. | ||||||
| Mineral oils | 13,540 | 13,540 | ||||
| Straits Statements. | ||||||
| Fruits, bottled and preserved | 21,815 | 26,925 | 30,646 | 21,426 | 27,001 | 30,723 |
| Sago and tapioca | 32,779 | 28,314 | 24,449 | 33,479 | 28,690 | 24,449 |
| Spices | 10,583 | 8,653 | 16,510 | 10,670 | 8,696 | 16,630 |
| Seychelles. | ||||||
| Guano | 6,161 | 6,161 | ||||
| South African Union. | ||||||
| Maize | 5,803 | 6,797 | 14,479 | 5,803 | 6,797 | 14,479 |
| Wine | 15,114 | 15,350 | 11,671 | 15,267 | 15,712 | 11,671 |
| Tanning-materials, crude | 28,964 | 15,498 | 20,720 | 33,903 | 25,114 | 21,608 |
| Precious stones, unmounted | 1,933 | 3,499 | 12,352 | 26,213 | 12,604 | 16,789 |
| British West Indies. | ||||||
| Cocoa-beans, uncrushed | 14,100 | 7,472 | 5,836 | 15,163 | 8,020 | 5,836 |
| Rum | 2,966 | 1,979 | 1,520 | 7,599 | 8,087 | 8,795 |
| Asphalt | 3,231 | 8,994 | 3,137 | 3,231 | 8,994 | 3,143 |
| Canada. | ||||||
| Fish | 58,577 | 98,500 | 117,930 | 58,915 | 99,529 | 118,460 |
| Confectionery | 29,514 | 20,945 | 37,090 | 29,514 | 20,945 | 37,184 |
| Fruit | 9,629 | 19,856 | 25,150 | 9,629 | 19,857 | 25,150 |
| Seeds | 11,402 | 22,444 | 12,897 | 11,942 | 6,547 | 8,558 |
| Apparel and ready-made clothing | 100,084 | 77,365 | 74,329 | 101,577 | 78,233 | 75,414 |
| Boots and shoes and parts thereof | 38,737 | 112,168 | 131,203 | 89,278 | 112,603 | 131,903 |
| Furs and fur trimmings | 7,051 | 11,304 | 6,526 | 8,061 | 11,639 | 7,334 |
| Hosiery | 31,715 | 25,130 | 34,477 | 31,851 | 25,512 | 34,482 |
| Cotton piece-goods | 12,594 | 14,756 | 11,493 | 12,787 | 15,475 | 12,019 |
| Iron and steel (unmanufactured) | 16,040 | 40,838 | 94,912 | 16,040 | 40,838 | 54,912 |
| Fencing-staples | 18,930 | 13,580 | 20,559 | 19,822 | 13,580 | 20,559 |
| Hardware and Ironmongery | 20,401 | 24,308 | 16,766 | 20,804 | 24,512 | 17,463 |
| Iron and steel tubes, pipes, and fittings | 77,625 | 66,590 | 58,019 | 77,625 | 66,938 | 58,132 |
| Nails | 75,770 | 35,049 | 35,064 | 77,156 | 35,076 | 35,282 |
| Tools, Implements, &c. | 14,605 | 16,829 | 19,999 | 14,632 | 16,829 | 20,004 |
| Wire— | ||||||
| Fencing | 139,415 | 67,695 | 58,534 | 140,788 | 68,046 | 58,534 |
| Other | 49,140 | 63,379 | 88,027 | 49,908 | 64,637 | 88,370 |
| Agricultural Implements, &c. | 25,943 | 28,902 | 38,660 | 26,816 | 29,898 | 39,846 |
| Electrical machinery | 76,485 | 70,671 | 97,139 | 76,839 | 71,214 | 97,591 |
| Tools—Engineers' and metal- and wood-workers', &c. | 3,027 | 5,767 | 9,521 | 3,027 | 5,773 | 9,521 |
| Belting, leather and other | 15,279 | 12,391 | 24,351 | 15,430 | 12,406 | 24,351 |
| Leather | 24,456 | 24,120 | 24,360 | 24,456 | 24,120 | 24,360 |
| PRINCIPAL IMPORTS | ||||||
|---|---|---|---|---|---|---|
| Article. | Country of Shipment. | Country of Origin. | ||||
| 1923. | 1924. | 1925. | 1923. | 1924. | 1925. | |
| £ | £ | £ | £ | £ | £ | |
| Canada | ||||||
| Timber | 87,030 | 134,128 | 137,449 | 87,234 | 134,205 | 137,783 |
| Wood, cane, and wicker manufactures | 62,471 | 72,078 | 59,247 | 63,751 | 72,131 | 59,428 |
| Cardboard | 3,528 | 12,568 | 13,053 | 4,260 | 12,568 | 13,053 |
| Paperhangings | 18,753 | 15,998 | 17,474 | 18,779 | 16,562 | 17,515 |
| Printing-paper | 242,536 | 241,275 | 247,021 | 242,536 | 241,491 | 247,078 |
| Wrapping-paper | 61,797 | 62,095 | 56,753 | 62,345 | 65,316 | 57,343 |
| Writing-paper | 12,305 | 6,136 | 9,326 | 12,408 | 6,167 | 9,319 |
| Stationery | 13,855 | 14,436 | 12,255 | 14,019 | 14,568 | 12,344 |
| Photographic materials and goods | 18,824 | 25,697 | 22,207 | 18,841 | 25,700 | 22,207 |
| Calcium carbide | 8,805 | 9,168 | 11,344 | 8,805 | 9,168 | 11,344 |
| Perfumery | 12,494 | 13,148 | 11,880 | 12,497 | 13,173 | 11,884 |
| Musical instruments | 19,115 | 24,594 | 25,129 | 19,415 | 24,662 | 25,282 |
| Vehicles— | ||||||
| Bicycles and materials for | 14,047 | 17,013 | 13,365 | 14,062 | 17,096 | 13,365 |
| Motors for road traffic and materials for | 1,299,413 | 2,071,153 | 2,015,455 | 1,299,964 | 2,077,663 | 2,019,401 |
| Australia. | ||||||
| Confectionery | 84,962 | 117,697 | 131,412 | 83,349 | 116,209 | 128,919 |
| Chaff | 25,816 | 84,278 | 17,438 | 25,816 | 84,278 | 17,438 |
| Fruits— | ||||||
| Bottled and preserved in syrup | 37,321 | 96,638 | 62,366 | 37,659 | 96,434 | 62,320 |
| Dried— | ||||||
| Currants | 38,255 | 35,499 | 23,229 | 38,255 | 34,950 | 23,229 |
| Raisins | 104,879 | 109,794 | 113,773 | 102,620 | 106,964 | 113,472 |
| Other | 6,230 | 10,922 | 14,857 | 2,867 | 948 | 9,589 |
| Fresh— | ||||||
| Oranges | 41,143 | 50,143 | 77,105 | 41,143 | 50,143 | 77,049 |
| Mandarins and grape-fruit | 20,040 | 17,177 | 20,496 | 20,006 | 17,162 | 20,494 |
| Other | 26,598 | 22,969 | 26,829 | 26,400 | 22,969 | 26,103 |
| Barley | 1,180 | 50,757 | 25,510 | 1,180 | 50,757 | 25,510 |
| Maize | 806 | 11,713 | 20,409 | 806 | 11,713 | 20,360 |
| Oats | 5,596 | 57,659 | 17,590 | 5,596 | 57,220 | 17,590 |
| Wheat | 1,039,774 | 794,207 | 1,039,774 | 794,207 | ||
| Bran | 6,049 | 24,249 | 16,894 | 6,049 | 24,249 | 16,894 |
| Flour | 6 | 3 | 122,126 | 2 | 3 | 122,126 |
| Pollard and sharps | 2,976 | 23,207 | 24,780 | 2,976 | 23,207 | 24,780 |
| Rice, dressed | 23,072 | 21,585 | 15,445 | 22,443 | 20,025 | 13,582 |
| Salt | 16,396 | 5,572 | 16,085 | 16,336 | 5,553 | 15,929 |
| Vegetables | 25,553 | 87,150 | 9,916 | 25,373 | 87,024 | 7,530 |
| Whisky | 30,755 | 28,001 | 28,034 | 1,251 | 3,131 | 2,294 |
| Spirits of wine | 14,769 | 15,529 | 16,364 | 14,769 | 15,520 | 16,362 |
| Wine, fermented | 63,323 | 66,911 | 67,924 | 57,671 | 60,359 | 61,772 |
| Tobacco and preparations thereof | 377,250 | 369,579 | 425,341 | 373,995 | 368,130 | 424,059 |
| Horses | 13,049 | 29,820 | 25,835 | 6,894 | 8,282 | 12,090 |
| Wool | 27,496 | 7,512 | 14,144 | 27,496 | 7,512 | 14,144 |
| Seeds | 13,971 | 31,970 | 22,346 | 11,508 | 29,008 | 18,800 |
| Tanning-materials, crude | 10,875 | 14,639 | 5,112 | 5,025 | 3,130 | 2,822 |
| Apparel and ready-made clothing | 38,766 | 27,703 | 23,295 | 27,177 | 21,269 | 14,293 |
| Boots and shoes and parts thereof | 25,237 | 16,747 | 21,414 | 22,629 | 14,984 | 19,680 |
| Hosiery | 27,014 | 42,367 | 8,382 | 20,738 | 39,710 | 7,266 |
| Drapery | 7,400 | 8,030 | 14,875 | 2,943 | 3,064 | 5,680 |
| Textile piece-goods— | ||||||
| Cotton | 29,562 | 33,807 | 28,085 | 2,012 | 982 | 2,002 |
| Silk | 3,247 | 14,110 | 10,390 | 61 | 61 | 70 |
| Woollen | 13,031 | 4,735 | 4,427 | 270 | 149 | 365 |
| Mineral oils | 31,436 | 55,853 | 50,761 | 3,832 | 6,131 | 5,644 |
| Vegetable oils | 14,484 | 17,571 | 20,732 | 10,099 | 11,234 | 15,711 |
| Stearine | 5,978 | 13,213 | 8,269 | 5,978 | 13,213 | 8,269 |
| Paints and colours | 29,457 | 20,039 | 32,803 | 26,851 | 18,807 | 30,465 |
| Coal | 519,021 | 773,975 | 679,681 | 519,021 | 773,975 | 679,681 |
| Lead, pig and bar (unmanufactured) | 45,178 | 86,319 | 73,609 | 44,847 | 86,319 | 73,609 |
| Tin (unmanufactured) | 40,955 | 61,129 | 64,339 | 40,801 | 61,129 | 64,047 |
| Hardware and ironmongery | 21,194 | 18,892 | 23,770 | 17,456 | 15,358 | 19,472 |
| Iron and steel— | ||||||
| Tubes, pipes, and fittings | 6,910 | 8,032 | 5,975 | 5,380 | 4,8591 | 4,720 |
| Other | 8,214 | 9,982 | 7,078 | 4,124 | 1,906 | 3,615 |
| Lead manufactures | 29,157 | 17,648 | 13,828 | 28,943 | 17,648 | 13,828 |
| Railway and tramway plant | 16,682 | 12,603 | 13,071 | 14,653 | 12,181 | 12,934 |
| Wire— | ||||||
| Copper | 92,215 | 26,519 | 51,919 | 92,155 | 26,295 | 51,447 |
| Other | 8,624 | 16,453 | 11,756 | 5,555 | 13,123 | 10,124 |
| Other metal manufactures | 87,459 | 74,210 | 81,907 | 59,632 | 50,218 | 57,492 |
| Dairying machinery | 35,935 | 30,396 | 38,535 | 29,342 | 26,540 | 35,374 |
| Electrical machinery | 40,879 | 54,687 | 48,355 | 24,778 | 36,843 | 24,644 |
| Tools—Engineers' and metal-and wood-workers', &c. | 15,198 | 18,373 | 33,971 | 12,726 | 14,846 | 31,724 |
| PRINCIPAL IMPOSTS | ||||||
|---|---|---|---|---|---|---|
| Article. | Country of Shipment. | Country of Origin. | ||||
| 1923. | 1924. | 1925. | 1923. | 1924. | 1925. | |
| £ | £ | £ | £ | £ | £ | |
| Australia | ||||||
| Other classes of machinery and machines | 82,289 | 104,781 | 104,396 | 37,077 | 55,155 | 52,776 |
| Indiarubber hose, tubing, and piping | 30,293 | 33,562 | 26,466 | 29,854 | 33,133 | 25,913 |
| Belting, leather and other | 15,835 | 15,274 | 13,090 | 15,361 | 14,534 | 12,402 |
| Leather | 123,423 | 116,934 | 79,366 | 104,736 | 89,580 | 58,622 |
| Timber | 438,439 | 729,565 | 752,758 | 434,980 | 722,685 | 744,943 |
| Wood, cane, and wicker manufactures | 35,205 | 36,047 | 27,434 | 32,251 | 32,554 | 23,358 |
| Glass and glassware | 52,102 | 37,026 | 38,681 | 50,683 | 34,098 | 37,108 |
| Paper | 24,284 | 35,846 | 37,357 | 16,109 | 23,737 | 25,510 |
| Stationery | 124,068 | 126,681 | 133,996 | 92,534 | 102,784 | 107,132 |
| Fancy goods and toys | 20,207 | 18,834 | 17,816 | 14,592 | 13,140 | 13,041 |
| Jewellery | 61,530 | 39,790 | 25,328 | 43,032 | 24,250 | 14,911 |
| Cinematograph, bioscope, and kinetoscope films | 32,287 | 34,280 | 35,945 | 4,123 | 1,729 | 3,770 |
| Photographic materials and goods | 49,082 | 60,030 | 58,836 | 45,792 | 56,976 | 56,186 |
| Dyes | 15,509 | 14,084 | 10,131 | 3,699 | 5,268 | 4,395 |
| Disinfectants | 8,571 | 9,960 | 13,082 | 8,355 | 9,841 | 12,976 |
| Liquefied and compressed gases | 21,295 | 21,703 | 20,825 | 20,470 | 21,223 | 20,680 |
| Medicinal preparations, drugs, and druggists' sundries | 104,264 | 82,386 | 82,292 | 92,788 | 70,897 | 73,873 |
| Perfumery | 21,111 | 16,887 | 11,654 | 9,043 | 13,820 | 10,418 |
| Manures | 40,109 | 26,745 | 23,476 | 40,109 | 26,636 | 22,294 |
| Arms, ammunition, and explosives | 22,053 | 26,755 | 39,570 | 17,320 | 25,150 | 38,349 |
| Brushes, brushware, brooms, and brush-makers' materials | 10,127 | 10,625 | 12,054 | 8,025 | 9,081 | 11,108 |
| Musical instruments | 31,867 | 26,405 | 25,295 | 12,133 | 11,145 | 18,037 |
| Polishes and dressings | 16,409 | 16,308 | 13,601 | 15,370 | 15,152 | 13,398 |
| Soap | 19,082 | 34,576 | 33,272 | 18,706 | 33,554 | 29,071 |
| Vehicles— | ||||||
| Bicycles and materials for | 52,550 | 31,623 | 34,053 | 51,773 | 30,718 | 33,132 |
| Motors for road traffic and parts thereof | 37,786 | 44,818 | 34,620 | 28,138 | 27,425 | 14,618 |
| Fiji. | ||||||
| Fruits, fresh | 107,718 | 113,718 | 143,529 | 107,718 | 113,718 | 143,529 |
| Sugar | 735,069 | 849,903 | 1,084,313 | 735,069 | 849,903 | 1,084,886 |
| Gilbert and Ellice Islands. | ||||||
| Phosphates | 30,969 | 8,223 | 25,374 | 30,969 | 8,223 | 25,374 |
| Nauru (Pleasant) Island. | ||||||
| Phosphates | 46,074 | 95,800 | 105,063 | 46,074 | 95,800 | 105,063 |
| Western Samoa. | ||||||
| Cocoa-beans, uncrushed | 8,325 | 5,740 | 8,847 | 8,432 | 5,740 | 8,347 |
| Austria. | ||||||
| Apparel and ready-made clothing | 220 | 607 | 9 | 5,930 | 19,481 | |
| Belgium. | ||||||
| Apparel and ready-made clothing | 119 | 34 | 355 | 9,510 | 9,183 | 11,720 |
| Cotton piece-goods | 1,599 | 7,341 | 9,900 | 21,152 | 30,387 | 30,358 |
| Stearine | 3,083 | 1,780 | 5,484 | 6,824 | 5,386 | 9,439 |
| Zinc—Bar and smelter | 3,821 | 5,228 | 10,825 | 4,066 | 10,957 | 10,825 |
| Lead—Sheet | 398 | 5,102 | 633 | 10,093 | ||
| Telephones, and accessories therefor | 7,438 | 7,615 | 54,792 | 34,449 | 26,875 | 65,366 |
| Electrical machinery | 5,907 | 18,112 | 80,625 | 10,142 | 29,529 | 110,304 |
| Glass and glassware | 10,868 | 11,308 | 25,468 | 28,201 | 26,476 | 41,190 |
| Vegetable parchment | 16,817 | 5,098 | 7,097 | 35,249 | 11,347 | 9,063 |
| Jewellery | 2 | 2 | 15,131 | 2 | 2,168 | 24,753 |
| Manures | 75,737 | 49,089 | 82,528 | 78,208 | 60,421 | 87,296 |
| Matches | 4,039 | 8,752 | 11,000 | 8,022 | 17,320 | 13,892 |
| Motor-vehicles for road traffic and parts thereof | 812 | 1,941 | 14,584 | 1,092 | 2,640 | 16,975 |
| Czecho-Slovakia. | ||||||
| Apparel and ready-made clothing | 73 | 329 | 117 | 10,908 | 9,983 | 6,902 |
| Glass and glassware | 2,962 | 3,969 | 6,022 | 12,070 | 10,440 | 14,657 |
| Fancy goods and toys | 1,542 | 1,902 | 1,615 | 23,223 | 17,424 | 16,202 |
| Musical instruments | 2,186 | 793 | 1,077 | 9,077 | 3,034 | 2,299 |
| Denmark. | ||||||
| Rennet | 10,687 | 10,848 | 8,736 | 14,968 | 16,320 | 11,932 |
| Seeds | 52,056 | 30,431 | 26,513 | 58,350 | 62,617 | 39,675 |
| Dairying machinery | 5,252 | 4,812 | 8,055 | 11,019 | 9,073 | 11,005 |
| PRINCIPAL IMPORTS | ||||||
|---|---|---|---|---|---|---|
| Article. | Country of Shipment. | Country of Origin. | ||||
| 1923. | 1924. | 1925. | 1923. | 1924. | 1925. | |
| £ | £ | £ | £ | £ | £ | |
| France. | ||||||
| Confectionery | 5,946 | 4,959 | 8,964 | 10,882 | 7,398 | 12,217 |
| Nuts, edible | 2,174 | 114 | 1,857 | 8,136 | 4,864 | 9,666 |
| Brandy | 13,378 | 17,358 | 24,486 | 35,294 | 45,410 | 41,672 |
| Wine | 5,147 | 10,859 | 16,239 | 15,287 | 26,284 | 30,014 |
| Seeds | 4,957 | 3,821 | 2,267 | 14,382 | 11,754 | 3,946 |
| Apparel and ready-made clothing | 681 | 1,416 | 3,056 | 61,575 | 78,330 | 128,130 |
| Furs and fur trimmings | 624 | 41 | 2,036 | 14,903 | 8,517 | 11,855 |
| Haberdashery | 17 | 58 | 9,151 | 5,384 | 7,117 | |
| Lace and laces | 22 | 19 | 48 | 11,604 | 9,805 | 6,317 |
| Millinery | 2,956 | 47 | 1,011 | 29,030 | 21,781 | 19,383 |
| Ribbons | 326 | 172 | 229 | 38,171 | 28,380 | 23,049 |
| Drapery | 422 | 351 | 202 | 30,131 | 19,675 | 22,796 |
| Textile piece-goods— | ||||||
| Cotton | 181 | 689 | 606 | 15,346 | 10,357 | 13,350 |
| Silk (including artificial and imitation) | 1,360 | 1,331 | 7,386 | 107,395 | 151,626 | 157,360 |
| Woollen | 65 | 222 | 814 | 28,500 | 39,630 | 31,242 |
| Fancy goods and toys | 1,622 | 2,479 | 2,972 | 43,206 | 41,173 | 36,459 |
| Tobacco-pipes and smokers' requisites | 10,856 | 2,426 | 1,092 | 48,860 | 22,400 | 12,108 |
| Perfumery and toilet preparations | 1,674 | 2,988 | 6,468 | 7,771 | 7,289 | 12,315 |
| Manures | 5,746 | 3,466 | 12,415 | 7,387 | 5,810 | 16,480 |
| Vehicles— | ||||||
| Bicycles and materials for | 4,708 | 1,253 | 3,317 | 5,130 | 2,020 | 4,141 |
| Motors for road traffic and parts thereof | 82,939 | 70,491 | 163,706 | 99,406 | 82,233 | 195,602 |
| Germany. | ||||||
| Apparel and ready-made clothing | 66 | 3,771 | 11,523 | 1,535 | 21,400 | 48,985 |
| Drapery | 1 | 8 | 1,570 | 651 | 610 | 11,444 |
| Hardware and ironmongery | 67 | 4,693 | 15,873 | 1,494 | 12,568 | 33,110 |
| Electrical machinery | 8 | 3,820 | 8,865 | 878 | 12,068 | 18,385 |
| Glass and glassware | 49 | 3,295 | 7,787 | 509 | 9,001 | 13,446 |
| Fancy goods and toys | 1,653 | 25,832 | 37,519 | 14,693 | 61,360 | 74,884 |
| Timepieces | 210 | 5,124 | 17,196 | 2,096 | 13,484 | 28,752 |
| Manures | 13,286 | 9,115 | 18,093 | 14,595 | 14,299 | 20,587 |
| Musical instruments | 1,960 | 5,640 | 15,625 | 6,904 | 20,001 | 25,964 |
| Greece. | ||||||
| Dried fruits | 2,655 | 5,416 | 4,127 | 8,184 | 15,134 | 15,038 |
| Italy. | ||||||
| Oranges and lemons | 499 | 774 | 7,577 | 656 | 774 | 8,359 |
| Nuts, edible | 25,734 | 20,211 | 32,353 | 31,394 | 32,229 | 48,669 |
| Peel | 6,172 | 5,766 | 3,946 | 6,615 | 5,766 | 3,946 |
| Haberdashery | 3,324 | 2,084 | 1,903 | 10,353 | 7,433 | 9,249 |
| Hats and caps | 14,449 | 13,729 | 15,686 | 19,611 | 19,148 | 19,590 |
| Hatmakers' materials | 308 | 709 | 6,936 | 1,949 | 3,579 | 13,262 |
| Silk piece-goods | 1,015 | 580 | 12,940 | 18,122 | 20,719 | |
| Marble | 7,569 | 7,976 | 9,246 | 8,502 | 9,170 | 10,256 |
| Sulphur | 589 | 24,261 | 268 | 641 | 24,395 | 333 |
| Vehicles—Motors for road traffic and parts thereof | 59,847 | 58,360 | 118,911 | 82,502 | 59,779 | 123,902 |
| Netherlands | ||||||
| Cocoa-butter, &c. | 19,504 | 23,194 | 30,627 | 59,378 | 47,548 | 68,506 |
| Cocoa and chocolate | 3,274 | 823 | 3,887 | 12,655 | 8,031 | 6,606 |
| Gin, geneva, and schnapps | 10,988 | 12,219 | 20,522 | 34,636 | 29,379 | 30,315 |
| Electrical machinery | 9,601 | 12,330 | 28,755 | 24,180 | 29,570 | 36,968 |
| Asphalt | 37,601 | 38,084 | ||||
| Cardboard | 7,511 | 7,109 | 8,743 | 16,200 | 12,995 | 12,607 |
| Norway. | ||||||
| Fish | 21,308 | 26,910 | 21,328 | 28,621 | 46,499 | 29,395 |
| Calcium carbide | 9,650 | 3,935 | 2,922 | 10,292 | 4,158 | 2,992 |
| Poland. | ||||||
| Clover-seeds | 3,077 | 603 | 10,287 | |||
| Portugal. | ||||||
| Wine | 727 | 1,781 | 3,831 | 8,818 | 10,203 | 12,104 |
| Cork, cut | 388 | 1,345 | 897 | 3,376 | 3,369 | 2,223 |
| Spain. | ||||||
| Nuts, edible | 1,270 | 1,706 | 8,813 | 8,125 | 8,252 | 15,584 |
| Wine | 944 | 1,083 | 3,561 | 5,700 | 6,659 | 10,346 |
| Cork, cut | 4,026 | 3,788 | 3,054 | 7,554 | 7,769 | 5,736 |
| PRINCIPAL IMPORTS | ||||||
|---|---|---|---|---|---|---|
| Article. | Country of Shipment. | Country of Origin. | ||||
| 1923. | 1924. | 1925. | 1923. | 1924. | 1925. | |
| £ | £ | £ | £ | £ | £ | |
| Sweden. | ||||||
| Wood pulp | 1,418 | 10,835 | 27,552 | 11,107 | 35,032 | 27,552 |
| Hardware and ironmongery | 4,782 | 5,157 | 6,056 | 9,950 | 14,158 | 12,185 |
| Metal manufactures n.e.i. | 1,303 | 2,014 | 16,030 | 2,774 | 2,925 | 17,730 |
| Dairying machinery | 64,160 | 54,738 | 63,190 | 106,505 | 85,612 | 70,575 |
| Electrical machinery | 9,136 | 8,969 | 44,043 | 16,972 | 37,283 | 50,412 |
| limber | 14 | 10,243 | 60,054 | 181 | 20,309 | 62,053 |
| Cardboard | 6,344 | 6,821 | 7,971 | 8,589 | 10,750 | 10,797 |
| Matches and vestas | 10,013 | 5,971 | 5,596 | 14,582 | 13,082 | 9,594 |
| Switzerland. | ||||||
| Confectionery | 9,082 | 7,731 | 10,861 | 11,953 | 10,955 | 13,552 |
| Apparel and ready-made clothing | 106 | 103 | 537 | 45,096 | 48,880 | 39,934 |
| Boots and shoes and parts thereof | 3 | 1,352 | 2,196 | 744 | 10,114 | 9,498 |
| Hatmakers' materials | 13 | 45 | 311 | 17,686 | 7,829 | 7,416 |
| Lace and laces | 152 | 77 | 8,641 | 7,229 | 6,362 | |
| Ribbons | 963 | 2,206 | 801 | 96,486 | 67,109 | 58,132 |
| Drapery | 127 | 229 | 1,219 | 34,214 | 33,272 | 30,015 |
| Silk piece-goods | 244 | 2,314 | 8,373 | 108,804 | 106,276 | 105,782 |
| Electrical machinery | 749 | 5,902 | 8,717 | 1,217 | 10,071 | 14,997 |
| Timepieces | 28,044 | 29,646 | 26,167 | 48,959 | 70,211 | 81,118 |
| Phonographs, records, and accessories | 1,531 | 2,992 | 9,984 | 5,645 | 8,834 | 17,840 |
| Asiatic Turkey. | ||||||
| Dried fruits— | ||||||
| Dates | 17,963 | 17,132 | 21,249 | 35,121 | 33,848 | 41,453 |
| Raisin | 8,689 | 14,614 | 2,860 | 11,053 | 16,142 | 3,992 |
| Other | 9,257 | 8,619 | 9,639 | 12,249 | 11,803 | 12,142 |
| China. | ||||||
| Rice | 11,334 | 12,354 | 10,509 | 11,356 | 12,478 | 10,537 |
| Nuts, edible | 13,415 | 15,180 | 23,352 | 14,459 | 17,450 | 23,988 |
| Tea | 7,250 | 6,043 | 10,751 | 7,295 | 6,638 | 10,981 |
| Hatmakers' materials | 2,316 | 947 | 62 | 5,375 | 8,038 | 7,526 |
| Lace and laces | 12,930 | 4,692 | 4,291 | 12,986 | 4,883 | 4,393 |
| Silk piece-goods | 16,451 | 11,357 | 6,486 | 22,078 | 17,783 | 10,017 |
| Brushmakers' materials | 6,968 | 4,561 | 4,483 | 11,313 | 9,055 | 7,813 |
| Dutch East Indies. | ||||||
| Mineral oils | 343,290 | 545,054 | 460,460 | 343,320 | 571,871 | 475,451 |
| Paraffin-wax | 22,126 | 21,660 | 8,097 | 23,278 | 24,863 | 9,961 |
| Sugar | 598,918 | 327,999 | 317 | 598,918 | 327,999 | 320 |
| Tea | 51,603 | 16,850 | 13,989 | 53,269 | 18,240 | 14,314 |
| Kapok | 69,546 | 82,650 | 74,301 | 70,058 | 83,257 | 75,235 |
| Japan. | ||||||
| Onions | 3,536 | 8,522 | 3,536 | 10,751 | ||
| Apparel and ready-made clothing | 29,370 | 14,519 | 21,157 | 29,513 | 14,632 | 22,101 |
| Haberdashery | 9,389 | 5,542 | 7,732 | 9,610 | 5,774 | 8,140 |
| Hatmakers' materials | 4,729 | 4,495 | 4,127 | 5,668 | 6,402 | 5,964 |
| Textile piece-goods— | ||||||
| Cotton | 105,679 | 75,085 | 168,718 | 107,638 | 80,850 | 172,887 |
| Silk | 254,757 | 253,235 | 301,033 | 257,712 | 269,553 | 311,921 |
| Timber | 50,696 | 48,538 | 66,485 | 51,130 | 54,749 | 71,729 |
| Glass and glassware | 11,069 | 5,078 | 8,178 | 11,221 | 5,434 | 6,776 |
| Fancy goods and toys | 24,601 | 13,032 | 17,719 | 25,032 | 14,089 | 18,999 |
| Philippine Islands. | ||||||
| Hemp | 20,531 | 26,463 | 44,238 | 20,531 | 26,463 | 45,081 |
| Egypt. | ||||||
| Phosphates | 18,138 | 17,328 | 40,168 | 18,138 | 17,328 | 40,168 |
| Madeira. | ||||||
| Drapery | 25 | 69 | 891 | 80 | 4,168 | |
| Brazil. | ||||||
| Nuts, edible | 96 | 377 | 110 | 4,384 | 5,014 | 7,743 |
| Cocoa-beans, uncrushed | 8,768 | 5,923 | 3,602 | 9,301 | 5,923 | 3,694 |
| Chile. | ||||||
| Nitrate of soda | 6,922 | 9,614 | 15,610 | 8,380 | 9,633 | 16,671 |
| Cuba. | ||||||
| Cigars | 4,928 | 6,398 | 9,968 | 5,136 | 6,663 | 10,519 |
| Ecuador. | ||||||
| Cocoa-beans, uncrushed | 2,819 | 2,942 | 4,116 | 5,185 | 3,126 | 4,116 |
| PRINCIPAL IMPORTS | ||||||
|---|---|---|---|---|---|---|
| Article. | Country of Shipment. | Country of Origin. | ||||
| 1923. | 1924. | 1925. | 1923. | 1924. | 1925. | |
| £ | £ | £ | £ | £ | £ | |
| Mexico. | ||||||
| Asphalt | 4,795 | 23,396 | 4 | 4,880 | 23,449 | |
| Sulphur | 4,968 | 3,483 | 6,268 | 4,968 | 3,483 | 6,268 |
| Peru. | ||||||
| Raw sugar | 197,452 | 197,452 | ||||
| United States of America. | ||||||
| Sausage casings | 46,448 | 48,654 | 52,057 | 47,875 | 48,794 | 52,532 |
| Fruits— | ||||||
| Bottled and preserved in syrup | 27,120 | 8,483 | 26,317 | 27,121 | 8,489 | 26,302 |
| Dried— | ||||||
| Apples and apricots | 6,698 | 4,813 | 1,579 | 6,698 | 4,815 | 1,589 |
| Prunes | 28,793 | 24,540 | 23,983 | 28,793 | 24,580 | 23,984 |
| Raisins | 94,218 | 77,655 | 79,478 | 94,220 | 77,709 | 78,881 |
| Fresh— | ||||||
| Lemons | 14,653 | 10,894 | 51 | 14,653 | 10,894 | 51 |
| Oranges | 21,099 | 20,609 | 21,099 | 20,609 | ||
| Sugar | 23,131 | 27,271 | 30,484 | 23,390 | 27,323 | 30,503 |
| Vegetables | 7,0,54 | 7,850 | 6,323 | 7,221 | 7,876 | 6,407 |
| Tobacco | 66,145 | 209,198 | 157,779 | 168,001 | 211,760 | 158,185 |
| Seeds | 27,203 | 32,786 | 26,313 | 26,564 | 24,389 | 21,322 |
| Apparel and ready-made clothing | 102,916 | 75,598 | 87,926 | 110,247 | 78,831 | 90,183 |
| Boots and shoes, and parts thereof | 79,477 | 41,902 | 46,053 | 81,075 | 42,440 | 46,683 |
| Hats and caps | 30,066 | 30,666 | 24,810 | 30,491 | 30,806 | 24,959 |
| Hosiery | 73,571 | 65,692 | 81,185 | 78,348 | 68,913 | 82,969 |
| Carpets, carpeting, and floorcloth | 12,686 | 13,798 | 12,941 | 22,479 | 12,946 | 13,044 |
| Textile piece-goods— | ||||||
| Cotton | 87,418 | 44,914 | 92,515 | 88,840 | 46,390 | 93,399 |
| Leather cloth | 12,837 | 12,617 | 20,299 | 13,127 | 12,843 | 20,408 |
| Silk | 17,439 | 14,129 | 10,110 | 17,762 | 14,826 | 10,633 |
| Sewing silks and cottons | 14,151 | 6,907 | 5,337 | 14,400 | 8,402 | 10,426 |
| Mineral oils— | ||||||
| Benzine | 224,707 | 263,857 | 125,836 | 224,707 | 253,857 | 125,836 |
| Gasolene | 189,604 | 249,489 | 337,303 | 189,604 | 249,489 | 337,303 |
| Kerosene | 202,476 | 193,893 | 158,328 | 202,477 | 194,171 | 158,358 |
| Lubricating oils | 188,361 | 232,091 | 205,392 | 216,452 | 255,623 | 222,296 |
| Motor-spirit n.e.i. | 859,942 | 1,138,914 | 1,423,016 | 859,942 | 1,138,914 | 1438,965 |
| Other | 24,585 | 160,386 | 290,218 | 26,404 | 162,013 | 291,226 |
| Vegetable oils | 46,241 | 40,792 | 39,470 | 48,912 | 41,952 | 39,723 |
| Faints and colours | 34,925 | 33,516 | 36,911 | 35,587 | 33,908 | 37,975 |
| Varnishes, lacquers, and goldsize | 10,647 | 8,793 | 8,422 | 10,710 | 8,968 | 8,454 |
| Hardware and ironmongery | 109,333 | 98,878 | 89,259 | 111,750 | 100,966 | 93,127 |
| Iron and steel tubes, pipes, and fittings | 10,276 | 19,159 | 2,941 | 10,963 | 19,346 | 3,080 |
| Lamps (not electric), lanterns, and lamp-wick | 11,152 | 15,374 | 9,723 | 11,437 | 15,531 | 9,911 |
| Meters | 25,463 | 27,994 | 25,526 | 25,903 | 30,245 | 26,134 |
| Nails | 25,643 | 12,933 | 12,789 | 25,822 | 13,039 | 12,809 |
| Railway and tramway plant | 24,108 | 21,985 | 11,769 | 24,108 | 22,059 | 11,769 |
| Telephones and accessories therefor | 35,903 | 21,326 | 22,689 | 43,827 | 21,890 | 24,378 |
| Tools, implements, &c. | 128,711 | 154,175 | 123,418 | 131,295 | 157,847 | 126,965 |
| Wire | 27,339 | 39,492 | 20,021 | 27,421 | 40,128 | 20,928 |
| Other metal manufactures | 180,392 | 201,383 | 191,599 | 186,996 | 207,390 | 198,232 |
| Agricultural implements, &c. | 57,952 | 75,884 | 77,535 | 58,213 | 76,824 | 77,863 |
| Cash registers | 18,545 | 15,306 | 23,450 | 18,545 | 15,415 | 23,606 |
| Dairying machinery | 11,583 | 7,554 | 5,474 | 11,734 | 7,617 | 5,474 |
| Dredging machinery | 3,804 | 11,138 | 19,455 | 3,804 | 11,159 | 19,455 |
| Electrical machinery | 310,175 | 390,855 | 378,942 | 320,098 | 397,455 | 386,427 |
| Gas and oil engines, including materials for and parts of | 22,208 | 35,814 | 42,307 | 24,509 | 36,501 | 43,343 |
| Mining machinery | 8,236 | 14,801 | 4,464 | 10,461 | 19,303 | 4,541 |
| Printing machinery | 64,244 | 52,544 | 59,095 | 68,199 | 55,783 | 61,269 |
| Sawing-machines | 10,998 | 12,276 | 22,476 | 22,111 | 16,609 | 28,957 |
| Toots—Engineers' and metal- and woodworkers', &c. | 32,653 | 22,425 | 29,349 | 34,507 | 25,802 | 31,104 |
| Typewriters | 28,416 | 30,598 | 32,672 | 34,515 | 33,460 | 35,192 |
| Other classes of machinery and machines | 116,932 | 249,392 | 332,099 | 124,993 | 271,772 | 355,568 |
| Belting, leather and other | 19,400 | 19,050 | 17,964 | 16,432 | 19,433 | 18,402 |
| Leather | 61,473 | 51,250 | 56,099 | 76,834 | 76,220 | 76,619 |
| Timber | 60,211 | 109,390 | 167,780 | 63,032 | 110,101 | 169,541 |
| Wood, cane, and wicker manufactures | 48,189 | 51,762 | 54,184 | 48,135 | 51,942 | 54,958 |
| Asphalt | 29,298 | 74,994 | 54,404 | 29,305 | 76,395 | 54,444 |
| Glass and glassware | 59,743 | 36,331 | 34,626 | 60,518 | 37,252 | 35,176 |
| Cardboard boxes, materials for | 36,244 | 26,411 | 20,836 | 36,696 | 26,539 | 20,947 |
| Books, papers, and music, printed | 42,133 | 46,754 | 43,956 | 46,085 | 50,257 | 48,916 |
| Fancy goods and toys | 32,885 | 28,830 | 30,827 | 33,119 | 29,840 | 31,676 |
| Timepieces | 42,648 | 30,740 | 24,549 | 43,141 | 30,823 | 26,038 |
| Cinematograph, bioscope, and kinetoscope films | 82,097 | 87,372 | 128,975 | 118,821 | 142,272 | 181,121 |
| Optical instruments | 15,188 | 15,677 | 9,635 | 15,915 | 16,421 | 10,620 |
| Photographic materials and goods | 12,487 | 15,716 | 14,360 | 14,211 | 16,659 | 15,978 |
| Surgical and dental instruments | 41,098 | 37,845 | 42,821 | 50,571 | 46,858 | 52,894 |
| PRINCIPAL IMPORTS | ||||||
|---|---|---|---|---|---|---|
| Article. | Country of Shipment. | Country of Origin. | ||||
| 1923. | 1924. | 1925. | 1923. | 1924. | 1925. | |
| £ | £ | £ | £ | £ | £ | |
| United States of America | ||||||
| Cream of tartar | 13,524 | 15,388 | 24,457 | 13,524 | 15,388 | 24,452 |
| Medicinal preparations, drugs, and druggists' sundries | 39,364 | 38,223 | 44,523 | 44,682 | 41,919 | 48,924 |
| Perfumery | 36,085 | 31,376 | 32,544 | 36,768 | 32,959 | 33,313 |
| Sulphur | 25,177 | 33,360 | 58,930 | 25,177 | 33,360 | 58,981 |
| Arms, ammunition, and explosives | 34,002 | 28,152 | 33,814 | 34,068 | 28,583 | 33,882 |
| Musical instruments— | ||||||
| Pianos | 18,548 | 22,540 | 30,662 | 18,837 | 22,674 | 30,772 |
| Other | 43,749 | 50,572 | 55,881 | 50,768 | 53,499 | 58,094 |
| Soap | 19,702 | 10,845 | 12,821 | 19,788 | 11,326 | 13,383 |
| Vehicles— | ||||||
| Bicycles and materials for | 117,688 | 72,348 | 103,900 | 118,396 | 73,103 | 104,178 |
| Motors for road traffic and parts thereof | 1,258,569 | 1,500,557 | 2,040,418 | 1,266,062 | 1,509,194 | 2,056,358 |
| Hawaii. | ||||||
| Fruits, bottled and preserved | 4,447 | 1,557 | 4,807 | 4,447 | 1,557 | 4,807 |
| New Caledonia | ||||||
| Guano | 18,902 | 21,599 | 16,031 | 18,902 | 21,599 | 16,031 |
| New Hebrides. | ||||||
| Cocoa-beans, unfinished | 4,318 | 6,324 | 8,654 | 4,475 | 9,479 | 9,490 |
| Society Islands. | ||||||
| Vanilla-beans | 5,378 | 5,539 | 6,773 | 5,378 | 5,539 | 6,773 |
| Tuamotu Archipelago. | ||||||
| Rock phosphates | 26,412 | 665 | .. | 26,412 | 665 | .. |
A small group of Pacific islands was annexed to the Dominion on the 11th June, 1901, and has since been administered as the “Cook and other Pacific islands.”
Trade with these islands from 1902 onwards has not been included in the export and import totals for the Dominion, but has been shown separately in official publications. The following table shows the growth of the import trade from the group during the last twenty years:—
| Year. | Imports.£ |
|---|---|
| 1906 | 63,477 |
| 1907 | 61,922 |
| 1908 | 67,483 |
| 1909 | 73,469 |
| 1910 | 90,039 |
| 1911 | 92,382 |
| 1912 | 105,943 |
| 1913 | 109,095 |
| 1914 | 94,620 |
| 1915 | 87,890 |
| 1916 | 63,702 |
| 1917 | 72,470 |
| 1918 | 70,374 |
| 1919 | 88,820 |
| 1920 | 105,146 |
| 1921 | 102,113 |
| 1922 | 131,639 |
| 1923 | 125,4 |
| 1924 | 149,676 |
| 1925 | 126,465 |
The principal articles imported for the last five years are as follow:—
| Article. | 1921. | 1922. | 1923. | 1924. | 1925. |
|---|---|---|---|---|---|
| £ | £ | £ | £ | £ | |
| Fruits, fresh— | |||||
| Bananas | 31,037 | 42,328 | 42,154 | 52,584 | 40,687 |
| Oranges | 35,141 | 52,494 | 57,419 | 66,130 | 44,469 |
| Tomatoes, plums, &c. | 15,359 | 12,520 | 8,750 | 9,542 | 21,441 |
| Other | 2,219 | 682 | 504 | 356 | 547 |
| Coconuts | 1,483 | 1,540 | 1,191 | 667 | 406 |
| Potatoes | 1,034 | 707 | 125 | 158 | 8 |
| Coffee, raw | 654 | 25 | 114 | 6 | |
| Copra | 10,512 | 14,912 | 11,950 | 16,469 | 15,334 |
| Hats and caps | 3,911 | 2,486 | 1,288 | 1,395 | 1,400 |
| Cinematograph-films | 3,048 | 925 | 1,256 | 1,078 | |
THE first Customs Ordinance in New Zealand was proclaimed in 1841. This Ordinance, which repealed the New South Wales Ordinance then in force in these Islands, was the first of two long series of enactments dealing with Customs law and the tariff of Customs duties.
The tariff of 1841 covered only a few items, and may be given in full as a type of all the early tariffs. It is noteworthy that, following the old mercantilist policy of colonial administration, preference was given to certain products of the Mother-land. The full schedule of duties was as follows:—
| £ | s. | d. | |
|---|---|---|---|
| Spirits or strong waters, not being the produce of the United Kingdom, of any British possession in America, or of New South Wales, or of Van Diemen's Land, per proof gallon | 0 | 5 | 0 |
| Spirits or strong waters, the produce of the United Kingdom, of any British possession in America, or of New South Wales, or of Van Diemen's Land, per proof gallon | 0 | 4 | 0 |
| Wine, for every hundred pounds' value | 15 | 0 | 0 |
| Tobacco, unmanufactured, per pound | 0 | 0 | 9 |
| Tobacco, manufactured, except cigars and snuff, per pound | 0 | 1 | 0 |
| Cigars and snuff, per pound | 0 | 2 | 0 |
| Tea, sugar, flour, meal, wheat, rice, and other grain and pulse, for every hundred pounds' value | 5 | 0 | 0 |
| On all other goods (except goods the produce and manufacture of the United Kingdom, or of New South Wales, or of Van Diemen's Land), for every hundred pounds' value | 10 | 0 | 0 |
In 1844 alterations were made in the direction of increasing most of the duties, while the preference to British countries was dropped. A very interesting item was the duty of 30 per cent. imposed “on all guns or weapons of any description, or gunpowder, or any munition of war,” evidently imposed to check the growing import of firearms for the Maoris. The rate of duty on all unspecified goods, except personal baggage, living animals, and specie, was 5 per cent.
In 1846 preference was again introduced by the imposition of a duty of 12½ per cent. on all foreign unspecified goods, while similar British goods paid only 10 per cent. At the same time there appears the germ of the later free list, five items—glass bottles, bullion, live animals, books, and seeds and bulbs—being proclaimed free of duty.
The tariff of 1851 was the first elaborate scale of duties, and is noticeable for the liberal use of ad valorem duties, mainly at the rate of 10 per cent., though cottons, woollens, &c., were charged by the yard, calico by the bolt, and trousers by the pair.
The general tariff of 1864 comprised many items, but the duties were levied for revenue primarily; the rates were low, and were mostly specific duties, even drapery being charged, at per cubic foot. Amendments of the tariff, mostly small and affecting only a few items, followed rapidly in 1866, 1867, 1871, 1873; but in 1878 some sweeping changes were made, particularly the reduction on sugar from 1d. per pound to ½d., and similar reductions on many foodstuffs, while tools were also made free of duty. Another Act in 1879 added a few dutiable articles—in this case, however, chargeable with ad valorem duty; and the Act of 1881 was similar. All these changes were revised and consolidated in the Customs Duties Consolidation Act, 1882, which also extended the range of the tariff a good deal. The tariff of 1888 was distinguished by a more liberal use of ad valorem duties, the most usual rate being 20 per cent., as against 10 per cent. in the earliest years, while a primage duty was also levied.
With the year 1895 the tariff took on its distinctive modern form, marked by the preponderance of ad valorem duties and a definitely protective intention. The scope of the tariff was greatly widened so as to enumerate in detail a number of new items, and there were many reductions, principally of the duties on foodstuffs such as dried fruits and cocoa.
The process of subdivision and protection then begun was continued in 1900, when further steps were taken in the direction of a free breakfast-table, and another notable remission was made, the duty on kerosene being abolished.
In 1907 the Customs tariff was completely revised and some important alterations were made. Among articles placed upon the free list were: Sugar, molasses and treacle, currants, raisins, figs, dates, prunes, unground spices, mustard, maizena, cornflour, almonds and nuts (except walnuts), carbonate and bicarbonate of soda, tartaric acid, infants' foods, forfar, dowlas and flax-sheeting, vegetable oils, fencing staples and standards, sheet lead; gas, electricity, and water meters; rubber and pneumatic tires for carriages. Children's boots (Nos. 0–6) and tea in bulk were admitted free if of British manufacture or growth.
Increased rates of ordinary duty were imposed on certain articles, among which were: Flavouring-essences n.o.e., medicinal preparations, drugs and druggists' sundries, candles, paraffin-wax, hosiery, cash-registers, cartridges (shot, 10–24 bore), cartridge-cases, certain sizes of iron and fibre pipes, mouldings and panels.
Tea, the produce of British dominions, if in packages of 6 lb. in weight or over, was admitted free; when put up in packages under 5 lb. there was a duty of 2d. per pound. The duty on tea of foreign growth was 2d. per pound if in packages of 5 lb. or over, and 2/5d. per pound if in packages of a less weight than 5 lb.
The Customs Duties Amendment Act, 1909, imposed a surtax of 1 per cent. on the amount of duty payable on tobacco, cigars, and cigarettes, and of 2 ½ per cent. on the amount of duty payable on all other dutiable goods. This surtax remained in operation until the 31st March, 1911.
In 1916 again changes were made in the rates of duty levied on certain articles, in order to meet the extraordinary expenses of the war. The duty was raised on spirits from 16s. to 17s. per gallon; gas and oil engines were made subject to 10 per cent., plus an additional preferential 10 per cent. if foreign, instead of being free and 20 per cent. preferential as before; electric motors, transformers, and lamps were charged 10 per cent. plus 10 per cent., instead of 10 per cent. plus 5 per cent.; and motor-cars were charged 10 per cent. plus 10 per cent. preferential surtax, whereas before the chassis was free and the body was liable to 20 per cent. duty. On the other hand, the 20 per cent. on bicycles was reduced to 10 per cent.
At the same time a primage duty of 1 per cent. was levied on all goods imported, with the exception of a few small classes of exempted articles. In addition, power was taken to gazette at any time an extra surtax of 50 per cent. on any goods which might be specified, being the produce or manufacture of any country then (October, 1915) at war with His Majesty. Power was also taken to impose an excise duty on aerated waters, cordials, and other beverages, subject to a report by an officer of Customs to be appointed as a Commission to inquire into the advisability of controlling and regulating this manufacture. Increases were made in certain excise duties in 1915, and again in 1917.
In August, 1917, also, as part of the scheme of additional war taxation, further increases were made in the rates of duties to be levied on certain items of import. These increases were somewhat more accentuated in some cases by the Finance Act, 1917, which received the assent of the Governor-General on the 15th September of that year. The rates of duty as thus amended remained in force until the coming into operation of the 1921 tariff revision.
During the earlier months of 1921 a Tariff Revision Committee was set up by the Government for the purpose of taking evidence and revising the then existing tariff, which had been in force with little amendment since 1907. On the Committee's report the Government based a new tariff, including excise duties on beer and tobacco, and this was brought into immediate operation by resolutions of the Legislature on the 3rd November, 1921. The tariff was subsequently included in a Customs Amendment Act passed later in the year.
Briefly, the main objects of the revision were to secure a larger revenue to the Dominion and to give a measure of protection to local industries. In attaining the first-named object the endeavour was to avoid increases in the rates of duty on items that would directly affect the cost of living, and articles in the nature of luxuries were accordingly made subject to the heavier duties. Substantial increases, referred to below, were made in the excise duties on tobacco and beer.
The 1921 tariff was extended in detail to a greater extent than the repealed scale of duties, the number of items being increased from 483 to 566. An outstanding feature was the introduction of an intermediate tariff. Under the old conditions there were two scales—the general tariff on all dutiable goods and the additional preferential duties which were usually added to importations from foreign countries. Now there are three rates of duty—viz., “general,” “intermediate,” and “British preferential.” The general tariff, which applies to foreign goods, is in effect the general duty plus the preferential duty under the repealed legislation, while the British preferential tariff of 1921 corresponds to the general duty under the older scale. A common ad valorem rate of duty under the repealed tariff was—General, 20 per cent.; additional preferential, 10 per cent.: this had the effect of placing a duty of 20 per cent. on British goods and 30 per cent. on foreign. Under the 1921 tariff articles affected are usually dutiable at—General, 35 per cent.; British preferential, 20 per cent.: the effect being to leave the duty of 20 per cent. on British goods as formerly and to increase the rate on foreign importations from 30 per cent. to 35 per cent. The intermediate tariff is intended to apply to countries entering into reciprocal relations with New Zealand, and will allow of the Dominion's goods being accorded preferential treatment in other countries disposed to reciprocate.
A feature of the 1921 Customs legislation is the provision for the imposition of an extra rate of duty on goods from countries with a depreciated rate of exchange. This ranges from 2½ to 20 per cent. ad valorem, according as to whether the depreciation at the date of exportation from the country of origin or intermediate country, as the case may be, is from 10 to 20 per cent. or from 80 to 90 per cent. A further noteworthy feature of the Customs Amendment Act, 1921, is a provision for a special dumping duty which may be imposed by the Minister of Customs on goods imported into New Zealand of a class or kind produced in New Zealand if the selling-price to an importer is less than the current domestic value of the goods and will have a prejudicial effect on an industry established in the Dominion. In such a case the special duty is not to exceed the difference between the actual selling-price and the current domestic value. No such dumping duty will, however, be levied where the imposition is not required in the public interest.
The rates of duty levied by the tariff now in force are divided into two classes, specific and ad valorem. In addition to these, the primage duty of 1 per cent. on the value of all imports (with a few exceptions) is retained. The specific class includes—Spirits, 36s. per gallon, which is double the rate previously in force; perfumed spirits, 70s. per gallon for British goods, and 90s. per gallon for foreign. Cigars, 12s. per pound; cigarettes under 2½ lb. per 1,000, 25s. 6d.; tobacco, fine cut, 10s. per pound; also 2s. per pound on unmanufactured and 4s. 8d. per pound on manufactured tobacco. Wine, sparkling, pays 15s. per gallon; other kinds, 6s. Ale and beer are charged 2s. per gallon. The duty charged on cocoa, chocolate, chicory, and roasted coffee is 3d. per pound British, and 5d. foreign. The ad valorem duties range from 5 to 60 per cent., this latter figure being charged only on apparel made in a foreign country to the order of a resident of New Zealand. Motor vehicles and parts (including tires, which were formerly free) were, by the Customs Amendment Act of 1921, made dutiable under the British preferential tariff at 10 per cent., and under the general tariff at 25 per cent.; in addition, bodies were charged a further £5 to £22 10s. each. By the Customs Amendment Act, 1926, the rates of duty on motor-vehicles were made 10 per cent. under the British preferential tariff, and 35 per cent. under the general tariff, plus additional body duties—viz., 10 and 15 per cent. respectively (on the whole vehicle) for the first £200 of value, and 5 and 7½ per cent. on the remainder of the value. Motor-cycles and other cycles pay 10 and 35 per cent. under the respective tariffs.
Of the items dealt with in the tariff that which most nearly concerns the people as a whole is tea, a commodity which has fluctuated considerably in the tariff scale. Originally 5 per cent. ad valorem, the duty was raised in 1856 to 3d. per pound, two years later to 4d. per pound, and in 1864 to 6d. per pound. This rate remained till 1895, when the duty was reduced to 4d., followed in 1900 by a further reduction to 2d., British tea being in 1903 placed on the free list. In 1907 the charge of 2d. per pound was reimposed in the case of British tea put up in packages under 5 lb., and at the same time an additional preferential duty of 2d. per pound if in packages of 5 lb. or over, and 2/5d. per pound if in packages under 5 lb., was imposed on tea of foreign growth. Under the tariff of 1917 tea paid a general rate of 3d. per pound if in bulk and 5d. per pound if in packages under 5 lb., with an additional preferential duty of 2d per pound for all foreign tea. These rates were virtually retained in the 1921 tariff, which provided for duties of 3d. and 5d. per pound on tea in bulk and in packages under 5 lb. in weight respectively if coming under the British preferential tariff, and a duty of d. and 7d. under the general tariff. In 1923, however, the 3d.-per-pound duty on bulk tea from British countries was abolished, and a reduction of 3d. per pound made in all other cases.
A few further amendments to the Customs tariff were made in 1923, the principal of which was the imposition (from the 17th July, 1923, to the 30th September, 1924) of a duty of 5/16d. per pound on refined sugar of No. 22 colour or over, and on invert sugar and invert syrup, whether of British or of foreign origin. Under the 1921 tariff these items were admitted free if of British origin, but were charged ½d. per pound if of foreign origin. After the 30th September, 1924, they were to be free in all cases, but by the Customs Amendment Act, 1924, a duty of ¼d. per lb. was imposed as from the 1st October, 1924. A reduction of 8d. per pound in the duty on cut and plug tobacco was also made in 1924, becoming effective from the 17th January, 1925.
In 1926 a rate of 2s. per 100 superficial feet was imposed on most of those classes of timbers which had formerly been admitted free, and, as stated above, the duty on motor-car bodies (except in the case of the cheapest cars) was increased, as was also the general (but not the British preferential) rate of duty on motor-vehicles, tires, and parts.
Excise duties are collected on two classes of manufactures—viz., beer and tobacco and its preparations. The more important excise duty is that on been which up to 1915 was charged at the rate of 3d. per gallon. In that year the beer duty was altered so as to increase according to the specific gravity of the worts used, the rate being 3¾d. per gallon when the specific gravity does not exceed 1,047, and increasing by 1/16d. per gallon for every unit of specific gravity up to 1,055, and by ⅛d. thereafter. The specific gravity of distilled water at 60° F. is taken as 1,000, and the specific gravity of the worts is determined in relation thereto. On the 2nd August, 1917, the minimum rate of duty for beer was increased from 3¾d. to 4 d. per gallon, and further (on the 15th September, 1917) to 5¾d., with a maximum of 6d. per gallon. The Finance Act, 1921 (No. 2), repealed the excise duties then in force, and substituted, as from the 4th November, 1921, a rate of 11½d. per gallon where the specific gravity of the worts used does not exceed 1,047, and this is increased by 1/16d. for every unit of specific gravity above 1,047.
The excise duties on tobacco and the preparations thereof are second in importance. Cut tobacco is charged 2s. 4d. per pound; fine-cut tobacco suitable for the manufacture of cigarettes, 6s. 3d. per pound; other kinds, 1s. or 2s. 2d. per pound. These rates replaced (on the 4th November, 1921) the previous excise duty of 1s. per pound on tobacco. Under the Finance Act, 1917, cigars and snuff paid 4s. per pound, and the excise duty on cigarettes made in New Zealand was 5s. 6d. per pound on machine-made and 4s. per pound on hand-made cigarettes. These rates were not increased in 1921. All packages of manufactured tobacco must be labelled before leaving the manufactory, and it is necessary to obtain warrants to use cutting-machines for cutting duty-paid manufactured tobacco for sale (or to be used in the manufacture of cigarettes by hand) and to manufacture cigarettes by hand, under certain conditions.
Excise duties were formerly levied on certain manufactures the preparation of which involved the use of a considerable proportion of spirits. By the Customs Amendment Act, 1921, this practice no longer operates. In lieu of excise duty on the finished manufactured article, a special reduced schedule of duties is provided on alcohol imported for use in warehouses manufacturing these articles. In practice this means that alcohol used in manufacturing processes in New Zealand pays duties at the usual rate, and receives, on proof of use in the preparation of the specified articles, a refund of duty to the reduced rates payable. These rates are as follows: On alcohol used in the manufacture of perfumed spirits, 36s. per gallon; toilet preparations, 30s.; culinary and flavouring essences, 16s.; medicinal preparations containing more than 50 per cent. of proof spirit, 4s. 6d. per gallon; and in similar preparations containing less than 50 per cent. the alcohol used is duty-free.
In 1856 the first Gold Duty Act was passed, empowering the collection of an export duty on gold at the rate of 2s. 6d. per ounce. This rate was amended by various Acts; but in 1890 the Gold Duty Abolition Act was passed, and a system of rating in mining districts was substituted for the export duty as far as the South Island was concerned. The Gold Duty Act, 1908, consolidated and repealed all previous enactments. An export duty was also imposed on timber (white-pine and kauri) by Acts of 1901 and 1903, and still operates. The rate is 3s. per 100 superficial feet for flitches, and 5s. per 100 superficial feet for logs.
In the earlier years of New Zealand's history the revenue derived from Customs and excise duties produced a greater proportion of the revenue from taxation than it does to-day. There has been a constant tendency for this proportion to decrease, and the table given below will show that, even in the last twenty years, this tendency has been very noticeable.
| AMOUNTOF CUSTOMSAND EXCISE REVENUE, EXPRESSEDASA PERCENTAGEOFTHE TOTAL TAXATIONOF NEW ZEALAND. | |||
|---|---|---|---|
| Year ending 31st March. | Total Taxation. | Customs and Excise Duties. | |
| Amount. | Percentage of Total Taxation. | ||
*Figures for these years include taxation paid into Main Highways Account Revenue Fund. (See-letter-press.) | |||
| £ | £ | Per Cent. | |
| 1907 | 4,264,555 | 3,048,622 | 71.49 |
| 1908 | 4,645,754 | 3,217,538 | 69.26 |
| 1909 | 4,377,761 | 2,917,462 | 66.64 |
| 1910 | 4,180,516 | 2,786,490 | 65.63 |
| 1911 | 4,837,322 | 3,145,929 | 65.03 |
| 1912 | 5,296,590 | 3,398,143 | 64.16 |
| 1913 | 5,606,829 | 3,531,761 | 62.99 |
| 1914 | 5,918,034 | 3,553,785 | 60.05 |
| 1915 | 5,880,811 | 3,294,943 | 56.03 |
| 1916 | 7,266,966 | 3,524,063 | 48.49 |
| 1917 | 10,549,654 | 4,037,628 | 38.27 |
| 1918 | 12,340,853 | 3,601,383 | 29.18 |
| 1919 | 13,801,643 | 4,104,016 | 29.74 |
| 1920 | 16,251,769 | 5,185,728 | 31.91 |
| 1921 | 22,184,414 | 8,769,251 | 39.53 |
| 1922 | 16,370,516 | 5,554,334 | 33.93 |
| 1923* | 15,715,380 | 6,765,512 | 43.05 |
| 1924* | 16,540,438 | 7,993,877 | 48.33 |
| 1925* | 16,549,609 | 8,339,576 | 50.39 |
| 1926* | 17,254,688 | 9,202,946 | 53.34 |
To enable a proper comparison to be made with former years, the figures from 1922–23 onwards are inclusive of tire-tax, which is paid into the Main Highways Account Revenue Fund. For 1924–25 and 1925–26 the figures for total taxation are inclusive of receipts from license fees under the Motor-vehicles Act, which are also paid into the Main Highways Account Revenue Fund.
In the foregoing table the financial year has been taken for purposes of comparison with total taxation, figures concerning which are not available for calendar years. In subsequent tables the Customs-taxation figures relate to the calendar year, which is the statistical year for trade purposes. Though the Customs revenue has increased greatly, the table shows that until recently other forms of taxation had increased still faster, so that the proportion of taxation furnished by the Customs duties has decreased considerably over the period. This relative decrease has been due in part to the greater use of direct taxation and to the remissions and reductions of duty which have been made from time to time. These reductions have been mainly in foodstuffs, so that the tariff has tended towards the ideal of a free breakfast-table. War conditions necessitated in 1917 a partial reversal of this principle, whereby non-alcoholic beverages again became the subject of taxation, and the rates of duty then imposed mainly remained unaltered in the 1921 tariff. The 1923 reduction in the case of tea has been already referred to.
The tables on the opposite page show the amounts and percentages collected at intervals of five years, 1891–1911, and in each of the last ten years, in respect of (1) foods and non-alcoholic drinks, (2) clothing and textiles, (3) alcoholic drinks and tobacco, and (4) all other articles. Excise duties on alcoholic liquors, tobacco, &c., are not included, nor are surtax, primage, and depreciated-currency duties for the years during which these have been in force.
| PRINCIPAL CLASSESOF IMPORTSFROMWHICH CUSTOMS REVENUEDEBITED. | |||||
|---|---|---|---|---|---|
| Year | Amount of Duty derived from | Total. | |||
| Foods and Non-alcoholic Drinks. | Clothing and Textiles. | Alcoholic Drinks and Tobacco. | All other Articles. | ||
| £ | £ | £ | £ | £ | |
| 1891 | 312,809 | 276,072 | 651,680 | 320,141 | 1,560,702 |
| 1896 | 329,622 | 322,947 | 715,019 | 400,264 | 1,767,852 |
| 1901 | 321,625 | 434,112 | 928,176 | 512,853 | 2,196,766 |
| 1906 | 369,964 | 610,873 | 1,130,837 | 787,429 | 2,899,103 |
| 1911 | 147,456 | 682,710 | 1,286,601 | 1,048,890 | 3,165,657 |
| 1916 | 170,009 | 985,335 | 1,390,322 | 1,036,227 | 3,581,893 |
| 1917 | 174,430 | 794,443 | 1,397,267 | 805,400 | 3,171,540 |
| 1918 | 278,939 | 935,203 | 1,342,443 | 801,953 | 3,358,538 |
| 1919 | 248,762 | 1,097,463 | 1,629,680 | 1,245,157 | 4,221,062 |
| 1920 | 438,740 | 2,432,704 | 2,084,196 | 2,424,045 | 7,379,685 |
| 1921 | 237,878 | 1,297,121 | 1,930,898 | 1,826,357 | 5,292,254 |
| 1922 | 287,276 | 1,354,718 | 1,857,586 | 1,624,380 | 5,123,960 |
| 1923 | 250,906 | 1,840,273 | 2,368,042 | 2,402,869 | 6,862,090 |
| 1924 | 291,781 | 1,655,180 | 2,485,227 | 2,608,310 | 7,040,498 |
| 1925 | 287,226 | 1,804,812 | 2,683,909 | 3,025,472 | 7,801,419 |
| PERCENTAGEOFEACH CLASSTOTHE TOTAL DUTYCOLLECTED. | ||||
|---|---|---|---|---|
| Year. | Percentage of Total Duty collected on | |||
| Foods and Non-alcoholic Drinks. | Clothing and Textiles. | Alcoholic Drinks and Tobacco. | All other Articles. | |
| Per Cent. | Per Cent. | Per Cent. | Per Cent. | |
| 3891 | 20.05 | 17.69 | 41.75 | 20.51 |
| 1896 | 18.64 | 18.27 | 40.45 | 22.64 |
| 1901 | 14.64 | 19.76 | 42.25 | 23.35 |
| 1906 | 12.76 | 21.07 | 39.01 | 27.16 |
| 1911 | 4.66 | 21.57 | 40.64 | 33.13 |
| 1916 | 4.75 | 27.51 | 38.81 | 28.93 |
| 1917 | 5.50 | 25.05 | 44.06 | 25.39 |
| 1918 | 8.31 | 27.84 | 39.97 | 23.88 |
| 1919 | 5.89 | 26.00 | 38.61 | 29.50 |
| 1920 | 5.95 | 32.96 | 28.24 | 32.85 |
| 1921 | 4.49 | 24.51 | 36.49 | 34.51 |
| 1922 | 5.60 | 26.44 | 36.26 | 31.70 |
| 1923 | 3.65 | 26.82 | 34.51 | 35.02 |
| 1924 | 4.14 | 23.51 | 35.30 | 37.05 |
| 1925 | 3.68 | 23.14 | 34.40 | 38.78 |
The Customs and excise duties received during the last five years are shown in more detail in the table given below, which also shows the rate of revenue per head of mean population for each year considered.
| CUSTOMSAND EXCISE REVENUE, 1921–25. | |||||
|---|---|---|---|---|---|
| — | 1921. | 1922. | 1923. | 1924. | 1925. |
| £ | £ | £ | £ | £ | |
| Customs Duties. | |||||
| Spirits | 914,596 | 646,556 | 1,073,826 | 1,102,255 | 1,226,708 |
| Wine | 56,023 | 23,651 | 38,436 | 48,935 | 56,882 |
| Ale, beer, &c. | 3,785 | 1,936 | 4,008 | 5,054 | 5,820 |
| Cigars, cigarettes, and snuff | 461,148 | 466,356 | 519,770 | 586,686 | 670,484 |
| Tobacco | 493,039 | 714,974 | 726,615 | 709,928 | 708,913 |
| Coffee, cocoa, &c. | 3,300 | 7,755 | 7,291 | 8,315 | 9,693 |
| Tea | 107,135 | 121,406 | 53,758 | 4,543 | 3,867 |
| Other goods by weight | 161,000 | 156,904 | 169,363 | 231,136 | 223,399 |
| Other goods ad valorem | 2,944,066 | 2,826,931 | 3,892,992 | 3,962,186 | 4,486,227 |
| Other duties | 148,162 | 133,105 | 278,915 | 348,619 | 409,426 |
| Primage | 372,684 | 307,442 | 410,685 | 440,449 | 482,973 |
| Depreciated-currency duty | 6,777 | 24,386 | 11,402 | 13,447 | 2,896 |
| Totals, Customs duties | 5,671,715 | 5,431,402 | 7,187,061 | 7,461,553 | 8,287,288 |
| CUSTOMSAND EXCISE REVENUE, 1921–25 | |||||
|---|---|---|---|---|---|
| – | 1921. | 1922. | 1923. | 1924. | 1925. |
| £ | £ | £ | £ | £ | |
* Minus quantity. | |||||
| Excise Duties. | |||||
| Tinctures—New Zealand | 14,581 | -17* | 19,394 | 21,552 | |
| Cigars, cigarettes, and snuff—New-Zealand-manufactured | 41,308 | 66,508 | 76,931 | 76,640 | 77,293 |
| Tobacco—New-Zealand-manufactured | 1,355 | 8,802 | 8,783 | 11,534 | 18,161 |
| Beer—New Zealand | 393,953 | 604,612 | 626,020 | 651,201 | 634,513 |
| Totals, excise duties | 451,197 | 679,905 | 711,734 | 758,769 | 751,519 |
| £ s. d | £ s. d | £ s. d. | £ s. d. | £ s. d. | |
| Revenue from Customs duties per head of mean population | 4 8 10 | 4 3 2 | 5 8 3 | 5 10 4 | 5 19 9 |
| Revenue from excise duties per head of mean population | 0 7 1 | 0 10 5 | 0 10 8 | 0 11 2 | 0 10 10 |
The following table furnishes a general view of the ratio of Customs revenue to imports since 1895, which is taken as the base year:—
| CUSTOMS REVENUECOMPAREDWITH IMPORT VALUES, 1895–1925. | |||||||||||||
|---|---|---|---|---|---|---|---|---|---|---|---|---|---|
| Year. | Imports. | Revenue. | Percentage of Revenue on Total Imports. | Index Numbers of Customs Revenue compared with Imports. | |||||||||
| Value. | Value per Head. | Amount. | Actual Value per Head. | Value per Head at 1895 Ratio. | |||||||||
| £ | £ | s. | d. | £ | £ | s. | d. | £ | s. | d. | Per Cent. | ||
| 1895 | 6,400,129 | 8 | 14 | 3 | 1,619,970 | 2 | 4 | 1 | 2 | 4 | 1 | 25.31 | 1000 |
| 1896 | 7,137,320 | 9 | 11 | 4 | 1,765,073 | 2 | 7 | 4 | 2 | 8 | 5 | 24.73 | 977 |
| 1897 | 8,055,223 | 10 | 11 | 6 | 1,912,161 | 2 | 10 | 2 | 2 | 13 | 5 | 23.74 | 938 |
| 1898 | 8,230,600 | 10 | 12 | 1 | 1,961,726 | 2 | 10 | 6 | 2 | 13 | 7 | 23.83 | 942 |
| 1899 | 8,739,633 | 11 | 13 | 0 | 2,042,002 | 2 | 11 | 8 | 2 | 15 | 11 | 23.36 | 923 |
| 1900 | 10,646,096 | 13 | 5 | 4 | 2,170,354 | 2 | 14 | 1 | 3 | 7 | 1 | 20.39 | 805 |
| 1901 | 11,817,915 | 14 | 7 | 10 | 2,191,798 | 2 | 13 | 4 | 3 | 12 | 9 | 18.55 | 733 |
| 1902 | 11,326,723 | 13 | 9 | 4 | 2,285,043 | 2 | 14 | 4 | 3 | 8 | 2 | 20.17 | 797 |
| 1903 | 12,788,675 | 14 | 16 | 3 | 2,501,896 | 2 | 17 | 11 | 3 | 14 | 11 | 19.56 | 773 |
| 1904 | 13,291,694 | 14 | 19 | 3 | 2,650,189 | 2 | 19 | 8 | 3 | 15 | 8 | 19.94 | 788 |
| 1905 | 12,828,857 | 14 | 0 | 11 | 2,652,666 | 2 | 18 | 1 | 3 | 10 | 8 | 20.68 | 817 |
| 1906 | 15,211,403 | 16 | 2 | 5 | 2,899,103 | 3 | 1 | 5 | 4 | 1 | 6 | 19.06 | 753 |
| 1907 | 17,302,861 | 17 | 17 | 11 | 3,079,422 | 3 | 3 | 8 | 4 | 10 | 6 | 17.80 | 703 |
| 1908 | 17,471,284 | 17 | 11 | 11 | 2,903,086 | 2 | 18 | 4 | 4 | 8 | 10 | 16.62 | 656 |
| 1909 | 15,674,719 | 15 | 7 | 6 | 2,653,617 | 2 | 12 | 0 | 3 | 17 | 8 | 16.93 | 669 |
| 1910 | 17,051,583 | 16 | 7 | 9 | 2,954,989 | 2 | 16 | 9 | 4 | 2 | 10 | 17.33 | 685 |
| 1911 | 19,545,879 | 18 | 7 | 5 | 3,165,657 | 2 | 19 | 6 | 4 | 12 | 11 | 16.20 | 640 |
| 1912 | 20,976,574 | 19 | 5 | 3 | 3,335,719 | 3 | 1 | 3 | 4 | 17 | 5 | 15.90 | 628 |
| 1913 | 22,288,302 | 19 | 18 | 6 | 3,425,426 | 3 | 1 | 3 | 5 | 0 | 10 | 15.37 | 607 |
| 1914 | 21,856,096 | 19 | 3 | 4 | 3,354,616 | 2 | 18 | 10 | 4 | 17 | 0 | 15.35 | 606 |
| 1915 | 21,728,834 | 18 | 13 | 1 | 3,190,883 | 2 | 15 | 6 | 4 | 15 | 7 | 14.68 | 580 |
| 1916 | 26,339,283 | 22 | 18 | 4 | 3,823,011 | 3 | 6 | 6 | 5 | 17 | 4 | 14.51 | 573 |
| 1917 | 20,919,265 | 18 | 4 | 2 | 3,368,403 | 2 | 18 | 7 | 4 | 12 | 1 | 16.10 | 636 |
| 1918 | 24,234,007 | 21 | 0 | 5 | 3,586,164 | 3 | 2 | 2 | 5 | 6 | 4 | 14.79 | 584 |
| 1919 | 30,671,698 | 25 | 14 | 4 | 4,502,354 | 3 | 15 | 5 | 6 | 15 | 9 | 14.06 | 556 |
| 1920 | 61,595,828 | 49 | 11 | 6 | 7,953,477 | 6 | 9 | 7 | 12 | 14 | 0 | 12.91 | 510 |
| 1921 | 42,942,443 | 33 | 12 | 8 | 5,671,715 | 4 | 8 | 10 | 8 | 9 | 0 | 13.28 | 522 |
| 1922 | 35,012,561 | 26 | 16 | 6 | 5,431,402 | 4 | 3 | 2 | 6 | 15 | 8 | 15.51 | 613 |
| 1923 | 43,378,493 | 32 | 13 | 2 | 7,187,061 | 5 | 11 | 7 | 18 | 9 | 16.56 | 654 | |
| 1924 | 48,527,603 | 35 | 17 | 6 | 7,461,553 | 5 | 10 | 4 | 9 | 1 | 11 | 15.38 | 608 |
| 1925 | 52,456,407 | 37 | 17 | 10 | 8,287,288 | 5 | 19 | 9 | 9 | 11 | 9 | 15.80 | 624 |
With regard to the foregoing table, it may be explained that the figures given in the column “Value per head at 1895 ratio” indicate the amount of revenue per head of population which would have been obtained had the same high ratio of Customs taxation been levied as prevailed in 1895. The last two columns in the table show clearly the substantial decline in the proportion which the Customs revenue bears to the value of the imports, and demonstrate that the increase over the period, both total and per capita, in the Customs revenue is not due to heavier imposts, but has actually been achieved in spite of very considerable reductions in the scale of duties. In 1895 the proportion of revenue to the total imports was one-fourth; in 1925 it was less than one-sixth.
In the following table the Customs revenue collected in 1925 over each class of the statistical classification is given, together with the percentage of revenue to imports in each case:—
| CUSTOMS REVENUEBY CLASSESOF IMPORTS, 1925. | ||||
|---|---|---|---|---|
| Class. | Articles. | Total Imports. | Customs Duty collected. | Percentage of Customs Duty to Imports. |
| £ | £ | |||
| I | Foodstuffs of animal origin (excluding live animals) | 337,415 | 59,177 | 17.50 |
| II | Foodstuffs of vegetable origin, and common salt | 4,247,351 | 210,474 | 4.90 |
| III | Beverages (non-alcoholic) and substances used in making up the same | 1,084,957 | 17,575 | 1.60 |
| IV | Spirits and alcoholic liquors | 1,094,029 | 1,304,512 | 119.20 |
| V | Tobacco and preparations thereof | 1,792,063 | 1,379,397 | 76.90 |
| VI | Live animals | 49,571 | 8 | |
| VII | Animal substances (mainly unmanufactured), not being foodstuffs | 37,740 | 1,523 | 4.00 |
| VIII | Vegetable substances and non-manufactured fibres | 606,206 | 24,889 | 4.10 |
| IXA | Apparel | 4,850,328 | 1,178,420 | 24.30 |
| IXB | Textiles | 6,239,084 | 626,392 | 10.40 |
| IXC | Manufactured fibres | 737,474 | 14,596 | 2.00 |
| X | Oils, fats, and waxes | 3,450,337 | 88,462 | 2.60 |
| XI | Paints and varnishes | 419,525 | 50,270 | 12.00 |
| XII | Stones and minerals used industrially | 736,156 | 4,535 | 060 |
| XIII | Specie | 30,650 | ||
| XIVA | Metal, unmanufactured, partially manufactured, and ores | 610,248 | 722 | 0.10 |
| XIVB | Metal manufactures, other than machines and machinery | 5,602,823 | 388,955 | 6.90 |
| XV | Machines and machinery | 4,524,485 | 261,397 | 5.80 |
| XVIA | Indiarubber and manufactures thereof (not including tires) | 95,050 | 1,601 | 1.70 |
| XVIB | Leather and manufactures thereof (including substitutes) | 543,601 | 50,588 | 9.30 |
| XVIIA | Timber | 1,195,350 | 34,673 | 2.90 |
| XVIIB | Wood, cane, and wicker manufactures | 258,179 | 50,994 | 19.75 |
| XVIII | Earthenware, china, glass, stoneware, cements, and cement materials | 1,018,261 | 135,584 | 13.30 |
| XIXA | Paper | 1,084,875 | 22,766 | 2.10 |
| XIXB | Stationery | 990,106 | 97,126 | 0.90 |
| XX | Jewellery, timepieces, and fancy goods | 891,050 | 200,769 | 22.60 |
| XXI | Optical, surgical, and scientific instruments | 519,288 | 35,095 | 6.80 |
| XXIIA | Drugs, chemicals, and de' wares | 1,165,017 | 125,851 | 10.80 |
| XXIIB | Manures | 430,618 | ||
| XXIII | Miscellaneous | 7,814,570 | 1,435,068 | 18.40 |
| Primage and depreciated-currency duties | 485,869 | |||
| Totals | 52,456,407 | 8,287,288 | 15.80 | |
A little more than one-sixth of the Customs revenue (exclusive of primage and depreciated-currency duties), collected during 1925 was derived from tobacco, which next to the miscellaneous group, furnished the largest amount of duty during that year. Tobacco was the chief source of revenue during the period 1918 to 1924, with the exception of the years 1920 and 1921. Up to 1917, however, and also in 1921, spirits and alcoholic liquors proved the most productive class. These two classes together provided a little more than one-third of the total revenue in 1925. Apparel, which is also an important source of revenue, was responsible for the greatest amount in 1920.
The next table gives the imports of free and dutiable goods arranged according to the statistical classification. The main features of the table are the overwhelming proportion of dutiable goods in the classes covering beverages (both alcoholic and non-alcoholic), tobacco, foodstuffs of animal origin, paints and varnishes, and apparel, and the high proportion of free goods in stones and minerals (mainly coal), specie. raw metals, paper, oils, fats, and waxes, and manures.
| FREEAND DUTIABLE IMPORTSBY CLASSES, 1925. | ||||||
|---|---|---|---|---|---|---|
| No. | Class. | Value of Imports. | Percentage of Total. | |||
| Free. | Dutiable. | Total. | Free. | Dutiable. | ||
| £ | £ | £ | ||||
| I | Foodstuffs of animal origin (excluding live animals) | 13,934 | 323,481 | 337,415 | 4.13 | 95.87 |
| II | Foodstuffs of vegetable origin, and common salt | 3,182,209 | 1,065,142 | 4,247,351 | 74.92 | 25.08 |
| III | Beverages (non-alcoholic) and substances used in making the same | 978,357 | 106,600 | 1,084,957 | 90.17 | 9.83 |
| IV | Spirits and alcoholic liquors | 745 | 1,093,284 | 1,094,029 | 0.07 | 99.93 |
| V | Tobacco and preparations thereof | 2,845 | 1,789,218 | 1,792,063 | 0.16 | 99.84 |
| VI | Live animals | 32,291 | 17,280 | 49,571 | 65.14 | 34.86 |
| VII | Animal substances (mainly unmanufactured), not being foodstuffs | 30,822 | 6,918 | 37,740 | 81.67 | 18.33 |
| VIII | Vegetable substances and non-manufactured fibres | 487,029 | 119,177 | 606,206 | 80.34 | 19.66 |
| IXA | Apparel | 504,157 | 4,346,171 | 4,850,328 | 10.60 | 89.40 |
| IXB | Textiles | 2,773,330 | 3,465,754 | 6,239,084 | 44.45 | 55.55 |
| IXC | Manufactured fibres | 665,064 | 72,410 | 737,474 | 90.18 | 9.82 |
| X | Oils, fats, and waxes | 3,073,100 | 377,237 | 3,450,337 | 89.07 | 10.93 |
| XI | Paints and varnishes | 73,059 | 346,466 | 419,525 | 17.41 | 82.59 |
| XII | Stones and minerals used industrially | 717,404 | 18,752 | 736,156 | 97.45 | 2.55 |
| XIII | Specie | 30,650 | 30,650 | 100.00 | ||
| XIVA | Metal, unmanufactured, partially manufactured, and ores | 606,344 | 3,904 | 610,248 | 99.36 | 0.64 |
| XIVB | Metal manufactures other than machinery and machines | 3,550,929 | 2,051,894 | 5,602,823 | 63.38 | 36.62 |
| XV | Machinery and machines | 2,853,504 | 1,670,981 | 4,524,485 | 63.07 | 36.93 |
| XVIA | Indiarubber and manufactures thereof (not including tires) | 84,312 | 10,738 | 95,050 | 88.70 | 11.30 |
| XVIB | Leather and manufactures thereof (including substitutes) | 240,178 | 303,423 | 543,601 | 44.18 | 55.82 |
| XVIIA | Timber | 908,306 | 287,044 | 1,195,350 | 75.99 | 24.01 |
| XVIIB | Wood, cane, and wicker manufactures | 58,961 | 199,218 | 258,179 | 22.84 | 77.16 |
| XVIII | Earthenware, china, glass, stoneware, cements, and cement materials | 379,996 | 638,265 | 1,018,261 | 37.32 | 62.68 |
| XIXA | Paper | 974,828 | 110,047 | 1,084,875 | 89.86 | 10.14 |
| XIXB | Stationery | 588,586 | 401,520 | 990,106 | 59.45 | 40.55 |
| XX | Jewellery, timepieces, and fancy goods | 85,008 | 806,042 | 891,050 | 9.54 | 90.46 |
| XXI | Optical, surgical, and scientific instruments | 227,940 | 291,348 | 519,288 | 43.90 | 56.10 |
| XXIIA | Drugs, chemicals, and druggists' wares | 634,208 | 530,809 | 1,165,017 | 54.44 | 45.56 |
| XXIIB | Manures | 430,618 | 430,618 | |||
| XXIII | Miscellaneous | 676,661 | 7,137,909 | 7,814,570 | 8.66 | 91.34 |
| Totals | 24,865,375 | 27,591,032 | 52,456,407 | 47.40 | 52.60 | |
On the average slightly less than half the imports into New Zealand are duty-free, while the value of goods which are liable to specific duties is about one-eighth. The most usual ad valorem rate during the period covered by the following table has been 20 per cent., followed by 25 per cent. and 10 per cent. Imports at the 30-per-cent. rate, which formerly occupied third position, have sunk to insignificant proportions under the 1921 tariff, while an entirely new rate, 35 per cent., has come into prominence.
| IMPORTSCLASSIFIEDACCORDINGTO RATEOF DUTY, 1921–25. | |||||
|---|---|---|---|---|---|
| Nature of Duty. | 1921. | 1922. | 1923 | 1924. | 1925. |
* Minus quantity. | |||||
| £ | £ £ | £ | £ | £ | |
| Free (excluding specie) | 23,901,684 | 17,181,779 | 19,585,541 | 22,964,917 | 24,834,725 |
| Specific duties | 5,393,749 | 4,397,812 | 5,421,688 | 6,081,249 | 5,449,115 |
| Ad valorem duties— | |||||
| 5 per cent. | 228,841 | 5,862 | 6,364 | 7,218 | 1,600 |
| 10 ,, | 1,245,999 | 1,502,501 | 3,541,482 | 4,863,506 | 5,673,621 |
| 141½0 ,, | 43 | 174 | |||
| 15 ,, | 311,761 | 1,437,818 | 927,219 | 1,001,331 | 1,067,313 |
| 19 2/5 ,, | 108 | 2,776 | 464 | 661 | |
| 20 ,, | 7,251,414 | 4,707,786 | 5,912,756 | 5,818,215 | 6,251,196 |
| 22 ½ ,, | 93,054 | ||||
| 24 ,, | 17,808 | ||||
| 24 ¼ ,, | 465 | 1,016 | 946 | 2,525 | |
| 24 ½ ,, | 483 | ||||
| 25 ,, | 2,491,517 | 3,691,131 | 5,838,540 | 5,570,828 | 6,671,379 |
| 30 ,, | 1,701,332 | 88,040 | 111,778 | 161,691 | 126,252 |
| 33 ,, | 115 | ||||
| 33 ¾ ,, | 6,844 | ||||
| 35 ,, | 1,115,020 | 1,320,270 | 1,438,125 | 1,559,375 | |
| 37 ½ ,, | 403,019 | ||||
| 40 ,, | 3,191 | 574,674 | 530,150 | 482,934 | 631,808 |
| 45 ,, | 121,121 | 161,680 | 132,276 | 152,563 | |
| 50 ,, | 1,860 | 2,670 | 3,404 | 3,422 | |
| 60 ,, | 99 | -18* | 10 | 16 | 28 |
| Totals, ad valorem | 13,754,879 | 13,246,483 | 18,356,754 | 19,481,437 | 22,141,917 |
| Specie | 198,321 | 186,487 | 14,510 | 30,650 | |
| Grand totals of imports | 42,942,443 | 35,012,561 | 43,378,493 | 48,527,603 | 52,456,407 |
In 1921 and previous years the value of boots imported was included under both specific and ad valorem duties. Imports of boots in 1921 were valued at £306,190, and the sum of the items in the 1921 column in the above table will be found to exceed the total by this amount.
The table following shows for the years immediately preceding and following the general tariff revisions of 1895 and 1907, and for 1925, the value of free and dutiable imports of merchandise, the percentage admitted free of duty, and the duty per cent. on dutiable imports and on all merchandise imported:—
| — | 1894. | 1896. | 1906. | 1908. | 1925. |
|---|---|---|---|---|---|
| £ | £ | £ | £ | £ | |
* Including excise duties levied on certain imports manufactured in bond. | |||||
| Merchandise— | |||||
| Free | 1,871,772 | 2,263,091 | 5,476,949 | 8,658,111 | 24,834,725 |
| Dutiable | 4,118,405 | 4,772,288 | 8,826,221 | 8,589,051 | 27,591,032 |
| Imports (less specie) | 5,990,177 | 7,035,379 | 14,303,170 | 17,247,162 | 52,425,757 |
| Percentage of free merchandise | Per Cent. 31.25 | Per Cent. 32.17 | Per Cent. 38.29 | Per Cent. 50.20 | Per Cent. 47.37 |
| Total net duty received* | 1,572,467 | 1,767,852 | 2,903,131 | 2,907,151 | 8,308,840 |
| Duty per cent. of imports— | Per Cent. | Per Cent. | Per Cent. | Per Cent. | Per Cent. |
| (a.) On dutiable imports | 38.18 | 37.04 | 32.89 | 33.85 | 30.11 |
| (b.) On all merchandise | 26.25 | 25.13 | 20.30 | 16.86 | 15.85 |
It is seen that the percentage of merchandise imported free of duty in 1925 was 47, as compared with a percentage of 50 in the year after the tariff revision of 1907. The average rate of duty levied, whether taken as a percentage of all imports or of dutiable goods only, was less in 1925 than in any of the other years shown.
Preference to British countries in respect of certain commodities was provided for in the earliest tariff in force in New Zealand—that introduced in 1841. The amended tariff of 1844 involved the dropping of this preference to British goods, but two years later preference was again introduced.
The first definite attempt at reciprocity was made in 1870, when the Colonial Reciprocity Act gave power to the Government to make reciprocal agreements with the Australian States, including Tasmania; but this Act failed to receive the Royal assent and consequently lapsed.
In 1895, however, the Customs Duties Reciprocity Act received the Royal assent, and ratified an agreement which had been tentatively proposed with South Australia, besides giving power to the Government to make further agreements with the other Australian States. In 1907 the New Zealand and South African Customs Treaty was negotiated. A tariff agreement with the Australian Commonwealth has been in operation since the 1st September, 1922, and is referred to more particularly below.
Imperial preference proper was introduced in New Zealand by the Preferential and Reciprocal Trade Act, 1903, which followed the lead given by Canada. At first only a few items were covered by the extra duties levied upon goods of foreign origin, but the Tariff Act of 1907 extended this additional preferential duty to a great number of items.
By regulations dated the 4th December, 1922, the following are stated to be the classes of goods which shall be deemed for the purposes of the Customs Amendment Act, 1921, to be the produce or manufacture of countries the produce or manufactures of which are entitled to be entered for duty under the British preferential tariff:—
Goods wholly the produce of such countries:
Goods wholly manufactured within such countries from materials produced in such countries:
Goods wholly manufactured within such countries in which all manufacturing processes are performed in such countries from manufactured raw material not produced in such countries:
Goods partially produced or partially manufactured in such countries, provided that the final process or processes of manufacture have been performed in such countries, and also that the expenditure in material produced in such countries and (or) labour performed within such countries in each and every article is not less than one-fourth (now one-half) of the factory or works cost of such article in its finished state.
An important alteration in respect to class (d) came into force from the 1st April, 1926, after which date a minimum of one-half (instead of the former minimum of one-fourth) of the expenditure must have been within a British country.
In the calculation of the proportion of produce or labour none of the following items shall be included or considered:—
Manufacturer's profit, or the profit or remuneration of any trader, agent, broker, or other person dealing in the article in its finished condition;
Royalties;
The cost of outside packages or any cost of packing the goods thereinto;
Any cost of conveying, insuring, or shipping the goods subsequent to their manufacture.
The following table shows the extent of the imports which are affected by preference, by giving the percentage of the total imports and of foreign imports so affected. It will be seen that the proportions have increased generally after the tariff changes of 1907, 1917, and 1921.
| IMPORTSAFFECTEDBY PREFERENTIAL SURTAX. | ||||||
|---|---|---|---|---|---|---|
| Year. | Value of Imports. | Imports on which Surtax was paid. | Percentage of | |||
| Total. | British Empire. | Foreign Countries. | Total Imports. | Foreign Imports. | ||
| £ | £ | £ | £ | Per Cent. | Per Cent. | |
| 1906 | 15,211,403 | 12,890,016 | 2,321,387 | 620,600 | 4.08 | 26.73 |
| 1907 | 17,302,861 | 14,942,183 | 2,360,678 | 658,027 | 3.98 | 27.87 |
| 1908 | 17,471,284 | 14,780,276 | 2,691,008 | 895,007 | 5.12 | 33.26 |
| 1909 | 15,674,719 | 13,554,962 | 2,119,757 | 842,407 | 5.37 | 39.74 |
| 1910 | 17,051,583 | 14,465,824 | 2,585,759 | 1,000,267 | 5.87 | 38.68 |
| 1911 | 19,545,879 | 16,497,340 | 3,048,539 | 1,159,342 | 5.93 | 38.03 |
| 1912 | 20,976,574 | 17,073,272 | 3,903,302 | 1,337,182 | 6.37 | 34.26 |
| 1913 | 22,288,302 | 18,348,249 | 3,940,053 | 1,325,057 | 5.95 | 33.63 |
| 1914 | 21,856,096 | 17,649,784 | 4,206,312 | 1,228,207 | 5.62 | 29.20 |
| 1915 | 21,728,834 | 17,727,137 | 4,001,697 | 1,321,853 | 6.08 | 33.03 |
| 1916 | 26,339,283 | 20,833,461 | 5,505,822 | 2,071,175 | 7.86 | 37.62 |
| 1917 | 20,919,265 | 15,591,308 | 5,327,957 | 2,251,428 | 10.77 | 42.26 |
| 1918 | 24,234,007 | 16,017,554 | 8,216,453 | 3,457,004 | 14.27 | 42.07 |
| 1919 | 30,671,698 | 19,519,619 | 11,152,079 | 4,794,249 | 15.63 | 42.99 |
| 1920 | 61,595,828 | 43,861,299 | 17,734,529 | 7,610,756 | 12.35 | 42.91 |
| 1921 | 42,942,443 | 31,160,299 | 11,782,144 | 4,122,296 | 9.59 | 34.99 |
| 1922 | 35,012,561 | 26,005,352 | 9,007,209 | 4,902,508 | 14.00 | 54.42 |
| 1923 | 43,378,493 | 31,866,993 | 11,511,500 | 6,465,171 | 14.90 | 56.16 |
| 1924 | 48,527,603 | 35,830,909 | 12,696,694 | 6,766,358 | 13.94 | 53.29 |
| 1925 | 52,456,407 | 38,262,276 | 14,194,131 | 8,118,838 | 15.47 | 57.21 |
The system of recording imports was changed in 1914, and for that and subsequent years statistics are available of the countries of origin as well as the countries of shipment. In the table above, the imports credited to any country prior to 1914 were those shipped to New Zealand from that country, but for 1914 and later years the figures relate to country of origin.
For the purpose of studying better the scope and effect of the preferential surtax, imports for the last three years have been classified in the next table into four groups, viz.:—
Goods duty-free, whether of British or of foreign origin:
Goods duty-free if of British origin, but dutiable if of foreign origin:
Goods dutiable and with same rates of duty whether of British or of foreign origin:
Goods dutiable but with additional preferential duty when of foreign origin.
| IMPORTSOF GOODSOF BRITISHOR FOREIGN ORIGIN, CLASSIFIEDACCORDINGTOTHE NATUREOF DOTYPAYABLE, 1923–1925. | ||||||
|---|---|---|---|---|---|---|
| – | 1923. | 1924. | 1925. | |||
| British. | Foreign. | British. | Foreign. | British. | Foreign. | |
| £ | £ | £ | £ | £ | £ | |
| Free in any case | 6,021,104 | 4,465,008 | 7,754,667 | 5,170,383 | 8,112,835 | 5,270,386 |
| Free when of British origin, but dutiable when of foreign origin | 9,113,939 | 1,652,012 | 10,039,867 | 1,796,228 | 11,482,154 | 2,055,542 |
| Dutiable with same rates whether of British or foreign origin | 2,465,168 | 581,032 | 2,639,540 | 759,938 | 2,942,657 | 804,907 |
| Dutiable with a higher rate of duty when of foreign origin | 14,266,782 | 4,813,448 | 15,396,850 | 4,970,130 | 15,724,630 | 6,063,296 |
| Totals | 31,866,993 | 11,511,500 | 35,830,924 | 12,696,679 | 38,262,276 | 14,194,131 |
It is of interest to study the effect of the increased preference granted under the 1921 tariff to goods of British origin, and in particular the extent to which goods formerly admitted free, irrespective of origin, are now admitted free only when of British origin. Thus, taking the year 1925, it is found that of foreign goods imported 37 per cent. were free of duty, as compared with 58 per cent. in 1921, while a further 6 per cent. (7 per cent. in 1921), although dutiable, paid no higher rate than if they had been of British origin. This leaves 57 per cent. (35 per cent. in 1921) with the disadvantage of the higher rate of duty applicable to foreign goods.
The percentage of all goods admitted free of duty, however, does not vary to any great extent. In 1924, and again in 1925, 47 per cent. of the total imports were free of duty, as compared with 45 per cent. in 1923 and 49 per cent. in 1920 and 1922.
As stated above, there was inaugurated in 1907 a reciprocal arrangement with British South Africa whereby products of that country, when imported direct, were admitted into New Zealand at reduced rates of duty, in return for similar concessions granted by South Africa in respect of New Zealand products. This agreement was terminated on the 1st August, 1922, but by a subsequent Order in Council gazetted on the 18th November, 1922, was reinstated as from the 1st August, 1922, in a revised form, the duties on tobacco and wine being increased. Further alterations, which came into force from 30th November, 1925, were made by an Order in Council of 7th September, 1925.
The main item of import benefited by the reciprocal arrangement is wine. Sparkling wine is admitted at 9s. 6d. per gallon, as against 15s. under the general and British preferential rates. On still wine the rate is 3s. 6d. per gallon, as compared with 6s. Other items specially provided for are feathers, fish, fruit, sugar, and tea; while in the case of all other dutiable goods, with the exception of spirits and tobacco, a reduction of 3 per cent. is made.
The following table shows the imports from South Africa during the last ten years. Figures of exports from New Zealand to South Africa are also given.
| Year. | Imports. | Exports. | |
|---|---|---|---|
| According to Country of Shipment. | According to Country of Origin. | ||
| £ | £ | £ | |
| 1916 | 71,300 | 105,000 | 6,681 |
| 1917 | 56,392 | 98,538 | 1,588 |
| 1918 | 43,856 | 110,645 | 718 |
| 1919 | 62,628 | 169,222 | 2,241 |
| 1920 | 189,767 | 263,653 | 5,571 |
| 1921 | 34,864 | 84,704 | 2,906 |
| 1922 | 152,386 | 180,672 | 17,993 |
| 1923 | 79,742 | 110,313 | 7,392 |
| 1924 | 62,864 | 89,295 | 28,585 |
| 1925 | 104,520 | 113,950 | 19,306 |
Not all the goods of South African origin receive the benefit of the reciprocal tariff, a certain quantity reaching New Zealand after transhipment from some other country or being duty-free in any case. As an example of the latter class may be mentioned unmounted precious stones, the imports of which in 1925 amounted to £16,789.
The following table shows for each of the last five years the principal items coming within the scope of the reciprocal tariff:—
| PRINCIPAL IMPORTSFROM BRITISH SOUTH AFRICAAFFECTEDBY RECIPROCAL TARIFF. | |||||
|---|---|---|---|---|---|
| Article. | 1921. | 1922. | 1923. | 1924. | 1925. |
| £ | £ | £ | £ | £ | |
* Excluded from reciprocal tariff from 30th November, 1925. | |||||
| Maize | 1,112 | 1,896 | 5,803 | 6,797 | 14,479 |
| Wine | 10,837 | 17,680 | 15,267 | 15,712 | 11,671 |
| Tobacco* | 184 | 4,920 | 455 | 1,212 | |
| Apparel | 156 | 297 | 264 | 721 | 1,043 |
| Ostrich-feathers | 7 | 262 | |||
Prior to the amendment of the Customs tariff in 1921 Australian goods entering the Dominion were accorded British preferential treatment, although articles of New Zealand origin or manufacture entered Australia under the general tariff. From the 22nd December, 1921, however, goods produced in the Commonwealth were placed on the general tariff, and were required in consequence to pay the same duties as were levied on foreign goods. Since the 1st September, 1922, a tariff agreement, confirmed by the Tariff Agreement (New Zealand and Australia) Ratification Act, 1922, has been in operation, under which, with the object of promoting trade between the Commonwealth and the Dominion, New Zealand and Australia grant mutual concessions in the matter of Customs duties.
In addition to these reciprocal arrangements, which have operated from the 1st September, 1922, the tariff agreement provides further that goods which are imported into Australia and are subsequently transhipped to New Zealand, and which, if they had been imported direct from the country of origin into New Zealand, would have been entitled to be entered under the British preferential tariff, shall be admitted to the Dominion under the British preferential tariff. A similar provision relates to goods imported into the Dominion and transhipped to the Commonwealth. These concessions have operated from the 1st May, 1922.
The main reciprocal agreement covers 129 items, in some cases the reduction -of the rate of duty amounting to less, and in some more, than that accorded British goods under the ordinary scale of preferential duties. In any instance where the rate of duty has not been lowered at least to the extent provided for British goods, the reason may generally be found in the fact that protection is sought for the development of a secondary industry in the country retaining the higher rate of duty. Then, apart from the 129 items which are thus specifically mentioned, all other goods which are produced or manufactured in either Australia or New Zealand are admitted to the other country concerned at British preferential rates of duty.
The item which figures most largely in the trade between the two countries is timber (rough-sawn). Australian-produced timber now enters New Zealand free, in lieu of the former general duty of 2s. per 100 superficial feet. New Zealand timbers, similarly, now enter the Commonwealth free, the rates superseded varying from 1s. per 100 superficial feet on timber for the manufacture of boxes (mainly white-pine) to 4s., 5s. 6d., and 7s. per 100 superficial feet on larger sizes. The duty on imports from Australia of grain and pulse in an unmanufactured condition has been reduced from 2s. per cental to 1s. 6d. per cental, and boots, shoes, &c., from Australia benefit also by a reduction of duty from 45 per cent. ad valorem to 35 per cent. ad valorem.
It is as yet a little premature to make a pronouncement as to what items of trade will be affected most by this measure, for the reason that one primary object of the reciprocal arrangement was to encourage expansion of trade in some classes of goods which have not hitherto figured very largely in commercial activities between the Commonwealth and the Dominion. During the last five years trade between the two countries has been as follows:—
| — | 1921. | 1922. | 1923. | 1924. | 1925. |
|---|---|---|---|---|---|
| £ | £ | £ | £ | £ | |
| Imports of Australian origin | 5,460,381 | 3,293,632 | 3,653,420 | 5,651,027 | 5,249,493 |
| Exports to Australia | 2,070,013 | 2,208,280 | 2,642,266 | 2,509,322 | 2,502,113 |
Exports show a moderate increase since the introduction of the tariff, although the advance is due to increases in items outside of the agreement, such as wool, butter, and hides. Imports also have increased but, as in the case of exports, the tariff items were not prominent in bringing about this result. The bulk of the increase in the last two years as compared with 1923 was accounted for by wheat for the New Zealand Government, coal, and sugar. Coming to items within the scope of the agreement, it is found that the average yearly value of timber imported from Australia during 1919–21 was £344,740, while the actual figures for the last three years were 1923, £434,990; 1924, £722,685; 1925, £744,943. The explanation of the increase probably lies more in the demand for poles in connection with the extension of hydro-electricity throughout New Zealand than in the removal of the duty.
IN the earliest statistical publication for New Zealand as a whole—covering the period 1853–56—and in its successors up to and including 1867, much more prominence was given to the overseas trade of individual New Zealand ports than to the countries with which the young colony was trading. Even the total trade with individual countries was not published, the only distinction made in this connection being as to trade with (1) the United Kingdom, (2) British possessions, and (3) foreign countries.
In 1868, however, a complete change was made, and detailed statistics of imports from and exports to individual countries were instituted. From this year the port details were reduced step by step until, in place of the elaborate detailed statements for each port, two tables showing for each port only the exports to and imports from each country were presented in the annual statistical volume. Later—in 1914—the system of details for each port was partially reverted to, particulars of items imported and exported being given for Auckland, Wellington, Lyttelton, and Dunedin separately, and all other ports in conjunction.
New Zealand has twenty-one ports of entry for Customs purposes, eleven in the North Island and ten in the South. It is interesting to compare the present list with that of ports for which statistics were compiled in the “fifties.” Of the latter no fewer than seven do not appear among the present-day ports of entry, though oversea vessels occasionally arrive direct at some of them. The list of ports of entry in 1853 and 1925 is as follows:—
| 1853. |
|---|
| Mangonui. |
| Russell. |
| Whangarei. |
| Hokianga. |
| Kaipara. |
| Auckland. |
| Kawhia. |
| Napier. |
| New Plymouth. |
| Wanganui. |
| Wellington. |
| Nelson. |
| Lyttelton. |
| Akaroa. |
| Chatham Islands. |
| Otago (Dunedin). |
| Bluff. |
| 1925. |
| Kaipara. |
| Auckland. |
| Tauranga. |
| Tokomaru Bay. |
| Gisborne. |
| Napier. |
| Waitara. |
| New Plymouth. |
| Patea. |
| Wanganui. |
| Wellington. |
| Wairau (including Picton). |
| Nelson. |
| Westport. |
| Greymouth. |
| Hokitika. |
| Lyttelton. |
| Timaru. |
| Oamaru. |
| Dunedin. |
| Invercargill (Bluff). |
Dealing with the overseas trade of the Dominion, the following table gives the actual amount of imports for the several ports of entry for the five years 1921–25:—
| IMPORTSBY PORTS, 1921–25. | |||||
|---|---|---|---|---|---|
| Ports. | 1921. | 1922. | 1923. | 1924. | 1925. |
| £ | £ | £ | £ | £ | |
| Auckland | 14,677,394 | 12,496,209 | 15,030,915 | 16,389,712 | 17,312,990 |
| Kaipara | 4,961 | 3,459 | 3,575 | 14,540 | 7,814 |
| Tauranga | 6,162 | 13,343 | 8,217 | 36,066 | 86,878 |
| Gisborne | 233,380 | 160,932 | 209,984 | 238,534 | 242,715 |
| New Plymouth | 463,682 | 467,081 | 637,215 | 813,562 | 857,111 |
| Patea | 59,941 | 31,114 | 40,019 | 37,803 | 42,628 |
| Wanganui | 461,695 | 288,591 | 454,893 | 617,025 | 662,677 |
| Wellington | 13,196,788 | 10,187,390 | 12,725,654 | 14,064,782 | 15,874,813 |
| Napier | 878,581 | 591,099 | 883,490 | 1,096,629 | 1,116,176 |
| Wairau (incl. Picton) | 61,038 | 47,349 | 60,032 | 75,545 | 82,448 |
| Nelson | 148,715 | 141,463 | 200,404 | 214,798 | 224,278 |
| Westport | 41,852 | 58,483 | 61,823 | 57,229 | 68,586 |
| Greymouth | 133,986 | 153,488 | 109,666 | 113,173 | 138,191 |
| Hokitika | 10,314 | 8,353 | 11,178 | 14,557 | 13,197 |
| Lyttelton | 6,761,320 | 5,672,470 | 6,365,373 | 6,965,094 | 7,641,331 |
| Timaru | 531,089 | 376,350 | 592,011 | 969,809 | 815,,621 |
| Oamaru | 109,304 | 101,033 | 124,197 | 179,580 | 162,199 |
| Dunedin | 4,530,995 | 3,592,777 | 4,878,297 | 5,290,550 | 5,921,749 |
| Invercargill | 631,246 | 621,577 | 981,550 | 1,338,615 | 1,185,005 |
| Totals | 42,942,443 | 35,012,561 | 43,378,493 | 48,527,603 | 52,456,407 |
During each of the five years covered by the above table well over half the imports came in by way of Wellington or Auckland, the actual proportion in 1925 being 63 per cent. From 1921 onwards Auckland has displaced Wellington for the premier position on the list of importing ports.
From 1914 to 1921 the Customs Department allocated exports as far as possible to the appropriate district of production, whether exported through the port for such district or not, and no complementary figures are available to show the export trade from each individual port for this period.
The system of showing exports according to the district of production was introduced on account of complaints from the smaller ports as to the injustice done them when goods produced in their surrounding districts were shown as an export of one of the larger ports to which they had been sent by railway or coastal vessel. The system, however, did not prove satisfactory in practice, and the former method of showing exports according to the port at which the goods were placed on board the exporting-vessel was reverted to from the 1st January, 1922.
The two tables following give for the latest five years available (1) overseas exports according to district of production, and (2) overseas exports according to the port at which they are actually placed on board the overseas vessel. Tauranga, which is omitted from the second table, was not a port of entry prior to 1915, and has had no overseas exports since the introduction of the present system.
| OVERSEAS EXPORTSBY DISTRICTSOF PRODUCTION, 1917–21. | |||||
|---|---|---|---|---|---|
| District. | 1917. | 1918. | 1919. | 1920. | 1921. |
| £ | £ | £ | £ | £ | |
| Auckland | 5,712,467 | 6,027,988 | 9,847,296 | 9,383,603 | 11,943,224 |
| Kaipara | 96,121 | 93,463 | 54,507 | 80,611 | 72,773 |
| Tauranga | 67,482 | 74,722 | 43,326 | 5,436 | 127,082 |
| Tokomaru Bay | 1,699,781 | 1,228,449 | 3,466,502 | 2,333,212 | 322,546 |
| Gisborne | 1,633,241 | ||||
| New Plymouth | 1,038,769 | 1,113,557 | 2,133,601 | 1,869,185 | 2,985,942 |
| Waitara | 345,450 | 214,097 | 555,265 | 486,128 | 86,295 |
| Patea | 976,922 | 1,329,100 | 2,369,581 | 1,813,522 | 2,371,832 |
| Wanganui | 1,986,983 | 1,900,467 | 3,975,354 | 4,037,116 | 3,759,494 |
| Wellington | 6,954,263 | 5,846,342 | 9,506,957 | 7,268,778 | 6,045,828 |
| Napier | 3,216,055 | 2,364,734 | 4,504,387 | 3,515,546 | 2,672,404 |
| Wairau (incl. Picton) | 298,223 | 287,399 | 836,317 | 460,235 | 587,194 |
| Nelson | 219,191 | 165,255 | 482,660 | 297,812 | 328,792 |
| Westport | 47,850 | 38,832 | 42,099 | 56,894 | 86,898 |
| Greymouth | 320,469 | 194,971 | 330,820 | 467,776 | 315,323 |
| Hokitika | 48,019 | 39,807 | 47,885 | 72,601 | 126,566 |
| Lyttelton | 3,926,241 | 3,225,428 | 6,702,130 | 6,029,542 | 4,487,376 |
| Timaru | 925,788 | 831,764 | 2,214,237 | 1,862,276 | 1,578,764 |
| Oamaru | 201,052 | 351,713 | 539,539 | 429,547 | 360,176 |
| Dunedin | 1,720,309 | 1,786,068 | 3,366,731 | 3,104,926 | 2,284,783 |
| Invercargill | 1,754,897 | 1,281,596 | 2,874,580 | 2,767,192 | 2,566,110 |
| Parcels-post | 31,215 | 120,436 | 76,301 | 100,008 | 86,184 |
| Totals | 31,587,547 | 28,516,188 | 53,970,075 | 46,441,946 | 44,828,827 |
| OVERSEAS EXPORTSBY PORTS, 1913 AND 1922—25. | |||||
|---|---|---|---|---|---|
| Port. | 1913. | 1922. | 1923. | 1924. | 1925. |
| £ | £ | £ | £ | £ | |
| Auckland | 4,024,740 | 9,595,225 | 11,336,676 | 12,295,834 | 12,434,223 |
| Kaipara | 79,283 | 27,339 | 13,401 | 6,392 | 31,026 |
| Tokomaru Bay | 1,216,354 | 337,149 | 1,662,024 | 374,829 | 427,240 |
| Gisborne | 1,939,140 | 1,608,690 | 1,776,359 | ||
| New Plymouth | 631,258 | 1,038,469 | 1,282,869 | 1,232,317 | 1,094,840 |
| Waitara | 310,462 | ||||
| Patea | 692,336 | 160,336 | |||
| Wanganui | 532,285 | 1,547,243 | 1,754,132 | 2,254,863 | 2,438,034 |
| Wellington | 5,322,808 | 11,842,144 | 13,788,209 | 16,017,834 | 15,607,425 |
| Napier | 1,949,288 | 2,577,431 | 2,738,796 | 3,834,134 | 5,321,266 |
| Wairau (incl. Picton) | 303,686 | 416,617 | 238,316 | 223,550 | 287,734 |
| Nelson | 160,216 | 302,205 | 136,974 | 68,016 | 74,680 |
| Westport | 40,345 | 46,934 | 42,149 | 28,755 | 51,954 |
| Greymouth | 375,451 | 191,969 | 238,874 | 259,967 | 331,483 |
| Hokitika | 14,047 | 25,581 | 381 | ||
| Lyttelton | 2,983,266 | 5,034,968 | 5,169,323 | 6,249,852 | 6,385,286 |
| Timaru | 1,205,241 | 2,285,747 | 1,877,624 | 1,992,317 | 2,380,367 |
| Oamaru | 209,298 | 455,205 | 249,727 | 237,013 | 324,997 |
| Dunedin | 1,582,020 | 2,442,453 | 2,739,320 | 3,482,791 | 3,621,646 |
| Invercargill | 1,302,776 | 2,392,770 | 2,624,958 | 2,369,985 | 2,596,351 |
| Parcels-post | 51,562 | 67,324 | 73,793 | 75,572 | 76,980 |
| Totals | 22,986,722 | 42,726,249 | 45,967,165 | 52,612,711 | 55,262,272 |
The west-coast ports of both Islands, as well as Nelson and Wairau in the northern portion of the South Island, send much of their produce to Wellington for loading on to the overseas vessels, and all of these ports show considerable decreases, as a result of the reintroduction of the system in force prior to 1914.
Neither under the system in force from 1914 to 1921, when exports were shown according to district of production, nor under the present system of allocating the goods to the port at which they are placed on hoard the exporting-vessel is it possible to show properly the total work and progress of each port, since overseas trade only is dealt with, and goods passing over two wharves can only be shown under one without duplication in the trade statistics of the Dominion. Moreover, by dealing only with values the progress of a port cannot be accurately estimated from year to year, owing to the extent to which these total values are affected by the variation in price of the goods included. The work of a port is properly gauged by the tonnage handled; the revenue is levied on a tonnage basis, and a proper estimate of the progress and development of a port from year to year is better obtained by a study of the statistics of tonnage handled than of values. In comparing one port with another, however, care must be taken to observe whether there is any great difference in the character and value of the cargo handled, and allowance made accordingly: a port which handles principally coal, timber, or cement is not properly comparable with a port handling principally butter and cheese.
To meet the lack of proper statistics for the close observation and study of individual ports a system was introduced in 1922 to show on a tonnage basis the total exports of each port, whether placed on the overseas vessel there, sent to a central port for shipment overseas, or despatched coastwise to another port for consumption in New Zealand. The inclusion of the coastal trade is of especial value. The statistics of overseas trade, on either of the systems hitherto followed, covered considerably less than half of the total sea-borne trade of the Dominion, and the smaller ports were placed under an even greater disadvantage than the larger ports on account of the greater disparity between coastal and direct overseas trade in the case of the former. The usefulness of a port and the importance of the service rendered by it to the district are determined not by its foreign trade but by its total trade; it is quite as necessary and valuable to the district to provide the facilities required for the home coastal trade as for the foreign trade.
In order to obtain statistics of the total trade of each port a system of monthly returns from the various port authorities has been instituted, showing under some forty headings the quantity of goods handled, distinguishing inwards and outwards cargo, coastal and overseas, and transhipments. For obvious reasons, total values of goods shipped coastwise cannot be obtained, and the statistics are compiled and published on a tonnage basis.
Detailed tables are published for each of forty-eight ports in the “Annual Statistical Report on Trade and Shipping.” In addition, successive issues of the Monthly Abstract of Statistics contain cumulative figures of the total tonnage handled at each port, and details of items for the eighteen more important ports. Space will not permit the inclusion in the Year-book of all these details, but the following table shows for each port the total cargo inwards and outwards in 1925, distinguishing between overseas and coastal, and giving the transhipments separately. The huge proportion of transhipments in the case of Wellington is very noticeable.
| Port. | inwards. | Transhipments (included once only). | Outwards. | Total. | ||
|---|---|---|---|---|---|---|
| Coastal. | Overseas. | Coastal. | Overseas. | |||
| Tons. | Tons. | Tons. | Tons. | Tons. | Tons. | |
* For three months ended 31st December. | ||||||
| Awanui* | 1,478 | 1,272 | 2,750 | |||
| Russell | 4,323 | 233 | 88 | 4,213 | 10,638 | 19,495 |
| Hokianga | 4,464 | 5,670 | 12,450 | 22,584 | ||
| Mangonui | 2,295 | 829 | 3,124 | |||
| Whangarei | 22,969 | 148,413 | 171,382 | |||
| Kaipara | 1,904 | 4,934 | 4,517 | 11,355 | ||
| Mangawai | 1,099 | 574 | 1,673 | |||
| Auckland | 612,792 | 810,557 | 87,040 | 248,059 | 117,158 | 1,875,606 |
| Port. | inwards. | Transhipments (included once only). | Outwards. | Total. | ||
|---|---|---|---|---|---|---|
| Coastal. | Overseas. | Coastal. | Overseas. | |||
| Tons. | Tons. | Tons. | Tons. | Tons. | Tons. | |
* For seven months ended 31st December. | ||||||
| Onehunga | 11,448 | 40,775 | 52,223 | |||
| Whitianga | 578 | 891 | 1,469 | |||
| Great Barrier | 524 | 410 | 934 | |||
| Kawhia | 2,353 | 2 | 744 | 3,099 | ||
| Raglan | 2,572 | 676 | 3,248 | |||
| Thames | 13,521 | 391 | 22,950 | 36,862 | ||
| Coromandel* | 1,196 | 623 | 1,819 | |||
| Tauranga | 37,100 | 9,127 | 55 | 12,426 | 58,708 | |
| Opotiki | 8,610 | 3,128 | 11,738 | |||
| Whakatane | 10,780 | 4,015 | 945 | 15,740 | ||
| Tolaga Bay | 2,612 | 939 | 3,551 | |||
| Tokomaru Bay | 7,363 | 3 | 638 | 1,346 | 4,340 | 13,690 |
| Gisborne | 60,937 | 5,847 | 663 | 19,089 | 22,472 | 109,008 |
| Wairoa | 11,274 | 238 | 3,260 | 14,772 | ||
| Waikokopu | 7,219 | 2,599 | 3,656 | 13,474 | ||
| Napier | 74,297 | 50,306 | 12,339 | 32,798 | 44,551 | 214,291 |
| Mokau | 735 | 694 | 1,429 | |||
| Waitara | 1,663 | 1,622 | 3,285 | |||
| New Plymouth | 66,623 | 68,271 | 20,489 | 22,824 | 178,207 | |
| Patea | 4,192 | 15,340 | 19,532 | |||
| Wanganui | 98,697 | 33,745 | 29,845 | 27,637 | 189,924 | |
| Foxton | 9,855 | 3,580 | 13,435 | |||
| Wellington | 381,448 | 614,831 | 344,311 | 180,804 | 164,554 | 1,685,948 |
| Wairau | 9,722 | 8,068 | 17,790 | |||
| Kaikoura | 2,836 | 740 | 3,576 | |||
| Picton | 30,595 | 28,342 | 3,253 | 62,190 | ||
| Nelson | 52,966 | 8,513 | 23,592 | 23,187 | 1,192 | 109,450 |
| Waitapu | 2,294 | 1,218 | 3,512 | |||
| Motueka | 7,880 | 119 | 11,689 | 19,688 | ||
| Westport | 17,599 | 453 | 555,412 | 573,464 | ||
| Greymouth | 17,029 | 810 | 225,771 | 49,220 | 292,830 | |
| Hokitika | 283 | 182 | 465 | |||
| Lyttelton | 152,132 | 343,555 | 3,019 | 163,407 | 64,965 | 727,078 |
| Akaroa | 1,147 | 87 | 1,234 | |||
| Timaru | 26,763 | 44,746 | 215 | 48,318 | 23,793 | 143,835 |
| Oamaru | 8,004 | 13,810 | 29 | 20,783 | 3,927 | 46,553 |
| Otago | 112,238 | 235,003 | 9,298 | 84,321 | 33,039 | 473,899 |
| Invercargill | 9,295 | 1,030 | 10,325 | |||
| Bluff | 23,001 | 73,952 | 124 | 15,464 | 35,717 | 148,258 |
| Half-moon Bay | 572 | 413 | 985 | |||
| Totals | 1,941,277 | 2,318,634 | 482,223 | 1,996,505 | 650,848 | 7,389,487 |
The above table shows the quantity of cargo placed on board the overseas vessels at the respective ports, and a table will be found in the shipping section of the Year-book showing the number and tonnage of overseas vessels calling at each port. These tables give a good indication of the extent to which each port enters directly into the overseas trade of the Dominion. The following table shows for the year 1925 the total shipments (overseas and coastwise) from each port of the nine principal commodities exported overseas by the Dominion, and clearly indicates from which ports they originate, thus showing the extent to which the various ports handle our overseas exports, although the goods may be sent outwards coastwise for transhipment at another port. The tonnage of transhipments included in the totals given in the table is shown in italics above the figures for each port.
TOTAL OUTWARDS CARGO (INCLUDING TRANSHIPMENTS) HANDLEDATTHEVARIOUS PORTSOFTHE DOMINIONIN 1925, SHOWINGTHE PRINCIPAL ITEMSOF NEW ZEALAND EXPORTSSEPARATELY.
| (Transhipments included shown in italics above the figures for the appropriate port.) | |||||||||||
|---|---|---|---|---|---|---|---|---|---|---|---|
| Port. | Wool. | Frozen Meat. | Butter | Cheese | Tallow | Hides, Skins, and Pelts. | Coal. | Hemp (Fibre and Tow). | Timber. | All other Goods. | Total. |
| Tons. | Tons. | Tons. | Tons. | Tons. | Tons. | Tons | Tons. | Tons. | Tons. | Tons. | |
* For three months ended 31st December. † For seven months ended 31st December. | |||||||||||
| Awanui* | 1,272 | 1,272 | |||||||||
| Russell | 49 | 39 | 88 | ||||||||
| 127 | 3,080 | 241 | 226 | 201 | 2,440 | 5 | 7,842 | 777 | 14,936 | ||
| Hokianga | 207 | 381 | 0 | 43 | 17,303 | 184 | 18,120 | ||||
| Mangonui | 76 | 275 | 34 | 444 | 829 | ||||||
| Whangarei | 261 | 1,504 | 18 | 0 | 53 | 31,824 | 6 | 114,741 | 148,413 | ||
| Kaipara | 4,515 | 2 | 4,517 | ||||||||
| Mangawai | 22 | 9 | 6 | 537 | 574 | ||||||
| Auckland | 606 | 131 | 8,356 | 3,208 | 210 | 659 | 5,735 | 2,382 | 5,563 | 60,190 | 87,040 |
| 9,196 | 11,460 | 38,021 | 9,108 | 4,117 | 6,260 | 16,725 | 3,975 | 27,628 | 325,767 | 452,257 | |
| Onehunga | 121 | 1 | 7 | 5 | 11 | 2,554 | 663 | 37,413 | 40,775 | ||
| Whitianga | 14 | 142 | 2 | 1 | 646 | 86 | 891 | ||||
| Great Barrier | 410 | 410 | |||||||||
| Kawhia | 2 | 2 | |||||||||
| 309 | 182 | 9 | 2 | 244 | 746 | ||||||
| Raglan | 246 | 196 | 9 | 122 | 103 | 676 | |||||
| Thames | 7 | 83 | 782 | 52 | 2 | 20,198 | 1,826 | 22,950 | |||
| Coromandel† | 623 | 623 | |||||||||
| Tauranga | 55 | 55 | |||||||||
| 168 | 2,477 | 52 | 243 | 742 | 5,058 | 3,741 | 12,481 | ||||
| Opotiki | 222 | 715 | 60 | 11 | 56 | 2,064 | 3,128 | ||||
| Whakatane | 222 | 822 | 106 | 1,014 | 109 | 181 | 159 | 138 | 2,209 | 4,960 | |
| Tolaga Bay | 804 | 47 | 6 | 16 | 1 | 65 | 939 | ||||
| TokomaruBay | 588 | 50 | 638 | ||||||||
| 2,719 | 2,490 | 260 | 250 | 605 | 6,324 | ||||||
| Gisborne | 188 | 475 | 663 | ||||||||
| 7,501 | 14,054 | 906 | 2 | 1,597 | 1,730 | 3,197 | 13,237 | 42,224 | |||
| Wairoa | 238 | 238 | |||||||||
| 2,016 | 238 | 161 | 59 | 4 | 198 | 2 | 3 | 817 | 3,498 | ||
| Waikokopu | 483 | 2,788 | 11 | 249 | 92 | 462 | 2,170 | 6,255 | |||
| Napier | 4,922 | 251 | 113 | 44 | 9 | 269 | 309 | 243 | 6,179 | 12,339 | |
| 24,014 | 22,773 | 1,103 | 116 | 2,613 | 2,507 | 5,075 | 1 | 2,172 | 29,314 | 89,688 | |
| Mokau | 48 | 5 | 93 | 521 | 27 | 694 | |||||
| Waitara | 290 | 1,332 | 1,622 | ||||||||
| New Plymouth | 175 | 10,222 | 9,614 | 16,750 | 1,105 | 1,512 | 334 | 3,601 | 43,313 | ||
| Patea | 162 | 1,15l | 1,080 | 11,632 | 362 | 523 | 430 | 15,340 | |||
| Wanganui | 10,733 | 14,397 | 4,449 | 9,590 | 2,683 | 2,263 | 92 | 2,394 | 10,881 | 57,482 | |
| Foxton | 3,580 | 3,580 | |||||||||
| Wellington | 3,967 | 1,289 | 11,924 | 28,508 | 1,562 | 1,961 | 167,512 | 3,944 | 3,761 | 119,883 | 344,311 |
| 30,420 | 37,565 | 19,829 | 45,507 | 6,309 | 10,311 | 167,677 | 14,384 | 7,367 | 350,300 | 689,669 | |
| Wairau | 1,100 | 392 | 137 | 72 | 36 | 6,331 | 8,068 | ||||
| Kaikoura | 339 | 94 | 46 | 4 | 33 | 224 | 740 | ||||
| Picton | 2,248 | 1,687 | 30 | 411 | 189 | 33 | 532 | 26,465 | 31,595 | ||
| Nelson | 128 | 302 | 499 | 2 | 32 | 8,812 | 44 | 27 | 13,746 | 23,592 | |
| 1,134 | 454 | 903 | 641 | 176 | 267 | 10,148 | 50 | 287 | 33,911 | 47,971 | |
| Waitapu | 113 | 311 | 58 | 24 | 82 | 630 | 1,218 | ||||
| Motueka | 119 | 119 | |||||||||
| 169 | 112 | 4 | 52 | 11,471 | 11,808 | ||||||
| Westport | 453 | 453 | |||||||||
| 27 | 164 | 56 | 155 | 543,832 | 172 | 5,797 | 5,662 | 555,865 | |||
| Greymouth | 27 | 1 | 1 | 31 | 159 | 192,535 | 79,829 | 2,408 | 274,991 | ||
| Hokitika | 3 | 179 | 182 | ||||||||
| Lyttelton | 52 | 146 | 821 | 7 | 5 | 1,988 | 3,019 | ||||
| 20,762 | 22,297 | 2,761 | 1,798 | 3,835 | 3,926 | 274 | 311 | 710 | 174,717 | 231,391 | |
| Akaroa | 32 | 19 | 36 | 87 | |||||||
| Timaru | 35 | 30 | 150 | 215 | |||||||
| 7,114 | 11,802 | 574 | 529 | 1,412 | 830 | 50,065 | 72,326 | ||||
| Oamaru | 29 | 29 | |||||||||
| 689 | 2,797 | 361 | 108 | 20,784 | 24,739 | ||||||
| Otago | 6 | 31 | 447 | 8,814 | 9,298 | ||||||
| 11,907 | 6,985 | 1,340 | 2,462 | 1,259 | 4,564 | 24 | 671 | 1,815 | 95,630 | 126,658 | |
| Invercargill | 25 | 174 | 37 | 794 | 1,030 | ||||||
| Bluff | 124 | 124 | |||||||||
| 6,388 | 9,000 | 782 | 9,101 | 1,621 | 1,073 | 85 | 2,329 | 3,983 | 16,943 | 51,305 | |
| Half - moon Bay | 413 | 413 | |||||||||
| Totals | 10,492 | 1,909 | 20,841 | 33,080 | 1,783 | 2,989 | 182,373 | 6,370 | 10,090 | 212,296 | 482,223 |
| 142,322 | 176,088 | 38,983 | 109,857 | 28,705 | 37,729 | 973,553 | 23,892 | 192,982 | 1,355,465 | 3,129,576 | |
Transhipments of cargo during 1925 are shown in the two preceding tables to have totalled 482,223 tons, of which 344,311 tons were transhipped at Wellington.
Transhipments are of four classes, as follows:—
Coastal to Coastal.—Cargo which has been loaded on a vessel at one New Zealand port and is transhipped to another vessel for discharge at another New Zealand port.
Coastal to Overseas.—Cargo which has been loaded on a vessel at a New Zealand port and is transhipped to another vessel for discharge at a port outside of the Dominion.
Overseas to Coastal.—Cargo which has come from overseas and is transhipped to another vessel for discharge at a New Zealand port.
Overseas to Overseas.—Cargo which has come from overseas and is transhipped to another vessel for discharge outside New Zealand.
The first class represents purely coastal trade, but each of the others may be added to the appropriate figures of overseas trade shown previously to get the total tonnage of goods arriving from or departing overseas. The total inwards tonnage from overseas is found to be 2,487,180, and the total outward tonnage going overseas 871,225. It should be noted that in the compilation of statistics tonnage is reckoned by weight for some items and by measurement for others.
Two tables are appended showing the transhipment trade of each port affected for 1925, and the transhipments of the various items of merchandise, &c., a distinction being made in each case between the four classes referred to above.
| TRANSHIPMENTSBY PORTSAND CLASS, 1925. | |||||
|---|---|---|---|---|---|
| Port. | Coastal to Coastal. | Coastal to Overseas. | Overseas to Coastal. | Overseas to Overseas. | Totals. |
| Tons. | Tons. | Tons. | Tons. | Tons. | |
| Russell | 88 | 88 | |||
| Auckland | 13,764 | 17,613 | 45,940 | 9,723 | 87,040 |
| Kawhia | 2 | 2 | |||
| Tauranga | 55 | 55 | |||
| Tokomaru Bay | 52 | 586 | 638 | ||
| Gisborne | 196 | 467 | 663 | ||
| Wairoa | 238 | 238 | |||
| Napier | 5,035 | 5,467 | 1,837 | 12,339 | |
| Wellington | 64,899 | 179,856 | 94,432 | 5,124 | 344,311 |
| Nelson | 21,834 | 1,758 | 23,592 | ||
| Motueka | 119 | 119 | |||
| Westport | 453 | 453 | |||
| Lyttelton | 513 | 1,150 | 1,356 | 3,019 | |
| Timaru | 8 | 65 | 142 | 215 | |
| Oamaru | 29 | 29 | |||
| Otago | 1,188 | 8,110 | 9,298 | ||
| Bluff | 124 | 124 | |||
| Totals | 108,147 | 205,530 | 153,699 | 14,847 | 482,223 |
| TRANSHIPMENTSBY ITEMSAND CLASS, 1925. | |||||
|---|---|---|---|---|---|
| Item. | Coastal to Coastal. | Coastal to Overseas. | Overseas to Coastal. | Overseas to Overseas. | Totals. |
| Tons. | Tons. | Tons. | Tons. | Tons. | |
| Butter | 396 | 20,440 | 5 | 20,841 | |
| Cheese | 601 | 32,479 | 33,080 | ||
| Coal | 62,795 | 117,647 | 1,931 | 182,373 | |
| Fruit | 9,022 | 5,487 | 6,524 | 21 | 21,054 |
| Hemp (fibre and tow) | 47 | 6,315 | 8 | 6,370 | |
| Hides, skins, and pelts | 356 | 2,536 | 5 | 92 | 2,989 |
| Kerosene, benzine, and other fuel oils | 249 | 115 | 36,950 | 3,365 | 40,679 |
| Manures, artificial | 1,129 | 27 | 5,127 | 10 | 6,293 |
| Meat, frozen (beef, mutton, and lamb) | 1,909 | 1,909 | |||
| Sugar | 1,826 | 30 | 22 | 828 | 2,706 |
| Tallow | 28 | 1,755 | 1,783 | ||
| Timber | 611 | 703 | 8,193 | 583 | 10,090 |
| Wines, spirits, ale, and beer | 960 | 9 | 1,328 | 4 | 2,301 |
| Wool | 343 | 10,070 | 61 | 18 | 10,492 |
| All other goods | 29,784 | 6,008 | 93,550 | 9,921 | 139,263 |
| Totals | 108,147 | 205,530 | 153,699 | 14,847 | 482,223 |
Table of Contents
THE number and tonnage of the registered vessels belonging to the several ports of registry in the Dominion on the 31st December, 1925 (distinguishing sailing-vessels, steamers, and motor-vessels), were as under:—
| Ports. | Sailing-vessels. | Steam-vessels. | Motor-vessels. | ||||||
|---|---|---|---|---|---|---|---|---|---|
| Vessels. | Gross Tonnage. | Net Tonnage. | Vessels. | Gross Tonnage. | Net Tonnage. | Vessels. | Gross Tonnage. | Net Tonnage. | |
| Auckland | 71 | 5,906 | 4,848 | 111 | 23,848 | 12,053 | 155 | 5,169 | 2,482 |
| Napier | 4 | 266 | 253 | 21 | 4,092 | 2,189 | 8 | 647 | 403 |
| Wellington | 13 | 5,315 | 4,905 | 56 | 89,375 | 51,133 | 9 | 710 | 398 |
| Nelson | 2 | 35 | 35 | 14 | 5,578 | 2,721 | 6 | 301 | 145 |
| Lyttelton | 9 | 2,290 | 2,199 | 17 | 5,809 | 2,744 | 1 | 10 | 6 |
| Timaru | 1 | 942 | 488 | ||||||
| Dunedin | 17 | 7,090 | 6,898 | 53 | 48,835 | 28,914 | |||
| Invercargill | 1 | 342 | 314 | 8 | 1,125 | 523 | 2 | 79 | 42 |
| Totals | 117 | 21,244 | 19,542 | 281 | 179,604 | 100,765 | 181 | 6,916 | 3,476 |
Auckland is the port of registry of the majority of the vessels forming New Zealand's “mosquito” fleet, the average net tonnage of the 337 vessels on the Auckland register being only 57 tons. At Dunedin many of the vessels of the Union Steam Ship Company of New Zealand are registered. Shortly after the outbreak of the late war, however, several of the principal vessels of this company were transferred to the London register.
| Year. | Sailing-vessels. | Steam and Motor Vessels. | Totals. | ||||||
|---|---|---|---|---|---|---|---|---|---|
| Vessels. | Gross Tonnage. | Net Tonnage. | Vessels. | Gross Tonnage. | Net Tonnage. | Vessels. | Gross Tonnage | Net Tonnage. | |
| 1916 | 190 | 23,664 | 21,853 | 390 | 124,833 | 70,442 | 580 | 148,497 | 92,295 |
| 1917 | 184 | 24,356 | 22,404 | 376 | 115,683 | 65,092 | 560 | 140,039 | 87,496 |
| 1918 | 178 | 25,200 | 23,158 | 379 | 116,551 | 65,388 | 557 | 141,751 | 88,546 |
| 1919 | 174 | 24,354 | 22,216 | 382 | 116,261 | 64,943 | 556 | 140,615 | 87,159 |
| 1920 | 163 | 23,334 | 21,223 | 384 | 116,611 | 64,837 | 547 | 139,945 | 86,060 |
| 1921 | 161 | 25,461 | 23,201 | 401 | 122,371 | 68,705 | 562 | 147,832 | 91,906 |
| 1922 | 138 | 23,583 | 21,484 | 418 | 127,006 | 70,860 | 556 | 150,589 | 92,344 |
| 1923 | 127 | 21,718 | 19,812 | 428 | 143,164 | 80,850 | 555 | 164,882 | 100,662 |
| 1924 | 123 | 21,297 | 19,392 | 441 | 168,847 | 94,978 | 564 | 190,144 | 114,370 |
| 1925 | 117 | 21,244 | 19,452 | 462 | 186,520 | 104,241 | 579 | 207,764 | 123,693 |
The number of sailing-vessels on the register has decreased rapidly during recent years, there having been a continuous decline since 1907, in which year 323 sailing-vessels were on the register.
The tonnage of vessels entered and cleared during 1925 amounted to 4,261,933. as compared with 4,440,162 for 1924. The number of vessels fell from 1,419 to 1,319,
Of late years the tendency has been for vessels of a larger size to be employed in the New Zealand trade, in order to cope with the growing imports and exports of the Dominion and for the purposes of the passenger traffic. The increase over a period of years is thus more noticeable on a comparison of tonnage than by comparing the number of vessels. The number of vessels entered inwards and cleared outwards in 1915 was 1,287, of an aggregate tonnage of 3,217,729 tons—an average of 2,500 tons, The 1,319 vessels in 1925 aggregated 4,261,933 tons, the average being 3,231 tons. Dealing with steamships only (1,166 in 1915 and 1,275 in 1925), the average tonnage is found to be 2,760 and 3,326 tons respectively. The number of sailing-vessels arriving and departing decreased from 121 in 1915 to only 44 in 1925, the aggregate tonnage falling in the same time from 59,629 to 21,368 tons.
The number and tonnage of vessels entered and cleared during each of the last ten years, separating steam from sailing, are as shown in the following table:—
| OVERSEA SHIPPING, 1916–25. | ||||||||
|---|---|---|---|---|---|---|---|---|
| Year. | Entered. | Cleared. | ||||||
| Vessels. | Tonnage. | Vessels. | Tonnage. | |||||
| Steam. | Sailing. | Steam. | Sailing. | Steam. | Sailing. | Steam. | Sailing. | |
| 1916 | 520 | 54 | 1,418,991 | 29,526 | 534 | 56 | 1,461,597 | 29,996 |
| 1917 | 485 | 58 | 1,378,676 | 27,100 | 486 | 61 | 1,353,975 | 27,907 |
| 1918 | 458 | 85 | 1,225,481 | 54,067 | 464 | 80 | 1,264,105 | 46,522 |
| 1919 | 472 | 92 | 1,427,759 | 53,124 | 475 | 99 | 1,444,206 | 61,050 |
| 1920 | 665 | 79 | 2,025,175 | 37,195 | 637 | 70 | 1,942,903 | 33,352 |
| 1921 | 611 | 67 | 1,891,309 | 48,927 | 610 | 68 | 1,895,419 | 48,922 |
| 1922 | 552 | 19 | 1,774,886 | 8,101 | 551 | 18 | 1,782,436 | 7,544 |
| 1923 | 646 | 18 | 2,106,587 | 5,292 | 628 | 18 | 2,055,795 | 4,707 |
| 1924 | 694 | 19 | 2,205,424 | 7,531 | 686 | 20 | 2,220,354 | 6,853 |
| 1925 | 635 | 21 | 2,112,428 | 10,313 | 640 | 23 | 2,128,137 | 11,055 |
The next table shows the number and tonnage of British, colonial, and foreign vessels entered and cleared in each of the ten years 1916 to 1925:—
| Year. | British. | Colonial. | Foreign. | Total. | ||||
|---|---|---|---|---|---|---|---|---|
| Vessels. | Tons. | Vessels. | Tons. | Vessels. | Tons. | Vessels. | Tons. | |
| Entered. | ||||||||
| 1916 | 255 | 998,388 | 283 | 388,961 | 36 | 61,768 | 574 | 1,448,517 |
| 1917 | 249 | 1,008,759 | 262 | 336,027 | 32 | 60,990 | 543 | 1,405,776 |
| 1918 | 193 | 838,198 | 289 | 374,130 | 61 | 67,220 | 543 | 1,279,548 |
| 1919 | 266 | 1,114,479 | 239 | 285,383 | 59 | 81,021 | 564 | 1,480,883 |
| 1920 | 363 | 1,477,965 | 302 | 403,025 | 79 | 181,380 | 744 | 2,062,370 |
| 1921 | 353 | 1,386,467 | 280 | 438,680 | 45 | 115,089 | 678 | 1,940,236 |
| 1922 | 356 | 1,369,799 | 200 | 360,365 | 15 | 52,823 | 571 | 1,782,987 |
| 1923 | 398 | 1,543,817 | 242 | 498,483 | 24 | 69,579 | 664 | 2,111,879 |
| 1924 | 342 | 1,393,545 | 329 | 691,272 | 42 | 128,138 | 713 | 2,212,955 |
| 1925 | 275 | 1,297,136 | 326 | 674,700 | 55 | 150,905 | 656 | 2,122,741 |
| Cleared. | ||||||||
| 1916 | 259 | 1,027,088 | 294 | 400,646 | 37 | 63,859 | 590 | 1,491,593 |
| 1917 | 253 | 995,346 | 261 | 327,822 | 33 | 58,714 | 547 | 1,381,882 |
| 1918 | 203 | 872,204 | 289 | 377,383 | 52 | 61,040 | 544 | 1,310,627 |
| 1919 | 273 | 1,139,812 | 239 | 286,062 | 62 | 79,382 | 574 | 1,505,256 |
| 1920 | 345 | 1,421,814 | 291 | 393,091 | 71 | 161,350 | 707 | 1,976,255 |
| 1921 | 356 | 1,388,147 | 267 | 417,786 | 55 | 138,408 | 678 | 1,944,341 |
| 1922 | 350 | 1,365,722 | 203 | 369,491 | 16 | 54,767 | 569 | 1,789,980 |
| 1923 | 387 | 1,517,096 | 237 | 478,086 | 22 | 65,320 | 646 | 2,060,502 |
| 1924 | 342 | 1,418,158 | 322 | 674,702 | 42 | 134,347 | 706 | 2,227,207 |
| 1925 | 286 | 1,318,680 | 323 | 663,215 | 54 | 157,297 | 663 | 2,139,192 |
British vessels entered in 1925 showed a drop in tonnage of approximately 100,000 as compared with 1924, while colonial ships also showed a slight decline. Foreign tonnage advanced appreciably during the year.
Of the colonial vessels entered inwards in 1925, 228, with an aggregate net tonnage of 483,106 tons, were of New Zealand registry. The foreign vessels entered inwards consisted of 28 American (97,213 tons), 15 Norwegian, 5 Danish, 3 Dutch, 1 Swedish, 1 German, 1 Greek, and 1 Chinese.
Particulars of the number and net tonnage of vessels entered and cleared between New Zealand and various countries during the years 1924 and 1925 are given below:—
| Country. | 1924. | 1925. | ||||||
|---|---|---|---|---|---|---|---|---|
| Entered. | Cleared. | Entered. | Cleared. | |||||
| No. | Tonnage. | No. | Tonnage. | No. | Tonnage. | No. | Tonnage. | |
| United Kingdom | 69 | 376,025 | 93 | 525,230 | 76 | 433,956 | 93 | 524,962 |
| British North Borneo (Protectorate) | 1 | 3,149 | ||||||
| Hong Kong | 2 | 7,496 | 1 | 3,748 | ||||
| India | 5 | 22,665 | 3 | 15,311 | ||||
| Straits Settlements | 2 | 2,482 | 1 | 3,944 | 1 | 2,438 | ||
| Seychelles Islands | 1 | 2,706 | ||||||
| South African Union | 2 | 8,626 | ||||||
| Canada | 42 | 174,654 | 19 | 104,536 | 40 | 195,850 | 17 | 125,412 |
| Australia | 423 | 1,082,982 | 507 | 1,338,655 | 362 | 936,569 | 451 | 1,193,344 |
| Fiji | 21 | 58,237 | 16 | 45,594 | 27 | 64,211 | 22 | 53,249 |
| Gilbert and Ellice Islands | 1 | 2,993 | 1 | 3,662 | 2 | 5,290 | 1 | 2,337 |
| Nauru (Pleasant) Island | 11 | 33,404 | 2 | 6,455 | 12 | 37,514 | 8 | 22,762 |
| Norfolk Island | 3 | 1,636 | 1 | 340 | ||||
| Solomon Islands | 2 | 806 | 2 | 806 | 1 | 403 | 5 | 2,288 |
| Tonga | 1 | 12 | 1 | 12 | ||||
| Other British Pacific | 1 | 3,231 | 3 | 10,551 | ||||
| islands | ||||||||
| Belgium | 1 | 3,168 | 3 | 9,390 | ||||
| France | 2 | 8,762 | 1 | 797 | 3 | 10,803 | ||
| Germany | 1 | 3,492 | ||||||
| Italy | 1 | 3,510 | 1 | 4,888 | ||||
| Norway | 1 | 4,882 | 1 | 4,882 | 2 | 132 | 1 | 4,882 |
| Sweden | 1 | 3,662 | ||||||
| Dutch East Indies | 13 | 34,603 | 1 | 3,500 | 8 | 19,822 | 2 | 6,257 |
| Egypt | 3 | 8,248 | ||||||
| Portuguese East Africa | 1 | 5,164 | ||||||
| Chile | 3 | 11,244 | 1 | 2,882 | 1 | 2,805 | 1 | 3,149 |
| United States of America | 93 | 351,511 | 37 | 144,217 | 93 | 346,987 | 38 | 154,984 |
| Mexico | 1 | 4,454 | ||||||
| Panama Canal Zone | 1 | 3,748 | ||||||
| Peru | 1 | 3,172 | ||||||
| Uruguay | 2 | 5,296 | ||||||
| New Caledonia | 4 | 3,796 | 6 | 12,558 | 6 | 6,001 | 4 | 4,094 |
| New Guinea | 1 | 12,088 | ||||||
| Society Islands | 5 | 4,720 | 6 | 8,458 | 3 | 4,714 | ||
| Tuamotu Archipelago | 1 | 2,510 | ||||||
| Tutuila | 1 | 1,194 | 3 | 4,918 | ||||
| Whale-fisheries | 6 | 5,320 | 6 | 5,320 | 6 | 5,320 | 6 | 5,258 |
| Totals | 713 | 2,212,955 | 706 | 2,227,207 | 656 | 2,122,741 | 663 | 2,139,192 |
More than half of the vessels, representing slightly less than half of the total tonnage inwards during the two years covered by the foregoing table, came from Australia, while a somewhat higher proportion of the shipping outwards was cleared for Australia. The United Kingdom ranks second, the United States third, Canada fourth, and Fiji fifth, shipping entered from or cleared to other countries being comparatively insignificant, though the aggregate for the numerous islands of the Pacific (other than Fiji) is fairly high. The figures for the principal countries for each of the last ten years are as follow:—
| SHIPPINGBETWEEN NEW ZEALANDAND PRINCIPAL COUNTRIES, 1916–25. | ||||||
|---|---|---|---|---|---|---|
| Year. | Australia. | United Kingdom. | United States. | Canada. | Fiji. | Pacific Islands (other than Fiji). |
| Tons. | Tons. | Tons. | Tons. | Tons. | Tons. | |
| Entered. | ||||||
| 1916 | 651,549 | 287,451 | 221,047 | 115,830 | 55,301 | 16,678 |
| 1917 | 614,055 | 308,932 | 205,440 | 112,969 | 50,077 | 28,674 |
| 1918 | 778,416 | 190,758 | 123,605 | 83,312 | 47,038 | 21,983 |
| 1919 | 637,368 | 388,303 | 220,819 | 70,066 | 57,877 | 27,385 |
| 1920 | 1,076,585 | 339,173 | 101,461 | 131,989 | 61,260 | 42,202 |
| 1921 | 888,287 | 415,020 | 324,089 | 167,951 | 70,461 | 33,894 |
| 1922 | 872,175 | 375,361 | 211,223 | 193,161 | 57,705 | 34,072 |
| 1923 | 1,045,264 | 387,987 | 298,470 | 192,098 | 53,779 | 42,620 |
| 1924 | 1,082,982 | 376,025 | 351,511 | 174,654 | 58,237 | 54,282 |
| 1925 | 936,569 | 433,956 | 346,987 | 195,850 | 64,211 | 44,843 |
| Cleared. | ||||||
| 1916 | 684,966 | 438,548 | 51,377 | 84,642 | 57,707 | 23,411 |
| 1917 | 654,237 | 428,799 | 50,540 | 77,730 | 38,732 | 30,929 |
| 1918 | 577,504 | 417,945 | 62,816 | 74,430 | 38,027 | 18,055 |
| 1919 | 683,432 | 559,476 | 58,256 | 75,603 | 40,909 | 31,071 |
| 1920 | 1,185,707 | 473,822 | 56,065 | 89,167 | 33,943 | 35,935 |
| 1921 | 1,178,138 | 535,273 | 84,571 | 69,416 | 56,223 | 15,578 |
| 1922 | 974,872 | 543,821 | 111,483 | 70,148 | 54,190 | 18,314 |
| 1923 | 1,211,532 | 523,663 | 92,844 | 105,218 | 48,737 | 53,228 |
| 1924 | 1,338,655 | 525,230 | 144,217 | 104,536 | 45,594 | 40,975 |
| 1925 | 1,193,344 | 524,962 | 154,984 | 125,412 | 53,249 | 31,324 |
New Zealand has twenty-one ports of entry for Customs purposes, and there are numerous other ports around the coast. A vessel arriving from overseas may call at several ports in the Dominion to discharge and load cargo, and is recorded as an overseas arrival at the first port of call, and as an overseas departure from the port from which it finally sails. Its movements from one port to another in New Zealand are treated as coastwise shipping. The figures in the following table must simply be taken as showing the extent to which various ports are made the first port of arrival or the last port of departure, and not as indicating the relative overseas trade of the various ports.
| OVERSEAS SHIPPING, 1923–25, BY PORTSOF FIRST ARRIVALAND FINAL DEPARTURE. | ||||||
|---|---|---|---|---|---|---|
| Port. | Entered. | Cleared. | ||||
| 1923. | 1924. | 1925. | 1923. | 1924. | 1925. | |
| Tons. | Tons. | Tons. | Tons. | Tons. | Tons. | |
| Kaipara | 1,736 | 2,995 | 2,049 | 1,038 | 1,562 | |
| Auckland | 1,120,883 | 1,229,298 | 1,228,679 | 768,377 | 809,471 | 812,860 |
| Tauranga | 2,065 | 1,367 | ||||
| Gisborne | 20,370 | 15,703 | 14,480 | 8,207 | 8,564 | 10,034 |
| Napier | 43,368 | 21,289 | 24,554 | 33,965 | 39,109 | 21,023 |
| New Plymouth | 34,609 | 31,652 | 31,726 | 21,269 | 49,558 | 42,107 |
| Wanganui | 27,992 | 29,365 | 23,189 | 5,862 | 12,238 | 20,979 |
| Wellington | 580,908 | 541,805 | 521,200 | 743,205 | 759,740 | 750,856 |
| Picton | 9,234 | 4,753 | 11,997 | 1,247 | 4,162 | |
| Nelson | 5,166 | 2,065 | 1,541 | 1,541 | 3,501 | |
| Westport | 15,311 | 2,533 | 3,232 | 24,502 | 20,584 | 51,917 |
| Greymouth | 498 | 1,526 | 1,088 | 34,172 | 34,608 | 25,997 |
| Lyttelton | 93,420 | 124,267 | 93,600 | 116,473 | 97,319 | 91,860 |
| Timaru | 6,892 | 8,155 | 3,709 | 18,509 | 21,019 | 22,091 |
| Oamaru | 3,466 | 7,703 | 7,953 | 1,860 | 1,901 | |
| Otago | 50,397 | 63,088 | 63,974 | 191,031 | 256,296 | 177,838 |
| Bluff | 95,564 | 125,391 | 89,770 | 91,104 | 112,679 | 104,666 |
| Totals | 12,111,879 | 2,212,955 | 2,122,741 | 2,060,502 | 2,227,207 | 2,139,192 |
Complementary to the statistical tables of overseas shipping entered and cleared, a table of coastwise shipping was until 1922 published annually in the successive volumes of Trade and Shipping Statistics, and the two sets of figures taken in conjunction showed the total shipping of each port. A drawback of the table of coastwise shipping, however, was that it made no distinction between vessels engaged: merely in the coastal trade and overseas vessels moving from port to port. To remedy this deficiency a new series of tables was instituted in 1922, showing for each of fifty-one ports (now fifty-six) the total shipping entered and cleared, and distinguishing between overseas and coastal vessels, irrespective of whether the former had been entered or cleared overseas or coastwise. From this series of tables may be seen at a glance not only the total shipping of each port, but the number and tonnage of vessels calling there which are engaged in the overseas trade.
A summary is here given showing, for each of the fifty-sis ports referred to, the number and tonnage of all vessels entered during 1924 and 1925. In this summary no distinction is made between overseas and coastal vessels.
| NUMBERAND TONNAGEOF VESSELS (OVERSEASAND COASTAL) ENTEREDATEACH PORT, 1924 AND 1925. | ||||
|---|---|---|---|---|
| Port. | 1924. | 1925. | ||
| Number. | Tonnage. | Number. | Tonnage. | |
* Returns not collected in 1924. | ||||
| Parengarenga | 14 | 2,262 | 21 | 3,431 |
| Awanui | 92 | 12,288 | 102 | 12,735 |
| Whangaroa | 211 | 52,845 | 179 | 43,264 |
| Russell | 177 | 91,991 | 178 | 99,236 |
| Herekino | 1 | 6 | ||
| Whangape | 34 | 2,556 | 40 | 2,924 |
| Hokianga | 101 | 21,533 | 115 | 28,300 |
| Mangonui | 107 | 25,014 | 62 | 18,596 |
| Whangarei | 1,247 | 239,768 | 1,106 | 235,306 |
| Kaipara | 13 | 4,294 | 16 | 6,128 |
| Mangawai | 58 | 2,972 | 66 | 3,206 |
| Mahurangi* | 178 | 10,732 | ||
| Auckland | 9,342 | 2,355,124 | 8,956 | 2,376,778 |
| Onehunga | 343 | 89,022 | 340 | 80,273 |
| Whitianga | 105 | 12,866 | 91 | 13,029 |
| Great Barrier | 63 | 7,945 | 54 | 7,367 |
| Kawhia | 47 | 10,019 | 52 | 9,440 |
| Raglan | 48 | 9,120 | 53 | 9,321 |
| Thames | 684 | 76,426 | 648 | 75,118 |
| Coromandel | 124 | 9,185 | 138 | 9,153 |
| Tauranga | 361 | 112,937 | 315 | 117,126 |
| Opotiki | 71 | 6,736 | 75 | 6,541 |
| Whakatane | 132 | 41,655 | 103 | 28,241 |
| Tolaga Bay | 101 | 39,112 | 98 | 38,246 |
| Tokomaru Bay | 277 | 143,658 | 252 | 114,982 |
| Gisborne | 498 | 410,491 | 539 | 355,895 |
| Wairoa | 225 | 17,332 | 153 | 11,733 |
| Waikokopu | 32 | 7,126 | 91 | 66,341 |
| Napier | 703 | 622,172 | 666 | 575,113 |
| Awakino | 14 | 196 | 15 | 210 |
| Mokau | 34 | 467 | 38 | 970 |
| Waitara | 55 | 1,124 | 65 | 2,086 |
| New Plymouth | 352 | 328,083 | 344 | 336,021 |
| Patea | 174 | 17,206 | 174 | 16,965 |
| Wanganui | 534 | 310,042 | 525 | 273,737 |
| Foxton | 86 | 10,374 | 73 | 8,853 |
| Wellington | 3,107 | 2,985,743 | 2,947 | 3,197,673 |
| Wairau | 243 | 16,727 | 184 | 13,676 |
| Havelock | 45 | 2,434 | 38 | 1,653 |
| Kaikoura | 160 | 22,534 | 66 | 8,349 |
| Picton | 410 | 214,447 | 439 | 292,808 |
| Nelson | 1,544 | 247,427 | 1,461 | 283,307 |
| Waitapu | 305 | 12,416 | 270 | 13,691 |
| Motueka | 386 | 30,843 | 297 | 22,739 |
| Westport | 565 | 318,739 | 587 | 369,072 |
| Greymouth | 367 | 193,567 | 315 | 174,663 |
| Hokitika | 15 | 360 | 17 | 425 |
| Lyttelton | 1,554 | 1,867,824 | 1,560 | 1,918,477 |
| Akaroa | 32 | 5,107 | 30 | 4,812 |
| Timaru | 370 | 520,571 | 362 | 495,802 |
| Oamaru | 176 | 163,654 | 182 | 146,672 |
| Otago | 589 | 1,077,101 | 554 | 1,002,085 |
| Invercargill | 133 | 8,820 | 141 | 7,787 |
| Bluff | 396 | 423,553 | 421 | 414,760 |
| Riverton | 3 | 249 | 1 | 23 |
| Half-moon Bay | 109 | 1,642 | 114 | 1,793 |
| Totals | 26,969 | 13,207,705 | 25,907 | 13,367,664 |
Wellington ranks as the first port of the Dominion as regards aggregate tonnage of shipping entered, followed by Auckland, Lyttelton, Otago, and Napier in that order. Wellington and Lyttelton are the termini of the daily inter-Island ferry service, and to this fact is due a large part of the coastwise shipping credited to these two ports.
The number and tonnage of overseas vessels included in the totals given on the previous page for the various ports concerned are now given. This table covers all vessels engaged in the overseas trade, whether entered overseas or coastwise, and the figures for individual ports differ greatly from those given in a previous table, wherein the tonnage of overseas vessels entered is counted only for the port of first entry in the Dominion.
| NUMBERAND TONNAGEOF OVERSEAS VESSELSENTEREDATEACH PORT, 1924 AND 1925. | ||||
|---|---|---|---|---|
| Port. | 1924. | 1925. | ||
| Number. | Tonnage. | Number. | Tonnage. | |
| Awanui | 1 | 200 | 1 | 166 |
| Whangaroa | 3 | 4,408 | 2 | 956 |
| Russell | 15 | 47,529 | 20 | 57,921 |
| Whangape | 2 | 772 | 2 | 956 |
| Hokianga | 11 | 8,540 | 15 | 14,163 |
| Whangarei | 8 | 8,460 | 11 | 14,517 |
| Kaipara | 4 | 2,995 | 5 | 4,260 |
| Auckland | 453 | 1,571,958 | 456 | 1,618,143 |
| Thames | 3 | 872 | 3 | 1,158 |
| Tauranga | 1 | 1,367 | ||
| Whakatane | 6 | 33,510 | 4 | 21,230 |
| Tokomaru Bay | 14 | 60,383 | 10 | 57,461 |
| Gisborne | 72 | 241,522 | 73 | 238,699 |
| Waikokopu | 1 | 3,300 | 11 | 54,554 |
| Napier | 112 | 452,504 | 118 | 460,207 |
| New Plymouth | 82 | 219,181 | 75 | 220,628 |
| Wanganui | 67 | 214,640 | 63 | 178,015 |
| Wellington | 436 | 1,702,470 | 449 | 1,828,632 |
| Picton | 22 | 71,115 | 27 | 80,055 |
| Nelson | 11 | 25,925 | 16 | 43,113 |
| Westport | 117 | 146,931 | 120 | 159,002 |
| Greymouth | 153 | 127,879 | 106 | 94,296 |
| Lyttelton | 245 | 1,022,348 | 268 | 1,044,779 |
| Akaroa | 1 | 1,500 | ||
| Timaru | 114 | 379,821 | 102 | 342,320 |
| Oamaru | 49 | 96,918 | 30 | 62,289 |
| Otago | 274 | 935,674 | 279 | 863,466 |
| Bluff | 135 | 385,106 | 122 | 371,116 |
| Totals | 2,412 | 7,767,828 | 2,388 | 7,832,102 |
Overseas vessels are shown to have called at twenty-six ports during 1925, including eleven which were not first ports of call for a single overseas vessel. The total entries of the 656 overseas vessels during the year were 2,388, which gives an average of somewhat over three ports called at on each visit to the Dominion. Many vessels—as, for instance, those engaged in the transport of timber and coal, and those merely touching at a New Zealand port while en route between Australia and America—call at only one port in the Dominion, while, on the other hand, vessels engaged in the Home trade generally call at half a dozen or more ports.
The examinations for masters, mates, engineers, &c., of vessels are controlled by the Marine Department, and the regulations relating to these examinations are based upon those of the Imperial Board of Trade, with such modifications as are necessitated by local conditions; but the British Board of Trade recognizes the following New Zealand certificates only as of Imperial validity: Master, extra; master, ordinary; master, steamship; first mate, only mate, and second mate, ordinary and steamship; first- and second-class marine engineers. It is a condition of such recognition that candidates must possess service qualifications and pass examinations similar and not inferior to those prescribed by the British Board of Trade.
New regulations for the examination of masters and mates were issued by the Board of Trade in 1921, and corresponding regulations were made in New Zealand and came into force on 6th June, 1923.
During 1925–26 some 439 candidates sat for examinations. Of the 232 who passed, 127 were masters, mates, and engineers of seagoing ships; 1 was for voluntary examination in compass deviation; 18 were masters, mates, and engineers of steamers plying within restricted limits; 33 were engineers of seagoing motor-propelled boats; and 53 were engineers of such boats plying within restricted limits.
The Shipping and Seamen Act of 1908, and its amendment of 1909, provide for an annual survey by Government surveyors of all vessels, with a view to ensuring their seaworthiness. Certificates of survey were issued in 1925–26 to 264 steamers, 509 oil-engine vessels, and 21 sailing-vessels.
The long coast-line of the Dominion is marred in many places by hidden rocks or reefs and other perils to navigation. This has compelled the erection of some forty-three coastal lighthouses of various types. No fewer than twelve of these are situated in the stormy area of Cook Strait and the bays opening therefrom, reaching from where the red and white rays of Cape Farewell light give warning of the seven-mile-long sandspit at the northern extremity of the South Island to the bluff shore marked by the Cape Palliser light at the southern point of the North Island.
The buildings are of varying, kinds, as necessitated by their respective situations. In some thirty cases the light apparatus is classed as of the dioptric order—i.e., a central lamp sending its rays through a combination of surrounding lenses: and in one catadioptric, in which system the light-rays are both refracted and refracted. Automatic lights are used in the remainder of the coastal lighthouses.
The most powerful light is that of Stephen Island, which, placed some 600 ft. above high water, is visible at a distance of 32½ nautical miles. Next in order come Cape Brett fight (altitude 510 ft.) and East Cape (505 feet), both visible at 30½ miles; Godley Head (altitude 450 ft.), visibility 29 miles; Cuvier Island light (altitude 390 ft.) and Mokohinou (altitude 385 ft.), both of which have a visibility of 27 miles. Sixteen other lights have a range of 20 miles or over.
All manually-attended coastal lighthouses are equipped with signalling flags and lamps, the keepers being competent to transmit or receive messages. Coastal lights —i.e., those outside the bounds of the various harbour authorities—are maintained by the Marine Department.
The average cost of erection and equipment of the coastal lighthouses was about £6,000 per light. The two most costly Were Cape Brett Lighthouse (£11,237) on the Auckland Peninsula, and Dog Island Lighthouse (£10,481) in Faveaux Strait. The cost of maintenance of all lighthouses under the control of the Marine Department was for 1925–26—Salaries, £17,575; oil, £1,456; stores and maintenance, £5,189; working-expenses of tender, £21,124; administration expenses. £6,000; interest and sinking-fund charges, £16,570; depreciation, £8,100; total, £76,014. Light dues collected during 1925–26 totalled £78,705.
In the case of any wreck or shipping casualty in New Zealand waters a Collector of Customs, Superintendent of Mercantile Marine, or other person empowered by the Minister of Marine institutes an inquiry into the cause and circumstances of such casualty. If necessary, a formal investigation is held by a Magistrate, who has power to cancel or suspend the certificate of any officer where the damage has resulted from his wrongful act or default.
Should any wreck occur on the coast the Receiver of Wrecks for that district, usually an officer of the Customs, has the necessary authority to be used in the preservation of life and property.
During the year 1925–26, 107 inquiries into shipping casualties were held, the number of vessels involved being 124. The principal casualty was the wreck of the s.s. “Karu” off Cape Maria Van Diemen, in which 2 lives were lost.
A summary of the casualties is given.
| Strandings— | No. | Tonnage. |
|---|---|---|
| Total wrecks | 3 | 1,435 |
| Slight damage | 26 | 12,598 |
| No damage | 20 | 18,899 |
| Collisions— | ||
| Total loss | 1 | 4 |
| Slight damage | 27 | 15,389 |
| No damage | 8 | 554 |
| Fires— | ||
| Total loss | 1 | 19 |
| Slight damage | 9 | 25,308 |
| No damage | 1 | 2,487 |
| Miscellaneous | 28 | 27,435 |
| Totals | 124 | 104,128 |
Table of Contents
RAILWAY history in New Zealand dates from the year 1860 only. In that year a contract was let for the construction of a line from Christchurch to Lyttelton. The first portion of this line was opened on the 1st December, 1863, so that to Canterbury Province belongs the honour of first having railway communication within its borders. Four years later the Lyttelton Tunnel (1 ½ miles long) had been pierced and the line completed. Meanwhile other lines were being proceeded with inland towards the Canterbury Plains. Following the lead of Canterbury, the Provincial Council of Southland commenced in 1863 a line from Invercargill to Bluff Harbour, which was opened on the 5th February, 1867. Driven by the necessity for efficient military transport, the Provincial Council of Auckland in 1863 began the construction of a line from Auckland to Drury.
The effect of the various short railways being constructed by different authorities is apparent in the different gauges adopted. The General Government recommended the adoption of a 5 ft. 6 in. gauge; nevertheless the Canterbury lines were using, a 5 ft. 3 in. gauge, while the Auckland and Otago lines had the standard English gauge of 4 ft. 8 in.
Happily, these troubles were solved by the historic Railways Act of 1870. At that date only forty-six miles of railway were in operation. This Act, which was part of the public-works policy of the late Sir Julius Vogel, provided a general railway policy for the colony. Six years later, when the abolition of the provinces placed the earlier-constructed lines in the hands of the General Government, railway mileage had risen to 718 miles.
Although practically all the railways are State-owned, some were built by private enterprise. Of these the more important were constructed by the Midland and Wellington-Manawatu Railway Companies. The former line, of which some eighty-seven miles were in use, was taken over by the Government on the 27th May, 1895. The latter, from Wellington to Longburn, a distance of eighty-four miles, was acquired by the State by purchase in December, 1908.
On the 4th August, 1923, the Otira Tunnel—the connecting-link of the two railway systems on the east and west coasts of the South Island—was opened for through traffic, and this event marked the completion of one of New Zealand's greatest engineering achievements. The Arthur's Pass Tunnel, as it is sometimes called, is seventh on the list of the world's longest tunnels, and is the longest tunnel in the British Empire.
The contract for driving the tunnel was let to a private firm as far back as 1908, for the sum of nearly £600,000, and the work was to be finished in five years, but events proved that this was impossible. The Government, realizing that the work was of national importance, decided to take over the task, and the construction fell to the lot of the Public Works Department. After a lapse of sixteen years the tunnel was completed at a cost of something like £1,500,000.
The working of the electrified section, Otira - Arthur's Pass, 8 miles 18 chains, including the tunnel of 5 ¼ miles, has been provided for by the erection of a power-station at Otira containing three modern steam boilers and two turbine-driven generators. Each of the five 50-ton electric locomotives attached to the section is capable of hauling a train of 140 tons up the ruling grade of 1 in 33 to Arthur's Pass.
The tunnel enters the mountain-side on the east (Arthur's Pass) at an altitude of 2,435 ft. above sea-level, burrows under the summit of Arthur's Pass on a downward course, and emerges after 5 miles 25 chains 12 feet at an altitude of 1,586 ft. above sea-level.
The development of automatic and electric-power signalling has been greatly. extended since its introduction on the New Zealand railways some years ago.
At the present time automatic signalling controlling the safe running of trains is in use between Lambton and Upper Hutt, a distance of 21 miles; between Addington and Stillwater, 97 miles; between Dunedin and Ravensbourne, 2 ¾ miles; between Auckland and Westfield, 7 ½ miles. These installations have been carried out with the most up-to-date signalling appliances in the world: the old type of semaphore signal has been discarded, and the signalling indications are given by means of coloured lenses.
In addition to automatic signalling, power signalling for the operation of yards has largely superseded the older form of mechanical signalling. The use of electric power for these purposes offers many advantages over the older mechanical system, inasmuch that points can be worked at great distances from a central point, and the operation can be automatically controlled by the movements of the trains themselves.
The use of electric power on the New Zealand railways is increasing to a great extent for many purposes, including pumping plants for the supply of water for engines outside stations, for driving electrical machinery in the shops, and the lighting of stations.
The system of railway-management has recently been reorganized and is at present carried on by a Board of three, consisting of a Chairman and two other members. There are two Divisional Superintendents, one in charge of the North Island lines with headquarters at Auckland and the other at Christchurch who controls the South Island system. In regard to the earlier organization of railway-management it was in the year 1876 that the railways of New Zealand passed from the control of the Provincial Governments to the Public Works Department. A few years later the opened lines were handed over to the Working Railways Department. and in 1889 a Board of three Railway Commissioners was appointed. This form of management, however, lasted only for five years, at the end of which period a General Manager, responsible to the Minister of Railways, took over the administration, and this system continued for close on thirty years.
At the 31st March, 1926, there were some 3,138 miles of State railways open for traffic, divided into seven distinct sections, as follows:—
| Section. | Length. Miles. |
|---|---|
| North Island main lines and branches | 1,276 |
| Kaihu | 24 |
| Gisborne | 60 |
| Total. North Island | 1,360 |
| South Island main lines and branches | 1,618 |
| Westport | 43 |
| Nelson | 61 |
| Picton | 56 |
| Total, South Island | 1,778 |
Government railways are constructed by the Public Works Department, and are transferred to the Railways Department when completed. During the year 1925–26 30 miles in the North Island and 23 miles in the South Island were taken over by the Railways Department.
The gauge is 3 ft. 6 in., and a steel rail of 70 lb. weight per lineal yard is the standard for the permanent-way, and is in use on 1,554 miles of line. Some 1,539 miles are still in 53 lb., 55 lb., and 56 lb. steel rails, and most of the remainder is of lighter material. Sleepers, which are laid down to the number of 2,100 to the mile, are principally Australian hardwoods or New Zealand silver-pine or totara.
All carriages and wagons required for use on the State railways have, since 1901, been manufactured in the railway workshops of the Dominion, with the exception of 2,500 four-wheeled wagons imported from England in 1921–22. Most of the locomotives also are now built in the Dominion, partly in the railway workshops and partly by an engineering firm at Thames. The Railways Department commenced building new engines in 1889 at the Addington Workshops (Christchurch). Since that year building operations have been gradually extended, the work being restricted to two of the four principal workshops of the Department. One of these, Addington, has specialized in tender-engines, while the other, Hillside (Dunedin), has confined itself to the construction of tank engines. Up to the present time 217 new locomotives have been built by the Department, of which 85 were tender-engines and 132 tank engines. The weights of the tender-engines in working trim vary from 63 to 94 tons, while those of the tank engines run from 29 ½ to 71 tons.
A new passenger locomotive, Class AB, was brought into operation during 1915, and has been adopted as a standard type. This is a simple superheated tender-engine of the “Pacific” type—weight in working trim, 79 tons; tractive power, 20,000 lb. The AB locomotive is of sufficient power to be also easily adapted for use as a goods engine. The standard goods locomotive used is of the four-cylinder balanced compound type, weighs 94 tons, and has a tractive power of 29,840 lb. Standard carriages are 50 ft. in length, fitted with chair seats to accommodate forty-four passengers, and lighted by the Pintsch-gas system. Electric lighting in passenger-cars is now being substituted for gas lighting, and express trains thus equipped are running on the main trunk systems in both Islands. The Westinghouse brake in fitted to all rolling-stock with the exception of that on the Kaihu, Picton, Nelson, and Westport Sections.
Information as to the rolling-stock in use on the State railways in each of the last ten years is given in the following table:—
| Year ended 31st March. | Locomotives. | Passenger-vehicles. | Wagons and Brake-vans. |
|---|---|---|---|
| 1917 | 607 | 1,480 | 22,380 |
| 1918 | 624 | 1,488 | 22,517 |
| 1919 | 620 | 1,489 | 22,658 |
| 1920 | 616 | 1,492 | 22,937 |
| 1921 | 608 | 1,492 | 23,119 |
| 1922 | 637 | 1,496 | 23,974 |
| 1923 | 639 | 1,498 | 26,106 |
| 1924 | 655 | 1,506 | 26,198 |
| 1925 | 662 | 1,568 | 26,488 |
| 1926 | 704 | 1,602 | 26,757 |
The following statement shows the number of miles of Government railways open in the Dominion, the number of train-miles travelled and of passengers carried, and the tonnage of goods traffic for the last twenty years:—
| Year ended 31st March, | Length open (Miles). | Train-mileage. | Passengers. | Season Tickets issued. | Goods and Live-stock.*Tons. |
|---|---|---|---|---|---|
* The equivalent tonnage for live-stock has been given. | |||||
| 1907 | 2,458 | 6,755,454 | 9,600,786 | 165,504 | 4,824,563 |
| 1908 | 2,474 | 7,051,274 | 9,756,716 | 185,174 | 5,070,176 |
| 1909 | 2,674 | 7,458,236 | 10,457,144 | 192,547 | 5,135,408 |
| 1910 | 2,717 | 7,889,166 | 11,141,142 | 199,371 | 5,490,018 |
| 1911 | 2,753 | 8,141,075 | 11,200,613 | 222,104 | 5,863,674 |
| 1912 | 2,798 | 8,371,687 | 11,891,134 | 236,957 | 5,887,908 |
| 1913 | 2,851 | 9,016,224 | 13,123,879 | 265,259 | 6,246,128 |
| 1914 | 2,854 | 9,319,268 | 13,355,893 | 287,037 | 6,019,633 |
| 1915 | 2,945 | 9,383,420 | 13,565,772 | 302,912 | 6,453,472 |
| 1916 | 2,960 | 9,356,522 | 14,201,506 | 330,622 | 6,370,945 |
| 1917 | 2,960 | 9,146,331 | 14,173,115 | 355,832 | 6,239,172 |
| 1918 | 2,983 | 7,468,646 | 11,408,156 | 322,487 | 5,742,968 |
| 1919 | 2,983 | 7,477,583 | 11,374,521 | 351,124 | 5,613,739 |
| 1920 | 2,996 | 7,408,608 | 12,760,814 | 400,621 | 6,000,279 |
| 1921 | 3,009 | 9/303,392 | 15,315,640 | 464,691 | 6,487,279 |
| 1922 | 3,021 | 8,717,265 | 14,262,410 | 472,865 | 6,321,351 |
| 1923 | 3,028 | 8,346,731 | 14,256,610 | 485,681 | 6,618,588 |
| 1924 | 3,053 | 9,024,503 | 13,836,311 | 525,744 | 6,925,517 |
| 1925 | 3,085 | 9,083,623 | 12,424,012 | 537,544 | 7,033,459 |
| 1926 | 3,138 | 10,319,407 | 11,813,480 | 600,292 | 7,256,142 |
The total coaching train-mileage in 1925–26 was 3,495,331. and the total freight train-mileage 6,824,076. Engine-mileage during the year aggregated 14,657,039, as compared with 12,854,287 in 1924–25. Net ton-miles for 1925=26 were 459,900,000, as compared with 431,231,000 in the previous year.
The figures for passengers in the foregoing table are exclusive of season-ticket holders. If these be included the total number of passengers in 1925–26 becomes 27,853,414, as against 26,106,859 in 1924–25.
The figures of total passengers for each year since 1911–12 (prior to which this information is not available) are as follows:—
| Year ended 31st March. | Passengers (including season-ticket holders). | Year ended 31st March. | Passengers (including season-ticket holders). |
|---|---|---|---|
| 1912 | 20,336,577 | 1920 | 24,582,186 |
| 1913 | 22,310,867 | 1921 | 28,821,783 |
| 1914 | 23,173,472 | 1922 | 28,121,763 |
| 1915 | 23,542,903 | 1923 | 28,221,362 |
| 1916 | 24,600,693 | 1924 | 28,436,475 |
| 1917 | 24,782,602 | 1925 | 26,106,859 |
| 1918 | 21,438,325 | 1926 | 27,653,414 |
| 1919 | 22,030,327 |
Live-stock carried in 1925–26 comprised 391,823 cattle and 8,220,135 sheep, equivalent to a tonnage of 447,539. The only other item shown separately in the railway statistics is timber, of which 771,576 tons were carried in 1925–26.
The total cost of construction of open lines up to the 31st March, 1926, was £47,608,676. The amount spent on lines in course of construction and not handed over to the Working Railways Department for traffic purposes was £6,107,779, making the total capital invested in State railways £53,716,455. The figures for each of the last five years are given.
| CAPITAL INVESTED IN STATE RAILWAYS AT 31ST MARCH, 1922–26. | |||||
|---|---|---|---|---|---|
| — | 1921–22. | 1922–23. | 1923–24. | 1924–25. | 1925–26. |
| £ | £ | £ | £ | £ | |
| Lines open for traffic | 39,309,097 | 40,275,161 | 41,399,427 | 44,570,746 | 47,608,676 |
| Lines under construction | 5,380,651 | 6,575,910 | 7,339,394 | 6,262,754 | 6,107,779 |
| Totals | 44,689,748 | 46,851,071 | 48,738,821 | 50,833,500 | 53,716,455 |
So varied are the geographical features of the Dominion that a great disparity exists in the cost of constructing the individual sections of lines. The numerous mountain-chains and the innumerable rivers fed by the heavy rainfall make railway-construction in general both difficult and expensive, as the next statement shows.
| COMPARISON OF CAPITAL COST AND OF REVENUE OF EACH SECTION, 1925–26. | ||||
|---|---|---|---|---|
| Section. | Capital Cost of Open Lines to 31st March, 1926. | Capital Cost per Mile (Open Lines). | Net Revenue, 1925–26. | |
| Per Mile of Open Line. | Per Cent. of Capital Cost. | |||
| £ | £ | £ | £ | |
* Loss. | ||||
| North Island— | ||||
| Kaihu | 189,165 | 7,882 | -122.63* | .. |
| Gisborne | 848,622 | 14,143 | -25.75* | .. |
| Main lines and branches | 22,381,992 | 17,541 | 915.29 | 5.55 |
| Totals | 23,419,779 | 17,220 | 855.46 | 4.97 |
| South Island— | ||||
| Westport | 697,859 | 15,810 | 715.00 | 4.41 |
| Nelson | 437,135 | 7,166 | -137.28* | .. |
| Picton | 680,883 | 12,158 | -45.50* | .. |
| Main lines and branches | 20,558,543 | 12,706 | 149.23 | 1.20 |
| Totals | 22,374,420 | 12,518 | 146.95 | 1.17 |
| Lake Wakatipu steamer service | 44,300 | .. | .. | .. |
| Subsidiary services | 1,620,070 | .. | .. | 13.15 |
| Stock of stores, &c. | 150,107 | .. | .. | .. |
| Grand totals | 47,608,676 | 15,172 | 45402 | 4.35 |
The cost of construction has been relatively greater in the North Island than in the South, but the net revenue per mile of open line and per cent. of capital cost has in recent years been considerably greater in the North than in the South. The North Island main lines and branches and the Westport Section show a greater capital cost per mile than any other section, but they give the highest percentage of net revenue.
The railways in New Zealand have never been regarded, or run, as a profit-making concern. Even if practicable, there is little doubt that such a policy would not meet with the approval of the public, nor would it bring about any material improvement in the condition of affairs as a whole. If, in the construction and working of the railway, considerations of financial return only were regarded, much greater profit would be earned. The railways have contributed in a great measure towards bringing the Dominion to its present high state of productiveness, and have given practical assistance in the development of the country, and have encouraged local industry. For many years a profit of 3 per cent. was regarded as sufficient, and any excess over this rate was followed by reductions in passenger charges or in freights. Consequent on the extension of settlement and the soundness of the Dominion's industries, a higher rate than 3 per cent. has been aimed at in recent years. The rate looked for in 1909–10 was 3¾ per cent., and in 1910–11 4 per cent., followed in 1911–12 by a return to 3 ¾ per cent. These rates were obtained, as will be seen from the table following. The rates for 1913–14 and 1914–15 fell below expectations, a result due in the earlier year to the extended strike which obtained during nearly three months of the year and to the outbreak of smallpox in the North Island, and in the later year to the outbreak of the European War. In 1915–16 and 1916–17, however, there were considerable increases, bringing the met revenue up to 4 8/4 per cent. and 5¼ per cent. respectively. The returns for the next three years all fell slightly below the figure for 1916–17; in 1920–21 there was an abrupt fall to somewhat less than 3 ½ per cent., and in 1921–22 the unprecedentedly low figure of slightly over 1 per cent. was reached, a state of affairs brought about by high running-costs, the competition of motor transport, and especially the state of depression which was in evidence during the year. The year 1922–23 showed a considerable improvement over the preceding period, the return being slightly over 3 per cent.; while for the year 1923–24 the policy rate of 3 ¾ per cent. was slightly exceeded. The restrictions imposed by the Health Department on account of the epidemic of infantile paralysis considerably affected the passenger traffic for the year 1924–25, and to this may he attributed the decrease in the rate of interest earned—viz., slightly over 3 ½ per cent.
In 1924 the Government decided upon a financial reorganization of the railways, and an entirely new system of accounts, based on commercial practice, was brought into operation on the 1st April, 1925.
The first and most important step in this direction was the establishment of a separate Working Railways Account into which all earnings are paid and from which all working-expenses, superannuation subsidies, and interest on capital are met. The interest on capital is based on the actual rates payable on the various loans.
The new financial policy embodies the setting-up of Renewals, Betterments, and Equalization Funds, and also provides for payment of subsidies from the Consolidated Fund for losses on operation of certain developmental lines.
The net revenue for the first year (1925–26) under the new system gave a return of 4.35 per cent. on the average capital invested in opened lines, after setting aside the sum of £317,142 as a Renewals and Insurance Fund, as compared with 3.55 per cent. for the previous year, when no like provision was made.
Information as to the revenue of the railways during each of the last twenty years is given in the following table:—
| RAILWAY REVENUE, 1906–7 TO 1925–26. | |||||||||
|---|---|---|---|---|---|---|---|---|---|
| Year ended 31st March. | Gross Revenue from | Total Gross Revenue. | Net Revenue. | Percentage of Net Revenue to Capital Cost. | |||||
| Passenger-fares. | Parcels, Luggage, and Mails. | Goods and Live-stock. | Rents and Miscellaneous. | ||||||
| £ | £ | £ | £ | £ | £ | £ | s. | d. | |
* Includes £359,540 subsidy from Consolidated Fund in respect of services rendered by non-paving developmental branch lines and Isolated sections. | |||||||||
| 1907 | 892,053 | 151,913 | 1,498,686 | 81,948 | 2,624,600 | 812,118 | 3 | 9 | 1 |
| 1908 | 912,978 | 176,876 | 1,582,328 | 89,756 | 2,761,938 | 812,179 | 3 | 6 | 8 |
| 1909 | 1,011,658 | 187,040 | 1,630,704 | 100,124 | 2,929,526 | 814,711 | 3 | 2 | 7 |
| 1910 | 1,171,040 | 192,585 | 1,772,547 | 113,618 | 3,249,790 | 1,080,316 | 3 | 16 | 0 |
| 1911 | 1,223,412 | 193,789 | 1,961,078 | 115,903 | 3,494,182 | 1,190,910 | 4 | 1 | 3 |
| 1912 | 1,319,114 | 203,334 | 2,032,785 | 121,276 | 3,676,509 | 1,210,613 | 3 | 19 | 7 |
| 1913 | 1,461,873 | 215,209 | 2,157,686 | 136,234 | 3,971,002 | 1,265,393 | 4 | 0 | 9 |
| 1914 | 1,450,480 | 236,761 | 2,209,398 | 146,689 | 4,043,328 | 1,163,005 | 3 | 12 | 3 |
| 1915 | 1,482,382 | 227,521 | 2,249,399 | 146,155 | 4,105,457 | 1,185,002 | 3 | 10 | 7 |
| 1916 | 1,722,702 | 236,705 | 2,423,493 | 165,456 | 4,548,356 | 1,637,473 | 4 | 14 | 4 |
| 1917 | 1,873,048 | 243,832 | 2,498,862 | 185,068 | 4,800,810 | 1,873,946 | 5 | 5 | 11 |
| 1918 | 1,802,597 | 254,110 | 2,465,241 | 165,752 | 4,687,700 | 1,644,793 | 4 | 11 | 11 |
| 1919 | 1,950,281 | 258,525 | 2,608,336 | 171,490 | 4,988,632 | 1,680,057 | 4 | 12 | 11 |
| 1920 | 2,303,987 | 290,453 | 2,956,237 | 201,810 | 5,752,487 | 1,647,420 | 4 | 10 | 8 |
| 1921 | 2,658,079 | 335,754 | 3,676,665 | 238,033 | 6,908,531 | 1,271,931 | 3 | 8 | 4 |
| 1922 | 2,418,227 | 339,482 | 3,646,594 | 239,288 | 6,643,591 | 405,864 | 1 | 1 | 4 |
| 1923 | 2,420,620 | 393,322 | 3,671,008 | 242,852 | 6,727,802 | 1,225,305 | 3 | 0 | 10 |
| 1924 | 2,349,599 | 406,832 | 3,953,213 | 274,567 | 6,984,211 | 1,580,445 | 3 | 16 | 6 |
| 1925 | 2,288,571 | 417,550 | 4,122,017 | 284,386 | 7,112,524 | 1,567,108 | 3 | 11 | 0 |
| 1926 | 2,541,364 | 410,272 | 4,648,263 | 860,863* | 8,460,762 | 1,992,334 | 4 | 6 | 11 |
The revenue from passenger-fares during the year 1925–26 represented an expenditure on railway travel of £1 16s. 6d. per head of mean population, including Maoris. The total revenue was equal to £6 1s 7d. per capita.
A table is added showing information as to railway revenue in each of the Australian States for the year ended 30th June, 1925. Figures for New Zealand or the year ended 31st March, 1925, are also given.
| REVENUE OF GOVERNMENT RAILWAYS IN AUSTRALIA AND NEW ZEALAND, 1924–25. | |||||||
|---|---|---|---|---|---|---|---|
| State. | Miles of Line open. | Train-miles run (,000 omitted). | Gross Revenue (,000 omitted). | Net Revenue. | |||
| Amount (,000 omitted). | Per Train-mile. | Per Cent. of Capital. | |||||
| £ | £ | s. | d. | ||||
* Loss † Year ended 31st March, 1925. | |||||||
| Queensland | 6,114 | 12,108 | 7,109 | 1,684 | 2 | 9 | 3.24 |
| New South Wales | 5,656 | 23,305 | 16,769 | 4,830 | 4 | 2 | 5.01 |
| Victoria | 4,484 | 17,482 | 12,759 | 3,329 | 3 | 10 | 4.94 |
| South Australia | 2,452 | 6,653 | 4,013 | 1,077 | 3 | 3 | 4.90 |
| Western Australia | 3,733 | 4,841 | 3,360 | 1.012 | 4 | 2 | 4.98 |
| Tasmania | 673 | 1,386 | 548 | 29 | 0 | 5 | 0.45 |
| Commonwealth Railways | 1,051 | 472 | 257 | -37* | -1 | 7* | -0.50* |
| Totals for Australia | 24,163 | 66,247 | 44,815 | 11,924 | 3 | 7 | 3.70 |
| New Zealand† | 3,085 | 9,084 | 7,112 | 1,567 | 3 | 5 | 3.55 |
Expenditure on State railways open for traffic during the year ended 31st March, 1926, amounted to £6,164,570, or 81.23 per cent. of the gross revenue, as compared with 77.97 per cent. in 1924–25 and 64.91 per cent. in 1917–18. The figures for each of the last twenty years are as follow:—
| Year ended 31st March. | Expenditure. | |
|---|---|---|
| Amount. £ | Per Cent. of Revenue. | |
| 1907 | 1,812,482 | 69.06 |
| 1908 | 1,949,759 | 70.59 |
| 1909 | 2,114,815 | 72.19 |
| 1910 | 2,169,474 | 66.76 |
| 1911 | 2,303,272 | 65.92 |
| 1912 | 2,465,896 | 67.07 |
| 1913 | 2,705,609 | 68.13 |
| 1914 | 2,880,323 | 71.24 |
| 1915 | 2,920,455 | 71.14 |
| 1916 | 2.910,883 | 64.00 |
| 1917 | 2,926,864 | 60.97 |
| 1918 | 3,042,907 | 64.91 |
| 1919 | 3,308,575 | 66.32 |
| 1920 | 4,105,067 | 71.37 |
| 1921 | 5,636,601 | 81.59 |
| 1922 | 6,237,727 | 93.89 |
| 1923 | 5,502,497 | 81.79 |
| 1924 | 5,403,766 | 77.37 |
| 1925 | 5,545,416 | 77.97 |
| 1926 | 6,164,570 | 81.23 |
The expenditure under various heads for each of the last eight years has been as follows:—
| Year ended 31st March. | Maintenance of Ways end Works. | Maintenance of Signals. | Maintenance of Rolling-stock. | Locomotive Transportation. | Traffic Transportation. | Head Office and General Charges. | Total. |
|---|---|---|---|---|---|---|---|
| £ | £ | £ | £ | £ | £ | £ | |
| 1919 | 715,858 | 36,700 | 566,140 | 815,656 | 1,039,595 | 134,626 | 3,308,575 |
| 1920 | 783,033 | 54,877 | 724,473 | 1,061,018 | 1,309,899 | 171,767 | 4,105,067 |
| 1921 | 983,940 | 69,109 | 984,244 | 1,672,568 | 1,722,834 | 203,906 | 5,636,601 |
| 1922 | 1,111,883 | 72,343 | 1,113,170 | 2,020,994 | 1,716,389 | 202,948 | 6,237,727 |
| 1923 | 1,040,892 | 67,425 | 1,043,590 | 1,613,564 | 1,541,132 | 195,894 | 5,502,497 |
| 1924 | 1,143,281 | 70,912 | 1,048,567 | 1,395,491 | 1,541,108 | 204,407 | 5,403,766 |
| 1925 | 1,113,048 | 81,201 | 1,083,788 | 1,408,927 | 1,611,947 | 246,505 | 5,545,416 |
| 1926 | 1,144,385 | 105,064 | 1,311,317 | 1,636,620 | 1,743,641 | 223,543 | 6,164,570 |
During the last eight years the expenditure has increased from £3,308,575 in 1918–19 to £6,164,570 in 1925–26, the increase of £2,855,995 being spread over the whole of the six headings shown in the above table in varying proportion. Locomotive transportation was responsible for £820,964, maintenance of rolling-stock £745,177, traffic transportation £704,046, and maintenance of ways and works £428,527. The increase per cent. over the period works out at 86. Maintenance of signals, with 186 per cent. increase, had the highest increase of any one group, and maintenance of ways and works, with a 60-per-cent. rise, had the lowest. Locomotive transportation, which had the highest numerical increase, had 101 per cent., and maintenance of rolling-stock and traffic transportation had percentage increases of 132 and 68 respectively.
A table showing the percentage of total expenditure under each of the various headings is next given:—
| Year ended 31st March. | Maintenance of Ways and Works. | Maintenance of Signals. | Maintenance of Rolling-stock. | Locomotive Transportation. | Traffic Transportation. | Head Office and General Charges. | Total. |
|---|---|---|---|---|---|---|---|
| Per Cent. | Per Cent. | Per Cent. | Per Cent. | Per Cent. | Per Cent. | Per Cent. | |
| 1919 | 21.64 | 1.11 | 17.11 | 24.65 | 31.42 | 4.07 | 100 |
| 1920 | 19.07 | 1.34 | 17.65 | 25.85 | 31.91 | 4.18 | 100 |
| 1921 | 17.47 | 1.22 | 17.46 | 29.67 | 30.56 | 3.62 | 100 |
| 1922 | 17.83 | 1.16 | 17.84 | 32.40 | 27.52 | 3.25 | 100 |
| 1923 | 18.92 | 1.22 | 18.97 | 29.32 | 28.01 | 3.56 | 100 |
| 1924 | 21.16 | 1.31 | 19.40 | 25.83 | 28.52 | 3.78 | 100 |
| 1925 | 20.07 | 1.46 | 19.54 | 25.41 | 29.07 | 4.45 | 100 |
| 1926 | 18.56 | 1.70 | 21.27 | 26.55 | 28.29 | 3.63 | 100 |
There have not been any great changes during the period. Maintenance of rolling-stock shows an increase from 17.11 to 21.27 per cent., while maintenance of ways and works and traffic transportation show decreases from 21.64 and 31.42 to 18.56 and 28.29 respectively.
The number of men employed in operating the State railways at the 31st March, 1926, was 17,990. The staff is divided into two divisions—namely, the first or clerical division, and the second or out-of-door division—and is further classed in four branches, as shown in the following table, which gives the number of employees in March of each of the last ten years:—
| RAILWAY EMPLOYEES, 1916–17 TO 1925–26. | |||||
|---|---|---|---|---|---|
| As at 31st March. | General. | Traffic. | Maintenance. | Locomotive. | Total. |
| 1917 | 675 | 4,798 | 3,586 | 4,649 | 13,708 |
| 1918 | 660 | 4,612 | 3,410 | 4,320 | 13,002 |
| 1919 | 661 | 4,505 | 3,347 | 3,878 | 12,391 |
| 1920 | 876 | 4,740 | 3,364 | 4,405 | 13,385 |
| 1921 | 927 | 4,930 | 3,576 | 4,819 | 14,252 |
| 1922 | 974 | 5,138 | 3,855 | 5,695 | 15,662 |
| 1923 | 1,038 | 5,039 | 3,796 | 5,855 | 15,728 |
| 1924 | 1,147 | 5,124 | 4,087 | 5,995 | 16,353 |
| 1925 | 1,495 | 5,212 | 4,194 | 6,345 | 17,246 |
| 1926 | 1,621 | 5,466 | 4,316 | 6,587 | 17,990 |
Railway employees are under a system of classification, first introduced in 1896, and revised at various times since then.
Appeal Boards (one in each Island) have been constituted to hear and redress grievances of men dissatisfied with decisions respecting the withholding of annual increments, promotion, loss of status, or breaches of discipline involving fines in, excess of £2. Each Board consists of a Magistrate and two members of the Rail-way service elected by the members thereof. The Minister of Railways has the power of veto in respect of any decision of the Appeal Board.
A superannuation fund in connection with the Railway service was established in 1903. Full information concerning this is given in the section dealing with “Pensions, Superannuation, &c.”
On the morning of Friday, 6th July, 1923, the express train from Auckland to Wellington ran into a slip near Ongarue Station. A huge boulder struck the engine of the train just as it was passing through the cutting, causing the engine to be badly derailed and some of the carriages to be telescoped. Seventeen passengers were killed and twenty-nine more or less injured. With the exception of this accident the history of railways in New Zealand has been one of comparative freedom from accidents of a serious nature. A table is given dealing with railway accidents during each of the last ten years.
| RAILWAY ACCIDENTS, 1916–17 TO 1925–26. | |||||||
|---|---|---|---|---|---|---|---|
| Year ended 31st March. | To Passengers. | To Employees. | To Others. | Fatal. | Serious. | Minor. | Total. |
| 1917 | 25 | 852 | 22 | 24 | 8 | 867 | 899 |
| 1918 | 11 | 765 | 29 | 22 | 13 | 770 | 805 |
| 1919 | 33 | 715 | 29 | 23 | 22 | 732 | 777 |
| 1920 | 22 | 827 | 39 | 42 | 34 | 812 | 888 |
| 1921 | 10 | 987 | 41 | 24 | 44 | 970 | 1,038 |
| 1922 | 8 | 1,215 | 16 | 22 | 43 | 1,174 | 1,239 |
| 1923 | 18 | 1,448 | 60 | 64 | 35 | 1,427 | 1,526 |
| 1924 | 74 | 1,777 | 51 | 62 | 40 | 1,800 | 1,902 |
| 1925 | 23 | 1,657 | 94 | 37 | 30 | 1,707 | 1,774 |
| 1926 | 63 | 1,909 | 65 | 55 | 42 | 1,940 | 2,037 |
Of the persons meeting with fatal accidents in 1925–26, 10 were passengers, 21 employees, and 24 neither passengers nor employees.
Private railways have a total mileage of 116 miles. A complete list is as follows:—
| Railway. | Location. | Length of Railway. | ||
|---|---|---|---|---|
| M. | C. | L. | ||
| Waipa Railway and Collieries (Limited) | Ngaruawahia | 5 | 50 | 0 |
| Taupo Totara Timber Company (Limited) | Putaruru | 50 | 40 | 0 |
| Waihi Gold-mining Company (Limited) | Waikino | 5 | 72 | 0 |
| Sanson Tramway | Sanson-Himatangi | 17 | 0 | 0 |
| Castlecliff Railway | Wanganui-Castlecliff | 3 | 40 | 0 |
| Napier Harbour Board's line | Port Ahuriri | 1 | 24 | 50 |
| Waronui Coal Company | Milton | 5 | 33 | 0 |
| Taratu Coal Company | Lovell's Flat | 7 | 47 | 0 |
| Kaitangata Coal Company | Stirling | 5 | 45 | 0 |
| Dunedin City Corporation's Ocean Beach Railway | Dunedin (about) | 3 | 14 | 0 |
| Ohai Railway | From Wairio | 5 | 60 | 0 |
| Denniston Incline (Westport Coal Company's line) | Waimangaroa-Conn's Creek | 1 | 2 | 0 |
| Paparoa Company's Railway | (Worked by N.Z.R.) | 1 | 68 | 21 |
| Reefton Coal Company | Reefton | 2 | 20 | 0 |
| Tongariro Timber Company | Kakahi | .. | ||
| Total mileage | .. | 116 | 35 | 71 |
Table of Contents
THE total mileage of formed roads in the Dominion at the 31st March, 1925, was 46,197, in addition to which there were also 5,219 miles of bridle-tracks, and 16,317 miles of unformed legal roads. The figures for the four classes of local authorities concerned are as follows:—
| LENGTH OF ROADS AT 31ST MARCH, 1925. | |||||
|---|---|---|---|---|---|
| — | Counties. | Boroughs. | Town Districts. | Road Districts. | Total. |
| Miles. | Miles. | Miles. | Miles. | Miles. | |
| Roads and streets formed to not less than dray-width and paved or surfaced with— | |||||
| Bituminous or cement concrete | .. | 49 ¼ | 4 | 5 ½ | 58 ¾ |
| Bitumen or tar | 337 ¾ | 264 ½ | 17 ¼ | 19 ½ | 639 |
| Metal or gravel | 24,078 | 2,227 | 365 ¼ | 1,536 ½ | 28,206 ¾ |
| Other or unspecified material | 47 | 325 ¾ | 48 ½ | .. | 421 ¼ |
| Roads and streets formed to not less than dray-width, but not paved or surfaced | 15,705 | 314 ½ | 138 ¾ | 712 ¾ | 16,871 |
| Total formed roads | 40,167 ¾ | 3,181 | 573 ¾ | 2,274 ¼ | 46,196 ¾ |
| Bridle-tracks | 5,038 ½ | 17 ¼ | 3 ½ | 160 ¼ | 5,219 ½ |
| Unformed legal roads | 15,027 ¼ | 379 ¼ | 94 ½ | 815 ¾ | 16,316 ¾ |
| Total of all roads | 60,233 ½ | 3,577 ½ | 671 ¾ | 3,250 ¼ | 67,733 |
As in the case of railway-construction, the formation of roads in many parts of the Dominion has been attended with considerable difficulties, arising from the configuration of the county and the abundance and frequency of rivers. As illustrating the latter aspect, the following table, showing the number and lengths of bridges incorporated in the roads system of the Dominion, is of interest. Only bridges 25 ft. or over in length have been taken into account, no official enumeration having been made of the innumerable culverts and short bridges that have had to be constructed to cross narrow ravines and watercourses.
| BRIDGES IN ROAD SYSTEM, 31ST MARCH, 1925. | ||||||||||
|---|---|---|---|---|---|---|---|---|---|---|
| Material of which constructed. | Counties. | Boroughs. | Town Districts. | Road Districts. | Totals. | |||||
| Number. | Total Length. | Number. | Total Length | Number. | Total Length. | Number. | Total Length. | Number. | Total Length. | |
| Ft. | Ft. | Ft. | Ft. | Ft. | ||||||
| Iron and steel | 109 | 14,675 | 19 | 5,506 | 2 | 105 | 1 | 29 | 131 | 20,315 |
| Stone and concrete | 345 | 31,743 | 56 | 4,746 | 6 | 325 | 1 | 26 | 408 | 36,840 |
| Australian or other hardwood | 1,362 | 164,994 | 79 | 13,055 | 13 | 2,013 | 12 | 467 | 1,466 | 180,529 |
| Native timbers | 1,969 | 161,280 | 47 | 5,532 | 9 | 310 | 10 | 435 | 2,035 | 167,557 |
| Other and unspecified | 68 | 8,441 | 6 | 160 | .. | .. | .. | .. | 74 | 8,601 |
| Totals | 3,853 | 381,133 | 207 | 28,999 | 30 | 2,753 | 24 | 957 | 4,114 | 413,842 |
Road-construction in New Zealand has been carried out partly by the Government and partly by local bodies, financial assistance being largely accorded by the Government towards local-body activities in this direction. From the inauguration of the public-works scheme in 1870 until the 31st March, 1926, the sum of £15,684,081 had been expended out of the Public Works Fund on the construction of roads and bridges. Considerable further expenditure has been paid out of the Land for Settlements Account on the construction of roads to open up Crown lands, and out of the National Endowment Account for the roading of national-endowment lands. Expenditure out of the Main Highways Account is dealt with farther on in this section.
Until recently only a small proportion of the total road-mileage outside of boroughs was represented by roads with permanent surfacing. The, advent of the motor-car, however, entirely changed the complexion of the roading problem in New Zealand, as elsewhere, and the demand for better roads arose very shortly after motor transport became an appreciable factor. Later on, with the rapid increase in the use of motor-vehicles, particularly heavy ones, the position became acute, and it was soon quite evident that the type of road that was suitable for slow-moving horse-drawn traffic was inadequate.
In counties where the country was sparsely populated, and the revenue derivable from rates was low, certain lengths of road have in the past been maintained more or less by means of grants or subsidies from the Government. It was found in New Zealand, as in other parts of the world, that under the strain of motor-traffic the roads were deteriorating, while the popular clamour that they be improved to meet modern conditions was insistent. This led in 1921 to the introduction of a Main Highways Bill, which provided that all works of construction and maintenance on certain specified highways were to be carried out by the Government without any contribution from local authorities. The mileage then proposed was about 2,000 miles, but the Bill provided that this could from time to time be extended.
It was contended, however, by the local authorities that the creation of these main highways under direct Government operation would lead to dual control and overlapping supervision, and also that it was undesirable to deprive the local authorities of all powers over roads within the areas under their jurisdiction. Further, it was claimed that the scheme, by not covering a sufficient length of roads, did not give adequate relief to the local authorities. In addition, the scheme proposed to spend all the money derived from the proposed motor-taxation on a limited length of roads, a great proportion of which were running parallel with railways, and depriving of any assistance the roads that brought the produce of the country to the railways. For these reasons this Bill did not become law; but in 1922 a modified Bill again came before Parliament, and was finally passed as the Main Highways Act, 1922.
For the purposes of the Act a Board called the “Main Highways Board” was provided for. The Main Highways Board consists of the Engineer-in-Chief and Under-Secretary of the Public Works Department (Chairman); the Assistant Engineer-in-Chief and the Chief Clerk of the Public Works Department; two representatives of County Councils; and one representative of owners of motor-vehicles.
The Dominion has been divided into eighteen highway districts, which are composed of groups of counties, suitable, by geographical situation and community of interest, for so being grouped. In the majority of cases the constituent counties acquiesced in the grouping; in the few cases where they did not do so the Main Highways Board exercised the authority conferred by the Act. The list of highway districts, with the counties included in each, is as follows:—
| District Number. | District Name. | Counties included. |
|---|---|---|
| 1 | Auckland North | Mongonui, Hokianga, Bay of Islands, Whangaroa, Hobson, Whangarei, Otamatea, Rodney, Waitemata. |
| 2 | Auckland South | Eden, Manukau, Franklin, Waikato, Raglan, Waipa, Coromandel, Thames, Hauraki Plains, Ohinemuri, Piako, Matamata. |
| 3 | Tauranga | Tauranga, Rotorua, Whakatane, Opotiki, Taupo. |
| 4 | Gisborne | Matakaoa, Waiapu, Uawa, Cook, Waikohu. |
| 5 | Napier | Wairoa, Hawke's Bay, Waipawa, Waipukurau, Patangata, Dannevirke, Weber, Woodville. |
| 6 | King-country | Waitomo, Taumarunui, Ohura, Kaitieke, Kawhia, Otorohanga. |
| 7 | Taranaki | Clifton, Whangamomona, Taranaki, Inglewood, Egmont Stratford, Waimate West, Eltham, Hawera. |
| 8 | Wanganui | Patea, Waitotara, Waimarino, Wanganui, Rangitikei. |
| 9 | Wellington West | Kiwitea, Pohangina, Oroua, Kairanga, Manawatu, Horowhenua, Hutt, Makara. |
| 10 | Wellington East | Pahiatua, Akitio, Eketahuna, Mauriceville, Castlepoint, Masterton, Wairarapa South, Featherston. |
| 11 | Nelson | Collingwood, Takaka, Waimea, Sounds, Marlborough, Murchison. |
| 12 | West Coast | Buller, Inangahua, Grey, Westland. |
| 13 | Canterbury North | Awatere, Kaikoura, Amuri, Cheviot, Waipara. |
| 14 | Canterbury Central | Tawera, Oxford, Ashley, Kowai, Rangiora, Eyre, Waimairi, Heathcote, Paparua, Halswell, Mount Herbert, Akaroa, Wairewa, Springs, Ellesmere, Malvern, Selwyn. |
| 15 | Canterbury South | Ashburton, Geraldine, Mackenzie, Levels, Waimate, Waitaki. |
| 16 | Otago Central | Maniototo, Vincent, Lake, Waihemo, Waikouaiti. |
| 17 | Otago South | Peninsula, Taieri, Tuapeka, Bruce, Clutha. |
| 18 | Southland | Southland, Wallace, Fiord. |
Section 8 of the Act required District Highway Councils to be set up in each highway district, these Councils being constituted to include a Public Works Engineer, and one person to represent each constituent county, with an executive of three to be appointed by the members of the Council. The personnel of these District Highway Councils was approved by the Main Highways Board on the 26th September, 1923.
Section 11 of the Act defined the functions of the District Highway Councils, which are to make recommendations for each year as to which roads within the several districts should be declared main highways, and what works should be done and what expenditure incurred on these highways during that period.
The Board instructed the District Highway Councils that they should be guided by the following considerations when recommending roads for declaration as main highways:—
As to whether the roads may be regarded as arterial in that they carry appreciable volumes of through as well as local traffic:
As to whether the roads connect large centres of population within the highway district:
As to whether the roads carry appreciable traffic to and from seaports or railway centres within or without the highway districts.
For the purpose of gauging the respective volumes of through and of local traffic the District Highway Councils were informed that it would be advisable to obtain tallies or estimates of traffic, and, this was done in the majority of cases.
It was intended that the activities of the Main Highways Board would begin on the 1st April, 1924, but owing to certain unavoidable delays it was not till the 12th June, 1924, that the first and principal schedule of main highways was gazetted, the date of the Governor-General's signature—viz., the 9th June, 1924:—being the legal date when the Board assumed control of the main highways as scheduled.
On the same date 1,046 miles (since increased to 1,544 miles) of main highways were gazetted Government roads, this action being in terms of section 22 of the Act, whereby the Board may declare any main highway to be a Government road, and provide a greater proportion of the cost of works of (a) construction and reconstruction (for which the usual subsidy payable by the Board is £1 for £1), and (b) maintenance and repair (for which the subsidy is £1 for £2). The highways that were declared Government roads were chiefly those in districts where settlement was sparse, and where the revenue from rates collectable by the local authorities was insufficient to meet the expenditure necessary for the construction, reconstruction, and maintenance of the highways therein.
The table hereunder shows the lengths of main highways in the various highway districts at 31st March, 1926, and the mileage of those that have been declared Government roads in terms of section 22 of the Main Highways Act:—
| LENGTHS OF MAIN HIGHWAYS. | ||||||
|---|---|---|---|---|---|---|
| Highway District. | Ordinary Main Highways. | Main Highways declared Government Roads. | Total all Main Highways. | |||
| M. | ch. | M. | ch. | M. | ch. | |
| 1. Auckland North | 423 | 15 | 138 | 30 | 561 | 45 |
| 2. Auckland South | 375 | 47 | 35 | 13 | 410 | 60 |
| 3. Tauranga | 169 | 0 | 268 | 0 | 437 | 0 |
| 4. Gisborne | 110 | 41 | 138 | 40 | 249 | 1 |
| 5. Napier | 393 | 70 | 36 | 50 | 430 | 40 |
| 6. King-country | 199 | 42 | 149 | 68 | 349 | 30 |
| 7. Taranaki | 191 | 10 | 113 | 10 | 304 | 20 |
| 8. Wanganui | 271 | 0 | 40 | 60 | 311 | 60 |
| 9. Wellington West | 271 | 42 | 23 | 8 | 294 | 50 |
| 10. Wellington East | 307 | 22 | 14 | 0 | 321 | 22 |
| Totals, North Island | 2,712 | 49 | 957 | 39 | 3,670 | 8 |
| 11. Nelson | 156 | 56 | 127 | 4 | 283 | 60 |
| 12. West Coast | .. | 331 | 5 | 331 | 5 | |
| 13. Canterbury North | 265 | 34 | 40 | 6 | 305 | 40 |
| 14. Canterbury Central | 309 | 60 | 54 | 0 | 363 | 60 |
| 15. Canterbury South | 430 | 40 | .. | 430 | 40 | |
| 16. Otago Central | 233 | 20 | 8 | 0 | 241 | 20 |
| 17. Otago South | 224 | 65 | 0 | 63 | 225 | 48 |
| 18. Southland | 394 | 29 | 26 | 0 | 420 | 29 |
| Totals, South Island | 2,014 | 64 | 586 | 78 | 2,601 | 62 |
| Totals, Dominion | 4,727 | 33 | 1,544 | 37 | 6,271 | 70 |
Under section 23 of the Act the Board has power to contribute towards the maintenance and repair of any street in a borough which is a continuation of a main highway. Payment under this section is limited to a rate equal to that paid in respect of the maintenance and repair of the adjoining main highway.
Numerous requests were received from boroughs throughout the Dominion for assistance towards maintenance of their streets which were extensions of main highways, and in a small number of cases, where the traffic was overwhelmingly foreign to the borough, the Board agreed. It did not feel justified in widening the scope of this provision until the financial results of its first year's working had been demonstrated. At the 31st March, 1925, however, it decided that in, all cases where the population of the borough did not exceed six thousand inhabitants assistance would be given under section 23. The length of road involved is approximately 180 miles.
The Main Highways Amendment Act was passed in 1925 with the principal object of overcoming several legal difficulties which the first year's operations presented to the Board. The most important section in this Amendment Act, however, authorized the Board to increase its subsidy on the cost of maintenance on ordinary main highways from one-third to one-half, retrospective to the 1st April. 1925. In applying the provisions of this section it was made clear to local bodies by the Board that it was not the intention, by giving a more liberal subsidy, to relieve them of liability in respect to maintenance. On the other hand, it was pointed out that the additional subsidy payable was for the purpose of meeting the additional cost of maintenance brought about by the increased motor traffic. Another important amendment enabled the Board to inaugurate a special system of graduated subsidies towards the cost of erection of large bridges. The amendment provides for payment by the Board of (a) one-half the cost up to £10,000, (b) three-fifths of so much of the cost as exceeds £10,000 but does not exceed £20,000, and (c) two-thirds of so much of the cost as exceeds £20,000. The Amendment Act also provides for (a) a more liberal subsidy than £1 for £1 in the case of a major deviation of a main highway, (b) the repair of any extraordinary damage, and (c) certain allowances out of the funds of the Highway Board to be paid to members of the executive bodies of District Highway Councils.
The application of the provisions of sections 109, 119, and 120 of the Public Works Act, governing the apportionment of cost of works between different local bodies in certain cases, was also authorized by the Amendment Act, and this authority has already been availed of in a number of cases where attempts to obtain mutual agreement as to the basis of allocation of cost in so far as affects the portion to be contributed by the local bodies have failed.
Power to sell roadmaking machinery, plant, equipment, and appliances to any local authority on terms providing for payment of the purchase-money by instalments extending over not more than four years is also embodied in this Act. A special section provides for the limitation of the Board's subsidy in any case where the standard of work adopted by any particular local authority is considered to be more elaborate than necessary to meet the present of early prospective traffic requirements.
The Main Highways Account is subdivided as under:—
Revenue Fund, which includes an annual transfer from the Consolidated Fund of at least £35,000; proceeds of tax on tires and tubes, as collected through the Customs Department; registration and license fees of motor-vehicles.
Construction Fund, which includes a transfer from the Public Works Fund, not less in any year than £200,000, together with all moneys borrowed by the Minister of Finance as may. be required for purposes of construction and reconstruction, to a limit of £3,000,000. This sum is intended to extend over a period of ten years.
The total income credited to the Revenue Account to 31st March, 1926, was £1,105,265. The expenditure out of the Revenue Fund from 1st April, 1924, to the 31st March, 1926, was £459,979. This sum was expended on maintenance and repair of main highways, administration charges, and fees relative to registration of motor-vehicles and annual licenses. The expenditure out of the Construction Account from the 1st April, 1924, to the 31st March, 1926, was £680,236.
The estimates of amounts required for maintenance and repairs, construction and reconstruction, and all other items are forwarded by the District Highway Councils, and after review by the Board are incorporated in the Consolidated Fund Estimates and Public Works Estimates respectively, which in turn are submitted for approval to both Houses of Parliament, for inclusion in the annual appropriations.
Under section 21 of the Act the revenue from the licensing of motor-vehicles and from taxes on tires and tubes is to be apportioned between the North and South Islands in the discretion of the Board, but generally so that the amount apportioned to either Island shall be fixed by reference to the number of motor-vehicles in that Island. In the first instance the Board received a very much greater number of applications for the inclusion of sums on the estimates from the North Island than from the South Island, and later on, similarly, received many more proposals from the North than from the South. Now that the expenditure is known, it is noted that, excluding works being carried out by the Public Works Department on behalf of the Board, the expenditure in the South Island is small.
The apportionment of the tire duty and license fees in each Island is made in proportion to the number of motor-vehicles registered in each Island on the 31st March of the year concerned, and the interest and sinking fund on moneys borrowed for construction work by the Board in each Island is charged against the proportion of the allocation for the respective Islands.
At the 31st March, 1925, the North Island possessed 60.9 per cent. of the total number of motor-vehicles registered at that date, the corresponding figure for the South Island being 39.1 per cent. The expenditure for the year 1925–26 out of the Revenue Fund in the North Island represented approximately 65.3 per cent. of the total, the corresponding figure for the South Island being 34.7 per cent. This discrepancy is likely to be reduced on account of the greater relative rate of the importation of motor-vehicles in the North Island, the figures at 31st March, 1926, being 61.4 per cent. and 38.6 per cent. for the North and South Island respectively.
The ratio of the contributions of the two Islands to the revenue of the Board differs from the ratio of the respective numbers of motor-vehicles, there being a slightly greater proportionate contribution from the North Island by reason of the fact that the motor-bicycle, the vehicle which pays the lowest rate of tax, is in greater evidence in the South Island than in the North Island; also the excess of motor-bicycles in the South is balanced in the North not by an excess of cars, but by an excess of motor-lorries, which, individually, pay the heaviest rate of tax.
Before the Main Highways Act was passed the Government recognized the reasonableness of motor-vehicle owners contributing towards the cost of the construction and upkeep of the road-surfaces which were required principally for them.
Amongst the funds laid down in the Main Highways Act as being available for the Revenue Fund, in addition to Customs duties on tires and tubes, was a sum to be derived from the licensing of motor-vehicles. When the Main Highways Act was passed it was expected that a Motor-vehicles Act dealing with the registration and licensing of motor-vehicles would be simultaneously passed, but owing to the difficulty of co-ordinating all interests it was not until November, 1924, that the Motor-vehicles Act came into being.
This Act provided for the registration and annual licensing of all motor-vehicles, the fees payable being as follows:—
| £. | s. | d. | |
|---|---|---|---|
| Registration fees:— | |||
| Motor-cycle | 0 | 10 | 0 |
| Any other motor-vehicle | 1 | 0 | 0 |
| License fees:— | |||
| For every motor-cycle | 0 | 10 | 0 |
| For every private motor-car | 2 | 0 | 0 |
| For every public motor-car | 2 | 0 | 0 |
| For every motor-coach or motor-omnibus | 5 | 0 | 0 |
| For trade motors— | |||
| (a.) For every 1-ton truck fitted with pneumatic tires on all wheels | 2 | 0 | 0 |
| (b.) For every motor-lorry fitted with solid tires | 5 | 0 | 0 |
| (c.) For every motor-lorry fitted with pneumatic tires on all wheels | 3 | 0 | 0 |
| License fees | |||
| For every traction-engine | 5 | 0 | 0 |
| For every trailer with three or more wheels | 3 | 0 | 0 |
| For every other trailer | 1 | 0 | 0 |
| For every other motor-vehicle | 2 | 0 | 0 |
| Other fees:— | |||
| All drivers to be licensed—fee | 0 | 5 | 0 |
| All changes of ownership to be notified | 0 | 5 | 0 |
| Special fees for manufacturers and dealers in motor-vehicles— | |||
| In respect of motor-cycles, each registration-plate | 0 | 5 | 0 |
| In respect of any other motor-vehicle, each registration-plate or set of plates | 0 | 10 | 0 |
All the above fees, except that for a driver's license, which is payable to the local authorities, have in terms of the Motor-vehicles Act to be credited to the Main Highways Revenue Account.
The definition of a motor-vehicle for the purposes of the Act is as follows: “‘Motor-vehicle' means any vehicle propelled by mechanical power, and includes a trailer and any other vehicle of a class declared by regulations under the Act to be motor-vehicles; but does not include a vehicle running on rails, or a vehicle which, though not running on rails, derives power from an overhead wire, if such vehicle is the property of and is run by any local authority.”
Up to the 30th June, 1926, registration of motor-vehicles under the Motor-vehicles Act, 1924, numbered 140,796, as compared with 106,449 at the 30th June, 1925. The total at the 30th June, 1926, is made up as follows:—
| Class of Motor-vehicle. | Number. |
|---|---|
| Cars | 92,813 |
| Trucks— | |
| 1 ton | 11,321 |
| 2 tons | 2,397 |
| 3 tons | 1,023 |
| 4 tons | 781 |
| 5 tons | 294 |
| 6 tons | 48 |
| Over 6 tons | 21 |
| Omnibuses | 1,471 |
| Traction-engines | 450 |
| Trailers— | |
| Two wheels | 358 |
| Three or more wheels | 225 |
| Tractors | 273 |
| Road-rollers | 117 |
| Fire-engines | 110 |
| Ambulances | 61 |
| Miscellaneous | 146 |
| Cycles | 28,887 |
| Total | 140,796 |
The numbers of the principal classes of motor-vehicles registered in each of the eighteen highway districts are as follows:—
| Highway District. | Motor-cars. | Motortrucks. | Motor-omnibuses. | Motorcycles. | Other Motor-vehicles. | Total. |
|---|---|---|---|---|---|---|
| 1. Auckland North | 11,680 | 3,111 | 386 | 2,722 | 152 | 18,051 |
| 2. Auckland South | 8,628 | 1,705 | 156 | 2,540 | 138 | 13,167 |
| 3. Tauranga | 1,924 | 400 | 47 | 476 | 16 | 2,863 |
| 4. Gisborne | 2,251 | 293 | 38 | 287 | 29 | 2,898 |
| 5. Napier | 6,682 | 1,141 | 86 | 1,790 | 123 | 9,822 |
| 6. King-country | 1,070 | 308 | 38 | 312 | 15 | 1,743 |
| 7. Taranaki | 5,353 | 780 | 46 | 1,995 | 44 | 8,218 |
| 8. Wanganui | 4,448 | 800 | 35 | 1,515 | 54 | 6,852 |
| 9. Wellington West | 11,212 | 2,264 | 165 | 3,689 | 204 | 17,534 |
| 10. Wellington East | 3,811 | 567 | 29 | 923 | 92 | 5,422 |
| 11. Nelson | 2.982 | 398 | 62 | 1,172 | 61 | 4,675 |
| 12. West Coast | 1,065 | 268 | 58 | 442 | 30 | 1,863 |
| 13. Canterbury North | 1,048 | 114 | 6 | 311 | 30 | 1,509 |
| 14. Canterbury Central | 10,479 | 1,381 | 80 | 4,712 | 263 | 16,915 |
| 15. Canterbury South | 7,654 | 640 | 78 | 2,293 | 308 | 10,973 |
| 16. Otago Central | 1,367 | 160 | 20 | 396 | 15 | 1,958 |
| 17. Otago South | 5,544 | 1,018 | 79 | 1,733 | 111 | 8,485 |
| 18. Southland | 5,615 | 537 | 62 | 1,579 | 55 | 7,848 |
| Totals | 92,813 | 15,885 | 1,471 | 28,887 | 1,740 | 140,796 |
On the coming into operation of the Main Highways Act in 1924 there were seven toll-gates in existence in the Taranaki District. These gates were established on dates between 1906 and 1915, and were instituted in order to raise revenue for the construction and maintenance of roads. The County Councils naturally placed them on those roads on which the traffic and the maintenance charges were greatest. The proceeds from these toll-gates were mainly used in paying interest and sinking funds on loans raised by the local authorities for reconstructing the principal roads, including tar and bituminous surfacing.
The revenue from these toll-gates exceeded all expectations. This was due to the extraordinary increase in traffic, especially of motor-vehicles, which took place, largely as a result of the better road-surfaces provided.
The following table shows the chief figures in connection with toll-gates, and is of interest as an instance of the manner in which revenue has been procured by this means:—
| County. | Locality. | Established. | Total Funds collected since Inception. | Funds collected, 1924. | Approximate Cost of Collection, 1924. |
|---|---|---|---|---|---|
| £ | £ | £ | |||
| Clifton | Waihi | 1906 | 16,974 | 1,895 | 150 |
| Taranaki | Puniho | 1908 | 20,918 | 2,583 | 232 |
| Eltham | Mangatoki | 1908 | 35,660 | 3,408 | 410 |
| Eltham | Riverlea | 1908 | |||
| Hawera | Riversdale | 1909 | 24,245 | 2,081 | 317 |
| Hawera | Okaiawa | 1909 | 2,778 | ||
| Stratford | Waipuku | 1915 | 19,745 | 3,604 | 240 |
As it was not legally possible for a toll-gate to operate on a main highway, the important routes affected could not be declared main highways until some equitable financial arrangement had been arrived at so that the toll-gates could be abolished without inflicting undue hardship upon the local authorities interested.
After much negotiation and discussion it was agreed—
That in the interests of the public generally the toll-gates in the Taranaki District be closed.
That the roads upon which the toll-gates were situated be declared main highways as from the 1st April, 1925, thus automatically closing the toll-gates.
That the local authorities controlling the toll-gates be compensated by the Board, the compensation to be in the form of annual payments equivalent to half the interest and sinking funds upon loans raised by these local authorities and expended on the roads in question, and the annual payments to be continued until the expiry of the respective loans, or alternatively until an equivalent lump-sum payment is made.
The District Highway Councils were advised that the standards of road-construction recommended for adoption should be such as are warranted by the present or early prospective traffic. To ensure uniformity in construction as far as possible throughout the Dominion the following standards for first-class, second-class, and third-class roads were laid down:—
| Item. | Unit. | First Class. | Second Class. | Third Class. |
|---|---|---|---|---|
| Formation | Minimum widths in feet | 22 | 17 | 14 |
| Curvature | Chains radius | 1 ½ | 1 | 0 ¾ |
| Grades | .. | 1 in 15 to 1 in 20 | 1 in 15 | 1 in 12 |
| Metalling | Feet and inches | 16' x 9” | 12' x 8” | 10' x 6” |
| Surfacing | .. | Concrete; bitumen; tar macadam. | Macadam or gravel. | Macadam or gravel. |
| Bridges | Widths in feet | 18 | 12 | 9 |
| Bridges | Types | According to sites, dimensions, convenience of materials, but generally to provide for permanent materials in substructures. In all cases standard information to be supplied. | ||
| Culverts | Types | To be of concrete, earthenware, Armco, or hardwoods. | ||
As a guide to local authorities in the preparation of proposals, the Board issued skeleton or outline specifications, dealing with: formation; subgrades of pavements; gravelled roads; two-course water-bound macadam roads; tar or bituminous surfacing of water - bound macadam roads; tar or bituminous penetration roads; bituminous concrete roads; Portland-cement concrete roads. These specifications are not laid down as hard-and-fast rules which local authorities must in every case adopt, but are regarded as standard practice, the following of which will result in satisfactory work. The standard of construction in all cases should, of course, be regulated by local conditions, and should be commensurate with the traffic requirements. As practically all extensive construction work is generally financed wholly or in part by loan, it is essential that the character of the work should be such as to ensure a life at least equal to the period of the loan.
All proposals are examined by the Board to determine—(1) Whether the proposal is sound from an engineering point of view; (2) whether the proposal is justified as to cost, having regard to the existing surfaces; (3) whether the proposal is economically sound, having regard to the value to the district concerned, and the capacity of the district to pay the cost; (4) whether the proposal fits into and forms part of a comprehensive plan.
The Board encourages the adoption of the simplest construction suitable for the present or early prospective traffic and the conditions obtaining in the particular locality. It has, however, adopted the principle that bridges should, wherever practicable, be on the best possible alignment, and constructed of the most permanent materials available.
In all works, whether formation, bridges, culverts, ditches, surfacing, or any other form of construction, the Board requires provision to be made for continuous and up-to-date maintenance. The patrol system is encouraged. By dividing the highways into suitable patrol sections, by the selection of suitable patrolmen, and by the provision of satisfactory supplies of material and efficient plant, it is considered that a very much improved standard of maintenance can in most cases be obtained without undertaking expensive reconstruction. Improved methods of maintenance will result in better and quicker returns being obtained from the expenditure of funds than will be the case by the piling-up of large sums of borrowed money on elaborate construction-work.
In the first nine months of the Board's operations the average cost of maintenance throughout the country was at the rate of £51 per mile per annum, whereas during the past year the average cost of maintenance has increased to £73 per mile per annum. This substantial increase is due to several causes, the principal one being the more favourable subsidy granted by the Board, which has enabled many local bodies to undertake long-deferred maintenance. It is anticipated that there will be a further increase in the forthcoming year, and it is predicted that the average expenditure will be in the vicinity of £90 per mile per annum.
In a number of parts of the North Island there are many miles of pumice road. During the past year the Board's representatives in two districts have endeavoured to apply new methods to the maintenance of these pumice roads, with very encouraging results. The road-drag in particular has proved an effective piece of maintenance equipment.
The use of up-to-date machinery on construction and maintenance of main highways is recognized to be in the interests of economy and efficiency, and, with the idea of encouraging local bodies to use such plant, power enabling the Main Highways Board to sell roadmaking machinery, plant, equipment; and appliances to local authorities on an instalment system was given by the Main Highways Amendment Act, 1925. As a consequence of this legislation a number of local authorities have purchased modern roadmaking plant through the Board. The following statement shows the total orders placed to the 31st March, 1926, the amount involved being £28,634: Road-rollers, 11; road-graders, 5; crushers, 7; bin, 1; motor-lorries, 6; tractors, 7; trailers, 6; bitumen-heaters, 4; bitumen-sprayers, 3; water-carts, 2; conveyer, 3; and several minor items.
In addition to the above, the Board has purchased the following plant for its own use, at a total cost of £15,701: Road-rollers, 14; road-graders, 2; motor-lorries, 2; bitumen-heater, 1; bitumen-sprayer, 1; tractors, 3; air-compressors, 2; conveyer, 1: crusher, 1; and several other minor items.
A petrological laboratory was established in Wellington in the beginning of 1925. Full reports are made on the various materials submitted by local authorities for use as road-metal as well as for other purposes throughout the Dominion. The machines installed are—Deval abrasion machine for testing wearing qualities of rocks; diamond-core drill for cutting test pieces; diamond-saw and grinding-lap; Dorry hardness machine; Page impact machine.
The following important properties are ascertained—Specific gravity; porosity; resistance to abrasion or attrition; resistance to friction or hardness; resistance to impact or toughness.
Tests for bitumens, tars, &c., are carried out by the Dominion Analyst, Wellington.
The testing of steel is carried out by the machines already in use by the Public Works or Railway Departments, or at the Canterbury School of Engineering.
The nature of surfacing now rendered necessary by modern traffic requires such knowledge and experience on the part of those laying such surfacing that a class of foremen and overseers with special experience and knowledge of modern road requirements superior to that which formerly was found sufficient is now necessary. On such surfacing all the men in charge should have some experience, and should possess knowledge of the use of the modern methods of construction and up-to-date machinery.
In order to afford some guarantee of experience and reliability, and to ensure that all high-class work is properly supervised, the Board decided to arrange for examinations of any persons desirous of qualifying themselves for positions as foremen or overseers of works. An examination was held on the 11th December, 1925. Twenty-six candidates sat for the examination, five obtaining a complete pass and nine a partial pass.
Various difficulties in the past have resulted in the local authorities not carrying out many deviations which are desirable, if not indispensable. It is undoubtedly wrong to surface a road, especially in such a high-class manner as is required for modern traffic, when the road itself is in the wrong position, and when possibly all this work will be lost through eventually having to carry out a deviation that should in the first case have been adopted.
The Board carefully considered the matter, and resolved to make an effort to provide a more liberal scale of subsidies to cover such cases, and thus encourage the adoption of really desirable deviations. Consequently the Board decided that where particular circumstances warrant such action—
It will carry out at its own cost all engineering and land-plan surveys of deviations in alignment that, are wholly outside the existing road reserve.
It will contribute £1 for £1 towards the cost of all engineering and land-plan surveys of approved deviations which are almost entirely within the existing road reserves.
It will contribute £1 for £1 towards the cost of compensation for land, new fencing, shifting of fences, severances, and other expenses of a like nature incidental to the legalization of any deviation not declared a Government road, provided it approves of the financial arrangements entered into by the local authority.
It reserves the right to enter into negotiations concerning the compensation direct.
In framing and carrying out its policy the Board has always regarded the safety and the convenience of the road-user as of vital importance, and in furtherance of this policy it has done its best to bring about such improvements as the elimination of the worst railway level crossings, the betterment of dangerous road alignment, and the installation of danger and direction signs. As a basis of negotiation with the Railway Department, the Board, during the early part of 1925–26, had a statement prepared showing the location of the 330 level crossings on the main-highways system, the relative danger of each, the best method of elimination of the most dangerous, and the approximate cost of elimination. A mutually satisfactory programme of elimination was arranged, and on the majority of the eliminations agreed upon the Railway Department offered to find half the total cost, the Main Highways Board and the local bodies interested being required to find the other half.
In the first year of the Board's operations a standard specification was drawn up for the construction and erection of road-direction and danger signs. The Board has since decided to subsidize the cost of erection of any signs complying generally with the specifications, and such subsidy on a £1-for-£1 basis is payable either to local bodies or to automobile associations. The subsidy payable on future signs is subject to the condition that the number of the highway is placed on the signboard.
In addition a suitable design for a boundary sign to be erected at county boundaries was issued to local bodies by the Board, with a suggestion that these be erected as opportunity offers.
Table of Contents
AT the 31st December, 1925, there were 1,982 post-offices in New Zealand, this number being exclusive of 37 receiving offices, 1 Delivering office, 4 marine post-offices, and 10 railway travelling post-offices. At the same date there were 2,151 street letter-boxes in the Dominion. The number of post-offices, -reckoning only those which are combined receiving and delivering offices, has shown a decrease in each of the last five years, the figures for which are—
| Year. | Number of Post-offices. |
|---|---|
| 1921 | 2,178 |
| 1922 | 2,109 |
| 1923 | 2,081 |
| 1924 | 2,035 |
| 1925 | 1,982 |
The following table, showing the number of articles posted and delivered during each of the last ten years, gives an indication of the extent to which the people of New Zealand utilize the postal facilities:—
| Year. | Letters and Letter-cards. | Post-cards. | Books and Pattern-packets. | Newspapers. | Parcels. |
|---|---|---|---|---|---|
| 1916 | 242,121,361 | 8,133,697 | 48,868,537 | 41,807,999 | 6,085,103 |
| 1917 | 245,796,945 | 7,549,867 | 44,934,218 | 40,366,792 | 6,314,875 |
| 1918 | 242,527,369 | 7,145,606 | 42,301,230 | 35,476,212 | 6,376,469 |
| 1919 | 247,143,183 | 7,292,922 | 44,320,385 | 35,498,263 | 6,193,475 |
| 1920 | 259,743,234 | 6,937,554 | 49,619,161 | 87,859,247 | 6,588,293 |
| 1921 | 253,767,131 | 6,548,655 | 53,635,951 | 38,680,982 | 6,464,244 |
| 1922 | 239,997,081 | 6,277,428 | 67,578,435 | 35,635,219 | 6,700,121 |
| 1923 | 252,021,959 | 6,603,293 | 79,546,000 | 38,138,697 | 6,886,858 |
| 1924 | 272.311,925 | 7,273,802 | 98,690,911 | 41,602,497 | 7,028,501 |
| 1925 | 294,630,760 | 9,107,081 | 115,946,882 | 44,717,406 | 7,101,628 |
Articles which are both posted and delivered in New Zealand (representing, of course, the great bulk of the volume) are counted twice in the ascertainment of the above figures. Separate figures of articles posted and delivered during the year 1925 are—
| Posted. | Delivered. | |
|---|---|---|
| Letters and letter-cards | 146,470,749 | 148,160,011 |
| Post-cards | 4,430,047 | 4,677,034 |
| Books, &c. | 59,717,229 | 56,229,653 |
| Newspapers | 20,812,404 | 23,905,002 |
| Parcels | 3,456,571 | 3,645,057 |
The above figures include registered articles, of which 2,103,229 were posted in the Dominion and 2,314,160 delivered therein.
During recent years the Post Office has made very substantial extensions in the establishment of rural-mail deliveries. Many of these are performed by contractors mounted on motor-cycles. By means of such deliveries it has been possible to give settlers living in the back country an. efficient service. The number of rural boxes in use has increased from 8,700 in 1920–21 to 14,547 in 1925–26.
The average number of letters, &c., actually posted in the Dominion per head of mean population (including Maoris) in the last ten years is as shown in the next table:—
| ARTICLES POSTED PER HEAD OF MEAN POPULATION, 1916–25. | |||||
|---|---|---|---|---|---|
| Year. | Letters and Letter-cards. | Post-cards. | Books and Parcels. | Newspapers. | Total. |
| 1916 | 104.87 | 3.07 | 24.71 | 16.47 | 149.12 |
| 1917 | 105.36 | 2.87 | 23.39 | 15.87 | 147.49 |
| 1918 | 107.71 | 2.81 | 22.55 | 14.49 | 147.56 |
| 1919 | 106.07 | 2.85 | 23.13 | 13.95 | 146.00 |
| 1920 | 103.58 | 2.49 | 23.77 | 13.46 | 143.30 |
| 1921 | 95.35 | 2.25 | 25.69 | 12.94 | 136.23 |
| 1922 | 89.68 | 2.18 | 29.66 | 11.90 | 133.42 |
| 1923 | 92.27 | 2.22 | 33.73 | 12.82 | 141.04 |
| 1924 | 100.93 | 2.49 | 39.90 | 13.57 | 156.89 |
| 1925 | 105.80 | 3.20 | 45.63 | 15.03 | 169.66 |
The facilities afforded for the transmission of parcels through the Post Office to places within and without the Dominion have proved of much convenience to the public. The regulations admit of parcels up to 11 lb. in weight being sent to almost all the important countries of the world, while inland parcels for or from places served the whole way by railway or steamer may be up to 28 lb. in weight.
The following table shows the number and weight of parcels received from and despatched overseas during each of the last five years, with the declared value of those received and the Customs duty collected on them:—
| PARCELS RECEIVED FROM AND DESPATCHED OVERSEAS, 1921–25. | ||||||
|---|---|---|---|---|---|---|
| Year. | Parcels received. | Parcels despatched. | ||||
| Number. | Weight. | Declared Value. | Customs Duty. | Number. | Weight. | |
| lb. | £ | £ | lb. | |||
| 1921 | 233,698 | 1,281,322 | 1,318,733 | 244,684 | 47,700 | 179,123 |
| 1922 | 302,639 | 1,725,098 | 1,332,719 | 276,865 | 42,506 | 158,246 |
| 1923 | 303,041 | 1,846,207 | 1,343,726 | 307,022 | 43,510 | 162,792 |
| 1924 | 303,092 | 1,802,656 | 1,333,745 | 277,468 | 46,360 | 184,605 |
| 1925 | 309,336 | 2,025,810 | 1,492,300 | 311,056 | 51,047 | 194,516 |
The figures plainly show the huge preponderance of inwards parcels among the overseas parcels-post business of New Zealand. Of the parcels received from overseas in 1925 no fewer than 179,973 came from the United Kingdom (including those from foreign countries via London), while 62,656 came from the United States and 48,430 from Australia. These countries, with 21,353, 5,024, and 16,876 respectively, also ranked highest among countries to which parcels were sent from New Zealand.
There are (July, 1926) 303 publications on the Register of Newspapers for New Zealand. Of these, some 62 are published daily, 18 being morning papers and 44 evening papers. Twenty-four appear three times per week, 29 twice per week, 77 weekly, 6 fortnightly, 1 twice monthly, 2 four-weekly, and 102 monthly
The number of offices open for the transaction of money-order business at the end of 1925 was 868.
During 1925, 766,689 money-orders, for a total sum of £4,977,230, were issued and 652,597 (£4,617,813) were paid. The money-orders from places beyond New Zealand and payable in the Dominion numbered 39,315, for the amount of £196,562, while those issued in New Zealand and payable overseas numbered 155,717, and represented an aggregate value of £570,769.
The number of offices open for the sale of postal notes at the 31st March, 1926, was 1,176. During the preceding twelve months 3,040,722 postal notes were sold, representing a value of £922,873. The notes paid numbered 3,032,931, of a total value of £899,796.
British postal orders issued in the Dominion during the year ended 31st March, 1926, numbered 136,763, of a value amounting to £78,031. Those paid numbered 30,248, and represented £17,666.
Up to the 31st March, 1926, a total sum of £6,280,509 had been expended on telegraph construction, including the construction of telephone exchanges. The amount expended during the financial year 1925–26 was £931,661.
There were 13,052 miles of telegraph and toll pole line in existence at the end of March, 1926, carrying 59,791 miles of wire. Of the latter, 4,152 miles were in use exclusively for telephone toll traffic, 10,902 exclusively for telegraph traffic, and 44,737 simultaneously or conjointly for toll and telegraph traffic, making totals of 48,889 available for toll traffic and 55,639 for the transmission of telegrams. A total of 12,114 miles of wire has been gained to the 31st March, 1926, for the purpose of telegraph transmission, by the superimposing of existing telephone circuits. The total length of additional telephone toll circuit improvised from the existing wire circuits by the use of subsidiary apparatus associated therewith (so-called phantom working) is 4,333 miles.
During the year ended 31st March, 1926, telegrams and toll communications to the number of 16,201,874 were transmitted, 16,143,414 of these being “paid” messages, and the balance free Government telegrams. The revenue from telegrams and toll communications was £782,680, to which should be added £980,283 revenue of telephone exchanges and £17,158 miscellaneous receipts, making a total telegraph and telephone revenue of £1,780,121.
A table is given showing the growth of telegraph business since 1866.
| Year ended | Number of Telegrams and Toll Messages forwarded during the Year. | Revenue (including Miscellaneous Receipts). | Value of Government Messages. | Total Value of Business done during the Year. | |||
|---|---|---|---|---|---|---|---|
| Paid. | Free Government. | Total. | Telegraph and Toll. | Telephone Exchange. | |||
| £ | £ | £ | £ | ||||
| 30 June, 1866 | 24,761 | 2,746 | 27,507 | 5,562 | .. | 483 | 6,045 |
| ,, 1876 | 890,382 | 160,704 | 1,051,086 | 62,716 | .. | 16,154 | 78,870 |
| 31 Dec., 1886 | 1,583,717 | 252,549 | 1,836,266 | 106,639 | .. | 27,281 | 133,920 |
| 31 Mar., 1896 | 1,899,632 | 224,579 | 2,124,211 | 97,178 | 25,933 | 25,844 | 148,955 |
| ,, 1906 | 5,351,084 | 289,135 | 5,640,219 | 184,369 | 89,542 | 24,168 | 298,079 |
| ,, 1916 | 10,708,910 | 127,841 | 10,836,751 | 549,627 | 287,547 | 9,085 | 846,259 |
| ,, 1917 | 10,734,168 | 140,952 | 10,875,120 | 527,249 | 317,275 | 10,774 | 855,298 |
| ,, 1918 | 11,510,710 | 114,010 | 11,624,720 | 516,865 | 344,368 | 6,949 | 868,182 |
| ,, 1919 | 11,989,882 | 101,135 | 12,091,017 | 615,786 | 373,169 | 5,036 | 993,991 |
| ,, 1920 | 14,957,615 | 116,452 | 15,074,067 | 619,188 | 419,318 | 5,830 | 1,044,336 |
| ,, 1921 | 13,884,466 | 116,385 | 14,000,851 | 704,228 | 533,535 | 7,036 | 1,244,799 |
| ,, 1922 | 12,782,037 | 152,428 | 12,934,465 | 697,864 | 614,367 | 8,458 | 1,320,689 |
| ,, 1923 | 13,342,823 | 170,385 | 13,513,208 | 713,380 | 595,967 | 9,727 | 1,319,074 |
| ,, 1924 | 14,407,269 | 69,597 | 14,476,866 | 711,895 | 830,470 | 4,930 | 1,547,295 |
| ,, 1925 | 15,410.390 | 61,560 | 15,471,950 | 764,290 | 867,218 | 4,420 | 1,635,928 |
| ,, 1926 | 16,143,414 | 58,460 | 16,201,874 | 799,838 | 980,283 | 4,992 | 1,785,113 |
Prior to the 1st September, 1869, inland telegrams were charged for on a mileage basis. From that date a uniform rate was fixed of 2s. 6d. for ten words and 6d. for each additional five words. From the 1st April, 1870, the minimum charge was reduced to 1s. From the 1st November, 1873, the rate was further reduced to 1s. for ten words and ld. for each additional word, address and signature, hitherto charged for, being free up to ten words. From the 1st July, 1877, there was introduced the “urgent” code, at double the ordinary rate. From the 1st July, 1878, a “delayed” system was introduced, the rate being fixed at 6d. for ten words, exclusive of address and signature up to ten words, and ½ d for each additional word. From the 1st February, 1892, the number of words allowed for the minimum charge in each case was increased to twelve, with free address and signature up to six words. From the 15th August, 1892, the ordinary rate was fixed at 1s. for eighteen words, including address and signature. From the 1st June, 1896, the rate was fixed at 6d. for twelve words, including address and signature, and 1d. for each additional word, and “delayed” telegrams were abolished. From the 1st November, 1906, the charge for additional words was reduced to ½ d. each. From the 23rd September, 1915, the ordinary rate was increased from 6d. to 8d. for twelve words (“urgent,” 1s. 2d.); and on the 1st August, 1920, it was further increased to 1s. for twelve words and 1d. for each additional word (“urgent” 2s., and 2d. for each additional word); Sundays and holidays, double rates. From the 1st November, 1920, there was introduced a system of night letter-telegrams, to be delivered by post on the morning following the day of presentation. The rate (since altered) was 1s. 6d. for thirty-six words and ½d. for each additional word. From the 1st February, 1923, the rate for ordinary telegrams was reduced to 9d. for twelve words the charge for each additional word remaining at 1d. (“urgent” 1s. 6d., and 2d. for each additional word). From the same date the night-letter-telegram rate was reduced to 9d. for twenty-seven words and 1d. for each additional three words
It should be explained that the free Government telegrams shown in the preceding table are in recent years mostly service telegrams of the Post and Telegraph Department, other Government Departments paying since 1907 the same rates as the public.
At the 31st March, 1926, there were 341 telephone exchanges in the Dominion. Of this number, 329 are wholly of the magneto type, 3 common battery, 8 wholly automatic, and 1 mixed exchange area—partly magneto and partly automatic—in which 3 automatic exchanges are operated. The exchanges which are wholly automatic are Auckland, Hamilton, Wanganui, Palmerston North, Masterton, Wellington, Blenheim, and Oamaru.
The following statement shows the automatic-exchange equipment installed and in use in the Dominion on the 31st March, 1926:—
| Exchange. | Number of Individual Lines installed. | Number of Party - lines installed. | Number of Individual-line Stations. | Number of Party-line Stations. | Total Number of Main Stations. | Number of Extension Stations. | Total Number of Automatic-telephone Stations. | |
|---|---|---|---|---|---|---|---|---|
| Two-party. | Four-party. | |||||||
* Auxiliary apparatus. † Party lines used for individual stations. Twenty-seven party lines used for individual stations. | ||||||||
| Auckland Exchange area— | ||||||||
| Wellesley Street | 7,200 | .. | 100 | 5,501 | 120 | 5,621 | 1,906 | 7,527 |
| Remuera | 1,600 | .. | 100 | 1,493 | 235 | 1,728 | 129 | 1,857 |
| Mount Eden | 1,600 | .. | 100 | 1,579 | 274 | 1,853 | 83 | 1,936 |
| Ponsonby | 1,200 | .. | 100 | 1,049 | 94 | 1,143 | 95 | 1,238 |
| Onehunga | 400 | .. | 307 | .. | 307 | 31 | 388 | |
| Devonport | 500 | .. | .. | 432 | .. | 432 | 22 | 454 |
| Wellington Exchange area— | ||||||||
| Courtenay Place | 3,800 | 100 | 100 | 3,058 | 316 | 3,374 | 733 | 4,107 |
| Wellington South | 1,400 | 100 | 100 | 1,355 | 489 | 1,844 | 113 | 1,957 |
| Kelburn | 1,200 | .. | 100 | 925 | 128 | 1,053 | 61 | 1,114 |
| Khandallah | .. | 100 | 100 | 115† | 235 | 350 | 7 | 357 |
| Stout Street | 7,600 | .. | 100 | 3,430 | 192 | 3,622 | 2,608 | 6,230 |
| Christchurch Exchange area— | ||||||||
| Hereford Street* | 1,500 | .. | .. | 1,498 | .. | 1,498 | 155 | 1,653 |
| St. Albans* | 500 | .. | .. | 497 | .. | 497 | 53 | 550 |
| Sydenham* | 300 | .. | .. | 299 | .. | 299 | 30 | 329 |
| Single-office exchanges— | ||||||||
| Hamilton | 1,600 | .. | 100 | 1,461 | 311 | 1,772 | 283 | 2,055 |
| Wanganui | 2,500 | 200 | 100 | 2,046 | 352 | 2,398 | 533 | 2,931 |
| Palmerston North | 1,800 | .. | 100 | 1,827 | 207 | 2,034 | 248 | 2,282 |
| Masterton | 1,000 | .. | 100 | 987 | 188 | 1,175 | 192 | 1,367 |
| Blenheim | 700 | .. | 100 | 687 | 142 | 829 | 93 | 922 |
| Oamaru | 700 | .. | 100 | 681 | 73 | 7/54 | 92 | 846 |
| Totals | 37,100 | 500 | 1,500 | 29,227 | 3,356 | 32,583 | 7,467 | 0,050 |
The following table indicates the phenomenal growth of the New Zealand telephone-exchange service during the last eight years:—
| — | 1918. | 1920. | 1922. | 1923. | 1924. | 1925. | 1926. |
|---|---|---|---|---|---|---|---|
| Exchanges | 280 | 291 | 301 | 320 | 327 | 340 | 341 |
| Subscribers, main stations | 53,501 | 64,396 | 76,307 | 82,459 | 86,605 | 94,371 | 102,509 |
| Toll and service stations | 3,434 | 3,512 | 3,666 | 3,856 | 3,906 | 3,882 | 3,940 |
| Public call offices | 261 | 295 | 339 | 351 | 371 | 380 | 409 |
| Extension stations | 10,567 | 12,520 | 14,371 | 15,366 | 15,882 | 16,916 | 18,514 |
| Telephone-station totals | 67,763 | 80,723 | 94,683 | 102,032 | 106,764 | 115,549 | 125,372 |
The total number of telephone-stations shows an increase of 57,609, or 85 per cent., during the period. Additional subscribers' stations contributed largely to this phenomenal growth, the increase in this respect being 49,008, or 92 per cent. The enormous demand for public call offices is clearly revealed in the table, these showing an increase from 261 in 1918 to 409 in 1926. Extension stations have nearly doubled.
In addition to the above, there are 4,448 stations connected by private telephone-lines with departmental toll - stations, and 366 stations connected with non-departmental rural exchanges which do not have communication with the departmental system, making a grand total of 130,186 telephone-stations in New Zealand on the 31st March, 1926.
The following table shows, for each class of exchange, the percentage of business and residential stations, the percentage of individual and party-line stations, also the number of exchanges in each class:—
| — | Class I: Exchanges or Networks observing Continuous Attendance and having more than 3,500 Paying Subscribers' Main Stations connected therewith. | Class II: Exchanges or Networks observing Continuous Attendance and having 1,001 to 3,500 Paying Subscribers' Main Stations connected therewith. | Class III: Exchanges or Networks observing Continuous Attendance and having 201 to 1,000 Paying Subscribers' Main Stations connected therewith. | Class IV: Exchanges or Networks where the Attendance is restricted. | Dominion Percentages. |
|---|---|---|---|---|---|
| Per Cent. | Per Cent. | Per Cent. | Per Cent. | Per Cent. | |
| Business stations | 43 | 35 | 31 | 24 | 34 |
| Residential stations | 57 | 65 | 69 | 76 | 66 |
| 100 | 100 | 100 | 100 | 100 | |
| Individual-line stations | 89 | 74 | 59 | 42 | 68 |
| Party- and rural-line stations | 11 | 26 | 41 | 58 | 32 |
| 100 | 100 | 100 | 100 | 100 | |
| Number of exchanges in each class | 4 | 12 | 41 | 284 | .. |
The “party” line system of telephone service is being largely availed of, particularly by those whose promises are situated at a distance from an exchange. In March, 1926, the number of party-line connections was 8,831, with a total of 33,740 subscribers.
The first public call offices (coin-in-the-slot telephones) erected in the Dominion were installed at Wellington on the 17th August, 1910. There are now 409 such instruments in use in the Dominion, the charges for which are as follow:—
| One penny | 378 |
|---|---|
| Twopence | 15 |
| Threepence | 9 |
| Sixpence | 7 |
The revenue of slot telephones during the year ended 31st March, 1926, was £25,187 Originally the charges from public call offices were as follow:—
Where the distance between the exchange and the public call office was—
| Under two miles, rate per call | 1d. |
|---|---|
| Two miles or over and under four miles, rate per call | 2d. |
| Four miles or over and under six miles, rate per call | 3d. |
| Six miles or over, rate per call | 6d. |
In August, 1925, a flat rate of 1d. was applied to calls from all public call offices situated within the base-rate area of any exchange. Later, the charge for public calls from public call offices outside the base-rate area was fixed as follows: Up to three miles beyond the base-rate boundary, 2d.; beyond three miles from the base-rate boundary, 3d. The reduced charge is being brought into operation as equipment becomes available for the necessary alteration in mechanism in the apparatus affected.
The telephone-exchange system included on the 31st March, 1926, 11,057 miles of pole line and 402,433 miles of wire.
An analysis of the wire in existence in connection with telephone exchanges is as follows:—
| Miles. | |
|---|---|
| In lead-covered cables— | |
| Underground | 247,279 |
| Aerial | 76,478 |
| Open aerial— | |
| Metallic circuit | 76,010 |
| Earth-working | 2,666 |
| 402,433 | |
The capital expenditure on the equipment, &c., of the telephone exchanges up to the 31st March, 1926, was £5,214,146, equal to an average cost of £41 11s. 9d. for each connection. The telephone-exchange receipts for the twelve months ended 31st March, 1926, were £980,283.
The first wireless-telegraph station opened in New Zealand for communicating with ships at sea was that at Wellington, on the 26th July, 1911. Details of the stations now under the control of the Post and Telegraph Department are—
| Station and Call Signal. | Hours of Service. | Wave-length, in Metres (Normal in Heavy Type). | Daylight Range (in Knots) on Normal Wave-length. |
|---|---|---|---|
* Observes continuous listening service for distress signals. † Communicates with ship stations mainly between 6.30 p.m. and 11 p.m. | |||
| Radio-Awanui (VLA), 173° 14' 34–44” E., 35° 4' 58–17” S. | 8 a.m.-11 p.m.*† | 300, 600, 1,000, 2,000, 2,500, 3,500 | 500 |
| Radio - Awarua (VLB), 168° 22' 21.5” E., 46° 30' 27.6” S. | Continuous | 300, 600, 1,000, 2,000 2,500, 3,500 | 300 |
| Radio-Apia, Samoa (VMG), 171° 49' 42” W., 13° 50' 17” S. | Continuous | 300, 600, 2,000 | 500 |
| Radio-Wellington (VLW), 174° 45' 55” E., 41° 16' 26” S. | Continuous | 300, 600 | 300 |
| Radio-Chatham Islands (VLC), 176° 31' 4” W., 43° 57' 2” S. | 4 p.m.-midnight | 300, 600, 1,600 | 300 |
| Radio-Auckland (VLD), 174° 46' 8.3” E., 36° 50” 36.9” S. | Continuous | 300, 600 | 300 |
| Station and Call Signal. | Hours of Service. | Wave-length, in Metres (Normal in Heavy Type). | Daylight Rang (in Knots) on Normal Wave-length. |
|---|---|---|---|
* Rarotonga time is 22 hours 9 minutes behind New Zealand time. † Station handling restricted public correspondence only, and erected for point-to-point communication. ‡ Radio-telephone station. § Attends Wednesdays and Saturdays from January to March, and Mondays, Wednesdays, Thursdays, and Saturdays, April to December. | |||
| Radio-Rarotonga, Cook Islands (VMR), 159° 48' 514” W., 21° 11' 54” S. | 6 p.m.-1 a.m. (local time).* Midnight to 1 a.m. attendance not observed on Sundays or holidays | 300, 600, 1,700 | 300 |
| † Radio-Aitutaki, Cook Islands (VLF), 159° 46' 30” W., 18° 52' 32” S. | 8–9 a.m., 6–7 p.m. | 450, 600 | 150 |
| † Radio-Mangaia, Cook Islands (VLG), 157° 56' W., 21° 55' S. | 8–9 a.m., 6–7 p.m. | 450, 600 | 150 |
| †‡ Radio-Niue (VLK), 169° 55' 15” W., 19° 1' 42” S. | Noon-1 p.m 6.30 – 11.30 p.m. | 600 | 350 |
| † Radio-Kawau Island (VLO), 174° 50' E., 36° 26' S. | 9 a.m.-6 p.m. | 600 | 50 |
| † Puysegur Point (VMBL), 166° 37' E., 46° 11' S. | 9 a.m,-5 p.m. | 600 | 100 |
| † Stephen Island (VMBP), 174° 1' E. 40° 46' S. | 9 a.m.-5 p.m. | 600 | 100 |
| †‡ Atiu, Cook Islands (VMY), 158° 2' W., 20° S. | 8.8.30 a.m.§ | 450 | 150 |
The Rarotonga station is of the Marconi synchronous gap type; the remainder use the Telefunken quenched gap (500 cycles) spark system. In addition, the Wellington and Auckland stations use valve transmitters fitted for both continuous wave and interrupted continuous wave transmission. The aerial system in most cases comprises an umbrella aerial, with earthed counterpoise for long waves and a T aerial for short waves.
By means of the radio-stations at Awanui, Apia, and Rarotonga communication is maintained between New Zealand and the Pacific islands.
Communication is effected with outer islands in the Cook Group by Radio-Rarotonga through small feeder-stations at Aitutaki, Atiu, and Mangaia; and a small radio-telephone station on Niue (or Savage Island) communicates with Radio-Apia.
The radio business transacted by the New Zealand coast stations during the last five years was as follows:—
| Year ended 31st March. | Forwarded. | Received. | ||||
|---|---|---|---|---|---|---|
| Messages. | Words. | Value. | Messages. | Words. | Value.* | |
* Amount earned by New Zealand. | ||||||
| £ | £ | |||||
| 1922 | 12,152 | 223,562 | 6,503 | 20,086 | 226,886 | 4,328 |
| 1923 | 11,940 | 230,481 | 5,628 | 19,715 | 215,013 | 3,792 |
| 1924 | 13,907 | 244,955 | 6,414 | 22,576 | 242,390 | 4,401 |
| 1925 | 16,259 | 293,189 | 7,331 | 25,669 | 270,814 | 4,777 |
| 1926 | 16,270 | 241,621 | 7,064 | 26,002 | 280,716 | 4,669 |
The foregoing table does not include free (service) messages.
The general rate for transmission of radio-telegrams has been fixed at 5d. a word for all vessels on the Australian or New Zealand register.
The New Zealand coast stations are all connected with the land-line systems. Complete arrangements exist for the prompt transmission of wireless telegrams over them, and for ensuring that distress signals shall be immediately communicated to the proper authorities.
Private radio-stations are at present governed by the Regulations for Radio Receiving, Amateur Transmitting and Receiving, and Experimental Stations, and by the Regulations for Radio Broadcasting Stations and the Sale of Radio Apparatus, which were gazetted on the 5th and 12th March, 1925, respectively.
The licenses for radio receiving-stations are designed to provide for reception from radio-telephone broadcasting stations as well as for experimental reception, and may be obtained at any postal money-order office or at any District Radio Inspector's office on payment of the prescribed fee.
The licenses for amateur transmitting and receiving stations are intended to provide facilities for experimental transmission to those interested in radio science, and are issued subject to the qualifications of the applicants being satisfactory.
The licenses for “experimental stations” are intended to provide facilities for the work of pure research in radio science, and are issued only to persons of recognized attainment in the theory or practice of radio-telegraphy, or to universities or other scientific institutions engaged in conducting experiments for the development of the science of radio telegraphy.
The regulations for the sale of radio apparatus are intended to provide for the proper control of the sale of apparatus designed and intended for use in connection with wireless telegraphy. The regulations govern the issue of three classes of radio-dealers' licenses, viz.—
Class I, for dealers in any of the four main cities.
Class II, for dealers, in towns with a population of more than 5,000.
Class III, for dealers in towns with a population of 5,000 or less.
At the 31st March, 1926, there were 3,588 receiving-station licenses in force, a percentage of this number, however, being for short periods. Licenses were also issued in respect of 98 transmitting and receiving stations, 6 private broadcasting stations, and 1 experimental station. The number of radio-dealers' licenses issued during the year was 191.
The regulations governing radio-telephone broadcasting are designed to render the broadcasting of music, lectures, religious services, news, and other items of interest as widely available as possible. The service is being provided by a recently formed company, with a capital of £20,000, known as the Radio Broadcasting Company of New Zealand (Limited). Up to the present the service has been carried out by means of temporary stations at Auckland, Wellington, Christchurch, and Dunedin, but these are to be replaced by stations embodying all the latest improvements in radio broadcasting. The new Auckland and Christchurch stations have already commenced operations.
The Pacific cable, opened for traffic between New Zealand and Australia and Fiji on the 9th April, 1902, was completed to Bamfield, Vancouver Island, on the 31st October following, and opened for international business on the 8th December, 1902.
The route is from Auckland to Vancouver, via Norfolk Island, Fiji, and Fanning Island. The Australian connection is at Norfolk Island. The deep-sea portion of the Vancouver - Fanning Island cable is stated to be the longest in the world.
Direct communication between Auckland and Sydney was established on the 31st December, 1912, thus giving the Pacific Cable Board an alternative route to Australia.
Additional facilities have been provided between New Zealand and Fiji by the laying, by the Pacific Cable Board, of a new cable between Auckland and Suva. This work was completed on the 12th August, 1923. Contracts have now been placed for the duplication of the two northern sections—Vancouver to Fanning Island and Fanning Island to Fiji. It is expected that the duplication of these sections will be completed within a few months.
In addition, the Eastern Extension, Australasia, and China Telegraph Company (Limited) provide and operate as part of their telegraph system two cables between Australia and New Zealand, the terminal offices being at Sydney and Wellington.
During the year 1925–26 the Pacific route took 65 per cent. of the outward business, and the Eastern route 35 per cent., the messages sent by the two routes numbering 204,586 and 110,146 respectively.
The length of submarine cable in use in the Dominion, apart from ocean-cable services, is 448 knots.
The huge volume and multifarious business of the Post and Telegraph Department entail the employment of a numerous staff. The Secretary, under the Ministerial control of the Postmaster-General, is the administrative head.
A return of the staff as at 31st March, 1926, is as follows: Permanent, 8,182; temporary, 1,224: total, 9,406. In addition, there are 1,988 country postmasters and telephonists who act as such in conjunction with other pursuits and do not rank as officers of the Department. There are also 102 officers of the Railways Department who act as postmasters.
The receipts and payments of the Post and Telegraph Department for the financial year 1925–26 are shown in the following table:—
| RECEIPTS. | |||
|---|---|---|---|
| Item. | Postal. | Telegraph. | Total. |
| £ | £ | £ | |
| Postages | 1,077,601 | .. | 1,077,601 |
| Money-order and postal-note commission | 48,447 | .. | 48,447 |
| Money-order commission received from foreign offices | 933 | .. | 933 |
| Private box and bag rents and rural-delivery fees | 24,547 | .. | 24,547 |
| Miscellaneous receipts | 168,749 | 17,158 | 185,907 |
| Paid telegrams | .. | 424,642 | 424,642 |
| Paid tolls | .. | 358,037 | 358,037 |
| Telephone exchanges | .. | 980,283 | 980,283 |
| Totals | 1,320,277 | 1,780,120 | 3,100,397 |
| PAYMENTS. | |||
|---|---|---|---|
| Item. | Postal. | Telegraph. | Total. |
| £ | £ | £ | |
| Salaries | 614,629 | 903,841 | 1,518,470 |
| Conveyance of mails by sea | 69,237 | .. | 69,237 |
| Conveyance of inland mails | 144,780 | .. | 144,780 |
| Conveyance of mails by railway | 103,248 | .. | 103,248 |
| Money-order commission credited to foreign offices | 2,765 | .. | 2,765 |
| Maintenance of telegraph and telephone lines | .. | 194,749 | 194,749 |
| Motor services and workshops | 27,957 | 25,566 | 53,523 |
| Miscellaneous | 164,688 | 158,097 | 322,785 |
| Totals | 1,127,304 | 1,282,253 | 2,409,557 |
| Balance of receipts over payments | 192,973 | 497,867 | 690,840 |
The growth of receipts and payments during the period 1881–82 to 1925–26 is shown by the following figures:—
| Year ended 31st March. | Receipts. | Payments. |
|---|---|---|
| £ | £ | |
| 1882 | 234,529 | 233,291 |
| 1892 | 320,058 | 268,343 |
| 1902 | 488,573 | 465,756 |
| 1912 | 1,087,710 | 988,911 |
| 1917 | 1,809,317 | 1,370,810 |
| 1918 | 1,837,260 | 1,489,446 |
| 1919 | 1,972,539 | 1,702,048 |
| 1920 | 2,106,995 | 1,944,161 |
| 1921 | 2,590,441 | 2,591,786 |
| 1922 | 2,811,535 | 2,451,572 |
| 1923 | 2,687,768 | 2,114,994 |
| 1924 | 2,688,953 | 2,120,585 |
| 1925 | 2,889,450 | 2,416,257 |
| 1926 | 3,100,397 | 2,409,557 |
In addition to its ordinary business, the Post and Telegraph Department performs an enormous amount of work for almost every other Department of State. The monetary value of this business reaches many millions of pounds annually, and the operations range from the receipt of advances-to-settlers payments (£7,040,770 during the twelve months ended 31st March, 1926) to the sale of fishing licenses (£2,080), and from the payment of pensions (£2,373,685) to the performance of marriage ceremonies. The registration of motor-vehicles under the Motor-vehicles Act, 1924, is carried out by the Postal Department.
Table of Contents
THE total area of the Dominion, excluding the Cook and other Pacific islands annexed in 1901, is 66,390,262 acres. Of this total, 43,606,829 acres were returned in 1926 as being in occupation, including reserves and Native lands leased, but excluding areas within borough boundaries, holdings of less than 1 acre in extent, and Native land held on the communal system.
According to information published by the Lands Department, the following is the condition of the land in the Dominion:—
| Acres. | |
|---|---|
| Total area sold or granted and held on freehold | 21,136,060 |
| Total area reserved for public purposes | 14,509,029 |
| Total area, of Crown lands leased under all tenures (exclusive of reserves leased by the Crown) | 18,219,768 |
| Total area of Crown land available for future disposal | 2,781,296 |
| Total area of Native land | 5,861,838 |
| Land unfit for settlement, including rivers, lakes, roads, &c. | 3,882,271 |
| Total | 66,390,262 |
The numbers of holdings and percentages of total holdings in occupation in groups of sizes, as returned at the last five collections, are given below:—
| OCCUPIED LANDS.—HOLDINGS. | ||||||||||
|---|---|---|---|---|---|---|---|---|---|---|
| Area, in Acres. | Number of Holdings. | Percentages of Total. | ||||||||
| 1922. | 1923. | 1924. | 1925. | 1926. | 1922. | 1923. | 1924. | 1925. | 1926. | |
| (Inclusive) | ||||||||||
| 1 to 10 | 15,629 | 15,450 | 15,540 | 15,381 | 15,242 | 18.41 | 18.07 | 18.04 | 17.89 | 17.78 |
| 11 ,, 50 | 13,898 | 14,030 | 14,277 | 14,265 | 14,232 | 16.37 | 16.40 | 1657 | 16.59 | 16.60 |
| 51 ,, 100 | 11,073 | 11,893 | 11,555 | 11,495 | 11,474 | 13.04 | 13.32 | 18.42 | 13.37 | 13.38 |
| 101 ,, 200 | 14,015 | 14,193 | 14,291 | 14,371 | 14,367 | 16.51 | 16.59 | 16.59 | 16.71 | 16.76 |
| 201 ,, 320 | 8,739 | 8,881 | 8,909 | 8,846 | 8,762 | 10.29 | 10.36 | 10.34 | 10.29 | 10.22 |
| 321 ,, 640 | 10,378 | 10,415 | 10,422 | 10,395 | 10,362 | 12.23 | 12.18 | 12.10 | 12.09 | 12.09 |
| 641 ,, 1,000 | 4,280 | 4,259 | 4,216 | 4,261 | 4,317 | 4.98 | 4.98 | 4.89 | 4.96 | 5.03 |
| 1,001 ,, 5,000 | 5,844 | 5,822 | 5,832 | 5,864 | 5,891 | 6.88 | 6.81 | 6.77 | 6.82 | 6.87 |
| 5,001 ,, 10,000 | 565 | 569 | 573 | 570 | 568 | 0.67 | 0.67 | 0.67 | 0.66 | 0.66 |
| 10,001 ,, 20,000 | 301 | 301 | 296 | 301 | 294 | 0.35 | 0.35 | 0.34 | 0.35 | 0.84 |
| 20,001 ,, 50,000 | 168 | 167 | 168 | 169 | 169 | 0.20 | 0.20 | 0.20 | 0.20 | 0.20 |
| Over 50,000 | 59 | 59 | 60 | 59 56 | 0.07 | 0.07 | 0.07 | 0.07 | 0.07 | |
| Totals | 84,899 | 85,519 | 86,139 | 85,977 | 85,734 | 100.00 | 100.00 | 100.00 | 10000 | 100.00 |
Seventy-five per cent. of the holdings are seen to be not more than one-half a square mile in area. These, however, represent only a little over 13 per cent. of the total area of occupied land in the Dominion, and from the two following tables, showing areas of holdings in occupation by size-groups and the percentage each group represents of the total area in occupation, it is seen that 68 per cent. of the occupied land is held in areas of over 1,000 acres, and 41 ½ per cent. in areas of over 5,000 acres.
| OCCUPIED LANDS.—AREAS. | |||||
|---|---|---|---|---|---|
| Sizes of Holdings, in Acres. | Aggregate Area of Group. | ||||
| 1922. | 1923. | 1924. | 1925. | 1926. | |
| (Inclusive) | Acres. | Acres. | Acres. | Acres. | Acres. |
| 1 to 10 | 73,445 | 73,073 | 73,746 | 73,700 | 72,957 |
| 11 ,, 50 | 392,768 | 397,253 | 405,642 | 405,650 | 404,817 |
| 51 ,, 100 | 860,009 | 881,756 | 892,793 | 887,840 | 886,784 |
| 101 ,, 200 | 2,072,357 | 2,094,165 | 2,109,410 | 2,118,701 | 2,119,247 |
| 201 ,, 320 | 2,240,664 | 2,270,585 | 2,281,501 | 2,265,477 | 2,247,609 |
| 321 ,, 640 | 4,737,640 | 4,745,854 | 4,750,329 | 4,735,425 | 4,722,140 |
| 641 ,, 1,000 | 3,417,338 | 3,428,628 | 3,392,881 | 3,425,566 | 3,498,739 |
| 1,001 ,, 5,000 | 11,453,335 | 11,393,459 | 11,386,971 | 11,477,823 | 11,595,789 |
| 5,001 ,, 10,000 | 3,891,874 | 3,893,329 | 3,886,902 | 3,905,686 | 3,896,934 |
| 10,001 ,, 20,000 | 4,252,754 | 4,235,050 | 4,169,965 | 4,242,147 | 4,162,307 |
| 20,001 ,, 50,000 | 5,094,088 | 5,170,089 | 5,151,061 | 5,139,745 | 5,216,027 |
| Over 50,000 | 5,042,065 | 5,069,922 | 5,071,363 | 4,954,612 | 4,783,479 |
| Totals | 43,528,337 | 43,653,163 | 43,572,564 | 43,632,372 | 43,606,829 |
| Sizes of Holdings, in Acres. | Percentage of Total Area occupied. | ||||
|---|---|---|---|---|---|
| 1922. | 1923. | 1921. | 1925. | 1926. | |
| (Inclusive) | |||||
| 1 to 10 | 0.17 | 0.17 | 0.17 | 0.17 | 0.17 |
| 11 ,, 50 | 0.90 | 0.91 | 0.93 | 0.93 | 0.93 |
| 51 ,, 100 | 1.98 | 2.02 | 2.05 | 2.03 | 2.03 |
| 101 ,, 200 | 4.76 | 4.80 | 4.84 | 4.86 | 4.86 |
| 201 ,, 320 | 5.15 | 5.20 | 5.24 | 5.19 | 5.15 |
| 321 ,, 640 | 10.88 | 10.87 | 10.90 | 10.85 | 10.83 |
| 641 ,, 1,000 | 7.85 | 7.85 | 7.79 | 7.85 | 8.02 |
| 1,001 ,, 5,000 | 26.31 | 26.10 | 2613 | 26.31 | 26.59 |
| 5,001 ,, 10,000 | 8.94 | 8.92 | 8.92 | 8.95 | 8.94 |
| 10,001 ,, 20,000 | 9.77 | 9.70 | 9.57 | 9.72 | 9.55 |
| 20,001 ,, 50,000 | 11.71 | 11.84 | 11.82 | 11.78 | 11.96 |
| Over 50,000 | 11.58 | 11.62 | 11.64 | 11.36 | 10.97 |
| Totals | 100.00 | 100.00 | 100.00 | 100.00 | 100.00 |
Taking the years 1921 and 1926, it is now possible to show the increase or decrease in the percentages of numbers and areas of holdings according to size-groups.
| OCCUPIED LANDS.—INCREASE OR DECREASE IN PEROENTAGES OF NUMBERS AND AREAS OF HOLDINGS BY SIZE-GROUPS. | ||||
|---|---|---|---|---|
| Sizes of Holdings, in Acres. | 1921. | 1926. | ||
| Per Cent. of Total. | Increase or Decrease compared with Percentages of 1921. | |||
| Number. | Area. | Number. | Area. | |
| (Inclusive) | ||||
| 1 to 10 | 18.73 | 0.17 | -0.95 | .. |
| 11 ,, 50 | 16.25 | 0.88 | +0.35 | +005 |
| 51 ,, 100 | 12.74 | 1.92 | +0.64 | +0.11 |
| 101 ,, 200 | 16.41 | 4.69 | +0.35 | +0.17 |
| 201 ,, 320 | 10.37 | 5.14 | -015 | +0.01 |
| 321 ,, 640 | 12.34 | 10.87 | -0.25 | -0.04 |
| 641 ,, 1,000 | 4.98 | 7.75 | +0.05 | +0.27 |
| 1,001 ,, 5,000 | 6.89 | 26.25 | -0.02 | +0.34 |
| 5,001 ,, 10,000 | 0.66 | 8.79 | .. | +0.15 |
| 10,001 ,, 20,000 | 0.37 | 10.16 | -0.03 | -0.61 |
| 20,001 ,, 50,000 | 0.19 | 11.46 | +0.01 | +0.50 |
| Over 50,000 | 0.07 | 11.92 | .. | -0.95 |
The following table gives the numbers and average areas of holdings for each land district in the Dominion as ascertained at the 1926 collection of agricultural and pastoral statistics.
As regards counties, Waimairi County is the most closely settled, the average area of holdings being 18.57 acres, while Fiord County shows the largest average—viz., 18,000 acres. In the latter county, however, there is in occupation only one holding of an acre or more. There are no counties in the North Island having an average in excess of 2,500 acres, but in the South Island there are no fewer than six — viz., Awatere, Amuri, Tawera, Mackenzie, Lake, and Fiord.
The average area of holdings for the Dominion is 508.63 acres, and this average is exceeded by twenty-three counties out of seventy-eight in the North Island, and by twenty-six out of fifty-one in the South Island. The average area for the North Island is 364–51 acres, and for the South 723–45 acres.
| TABLE SHOWING THE NUMBERS AND AVERAGE AREAS OF HOLDINGS FOR EACH LAND DISTRICT IN THE DOMINION. | |||
|---|---|---|---|
| Land District. | Number of Holdings. | Total Area occupied. | Average Area of Holdings. |
| Acres. | Acres. | ||
| North Auckland | 13,858 | 2,960,337 | 213.62 |
| Auckland | 12,415 | 4,187,822 | 337.32 |
| Gisborne | 2,839 | 2,774,667 | 977.34 |
| Hawke's Bay | 4,597 | 2,084,306 | 453.41 |
| Taranaki | 6,560 | 1,722,499 | 262.58 |
| Wellington | 11,042 | 4,973,825 | 450.45 |
| Nelson | 3,797 | 1,298,436 | 341.96 |
| Marlborough | 1,977 | 2,491,324 | 1,260.15 |
| Westland | 1,514 | 1,799,488 | 1,188.57 |
| Canterbury | 13,363 | 8,109,260 | 606.84 |
| Otago | 7,935 | 7,963,397 | 1,003.58 |
| Southland | 5,837 | 3,241,468 | 555.33 |
| Totals, Dominion | 85,734 | 43,606,829 | 508.63 |
Land in occupation in each land district, tabulated according to tenure, is given in the following table:—
| OCCUPIED LANDS.—TENURE, 1926. | |||||
|---|---|---|---|---|---|
| Land District. | Total of Holdings. | Freehold, including land held on Deferred Payment (occupied by Owner). | Leased from Private Individuals or Public Bodies. | Leased from Natives. | Held from Crown under different Tenures, not Including Land held on Deferred Payment. |
*Including 145 acres the tenure of which was unspecified. † Of which 1,799,698 acres were returned as leased from private individuals and 49,840 acres from public bodies. | |||||
| Acres. | Acres. | Acres. | Acres. | Acres. | |
| North Auckland | 2,960,337 | 2,387,106 | 162,479 | 82,841 | 327,911 |
| Auckland | 4,187,822* | 2,820,339 | 196,595 | 334,703 | 836,040 |
| Gisborne | 2,774,667 | 1,453,377 | 195,483 | 526,037 | 599,770 |
| Hawke's Bay | 2,084,306 | 1,461,308 | 126,829 | 73,C91 | 422,478 |
| Taranaki | 1,722,499 | 905,104 | 244,083 | 73,545 | 499,767 |
| Wellington | 4,973,825 | 3,432,945 | 421,925 | 445,224 | 673,731 |
| Nelson | 1,298,436 | 628,131 | 63,493 | 15,706 | 591,106 |
| Marlborough | 2,491,324 | 910,241 | 43,815 | 20,002 | 1,517,266 |
| Westland | 1,799,488 | 149,923 | 33,145 | 4,036 | 1,612,384 |
| Canterbury | 8,109,260 | 3,182,779 | 563,727 | 8,993 | 4,353,761 |
| Otago | 7,963,397 | 1,619,584 | 265,694 | 7,590 | 6,070,529 |
| Southland | 3,241,468 | 1,500,380 | 232,270 | 6,114 | 1,502,704 |
| Totals | 43,606,829* | 20,451,217 | 2,549,638t | 1,598,482 | 19,007,447 |
The acreage in the last column does not agree exactly with the figures published in the report of the Lands and Survey Department, for the reason that, although these figures include Crown reserves leased, they do not include Crown lands not in occupation at the time of collecting the agricultural and pastoral statistics. Further, all land held on deferred payment is shown as freehold, irrespective of whether in process of purchase from the Crown or not; also, the figures are as at the 31st January, whilst those figures published by the Lands and Survey Department are as at the 31st March.
In point of area the most important Crown-lands tenure is “pastoral run,” the area for 1926 being 9,650,132 acres. Considerable areas are also held under the following tenures: Small grazing-runs, 2,736,596 acres; lease in perpetuity, 1,657,563 acres; occupation with right of purchase, 1,240,150 acres; renewable lease, 2,083,916 acres.
Further details of tenure, &c., of Crown lands will be found in Subsection B of this section.
Lands in occupation are, however, not strictly comparable with Crown lands, alienated or in process of alienation, for certain lands have passed into the hands of Europeans which were never made waste lands of the Crown. It must also be remembered that of the freehold land in the Dominion a considerable area is unoccupied and unused.
A special classification of holdings (according to purpose for which principally used) is made three times in each decennium. The following table gives a comparison of the last two classifications—viz., those of 1919–20 and 1922–23. Figures exclude borough holdings and holdings under 1 acre in extent.
| CLASSIFIED HOLDINGS, 1919–20 AND 1922–23. | ||||
|---|---|---|---|---|
| Classification. | 1919–20. | 1922–23. | ||
| Number of Holdings. | Area. | Number of Holdings. | Area. | |
| Acres. | Acres. | |||
| Agricultural | 10,146 | 2,220,207 | 10,489 | 2,129,802 |
| Dairying | 29,111 | 4,244,986 | 38,818 | 6,267,597 |
| Pastoral and other (including unspecified) | 42,335 | 37,007,886 | 36,212 | 35,255,764 |
| All holdings | 81,592 | 43,473,079 | 85,519 | 43,653,163 |
Hitherto Maori holdings have been classified in the same way each year, but it has now been decided to undertake this tabulation only in the same years as the main classification. It should be noted that Maori holdings include those held and worked by full-blooded, three-quarter-caste, and half-caste Maoris. Maori lands held on the communal system are excluded.
| CLASSIFIED HOLDINGS (MAORIS ONLY), 1922–23, 1923–24, AND 1924–25. | ||||||
|---|---|---|---|---|---|---|
| Classification. | 1922–23. | 1923–21. | 1924–25. | |||
| Number of Holdings. | Area. | Number of Holdings. | Area. | Number of Holdings. | Area. | |
| Acres. | Acres. | Acres. | ||||
| Agricultural | 144 | 4,789 | 134 | 8,309 | 157 | 9,226 |
| Dairying | 947 | 143,024 | 1,090 | 164,260 | 1,245 | 173,799 |
| Pastoral and other (including unspecified) | 1,527 | 582,207 | 1,383 | 573,804 | 1,324 | 622,353 |
| All holdings | 2,618 | 730,020 | 2,607 | 746,373 | 2,726 | 805,378 |
The land in occupation in the Dominion at the 31st January, 1926, is classified according to condition and use as follows:—
| Acres. | |
|---|---|
| In grain and pulse crops | 577,525 |
| In grasses and clovers (for hay and seed) and green and root crops | 1,068,194 |
| In fallow | 135,355 |
| In grasses and clovers, not cut for hay or seed | 16,615,960 |
| In vineyards and orchards | 27,329 |
| In market gardens, nurseries, and seed-gardens | 5,104 |
| In private gardens and pleasure-grounds | 64,872 |
| In plantations | 88,656 |
| Total area in cultivation | 18,582,995 |
| Unimproved land | 25,023,834 |
| Total area in occupation | 43,606,829 |
Further details of land in cultivation and of the various crops grown are given under their respective headings in Subsection B of the next section. Unimproved lands are not again referred to, and accordingly a table is appended showing by land districts more detailed information as to the condition of unimproved occupied land.
| UNIMPROVED OCCUPIED LAND, 1925–26. | ||||||
|---|---|---|---|---|---|---|
| Land District. | Phormium Tenax. | Tussock and other Native Grasses. | Fern, Scrub, and Second Growth. | Standing Virgin Bush. | Barren and Unproductive Land. | Total Unimproved Occupied Land. |
| Acres. | Acres. | Acres. | Acres. | Acres. | Acres. | |
| North Auckland | 4,786 | 152,609 | 805,128 | 339,253 | 63,218 | 1,364,994 |
| Auckland | 11,179 | 174,061 | 1,171,822 | 587,670 | 32,332 | 1,977,064 |
| Gisborne | 1,180 | 194,211 | 257,114 | 386,939 | 13,172 | 852,616 |
| Hawke's Bay | 449 | 393,485 | 149,048 | 53,458 | 13,061 | 609,501 |
| Taranaki | 155 | 6,293 | 115,260 | 277,969 | 4,465 | 404,142 |
| Wellington | 15,905 | 613,573 | 332,493 | 374,414 | 81,745 | 1,418,130 |
| Nelson | 2,058 | 340,398 | 172,712 | 400,007 | 24,776 | 939,951 |
| Marlborough | 819 | 1,228,850 | 226,796 | 189,879 | 377,324 | 2,023,668 |
| Westland | 13,104 | 195,539 | 123,449 | 973,671 | 347,085 | 1,652,848 |
| Canterbury | 730 | 4,141,601 | 111,703 | 198,627 | 870,772 | 5,323,433 |
| Otago | 1,108 | 5,426,182 | 441,255 | 265,699 | 401,341 | 6,535,585 |
| Southland | 6,307 | 1,431,816 | 258,796 | 128,983 | 96,000 | 1,921,902 |
| Totals | 57,780 | 14,298,618 | 4,165,576 | 4,176,569 | 2,325,291 | 25,023,834 |
The diagram on the next page shows clearly the condition of land in occupation at the 31st January, 1926. Of the total of 43,606,829 acres, unimproved land amounted to 25,023,834 acres, and improved land to 18,582,995 acres. As might be expected in a pastoral-dairying country like New Zealand, permanent pasture (16,615,960 acres) forms a considerable portion of the land occupied. Gram and pulse crops, grasses and clovers (cut for hay or seed), and green and root crops aggregated 1,645,719 acres, or less than 4 per cent. of the total area occupied. The various groups of these crops are given in subdivisions of the broader general divisions.
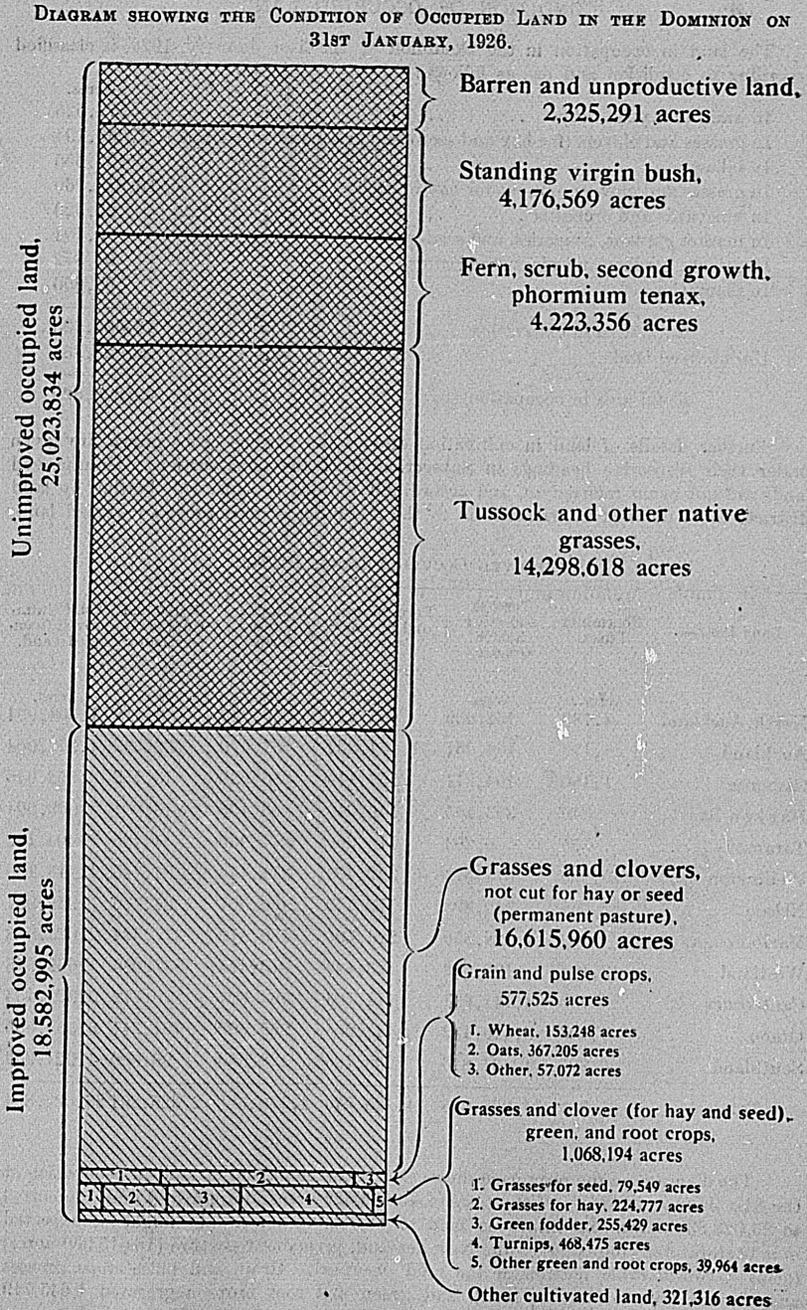
Prior to 1870 conveyancing in New Zealand was based upon the English laws of real property as existing at the date of the constitution of the colony, varied in some important particulars by the Conveyancing Ordinance of 1842 and other colonial legislation, now embodied in the Property Law Act, 1908. Considerable areas of land in all parts of the Dominion are still held and dealt with under this system. Although provision is made for the registration of deeds affecting such land, registration is no guarantee of their validity, and a purchaser has to rely for the security of his title upon the skill and care of his legal adviser.
By the Land Transfer Act, 1870, the system of title by registration was introduced. The title to land under this system is not affected by the execution of documents. Registration is the fundamental principle, and it is only on registration that any interest passes. The Land Transfer Department assumes all responsibility for the registration, and any person named in the register as taking an interest under a registered instrument acquires a practically indefeasible title.
In the year 1924 it was estimated that 81.4 per cent. of the land in the Dominion alienated from the Crown in fee-simple had been brought under the provisions of the Land Transfer Act. The estimated percentages for the various registration districts were—
| Registration District. | Deeds. | Land Transfer |
|---|---|---|
| Per Cent. | Per Cent. | |
| Auckland | 24.5 | 75.5 |
| Poverty Bay | 1.5 | 98.5 |
| Taranaki | 140 | 86.0 |
| Wellington | 8.6 | 91.4 |
| Hawke's Bay | 25.5 | 74.5 |
| Marlborough | 35.8 | 64.2 |
| Nelson | 330 | 67.0 |
| Westland | 14.7 | 85.3 |
| Canterbury | 9.1 | 90.9 |
| Otago | 26.5 | 73.5 |
| Invercargill | 11.7 | 88.3 |
| Totals for Dominion | 18.6 | 81.4 |
The estimated number of holdings or titles then under the deeds-registration system was seventy thousand, and the number was increasing at the rate of about 4 per cent. per annum, in spite of lands being brought under the Land Transfer Act.
By the Land Transfer (Compulsory Registration of Titles) Act, 1924, title by registration is to be made compulsory. The Land Transfer system of title by registration has great advantages over the other and older system of title by deeds, even when the deeds are duly registered. The state of a Land Transfer title can be ascertained by a search of the register with very much greater facility than can the state of a title under the other system, and the powers vested in Registrars under the Land Transfer Act enable them to keep the register simple, clear, and free from doubts, which is not the case under the other system; the simplicity of searching, and of the preparation of instruments under the Land Transfer system enables transactions with land under that system to be carried out at less cost than under the other system; and under the Land Transfer system there is the State guarantee of a practically indefeasible title, as mentioned above.
These considerations led to the passing in 1924 of the Land Transfer (Compulsory Registration of Titles) Act, which has for its object the bringing under the provisions of the Land Transfer Act, 1915, of all land alienated by the Crown and not already under the provisions of that Act, except lands held by aboriginal Natives of New Zealand under their customs and usages.
The Registrars in charge of the various registration districts constituted under the Land Transfer Act, 1915, are directed by the new Act to make what will be in effect an official examination of all the titles to land not subject to the Land Transfer Act, and to issue certificates of title to the persons entitled to estates of freehold therein. Such certificates of title will, in cases where the Registrar finds that the title is free from any defect or doubt, be ordinary certificates of title under which the holder's title is fully guaranteed by the State. If, however, it appears that the owner's title is defective or doubtful, it is the duty of the Registrar to issue what is-termed a limited certificate of title, the effect of which is that the owner's title is guaranteed except as to the specific defects or doubts that may be found by the Registrar to exist. It is open to the owner to have the defects or doubts remedied or removed, and he will then be entitled to receive a certificate of title fully guaranteed. Owners or claimants of interest in land other than registered proprietors are given twelve years in which to prove their titles or to substantiate their claims, if such claims or interest have been excepted from the guarantee, and if they do not do so, then at the expiration of the twelve years the registered proprietor will be entitled to an ordinary fully-guaranteed certificate of title, upon his proving to the satisfaction of the Registrar merely that he is in possession of the land comprised in his certificate of title.
As soon as a certificate of title, whether fully guaranteed or limited, has been issued for any particular parcel of land, it will no longer be necessary for conveyancers to examine the various deeds which have affected the title. All they will need to do will be to search the certificate of title and the Registrar's minutes setting forth the defects (if any).
Provision has existed since 1841 and is now contained in the Deeds Registration Act, 1908, for the registration of deeds and Instruments affecting land which is not subject to the provisions of the Land Transfer Act. Registration is not essential to the validity of the instrument, but it is highly important as a record and to secure priority. The Act provides that every deed shall be void as against any person claiming for valuable consideration under any subsequent deed duly registered unless the earlier deed was registered before the subsequent one. The Department is not responsible for the form or matter of the instruments registered beyond seeing that they are duly stamped and contain a sufficient description of the land to identify it.
Provision is made for the deposit of instruments in the Deeds Registry Office for safe custody and reference, and such deposit operates as a release from any covenant for production. The Deeds Index and ail recorded and deposited instruments are open to public inspection, and certified copies may be obtained on payment of the prescribed fees.
Information as to transactions under the Deeds Registration Act for each of the last ten years is given in the following statement:—
| Year ended 31st March. | Deeds recorded. | Fees. £ |
|---|---|---|
| 1917 | 15,664 | 14,371 |
| 1918 | 13,673 | 13,226 |
| 1919 | 12,798 | 13,148 |
| 1920 | 24,650 | 25,157 |
| 1921 | 38,122 | 32,251 |
| 1922 | 25,352 | 21,956 |
| 1923 | 23,176 | 20,897 |
| 1924 | 25,411 | 23,706 |
| 1925 | 27,347 | 25,152 |
| 1926 | 28,784 | 25,649 |
The land - transfer system in New Zealand originated, as stated earlier, with the Land Transfer Act, 1870. This, re-enacted with amendments, is now the Land Transfer Act, 1915.
The land subject to the Land Transfer Act comprises all land alienated from the Crown since 1870, all land included in any order under the Native Land Acts vesting such land in any person in freehold tenure, and all land vested in any person in fee-simple by virtue of any Act of the General Assembly, besides land which has been brought under the Act on the application of the proprietors after investigation and acceptance of the title by the Department, and land brought under the Act pursuant to the Land Transfer (Compulsory Registration of Titles) Act, 1924.
Information as to applications to bring land under the Land Transfer Act during each of the last ten years is given in the next table:—
| Year ended 31st March. | Applications. | |||
|---|---|---|---|---|
| Number. | Area. | Value. | ||
| Town and Suburban. | Country. | |||
| Acres. | Acres. | £ | ||
| 1917 | 409 | 133 | 37,447 | 1,029,143 |
| 1918 | 316 | 99 | 89,388 | 965,089 |
| 1919 | 291 | 133 | 76,441 | 776,403 |
| 1920 | 497 | 175 | 85,237 | 1,343,243 |
| 1921 | 619 | 208 | 70,536 | 1,767,397 |
| 1922 | 491 | 197 | 31,786 | 1,181,317 |
| 1923 | 407 | 130 | 34,515 | 815,855 |
| 1924 | 447 | 241 | 25,656 | 1,285,587 |
| 1925 | 423 | 876 | 25,626 | 1,285,325 |
| 1926 | 422 | 194 | 25,720 | 989,404 |
The following table shows the number of certificates issued for the last ten years. Included in the totals are those certificates issued in lieu of Crown gr, 966 being the number for 1925–26. Also included in the number for 1926 are 8,095 certificates issued compulsorily under the Act of 1924.
| CERTIFICATES OF TITLE ISSUED. | |
|---|---|
| Year ended 31st March. | Number. |
| 1917 | 10,350 |
| 1918 | 10,230 |
| 1919 | 7,988 |
| 1920 | 11,637 |
| 1921 | 16,010 |
| 1922 | 19,653 |
| 1923 | 14,045 |
| 1924 | 14,077 |
| 1925 | 14,206 |
| 1926 | 23,654 |
The table next following shows transfers registered under the Land Transfer Act during each of the last ten years:—
| TRANSFERS REGISTERED. | ||||
|---|---|---|---|---|
| Year ended 31st March. | Number. | Area. | Consideration-money. | |
| Town and Suburban. | Country. | |||
| Acres. | Acres. | £ | ||
| 1917 | 22,187 | 79,316 | 2,676,691 | 34,288,831 |
| 1918 | 19,949 | 6,156 | 2,370 | 18,083,634 |
| 1919 | 22,496 | 21,156 | 1,312 | 25,197,384 |
| 1920 | 45,128 | 107,432 | 3,775,251 | 62,446,574 |
| 1921 | 55,746 | 16,154 | 4,557,328 | 81,790,063 |
| 1922 | 33,784 | 10,652 | 1,984,695 | 35,436,823 |
| 1923 | 31,021 | 7,955 | 2,499,123 | 29,980,153 |
| 1924 | 33,293 | 10,697 | 1,796,871 | 33,871,246 |
| 1925 | 34,289 | 8,589 | 2,007,984 | 33,625,622 |
| 1926 | 36,038 | 8,668 | 2,007,451 | 35,195,960 |
Monthly statistics of transfers registered under the Land Transfer Act are now avail. able, and are given from April, 1924, onwards in the table which follows, a distinction being made between town and suburban transactions on the one band and country transactions on the other. Slight discrepancies exist between the totals shown above and those arrived at for the last two years by the addition of the monthly figures, this being due to correction of minor errors when compiling the annual figures, without the corresponding adjustment being made in the totals for the appropriate months.
| Month. | Town and Suburban Properties. | Country Properties. | All Properties. | |||
|---|---|---|---|---|---|---|
| Number. | Consideration. | Number. | Consideration. | Number. | Consideration. | |
| 1924–25. | ||||||
| £ | £ | £ | ||||
| April | 1,905 | 1,650,994 | 541 | 1,272,625 | 2,446 | 3,923,619 |
| May | 2,472 | 1,762,561 | 701 | 1,378,048 | 3,173 | 3,140,609 |
| June | 2,190 | 1,408,780 | 663 | 1,380,468 | 2,853 | 2,789,248 |
| July | 2,512 | 1,676,069 | 786 | 1,533,196 | 3,298 | 3,209,265 |
| August | 1,806 | 1,506,165 | 1,228 | 1,471,532 | 3,034 | 2,977,697 |
| September | 2,195 | 1,580,084 | 641 | 1,043,587 | 2,836 | 2,623,671 |
| October | 2,339 | 1,418,902 | 680 | 1,282,721 | 3,019 | 2,701,623 |
| November | 2,044 | 1,327,178 | 667 | 1,279,587 | 2,711 | 2,606,765 |
| December | 2,321 | 1,550,642 | 743 | 1,589,652 | 3,064 | 3,140,294 |
| January | 1,423 | 803,489 | 410 | 788,167 | 1,833 | 1,591,656 |
| February | 2,169 | 1,470,046 | 671 | 1,308,956 | 2,840 | 2,779,002 |
| March | 2,487 | 1,570,682 | 654 | 1,494,924 | 3,141 | 3,065,606 |
| Year 1924–25 | 25,863 | 17,725,592 | 8,385 | 15,823,463 | 34,248 | 33,549,055 |
| 1925–26. | ||||||
| April | 1,703 | 1,180,302 | 738 | 1,264,542 | 2,441 | 2,444,844 |
| May | 2,195 | 1,686,257 | 949 | 1,971,039 | 3,144 | 3,657,296 |
| June | 2,243 | 1,481,353 | 976 | 1,637,963 | 3,219 | 3,119,316 |
| July | 2,471 | 1,665,694 | 1,134 | 2,435,907 | 3,605 | 4,101,601 |
| August | 2,265 | 1,538,445 | 810 | 1,360,847 | 3,075 | 2,899,292 |
| September | 2,343 | 1,445,636 | 806 | 1,397,438 | 3,149 | 2,843,074 |
| October | 2,780 | 1,675,690 | 827 | 1,396,048 | 3,607 | 3,071,738 |
| November | 2,037 | 1,631,490 | 701 | 1,679,346 | 2,738 | 3,310,836 |
| December | 2,217 | 1,561,525 | 661 | 1,058,352 | 2,878 | 2,619,877 |
| January | 1,241 | 856,416 | 375 | 713,491 | 1,616 | 1,569,907 |
| February | 2,001 | 1,336,392 | 600 | 1,031,436 | 2,601 | 2,367,828 |
| March | 2,642 | 1,797,864 | 743 | 1,389,140 | 3,385 | 3,187,004 |
| Year 1925–26 | 26,138 | 17,857,064 | 9,320 | 17,335,549 | 35,458 | 35,192,613 |
| 1926–27. | ||||||
| April | 1,775 | 1,228,045 | 739 | 1,172,087 | 2,514 | 2,400,132 |
| May | 2,346 | 1,404,813 | 755 | 1,524,500 | 3,101 | 2,929,313 |
| June | 2,274 | 1,468,358 | 843 | 1,591,671 | 3,117 | 3,060,029 |
| July | 2,486 | 1,738,390 | 800 | 1,605,058 | 3,286 | 3,343,448 |
| August | 2,124 | 1,566,598 | 801 | 1,475,773 | 2,925 | 3,042,371 |
| September | 2,382 | 1,739,469 | 793 | 1,495,386 | 3,175 | 3,234,855 |
Information as to mortgages registered under the Land Transfer and Deeds Registration Acts is contained in the section of this book dealing with “Mortgages.”
THE Crown lands are administered under the authority of the Land Act, 1924, the Land for Settlements Act, 1925, and the Discharged Soldiers Settlement Act, 1915, by the Minister of Lands at Wellington, his executive officer being the Under-Secretary of Lands, who is the permanent head of the Department of Lands and Survey. New Zealand is divided into twelve land districts, each being under the local direction of a Commissioner of Crown Lands and a Land Board. The Commissioner's office is known as the principal land office, and in some of the larger districts there are one or more local land offices. It is with these land offices that the selector has to transact all business, from the first consultation of the maps to the final receipt of the Crown title.
The names of the land districts and of the towns where the principal office of each is situated are as under:—
| Land District. | Principal Land Office situated at |
|---|---|
| North Auckland | Auckland. |
| Auckland | ,, |
| Gisborne | Gisborne. |
| Hawke's Bay | Napier. |
| Taranaki | New Plymouth. |
| Wellington | Wellington. |
| Nelson | Nelson. |
| Marlborough | Blenheim. |
| Westland | Hokitika. |
| Canterbury | Christchurch. |
| Otago | Dunedin. |
| Southland | Invercargill. |
Commissioners of Crown Lands are executive officers of the land districts, having large discretionary powers under the Act. Each is the Chairman of the Land Board of his district, and transacts all its routine business in the sale, letting, and occupation of Crown lands. The Commissioners deal with trespassers and intruders (persons and cattle), removing the former and prosecuting the owners of the latter; they recover all penalties, ascertain the boundaries of Crown lands, enforce all contracts for the disposition of Crown lands, recover rents and other moneys, deal with determinable contracts, prosecute and defend suits, and do whatever is necessary in the course of their duties.
A Land Board consists of five members—viz., the Commissioner of Crown Lands for the district (who is ex officio Chairman), three members nominated by the Governor-General, and one member elected by the Crown tenants of the district.
The Boards transact all business connected with the sale, letting, disposal, and occupation of Crown lands, and all matters connected with the management and control of the public lands in their hands. They are the sole judges of the fulfilment of conditions in leases and licenses, and they can declare them forfeit. All meetings are open to the Press and public, with certain limitations.
A selector may purchase for cash, or may select for occupation with right of purchase or for renewable lease. Every applicant must be of the age of seventeen years or upwards, and must apply for Crown land solely for his own use and benefit, and not directly or indirectly for the use or benefit of any other person. Including the land he applies for, he is not to be the owner, holder, or occupier under any tenure of more than one year's duration, either severally or jointly or in common with any other person or persons, of any land anywhere in New Zealand exceeding in the whole 5,000 acres of land, computed as follows:—
Every acre of first-class land is reckoned as 7 ½ acres;
Every acre of second-class land is reckoned as 2 ½ acres;
Every acre of third-class land is reckoned as 1 acre.
The annual rental payable for occupation-with-right-of-purchase selections is 5 per cent. on the cash price of the land, and for lands selected for renewable lease the annual rental is 4 per cent. on the cash price of the land.
Crown land may be selected and occupied under the following tenures and systems:—
Town, suburban, and village lands—
For cash and deferred payment, by public auction;
By lease for terms up to ten years;
By renewable lease for thirty-three years.
Rural land (unimproved), (under optional system)—
For cash, by application;
Occupation with right of purchase for twenty-five years;
Renewable lease for sixty-six years.
Village settlements—Under the three foregoing tenures of optional system.
Improved-farm settlements (rural land)— Under special conditions, and either (a) on occupation-with-right-of-purchase license or (b) on renewable lease.
Special settlements (rural land)— On renewable lease for sixty-six years and under special regulations.
Land-for-settlement estates (improved rural and pastoral land)—
Under renewable lease for thirty-three years, with limited right to acquire freehold;
For cash or on deferred payments, by auction.
Pastoral land—
By small-grazing-run lease for twenty-one years, with right of renewal (maximum area, 20,000 acres);
By pastoral license on terms up to thirty-five years.
Land within mining districts—
On pastoral licenses under special regulations, with right to acquire the freehold or exchange to a renewable lease;
On occupation leases under special regulations, with similar rights as to purchase of freehold and exchange.
Miscellaneous—
Temporary occupation on terms up to five years;
Sale or occupation for special purposes;
Outlying land.
Full particulars are given in the Crown Lands Guide, issued periodically and obtainable at any land office, as to the conditions of lease and occupation. Improvements to a certain value are required to be effected on rural land purchased for cash or held under occupation-with-right-of-purchase or renewable-lease tenures, and residence is compulsory for certain periods on most Crown leaseholds. Rebate of rent is given in many cases when the half-yearly instalment of rent is paid within thirty days of its becoming due. Applications for mortgage, transfer, and sublease of a Crown leasehold under most of the tenures require the approval of the Land Board of the district.
National endowments may be disposed of under renewable lease, small-grazing-run lease, or pastoral license. These lands are occupied on the same conditions as ordinary Crown lands, with the exception that the freehold cannot be acquired while such lands continue to be included in the endowment. Under section 302 of the Land Act, 1924, the Governor-General is authorized to remove from the endowment certain lands comprised therein, including lands occupied by discharged soldiers under any tenure, and small grazing-runs held under leases issued under the Land Act, 1892, or the Land Act, 1908, up till the 10th December, 1918. Upon the removal of such lands from the endowment the occupiers thereof can acquire the freehold in manner prescribed by the Land Act, 1924.
Lands held under pastoral license and forming part of the national-endowment area which have been held for not less than seven years may likewise, with the consent of the Land Board and Minister, be removed from the national endowment and the freehold acquired at valuation if not suitable for closer subdivision.
Education endowments are available for leasing under the Education Reserves Amendment Act, 1910 (modifying the Education Reserves Act, 1908), which permits of a lease being granted under the Public Bodies' Leases Act, 1908, as well as under the Land Act, 1924. The freehold of the land cannot be acquired.
Public reserves not vested in trustees or a local authority may be leased under the Public Reserves and Domains Amendment Act, 1911, for any term not exceeding twenty-one years, with right of renewal for a further term. The freehold of the land cannot be acquired.
During the year ended 31st March, 1926, an area of 272,393 acres of land was offered for selection under the various tenures provided by the Land Act, Land for Settlements Act, and Education Reserves Act.
Under renewable lease an area of 62,327 acres was offered, 22,046 acres being national endowment, 27,279 acres land for settlements, and 13,002 acres ordinary Crown lands; while an area of 29,648 acres of ordinary Crown land was offered under the optional system; The pastoral-run area comprised 149,921 acres.
In addition to the above a total area of 7,477 acres of Crown, settlement, and national-endowment lands was set apart for selection by discharged soldiers, under the ordinary tenures of the Land Act and the Land for Settlements Act, and the special tenures of the Discharged Soldiers Settlement Act. Fuller particulars regarding these lands will be found at the end of this subsection.
The total selections during the year covered an area of 347,716 acres, by 1,390 selectors. These figures include, however, 217 purchases of small town, suburban, and rural lands, aggregating 5,539 acres, offered for sale at auction. The ordinary Crown lands holdings represented 249,813 acres; land for settlements and Cheviot Estate, 55,239 acres; national endowment, 18,531 acres; educational endowments, 20,468 acres; and other endowments, 3,665 acres. Selections by discharged soldiers are included in the foregoing totals.
Areas under this heading include all lands sold for cash or selected on the deferred-payment system, small grazing-runs, and leases under the following tenures: Renewable lease, occupation with right of purchase, mining districts land occupation leases, educational-endowment leases, and pastoral licenses in mining districts under special regulations. A five-years summary of selections is as follows:—
| Year ended 31st March. | Sold for Cash. | Deferred-payment Licenses. | Leases and Licenses (Ordinary Settlement). | Small Grazing-runs. | Totals. |
|---|---|---|---|---|---|
| Number. | Number. | Number. | Number. | Number. | |
| 1922 | 218 | 213 | 779 | 9 | 1,219 |
| 1923 | 233 | 121 | 596 | 4 | 954 |
| 1924 | 163 | 247 | 503 | 3 | 916 |
| 1925 | 154 | 115 | 459 | 1 | 729 |
| 1926 | 217 | 188 | 486 | 8 | 899 |
The acreage represented by the selections included in the foregoing table is as follows:—
| Year ended 31st March. | Sold for Cash. | Deferred-payment Licenses. | Leases and licenses (Ordinary Settlement). | Small Grazing-runs. | Totals. |
|---|---|---|---|---|---|
| Acres. | Acres. | Acres. | Acres. | Acres. | |
| 1922 | 11,410 | 1,443 | 165,442 | 21,161 | 199,456 |
| 1923 | 8,140 | 1,741 | 85,707 | 4,347 | 99,935 |
| 1924 | 2,371 | 53,846 | 97,664 | 1,245 | 155,126 |
| 1925 | 3,656 | 3,891 | 125,259 | 905 | 133,711 |
| 1926 | 5,539 | 887 | 113,184 | 10,704 | 130,314 |
The following table shows in a condensed form the area of land held from the Crown at 31st March, 1926, the yearly rental payable, and the area made freehold to that date:—
| Tenure. | Total Number of Selectors. | Total Area held. | Total Yearly Rental or Instalment payable. | Total Area made Freehold. | |
|---|---|---|---|---|---|
| Number of Purchasers. | Area. | ||||
* Excluding “cash lands.” | |||||
| Acres. | £ | Acres. | |||
| Cash lands | .. | .. | .. | .. | 13,250,339 |
| Deferred payment | 2,460 | 331,377 | 62,848 | 10,560 | 1,256,143 |
| Perpetual lease | 179 | 10,013 | 1,184 | 3,064 | 851,987 |
| Occupation with right of purchase | 4,125 | 1,240,150 | 106,221 | 4,706 | 1,222,740 |
| Lease in perpetuity | 7,684 | 1,657,563 | 197,312 | 3,073 | 523,285 |
| Renewable lease | 7,598 | 2,083,916 | 446,029 | 229 | 39,425 |
| Agricultural lease | 9 | 282 | 18 | 1,408 | 140,896 |
| Mining districts land occupation leases | 709 | 19,490 | 1,755 | 121 | 3,911 |
| Homestead | .. | .. | .. | 61 | 80,453 |
| Pastoral licenses in mining districts under special regulations | 700 | 156,541 | 3,936 | 75 | 16,384 |
| Small grazing-runs | 857 | 2,736,596 | 102,757 | 50 | 59,912 |
| Pastoral runs | 643 | 9,650,132 | 92,633 | 4 | 6,155 |
| Miscellaneous leases and licenses | 6,664 | 1,167,691 | 48,297 | 111 | 11,490 |
| Totals | 31,628 | 19,053,751 | 1,062,990 | 23,462* | 17,463,120 |
| Thermal-springs leases (Rotorua) | 318 | 2,044 | 1,959 | 14 | 162 |
| Education endowments— | |||||
| Primary | 3,491 | 783,651 | 115,204 | 4 | 87 |
| Secondary | 509 | 40,207 | 8,842 | .. | .. |
| Totals | 4,318 | 825,902 | 126,005 | 18 | 249 |
| Grand totals | 35,946 | 19,879,653 | 1,188,995 | 23,480* | 17,463,369 |
| Other endowment lands | 761 | 356,418 | 15,649 | 4 | 5,019 |
National-endowment lands are included in the above table in the figures for the various tenures under which they are held. National-endowment lands of an aggregate area of 6,739,957 acres were held at 31st March, 1926, by 4,474 selectors, the annual rental payable being £137,185. Settlement lands under the Land for Settlements Act, which are dealt with later on in this subsection, are also included.
The next table shows the area of Crown land made freehold during the year ended 31st March, 1926, together with the amount of purchase-money. The information is given for the various tenures under which the land was held immediately prior to the freehold being acquired by the occupier.
| CROWN LAND MADE FREEHOLD, YEAR ENDED 31ST MARCH, 1926. | ||
|---|---|---|
| Tenure. | Area. | Amount realized. |
| Acres. | £ | |
| Cash lands sold | 5,781 | 52,072 |
| Freehold acquired under following tenures— | ||
| Deferred payment (Acts of 1912 and 1913) | 9,402 | 48,883 |
| Perpetual lease | 408 | 377 |
| Occupation with right of purchase | 36,846 | 30,996 |
| Lease in perpetuity | 3,541 | 12,169 |
| Renewable lease | 934 | 2,995 |
| Mining districts land occupation lease | 262 | 472 |
| Pastoral licenses in mining districts | 367 | 262 |
| Small grazing-runs | 3,449 | 6,559 |
| Miscellaneous | 661 | 3,533 |
| Pastoral runs | 1,816 | 900 |
| Totals | 63,467 | 159,218 |
Much of the land legislation of recent years has been in the direction of preventing large areas of good land from being acquired or retained by a single individual. Part VI of the Land for Settlements Act, 1925, makes provision for an agreement being made between the Minister of Lands and the owner in fee-simple of any land for the subdivision of that land, and for the disposal by public tender of the allotments by way of sale or by way of lease with right of purchase.
Section 97 provides for similar agreements between the Minister and the owners of Native freehold land in respect of the disposition by sale or lease of that land.
In Part VII of the Land for Settlements Act, 1925, provision is made whereby the Minister of Lands may at any time in writing notify an owner of land that such land or a portion thereof is required for purposes of settlement. The owner of the land is required, within six months after such notice has been gazetted, to notify the Minister whether he elects (a) to himself subdivide and offer the land for sale in subdivisions, or (b) to enter into an agreement with the Minister as above, or (c) that the land shall be taken compulsorily under the Act.
In sections 381 and 382 of the Land Act. 1924, provision exists for compulsorily taking private land (not within a borough or town district) in cases where in the opinion of the Board of Land Purchase Commissioners such land has been acquired by way of aggregation, and where such aggregation is contrary to the public interest. Compensation is payable for all land so taken.
The purchase of private lands by the Crown for closer settlement purposes is authorized by the Land for Settlements Act, 1925, In each land district is a local Land Purchase Board, of which the Commissioner of Crown Lands is the Chairman, and its recommendations are dealt with by the Dominion Land Purchase Board (Wellington), consisting of the Land Purchase Controller (Chairman), the Under-Secretary of Lands, the Surveyor-General, and a nominated member
The number of estates offered during the year ended 31st March, 1926, was 49, of an area of 123,310 acres. In addition several were submitted, direct to the Commissioners of Crown Lands of the several districts and considered by the local Boards. The figures given herein do not include any purchases under section 2 of the Discharged Soldiers Settlement Amendment Act, 1917. The area purchased during the year was 2,695 acres, of a value of £33,401.
The total number of estates purchased since the inception of the land-for-settlements scheme is 635, of a total area of 1,984,718 acres, the aggregate amount of purchase-money being £13,012,896. The figures for each land district are—
| SUMMARY OF ESTATES ACQUIRED UP TO THE 31ST MARCH, 1926. | |||
|---|---|---|---|
| Land District. | Number. | Area. | Purchase-money. |
* Including North Auckland. † Including Gisborne. | |||
| Acres. | £ | ||
| Auckland* | 97 | 387,871 | 1,507,329 |
| Hawke's Bay† | 61 | 301,498 | 2,292,083 |
| Taranaki | 25 | 27,628 | 369,818 |
| Wellington | 144 | 158,511 | 2,248,013 |
| Marlborough | 22 | 224,090 | 755,482 |
| Nelson | 14 | 48,821 | 150,473 |
| Westland | 2 | 5,125 | 8,343 |
| Canterbury | 172 | 447,349 | 3,444,252 |
| Otago | 73 | 293,188 | 1,779,317 |
| Southland | 25 | 90,637 | 457,786 |
| Totals | 635 | 1,984,718 | 13,012,896 |
The transfer of certain areas from Crown to settlement lands, and the adjustment of areas to account for ascertained surpluses or deficiencies, bring the total area to 2,178,108 acres at the 31st March, 1926. Of this, 209,718 acres have been sold for cash or made freehold, the total purchase-money being £867,960, and 95,314 acres are occupied by roads or by reserves unlet. At the 31st March, 1926, 7,122 selectors were holding a total of 1,809,799 acres, the annual rental for which amounts to £558,407; and the remaining 63,277 acres were unlet. The figures for each land district are as follow:—
| POSITION OF LAND FOR SETTLEMENTS AT THE 31ST MARCH, 1926. | ||||||
|---|---|---|---|---|---|---|
| Land District. | Area acquired. | Area occupied by Roads and Reserves unlet. | Area of Land unlet, including Land forfeited, surrendered, or resumed and not relet, and also Land not yet offered for Selection. | Total Area purchased for Cash or made Freehold to Date. | ||
| Number of Purchasers. | Area. | Price realized. | ||||
| Acres. | Acres. | Acres. | Acres. | £ | ||
| North Auckland | 40,996 | 880 | 6,735 | 195 | 1,794 | 26,303 |
| Auckland | 354,211 | 78,103 | 28,711 | 676 | 123,925 | 282,178 |
| Gisborne | 76,248 | 390 | 269 | 43 | 6,185 | 50,471 |
| Hawke's Bay | 227,376 | 2,489 | 229 | 104 | 19,342 | 120,433 |
| Taranaki | 28,233 | 256 | 3,660 | 43 | 1,461 | 34,479 |
| Wellington | 142,852 | 1,104 | 3,132 | 180 | 9,707 | 96,457 |
| Nelson | 68,190 | 929 | 8,267 | 6 | 1,635 | 2,953 |
| Marlborough | 235,867 | 2,643 | 682 | 39 | 8,858 | 34,394 |
| Westland | 5,125 | 81 | 2 | 192 | 116 | |
| Canterbury | 605,709 | 4,230 | 3,602 | 270 | 17,087 | 132,504 |
| Otago | 296,101 | 3,160 | 7,041 | 57 | 6,399 | 32,126 |
| Southland | 97,200 | 1,049 | 942 | 95 | 13,133 | 55,546 |
| Totals | 2,178,108 | 95,314 | 63,270 | 1,710 | 209,718 | 867,960 |
| POSITION OF LAND FOR SETTLEMENTS AT THE 31ST MARCH, 1926 | |||||
|---|---|---|---|---|---|
| District. | Total Lands leased at 31st March, 1926. | Rent and other Payments received during 1925–26. | Total Receipts from Inception to 31st March, 1926. | ||
| Number of Selectors. | Area | Annual Rental. | |||
| Acres. | £ | £ | £ | ||
| North Auckland | 279 | 31,587 | 13,392 | 8,034 | 133,345 |
| Auckland | 900 | 123,472 | 33,109 | 33,285 | 801,418 |
| Gisborne | 244 | 69,402 | 24,923 | 24,257 | 171,781 |
| Hawke's Bay | 612 | 205,313 | 77,918 | 82,736 | 530,802 |
| Taranaki | 142 | 22,855 | 14,118 | 13,847 | 166,326 |
| Wellington | 987 | 128,908 | 94,204 | 94,659 | 834,891 |
| Nelson | 67 | 57,360 | 5,001 | 4,413 | 50,617 |
| Marlborough | 502 | 223,684 | 36,762 | 36,384 | 641,003 |
| Westland | 31 | 4,851 | 537 | 641 | 13,341 |
| Canterbury | 1,883 | 680,789 | 161,806 | 158,158 | 2,806,111 |
| Otago | 1,121 | 279,501 | 78,377 | 73,948 | 1,288,285 |
| Southland | 354 | 82,077 | 18,260 | 20,564 | 377,628 |
| Totals | 7,122 | 1,809,799 | 558,407 | 550,926 | 7,815,548 |
On the 1st January, 1910, the Land Settlement Finance Act, which is described fully in the 1915 issue of this book, came into force. The associations incorporated now number forty-six. There were no transactions during the year 1925–26.
Under the provisions of the Discharged Soldiers Settlement Act, 1915, and amendments, any person is entitled to the benefits of the Act who, as a member of a New Zealand Naval or Expeditionary Force, served beyond New Zealand in connection with the late war, returned to New Zealand, and received an honourable discharge, together with any person who immediately prior to the commencement of the war was a bona fide resident of New Zealand, and also served during the war with some portion of His Majesty's Naval or Military Forces (not being Forces raised in New Zealand) and received an honourable discharge therefrom. In addition, all discharged members of an Expeditionary Force who, having been classed as medically fit for service beyond the seas, served as members of that Force in a camp of military training and remained attached to that camp on the 12th November, 1918 (being the date of the cessation of hostilities with Germany), are entitled to apply for advances or private land under sections 2 or 3 of the Discharged Soldiers Settlement Amendment Act, 1917.
There is power to dispose of land under the ordinary tenures of the Land Act, 1924, and the Land for Settlements Act, 1925—i.e., for cash, or occupation with right of purchase, or on renewable lease under the former Act, and renewable lease under the latter Act; also under the “special tenures” of the Discharged Soldiers Settlement Act, 1915, which are cash, deferred payment, or a renewable lease with a purchasing clause. The various tenures mentioned may be explained as under, and are given under two headings—viz., “Ordinary Tenures” and “Special Tenures.”
Cash.—In all cases of purchase of land for cash the applicant is required to pay one-fifth of the purchase-money at the date of the sale, and the balance, with the Crown-grant fee, within thirty days from the date of the approval of the application.
Occupation with Right of Purchase.—Term, twenty-five years; rental, 5 per cent. on the capital value of the land; right of purchase after the license has been held six years, provided the residence and improvement conditions have been complied with. If the licensee does not acquire the freehold prior to the expiration of the term of twenty-five years he has a prior right to a renewable lease.
Renewable Lease under the Land Act.—Term, sixty-six years, with a perpetual right of renewal; rental, 4 per cent. on the capital value of the land. There is a right to the freehold.
Renewable Lease under the Land for Settlements Act.—Term, thirty-three years, with perpetual right of renewal; rental, 5 per cent. on the capital value of the land. Right of purchase at any time during the currency of the lease. Purchase of the freehold may be made on the deferred-payment system if desired.
Cash.—As shown under “Ordinary Tenure” above.
Deferred Payment under Special Tenures.—Term, such period as the Board may determine, usually nineteen years; licensee to deposit 5 per cent. of the purchase-money, and thereafter pay the balance of 95 per cent. by equal annual payments, together with interest at 5 per cent., payable half-yearly, on all outstanding balances. The licensee has the right to pay off the whole or any part of the outstanding money at any time during the currency of the license.
Renewable Lease with Purchasing Clause under Special Tenures.—Term may be for any period not exceeding thirty-three years in the case of settlement land, and sixty-six years in the case of Crown land, with perpetual rights of renewal for thirty-three years or sixty-six years as the case may be. Freehold may be acquired any time during the currency of the lease. Purchase of the freehold may be made on the deferred-payment system if desired.
The following table shows the total area proclaimed under the Discharged Soldiers Settlement Act, 1915. Of the total area proclaimed, ordinary Crown lands amounted to 593,225 acres, Cheviot Estate to 3,356 acres, land for settlements to 392,238 acres, and national-endowment land to 430,998 acres.
| District. | Under Section 3 of the Act. (Ordinary Tenures.) | Under Section 4 of the Act. (Special Tenures.) | Total Area proclaimed. | |||
|---|---|---|---|---|---|---|
| For the Year ended 31st March, 1926. | Total to 31st March, 1926. | For the Year ended 31st March, 1926. | Total to 31st March, 1926. | For the Year ended 31st March, 1926. | Total to 31st March, 1926. | |
| Acres. | Acres. | Acres. | Acres. | Acres. | Acres. | |
| North Auckland | .. | 23,595 | 55 | 42,798 | 55 | 66,393 |
| Auckland | 166 | 62,439 | 1,248 | 150,648 | 1,414 | 213,087 |
| Gisborne | 43 | 43 | 3,514 | 12,247 | 3,557 | 12,290 |
| Hawke's Bay | .. | 27,263 | .. | 172,411 | .. | 199,674 |
| Taranaki | .. | 15,657 | .. | 38,787 | .. | 54,444 |
| Wellington | .. | 2,490 | 1,661 | 109,744 | 1,661 | 112,234 |
| Nelson | .. | 35,380 | .. | 34,660 | .. | 70,040 |
| Marlborough | .. | .. | .. | 20,674 | .. | 20,674 |
| Westland | .. | 27,752 | .. | 480 | .. | 28,232 |
| Canterbury | .. | 254,401 | .. | 46,480 | .. | 300,881 |
| Otago | .. | 239,780 | 790 | 77,087 | 790 | 316,867 |
| Southland | .. | 10,824 | .. | 14,177 | .. | 25,001 |
| Totals | 209 | 699,624 | 7,268 | 720,193 | 7,477 | 1,419,817 |
During the year ended 31st March, 1926, 109 applications were made under the provisions of the Discharged Soldiers Settlement Act, and allotments were made in the case of 86 applicants, the total area being 20,500 acres.
The various systems of financial assistance in connection with the settlement of discharged soldiers were dealt with in the 1924 and previous issues of the Year-book. Operations at the present time are confined to advances on current account for stocking and developing farms.
From the inception of the scheme of discharged-soldiers settlement in 1915 to the end of the financial year 1925–26, £22,490,303 had been advanced to 22,483 discharged soldiers as follows:—
| Class. | Number of Soldiers. | Amount. £ |
|---|---|---|
| Advances on current account (including £1,495,600 for the erection of buildings on farms) | 5,017 | 4,863,584 |
| Advances towards purchase of farms, market gardens, and orchards, and discharge of mortgages | 5,511 | 8,966,773 |
| Advances towards purchase and erection of dwellings and discharge of mortgages thereon in town and suburban areas | 11,955 | 8,659,946 |
| Totals | 22,483 | £22,490,303 |
Repayments of principal to the 31st March, 1926, total £4,830,396, of which £940,596 was repaid during the financial year 1925–26. Receipts in respect of interest and sundries brought the total receipts for the year to £1,629,763.
During 1925–26, loans totalling £282,000 were granted. Of this amount £54,000 was for the erection of dwellings, and £228,000 towards the improvement and stocking of lands. Advances actually made during the year, including loans previously authorized and readvances from current account, totalled £685,600.
By the Discharged Soldiers Settlement Amendment Act, 1923, a Dominion Revaluation Board was constituted with power to revalue and reduce where necessary the capital values of lands leased by soldiers from the Crown, and also to reduce mortgages in cases where soldiers had acquired lands by means of Government advances. To assist this Board twenty-four district revaluation committees were set up, whose reports were submitted for consideration and action. The work of revaluation has been practically completed. Of 5,347 applications received for revaluation the Dominion Board has issued determinations in 5,284 cases, while the remaining 63 applications have lapsed owing to forfeiture or abandonment. Reductions have been made in capital and mortgage values to the total of £2,480,808, and negotiations with private mortgagees and unsecured creditors have resulted in mortgages and debts of various descriptions totalling £142,378 being reduced by over 75 per cent. In addition, private mortgages totalling £50,700 have been purchased by the Crown at a discount of approximately £24,000.
The Board is now engaged in investigating current accounts under the Discharged Soldiers Settlement Amendment Act, 1924. Some 5,415 cases are involved, about three-fifths of which had been dealt with at the 31st March, 1926.
NATIVE land is of two kinds—namely, customary land and Native freehold land. Customary land is land which has never been the subject of a Crown grant and is held by Natives under the customs and usages of the Maori people. It is land in respect of which the ancient customary Native title as recognized and guaranteed by the Treaty of Waitangi has not yet been extinguished. Such land, since it has not been Crown-granted, remains vested in the Crown, subject, however, to the customary title of the Natives, and to their right to have the customary title transformed into a freehold title by the Native Land Court.
Customary land has always been restricted from alienation except in favour of the Crown. By the Treaty of Waitangi the exclusive right to purchase such land was reserved to the Crown, and in all statutes since passed the alienation of customary land to private individuals has been prohibited, and this prohibition is now extended to the Crown. Native freehold land is the land held by Natives under an English freehold title, though subject to certain restrictions on alienation and other special incidents which are unknown to the ordinary law.
Whether land is Native or European land depends upon the beneficial ownership of it, and not merely on the legal ownership. If land is held by a European upon trust for a Native, it is Native land; if it is held in trust by a Native for a European, it is European land. There are, however, four exceptions to this:—
When once land has become European land, it never again becomes Native land unless by special enactment.
Land purchased by a Native from the Crown for a pecuniary consideration is not Native land.
Land held by a Native in severalty may be declared to be European land by the Native Appellate Court.
Under certain circumstances the Native owner may be declared a European.
Even though one of many Native owners may sell, the land remains Native land until all have disposed of their interest, or until the purchaser has had his interests partitioned off. A “Native” means a Maori or half-caste, or a person intermediate in blood between a Maori and a half-caste.
The Native Land Court consists of a Chief Judge and such other Judges as the Governor-General thinks fit to appoint. All powers of the Court may be exercised by a single Judge, but there are certain important powers vested exclusively in the Chief Judge. Commissioners are appointed who exercise such jurisdiction of a Judge as the Governor-General authorizes. The chief matters within the jurisdiction of the Court are:—
The investigation of title to customary land, and transforming it into Native freehold land.
The exclusive power of partitioning land among the owners.
The sanctioning of exchanges for other Native land and European land.
Granting probates of wills and succession orders to Natives.
Making orders for the adoption of children.
Appointing trustees for Natives who are minors or under other disability.
The incorporation of the owners of Native land.
The determination of various claims as between Natives.
Particulars of the business dealt with by the Native Land Court during the twelve months ended 31st March, 1926, are as follow:—
| Number of sittings | 121 |
|---|---|
| Number of cases notified | 16,103 |
| Number of cases for which orders were made | 5,782 |
| Number of cases dismissed | 1,712 |
| Number of cases adjourned sine die | 3,587 |
| Number of partitions made | 853 |
| Area affected (acres) | 123,398 |
| Number of investigations of title | 8 |
| Area affected (acres) | 372 |
| Number of succession orders made | 5,081 |
| Number of other orders made | 1,529 |
The Native Appellate Court consists of any two or more Judges of the Native Land Court. With certain exceptions the Appellate Court has jurisdiction to hear and determine appeals, whether on law or fact, from all final orders of the Native Land Court.
There are seven Maori Land Boards, each consisting of the Judge and Registrar of the Native Land Court district, the Judge acting as President. The chief functions of a Maori Land Board are—
To grant confirmation of alienation of Native land.
To administer certain large areas of Native land vested in those Boards in trust for the Native owners, the Boards having extensive powers of sale, lease, and management.
To act as statutory agent of the Native owners in respect of certain areas of Native land set apart for Native settlement.
To control the administration and disposition of Native land, by resolution of the assembled owners.
The total area vested in and administered by the various Maori Land Boards as at the 31st March, 1926, was 677,091 acres.
During the year 1925–26 2,735 acres of vested land were disposed of by lease, while 7,341 acres were revested in the Native owners.
With regard to Native freehold land, the Boards during the year approved of 307 leases, comprising 27,729 acres, and confirmed 511 transfers (apart from sales to the Crown) affecting 25,530 acres of freehold land.
The ordinary provisions as to alienation of Native land do not affect the power to dispose of land by will, but a Native cannot will to a European except it be a husband or wife or other relative of the person making the will. A Native cannot dispose of customary land, whether by will or otherwise. No alienation of Native land by a Native has any effect until it is confirmed by a Maori Land Board, and the instrument of alienation must be attested by a solicitor, a Justice of the Peace, a Magistrate, a Judge, a Registrar, a Commissioner of the Native Land Court, or a Postmaster. If the Native has not a sufficient knowledge of the English language it must also be attested by a licensed interpreter, who must certify that the Native understood the effect of the instrument. It must also have a translation and a plan of the land affected endorsed.
The Board, before confirming an alienation, must satisfy itself—
That the instrument has been duly executed:
That the alienation is not contrary to good faith or the interests of the Native alienating:
That no Native is rendered landless by the alienation:
That the consideration is adequate:
That the purchase-money is paid or secured:
That the rules as to limitation of area have not been infringed:
That the alienation is not a breach of trust and is not otherwise prohibited by law.
A lease cannot be for a longer term than fifty years, and a mortgage must have the approval of the Governor-General in Council.
For the purpose of effecting the purchase of Native land by the Crown there is constituted a Native Land Purchase Board, consisting of the Native Minister, the Under-Secretary for Crown Lands, the Under-Secretary of the Native Department, and the Valuer-General. The duty of the Board is to undertake, control, and carry out negotiations for purchase and the performance and completion of contracts entered into. Pending any purchase by the Crown the Governor-General may, by Order in Council, prohibit any attempt at alienation otherwise than to the Crown. Any such attempted alienation is absolutely void, and constitutes an offence punishable by fine or imprisonment. Upon the purchase being completed the land is proclaimed Crown land, and is subject to administration under the Land Act, 1924. Where it is subject to lease when purchased the option may be extended to the tenant of purchasing the land from the Crown or having at the expiration of his lease a renewable lease granted to him.
Since the Board was constituted, on the 1st April, 1910, 1,392,027 acres of Native land has been purchased by the Crown, the aggregate purchase-money paid being £3,330,342. The total area of Native land alienated by way of sale to the Crown or other purchasers since 1910 is 2,947,585 acres.
The area of Native land still held by Natives in the North Island is estimated at 4,197,246 acres, and in the whole Dominion at 4,468,231 acres. In many cases the Natives are utilizing their land for pastoral and dairying purposes. Other lands are being farmed for them by Maori Land Boards and by the East Coast Commissioner. Various returns disclose that there are under Maori ownership upwards of 500,000 sheep, 50,000 cattle, 13,000 horses, and 10,000 pigs.
In order better to provide for the administration of Native funds and Native reserves formerly conducted by the Public Trustee, legislation was passed transferring the administration of these from the Public Trustee to the Native Trustee as from the 1st April, 1921. The Native Trustee Act, 1920, which, together with its amendments of 1921–22, 1922, and 1924, embodies the legislation relating to the creation and functions of the Native Trust Office, provides for the appointment of a Native Trustee and of a Native Trust Office Board, consisting of the Minister of Native Affairs, one other member of the Executive Council being either a Native or a half-caste, the Native Trustee, the Under-Secretaries of Native Affairs and of Lands, and one other person appointed by the Governor-General. The Office is subject to the control of the Minister of Native Affairs.
The Native Trustee administers many reserves of Native land on behalf of the beneficiaries and grants leases thereof. The beneficial owners of these reserves have no power of alienation.
The Native Trustee also, where necessary, acts as trustee for Natives who are minors or under other disability, and is sometimes called upon to administer the estates of deceased Natives.
The funds of the Native Trust Office at the 31st March, 1926, amounted to £855,747, made up as follows:—
| Amounts held under— | £ |
|---|---|
| West Coast Settlement Reserves Act, 1892 | 61,440 |
| Native Reserves Act, 1882 | 49,032 |
| Native Land Act, 1909 (Part X) | 131,040 |
| Native Land Act, 1909 (Miscellaneous) | 39,035 |
| Native Trustee Act, 1920, and amendments | 30,462 |
| Miscellaneous funds (including Maori Land Board accounts) | 485,407 |
| Sundry creditors | 57 |
| Reserve and Assurance Fund | 53,321 |
| Investment Fluctuation Fund | 5,953 |
| Total | £855,747 |
Of the total funds £551,788 was invested in the form of mortgages, £65,000 in Government securities, and £195,290 in local bodies' securities.
The interest on investments for the year 1925–26 totalled £13,185, and commissions, fees, and charges brought in a further £4,265. The net profit for the year was £6,854, of which £6,169 was placed to the Reserve and Assurance Fund and £685 to the Investment Fluctuation Fund.
THE surveys of Crown lands, Native lands, and land purchased under the Land for Settlement Act, 1925, or the Discharged Soldiers Settlement Act, 1915, are executed under the authority of the Minister of Lands, and are carried out by staff and contract surveyors licensed by the Surveyors' Board constituted under the Surveyors' Institute and Board of Examiners Act, 1908.
In respect of surveys for the purpose of the Land Transfer Act, an additional and special license under the hand of the Surveyor-General is required, in terms of section 177 of the Land Transfer Act, 1915.
Any surveyor or other person, in pursuance of the written authority of the Surveyor-General or of the Chief Surveyor of the district, may enter upon Native land for survey purposes, and any person who obstructs any surveyor or other person so authorized is guilty of an offence punishable on summary conviction by fine or imprisonment (vide section 403 of the Native Land Act, 1909).
Authority for a surveyor and his assistant to enter on any land for the purpose of making a survey under the Public Works Act, 1908, must be obtained from either the Minister of Public Works, the Minister of Lands, the Surveyor-General or his Deputy, or the local body, as the case may be (vide Public Works Act, 1905, section 97).
Regulations for conducting the survey of the Dominion lands are made by the Surveyors' Board in terms of the Surveyors' Institute and Board of Examiners Act, 1908, as amended by the Surveyors' Institute and Board of Examiners Amendment Act, 1922.
In terms of section 5 of the last-mentioned Act power is conferred on the Surveyor General to make rules for all or any of the following purposes:—
The conduct and control of fundamental or basic surveys to be made for standard, topographical, geodesical, or other scientific purposes.
The conduct and control of the technical operations carried out by the Department of Lands and Survey.
Prescribing the fees to be paid for the inspection or examination or checking of plans, and also prescribing rates of payment for surveys executed under the direction of the Crown.
The Surveyor-General is the custodian of the legal standards of length for survey purposes. All measurements of land affecting titles are to be expressed in terms of the chain of 100 links, and all areas in acres, roods, perches, and decimals of a perch (Land Act, 1924, section 8 (1)).
Comparison of surveyors' measuring-bands with certified copies of these are made on request free of cost by the Chief Surveyors, or at the Surveyor-General's Office.
The present Surveyor-General is Mr. W. T. Neill.
Until the abolition of the provincial system of government in November, 1876, the surveys of New Zealand were conducted by nine survey departments, each independent of the other, and working on no common system. At that date an amalgamation into one department was accomplished. Several of the provincial services had conducted their surveys on a trigonometrical basis, but, as the others were building one survey on another by traverse on magnetic or other azimuthal bearings, without any reference to true meridian or the independent check of triangulation, a state of considerable confusion and uncertainty had arisen in the survey records.
In these circumstances it was necessary to devise a system that would rapidly bring the surveys under control and record, so that settlers might be placed in secure possession of their land, and the Crown be safe to issue titles on reliable plans and descriptions.
The plan adopted was to divide the country into twenty-eight districts, designated “meridional circuits.” At the initial or main station of each the astronomical meridian was determined from observations of circumpolar stars, and the latitude from observations of stars north and south of zenith. Lines of bearings on the true astronomical meridian of the initial station were extended throughout its circuit to the plains and valleys where surveys were in progress. Within three years these standard bearings had been so extended as to enable all the surveys to be conducted on the true meridian of their respective circuits; for, following immediately on this operation, a base-line was measured, and a minor triangulation of two- and three-mile sides, starting from one of the stations of the standard bearings, was spread over the country wherever most required for the check and connection of the settlement surveys. In this way the Dominion was placed very quickly under a system of correct recordable survey, readily adjustable to the requirements of a population rapidly spreading over areas widely apart. The intervening spaces have since been filled in, and the network of triangles is a continuous chain extending over the Islands from north to south a distance of 1,100 miles. Simultaneously with the minor triangulation of the country a topographical survey was carried on, giving the positions of rivers, plains, mountains, forests; best lines for future roads; altitudes of valleys, passes, and mountains; and generally a correct representation of the features of the country, to a scale of 2 in. to the mile.
Settlement survey, as the name implies, is the marking off of the land purchases already made, or the subdivision by survey of the Crown lands into areas for future selection. The surveyor, aided by the topographical map of the district, makes a careful examination of the country, selecting and grading, if need be, the most suitable main and occupation lines of road which he traverses, proving the accuracy of his work by beginning on one of the stations of the minor triangulation and closing on another. This satisfactorily done, the sectioned areas are designed so as to fairly distribute road - frontages, water-supply, and natural advantages to the several sections. The boundary - lines of sections are marked at each corner by stout pegs, and by lock-spits, with additional pegs and lock-spits on the lines giving the range from the road-frontage. Lithographic plans of these surveys are published showing road-lines, number of sections, areas, streams, and natural features, thereby enabling settlers to find their purchases or make selections without any chance of mistake.
The main object of the survey is to enable the settlement of the lands to proceed on a system of survey and record which, for the settler, will give him possession of a definite piece of land which can never afterwards be overridden by a rival claim, and for the Crown the assurance that its guarantee of title will not involve it in embarrassing claims for compensation through overlapping boundaries.
The settlement surveys comprise Crown and Native lands, land purchased under the Land for Settlements Act, 1925, and the Discharged Soldiers Settlement Act, 1915.
In the measurement of lines the linked chain has been superseded for several years by steel and invar tapes adjusted to the standard band in the custody of the Chief Surveyor at each district office, or at the Head Office in Wellington.
In base and verification lines the ground is cleared of surface irregularities, the steel or invar tape is stretched with an even strain, the terminals are marked by a fine puncture on lead, the inclination of surface and changes of temperature noted and allowed for, and the measurement repeated three times alternately from opposite ends of base.
In traverse-lines there is no preparation of surface, but the angle of slope is taken, also the temperature, and the corresponding correction made. In bush and rugged country the work is greatly expedited by using a 1 1/16 in. tape in 4- or 5-chain lengths. It is very light, is unwound from a reel, and stretches taut across rivers, gullies, or uneven surfaces. The maximum error allowed in averse is 4 links to the mile; but since the introduction of the steel tape the error rarely exceeds 2 links even in the most difficult circumstances.
For convenience of record the country is divided into survey districts of 12 ½ miles or 1,000 chains square, and then again into survey blocks of 3 3/8 miles or 250 chains square. The trigonometrical and topographical sheets of the survey districts are to a scale of 2 in. to the mile, and the survey blocks, which contain the working-plans of the subdivision for sale and settlement, are to a scale of 8 in. to the mile. The sheets are of a uniform size of 30 in. square, and are kept flat in portfolios on shelves or in drawers in fireproof rooms.
The reduction of the trigonometrical stations is made on the meridian and perpendicular of the initial station of the circuit, or the initial station of the survey district, according to circumstances. The traverse-lines of the survey blocks are reduced to one of the trigonometrical stations in the survey block. These reductions were tabulated, and, being all connected and held in one complete network of check, serve ever afterwards as an unmistakable means of rehabilitating the survey should boundaries become obliterated or be challenged by rival landowners.
In a new country it is of the first importance that all surveys should stand the mathematical test of reduction to the meridian and perpendicular of a governing trigonometrical survey, for, unlike the surveys of old countries, where time-honoured landmarks and a settled population conserve boundaries, the surveys of a new country have no such aids, but, instead, have to create boundaries in the unoccupied wilderness, which at best can only be marked by perishable surface marks. Then again, the frequent changes of ownership of land in the Dominion facilitated by the Land Transfer system, and the responsibility of the Government in guaranteeing all titles under it, are cogent reasons why the rigid mathematical system of reduction of traverse to the meridian and perpendicular of the stations of a trigonometrical survey should be adopted and maintained.
The geodetic survey of New Zealand was commenced in 1909 by the measurement of a base-line in the Wairarapa District, and its activities continued until the outbreak of the Great War in 1914, when the work was stopped. Operations were resumed in 1921, and have been continually extended up to the present time.
The ultimate aim of the geodetic survey is to establish, by means of a primary triangulation, a number of fixed points over the country at fairly regular intervals, and with a high degree of accuracy.
As the triangulation progresses, surveys of lesser degrees of accuracy are connected to it, and thus finally geographic results over the Dominion can be moulded into one harmonious whole on a co-ordinated scheme, and on a basis which gives the correct relation of one part to another, with no possibility of overlapping where the different systems join.
Precise levelling is being conducted in connection with the geodetic survey. All elevations are on a mean sea-level da and are based on the principal tidal stations.
The standard beach-marks consist of a galvanized-iron tube set in concrete. In selecting sites for these bench-marks, which are generally about one mile apart, every effort is made to place them so as to be secure from disturbance in the future.
The Imperial standard of length is now uniformly used on all surveys throughout the Dominion. Steel bands are in the custody of the Chief Surveyors in the various land districts, which are true copies of the Imperial standard at a temperature of 62° F. and under a tension of 15 lb. avoirdupois.
For the purpose of standardization of the invar tapes used on the base-line measurements, an apparatus was obtained from the Cambridge Scientific Instrument Company, England, in 1912. The apparatus consists of a standard bar, 10 links long, and comparator, and is the standard with which the tapes used in the measurement of base-lines are compared.
The azimuth and latitude of the initial station of each of the meridional circuits were determined by astronomical observations of stars with a large-pattern theodolite. More accurate determinations of latitude have been made with a zenith telescope by Talcott's method; and the Almucantar method, advocated by Mr. S. C. Chandler, of Harvard College Observatory, has been used with satisfactory results.
The method adopted to determine the absolute longitude of the initial stations in 1871 was that technically termed “moon culminations.” Since then the electric telegraph has been used in longitude work, and the most recent determination of differences of longitude has been accomplished by wireless telegraphy.
With the object of facilitating land-transfer work, standard points have been laid down in the streets of most of the principal towns in the Dominion and on some of the main highways, and there are still other towns and main roads in which these surveys are now in progress, or soon will be.
The Department in making these surveys does not attempt to settle the boundaries of properties. Permanent monuments are laid down, the bearings and distances between them are accurately observed and measured, and their relation to the occupancy is shown on a large-scale plan, which furnishes a sure guide and standard of reference for all surveys under the land-transfer system.
For this precise work much more accurate instruments are used than would suffice for ordinary land surveys. In the more recent surveys precise levelling has been included in the operations, and the height of each monument above the mean sea-level is shown on the plan.
A basic topographical survey of the Dominion is in progress, which aims at collecting information for the purpose of constructing a map showing with practical accuracy all the drainage, culture, and relief features which the scale of representation will permit. It is the foundation or mother map from which can be constructed any variety of maps for the serving of separate purposes, or on which can be indicated, in colours or otherwise, any special class of information.
Work was commenced by mapping for the Defence Department an area of 200 square miles in 1899 surrounding the City of Dunedin, and since then several areas have been surveyed in Auckland, Wellington, and Nelson Districts. These surveys are now in progress in the thermal-springs region, Rotorua, the Motueka Valleys Nelson District, and Taranaki, and soon will be commenced in other land districts.
A Geographic Board has been appointed provisionally to deal with the following subjects:—
To adopt rules for the orthography of geographic names.
To examine cases of doubtful spelling of geographic names and decide on the spelling of such names for use on the official maps of the Department.
To investigate and decide on the priority of the discovery of any geographical feature, and recommend the name to be given to such feature.
To collect original Maori place-names for record on the official maps.
To determine any alien names appearing on the official maps that shall be replaced by Native or British names.
To investigate and decide upon any proposed alteration of a geographic name.
The members of the Board are well-known authorities in such matters, and comprise the following: The Venerable Archdeacon Williams (Gisborne), Hon. Sir Frederick Chapman, Messrs. Elsdon Best, M. Crompton-Smith, J. C. Andersen, and W. T. Neill (Surveyor-General). Mr. E. Ward is Secretary to the Board.
The tidal work carried out by the Department at the commencement of the survey operations in the Dominion consisted of determinations of mean high-water mark (H.W.M.) for the purpose of defining the boundary of land abutting an tidal waters.
Later the adoption of mean sea-level as the datum of reference for the heights shown on the maps of the trigonometrical and precise levelling surveys led to a more accurate system of tidal observations being initiated; but it was not until 1909 that a complete tidal survey was inaugurated, at the request of the Admiralty, to include the predictions of the times and heights of high and low water of the ports of Auckland and Wellington in the Admiralty Tide-tables.
The tidal observations are made mainly by the self-registering tide-gauges, in which a curve is traced which shows the height of the water at any time above an arbitrary datum. This curve is decomposed, by a process devised by Lord Kelvin, and known as “harmonic analysis,” into its harmonic elements. These components are now computed for the ports of Auckland, Wellington, Lyttelton, Dunedin, Bluff, and Westport, from which the predicted times and heights of high and low water are obtained by means of the tide-predictor at the Tidal Institute, University of Liverpool, and published in advance in the “New Zealand Nautical Almanac,” the Admiralty Tide-tables, and several of the maritime publications of foreign nations.
The six ports for which tide-tables are prepared serve as standards of reference on which to base, by means of tidal difference, the times and heights of high and low water of all the other ports in the Dominion.
A magnetic survey of the Dominion was commenced in February, 1899, with instruments of the Kew pattern kindly lent to the Department by the Royal Society, London.
Observations of the magnetic declination, inclination, and horizontal intensity were taken over the period from 1899 to 1909. During this period observations were obtained at 334 stations, distributed as uniformly as possible throughout the islands of New Zealand.
The usual field methods of observation and reduction were adopted, and the results reduced to epoch 30th June, 1903, chiefly by the aid of data and magneto-grams obtained at the base station, Christchurch Observatory, from 1902 onwards.
The results were published in “The Magnetic Survey of New Zealand,” by the Department of Lands and Survey, in 1916, and are in constant practical use by the mariner, surveyor, and aviator.
A reobservation at a few selected repeat stations has twice been performed since 1909 by observers of the Carnegie Institution of Washington, and the stations on the Chatham Island were reobserved by officers of the Department in 1924.
The Christchurch Magnetic Observatory was established in the Botanic Gardens in 1901 to serve as a base station for the magnetic survey of the Dominion, then in progress, and as a base for the magnetic work of various expeditions.
The work of recording magnetic declination, horizontal force, and vertical force by the Adie magnetographs was commenced in January, 1902, and since then the records have been continuous, though since 1905 the vertical component of the field has been artifically disturbed. A subsidiary station was therefore established at Amberley, twenty-five miles north of Christchurch, beyond the range of artificial disturbance. A complete set of Eschenhagen magnetographs is in operation there in an above-ground insulated structure.
The activities of the Observatory include meteorological, seismological, and atmospheric electric observations, the results of which are published annually in the “Records of the Survey of New Zealand.”
The facilities at the Christchurch Observatory for comparison and standardization of magnetic instruments have been availed of by the following expeditions:—
The British National Antarctic Expedition of 1901–04 (Captain R. P. Scott s.v. “Discovery”).
The “Nimrod” in 1907 (Sir Ernest Shackleton).
The “Galilee” in 1907 (Carnegie Institution of Washington).
The “Terra Nova” in 1910 (Captain Scott's second Antarctic Expedition).
The “Carnegie” in 1915 (Carnegie Institution of Washington).
The “Carnegie” in 1916 (Carnegie Institution of Washington).
The “Carnegie” in 1920 (Carnegie Institution of Washington).
The annual reports of parties and officers conducting basic surveys and scientific operations are collected into a publication under the title of “The Records of the Survey of New Zealand.” This makes them readily available for reference to the public and scientific societies interested.
Maps on various scales are published by the Lands and Survey Department when drawn, and the present state of the publication is indicated below. Catalogues and price-lists may be had on application to the Surveyor-General, and the maps may be purchased from him or through any bookseller. Local maps may also be obtained from the Chief Surveyors of the land districts.
Two series of maps are published on this scale, one of the separate survey districts, which are areas 1,000 chains square, and the other comprising the county. The details shown are practically the same in each series, being chiefly of a cadastral nature, showing sections, areas, roads, streams, and trig. stations with heights. Of the survey district maps those within the Land Districts of Taranaki, Wellington, Marlborough, Nelson, Otago, and Southland are practically complete; North Auckland, Westland, and Canterbury are partly so; and Auckland, Gisborne, and Hawke's Bay are not yet commenced. In all, 570 out of the total 1,005 are drawn and published. County maps covering the whole of the North Island and the greater part of the South Island are also published, so that maps of any area may be obtained on a scale of 1 mile to 1 inch except that portion within the Fiord County, of which detailed surveys have not yet been made.
A series on this scale has only recently been commenced. The intention is to publish sheets comprising 1° in longitude by ½° in latitude, covering the whole of the Dominion in about 100 sheets. The detail shown will be similar to the 1-mile maps mentioned above, and these maps will eventually supersede the county maps. Up to the present seven only have been published.
Maps on this scale may be had covering the whole of the Dominion, but they are not similar in character. For instance, the five sheets comprising the northern half of the North Island show sectional detail, whilst the others omit these and give more prominence to topographical features. The styles of draughting are, moreover, varied, which does not permit of these being assembled into a homogeneous whole. A new series now being drawn, consisting of thirty-six sheets 2° in longitude by 1° in latitude, will overcome this difficulty. Ten of these are now published or in the press.
On this scale is published a series map in twelve sheets, each sheet comprising an area 4° in longitude and 2° in latitude. This is a general atlas map giving special prominence to roads and towns.
Wall-maps on 10 and 16 miles to 1 inch and 1: 1,000,000 are published—each Island separately; and on 24 miles, both Islands in their relative position. A 32-miles-to-1-inch map of each Island is also published, besides smaller scale outline maps suitable for a base for book-illustrating.
Up to the present very little has been done, but topographical surveys are in hand, and maps will be published as the surveys are completed. Dunedin and vicinity map, on a scale of 40 chains to 1 inch, and Auckland and Wellington sheets, on 1: 125,000 (approximately 2 miles to 1 inch), have been published; while Rotorua Taranaki, and Nelson sheets are being prepared.
Maps of the six cities and of about a hundred of the boroughs, town districts, and towns have been published on scales of from 5 to 10 chains to 1 inch.
Table of Contents
THE Dominion of New Zealand is a country specially favoured for primary production. The soil covering is varied in character, a considerable portion of it being of exceptional fertility; but even the poorer soils are largely capable of profitable utilization by reason of the comparatively mild and equable weather conditions. The best grasses and fodder plants flourish in the congenial environment, and the country has gained a world-wide reputation for the quality of its pastures. Numerous streams intersect the country, and present to the farmer a great potential source of cheap power. Electricity is now put to a variety of uses on the farm, but by far the most important is that of providing power for milking-machinery. Nearly half of the electric power used on farms is employed in the Auckland Land District.
A conspicuous feature of New Zealand farming is that the stock do not require to be stalled in the winter, though the pastures are more or less supplemented by fodder crops in the colder months of the year. This fact, combined with the factor of soil-fertility, enables the New Zealand farmer to produce stock at a much smaller cost than the farmer in countries where artificial feeding has to be employed or where droughts periodically occur.
New Zealand is primarily a grazing-country, and, while more of the land is every year being given up to the cultivation of fodder crops, its future will, no doubt, be inseparably associated with stock-raising, principally of dairy cattle and sheep. Though less than a century has elapsed since the colonization of New Zealand, sixteen million acres of land in the Dominion have been sown down in English grasses. A great proportion of the crops grown in the Dominion are for the production of such commodities as meat, wool, and dairy-produce.
Grain crops, principally oats and wheat, are grown on a fairly large scale in the eastern and southern districts of the South Island. Barley is also grown, but to a very much smaller extent. Much of the crop of oats produced is chaffed for stock-feeding purposes within the country. Root crops, principally turnips, are grown on a large scale for winter feed and for stock-fattening purposes, more particularly in the South Island. Owing to the comparative difficulty of growing large areas of turnips free from disease, other stock-foods are coming into prominence. Mangolds are being cultivated to a larger extent, and farmers are beginning to realize the great value of lucerne. Ensilage-making, particularly in the stack form, is increasing in the dairying districts. Quite a feature of milk - producing operations is the growing of green fodder crops to maintain the milk-supply during the drier months of the year. It will be seen that live-stock in New Zealand is for the most part maintained on food produced on the farm itself.
The North Island of the Dominion is remarkable for the congenial environment it furnishes for many phases of primary production. In no part is the winter really severe, and the question of stalling stock during the colder months of the year has not to be considered. It is more a grazing than an agricultural country, and practically all the cereal crops raised are used for feeding farm stock. The dominant industries are dairying and sheep-farming. There is probably no finer sheep-country in the world than the limestone downs of Hawke's Bay. It may be said with every confidence that there is more butterfat produced to the acre on many farms in the Taranaki District than on any equal area in the world when it is considered that all the food provided for the stock is produced on the farm itself. The standard of dairy-farming is steadily improving, not only by reason of special fodder being provided for the drier parts of the summer and the colder months of the year, but on account of the fact that the farmer is coming to realize the value of herd testing and culling.
In various parts of the Island fruitgrowing, principally of apples, pears, and peaches, is being placed on a sound commercial basis. In the northern portion citrus fruits can be successfully produced, and with the adoption of better storage and marketing methods, lemons in particular are being cultivated on a considerable scale. Outdoor grapes are freely grown. Both the North and the South Islands have established an export trade in apples, and to a less extent in pears.
During recent years the Waikato district and the Auckland Provincial District in general have shown themselves to be admirably adapted to the dairy industry, and dairying has made remarkable development. The Auckland District, in fact, has become easily the largest exporter of butter in the Dominion, while it also leads in the production of milk-powder.
With the adoption of improved methods in the treatment of the land, and the demonstration of correct manurial treatment, farming in the Auckland Provincial District has been placed on a much more stable basis. Assisted by a favourable climate, of which a short and mild winter is a feature, stock-raising of all descriptions is being carried on with conspicuous success. The country is eminently adapted for the production of root and fodder crops, and stock can be brought to maturity and fattened for the market at a minimum of cost.
The South Island was the portion of the Dominion where agriculture proper was first established, the settlement of the land being greatly facilitated by the fact that on the eastern, southern, and northern portions large fertile plains, rolling downs, and hills were available, devoid of the forests which in a very large portion of the North Island have had to be cleared before the land could be utilized by the farmer. Agricultural operations in the South have been maintained at a high standard for many years, principally in Otago and Canterbury, many of the pioneers of which districts were British yeomen farmers who brought with them the best methods of the Old Land. So in the breeding of live-stock, many of the original holders of land in the South, and the shepherds and herdsmen they employed, were well trained in stock - management by live-stock breeders of the Mother - country. The South Island may be fairly said to have been the nursery of the live-stock of the Dominion, and the high quality of the stock bred in the country is in a large measure due to the capacity of the men who founded and developed the flocks and herds in the eastern and southern districts. The growing of the finer wools, and the raising of fat lambs for the frozen-meat industry, are features of primary production in the South Island, while the dairy industry is also well represented, especially in Otago and Southland. Draught horses of a very fine stamp are also bred on a considerable scale in some districts.
While the climate in the southern districts of the South Island is not so congenial as that in the northern, there are only a few portions where the winter is at all rigorous. The Nelson Provincial District, in the north-west corner of the Island, is noted for its climate, which is remarkably equable in character. Nelson has a sunshine-record which is equalled in but few parts of the Temperate Zone. The district is specially suitable for fruitgrowing, which is being developed on a rapidly expanding commercial scale. At the other end of the Island, in Central Otago, a peculiar configuration of the country enables fruitgrowing to be prosecuted with great success. The winter is comparatively severe, but the warm summer sun and the absence of wind make it an ideal environment for fruitgrowing.
In some sections, particularly in Canterbury, Otago, and Marlborough, grain-growing is prosecuted on a considerable scale. The Canterbury Plains, extending a hundred and fifty miles north and south and running inland for forty miles from the sea, represent an area of over 3,000,000 acres. This forms the principal grain-growing area. Wheat, oats, and barley are cultivated to a large extent. In Otago and Southland oats are the grain principally produced. In some of the richer lands the yield of wheat has reached very high figures, even up to 80 or 90 bushels-per acre, while over 100 bushels to the acre have been recorded for crops of oats. In root crops up to 70 tons per acre of turnips have been secured, while the yield of mangolds has frequently reached 90 tons.
Under the control of the Minister of Agriculture the Department of Agriculture is a service which is mainly concerned in advancing the interests of primary production. Under a Director-General of Agriculture there are Directors of Divisions of Live-stock, Dairy, Fields, and Horticulture, also a Chemistry Section.
While the service is mainly educative, it also carries out important inspection work. Under the Live-stock Division, all meat exported is inspected by qualified officers. Cattle are inspected for tuberculosis and other bovine troubles; sheep and swine also receive attention; slaughterhouses are licensed and controlled; and all stock exported and imported is examined by the veterinarians of the Department. Special instruction and advice are given in swine husbandry and in wool growing and handling. The Division is provided with a well-equipped laboratory, mainly devoted to veterinary research, &c.
Dairy-produce is inspected and graded prior to shipment, a close supervision being also exercised over the moisture content of butter and cheese, as well as over the weights of such produce; dairy-farm premises are inspected; herd-testing is promoted, and a system of semi-official testing of purebred dairy cows is in operation. Milk-samples are tested for dairy companies and farmers.
The duties of the Fields Division comprise agricultural instruction, the control of experimental areas, the laying-out of experimental work on State farms, advice regarding crops, pastures, and farm-management, co-operative experimental work, agricultural investigations generally, including crop-management and the control of crop diseases and crop pests, seed-testing, hemp-grading, and grain-grading.
The Horticulture Division is charged with orchard instructional work and instruction to beekeepers, and the inspection of fruit and trees imported and offered for sale. It inspects orchards and apiaries, and generally controls diseases of plants and bees.
The Chemistry Section carries out analyses of soils, limestones, fertilizers, water, &c. The Biological Laboratory attached to the Division investigates and gives advice in agricultural botany, plant-pathology, entomology, and related subjects.
There are several experimental farms and horticultural stations which carry out experiments and demonstrations of national as well as local import, including the breeding of purebred cattle and sheep. Several of the farms were established to solve local problems, and the objective in each case has been attained. The principal establishments are those at Ruakura (Hamilton), Weraroa (Levin), Te Kauwhata (Lower Waikato), and Ashburton. Other experimental areas are operated at Puwera (Whangarei), Albany (Auckland), Marton, Gore, Winton, and Galloway (Central Otago).
The agricultural instructional work covers a comprehensive field, farmers being assisted by visits or by letters of advice. Thousands of farmers visit the experimental farms and areas. Comprehensive educational displays are frequently made at winter shows, largely illustrative of the experiments conducted by the Department. Numbers of farmers also co-operate with the Department in conducting experiments on their farms. A monthly journal, the New Zealand Journal of Agriculture, is published at a low rate of subscription, and bulletins are frequently issued. Any farmer can obtain advice regarding his soil, have seed examined for germination-capacity and purity, milk tested for butterfat content or for the presence of disease, plants identified, and diseases of either animals or plants described, and remedies suggested—all these services being rendered free of charge.
By an Act of Parliament passed in 1913 provision was made for the establishment of a Board of Agriculture, consisting of not more than twelve members appointed by the Governor-General, of whom not more than four were to be appointed on the recommendation of the agricultural and pastoral societies of the North Island, and an equal number on the recommendation of such societies in the South Island. The functions of the Board are to advise the Minister of Agriculture on matters relating to the development of agricultural and other rural industries in New Zealand. In particular, but without limiting the application of the term “agricultural and rural industries,” the functions of the Board extend to the following matters:—
The aiding, improving, and developing of agriculture and all rural industries, including fruit-culture, horticulture, forestry, dairying, the breeding of stock and poultry, beekeeping, and the flax industry;
The prevention and control of disease in stock and poultry, the control of rabbits and noxious weeds, and the dipping of sheep;
The establishment of agricultural colleges and agricultural education generally; and
The aiding or facilitating of the carriage and distribution of produce.
In the years previous to and inclusive of 1908–09 complete agricultural and pastoral statistics were collected annually by sub-enumerators appointed by the Department of Agriculture; in 1909–10 full statistics were not collected, but the areas under the principal grain and root crops were ascertained, and an estimate was made of the yields; for 2910–11 complete information was obtained in connection with the 1911 census. In the four succeeding years returns were collected by post regarding the acreage and yield of the principal crops; but this method of collection was found to be less satisfactory than the personal visit, and the figures for these years are probably not quite accurate.
Beginning with the 1915–16 season, a new and comprehensive system of collection of agricultural and pastoral statistics was instituted. Under this system complete collections of agricultural and pastoral statistics are made annually by the Census and Statistics Office through the agency of officers of the Police Department. Practically every holding of one acre or over (with the exception of those within borough boundaries and Maori lands held on the communal system) is canvassed personally. Interim returns of principal crops and live-stock are published in the New Zealand Gazette, and when the collection is completed the full statistics are published in the “Annual Statistical Report on Agricultural and Pastoral Production.” Complementary to the personal canvass a system of postal verification of yields of linseed and potatoes has recently been instituted. This was found necessary owing to the fact that at the time of the sub-enumerator's visit a large proportion of the crops mentioned was not harvested. The results have fully justified the new system.
In addition to the main collection of agricultural and pastoral statistics the following supplementary inquiries are undertaken: Areas sown or intended to be sown in wheat, oats, and potatoes (taken at the end of September); stocks of flour, wheat, and oats in the hands of millers, merchants, storekeepers, and farmers (at the end of November); estimated yields of wheat and oats (early in February); and returns of wheat and oats threshed (throughout the threshing season). The results of these first three inquiries are gazetted, and they are also, together with the figures of threshings, published from time to time in the Monthly Abstract of Statistics.
Summarized statistical information concerning agricultural and pastoral production will be found in Subsections B and C respectively of this section. Farm machinery and farm employees are probably best dealt with together (the more particularly as part of the machinery in use cannot be definitely allocated to one branch or the other of forming), and are accordingly referred to in this subsection.
Information concerning farm machinery is of value as showing in some measure the degree of reliance placed upon mechanical labour. The number of persons employed upon farms (including working proprietors or managers) is also given in the appropriate tables.
The number of milking plants shown in the returns for 1926 was 16,391, as against 15,561 in 1925. Cream-separators numbered 45,765, being an increase of 1,109 over the number shown for 1925 (44,656). Some 58,648 cows could be milked simultaneously by the machinery in use in the Dominion on the 31st January, 1926 as against 56,226 in 1925. The approximate number of cows milked by machinery on 31st January, 1926, was 729,272, as against 705,033 in 1925.
| DAIRYING MACHINERY AND PERSONS EMPLOYED, 1925–26. | ||||||
|---|---|---|---|---|---|---|
| Land District (excluding Interior Boroughs). | Persons employed on Holdings used principally for Dairying Purposes (Including Working Proprietors or Managers). | Milking Plants. | Cream-separators. | |||
| Number. | Cows capable of being milked simultaneously. | |||||
| Males. | Females. | Total. | ||||
| North Auckland | 10,015 | 4,463 | 14,478 | 2,392 | 8,024 | 7,417 |
| Auckland | 12,974 | 5,258 | 18,232 | 4,976 | 18,109 | 7,302 |
| Gisborne | 1,160 | 379 | 1,539 | 278 | 1,079 | 1,416 |
| Hawke's Bay | 1,679 | 967 | 2,646 | 612 | 2,040 | 2,050 |
| Taranaki | 7,763 | 3,762 | 11,525 | 2,869 | 10,819 | 1,938 |
| Wellington | 7,238 | 2,538 | 9,776 | 2,527 | 8,757 | 5,347 |
| Nelson | 1,373 | 389 | 1,762 | 306 | 953 | 1,998 |
| Marlborough | 497 | 420 | 917 | 203 | 691 | 1,320 |
| Westland | 621 | 314 | 935 | 136 | 443 | 566 |
| Canterbury | 2,343 | 885 | 3,228 | 776 | 2,482 | 8,320 |
| Otago | 2,128 | 1,290 | 3,418 | 415 | 1,512 | 4,675 |
| Southland | 2,785 | 2,129 | 4,914 | 901 | 3,739 | 3,416 |
| Totals, 1925–26 | 50,576 | 22,794 | 73,370 | 16,391 | 58,648 | 45,765 |
| Totals, 1924–25 | 52,606 | 24,370 | 76,976 | 15,561 | 56,226 | 44,656 |
The number of shearing plants returned in 1926 was 5,949, controlling 18,797 stands. As against this, the number of shearing plants was 5,728 in 1925, and the number of stands 18,445. Wool-presses totalled 8,641 in 1926, as against 8,601 in 1925.
| PASTORAL MACHINERY AND PERSONS EMPLOYED, 1925–26. | ||||||
|---|---|---|---|---|---|---|
| Land District (excluding Interior Boroughs). | Persons employed on Holdings used principally for Pastoral and other (including unspecified) Purposes (Including Working Proprietors or Managers). | Shearing-machines. | Wool-presses. | |||
| Males. | Females. | Total. | Plants. | Stands. | ||
| North Auckland | 3,027 | 638 | 3,665 | 352 | 910 | 376 |
| Auckland | 3,173 | 450 | 3,623 | 431 | 1,169 | 523 |
| Gisborne | 3,170 | 381 | 3,551 | 595 | 2,842 | 642 |
| Hawke's Bay | 3,791 | 842 | 4,633 | 660 | 2,341 | 736 |
| Taranaki | 1,547 | 281 | 1,828 | 314 | 961 | 428 |
| Wellington | 7,923 | 1,749 | 9,672 | 1,914 | 5,810 | 2,247 |
| Nelson | 1,217 | 194 | 1,411 | 94 | 223 | 268 |
| Marlborough | 1,496 | 490 | 1,986 | 184 | 613 | 523 |
| Westland | 338 | 109 | 447 | 10 | 20 | 51 |
| Canterbury | 7,420 | 1,459 | 8,879 | 901 | 2,563 | 1,547 |
| Otago | 4,818 | 1,456 | 6,274 | 344 | 981 | 1,001 |
| Southland | 3,010 | 1,409 | 4,419 | 150 | 364 | 299 |
| Totals, 1925–26 | 40,930 | 9,458 | 50,388 | 5,949 | 18,797 | 8,641 |
| Totals, 1924–25 | 41,297 | 10,494 | 51,791 | 5,728 | 18,445 | 8,601 |
Agricultural tractors numbered 2,025 in 1926 (1,026 in 1925), with a nominal horsepower of 32,360 (as against 17,222 in 1925). The number of reapers-and-binders was 15,574; of threshing-machines, 361; and of chaff cutters, 2,865. In 1925, reapers-and-binders numbered 15,881, threshing-machines 477, and chaffcutters 2,903. Particulars regarding other machinery used specifically for agricultural purposes are not collected.
| AGRICULTURAL MACHINERY AND PERSONS EMPLOYED, 1925–26. | ||||||||
|---|---|---|---|---|---|---|---|---|
| Land District (excluding Interior Boroughs). | Persons employed on Holdings used principally for Agricultural Purposes (including Working Proprietors or Managers). | Agricultural Tractors. | Reapers-and-binders. | Threshing. machines. | Chaffcutters. | |||
| Males. | Females. | Total. | Number | Nominal Horse power. | ||||
| North Auckland | 761 | 106 | 867 | 88 | 1,190 | 244 | 42 | 690 |
| Auckland | 328 | 33 | 361 | 134 | 2,476 | 1,370 | 18 | 245 |
| Gisborne | 85 | 7 | 92 | 19 | 414 | 116 | 7 | 86 |
| Hawke's Bay | 527 | 191 | 718 | 97 | 1,656 | 294 | 21 | 104 |
| Taranaki | 24 | 3 | 27 | 19 | 341 | 608 | 2 | 74 |
| Wellington | 491 | 54 | 545 | 235 | 4,170 | 779 | 56 | 313 |
| Nelson | 919 | 41 | 960 | 39 | 654 | 319 | 4 | 121 |
| Marlborough | 253 | 178 | 431 | 50 | 723 | 951 | 17 | 80 |
| Westland | 3 | .. | 3 | 20 | 345 | 89 | 1 | 86 |
| Canterbury | 5,533 | 1,079 | 6,612 | 805 | 11,898 | 5,733 | 122 | 303 |
| Otago | 1,657 | 408 | 2,065 | 195 | 3,335 | 3,032 | 43 | 673 |
| Southland | 684 | 328 | 1,012 | 324 | 4,897 | 2,039 | 28 | 90 |
| Totals, 1925–26 | 11,265 | 2,428 | 13,693 | 2,025 | 32,360 | 15,574 | 361 | 2,865 |
| Totals, 1924–25 | 11,398 | 2,577 | 13,975 | 1,026 | 17,222 | 15,881 | 477 | 2,903 |
Farm engines cannot be allocated to any definite branch of the farming industry. Information concerning the various classes of farm engines is given below for the season 1925–26, and 1924–25 figures are given for comparative purposes:—
| FARM ENGINES, 1925–26. | ||||||||||
|---|---|---|---|---|---|---|---|---|---|---|
| Land District (excluding interior Boroughs). | Stationary Engines. | Portable or Traction Engines. | ||||||||
| Water-wheels or Motors. | Electric Motors. | Steam. | Internal Combustion. | |||||||
| Number | Approximate Horse-power.* | Number. | Nominal Horse-power. | Number. | Nominal Horse power. | Number. | Nominal Horse-power | Number. | Nominal Horse-power. | |
* Being aggregate power of cases where specified. | ||||||||||
| North Auckland | 24 | 95 | 48 | 124 | 22 | 126 | 3,191 | 10,297 | 26 | 230 |
| Auckland | 51 | 234 | 2,732 | 5,339 | 44 | 216 | 3,316 | 9,492 | 24 | 219 |
| Gisborne | 4 | 27 | 34 | 124 | 7 | 58 | 921 | 3,545 | 36 | 243 |
| Hawke's Bay | 32 | 185 | 211 | 436 | 116 | 486 | 1,133 | 3,776 | 136 | 667 |
| Taranaki | 468 | 1,373 | 472 | 1,069 | 21 | 88 | 2,262 | 6,151 | 6 | 20 |
| Wellington | 52 | 243 | 1,195 | 2,121 | 102 | 434 | 3,782 | 12,305 | 208 | 1,187 |
| Nelson | 59 | 195 | 24 | 48 | 29 | 152 | 628 | 1,785 | 15 | 142 |
| Marlborough | 38 | 206 | 8 | 45 | 22 | 108 | 431 | 1,571 | 48 | 240 |
| Westland | 15 | 50 | 4 | 9 | 15 | 46 | 157 | 449 | 6 | 14 |
| Canterbury | 104 | 429 | 711 | 1,233 | 32 | 1541 | 1,852 | 6,441 | 187 | 1,426 |
| Otago | 88 | 463 | 141 | 402 | 18 | 78 | 1,066 | 3,934 | 85 | 629 |
| Southland | 32 | 114 | 776 | 1,681 | 45 | 275 | 695 | 1,960 | 55 | 439 |
| Totals, 1925–26 | 967 | 3,614 | 6,356 | 12,631 | 473 | 2,221 | 19,434 | 61,706 | 832 | 5,456 |
| Totals, 1924–25 | 846 | 3,325 | 3,451 | 7,235 | 622 | 2,975 | 19,894 | 62,794 | 854 | 5,427 |
A summary of persons employed on farms in each land district is given below for each of the last five years. The figures are inclusive of working proprietors and managers.
| FARM EMPLOYEES, 1922–26. | |||||
|---|---|---|---|---|---|
| Land District (excluding Interior Boroughs). | 1922. | 1923. | 1924. | 1925. | 1926. |
| North Auckland | 17,251 | 19,795 | 19,760 | 19,143 | 19,010 |
| Auckland | 21,332 | 22,677 | 22,438 | 21,893 | 22,216 |
| Gisborne | 10,277 | 5,001 | 4,903 | 5,181 | 5,132 |
| Hawke's Bay | 6,763 | 7,777 | 8,009 | 7,997 | |
| Taranaki | 13,146 | 13,603 | 11,383 | 13,490 | 13,380 |
| Wellington | 18,561 | 19,957 | 20,139 | 20,475 | 19,993 |
| Nelson | 4,254 | 4,501 | 4,490 | 4,076 | 4,133 |
| Marlborough | 2,850 | 2,978 | 3,173 | 3,663 | 3,334 |
| Westland | 1,390 | 1,539 | 1,508 | 1,530 | 1,385 |
| Canterbury | 22,013 | 23,097 | 22,403 | 20,260 | 18,719 |
| Otago | 13,759 | 14,308 | 13,530 | 13,377 | 11,757 |
| Southland | 10,562 | 12,161 | 12,195 | 11,645 | 10,345 |
| Totals | 135,395 | 146,380 | 143,699 | 142,742 | 137,451 |
The following summary of farm machinery employed on holdings outside borough boundaries during the last five years is of interest as showing the greatly increased use now being made of electricity and of mechanical equipment as compared with the position disclosed only four years previously:—
| FARM MACHINERY AND ENGINES, 1922–26. | |||||
|---|---|---|---|---|---|
| Class of Machinery, &c. | 1922. | 1923. | 1924. | 1925. | 1926. |
| Milking plants | 12,468 | 13,553 | 14,553 | 15,561 | 16,391 |
| Cream-separators | 38,861 | 40,916 | 42,473 | 44,656 | 45,765 |
| Shearing-machines— | |||||
| Plants | 5,468 | 5,317 | 5,480 | 5,728 | 5,949 |
| Stands | 17,788 | 17,394 | 17,844 | 18,445 | 18,797 |
| Wool-presses | 8,253 | 8,179 | 8,035 | 8,601 | 8,641 |
| Agricultural tractors | 412 | 439 | 512 | 1,026 | 2,025 |
| Reapers-and-binders | 15,645 | 15,380 | 15,048 | 15,881 | 15,574 |
| Threshing-machines | 390 | 343 | 332 | 477 | 361 |
| Chaffcutters | 3,179 | 3,061 | 2,970 | 2,903 | 2,865 |
| Water-wheels or motors | 934 | 1,129 | 871 | 846 | 967 |
| Electric motors | 778 | 1,339 | 2,587 | 3,451 | 6,356 |
| Steam-engines | 740 | 709 | 626 | 622 | 473 |
| Internal-combustion engines | 17,551 | 18,209 | 18,864 | 19,894 | 19,434 |
OF the total area of 18,582,995 acres under cultivation in 1925–26, 577,525 acres were in grain and pulse crops. If from this total be deducted areas under crops act intended for threshing, the total is reduced to 309,655 acres. The areas and the total and per-acre yields of the principal grain and pulse crops for threshing are given below for each of the last tea years:—
| GRAIN AND PULSE CROPS, 1916–17 TO 1925–26. | |||||
|---|---|---|---|---|---|
| Areas. | |||||
| Season. | Wheat. | Oats. | Barley. | Maize. | Peas and Beans. |
| Acres. | Acres. | Acres. | Acres. | Acres. | |
| 1916–17 | 217,743 | 177,524 | 29,646 | 6,359 | 11,905 |
| 1917–18 | 280,978 | 156,202 | .18,860 | 8,151 | 11,685 |
| 1918–19 | 208,030 | 172,686 | 18,753 | 9,792 | 17,929 |
| 1919–20 | 139,611 | 179,800 | 22,907 | 9,064 | 14,416 |
| 1920–21 | 219,985 | 147,559 | 46,802 | 11,514 | 14,466 |
| 1921–22 | 352,918 | 170,655 | 33,078 | 10,522 | 12,789 |
| 1922–23 | 275,775 | 143,090 | 17,473 | 9,732 | 24,449 |
| 1923–24 | 173,864 | 63,842 | 21,286 | 8,208 | 18,676 |
| 1924–25 | 166,964 | 147,387 | 25,138 | 8,621 | 14,027 |
| 1925–26 | 151,673 | 102,485 | 25,969 | 8,508 | 11,749 |
| Total Yields. | |||||
| Bushels. | Bushels. | Bushels. | Bushels. | Bushels. | |
| 1916–17 | 5,051,227 | 5,371,436 | 738,050 | 274,283 | 243,297 |
| 1917–18 | 6,807,536 | 4,942,759 | 568,702 | 367,761 | 312,582 |
| 1918–19 | 6,567,629 | 6,884,609 | 710,932 | 413,595 | 505,950 |
| 1919–20 | 4,559,934 | 6,967,862 | 815,807 | 405,775 | 369,306 |
| 1920–21 | 6,872,262 | 5,225,115 | 1,586,711 | 500,845 | 355,395 |
| 1921–22 | 10,565,275 | 6,752,663 | 1,151,813 | 488,452 | 339,398 |
| 1922–23 | 8,395,023 | 5,688,157 | 598,040 | 505,776 | 697,548 |
| 1923–24 | 4,174,537 | 1,964,511 | 597,416 | 405,855 | 362,787 |
| 1924–25 | 5,447,758 | 5,707,174 | 798,128 | 426,875 | 410,582 |
| 1925–26 | 4,617,041 | 4,115,606 | 947,002 | 423,700 | 287,775 |
| Average Yields per Acre. | |||||
| Bushels. | Bushels. | Bushels. | Bushels. | Bushels. | |
| 1916–17 | 23.19 | 30.26 | 24.89 | 43.13 | 20.43 |
| 1917–18 | 24.23 | 31.64 | 30.15 | 45.09 | 26.73 |
| 1918–19 | 31.57 | 39.87 | 37.91 | 42.17 | 28.16 |
| 1919–20 | 32.66 | 38.75 | 35.61 | 44.76 | 25.62 |
| 1920–21 | 31.24 | 35.41 | 33.90 | 43.50 | 24.54 |
| 1921–22 | 29.94 | 39.56 | 34.81 | 46.42 | 26.54 |
| 1922–23 | 30.44 | 39.75 | 34.23 | 51.96 | 28.51 |
| 1923–24 | 24.01 | 30.77 | 28.07 | 49.40 | 19.43 |
| 1924–25 | 32.62 | 38.72 | 31.75 | 49.47 | 29.27 |
| 1925–26 | 30.44 | 40.14 | 36.47 | 49.80 | 24.49 |
Wheat is principally grown in the central and southern portions of the South Island, Seventy-eight per cent. of the grain produced in 1925–26 came from Canterbury, Otago and Southland together produced 18 per cent., while the remainder of the South Island and the whole of the North Island contributed the remaining 4 per cent.
The following diagram will give a clear conception of the relationship between area and yield of wheat for the period 1868–69 to 1935–26. It is seen that in later years the yield curve diverges considerably from that for the area, the tendency being upward. As a matter of fact, the average yield per acre for the ten seasons fit the end of the curve is fully 2 bushels more than the average for the first ten seasons.
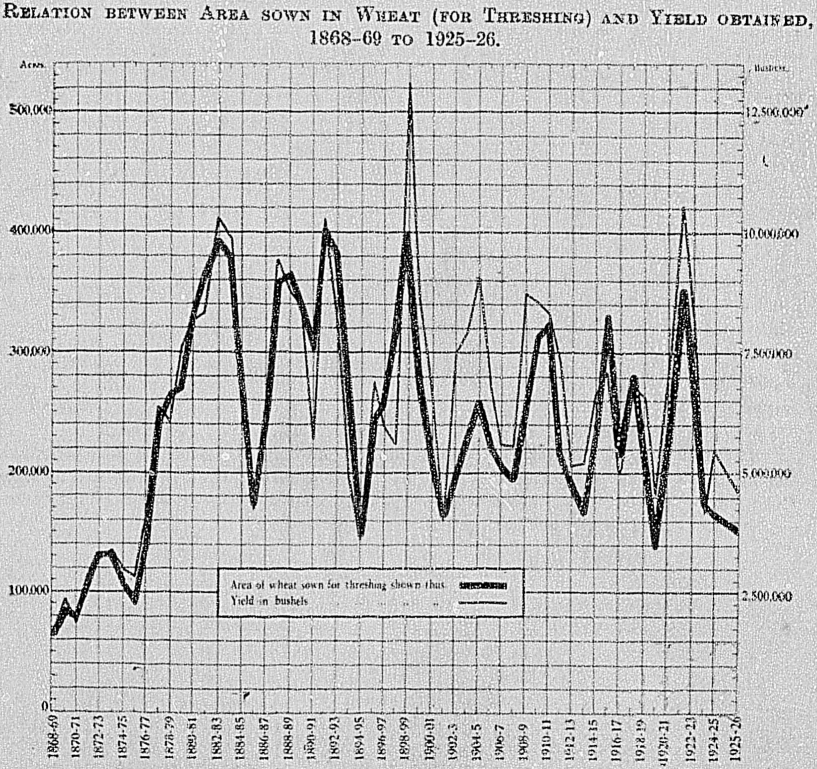
The heavy black line can be taken as representing not only the area sown (in acres), but also the yield which that area would have produced had a standard yield of 25 bushels per acre been maintained throughout. Prior to the 1899–1900 season the average yield per acre fell below 25 bushels per acre on fourteen occasions, while subsequent to that date the yield has been above 25 bushels per acre, except on only five occasions. This increase in the average yield has been ascribed to various reasons, the main one being the increased use of artificial manures. While this explanation is not without foundation, due weight must also be given to the economic law of marginal utility, whereby, fallowing the varying fortunes of demand and supply, varying classes of land will be sewn. When the demand is insufficient to induce farmers to grow on the poorer lands, the average yield must certainly, other things being equal, tend to be higher than would be the case where the demand (or anticipated demand) is greater. This law is well, illustrated by the fact that the fifteen occasions upon which the demand (or anticipated demand) was sufficient to induce 300,000 acres or more to be sown include six occasions upon which the average yield fell below 25 bushels per acre. The average yield over the whole period amounts to 27.3 bushels per acre, while for the fifteen occasions upon which 300,000 acres or more were sown the average was 24.88 bushels per acre.
The area (for threshing) and the production of wheat per head of population (including Maoris) for the last, ton years are now given. The population is taken at the 1st April, a date corresponding approximately to harvest-time.
| Year. | Per Head of Population. | |
|---|---|---|
| Area. | Production. | |
| Acres. | Bushels. | |
| 1916–17 | 0.19 | 4.42 |
| 1917–18 | 0.24 | 5.90 |
| 1918–19 | 0.18 | 5.57 |
| 1919–20 | 0.11 | 3.69 |
| 1920–21 | 0.17 | 5.42 |
| 1921–22 | 0.27 | 8.12 |
| 1922–23 | 0.21 | 6.33 |
| 1923–24 | 0.13 | 3.10 |
| 1924–25 | 0.12 | 3.95 |
| 1925–26 | 0.11 | 3.28 |
Unless there is a considerable carry-over from the previous season, importation of wheat requires to be made when the production falls below about 6 bushels per head of population. In 1917, 719,977 bushels of wheat were imported; in 1918, 1,370,542 bushels; in 1919, 1,336,222 bushels; in 1920, 1,905,163 bushels; and in 1921, 306,257 bushels. In 1922 the abnormal harvest of 10,500,000 bushels permitted almost 1,250,000 bushels to be exported, the imports in that year being insignificant, while in 1923 there was again a surplus, although small, of exports over imports. In 1924 there was again a shortage, which was required to be met by the importation of 3,548,340 bushels of wheat, followed by 2,253,740 bushels of wheat and 8,206 tons of flour in 1925.
The following information is based on the production figures as ascertained at the five collections of agricultural and pastoral statistics previous to and including 1925, whilst due weight is given to imports and exports of wheat and flour (including exports to Cook Islands) and estimated carry-over.
| WHEAT-CONSUMPTION, 1921–25. | |||
|---|---|---|---|
| Year. | Production of Wheat at Harvest. | Excess of Imports over Exports of Wheat.* | Total. |
* Including flour converted on the basis of 48 bushels of wheat to 1 short ton of flour. † Excess of exports over Imports. | |||
| Bushels. | Bushels. | Bushels. | |
| 1921 | 6,872,262 | 292,730 | 7,165,992 |
| 1922 | 10,565,275 | -1,217,345† | 9,347,930 |
| 1923 | 8,395,023 | -10,113† | 8,384,910 |
| 1924 | 4,174,537 | 3,544,752 | 7,719,289 |
| 1925 | 5,447,758 | 2,642,212 | 8,089,970 |
| Total for five years | 35,454,855 | 5,252,236 | 40,707,091 |
| Average | 7,090,971 | 1,050,447 | 8,141,418 |
| Less average net increase in carry-over | 35,279 | ||
| Estimated average annual consumption | 8,106.139 | ||
Over the average of the last five years it is found that New Zealand has consumed annually some 8,106,139 bushels of wheat for all purposes, including seed, fowl-feed, &c. Of this total 340,521 bushels have been required on the average for seed purposes, and 312,812 bushels were threshing-millers' seconds. The latter would probably be all used for fowl and other stock feeding purposes. The balance available for gristing into flour may thus be taken as averaging 7,452,806 bushels, representing 155,267 tons of 2,000 lb. at the rate of 48 bushels to the ton.
Information concerning carry-over or surplus at the end of the season was first collected under the present system in 1916. At the 30th November, 1925, there was a surplus (allowing for flour) of 1,759,894 bushels, while the carry-over on the 30th November, 1920, was 1,583,500 bushels (or the equivalent), the surplus having thus increased during the five years by 176,394 bushels, or at the rate of 35,279 bushels annually.
The amount of wheat sown per acre for seed purposes varies in different districts, but after making due allowance for these differences it is estimated that on the average about 1 ½ bushels are sown to the acre throughout the Dominion. The following table gives particulars upon which this estimate is based:—
| District. | Amount of Seed sown per Acre. | Mean Sowings per Acre. | Area under Wheat in 1925–26. | Estimated Sowings, 1925–26. |
|---|---|---|---|---|
| Bushels. | Bushels. | Acres. | Bushels. | |
| North Auckland, Auckland | 2 to 2 ½ | 2.250 | 199 | 448 |
| Gisborne, Hawke's Bay, Wairarapa | 1 ¼ to 2 | 1.625 | 1,047 | 1,700 |
| Taranaki, Wellington (excluding Wairarapa) | 2 to 2 ½ | 2.250 | 1,369 | 3,080 |
| Nelson, Marlborough, Westland, Canterbury, North Otago | 1 to 1 ¾ | 1.375 | 139,019 | 191,151 |
| South Otago, Southland | 2 to 3 | 2.500 | 11,614 | 29,035 |
| Dominion totals | 1 to 3 | 1.471 | 153,248 | 225,414 |
Taking an average of the last five seasons it is found that 227,000 acres are annually put down in wheat for all purposes, and at the rate of 1 ½ bushels per acre this would represent an average annual seed requirement of 340,500 bushels.
The amount of fowl-wheat annually consumed within the Dominion is extremely difficult to assess. Wheat for this purpose comes into competition with oats, and therefore price-variations must necessarily play a prominent part among the various factors concerned in the amount used for this purpose. Moreover, in years of plenty flour-millers will tend to be more strict in the application of standards, and thus much wheat which in other years would be ground into flour would be rejected. This wheat would probably all be sold subsequently as fowl-wheat. Information as to classification by flour-millers is not available, but the proportions of threshing-millers' seconds and of firsts for the last five seasons are as follows:—
| Season. | Proportion of Total Yield. | |
|---|---|---|
| Firsts. | Seconds. | |
| Per Cent. | Per Cent. | |
| 1921–22 | 94.76 | 5.24 |
| 1922–23 | 95.00 | 5.00 |
| 1923–24 | 96.41 | 3.59 |
| 1924–25 | 95.06 | 4.94 |
| 1925–26 | 96.72 | 3.28 |
The average for the five seasons gives 4.41 per cent. as seconds, and on the average of five seasons this represents 312,812 bushels annually. It is noteworthy that the proportion of millers' seconds is greatest when the harvest is poorest, and least when the harvest is exceptionally good.
The area and yield of wheat in 1925–26 for each State of the Commonwealth of Australia and for New Zealand were as shown in the following table.
| State. | Wheat Crop. | ||
|---|---|---|---|
| Area. | Total Yield. | Average Yield per Acre. | |
| Acres. | Bushels. | Bushels. | |
| Queensland | 137,144 | 1,159,237 | 8.45 |
| New South Wales (including Federal Territory) | 2,928,790 | 33,815,000 | 11.55 |
| Victoria | 2,513,494 | 29,255,534 | 11.64 |
| South Australia | 2,464,395 | 28,354,728 | 11.51 |
| Western Australia | 2,111,871 | 20,468,805 | 9.69 |
| Tasmania | 19,500 | 390,000 | 20.00 |
| Totals for Commonwealth | 10,175,194 | 113,443,304 | 11.15 |
| New Zealand | 151,673 | 4,617,041 | 30.44 |
| Grand totals | 10,326,867 | 118,060,345 | 11.43 |
The average production per acre for the ten seasons ending with 1925–26 is— for New Zealand, 29.03 bushels per acre; and for Australia, 13.59 bushels per acre.
It may be said that, although from twenty to thirty countries in the world generally produce more wheat than does New Zealand, only one or two European countries have a better record of production per acre. This says much for the fertility of the soil of the Dominion, for cultivation here is naturally less intensive than it is in the closely settled Continental countries.
In point of area oats is the most important grain crop of the Dominion. About 80 per cent., is grown in Canterbury, Otago, and Southland, 5 per cent. in the remainder of the South Island, and 15 per cent. in the North Island. The greater portion of the oat crop is usually converted into chaff without threshing, but the proportion so dealt with depends partly on the condition of the crop and partly on market conditions. In 1916–17, 33.36 per cent. of the crop harvested was threshed; in 1917–18, 33.41 per cent.; in 1918–19, 36.40 per cent.; in 1919–20, 35.82 per cent.; in 1920–21, 25.67 per cent.; in 1921–22, 33.16 per cent.; in 1922–23, 30.51 per cent.; in 1923–24 only 15.29 per cent.; in 1924–25, 31.21 per cent.; and in 1925–26, 27.91 per cent.
The total and average yields per acre of grain and of chaff, hay, or ensilage for the last ten seasons were as follows:—
| Season. | Grain. | Chaff, Hay, or Ensilage. | ||
|---|---|---|---|---|
| Total Yield. | Average per Acre. | Total Yield. | Average per Acre. | |
| Bushels. | Bushels. | Tons. | Tons. | |
| 1916–17 | 5,371,436 | 30.26 | 432,878 | 1.22 |
| 1917–18 | 4,942,759 | 31.64 | 419,434 | 1.35 |
| 1918–19 | 6,884,609 | 39.87 | 461,739 | 1.53 |
| 1919–20 | 6,967,862 | 38.75 | 467,640 | 1.45 |
| 1920–21 | 5,225,115 | 35.41 | 557,023 | 1.36 |
| 1921–22 | 6,752,663 | 39.56 | 538,194 | 1.56 |
| 1922–23 | 5,688,157 | 39.75 | 480,147 | 1.59 |
| 1923–24 | 1,964,511 | 30.77 | 366,546 | 1.12 |
| 1924–25 | 5,707,174 | 38.72 | 507,173 | 1.64 |
| 1925–26 | 4,115,606 | 40.14 | 354,373 | 1.45 |
New Zealand has no regular export of oats, and in some years has practically no surplus available for export. In 1901 the export reached 10,514,924 bushels, in 1909 5,133,473 bushels, and in 1912 4,123,920 bushels. The 1923–24 oat crop was so phenomenally small that in 1924 1,074,070 bushels were imported, a state of affairs unprecedented in the history of the Dominion. Imports of oats in 1925 (98,590 bushels) were considerably in excess of exports for that year. The quantity exported in each of the last ten years was as follows:—
| Year. | Bushels. |
|---|---|
| 1916 | 220,265 |
| 1917 | 5,767 |
| 1918 | 3,250 |
| 1919 | 144,827 |
| 1920 | 227,027 |
| 1921 | 431,472 |
| 1922 | 685,680 |
| 1923 | 478,147 |
| 1924 | 5,332 |
| 1925 | 8,140 |
The oat crop for 1924–25 in the States of the Commonwealth of Australia was as follows:—
| Acres. | Bushels. | Average per Acre. Bushels. | |
|---|---|---|---|
| Queensland | 4,010 | 63,912 | 15.94 |
| New South Wales | 122,994 | 2,500,951 | 20.33 |
| Federal Capital Territory | 523 | 10,449 | 19.98 |
| Victoria | 517,229 | 9,572,003 | 18.51 |
| South Australia | 155,214 | 1,939,415 | 12.50 |
| Western Australia | 318,982 | 4,241,074 | 13.30 |
| Tasmania | 46,175 | 1,065,933 | 23.08 |
| Totals for Commonwealth | 1,165,127 | 19,393,737 | 16.65 |
The area under barley for threshing for the season 1925–26 was 25,969 acres, the crop amounting to 947,002 bushels, an average of 36.47 bushels per acre. In 1924–26 the area under barley was 25,138 acres, and the yield 798,128 bushels, or 31.75 bushels per acre.
The returns for 1925–26 show that 8,508 acres of maize were sown for grain, being a decrease of 113 acres on the area for the previous season (8,621 acres). The yield for the 1925–26 harvest was 423,700 bushels of corn, an average of 49.80 bushes per acre, and in 1924–25 426,875 bushels, an average of 49.47 bushels per acre. Practically all the maize is grown in the North Island.
The area under peas and beans for threshing in the season 1925–26 was 11,749 acres, yielding 287,775 bushels. The area under these crops in 1924–25 was 14,027 acres.
New Zealand has a considerable export of peas and beans, the figures for the last ten years being—
| EXPORT OF PEAS AND BEANS, 1916 TO 1925. | |
|---|---|
| Year. | Bushels. |
| 1916 | 84,168 |
| 1917 | 111,175 |
| 1918 | 90,495 |
| 1919 | 451,595 |
| 1920 | 208,414 |
| 1921 | 224,080 |
| 1922 | 201,478 |
| 1923 | 361,048 |
| 1924 | 189,015 |
| 1925 | 215,538 |
Particulars of the areas under cereals, grasses, and clovers out for chaff, hay, or ensilage, or for use as green fodder, are next given for each of the last ten seasons, together with, information as to yields.
| CEREALS AND GRASSES FOR CHAFF, HAY, OR ENSILAGE, AND FOR GREEN FODDER. | ||||||
|---|---|---|---|---|---|---|
| Areas. | ||||||
| Season. | Wheat for Chaff, &c. | Oats for Chaff, &c. | Barley for Chaff, &c. | Maize for Ensilage, &c. | Grasses and Clovers for Hay. | Green Fodder. |
| Acres. | Acres. | Acres. | Acres. | Acres. | Acres. | |
| 1916–17 | 3,738 | 354,550 | 1,240 | 711 | 106,723 | 218,452 |
| 1917–18 | 2,258 | 311,316 | 634 | 613 | 111,181 | 180,867 |
| 1918–19 | 1,646 | 301,724 | 530 | 272 | 131,557 | 149,622 |
| 1919–20 | 2,125 | 322,174 | 711 | 589 | 117,110 | 166,758 |
| 1920–21 | 1,623 | 410,059 | 670 | 667 | 161,820 | 185,284 |
| 1921–22 | 1,252 | 344,051 | 793 | 1,039 | 187,363 | 201,351 |
| 1922–23 | 1,181 | 302,216 | 428 | 739 | 175,558 | 249,417 |
| 1923–24 | 1,629 | 326,652 | 590 | 958 | 188,979 | 239,652 |
| 1924–25 | 1,105 | 308,527 | 242 | 600 | 229,644 | 240,061 |
| 1925–26 | 857 | 245,026 | 370 | 557 | 224,777 | 255,429 |
| Yields. | |||||
|---|---|---|---|---|---|
| Season. | Wheat Chaff &c. | Oaten Chaff, &c. | Barley Chaff, &c. | Maize (Ensilage). | Grass, Clover, lucerne. and Hay, |
| Tons. | Tons. | Tons. | Tons. | Tons. | |
| 1916–17 | 5,186 | 432,878 | 2,151 | 5,107 | 179,505 |
| 1917–18 | 3,549 | 419,434 | 1,240 | 3,335 | 180,436 |
| 1918–19 | 2,554 | 461,739 | 938 | 1,378 | 225,549 |
| 1919–20 | 3,172 | 467,640 | 1,182 | 2,909 | 184,115 |
| 1920–21 | 2,481 | 557,023 | 1,220 | 4,418 | 272,515 |
| 1921–22 | 2,443 | 538,194 | 1,469 | 6,470 | 336,273 |
| 1922–23 | 1,724 | 480,147 | 901 | 4,231 | 316,573 |
| 1923–24 | 2,146 | 366,546 | 976 | 5,852 | 317,616 |
| 1924–25 | 1,753 | 507,173 | 398 | 2,414 | 426,738 |
| 1925–26 | 1,156 | 354,373 | 793 | 1,679 | 400,148 |
The growing of linseed increased at a fast rate during the six seasons following 1917–18, but the area sown in the last two seasons has been considerably smaller than in 1923–24. The following table summarizes the information available in regard to this crop:—
| Season. | Area sown. | Total Yield. | Yield per Acre. |
|---|---|---|---|
* Not available. | |||
| Acres. | Tons. | Tons. | |
| 1916–17 | 1,431 | * | * |
| 1917–18 | 1,456 | * | * |
| 1918–19 | 3,890 | * | * |
| 1919–20 | 5,046 | 2,291 | 0.45 |
| 1920–21 | 9,663 | 4,552 | 0.47 |
| 1921–22 | 5,880 | 2,830 | 0.48 |
| 1922–23 | 10,545 | 5,133 | 048 |
| 1923–24 | 12,119 | 2,705 | 0.22 |
| 1924–25 | 6,679 | 2,135 | 0.32 |
| 1925–26 | 8,143 | 2,361 | 0.29 |
By far the greater portion of the linseed is grown in Canterbury (6,313 acres in 1925–26).
The areas and yields of seed and root crops for each of the ten seasons 1916–17 to 1925–26 are next given. It should be understood that the areas shown for seed crops represent only those crops actually cut for seed.
| SEED AND ROOT CROPS. | ||||||||
|---|---|---|---|---|---|---|---|---|
| Areas. | ||||||||
| Season. | Rye-grass. | Cocksfoot. | Chewings Fescue. | Red Clover and Cow-grass. | White Clover. | Potatoes. | Turnips. | Mangolds. |
* Of 20 lb. | ||||||||
| Acres. | Acres. | Acres. | Acres. | Acres. | Acres. | Acres. | Acres. | |
| 1916–17 | 79,135 | 16,134 | 5,514 | 2,978 | 1,330 | 26,156 | 526,283 | 9,073 |
| 1917–18 | 70,220 | 16,595 | 4,372 | 6,907 | 3,722 | 22,854 | 450,819 | 8,712 |
| 1918–19 | 31,250 | 19,318 | 2,329 | 6,682 | 6,798 | 19,169 | 438,045 | 8,233 |
| 1919–20 | 39,580 | 16,789 | 3,425 | 6,181 | 2,284 | 24,933 | 542,310 | 9,546 |
| 1920–21 | 56,471 | 17,527 | 3,469 | 6,347 | 3,356 | 22,068 | 551,190 | 9,170 |
| 1921–22 | 51,356 | 14,987 | 6,231 | 6,910 | 3,030 | 19,418 | 508,520 | 10,063 |
| 1922–23 | 34,850 | 13,431 | 6,423 | 13,494 | 5,526 | 20,197 | 492,974 | 9,694 |
| 1923–24 | 43,487 | 11,619 | 9,279 | 5,543 | 4,161 | 20,993 | 477,381 | 9,989 |
| 1924–25 | 66,764 | 12,258 | 4,459 | 10,400 | 3,196 | 23,092 | 452,894 | 15,111 |
| 1925–26 | 45,154 | 9,745 | 6,902 | 6,579 | 5,358 | 23,484 | 468,475 | 13,296 |
| Yields. | ||||||
|---|---|---|---|---|---|---|
| Season. | Eye-grass. | Cocksfoot. | Chewings Fescue. | Red Clover and Cow-grass. | White Clover. | Potatoes. |
| Bushels.* | lb. | lb. | lb. | lb. | .Tons. | |
| 1916–17 | 1,152,487 | 1,907,043 | 1,247,545 | 443,861 | 143,465 | 133,642 |
| 1917–18 | 1,355,612 | 2,410,557 | 1,013,042 | 1,076,360 | 461,853 | 100,596 |
| 1918–19 | 646,194 | 3,761,814 | 551,588 | 1,255,478 | 958,360 | 105,483 |
| 1919–20 | 652,672 | 2,201,729 | 827,769 | 1,146,882 | 335,203 | 144,705 |
| 1920–21 | 1,015,507 | 2,724,816 | 680,116 | 1,554,770 | 512,480 | 126,648 |
| 1921–22 | 952,933 | 2,713,648 | 1,650,327 | 1,518,824 | 362,812 | 112,090 |
| 1922–23 | 681,709 | 1,971,135 | 2,334,386 | 2,570,650 | 870,087 | 113,826 |
| 1923–24 | 725,959 | 1,428,759 | 1,499,177 | 1,213,835 | 581,676 | 105,552 |
| 1924–25 | 1,517,554 | 1,852,754 | 1,198,111 | 2,015,486 | 490,073 | 122,184 |
| 1925–26 | 1,041,716 | 1,381,607 | 1,574,502 | 1,517,763 | 954,082 | 143,781 |
The area under potatoes in 1925–26 was 23,484 acres, yielding a return of 143,781 tons, or an average of 6.09 tons per acre, against 23,092 acres and 122,184 tons (or 5.27 tons per acre) in 1924–25. Second crops are included in the yield, but not in the area, though the area of second crops is taken into account in computing the average yield.
These figures do not include areas of less than a quarter of an acre, so that a considerable quantity of potatoes grown for private use has not been taken into account. The following table shows the average yield per acre of potatoes in each of the Australian States and in New Zealand from 1920–21 to 1924–25:—
| AVERAGE YIELD PER ACRE OF POTATOES, 1920–21 TO 1924–25. | |||||
|---|---|---|---|---|---|
| State. | 1920–21. | 1921–22. | 1922–23. | 1923–24. | 1924–25. |
| Tons. | Tons. | Tons. | Tons. | Tons. | |
| Queensland | 2.17 | 1.76 | 1.37 | 1.45 | 2.14 |
| New South Wales | 2.29 | 1.96 | 1.58 | 2.79 | 2.45 |
| Victoria | 2.74 | 2.72 | 2.40 | 4.02 | 2.27 |
| South Australia | 3.55 | 3.21 | 3.02 | 4.07 | 3.71 |
| Western Australia | 3.14 | 3.77 | 4.20 | 3.74 | 3.88 |
| Tasmania | 2.77 | 2.92 | 2.94 | 2.70 | 2.31 |
| Federal Territory | 3.67 | 3.33 | 2.67 | 4.48 | 5.00 |
| Commonwealth | 2.66 | 2.60 | 2.42 | 3.33 | 2.39 |
| New Zealand | 5.72 | 5.76 | 5.63 | 5.03 | 5.27 |
Turnips form a most important crop in a sheep-breeding country such as New Zealand, and in 1925–26 the area under this crop was 468,475 acres, while there were 13,296 acres of mangolds.
The figures for these crops or 1924–25 were 452,894 acres and 15,111 acres respectively.
The area under rye-grass for seed in the season 1925–26 was 45,154 acres, yielding 1,041,716 bushels of 20lb., or an average of 22.89 bushels per acre, as against 1,517,554 bushels from 66,764 acres (average 22.61 bushels per acre) in 1924–25.
In cocksfoot there were 9,745 acres, which yielded 1,381,607 lb., or an average of 141.78 lb. per acre. The area in the previous season was 12,258 acres, and the total yield 1,852,754 lb., the average yield per acre being 150.39 lb. The area returned by farmers as being under cocksfoot (for seed) is decreasing steadily, having been 41,918 acres in 1910–11. Much of the waste land of the Dominion is laid down in cocksfoot, including a large proportion of the land enclosed with the State railway-lines. Much of this is harvested, but no record of the amount obtained from this source is kept.
Second or catch crops are taken account of in the yield figures, the total yield including crops obtained from areas which had previously yielded some other crop in the season concerned. The areas, however, do not include second crops, and average yields cannot therefore be obtained by the mere division of the total yield by the area shown.
There were 648 acres under hops in 1925–26, 644 acres of this area being in the Nelson Land District. The total produce amounted to 751,416 lb., an average of 1,351 lb. per acre.
Of the minor crops for threshing, rye was the most important in 1925–26. amounting to 933 acres. The area sown in vetches was 105 acres. The following table gives details for the seasons 1924–25 and 1925–26:—
| — | Area. | Yield. | ||
|---|---|---|---|---|
| 1924–25. | 1925–26. | 1924–25. | 1925–26. | |
| Acres. | Acres. | Bushels. | Bushels. | |
| Rye | 1,699 | 933 | 34,418 | 23,146 |
| Vetches, tares | 685 | 105 | 16,340 | 5,787 |
| Lupins | 5 | .. | 162 | .. |
| Buckwheat | 1 | .. | 50 | .. |
| Cape Barley | .. | 8 | .. | 150 |
| Unspecified | .. | 82 | .. | 1,500 |
| Totals | 2,390 | 1,128 | 50,970 | 30,583 |
Minor green and root crops (including certain “industrial” crops) amounted to 2,670 acres in 1925–26, as against 3,950 acres in 1924–25. The following table gives details for the two seasons:—
| — | 1924–25. | 1925–26. |
|---|---|---|
| Acres. | Acres. | |
| Kumeras (sweet potatoes) | 234 | 126 |
| Pumpkins, marrows, &c. (for stock) | 1,485 | 816 |
| Carrots (for stock) | 1,475 | 1,279 |
| Millet | 110 | 14 |
| Rye-straw | 6 | .. |
| Chicory | 26 | 6 |
| Tobacco | 206 | 150 |
| Artichokes | 126 | 181 |
| Osiers | .. | 40 |
| Unspecified | 282 | 58 |
| Totals | 3,950 | 2,670 |
Large areas in various parts of New Zealand are covered with phormium lenax, or New Zealand flax, the fibre of which is largely used for ropemaking, &c. At the census of factory production for the year 1924–25 sixty-four flax-mills were returned, employing 1,211 hands, the total value of the year's output being £505,761. The export of fibre and tow during each of the last ten years was as follows:—
| PHORMIUM EXPORTED, 1916 TO 1925. | ||
|---|---|---|
| 1921 | 9,643 | 1,534 |
| 1922 | 9,727 | 1,698 |
| 1923 | 10,612 | 1,694 |
| 1924 | 12,982 | 2,196 |
| 1925 | 16,408 | 3,515 |
| 1916 | 27,674 | 4,578 |
| 1917 | 23,516 | 2,500 |
| 1918 | 25,167 | 1,815 |
| 1919 | 22,347 | 3,262 |
| 1920 | 18,949 | 3,126 |
The area of phormium tenax on occupied holdings in 1925–26 was 57,780 acres.
In 1925–26 there were 4,599 acres in market gardens, 405 acres in nurseries and seed-gardens, and 64,872 acres in private gardens and pleasure-grounds. The area in plantations (not virgin bush) was 88,656 acres.
In the collection of agricultural and pastoral statistics commercial orchards are defined as “those producing fruit for sale to the value of £50 and upwards annually, or, if not in full bearing, or if for any reason the crop has been a failure, that are calculated to produce fruit for sale to that value when in full bearing or in normal seasons, as the case may be.” This definition must not be confused with the definition of a “commercial” orchard used for the purpose of assessing orchard-tax under the Orchard-tax Amendment Act, 1921.
Private orchards consist chiefly of small areas the produce of which is consumed principally on the holding, or, if sold, does not aggregate an annual value of £50. Larger areas, which through age, disease, or other cause are incapable of producing a yearly revenue of the stipulated amount, are also included in private orchards.
A great impetus to the planting of fruit-trees was given by the discovery some years ago that tracts of land, principally in the Nelson Land District, which formerly bore nothing but stunted manuka and were looked on as being practically useless, were eminently suited for growing fruit, particularly apples. For a time considerable areas of this and other land were annually added to the Dominion's orchard area, but in the last few years planting has diminished to comparatively small proportions.
The position is fairly well indicated by the following table, which shows the area outside borough boundaries which has been returned as under fruit-trees at each of the last ten annual enumerations:—
| AREA IN ORCHARD, 1916–17 TO 1925–26. | ||||
|---|---|---|---|---|
| Year. | Commercial Orchards. | Private Orchards. | Total. | |
| Bearing. | Not Bearing. | |||
| Acres. | Acres. | Acres. | Acres. | |
| 1916–17 | 12,192 | 12,618 | 9,164 | 33,974 |
| 1917–18 | 12,689 | 13,865 | 7,898 | 34,452 |
| 1918–19 | 14,182 | 12,968 | 7,572 | 34,722 |
| 1919–20 | 15,545 | 10,959 | 6,675 | 33,179 |
| 1920–21 | 16,603 | 9,235 | 5,669 | 31,507 |
| 1921–22 | 17,607 | 7,604 | 5,910 | 31,121 |
| 1922–23 | 20,235 | 4,929 | 5,679 | 30,843 |
| 1923–24 | 20,084 | 3,754 | 5,851 | 29,689 |
| 1924–25 | 19,547 | 2,651 | 5,327 | 27,525 |
| 1925–26 | 19,876 | 1,937 | 5,255 | 27,068 |
The increase in the area of “bearing” commercial orchards over the period has been achieved at the expense of the non-bearing area, which has fallen from 12,618 acres in 1916–17 to 1,937 acres in 1925–26. Evidently there has been a good deal of cutting-out of orchards, particularly private orchards, owing to their having passed their period of utility, or for other reasons, such as the increase in land-values, the presence of disease, &c.
The figures show a decrease of 6,906 acres between 1916–17 and 1925–26. The decrease in the area of utility orchards has undoubtedly been considerably less, and there is indeed reason to believe that with the application of more modern methods of culture the yield is steadily increasing. Unfortunately, the area shown cannot be relied upon as being altogether accurate; and though the position is improving in this respect, it would seem that the area which as stated above is not inclusive of orchards within borough boundaries is still to a certain extent overstated. A special investigation into the matter is now in progress.
The distribution of the orchard area of the Dominion, as shown by the 1925–26 collection of statistics, is as follows:—
| AREA IN ORCHARD, 1925–26. | ||||
|---|---|---|---|---|
| Land District. | For Commercial Purposes. | For Private Use only. | Total Area in Orchard. | |
| Bearing. | Not bearing. | |||
| Acres. | Acres. | Acres. | Acres. | |
| North Auckland | 4,408 | 386 | 1,211 | 6,005 |
| Auckland | 811 | 122 | 720 | 1,653 |
| Gisborne | 216 | 32 | 310 | 558 |
| Hawke's Bay | 2,070 | 351 | 251 | 2,672 |
| Taranaki | 20 | 3 | 103 | 126 |
| Wellington | 423 | 20 | 595 | 1,038 |
| Nelson | 5,764 | 611 | 329 | 6,704 |
| Marlborough | 497 | 27 | 134 | 658 |
| Westland | 20 | .. | 11 | 31 |
| Canterbury | 1,825 | 73 | 915 | 2,813 |
| Otago | 3,811 | 312 | 463 | 4,586 |
| Southland | 11 | .. | 213 | 224 |
| Dominion | 19,876 | 1,937 | 5,255 | 27,068 |
A good market exists locally for choice, clean fruit, but, as additional areas come into bearing, growers are having to look to outside markets to take the surplus. With a view to assisting towards building up an export trade in apples and pears the State has from 1924 onwards guaranteed growers a net return of 1d. per lb. on fruit exported in compliance with the Government's requirements as to grading, &c.
For the purpose of the proper control of the fruit industry the Fruit Control Act was passed in the session of 1924, Part I of the Act provides for a Dominion Fruit-export Control Board, to have power of control of all fruit intended for export, while Part II provides for local boards to have control over fruit intended for local consumption. Neither part was to come into operation until a proposal to that effect was carried at a poll of the producers.
Polls taken in December, 1924, resulted in the provisions of Part I being carried by a majority of 151 rotes, Otago Provincial District being, however, excluded from the operation of the control on account of a petition to that effect having been signed by 70 per cent. of the producers in that district. The proposal with respect to provincial control of fruit intended for sale in New Zealand was negatived in each provincial district. A voluntary local Control Board was, however, established in the Nelson District in the 1924–25 season.
The Department of Agriculture assists orchardists by supplying information on fruitgrowing generally, and as to the most up-to-date methods to adopt for the control of diseases and insect pests, pruning, &c. Practical demonstrations of pruning, spraying, and the grading and packing of fruit are given regularly by the Orchard Instructors attached to the Department.
Extensive experiments have been carried out in the growing of tomatoes and the control of diseases affecting them, many thousands of pounds having been lost through failure of the tomato crops grown under glass during the last few years. The results of these experiments have proved of great value, and have enabled growers to adopt successful methods for the production of large and profitable crops. There are approximately 880 glasshouses in the Dominion used for the production of tomatoes, table grapes, &c.
The total acreage in vineyards outside of borough boundaries is 261 acres. The growing of outdoor grapes is chiefly confined to the districts situated between the North Cape and Hawke's Bay. The greater portion of the crop is used for wine-making, but a considerable quantity of outdoor-grown grapes is sold for table use.
Since 1913 the State has had authority to borrow money for the purpose of making advances for the establishment of cold stores for fruit and of fruit-canning works, and otherwise for the assistance of the fruitgrowing industry.
The Orchard-tax Act, 1916, provided for the levying, in each year from 1916 to 1921, of a tax of 1s. per acre on commercial orchards (with a minimum of 2s. 6d.), the proceeds to be paid over to the New Zealand Fruitgrowers' Federation and to be expended in aid of the fruitgrowing industry. The operation of the Act was extended for a further period of five years by the Orchard-tax Amendment Act, 1921. Registrations of commercial orchards during 1925 numbered 6,637, the amount of £1,502 being collected in orchard tax.
New Zealand is essentially suited for grazing purposes. Wherever there is light and moisture English grasses thrive when the natural bush and fern are cleared off, and, from the mildness of the winter season, there are few places where there is not some growth even in the coldest months of the year, enabling stock to winter on the pastures.
Sown-grass land, as might be expected, heads the list of cultivations. At the beginning of the year 1926 there were 16,615,960 acres under artificial (pasture) grasses. Seeds for sowing pasture lands are used much as in Great Britain.
In addition to the artificially sown pastures, the returns for 1925–26 show that 14,298,618 acres in tussock or native grass belonged to the occupied holdings, and were available for stock-feeding by the sheep and cattle farmers.
THE numbers of live-stock of various kinds at each of the last five annual enumerations are as shown in the following table. With the exception of the figures for sheep as disclosed by the special annual collection of sheep returns as at the 30th April, the figures relate to the 31st January.
| — | 1922. | 1923. | 1924. | 1625. | 1926. |
|---|---|---|---|---|---|
| Horses | 332,105 | 330,818 | 330,430 | 326,830 | 314,867 |
| Asses and mules | 286 | 205 | 148 | 190 | 161 |
| Dairy cows | 1,137,055 | 1,248,643 | 1,312,588 | 1,323,432 | 1,303,856 |
| Cattle (including dairy cows) | 3,323,223 | 3,480,694 | 3,563,497 | 3,503,744 | 3,452,486 |
| Sheep shorn during season | 21,100,550 | 20,420,119 | 21,077,684 | 22,335,528 | 22,686,200 |
| Lambs tailed during season | 10,267,550 | 10,895,521 | 11,133,336 | 11,467,147 | 11,435,780 |
| Sheep (including lambs) as at 30th April | 22,222,259 | 23,081,439 | 23,775,776 | 24,547,955 | 24,904,993 |
| Pigs | 384,333 | 400,889 | 414,271 | 440,115 | 472,534 |
| Goats— | |||||
| Angora | 5,904 | 4,338 | 5,579 | 5,696 | 4,945 |
| Other | 11,576 | 12,733 | 12,617 | 13,279 | 16,816 |
The following table gives the number of the principal kinds of live-stock in Australia and New Zealand for the year 1924–25:—
| State. | As at | Sheep. | Cattle. | Horses. | Pigs. |
|---|---|---|---|---|---|
*Sheep, 30th April, 1925; others, 31st January, 1925, | |||||
| New South Wales | 30 June, 1925 | 46,934,210 | 2,871,196 | 646,110 | 339,378 |
| Victoria | 31 Dec., 1924 | 12,649,898 | 1,605,554 | 473,236 | 288,509 |
| Queensland | 31 Dec., 1924 | 19,028,252 | 6,454,653 | 659,023 | 156,163 |
| South Australia | 31 Dec., 1924 | 6,359,240 | 400,423 | 255,022 | 80,988 |
| Western Australia | 31 Dec., 1924 | 6,396,564 | 891,564 | 175,116 | 66,375 |
| Tasmania | 31 Dec., 1924 | 1,614,085 | 225,740 | 37,091 | 47,305 |
| Northern Territory | 31 Dec., 1924 | 6,914 | 855,285 | 45,059 | 1,000 |
| Federal Capital Territory | 30 June,1925 | 165,790 | 5,058 | 1,393 | 1,393 |
| Totals for Commonwealth | 93,154,953 | 13,309,473 | 13,309,473 | 2,292,050 | 980,009 |
| New Zealand | * | 24,547,955 | 3,503,744 | 326,830 | 440,115 |
The following diagram will give an idea of the large increase in the number of sheep, cattle, horses, and pigs in New Zealand since 1858:—
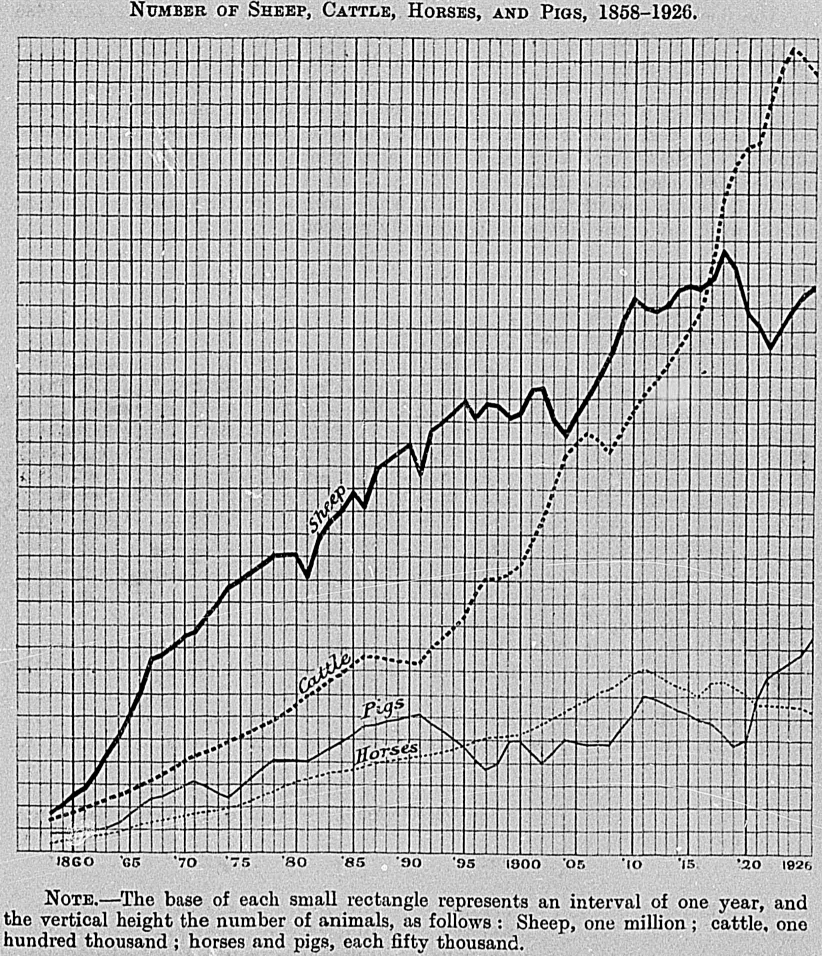
NOTE.—The base of each small rectangle represents an interval of one year, and the vertical height the number of animals, as follows: Sheep, one million; cattle, one hundred thousand; horses and pigs, each fifty thousand.
The Dominion is eminently suited for sheep-breeding, practically every description of sheep finding a favourable local habitat. In the hilly and down country of the South Island the Merino has been bred for very many years, and was the original sheep depastured. In fact, the Merino ewe furnished the foundation of the crossbred stock which has made Canterbury mutton famous on British meat-markets. In the early days of the Canterbury meat trade the English Leicester of the original type was the favourite ram for putting to the Merino ewe. Of later years the Lincoln has been largely employed to cross with the Merino, and black-faced rams have been further employed to put to the crossbred ewes. Systematic inbreeding of Merino-longwool half-bred sheep produced the now world-known Corriedale breed. In the North Island the Romney sheep, which suits the rather moist climate of this portion of the Dominion, has become the most popular sheep; it is also increasing in numbers in the South Island. The Lincoln and the Border Leicester are also favoured in both Islands, while the Southdown is taking the lead for fat-lamb production throughout the Dominion.
The flocks of the North Island increased from 5,285,907 sheep in the year 1886 to 10,009,731 in 1906 and 13,880,799 in 1916, or at the rate of 89 per cent. in the first twenty years of the period, and of 38 ½ per cant. between 1906 and 1916; but subsequent to 1918 there was a decrease, which was not broken till 1923.
The number of sheep in the South Island has fluctuated considerably, decreases from previous years having lately been more numerous than increases. The greatest number (11,780,024) was attained in 1918, after which year a steady decrease was recorded until checked in 1923.
Both Islands and the Dominion as a whole had a greater number of sheep in 1926 than in any of the six years immediately preceding.
| Year. | North Island. | South Island. | Total. |
|---|---|---|---|
| 1917 | 14,567,128 | 10,703,258 | 25,270,386 |
| 1918 | 14,758,278 | 11,780,024 | 26,538,302 |
| 1919 | 14,211,944 | 11,616,610 | 25,828,554 |
| 1920 | 13,166,750 | 10,753,220 | 23,919,970 |
| 1921 | 12,774,323 | 10,510,708 | 23,285,031 |
| 1922 | 12,095,805 | 10,126,454 | 22,222,259 |
| 1923 | 12,809,663 | 10,271,776 | 23,081,439 |
| 1924 | 13,478,717 | 10,297,059 | 23,775,776 |
| 1925 | 13,719,541 | 10,828,414 | 24,547,955 |
| 1926 | 13,830,250 | 11,074,743 | 24,904,993 |
In the table given above the Chatham Islands are included in the South Island, as they form portion of the Canterbury-Kaikoura Sheep District. In dealing with land districts, however, they are included with Wellington.
The following table shows the number of sheep and of breeding-ewes in the Dominion on the 30th April, 1925 and 1926. It will be noted that of the land districts Wellington had the most sheep in 1926, followed by Canterbury, Otago, Gisborne, and Hawke's Bay, in that order. Although a substantial increase is shown in the aggregate, six land districts showed decreases in 1926 when compared with 1925.
| Land District. | Sheep on 30th April, | Breeding-ewes on 30th April, | ||
|---|---|---|---|---|
| 1925. | 1926. | 1925. | 1926. | |
| North Auckland | 774,793 | 818,202 | 429,504 | 439,502 |
| Auckland | 883,760 | 1,010,809 | 498,681 | 559,826 |
| Gisborne | 3,055,726 | 2,976,255 | 1,619,472 | 1,582,521 |
| Hawke's Bay | 2,950,796 | 2,916,689 | 1,646,267 | 1,600,556 |
| Taranaki | 786,673 | 787,077 | 399,192 | 415,134 |
| Wellington | 5,353,749 | 5,408,119 | 2,908,230 | 2,944,683 |
| Nelson | 425,050 | 422,459 | 233,009 | 228,278 |
| Marlborough | 1,041,406 | 1,040,063 | 537,681 | 540,849 |
| Westland | 63,580 | 63,137 | 41,613 | 40,497 |
| Canterbury | 4,719,959 | 4,711,837 | 2,881,191 | 2,922,753 |
| Otago | 3,021,932 | 3,121,881 | 1,621,349 | 1,689,988 |
| Southland | 1,470,531 | 1,628,465 | 899,034 | 983,665 |
| Totals | 24,547,955 | 24,904,993 | 13,715,223 | 13,948,252 |
Another increase in the number of breeding-ewes was recorded, the number as at 30th April, 1926, being 13,948,252, as against 13,715,223 in 1925. The number of rams (stud and flock) in the Dominion on the 30th April, 1926, was 370,535, as against 355,579 in 1925, an increase of 14,956.
The following table shows the number of rams, wethers, breeding-ewes, dry ewes, and lambs in the Dominion for the last five years;—
| Year. | Rams. | Wethers. | Breeding Ewes. | Dry Ewes. | Lambs. | Totals. |
|---|---|---|---|---|---|---|
| Stud Sheep (entered in Flock-book). | ||||||
| 1922 | 12,388 | .. | 154,277 | 7,259 | 98,221 | 272,145 |
| 1923 | 10,862 | .. | 172,843 | 9,013 | 119,749 | 312,467 |
| 1924 | 12,008 | .. | 179,533 | 9,727 | 132,137 | 333,405 |
| 1925 | 12,400 | .. | 184,744 | 7,867 | 131,485 | 336,496 |
| 1926 | 13,808 | .. | 192,055 | 10,053 | 138,526 | 354,442 |
| Sheep of a distinctive breed but not entered in Flock-book. | ||||||
| 1922 | 309,684 | 857,790 | 2,774,661 | 202,240 | 1,316,568 | 5,460,943 |
| 1923 | 319,193 | 926,581 | 3,282,709 | 199,711 | 1,624,962 | 6,353,156 |
| 1924 | 320,806 | 933,040 | 3,207,733 | 218,412 | 1,633,188 | 6,313,179 |
| 1925 | 343,179 | 982,631 | 3,295,240 | 204,864 | 1,695,955 | 6,521.869 |
| 1926 | 356,727 | 1,008,783 | 3,153,805 | 232,363 | 1,492,959 | 6,244,637 |
| Crossbred and other Sheep not otherwise enumerated. | ||||||
| 1922 | 1,869,834 | 9,567,116 | 750,549 | 4,301,672 | 16,489,171 | |
| 1923 | 1,625,046 | 9,607,451 | 609,208 | 4,574,111 | 16,415,816 | |
| 1924 | 1,873,992 | 9,688,828 | 818,311 | 4,748,061 | 17,129,192 | |
| 1925 | 2,081,032 | 10,235,239 | 671,035 | 4,702,284 | 17,689,590 | |
| 1926 | 2,203,652 | 10,602,392 | 837,319 | 4,662,551 | 18,305,914 | |
| Totals. | ||||||
| 1922 | 322,072 | 2,727,624 | 12,496,054 | 960,048 | 5,716,461 | 22,222,259 |
| 1923 | 330,055 | 2,551,627 | 13,063,003 | 817,932 | 6,318,822 | 23,081,439 |
| 1924 | 332,814 | 2,807,032 | 13,076,094 | 1,046,450 | 6,513,386 | 23,775,776 |
| 1925 | 355,579 | 3,063,663 | 13,715,223 | 883,766 | 6,529,724 | 24,547,955 |
| 1926 | 370,535 | 3,212,435 | 13,948,252 | 1,079,735 | 6,294,036 | 24,904,893 |
The number of breeding-ewes has varied considerably from time to time, the maximum having been attained in 1926. The number of dry ewes on 30th April, 1926, was 1,079,735, being a increase of 195,969 compared with the previous year.
The number of lambs returned in 1922 was the smallest since 1906, but a recovery was made in 1923, the total for that year being on a par with that recorded for 1920, while further increases were shown by the figures for 1924 and 1925, followed however by a fall in 1926.
In sympathy with the increase in sheep in 1926, the number of flocks has increased almost proportionately, as is shown by the following table:—
| NUMBER OF FLOCKS. | |||||
|---|---|---|---|---|---|
| Size of Flocks. | 1922. | 1923. | 1924. | 1925. | 1926. |
| Under 500 | 13,067 | 12,118 | 11,927 | 11,953 | 12,332 |
| 500 and under 1,000 | 4,803 | 5,017 | 5,071 | 5,461 | 5,732 |
| 1,000 ,, 2,500 | 4,047 | 4,233 | 4,393 | 4,637 | 4,858 |
| 2,500 ,, 5,000 | 1,233 | 1,335 | 1,356 | 1,399 | 1,452 |
| 5,000 ,, 10,000 | 492 | 515 | 522 | 536 | 532 |
| 10,000 ,, 20,000 | 139 | 130 | 128 | 138 | 120 |
| 20,000 and upwards | 19 | 25 | 26 | 22 | 19 |
| Totals (all flocks) | 23,800 | 23,373 | 23,423 | 24,146 | 25,045 |
The average size of the flocks is found to have been 934 sheep in 1922, 988 in 1923, 1,015 in 1924, 1,017 in 1925, and 994 in 1926.
The numbers of the different classes composing the flocks in April, 1926, were as follows:—
| — | North Island. | South Wand. | Total in Dominion. |
|---|---|---|---|
| Stud sheep (entered in Flock-book)— | |||
| Merino | 23 | 30,411 | 30,434 |
| Lincoln | 12,190 | 1,593 | 13,783 |
| Romney | 111,462 | 49,307 | 160,769 |
| Border Leicester | 798 | 22,991 | 23,789 |
| English Leicester | 1,803 | 18,283 | 20,086 |
| Shropshire | 1,430 | 4,168 | 5,598 |
| Southdown | 32,573 | 14,191 | 46,764 |
| Corrindale | 1,377 | 44,591 | 45,968 |
| Other breeds | 1,469 | 5,782 | 7,251 |
| Totals | 163,125 | 191,317 | 354,442 |
| Sheep of a distinctive breed, but not entered in Flock-book— | |||
| Merino | 26,964 | 917,431 | 944,395 |
| Lincoln | 74,226 | 27,956 | 102,182 |
| Romney | 2,319,813 | 566,613 | 2,886,426 |
| Border Leicester | 11,028 | 80,019 | 91,047 |
| English Leicester | 4,216 | 54,625 | 58,841 |
| Shropshire | 6,413 | 8,128 | 14,541 |
| Southdown | 58,148 | 22,684 | 80,832 |
| Corriedale | 50,787 | 806,453 | 857,240 |
| Half-bred | 21,614 | 1,172,345 | 1,193,959 |
| Other breeds | 3,301 | 11,873 | 15,174 |
| Totals | 2,576,510 | 3,668,127 | 6,244,637 |
| Flock sheep— | |||
| Crossbreds and others not otherwise enumerated | 11,090,615 | 7,215,299 | 18,305,914 |
| Grand totals | 13,830,250 | 11,074,743 | 24,904,993 |
The most recent statistics (30th April, 1926) show that the Romney is still the predominating breed in all land districts with the exception of Marlborough, Canterbury, and Otago, where half-breds occupy the premier position.
The number of sheep in the Australian States and in New Zealand at enumerations corresponding approximately to the end of the years 1905, 1910, 1915, 1920, and 1924 was as follows:—
| — | 1905. | 1910. | 1915. | 1920. | 1924. |
|---|---|---|---|---|---|
* Includes Federal Capital Territory. † Includes Northern Territory. | |||||
| Queensland | 12,535,231 | 20,331,838 | 15,950,154 | 17,404,840 | 19,028,252 |
| New South Wales | *39,506,764 | *45,560,969 | 32,874,359 | 33,691,838 | 46,934,210 |
| Victoria | 11,455,115 | 12,882,665 | 10,545,632 | 12,171,084 | 12,649,898 |
| South Australia | †6,339,542 | †6,324,717 | †3,744,747 | †6,366,006 | †6,366,154 |
| Western Australia | 3,120,703 | 5,158,516 | 4,831,727 | 6,532,965 | 6,396,564 |
| Tasmania | 1,583,561 | 1,788,310 | 1,624,450 | 1,570,832 | 1,614,085 |
| Federal Territory | .. | .. | 134,679 | 159,990 | 165,790 |
| New Zealand | 19,130,875 | 23,996,126 | 24,788,150 | 23,285,031 | 24,547,955 |
| Totals | 93,671,791 | 116,043,141 | 94,493,898 | 101,182,586 | 117,702,908 |
The following figures, compiled partly from “The Statesman's Year-book” (1926 edition), partly from various publications of the International Institute of Agriculture, and partly from other sources, give some idea of the sheep flocks in the principal countries in respect of which the information is available:—
| Country. | Number of Sheep. |
|---|---|
* Union of Soviet Republics excluding Turkestan and Transcaucasia. † Including goats. | |
| Australia (1924–25) | 93,154,953 |
| Russia, Soviet (1925) | 82,865,600* |
| United States (1926) | 41,003,000 |
| South African Union (1924) | 32,002,848 |
| Argentine Republic (1922) | 30,671,841 |
| New Zealand (1926) | 24,904,993 |
| British India (1923–24) | 22,340,000 |
| Spain (1924) | 18,459,627 |
| England and Wales (1925) | 15,974,400 |
| Uruguay (1924) | 14,443,341 |
| Rumania (1925) | 12,950,212 |
| Italy (1921) | 12,060,000 |
| Turkey (1923) | 11,913,703† |
| France (1925) | 10,537,020 |
| Ukraine (1925) | 9,300,000 |
| Bulgaria (1920) | 8,922,604 |
| Sudan, Anglo-Egyptian (1924) | 8,214,585 |
| Morocco, French (1923–24) | 8,214,000 |
| Brazil (1920) | 7,933,437 |
| Jugo-Slavia (1925) | 7,906,808 |
| Scotland (1925) | 7,118,820 |
| Greece (1925) | 6,000,000 |
| Algeria (1923) | 5,396,557 |
| Germany (1925) | 4,741,897 |
| Chile (1923) | 4,569,166 |
| Portugal (1920) | 3,850,733 |
| Irish Free State (1924) | 3,127,921 |
| Canada (1925) | 2,755,556 |
| Poland (1921) | 2,178,216 |
| Sudan, French (1921) | 2,029,550 |
| Hungary (1925) | 1,890,511 |
| Mexico (1924) | 1,728,216 |
| Sweden (1920) | 1,568,000 |
| Norway (1925) | 1.528,819 |
| Finland (1924) | 1,484,529 |
| Lithuania (1924) | 1,399,000t |
| Tunis (1924) | 1,378,840 |
| Latvia (1925) | 1,181,600 |
| Egypt (1924) | 1,084,703 |
Wool obtained from sheep shorn during the season 1925–26 amounted to 167,373,260 lb., while lambs yielded 6,029,504 lb. The following table shows the amount of wool produced in each land district in the Dominion during the seasons 1924–25 and 1925–26.
| WOOL PRODUCED, 1924–25 AND 1925–26. | ||||
|---|---|---|---|---|
| Land District. | Wool obtained during Season 1924–25 from | Wool obtained during Season 1925–26 from | ||
| Sheep. | Lambs. | Sheep. | Lambs. | |
| lb. | lb. | lb. | lb. | |
| North Auckland | 5,225,451 | 358,699 | 5,229,765 | 257,939 |
| Auckland | 6,388,384 | 451,234 | 6,857,048 | 486,609 |
| Gisborne | 23,888,540 | 1,710,861 | 20,738,512 | 1,468,706 |
| Hawke's Bay | 24,729,478 | 888,861 | 22,179,197 | 812,631 |
| Taranaki | 6,284,452 | 521,933 | 6,030,835 | 484,397 |
| Wellington | 44,212,679 | 2,691,628 | 41,268,467 | 2,442,759 |
| Nelson | 2,323,788 | 37,141 | 2,152,840 | 16,861 |
| Marlborough | 7,497,370 | 91,887 | 7,107,212 | 28,635 |
| Westland | 340,061 | 7,687 | 348,907 | 6,390 |
| Canterbury | 29,165,063 | 32,024 | 27,621,286 | 19,129 |
| Otago | 18,709,512 | 1,468 | 18,534,430 | 4,898 |
| Southland | 9,269,834 | 2,510 | 9,304,761 | 550 |
| Totals | 178,034,612 | 6,795,933 | 167,373,260 | 6,029,504 |
It should be noted that these figures cover only sheep shorn by farmers. Wool obtained by the various freezing companies from sheep slaughtered is not covered by this inquiry.
The following table gives the average weight of fleece for each land district in each of the last five years:—
| AVERAGE WEIGHT OF FLEECE, 1921–22 TO 1925–26. | |||||
|---|---|---|---|---|---|
| Land District. | 1921–22. | 1922–23. | 1923–24. | 1924–25. | 1925–26. |
| lb. | lb. | lb. | lb. | lb. | |
| North Auckland | 7.11 | 7.27 | 7.10 | 7.29 | 6.82 |
| Auckland | 6.88 | 7.33 | 7.12 | 7.27 | 6.99 |
| Gisborne | 7.95 | 8.08 | 7.92 | 8.17 | 7.31 |
| Hawke's Bay | 8.48 | 8.17 | 903 | 8.10 | |
| Taranaki | 7.34 | 7.77 | 7.63 | 7.86 | 7.41 |
| Wellington | 8.09 | 8.47 | 8.32 | 8.82 | 8.07 |
| Nelson | 5.60 | 5.80 | 5.85 | 6.35 | 5.89 |
| Marlborough | 7.13 | 7.32 | 7.60 | 7.91 | 7.39 |
| Westland | 5.63 | 5.66 | 6.23 | 610 | 6.03 |
| Canterbury | 6.92 | 7.24 | 7.14 | 7.42 | 6.87 |
| Otago | 6.80 | 7.18 | 6.79 | 7.29 | 7.05 |
| Southland | 643 | 6.58 | 6.62 | 6.77 | 6.65 |
| Dominion | 7.39 | 7.72 | 7.57 | 7.98 | 7.38 |
The approximate annual production of wool for the last twenty years available, taking the exports for the twelve months immediately preceding the commencement, of shearing and adding thereto the quantity used in the Dominion for manufacturing purposes, is shown in the next table, but no addition has been made for wool on sheep-skins exported, nor for loss in scouring and washing.
| Year ended 30th September. | Quantity exported. | Quantity purchased by Local Mills. | Total. |
|---|---|---|---|
| lb. | lb. | lb. | |
| 1907 | 164,006,579 | 4,116,722 | 168,123,301 |
| 1908 | 163,930,722 | 4,779,198 | 168,709,920 |
| 1909 | 187,619,181 | 5,202,821 | 192,822,002 |
| 1910 | 194,472,934 | 5,642,113 | 200,115,047 |
| 1911 | 184,854,149 | 6,048,164 | 190,902,313 |
| 1912 | 189,553,723 | 6,284,114 | 195,837,837 |
| 1913 | 195,353,533 | 6,823,545 | 202,177,078 |
| 1914 | 196,499,896 | 6,846,960 | 203,346,856 |
| 1915 | 208,908,118 | 6,628,019 | 215,536,137 |
| 1916 | 200,119,016 | 8,772,467 | 208,891,483 |
| 1917 | 162,043,634 | 7,590,445 | 169,634,079 |
| 1918 | 110,054,315 | 7,488,932 | 117,543,247 |
| 1919 | 258,363,524 | 6,720,400 | 265,083,924 |
| 1920 | 165,821,508 | 8,599,212 | 174,420,720 |
| 1921 | 174,950,190 | 5,307,495 | 180,257,685 |
| 1922 | 325,256,613 | 8,483,140 | 333,739,753 |
| 1923 | 214,845,027 | 9,170,697 | 224,015,724 |
| 1924 | 210,582,999 | 7,786,337 | 218,369,336 |
| 1925 | 195,394,999 | 5,141,473 | 200,536,472 |
| 1926 | 218,272,768 | 5,611,711 | 223,884,479 |
The following summary is interesting as showing the various classes of wool purchased by the New Zealand mills. For 1925–26 greasy wool represents 98 ½ per cent. of the total.
| — | Merino. | Half-bred. | Crossbred. | Total. |
|---|---|---|---|---|
| lb. | lb. | lb. | lb. | |
| Greasy | 986,098 | 2,765,889 | 1,786,408 | 5,538,395 |
| Washed | .. | .. | 7,117 | 7,117 |
| Scoured | 25,413 | .. | .. | 25,413 |
| Sliped | 15,973 | 3,427 | 21,386 | 40,786 |
| Totals, 1925–26 | 1,027,484 | 2,769,316 | 1,814,911 | 5,611,711 |
| Totals, 1924–25 | 878,320 | 2,156,173 | 2,106,980 | 5,141,473 |
The percentages of greasy, scoured, and washed wool to the total quantities exported during the last ten calendar years are—
| Year. | Greasy. | Scoured and Sliped. | Washed. |
|---|---|---|---|
| Per Cent. | Per Cent. | Per Cent. | |
| 1916 | 79.27 | 20.24 | 0.49 |
| 1917 | 81.77 | 18.07 | 0.16 |
| 1918 | 77.92 | 21.21 | 0.87 |
| 1919 | 71.78 | 28.07 | 0.15 |
| 1920 | 65.53 | 34.29 | 0.18 |
| 1921 | 74.50 | 25.42 | 0.08 |
| 1922 | 70.95 | 28.96 | 0.09 |
| 1923 | 76.01 | 23.89 | 0.10 |
| 1924 | 78.58 | 21.30 | 0.12 |
| 1925 | 80.70 | 19.23 | 0.07 |
The following diagram shows the increase in the weight of wool exported since 1882, also the great expansion of the frozen-meat trade in the same period. The decrease during the war period is attributable to lack of shipping facilities.
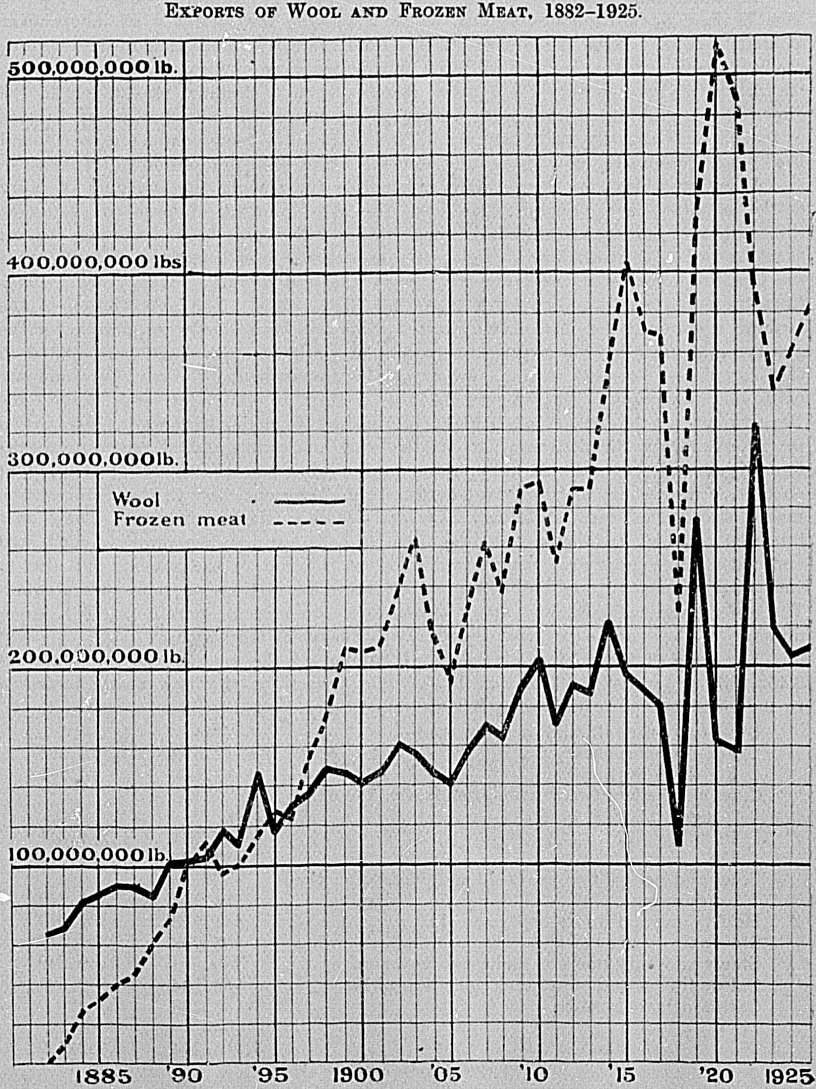
Most of the leading breeds of the cattle of Great Britain are represented in the Dominion by herds bred on sound lines, though the development of the beef breeds in later years has received a check owing to the advance taking place in dairying operations. There are still very many fine Shorthorn herds of the beef type, while Hereford and Aberdeen-Angus cattle are also largely bred. There are herd-books for each of these breeds.
The breeding of dairy cattle has made great progress in recent years. Herd-book societies are established for the Jersey, Friesian, Ayrshire, Milking Shorthorn, and Red Poll breeds. The various societies have heartily co-operated in a scheme for establishing registers of merit in connection with the certificate-of-record testing of purebred dairy cattle, thus giving a great fillip to the breeding of purebred dairy stock. The dairy-farmer is encouraged to use purebred bulls and thereby to assist materially in raising the standard of the dairy stock of the country. He is now coming to appreciate the value of herd- testing work, and thus, knowing the really profitable cows in his herd, will be anxious to secure a bull which will enable them to perpetuate their good qualities.
An important factor responsible for the improved position of dairy cattle in New Zealand is the milking-machine, which is making the farmer more independent of hired labour. With the higher price of land there is a gradual tendency towards smaller farms and the keeping of fewer but better cows. Also, there is a growing realization of the necessity for a more liberal system of feeding, particularly in the direction of growing special fodder crops to maintain the milk-flow at all seasons of the year. Generally, dairy-farming in New Zealand is being conducted on a sound basis, and the industry now ranks fully with meat and wool production in importance.
A policy which has been partly responsible for placing the breeding of dairy cattle on up-to-date principles has been the establishment of purebred herds at three of the State experimental farms, where they are bred according to an exact record of performance. High-priced stock have been imported in order that the foundation herds at the farms may be of the best quality. The yearling bulls from these State milk-record herds command high values. The appreciation of the farming community for this officially tested stock has been chiefly responsible for the gratifying manner in which private breeders of pedigree stock have participated in the certificate-of-record testing system of the Department of Agriculture and the herd-book societies. With regard to the testing of dairy-farmers' herds, the Department in the season of 1910–11 established a model herd-testing association in the Wairarapa district, carrying out the work of testing and of recording results free of all charge to the farmers taking part. This had the effect of creating at once wide interest in the important herd-testing movement, and the following season model associations were established in several leading dairying districts. These were intended not only to demonstrate the value of herd-testing when properly conducted and with full comparative records published at the end of the season, but also to encourage farmers to establish co-operative testing associations on their own account. The object was achieved, and many associations are now in operation. The larger number of these are supervised by the Department of Agriculture.
The total number of cattle in the Dominion at the enumeration of 1926 was 3,452,486, as against 3,503,744 in 1925. The figures for the two years, according to the classification in use, are as follows:—
| Bulls two years old and over, for stud— | 1925. | 1926. |
|---|---|---|
* Included under headings above. | ||
| For beef purposes | 12,679 | 12,908 |
| For dairy purposes | 47,141 | 45,945 |
| Cows and heifers two years old and over, for dairying— | ||
| In milk | 1,178,504 | 1,181,441 |
| Dry | 124,625 | 122,415 |
| Cows and heifers two years old and over, other than for dairying | 518,284 | 535,273 |
| Heifers one and under two years old | 441,510 | 401,013 |
| Steers two years old and over | 405,768 | 394,547 |
| Steers and bulls one and under two years old | 189,801 | 169,249 |
| Calves (heifer and steer) under one year old | 552,164 | 589,695 |
| Cattle in boroughs, &c. | 33,268 | * |
| Totals | 3,503,744 | 3,452,486 |
Out of a total of 3,452,486 cattle in 1926, the North Island had 2,824,204, or 81.80 per cent., while the South Island had 628,282, or 18.20 per cent. The figures for each land district were—
| Land District. | Number. |
|---|---|
| North Auckland | 477,098 |
| Auckland | 705,656 |
| Gisborne | 339,447 |
| Hawke's Bay | 246,427 |
| Taranaki | 374,184 |
| Wellington | 681,392 |
| Nelson | 65,692 |
| Marlborough | 45,681 |
| Westland | 42,207 |
| Canterbury | 187,054 |
| Otago | 128,773 |
| Southland | 158,875 |
| Total | 3,452,486 |
The total number of dairy cows and heifers intended for dairying was 1,303,856, and of this number the North Island had 1,026,389, or 78.72 per cent., and the South Island 277,467, or 21.28 per cent.
In connection with the enumeration of live-stock in 1924 information was collected as to breeds of cattle, horses, and pigs, in addition to the usual details of age, sex, &c. A summary of the results of this enumeration as regards cattle is given below:—
| TABLE SHOWING DETAILS OF CATTLE IN THE DOMINION ON 31ST JANUARY, 1924, CLASSIFIED AOCOEDING TO BREED, SEX, AND AGE. (EXCLUDING BOROUGHS.) | |||||||
|---|---|---|---|---|---|---|---|
| Breed. | Bulls Two Years Old and over for Breeding only. | Cows and Heifers Two Years Old and over. | Heifers One and under Two Years Old. | Steers Two Years Old and over. | Steers and Bulls One and under Two Years Old. | Calves (Heifer and Steer) under One Year Old. | Total Cattle. |
| Purebred— | |||||||
| Jersey | 6,458 | 10,336 | 3,048 | 2,983 | 1,763 | 3,966 | 28,554 |
| Guernsey | 6 | 14 | 6 | .. | .. | 10 | 36 |
| Alderney | 1 | .. | .. | .. | 1 | .. | 2 |
| Friesian | 1,533 | 3,675 | 1,203 | 126 | 262 | 1,378 | 8,177 |
| Ayrshire | 477 | 2,082 | 551 | 29 | 105 | 588 | 3,832 |
| Red Poll | 136 | 485 | 132 | 9 | 48 | 244 | 1,054 |
| Shorthorn (including Milking Shorthorns) | 1,219 | 3,995 | 786 | 33 | 158 | 1,097 | 7,288 |
| Hereford | 467 | 1,994 | 453 | 242 | 245 | 833 | 4,234 |
| Polled Angus | 572 | 2,011 | 448 | 32 | 381 | 851 | 4,295 |
| Other purebred-cattle | 2 | .. | .. | 14 | .. | .. | 16 |
| Crossbred with predominating strain of— | |||||||
| Jersey and other Channel Island breeds | 18,855 | 539,636 | 135,375 | 7,888 | 6,946 | 174,370 | 883,070 |
| Friesian | 4,837 | 159,076 | 35,929 | 19,724 | 8,971 | 46,731 | 275,268 |
| Ayrshire | 983 | 34,041 | 6,150 | 1,820 | 943 | 7,460 | 51,397 |
| Milking Shorthorn | 8,481 | 489,727 | 101,821 | 30,420 | 20,181 | 124,061 | 774,691 |
| Red Poll | 316 | 1,773 | 654 | 406 | 225 | 1,039 | 4,413 |
| Other dairy breeds (including unspecified) | 16 | 3,946 | 581 | 430 | 164 | 831 | 5,968 |
| Shorthorn | 6,498 | 231,577 | 66,154 | 195,781 | 66,055 | 100,422 | 666,487 |
| Hereford | 4,750 | 183,768 | 53,113 | 118,820 | 53,085 | 100,992 | 514,528 |
| Polled Angus | 3,262 | 108,137 | 30,483 | 51,874 | 28,960 | 63,225 | 285,941 |
| Devon | 62 | 723 | 185 | 322 | 151 | 475 | 1,918 |
| Other beef breeds (including unspecified) | 5 | 3,339 | 1,100 | 2,639 | 930 | 1,629 | 9,642 |
| Total, purebred | 10,871 | 24,592 | 6,627 | 3,468 | 2,963 | 8,967 | 57,488 |
| Total, crossbred | 48,065 | 1,755,743 | 431,545 | 430,124 | 186,611 | 621,235 | 3,473,323 |
| Dominion totals | 58,936 | 1,780,335 | 438,172 | 433,592 | 189,574 | 630,202 | 3,530,811 |
Such information as is available concerning cattle in the main countries of the world is appended hereto. Figures have been compiled mainly from “The Statesman's Year-book,” partly from various publications of the International Institute of Agriculture, and partly from other sources.
| Country. | Number of Cattle. |
|---|---|
* Union of Soviet Republics excluding Turkestan and Transcaucasia. † Tertib census. | |
| British India (1923–24) | 117,490,000 |
| United States (1926) | 64,020,000 |
| Russia, Soviet (1925) | *53,779,300 |
| Argentine Republic (1922) | 37,064,850 |
| Brazil (1920) | 34,271,324 |
| Germany (1925) | 17,182,724 |
| China (1921) | 16,000,000 |
| France (1925) | 14,372,980 |
| Australia (1924–25) | 13,309,473 |
| South African Union (1924) | 9,606,274 |
| Canada (1925) | 9,307,298 |
| Uruguay (1924) | 8,431,613 |
| Ukraine (1925) | 8,000,000 |
| Poland (1921) | 7,894,586 |
| Madagascar (1924) | 7,293,446 |
| Italy (1918) | 6,239,741 |
| England and Wales (1925) | 6,163,300 |
| Paraguay (1915) | 5,249,043 |
| Rumania (1925) | 5,049,078 |
| Cuba (1924) | 4,600,214 |
| Czecho-Slovakia (1921) | 4,376,765 |
| Irish Free State (1925) | 3,991,358 |
| Siam (1925) | 3,871,673 |
| Jugo-Slavia (1925) | 3,768,135 |
| Turkey (1923) | 3,551,449 |
| Japanese Empire (1923) | 3,505,630 |
| New Zealand (1926) | 3,452,486 |
| Spain (1924) | 3,436,129 |
| Denmark (1925) | 2,758,000 |
| Sweden (1921) | 2,736,000 |
| Mexico (1924) | 2,187,867 |
| Austria (1923) | 2,162,385 |
| Venezuela (1920) | 2,077,684 |
| Netherlands (1921) | 2,062,771 |
| Chile (1923) | 1,995,538 |
| Hungary (1925) | 1,920,026 |
| Bulgaria (1920) | 1,877,108 |
| Finland (1924) | 1,864,469 |
| Sudan, Anglo-Egyptian (1924) | †1,840,209 |
| Morocco, French (1923) | 1,840,000 |
| Belgium (1925) | 1,654,767 |
| Switzerland (1921) | 1,425,341 |
| Ceylon (1924) | 1,383,000 |
| Lithuania (1924) | 1,252,000 |
| Scotland (1925) | 1,204,791 |
| Norway (1925) | 1,150,617 |
| Sudan, French (1921) | 1,025,345 |
The Dairy Industry Act, 1908 (a consolidation of previous legislation), with its amendments of 1915, 1922, 1924, and 1926, provides for the appointment of Inspectors of dairy stock and factories or other places used for the manufacture of dairy-produce, and power is given to condemn or forbid their use, if necessary. The sale of unwholesome milk or other dairy-produce is prohibited, and provision is made for the inspection, grading, and shipping of all such produce exported. Butter containing less than 80 per cent. of butter-fat or more than 16 per cent. of water must not be exported. A national brand is provided for by regulations gazetted in August, 1926, This brand is to be placed on every package forwarded for export and containing creamery butter or factory cheese grading 90 points or over.
Provision is made for the framing of regulations for the registration of dairies, the licensing of persons carrying on the manufacture or sale of the produce, the registration of trade-marks or brands, and for inspection and grading. A fine not exceeding £50 may be inflicted for any offence under this part of the Act.
Milk or cream purchased for the manufacture of dairy-produce and paid for according to the percentage of butter-fat it contains, must have this percentage determined by the Babcock, Gerber, or other prescribed test. A certified statement of overrun must be furnished to each supplier, and provision is made for an independent investigation by the Audit Department where a supplier is dissatisfied with the statement received.
The Act also provides for the registration of co-operative dairy companies, and shareholders are protected in the event of certain contingencies. A dairy company must not include in its registered name the word “co-operative,” unless it is entitled to be registered as a co-operative dairy company under the Act.
The following table shows the number of factories registered under the Dairy Industry Act, together with the amount of butter and cheese forwarded for export and the number of suppliers to such factories.
The table establishes the fact that the popular description of Taranaki as the “butter” province is no longer justified, pride of place in this connection being easily taken by Auckland. Taranaki, however, forwarded for export in 1925–26 more than two and a half times the amount of cheese which was forwarded by her nearest competitor (Wellington). Taranaki comes second and Wellington third in batter-production. Disregarding dual-plant factories, the returns for the season 1925–26 indicated an average of 384.87 tons per factory for butter and 264.51 tons for cheese, while if dual-plant factories are included the averages are 26958 tons and 211.45 tons respectively.
| District. | Number of Factories. | Forwarded for Export, 1925–26. | Number of Suppliers. | ||||
|---|---|---|---|---|---|---|---|
| Butter. | Cheese. | Dual Plant. | Butter. | Cheese. | Butter. | Cheese.* | |
* Suppliers to dual-plant establishments included in this column only. | |||||||
| Tons. | Tons. | ||||||
| Auckland | 65 | 35 | 6 | 37,947 | 10,785 | 16,417 | 1,255 |
| Hawke's Bay | 14 | 16 | 3 | 2,629 | 3,146 | 3,775 | 554 |
| Taranaki | 20 | 73 | 37 | 7,736 | 31,953 | 3,150 | 3,397 |
| Wellington | 18 | 51 | 10 | 6,931 | 11,852 | 4,551 | 1,671 |
| Nelson | 6 | 4 | 1 | 1,052 | 499 | 1,144 | 444 |
| Marlborough | 4 | 2 | 4 | 676 | 718 | 769 | 212 |
| Westland | 9 | .. | 1 | 487 | 73 | 709 | 32 |
| Canterbury | 9 | 12 | 5 | 1,933 | 1,589 | 4,816 | 2,393 |
| Otago and Southland | 14 | 78 | 1 | 1,804 | 11,067 | 6,552 | 2,764 |
| Totals, 1925–26 | 159 | 271 | 68 | 61,195 | 71,682 | 41,883 | 12,722 |
| Totals, 1924–25 | 156 | 267 | 69 | 71,063 | 72,016 | 43,381 | 11,807 |
Returns of factory production showed that during the year ended 31st March, 1925, 1,624,333 cwt. of butter was produced by butter-factories in the Dominion. In addition to this, 27,933 cwt. of whey butter was manufactured. For the twelve months ended 31st January, 1925, 55,370 cwt. of butter was produced on holdings of 1 acre and over, followed by 55,011 cwt. for the year 1925–26.
Returns from cheese-factories give the quantity manufactured during the twelve months ended 31st March, 1925, as 1,436,541 cwt.
The total export of butter and cheese in the last twenty years, and the total quantity of each commodity sent to the United Kingdom, are tabulated below:—
| Calendar Year, | Total Export of Butter. | Butter exported to the United Kingdom. | Total Export of Cheese. | Cheese exported to the United Kingdom. |
|---|---|---|---|---|
| Cwt. | Cwt. | Cwt. | Cwt. | |
| 1906 | 320,225 | 306,739 | 131,206 | 129,321 |
| 1907 | 328,441 | 314,081 | 236,833 | 234,517 |
| 1908 | 229,971 | 211,242 | 280,798 | 276,212 |
| 1909 | 321,108 | 301,693 | 400,607 | 398,619 |
| 1910 | 356,535 | 345,400 | 451,915 | 449,167 |
| 1911 | 302,387 | 283,505 | 439,174 | 435,616 |
| 1912 | 378,117 | 316,857 | 577,070 | 572,562 |
| 1913 | 372,258 | 288,224 | 611,663 | 608,933 |
| 1914 | 434,067 | 361,381 | 863,776 | 859,986 |
| 1915 | 420,144 | 371,959 | 817,258 | 803,917 |
| 1916 | 358,632 | 336,412 | 949,416 | 942,773 |
| 1917 | 254,397 | 250,721 | 885,751 | 865,152 |
| 1918 | 431,023 | 415,250 | 883,445 | 844,198 |
| 1919 | 345,818 | 336,606 | 1,572,355 | 1,517,102 |
| 1920 | 312,009 | 282,679 | 1,222,070 | 1,220,409 |
| 1921 | 898,478 | 878,737 | 1,368,786 | 1,368,051 |
| 1922 | 1,120,200 | 1,081,512 | 1,161,196 | 1,160,285 |
| 1923 | 1,250,140 | 1,119,355 | 1,441,460 | 1,428,762 |
| 1924 | 1,269,455 | 1,174,894 | 1,594,486 | 1,585,635 |
| 1925 | 1,245,324 | 1,186,965 | 1,376,754 | 1,371,986 |
Exports of butter to countries other than the United Kingdom in 1925 include 19,236 cwt. to the United States, 11,419 cwt. to Hawaii, and 14,968 cwt. to Germany, besides smaller quantities to other countries.
The quantities of butter and cheese exported continued about equal till the year 1895. During the period 1896–1907 butter assumed the lead, reaching its maximum of comparative importance in 1903, in which year the export was nearly four times that of cheese. A remarkable rise then took place in the cheese exports, and the increase in the exports continued so rapidly that 1919 saw the quantity of cheese nearly five times that of butter. Cheese exports then declined slightly in volume, and butter made great strides, having more than trebled in four years, until in 1922 quantities of butter and cheese exported were about equal. Cheese, however, went to the fore again in 1923, and increased its lead still further in 1924, which year witnessed record shipments of both butter and cheese. On a value basis, of course, butter exports greatly exceed cheese, the figures for 1925 being £10,240,132 for butter and £5,800,808 for cheese.
Under the Dairy-produce Export Control Act, 1923, there has been established a Board consisting of two Government nominees, nine representatives of suppliers to dairy factories, and one person representing manufacturers of dairy-produce. A London agency of the Board has also been constituted, to consist of such number of persons as may be decided upon by the Board—but at least one person must be appointed by the Government, through the Director-General of Agriculture. Broadly defined, the duties of the Board are to control the export and sale of butter and cheese in the interests of the producers, while the London agency is required to keep the Board informed as to current prices and other matters relating to the disposal of New Zealand dairy-produce in England. The funds of the Board are to be derived from levies on butter and cheese exported, and by Gazette notice published on 14th February, 1924, a levy of 1/16d. on butter and 1/32d. on cheese exported after Saturday, 16th February, 1924, was imposed.
The operation of the Act was subject to veto by the majority of the dairy-producers of the Dominion as determined by popular vote, but the number of votes polled amounted to 22,284 for and 9,255 against the bringing of the Act into operation, there being thus a majority of 13,029 for the proposal.
Figures showing sheep and lambs slaughtered for food purposes during each of the last ten years, together with the exports of frozen mutton and lamb, are given in the tables following.
The balance between killings and exports represents an annual consumption of somewhat over 90 lb. of mutton and lamb per head of population, including Maoris.
| SHEEP. | ||||||
|---|---|---|---|---|---|---|
| Year. | Slaughterings. | Exports (including Pieces) during Twelve Months ended 31st March. | Balance for Home Consumption. | |||
| At Abattoirs and Slaughterhouses during Twelve Months ended 31st March. | On Farms during Twelve Months ended 31st January. | Total. | Number. | Approximate Weight. | ||
* Excess of exports over slaughterings during year. | ||||||
| Carcases. | Carcases. | Carcases. | Carcases. | Carcases. | Cwt. | |
| 1916–17 | 3,601,284 | 601,192 | 4,202,476 | 2,409,899 | 1,792,577 | 960,309 |
| 1917–18 | 3,631,344 | 596,917 | 4,228,261 | 2,150,505 | 2,077,756 | 1,113,084 |
| 1918–19 | 4,381,005 | 617,147 | 4,998,152 | 1,300,047 | 3,698,105 | 1,981,128 |
| 1919–20 | 5,512,482 | 671,136 | 6,183,618 | 4,127,853 | 2,055,765 | 1,101,303 |
| 1920–21 | 4,615,520 | 708,473 | 5,323,993 | 5,488,976 | -164,983* | -88,384* |
| 1921–22 | 4,127,226 | 769,198 | 4,896,424 | 3,340,548 | 1,555,876 | 833,505 |
| 1922–23 | 2,913,578 | 665,549 | 3,579,127 | 2,530,232 | 1,048,895 | 561,908 |
| 1923–24 | 2,774,043 | 590,616 | 3,364,659 | 1,719,437 | 1,645,222 | 881,369 |
| 1924–25 | 3,354,300 | 552,002 | 3,906,302 | 2,037,953 | 1,868,349 | 1,000,901 |
| 1925–26 | 3,026,127 | 543,859 | 3,569,986 | 2,058,083 | 1,511,903 | 809,948 |
| Totals for ten years | 37,936,909 | 6,316,089 | 44,252,998 | 27,163,533 | 17,089,465 | 9,155,071 |
| LAMBS. | ||||||
|---|---|---|---|---|---|---|
| Year. | Slaughterings. | Exports (including Pieces) during Twelve Months ended 31st March. | Balance for Home Consumption. | |||
| At Abattoirs and Slaughterhouses during Twelve Months ended 31st March. | On Farms during Twelve Months ended 31st January. | Total. | Number. | Approximate Weight. | ||
* Excess of exports over slaughterings during year. | ||||||
| Carcases. | Carcases. | Carcases. | Carcases. | Carcases. | Cwt. | |
| 1916–17 | 3,431,943 | 52,844 | 3,484,787 | 2,797,290 | 687,497 | 220,981 |
| 1917–18 | 2,695,443 | 48,438 | 2,743,881 | 2,048,612 | 695,269 | 223,479 |
| 1918–19 | 2,950,316 | 56,090 | 3,006,406 | 916,914 | 2,089,492 | 671,622 |
| 1919–20 | 3,280,601 | 57,529 | 3,338,130 | 3,420,220 | -82,090* | -26,386* |
| 1920–21 | 3,563,970 | 60,174 | 3,624,144 | 4,350,964 | -726,820* | -233,621* |
| 1921–22 | 5,085,269 | 68,916 | 5,154,185 | 4,842,545 | 311,640 | 100,170 |
| 1922–23 | 4,545,793 | 50,263 | 4,596,056 | 5,479,780 | -883,724* | -284,054* |
| 1923–24 | 5,226,850 | 47,328 | 5,274,178 | 5,076,429 | 197,749 | 63,562 |
| 1924–25 | 4,923,373 | 45,049 | 4,968,422 | 4,401,142 | 567,280 | 182,340 |
| 1925–26 | 5,160,941 | 45,380 | 5,206,321 | 4,736,519 | 469,802 | 151,008 |
| Totals for ten years | 40,864,499 | 532,011 | 141,396,510 | 38,070,415 | 3,326,095 | 1,069,101 |
The following table shows the number and approximate weight of cattle slaughtered for food purposes in each of the last ten years, together with the weight of beef exported:—
| Year. | Slaughterings. | Exports during Twelve Months ended 31st March. | Balance for Home Consumption: Approximate Weight. | |||
|---|---|---|---|---|---|---|
| At Abattoirs and Slaughterhouses during Twelve Months ended 31st March. | On Farms during Twelve Months ended 31st January. | Total. | Number. | Approximate Weight. | ||
| Carcases. | Carcases. | Carcases. | Cwt. | Cwt. | Cwt. | |
| 1916–17 | 385,129 | 3,922 | 389,051 | 2,778,936 | 1,008,689 | 1,770,247 |
| 1917–18 | 341,300 | 2,969 | 344,269 | 2,459,064 | 882,982 | 1,576,082 |
| 1918–19 | 355,357 | 2,961 | 358,318 | 2,559,414 | 804,512 | 1,754,902 |
| 1919–20 | 413,206 | 3,810 | 417,016 | 2,978,686 | 576,054 | 2,402,632 |
| 1920–21 | 366,565 | 4,098 | 370,663 | 2,647,593 | 810,322 | 1,837,271 |
| 1921–22 | 261,718 | 5,998 | 267,716 | 1,912,257 | 839,598 | 1,072,659 |
| 1922–23 | 348,399 | 11,053 | 359,452 | 2,567,514 | 613,597 | 1,953,917 |
| 1923–24 | 411,034 | 12,406 | 423,440 | 3,024,571 | 696,704 | 2,327,867 |
| 1924–25 | 488,138 | 12,541 | 500,679 | 3,576,279 | 597,304 | 2,978,975 |
| 1925–26 | 457,831 | 11,023 | 468,854 | 3,348,957 | 662,234 | 2,686,723 |
| Totals for ten years | 3,828,677 | 70,781 | 3,899,458 | 27,853,271 | 7,491,996 | 20,361,275 |
Under the Meat-export Control Act, 1921–22, there has been formed a Meat-producers Board consisting of eight members. Five of these members represent producers of meat for export, two are appointed by the Government, and one represents stock and station agents. Briefly, the objects of the Board are to control the export of meat in the interests of the producers.
Since its inauguration the Board has performed a great deal of work. Matters which have received attention have been marking of parcels, grading of meat, loading and discharging frozen produce, regulation of shipments, freights (rail and sea), and freezing charges, besides other matters of prime importance to the producers of meat for export. The Board has fixed the size of shipping-parcels of mutton and lamb at a minimum of 250 carcases. The question of grading has been firmly tackled, with consequent improvement in uniformity throughout the Dominion. Shipments are regulated to avoid (so far as possible) causing a glut in the Home market. The Board has succeeded in arranging for successive reductions in the shipping freight-rates, as shown in the table following:—
| Freight to London. | ||||
|---|---|---|---|---|
* Plus 2 ½ per cent. † Net. | ||||
| Old Rate. Per lb.* d. | 1922–23 Rate. Per lb.† d. | 1923–24 Rate. Per lb.† d. | 1924–25 Rate (3-years contract Per lb.† d. | |
| Mutton | 1 5/8 | 1 ¼ | 1 ⅛ | 1 3/32 |
| Lamb | 1 ¾ | 1 ½ | 1 3/8 | 1 9/32 |
| Veal | 1 5/8 | 1 ⅛ | 1 ⅛ | 7/8 |
| Pork | 1 5/8 | 1 | 1 | 7/8 |
| Beef, quarters | 1 3/8 | 1 ⅛ | 1 | 7/8 |
| Boned beef, cases | 1 5/8 | 1 ⅛ | 1 | 7/8 |
| Boned beef, bags | 1 ¾ | 1 ⅛ | 1 | 7/8 |
| Frozen sundries, cases | 1 5/8 | ¾ | ¾ | ¾ |
| Frozen sundries, bags | 1 ¾ | ¾ | ¾ | ¾ |
| Mutton, legs and pieces, cases. | 1 5/8 | 1 7/16 | 1 5/16 | 1 ⅛ |
| Mutton, legs and pieces, bags. | 1 4/3 | 1 7/16 | 1 5/16 | 1 ⅛ |
On average-sized carcases the reductions to date are equivalent to the following sums per head, namely—sheep 2s. 10d., lambs 1s. 6d., pigs 5s. 11d., bullocks 32s.
Reductions have also been effected in other charges since 1922, the per unit reductions to date for various services being—
| Sheep. | Lambs. | Bullocks. | Pigs. | |||||
|---|---|---|---|---|---|---|---|---|
| s. | d. | s. | d. | s. | d. | s. | d. | |
| Shipping freight— | ||||||||
| Frozen meat | 2 | 10 | 1 | 6.2 | 32 | 0 | 5 | 11.2 |
| Tallow, pelts, and hides | 0 | 2.5 | 0 | 1.5 | 1 | 0 | .. | |
| Insurance | 0 | 2.4 | 0 | 2 | 1 | 4.2 | 0 | 36 |
| London charges (based on six weeks' storage) | 0 | 3.8 | 0 | 2.2 | 3 | 10.3 | 0 | 5.8 |
| Kidney-fat in lambs | .. | 0 | 10 | .. | .. | |||
| Freezing charges (not all companies have reduced to this extent) | 1 | 7.8 | 0 | 11.5 | 19 | 9.6 | 2 | 5.7 |
| New Zealand railway tariff (based on works 50 miles from pert) | 0 | 2.2 | 0 | 1.3 | 2 | 6.5 | 0 | 3.3 |
| Totals | 5 | 5 | 3 | 11 | 60 | 7 | 9 | 6 |
The Board regulates shipments from the Dominion with a view to securing, as far as may be possible, steady prices to the consumer. The following table shows shipments during each month of the season 1924–25 and the first eight months of the season 1925–26:—
| Month of Shipment. | Season 1924–25. | Season 1925–26. | ||||
|---|---|---|---|---|---|---|
| Beef. | Mutton. | Lamb. | Beef. | Mutton. | Lamb. | |
*No shipments owing to seamen's strike. | ||||||
| Quarters. | Carcases. | Carcases. | Quarters. | Carcases. | Carcases. | |
| November | 13,510 | 110,381 | 27,194 | 97,599 | 308,901 | 134,485 |
| December | 36,832 | 142,056 | 204,746 | 80,346 | 134,575 | 102,733 |
| January | 7,480 | 108,173 | 380,326 | 3,924 | 143,820 | 400,885 |
| February | 17,876 | 290,113 | 704,594 | 12,180 | 252,384 | 597,307 |
| March | 32,031 | 209,102 | 373,425 | 8,808 | 127,941 | 566,491 |
| April | 43,505 | 208,733 | 822,588 | 10,485 | 133,478 | 840,152 |
| May | 77,170 | 204,260 | 905,589 | 27,890 | 121,095 | 769,184 |
| June | 33,657 | 140,531 | 478,603 | 9,306 | 118,536 | 523,401 |
| July | 12,860 | 147,174 | 347,301 | |||
| August | 21,146 | 222,693 | 223,585 | |||
| September | * | * | * | |||
| October | 20.944 | 139,081 | 139,639 | |||
There were 314,867 horses in the Dominion on the 31st January, 1926, being a decrease of 11,963 on the total for the previous year. The following table gives details by land districts:—
| Land District (including Boroughs). | Stallions Three Years Old and over. | Geldings Three Years Old, and over. | Mares Three Years Old and over. | Fillies under Three Years Old. | Colts or Geldings under Three Years Old. | Other Horses, and Horses unspecified. | Total Horses. | |
|---|---|---|---|---|---|---|---|---|
| Dry. | With Foal at Foot or to foal this Season. | |||||||
| North Auckland | 173 | 17,379 | 14,235 | 1,306 | 1,348 | 1,103 | 141 | 35,685 |
| Auckland | 213 | 21,181 | 18,621 | 2,028 | 1,986 | 1,586 | 345 | 45,960 |
| Gisborne | 136 | 7,959 | 6,789 | 1,433 | 1,489 | 1,255 | 212 | 19,273 |
| Hawke's Bay | 104 | 7,336 | 6,363 | 902 | 806 | 755 | 221 | 16,487 |
| Taranaki | 108 | 9,518 | 8,888 | 907 | 733 | 619 | 100 | 20,873 |
| Wellington | 292 | 17,654 | 17,108 | 2,175 | 2,228 | 1,979 | 506 | 41,942 |
| Nelson | 36 | 3,220 | 3,200 | 256 | 363 | 291 | 20 | 7,386 |
| Marlborough | 63 | 2,923 | 2,717 | 432 | 548 | 467 | 11 | 7,161 |
| Westland | 19 | 1,036 | 1,028 | 100 | 130 | 82 | 27 | 2,422 |
| Canterbury | 274 | 25,515 | 23,089 | 2,715 | 3,776 | 3,121 | 300 | 58,790 |
| Otago | 152 | 13,685 | 13,322 | 1,632 | 2,375 | 2,014 | 150 | 33,330 |
| Southland | 123 | 10,503 | 10,290 | 1,113 | 1,863 | 1,362 | 304 | 25,558 |
| Totals | 1,693 | 137,909 | 125,650 | 14,999 | 17,645 | 14,634 | 2,337 | 314,867 |
The numbers of horses in each of the last five years have been as follows:—
| Year (31st January). | Number of Horses. | Numerical Decrease. | Decrease per Cent. |
|---|---|---|---|
| 1922 | 332,105 | 5,154 | 1.50 |
| 1923 | 330,818 | 1,287 | 0.39 |
| 1924 | 330,430 | 388 | 0.12 |
| 1925 | 326,830 | 3,600 | 1.09 |
| 1926 | 314,867 | 11,963 | 3.80 |
Details of breeds of horses, as ascertained at the special collection of 1924, are as given in the following table:—
| HORSES IN THE DOMINION ON 31ST JANUARY, 1924, CLASSIFIED ACCORDING TO BREED, SEX, AND AGE, (EXCLUDING BOROUGHS.) | |||||||
|---|---|---|---|---|---|---|---|
| — | Thoroughbred. | Trotting. | Ponies under Fourteen Hands. | Other Light Horses (Hack or Harness). | Draught (including Three-quarter-draught). | Spring Cart or Light Artillery (including Half-draught). | Totals. |
| Stallions three years old and over | 247 | 137 | 133 | 188 | 712 | 61 | 1,478 |
| Geldings three years old and over | 1,700 | 1,403 | 3,833 | 47,682 | 57,964 | 27,060 | 139,642 |
| Dry mares three years old and over | 1,572 | 1,069 | 4,071 | 42,887 | 54,399 | 25,412 | 129,410 |
| Mares three years old or over with foal at foot or to foal this season | 752 | 334 | 422 | 4,351 | 6,341 | 1,597 | 13,797 |
| Fillies under three years old | 582 | 308 | 441 | 4,766 | 7,044 | 1,662 | 14,803 |
| Colts or geldings under three years old | 486 | 265 | 334 | 3,790 | 5,991 | 1,520 | 12,386 |
| Other horses and horses unspecified | 30 | 31 | 198 | 1,019 | 211 | 192 | 1,681 |
| Total horses | 5,369 | 3,547 | 9,432 | 104,683 | 132,662 | 57,504 | 313,197 |
Asses and mules numbered 161 as at the 31st January, 1926, being a decrease of 29 on the figures for 1925.
Excluding boroughs, there were 407,042 pigs in the Dominion on the 31st January, 1924. The following table shows the classification by breeds:—
| Breed. | Pigs under One Year Old. | Breeding-boars One Year Old and over | Breeding-sows One Year Old and over. | Other Pigs One Year Old and over. | Total. |
|---|---|---|---|---|---|
| Pure Berkshire | 71,295 | 5,338 | 18,010 | 6,536 | 101,179 |
| Pure Yorkshire | 4,548 | 492 | 1,850 | 338 | 7,228 |
| Other purebred pigs | 2,394 | 265 | 935 | 244 | 3,838 |
| Crossbred pigs | 236,552 | 4,853 | 34,553 | 18,839 | 294,797 |
| Totals | 314,789 | 10,948 | 55,348 | 25,957 | 407,042 |
After earlier vicissitudes, pig-breeding now shows signs of being in a more stable condition, increases in the total number having been recorded in each year since 1919. The number on the 31st January, 1926, was 472,534, as against 440,115 in 1925.
| Land District. (including Boroughs). | Pigs under One Year Old. | Breeding-boars One Year Old and over. | Breeding-sows One Year Old and over. | Other Pigs One Year Old and over. | Total Pigs |
|---|---|---|---|---|---|
| North Auckland | 54,183 | 1,924 | 9,658 | 6,537 | 72,302 |
| Auckland | 101,274 | 3,549 | 18,672 | 8,825 | 132,320 |
| Gisborne | 10,712 | 378 | 1,909 | 642 | 13,641 |
| Hawke's Bay | 10,662 | 491 | 2,329 | 3,367 | 16,849 |
| Taranaki | 46,161 | 1,670 | 7,918 | 2,079 | 57,828 |
| Wellington | 55,654 | 1,971 | 10,386 | 4,705 | 72,716 |
| Nelson | 11,922 | 366 | 1,825 | 545 | 14,658 |
| Marlborough | 4,405 | 188 | 1,098 | 1,488 | 7,179 |
| Westland | 4,712 | 171 | 727 | 255 | 5,865 |
| Canterbury | 39,225 | 1,043 | 5,659 | 2,443 | 48,370 |
| Otago | 16,625 | 488 | 2,258 | 244 | 19,615 |
| Southland | 9,427 | 271 | 1,263 | 230 | 11,191 |
| Totals | 364,962 | 12,510 | 63,702 | 31,360 | 472,534 |
During the ten years ended the 31st March, 1926, 2,330,978 pigs were slaughtered at abattoirs and registered slaughterhouses, and during the decennium to 31st January. 1926, 482,263 were slaughtered by farmers on holdings of 1 acre or over; the total slaughterings during the ten years representing approximately 3 ¼ million hundredweight of pork, bacon, and ham. The figures for each year are—
| Year. | Pigs slaughtered | Approximate Weight of Pork, Bacon, and Ham. | ||||
|---|---|---|---|---|---|---|
| At Abattoirs, &c. | On Farms. | Total. | Pigs slaughtered at Abattoirs, &c. | Pigs slaughtered on Farms. | Total. | |
| Number. | Number. | Number. | Cwt. | Cwt. | Cwt. | |
| 1916–17 | 202,834 | 44,908 | 247,742 | 235,432 | 52,125 | 287,557 |
| 1917–18 | 179,540 | 41,121 | 220,661 | 208,395 | 47,730 | 256,125 |
| 1918–19 | 155,960 | 47,974 | 203,934 | 181,025 | 55,684 | 236,709 |
| 1919–20 | 200,952 | 35,783 | 236,735 | 233,248 | 41,534 | 274,782 |
| 1920–21 | 169,700 | 43,707 | 213,407 | 196,973 | 50,731 | 247,704 |
| 1921–22 | 230,446 | 56,578 | 287,024 | 267,482 | 65,671 | 333,153 |
| 1922–23 | 221,201 | 59,117 | 280,318 | 256,751 | 68,618 | 325,369 |
| 1923–24 | 266,384 | 53,769 | 320,153 | 309,196 | 62,410 | 371,606 |
| 1924–25 | 345,622 | 51,409 | 397,031 | 401,168 | 59,675 | 460,843 |
| 1925–26 | 358,339 | 47,897 | 406,236 | 415,929 | 55,595 | 471,524 |
| Totals, 10 years | 2,330,978 | 482,263 | 2,813,211 | 2,705,599 | 559,773 | 3,265,372 |
Exports of frozen pork during the ten calendar years 1916–25 totalled 149,204 cwt of which 122,811 cwt. was shipped during the last four years. During the ten years 22,770 cwt. of bacon and hams and 63 cwt. of salted pork were also exported. Over the whole period nearly 96 per cent. of the pork, bacon, and ham produced was consumed in the Dominion.
The number of Angora goats in the Dominion on the 31st January, 1926, was 4,945, a decrease of 751 since 1925. Other goats increased by 3,537 during the period, the number in 1926 being 16,816.
The number of poultry in New Zealand at the taking of the 1921 census was ascertained to be 3,991,009, an increase of 525,371 over the number for the year 1916 (3,465,638).
The figures of poultry for each of the last four censuses are as follows:—
| Census Year. | Fowls. | Ducks. | Geese. | Turkeys. | Total. |
|---|---|---|---|---|---|
| 1906 | 2,784,269 | 281,999 | 44,300 | 77,101 | 3,187,669 |
| 1911 | 3,215,031 | 329,230 | 45,389 | 97,933 | 3,687,583 |
| 1916 | 3,141,354 | 220,808 | 46,955 | 56,521 | 3,465,638 |
| 1921 | 3,491,567 | 379,988 | 46,234 | 73,220 | 3,991,009 |
In connection with the census of 1921, statistics were compiled as to the sizes of flocks of fowls, and the results are instructive as showing that, though poultry-farming as a definite branch of farming exists to some small extent, poultry-keeping is generally carried on merely as a side-line.
The classification of flocks of fowls is—
| Size of Flock. | Number of Flocks. |
|---|---|
| Under 12 | 43,913 |
| 12 and under 25 | 54,130 |
| 25 ,, 50 | 32,180 |
| 50 ,, 75 | 8,285 |
| 75 ,, 100 | 2,102 |
| 100 ,, 150 | 1,414 |
| 150 ,, 200 | 422 |
| 200 ,, 250 | 205 |
| 250 ,, 300 | 113 |
| 300 ,, 400 | 147 |
| 400 ,, 500 | 71 |
| 500 ,, 600 | 33 |
| 600 ,, 700 | 16 |
| 700 and under 800 | 23 |
| 800 ,, 900 | 16 |
| 900 ,, 1,000 | 8 |
| 1,000 ,, 1,250 | 21 |
| 1,250 ,, 1,500 | 5 |
| 1,500 ,, 1,750 | 6 |
| 1,750 ,, 2,000 | 5 |
| 2,000 ,, 2,250 | 1 |
| 2,250 ,, 2,500 | 1 |
| 2,500 ,, 3,000 | |
| 3,000 and over | 2 |
| Total | 143,119 |
The average number of fowls per flock was thus only two dozen. The total number of households keeping poultry of any kind was 145,993, of which no fewer than 61,459 were in boroughs.
The Poultry Act, 1924, provides for the regulating of the keeping of poultry and the sale and export of poultry and eggs. Provision is made for the appointment of Inspectors, on whom certain powers of entry for purposes of inspection of poultry or eggs intended for export are conferred. Poultry are required to be kept under sanitary conditions, and cruelty to poultry is made an offence. Every owner of poultry is required to notify an Inspector of any outbreak of disease among his poultry, and to comply with the Inspector's directions. It is an offence to sell diseased poultry. The Governor-General in Council is empowered to declare diseases, to appoint ports of export, and to appoint grading-stores.
The dairying-lands of the Dominion are eminently suited for the rearing of bees, and a very high-grade product is put on the market from local apiaries. The export trade is, of course, small when compared with the main primary industries, but is capable of considerable development. Honey from the apiaries of the Dominion is much appreciated wherever it is known.
In New Zealand the Department of Agriculture devotes proportionately the tame attention to detail in the case of honey for export as is given to butter and cheese forwarded for consumption beyond the Dominion. Honey must be forwarded to grading-stores at Auckland, Wellington, Lyttelton, Timaru, Dunedin, and Bluff for grading prior to export, and may be exported only through the ports of Auckland, Waitara, Wellington, Lyttelton, Timaru, and Dunedin. Stringent regulations have been enacted in order to control foul-brood, bee-moths, and other diseases of bees. Beekeepers are required to register their apiaries triennially, and of late years have been called upon to supply certain statistics at the time of such registration.
For the triennial registration as at 31st May, 1923, 6,289 apiaries were registered by the Director of the Horticulture Division, Department of Agriculture, the following table showing the classification as regards sizes:—
| TABLE SHOWING THE NUMBER OF APIARIES REGISTERED IN EACH LAND DISTRICT IN NEW ZEALAND IN 1923, CLASSIFIED ACCORDING TO SIZE. | |||||||
|---|---|---|---|---|---|---|---|
| Land District. | Size of Apiary. | Total. | |||||
| Under 5 Hives. | 5 Hives and under 10. | 10 Hives and under 25. | 25 Hives and under 50. | 50 Hives and under 100. | 100 Hives or more. | ||
| North Auckland | 471 | 151 | 117 | 42 | 51 | 10 | 842 |
| Auckland | 256 | 109 | 96 | 86 | 96 | 43 | 686 |
| Gisborne | 48 | 22 | 10 | 8 | 6 | 5 | 99 |
| Hawke's Bay | 134 | 36 | 34 | 24 | 6 | .. | 234 |
| Taranaki | 163 | 85 | 62 | 73 | 21 | 4 | 408 |
| Wellington | 397 | 142 | 134 | 83 | 53 | 9 | 818 |
| Nelson | 196 | 75 | 46 | 12 | 4 | .. | 333 |
| Marlborough | 67 | 31 | 18 | 8 | 5 | 2 | 131 |
| Westland | 53 | 22 | 31 | 17 | 13 | 4 | 140 |
| Canterbury | 342 | 181 | 209 | 112 | 79 | 19 | 942 |
| Otago | 523 | 201 | 164 | 42 | 33 | 10 | 973 |
| Southland | 364 | 148 | 95 | 45 | 21 | 10 | 683 |
| Totals | 3,014 | 1,203 | 1,016 | 552 | 388 | 116 | 6,289 |
Information in regard to the predominating breed of the colonies registered is given below.
| TABLE SHOWING THE NUMBER OF HIVES REGISTERED IN EACH LAND DISTRICT IN NEW ZEALAND IN 1923. | ||||
|---|---|---|---|---|
| Land District. | Hives registered, 1923. | |||
| Italian. | Black. | Crossbred. | Total. | |
| North Auckland | 4,026 | 2,019 | 3,789 | 9,834 |
| Auckland | 9,606 | 2,155 | 5,890 | 17,651 |
| Gisborne | 581 | 342 | 882 | 1,805 |
| Hawke's Bay | 563 | 630 | 1,069 | 2,262 |
| Taranaki | 3,496 | 937 | 1,660 | 6,093 |
| Wellington | 3,550 | 1,948 | 5,819 | 11,317 |
| Nelson | 222 | 1,134 | 841 | 2,197 |
| Marlborough | 325 | 379 | 771 | 1,475 |
| Westland | 694 | 1,271 | 918 | 2,883 |
| Canterbury | 4,624 | 4,980 | 7,537 | 17,141 |
| Otago | 2,563 | 3,456 | 3,737 | 9,756 |
| Southland | 1,162 | 2,585 | 3,439 | 7,186 |
| Totals | 31,412 | 21,836 | 36,352 | 89,600 |
Since the general registration of 1923, the number of apiaries on the register has been largely augmented, there being now approximately 7,700 apiaries registered, representing some 104,000 hives.
The results of the last four quinquennial censuses may be briefly summarized as follows:—
| Census. | Number of Households keeping Bees. | Number of Beehives. | Honey produced during Year. | Beeswax produced during Year |
|---|---|---|---|---|
| lb. | lb. | |||
| 1906 | 15,396 | 74,341 | 1,003,940 | 31,682 |
| 1911 | 11,011 | 71,605 | 1,457,429 | 28,061 |
| 1916 | 8,244 | 57,540 | 1,363,334 | 31,032 |
| 1921 | 8,426 | 85,861 | 2,807,346 | 51,180 |
Of the colonies in 1921, 29,672 were of black, 26,184 hybrid, 25,925 of Italian, and 4,080 of other (including unspecified) bees.
Exports of honey for the last five years were—
| Year. | Quantity. | Value. |
|---|---|---|
| lb. | £ | |
| 1921 | 861,921 | 28,428 |
| 1922 | 1,289,135 | 46,821 |
| 1923 | 972,038 | 25,588 |
| 1924 | 1,186,269 | 29,721 |
| 1925 | 1,822,043 | 53,156 |
A system of control on much the same lines as in the case of meat and dairy-produce was introduced by the Honey-export Control Act, 1924. The function of the Board set up (after a poll of producers, who decided by a large majority in favour of the scheme) is to control all honey intended for export.
Table of Contents
THE administration of the State forests and of the afforestation activities of New Zealand was for many years under the control of the Lands and Survey Department, but in 1919 a separate Forestry Department was formed. This was reorganized in 1920 as the State Forest Service, and on the passing of the Forests Act, 1921–22, the Forest Authority was defined as the Minister of Forestry (also called the Commissioner of State Forests), the Director of Forestry, the Secretary of Forestry, and such conservators, rangers, and other officers as may from time to time be appointed as officers of the State Forest Service.
The central management and administrative control of the Service consists of the Director of Forestry (assisted by the Chief Inspector) and the Secretary of Forestry, with the Head Office at Wellington. Other personnel consists of conservators, a milling expert, an engineer in forest products, forest assistants, rangers, forest guards, and a clerical staff, the total personnel of the State Forest Service being at present 106.
The rapid advance of settlement since 1840 (too often indiscriminate), the operations of sawmills, and the ravages caused by fires of kauri-gum diggers, mining prospectors, and other pioneers, have resulted in the original forest area of New Zealand being rapidly reduced, so that according to the forest inventory the remaining total area of forest in the Dominion is now only about 12,593,000 acres, or 19.1 per cent. of the total area. A considerable proportion of this area, however, being ordinary Crown land, Native land, and privately-owned land, will probably be deforested and surrendered for settlement. About half of the area is alpine meadow-land, subalpine scrub-land, or protection forest.
A classification of the total area of the North, South, and Stewart Islands, as disclosed by the national forest inventory completed in 1923, shows the following position:—
LAND CLASSIFICATION, NEW ZEALAND.
(National Forest Inventory, 1923.)
| Acres. | |
|---|---|
| Land used for agricultural and pastoral purposes | 40,687,019 |
| Forest land | 12,592,811 |
| State plantations | 44,610 |
| Non-productive (above and below timber-line) | 10,692,423 |
| Lakes, roads, and rivers | 1,847,737 |
| 65,864,600 |
Of the forest land, 5,589,501 acres carry timber stands of over 5,000 ft., board measure, to the acre, and may be classed as “merchantable” forest land.
MILLING-TIMBER RESOURCES.
(National Forest Inventory, 1923.)
| Species. | Million Feet, B.M. | Percentage of Total. |
|---|---|---|
| Softwoods— | ||
| Kauri | 368.6 | 0.6 |
| Totara | 3,176.1 | 5.1 |
| Rimu | 28,074.6 | 45.2 |
| Kahikatea | 3,054.5 | 4.9 |
| Matai | 2,617.7 | 4.2 |
| Silver-pine | 334.4 | 0.5 |
| Miro | 854.1 | 1.4 |
| Kaikawaka | 398.0 | 0.7 |
| Total softwoods | 38,878.0 | 62.6 |
| Hardwoods— | ||
| Beech | 20,311.7 | 32.7 |
| Tawa | 2,875.9 | 4.7 |
| Total hardwoods | 23,187.6 | 37.4 |
| Total milling-timber | 62,065.6 | 100.0 |
The kauri is practically all gone, and a great proportion of that left is State-owned. The quantities of totara and matai are not considerable, and are chiefly concentrated in the central part of the North Island. The normal life of the white-pine resources is not more than twelve years. Rimu to-day is the principal economic softwood timber, but this timber must gradually give way, in about forty years, to plantation and hardwood timbers. The total quantity of economically available softwoods, after deducting all areas of inaccessible, protection, and climatic forests, is 25,000,000,000 ft., board measure. The hardwoods will function in the national timber problem only as a subsidiary source of supply, because of their general distribution in the mountain and plateau regions, and because, owing to their normal refractory qualities, they do not lend themselves readily to industrial and constructional and building uses. Over 90 per cent. of New Zealand's demand, as of all civilized countries, is for softwoods.
The policy of dedicating for forest management all Crown forests and other forest lands chiefly valuable for timber cropping and conservation and not for agricultural or pastoral uses has been maintained by the Government since the inauguration of the present forest policy, with the results shown in the following schedule:—
| AREAS DEDICATED TO FORESTRY AND CONSERVATION. | ||||
|---|---|---|---|---|
| Period. | Permanent State Forests. | Provisional State Forests. | Forest Reserves and Miscellaneous. | Total Area. |
* 418,370 acres reserved prior to 1919; of this, 96,409 acres have been transferred to the control of the Forest Service. | ||||
| Acres. | Acres. | Acres. | Acres. | |
| Dedicated prior to year 1919 | 1,662,007 | .. | * | 1,662,007 |
| Dedicated during the period 1919–26 (net increase) | 108,574 | 5,686,700 | 96,409 | 5,891,683 |
| Total at 31st March, 1926 | 1,770,581 | 5,686,700 | 96,409 | 7,553,690 |
Acquisition by purchase of forested lands through the medium of the State Forests Account during the period 1920–26 aggregated over 152,000 acres.
The composition and distribution of the forest types of New Zealand are dependent chiefly upon altitude and climatic conditions, the amount of precipitation, with the resulting soil-moisture, being the main determining climatic factor. At least four broad forest divisions may be distinguished:—
Kauri Division.—Kauri-forest type, in that part of the Dominion lying north of a line drawn from Tauranga to Port Waikato. Kauri is the predominant tree.
Taxad or Rain-forest Division.—
Rimu type, common throughout on the foothills up to 2,000 ft.; the heaviest stands occur in the central part of the North Island, the west-coast and southern portions of the South Island.
Kahikatea type, found on alluvial flats throughout the Dominion.
Totara type, on the drier spurs of the rain-forest region, with its optimum in the central and eastern portions of the North Island.
Eastern Dry Division.—Beech type, on high land, generally above 2,000 ft., in the central part of the North Island, and over most of the South Island, generally between 1,000 ft. and 4,000 ft. altitude.
Scrub Types.—Manuka type; gorse and blackberry type; mangrove type; &c.
From the number of species, the abundance of lianes, perching-plants, tree-ferns, filmy ferns, &c., the rain forests have the appearance and general character of tropical forests. The components of the rain forest vary, however, in different localities, and often one or two species dominate the association to such an extent as to warrant the application of a type name—e.g., “tawa association,” “tawhero association,” &c.
Though the forest-trees of New Zealand are ninety-nine in number, there are only about twenty of them which are of value as timber-trees; in fact, at present only six are being used to any extent by sawmillers, and, of these, five are coniferous (softwood) timbers. There are already indications that the high prices and growing scarcity of many of our best timbers will bring about the use of many of those now neglected. There are several timbers—e.g, puriri, kohekohe, pukatea—which possess very high qualities, but which are now to be obtained only in such small quantities that they are of little commercial importance. A short description of each of the chief forest-trees appeared in the 1924 number of the Year-book.
The principal timbers milled in New Zealand at present are rimu and kahikatea. The figures of the output of sawn timber by bush mills for the year 1915–16 and for each of the last three years for which statistics are available are as follows:—
| Kind. | 1915–16. | 1922–23. | 1928–24. | 1924–25. | |
|---|---|---|---|---|---|
| Quantity. | Per Cent. of Total. | ||||
| Ft. B.M. | Ft. B.M. | Ft. B.M. | Ft. B.M. | ||
| Rimu | 134,462,000 | 155,628,000 | 181,094,000 | 194,565,000 | 56.5 |
| Kahikatea | 85,354,000 | 66,088,000 | 56,699,000 | 66,539,000 | 19.4 |
| Matai | 11,610,000 | 23,747,000 | 24,326,000 | 23,392,000 | 6.8 |
| Kauri | 49,708,000 | 22,461,000 | 19,743,000 | 22,892,000 | 6.7 |
| Totara | 10,983,000 | 20,844,000 | 18,904,000 | 18,507,000 | 5.4 |
| Beech | 5,710,000 | 5,227,000 | 6,529,000 | 7,439,000 | 2.2 |
| Tawa | 623,000 | 607,000 | 509,000 | 490,000 | 0.1 |
| Rata | 31,000 | 116,000 | 373,000 | 82,000 | .. |
| Puriri | 50,000 | 108,000 | 96,000 | 32,000 | .. |
| Silver-pine | 18,000 | 56,000 | 61,000 | 57,000 | .. |
| Taraire | 490,000 | 116,000 | 36,000 | 51,000 | .. |
| Pukatea | 3,000 | 14,000 | 70,000 | 143,000 | .. |
| Pinus radiata (insignis) | 25,000 | 7,684,000 | 7,386,000 | 7,706,000 | 2.2 |
| Blue-gum | .. | 4,000 | 145,000 | 200,000 | 0.1 |
| Poplar | .. | 760,000 | 159,000 | 567,000 | 0.2 |
| Undefined | 9,500,000 | 894,000 | 939,000 | 1,433,000 | 0.4 |
| Totals | 308,567,000 | 304,354,000 | 317,069,000 | 344,095,000 | 100.0 |
A huge decrease in the output of kauri is disclosed, and that of kahikatea is also steadily falling off, while that of rimu and matai has, on the whole, steadily increased. The year 1915–16 saw a modest beginning of the utilization of Pinus radiata (insignis) as a timber-tree in the Dominion, some 25,000 ft. having been milled in that year. Four years later the annual output had increased to nearly 6,000,000 ft., and by 1921–22 to nearly 11,000,000 ft., but fell in the next three years to between 7,000,000 ft. and 8,000,000 ft.
During the year 1925, 71,148,684 ft. B.M. of timber, 4,901,440 laths, 4,759,620 shingles, 266,737 palings, 461,790 sleepers, and other items of lumber not measured in feet were imported, the total value of timber imports being £1,194,944, as compared with £1,043,985 in 1924 and £638,562 in 1923. The chief varieties imported in 1925 were: Oregon pine (rough-sawn and dressed), 17,115,606 ft. B.M., value £125,710; cedar (rough-sawn and dressed), 6,525,681 ft. B.M., value £81,486; ironbark (logs, poles, and sawn timber), 16,207,338 ft. B.M., value £278,897; jarrah (logs and sawn timber), 6,982,860 ft. B.M., value. £101,377; and oak (rough-sawn and dressed), 2,719,547 ft. B.M., valued at £83,761. Exports of New Zealand timber amounted to 50,263,186 ft. B.M., value £583,581, including kahikatea, 33,375,607ft. B.M. (£360,188); rimu, 3,709,934 ft. B.M. (£45,953); and kauri, 3,238,693 ft. B.M. (£38,620).
New Zealand in 1920 evolved a definite national forest policy, which has for its main objectives—
The development of an economic policy of New Zealand timber for the New Zealand people, ensuring ample timber-supplies for the Dominion by the management of the forest domain on a sustained-yield basis;
Regulation of stream-flow, conservation of water-supplies, and maintenance of climate stability through protection forests;
Restoration of denuded forest lands to a timber-production basis;
Dedication of all the national forest resources as State forests.
Much work has been done and much progress achieved since the inauguration of the national forest policy in 1920, and the foundation has been laid for the proper utilization of the Dominion's forest resources and for the systematic provision of timber for future requirements.
A national forest inventory and stocktaking, which took over three years to compile, was completed in 1923. This examination made available for the first time in the forestry history of New Zealand an accurate survey of the Dominion's resources in forest wealth, and provided the means for accurately building future plans of management.
General forest reconnaissance of the State forests has, during the collection of data for the national forest inventory, or during timber inspections, investigation of water shed protection forests, &c., since 1920, been carried out over practically the whole of the State forests.
The programme of land-classification, so necessary to the application of scientific wood-cropping plans, is now 36 per cent. completed, an area of 2,680,530 acres having been examined in the field. All forest areas chiefly valuable for agriculture have been earmarked for excision, and, as the commercial timbers are removed, will be released for settlement. All open areas of pastoral value are also being deleted from within forest boundaries.
Demarcation of the State forests has been 7 per cent. completed, 515,340 acres having been permanently defined in the field, and 54 standard survey plans for these areas prepared and approved.
The forest atlas is being gradually built up by the addition of topographic and forest-type features to these authoritative plans.
Permanent forest improvements have been built wherever urgently required, and include seven dwellinghouses for officers at outlying stations, patrol huts, a seed-extraction house, and other buildings; over thirty-five miles of forest telephone-line; several miles of forest roads; and over one hundred miles of new forest tracks. Four modern fire lookout stations and many fire-fighting-tool depots have been erected in the State plantations.
Preliminary working plans are in operation for Westland Forest Experiment Station and Nursery. Progress in forest demarcation, forest improvements, forest statistics, and in silvical, incremental, and utilization studies has been such that forest-management plans can be prepared and applied to certain forests as the necessary technical staff becomes available.
Forest - management investigations include volume - tables and mill - conversion studies for the native “pine” (taxad) trees in both Islands, and investigations into the rate of growth in diameter, height, and volume of the most important indigenous and introduced tree species. A Forest Service log-scale has been published.
The State Forest Service co-operates with and advises other Government Departments in regard to timber lands under their control, timber production, planting, &c. For local bodies, forest planting and other similar projects are investigated and reported upon, whilst for prospective industrial and private planters reports and advisory memoranda are prepared. The services of the Department are also readily given to the public with regard to all timber technological problems, and to a thousand-and-one other aspects of woods and forestry.
Silvicultural investigations have been carried out into the response as regards rate of growth of indigenous forests and plantations after thinning; underplanting of indigenous forest with exotic conifers; fixation of sand-dunes and tree-planting thereon; and the planting of exotic tree species on a forest scale in fresh districts, as at the Westland Forest Experiment Station and on the gum lands of North Auckland. There are now in operation seventy - two permanent sample plots, compared with ten in 1919–20. In addition, many experiments have been made with a view to improving forest nursery and plantation technique and economy, and already results have been applied to large-scale operations with success. Ecological and silvical study of the life-history of the beech forests has been completed, that of the kauri forests and of the West Coast forests practically completed, and a study of the tawa forests commenced. These and forest-management studies afford the essential preliminary data for the preparation of scientific forest-management plans designed to regulate the growth and harvesting of timber crops.
Investigations with a view to eliminating the enormous waste in the utilization of the Dominion's timber forests have been carried out by the State Forest Service. Since 1921 a broad study of all phases of wood conversion and manufacture by both primary and secondary industries has been completed as a basis for a broad scheme of research. A revision of building by-laws is already reflected in closer utilization of timber by the building industry.
Strength properties of native and exotic woods in the form of poles, cross-arms, and plywoods have been determined accurately. Important improvements have been found possible in the technique of the drying of native woods by air-seasoning and kiln-drying, and in the use of wood-preservatives in poles and fencing-posts cut from State plantations. An effective remedy has been found for sapstain, and the forest and timber insects of the Dominion have been investigated, classified, and described. other researches include kauri-bleeding, destructive distillation of kauri waste, and the use of native woods for the manufacture of pulp and paper.
The greater part of the forest-products research work already done has been carried out in co-operation with the Auckland, Victoria, and Canterbury University Colleges.
A modern and efficient sales policy for the disposal of the ripe and mature timber in. State forests was put into operation in 1920, with splendid consequential results both to the State and to the wood using and consuming public, for New Zealand is now securing a fairer and larger share of the competitive market value of all merchantable forests sold for exploitation. The receipts from timber sales during the last five years are as follows:—
| Year. | Timber sold. | Contract Price obtained. |
|---|---|---|
* Includes three extraordinary departmental sales amounting to £140,000. | ||
| Ft. B.M. | £ | |
| 1921–22 | 35,669,000 | 38,208 |
| 1922–23 | 78,830,000 | 95,357 |
| 1923–24 | 212,085,000 | 266,388* |
| 1924–25 | 69,253,000 | 96,158 |
| 1925–26 | 73,659,000 | 80,565 |
Up to and including the financial year 1915–16 the expenditure on forestation was provided out of rents and royalties received from State forest reserves and by an annual contribution from the Consolidated Fund. From 1916–17, however, all receipts and payments were to be shown in a State Forests Account, and provision was made for the borrowing of money for forestry purposes.
A statement showing the total receipts and payments since the 31st March, 1917, is given below.
| Year. | Receipts. | Payments. | ||||||
|---|---|---|---|---|---|---|---|---|
| Forest Income. | Loans raised. | Interest on Investments. | Total. | Capital. | Operation. | Interest on Loans. | Total. | |
* Includes £10,000 from Consolidated Fund. † Includes £100,000 purchase of Selwyn Settlement forest. | ||||||||
| £ | £ | £ | £ | £ | £ | £ | £ | |
| Balance, 3 1/3/17 | .. | .. | .. | 2,530 | .. | .. | .. | .. |
| 1917–18 | 13,299 | 28,100 | .. | 41,399 | 40,865 | 988 | 902 | 42,755 |
| 1918–19 | 7,529 | 36,900* | .. | 44,429 | 39,162 | 2,182 | 1,861 | 43,205 |
| 1919–20 | 3,514 | 65,000 | .. | 73,514 | 60,844 | 5,975 | 3,577 | 70,396 |
| 1920–21 | 19,518 | 70,000 | .. | 89,518 | 64,802 | 14,570 | 6,127 | 85,499 |
| 1921–22 | 30,784 | 86,780 | .. | 117,564 | 69,840 | 38,087 | 9,797 | 117,724 |
| 1922–23 | 63,372 | 214,221 | 2,935 | 280,528 | 51,823 | 38,591 | 19,701 | 110,115 |
| 1923–24 | 93,480 | 209 | 6,013 | 99,702 | 54,323 | 43,077 | 23,172 | 120,572 |
| 1924–25 | 161,469 | 100,000 | 6,727 | 268,196 | 171,920† | 56,245 | 23,157 | 251,322 |
| 1925–26 | 152,550 | .. | 7,178 | 159,728 | 115,886 | 63,729 | 28,004 | 207,619 |
| Balance, 3 1/3/26 | .. | .. | .. | .. | .. | .. | .. | 127,901 |
| 1,177,108 | 1,177,108 | |||||||
The question of the conservation and control of wild life within State forests has received serious attention, for a very close and intimate relationship exists between the indigenous avifauna and the regeneration of the taxad or native “pine” forests. Investigation indicates that “No native bird-life means no taxad forests; and no forests mean no native bird-life.” For that reason the State Forest Service has co-operated closely with the controlling Government authority (the Department of Internal Affairs), the Native Bird Protection Society, and others, with a view to building up a better bird sentiment, and, where possible and desirable, prosecutions for illegal shooting have been carried through.
The deer herds throughout the Dominion, which, unfortunately for the welfare of the forest-growth, harbour in the forests, had so rapidly increased during the past generation that further investigation was made into this menace. It was found that there were approximately 300,000 head in the Dominion, that the annual increase is probably over 25 per cent., and that the yearly damage is in the neighbourhood of £180,000, whilst the problematical annual benefit through licenses and tourists was only £7,000. As a result of representations to the responsible agency, open seasons were declared over 11,250 square miles in the South Island, and bounty moneys were made available for all deer destroyed. To date at least 30,000 deer have been exterminated in the Dominion by systematic culling, payment of bounty, and open seasons.
The wild-pig nuisance in certain parts of the North Island has also received attention, and bounty has been paid on over 34,000 wild pigs destroyed.
The opossum-trapping industry in State forests is being carefully regulated, in order to avoid overtrapping and extermination of this highly valuable yet forest-harmless animal.
One of the greatest problems of forest - conservation is that of fire - prevention, and in New Zealand the problem is probably greater than in countries of the Northern Hemisphere, the primitive taxad timber-trees of the Dominion being much more susceptible to death or damage by the agency of fire than are modern types of conifers. The Forest Authority is concerned with the prevention and suppression of fires on and contiguous to State forests. The annual losses by forest fires prior to 1920 ranged from 40 to 150 square miles per annum. Immediate steps were taken to solve the problem by—
Systematic protection patrol in the hazardous areas:
Application of the forest fire district machinery and closed seasons:
Appointment of honorary forest rangers:
Development of co-operative patrols by sawmilling operators:
Operation of fire lookout stations, clearing of fire-breaks and tracks:
Direct personal appeals to settlers, mill and wood workers, travellers, sportsmen, and tourists:
General educational propaganda by Press and posters.
The creation and operation of fire districts have formed an important feature in the forest-fire policy of the State Forest Service. The results obtained justified provision being made in the Forests Amendment Act, 1925, for their extension to provide, on the application of the owner or owners, protection to forests on private or other lands of an area of not less than 200 acres.
The results of these operations have been highly satisfactory, and the fire menace is now within control. The amount represented by fire losses in 1925–26 was only £87.
The policy of popularizing forestry, of inculcating a love of trees and of nature, and of developing a wide appreciative knowledge of the benefits to be secured from tree-culture has been steadily pursued. By popular lectures, by exhibits at agricultural shows, by moving-picture films, by free advice, by producing and selling trees for planting at lowest prices, by publication and Dominion-wide circulation of descriptive literature, by advertisement, by the “forestry in the schools” campaign, and by many other means the lesson of forestry has been driven home.
Tree nurseries in 518 schools throughout the Dominion have been established, and 164 lb. of tree-seeds, in addition to 37,525 young trees, have been provided free of charge by the Forest Service for planting purposes by scholars.
Full economic use of the knowledge gained by school-children in the raising of forest-trees, and the utilization of the young trees themselves, demand the extension of the scheme to include the establishment of school endowment plantations. As the majority of schools have not available areas of land suitable for this purpose, the Forest Service has formulated a scheme whereby certain lands contiguous to schools should be acquired as endowment areas and vested in one or more schools, which will carry out the formation of the forest and share in the proceeds. The educational and financial returns which will accrue to the schools participating and carrying out the scheme will rest with the Education Boards, the Forest Service being at all times willing to co-operate and undertake responsibility on the technical side.
The proposed scheme is now under consideration by the Education authorities.
University educational facilities by way of a School of Forestry have been provided at Canterbury University College for the training of professional forest engineers and technicians, and for the giving of special and applied instruction to timber-land owners, operators, and workers, whilst similar equal facilities have also been made available at Auckland University College.
New Zealand has 4,860,000 acres of fern, scrub, and second-growth land hitherto unproductive but highly suitable for the growth of trees. Nearly 79,000 acres of this have been afforested by the State.
State afforestation on an organized basis dates from 1896, when an Afforestation Branch of the Lands Department was formed, and forest-tree nurseries were established at Tapanui and Eweburn in the South Island, and at Rotorua in the North Island. Shortly afterwards afforestation was started on an extensive scale at these and other localities.
The total expenditure on State afforestation up to the 31st March, 1926, has been £164,505. Profitable thinning has been carried out on an experimental scale, with a view to extending thinning operations over several thousand acres where it is needed to improve the volume increment.
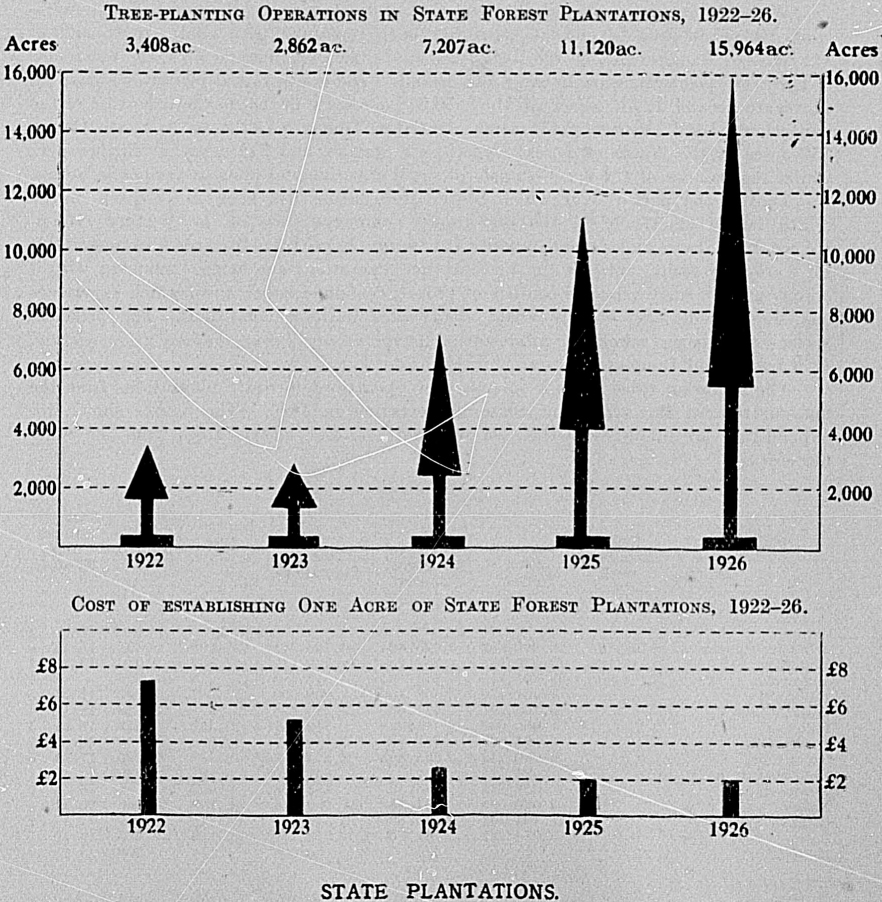
The total area of State plantations is now 78,909 acres, of which 55,053 acres are in the Rotorua district, in three plantations—Whakarewarewa (8,037 acres), Waiotapu (7,010 acres), and Kaingaroa (40,006 acres).
The reserve known as Whakarewarewa Plantation is situated immediately behind Rotorua Nursery (where all trees required in the North Island plantations are raised), whence it extends in a southerly direction for a distance of seven miles. Waiotapu Plantation, which is twenty miles distant by road from Rotorua, comprises a large block of undulating country lying to the east of the Rotorua - Taupo Road. Joining this plantation on the east is the reserve on the Kaingaroa Plains, distant from Rotorua some thirty miles, and comprising a comparatively small part of the extensive plateau which lies between the Rangitaiki River on the east and the Waiotapu Valley on the west. Here are situated the youngest portions of the State plantations and the present centre of the tree-planting activities.
While a considerable number of species was experimented with in the initial stages of the work, the chief species used to any considerable extent in the Rotorua district were European larch, Austrian pine, Corsican pine, Western yellow-pine, and a variety of eucalypti. Of more recent years the species used for planting have been Douglas fir, Western yellow-pine, Pinus radiata, Corsican pine, and, to a smaller extent, Weymouth pine.
With the exception of a small plantation of 1,200 acres at Puhipuhi, North Auckland, where an area of cut-out kauri has been replanted with exotic trees, and of 141 acres at Tangimoana, on the Rangitikei sand-dune experimental area, the remainder of the State plantations are in the South Island. The South Island plantations have an aggregate area of 22,515 acres, of which 10,258 acres are in the northern portion of the Canterbury Land District, 2,454 acres in Central Otago, 8,758 acres in South Otago, 482 acres at the Westland Forest Experiment Station, and 342 acres in Marlborough, whilst the balance of 221 acres consists of small experimental plots in various localities.
During the period over which State afforestation has been in progress in the South Island practically all the best-known commerce trees of the Northern Hemisphere have been experimented with, but many have been discarded as unsuitable for various reasons, until at the present time operations are being conducted with a comparatively small range of conifers of proved economic importance, which experience has shown will most readily adapt themselves to local conditions. The principal species now being raised for afforestation purposes are Pinus radiata, P. ponderosa, P. Laricio, and Douglas fir.
The following table gives a summary of operations in State plantations from the inauguration of the system of State afforestation in 1896. The figures shown for expenditure are inclusive of the cost of buildings, &c., and of trees from the State nurseries:—
| Plantation. | Trees. | Expenditure to Date. | Area planted. | Expenditure per Acre planted. | |||||
|---|---|---|---|---|---|---|---|---|---|
| Raised from Seed sown in Situ. | Received from Nursery. | Used to replace Losses. | Total in Plantations. | £ | Acres. | £ | s. | d. | |
| Whakarewarewa | 109,725 | 20,626,050 | 3,999,464 | 16,736,311 | 125,909 | 8,037 | 15 | 13 | 6 |
| Waiotapu | 83,121 | 23,529,152 | 4,883,134 | 18,729,139 | 94,867 | 7,010 | 13 | 10 | 7 |
| Kaingaroa | 124,600 | 39,635,715 | 3,243,835 | 36,516,480 | 177,218 | 40,006 | 4 | 8 | |
| Puhipuhi | .. | 1,462,450 | 462,450 | 1,000,000 | 13,237 | 1,200 | 11 | 1 | 5 |
| Conical Hills | .. | 10,760,951 | 1,474,655 | 9,286,296 | 65,377 | 3,533 | 18 | 10 | 1 |
| Pukerau | .. | 905,085 | 85,088 | 819,997 | 10,359 | 573 | 18 | 1 | 7 |
| Dusky Hill | .. | 3,061,997 | 8,81,160 | 2,180,837 | 24,903 | 746 | 33 | 7 | 7 |
| Greenvale | .. | 3,980,245 | 465,355 | 3,514,890 | 49,897 | 2,926 | 17 | 1 | 0 |
| Blue Mountains | .. | 691,325 | .. | 691,325 | 5,192 | 980 | 5 | 5 | 11 |
| Gimmerburn | .. | 936,235 | 783,339 | 152,896 | 6,907 | 88 | 78 | 9 | 9 |
| Naseby | .. | 5,926,598 | 927,580 | 4,999,018 | 48,708 | 2,366 | 20 | 11 | 8 |
| Hanmer Springs | .. | 11,433,403 | 1,920,699 | 9,512,704 | 66,313 | 5,591 | 11 | 17 | 2 |
| Balmoral | .. | 5,078,337 | 764,560 | 4,313,777 | 49,153 | 4,667 | 10 | 10 | 7 |
| Raincliff | .. | .. | .. | 50,000 | 1,144 | 206 | 5 | 11 | 0 |
| Experimental Group. | |||||||||
| Waitahuna | .. | 42,025 | 11,500 | 30,525 | 330 | 11 | 30 | 0 | 8 |
| Dumgree | .. | 1,770,265 | 1,110,125 | 660,140 | 17,867 | 342 | 52 | 4 | 10 |
| Galloway | .. | 6,930 | 3,050 | 3,880 | 85 | 2 | 42 | 9 | 11 |
| Omarama | .. | 4,390 | .. | 4,390 | 81 | 2 | 40 | 6 | 5 |
| Westland | .. | 332,250 | .. | 332,250 | 6,324 | 482 | 13 | 2 | 2 |
| Tangimoana | .. | 96,765 | .. | 96,765 | 584 | 141 | 4 | 2 | 10 |
| Totals | 317,446 | 130,280,168 | 21,015,994 | 109,631,620 | 764,505 | 78,909 | 9 | 13 | 9 |
To provide trees for the State plantations, and also for distribution to local bodies and private individuals, four nurseries are maintained, the principal being that at Rotorua, where 114,000,000 trees have been raised since 1898. The South Island nurseries are situated at Hanmer, Tapanui, and Naseby. These, with three other nurseries now closed, had successfully raised 62,900,000 trees to the 31st March, 1926, the total for all State nurseries to that date being 176,900,000.
Of the total trees raised in nurseries to the 31st March, 1926, 129,700,000 had been utilized in State plantations and 18,200,000 for distribution to local bodies and settlers, the balance remaining in stock in the nurseries.
During the year ended 31st March, 1926, the nurseries disposed of 15,100,000 trees, of which 10,500,000 went to the State plantations and 4,600,000 to settlers, &c.
A large nursery was opened in 1923 at the South Island Forest Experiment Station in Westland.
The same forces that have enabled the Central Government to work to a wider objective in the creation of man-raised forests have also been reflected in the splendid interest shown by boroughs, town districts, counties, Power and Harbour Boards, and other local governments in the formation of commercial forests.
Twenty-nine local-government bodies in the North Island have established tree plantations, ranging in area from 2 ½ acres to 630 acres. In the South Island nineteen local authorities planted 1,221 acres during the period under review, the Dunedin City Council heading the list by establishing 450 acres, while other areas exceeding 100 acres were planted by the Selwyn Plantation Board (368 acres), Christchurch City Council (150 acres), and Ashburton County Council (118 acres).
The area of Crown land set aside for tree-planting purposes by local bodies was further increased by vesting 721 acres in the Whakatane County Council, and the disposal of further areas for the purpose of creating communal artificial forests is under consideration.
The year 1925–26 has set a new record in the history of New Zealand in the areas of tree plantations, wind-breaks, shelter-belts, and wood lots established by interests other than the State. A special feature of the State Forest Service activities is the raising of forest-tree plants of high quality for sale, at prices that cover merely actual cost and overhead expenses, to local bodies, School Committees, settlers, proprietary and co-operative afforestation companies, and others. This system, inaugurated in 1915, has resulted in the supply to date of some 18,200,000 trees, of which 4,600,000 were supplied during the year ended 31st March, 1926. In addition, many trees are obtained for private afforestation from the Dominion Federated Nurserymen's Association.
During 1925–26 the State Forest Service, which now operates an up-to-date seed-extracting plant, supplied 2,692 lb. of tree-seeds to Dominion and overseas growers, as compared with 2,529 lb. in 1924–25. The Service also co-operated with Forest Administrations abroad by exchanging considerable quantities of tree-seeds.
The State Forest Service encourages and fosters private planting by means of expert advice, personal instruction, correspondence, lectures and demonstrations at agricultural and industrial shows, distribution of circulars and leaflets, and preparation of planting plans. There is a special forest-extension officer in each Island.
The year 1925–26 witnessed a new planting record set by individuals, syndicates, tree-growing companies, and other industrial corporations, nearly 18,000 acres of forest plantations being established. The State Forest Service sold for these purposes 4,540,176 trees, and at least 10,000,000 trees were purchased or raised by others. From the information at the disposal of the Forest Service the area of commercial timber plantations formed was—
| Acres. | |
|---|---|
| State forest plantations | 15,964 |
| Farmers | 2,800 |
| Tree-planting companies and syndicates | 14,847 |
| Other industrial companies | 277 |
| Total | 33,888 |
The plantings for the current year will much exceed this figure.
Prior to 1923 forestation operations were carried on in the Dominion by the State Forest Service, the Prisons Department, a number of local bodies, and to a varying extent by farmers. Apart from the operations of the State Forest Service and the Prisons Department, the amount of forestation carried on, as indicated by the areas planted annually, was practically negligible.
Rising timber-prices, the certainty in the future of further decreases in the available supply, together with a reasonable assurance of a constant and growing demand, have in recent years drawn attention to the growing of timber for profit, and in 1923 the planting of forests was undertaken by commercial concerns. By the end of 1924 no fewer than twenty-five companies had registered under the Companies Act, 1908, for the purpose of carrying on forestation operations.
Two classes of companies were formed to carry out the various ventures entered upon. The first is the ordinary joint-stock company, where the property is vested in the company and the shareholders receive a pro rata share of the profits according to the amount of capital contributed; the second is a private company registered with a comparatively small capital, but of which the investing public do not become shareholders. The company contracts with each investor that in consideration of his paying the prescribed amount of cash it will convey to him at the end of a given term a certain area of land duly planted according to a prescribed agreement. The interests of the investing public are watched over by trustees appointed by investors, and the lands concerned are conveyed by way of mortgage to the trustees until the time for conveyance to the investor arrives. Of the nine returns dealt with in the inquiry referred to below, two are for companies organized on the latter basis; but, though in the minority in point of numbers, their operations are on a much larger scale.
In 1924 it was decided to collect statistics relating to commercial forestation in New Zealand, the initial collection to relate to the year ended 31st March, 1925. The following were the principal heads under which information was sought:—
Assets and liabilities.
Receipts and payments.
Employees engaged and salaries and wages paid.
Particulars of transactions in forest areas.
Particulars of nursery.
Particulars of plantation formed.
Particulars of thinning operations.
Particulars of land held for forestation purposes.
The whole of the twenty-five companies were approached for returns, but in sixteen cases operations had either been in progress for a few months or weeks only, or had not at the time been commenced. Particulars regarding these concerns have not been included in the data given hereunder.
It will be readily understood that commercial forestation was in its early infancy during the period covered by the statistical returns, and that definite conclusions cannot be drawn from the statistical data given, without the exercise of extreme caution.
The following statement shows the assets and liabilities of the forestation companies as at 31st March, 1925:—
| Liabilities. | ||
|---|---|---|
| £ | £ | |
| Capital— | ||
| Subscribed | 181,985 | |
| Less amount not paid up | 82,085 | |
| Paid up— | 99,900 | |
| Loans | 5,780 | |
| Mortgages | 157,184 | |
| Sundry creditors | 15,519 | |
| Other liabilities | 87,070 | |
| Total liabilities | £365,453 | |
| Assets. | ||
| Floating assets | 12,054 | |
| Investments | 3,742 | |
| Value of land | 208,220 | |
| Value of buildings | 2,652 | |
| Other fixed assets | 12,436 | |
| Development Account | 126,349 | |
| Total assets | £365,453 | |
The returns from the nine companies show that altogether £181,985 of share capital has been subscribed for. Of this amount £99,900, or over half, has been paid up. Considering that all the companies were in the formation period during the period covered, and, further, that no return on the investments will be realized until the forests mature, it is pertinent testimony to the keenness of the investors that approximately £100,000 cash was put into forestation schemes within the space of twelve months. The policy followed by the State Forest Service of popularizing forestry has no doubt paved the way for the newly created forestation companies, which appear to have reaped the advantage of the “forest consciousness” created in the public mind by the Service.
It will be seen that the item “mortgages, £157,184,” among the liabilities is greater than the paid-up capital, and exceeds the uncalled capital by a considerable margin. This is perhaps to be expected in the case of forestation companies, which are dependent on securing large tracts of suitable land, and must make provision for working capital to carry on with.
“Other liabilities, £87,070,” figure largely in comparison with the total (£365,453), but this is accounted for by the inclusion in this item of the instalments paid by purchasers of forest areas, which have been included in the returns as liabilities, being temporarily regarded as akin to loan-money.
On the assets side, as might be expected, the value of land held (£208,220) is the largest item, closely followed by “Development Account, £126,349.” In regard to the latter item, it is clear that, unless engaged in nursery or other revenue-producing operations, a forestation company will not derive any income (apart from thinnings, &c.) until its forests mature. This postponement of its returns renders the creation of a Development Account necessary, in order that the actual profit on the venture may be ascertained in due course. All expenditure is charged in the meantime to this account, and at the end of the period when the forests mature the amount standing to the debit of this account will be set against the proceeds from the sale of the timber. The result will then represent either profit or loss on the venture. Floating or liquid assets stand at £12,054, or 4 per cent. of the total assets, while buildings account for £2,652. Other fixed assets of various natures stand at £12,436.
Provision was originally made on the forms used for the collection of the necessary data for items of a revenue nature, but it was subsequently found that the treatment of the data on a receipts-and-payments basis was more suitable, and the latter system was followed.
The total receipts during the year amounted to £110,494, against recorded payments, £117,441, showing an excess of the latter of £6,947. The bulk of the receipts comprised cash of a capital nature received from shareholders, purchasers of forest areas, &c.
The principal payments are shown hereunder:—
| £ | |
|---|---|
| Tree-raising operations | 4,220 |
| Planting operations | 6,670 |
| Maintenance of forests | 2,054 |
| Management and office expenses | 40,832 |
| Other expenditure | 63,665 |
| £117,441 |
Being the first year (the formation period) the last two items will include many non-recurring payments, such as salesmen's commission, general flotation charges, &c.; while the planting and maintenance operations will be only just beginning.
The following table shows the average number of employees engaged during the year ended 31st March, 1925, together with the amount paid as salaries and wages during the same period:—
| Employees in connection with | Number. | Salaries and Wages. |
|---|---|---|
| £ | ||
| Tree-raising | 28 | 2,445 |
| Planting | 13 | 1,131 |
| Maintenance | 1 | 200 |
| Management | 6 | 1,307 |
| Totals | 48 | £5,083 |
Planting operations were merely in the embryo stage during the year under review. The following table gives particulars of the work carried on during the year in the way of areas planted:—
| Species of Trees planted. | Number of Trees planted. | Area planted. Acres. |
|---|---|---|
| Pinus radiata (insignis) | 970,000, | 3,231 |
| Eucalyptus eugenioides | 7,700 | 11 |
| Eucalyptus saligna | 700 | 1 |
| Eucalyptus pilularis | 700 | 1 |
| 979,100 | 3,244 |
Altogether 72,196 acres of land have been acquired by forestation companies. Of this area 650 acres are held under lease and 71,546 acres are freehold. Based on cost, the value of the freehold land was returned at £192,531, which gives an average of £2 14s. per acre.
In addition to the routine work carried out to this end by the State Forest Service, by authority of the Forests Act, 1921–22, great assistance is afforded by the State in other ways.
The method first adopted in New Zealand for inducing the planting of trees for the production of timber was by means of “land grants”—a settler being given a free grant of land if he planted a certain portion of his land with suitable trees. In Canterbury, where the system was adopted in the early “seventies,” an area of as much as two acres of Crown lands for one acre planted with trees was sometimes granted. Several large plantations that were established in Canterbury by this method may now be seen; and in some cases very good returns have during late years been obtained from the milling of these. The Selwyn and Ashburton County Councils are the outstanding examples of local bodies taking advantage of this scheme, and are now netting handsome revenues from their tree plantations.
The State assists also by reduction of rent to Crown-land tenants planting trees on their land, by granting subsidies to local bodies to aid in tree-planting schemes, and by remission of taxation on tree plantations.
New Zealand legislation gives distinct encouragement to the extension of afforestation by exempting the growing stock in plantations, though not the land itself, from the payment of certain taxes and rates. Income-tax is, of course, payable on profits from all classes of forests and forest products, but the royalty paid, or the cost of planting and growing the trees, is allowed as an item in the cost of production, and is not taxed. Land-tax is levied on plantation as well as on indigenous forest land, the unimproved value—and this is appraised as if the land were grazing-land only—being the basis for taxation. The remaining taxes—viz., death duties (estate, succession, and gift duties) and local rates—are levied on the value of the land, which is defined for this purpose to include, amongst other things, “all trees or flax growing or standing thereon provided that the value of any trees that have been planted (other than fruit-trees or live hedges) and the value of any trees that have been preserved for shelter or ornamental purposes shall not be included in any valuation appearing in a valuation roll supplied by the Valuer-General to a local authority.” As soon as a timber license is granted in respect to standing timber in a block of State (indigenous) forest the millable timber becomes subject to payment of local rates, payable by the licensee. Whether rating is on the improved or on the unimproved value, the value of standing timber in plantations—the sale value in the case of mature timber, and the cost value in the case of young crops—is not included in the value of the land for rating purposes.
Table of Contents
IN her fisheries, both sea and fresh-water, New Zealand possesses a most valuable asset, as her natural advantages in this connection are undoubtedly superior to those of any other country in the Southern Hemisphere. With its great extent of coast-line, splendid harbours, and numerous sheltered bays, and with an abundance and splendid variety of edible fishes, this Dominion must in time become a great fishing-centre in the South Pacific, providing for its people a regular and abundant supply of this necessary food, besides developing a large export trade in fresh, cured, and canned fish to other countries.
In all countries which possess large supplies of food fishes the harvest of the sea is recognized as a great and extremely reproductive one for the employment of capital, and there is no doubt that when the fishing industry of this Dominion is placed on a proper footing capital will be readily invested, and that it will at once become one of the important and profitable sources for the employment of labour. The value and importance of New Zealand's fisheries at the present time are as nothing compared with the possibilities which the future holds.
It is important to call attention to the fact that the resources of the sea, unlike food resources produced from the land, are not endangered in time of war and international trouble. A nation with well-developed sea-fisheries is never in danger of starvation. The vast schools of fish in the sea, unlike the resources of the land, are available at practically all times, and can be most economically and reliably utilized. Great international crises and dangers of war do not affect the inhabitants of the deep, which do not require constant human labour to cultivate. Agriculture, stock-raising, &c., demand such constant labour and so much investment of capital that in time of trouble the utilization of these resources may be seriously interfered with, and farms are liable to be laid waste, and the activities essential to their cultivation and utilization may be turned to military duties or to other purposes. It is not too much to say, therefore, that the fish resources are amongst the most valuable and most lasting of all national resources.
Provision exists in the Fisheries Act, 1908, whereby owners of boats and fish-curers may be required to make returns to the Marine Department in such form and in such manner as may be prescribed by the Governor-General in Council, but advantage of this provision has not yet been taken to enable information to be collected as to quantity of fish caught. A statement is, however, compiled annually by the Chief Inspector of Fisheries as to the weight and value of fish caught. The figures for each fishing-port are as follows for the year ended 31st March, 1926:—
| Name of Port. | Principal Kinds of Fish caught. | Quantity. | Total Value.£ |
|---|---|---|---|
* Information not available. | |||
| Hokianga | Snapper, mullet, kahawai, flounder | * | * |
| Russell | Crayfish, mullet, hapuku, snapper, flounder. kahawai, kingfish, maumau | 15,800 cwt. | 9,600 |
| Whangarei | Snapper, mullet, flounder, hapuku | 2,348 cwt. | 4,749 |
| Kaipara | Snapper, flounder, mullet, kahawai, trevally, gurnard | 4,300 cwt, | 9,300 |
| Toheroa | 980 cases | 1,715 | |
| Auckland District | Snapper, tarakihi, trevally. flounder, sole, gurnard, hapuku, john-dory, kingfish, mold, rock-cod, kahawai, butterfish, crayfish, barracouta, mullet, garfish | 159,588 cwt. | 147,429 |
| Crayfish | 2,220 cases | 3,050 | |
| Mussels | 1,600 sacks | 500 | |
| Tauranga | Snapper, hapuku, trevally, kahawai, rock-cod, garfish, moki, flounder, crayfish | 3,000 cwt. | 5,599 |
| Gisborne | Tarakihi, gurnard, snapper, flounder, soles, kahawai, hapuku, crayfish | 2,514 cwt. | 3,752 |
| Napier | Tarakihi, snapper, mold, kahawai, gurnard, trevally, hapuku, southern kingfish, barracouta, john-dory, flounder, sole, brill | 24,224 cwt. | 32,581 |
| Crayfish | 780 sacks | 1,462 | |
| Whitebait | 3,200 lb. | 400 | |
| Shell-fish (pipis, cockles, mussels) | 310 sacks | 194 | |
| New Plymouth | Snapper, hapuku, kingfish, tarakihi, kahawai, cod, crayfish, gurnard | 1,200 cwt. | 1,680 |
| Wanganui | Blue-cod, hapuku, flounder, snapper | 293 cwt. | 464 |
| Foxton | Flounder, snapper, hapuku, kahawai, whitebait | 500 cwt. | 1,600 |
| Wellington | Tarakihi, gurnard, flounder, sole, snapper, ling, warehou, hapuku, moki, butterfish, blue cod, southern kingfish | 70,662 cwt. | 109,307 |
| Picton | Hapuku, moki, butterfish, garfish, crayfish, blue cod | 6,200 cwt. | 9,300 |
| Blenheim | Red cod, sole, flounder, ling, snapper, moki, hapuku, gurnard, tarakihi, mackerel, butterfish, crayfish | 2,000 cwt. | 3,750 |
| Nelson | Snapper, flounder, gurnard, bream, hapuku, cod, crayfish, barracouta | 1,400 cwt. | 1,517 |
| Westport | Red cod, crayfish, flounder, groper, gurnard, kahawai, ling, moki, snapper, sole, turbot, whitebait | 820 cwt. | 3,310 |
| Greymouth | Flounder, sole, cod, groper, snapper, whitebait, herring | 30 cwt. | 168 |
| Whitebait | 24,000 lb. | 3,000 | |
| Hokitika | Groper, snapper, flounder, herring, kahawai | 50 cwt. | 100 |
| Whitebait | 94,595 lb. | 8,904 | |
| Kaikoura | Groper, ling, trumpeter, southern kingfish, butterfish, tarakihi, moki, crayfish | 2,319 cwt. | 4,200 |
| Kaiapoi | Whitebait, kahawai, flounder | 234 cwt. | 980 |
| Akaroa | Groper, ling, conger eel, flounder, sole, brill, blue and red cod, crayfish, barracouta, kingfish, kahawai, moki, butterfish, &c. | 1,200 cwt. | 1,900 |
| Lyttelton | Groper, barracouta, red cod, ling, flounder, sole, gurnard, brill | 12,000 cwt. | 18,000 |
| Southbridge (Lake Ellesmere) | Flounder, herring | 500 cwt. | 2,000 |
| Timaru | Flounder, sole, brill, groper, ling, red cod, gurnard, kingfish, barracouta | 4,400 cwt. | 6,600 |
| Oamaru | Groper, red cod, blue cod, moki, barracouta, ling | 2,174 cwt, | 2,966 |
| Moeraki | Groper, red cod, blue cod, moki, crayfish, barracouta, ling | 3,065 cwt. | 5,038 |
| Otago District | Groper, ling, red cod, barracouta, kingfish, blue cod, moki, trumpeter, tarakihi, trevally, mullet, garfish, kahawai, gurnard, kelpfish, sole, flounder, brill, skate | 43,540 cwt. | 45,717 |
| Invercargill | Blue and red cod, groper, moki, flounder, kingfish, mullet, ling, sole, crayfish, barracouta, whitebait | 1,750 cwt. | 4,300 |
| Bluff | Groper, blue cod, flounder | 9,686 cwt. | * |
| Stewart Island | Blue cod, groper, trumpeter, moki | 7,639 cwt. | 13,480 |
| Chatham Is -lands | Blue cod, hapuku, trumpeter | 4,775 cwt, | 12,825 |
According to the figures given by the Inspector of Fisheries at the various ports, the quantity of fish brought in from the fishing-grounds for the year ended the 31st March, 1926, was about 390,000 cwt., representing a wholesale value of nearly £500,000. The wholesale value of the oysters landed from the various beds was £27,782, and the produce of the whale-fisheries was £10,640.
Included in New Zealand produce exported during the last five years were—
| Item. | 1921. | 1922. | 1923. | 1924. | 1925. |
|---|---|---|---|---|---|
| £ | £ | £ | £ | £ | |
| Fish | 34,337 | 43,356 | 69,328 | 58,417 | 55,423 |
| Oysters | 965 | 1,713 | 762 | 571 | 1,474 |
| Whalebone | 244 | .. | 425 | 290 | 160 |
| Whale-oil | 7,505 | 2,310 | 6,072 | 6,515 | 10,451 |
| Ambergris | .. | .. | 75 | 2,000 | 1,200 |
| Other products of fisheries | 165 | 44 | 89 | 103 | .. |
| Totals | 43,216 | 47,423 | 76,751 | 67,896 | 68,708 |
The value of fish (preserved) imported in 1925 was £190,794.
A further table is given showing for each port from which returns have been received the number of steam trawlers, oil-engine trawlers, and other vessels employed in line and net fishing, with the number of fishermen employed, and approximately the total number of persons engaged in the fishing industry, for the year ended the 31st March, 1926.
| Name of Port. | Steam Trawlers. | Oil-engine Trawlers. | Line- and Net-fishing Vessels. | Number of Fishermen employed. | Persons other than Fishermen employed. | Total Number of Persons employed. |
|---|---|---|---|---|---|---|
* Including Thames, Coromandel, Manukau. † Danish seiners. | ||||||
| Hokianga | .. | .. | 15 | 22 | .. | 22 |
| Russell | .. | .. | 56 | 174 | 40 | 214 |
| Whangarei | .. | .. | 15 | 18 | 8 | 26 |
| Kaipara | .. | .. | 34 | 50 | 10 | 60 |
| Auckland* | 5 | 23† | 270 | 530 | 350 | 880 |
| Tauranga | .. | .. | 36 | 30 | 6 | 36 |
| Gisborne | 1 | .. | 10 | 32 | 6 | 38 |
| Napier | 30 | .. | 85 | 167 | 20 | 187 |
| New Plymouth | 1 | .. | 19 | 45 | 25 | 70 |
| Wanganui | .. | .. | 10 | 4 | .. | 4 |
| Foxton | .. | .. | 23 | 49 | 5 | 54 |
| Wellington | 1 | .. | 105 | 180 | 115 | 295 |
| Picton | 1 | .. | 42 | 78 | .. | 78 |
| Blenheim | .. | 13 | .. | 20 | 2 | 22 |
| Nelson | .. | 3 | 78 | 125 | 8 | 133 |
| Westport | 1 | .. | 16 | 24 | 6 | 30 |
| Greymouth | .. | .. | 12 | 6 | 2 | 8 |
| Hokitika | .. | .. | 2 | 1 | 6 | 7 |
| Kaikoura | .. | .. | 18 | 20 | 2 | 22 |
| Kaiapoi | .. | .. | 16 | 16 | .. | 16 |
| Southbridge | .. | .. | 20 | 40 | .. | 40 |
| Lyttelton | 1 | 3 | 92 | 140 | .. | 140 |
| Akaroa | .. | .. | 15 | 24 | .. | 24 |
| Timaru | .. | 24 | .. | 25 | 8 | 33 |
| Oamaru | .. | .. | 9 | 15 | .. | 15 |
| Moeraki | .. | .. | 27 | 30 | .. | 30 |
| Otago | 5 | 9 | 93 | 186 | 126 | 312 |
| Invercargill | .. | .. | 34 | 40 | 15 | 55 |
| Bluff | .. | .. | 51 | 124 | 20 | 144 |
| Stewart Island | .. | .. | 35 | 91 | 11 | 102 |
| Totals | 46 | 75 | 1,238 | 2,306 | 791 | 3,097 |
The principal oyster-beds round the coast of New Zealand are those situated in Foveaux Strait, between South and Stewart Islands, and the rock-oyster beds on the east and west coasts of the Auckland Peninsula. The Foveaux Strait beds are very extensive, and are considered to be inexhaustible. An official prospecting cruise was carried out in respect of these beds in 1904, resulting in a number of new beds being discovered and reliable information being ascertained concerning the areas and qualities of the various beds.
During the 1925 season 26,039 sacks of oysters, valued at £17,576, were picked from the Foveaux Strait beds, as compared with 23,796 sacks, valued at £14,873, in 1924.
The rock-oyster beds of Auckland were worked for many years under a variety of systems, including the leasing of the beds to individuals and the licensing of pickers to take oysters on payment of a fee, but owing to stripping of the beds close seasons had frequently to be proclaimed. For some years an export duty of 6d. per hundredweight was payable on all North Island oysters exported, and in 1899 the export of rock-oysters and also of mangrove-oysters was absolutely prohibited. A further step towards conserving the beds was taken in 1908, when the picking and wholesale marketing of rock-oysters from the North Island beds was undertaken by the State, private picking being prohibited. A table is given showing the quantity and value of oysters picked and sold by the State during each of the last five years; also the cost of picking and selling, this item including interest and depreciation on the cost of the oil-launches used by the Inspectors. It will be seen that a profit accrues to the State, and the scheme has, moreover, resulted in the conservation and extension of the beds.
| Season. | Oysters sold. | Prices realized. | Cost of Picking and Selling. |
|---|---|---|---|
| Sacks. | £ | £ | |
| 1921 | 7,160 | 7,763 | 4,531 |
| 1922 | 7,323 | 7,703 | 4,731 |
| 1923 | 6,801 | 7,132 | 4,410 |
| 1924 | 6,841 | 8,395 | 5,503 |
| 1925 | 8,281 | 10,206 | 6,792 |
Various attempts were made several years ago by private persons to form artificial oyster-beds, but none of these met with success.
Realizing the necessity for extending and improving the oyster-beds in the Auckland District, the Marine Department in 1909 and 1910 commenced replanting the bays and foreshore on the Coromandel coast. These beds had been practically wiped out by the old system of licensed picking. The system adopted by the Department for stocking depleted areas consisted of taking rocks covered with oysters of all ages from well-stocked beds and planting them in suitable places along the foreshore. The work done on the Coromandel coast and at the Bay of Islands has been very successful, and several of the replanted beds are now well stocked with mature oysters. Recently the formation of new beds has been undertaken. This consists of the building of hollow rock walls in sheltered bays and on tidal flats. In the spawning season the oyster-spat attaches itself to the under-side of the rocks, which are allowed to remain in that position until a month or two before the next spatting season comes round, when they are turned over and the other side of the rocks in turn becomes covered with spat.
Oyster-cultivation work was continued during the year in the Hauraki Gulf, Bay of Islands, and Whangarei. The rock walls previously built are now well covered with young oysters. A large number of the oysters on the walls built at Bay of Islands in 1920 and 1921 are now ready to pick for market.
In the earlier part of the nineteenth century New Zealand was the centre of an important whale-fishery, many whaling-stations being established in the North of Auckland and in Cook and Foveaux Straits. The industry gradually declined in importance until at present only two or three stations remain. The whales caught are mostly of the hump-back variety. At Whangamumu, North Auckland, a whaling-steamer, fitted with the most modern appliances for killing and handling whales, has been placed in commission, and a very serviceable whaling plant has been established. Forty-eight whales were taken last season (1925) in this locality, yielding 250 tons of oil and 40 tons of bonedust, of a total value of approximately £6,400. Whaling operations are also carried on in Tory Channel, in Marlborough. The value of the product of the Marlborough whale-fisheries in 1925 (232 tons of oil) was £4,250–48 humpback whales were taken.
A reference to the whaling operations carried out in the Ross Sea appears in the section on “Islands attached to New Zealand.”
A close season for seals existed in New Zealand from the end of August, 1894, until 1913, but owing to poaching, which it was found impossible to stop, the seals did not increase to any great extent. It was proposed a few years ago to grant licenses for the right to take seals, one of the conditions of which was that a royalty should be paid on each skin. Tenders were invited for the licenses, but none was received. At present the taking of seals is prohibited.
A site for a marine fish-hatchery was selected at Purakanui, Otago, in 1900, but this being found unsuitable for its intended purpose another site was chosen at Portobello, in Otago Harbour. The erection of the hatchery was carried out by a Board set up to superintend the work of the hatchery, funds being provided by the State, and grants being made by the Otago Institute, the Australasian Association for the Advancement of Science, and a number of acclimatization societies. The State makes an annual grant towards the maintenance of the hatchery, the buildings and equipment of which have also been added to from time to time.
Experiments have been carried out with a view to introducing English food fishes to New Zealand waters, and these have been fairly successful as regards the three species dealt with so far—viz., lobsters, edible crabs, and turbot. Much valuable work has also been done in. the direction of hatching the spawn of various indigenous fishes and in making a study of their life-habits.
The early colonists who emigrated from Britain to New Zealand were much surprised to find a country with such splendid rivers and lakes, but with no fish of any commercial or sporting value in them. In a few years the question of introducing some of the British salmonidæ was considered, and as early as 1864 the matter assumed definite shape when the Otago Provincial Council took it up, and voted a sum for the importation of Atlantic salmon and English brown trout. There was, however, some delay in arranging for shipment, and it was not until 1868 that the first consignments of salmon and trout eggs arrived. Since that time the English brown trout (S. fario), Loch Leven (S. levenensis), American rainbow (S. irideus), American brook-trout (S. fontinalis), Quinnat salmon (O. tschawytscha), Atlantic salmon, English perch and tench, have been successfully acclimatized.
Ova of the sockeye or blue-back salmon were imported in 1902, and specimens of this fish were caught in 1907. A number exist in Lake Ohau, having acquired a land-locked habit. These fish run up creeks at the head of the lake and spawn there every season in March and April.
Several shipments of whitefish-ova have been made since 1898, the fry being liberated in Lakes Kanieri and Tekapo. Reports as to the fish having been seen are received from time to time, but so far as is known no whitefish have yet been caught.
With the exception of the Hot Lakes District, which is under the control of the Department of Internal Affairs, the propagation of trout and the oversight of fishing operations is carried out by local Acclimatization Societies, fishing licenses being issued on payment of a small fee.
As already stated, the first shipment of Atlantic-salmon eggs arrived in 1868, and from that year to 1902 about fifteen consignments were brought out. Some of the earlier shipments arrived in bad condition, and none had a loss of less than 25 per cent. Up to 1908 there was no proof that these fish had been acclimatized, and the Government that year decided to make a vigorous and systematic effort to establish them in one of our best rivers. The Waiau, in Southland, was chosen as the most suitable, and a hatchery, capable of accommodating a million eggs, was erected on a cold-water creek near the lower end of Lake Te Anau. A quarter of a million eggs were obtained from eastern Canada in 1908, and one million from England in 1909, and the same number from England in 1911. In each case an expert was sent to pack the eggs and attend to them on the voyage out, with the result that each shipment arrived with a loss of not more than 1 per cent.
In the 1920–21 and 1921–22 angling seasons salmon-smolts were taken near the mouth of the Waiau. Inspection of the Upokororo, the tributary into which most of the young fish hatched from the three shipments referred to above had been liberated, disclosed the fact that a number of salmon had spawned there, and three specimens caught on the spawning-beds were definitely identified as Atlantic salmon. In 1922–23 fifty-six Atlantic salmon were caught in the Waiau and its tributaries. During the 1923–24 season good catches were made by anglers in the Upokororo and Eglington Rivers and in Lake Te Anau near its outflow, and several were caught in the lower reaches of the Waiau. The total number taken by anglers that season was approximately three hundred.
During the season 1925–26 approximately 700 salmon were caught by anglers. Most of the fish were taken in the Upokororo River and at the outlet of Lake Te Anau. The fish continue to increase rapidly. Last spawning season the weather and river conditions were favourable for collecting salmon-eggs, and close on a million were secured. The Marine Department is now stocking the Wanganui River, in the North Island, with these fish, and most of the eggs collected in the last three seasons have been hatched out at the Government hatchery on Waitea Creek, on the upper Wanganui, and the young fish liberated in suitable tributary streams and in the main river. The balance of the eggs collected have been allotted to the Clutha and Waiau Rivers.
The first importation of quinnat-salmon eggs was made in 1875, and from that date to 1880 several shipments were made. On the arrival of these consignments the eggs were parcelled out to the different acclimatization societies, and the young fish hatched were planted in rivers from the north of Auckland to the far south, but no results were obtained from these shipments.
In 1900 the Government decided to make a vigorous effort to establish this fish, and decided to confine its efforts to one of the rivers considered to be the most suitable, and the Waitaki was chosen, as in its general characteristics it bears a considerable resemblance to some of the salmon rivers on the Pacific coast of America. The first shipment of eggs for the Government salmon-hatchery arrived in January, 1900. From that year to 1907 annual importations of half a million eggs each year were made, and, as they were specially packed and attended to by an expert during the voyage, they invariably arrived in splendid condition; the loss would not be more than ½ per cent. The result of the systematic effort made to establish the quinnat has been highly successful. In the seasons of 1905 and 1906 they were found spawning in the Hakataramea and other tributaries of the Waitaki, and in 1907 fifty thousand eggs were collected from salmon caught in the Hakataramea. Since then there has been a steady increase in the Waitaki every season, and they have now spread into all the snow-fed rivers north as far as the Waiau, North Canterbury.
The run of quinnat salmon this season (1926) in all the snow-fed rivers on the east coast was by far the largest which has been experienced since their introduction. Netting licenses were issued for taking salmon for market, in the estuary of the Waimakariri, and in a section of the Rangitata; and licenses for £1 for the season were issued to anglers empowering them to sell their catches. Sea-fishermen, on payment of a license fee of £1, were allowed to take salmon and market their catches. The number of eggs collected last season was 672,000, of which 500,000 were sent to the Government hatchery at Maori Creek, the young fish being liberated in the Wairau River and its tributaries.
Table of Contents
IN no other country of equal size to New Zealand are indications of a greater number of economic minerals to be found, yet, with the exception of iron-ore, the known mineral reserves are not great in comparison with those in many other countries. The coal reserves of the Dominion are considerable, however, and their duration will be extended by the utilization of the enormous water-power resources of the country.
The gold-mining industry, which in its early stages contributed greatly to the progress and settlement of New Zealand, has for a number of years declined in importance, in common with the experience of most other gold-producing countries.
The following statement shows the quantity and value of the production of metalliferous mines, of stone-quarries under the Stone-quarries Act, and of coal-mines during 1924 and 1925:—
| Mineral. | 1924. | 1925. | ||
|---|---|---|---|---|
| Quantity. | Value. | Quantity. | Value. | |
* In respect of gold, ounces of the fineness of 20 carats and upwards. | ||||
| Oz. | £ | Oz. | £ | |
| Gold and silver (estimated)* | 652,855 Tons cwt. | 607,253 | 625,626 Tons cwt. | 546,026 |
| Tungsten-ore | 3 0 | 126 | 1 15 | 64 |
| Iron | 630 0 | 4,725 | 1,289 0 | 8,701 |
| Stone | .. | 373,827 | .. | 463,667 |
| Pumice | 1,629 0 | 4,956 | 2,532 0 | 7,672 |
| Sulphur | .. | .. | 269 0 | 1,154 |
| Coal | 2,083,207 0 | 2,083,207 | 2,114,995 0 | 2,114,995 |
| Totals | .. | 3,074,094 | .. | 3,142,279 |
The production of gold and silver is of necessity taken together, as separate figures are not available. Kauri-gum, the fossilized resin of former kauri forests, is counted as a mineral, but the production figures are not available.
The next statement shows the value of New Zealand minerals exported from the 1st January, 1853, to the 31st December, 1925, with separate details for the years 1924 and 1925:—
| Mineral. | 1924. | 1925. | Increase or Decrease. | Total from 1st January, 1853, to 31st December, 1925. |
|---|---|---|---|---|
| £ | £ | £ | £ | |
| Gold | 551,788 | 472,364 | Dec. 79,424 | 91,887,192 |
| Silver | 71,981 | 60,773 | ,, 11,208 | 2,965,424 |
| Quicksilver | .. | .. | .. | 8,336 |
| Tungsten-ore | 1,156 | 2,255 | Inc. 1,099 | 304,125 |
| Manganese | 36 | .. | Dec. 36 | 61,994 |
| Kauri-gum | 443,576 | 414,901 | ,, 28,675 | 21,522,986 |
| Other minerals | 12,692 | 8,419 | ,, 4,273 | 441,373 |
| Coal | 161,432 | 235,047 | Inc. 73,615 | 5,920,146 |
| Totals | 1,242,661 | 1,193,759 | Dec. 48,902 | 123,111,576 |
Gold-mining operations in New Zealand are divided into three branches, viz.: (1) Quartz-mining, (2) alluvial mining, and (3) dredging.
The actual figures of gold-production are not available owing to no distinction being made between gold and silver in the case of mines which produce both. The following statement shows the value of the bullion-production during 1925, also the number of persons employed, and the number of gold-mines and dredges:—
| — | Production of Bullion.* | Number of Persons ordinarily employed at Productive and Unproductive Mines and Dredges. | Number of Productive Mines and Dredges. | |
|---|---|---|---|---|
| Quantity. | Value. | |||
*Including a proportion of silver. | ||||
| Oz. | £ | |||
| Quartz-mining | 604,044 | 460,042 | 1,089 | 22 |
| Dredge mining | 10,037 | 40,994 | 107 | 5 |
| Alluvial mining | 11,545 | 44,990 | 470 | 248 |
| Totals, 1925 | 625,626 | 546,026 | 1,666 | 275 |
| Totals, 1924 | 652,855 | 607,253 | 1,829 | 301 |
The quantity of bullion produced during the year 1925 was 27,229 oz. less than in the previous year, and the value less by £61,227. This reduction was principally due to the diminished returns from quartz-mining in Waihi Borough and Tauranga County, though decreases were also shown in the gold obtained from dredging and from alluvial mining.
The export of gold according to districts of production during 1924 and 1925, together with the total since April, 1857, when the first parcel was exported, is as shown in the next table.
| GOLD EXPORTS, 1924 AND 1925, AND TOTAL, 1857–1925. | ||||||
|---|---|---|---|---|---|---|
| District. | 1924. | 1925. | Total, 1857–1925. | |||
| Quantity. | Value. | Quantity. | Value. | Quantity. | Value. | |
| Oz. | £ | Oz. | £ | Oz. | £ | |
| Auckland | 82,757 | 347,932 | 72,092 | 301,377 | 7,236,109 | 28,074,102 |
| Wellington | .. | .. | .. | .. | 188 | 706 |
| Marlborough | 27 | 110 | 569 | 2,138 | 106,048 | 412,892 |
| Nelson | 148 | 576 | 105 | 398 | 1,741,206 | 6,903,761 |
| West Coast | 38,667 | 154,599 | 37,516 | 150,599 | 6,446,432 | 25,588,958 |
| Canterbury | 13 | 50 | 20 | 79 | 155 | 611 |
| Otago | 11,451 | 46,150 | 3,609 | 14,605 | 7,752,119 | 30,871,427 |
| Unknown | 568 | 2,371 | 785 | 3,168 | 8,530 | 34,735 |
| Totals | 133,631 | 551,788 | 114,696 | 472,364 | 23,290,787 | 91,887,192 |
The most important gold-mining operations in New Zealand consist in the working of quartz lodes and the extraction of the precious metals therefrom. Quarts-mining is conducted in the North Island in the Ohinemuri County, and to a less extent in the Tauranga, Thames, and Coromandel Counties. The mountain-ranges and hills of andesite and other volcanic rocks which form the Hauraki Goldfields are intersected by lodes containing gold and silver. In the South Island quartz-mining operations are carried on in the Reefton and Blackwater districts, also to a small extent in the Wakamarina Valley (Marlborough). In Otago operations are generally confined to the working of quartz-mines in which scheelite is associated with gold. The average value per ton of ore treated during 1925 amounted to £1 17s. 3d., as compared with £1 17s. 7d. during 1924.
Alluvial gold is found chiefly on the west coast of the South Island and in Otago, where mining operations have been conducted over an area of 17,000 square miles. On the West Coast the auriferous alluvium originated from the weathering and denudation of the gold-hearing lodes during countless ages. The rich leads or defined placers of auriferous wash are the result of concentration. The first transportation of auriferous gravel from the mountains was by streams, and following this the glaciers carried much material from the interior seawards. During the advance and retreat of these glaciers immense masses of drift were deposited all over the low lands and even high up on the lower hills. Since glacial times the rivers have continued the movement of auriferous gravel from the interior to the sea. In Otago the conditions are different—the alluvial gold rests in the hollows of the denuded surface of the schistose rocks, from which it has most probably been derived.
The method of working these deposits depends on the depth of the superincumbent strata and the elevation at which they occur: where there is ample fall and a good supply of water is available, hydraulic sluicing has been generally adopted; but where the material is mainly or partly below water-level, and is comparatively free from hard boulders or hard matrix, elevating or dredging is employed.
This system of gold-mining, which originated in New Zealand, is generally employed upon rivers and streams and at places where the sluicing method may not be advantageously applied owing to the absence of water-supply or to excessive water in the deposits. Gold-dredging is rapidly declining in importance, the number of productive dredges having decreased from 167 during 1906 to five during 1925.
The greatest weekly output by a New Zealand gold-dredge was attained by the “Lady Ranfurly” during six days ended the 4th November, 1904, when operating on the River Molyneux (Clutha), 1,273 oz. of gold being obtained.
The following table shows the result of gold-dredging operations in New Zealand from 1916 to 1925 inclusive:—
| Year. | Total Number of Dredges working. | Value of Production. | Average Production per Dredge. | Dividend-paying Dredges owned by Registered Companies. | Number of Persons employed. | |
|---|---|---|---|---|---|---|
| Number. | Dividends. | |||||
| £ | £ | £ | ||||
| 1916 | 45 | 125,317 | 2,785 | 10 | 9,915 | 392 |
| 1917 | 35 | 91,666 | 2,619 | 6 | 4,800 | 260 |
| 1918 | 28 | 63,691 | 2,274 | 5 | 4,925 | 187 |
| 1919 | 19 | 47,838 | 2,518 | 4 | 2,845 | 138 |
| 1920 | 12 | 34,672 | 2,889 | 1 | 1,400 | 112 |
| 1921 | 11 | 36,179 | 3,289 | 1 | 600 | 136 |
| 1922 | 11 | 67,239 | 6,113 | .. | .. | 121 |
| 1923 | 8 | 68,003 | 8,500 | 1 | 3,283 | 100 |
| 1924 | 5 | 58,540 | 11,708 | 1 | 6,566 | 78 |
| 1925 | 5 | 40,994 | 8,199 | 1 | 3,283 | 107 |
Of the total production in 1925, £35,720 was won by the Rimu Flat dredge at Rimu, on the West Coast, and £4,960 by three dredges in Otago and Southland.
During the year 1924 the Kawarau Gold-mining Company (Limited) made a commencement with the damming of Lake Wakatipu. The dam is equipped with ten stony sluice-gates, each having an effective waterway 40 ft. in width by 7 ft. 6 in. in height, and each being supported at its end by massive concrete pillars, of which there are eleven, including the abutments. The object of this work is to keep back the water in Lake Wakatipu during certain months of the year, and thus enable mining operations to be carried out as far as possible in the Kawarau River. The company has subleased, under tribute agreements, portions of the mining rights held by it in the Kawarau River. Substantial sums of money have been raised by the subsidiary companies for the purpose of carrying on mining operations in the river.
During the year 1925 eight of the eleven piers required for the dam and four spans of the overhead bridge were constructed, and the dam itself was finally completed in August, 1926. The gates of the dam were closed for the first time on the 30th of the same month and operated satisfactorily.
The following figures showing the world's gold-production for the last ten years have been compiled from official sources by the American Bureau of Metal Statistics:—
| Year. | Fine Ounces. |
|---|---|
| 1916 | 21,976,437 |
| 1917 | 20,611,049 |
| 1918 | 18,556,920 |
| 1919 | 17,629,977 |
| 1920 | 16,125,697 |
| 1921 | 15,983,772 |
| 1922 | 15,444,830 |
| 1923 | 17,786,472 |
| 1924 | 18,852,432 |
| 1925 | 19,061,926 |
Nearly the whole of the silver exported from New Zealand, amounting in value at the end of 1925 to £2,965,424, has been obtained from the refinement of bullion from the quartz-mines, principally those of the Hauraki Goldfield, where the two precious metals are found alloyed, the ratio of the two metals in the alloy varying greatly. No other silver-mining operations have been carried out profitably in this country.
Iron-ore occurs in New Zealand at Parapara, Golden Bay; on the seashore in Taranaki; at Kerr Point and Waitangi River, North Auckland; in the Raglan-Kawhia district; on Mount Peel, Nelson; on Mount Royal, near Palmerston; on Table Hill, near Milton; in the Lake Wakatipu district; and in the Mount Cook district, Westland.
The most extensive iron-ore deposits occur near Parapara and Onakaka, Golden Bay, in the Nelson Province. The limonite-deposit of this locality is of great extent, and it is estimated in “Iron-ore Resources of the World,” published by the International Geological Congress, to contain 64,000,000 metric tons, of which about 30,000,000 tons occur in the Onakaka Block.
At Onakaka the ore and crystalline limestone flux occur at an altitude of about 1,200 ft. above the works, being conveyed thereto by aerial tramway 8,000 ft. in length.
During 1921 the Onakaka Iron and Steel Company constructed a blast-furnace installation on its lease at Onakaka. The present capacity of the plant is 25 tons of pig iron per day, but it could be altered at little cost to produce an output of 50 tons per day.
A trial run was made in 1922, the first half with coke imported from Australia, and the second half with coke from Miramar gasworks made from Liverpool (N.Z.) coal. The latter gave results at least as good as those from Australian coke, and the consumption of coke in both cases was 22 cwt. per ton of pig iron produced. The pig iron was of good marketable quality, and was reported on favourably by users in different parts of the Dominion. The two important facts demonstrated by the test were—(1) That a good foundry pig iron could be produced by the Onakaka plant; (2) that the furnace could be run with Miramar coke as fuel and with a consumption of 22 cwt. of coke per ton of iron.
The company has erected a wharf about 1,000 ft. in length at Onakaka for the purpose of providing facilities for landing coal or coke and shipping its products to different parts of the Dominion. Between the 12th January, 1924, and the 8th of the following month about 1,000 tons of pig iron were produced. It was then found that the cost of transportation of coal from the wharf to the works, and of pig iron from the works to the wharf, by means of motor-wagons along the road was too high. The company thereupon arranged to have a rope-road constructed, which work has now been completed. It was also found that the number of coke-ovens previously built was inadequate, and additional coke-ovens have been erected.
During the year 1925 1,290 tons of pig iron of fair quality were produced. The analyses of three samples show its average composition to be as follows: Graphite carbon, 3.02 per cent.; combined carbon, 0.48; silicon, 2.11; sulphur, 0.07; phosphorus, 0.32; manganese, 0.76; iron, 93.24.
| TABLE SHOWING THE CHEMICAL COMPOSITION OF ONAKAKA PIG IRON (TAPPED 29TH APRIL, 1922), AND, FOR COMPARISON, THAT OF THE PRINCIPAL BRANDS OF FOUNDRY PIG IRON MANUFACTURED ELSEWHERE. | ||||||||
|---|---|---|---|---|---|---|---|---|
| Brand of Pig Iron. | Chemical Composition per Cent. | Kind of Iron. | ||||||
| Iron. | Graphitic Carbon. | Combined Carbon. | Silicon. | Phosphorus. | Sulphur. | Manganese. | ||
| Onakaka, sample 2 | 92.10 | 2.89 | 0.19 | 3.92 | 0.22 | 0.04 | 0.64 | Foundry. |
| Carron, Scotland (as imported to New Zealand) | 91.82 | 3.50 | 0.14 | 2.80 | 0.70 | 0.035 | 1.00 | No. 1 foundry |
| Ditto | 92.63 | 3.35 | 0.20 | 2.15 | 0.70 | 0.06 | 0.91 | No. 2 foundry. |
| Summerlee (as imported to New Zealand) | 92.03 | 3.00 | 0.25 | 2.75 | 0.80 | 0.03 | 0.85 | No. 3 foundry. |
| Lithgow (Hoskins), New South Wales, 1914 | .. | .. | .. | 2.00 | 0.85 | 0.03 | 1.00 | Foundry. |
| Characteristic samples quoted in “The Manufacture and Properties of Iron and Steel.” by H. H. Campbell | 92.37 | 3.52 | 0.13 | 2.44 | 1.25 | 0.02 | 0.28 | No. 1 grey. |
| 92.31 | 2.99 | 0.37 | 2.52 | 1.08 | 0.02 | 0.72 | No. 2 grey. | |
| Alabama | .. | 3.49 | 0.07 | 2.8 to 3.5 | .. | .. | .. | No. 1 foundry. |
| ANALYSES OF ORE, FLUX, AND SLAG. | |||
|---|---|---|---|
| Iron-ore (Limonite). | Crystalline Limestone (Flux). | Slag from Furnace. | |
* Equivalent to metallic iron, 50.16 per cent. | |||
| Silica (SiO2) | 12.13 | 10.26 | 40.03 |
| Alumina (Al2O3) | 2.79 | 2.12 | 12.87 |
| Ferrous oxide (FeO) | .. | .. | 2.73 |
| Ferric oxide (Fe2O3) | 71.66* | 1.76 | .. |
| Titanium dioxide (TiO2) | 0.20 | 017 | 0.49 |
| Lime(CaO) | 0.10 | 47.10 | 40.27 |
| Magnesia (MgO) | 0.33 | 1.24 | 1.19 |
| Phosphorus pentoxide (P2O5) | 0.23 | 0.07 | 0.10 |
| Manganous oxide (MnO) | 0.72 | .. | 0.45 |
| Calcium sulphide (CaS) | .. | .. | 2.54 |
| Sulphur (S) | 0.13 | 0.21 | |
| Loss on ignition | 12.01 | 37.18 | .. |
| 100.30 | 100.11 | 100.67 | |
Along the seashore from Patea to New Plymouth occur large quantities of magnetic ironsand more or less titaniferous. This has originated through the disintegration of hornblende-andesites and their tufas, which occur very extensively near New Plymouth around the volcanic cone of Mount Egmont. It is quite impossible to give any definite idea of the quantity of this ironsand; undoubtedly, however, it exists in immense quantities, and is measurable in millions of tons.
The most extensive deposit of ironsand occurs near Patea, the quantity of which has been estimated to be at least 5,374,000 tons of high-grade ore in addition to a great quantity of low-grade ironsand.
Between the years 1869 and 1918 several attempts were made to smelt Taranaki ironsand.
In 1921 the Mines Department arranged for the shipment of 20 tons of Taranaki ironsands to Messrs. Thomas Summerson and Sons' works at Darlington, England, for the purpose of having tests made to ascertain the suitability by that firm's process of the sand for the production of pig iron and steel therefrom. The experiments, which were conducted under the supervision of Professor Harbord, representing the New Zealand Government, were made in an electric furnace. The results were not quite satisfactory, considered from a commercial point of view, as the cost of producing pig iron and steel was too high.
Professor Harbord's report shows that in his opinion the production of steel direct from the ore or in one furnace is not commercial, and that two furnaces are essential—one to reduce the ore, and the other to refine the metal produced and to convert it into steel.
The conclusion arrived at by Professor Harbord is that the conditions in New Zealand are such that a blast furnace and modern steel plant are not at present feasible, but if power, coke, coal, and limestone are obtainable at reasonable prices small quantities of pig iron and steel may be produced to partially meet the local requirements, and this would form the basis for building up a larger industry when the demand is increased sufficiently to justify expansion on a larger scale.
The report also shows that both pig iron and steel of satisfactory quality, containing little titanium, can be produced from titaniferous ironsands in the electric furnace. The full text of the report appears in parliamentary paper C.-15, 1922.
Near the Breakwater, Now Plymouth, the New Zealand Iron-ore Smelting Company (Limited), which was formed for working the beach ironsand, commenced smelting during the latter part of 1917, and after several trials pig iron was obtained in grades varying from white to grey. The company subsequently went into liquidation, and the furnace was removed to Onakaka.
The following is an analysis of the ironsand which, after magnetic concentration, was used in the blast-furnace charge:—
| Silica (SiO2) | 5.40 |
|---|---|
* Equivalent to phosphorus, 0.30 per cent. † Equivalent to metallic iron. 56.36 per cent. | |
| Alumina (Al2O3) | 1.53 |
| Lime (CaO) | 1.81 |
| Magnesia (MgO) | 2.80 |
| Phosphoric anhydride* | 0.69 |
| Titanium dioxide (TiO2) | 10.45 |
| Ferrous oxide (FeO)† | 28.71 |
| Ferric oxide (Fe2O3)† | 48.61 |
| 100.00 | |
At Kerr Point the deposit of iron-ore consists of limonite, but does not probably exceed 100,000 tons. The iron-ore near the head of the Waitangi River is also limonite of excellent quality, but does not exceed 100,000 tons. The limonite deposits in the Kawhia-Raglan district and on Table Hill, so far as known, are not large. Little authentic information exists concerning the iron-ore deposits at Mount Peel or at Mount Royal. In the Lake Wakatipu district from Moke Creek, through Benmore in the direction of Mount Gilbert, a band of hæematite has been reported to occur, also at Maori Point, Shotover River. On the Westland side of Mount Cook large quantities of magnetite are disseminated through chlorite schist.
During 1914 the Government, with a view to stimulating interest in this industry, passed an Act having for its object the payment of fairly large bonuses for the production in New Zealand of pig iron, puddled bar iron, and steel. In 1920, the time-limit, as specified by the principal Act, in which notice of intention to claim the bounty was to be given, having expired, an amendment was passed reviving the payment of bonuses, and extending the time-limit in which notice of intention to claim the bounty was to be given. The bonus on pig iron was by an amendment passed in 1925 increased to £1 10s. per ton, the increased rate to be payable on all pig iron produced at any time after the 1st January, 1925. No bounties under the Act are payable after the 31st March, 1934.
Scheelite, one of the principal ores of tungsten, was for a number of years mined on a fairly extensive scale in conjunction with gold, the principal gold-scheelite mines being those at or near Glenorchy, Paradise, Macrae's, Stoneburn, Hyde, and Barewood, Otago; and at Wakamarina Valley, Marlborough.
Since the termination of the war there has been a considerable collapse in the tungsten-ore-mining industry owing to the great decline in price on the Homo market, due greatly to accumulated stocks. During the war the Empire's supply was commandeered, and the price increased to £3 8s. per unit (on a 65-per-cent. WO3 basis per ton). Consequent on an increase in the price to £1 3s. per unit there is a probability of active mining operations being resumed.
The following statement shows the quantity and value of scheelite exported in each of the last twenty years:—
| Year. | Quantity exported. | Value. |
|---|---|---|
| Tons. | £ | |
| 1906 | 55 | 3,407 |
| 1907 | 137 | 15,486 |
| 1908 | 68 | 6,055 |
| 1909 | 58 | 4,263 |
| 1910 | 143 | 15,070 |
| 1911 | 138 | 11,853 |
| 1912 | 135 | 13,347 |
| 1913 | 221 | 22,933 |
| 1914 | 204 | 21,498 |
| 1915 | 194 | 27,784 |
| 1916 | 266 | 49,070 |
| 1917 | 161 | 28,972 |
| 1918 | 169 ½ | 37,922 |
| 1919 | 131 | 29,489 |
| 1920 | 10 1/10 | 1,378 |
| 1921 | .. | .. |
| 1922 | 7 1½0 | 528 |
| 1923 | 13 | 875 |
| 1924 | 14 19/20 | 1,156 |
| 1925 | 31 3/20 | 2,255 |
| Totals to end of 1925 | 2,371 1/5 | 304,125 |
Ores of copper are found in New Zealand in no fewer than thirty-two localities, but during the last fifty years attempts at their successful exploitation have been unprofitable, the total recorded copper-production to the end of 1925 amounting in value to only £19,390. Prior to the inauguration of systematic records there was a considerable production from mines on Great Barrier and Kawau Islands.
Copper-mines have been worked on Kawau and Great Barrier Islands in the Hauraki Gulf, and on the Dun Mountain, near Nelson. Underground prospecting has been carried on near Kaeo, Whangaroa; at Maharahara, near Woodville; and at Mount Radiant, near Karamea; but no conclusive results have been obtained. A syndicate is now engaged in reopening the mine at Maharahara, but so far the results are disappointing.
Manganese-ore has been found at Otau, Wairoa, Bay of Islands, Purua Bay, Mangapai, Otonga, Waiheke Island, and Taieri Mouth. Many years ago a considerable amount of manganese-ore was mined at Tikiora, near the Bay of Islands. At a later period operations were carried on at Waiheke Island, distant about twelve miles from Auckland. On that island manganese-ore may be traced for several miles, where it occurs in massive but bunchy form and of excellent quality, bulk analyses returning 56.5 per cent. metallic manganese. Some thousands of tons have been exported, but it is supposed that fluctuating prices prevented expansion of this industry. The total quantity of manganese-ore exported to the end of 1925 amounted to 19,380 tons, of a value of £61,994.
After several unsuccessful attempts, extending over a number of years, to work cinnabar-deposits in the Auckland Province, satisfactory results were obtained by the New Zealand Quicksilver-mines (Limited), whose mine and furnace were situated at Puhipuhi, about twenty-eight miles by road from Whangarei. This company, to the end of 1922, had produced 16 1/5 tons of quicksilver, valued at £8,103, but did not continue production.
Cassiterite in the form of “stream-tin” occurs near Port Pegasus, Stewart Island, where it has been worked to some extent. “Lode-tin” has been found in the same locality, and is now being prospected. Small quantities of cassiterite have also been detected in the stream-gravels of the Reefton, Greymouth, and Westport districts. Among other localities in which traces of tin occur are Wet Jacket Arm (Otago) and Campbell Island.
In the published lists of minerals of New Zealand platinum is stated to occur in several places associated generally with gold in gravel. It is only from Southland, however, that platinum has been exported.
The Customs Department has not kept any separate record of the quantity and value of platinum entered for exportation, the value of this metal exported being included in a general total of exports by parcel-post, by which means platinum has generally been despatched from the Dominion.
In Southland native platinum occurs in auriferous wash, and is distributed on the beaches and coastal terraces from Blue Cliffs, west of Invercargill, to Longbeach, Waikawa River, east of Invercargill, over a distance of about ninety-two miles. It is probable that the platiniferous sands of Southland have boon derived from serpentine or other olivine-bearing rocks, which are known to occur in Fiordland. In Russia and in Lapland platinum has been found in a matrix of serpentine (altered peridotite).
Native platinum has been obtained in payable quantities from claims at Cameron Creek, Groveburn, Orepuki, Pahi, Round Hill, Steel Head, Bushy Point, Waipapa, Otara Beach, Twelve-mile Beach, and Waikawa. The coarsest and heaviest samples have been obtained from west of Waiau River, that obtained east of Otara being extremely fine. Direct from the gold-saving mats at the alluvial workings at the Waikoau River, Rowallen. as high a proportion as 1 oz. platinum to 3 oz. gold has been obtained.
The platinum is collected by miners as a residue, after amalgamation, of alluvial gold, and is reduced by further washing to about a 50-per-cent. concentrate, the remainder of the concentrate being chiefly iridosmine (osmiridium).
During the earlier and more prosperous era of gold-mining alluvial miners did not save the platinum, as the banks would not give more than a few shillings per ounce for mat concentrates of platinum and osmiridium; consequently by far the greater proportion collected on the gold-saving matting at alluvial claims was thrown away. As years passed the price increased; during 1925 the price ruling on the London metal-market averaged £25 per ounce for refined metal.
The following are the results of assays of concentrates taken direct from the gold-saving mats of Smith's Claim, Round Hill: No. 1 sample—Gold per ton of concentrate, 55 oz.; platinum per ton of concentrate, 72 oz. No, 2 sample—Gold per ton of concentrate, 15 oz.; platinum per ton of concentrate, 51.5 oz.
The following is the result of an assay of a sample of concentrate from rich wash from the Otara Claim: Osmiridium, 15 dwt. 7 gr. per ton; platinum, 7 dwt. 14 gr. per ton; gold, 4 dwt. 22 gr. per ton; monazite, 207 per cent.; thoria, 0.67 per cent. This industry is now again engaging attention in the Orepuki district. The value of platinum recovered during the year 1925 is estimated at £126.
Native sulphur in sufficient quantity to be profitably worked occurs in the thermal districts of the North Island, near Rotorua and Lake Taupo, and at White Island. With the exception of the lake deposit on White Island, all the known native sulphur in payable quantity occurs in the form of pockets in pumice, or sinter around fumaroles or thermal springs (from which it has been sublimed in crystalline form), and as black sulphur. The fumarolic deposits, although of high grade generally, are inextensive when compared with those of massive form in seams or in veins as extensively worked in Japan, Sicily, and North America.
Sulphur is destined in the future to play an important part in the progress of the Dominion, and, recognizing this, the Government in 1922 completed the purchase of a large block of sulphur-bearing land in the North Island, which, when served by a railway, will constitute a most valuable asset.
Another attempt is being made to work the White Island sulphur deposits, this time by the White Island Agricultural Chemical Company (Limited). Operations were commenced late in 1925, and comprised the testing and preparing for opencast working of the sulphur deposit, the provision of a safe anchorage and loading facilities for small craft at Crater Bay, and the building of accommodation for the men employed on the island. A small quantity of high-grade sulphur was shipped to Auckland, and liquefied out at 99.8 per cent. pure. It is at present proposed to work the crude sulphur and market it as a fertilizer. In this connection the company has acquired a site on Tauranga Harbour, and is constructing a wharf and erecting a crushing and bagging plant.
White Island also contains several guano deposits, but no reliable estimate has yet been made of the quantity and quality available Wireless communication is maintained between the island and the mainland.
During the year 269 tons of sulphur, valued at £1,154, were produced.
Coal, varying in grade from anthracite to lignite, occurs in many parts of New Zealand. In proportion to the present yearly consumption of somewhat under 2,300,000 tons (10 to 15 per cent. of which is in normal times imported), the supply may be considered relatively large, but in comparison with probable future needs it is decidedly small. It is likely, indeed, that the proved bituminous-coal resources of the Dominion will be practically exhausted within a hundred years. The resources of brown coal are very much greater.
An estimate of the proved and probable coal in New Zealand, which was prepared by the Director of the Geological Survey of New Zealand in May, 1919, is as follows:—
| Class of Coal. | Proved. | Probable. | Possible. |
|---|---|---|---|
| Imperial Tons. | Imperial Tons. | ||
| Anthracite | Very little. | Very little. | Small. |
| Bituminous | 187,000,000 | 477,000,000 | Moderate. |
| Semi-bituminous | 68,000,000 | 196,000,000 | ,, |
| Brown | 194,000,000 | 728,000,000 | Large. |
| Lignite | 161,000,000 | 420,000,000 | ,, |
| Totals | 610,000,000 | 1,821,000,000 | Large. |
No individual coal-seam has yet been traced for more than a few miles in any direction. The variations in thickness are extraordinary. There are many instances of seams 10 ft. to 20 ft. thick thinning to 1 ft. or 2 ft. in distances of a quarter of a mile or less. The following instances of thick seams may be mentioned: In the Waikato district (Auckland), 50 ft. to 60 ft. of brown coal; in the Buller-Mokihinui district (Nelson), 53 ft. of bituminous coal; in the Kaitangata district (Otago), 30 ft. or more of brown coal; at Coal Creek, near Roxburgh, Central Otago, 80 ft. (or, according to Professor Park, 100 ft.) of lignite; at Nightcaps (Southland), 36 ft. of brown coal.
In New Zealand the difficulties in settling the relative ages of the principal coalfields are such that for many years the subject has been a controversial one. The known facts may be summarize as follows: In south-east Otago (Waikawa, Catlin's River) and in Southland (Hokonui Hills) small seams of coal occur in Jurassic rocks, but in no case is a workable seam known to be present. The chief coal-bearing rocks are probably of early Tertiary age, but late Cretaceous coal-seams almost certainly occur. There are also considerable quantities of lignite of Miocene, Pliocene, and possibly even Pleistocene age.
The output of the several classes of coal mined in each inspection district during 1925 is summarized as follows:—
| Class of Coal. | Output of Coal during 1925. | Total Output to the End of 1925. | |||
|---|---|---|---|---|---|
| Northern District (North Island). | West Coast District (South Island) | Southern District (South Island). | Totals. | ||
| Tons. | Tons. | Tons. | Tons. | Tons. | |
| Bituminous and sub-bituminous | 131,540 | 913,186 | .. | 1,044,726 | 37,983,397 |
| Brown | 540,863 | 37,771 | 332,791 | 911,425 | 19,901,452 |
| Lignite | .. | 439 | 158,405 | 158,844 | 3,834,494 |
| Totals for 1925 | 672,403 | 951,396 | 491,196 | 2,114,995 | 61,719,343 |
| Totals for 1924 | 637,525 | 990,612 | 455,070 | 2,083,207 | .. |
The gross output of coal for 1925 was 31,788 tons in excess of the output for 1924. This increase is wholly due to the increased output of brown coal, which is 72,408 tons in excess of the output for the previous year. Bituminous coal shows a reduction of 40,278 tons, and lignite a reduction of 342 tons.
In the Northern District the output of bituminous coal from the Hikurangi mines was 1,613 tons over that for 1924, and the output of brown coal from the Waikato mines exceeded the previous year's output by 33,265 tons.
In the West Coast District there was a decrease of 41,891 tons in the output of bituminous coal, an increase of 2,598 tons in the output of brown coal, mostly from the Reefton mines, and an increase of 77 tons of lignite, making altogether a net decrease of 39,216 tons for the district.
In the Southern District there was an increase of 36,545 tons in the amount of brown coal produced, and a reduction of 419 tons of lignite, a total increase of output for the district of 36,126 tons.
The market for all classes of coal was dull throughout the year, and at many of the mines a considerable amount of slack time was worked. The industry was almost free from stoppages due to labour trouble. Co-operative mining still continues to be successfully carried out in the Northern and West Coast Districts.
The annual production of coal and the quantity of coal imported during the last ten years are as follows:—
| Year. | Coal produced. | Coal imported. | Total Quantity of Coal produced and Imported. |
|---|---|---|---|
| Tons. | Tons. | Tons. | |
| 1916 | 2,257,135 | 293,956 | 2,551,091 |
| 1917 | 2,068,419 | 291,597 | 2,360,016 |
| 1918 | 2,034,250 | 255,332 | 2,289,582 |
| 1919 | 1,847,848 | 391,434 | 2,239,282 |
| 1920 | 1,843,705 | 476,343 | 2,320,048 |
| 1921 | 1,809,095 | 822,459 | 2,631,554 |
| 1922 | 1,857,819 | 501,478 | 2,359,297 |
| 1923 | 1,969,834 | 445,792 | 2,415,626 |
| 1924 | 2,083,207 | 674,483 | 2,757,690 |
| 1925 | 2,114,995 | 572,573 | 2,687,568 |
The following statement shows the tons of coal raised, the number of persons employed, and the number of lives lost by accidents in or about coal-mines, &c., in each of the last twenty years:—
| Year. | Output. (Tons.) | Persons employed above and below Ground. | Tons raised per Person employed Underground. | Lives lost. | ||
|---|---|---|---|---|---|---|
| Number | Per Million Tons raised. | Per Thousand Persons employed. | ||||
* Year of Ralph's (Huntly) explosion. | ||||||
| Prior to 1906 | 21,686,976 | .. | .. | 188 | 8.67 | .. |
| 1906 | 1,729,536 | 3,692 | 687 | 6 | 3.47 | 1.63 |
| 1907 | 1,831,009 | 3,910 | 662 | 12 | 6.55 | 3.07 |
| 1908 | 1,860,975 | 3,894 | 641 | 5 | 2.69 | 1.28 |
| 1909 | 1,911,247 | 4,191 | 630 | 7 | 3.70 | 1.67 |
| 1910 | 2,197,362 | 4,599 | 634 | 16 | 7.28 | 348 |
| 1911 | 2,066,073 | 4,290 | 706 | 14 | 6.78 | 3.26 |
| 1912 | 2,177,615 | 4,328 | 681 | 9 | 4.13 | 2.08 |
| 1913 | 1,888,005 | 4,250 | 590 | 6 | 3.18 | 141 |
| 1914* | 2,275,614 | 4,734 | 639 | 49 | 21.53 | 10.35 |
| 1915 | 2,208,624 | 4,156 | 711 | 9 | 4.07 | 2.17 |
| 1916 | 2,257,135 | 3,988 | 752 | 6 | 2.66 | 1.50 |
| 1917 | 2,068,419 | 3,983 | 715 | 4 | 1.93 | 1.00 |
| 1918 | 2,034,250 | 3,994 | 703 | 6 | 2.95 | 150 |
| 1919 | 1,847,848 | 3,944 | 648 | 10 | 5.41 | 2.54 |
| 1920 | 1,843,705 | 4,078 | 630 | 1 | 0.54 | 025 |
| 1921 | 1,809,095 | 4,367 | 574 | 10 | 5.53 | 2.29 |
| 1922 | 1,857,819 | 4,556 | 552 | 6 | 3.23 | 1.32 |
| 1923 | 1,969,834 | 5,000 | 540 | 5 | 2.54 | 1.00 |
| 1924 | 2,083,207 | 4,869 | 594 | 10 | 4.80 | 2.05 |
| 1925 | 2,114,995 | 4,777 | 606 | 8 | 3.78 | 1.67 |
| Totals to date | 61,719,343 | .. | .. | 387 | 6.27 | .. |
Experimental work on the briquetting of coals was commenced in the Dominion Laboratory towards the close of 1924 and continued during 1925. It has been found that good briquettes can be made from most of the lignites tried (Mataura, Bannock-burn, Charleston, Taratu, &c.) without the use of any binder, but that this is not the case with brown coal and bituminous coal. The best and most economical briquettes from brown and bituminous coals are obtained by using coal-tar pitch or bitumen. Briquettes made from bituminous coal with either of these binders are of very good quality and of moderate cost. In the case of brown coals such, briquettes stand handling and weathering very well, but crumble in the fire. Experiments show that this defect can be entirely removed by mixing the brown coal with about 20 per cent. of a bituminous coal. Briquettes made with such a mixture and a suitable amount of pitch or bitumen are of moderate cost, and of excellent quality in every respect for household use. If the proportion of bituminous coal is increased to 50 per cent. of the mixture the briquettes are free from the tendency to sparking so characteristic of Waikato brown coals and should furnish an excellent locomotive fuel.
With a view to investigating the possibilities of increasing the market for small coal, representative samples of coal from Waikato, Reefton, Otago, and Southland were forwarded for special investigation and report upon their commerical and economic uses to Professor W. A. Bone, D.Sc., Ph.D., F.R.S., of the Imperial College of Science and Technology, London, the recognized authority in the Empire on the low-temperature carbonization of coal. Professor Bone's conclusions as to the utilization of this small coal are given as follows in his report:—
“In my opinion the best prospect of utilizing these coals commercially would be either (i) as pulverized fuels for the firing of boilers or reverberatory furnaces, or (ii) as briquettes, after being crushed and briquetted with the addition of some 4 per cent. or 5 per cent. of pitch or other suitable binder. Speaking generally, probably a suitable process of low-temperature carbonization (say at 550° to 600£° C.), when such becomes commercially available, would be the best means of ‘up-grading' these coals; because, in addition to yielding satisfactory amounts of fuel oils, the residues, which would be free-burning and smokeless in their combustion, could readily be used either as pulverized fuels for steam generation and the like or as briquetted fuels.”
Further investigation as to the commercial and economic value of coal in the Dominion is being made, and to this end a sample of Waikato coal has recently been forwarded to Messrs. Vickers Limited, London, for preliminary test by low-temperature carbonization at that firm's laboratories at Dartford to determine the yield of oil, gas, and coke, also the properties of oil obtained.
A private syndicate is also having experiments made with Waikato slack, and has sent a parcel of 75 tons of this coal to Antwerp for treatment by distillation process.
The Coal-mines Act of 1901 provided for the acquisition and working of State coal-mines in New Zealand under the direct control of the Minister of Mines. At the present time two State collieries are in operation.
During 1925–26 the Liverpool Colliery produced 102,400 tons of marketable coal, a decrease of 9,087 tons on the previous year's production. The James Colliery produced 24,735 tons of marketable coal during the year, a decrease of 1,710 tons on the production for 1924–25.
The disposal, inclusive of stock on hand at beginning of year, was as follows:—
| Supplied to | Tons. |
|---|---|
| Depots | 30,728 |
| Railways | 6,338 |
| Other Government Departments | 6,150 |
| Shipping companies | 15,350 |
| Gas companies | 62,212 |
| Other consumers | 5,073 |
| Total | 125,851 |
The total sales of State coal from the Liverpool Mine for the year amounted to 102,953 tons, value £149,978, as compared with 112,197 tons, value £168,600, for 1924–25, a decrease of 9,244 tons, with a decrease in value of £18,622.
The average price realized by the mine on the total sales for the year was £1 9s. 1.62d. per ton, a decrease of 11.03d. on the previous year's average.
The total sales of State coal from the James Mine for the year amounted to 22,898 tons, value £34,762, giving an average of £1 10s. 4–35d. per ton, an increase of 7.57d. on last year's average.
The sales of coal, &c., through the medium of the depots totalled 98,326 tons, value £198,745, as against 104,486 tons, value £210,619, for 1924–25.
The profits at the mines were £2,693, and at the depots, &c., £3,722, making a total net profit of £6,415. The sum of £4,552 was applied to Sinking Fund Account out of the General Reserve.
Drilling for petroleum has in recent yews been carried on in Taranaki, Hawke's Bay, Canterbury, and Westland. Throughout the Dominion twenty-six deep boreholes in search of petroleum have been drilled, the deepest being that of the Paritutu Oil Company (formerly the Blenheim Oil Company) at Moturoa, near New Plymouth, which has attained a depth of approximately 6,000 ft. Petroleum of good quality but in limited quantity has been proved at Moturoa, but up to the present time boring for petroleum in the Dominion has attained only a small and intermittent flow.
An Australian company, the Taranaki Oilfields (Limited), was formed in 1924, to further test the Taranaki oilfield. Drilling operations were commenced at the beginning of 1925, and two wells were started, one at Tarata and another on the foreshore at Moturoa. By the end of the year the Tarata well was down 4,130 ft., without, however, meeting more than traces of oil. The Moturoa well got a good show of oil at 930 ft. At 1,550 ft. gas at high pressure was struck, but the analysis of the gas showed that it contained 72 per cent. of carbon dioxide and only about 25 per cent. of methane and its homologues, so that the gas was valueless as a fuel. From the records of other wells in the vicinity it was expected to strike an oil-sand at about 2,200 ft., but this anticipation was not realized. Good shows of oil were got between 2,150 ft. and 2,600 ft., but nothing to indicate the presence of oil in commercial quantities. By the end of the year the Moturoa well had reached a depth of 3,192 ft. Detailed field-work by expert oil geologists was carried on continuously in other parts of the Taranaki field with a view to discovering areas whose structure is favourable for the retention of oil.
A great deal of field-work was done during the year in the Gisborne district and several favourable structures located. Drilling is now in progress.
Oil-seepages occur near the Mangles River in the Murchison district, and a company has been formed to drill this area. Drilling was commenced early in 1926.
Oil-prospecting operations throughout the Dominion have received very liberal financial assistance from the Government in the forms of bonuses, subsidies, and loans.
The kauri-gum industry is under the administration of a separate Department controlled by a Superintendent. During 1925, 5,370 tons of kauri-gum, valued at £414,901, were exported, the total quantity of gum exported to the end of 1925 being 394,422 tons, valued at £21,522,986.
The European market for this fossil resin—used in the manufacture of varnish and linoleum—being greatly restricted by the recent war, new but smaller markets were obtained. The Kauri-gum Industry Act, 1914, providing for State purchase of gum from diggers and the disposal of the gum, served a useful purpose in enabling the industry to keep going in spite of the disorganization occasioned by the war.
As in the case of several other important items of primary produce, the kauri-gum industry has now a Control Act. This Act, passed in 1925, makes provision for the control of the trade in and of the export of kauri-gum.
At Clarendon and Milburn, Otago, considerable deposits of phosphate rock were discovered in 1902, and have since been actively worked. A thin bed of phosphatic rock has been identified at Kaikoura and Amuri Bluff, in Marlborough. A similar bed occurs near Port Robinson. Phosphatic nodules are found in the Kaikorai Valley (near Dunedin), at Weka Pass (North Canterbury), and elsewhere. A limestone containing 10.6 per cent. of tricalcic phosphate occurs in the neighbourhood of Onewhero, Waikato district. Other districts where phosphatic material of good quality, though, so far as known, not in commercial quantity, is found are Amberley, Dipton, Oamaru, Waimate, Wangapeka, Clarence Valley, Tutira Block (Mangaharuru Survey District, Hawke's Bay), and Whangarei.
Phosphatic minerals, the most common of which is the hydrous iron phosphate vivianite, have been discovered in numerous other localities besides those mentioned above, but commercially these occurrences are of little importance.
There was no production during 1925, the Milburn Lime and Cement Company's works at Clarendon having been closed down temporarily.
The mineral nephrite, the “pounamu” of the Maori, more popularly known as one of the varieties of “greenstone,” whenever observed in situ, occurs as rounded segregations in talc or talc-serpentine rocks. These segregations vary up to 2 ft. or even more in lateral dimensions. As a rule they average less than 1 ft. in width. So far as is known, the mineral has been found in its original locus only in the Griffin Range, Turiwhate Survey District, North Westland.
Pounamu is a deep-green semi-transparent mineral with dark opaque patches. With the wearing-away of the enclosing matrix the segregations are freed as rounded masses, and were once transported by the Arahura, Taramakau, and other glaciers, and are now found as boulders in the glacial debris along the lower streams of the Arahura and Taramakau Valleys. From boulders all greenstone ornaments have hitherto been manufactured.
New Zealand possesses a great variety of handsome and durable building-stones scattered throughout both Islands. In Auckland there are basalt, andesite, porphyrite, and quartz biotite-diorite, known in the building trade as Coromandel “granite,” a hard, coarsely crystalline rock, capable of taking a fine polish. Besides these rocks are the Whangarei limestone and Raglan stone, the former an excellent building-stone, the latter a good freestone. Taranaki has the hornblende andesites of Now Plymouth and Mount Egmont, and Wellington the andesites of Ruapehu.
In Nelson there is the granite of Tata Island and Tonga Bay, and the marble or crystalline limestones of the Pikiruna (Riwaka) Range. The Parliamentary Buildings at Wellington were constructed of this marble. West Nelson and Westland are well provided with granites and limestones of good quality, well adapted for building purposes; and in the Griffin Range, North Westland, there is found an abundance of finely coloured serpentine, unsurpassed as a decorative stone. Building-stone is scarce in Marlborough, but Canterbury is well supplied, having an abundance of Lyttelton bluestone (andesite) and Mount Somers stone, a limestone of exceptional quality. In Otago there is an abundance of excellent building-stone, ranging from the well-known Oamaru stone to the granite, gneiss, and limestones of Fiordland, all close to deep water. In Southland there is the so-called Ruapuke “granite,” the norite of the Bluff, and the granites of Stewart Island.
Many of the principal buildings in New Zealand have been constructed in stone from local quarries.
During 1925 the value of stone, &c., produced was £463,667, as against £373,827 for the previous year.
The following table shows the number of quarries under the Stone-quarries Act, also the number of persons ordinarily employed thereat, and the annual output and value of crude stone during 1925:—
| Provincial District. | Number of Working Quarries under the Act. | Number of Persons ordinarily employed. | Output of Crude Stone. | |||||||
|---|---|---|---|---|---|---|---|---|---|---|
| Stone or Gravel for Macadamizing or Ballast. | Stone for Harbour-works. | Building or Monumental Stone. | Limestone for Agriculture. | Limestone for Cement or Mortar. | Phosphate for Agriculture. | Miscellaneous. | Value at Quarry. | |||
| Tons. | Tons. | Tons. | Tons. | Tons. Tons. | Tons. | £ | ||||
| Auckland | 160 | 1,062 | 625,563 | 9,096 | 6,343 | 20,865 | 222,670 | .. | 1,520 | 251,434 |
| Hawke's Bay | 17 | 78 | 19,401 | 1,803 | 400 | 10,692 | .. | .. | 1,886 | 9,709 |
| Taranaki | 14 | 65 | 21,382 | 6,844 | .. | .. | .. | .. | 8,910 | |
| Wellington | 36 | 219 | 95,981 | 15,670 | 2,300 | 8,689 | .. | .. | .. | 33,813 |
| Canterbury | 14 | 112 | 88,378 | 7,502 | 2,593 | 4,885 | .. | .. | 438 | 36,960 |
| Nelson | ||||||||||
| Westland | 12 | 136 | 3,084 | 47 | 279 | 2,601 36,418 | .. | 1,184 | 11,813 | |
| Marlborough | ||||||||||
| Otago Southland | 36 | 300 | 104,333 | 11,287 | 14,708 | 86,957 | 46,394 | .. | 617 | 111,028 |
| Totals, 1925 | 289 | 1,972 | 958,122 | 52,249 | 26,623 | 134,689 | 305,482 | .. | 5,645 | 463,667 |
| Totals, 1924 | 260 | 1,748 | 855,958 | 103,781 | 19,174 | 138,734 | 260,957 | 1,575 | 1,150 | 373,827 |
By section 2 of the Stone-quarries Amendment Act, 1920, the application of the Act was extended to include every place, not being a mine, in which persons work in quarrying stone and any part of which has a face more than 15 ft. deep, and also in any tunnel in the construction of which explosives are used. The Act, however, does not apply to any Government operations, or any road or railway cutting, or excavations for buildings.
The following table shows the number and proportion of persons killed at coalmines, metal-mines, and at quarries and places under the Stone-quarries Act for the last ten years:—
| Year. | Coal-mines. | Metal-mines. | Stone-quarries. | |||
|---|---|---|---|---|---|---|
| Number of Deaths. | Proportion per 1,000 Persons employed. | Number of Deaths. | Proportion per 1,000 Persons employed. | Number of Deaths. | Proportion per 1,000 Persona employed. | |
| 1916 | 6 | 1.50 | 9 | 2.42 | 2 | 1.23 |
| 1917 | 4 | 1.00 | 7 | 2.03 | 2 | 2.00 |
| 1918 | 6 | 1.50 | 2 | 0.77 | 2 | 1.40 |
| 1919 | 10 | 2.54 | 4 | 1.82 | 1 | 0.71 |
| 1920 | 1 | 0.25 | 1 | 0.51 | .. | .. |
| 1921 | 10 | 2.29 | 1 | 0.48 | 1 | 0.64 |
| 1922 | 6 | 1.32 | 1 | 0.47 | 2 | 1.44 |
| 1923 | 5 | 1.00 | .. | .. | 3 | 1.82 |
| 1924 | 10 | 2.05 | 3 | 1.61 | 4 | 2.29 |
| 1925 | 8 | 1.67 | 3 | 1.72 | 3 | 1.52 |
| PERSONS EMPLOYED AT MINES AND AT PLACES UNDER THE STONE-QUARRIES ACT. | |||
|---|---|---|---|
| — | 1824. | 1925. | Increase or Decrease. |
| Metalliferous mines | 1,858 | 1,749 | Decrease 109 |
| Coal-mines | 4869 | 4,777 | ,, 92 |
| Stone-quarries | 1748 | 1,972 | Increase 224 |
| Totals | 8,475 | 8,498 | Increase 23 |
In no other country does the State offer such liberal and varied assistance to miners and prospectors as in New Zealand. During and since the war State aid to mining in this Dominion has been given in several forms, viz.:—
(1) Geological survey and bulletins; (2) financial aid to prospecting; (3) Government prospecting-drills; (4) loans for mining operations; (5) schools of mines; (6) subsidized roads to mining-fields; (7) Government water-races.
Since the first discovery of coal and the precious metals in New Zealand the Government has employed skilled geologists, who have reported, after examination, on all the known mineral deposits. Since 1916 the Geological Survey Branch of the Mines Department has been enlarged, and has included on its staff the most eminent geologists of the Dominion.
As an aid towards the development of the mining industry the Government offers varied and liberal assistance to prospectors in the form of subsidies, loans, expert and technical advice, use of plant, &c. Subject to the provisions of the Mining Act, the holder of a valid miner's right is entitled to prospect for gold or any other metal or mineral (except coal) on any Crown land. He may also obtain authority from the Governor-General to prospect on Native land, and he may also prospect on private land with the consent of the owner. Wardens in mining districts and Commissioners of Crown Lands in other districts may, with the consent of the Minister of Mines, grant prospecting licenses for coal.
Assistance is offered to prospectors as under:—
Subsidies for prospecting (vide Regulation 127 under the Mining Act):—
For prospecting new ground by parties of not less than two men, a subsidy not exceeding £1 19s. per week per man.
For sinking in dry ground by parties of not less than two men—from surface to 15 ft., 1s. 11d. per foot; from 15 ft. to 30 ft., 3a 3d. per foot; from 30 ft. to 60 ft, 3s. 11d. per foot; over 60 ft., 5s. 2d. per foot.
For sinking in wet ground where slabbing is necessary, double the foregoing rates. For sinking in solid rock by blasting, 9s. 9d. per foot; but if the cost exceeds £1 19s. per foot, then 13s. per foot may be paid.
For tunnelling or driving through drift or blue reef—up to 400 ft, 1s. 11d. per foot; 400ft to 700ft., 3s. 3d per foot; 700ft. to 1,000 ft, 3s. 11d. per foot; over 1,000 ft., 5s. 2d. per foot.
For tunnelling or driving through hard rock by blasting, a subsidy of 6s. 6d. per foot is offered; but if the cost exceeds £1 6s. per foot, then 8s. 8d. per foot may be paid. When timbering by sets is necessary, then a subsidy not exceeding 2s. 7d. per foot of driving, or one-half the cost of the timber, may be paid.
Subsidies for prospecting deep levels for gold-quartz lodes down to a depth of not less than 1,000 ft., and for alluvial drift not less than 250 ft. (vide Regulation 125 under the Mining Act): Such subsidies up to half the estimated cost of the work, but not to exceed £10,000.
The identification and assaying, free of charge, of samples from bona fide pro-spectors, at the Dominion Laboratory, Wellington, or at the schools of mines.
Any prospector desiring information regarding favourable localities, or the most suitable method of prospecting, or any other matter connected with mining, may receive free advice upon application to the Mines Department, Wellington.
During the year ended 31st March, 1926, a total of £9,795 was expended in subsidies for prospecting, and 106 persons were employed in connection therewith.
Prospecting-drills of various types suitable for the conditions existing in the Dominion are lent to bona fide prospectors. A monthly rental is charged for the plant, and the hirer is required to maintain it in good order and condition, as security for which a deposit is required, together with a bond varying in amount according to the class of drill loaned.
Where the Government provides an expert drill superintendent to take charge, one-half of his salary, together with one-half the amount of the authorized travelling allowances and expenses incurred while proceeding from his last employment to the site of the drilling operations, and one-half of his camp allowance while the work is in progress, is paid by the Mines Department, but if the hirer provides the drill superintendent the whole of his salary is paid by the hirer. All working-expenses are also paid by the hirer, including renewals, &c., and the loss on carbons.
The hirer is required to furnish to the Mines Department weekly reports of boring results.
For boring in rock for coal and oil-shale seams or for mineral lodes (reefs) the following drills are available:—
One Schram-Harker steam-power-driven diamond drill of 1,100 ft. capacity; Weight, 8 tons (casing excluded).
One Schram-Harker kerosene-engine driven combination diamond drill of 600ft. capacity; weight, 7 tons (including casing). Will drill to 75 ft. in gravels by percussion method. Suitable drill for boring lignite or soft deposits.
One Sullivan C.N. steam-power-driven diamond drill of 800 ft. capacity; weight, 10 tons (including casing).
The above drills produce cores of the rocks penetrated.
For boring in gravel or other alluvium for alluvial gold:—
Three Keystone percussion traction drills, driven by steam-power, of 150 ft. capacity in favourable ground; weight of each drill, 9 tons (including 100 ft. of 6 in. drive pipe).
One hand placer drill of 60 ft. capacity: weight, about 30 cwt.; can be transported on field by hand labour.
Considerable use was made of the Government prospecting-drills during 1925, an aggregate of 9,403 ft. being drilled in two hundred and seventy-three holes for seven parties, as follows:—
| Drills used: Schram-Harker diamond and Keystone drills. | ||||||||||||
|---|---|---|---|---|---|---|---|---|---|---|---|---|
| Number of Holes drilled. | Total Depth. | Diameter of Hole. | Mineral Bought. | Character of Rocks drilled through. | To whom lent. | Cost of Drilling, per Foot drilled. | Cost of Transport, per Foot drilled. | Cost of Carbon's Wear, per Foot drilled. | Results. | |||
| Ft. | In. | s. | d. | s. | d. | s. | d. | |||||
* Drainage. † Harbour-works. ‡ Hydro-electric scheme. | ||||||||||||
| 1 | 842 | 3 | Coal | Sandstones, shales, grits, and clays | New Zealand State Coal-mines | 4 | 3 | 1 | 6 | 2 | 10 | Unsatisfactory. |
| 1 | 376 | 3 | * | Mudstones, sand-stone, shales, and grit | Manderson and party | 8 | 2 | 2 | 6 | 0 | 8 | Satisfactory. Good, flow of water. |
| 1 | 756 | 2 ¾ | Gold, | Andesites and tuff | Waihi Grand Junction Gold Company (Limited) | 38 | 1 | 0 | 5 | 10 | 0 | Inconclusive. |
| 49 | 2,367 | 6 | Gold | Clay, blacksand, and sandstone | Clutha Development Syndicate | .. | .. | .. | Fair. Unfinished. | |||
| 156 | 2,367 | 2 ¼ & 3 | † | .. | Napier Harbour Board | 13s. 6d. | .. | .. | ||||
| 61 | 2,509 | 6 | Gold | Gravels | Rimu Gold Dredging Company (Limited) | 8s. 3d. | .. | Unfinished. | ||||
| 4 | 186 | 6 | ‡ | Greywacke, &c. | Public Works Department | 81 | 1 | 12 | 4 | .. | Satisfactory. | |
For the education of prospectors and mining students eight schools of mines are subsidized or entirely supported by the Government, in addition to the Otago University School of Mines. The schools of mines are situated at Coromandel, Thames, Waihi, Huntly, Reefton, Westport, Kaitangata, and Nightcaps.
The expenditure on these schools by the Government during the year ended the 31st March, 1926, was £4,004, as against £3,502 during the previous year.
A great deal of useful and necessary work continues to be performed by the schools of mines, but in those districts where mining has seriously declined and been replaced by other industries few of the students taking the classes are engaged or likely to be engaged in mining.
The expenditure in the form of subsidies and direct grants upon roads on gold-fields during the year ended the 31st March, 1926, amounted to £6,033, as compared with £4,126 during the previous year.
To enable alluvial-gold mining to be carried on in the neighbourhood of Kumara (Westland) and Naseby (Central Otago), the Government, during former years, constructed or acquired water-races of great capacity, at an approximate cost of about £350,000, and for a number of years the water from these races, which was supplied to parties of miners at a reasonable price, enabled considerable quantities of gold to be won, and thus gave profitable employment to many persons. Of late years, however, the gold-production has greatly declined.
During the year ended the 31st March, 1926, claims employing in all an average of 6.08 persons were supplied with water from the Waimea-Kumara races, and gold to the approximate value of £1,283 was obtained. The expenditure upon the upkeep of the races was £1,299, and the cash received for sales of water £914. The control of the Mount Ida water-races was transferred to the Public Works Department on the 1st September, 1924, with the intention that water not being used in gold-mining should be utilized for irrigation.
Another form of Government assistance, to mining consists of the publication of information as to localities recommended to the attention of prospectors. The undermentioned localities are so recommended:—
Coromandel County.—Between Colville and Tokatea, also from Mahakirau to Gumtown. In different parts of these localities loose specimen ore has been found. Numerous lodes varying in size have been discovered, some of which by assay contain payable values; but the source of the rich specimen ore referred to has not been located.
Thames County.—A large area of unprospected country occurs on the main range between Waikawau and Whangamata. The locality which offers the best prospects lies between Tararu and Tapu Creeks. Some rich pockets have been found, but in most cases the ore is accompanied by sulphides of lead and zinc, and the treatment plants installed, with the exception of that at the New Sylvia Mine, have been unsuitable.
Thames Borough.—Much of the auriferous ground within the borough has been well prospected. Numerous shoots of exceedingly rich ore have been found above the 500 ft. level, but these have invariably given out at depth. The total value of bullion obtained within the borough exceeds £5,000,000. Prospecting by driving at the 1,000 ft. level proved nothing of value, and operations were stopped on account of large quantities of a mixture of nitrogen and carbon-dioxide gases being given off in the workings, rendering mining dangerous. Owing to the cessation of pumping the mine-water has risen to sea-level.
Ohinemuri County.—A large area of promising unprospected country exists between the Karangahake and Te Aroha Mountains. Large lodes are known to exist, and it is possible that payable ore may be found by systematic and exhaustive prospecting.
Tauranga County.—No sustained or well-considered attempt has yet been made to prospect the country surrounding the mine of Muir's Gold Reefs (Limited), near Te Puke. Quartz lodes outcrop on the main range two miles from that mine, the country there being similar to that at the mine.
Buller and Murchison Counties.—What is known as the central Karamea area, lying between Mount William on the south and the upper waters of the Roaring Lion River and other tributaries of the Karamea River on the north, and extending eastward in the direction of Lyell. Quartz, and other lodes have been found, but so far none has been rich enough to pay for working. The country is, however, not suitable for prospecting by small parties, as it is difficult of access, and stores have to be packed long distances.
Westland County.—The locality of the Taipo River, a tributary of the Taramakau River: Platinum in small quantities has been found in reefs in this area, but little investigation of such reefs has been made. A number of reefs carrying gold have been located about the headwaters of the Arahura and Wilberforce Rivers, and although a certain amount of prospecting has been done on them some further examination may be justified. That area of country lying between Bald Hill Range and the Upper Totara River, including the valleys of Smyth, Upper Totara, and Weir and Parmer Streams, may also be worthy of further investigation.
Lake County.—The country between Macetown and the Rees River: Several-auriferous lodes have been worked in the past, and possibly others will be found within the area. Parts of the country, which are difficult of access, can be prospected only by properly equipped parties under efficient leadership.
Central Otago.—At Macrae's, Hindon, Barewood, Bendigo, Carrick Range, and Old Man Range, where auriferous lodes and lodes carrying gold and scheelite have been worked, surface prospecting may result in new discoveries, while some of the known lodes are worth developing at deeper levels.
South-west Otago.—An extensive area of country in this locality remains to be prospected. Gold, copper, molybdenite, lead, and other minerals have been found within the area, which is highly mountainous, covered with timber, and very difficult of access. Only strong and well-equipped parties, with a leader having geological experience and a knowledge of minerals, should undertake prospecting in this locality.
Stewart Island.—Tin and gold have been found near Port Pegasus, where there is a large area of almost unprospected country.
Examinations are held by the Board of Examiners annually of candidates for certificates as first-class and second-class mine-managers, battery-superintendents, and dredgemasters under the Mining Act, and for certificates as first-class and second-class mine-managers under the Coal-mines Act. Examinations of candidates for certificates as underviewers and firemen and deputies under the Coal-mines Act are held periodically when necessary. No candidate is permitted to present himself for examination unless he holds an authority from the Secretary to the Board of Examiners.
Regulations have been gazetted re the issue of mine surveyors' certificates, as-prescribed by section 79 (4) of the Coal-mines Act, 1925.
As required by the Coal-mines Act, 1925, the owner of every coal-mine contributes ½d. per ton on all coal sold, for the relief of the coal-miners who may be injured whilst working, and for the relief of families of coal-miners who may be killed or injured. Under the Act the Sick and Accident Funds have been abolished, and accident relief will in future be paid from the Coal-miners' Relief Fund, which is administered by the Public Trustee with the assistance of local committees.
The following is a statement of the Coal-miners' Relief Fund Account during the last two financial years:—
| Year ended 31st March, 1925. £ | Year ended 31st March, 1926. £ | |
|---|---|---|
| Contributions | 1,870 | 1,978 |
| Allowances on account of accidents | 1,559 | 2,320 |
| Balance carried forward | 13,775 | 12,469 |
The following is a statement of the Sick and Accident Funds for the calendar years 1924 and 1925:—
| Year ended 31st December, 1924. £ | Year ended 31st December, 1925. £ | |
|---|---|---|
| Contributions | 2,060 | 2,228 |
| Allowances on account of accidents | 2,949 | 3,042 |
| Balance carried forward | 13,962 | 14,174 |
Table of Contents
THE population of New Zealand is as yet insufficient to maintain a wide range of secondary industries, and consequently the Dominion's manufacturing field is for the main part limited to the treatment of the principal primary products. Statistics for recent years, however, indicate brisk advancement among the principal branches of manufacture, as well as a tendency, with the increasing population, for greater diversity in the branches covered.
Statistics of factory production were collected in New Zealand from 1867 to 1916 in conjunction with the population census—viz., in 1867, 1871, 1874, 1878, and 1881, and quinquennially thereafter. Commencing with the year 1918–19, the collection became an annual one.
Under the regulations authorizing the collection of statistics of factory production a “factory” is defined as an establishment engaged in manufacture, repair, or preparation of articles for wholesale or retail trade or for export, which employs at least two hands or uses motive power, with the exception of the following, which are expressly excluded: Bakeries, butcheries, laundries, smithies, waterworks, shops engaged in retail trade only, and farmers or others using motive power for their own individual and private use. The following are, however, required to furnish returns even although employing less than two hands and not using motive power: Tanneries: bacon, butter, cheese, soap or candle factories; brickyards; and limeworks.
The definition is fairly comprehensive, and clearly includes such industries as, for instance, jewellery and watch repairing, boot, shoe, and saddlery repairing, and similar trades. In former years a number of small establishments thus engaged were included in the statistics, but such are now excluded unless they are also engaged in actual manufacture employing at least two hands.
Other classes of establishments formerly covered by the statistics but excluded from 1921–22 onwards are those engaged in dressmaking and millinery (unless manufacturing wholesale for sale in retail shops), bespoke tailoring, and establishments engaged in tea blending and packing, bottling liquor, stone quarrying and crushing, asphalting, or monumental masonry. The latter industries were excluded to bring the statistics into line with other parts of the Empire. In addition, returns are not pressed for from plumbers or from builders who make joinery for their own building contracts.
This has had the effect of showing an apparent decrease in the number of establishments in some industries and also in the total of all industries; but in other respects the effect on the statistics is negligible, the number of employees and the value of materials used, products, &c., covered by the trades concerned being comparatively small. The comparative tables which follow have, where necessary, been adjusted to some extent by deducting from the totals figures for industries which appear in some years and not in others.
It should be noted that these statistics do not cover, and do not purport to cover, all establishments registered as factories in the Dominion, for the following reason: “One man” businesses are excluded with the exception of tanneries, bacon, butter, cheese, soap or candle factories, brickyards, or limeworks; some small repair-shops (as explained previously) are excluded even although they may employ two or more hands; and in some cases where a factory has two or more branches it has been found impracticable to obtain separate returns, and all branches have been treated as one establishment. The effect of this is seen from the fact that while for the year 1924–25 15,868 factories, employing 99,423 hands, were registered under the Factories Act, only 4,547 factories (with, however, 71,760 productive employees) were covered by the statistics of factory production.
In comparing figures for different years the foregoing remarks should be borne in mind, and also the fact that in some of the earlier years, owing to the longer intervals between collections, greater prevalence of lax methods of book-keeping, less understanding of the requirements of the Statistical Office, and less appreciation of the necessity for and value of the statistics compiled, no doubt to a certain extent impaired the accuracy of the published results.
The establishments recorded in 1924–25 numbered 4,547, an excess of 86 over the number recorded in the previous year. This increase is confined mainly to a few industries, the principal being—Saw-milling, 25; flax-milling, 19; printing, &c., 18; engineering, 18; ærated-waters, 13; motor and cycle engineering, 11; and furniture-making, 11. A number of industries showed decreases, but the establishments that have gone out of existence appear to be of the smaller type.
It is not surprising to find the number of motor and cycle, printing, engineering, and woodware establishments having their numbers swelled each year. These industries have been appropriately termed “neighbourhood” industries, and are usually found serving defined communities, each of which has its own motor-garage, printing-works, and joinery-shop. In a growing community the tendency is for new establishments of these classes to come into existence as against the expansion of those already in existence. In quite a few cases decreases in the number of establishments were recorded, but in the majority of such cases the decrease was very slight, and was due, no doubt, to the lives of many concerns being brought to an end by the death or retirement of the proprietor or by other cognate causes. The decreases, however, recorded in the meat-freezing (3), coachbuilding (19), jewellery (8), and clothing (2) industries are much greater in proportion to those referred to, and merit special consideration. During the war and immediate post-war years the number of freezing-works in the Dominion climbed steadily upwards from 45 in 1916 to 51 in 1921, when this industry reached its zenith. Following the slump in the latter part of 1921, the fall in prices of meat in the Home markets made it quite clear that the meat-freezing industry in the Dominion could not shoulder the burden of overhead involved in the upkeep of 51 works, and subsequent years saw a gradual diminution in the number of works, until in 1924 there were 46 in operation. The figures for 1925 show that three more works have been closed. The enormous increase of late years in motor traffic has gradually forced many small coachbuilding establishments out of business, hence the substantial decrease in the number of these establishments reporting. Changes in fashion have seriously affected the jewellery trade during recent years, with the result that several jewellery establishments have been obliged to close down. The number of clothing establishments showed steady increases up to 1922, but the depression experienced in this industry during the last two years is no doubt responsible for the decrease in the number of factories as disclosed by the figures for these years.
The remarks made previously regarding comparisons between the figures for different years are particularly applicable in connection with the number of establishments A comparison between the gross figures for the years shown in the subjoined table gives an altogether wrong impression of the actual state of affairs. The net figures common to all years are comparable, and show that the number of establishments returned in the latest collection is larger than that for any other year shown.
| Provincial District. | 1910–11. | 1915–16. | 1920–21. | 1922–23. | 1923–24. | 1924–25. |
|---|---|---|---|---|---|---|
| Auckland | 934 | 1,236 | 1,312 | 1,218 | 1,272 | 1,339 |
| Taranaki | 253 | 246 | 250 | 235 | 228 | 228 |
| Hawke's Bay | 251 | 256 | 293 | 254 | 256 | 247 |
| Wellington | 982 | 953 | 1,028 | 943 | 961 | 950 |
| Marlborough | 95 | 57 | 54 | 67 | 70 | 79 |
| Nelson | 214 | 156 | 153 | 141 | 150 | 140 |
| Westland | 107 | 105 | 109 | 108 | 117 | 120 |
| Canterbury | 724 | 776 | 748 | 650 | 675 | 701 |
| Otago | 549 | 579 | 570 | 468 | 469 | 477 |
| Southland | 293 | 306 | 287 | 251 | 263 | 266 |
| Totals | 4,402 | 4,670 | 4,804 | 4,335 | 4,461 | 4,547 |
| Deduct certain industries included in some years and not in others | 878 | 971 | 853 | 76 | 53 | 45 |
| Totals, industries common to all years | 3,524 | 3,699 | 3,951 | 4,259 | 4,408 | 4,502 |
In point of numbers Auckland claims the premier position, having nearly 400 more establishments than Wellington, which occupies a corresponding position in regard to Canterbury, with Otago over 200 behind Canterbury. Southland, Hawke's Bay, and Taranaki all have between 200 and 300 establishments, followed by Nelson, Westland, and Marlborough in that order.
The following table shows the number of establishments, classified by industries and provincial districts, for the year ended 31st March, 1925:—
| Class of Industry. | Auckland. | Taranaki. | Hawke's Bay. | Wellington. | Marlborough. | Nelson. | Westland. | Canterbury. | Otago. | Southland. | Totals. |
|---|---|---|---|---|---|---|---|---|---|---|---|
| Animal food | 119 | 74 | 31 | 104 | 11 | 13 | 9 | 57 | 45 | 70 | 533 |
| Vegetable food | 32 | 2 | 3 | 16 | 3 | 4 | .. | 31 | 29 | 4 | 124 |
| Drinks, narcotics, and stimulants | 51 | 12 | 22 | 39 | 7 | 16 | 9 | 41 | 20 | 9 | 226 |
| Animal matters (not otherwise classed) | 17 | 5 | 7 | 16 | 2 | 2 | 2 | 14 | 5 | .. | 70 |
| Working in wood | 192 | 10 | 33 | 124 | 18 | 42 | 61 | 62 | 42 | 42 | 626 |
| Vegetable produce for fodder | 3 | 1 | .. | 2 | .. | .. | .. | 2 | 1 | .. | 9 |
| Paper manufactures | 4 | .. | .. | 4 | .. | .. | .. | 3 | 5 | 3 | 19 |
| Heat, light, and power | 37 | 12 | 13 | 26 | 4 | 7 | 3 | 28 | 11 | 7 | 148 |
| Processes relating to stone, clay, glass, &c. | 63 | 4 | 9 | 33 | 5 | 6 | 3 | 24 | 17 | 14 | 178 |
| Metals other than gold or silver | 120 | 15 | 14 | 88 | 2 | 8 | 6 | 69 | 48 | 17 | 387 |
| Precious metals | 11 | .. | 2 | 14 | .. | .. | .. | 7 | 10 | 1 | 45 |
| Books and publications | 96 | 13 | 13 | 65 | 4 | 10 | 4 | 51 | 37 | 17 | 310 |
| Musical instruments | 2 | .. | .. | .. | .. | .. | .. | 2 | 4 | .. | 8 |
| Ornaments and minor art products | 16 | .. | 2 | 16 | .. | .. | .. | 15 | 8 | 1 | 58 |
| Equipment for sports and games | 1 | .. | .. | 2 | .. | .. | .. | 1 | .. | .. | 4 |
| Designs, medals, type, and dies | 4 | .. | .. | 7 | .. | .. | .. | 2 | 1 | .. | 14 |
| Machines, tools, and implements | 9 | 1 | .. | 6 | .. | .. | .. | 14 | 5 | 2 | 37 |
| Carriages and vehicles | 193 | 46 | 58 | 177 | 16 | 17 | 14 | 103 | 69 | 37 | 730 |
| Harness, saddlery, and leather-ware | 54 | 3 | 12 | 23 | .. | 1 | .. | 42 | 17 | 9 | 161 |
| Ships, boats, and their equipment | 30 | 2 | 3 | 10 | 1 | 2 | .. | 7 | 7 | .. | 62 |
| House furnishings | 127 | 20 | 15 | 53 | 1 | 8 | 6 | 48 | 15 | 9 | 302 |
| Chemicals and by-products | 14 | 2 | 6 | 20 | .. | .. | .. | 13 | 11 | 2 | 68 |
| Textile fabrics | 2 | .. | 1 | 3 | .. | .. | .. | 4 | 5 | 1 | 16 |
| Apparel | 117 | 6 | 2 | 76 | .. | 1 | 1 | 54 | 49 | 4 | 310 |
| Fibrous materials | 17 | .. | 1 | 17 | 5 | 3 | 2 | 6 | 12 | 17 | 80 |
| Miscellaneous | 8 | .. | .. | 9 | .. | .. | .. | 1 | 3 | 1 | 22 |
| Totals | 1,339 | 228 | 247 | 950 | 79 | 140 | 120 | 701 | 476 | 267 | 4,547 |
The number of establishments is not a very satisfactory basis on which to judge of the development of the various industries. In those industries where the initial capital outlay is large and the materials operated upon are easily transferable (e.g., meat-freezing, &c.), there is a tendency for the establishments to expand within themselves, while in other cases, such as motor and cycle engineering, where the initial capital outlay is small and where each establishment supplies the needs of individual communities, a mushroom-like growth in the number of establishments is evident.
An interesting classification of establishments is according to the number of hands engaged, and the following table gives the establishments for the last five years classified in this way:—
| Year. | 10 or under. | 11–20. | 21–50. | 51–100. | Over 100. | Total. |
|---|---|---|---|---|---|---|
| 1920–21 | 2,646 | 603 | 493 | 175 | 116 | 4,033 |
| 1921–22 | 2,772 | 643 | 509 | 140 | 116 | 4,180 |
| 1922–23 | 2,913 | 637 | 509 | 160 | 116 | 4,335 |
| 1923–24 | 2,933 | 691 | 544 | 165 | 128 | 4,461 |
| 1924–25 | 2,972 | 721 | 572 | 157 | 125 | 4,547 |
To enable a proper comparison to be made, certain industries covered in 1920–21, but not in later years, have been omitted from the figures for the first-mentioned year in this and the two succeeding tables.
As might be expected, the establishments with the smaller numbers of employees reflect greater movements during the last four years than the larger establishments. It is particularly interesting to note that the establishments employing over 100 persons showed in 1924–25 a decrease of 3 in comparison with the figure for the previous year. The decrease in the number of establishments employing over 50 hands is mainly accounted for by the fact that some establishments which operated several factories, and which previously furnished one return covering all their factories, thus being recorded as one large factory, furnished separate returns for each factory operated during the year ended 31st March, 1925. Each factory was recorded as a separate establishment, with the result that the total establishments employing from 10 to 20 and 20 to 50 hands in 1924–25 showed an increase, while the larger concerns employing 50 hands and over showed a decrease.
Prior to 1923–24 the number of establishments employing 10 workers or under showed increases of over 100 as compared with the immediately preceding year, but in that and the following 3 year the increases in the establishments under this heading over the numbers recorded in the previous years were only 20 and 39 respectively. This proportionately lower increase in the smaller establishments was, however, counteracted by an upward movement in the establishments employing between 10 and 100 hands. The movements in the numbers of establishments under each heading are disclosed perhaps a little more clearly in the following table showing the percentages of each group to the total over the last five years.
| Year. | 10 or under. | 11–20. | 21–50. | 51–100. | Over 100. | Total. |
|---|---|---|---|---|---|---|
| Per Cent. | Per Cent. | Per Cent | Per Cent. | Per Cent. | Per Cent. | |
| 1920–21 | 65.61 | 14.95 | 12.22 | 4.34 | 2.88 | 100.00 |
| 1921–22 | 66.32 | 15.38 | 12.18 | 3.35 | 2.77 | 100.00 |
| 1922–23 | 67.20 | 14.69 | 11.74 | 3.69 | 2.68 | 100.00 |
| 1923–24 | 65.75 | 15.49 | 12.19 | 3.70 | 2.87 | 100.00 |
| 1924–25 | 65.36 | 15.86 | 12.58 | 3.45 | 2.75 | 100.00 |
The following table shows the number of employees engaged in factories of the various categories, with the percentage of each to the total, and the number of employees per establishment:—
| Year. | 10 or under. | 11–20. | 21–50. | 51–100. | Over 100. | Total. |
|---|---|---|---|---|---|---|
| Number of Employees. | ||||||
| 1920–21 | 11,245 | 8,961 | 15,351 | 12,345 | 24,384 | 72,286 |
| 1921–22 | 11,501 | 9,448 | 15,422 | 9,870 | 24,075 | 70,316 |
| 1922–23 | 12,451 | 9,429 | 16,275 | 11,219 | 24,288 | 73,662 |
| 1923–24 | 12,330 | 10,127 | 16,921 | 11,481 | 26,802 | 77,661 |
| 1924–25 | 12,658 | 10,702 | 18,133 | 11,226 | 27,608 | 80,327 |
| Percentages of Total. | ||||||
| 1920–21 | 15.55 | 12.40 | 21.24 | 17.08 | 33.73 | 100.00 |
| 1921–22 | 16.35 | 13.44 | 21.93 | 14.04 | 34.24 | 100.00 |
| 1922–23 | 16.90 | 12.80 | 22.09 | 15.24 | 32.97 | 100.00 |
| 1923–24 | 15.88 | 13.04 | 21.79 | 14.78 | 34.51 | 100.00 |
| 1924–25 | 15.76 | 13.32 | 22.57 | 13.98 | 34.37 | 100.00 |
| Employees per Establishment. | ||||||
| 1920–21 | 4.25 | 14.86 | 31.14 | 70.54 | 210.20 | 17.92 |
| 1921–22 | 4.15 | 14.69 | 30.30 | 70.50 | 207.54 | 16.82 |
| 1922–23 | 4.27 | 14.80 | 31.97 | 70.12 | 209.38 | 16.99 |
| 1923–24 | 4.20 | 14.66 | 31.10 | 69.58 | 209.39 | 17.41 |
| 1924–25 | 4.26 | 14.84 | 31.70 | 71.50 | 220.86 | 17.67 |
The average number of employees per establishment shows a slight but consistent upward trend over the last four years. The percentages given above, in conjunction with the classification of establishments according to the number of hands engaged, shows that the number of employees engaged in the middle-sized factories tends to increase at a faster rate than those engaged in the smaller and larger-sized factories.
Prior to 1918–19 information regarding productive employees only was asked for, but since that date information regarding all employees has been sought under the following heads, viz.: Administrative, productive, and distributive. The following table shows the total employees returned at each of the last five collections, classified by provincial districts:—
| Year. | Auckland. | Taranaki. | Hawke's Bay | Wellington. | Marlborough. | Nelson. | Westland. | Canterbury. | Otago. | Southland. | Total. |
|---|---|---|---|---|---|---|---|---|---|---|---|
| Numbers. | |||||||||||
| 1920–21 | 24,675 | 2,519 | 2,828 | 16,447 | 432 | 1,255 | 1,389 | 14,666 | 11,557 | 3,085 | 78,853 |
| 1921–22 | 21,814 | 2,325 | 2,587 | 14,947 | 504 | 1,108 | 1,259 | 12,865 | 10,263 | 2,644 | 70,316 |
| 1922–23 | 23,838 | 2,312 | 2,692 | 14,842 | 549 | 1,154 | 1,353 | 13,539 | 10,583 | 2,800 | 73,662 |
| 1923–24 | 25,290 | 2,450 | 2,716 | 15,493 | 589 | 1,336 | 1,695 | 13,934 | 11,041 | 3,117 | 77,661 |
| 1924–25 | 26,411 | 2,415 | 2,814 | 17,021 | 568 | 1,251 | 1,828 | 14,082 | 10,643 | 3,294 | 80,327 |
| Percentages of Dominion Total. | |||||||||||
| 1920–21 | 31.29 | 3.19 | 3.59 | 20.86 | 0.55 | 1.59 | 1.76 | 18.60 | 14.66 | 3.91 | 100.00 |
| 1921–22 | 31.02 | 3.31 | 3.68 | 21.26 | 0.72 | 1.57 | 1.79 | 18.29 | 14.60 | 3.76 | 100.00 |
| 1922–23 | 32.36 | 3.14 | 3.65 | 20.15 | 0.75 | 1.57 | 1.84 | 18.37 | 14.37 | 3.80 | 100.00 |
| 1923–24 | 32.56 | 3.16 | 3.50 | 19.95 | 0.76 | 1.72 | 2.18 | 17.94 | 14.22 | 4.01 | 100.00 |
| 1924–25 | 32.88 | 3.01 | 3.50 | 21.19 | 0.71 | 1.56 | 2.27 | 17.53 | 13.25 | 4.10 | 100.00 |
The drop in the total employees in 1921–22, as compared with the preceding year, was caused by the exclusion, in that and following years, of dressmaking and other industries. It is interesting to note that more than 50 per cent. of the total employees are located in the Auckland and Wellington Provincial Districts, and that for the latest year Auckland alone accounted for over 30 per cent of the total, as against 20 per cent. for Wellington. The gross figures for the latest collection show that six of the provincial districts record increases, and four decreases in the number of employees, while the percentages given indicate that the Auckland and Wellington Provincial Districts are increasing at a relatively higher rate than the other districts.
It is not surprising to find that the distribution of the sexes in the employees shows a considerable preponderance of males. In 1918–19 the number of females per 100 males was 32, which figure fell to 28 in the two following years, the decrease being due, no doubt, to the re-entry of many overseas troops into industrial life. In 1921–22 the exclusion of the dressmaking industry was responsible for a further decrease in the proportion of females to males, but the figures for that and succeeding years have remained fairly constant except for a slight upward movement in 1922–23, followed by slight decreases in 1923–24 and 1924–25. The following table gives the number of females per 100 males employed in factories in each provincial district for the last five years.
| Provincial District. | 1920–21. | 1921–22. | 1922–23. | 1923–24. | 1924–25. |
|---|---|---|---|---|---|
| Auckland | 26 | 21 | 22 | 22 | 21 |
| Taranaki | 11 | 7 | 7 | 7 | 8 |
| Hawke's Bay | 13 | 7 | 7 | 7 | 8 |
| Wellington | 24 | 21 | 22 | 21 | 22 |
| Marlborough | 5 | 4 | 2 | 2 | 2 |
| Nelson | 17 | 12 | 14 | 14 | 12 |
| Westland | 6 | 3 | 2 | 2 | 2 |
| Canterbury | 37 | 25 | 26 | 25 | 24 |
| Otago | 44 | 37 | 40 | 38 | 36 |
| Southland | 18 | 10 | 9 | 8 | 9 |
| Totals | 28 | 22 | 23 | 22 | 21 |
In the smaller districts there are few industries employing female labour to any extent, and the preponderance of males in such districts is very great.; but this preponderance is considerably smaller in the four main districts, where female labour is in greater demand. In Otago the excess of males is less than in any other district, being as a matter of fact approximately two-thirds of that in Auckland and Wellington. Canterbury also has a comparatively small excess, but the presence of woollen-mills, which employ mainly female labour, is no doubt responsible for the position in both districts.
The subjoined table shows the employees for the last five collections classified according to the class of employment—i.e., the numbers employed in administrative, productive, and distributive capacities—and the percentage of each class of the total:—
| Year. | Administrative. | Productive. | Distributive. | Total. | |||
|---|---|---|---|---|---|---|---|
| Number. | Per Cent. of Total. | Number. | Per Cent. of Total. | Number. | Per Cent. of Total. | ||
| 1920–21 | 2,775 | 3.52 | 70,255 | 89.10 | 5,823 | 7.38 | 78,853 |
| 1921–22 | 2,859 | 4.07 | 61,542 | 87.52 | 5,915 | 8.41 | 70,316 |
| 1922–23 | 2,808 | 3.81 | 64,658 | 87.78 | 6,196 | 8.41 | 73,662 |
| 1923–24 | 3,175 | 4.09 | 67,945 | 87.49 | 6,541 | 8.42 | 77,661 |
| 1924–25 | 2,765 | 3.44 | 71,760 | 89.34 | 5,802 | 7.22 | 80,327 |
The amount of salaries and wages paid offers a good basis upon which to study the development of factories. Since 1906 the amount paid in productive wages has approximately trebled, while during the same period the “added value” shows a similar increase. The inflation of prices which marked the early post-war period is particularly manifest in the figures for salaries and wages, and the aggregate amounts paid to labour during 1918–19 and the two subsequent years show violent fluctuations. Indeed, within the twelve months following the year 1918–19 the amount paid away in this connection increased by nearly £2,000,000, to be followed in 1920–21 with another increase of £3,000,000 over 1919–20 and of £5,000,000 over 1918–19. During this time the number of employees had not, however, remained stationary, but did not show increases nearly commensurate with the increase in salaries and wages; the percentage increases of the figures for the years 1919–20 and 1920–21 over the year immediately preceding, and of 1920–21 over 1918–19, were 8.94 per cent., 8.18 per cent., and 17.85 per cent. respectively. Corresponding increases in. salaries and wages show percentages of 2273, 25.85, and 54.45 respectively.
Since the drop following the slump of 1921–22 the total amount paid in wages has climbed steadily upwards. In 1923–24 the record set in 1920–21 was practically equalled, while the amount recorded in the latest collection established a new record. This latest figure (£15,690,202) was £1,116,761, or 7.66 per cent. greater than the figure for the immediately preceding year, while the figure for the latter year was £808,557, or 5.87 per cent. in excess of that for its predecessor. Viewing the figures from a slightly different but more expressive aspect, the amount paid in wages has increased by £1,925,318, or 14 per cent., within the short space of two years. The number of employees during the same period increased by 6,665, or 9 per cent., showing prima facie that there is a tendency for the average wage per employee to increase, notwithstanding an increase in the total employees. In point of fact, approximately 33 ⅓ per cent. of the total increase of £1,925,318 over the last two years was required to pay actual increases in the average rates, the balance being paid to new employees. The following figures, which represent the average wage-rates over all employees as recorded in the last six collections, expressed in the purchasing-power of the sovereign in 1914, show clearly that the average rate of wages has substantially increased during that period:—
| Year. | Adjusted Average Yearly Rate of Wages. | Figures in previous Column expressed relatively (1919–20 = 100). |
|---|---|---|
| 1919–20 | 159.55 | 100 |
| 1920–21 | 163.77 | 103 |
| 1921–22 | 171.81 | 108 |
| 1922–23 | 183.36 | 115 |
| 1923–24 | 186.11 | 117 |
| 1924–25 | 190.82 | 120 |
The following table shows the wages paid during the last five years according to provincial districts:—
| Year. | Auckland. | Taranaki. | Hawke's Bay. | Wellington. | Marlborough. | |
|---|---|---|---|---|---|---|
| £ | £ | £ | £ | £ | ||
| 1920–21 | 4,649,341 | 478,068 | 521,375 | 3,300,905 | 72,789 | |
| 1921–22 | 4,293,067 | 459,696 | 510,414 | 3,051,375 | 91,455 | |
| 1922–23 | 4,451,192 | 430,415 | 503,443 | 2,900,206 | 95,601 | |
| 1923–24 | 4,907,600 | 473,373 | 519,957 | 3,000,546 | 90,159 | |
| 1924–25 | 5,232,278 | 486,258 | 580,097 | 3,478,532 | 89,191 | |
| Year. | Nelson. | Westland. | Canterbury. | Otago. | Southland. | Total. |
|---|---|---|---|---|---|---|
| £ | £ | £ | £ | £ | £ | |
| 1920–21 | 203,643 | 268,068 | 2,589,254 | 2,003,943 | 548,215 | 14,635,601 |
| 1921–22 | 186,116 | 286,465 | 2,437,173 | 1,851,646 | 509,969 | 13,677,376 |
| 1922–23 | 184,640 | 279,276 | 2,610,882 | 1,799,784 | 509,445 | 13,764,884 |
| 1923–24 | 219,324 | 344,717 | 2,551,320 | 1,901,511 | 564,934 | 14,573,441 |
| 1924–25 | 224,929 | 428,699 | 2,638,457 | 1,911,760 | 620,001 | 15,690,202 |
The amounts received by male and female employees, and the average amount received per employee of each sex, as recorded in the last five collections, are set out below:—
| Year. | Males. | Females. | Both Sexes. | |||
|---|---|---|---|---|---|---|
| Total. | Average. | Total. | Average. | Total. | Average. | |
| £ | £ | £ | £ | £ | £ | |
| 1920–21 | 12,989,629 | 210.35 | 1,645,972 | 96.26 | 14,625,601 | 185.61 |
| 1921–22 | 12,477,854 | 215.78 | 1,199,522 | 96.05 | 13,677,376 | 194.51 |
| 1922–23 | 12,492,799 | 208.13 | 1,272,085 | 93.28 | 13,764,884 | 186.87 |
| 1923–24 | 13,220,908 | 207.13 | 1,352,533 | 97.78 | 14,573,441 | 187.65 |
| 1924–25 | 14,327,777 | 216.92 | 1,362,425 | 97.53 | 15,690,202 | 195.33 |
Owing to the fact that employees who were engaged for part of the year only were not excluded from the figures in computing the average given above, and, further, as it was not practicable to take into consideration other factors which would disturb the accuracy of the final averages, the figures given in the above table cannot be regarded in other than a general way.
The classification of the salaries and wages paid according to the class of employees is interesting, but, owing to the difficulty in many cases of differentiating between the three classes, the figures given below are in many cases the result of estimations.
The following table shows the total salaries and wages paid during the last five years classified according to the class of employees, together with the percentage which the amount received by each class bears to the total amount paid:—
| Year. | Administrative. | Productive. | Distributive. | Total Amount. | |||
|---|---|---|---|---|---|---|---|
| Amount. | Per Cent. of Total. | Amount. | Per Cent. of Total. | Amount. | Per Cent. of Total. | ||
| £ | £ | £ | £ | ||||
| 1920–21 | 805,869 | 5.50 | 12,569,904 | 85.89 | 1,259,828 | 8.61 | 14,635,601 |
| 1921–22 | 826,554 | 6.04 | 11,519,975 | 84.23 | 1,330,847 | 9.73 | 13,677,376 |
| 1922–23 | 834,324 | 6.06 | 11,549,146 | 83.90 | 1,381,414 | 10.04 | 13,764,884 |
| 1923–24 | 925,260 | 6.35 | 12,136,394 | 83.28 | 1,511,787 | 10.37 | 14,573,441 |
| 1924–25 | 915,102 | 5.83 | 13,557,236 | 86.40 | 1,217,864 | 7.77 | 15,690,202 |
The average amounts received annually during the last five years by administrative, productive, and distributive employees are given in the following table:—
| year. | Administrative. | Productive. | Distributive. | |||
|---|---|---|---|---|---|---|
| Males. | Females. | Males. | Females. | Males. | Females. | |
| £ | £ | £ | £ | £ | £ | |
| 1920–21 | 318.15 | 127.55 | 203.82 | 94.59 | 229.52 | 116.91 |
| 1921–22 | 318.18 | 126.65 | 208.39 | 93.73 | 239.12 | 115.53 |
| 1922–23 | 324.99 | 124.83 | 199.75 | 91.08 | 236.07 | 115.87 |
| 1923–24 | 321.67 | 122.40 | 197.50 | 95.71 | 254.86 | 116.80 |
| 1924–25 | 363.10 | 126.75 | 209.32 | 95.05 | 223.43 | 123.85 |
With the exception of the female productive employees and the male distributive employees, the 1924–25 figures show substantial increases over those for the two immediately preceding years.
The following table shows the salaries and wages paid during the year ended 31st March, 1925, in each class of industry, classified according to whether paid on account of administration, production, or distribution.
| Class of Industry. | Salaries and Wages paid on account of | |||||||||||
|---|---|---|---|---|---|---|---|---|---|---|---|---|
| Administration. | Production. | Distribution. | Total. | |||||||||
| To Males. | To Females. | Total. | To Males. | To Females. | Total. | To Males. | To Females. | Total. | To Males. | To Females. | Total. | |
| £ | £ | £ | £ | £ | £ | £ | £ | £ | £ | £ | £ | |
| Animal food | 169,994 | 10,494 | 180,488 | 2,172,853 | 20,399 | 2,193,252 | 67,647 | 8,106 | 75,753 | 2,410,494 | 38,999 | 2,449,493 |
| Vegetable food | 45,722 | 1,703 | 47,425 | 395,867 | 102,215 | 498,082 | 71,367 | 9,245 | 80,612 | 512,956 | 113,163 | 626,119 |
| Drinks, narcotics, and stimulants | 42,507 | 1,232 | 43,739 | 327,695 | 21,440 | 349,135 | 84,884 | 5,088 | 89,972 | 455,086 | 27,760 | 482,846 |
| Animal matters (not otherwise classed) | 27,713 | 2,008 | 29,721 | 168,794 | 8,070 | 176,864 | 15,311 | 1,739 | 17,050 | 211,818 | 11,817 | 223,635 |
| Working in wood | 98,349 | 1,185 | 99,534 | 2,237,845 | 4,982 | 2,242,827 | 173,376 | 4,172 | 177,548 | 2,509,570 | 10,339 | 2,519,909 |
| Vegetable produce for fodder | 1,750 | .. | 1,750 | 13,497 | 2,097 | 15,594 | 2,564 | 816 | 3,380 | 17,811 | 2,913 | 20,724 |
| Paper manufactures | 2,492 | 520 | 3,012 | 43,039 | 19,099 | 62,138 | 616 | 358 | 974 | 46,147 | 19,977 | 66,124 |
| Heat, light, and power | 90,021 | 10,540 | 100,561 | 1,064,869 | 3,464 | 1,068,333 | 313,622 | 13,378 | 327,000 | 1,468,512 | 27,382 | 1,495,894 |
| Processes relating to stone, clay, glass, &c. | 27,546 | 716 | 28,262 | 604,331 | 2,708 | 607,039 | 24,573 | 3,226 | 27,799 | 656,450 | 6,650 | 663,100 |
| Metals other than gold or silver | 72,890 | 481 | 73,371 | 1,145,348 | 14,911 | 1,160,259 | 34,248 | 5,232 | 39,480 | 1,252,486 | 20,624 | 1,273,110 |
| Precious metals | 702 | 150 | 852 | 38,279 | 850 | 39,129 | 916 | 525 | 1,441 | 39,897 | 1,525 | 41,422 |
| Books and publications | 116,473 | 7,1£ | £,614 | 1,102,495 | 146,898 | 1,249,393 | 115,654 | 13,001 | 128,655 | 1,334,622 | 167,040 | 1,501,662 |
| Musical instruments | 263 | .. | 263 | 11,845 | .. | 11,845 | .. | .. | .. | 12,108 | .. | 12,108 |
| Ornaments and minor art products | 660 | .. | 660 | 45,308 | 3,566 | 48,874 | 39 | 590 | 629 | 46,007 | 4,156 | 50,163 |
| Equipment for sports and games | 500 | .. | 500 | 6,831 | 156 | 6,987 | .. | .. | .. | 7,331 | 156 | 7,487 |
| Designs, medals, type, and dies | 387 | 65 | 452 | 12,491 | 155 | 12,646 | 197 | 140 | 337 | 13,075 | 360 | 13,435 |
| Machines, tools, and implements | 11,409 | 600 | 12,009 | 170,373 | 6,132 | 176,505 | 39,706 | 5,469 | 45,175 | 221,488 | 12,201 | 233,689 |
| Carriages and vehicles | 27,824 | 2,121 | 29,945 | 700,131 | 15,188 | 715,319 | 1,357 | 283 | 1,640 | 729,312 | 17,592 | 746,904 |
| Harness, saddlery, and leatherware | 27,907 | 832 | 28,739 | 309,109 | 12,082 | 321,191 | 28,359 | 3,796 | 32,155 | 365,375 | 16,710 | 382,085 |
| Ships, boats, and their equipment | 4,904 | 812 | 5,716 | 237,987 | 7,767 | 245,754 | 1,895 | 230 | 2,125 | 244,786 | 8,809 | 253,595 |
| House-furnishings | 17,561 | 1,171 | 18,732 | 394,947 | 30,420 | 425,367 | 20,629 | 4,481 | 25,110 | 433,137 | 36,072 | 469,209 |
| Chemicals and by-products | 20,416 | 1,226 | 21,642 | 127,073 | 27,581 | 154,654 | 51,605 | 3,370 | 54,975 | 199,094 | 32,177 | 231,271 |
| Textile fabrics | 10,648 | 345 | 10,993 | 235,860 | 123,655 | 359,515 | 15,384 | 2,382 | 17,766 | 261,892 | 126,382 | 388,274 |
| Apparel | 39,640 | 4,200 | 43,840 | 493,427 | 631,112 | 1,124,539 | 47,280 | 9,342 | 56,622 | 580,347 | 644,654 | 1,225,001 |
| Fibrous materials | 6,857 | 117 | 6,974 | 258,618 | 4,940 | 263,558 | 5,544 | 958 | 6,502 | 271,019 | 6,015 | 277,034 |
| Miscellaneous | 2,308 | .. | 2,308 | 21,155 | 7,282 | 28,437 | 3,494 | 1,670 | 5,164 | 26,957 | 8,952 | 35,909 |
| Totals | 867,443 | 47,659 | 915,102 | 12,340,067 | 1,217,169 | 13,557,236 | 1,120,267 | 97,597 | 1,217,864 | 14,327,777 | 1,362,425 | 15,690,202 |
A supply of cheap motive power is essential for the development of factory production. New Zealand industries have in the past been somewhat handicapped in this respect, as coal and oil, which were in the earlier days the only sources of power, were by no means cheap. The difficulties in the way of obtaining a plentiful supply of cheap motive power are now being overcome by the development of hydroelectric power, for which New Zealand is geographically ideal. The Government has in recent years developed this phase of the Dominion's resources, and in doing so has provided a margin of power for attracting special industries depending on a supply of cheap motive power, as well as amply meeting present demands. The question also of providing large surplus power to attract special export industries by offering cheap electric power is realized to be an important one, and is receiving full consideration.
The following table shows the number of each class of engine used for the last five years, with figures of horse-power for the last four years:—
| Class of Engine. | 1920–21. | 1921–22. | 1922–23. | 1923–24. | 1924–25. |
|---|---|---|---|---|---|
| Steam No. | 2,266 | 2,266 | 2,310 | 2,263 | 2,274 |
| H.P. | .. | 101,083 | 98,875 | 113,894 | 126,847 |
| Coal-gas No. | 577 | 519 | 561 | 505 | 457 |
| H.P. | .. | 10,295 | 10,088 | 12,177 | 11,548 |
| Suction gas No. | 234 | 237 | 246 | 239 | 508 |
| H.P. | .. | 14,181 | 13,949 | 12,381 | 11,675 |
| Oil No. | 372 | 389 | 418 | 395 | 359 |
| H.P. | .. | 5,466 | 6,451 | 6,966 | 7,805 |
| Electric No. | 4,812 | 5,235 | 5,784 | 6,673 | 8,057 |
| H.P. | .. | 49,571 | 56,108 | 62,221 | 76,167 |
| Water No. | 246 | 222 | 210 | 221 | 233 |
| H.P. | .. | 39,104 | 41,630 | 43,272 | 54,364 |
| Totals No. | 8,477 | 8,868 | 9,529 | 10,296 | 11,588 |
| H.P. | 217,174 | 219,700 | 227,101 | 250,911 | 288,406 |
The aggregate available horse-power of the engines used shows enormous increases over the last twenty years, and since 1900–1 has increased approximately sixfold. In 1900–1 the average horse-power of the engines used per establishment and per employee was 10.7 and 0.8 respectively, while in 1920–21 the corresponding figures appeared as 45.21 and 309. The averages per establishment and per productive employee show further increases in 1924–25 to 63.43 and 4.02 respectively.
The table on the next page shows the engines used and their horse-power as recorded in the last five collections, classified according to the various classes of industries. The total horsepower of engines engaged in the production of heat, light, and power is seen to have increased from 75,992 in 1920–21 to 114,597 in 1924–25. Establishments engaged in the preparation of animal food, which rank second as regards aggregate horse - power used, also show a substantial increase over the period, while a much greater advance is disclosed by the figures for the timber-milling and wood-working industry, which ranks third.
| Class of Industry. | 1920–21. | 1921–22. | 1922–23. | 1923–24. | 1924–25. | |||||
|---|---|---|---|---|---|---|---|---|---|---|
| Number of Engines. | Horsepower. | Number of Engines. | Horsepower. | Number of Engines. | Horsepower. | Number of Engines. | Horsepower. | Number of Engines. | Horsepower. | |
* Included in “Miscellaneous,” | ||||||||||
| Animal food | 2,122 | 49,543 | 2,452 | 56,786 | 2,548 | 57,034 | 2,657 | 53,865 | 2,808 | 55,204 |
| Vegetable food | 327 | 7,520 | 359 | 7,642 | 385 | 8,063 | 435 | 8,219 | 484 | 9,197 |
| Drinks, narcotics, and stimulants | 489 | 3,576 | 461 | 3,328 | 471 | 3,394 | 488 | 3,564 | 521 | 3,806 |
| Animal matters (not otherwise classed) | 248 | 4,181 | 158 | 2,084 | 138 | 1,688 | 128 | 1,507 | 125 | 1,224 |
| Working in wood | 1,157 | 28,014 | 1,200 | 30,481 | 1,313 | 35,491 | 1,422 | 33,924 | 1,648 | 37,758 |
| Vegetable produce for fodder | 15 | 232 | 11 | 279 | 25 | 337 | 24 | 331 | 34 | 412 |
| Paper manufactures | 33 | 1,130 | 29 | 1,169 | 32 | 1,162 | 58 | 3,403 | 63 | 4,008 |
| Heat, light, and power | 185 | 75,992 | 180 | 74,711 | 170 | 71,801 | 186 | 93,907 | 183 | 114,597 |
| Processes relating to stone, clay, glass, &c. | 444 | 14,399 | 348 | 10,957 | 384 | 12,573 | 408 | 14,027 | 497 | 18,792 |
| Metals other than gold or silver | 574 | 6,132 | 603 | 6,537 | 625 | 6,953 | 745 | 7,932 | 837 | 8,691 |
| Precious metals | 54 | 105 | 62 | 89 | 62 | 82 | 61 | 77 | 56 | 76 |
| Books and publications | 744 | 4,735 | 803 | 4,964 | 884 | 5,246 | 986 | 5,364 | 1,251 | 6,041 |
| Musical instruments | 8 | 42 | 10 | 51 | 12 | 55 | 8 | 38 | 10 | 35 |
| Ornaments and minor art products | 25 | 51 | 19 | 35 | 20 | 47 | 23 | 44 | 25 | .50 |
| Equipment for sports and games | 12 | 46 | * | * | 12 | 52 | 12 | 51 | 10 | 44 |
| Designs, medals, type, and dies | 7 | 13 | 12 | 18 | 15 | 20 | 17 | 29 | 20 | 33 |
| Machines, tools, and implements | 73 | 960 | 94 | 557 | 117 | 990 | 129 | 1,080 | 121 | 1,128 |
| Carriages and vehicles | 554 | 2,293 | 646 | 2,727 | 750 | 3,147 | 781 | 3,145 | 842 | 3,355 |
| Harness, saddlery, and leatherware | 242 | 2,734 | 264 | 2,912 | 273 | 3,020 | 287 | 2,925 | 304 | 3,084 |
| Ships, boats, and their equipment | 91 | 668 | 83 | 659 | 98 | 662 | 90 | 656 | 93 | 714 |
| House-furnishings | 374 | 2,899 | 375 | 2,964 | 397 | 3,129 | 435 | 3,202 | 457 | 3,247 |
| Chemicals and by-products | 58 | 466 | 85 | 792 | 111 | 1,097 | 164 | 1,551 | 306 | 3,874 |
| Textile fabrics | 68 | 3,989 | 79 | 3,936 | 97 | 4,544 | 111 | 4,938 | 163 | 5,494 |
| Apparel | 427 | 1,963 | 423 | 2,054 | 462 | 2,052 | 477 | 2,195 | 544 | 2,263 |
| Fibrous materials | 98 | 4,012 | 87 | 3,735 | 106 | 4,276 | 127 | 4,665 | 142 | 4,987 |
| Miscellaneous | 48 | 430 | 25 | 233 | 22 | 186 | 37 | 272 | 44 | 293 |
| Totals | 8,477 | 216,125 | 8,868 | 219,700 | 9,529 | 227,101 | 10,296 | 250,911 | 11,588 | 288,407 |
As regards kind of power used, the most remarkable development is the large increase in electric motors Where electric current is available new installations of power are almost invariably of this type, and with increasing facilities electricity will no doubt become correspondingly preponderant. The subjoined table shows the number of engines or motors of each kind in use at the last five collections, together with the percentage each represents of the total number of engines or motors in the respective years:—
| Kind of Power. | 1920–21. | 1921–22. | 1922–23. | 1923–24. | 1924–25. | |||||
|---|---|---|---|---|---|---|---|---|---|---|
| No. of Engines or Motors. | Per Cent. of Total. | No. of Engines or Motors. | Per Cent. of Total. | No. of Engines or Motors. | Per Cent. of Total. | No. of Engines or Motors. | Per Cent. of Total. | No. of Engines or Motors. | Per Cent. of Total. | |
| Steam | 2,266 | 26.72 | 2,266 | 25.55 | 2,310 | 24.24 | 2,263 | 21.98 | 2,274 | 19.63 |
| Coal-gas | 577 | 6.81 | 519 | 5.85 | 561 | 5.89 | 505 | 4.90 | 457 | 3.94 |
| Suction gas | 234 | 2.76 | 237 | 2.67 | 246 | 2.58 | 239 | 2.32 | 208 | 1.79 |
| Oil | 372 | 4.39 | 389 | 4.39 | 418 | 4.39 | 395 | 3.84 | 359 | 3.10 |
| Electric | 4,812 | 56.77 | 5,235 | 59.03 | 5,784 | 60.70 | 6,673 | 64.81 | 8,057 | 69.53 |
| Water | 216 | 2.55 | 222 | 2.51 | 210 | 2.20 | 221 | 2.15 | 233 | 2.01 |
| Totals | 8,477 | 100.0 | 8,868 | 100.0 | 9,529 | 100.0 | 10,296 | 100.0 | 11,588 | 100.0 |
In conjunction with the returns of factory production, statistics as to the quantity of coal used in the various manufacturing industries are now collected. The most noticeable feature of the figures for 1924–25 is that 68 per cent. of the coal used as above in the Dominion was shown as consumed in the North Island. The biggest contributing factor to this is undoubtedly the extensive use of hydroelectric power in the two main centres of the South Island. The most remarkable differences appear in tramways, electric supply, and gasworks. Tramways in the North Island used 6,873 tons of coal, as against 608 tons used in the South Island; electric supply, 116,889 in the North, as against 14,700 in the South; and gas-supply, 171,812 tons in the North, as against 73,210 tons in the South.
The appended table shows the quantity of coal consumed in connection with the principal manufacturing industries in the two Islands for the year ended 31st March, 1925:—
| Industry. | North Island. | South Island. Tons. | Total. |
|---|---|---|---|
| Tons. | Tons. | Tons. | |
| Meat freezing and preserving | 84,491 | 30,165 | 114,656 |
| Butter, cheese, and condensed-milk manufacture | 84,032 | 24,291 | 108,323 |
| Grain-milling | 3,935 | 5,921 | 9,856 |
| Brewing and malting | 5,387 | 6,549 | 11,936 |
| Gas making and supply | 171,812 | 73,210 | 245,022 |
| Electricity generation and supply | 116,889 | 14,700 | 131,589 |
| Electric tramways | 6,873 | 608 | 7,481 |
| Lame crushing and burning and cement-making | 55,146 | 44,731 | 99,877 |
| Brick, tile, and pottery making | 28,371 | 19,393 | 47,764 |
| Engineering, boilermaking, and other metal-working | 2,704 | 3,404 | 6,108 |
| Tanning, fellmongering, and wool-scouring | 3,143 | 6,511 | 9,654 |
| Woollen-milling | 4,613 | 15,613 | 20,226 |
| Biscuits, confectionery-making, and sugar-boiling | 2,114 | 5,600 | 7,714 |
| Soap and candle making | 3,945 | 2,537 | 6,482 |
| Boiling-down and manure-making | 2,773 | 3,839 | 6,612 |
| Sawmilling and sash and door making | 2,968 | 5,082 | 8,050 |
| Flaxmilling, rope and twine making | 5,716 | 4,104 | 9,820 |
| Other industries | 31,545 | 21,787 | 53,332 |
| Totals | 616,457 | 288,045 | 904,502 |
Information regarding the consumption of coal in the factories, mills, works, &c., is now available from the 1921–22 collection onwards for the various industries. A study of this information in respect of certain industries is interesting when considered for the last four years. Notwithstanding the great strides being made in the generation of electricity by water-power, the total consumption of coal shows increases during the period under review. The industries contributing principally to this increase are as follows: Butter, cheese, and condensed milk; electricity-generation; lime crushing and burning; brick, tile, and pottery; woollen-milling; and flax-milling. The phenomenal drop in the quantity of coal consumed in the generation of energy by electric-tramway concerns in 1925 was caused by the generation works of the Auckland City Tramways being taken over early in 1924 by the Auckland Power Board. The decrease recorded for tramways is therefore represented by an increase in the figure for the electricity-generation industry.
The following table shows the consumption of coal in the various industries as recorded in each of the last four collections:—
| Industry | Year ended 31st March, | |||
|---|---|---|---|---|
| 1922. | 1923. | 1924. | 1925. | |
| Tons. | Tons. | Tons. | Tons. | |
| Meat freezing and preserving | 115,716 | 114,815 | 116,132 | 114,656 |
| Butter, cheese, and condensed milk | 74,232 | 85,324 | 83,336 | 108,323 |
| Grain-milling | 12,031 | 11,788 | 12,488 | 9,856 |
| Brewing and malting | 10,902 | 10,868 | 10,456 | 11,936 |
| Gas making and supply | 247,471 | 242,740 | 249,710 | 245,022 |
| Electricity generation and supply | 93,240 | 50,255 | 95,729 | 131,589 |
| Electric tramways | 70,392 | 67,643 | 58,616 | 7,481 |
| Lime crushing and burning and cement-making | 59,375 | 65,514 | 105,406 | 99,877 |
| Brick, tile, and pottery | 38,178 | 35,966 | 41,843 | 47,764 |
| Engineering, boilermaking, and other metal-working | 12,114 | 8,106 | 12,214 | 6,108 |
| Tanning, fellmongering, and wool-scouring | 11,831 | 13,235 | 11,688 | 9,654 |
| Woollen-milling | 15,601 | 21,814 | 22,342 | 20,226 |
| Biscuits, confectionery-making, and sugar-boiling | 7,141 | 7,366 | 7,352 | 7,714 |
| Soap and candle making | 6,403 | 7,060 | 6,452 | 6,482 |
| Boiling-down and manure-making | 6,656 | 8,832 | 7,036 | 6,612 |
| Sawmilling and sash and door making | 7,921 | 6,390 | 7,235 | 8,050 |
| Flaxmilling, rope and twine making | 6,005 | 5,764 | 6,751 | 9,820 |
| Other industries | 46,966 | 51,840 | 53,265 | 53,332 |
| Totals | 842,175 | 815,320 | 908,051 | 904,502 |
It is interesting to note that in 1924–25 the factories in New Zealand used 142,599 tons of imported coal. Difficulties in the way of transport and the purpose for which the coal is used sometimes make it advantageous to use imported coal. For instance, statistics relating to the manufacture of gas prove conclusively that imported coal appears to have higher gas-producing qualities than New Zealand coal, and it is not surprising to note that 115,513 tons of the total of 142,599 tons of imported coal were used in gasworks in 1924–25.
The table hereunder shows the quantity (in tons) of New Zealand and imported coal used in factories, mills, works, &c., during the year ended 31st March, 1925:—
| Industry. | New Zealand. | Imported. | Total. |
|---|---|---|---|
| Tons | Tons. | Tons. | |
| Meat freezing and preserving | 111,374 | 3,282 | 114,656 |
| Butter, cheese, and condensed milk | 104,234 | 4,089 | 108,323 |
| Grain-milling | 9,773 | 83 | 9,856 |
| Brewing and malting | 10,821 | 1,115 | 11,936 |
| Gas making and supply | 129,509 | 115,513 | 245,022 |
| Electricity generation and supply | 131,589 | .. | 131,589 |
| Electric tramways | 7,481 | .. | 7,481 |
| Lime crushing and burning and cement-making | 99,877 | .. | 99,877 |
| Brick, tile, and pottery making | 44,635 | 3,129 | 47,764 |
| Engineering, boilermaking, and other metal-working | 5,374 | 734 | 6,108 |
| Tanning | 3,281 | 176 | 3,457 |
| Fellmongering and woolscouring | 6,006 | 191 | 6,197 |
| Woollen-milling | 20,226 | .. | 20,226 |
| Biscuits, confectionery-making. and sugar-boiling | 7,609 | 105 | 7,714 |
| Soap and candle making | 6,464 | 18 | 6,482 |
| Boiling-down and manure-making | 6,562 | 50 | 6,612 |
| Sawmilling and sash and door making | 7,556 | 494 | 8,050 |
| Flaxmilling, rope and twine making | 9,800 | 20 | 9,820 |
| Other industries | 39,732 | 13,600 | 53,332 |
| Totals, 1924–25 | 761,903 | 142,599 | 904,502 |
| Totals, 1923–24 | 738,250 | 169,801 | 908,051 |
The value of materials used or operated upon does not afford a very satisfactory basis of comparison as between one industry and another for the reason that the changes wrought during the process of manufacture vary considerably in degree. For instance, materials used or operated upon in the tanning, fellmongering, and wool-scouring industry were in 1924–25 valued at £2,340,456, while those used in printing, publishing, and bookbinding were valued at less than one half of this figure (£1,025,405). If, however, value of output be considered, it is found that the figure for tanning, fellmongering, and wool-scouring (£2,809,486) is over £1,000,000 less than that for printing, &c. (£4,052,545), the added value in the former case being only £469,030, as against £3,027,140 in the latter.
The appended table gives the value of materials used in manufacturing industries, according to provincial districts, for the five years 1920–21 to 1924–25:—
| Provincial District. | 1920–21. | 1921–22. | 1922–23. | 1923–24. | 1924–25. |
|---|---|---|---|---|---|
| £ | £ | £ | £ | £ | |
| Auckland | 18,883,924 | 13,296,016 | 14,585,802 | 15,133,139 | 16,792,206 |
| Taranaki | 4,156,284 | 2,759,931 | 3,544,365 | 3,694,745 | 4,000,975 |
| Hawke's Bay | 2,156,182 | 1,709,729 | 2,106,844 | 2,486,654 | 3,037,532 |
| Wellington | 10,440,828 | 8,084,038 | 9,184,643 | 9,448,411 | 10,773,307 |
| Marlborough | 322,373 | 288,577 | 304,208 | 324,590 | 316,813 |
| Nelson | 650,590 | 527,775 | 491,605 | 598,641 | 585,240 |
| Westland | 242,325 | 169,175 | 189,639 | 174,526 | 182,832 |
| Canterbury | 10,212,772 | 7,242,065 | 8,382,918 | 8,674,880 | 9,680,180 |
| Otago | 6,030,856 | 4,241,885 | 4,320,204 | 4,328,022 | 4,548,453 |
| Southland | 2,415,029 | 1,725,134 | 1,985,459 | 2,163,425 | 2,243,882 |
| Totals | 55,511,163 | 40,044,325 | 45,095,687 | 47,027,033 | 52,161,420 |
The value of materials used in the various classes of industries during the last five years is given in the table hereunder:—
| Class of Industry. | Value of Materials used. | ||||
|---|---|---|---|---|---|
| 1920–21. | 1921–22. | 1922–23. | 1923–24. | 1924–25. | |
* Included in “Miscellaneous.” | |||||
| £ | £ | £ | £ | £ | |
| Animal food | 28,437,982 | 20,202,850 | 25,581,683 | 26,354,325 | 29,586,015 |
| Vegetable food | 5,719,645 | 5,274,154 | 4,739,775 | 4,717,299 | 4,686,856 |
| Drinks, narcotics, and stimulants | 1,621,146 | 910,353 | 781,223 | 786,403 | 983,280 |
| Animal matters (not otherwise classed) | 1,322,594 | 692,626 | 603,519 | 587,313 | 659,738 |
| Working in wood | 1,829,503 | 1,281,550 | 1,408,105 | 1,604,431 | 1,845,068 |
| Vegetable produce for fodder | 52,113 | 95,024 | 67,184 | 77,048 | 95,241 |
| Paper manufactures | 138,705 | 75,204 | 85,602 | 82,365 | 127,051 |
| Heat, light, and power | 1,898,009 | 2,175,024 | 2,160,587 | 2,357,151 | 2,614,178 |
| Processes relating to stone, clay, glass, &c. | 764,353 | 336,252 | 294,246 | 320,411 | 421,129 |
| Metals other than gold or silver | 1,476,705 | 1,252,766 | 1,067,951 | 1,223,819 | 1,368,717 |
| Precious metals | 68,917 | 67,715 | 52,277 | 49,172 | 49,453 |
| Books and publications | 1,213,039 | 1,125,142 | 885,123 | 916,818 | 1,025,405 |
| Musical instruments | 12,709 | 4,870 | 7,427 | 5,867 | 8,459 |
| Ornaments and minor art products | 61,167 | 54,901 | 52,909 | 54,838 | 60,536 |
| Equipment for sports and games | 18,468 | * | 12,937 | 13,334 | 7,344 |
| Designs, medals, type, and dies | 3,846 | 5,367 | 5,430 | 6,512 | 6,899 |
| Machines, tools, and implements | 489,058 | 276,409 | 266,699 | 286,382 | 394,646 |
| Carriages and vehicles | 641,913 | 618,541 | 619,682 | 678,469 | 671,112 |
| Harness, saddlery, and leatherware | 3,038,905 | 1,300,413 | 1,936,117 | 2,237,734 | 2,540,379 |
| Ships, boats, and their equipment | 375,882 | 285,345 | 190,292 | 204,384 | 232,308 |
| House-furnishings | 755,224 | 551,477 | 530,778 | 642,395 | 732,066 |
| Chemicals and by-products | 366,128 | 345,378 | 426,095 | 586,612 | 877,904 |
| Textile fabrics | 684,715 | 569,708 | 722,794 | 764,848 | 705,121 |
| Apparel | 3,823,307 | 2,059,697 | 2,250,106 | 2,122,452 | 1,970,219 |
| Fibrous materials | 452,811 | 297,623 | 296,789 | 296,852 | 333,720 |
| Miscellaneous | 244,319 | 185,936 | 50,357 | 49,799 | 158,076 |
| Totals | 55,511,163 | 40,044,325 | 45,095,687 | 47,027,038 | 52,161,420 |
The cost of the materials used at the factory is asked for on the returns, but in the butter, cheese, &c., industry this information has not been supplied. The establishments engaged in this industry are mainly co-operative companies and do not actually purchase the milk, &c., from the suppliers, but treat it on their behalf, and divide the proceeds of the manufactured goods according to the quantity of milk, &c., supplied.
The figures shown do not represent the actual cost price of the milk and butter-fat used in these concerns, but are in such cases the proceeds from the sale of the manufactured products, less the expenses of manufacture.
The products of manufacture are valued at the current selling-price of the goods manufactured or work done at the factory, where a valuation on this basis is possible, but in many of the principal industries, such as butter, cheese, &c., and meat-freezing, where the commodities are marketed abroad, it is possible that the values of the products are in excess of the actual values as at the factory. By excluding indirect expenses incurred beyond the factory from the value of the products based on the actual selling-prices an attempt has been made to reduce the values shown in such cases to the value at the factory.
In making use of the value of gross products it must be borne in mind that the figures include the value of raw materials operated upon, which constitutes more than half of the total value; in fact, the cost of materials used has represented no less than 69, 67, 67, 60, 61, 61, and 62 per cent. respectively of the value of the products in the last seven years. Where the products of one industry—for example, sawmilling — are treated again in other industries, such as furniture-making, joinery, &c., it must be obvious that the value of timber shown as products of the former industry appears again as the materials of the latter industry and enters into the value of joinery and furniture made. Duplication of this kind is apparent in many industries.
The following table shows the gross value of products by provincial districts for the years 1920–21 to 1924–25:—
| Provincial District. | 1920–21. | 1921–22. | 1922–23. | 1923–24. | 1924–25. |
|---|---|---|---|---|---|
| £ | £ | £ | £ | £ | |
| Auckland | 27,153,253 | 22,287,176 | 24,544,257 | 25,764,304 | 28,134,561 |
| Taranaki | 5,523,081 | 3,999,789 | 4,850,053 | 4,979,022 | 5,396,883 |
| Hawke's Bay | 3,358,023 | 3,001,692 | 3,324,982 | 3,681,129 | 4,227,815 |
| Wellington | 16,135,888 | 13,572,042 | 14,923,815 | 15,386,201 | 17,423,409 |
| Marlborough | 468,187 | 472,386 | 498,527 | 484,783 | 529,183 |
| Nelson | 1,068,755 | 914,378 | 935,845 | 1,076,288 | 1,118,841 |
| Westland | 762,311 | 732,527 | 710,693 | 826,577 | 976,797 |
| Canterbury | 15,042,223 | 11,916,895 | 13,023,529 | 13,469,075 | 14,656,628 |
| Otago | 9,445,723 | 7,514,251 | 7,727,816 | 8,053,579 | 8,123,880 |
| Southland | 3,516,125 | 2,735,133 | 3,313,906 | 3,275,439 | 3,513,316 |
| Totals | 82,473,569 | 67,146,269 | 73,853,423 | 76,996,397 | 84,101,313 |
The following table shows the gross value of products by classes of industries as recorded in the last five collections:—
| Class of Industry. | Value of Products | ||||
|---|---|---|---|---|---|
| 1920–21. | 1921–22. | 1922–23. | 1923–24. | 1924–25. | |
* Included in “Miscellaneous.” | |||||
| £ | £ | £ | £ | £ | |
| Animal food | 33,393,950 | 26,245,828 | 32,640,666 | 33,173,678 | 36,381,241 |
| Vegetable food | 7,068,650 | 6,861,581 | 6,462,845 | 6,395,407 | 6,446,548 |
| Drinks, narcotics, and stimulants | 2,878,117 | 2,054,324 | 1,875,170 | 1,871,803 | 2,381,024 |
| Animal matters (not otherwise classed) | 1,896,635 | 1,221,692 | 1,172,517 | 1,073,878 | 1,202,078 |
| Working in wood | 5,620,092 | 5,572,082 | 5,534,604 | 5,857,322 | 6,424,182 |
| Vegetable produce for fodder | 66,139 | 87,872 | 109,433 | 110,462 | 147,643 |
| Paper manufactures | 311,086 | 153,245 | 221,303 | 217,389 | 284,159 |
| Heat, light, and power | 3,637,605 | 4,113,248 | 4,224,835 | 4,532,343 | 4,846,630 |
| Processes relating to stone, clay, glass, &c. | 1,997,088 | 1,383,519 | 1,439,476 | 1,858,086 | 2,094,624 |
| Metals other than gold or silver | 3,303,513 | 3,038,149 | 2,779,687 | 3,161,570 | 3,441,263 |
| Precious metals | 160,963 | 158,330 | 135,331 | 129,946 | 124,545 |
| Books and publications | 3,395,276 | 3,464,224 | 3,531,936 | 3,623,123 | 4,052,545 |
| Musical instruments | 29,995 | 26,467 | 27,921 | 22,319 | 24,165 |
| Ornaments and minor art products | 140,540 | 133,489 | 129,738 | 138,473 | 151,583 |
| Equipment for sports and games | 33,290 | * | 32,704 | 30,710 | 19,016 |
| Designs, medals, type, and dies | 16,896 | 23,136 | 28,785 | 32,589 | 41,300 |
| Machines, tools, and Implements | 938,343 | 704,961 | 602,259 | 720,907 | 733,088 |
| Carriages and vehicles | 1,676,173 | 1,652,598 | 1,705,917 | 1,867,320 | 1,938,057 |
| Harness, saddlery, and leather ware | 3,845,295 | 1,951,732 | 2,822,641 | 3,088,276 | 3,192,624 |
| Ships, boats, and their equipment | 721,611 | 557,273 | 417,941 | 463,586 | 565,829 |
| House-furnishings | 1,514,001 | 1,221,266 | 1,186,107 | 1,365,040 | 1,533,227 |
| Chemicals and by-products | 551,005 | 606,174 | . 808,831 | 1,019,839 | 1,530,002 |
| Textile fabrics | 1,364,169 | 1,252,613 | 1,164,342 | 1,475,855 | 1,338,933 |
| Apparel | 6,643,777 | 3,737,709 | 4,051,437 | 3,939,034 | 3,766,621 |
| Fibrous materials | 873,412 | 648,963 | 635,774 | 674,677 | 839,452 |
| Miscellaneous | 395,948 | 275,794 | 111,223 | 122,765 | 2130,934 |
| Totals | 82,473,569 | 67,146,269 | 73,853,423 | 76,996,397 | 84,101,318 |
As indicated under the heading of “products,” the value of products is not always a satisfactory measure of either the absolute or the relative importance of a given industry, for the reason that only part of this value is actually created by the manufacturing processes carried on in the industry itself. Another part, and in many cases by far the larger portion, represents the value of the materials used. From a manufacturing standpoint, therefore, the best measure of the importance of an industry is the value created by the manufacturing operations carried on within the industry. This value is obtained by deducting the cost of materials used from the gross value of the products, and is referred to as the “added value.” As the basis of the added value is the value of products, it is clear that it must be affected by fluctuations in values, and this fact should not be lost sight of when use is made of these figures.
For the purpose of eliminating the effect of fluctuations in prices from the added value special index numbers have been prepared, on the basis of wholesale prices in 1914, for commodities that are chiefly manufactured or produced in New Zealand, and the added value has been adjusted in accordance therewith. The adjusted figures, together with the increase per cent. of the figure for each year over the immediately preceding one, are given hereunder, and represent comparable monetary units whose purchasing-power during each of the years covered was the same as the purchasing-power of the sovereign in 1914.
| £ | Increase per Cent. | |
|---|---|---|
| 1918–19 | 11,187,483 | .. |
| 1919–20 | 12,326,486 | 10.18 |
| 1920–21 | 12,345,424 | 0.15 |
| 1921–22 | 12,856,710 | 4.14 |
| 1922–23 | 16,331,344 | 27.03 |
| 1923–24 | 17,577,340 | 7.63 |
| 1924–25 | 20,579,828 | 17.08 |
It is not claimed that the above figures are quite free from the effects of price-fluctuations—to render the figures so would be for practical purposes impossible—but it is submitted that the gross figures for each year, having been reduced to a common price-level, are sufficiently accurate to be comparable, and can be accepted as an index, though only an approximate one, of the value created in the factories and works during the years given. Even though the adjusted figures are of necessity only roughly approximate, they are infinitely more truly indicative of the actual state of affairs than the unadjusted figures.
The rapid growth in the Dominion's manufactories during recent years is reflected in the added-value figure recorded at successive collections. Taking the totals for industries common to all years, which permit of comparison, the added value, which appeared at £9,702,780 in 1906, reached the imposing figure of £31,939,893 in 1924–25, an increase of well over 200 per cent. The largest increase shown by the figures for one collection over those for the immediately preceding one was between the years 1919–20 and 1920–21, the added value in the latter year exceeding that in the former by approximately £4,000,000. This increase was mainly due to the phenomenal rise in the prices of manufactured articles at that time. The increase of the figure for 1924–25 over that for the immediately preceding year was approximately £2,000,000, and was the largest increase between any two successive years since 1920–21.
The added value by provincial districts for the last five collections, taking all industries into account, is given in the table hereunder:—
| Provincial District. | 1920–21. | 1921–22. | 1922–23. | 1922–24. | 1924–25. |
|---|---|---|---|---|---|
| £ | £ | £ | £ | £ | |
| Auckland | 8,269,329 | 8,991,160 | 9,958,455 | 10,631,165 | 11,342,355 |
| Taranaki | 1,366,797 | 1,239,858 | 1,305,688 | 1,284,277 | 1,395,908 |
| Hawke's Bay | 1,201,841 | 1,291,963 | 1,218,138 | 1,194,475 | 1,190,283 |
| Wellington | 5,695,060 | 5,488,004 | 5,739,172 | 5,937,790 | 6,650,102 |
| Marlborough | 145,814 | 183,809 | 194,319 | 160,193 | 212,370 |
| Nelson | 418,165 | 386,603 | 444,240 | 477,647 | 533,601 |
| Westland | 519,986 | 563,352 | 521,054 | 652,051 | 793,965 |
| Canterbury | 4,829,451 | 4,674,830 | 4,640,611 | 4,794,195 | 4,976,448 |
| Otago | 3,414,867 | 3,272,366 | 3,407,612 | 3,725,557 | 3,575,427 |
| Southland | 1,101,096 | 1,009,999 | 1,328,447 | 1,112,014 | 1,269,434 |
| Totals | 26,962,406 | 27,101,944 | 28,757,736 | 29,969,364 | 31,939,893 |
For the last five years the Auckland Provincial District has contributed the largest proportion of the total added value, with Wellington, Canterbury, and Otago following in that order, and Southland, Taranaki, and Hawke's Bay in excess of one million each. Fairly even increases have been recorded for the Auckland District, where a large variety of industries is located, while in Taranaki, where mainly butter and cheese making is carried on, the movement in the added-value figure over the period approximates to the fluctuations in the prices for dairy-produce. In the Wellington Provincial District a similar movement of a less marked nature is evident, and it is somewhat remarkable that the 1924–25 figures in this case show an increase of 17 per cent. only over those for 1920–21. Auckland during the same period showed an increase of 37 per cent.
The following table shows various percentages and rates that have been computed in connection with the added value for the last five years:—
| 1920–21. | 1921–22. | 1922–23. | 1923–24. | 1924–25. | |
|---|---|---|---|---|---|
| £ | £ | £ | £ | £ | |
| Added value per head of mean population | 21.53 | 21.08 | 21.93 | 22.47 | 23.49 |
| Added value per productive employee | 383.78 | 440.38 | 444.77 | 444.08 | 445.09 |
| Added value per £100 expended on productive wages | 214.50 | 235.26 | 249.00 | 246.94 | 235.59 |
| Per Cent. | Per Cent. | Per Cent. | Per Cent. | Per Cent. | |
| Percentage of productive wages to added value | 46.62 | 42.51 | 40.16 | 40.50 | 42.45 |
| Percentage of added value to cost of materials used | 48.57 | 67.68 | 63.77 | 67.97 | 61.23 |
In 1919–20 the added value per productive employee was £350–15, while in 1924–25 it had reached £445.09, an increase of 27 per cent. The wholesale-prices index numbers for the years shown in this table do not show increases commensurate with the increase in added value; in fact, the general index number for 1924 (1739) shows a decrease of 6.40 per cent. over the figure for 1919 (1858). As the general index number is based on many commodities which are not manufactured to any extent in the Dominion, it is well to consider the movements in the index numbers (already referred to) which have been computed in regard to New Zealand manufactures only. The index numbers in question decreased from 1845 in 1919 to 1552 in 1924, or 15.88 per cent. During the same period the aggregate mechanical power available increased by 32 per cent., which is quite out of proportion to the increase of approximately 10 per cent. in the total productive employees. In view of the above it seems a reasonable conclusion that the increase in the added value per employee has been due to the following factors: (a) Fluctuations in values; (b) increased motive power; and (c) increase in productivity of labour. It is difficult to measure the influence exerted by each, but it would seem that the increased motive power has been responsible for the major part of the increase, while fluctuations in values have accounted for most of the balance.
The figures given in respect of the added value per £100 expended on productive wages are interesting, inasmuch as they indicate to a certain extent the manufacturer's return for each £100 paid away as wages. It is perhaps not out of place to point out that this comparison is merely an arbitrary one, and that other factors such as cost of motive power, general overhead, &c., combine with labour in the creation of the value. Taking into consideration the increase in motive power and ignoring fluctuations in values, the upward tendency in the added value per £100 expended on productive wages is due principally to the expanding use of motive power.
More or less conflicting results are shown by the proportion per cent. of productive wages to added value during the period under review, but up to 1921–22 the figures illustrate the tendency for wages to follow fluctuations in prices. In 1919–20, when prices soared, wages did not increase in proportion, with the result that labour's-share of the fund created by manufacture dropped slightly, but in 1920–21, when prices fell and wages lagged behind, labour secured an increased share (47 per cent.). Wages did not drop until some time after the fall in prices, with the result that the proportion paid away as wages was higher than usual, and industry became relatively unprofitable. Further, the increased real cost of labour reduced the demand for it, and unemployment followed. The following year recorded a fall in wages, while prices had recovered to some extent, and the proportion received by labour was therefore smaller, being 42.51 per cent. A further fall in the percentage paid away as wages was recorded in 1922–23, but a slightly upward tendency is manifested by the figure for 1923–24. This upward tendency showed a sharp incline in 1924–25, when the percentage rose to 42.45.
Although the relation between the aggregates of wages paid and of added value bear out to a certain extent the changing times through which industry has passed in the last five years, yet definite conclusions cannot be arrived at without due regard to the effects brought about by the increased use of machinery and changes in the relative importance of different groups of industries. Some idea of the effects of the latter consideration can be seen from the following table showing the percentages of wages to added value in the principal classes of industries:—
| — | 1920–21. | 1921–22. | 1922–23. | 1923–24. | 1924–25. |
|---|---|---|---|---|---|
| Per Cent. | Per Cent. | Per Cent. | Per Cent. | Per Cent. | |
| Animal food | 46.28 | 38.27 | 29.67 | 29.91 | 30.06 |
| Vegetable food | 28.97 | 28.36 | 29.79 | 31.82 | 29.57 |
| Drinks, narcotics, and stimulants | 29.19 | 29.18 | 31.98 | 28.95 | 26.93 |
| Animal matters (not otherwise classed) | 43.21 | 38.25 | 32.95 | 36.27 | 32.61 |
| Working in wood | 54.89 | 45.92 | 46.60 | 48.32 | 48.98 |
| Heat, light, and power | 51.89 | 50.15 | 45.43 | 49.40 | 47.85 |
| Books and publications | 37.12 | 36.63 | 31.68 | 38.31 | 41.27 |
| Designs, medals, type, and dies | 41.30 | 40.06 | 43.64 | 42.75 | 36.76 |
| Machines, tools, and implements | 49.93 | 42.64 | 51.09 | 41.46 | 52.15 |
| Apparel | 59.99 | 61.38 | 71.41 | 63.89 | 62.60 |
| Fibrous materials | 45.33 | 50.10 | 50.07 | 51.99 | 52.11 |
The table given hereunder shows the added value by classes of industries for each of the years 1920–21 to 1924–25:—
| Class. | 1920–21. | 1921–22. | 1922–23. | 1923–24. | 1924–25. |
|---|---|---|---|---|---|
* Decreased value. † Included in “Miscellaneous.” | |||||
| £ | £ | £ | £ | £ | |
| Animal food | 4,955,968 | 6,042,978 | 7,058,983 | 6,819,353 | 7,295,226 |
| Vegetable food | 1,349,005 | 1,587,427 | 1,723,070 | 1,678,108 | 1,759,692 |
| Drinks, narcotics, and stimulants | 1,256,971 | 1,143,971 | 1,093,947 | 1,095,400 | 1,297,744 |
| Animal matters (not otherwise classed) | 574,041 | 529,066 | 568,998 | 486,565 | 542,340 |
| Working in wood | 3,790,589 | 4,290,532 | 4,126,499 | 4,252,891 | 4,579,114 |
| Vegetable produce for fodder | 14,026 | -7,152* | 42,249 | 33,414 | 52,402 |
| Paper manufactures | 172,381 | 78,041 | 135,701 | 135,024 | 157,108 |
| Heat, light, and power | 1,739,596 | 1,938,224 | 2,064,248 | 2,205,192 | 2,232,452 |
| Processes relating to stone, clay, glass, &c. | 1,232,735 | 1,047,267 | 1,145,230 | 1,537,675 | 1,673,495 |
| Metals other than gold or silver | 1,826,808 | 1,785,383 | 1,711,736 | 1,937,751 | 2,072,546 |
| Precious metals | 92,046 | 90,613 | 83,054 | 80,774 | 75,092 |
| Books and publications | 2,182,237 | 2,339,082 | 2,646,813 | 2,706,305 | 3,027,140 |
| Musical instruments | 17,286 | 21,597 | 20,494 | 16,452 | 15,706 |
| Ornaments and minor art products | 79,373 | 78,538 | 76,829 | 83,635 | 91,047 |
| Equipment for sports and games | 14,822 | † | 19,767 | 17,376 | 11,672 |
| Designs, medals, type, and dies | 13,050 | 17,769 | 23,355 | 26,077 | 34,401 |
| Machines, tools, and implements | 449,285 | 428,552 | 335,560 | 434,525 | 338,442 |
| Carriages and vehicles | 1,034,260 | 1,034,057 | 1,086,235 | 1,188,851 | 1,266,945 |
| Harness, saddlery, and leatherware | 806,390 | 651,319 | 886,524 | 840,542 | 651,745 |
| Ships, boats, and their equipment | 345,729 | 271,928 | 227,649 | 259,202 | 333,521 |
| House-furnishings | 758,777 | 669,789 | 655,329 | 722,645 | 801,161 |
| Chemicals and by-products | 184,877 | 260,796 | 382,736 | 433,227 | 652,098 |
| Textile fabrics | 679,454 | 682,905 | 441,548 | 711,007 | 603,812 |
| Apparel | 2,820,470 | 1,678,012 | 1,801,331 | 1,816,582 | 1,796,402 |
| Fibrous material | 420,601 | 351,340 | 338,985 | 377,825 | 505,732 |
| Miscellaneous | 151,629 | 89,858 | 60,866 | 72,966 | 72,858 |
| Totals | 26,962,406 | 27,101,944 | 28,757,736 | 29,969,364 | 31,939,893 |
The values of the fixed assets give some idea as to the permanency and stability of the manufacturing industries in New Zealand as well as affording the means of judging to some extent of the amount of capital that has been sunk therein.
In connection with the following table it should be understood that the figures given are of necessity only approximate, the principal reason for this being that where one building houses two or more factories carrying on different industries an apportionment has to be made between the industries, and this cannot be done with absolute accuracy. Furthermore, in many instances fixed assets are stated at their book value, and this may be an understatement owing to appreciated site-value, or an overstatement owing to insufficient allowance being made for depreciation, obsolescence, &c. Where premises occupied are rented or leased (particularly if only a portion) it has been found impossible to arrive at the correct value. In such circumstances the practice has been to ascertain the annual rental value and capitalize this.
The following table shows the value of land, buildings, and plant and machinery recorded in the years 1920–21 to 1924–25 by provincial districts:—
| Provincial District. | 1920–21. | 1921–22. | 1922–23. | 1923–24. | 1924–25. |
|---|---|---|---|---|---|
| £ | £ | £ | £ | £ | |
| Auckland | 13,321,327 | 14,005,480 | 14,684,367 | 15,877,209 | 18,802,318 |
| Taranaki | 1,887,057 | 2,043,310 | 1,900,321 | 1,788,372 | 1,907,088 |
| Hawke's Bay | 1,711,480 | 1,684,389 | 1,779,534 | 1,812,904 | 1,779,530 |
| Wellington | 8,989,942 | 9,352,441 | 10,009,230 | 9,974,750 | 10,591,068 |
| Marlborough | 195,256 | 259,814 | 308,086 | 325,853 | 354,517 |
| Nelson | 626,042 | 578,362 | 588,664 | 705,431 | 731,838 |
| Westland | 585,996 | 703,845 | 715,462 | 711,878 | 715,158 |
| Canterbury | 6,667,649 | 7,166,652 | 8,152,851 | 8,065,429 | 8,622,874 |
| Otago | 3,988,082 | 4,120,110 | 4,457,568 | 4,590,221 | 4,725,028 |
| Southland | 1,592,006 | 1,469,516 | 1,623,042 | 1,646,007 | 1,749,423 |
| Totals | 39,564,837 | 41,384,219 | 44,219,125 | 45,498,054 | 49,978,842 |
The value of land, buildings, and plant and machinery may be taken as representing approximately the fixed capital, and a classification by classes of industries is therefore interesting, as it shows to a certain extent the amount of this capital required in the various classes. It is recognized that electric-supply undertakings and gasworks require heavy expenditure on plant and machinery, &c., and it is not surprising that the value of fixed assets employed in the industries coming under the “Heat, light, and power” class is much greater than that for any other class, notwithstanding that the added value in this case is relatively small. It is particularly interesting to note that while the added value in the “Animal food” class amounts to £7,295,226, as against £2,232,452 for heat, light, and power, the fixed capital in the latter case is £18,372,645, while in the former it is £8,933,667—over £9,000,000 less. The following table shows the value of land, buildings, plant, and machinery by classes of industries for the last five years:—
| Class of Industry. | Value of Land, Buildings, Plant, and Machinery. | ||||
|---|---|---|---|---|---|
| 1920–21. | 1921–22. | 1922–23. | 1923–24. | 1924–25. | |
* Included in “Miscellaneous.” | |||||
| £ | £ | £ | £ | £ | |
| Animal food | 8,880,840 | 9,616,370 | 9,470,214 | 8,502,359 | 8,933,667 |
| Vegetable food | 1,323,709 | 1,625,489 | 1,698,223 | 1,919,501 | 2,209,240 |
| Brinks, narcotics, and stimulants | 1,251,448 | 1,211,797 | 1,350,464 | 1,167,199 | 1,308,030 |
| Animal matters (not otherwise classed) | 713,628 | 479,846 | 445,383 | 431,542 | 471,924 |
| Working in wood | 2,852,255 | 3,126,000 | 3,243,686 | 3,274,955 | 3,383,882 |
| Vegetable produce for fodder | 55,989 | 65,178 | 91,554 | 83,002 | 92,739 |
| Paper manufactures | 109,993 | 121,339 | 168,991 | 194,039 | 259,036 |
| Heat, light, and power | 10,922,598 | 12,549,066 | 14,333,067 | 15,786,878 | 18,372,645 |
| Processes relating to stone, clay, glass, &c. | 1,767,486 | 1,467,302 | 1,279,184 | 1,435,351 | 1,568,521 |
| Metals other than gold or silver | 1,553,444 | 1,650,507 | 1,760,703 | 1,916,217 | 2,012,938 |
| Precious metals | 148,480 | 151,208 | 125,537 | 140,289 | 126,337 |
| Books and publications | 2,022,374 | 2,197,228 | 2,812,734 | 2,454,826 | 2,822,580 |
| Musical instruments | 22,792 | 33,015 | 31,106 | 24,944 | 19,445 |
| Ornaments and minor art products | 110,220 | 120,436 | 118,834 | 151,715 | 135,819 |
| Equipment for sports and games | 16,504 | * | 17,280 | 16,947 | 17,339 |
| Designs, medals, type, and dies | 13,190 | 25,725 | 27,326 | 32,374 | 38,467 |
| Machines, tools, and implements | 309,633 | 322,380 | 430,702 | 386,318 | 405,815 |
| Carriages and vehicles | 1,679,519 | 2,064,067 | 2,256,035 | 2,155,913 | 1,982,698 |
| Harness, saddlery, and leatherware | 581,942 | 617,088 | 636,160 | 607,111 | 578,163 |
| Ships, boats, and their equipment | 205,898 | 247,072 | 245,231 | 267,785 | 267,420 |
| House-furnishings | 711,853 | 774,086 | 855,305 | 868,586 | 803,435 |
| Chemicals and by-products | 171,461 | 213,116 | 467,881 | 518,338 | 1,043,689 |
| Textile fabrics | 622,299 | 677,236 | 706,844 | 822,634 | 940,818 |
| Apparel | 2,628,922 | 1,351,178 | 1,518,488 | 1,615,750 | 1,533,634 |
| Fibrous materials | 710,467 | 562,118 | 557,835 | 630,767 | 552,402 |
| Miscellaneous | 177,893 | 115,372 | 69,998 | 92,719 | 98,159 |
| Totals | 39,564,837 | 41,384,219 | 44,219,125 | 45,498,054 | 49,978,842 |
The relation between the value of (a) land and buildings, and (b) plant and machinery illustrates the tendency for the latter to increase at a proportionately faster rate than the former. In 1906 the proportions per cent. of land and buildings and of plant and machinery to the total fixed assets were 57 and 43 respectively, but in the last collection these positions were more than reversed, the percentages being 40 and 60. Each collection since 1906 has shown a gradual and consistent decrease in the percentage of the value of land and buildings to the total fixed assets, and an increase, in the figure for plant and machinery. The table given hereunder shows the movement during the last five years:—
| Year. | Land and Buildings. | Plant and Machinery. | Total Amount. | ||
|---|---|---|---|---|---|
| Amount. | Per Cent. of Total. | Amount. | Per Cent. of Total. | ||
| £ | £ | £ | |||
| 1920–21 | 19,707,988 | 49.81 | 19,856,849 | 50.19 | 39,564,837 |
| 1921–22 | 19,244,031 | 46.50 | 22,140,188 | 53.50 | 41,384,219 |
| 1922–23 | 19,904,178 | 45.01 | 24,314,947 | 54.99 | 44,219,125 |
| 1923–24 | 19,289,484 | 42.40 | 26,208,570 | 57.60 | 45,498,054 |
| 1924–25 | 19,923,436 | 39.86 | 30,055,406 | 60.14 | 49,978,842 |
Although information as to the amount of capital sunk in each factory has been collected for some years, the figures in this respect have been found to be inaccurate and have not been made use of. The chief factors militating against the collection of satisfactory information in this connection are the lax methods of accounting in use in many of the smaller establishments, and the difficulty of apportioning the capital where an establishment is only partly manufacturing. In the case of joint-stock companies the capital figures have been found to be reasonably accurate, and have been published in the “Annual Statistical Report on Factory Production” for some years. The following table shows particulars of the capital employed in factories by joint-stock companies at the 1911 and each succeeding collection:—
| Year. | Number of Companies. | Subscribed Capital. | Paid-up Capital. | Percentage of Paid-up Capital to Total Capital. | Loan Capital (excluding Bank Overdraft). | Percentage of Loan Capital to Total Capital. | Total Capital (Paid-up and Loan Capital). | Paid-up Shares issued Vendors as Part of Purchase Consideration, included under heading “Paid-up Capital.” |
|---|---|---|---|---|---|---|---|---|
| £ | £ | £ | £ | £ | ||||
| Private Companies. | ||||||||
| 1911 | 433 | 2,950,765 | 2,606,435 | 88.87 | 326,275 | 11.13 | 2,932,710 | 798,050 |
| 1916 | 595 | 5,751,073 | 5,115,045 | 87.98 | 699,059 | 12.02 | 5,814,104 | 1,561,841 |
| 1919 | 761 | 7,918,816 | 7,209,558 | 89.16 | 876,698 | 10.84 | 8,086,256 | 1,347,371 |
| 1920 | 788 | 6,846,867 | 6,328,721 | 86.68 | 972,366 | 13.32 | 7,301,087 | 1,214,773 |
| 1921 | 954 | 8,665,683 | 7,829,180 | 86.69 | 1,202,008 | 13.31 | 9,031,188 | 1,481,147 |
| 1922 | 897 | 9,439,728 | 8,686,580 | 88.29 | 1,152,147 | 11.71 | 9,838,727 | 1,183,445 |
| 1923 | 980 | 10,616,977 | 9,743,238 | 87.82 | 1,351,306 | 12.18 | 11,094,544 | 1,367,205 |
| 1924 | 1,073 | 11,145,577 | 10,290,736 | 86.11 | 1,660,217 | 13.89 | 11,950,953 | 1,099,693 |
| 1925 | 1,141 | 11,107,584 | 10,250,703 | 86.82 | 1,556,134 | 13.18 | 11,806,837 | 1,459,043 |
| Year. | Number of Companies. | Subscribed Capital. | Paid-up Capital. | Per-centage of Paid-up Capital to Total Capital. | Loan Capita] (excluding Bank Overdraft). | Percentage of Loan Capital to Total Capital. | Total Capital (Paid-up and Loan Capital). | Paid-up Shares issued Vendors as Part of Purchase Consideration, Included under heading “Paid-up Capital.” |
|---|---|---|---|---|---|---|---|---|
| £ | £ | £ | £ | £ | ||||
* Including co-operative companies from 1923 onwards. | ||||||||
| Public Companies.* | ||||||||
| 1911 | 566 | 12,497,095 | 10,501,692 | 85.80 | 1,738,126 | 14.20 | 12,239,818 | 1,778,786 |
| 1916 | 445 | 15,442,482 | 12,432,852 | 86.62 | 1,920,739 | 13.38 | 14,353,591 | 1,387,341 |
| 1919 | 447 | 17,649,958 | 15,052,664 | 85.28 | 2,597,309 | 14.72 | 17,649,973 | 1,702,944 |
| 1920 | 428 | 18,999,051 | 16,518,568 | 87.76 | 2,303,752 | 12.24 | 18,822,320 | 1,683,078 |
| 1921 | 483 | 19,897,588 | 17,515,421 | 90.06 | 1,933,123 | 9.94 | 19,448,544 | 2,260,432 |
| 1922 | 426 | 18,089,454 | 16,092,693 | 86.52 | 2,507,411 | 13.48 | 18,600,104 | 4,209,195 |
| 1923 | 845 | 24,405,077 | 20,549,176 | 87.45 | 2,949,846 | 12.55 | 23,499,022 | 2,245,922 |
| 1924 | 833 | 26,455,416 | 22,647,701 | 85.63 | 3,800,539 | 14.37 | 26,448,240 | 3,316,417 |
| 1925 | 877 | 23,752,543 | 20,634,305 | 85.12 | 3,607,560 | 14.88 | 24,241,865 | 3,535,141 |
| Total (Public and Private Companies). | ||||||||
| 1911 | 999 | 15,447,860 | 13,108,127 | 86.39 | 2,064,401 | 13.61 | 15,172,528 | 2,576,836 |
| 1916 | 1,040 | 21,193,555 | 17,547,897 | 87.01 | 2,619,798 | 12.99 | 20,167,695 | 2,949,185 |
| 1919 | 1,208 | 25,568,774 | 22,262,222 | 86.50 | 3,474,007 | 13.50 | 25,736,229 | 3,050,312 |
| 1920 | 1,216 | 25,845,918 | 22,847,289 | 87.46 | 3,276,118 | 12.54 | 26,123,407 | 2,897,851 |
| 1921 | 1,437 | 28,563,271 | 25,344,601 | 88.99 | 3,135,131 | 11.01 | 28,479,732 | 3,741,579 |
| 1922 | 1,323 | 27,529,182 | 24,779,273 | 87.13 | 3,659,558 | 12.87 | 28,438,831 | 5,392,640 |
| 1923 | 1,825 | 35,022,054 | 30,292,414 | 87.57 | 4,301,152 | 12.43 | 34,593,566 | 3,613,127 |
| 1924 | 1,906 | 37,600,993 | 32,938,437 | 85.78 | 5,460,756 | 14.22 | 38,399,193 | 4,416,110 |
| 1925 | 2,018 | 34.860,127 | 30,885,008 | 85.68 | 5,163,694 | 14.32 | 36,048,702 | 4,994,184 |
An examination of the above figures reveals that from 1911 onwards a little more than 10 per cent. of the capital invested in the factories and works operated by companies was obtained by way of loan. It is of interest to note that public companies work on a slightly higher percentage of loan capital than private companies, and that from 1916 onwards the paid-up and loan capital of private companies has been consistently in excess of the subscribed capital, while public companies have only twice—and then by comparatively small margins—since 1911 had the use of paid-up and loan capital in actual excess of the subscribed capital. This dealing within the margin of the subscribed capital by public companies is due, no doubt, to the fact that such concerns are, in comparison with private companies, more or less at a disadvantage as regards procuring extra capital, and keep a wide margin of uncalled capital available to meet emergencies. The relationship between the paid-up and loan capital invested as shown in the percentages in the previous table has shown slight, though highly significant, movements during the last six years. The general contraction of credit and the difficulty in obtaining loans which followed the slump in 1921 were responsible for the percentage of loan capital to the total capital in that year falling slightly below normal. Since 1921 the percentage of loan capital has shown an upward tendency, and the figures for the latest collection for public companies and for private and public companies together is the highest recorded.
The following table, showing the added value per £100 of capital (loan and paid up) for private and public companies, throws considerable light on the relative returns received on capital invested in both kinds of companies:—
| Year. | Added Value per £100 Capital. | ||
|---|---|---|---|
| Private Companies. | Public Companies. | Private and Public Companies. | |
| £ | £ | £ | |
| 1911 | 60.75 | 32.17 | 37.70 |
| 1916 | 50.72 | 36.87 | 40.86 |
| 1919 | 58.40 | 35.65 | 42.80 |
| 1920 | 79.12 | 43.67 | 53.58 |
| 1921 | 79.54 | 47.06 | 57.36 |
| 1922 | 73.57 | 49.08 | 57.55 |
| 1923 | 70.34 | 48.15 | 55.91 |
| 1924 | 73.56 | 40.81 | 51.74 |
| 1925 | 81.34 | 60.95 | 67.62 |
The increase in the added value per £100 of capital in both public and private companies is due to a decrease in capital brought about by the stricter exclusion of capital not sunk in manufacturing operations, rather than to more profitable use being made of capital.
The figures show that the added value per £100 of capital is higher in the case of private companies than for public companies, and indicate either that the capital n the former companies is put to better use than in the latter, or that there is relatively more capital employed in public than in private companies.
In considering the figures given in regard to capital it must be borne in mind that the registered capital is taken in each case, except where the company may not be fully-engaged in manufacture, in which case an apportionment on the basis of fixed, assets is taken, and that the capital necessarily includes capital invested in securities outside the company. This excess capital, as it may be called, would for various reasons be more likely to be found to any great extent in public companies than in private companies, and has, no doubt, the effect of swelling the capital figure for public companies to some considerable extent, beyond the amount actually invested in the various factories. The smaller return for each £100 of capital invested in the case of public companies is no doubt due in some measure to this fact, but. the main cause for the difference would appear to he in the more economical administration of the private companies as compared with the public companies.
The average capital per productive employee in factories operated by public and private companies is given for the last seven collections: 1916, £1,162; 1919, £614; 1920, £580; 1921, £575; 1922, £628; 1923, £659; 1924, £708; 1925, £671.
Information as to the character of organization of the establishments engaged in factory production is given in the following table for each of the last three years.
| Character of Organization. | 1922–23. | 1923–24. | 1924–25. | |||
|---|---|---|---|---|---|---|
| No. | Added Value. | No. | Added Value. | No. | Added Value. | |
| £ | £ | £ | ||||
| Individual | 1,463 | 3,141,420 | 1,505 | 3,163,128 | 1,490 | 3,186,517 |
| Private firm or partnership | 92 | 42,804,032 | 923 | 2,951,230 | 906 | 2,607,317 |
| Public registered company | 426 | 9,950,116 | 409 | 9,740,105 | 457 | 10,743,405 |
| Private registered company | 980 | 7,804,284 | 1,073 | 8,790,617 | 1,141 | 9,602,966 |
| Municipal | 116 | 1,458,752 | 124 | 1,575,370 | 129 | 1,768,634 |
| Co-operative and miscellaneous | 426 | 3,599,132 | 427 | 3,748,914 | 424 | 4,031,054 |
| Totals | 4,335 | 28,757,736 | 4,461 | 29,969,364 | 4,547 | 31,939,893 |
The figures in the above table show that the excellent facilities offered by the limited-liability company have been taken advantage of by the larger manufacturing establishments. Although the majority of establishments were either individual or partnership concerns, the actual added value of such concerns during each of the periods shown has been only slightly in excess of 20 per cent. of the total added value. Public and private registered companies contributed more than 50 per cent. of the total output during the same periods.
A table is now given showing for the various classes of industries the number of establishments instituted during the periods indicated:—
| Class of Industry. | Number established. | ||||||||||
|---|---|---|---|---|---|---|---|---|---|---|---|
| Prior to 1870. | 1870–79. | 1880–89. | 1890–99. | 1900–09. | 1910–21. | 1922. | 1923. | 1924. | Not stated. | Total. | |
| Animal food | 8 | 2 | 27 | 76 | 109 | 231 | 15 | 14 | 7 | 44 | 533 |
| Vegetable food | 17 | 11 | 16 | 14 | 12 | 24 | 3 | 3 | 5 | 19 | 124 |
| Drinks, narcotics, and stimulants | 28 | 26 | 33 | 18 | 37 | 34 | 1 | 5 | 7 | 37 | 226 |
| Animal matters (not otherwise classed) | 2 | 4 | 6 | 14 | 16 | 13 | 1 | 2 | 2 | 10 | 70 |
| Working in wood | 11 | 25 | 30 | 31 | 117 | 251 | 22 | 57 | 34 | 48 | 626 |
| Vegetable produce for fodder | .. | 1 | .. | 1 | 1 | 4 | 1 | 1 | .. | .. | 9 |
| Paper manufactures | 2 | 6 | 2 | .. | 2 | 3 | 1 | 2 | .. | 1 | 19 |
| Heat, light, and power | 4 | 14 | 9 | 8 | 29 | 68 | 6 | 6 | 3 | 1 | 148 |
| Processes relating to stone, clay, glass, &c. | 5 | 9 | 13 | 11 | 30 | 72 | 5 | 4 | 7 | 22 | 178 |
| Metals other than gold or silver | 31 | 23 | 42 | 32 | 70 | 119 | 14 | 17 | 7 | 32 | 387 |
| Precious metals | 5 | 2 | 8 | 6 | 8 | 13 | .. | .. | .. | 3 | 45 |
| Books and publications | 36 | 32 | 32 | 49 | 52 | 61 | 7 | 7 | 6 | 28 | 310 |
| Musical instruments | 1 | .. | 2 | 1 | .. | 3 | .. | .. | .. | 1 | 8 |
| Ornaments and minor art products | .. | 4 | 6 | 5 | 9 | 21 | 2 | 1 | 3 | 7 | 58 |
| Equipment for sports and games | 1 | .. | .. | 1 | 1 | 1 | .. | .. | .. | .. | 4 |
| Designs, medals, type, and dies | .. | .. | 1 | 2 | 3 | 5 | .. | .. | .. | .. | 14 |
| Machines, tools, and implements | 3 | 4 | 3 | 3 | 8 | 6 | 2 | 3 | .. | 5 | 37 |
| Carriages and vehicles | 8 | 16 | 30 | 42 | 87 | 337 | 43 | 41 | 25 | 101 | 730 |
| Harness, saddlery, and leather-ware | 6 | 9 | 25 | 25 | 32 | 34 | 3 | 6 | 2 | 19 | 161 |
| Ships, boats, and their equipment | 7 | 6 | 8 | 8 | 11 | 11 | 2 | .. | .. | 9 | 62 |
| House-furnishings | 14 | 5 | 15 | 23 | 47 | 119 | 16 | 7 | 10 | 46 | 302 |
| Chemicals and by-products | 3 | 5 | 4 | 10 | 15 | 22 | 1 | 3 | 2 | 3 | 68 |
| Textile fabrics | .. | 5 | 5 | 2 | 1 | 2 | .. | .. | .. | 1 | 16 |
| Apparel | 8 | 14 | 21 | 24 | 50 | 111 | 21 | 14 | 8 | 39 | 310 |
| Fibrous materials | .. | 6 | 2 | 5 | 19 | 20 | 2 | 6 | 5 | 15 | 80 |
| Miscellaneous | 2 | 2 | 2 | 6 | 2 | 5 | 1 | 1 | .. | 1 | 22 |
| Totals | 202 | 231 | 342 | 417 | 768 | 1,590 | 169 | 200 | 133 | 495 | 4,547 |
Out of the total manufacturing establishments in existence in New Zealand during the year ended 31st March, 1925, only 202 were in operation prior to 1870, so that in the 55 years following that date, excluding those cases where the date of establishment is unknown, 3,850 of the present establishments came into existence, at an average rate over the whole period of 70 per annum, or just under 6 per month. The actual rate of increase, however, has been much greater from 1910 onwards. The growth of the meat-freezing, &c., and butter and cheese, &c., establishments can be traced to the inauguration of refrigeration in 1882, which was responsible for the coming into operation in the 1880–89 period of 10 of the former establishments which are now in existence and 17 of the latter.
Individual particulars regarding the principal industries for the five years 1920–21 to 1924–25 are set out in the following pages. Fuller details for individual years are given in successive issues of the Annual Statistical Report on Factory Production.
| STATISTICS OF PRINCIPAL INDUSTRIES, 1920–21 TO 1924–25. | |||||
|---|---|---|---|---|---|
| — | 1920–21. | 1921–22. | 1922–23. | 1923–24. | 1924–25. |
* Tons. † Including unallocated. * Tons. † Including unallocated. | |||||
| Meat Freezing and Preserving | |||||
| Number of— | |||||
| Works | 51 | 50 | 48 | 46 | 43 |
| Hands employed | 8,631 | 8,245 | 7,408 | 7,361 | 7,567 |
| Amount of— | |||||
| Wages paid £ | 1,737,843 | 1,649,650 | 1,419,063 | 1,335,281 | 1,471,028 |
| Horse-power H.p. | 38,434 | 40,841 | 39,576 ½ | 34,972 | 35,312 |
| Approximate value of— | |||||
| Land and buildings £ | 3,593,702 | 3,763,197 | 3,875,548 | 2,874,865 | 3,130,402 |
| Machinery and plant £ | 1,920,708 | 2,039,096 | 2,098,923 | 1,780,137 | 1,803,505 |
| Frozen sheep— | |||||
| Carcases No. | 3,336,926 | 2,707,801 | 2,052,226 | 1,792,475 | 2,331,150 |
| Value £ | 3,834,483 | 2,668,631 | 2,334,786 | 2,251,243 | 3,028,514 |
| Frozen, lambs— | |||||
| Carcases No. | 3,302,274 | 4,452,011 | 4,945,973 | 4,832,820 | 4,764,718 |
| Value £ | 3,331,073 | 4,584,785 | 5,985,997 | 5,914,122 | 6,414,114 |
| Frozen, mutton and lamb pieces— | |||||
| Quantity Cwt. | 23,769 | 24,997 ½ | 30,990 ¼ | 12,174 | 18,160 |
| Value £ | 51,375 | 52,666 | 69,389 | 30,645 | 50,078 |
| Frozen beef— | |||||
| Quantity Cwt. | 841,767 | 554,215 | 729,8303 ¼ | 825,613 | 985,838 |
| Value £ | 1,462,604 | 572,072 | 791,546 | 977,469 | 1,255,730 |
| Frozen rabbits—Value £ | 21,027 | 30,724 | 8,459 | 9,541 | 14,952 |
| Preserved meats— | |||||
| Quantity Cwt. | 135,532 | 74,269 | 76,248 | 75,379 | 103,589 |
| Value £ | 566,212 | 241,318 | 242,683 | 245,560 | 291,016 |
| Tallow— | |||||
| Quantity Cwt. | 417,129 | 352,434 | 344,389 | 323,573 | 467,499 |
| Value £ | 718,026 | 492,742 | 517,706 | 506,551 | 688,083 |
| Bonedust— | |||||
| Quantity Cwt. | 458,761 | 106,292 | 161,051 | 99,202 | 60,267 |
| Value £ | 228,404 | 45,078 | 112,915 | 45,001 | 27,164 |
| Other manures— | |||||
| Quantity Cwt. | 705,690 | 394,271 | 483,315 | 364,818 | 532,971 |
| Value £ | 319,794 | 161,861 | 222,021 | 130,776 | 191,284 |
| Quantity Gallons | 43,061 | 37,734 | 38,592 | 37,780 | 36,500 |
| Value £ | 10,823 | 6,750 | 6,383 | 7,184 | 5,291 |
| Bones, horns, hoofs, &c.— | |||||
| Quantity Cwt. | 3,947 | 3,495 | 4,514 | 1,622 | 1,998 |
| Value £ | 947 | 1,675 | 6,282 | 1,720 | 2,542 |
| Other products—Value £ | 3,124,334 | 1,671,805 | 2,358,040 | 3,160,311 | 3,866,406 |
| Total value of output £ | 13,669,102 | 10,530,107 | 12,677,331 | 13,261,678 | 15,812,389 |
| Ham and Bacon Curing. | |||||
| Number of— | |||||
| Works | 34 | 36 | 38 | 38 | 36 |
| Hands employed | 221 | 276 | 290 | 288 | 333 |
| Amount of— | |||||
| Wages paid £ | 41,773 | 54,568 | 61,493 | 68,948 | 76,797 |
| Horse-power H.p. | 619 | 1,266 | 1,301 | 1,388 | 1,252 |
| Approximate value of— | |||||
| Land and buildings £ | 107,199 | 115,134 | 127,220 | 118,679 | 129,778 |
| Machinery and plant £ | 53,832 | 61,478 | 60,030 | 82,213 | 75,936 |
| Pigs dealt with— | |||||
| Number | 90,376 | 109,476 | 151,201 | 175,917 | 195,659 |
| Value £ | 493,113 | 430,796 | 476,462 | 634,476 | 613,092 |
| Value of other materials used £ | 20,232 | 30,563 | 33,286 | 27,615 | 33,888 |
| Hams and bacon—Quantity Cwt. | 78,214 | 97,182 | 137,006 | 168,328 | 190,214 |
| Lard—Quantity Cwt. | 4,109 | 3,683 | 7,014 ½ | 7,888 | 7,521 |
| Total value of output £ | 599,131 | 581,644 | 657,496 | 906,042 | 959,189 |
| Fish Curing and Preserving. | |||||
| Number of— | |||||
| Works | 8 | 11 | 12 | 9 | 9 |
| Hands employed | 94 | 96 | 114 | 99 | 87 |
| Approximate value of— | |||||
| Land and buildings £ | 29,844 | 30,368 | 37,696 | 33,994 | 27,041 |
| Machinery and plant £ | 15,153 | 14,939 | 17,967 | 16,477 | 16,467 |
| Fish cured—Value £ | 96,702 | 111,596 | 109,514 | 75,243 | 57,720 |
| Fish canned—Value £ | 1,788 | 3,595 | 6,000 | 3,485 | 7,238 |
| Value of other products £ | 25,180 | 14,928 | 8,701 | .. | 8,043 |
| Total value of output £ | 123,670 | 130,119 | 124,215 | 78,728 | 73,001 |
| Butter, Cheese, and Condensed-milk Making. | |||||
| Number of— | |||||
| Factories | 423 | 436 | 431 | 445 | 445 |
| Hands employed | 3,762 | 4,138 | 4,212 | 4,321 | 4,324 |
| Amount of— | |||||
| Wages paid £ | 712,249 | 813,489 | 810,858 | 868,006 | 881,713 |
| Horse-power H.p. | 10,372 ¼ | 14,553 ½ | 16,000 | 17,325 | 18,395 |
| Approximate value of— | |||||
| Land and buildings £ | 1,542,570 | 1,926,031 | 1,707,041 | 1,720,205 | 1,773,416 |
| Machinery and plant £ | 1,617,834 | 1,666,127 | 1,545,789 | 1,875,789 | 1,977,122 |
| Number of separators— | |||||
| At home | 24,404 | 32,114 | 34,845 | 36,414 | 36,798 |
| At butter-factories | 547 | 553 | 613 | 824 | 866 |
| Butterfat separated— | |||||
| At home lb. | 62,438,996 | 90,683,490 | 108,182,546 | 112,068,684 | 94,862,029 |
| At butter-factories lb. | 15,790,973 | 23,482,681 | 40,089,862 | 32,500,710 | 56,236,858 |
| Milk received by cheese-factories lb. | 1,242,520,939 | 1,408,257,610 | 1,287,360,988 | 1,680,417,442 | 1,563,265,082 |
| Fat received lb. | 47,098,181 | 53,946,628 | 52,509,031 | 70,092,509 | 60,526,650 |
| Value of materials used £ | 16,400,926 | 11,528,370 | 15,696,639 | 15,136,630 | 15,801,956 |
| Butter produced (including whey butter)— | |||||
| Quantity Cwt. | 829,698 | 1,205,441 | 1,576,444 | 1,473,783 | 1,652,266 |
| Value £ | 11,296,717 | 9,098,344 | 12,822,056 | 12,207,741 | 13,303,609 |
| Cheese produced— | |||||
| Quantity Cwt. | 1,115,650 | 1,268,534 | 1,247,987 | 1,534,980 | 1,436,541 |
| Value £ | 6,254,350 | 4,838,375 | 5,473,173 | 5,994,651 | 6,021,305 |
| Value of other produce £ | 1,450,980 | 1,067,339 | 886,395 | 724,838 | 711,748 |
| Total value of all produce £ | 19,002,047 | 15,003,958 | 19,181,624 | 18,927,230 | 20,036,662 |
| Grain-mills. | |||||
| Number of— | |||||
| Mills | 53 | 52 | 53 | 52 | 51 |
| Hands employed | 644 | 688 | 670 | 695 | 672 |
| Amount of— | |||||
| Wages paid £ | 150,396 | 166,471 | 165,913 | 167,467 | 171,558 |
| Horse-power H.p. | 4,238 ½ | 4,442 ½ | 4,603 ½ | 4,384 | 4,912 |
| Approximate value of— | |||||
| Land and buildings £ | 333,382 | 388,365 | 390,060 | 403,698 | 365,917 |
| Machinery and plant £ | 251,532 | 277,080 | 282,302 | 319,157 | 341,477 |
| Wheat used—Quantity Bushels | 6,200,483 | 5,655,563 | 6,258,159 | 6,470,496 | 6,358,369 |
| Total grain—Value £ | 2,599,405 | 2,326,297 | 2,272,122 | 1,933,679 | 2,035,489 |
| Flours produced Tons | 131,766 ½ | 121,663 | 139,702 | 133,428 | 136,215 |
| Oatmeal produced Tons | 6,485 ½ | 5,035 | 5,529 | 7,259 | 6,223 |
| Other products—Value £ | 534,080 | 503,559 | 505,415 | 484,254 | 415,201 |
| Total value of output £ | 3,426,965 | 3,156,530 | 3,059,004 | 2,718,611 | 2,849,222 |
| — | 1920–21. | 1921–22. | 1922–23. | 1923–24. | 1924–25. |
| Biscuit and Confectionery Making. | |||||
| Number of— | |||||
| Works | 51 | 58 | 60 | 59 | 64 |
| Hands employed | 1,698 | 1,886 | 2,032 | 2,290 | 2,404 |
| Amount of— | |||||
| Wages paid £ | 230,844 | 258,057 | 261,847 | 290,928 | 318,703 |
| Horse-power H.p. | 1,692 | 1,589 ½ | 1,838 ½ | 2,214 | 2,655 |
| Approximate value of— | |||||
| Land and buildings £ | 274,677 | 278,797 | 276,527 | 412,756 | 376,679 |
| Machinery and plant £ | 201,281 228,120 | 273,196 | 306,069 | 334,490 | |
| Flour used—Quantity Tons | 5,343 | 4,939 ½ | 4,771 ½ | 4,964 | 5,552 |
| Sugar used—Quantity Tons | 5,390 ½ | 5,626 ½ | 6,603 ¼ | 6,830 | 6,911 |
| Value of other materials £ | 460,238 | 402,901 | 422,933 | 489,937 | 488,331 |
| Biscuits and confectionery made £ | 1,237,685 | 1,174,550 | 1,165,104 | 1,283,218 | 1,358,950 |
| Other products £ | 33,311 | 63,475 | 65,259 | 101,248 | 110,858 |
| Total value of products £ | 1,270,996 | 1,238,025 | 1,230,363 | 1,384,466 | 1,469,808 |
| Fruit-preserving and Jam-making. | |||||
| Number of— | |||||
| Works | 10 | 8 | 7 | 7 | 7 |
| Hands employed | 310 | 229 | 322 | 298 | 299 |
| Amount of wages paid | £ 44,210 | 39,133 | 42,181 | 50,103 | 47,928 |
| Approximate value of— | |||||
| Land and buildings £ | 49,372 | 57,828 | 49,218 | 46,120 | 46,970 |
| Machinery and plant £ | 21,838 | 19,011 | 27,174 | 28,436 | 23,707 |
| Fruit used Tons | 4,473 ¼ | 2,633 | 3,293 | 2,762 | 2,633 |
| Value of— | |||||
| Fruit used £ | 79,547 | 42,947 | 62,691 | 51,100 | 53,377 |
| Sugar and other ingredients £ | 89,552 | 68,560 | 58,480 | 55,137 | 56,775 |
| Fruit bottled or preserved—Value £ | 14,344 | 22,561 | 18,902 | 16,359 | 23,402 |
| Jams and jellies made— | |||||
| Quantity Cwt. | 83,921 | 68,170 | 51,763 | 54,708 | 53,878 |
| Value £ | 281,222 | 231,539 | 189,158 | 200,866 | 185,404 |
| Other preserves—Value £ | 21,109 | 24,776 | 29,135 | 26,481 | 30,936 |
| Total value of output £ | 316,675 | 278,876 | 237,195 | 243,706 | 239,742 |
| Breweries and Malt-houses. | |||||
| Number of— | |||||
| Establishments | 56 | 53 | 54 | 53 | 51 |
| Hands employed | 1,129 | 1,047 | 1,038 | 974 | 977 |
| Amount of— | |||||
| Wages paid £ | 289,823 | 275,448 | 283,158 | 228,510 | 260,528 |
| Horse-power H.p. | 2,297 ¾ | 2,172 ¾ | 2,175 ¾ | 2,244 | 2,275 |
| Approximate value of— | |||||
| Land and buildings £ | 428,571 | 472,435 | 567,458 | 407,502 | 445,644 |
| Machinery and plant £ | 270,571 | 264,337 | 305,837 | 291,803 | 307,631 |
| Barley used in production of malt Bushels | 687,544 | 623,648 | 557,357 ½ | 523,926 | 590,312 |
| Hops used Cwt. | 6,244 | 6,864 | 5,352 ½ | 6,313 | 5,313 |
| Sugar used Cwt. | 24,420 | 24,550 ½ | 22,675 | 20,374 | 25,038 |
| Total cost of materials used £ | 648,566 | 530,205 | 393,591 | 363,560 | 545,571 |
| Ale brewed Gallons | 14,331,989 | 13,054,110 | 12,241,835 | 10,921,367 | 12,739,796 |
| Stout brewed Gallons | 1,308,295 | 1,165,095 | 1,496,566 | 1,011,830 | 1,344,810 |
| Ale bottled Doz. qts. | 807,063 | 649,573 | 547,529 | 464,211 | 598,744 |
| Stout bottled Doz. qts. | 339,607 | 350,956 | 324,845 | 286,352 | 392,802 |
| Value of output £ | 1,463,558 | 1,286,186 | 1,053,016 | 943,030 | 1,298,291 |
| Aerated-water and Cordial Factories. | |||||
| Number of— | |||||
| Works | 124 | 124 | 121 | 123 | 136 |
| Hands employed | 537 | 611 | 582 | 589 | 675 |
| Amount of wages paid £ | 102,192 | 121,118 | 113,796 | 123,804 | 137,297 |
| Approximate value of— | |||||
| Land and buildings £ | 184,226 | 182,369 | 181,438 | 180,980 | 222,350 |
| Machinery and plant £ | 92,344 | 104,344 | 115,192 | 125,619 | 147,360 |
| Total cost of materials used £ | 136,445 | 122,698 | 107,968 | 131,770 | 128,141 |
| Other expenses £ | 48,008 | 54,626 | 57,360 | 68,313 | 67,061 |
| Aerated waters—Quantity Doz. | 2,230,296 | 1,906,894 | 1,874,181 | 2,067,628 | 2,297,418 |
| Cordials—Quantity Doz. | 44,328 | 43,406 | 34,650 ½ | 46,078 | 53,631 |
| Hop-beer—Quantity sold in bottles Doz. | 163,943 | 148,511 | 221,314 | 202,278 | 115,512 |
| Hop-beer—Quantity sold in bulk Gallons | 120,934 | 185,039 | 165,756 | 141,651 | 188,873 |
| Total value of all manufactures £ | 370,613 | 364,048 | 354,341 | 404,795 | 413,746 |
| Sauce. Pickle, and Vinegar Making. | |||||
| Sauce. Pickle, and Vinegar Making. | |||||
| Number of— | |||||
| Works | 15 | 17 | 21 | 19 | 18 |
| Hands employed | 275 | 247 | 269 | 279 | 239 |
| Amount of wages paid £ | 48,174 | 41,324 | 46,030 | 46,688 | 43,338 |
| Approximate value of— | |||||
| Land and buildings £ | 60,029 | 61,757 | 70,295 | 51,768 | 71,423 |
| Machinery and plant £ | 21,140 | 25,100 | 26,319 | 27,322 | 27,649 |
| Value of materials used £ | 119,605 | 102,753 | 100,185 | 103,353 | 104,204 |
| Other expenses of manufacture £ | 28,974 | 28,442 | 23,347 | 21,357 | 39,165 |
| Total value of all manufactures £ | 184,528 | 186,998 | 188,773 | 198,326 | 200,164 |
| Soap and Candle Works. | |||||
| Number of— | |||||
| Works | 22 | 18 | 18 | 20 | 22 |
| Hands employed | 374 | 406 | 397 | 464 | 472 |
| Amount of wages paid £ | 77,594 | 84,328 | 85,492 | 92,765 | 98,278 |
| Approximate value of— | |||||
| Land and buildings £ | 110,545 | 99,429 | 106,131 | 117,008 | 144,360 |
| Machinery and plant £ | 75,372 | 84,637 | 82,644 | 121,891 | 110,274 |
| Soap manufactured— | |||||
| Quantity Tons | 6,159 | 7,348 | 6,521 ¾ | 8,557 | 8,845 |
| Value £ | 267,085 | 301,722 | 302,123 | 272,552 | 317,392 |
| Candles manufactured— | |||||
| Quantity lb. | 3,355,515 | 3,448,401 | 3,932,150 | 3,806,805 | 4,000,472 |
| Value £ | 161,008 | 140,074 | 125,468 | 105,495 | 117,292 |
| Other manufactures—Value £ | 108,309 | 109,002 | 124,637 | 118,693 | 126,213 |
| Total value of all manufactures £ | 536,402 | 550,798 | 552,228 | 496,740 | 560,897 |
| Clothing and Waterproof Factories. | |||||
| Number of works | 197 | 213 | 224 | 213 | 211 |
| Number of hands employed— | |||||
| Males | 905 | 945 | 1,085 | 1,202 | 1,074 |
| Females | 5,547 | 5,430 | 6,033 | 5,645 | 5,578 |
| Amount of wages paid— | |||||
| To males £ | 209,445 | 219,994 | 360,996 | 267,004 | 246,276 |
| To females £ | 522,949 | 511,415 | 541,060 | 548,980 | 529,667 |
| Approximate value of— | |||||
| Land and buildings £ | 669,926 | 762,730 | 875,346 | 927,995 | 826,920 |
| Machinery and plant £ | 114,759 | 142,719 | 155,599 | 156,485 | 155,351 |
| Output— | |||||
| Suits No. | 232,004 | 117,799 | 163,258 | 159,787 | 161,322 |
| Shirts Doz. | 70,597 | 80,669 | 103,993 | 106,572 | 93,052 |
| Caps and bats Doz. | 50,318 | 57,637 | 60,257 ¼ | 141,634 | 63,821 |
| Other garments No. | 973,565 | 716,759 | 684,188 | 913,145 | 567,157 |
| Total value £ | 2,859,439 | 2,225,042 | 2,409,377 | 2,400,278 | 2,339,462 |
| Hosiery-factories. | |||||
| Number of— | |||||
| Works | 8 | 9 | 11 | 10 | 11 |
| Hands employed | 215 | 276 | 300 | 304 | 357 |
| Amount of wages paid £ | 21,077 | 37,315 | 34,472 | 33,504 | 33,951 |
| Approximate value of— | |||||
| Land and buildings £ | 16,739 | 32,414 | 37,525 | 30,573 | 37,453 |
| Machinery and plant £ | 27,733 | 39,019 | 44,464 | 45,616 | 46,713 |
| Total value of all manufactures £ | 146,750 | 178,255 | 171,626 | 155,773 | 170,043 |
| Boot and Shoe Factories. | |||||
| Number of works | 74 | 73 | 80 | 81 | 81 |
| Number of hands employed— | |||||
| Males | 1,523 | 1,534 | 1,716 | 1,586 | 1,549 |
| Females | 763 | 797 | 977 | 887 | 926 |
| Amount of wages paid— | |||||
| To males £ | 320,746 | 299,917 | 353,531 | 331,387 | 318,126 |
| To females £ | 81,806 | 80,422 | 102,389 | 96,195 | 90,296 |
| Approximate value of— | |||||
| Land and buildings £ | 224,267 | 238,894 | 254,921 | 302,890 | 316,274 |
| Machinery and plant £ | 108,171 | 117,971 | 126,079 | 128,217 | 127,599 |
| Value of materials used— | |||||
| New Zealand leather £ | 473,639 | 368,243 | 397,757 | 366.655 | 309,414 |
| Imported leather £ | 252,320 | 188,820 | 247,710 | 250,964 | 209,100 |
| Other materials £ | 175,545 | 90,015 | 103,710 | 87,621 | 78 858 |
| Total value £ | 901,504 | 647,078 | 749,177 | 705,240 | 597,372 |
| Manufactures— | |||||
| Boots and shoes Pair | 1,285,058 | 1,329,158 | 1,437,663 | 1,471,093 | 1,372,777 |
| Slippers Pair | 21,488 | 32,811 | 20,529 | 17,217 | 18,965 |
| Shoe-ettes Pair | 36,037 | 29,296 | 49,041 | 56 299 | 34,085 |
| Uppers Pair | 1,978 | 1,295 | 1,741 | 2,111 | 1, 934 |
| Leggings Pair | 577 | 6 | 25 | 53 | 158 |
| Total value of all manufactures £ | 1,496,474 | 1,310,059 | 1,441,701 | 1,354,833 | 1,225,698 |
| Flax-milling. | |||||
| Number of— | |||||
| Works | 36 | 34 | 42 | 48 | 64 |
| Hands employed | 834 | 681 | 755 | 967 | 1,211 |
| Amount of— | |||||
| Wages paid £ | 148,372 | 117,871 | 118,334 | 149,001 | 221,984 |
| Horse-power H.p. | 2,554 ½ | 2,412 ½ | 2,779 ½ | 2,942 | 3,245 |
| Approximate value of— | |||||
| Land and buildings £ | 527,203 | 406,637 | 375,141 | 421,165 | 328,045 |
| Machinery and plant £ | 75,799 | 54,386 | 64,898 | 81,855 | 93,189 |
| Raw material used— | |||||
| Quantity Tons | 53,409 | 62,486 | 74,951 | 98,444 | 129,985 |
| Value £ | 77,948 | 67,809 | 72,196 | 73,903 | 113,794 |
| Fibre dressed— | |||||
| Quantity Tons | 10,236 | 8,972 | 9,502 ¼ | 11,553 | 14,873 |
| Value £ | 323,495 | 241,430 | 252,747 | 305,071 | 453,503 |
| Tow produced— | |||||
| Quantity Tons | 1,313 ½ | 1,321 ¾ | 1,463 | 1,768 | 2,713 |
| Value £ | 14,897 | 17,849 | 19,120 | 23,215 | 44,087 |
| Total value of output £ | 344,086 | 260,267 | 277,267 | 334,169 | 505,761 |
| Sawmilling. | |||||
| Number of— | |||||
| Mills | 389 | 397 | 426 | 446 | 471 |
| Hands employed | 9,135 | 8,423 | 8,638 | 9,435 | 10,082 |
| Amount of— | |||||
| Wages paid £ | 2,036,878 | 1,970,571 | 1,893,464 | 2,058,774 | 2,286,831 |
| Horse-power H.p. | 24,918 ½ | 27,721 ½ | 32,403 ¾ | 30,843 | 34,407 |
| Approximate value of— | |||||
| Land and buildings £ | 764,638 | 894,882 | 863,704 | 883,151 | 855,253 |
| Machinery and plant £ | 1,087,600 | 1,249,377 | 1,227,518 | 1,161,392 | 1,232,439 |
| Tramways £ | 555,279 | 624,147 | 735,822 | 810,847 | 902,961 |
| Sawn timber— | |||||
| Quantity Ft. | 290,213,087 | 314,972,310 | 304,351,877 | 317,069,216 | 344,094,874 |
| Value £ | 3,149,673 | 3,272,203 | 3,048,220 | 3,164,569 | 3,468,099 |
| Posts, rails, &c.—Value £ | 16,538 | 20,714 | 19,961 | 18,430 | 19,727 |
| Resawing, planed flooring, skirting, &c.— | |||||
| Quantity Ft. | 63,825,814 | 50,089,047 | 62,284,953 | 67,558,213 | 76,660,370 |
| Value £ | 1,007,525 | 888,906 | 974,806 | 1,135,371 | 1,424,037 |
| Moulding— | |||||
| Quantity Ft. | 3,361,777 | 3,696,481 | 4,677,147 | 7,894,759 | 8,872,683 |
| Value £ | 40,967 | 42,481 | 80,444 | 87,991 | 100,849 |
| Doors and sashes—Value £ | 168,960 | 194,266 | 134,948 | 127,669 | 151,476 |
| Joinery, undescribed £ | 328,340 | 353,752 | 311,696 | 488,226 | 466,697 |
| Total value of output £ | 4,712,003 | 4,772,322 | 4,570,075 | 5,022,256 | 5,630,885 |
| Gasworks. | |||||
| Number of— | |||||
| Works | 50 | 50 | 53 | 51 | 50 |
| Employees | 1,856 | 1,806 | 1,859 | 2,011 | 2,010 |
| Amount paid in wages £ | 345,961 | 358,367 | 340,126 | 443,020 | 451,153 |
| Approximate value of— | |||||
| Land and buildings £ | 592,516 | 499,680 | 532,405 | 584,112 | 525,048 |
| Machinery and plant £ | 2,695,518 | 2,959,917 | 3,259,128 | 3,358,934 | 3,419,758 |
| Coal used— | |||||
| Quantity Tons | 247,277 | 247,471 | 242,740 | 249,710 | 245,022 |
| Value £ | 623,649 | 674,948 | 608,146 | 572,166 | 543,069 |
| Total gas made Cub. ft. | 3,401,337,490 | 3,438,855,791 | 3,570,431,350 | 3,730,206,434 | 3,739,172,005 |
| Gas sold— | |||||
| Quantity. Cub. ft. | 3,003,222,172 | 3,008,060,710 | 3,121,423,299 | 3,241,070,596 | 3,258,267,031 |
| Value £ | 1,146,796 | 1,277,720 | 1,308,447 | 1,303,849 | 1,266,081 |
| Coke sold— | |||||
| Quantity Tons | 100,356 | 83,416 ½ | 84,167 ¼ | 80,009 | 81,128 |
| Value £ | 156,437 | 171,049 | 141,442 | 140,377 | 148,565 |
| Tar sold— | |||||
| Quantity Gallons | 2,564,524 | 2,462,424 | 2,481,837 | 2,465,545 | 2,711,811 |
| Value £ | 62,589 | 67,251 | 68,461 | 70,729 | 72,263 |
| Other receipts £ | 72,619 | 87,873 | 40,737 | 53,646 | 69,043 |
| Total receipts £ | 1,438,441 | 1,603,893 | 1,559,087 | 1,568,601 | 1,555,952 |
| Total expenditure £ | 1,335,923 | 1,444,344 | 1,378,176 | 1,376,863 | 1,346,292 |
| Quantity of gas sold for— | |||||
| Street lighting Cub. ft. | 61,578,026 | 61,209,710 | 65,692,622 | 63,290,018 | 56,248,871 |
| General lighting - Cub. ft. | 449,988,270 | 199,842,400 | 270,617,450 | 459,832,600 | 458,590,250 |
| Heating and cooking Cub. ft. | 368,657,450 | 444,537,700 | 350,266,900 | 371,483,500 | 400,766,000 |
| Motive power - Cub. ft. | 34,492,800 | 24,258,700 | 31,399,500 | 30,084,300 | 24,982,100 |
| Undefined Cub. ft. | 2,088,505,626 | 2,278,212,200 | 2,403,446,827 | 2,316,380,178 | 2,317,679,810 |
| Total Cub. ft. | 3,003,222,172 | 3,008,060,710 | 3,121,423,299 | 3,241,070,596 | 3,258,267,031 |
| Electric Current. | |||||
| Number of— | |||||
| Works | 78 | 79 | 79 | 85 | 89 |
| Employees | 1,022 | 1,020 | 1,082 | 1,247 | 1,407 |
| Amount paid in wages £ | 206,072 | 220,644 | 223,665 | 267,165 | 300,514 |
| Horse-power available H.p. | 75,992 | 74,711 | 71,801 | 93,907 | 114,597 |
| Fuel used— | |||||
| Coal and coke Tons | 131,281 | 127,707 | 54,968 | 95,729 | 131,589 |
| Oil Gallons | 185,250 | 9,592 | 232,667 | 35,639 | 2,527* |
| Total units generated | 170,211,048 | 193,542,420 | 207,379,021 | 258,413,218 | 310,406,597 |
| Revenue £ | . 900,858 | 1,035,345 | 1,155,357 | 1,430,951 | 1,668,743 |
| Expenditure £ | 842,827 | 950,507 | 1,020,886 | 1,278,526 | 1,547,318 |
| Capital outlay— | |||||
| Land and buildings £ | 444,909 | 447,297 | 591,095 | 592,165 | 671,954 |
| Generating plant £ | 1,363,361 | 1,733,339 | 2,061,798 | 2,442,661 | 2,784,298 |
| Distribution system and substations £ | 1,417,730 | 1,877,018 | 2,372,566 | 2,997,858 | 3,861,257 |
| Other £ | 686,792 | 957,904 | 1,145,745 | 1,775,834 | 2,385,591 |
| Total £ | 3,912,792 | 5,015,558 | 6,171,204 | 7,830,185† | 9,726,167† |
| Current sold for— | |||||
| Street lighting Units | 3,489,378 | 3,467,024 | 3,729,171 | 4,655,632 | 5,478,012 |
| General lighting, heating, and cooking Units | 68,194,084 | 59,789,826 | 104,509,217 | 147,115,339 | 158,723,257 |
| Motive power Units | 39,787,400 | 60,490,292 | 36,701,032 | 37,726,568 | 45,579,243 |
| Tramway supply Units | 13,327,661 | 20,508,723 | 22,452,511 | 22,162,670 | 33,984,272 |
| Other local purposes Units | 3,365,614 | 2,120,669 | 3,927,825 | 3,779,438 | 11,810,875 |
| Total Units | 128,164,137 | 146,376,534 | 171,319,756 | 215,439,647 | 255,575,659 |
| Lime and Cement Works. | |||||
| Number of— | |||||
| Works | 23 | 23 | 22 | 27 | 28 |
| Hands employed | 773 | 684 | 840 | 999 | 939 |
| Amount of— | |||||
| Wages paid £ | 150,608 | 151,211 | 184,306 | 203,610 | 214,109 |
| Horse-power H.p. | 8,902 ¼ | 7,039 ¼ | 8,380 ¾ | 9,992 | 13,677 |
| Approximate value of— | |||||
| Land and buildings £ | 316,263 | 323,975 | 245,149 | 220,745 | 308,907 |
| Machinery and plant £ | 499,271 | 429,533 | 282,542 | 425,199 | 446,017 |
| Value of materials used £ | 285,416 | 174,679 | 149,979 | 134,281 | 233,659 |
| Total value of output £ | 638,685 | 568,398 | 611,161 | 880,266 | 965,997 |
| Brick, Tile, and Pottery Works. | |||||
| Number of— | |||||
| Works | 60 | 73 | 76 | 69 | 68 |
| Hands employed | 1,100 | 1,101 | 1,121 | 1,235 | 1,283 |
| Amount of— | |||||
| Wages paid. £ | 214,737 | 236,492 | 225,822 | 247,109 | 281,421 |
| Horse-power H.p. | 3,042 ¼ | 3,362 ¾ | 3,570 | 3,336 | 4,141 |
| Approximate value of— | |||||
| Land and buildings £ | 344,445 | 356,832 | 382,295 | 353,627 | 327,188 |
| Machinery and plant £ | 161,317 | 184,423 | 193,028 | 189,847 | 205,941 |
| Bricks manufactured— | |||||
| Common No. | 51,462,746 | 48,862,488 | 49,398,373 | 55,929,736 | 65,131,301 |
| Fire No. | 1,156,243 | 2,243,648 | 1,372,883 | 3,417,519 | 1,150,549 |
| Total value £ | 247,715 | 269,036 | 259,098 | 290,079 | 302,900 |
| Value of pottery manufactured £ | 246,882 | 289,484 | 305,986 | 308,481 | 331,864 |
| Total value of all manufactures £ | 494,597 | 558,520 | 565,084 | 598,560 | 634,764 |
| Tinware and Sheet-metal Works. | |||||
| Number of— | |||||
| Works | 91 | 120 | 119 | 119 | 111 |
| Hands employed | 858 | 1,086 | 1,114 | 1,231 | 1,233 |
| Amount of wages paid £ | 161,778 | 208,091 | 202,980 | 226,146 | 227,108 |
| Approximate value of— | |||||
| Land and buildings £ | 225,877 | 282,658 | 266,879 | 262,169 | 305,998 |
| Machinery and plant £ | 84,792 | 101,290 | 107,461 | 114,115 | 125,755 |
| Value of materials used £ | 389,489 | 380,369 | 306,961 | 333,444 | 340,073 |
| Total value of manufactures and repairs £ | 670,655 | 740,499 | 661,782 | 706,469 | 696,925 |
| Iron and Brass Foundries. | |||||
| Number of— | |||||
| Works | 34 | 43 | 41 | 48 | 51 |
| Hands employed | 528 | 633 | 607 | 832 | 945 |
| Amount of— | |||||
| Wages paid £ | 104,873 | 138,705 | 120,768 | 164,467 | 212,262 |
| Horse-power H.p. | 623 ½ | 1,159 ½ | 1,005 ½ | 1,511 | 1,669 |
| Approximate value of— | |||||
| Land and buildings £ | 112,198 | 155,882 | 125,042 | 154,761 | 183,313 |
| Machinery and plant £ | 53,112 | 79,582 | 75,188 | 81,392 | 94,618 |
| Value of materials used or operated on £ | 160,069 | 189,295 | 116,197 | 170,090 | 187,330 |
| Total value of manufactures (including £ repairs) | 356,222 | 424,601 | 327,705 | 435,475 | 512,029 |
| Number of— | |||||
| Engineering-works. | |||||
| Works | 143 | 131 | 147 | 159 | 177 |
| Hands employed | 3,388 | 2,835 | 2,993 | 3,524 | 3,509 |
| Amount of— | |||||
| Wages paid £ | 666,075 | 574,295 | 542,412 | 682,392 | 702,662 |
| Horse-power H.p. | 4,468 ¾ | 4,083 ½ | 4,832 ½ | 5,033 | 5,739 |
| Approximate value of— | |||||
| Land and buildings £ | 538,454 | 505,161 | 584,277 | 646,359 | 643,507 |
| Machinery and plant £ | 338,130 | 307,085 | 390,270 | 422,601 | 440,273 |
| Value of materials used £ | 691,453 | 501,378 | 515,508 | 562,660 | 682,378 |
| Total value of manufactures (including £ repairs) | 1,837,651 | 1,454,438 | 1,459,923 | 1,644,224 | 1,846,218 |
| Printing and Publishing Establishments. | |||||
| Number of works | 251 | 261 | 280 | 292 | 310 |
| Hands employed— | |||||
| Males No. | 3,743 | 3,712 | 4,288 | 4,562 | 5,237 |
| Females No. | 1,161 | 1,141 | 1,167 | 1,317 | 1,542 |
| Wages paid— | |||||
| To males £ | 892,598 | 926,128 | 1,031,976 | 1,118,585 | 1,334,622 |
| To females £ | 121,686 | 122,756 | 121,045 | 142,444 | 167,040 |
| Approximate value of land, buildings, machinery, and plant £ | 2,022,374 | 2,197,228 | 2,312,734 | 2,454,826 | 2,822,580 |
| Value of materials used £ | 1,213,039 | 1,125,142 | 885,123 | 916,818 | 1,025,405 |
| Value of all manufactures £ | 3,395,276 | 3,464,224 | 3,531,936 | 3,623,123 | 4,052,545 |
| Number of— | |||||
| Agricultural and Dairying Machinery and Implement Making. | |||||
| Works | 29 | 33 | 30 | 25 | 27 |
| Hands employed | 1,080 | 900 | 939 | 973 | 986 |
| Amount of— | |||||
| Wages paid £ | 236,172 | 201,329 | 192,288 | 196,143 | 198,073 |
| Horse-power H.p. | 799 ¾ | 366 ½ | 785 ¾ | 843 | 925 |
| Approximate value of— | |||||
| Land and buildings £ | 166,224 | 163,330 | 247,894 | 184,363 | 225,680 |
| Machinery and plant £ | 104,537 | 100,186 | 116,073 | 137,733 | 125,763 |
| Value of all materials used £ | 418,311 | 224,701 | 214,805 | 231,919 | 339,942 |
| Total value of manufactures (including £ repairs) | 800,673 | 591,240 | 483,966 | 597,699 | 619,775 |
| Number of— | |||||
| Coachbuilding-works. | |||||
| Works | 167 | 183 | 188 | 189 | 167 |
| Hands employed | 1,166 | 1,021 | 1,127 | 1,302 | 1,316 |
| Amount of— | |||||
| Wages paid £ | 240,254 | 211,561 | 208,630 | 242,857 | 260,467 |
| Horse-power H.p. | 888 ¾ | 820 ¾ | 983 ¾ | 1,073 | 1,082 |
| Approximate value of— | |||||
| Land and buildings £ | 312,512 | 313,697 | 361,698 | 371,336 | 347,399 |
| Machinery and plant £ | 66,624 | 58,556 | 66,769 | 70,487 | 71,112 |
| Value of materials used £ | 278,264 | 231,824 | 215,735 | 260,962 | 269,643 |
| Total value of manufactures (including £ repairs) | 700,236 | 605,467 | 591,265 | 711,081 | 720,886 |
| Number of— | |||||
| Works | 398 | 473 | 514 | 549 | 560 |
| Hands employed | 2,098 | 2,139 | 2,347 | 2,588 | 2,808 |
| Amount of wages paid £ | 362,776 | 378,734 | 384,229 | 434,213 | 494,580 |
| Approximate value of— | |||||
| Land and buildings £ | 1,085,106 | 1,403,839 | 1,507,758 | 1,408,180 | 1,257,541 |
| Machinery and plant £ | 215,277 | 287,975 | 319,810 | 305,910 | 306,646 |
| Total value of manufactures (including £ repairs) | 975,937 | 1,047,131 | 1,114,652 | 1,156,239 | 1,217,171 |
| Harness, Saddlery, and Leatherware. | |||||
| Number of— | |||||
| Works | 61 | 73 | 71 | 77 | 76 |
| Hands employed | 424 | 391 | 440 | 459 | 434 |
| Amount of wages paid £ | 82,121 | 76,726 | 79,625 | 87,465 | 88,747 |
| Approximate value of— | |||||
| Land and buildings £ | 106,699 | 145,839 | 157,959 | 157,527 | 141,853 |
| Machinery and plant £ | 11,196 | 11,849 | 11,868 | 13,015 | 12,750 |
| Value of materials used £ | 150,471 | 131,378 | 102,724 | 125,946 | 128,550 |
| Total value of manufactures (including £ repairs) | 264,150 | 228,035 | 208,074 | 250,027 | 239,709 |
| Tanning, Fellmongery, and Wool-scouring. | |||||
| Number of— | |||||
| Works | 54 | 58 | 62 | 60 | 59 |
| Hands employed | 1,157 | 1,290 | 1,412 | 1,293 | 1,179 |
| Amount of— | |||||
| Wages paid £ | 254,294 | 268,976 | 288,317 | 272,502 | 251,766 |
| Horse-power H.p. | 2,696 | 2,805 ½ | 2,941 | 2,814 | 2,990 |
| Approximate value of— | |||||
| Land and buildings £ | 265,644 | 263,608 | 269,517 | 215,412 | 196,402 |
| Machinery and plant £ | 133,043 | 140,243 | 149,397 | 157,063 | 143,920 |
| Value of materials used £ | 2,792,869 | 1,117,667 | 1,786,571 | 2,042,321 | 2,340,456 |
| Materials operated upon— | |||||
| Sheep-skins No. | 2,960,271 | 2,696,105 | 2,033,203 | 1,342,753 | 1,051,034 |
| Greasy wool lb. | 24,723,532 | 16,120,780 | 31,658,889 | 26,280,448 | 26,426,159 |
| Hides, pelts, &c. No. | 557,232 | 803,660 | 890,163 | 571,748 | 828,322 |
| Bark used— | |||||
| New Zealand Tons | 210 ¼ | 146 ½ | 100 ¾ | 70 | 175 |
| Other Tons | 3,327 ½ | 2,799 ¾ | 3,078 ½ | 2,807 | 2,276 |
| Output— | |||||
| Scoured and sliped wool lb. | 26,884,735 | 21,405,074 | 29,033,929 | 24,397,358 | 20,947,091 |
| Pelts No. | 588,852 | 704,555 | 941,907 | 615,096 | 238,393 |
| Leather lb. | 5,688,470 | 4,622,081 | 4,502,455 | 5,219,713 | 3,929,551 |
| Basils lb. | 142,543 | 296,186 | 285,477 | 235,914 | 217,732 |
| Pickled pelts No. | 2,167,747 | 1,697,929 | 1,263,621 | 832,060 | 1,140,450 |
| Total value of manufactures and produce £ | 3,435,212 | 1,625,861 | 2,463,227 | 2,702,534 | 2,809,486 |
| Ship and Boat Building. | |||||
| Number of— | |||||
| Establishments | 27 | 29 | 30 | 30 | 30 |
| Hands employed | 926 | 806 | 678 | 798 | 892 |
| Amount of wages paid £ | 233,083 | 190,936 | 139,032 | 160,869 | 218,290 |
| Number of vessels built | 85 | 195 | 90 | 119 | 100 |
| Total value of manufactures and repairs £ | 459,748 | 381,695 | 280,272 | 325,187 | 390,051 |
| Sail, Tent, and Oilskin Making. | |||||
| Number of— | |||||
| Works | 33 | 34 | 34 | 32 | 32 |
| Hands employed | 289 | 227 | 186 | 203 | 206 |
| Amount of wages paid £ | 40,924 | 37,617 | 31,370 | 30,165 | 35,305 |
| Sails manufactured No. | 739 | 637 | 1,057 | 883 | 1,000 |
| Tents and flies manufactured No. | 9,110 | 7,340 | 8,747 | 13,045 | 12,358 |
| Oilskins manufactured No. | 32,615 | 10,110 | 6,596 | 10,987 | 14,576 |
| Horse and cow covers manufactured No. | 39,348 | 27,288 | 27,277 | 19,566 | 18,284 |
| Total value of all manufactures £ | 261,863 | 175,578 | 137,669 | 138,399 | 175,778 |
| Furniture-making Works. | |||||
| Number of— | |||||
| Factories | 225 | 253 | 269 | 271 | 286 |
| Hands employed | 2,149 | 2,226 | 2,002 | 2,042 | 2,337 |
| Amount of wages paid £ | 332,133 | 433,143 | 380,644 | 364,691 | 413,921 |
| Approximate value of— | |||||
| Land and buildings £ | 441,578 | 531,836 | 576,766 | 636,317 | 600,110 |
| Machinery and plant £ | 91,054 | 108,476 | 117,670 | 118,695 | 116,536 |
| Value of materials used £ | 458,652 | 586,405 | 436,304 | 421,930 | 562,759 |
| Total value of manufactures £ | 990,233 | 1,238,539 | 1,028,144 | 1,003,770 | 1,256,073 |
| Woollen-mills. | |||||
| Number of— | |||||
| Mills | 11 | 12 | 12 | 12 | 13 |
| Hands employed | 2,048 | 2,205 | 2,498 | 2,620 | 2,381 |
| Amount of— | |||||
| Wages paid £ | 287,109 | 333,281 | 364,105 | 396,436 | 381,886 |
| Horse-power H.p. | 3,315 | 3,788 | 3,766 | 4,298 | 5,190 |
| Approximate value of— | |||||
| Land and buildings £ | 238,986 | 258,177 | 249,370 | 262,766 | 334,219 |
| Machinery and plant £ | 263,058 | 353,143 | 420,716 | 437,229 | 593,171 |
| Scoured wool used— | |||||
| Quantity lb. | 4,014,286 | 4,902,059 | 4,438,993 | 4,951,670 | 3,985,060 |
| Value £ | 497,925 | 530,278 | 412,398 | 551,719 | 563,082 |
| Output— | |||||
| Tweed Yards | 1,444,955 | 1,647,551 | 1,604,478 ½ | 1,273,780 ½ | 909,448 |
| Flannel Yards | 845,968 | 778,139 | 1,379,711 | 1,526,579 | 1,173,663 |
| Blankets Pairs | 74,877 | 88,709 | 96,948 | 105,433 | 132,445 |
| Bugs and shawls No. | 24,351 | 23,667 | 42,483 | 52,149 | 55,712 |
| Yarn lb. | 366,104 | 384,069 | 589,179 ½ | 453,591 | 541,890 |
| Total value £ | 1,143,265 | 1,332,451 | 1,229,829 | 1,132,082 | 1,263,743 |
Commencing with 1918–19, special annual returns as to wages and employment have been collected. The information contained in the returns is reasonably accurate, and an attempt has therefore been made to present it in such a form as to depict as far as possible the position regarding employment and wages in the various industries. The information collected can be divided under three headings: (1) Wage rates and number of employees; (2) overtime; (3) short time.
The period covered by the returns in this case is the nearest normal week to 31st March in each year, and the data collected include the number of employees engaged at each wage rate, as well as the total employees and the total earnings during the specified week. Working proprietors, managers, overseers, accountants, and clerks do not come within the scope of the return, which covers productive employees only, and out-workers, if any. All productive employees of either sex are covered, irrespective of age, and the figures are therefore inclusive of many young male and female workers receiving low wages. The inclusion of these workers has had the effect of making the average earnings lower than they would otherwise have been, and this fact must not be overlooked when the figures are made use of.
A table is shown giving the figures for males, females, and both sexes over all industries for the last five collections. The figures for the five years covered have been adjusted by deducting certain industries which were included in some years 2nd not in others, with the result that they are now comparable.
The weekly wage-bill of the manufacturing industries in the Dominion shows substantial increases during the last five years. The figure for the last collection shows an increase of £19,288 over that taken in 1924, and each collection, with the exception of that in 1921–22, shows an increase over the preceding one. In 1921–22 the slump was responsible for the weekly wage-bill in March of that year falling approximately £600 below that for the corresponding week in the previous year.
The average earnings of male workers during the week covered in 1919–20 was. recorded as £4 1s. 11d., while the average for females in the same week was £1 14s. 3d. The collection of 1920–21 showed increases of 12s. 2d. in the average for males and 4s. 6d. in the case of females, the average earnings for males and females being in March, 1921, £4 14s. 1d. and £1 18s. 9d. respectively, the highest on record. In 1921–22 decreases of 4s. 8d. and 11d. were recorded for males and females respectively, while the next collection showed a further decrease of 3s. 10d. for males and an increase of 6d. for females. The average earnings for males and females in the 1924–25 collection were £4 8s. 7d. and £1 18s. 9d. respectively, which, compared with those for the 1919–20 collection, show increases of 6s. 8d., or 8 per cent., and 4s. 6d., or 13 per cent., respectively.
Not only have there been substantial changes in the average weekly earnings-over the period covered by the table, but there have also been movements in what may be called the standard wage rate—i.e., that received by the greatest number of employees. In 1919–20 employees who received between 80s. and 85s were numerically the most important, but in 1920–21 this group ranked only eighth, first position being occupied by those in receipt of from 95s. to 100s. The group “90s. to 95s.” came first in 1921–22, 1923–24, and 1924–25, but gave way to the “80s. to 85s.” group in 1922–23.
The following table shows for the nearest normal week to 31st March in the five years, 1921 to 1925, the number of employees engaged in all industries, classified according to wage rates, the total earnings during the week covered, and the averages earnings per employee. Separate figures are given for male and female employees.
| WAGE RATES OF EMPLOYEES IN MANUFACTURING INDUSTRIES, 1920–21 TO 1924–25. | ||||||||||||||||||||||||||||||
|---|---|---|---|---|---|---|---|---|---|---|---|---|---|---|---|---|---|---|---|---|---|---|---|---|---|---|---|---|---|---|
| Weekly Hate of Wages. | Males. | Females. | ||||||||||||||||||||||||||||
| 1920–21. | 1921–22. | 1922–23. | 1928–24. | 1924–25. | 1920–21. | 1921–22. | 1922–23. | 1923–24. | 1924–25. | |||||||||||||||||||||
| Under 20s. | 958 | 939 | 1,191 | 1,378 | 1,480 | 745 | 906 | 1,449 | 1,237 | 1,102 | ||||||||||||||||||||
| 20s. and under 25s. | 1,181 | 1,311 | 1,398 | 1,605 | 1,754 | 1,091 | 1,082 | 1,259 | 1,337 | 1,240 | ||||||||||||||||||||
| 25s. ,, 30s. | 1,027 | 1,085 | 1,304 | 1,275 | 1,397 | 1,017 | 1,207 | 1,318 | 1,246 | 1,288 | ||||||||||||||||||||
| 30s. ,, 35s. | 1,027 | 1,226 | 1,372 | 1,375 | 1,555 | 1,196 | 1,318 | 1,361 | 1,249 | 1,177 | ||||||||||||||||||||
| 35s. ,, 40s. | 547 | 733 | 841 | 854 | 1,007 | 888 | 917 | 885 | 934 | 810 | ||||||||||||||||||||
| 40s. ,, 45s. | 798 | 891 | 987 | 963 | 1,234 | 1,616 | 1,048 | 1,955 | 1,915 | 1,951 | ||||||||||||||||||||
| 45s. ,, 50s. | 479 | 577 | 704 | 792 | 1,044 | 1,387 | 2,050 | 1,565 | 1,486 | 1,217 | ||||||||||||||||||||
| 50s. ,, 55s. | 582 | 568 | 665 | 685 | 761 | 1,058 | 1,059 | 1,034 | 1,117 | 788 | ||||||||||||||||||||
| 55s. ,, 60s. | 310 | 388 | 390 | 453 | 415 | 536 | 457 | 437 | 491 | 622 | ||||||||||||||||||||
| 60s. ,, 65s. | 739 | 960 | 1,036 | 916 | 945 | 441 | 385 | 414 | 375 | 390 | ||||||||||||||||||||
| 65s. ,, 70s. | 509 | 508 | 780 | 662 | 620 | 191 | 146 | 155 | 165 | 122 | ||||||||||||||||||||
| 70s. ,, 75s. | 896 | 1,020 | 1,556 | 1,022 | 944 | 94 | 94 | 89 | 105 | 116 | ||||||||||||||||||||
| 75s. ,, 80s. | 1,358 | 1,518 | 3,263 | 3,563 | 1,961 | 48 | 35 | 40 | 43 | 372 | ||||||||||||||||||||
| 80s. ,, 85s. | 3,089 | 3,244 | 6,433 | 5,871 | 4,733 | 53 | 51 | 62 | 51 | 176 | ||||||||||||||||||||
| 85s. ,, 90s. | 3,707 | 5,325 | 4,601 | 4,805 | 6,317 | 23 | 11 | 26 | 15 | 84 | ||||||||||||||||||||
| 90s. ,, 95s. | 4,992 | 6,127 | 6,302 | 7,050 | 5,191 | 21 | 25 | 22 | 23 | 78 | ||||||||||||||||||||
| 95s. ,, 100s. | 5,445 | 4,296 | 4,988 | 5,094 | 6,329 | 44 | 8 | 11 | 4 | 65 | ||||||||||||||||||||
| 100s. ,, 105s. | 4,905 | 5,272 | 4,482 | 4,800 | 5,023 | 11 | 13 | 24 | 15 | 63 | ||||||||||||||||||||
| 105s. ,, 110s. | 3,685 | 3,627 | 3,145 | 3,085 | 3,719 | 3 | 9 | 9 | 2 | 13 | ||||||||||||||||||||
| 110s. ,, 115s. | 3,405 | 2,905 | 2,274 | 2,533 | 3,070 | 3 | 4 | 5 | 6 | 21 | ||||||||||||||||||||
| 115s. ,, 120s. | 1,099 | 1,254 | 969 | 783 | 1,131 | 1 | 6 | 2 | .. | 2 | ||||||||||||||||||||
| 120s. ,, 130s. | 3,303 | 2,779 | 2,168 | 2,489 | 3,241 | 3 | 9 | 5 | 2 | 15 | ||||||||||||||||||||
| 130s. ,, 140s. | 1,291 | 891 | 918 | 948 | 1,302 | 2 | .. | .. | .. | 20 | ||||||||||||||||||||
| 140s. ,, 160s. | 864 | 993 | 844 | 1,007 | 1,178 | 1 | .. | 2 | 1 | 13 | ||||||||||||||||||||
| 160s. and over | 784 | 798 | 510 | 649 | 928 | 4 | 1 | 1 | 1 | 7 | ||||||||||||||||||||
| £ | s. | d. | £ | s. | d. | £ | s. | d. | £ | s. | d. | £ | s. | d. | £ | s. | d. | £ | s. | d. | £ | s. | d. | £ | s. | d. | £ | s. | d. | |
| Earnings during specified week | 221,031 | 12 | 7 | 220,036 | 8 | 5 | 227,210 | 8 | 1 | 235,116 | 13 | 4 | 253,601 | 18 | 7 | 20,298 | 17 | 9 | 20,518 | 1 | 10 | 22,622 | 5 | 3 | 21,975 | 8 | 3 | 22,778 | 5 | 11 |
| Average earnings during week | 4 | 14 | 1 | 4 | 9 | 5 | 4 | 5 | 7 | 4 | 6 | 0 | 4 | 8 | 7 | 1 | 18 | 9 | 1 | 17 | 10 | 1 | 17 | 4 | 1 | 17 | 2 | 1 | 18 | 9 |
| Number of employees | 46,980 | 49,235 | 53,071 | 54,652 | 57,279 | 10,477 | 10,841 | 12,130 | 11,820 | 11,752 | ||||||||||||||||||||
As the information collected in respect of overtime does not entail the keeping of special statistical books in each establishment, but can be readily ascertained from the records kept in the wages-books, the information contained in the table given below may be accepted as being fairly accurate. Although data relating to overtime have been collected since the inception of the “Special Returns as to Wages and Employment,” the figures have been published only since 1922–23.
That many of our industries are not fully manned is clearly indicated by the figures in respect of overtime. During the year ended 31st March, 1925, no less than 1,874,002 hours' overtime was worked in all industries furnishing returns, the efforts-of male workers accounting for 1,720,798 hours, against 153,204 hours for females. Compared with similar figures for the previous year the foregoing figures represent increases of 137,311, 84,749, and 52,562 hours respectively. Of course, all employees are not actually affected by overtime, and out of the total of 57,279 males and 11,752 females engaged in all industries, 5,612 of the former and 1,769 of the latter were on the average directly concerned with overtime each week, the males working on the average 6.49 hours per week and the females 6.00 hours.
An average over all the employees engaged in all industries discloses the fact that if overtime were distributed evenly among all employees, each male worker would do 30.04 hours and each female worker 1304 hours per year. Again, if all establishments worked overtime each would be occupied for 6.52 weeks in excess of their ordinary time.
The table given hereunder shows particulars in respect of the overtime worked in the various industries during the year 1924–25:—
| Industry. | Number of Hours Overtime worked during Year. | Average Number of Weeks per Establishment during which Overtime worked. | Average Number of Hours per Employee affected per Week. | Average Number of Hours' Overtime during Year for all Employees, whether working Overtime or not. | |||
|---|---|---|---|---|---|---|---|
| M. | F. | M. | F. | M. | F. | ||
| Aerated waters | 7,973 | 60 | 3.53 | 4.87 | 4.00 | 17.60 | 4.29 |
| Agricultural machinery | 5,752 | .. | 4.81 | 6.71 | .. | 10.77 | .. |
| Bag and sack | 96 | 480 | 6.75 | 3.00 | 5.00 | 7.38 | 12.31 |
| Billiard-tables | 204 | .. | 4.25 | 6.00 | .. | 6.80 | .. |
| Biscuits and confectionery | 15,930 | 13,270 | 5.01 | 6.06 | 5.79 | 15.76 | 12.26 |
| Blindmaking | .. | 562 | 8.50 | .. | 5.20 | .. | 46.83 |
| Boiling-down and manure | 7,068 | .. | 8.90 | 5.77 | .. | 34.99 | .. |
| Boots and shoes | 5,136 | 2,419 | 4.14 | 5.98 | 4.61 | 413 | 2.91 |
| Brewing and malting | 37,614 | .. | 19.98 | 4.94 | .. | 47.37 | .. |
| Brick, tile, and pottery | 9,447 | .. | 6.32 | 6.12 | .. | 7.95 | .. |
| Brush and broom | 30 | .. | 0.20 | 5.00 | .. | 0.24 | .. |
| Butter and cheese | 36,107 | .. | 1.45 | 8.30 | .. | 12.91 | .. |
| Chemicals | 10,889 | 520 | 11.05 | 6.31 | 5.00 | 27.43 | 8.39 |
| Clothing | 13,838 | 81,396 | 6.47 | 7.42 | 7.39 | 17.74 | 14.57 |
| Coachbuilding | 25,086 | .. | 4.98 | 6.09 | .. | 19.72 | .. |
| Coffee and spice | 450 | 2,726 | 6.14 | 6.00 | 5.56 | 10.00 | 64.90 |
| Cooperages, packing-case, &c. | 3,840 | .. | 2.58 | 5.56 | .. | 19.59 | .. |
| Electric current | 37,269 | .. | 8.81 | 4.71 | .. | 21.99 | .. |
| Electrical engineering | 9.327 | .. | 5.00 | 10.71 | .. | 44.84 | .. |
| Electric tramways | 354,640 | .. | 34.70 | 4.61 | .. | 124.74 | .. |
| Engineering (general) | 85,300 | .. | 11.89 | 6.19 | .. | 26.48 | .. |
| Engraving | 795 | .. | 9.42 | 3.63 | .. | 12.82 | .. |
| Fibrous plaster and concrete | 12,026 | .. | 5.62 | 4.96 | .. | 32.33 | .. |
| Fish-curing | 348 | .. | 322 | 4.00 | .. | 4.70 | .. |
| Flax-milling | 6,791 | .. | 1.48 | 6.96 | .. | 5.32 | .. |
| Fruit-preserving and jam | 9,190 | 3,131 | 12.86 | 6.99 | 14.73 | 61.27 | 29.82 |
| Furniture and cabinetmaking | 10,480 | 640 | 1.94 | 6.16 | 4.96 | 5.16 | 3.92 |
| Gas-manufacture | 16,495 | .. | 11.93 | 2.91 | .. | 11.67 | .. |
| Grain-crushing | 180 | .. | 0.66 | 10.00 | .. | 2.77 | .. |
| Grain-milling | 12,257 | .. | 7.71 | 4.98 | .. | 25.64 | .. |
| Ham and bacon curing | 41,318 | .. | 7.35 | 6.51 | .. | 85.90 | .. |
| Hosiery | .. | 2,130 | 500 | .. | 5.45 | .. | 7.42 |
| Iron and brass foundries | 31,754 | .. | 5.25 | 8.28 | .. | 41.51 | .. |
| Leadlight-manufacture | 4,377 | .. | 6.16 | 6.83 | .. | 14.89 | .. |
| Leather goods | 1,328 | 924 | 2.25 | 4.73 | 4.67 | 9.35 | 10.87 |
| Lime and cement | 82,740 | .. | 6.43 | 10.47 | .. | 109.01 | .. |
| Mattress and bedding | 13,099 | 6,259 | 21.27 | 7.89 | 7.03 | 84.51 | 48.89 |
| Meat freezing and preserving | 426,521 | .. | 13.24 | 8.43 | .. | 64.69 | .. |
| Motor and cycle | 52,881 | .. | 11.03 | 3.49 | .. | 21.37 | .. |
| Paint and varnish | 348 | 160 | 4.12 | 4.50 | 6.33 | 6.21 | 40.00 |
| Paper bag and box | 4,930 | 3,609 | 11.00 | 6.10 | 4.09 | 69.44 | 16.94 |
| Perambulators and baskets | 2,967 | 288 | 4.13 | 7.31 | 5.33 | 13.49 | 8.00 |
| Picture-framing | 329 | 12 | 4.53 | 3.67 | 3.00 | 914 | 3.00 |
| Printing and publishing | 145,234 | 22,375 | 17.89 | 4.43 | 4.30 | 38.43 | 19.61 |
| Proprietary medicines | 3,852 | 424 | 5.40 | 5.42 | 6.91 | 36.00 | 6.24 |
| Rope and twine | 7,890 | 252 | 20.17 | 4.73 | 9.00 | 41.97 | 10.94 |
| Saddlery and harness | 2,095 | 150 | 1.43 | 6.11 | 10.00 | 7.88 | 3.49 |
| Sail, tent, and oilskin | 1,828 | 228 | 2.74 | 7.00 | 3.48 | 21.26 | 3.93 |
| Sauce, pickle, and vinegar | 3,590 | 776 | 6.17 | 5.44 | 7.33 | 33.24 | 10.08 |
| Sausage-casings | 25,364 | .. | 6.73 | 13.42 | .. | 78.77 | .. |
| Sawmilling, &c. | 42,262 | .. | 1.57 | 8.69 | .. | 5.04 | .. |
| Ship and boat building | 31,333 | .. | 11.24 | 9.42 | .. | 39.46 | .. |
| Soap and candle | 4,585 | 348 | 11.73 | 3.90 | 6.00 | 15.54 | 4.97 |
| Tanning | 5,064 | .. | 7.24 | 5.00 | .. | 1013 | .. |
| Tinware and sheet-metal | 20,308 | 1,019 | 4.70 | 5.81 | 7.00 | 18.26 | 21.23 |
| Tobacco and cigarette-making | 1,530 | 900 | 20.25 | 6.00 | 3.00 | 30600 | 11.79 |
| Watch and jewellery | 2,082 | .. | 2.32 | 12.00 | .. | 11.89 | .. |
| Wirework | 4,261 | .. | 6.32 | 9.92 | .. | 28.59 | .. |
| Woodware and turnery | 4,836 | .. | 1.76 | 5.45 | .. | 4.41 | .. |
| Woollen-milling | 1,842 | 8,146 | 27.08 | 3.79 | 4.35 | 1.42 | 8.16 |
| Woolscouring and fellmongery | 12,630 | .. | 8.00 | 6.53 | .. | 26.82 | .. |
| Miscellaneous | 1,110 | .. | 2.00 | 8.71 | .. | 22.65 | .. |
| Industries for which the number of returns received was less than four | 1,952 | .. | 3.94 | 602 | .. | 3.25 | .. |
| Totals | 1,720,798 | 153,204 | 6.52 | 6.49 | 6.00 | 30.04 | 13.04 |
Industries in which overtime was not worked at all during the year are omitted from the table, but are included in the totals on which the general averages are based.
Information regarding time lost in factories has been collected for some years, but prior to 1923–24 it was found to be so unsatisfactory as not to warrant publication. The difficulties militating against the collection of satisfactory information on the question have now been overcome to an appreciable extent by the issue of more explicit instructions bearing on the matter, with the result that reasonably accurate information is now available on this important phase of the Dominion's industrial life.
For statistical purposes short-time is deemed to be time lost through machinery, tools, &c. being out of order, lack of materials, adverse market conditions, cessation of work due to weather conditions, and other cognate causes. Time lost through holidays (annual, ordinary, or public holidays) and sickness, however, is not counted as short-time. Information as to how much short-time can be attributed to each cause is, unfortunately, not available, and it is therefore impossible to form any definite conclusions as to the extent to which unavoidable circumstances are responsible. It is interesting, however, to note that the sawmilling, flax-milling, wool-scouring and fellmongering, and brick and tile industries, where many employees work exposed to the weather conditions, account altogether for nearly 33 per cent. of the total hours of short-time; also the figures for the woollen-milling, clothing, and boot and shoe industries reflect only too well the depressions which were experienced in these industries during the year.
Altogether 886,236 hours short-time were recorded during the year, or, in other words, it would take 400 men working 44 hours a week a whole year to make up the deficiency in time. Male employees suffered in the aggregate 724,686 hours, against 161,550 hours for females. These figures represent very substantial increases over those for the previous year, being increases of 131,685 and 95,331 respectively. As in the case of overtime, short-time does not affect all employees, and out of the total employees (57,279 males, 11,752 females) only 4,361 males and 1,219 females were directly affected during the whole year. Although comparatively few employees were directly affected by short time, it would appear that those who were affected suffered considerably, the average number of hours per employee affected per week being 12.63 hours in the case of males and considerably more (14.26 hours) in the case of females. Averages taken over the total establishments and employees and the total hours short-time for the year disclose the fact that if the short-time were evenly distributed each male worker would have lost 12.7 hours, each female worker 13.8 hours, and each establishment 1.4 weeks in the year.
The substantial increase in the average short-time per female worker appears to be due principally to an alarming increase in the aggregate short time in the woollen-milling and clothing industries.
Subjoined is a table showing particulars in respect of the short-time suffered in the various industries during the year 1924–25:—
| Industry. | Number of Hours Short-time worked drying Year. | Average Number of Weeks per Establishment during which Short-time worked. | Average Number of Hours per Employee affected per Week. | Average Number of Hours Short-time during Year for all Employees, whether working Short-time or not. | |||
|---|---|---|---|---|---|---|---|
| M. | F. | M. | F. | M. | F. | ||
| Aerated waters | 60 | .. | 0.09 | 300 | 0.13 | .. | |
| Agricultural machinery | 3,410 | .. | 3.56 | 4.74 | 6.39 | .. | |
| Bag and sack | .. | 696 | 7.25 | .. | 8.00 | 17.85 | |
| Billiard-tables | 954 | .. | 18.25 | 8.66 | 31.80 | .. | |
| Biscuits and confectionery | 1,648 | 5,773 | 0.66 | 27.14 | 25.62 | 1.63 | 5.34 |
| Boiling-down and manure | 1,816 | .. | 2.07 | 24.67 | 8.99 | .. | |
| Boots and shoes | 25,888 | 7,215 | 7.68 | 9.94 | 10.29 | 20.83 | 8.68 |
| Brewing and malting | 321 | .. | 0.07 | 21.44 | 0.40 | .. | |
| Brick, tile, and pottery | 7,489 | .. | 1.91 | 4.69 | 6.30 | .. | |
| Brush and broom | 4,492 | 248 | 6.90 | 18.96 | 4.00 | 36.52 | 4.77 |
| Butter and cheese | 1,680 | .. | 0.10 | 6.00 | .. | 0.60 | .. |
| Clothing | 11,423 | 79,330 | 347 | 20.30 | 15.79 | 14.64 | 14.20 |
| Coachbuilding | 3,588 | .. | 1.44 | 4.70 | .. | 2.82 | .. |
| Electric current | .360 | .. | 0.29 | 4.00 | .. | 0.21 | .. |
| Engineering (general) | 4,615 | .. | 0.59 | 7.18 | .. | 1.43 | .. |
| Fibrous plaster and concrete | 5,424 | .. | 1.90 | 11.20 | .. | 14.58 | .. |
| Flax-milling | 35,137 | .. | 3.71 | 12.88 | .. | 27.52 | .. |
| Furniture and cabinetmaking | 268 | 450 | 0.23 | 20.00 | 9.00 | 6.13 | 2.76 |
| Gas-manufacture | 3,120 | .. | 1.16 | 4.00 | .. | 2.21 | .. |
| Grain-milling | 6,138 | .. | 1.33 | 37.67 | .. | 12.84 | .. |
| Ham and bacon curing | 5,442 | .. | 0.62 | 3.26 | .. | 11.31 | .. |
| Hosiery | .. | 2,400 | 1.55 | .. | 6.75 | 8.36 | |
| Iron and brass foundries | 6,768 | .. | 0.92 | 6.00 | .. | 8.85 | .. |
| Industry. | Number of Hours Short-time worked during Year. | Average Number of Weeks per Establishment during which Short-time worked. | Average Number of Hours per Employee affected per Week. | Average Number of Hours Short-time during Year for all Employees, whether working Short-time or not. | |||
|---|---|---|---|---|---|---|---|
| M. | F. | M. | F. | M. | F. | ||
| Leadlight-manufacture | 16 | .. | 0.08 | 4.00 | .. | 0.05 | .. |
| Leather goods | 6 | 45 | 0.21 | 3.00 | 300 | 0.04 | 0.53 |
| Lime and cement | 4,182 | .. | 3.36 | 34.50 | .. | 5.51 | .. |
| Meat freezing and preserving | 304,283 | .. | 8.24 | 10.81 | .. | 46.15 | .. |
| Motor and cycle | 3,488 | .. | 0.67 | 900 | .. | 141 | .. |
| Paper bag and box | .. | 2,142 | 0.89 | .. | 27.00 | .. | 10.06 |
| Perambulators and baskets | 1,383 | 14 | 1.30 | 24.27 | 3.50 | 6.29 | 0.39 |
| Picture-framing | 63 | .. | 1.06 | 3.50 | .. | 1.75 | .. |
| Printing and publishing | .. | 2,309 | 0.88 | 7.56 | 16.12 | 0.40 | 2.02 |
| Proprietary medicines | 1,282 | 3,914 | 5.47 | 29.50 | 2144 | 11.98 | 57.56 |
| Rope and twine | 8 | .. | 0.33 | 2.00 | .. | 0.04 | .. |
| Sail, tent, and oilskin | 9 | .. | 0.10 | 3.00 | .. | 0.10 | .. |
| Sausage-casings | 2,520 | .. | 0.80 | 14.00 | .. | 7.83 | .. |
| Sawmilling, &c. | 191,409 | .. | 2.58 | 16.01 | .. | 22.82 | .. |
| Ship and boat building | 1,764 | .. | 0.97 | 10.50 | .. | 2.22 | .. |
| Tanning | 268 | .. | 0.12 | 48.00 | .. | 0.54 | .. |
| Tinware and sheet-metal | 1,028 | .. | 0.05 | 33.80 | .. | 0.92 | .. |
| Wirework | 1,664 | .. | 2.74 | 4.00 | .. | 11.17 | .. |
| Woodware and turnery | 424 | .. | 0.09 | 6.73 | .. | 0.39 | .. |
| Woollen-milling | 70,897 | 55,124 | 23.15 | 13.76 | 10.57 | 54.79 | 55.23 |
| Woolscouring and fellmongery | 8,097 | .. | 2.71 | 7.40 | .. | 17.19 | .. |
| Industries for which the number of returns received was less than four | 312 | 1,890 | 0.78 | 34.00 | 10.00 | 0.52 | 10.50 |
| Miscellaneous | 14 | .. | 0.11 | 7.00 | .. | 0.29 | .. |
| Totals | 724,686 | 161,550 | 1.35 | 12.63 | 14.26 | 12.65 | 13.75 |
Table of Contents
ALTHOUGH abundant water-power is available throughout New Zealand, comparatively little use had been made of it before 1900, but since then the development has been extensive, and promises to be still more extensive in the early future. In 1903 water-power to the extent of 9,911 horse-power was actually in use. By 1913 this amount had risen to 34,956 horse-power, and by 1926 to 113,055 ¼. The increase of 42,911 ¾ horse-power in use in 1925–26 over the year 1924–25 is due mainly to the Mangahao supply becoming available, the hydro-electric horse-power in use in the Wellington District actually increasing from 1,301 in 1924–25 to 34,329 in 1925–26. The extension of the Waipori scheme in Otago was responsible for most of the remainder of the total increase.
The Public Works Act, 1908, vests the sole right to use the water-power of the Dominion in His Majesty, subject to any existing rights, and gives the Government the right to develop such power, or to delegate such power to any local authority, or, outside a mining district, to any person or company, subject to conditions. Advantage has been taken of this in several cases, the right in the case of local authorities being issued subject to a royalty of 1s. per year per kilowatt of maximum output, and in the case of private concerns developing water-power for electrical distribution, subject to a royalty of 4s. per year per kilowatt of maximum output
The following table shows the hydro-electric horse-power actually in use in the various districts at the 31st March in each of the last five years:—
| District, | 1921–22. | 1922–23. | 1923–24. | 1924–25. | 1925–26. |
|---|---|---|---|---|---|
| H.P | H.P. | H.P. | H.P. | H.P. | |
| Auckland North | 2,747 | 2,747 | 2,747 | 2,967 | 2,786 |
| Auckland | 5,646 ½ | 5,968 ½ | 6,028 ½ | 5,921 ½ | 5,369 |
| Auckland South | 9,517 | 9,487 | 9,523 | 10,147 ½ | 13,599 ½ |
| Gisborne | .. | 1,250 | 1,250 | 1,262 | 1,262 |
| Hawke's Bay | 137 | 109 | 379 | 322 ¾ | 372 |
| Taranaki North | 2,767 ½ | 2,973 ½ | 3,437 ½ | 4,453 | 5,939 |
| Taranaki | 1,452 | 1,935 ½ | 1,988 ½ | 1,557 ½ | 1,707 ½ |
| Wellington North | 565 | 573 | 570 | 566 | 566 |
| Wellington | 260 | 392 | 1,584 ½ | 1,491 | 34,503 ½ |
| Nelson | 240 ¼ | 231 ½ | 194 ½ | 323 ½ | 350 ½ |
| Westland | 4,096 | 2,479 | 2,745 | 2,170 | 2,363 ½ |
| Canterbury | 16,074 | 13,562 | 13,562 | 16,006 | 16,006 |
| Canterbury South | 149 | 147 | 206 | 206 | 213 |
| Otago | 10,478½ | 10,463 ½ | 10,827 ½ | 12,492 | 17,128 |
| Southland | 1,956 ¾ | 1,925 ¾ | 3,643 ¾ | 10,257 ¾ | 10,889 ¾ |
| Totals | 56,086 ½ | 54,244 ¼ | 53,686 ¾ | 70,143 ½ | 113,055 ¼ |
The following table gives the analysis of the purposes for which water-power was employed as at the 31st March, 1926:—
| WATER-POWER IN USE AT THE 31ST MARCH, 1926. | |||||||||||
|---|---|---|---|---|---|---|---|---|---|---|---|
| District. | Mining. | Electric Supply. | Flax-mills. | Sawmills. | Flour-mills. | Dairying. | Construction-works. | Freezing-works. | Paper-mills. | Miscellaneous. | Total. |
| Auckland North | .. | 2,680 | .. | .. | .. | 24 | .. | 75 | .. | 7 | 2,786 |
| Auckland | 2,227 | 1,625 | 10 | 37 | .. | 21 | 94 | 10 | .. | 1,345 | 5,369 |
| Auckland South | .. | 13,458 | 30 | .. | .. | 74 ½ | .. | .. | .. | 37 | 13,5994 |
| Gisborne | .. | 1,250 | .. | .. | .. | .. | .. | .. | .. | 12 | 1,262 |
| Hawke's Bay | .. | 348 | .. | .. | .. | 24 | .. | .. | .. | .. | 372 |
| Taranaki North | .. | 5,160 | .. | .. | 24 | 679 | .. | 10 | .. | 66 | 5,939 |
| Taranaki | .. | 1,135 | .. | .. | .. | 371 | .. | .. | .. | 2014 | 1,7074 |
| Wellington North | .. | 555 | .. | .. | .. | 11 | .. | .. | .. | .. | 566 |
| Wellington | .. | 34,329 | .. | 18 | .. | 50 | .. | .. | .. | 106 ½ | 34,5034 |
| Nelson | 115 | 51 | 71 | 47 | .. | 21 ½ | .. | .. | .. | 45 | 3504 |
| Westland | 2654 | 1,807 | 38 | 155 | .. | 10 | .. | .. | .. | 88 | 2,3634 |
| Canterbury | .. | 15,818 | 27 | .. | 109 | 9 | .. | .. | .. | 43 | 16,006 |
| Canterbury South | .. | 124 | 30 | .. | 44 | .. | .. | .. | .. | 15 | 213 |
| Otago | 24 | 16,877 | 7 | 12 | 82 | .. | .. | .. | .. | 126 | 17,128 |
| Southland | 78 | 7,688 | 36 | 5 | 69 | 17 | .. | 1,200 | 450 | 1,346 ¾ | 10,889 ¾ |
| Totals | 2,709 ½ | 102,905 | 249 | 274 | 328 | 1,312 | 94 | 1,295 | 450 | 3,438 ¾ | 113,055 ¼ |
The following table gives details of the chief hydro-electric installations from which power is distributed for public supply.
| Locality. | Supply Authority. | Power Installed. | Max. Load, Kw., Year ended 31st March, 1926. | Route-miles of Transmission-lines. | Voltage of Transmission. | |
|---|---|---|---|---|---|---|
| Water. | Total. | |||||
* Diesel auxiliary. † Gas auxiliary. ‡ Steam auxiliary. § lake Coleridge plant. ∥ Overload ¶ Walpori plant. ** Monowai. | ||||||
| H.P. | Kw. | |||||
| Wairua Falls | Wilsons (N.Z.) Cement Co. | 3,250 | 2,500 | 2,200 | 31 | 22,000 |
| Horahora | Public Works Department | 17,000 | 12,875 | 11,860 | 278 | 50,000 |
| Tauranga | Borough Council | 5,600 | 4,300 | 2,564 | 70 | 11,000 |
| Rotorua* | Tourist Department | 380 | 350 | 293 | 36 | 6,600 |
| Whakatane | Borough Council | 300 | 240 | 145 | 31 | 22,000 |
| Waikaremoana | Power Board | 1,000 | 700 | 744 | 67 | 11,000 |
| Havelock North | Town Board | 200 | 176 | 120 | 17 | 3,300 |
| New Plymouth | Borough Council | 4,500 | 3,500 | 1,600 | 295 | 6,600 |
| Stratford* | ,, | 120 | 280 | 232 | 25 | 2,200 |
| Kaponga | Town Board | 196 | 130 | 90 | 36 | 3,300 |
| Opunake | Power Board | 450 | 320 | 275 | 146 | 6,600 |
| Hawera* | Electric Light Company | 900 | 625 | 522 | 77 | 5,500 |
| Patea† | Borough Council | 120 | 135 | 83 | 13 | 3,000 |
| Waverley | Town Board | 60 | 40 | 17 | 6 | 2,300 |
| Taumarunui | Borough Council | 600 | 425 | 400 | 15 | 3,300 |
| Ohakune* | ,, | 220 | 120 | 91 | 18 | 2,400 |
| Raetihi | ,, | 600 | 470 | 137 | 28 | 3,000 |
| Taihape† | ,, | 200 | 150 | 166£ | 10 | 460 |
| Mangaweka | Town Board | 60 | 40 | 37 | 7 | 2,300 |
| Wairarapa | Power Board | 1,500 | 837 | 683 | 294 | 11,000 |
| Mangahao | Public Works Department | 24,000 | 18,000 | 13,960 | 353 | 110,000 |
| Brightwater† | Waimea Electric Company | 140 | 100 | 90 | 33 | 2,500 |
| Murchison | County Council | 140 | 100 | 93 | 19 | 3,300 |
| Reefton | Electric Supply Company | 90 | 80 | 65 | 9 | 230 |
| Lake Kanieri‡ | Company | 1,100 | 700 | 630 | 18 | 11,000 |
| Canterbury§ | Public Works Department | 26,000 | 19,500 | 14,430 | 476 | 66,000 |
| Fairlie | County Council | 50 | 40 | 25 | 6 | 400 |
| Waitaki† | Power Board | 700 | 510 | 330 | 38 | 3,000 |
| Dunedin¶ | City Council | 15,000 | 11,000 | 9,400 | 446 | 35,000 |
| Gore | Borough Council | 320 | 240 | 220 | 8 | 11,000 |
| Mataura | ,, | 100 | 75 | 55 | 25 | 440 |
| Queenstown | ,, | 115 | 60 | 40 | 4 | 3,300 |
| Southland** | Power Board | 5,500 | 4,000 | 2,450 | 2,322 | 66,000 |
Of the thirty-three stations mentioned, twenty-four are operated by local authorities, four by the State, and five by private companies.
The Aid to Water-power Works Act of 1910 empowered the State to establish hydro-electric-supply installations, and the first—at Lake Coleridge, sixty-five miles west of Christchurch—has been in operation for eleven years. This plant was originally designed for a total capacity of 12,000 kilowatts (16,000 horse-power), but natural features of the lake and adjacent rivers allow of a very large extension of the supply up to 36,000 h.p. During March, 1921, the Harper River was diverted into the lake, and the level of the water in the lake has been appreciably raised thereby.
The 66,000-volt transmission-line is constructed in triplicate to Christchurch, thus ensuring continuity of supply, two lines having a capacity of 12,000 kw. each, and the other a capacity of 5,000 kw. The present installed plant capacity is 26,000 h.p., and a second tunnel, approximately 111 chains in length, has been completed. Two new pipe-lines have been completed, the total number of pipe-lines now being six; contracts have been let for two 12,650 h.p. turbines, two 7,500 kw. generators, and the necessary switch-gear. The additional plant capacity of 15,000 kw. will be available within the next few months, thus raising the total plant capacity to 27,000 kw. The population being served is over 210,000, and a largo demand for power is being made. The capital outlay to the 31st March, 1926, was £1,366,951, the total revenue for the year 1925–26 was £123,355, and after payment of all charges, including interest and depreciation, an excess of £26,646 was shown. The accumulated deficiency of £17,738 on the Profit and Loss Account has been wiped out, and £8,907 paid to the credit of Sinking Fund Account. The power-house maximum output was 14,430 kw., representing an overload of approximately 20 per cent. on the present capacity of the plant—viz., 12,000 kw.
In addition to the transmission-lines to Christchurch a single-circuit transmission-line is in operation, supplying the towns of Ashburton and Timaru, at which places the voltage is stepped down for local reticulation. Work on the erection of a second transmission-line to Timaru and an extension to Oamaru is now in progress.
The standard rate of sale by the Public Works Department to local authorities and wholesale consumers is £10 per kv.a. year for the first 200 kv.a., and £8 per kv.a. year for all over 200 kv.a. and up to 4,800 kv.a. For contracts exceeding 5,000 kv.a. the rate is £7 per kv.a. year, and exceeding 20,000 kv.a. £5 5s. per kv.a. year.
The growth of the supply and the general financial results for each of the last five years are as follow:—
| — | Seventh Year (ended March, 1922). | Eighth Year (ended March, 1923). | Ninth Year (ended March, 1924). | Tenth Year (ended March, 1925). | Eleventh Year (ended March, 1926). |
|---|---|---|---|---|---|
| Capital outlay | £671,608 | £848,033 | £892,801 | £1,008,491 | £1,366,951 |
| Working-costs | £25,911 | £19,271 | £20,777 | £23,270 | £27,035 |
| Interest | £20,981 | £35,275 | £44,444 | £47,780 | £50,324 |
| Depreciation | £8,424 | £9,307 | £12,584 | £15,679 | £19,350 |
| Total costs | £55,316 | 263,853 | £77,805 | £86,729 | £96,709 |
| Total revenue | £56,814 | £69,153 | £78,508 | £92,163 | £123,355 |
| Maximum load, kw.— | |||||
| Power-house | 7,600 | 9,390 | 10,800 | 13,180 | 14,430 |
| Substations | 6,720 | 8,420 | 9,490 | 11,190 | 13,583 |
| Units output— | |||||
| Power-house | 37,929,750 | 43,451,660 | 48,777,886 | 56,935,840 | 63,860,614 |
| Substation | 33,947,100 | 39,665,420 | 45,778,007 | 53,261,142 | 61,167,881 |
| Total units sold | 32,943,934 | 37,561,627 | 43,792,372 | 51,287,033 | 60,952,889 |
| Average weekly load factor, per cent.— | |||||
| Power-house | 62.9 | 53.5 | 53.0 | 1.8 | 54.8 |
| Substation | 62.0 | 53.6 | 54.3 | 50.8 | 54.0 |
| Working-cost per unit sold | 0.188d. | 0.123d. | 0.113d. | 0.109d. | 0.106d. |
| Capital charge per unit sold | 0.214d. | 0.284d. | 0.313d. | 0297d. | 0.274d. |
| Total cost per unit sold | 0.403d. | 0.408d. | 0426d. | 0.406d. | 0.381d. |
| Revenue per unit sold | 0.414d. | 0.441d. | 0.430d. | 0.481d. | 0486d. |
| Total cost per kw. substation maximum | £8.23 | £7.58 | £8.20 | £7.75 | £7.12 |
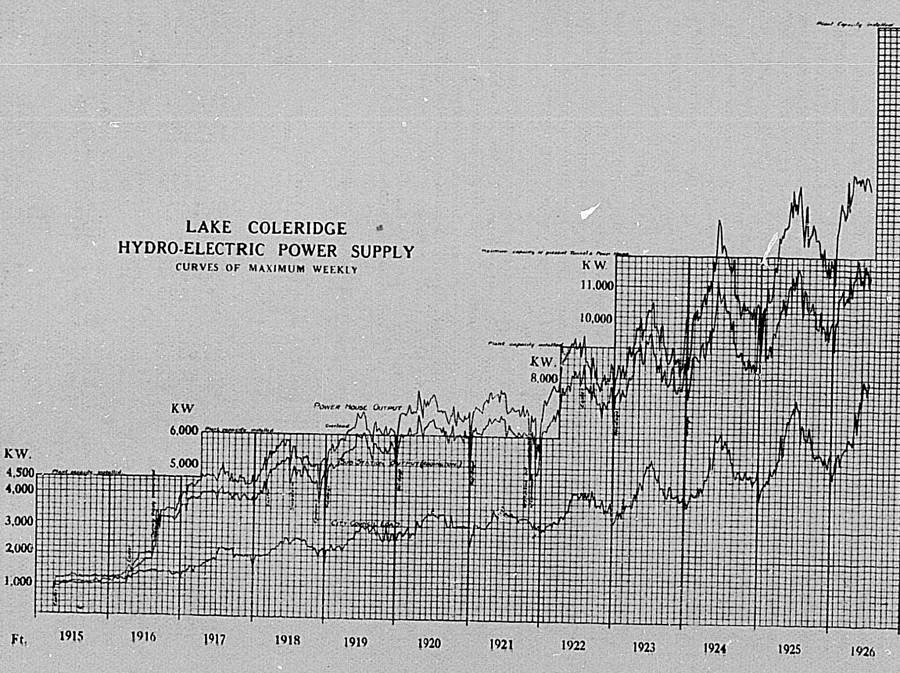
In November, 1920, the Waihi Gold-mining Company's electric-power plant at Horahora was acquired by the State for £212,500. The necessary transmission-lines have since been erected, and the plant has been extended. The capital account to the 31st March, 1926, stands at £735,091, which includes £174,026 out of Arapuni moneys brought into operation in connection with Horahora scheme.
The main features of the plant acquired are the headworks and generating station on the Waikato River at Horahora, seventeen miles from Cambridge, with a plant capacity of six generators, each capable of generating 1,050 kw., or a total of 6,300 kw.; the transmission-line of three No. 0 S.W.G. copper conductors on steel towers from Horahora to Waikino (fifty-five miles); and the transformer-station at Waikino, for transforming the energy supplied to the Waihi Company's mine. Extensions to the powerhouse building, and alterations to the head-race and tail-race, were completed during the year 1924–25, and the two new 2,000 kw. units have been installed and placed in operation.
The operations for the twelve months ended the 31st March, 1926, resulted in a gross revenue of £85,830£ or £66,218 in excess of working-expenses. Interest amounted to £31,269, and depreciation to £13,601, leaving a surplus of £10,006 after paying working and capital charges and sinking fund.
A table showing the progress of the scheme during each of the last four years is given below.
| RESULTS OF OPERATION. | ||||
|---|---|---|---|---|
| — | Third Year (ended March, 1923). | Fourth Year (ended March, 1924). | Fifth Year (ended March, 1925). | Sixth Year (ended March, 1926). |
| £ | £ | £ | £ | |
| Capital outlay | 395,022 | 474,817 | 522,973 | 735,091 |
| Working-costs | 9,721 | 12,474 | 14,106 | 19,612 |
| Interest | 19,208 | 21,231 | 20,129 | 31,269 |
| Depreciation | 6,620 | 10,393 | 9,757 | 13,601 |
| Sinking Fund | .. | .. | 4,139 | 11,342 |
| Total costs | 35,549 | 44,098 | 48,131 | 75,824 |
| Total revenue | 41,818 | 59,924 | 65,184 | 85,830 |
| Maximum load— | Kw. | Kw. | Kw. | Kw. |
| Power-house, for year | 6,900 | 7,400 | 7,600 | 11,400 |
| Power-house, average weekly | 5,382 | 6,852 | 6,963 | 9,665 |
| Output— | Units. | Unite. | Units. | Unite. |
| Power-house | 33,732,150 | 45,077,150 | 45,070,650 | 65,435,630 |
| Substations total | 30,435,036 | 40,614,013 | 41,461,299 | 60,286,867 |
| Total units sold | 30,030,369 | 39,914,854 | 41,281,159 | 60,261,326 |
| Load-factor— | Per Cent. | Per Cent. | Per Cent. | Per Cent. |
| Power-house, annual | 55.8 | 69.6 | 67.6 | 65.5 |
| Power-house, average weekly | 71.2 | 75.3 | 71.9 | 77.5 |
| d. | d. | d. | d. | |
| Working-cost per unit sold | 0.078 | 0.075 | 0.076 | 0.070 |
| Capital charge per unit sold | 0.206 | 0.194 | 0.200 | 0.230 |
| Total cost per unit sold | 0.284 | 0.277 | 0.277 | 0.299 |
| Revenue per unit sold | 0.334 | 0.360 | 0.379 | 0.342 |
| Total cost— | £ | £ | £ | £ |
| Per kilowatt (power-house annual maximum) | 5.15 | 5.96 | 6.17 | 6.42 |
| Per kilowatt (power-house average weekly maximum) | 6.61 | 6.44 | 6.73 | 7.58 |
The Public Works Department supplies two large gold-mining companies and four large factories direct. The balance of the reticulation is carried out by six Electric-power Boards and the Hamilton Thames, and Te Aroha Borough Councils. Power to the amount of 2,000 kv.a. is also supplied to the Auckland Electric-power Board at Penrose substation.
The general result of operation by all eight distributing authorities is a gross profit of £35,955 for the year 1925–26.
Construction-work on the tunnels, two dams, pipe-lines, and power-house building in connection with the Mangahao electric-power-supply scheme was completed in 1924, and two of the main units of the plant (12,000 kv.a.) were ready for operation at the beginning of November, 1924, when the official “turning-on” ceremony took place. The second instalment of 12,000 kv.a. was placed in operation during 1925. The Khandallah substation was completed and placed in operation in December, 1924.
Power was supplied to Wellington City in March, 1925, and to the following Power Boards: Horowhenua, in November, 1924; Manawatu Oroua, in December, 1924; Hutt Valley, in December, 1924; Tararua, in April, 1925; Wairarapa, in May, 1925; Dannevirke, in May, 1925; Central Hawke's Bay, in September, 1925; and Wanganui-Rangitikei, in April, 1926.
The transmission-lines to Wellington, Bunnythorpe, Masterton, Wanganui, and Waipukurau were completed and placed in service, and the line to Napier is nearing completion. Work on the third dam is now in progress, and it is anticipated will be completed by the end of 1927.
A contract has been let for substation buildings at Napier. It is anticipated that power will be available at Napier by the end of 1926.
The whole of the available power from Mangahao has now been definitely allocated, and guarantees of revenue have been obtained from the Wellington City Corporation and the various Power Boards.
The capital outlay at 31st March, 1926, was £2,022,315, of which sum £519,525 represents works which are not yet in operation. The total revenue for the year ended 31st March, 1926, which is the first complete year of operation, was £76,859, and working-expenses £21,865. Interests costs were £92,226, and depreciation £30,056. The total annual costs for the year under review were thus £144,147, and the loss £67,288.
| RESULTS OF OPERATION, YEAR ENDED 31ST MARCH, 1926. | |
|---|---|
| £ | |
| Capital outlay | 2,022,315 |
| Working-costs | 21,865 |
| Interest | 92,226 |
| Depreciation | 30,056 |
| Total costs | 144,147 |
| Total revenue | 76,859 |
| Kw. | |
| Maximum load, power-house, for year | 13,960 |
| Output— | Units. |
| Power-house total | 49,482,425 |
| Khandallah substation | 34,897,960 |
| Total units sold | 45,131,120 |
| Load-factor— | Per Cent. |
| Power-house, annual | 40 |
| d. | |
| Power-house, average weekly | 60 |
| Working-cost per unite sold | 0.115 |
| Capital charge per unit sold | 0.659 |
| Total cost per unit sold | 0.774 |
| Revenue per unit sold | 0.412 |
| £ | |
| Total cost per kilowatt of power-house maximum | 10.32 |
| Revenue per kilowatt of power-house maximum | 5.50 |
In addition to the Government schemes the following schemes of 1,000 kw. and over are in operation:—
Waipori River, thirty-two miles from Dunedin. Water is conducted from several artificial storage reservoirs on the Waipori River and its tributaries, through a tunnel and pipe-lines to the power-house, which is situated at the bottom of a narrow ravine. The present capacity of the plant is 11,000 kw., and the head available is 700 ft. Power is generated at 2,400 volts and transmitted at 35,000. The capital outlay to 31st March, 1926, was £927,513.
At Wairua Falls (Whangarei) a 2,000 kw. plant was installed in 1916 by the Dominion Portland Cement Company to furnish power for cement-making. The energy is transmitted a distance of sixteen miles to the factory at a pressure of 22,000 volts. A branch-line also supplies the Borough of Whangarei and the farming districts en route.
New Plymouth has a plant of 3,000 kw. This plant was installed in 1906, and transmits power at 6,600 volts.
The Southland Electric - power Board has constructed a 4,000 kw. plant at Lake Monowai, and transmits power at 66,000 volts to Invercargill, Gore, and Winton. The Monowai River at its outlet from the lake is diverted through an open channel and steel pipe 8 ft. in diameter to a surge-chamber above the power-house on the bank of the Waiau River. A head of 180 ft. is available, permitting an ultimate development of 20,000 h.p. on a 50-per-cent. load-factor.
The Taranaki Electric-power Board is constructing a plant to develop 2,000 h.p. from the Manganui River. The Marlborough Electric-power Board is constructing a plant to develop 1,000 kw. from the Waihopai River, and the Tauranga Borough Council is constructing a plant to develop 2,500 kw. from the Wairoa River.
Persistent demands were made for some years that the Government should develop the power sources of the Dominion itself for the benefit of the people generally, and in 1910 the Aid to Water-power Works Act was passed, and the Lake Coleridge scheme for the supply of Christchurch City and Canterbury Province was selected for development. Operations were commenced on these works in 1911 and completed in 1915, with a capacity of 4,500 kw., which has since been extended to 26,000 kw. This scheme has proved thoroughly successful. After the successful inauguration of the Lake Coleridge scheme, a complete system was drawn up of interconnected power systems in both the North and South Islands.
A very complete report and estimate of the demand and cost of supply for the North Island was submitted by the then Chief Electrical Engineer, Mr. Evan Parry, B.Sc., &c., in October, 1918. After a full discussion of the use of electricity in the Dominion he assessed the demand at h.p. (0.15 kw.) per head of population, and estimated the total power required, allowing for losses, at 160,000 h.p. of installed capacity in the North Island and 110,000 h.p. in the South Island.
After careful comparisons with the developments in other countries and detailed estimates of the future demand in New Zealand, this has been adopted as the basis of the Government scheme. For the North Island it is proposed to develop the power at three main stations—viz., Mangahao (24,000 h.p.), Lake Waikaremoana (40,000 h.p., capable of extension to 130,000 h.p.), and the Arapuni Rapids, on the Waikato River (96,000 h.p., capable of extension to 160,000 h.p.). These three power-stations are to be ultimately interconnected by a complete system of 110,000-volt lines for a total length of 1,112 miles with 309 miles of branch mains at 50,000 and 33,000 volts.
The cost of the complete North Island scheme of wholesale generation and transmission as estimated in 1918 was as follows:—
| — | H.P. | Cost. | Per H.P. | Amount. | Per Horsepower. |
|---|---|---|---|---|---|
| £ | £ | £ | £ | ||
| Generating-stations (total plant capacity, 160,000 h.p.)— | |||||
| Mangahao | 24,000 | 438,654 | 18.30 | ||
| Waikaremoana | 40,000 | 544,369 | 13.16 | ||
| Arapuni | 96,000 | 1,078,700 | 10.80 | 2,061,723 | 12.88 |
| 160,000 | |||||
| Main transmission-lines | 1,553,880 | 11.22 | |||
| Extra branch transmission-lines at lower voltage to main substations not on main lines | 241,360 | ||||
| Main substations | 838,808 | 5.24 | |||
| Distribution-lines and secondary substations | 2,086,000 | 13.04 | |||
| 6,781,771 | 42.38 | ||||
| Interest during construction | 271,271 | 1.69 | |||
| Assistance to local authorities and power-users | 100,000 | 0.62 | |||
| Working capital | 150,000 | 0.94 | |||
| Total | 7,303,042 | 45.63 | |||
Between 1918 and the passing of the legislative authorizations in 1919 and 1920 costs generally increased to a large extent, and the authorizations were therefore increased accordingly. The items under each power scheme in the authorizations include, of course, the portion of the transmission-lines and substations supplied from each source.
It was estimated that the programme would take ten years to develop, and that the total annual charges when completed, allowing 7 ½ per cent. to cover interest, depreciation, and sinking fund, and £220,000 per annum for working-expenses, would amount to £767,728—that is, practically £6 per horse-power, or £8 per kilowatt-year.
It is estimated that this scheme when in full operation will effect a saving of 1,000,000 tons of coal per year out of a total annual consumption of 2,400,000 tons in the whole Dominion.
On the same basis 110,000 h.p. is also required in the South Island, and towards this developments are in hand for an ultimate capacity as follows:—
| Horse-power. | |
|---|---|
* Completed 1926. | |
| Lake Coleridge (Public Works Department) | 36,000* |
| Waipori Falls (Dunedin City Council) | 25,000 |
| Lake Monowai (Southland Electric-power Board) | 16,000 |
| Total | 77,000 |
In addition the following schemes have been investigated in order to make up the balance:—
| Horse-power. | |
|---|---|
| Teviot River | 25,000 |
| Lake Hawea | 80,000 |
| Lake Tekapo | 20,000 |
| Waimakariri River | 30,000 |
| Clarence River | 25,000 |
| Toaroha River | 10,000 |
| Arnold River | 4,000 |
| Waihopai River | 2,000 |
| Gowan River | 25,000 |
The final selection of the sources, their order of development, and the economical limits in each case, have not yet been determined.
The statutory authorizations to date for the development of hydro-electric power in the Dominion are as follow:—
| Aid to Water-power Works Act, 1910— | £ |
|---|---|
| Lake Coleridge electric-power works | 500,000 |
| Electric-power Works Loan Act, 1919— | |
| Arapuni electric-power works | 4,500,000 |
| Mangahao electric-power works | 1,600,000 |
| Lake Coleridge extensions | 257,500 |
| Horahora electric-power works | 412,500 |
| Waikaremoana—Surveys, &c. | 30,000 |
| Otago—Surveys, &c. | 30,000 |
| Finance Act, 1920— | |
| Waikaremoana electric-power works | 2,600,000 |
| Kaituna River | 150,000 |
| Lake Coleridge extensions | 720,000 |
| Surveys and investigations | 30,000 |
| £10,830,000 | |
The total expenditure to the 31st March, 1926, including capital outlay, stocks, and debit balances on the trading accounts, is as follows:—
| £ | |
|---|---|
| Lake Coleridge | 1,464,931 |
| Horahora | 785,234 |
| Waikaremoana | 92,386 |
| Mangahao | 2,179,199 |
| Arapuni | 553,020 |
| Hutt River | 2,706 |
| Kaituna River | 1,355 |
| Other surveys | 7,905 |
| General expenditure | 4,613 |
| Cost of raising loans | 43,148 |
| £5,134,497 |
Of the above, the Lake Coleridge, Horahora, Mangahao, and Waikaremoana systems are in commercial operation, and Arapuni is under construction.
The policy of the Government generally is to supply power in bulk, leaving the reticulation and retail supply in the hands of the local authorities. Formerly the only local authorities available were the cities, boroughs, counties, and town districts, but with the extension of electric supply into the country areas a stronger organization became necessary, and this was provided under the Electric-power Boards Act of 1918. This Act provides for several local districts to combine for the purpose of electric-power distribution, and to set up a special Electric-power Board to carry out the work, with rating-powers over the district concerned.
Amendments to the original Act, based on the results of experience, were passed in 1919, 1920, 1921, 1922, and 1923. The legislation was consolidated and amended in the Electric-power Boards Act, 1925.
The development of the reticulation by means of Electric-power Boards has made substantial progress during the year. Three additional districts were formed, and there are now 42 districts constituted, and 33 actually carrying out the distribution and sale of electrical energy (August, 1926). The total area covered is 65,416 square miles, or 64 per cent. of the total area of the Dominion. The total population concerned is 863,000, or 61 per cent. of the total population of the Dominion; and the unimproved value of the land included in the electric-power districts and outer areas is £258,252,354, or 78 per cent. of the total unimproved value of the Dominion.
So far only one of the four main cities—viz., Auckland—has been included in the inner area of a power district, but of the secondary centres the City of Wanganui and the boroughs of Palmerston North, Invercargill, Timaru, Napier, Gisborne, and Oamaru are included. The advantage of Power Board organization is more obvious to rural than to urban ratepayers, and yet the above position indicates that some of the more important centres are realizing that it is to their advantage generally to be associated with the country in undertaking the work of reticulation of electric power on a comprehensive scale.
The Boards already formed are getting to work energetically in carrying out their functions. Nineteen Boards—viz., Thames Valley, Cambridge, Central, Franklin, Waitomo, Te Awamutu, Hutt Valley, Horowhenua, Manawatu - Oroua, Wanganui-Rangitikei, Central Hawke's Bay, Dannevirke, Tararua, Wairarapa, Malvern, Banks Peninsula, Springs-Ellesmere, Ashburton, and South Canterbury — have carried out fairly complete reticulation of their areas, and are distributing power taken in bulk from the plants at Horahora, Mangahao, and Lake Coleridge. The Auckland Board has taken over the city electric-power station, and is providing for large extensions of both plant and mains. It has also entered into a contract to take the whole of its power, with a minimum of 15,000 kw., from the Government when the Arapuni Station is completed, which is estimated to be in 1928. Taranaki, while pushing on with its reticulation in anticipation of a general supply of hydro-electric power, is giving a partial supply from smaller stations in the meantime. Wairoa is taking power in bulk from the Department's station at Lake Waikaremoana, and supplies the borough and a few consumers in the neighbourhood. Three—viz., Opunake, Southland, and Teviot—have local water-power stations in operation. Four others—viz., Waitemata, Poverty Bay, Hawke's Bay, and Waitaki—are arranging to take power in bulk from the Government hydro-electric sources, and are preparing their systems of reticulation with this end in view. The Grey Power Board has erected a steam station of its own; the Wairere and Marlborough Power Boards are each erecting local water-power stations. The Tauranga, Otago, and Otago Central Boards have arranged to purchase power in bulk from other authorities. The other four—viz., Hobson, Buller, Reefton, and Westland—are making arrangements which have not yet been finalized.
The following table gives details of the date of constitution, the area, population, and rateable value of each of 42 power districts already formed, also the amounts of the loans already authorized, and the voting on each poll taken. The total amount of the loans authorized by the 35 districts which have taken their polls is £10,121,788. The population of the districts concerned is 811,830, so that the loans authorized amount to £12.5 per head of population, as compared with £13.2 last year. The unimproved valuation of the districts is £245,153,266, the loans authorized amounting to 4.1 per cent. of the unimproved rateable value of the lands pledged as security for the loans. The voting at the polls totalled 42,471 to 5,522—i.e., a majority of 88 per cent.
| ELECTRIC-POWER BOARDS AS CONSTITUTED ON 31ST MARCH, 1926. | ||||||||
|---|---|---|---|---|---|---|---|---|
| Name of Electric-power Board. | Proclamation constituting Power Board gazetted. | Number of Members on Board. | Approximate Area of District. | Population. | Value of Rateable Property. | Amount of Loan authorized. | Voting for Loan Poll. | |
| For. | Ag'nst | |||||||
* Lost year's figures. | ||||||||
| Square Miles. | £ | £ | ||||||
| Ashburton | 17/1½1 | 12 | 2,542 | 18,001 | 9,346,863 | 296,500 | 1,590 | 96 |
| Auckland | ¼/22 | 12 | 300 | 175,000 | 50,491,865* | 1,722,500 | 7,069 | 476 |
| Banks Peninsula | 8/½0 | 7 | 387 | 4,000 | 5,089,798 | 109,000 | 331 | 23 |
| Bay of Plenty | 20/8/25 | 8 | 3,075 | 10,900 | 2,096,042 | Poll not | yet taken. | |
| Buller* | 11/5/22 | 5 | 1,987 | 9,197 | 696,374 | ,, | ,, | |
| Cambridge | 8/½0 | 8 | 137 | 6,000 | 2,650,705 | 113,238 | 474 | 71 |
| Central | 8/7/20 | 8 | 752 | 17,512 | 4,630,943 | 217,000 | 580 | 23 |
| Central Hawke's Bay | 19/10/22 | 9 | 1,300 | 10,056 | 6,839,951 | 150,000 | 543 | 41 |
| Dannevirke | 1⅛/21 | 10 | 673 | 12,081 | 4,177,743 | 175,000 | 651 | 93 |
| Franklin | 25/9/24 | 8 | 822 | 14,444 | 6,763,874 | 200.000 | 1,030 | 145 |
| Golden Bay | 18/6/25 | 5 | 51 | 1,200 | 240,717 | Poll not | yet taken. | |
| Grey | 26/10/22 | 9 | 1,450 | 12,000 | 614,694 | 80,000 | 630 | 134 |
| Hawke's Bay | 19/6/24 | 8 | 1,040 | 40,104 | 15,037,110 | 304,000 | 681 | 68 |
| Hobson | 29/3/23 | 8 | 778 | 7,180 | 1,424,942 | Poll not | yet taken. | |
| Horowhenua | 1/12/21 | 9 | 630 | 12,095 | 3,403,255 | 260,000 | 973 | 26 |
| Hutt Valley | 6/7/22 11/12/24 | 11 | 530 | 27,275 | 3,119,920 | 240,000 | 1,748 | 146 |
| Malvern | 28/6/23 | 6 | 2,141 | 5,050 | 3,037,533 | 40,000 | 326 | 22 |
| Manawatu-Oroua | 1/12/21 | 12 | 1,301 | 40,000 | 13,955,493 | 500,000 | 1,144 | 96 |
| Marlborough | 25/10/23 | 8 | 3,218 | 20,780 | 9,442,042 | 300,000 | 1,334 | 300 |
| Opunake | 9/8/21 1 1/3/22 | 7 | 197 | 7,000 | 1,728,168 | 99,000 | 231 | 26 |
| Otago | 18/10/23 | 6 | 2,281 | 24,082 | 3,136,178 | 200,000 | 961 | 162 |
| Otago Central | 26/10/22 4/12/24 | 9 | 2,684 | 5,170 | 528,839 | 50,000 | 252 | 11 |
| Poverty Bay | 20/12/23 | 11 | 1,900* | 23,986* | 16,502,852* | 280,000 | 1,203 | 244 |
| Reefton* | 30/6/21 | 5 | 24 | 1,850 | 220,042 | Poll not | yet taken. | |
| South Canterbury* | 16/10/22 | 12 | 5,102 | 41,618 | 12,946,839 | 145,000 | 978 | 299 |
| Southland | 19/11/19 | 12 | 10,857 | 66,009 | 15,356,035 | 1,650,000 | 6,516 | 415 |
| South Taranaki | 30/4/25 | 8 | 868 | 17,612 | .. | Poll not | yet taken. | |
| Springs-Ellesmere | 8/7/20 | 5 | 412 | 11,270 | 6,480,598 | 114,000 | 795 | 41 |
| Taranaki | 18/5/22 | 7 | 1,637 | 22,000 | 5,238,319 | 350,000 | 635 | 190 |
| Tararua | 23/3/22 | 10 | 1,566 | 10,255 | 2,833,994 | 200,000 | 714 | 83 |
| Tauranga | 14/6/23 | 7 | 641 | 8,425 | 964,553 | 100,000 | 421 | 277 |
| Te Awamutu | 8/½0 | 10 | 270 | 8,500 | 3,683,474 | 153,000 | 584 | 39 |
| Teviot | 22/7/20 22/7/22 | 7 | 320 | 2,400 | 183,022 | 38,500 | 191 | 27 |
| Thames Valley | 5/1/19 | 12 | 2,300 | 30,000 | 13,000,000 | 700,000 | 1,786 | 114 |
| Wairarapa | 25/3/20 | 9 | 1,998 | 19,000 | 7,282,726 | 316,550 | 1,703 | 225 |
| Wairere | 18/½3 | 7 | 407 | 2,500 | 380,000 | 38,500 | 82 | 8 |
| Wairoa | 29/7/20 | 10 | 1,345 | 7,712 | 4,344,027 | 100,000 | 504 | 31 |
| Waitaki | 9/8/23 | 9 | 2,333 | 17,580 | 6,735,789 | 135,000 | 1,286 | 124 |
| Waitemata | 18/10/23 14/1½4 | 9 | 632 | 21,425 | 6,933,364* | 200,000 | 2,940 | 1,196 |
| Waitomo | 6/3/24 | 7 | 1,160 | 8,500 | 1,066,152 | 70,000 | 270 | 36 |
| Wanganui-Rangitikei | 1/12/21 | 12 | 2,620 | 60,000 | 26,808,866 | 475,000 | 1,315 | 214 |
| Westland* | 28/10/20 | 9 | 750 | 3,272 | 196,268 | Poll not | yet taken. | |
| Totals | .. | .. | 65,416 | 863,041 | 279,589,969 | 10,121,788 | 42,471 | 5,522 |
The next table shows the capital expenditure incurred by each Board up to the end of the financial year 1925–26, the revenue and expenditure, and the amount of rates struck and collected.
The total capital outlay by the 34 Boards which have started construction is £7,350,516, but a great part of this is on works not yet in service. The gross revenue from the sale of electricity by the 30 Boards which had commenced supply was £855,432, of which 47 ½ per cent. was received by the Auckland Board. The general result is a profit over the whole business of the Power Boards of £70,548. The rating for the next few years wall have to be substantially heavier unless provision is made to enable Power Boards to carry forward losses in early stages of their operations, to be paid out of the profits which can be anticipated after the first few years, as the Public Works Department has done in connection with Lake Coleridge and Horahora. But, even so, such losses in the early stages do not indicate any want of security in the business as a whole, but are inherent in the commencement of any concern depending to such an extent on a large initial capital outlay to earn a revenue which takes time to develop.
| ELECTRIC-POWER BOARDS.—RETURN FOR YEAR ENDED 31ST MARCH, 1926. | |||||||||||||||
|---|---|---|---|---|---|---|---|---|---|---|---|---|---|---|---|
| Board. | Main supply commenced. | Capital Outlay. | Revenue. | Expenditure. | Profit. | Loss. | General Rate. | Special Rates. | Valuation Basis.* | ||||||
| Sale of Electricity. (Gross). | Sale of Materials. (Profit.) | General. | Capital Charges. | Power. | General. | Levied. | Collected. | Levied. | Collected. | ||||||
* U = Unimproved; C = Capital value. † Last year's figures, this year's not available. ‡ Includes arrears. § Arrears. ∥ Figures not yet available. ¶ Boards capitalizing whole of interest and sinking funds not included. NOTE.—Buller, Golden Bay, Reefton, South Taranaki, and Westland Boards are not yet in operation. | |||||||||||||||
| £ | £ | £ | £ | £ | £ | £ | £ | £ | d. | £ | d. | £ | |||
| Ashburton | 1923 | 244,519 | 23,761 | 45 | 88 | 8,599 | 5,681 | 4,727 | 4,887 | .. | .. | .. | .. | .. | U. |
| Auckland | 1908 | 1,618,368† | 408,090 | .. | 5,799 | 181,239 | 118,476 | 71,263 | 42,861 | .. | .. | .. | 0026 | Nil | C. |
| Banks Peninsula | 1922 | 93,010 | 9,449 | 332 | 185 | 6,707 | 1,574 | 4,260 | .. | 2,575 | 0.10 | 4,714£ | .. | .. | C. |
| Bay of Plenty | .. | .. | .. | .. | .. | .. | .. | 125 | .. | .. | 0.1875 | Nil | .. | .. | U. |
| Cambridge | 1921 | 100,327 | 14,055 | 227 | 935 | 7,666 | 4,537 | 2,787 | 227 | .. | .. | .. | .. | .. | C. |
| Central | 1921 | 212,415 | 29,015 | 73 | 2,725 | 14,862 | 7,929 | 8,441 | 581 | .. | .. | .. | .. | .. | U. |
| Central Hawke's Bay | 1925 | 90,826 | 3,378 | .. | 490 | .. | 967 | 90 | .. | .. | .. | .. | .. | .. | U. |
| Dannevirke | 1925 | 130,693 | 8,221 | 601 | 330 | 2,245 | 1,978 | 1,548 | 3,381 | .. | .. | .. | 1.03 | Nil | U. |
| Franklin | 1925 | 24,083 | 3,312 | 617 | 327 | 1,096 | 1,758 | 389 | 1,013 | .. | .. | .. | .. | .. | C. |
| Grey | 1926 | 73,172 | .. | .. | .. | .. | .. | .. | .. | .. | .. | .. | 1.10 | Nil | C. |
| Haw£'s Bay | .. | 5,762 | 301 | .. | 70 | .. | 100 | 76 | .. | .. | .. | .. | .. | .. | C. |
| Hobson | .. | .. | .. | .. | .. | .. | .. | 136 | .. | .. | 010 | 482£ | .. | .. | U. |
| Horowhenua | 1924 | 160,115 | 24,277 | 1,477 | 2,075 | 3,320 | 9,300 | 4,561 | 10,648 | .. | .. | .. | .. | .. | U. |
| Hutt Valley | 1925 | 187,280 | 24,473 | .. | 266 | 14,621 | 7,955 | 3,527 | .. | 1,364 | .. | .. | .. | .. | U. |
| Malvern | 1925 | 28,854 | 849 | .. | .. | 100 | 313 | 75 | 361 | .. | 0.25 | Nil | .. | .. | C. |
| Manawatu-Oroua | 1924 | 324,355 | 29,892 | 787 | 463 | 18,314 | 7,748 | 4,276 | 804 | .. | .. | .. | .. | .. | U. |
| Marlborough | .. | 48,521 | .. | .. | .. | .. | .. | .. | .. | .. | .. | .. | .. | .. | C. |
| Opunake | 1923 | 80,945 | 7,100 | 240 | 40 | 5,563 | 177 | 1,683 | .. | 43 | .. | .. | .. | .. | C. |
| Otago | 1925 | 114,052 | 2,766 | .. | 30 | 1,777 | 2,143 | 1,099 | .. | 2,223 | .. | .. | .. | .. | C. |
| Otago Central | 1925 | 41,648 | 1,899 | 58 | 94 | 1,696 | 250 | 318 | .. | 213 | .. | .. | .. | .. | C. |
| Poverty Bay | .. | 34,811 | .. | .. | .. | .. | .. | .. | .. | .. | 0.06 | 4,217£ | .. | .. | C. |
| South Canterbury | 1925 | 34,300† | .. | .. | .. | .. | .. | .. | ... | .. | .. | .. | .. | .. | U. |
| Southland | 1925 | 1,572,785 | 37,168 | 499 | 3,228 | .. | 4,830 | 15,055 | .. | .. | 1.25 | 79,807£ | .. | .. | U. |
| Springs-Ellesmere | 1922 | 92,103 | 12,702 | 213 | 177 | 4,599 | 3,522 | 3,537 | 1,434 | .. | .. | .. | .. | .. | U. |
| Taranaki | .. | 313,783 | 13,310 | 3,170 | 440 | 1,015 | 3,813 | 7,573 | 4,519 | .. | .. | .. | .. | .. | C. |
| Tararua | 1925 | 122,737 | 9,423 | 8 | 324 | 5,416 | 3,218 | 760 | 361 | .. | .. | .. | 1.25 | Nil | U. |
| Tauranga | 1925 | 45,940 | 3,308 | 594 | 117 | 1,808 | 719 | 3,663 | .. | 2,171 | .. | .. | .. | .. | U. |
| Te Awamutu | 1922 | 140,175 | 18,993 | .. | 1,112 | 10,869 | 4,981 | 5,692 | .. | 3,437 | 0.14 | 2,202£ | .. | .. | C. |
| Teviot | 1924 | 33,172 | 2,718 | 263 | 78 | 1,400 | 141 | 843 | 675 | .. | 1.00 | 763£ | 6.00 | 119 | U. |
| Thames Valley | 1921 | 598,260 | 76,302 | 5,251 | 3,474 | 39,189 | 25,629 | 18,941 | 1,268 | .. | .. | 768£ | .. | .. | C. |
| Wairarapa | 1924 | 285,950 | 25,628 | 1,331 | 229 | 17,617 | 2,617 | 6,094 | 870 | .. | .. | .. | .. | .. | C. |
| Wairere | 1925 | 23,893 | 134 | .. | 1 | .. | .. | .. | .. | .. | .. | .. | .. | .. | U. |
| Wairoa | 1923 | 60,983 | 8,278 | .. | 151 | 4,796 | 3,796 | 2,644 | .. | 2,807 | 010 | Nil | .. | .. | C. |
| Waitaki | 1918 | 70,765 | 12,441 | 114 | 253 | 5,330 | 4,208 | 2,436 | 784 | .. | .. | .. | .. | .. | C. |
| Waitemata | 1925 | 61,928 | 610 | .. | .. | .. | .. | .. | .. | .. | .. | .. | .. | .. | C. |
| Waitomo | 1926 | .. | .. | .. | .. | .. | .. | .. | .. | .. | .. | .. | .. | U. | |
| Wanganui-Rangitikei | 1924 | 279,996 | 45,579 | .. | 3,375 | 15,912 | 16,784 | 5,351 | 10,707 | .. | .. | .. | .. | C. | |
| Totals | .. | 7,350,516 | 855,432 | 15,900 | 26,676 | 375,806 | 245,144 | 182,020 | 85,381£ | 14,833£ | .. | 92,953 | .. | 119 | .. |
During last year 9 of the Boards struck a general rate, which was collected in 6 cases, and 5 of the Boards struck special rates for the security for loans, which were collected in only 1 case.
Several of the Boards are passing through a critical stage owing to the high cost and high interest rates ruling in 1921 when they started construction-work, and to the fact that they have undertaken the construction of many lines without requiring the guarantees from consumers authorized by clause 7 (d) of the regulations. But costs and rates of interest are now substantially lower, and the other Boards are profiting by such experiences, and much better results will be attained by the Power Boards generally in future as the result of the experience of these earlier districts.
Including the Government plants, there are now 51 public electric-power stations in the Dominion.
The total installed capacity has increased during the year by 45,141 kw., or 55 per cent. (from 81,876 kw. to 127,017 kw.), while the sum of the maximum loads has increased by 19,773 kw., or 29 per cent. (from 68,088 kw. to 87,861 kw.).
The proportion of installed plant is now as follows:—
| Stations. | Kilowatts. | Proportion per Cent. | |
|---|---|---|---|
| Water-power | 34 | 89,068 | 70.1 |
| Steam-power | 6 | 34,412 | 27.1 |
| Gas-power | 8 | 2,401 | 1.9 |
| Oil-power | 3 | 1,136 | 0.9 |
| 51 | 127,017 | 100.0 |
The number of consumers supplied has increased from 148,699 to 192,392, an increase of 43,693, or 29 per cent., for the year.
The total population included in the various areas of electric-power supply is 1,113,850, or 80 per cent. of the total population of the Dominion; so that the ideal of a supply being available to every home in the Dominion is well on the way to realization.
The maximum demand per head of population in the areas supplied is 0.079 kw., slightly over one-half of the allocation of 0.15 kw. or 0.2 h.p. per head of population, which is the basis of the design of the Government schemes. The units sold per head of population supplied were 241, as compared with 214 last year.
The total length of distributing-line is 12,454 route-miles, as compared with 6,011 last year, an increase of 6,443 miles, or 107 per cent. The number of consumers per route-mile is 15.4, as compared with 24.8 last year, the reduction being due to the large mileage of new lines erected during the year to which the full number of services is not yet connected, and to the increased proportion of country lines.
The maximum power-demand per route-mile of line is now 7.1 kw., the sales 21,600 units, and the revenue £184. These are substantially smaller than last year, for the reason indicated above, but are still remunerative returns over the whole business.
The revenue per kilowatt of output of all stations was £26.1, as compared with £24.4 last year. The water-power stations show a revenue of £26.1 per kilowatt, steam stations of £24.9 per kilowatt, and gas stations of £35.6 per kilowatt. These are valuable figures for use in forecasting the revenue from systems of various descriptions. The water-power systems include the greatest proportion of large consumers, and the gas-engine stations the greatest proportion of small consumers.
Out of the 101 distributing authorities, 71 showed a profit for the year amounting to £276,426, and 28 showed a loss amounting to £91,667. The general result is a net profit for the whole Dominion of £184,759 after paying working-costs (£1,016,860) and capital charges (£1,037,196) at the rate of 5.4 per cent. on the total capital outlay of £19,127,108. This shows a net profit of 1 per cent., as compared with 1.3 per cent. last year. The business on the whole is thus a thoroughly sound and remunerative one, as well as supplying a public necessity to 80 per cent. of the population of the Dominion.
| ELECTRIC-POWER SUPPLY OF NEW ZEALAND FOR THE YEAR ENDED 31ST MARCH, 1926 | |||||
|---|---|---|---|---|---|
| — | Water. | Steam. | Gas. | Oil. | Total. |
* Includes distribution. † Includes special expenditure for Wellington. | |||||
| Number of stations | 34 | 6 | 8 | 3 | 51 |
| Average capacity (kilowatts) | 2,620 | 5,735 | 300 | 379 | 3,772 |
| Number of consumers | 137,527 | 44,101 | 7,123 | 3,641 | 192,392 |
| Installed capacity (kilowatts), (main plant only) | 89,068 | 34,412 | 2,401 | 1,136 | 127,017 |
| Maximum load (kilowatts) | 63,323 | 21,857 | 1,768 | 908 | 87,861 |
| Units generated | 264,994,867 | 74,684,143 | 4,261,689 | 2,379,143 | 346,319,842 |
| Annual load factor (per cent.) | 47.8 | 390 | 27.5 | 29.9 | 450 |
| Units sold | 201,626,002 | 61,314,202 | 3,418,524 | 1,880,310 | 268,239,038 |
| Total capital outlay* | 16,516,884 | £2,191,962 | £305,599 | £112,863 | 10,127,108 |
| Total capital per kilowatt installed | £185 | £64 | £127 | £99 | £150 |
| Total annual working-costs* | £696,165 | £230,985 | £40,357 | £19,353 | £1,016,860 |
| Total annual working-cost per sold | 0.83d. | 1.02d. | 2.83d. | 2.47d. | 0.91d. |
| Total annual working-cost per kilowatt, maximum | £11.0 | £11.9 | £22.8 | £21.3 | £11.6 |
| Total annual capital charges* | £787,822 | £225,103 | £16,278 | £7,993 | £1,037,196 |
| Total annual capital charges per unit sold | 0.94d. | 0.88d. | 1.14d. | 102d. | 0.93d. |
| Total annual capital charges per kilowatt, maximum | £12.4 | £10.3 | £9.2 | £8.8 | £11.8 |
| Total annual capital charges, percentage of capital outlay | 4.77 | 10.27 | 5.33 | 7.08 | 5.42 |
| Total annual costs* | £1,536,408t | £486,068 | £56,635 | £27,346 | £2,106,477† |
| Total annual cost per unit sold | 1.83d. | 1.90d. | 3.98d. | 3.49d. | 1.88d. |
| Total annual cost per kilowatt, maximum | £24.2 | £22.2 | £82.0 | £30.1 | £24.0 |
| Total annual revenue (not including rates) | £1,655,411 | £543,510 | £62,981 | £29,334 | £2,291,236 |
| Total annual revenue per unit sold | 1.97d. | 2.13d. | 4.42d. | 3.74d. | 2.05d. |
| Total annual revenue per kilowatt maximum | £26.1 | £24.9 | £35.6 | £32.3 | £26.1 |
| Net profit. | £119,003 | £57,422 | £6.348 | £1,988 | £184,759 |
The question of the daily load curve and the ratio of the average load to the maximum load or the load-factor is an important one in determining the selling-price of electric power. Each station must ascertain its own load-factor and determine its selling policy accordingly. But as a general guide the daily load curves of fourteen of the larger stations of the Dominion have, by the co-operation of the engineers to these places, again been obtained for two days of the current year—via., Friday, 19th March (representing equinoctial conditions), and Friday, 18th June (representing midwinter conditions). Friday has been selected as the late-shopping night in most places, thus representing the most extreme conditions of loading. These fourteen stations have an installed capacity of 95,195 kw., or 75 per cent. of the total installed capacity of the Dominion, so that the resultant curves may be taken to represent quite accurately the shape of the load curve of the combined output of the whole Dominion. Water-power and fuel stations are proportionately represented, including all the large stations of each type, and the diagram includes not only the total output, but the water-power and fuel-power outputs separately. The summation curves are plotted in the diagram on the opposite page, and the results are as follow:—
| — | Installed Capacity. | Maximum Load. | Units. | Daily Load-factor. |
|---|---|---|---|---|
| Kilowatts. | Kilowatts. | Per Cent. | ||
* Combined maximum. | ||||
| March, 19th, 1926— | ||||
| Water-power | 63,700 | 48,413 | 881,769 | 75.9 |
| Fuel-power | 31,472 | 15,704 | 193,498 | 51.3 |
| Totals | 95,172 | 63,697* | 1,075,267 | 70.3 |
| June, 18th, 1926— | ||||
| Water-power | 63,700 | 57,072 | 937,030 | 68.4 |
| Fuel-power | 31,495 | 21,436 | 252,888 | 49.1 |
| Totals | 95,195 | 77,468* | 1,189,918 | 64.0 |
These are daily load-factors. The annual load-factors are, of course, substantially lower, being 47.8 per cent. for water-power, 39.0 per cent for steam-power, and 45 per cent. for the whole output of the Dominion.
In addition to the developed power in New Zealand there is a practically unlimited amount of undeveloped power. The following table gives the particulars of the more important available water-powers, showing also the nearest market, consisting of a city or town or an actual or potential port. Many of these are suitable for general industrial development, but the largest ones, as a rule being in the unsettled portions of the South sland and near the deep-water sounds, are particularly suitable for utilization in connection with electro-chemical or electro-metallurgical industries.
| NORTH ISLAND. | |||||||
|---|---|---|---|---|---|---|---|
| Source of Power. | Position of Powerhouse. | Available Flow: Cubic Feet per Second. | Available Head: Feet. | Average Power on 50 per Cent. Load-factor. | Nearest Town, Port, or Deep Water. | Distance: Miles. | |
| H.P. | Kw. | ||||||
* Signifies daily storage available to utilize 50 per cent. load-factor. † Signifies seasonal storage made available. | |||||||
| North Auckland District. | |||||||
| Wairua Falls | Wairua Falls | 150* | 130 | 3,200 | 2,400 | Whangarei | 18 |
| Omapere | Utakura Stream | 11* | 550 | 1,000 | 750 | .. | .. |
| South Auckland District. | |||||||
| Kaituna | Kaituna River | 500† | 784 | 65,000 | 50,000 | Tauranga | 25 |
| Auckland | 125 | ||||||
| Wairoa River | Wairoa | 420* | 80 | 5,600 | 4,200 | Tauranga | 20 |
| Waikato River | Aratiatia Rapids | 4,400† | 170 | 136,000 | 100,000 | Auckland | 154 |
| ,, | Orakeikorako Rapids | 4,400† | 35 | 14,000 | 10,000 | ,, | 148 |
| ,, | Aniwhaniwha Falls | 4,400† | 80 | 32,000 | 24,000 | ,, | 142 |
| ,, | Atiamuri Rapids | 4,400† | 25 | 10,000 | 7,500 | ,, | 139 |
| ,, | Arapuni Gorge | 5,300† | 165 | 163,000 | 120,000 | ,, | 105 |
| ,, | Horahora Rapids | 5,300† | 27 | 13,000 | 10,000 | ,, | 97 |
| Pokaiwhenua River | ,, | 165* | 170 | 4,600 | 3,400 | ,, | 97 |
| Marakopa Falls | Marokopa | 90 | 420 | 3,100 | 2,300 | Te Kuiti | 27 |
| Wairere Falls | Wairere Falls | 160* | 60 | 1,600 | 1,200 | ,, | 22 |
| Hawke's Bay District. | |||||||
| Waikaremoana | Upper Waikaretaheki | 530† | 1,100 | 97,000 | 75,000 | Gisborne | 50 |
| Lower Waikaretaheki | 530† | 360 | 32,000 | 24,000 | Napier | 60 | |
| Te Reinga Falls | Te Reinga Falls | 124 | 125 | 1,300 | 1,000 | Gisborne | 35 |
| Waikohu River | Waikohu | 45† | 847 | 6,000 | 4,500 | ,, | 28 |
| Wanqanui District. | |||||||
| Mangawhero River | Raukawa Falls | 125 | 90 | 1,000 | 750 | Wanganui | 45 |
| Wanganui River | 125 | 680 | 7,100 | 6,950 | ,, | 24 | |
| Rangitikei River | Makohine | 1,500† | 300 | 75,000 | 56,000 | ,, | 48 |
| Wangaehu River | Wangaehu River | 260 | 70 | 1,500 | 1,100 | ,, | 25 |
| Karioi | Karioi | 309* | 180 | 8,800 | 6,600 | ,, | 60 |
| Taranaki District. | |||||||
| Waitara River | Waitara River | 400 | 140 | 4,600 | 3,600 | New Plymouth | 12 |
| Waiwakaiho | Waiwakaiho | 150† | 250 | 6,200 | 4,800 | ,, | 4 |
| Manganui River | Waitara River | 415† | 340 | 26,000 | 19,400 | ,, | 25 |
| Wellington District | |||||||
| Mangahao River | Shannon | 160† | 895 | 24,000 | 18,000 | Wellington | 65 |
| Makuri River | Makuri Gorge | 100* | 384 | 6,400 | 4,800 | Pahiatua | 20 |
| Waiohine | Woodside | 120* | 120 | 2,400 | 1,800 | Masterton | 15 |
| Hutt River | Mungaroa | 200† | 330 | 11,000 | 8,300 | Wellington | 24 |
| Tauherenikau | Featherston, | 150* | 440 | 11,000 | 8,300 | Wairarapa | .. |
| Kourarau | Kourarau | 20 | 755 | 2,680 | 2,000 | Masterton | 12 |
| Totals, North Island | .. | .. | .. | 776,080 | 582,650 | ||
| SOUTH ISLAND. | |||||||
|---|---|---|---|---|---|---|---|
| Source of Power. | Position of Powerhouse. | Available Flow: Cubic Feet per Second. | Available Head: Feet. | Average Power on 50 per Cent. Load-factor. | Nearest Town, Port, or Deep Water. | Distance: Miles. | |
| H.P. | Kw. | ||||||
* Signifies daily storage available to utilize 50 per cent. load-factor. † Signifies seasonal storage made available. | |||||||
| Marlborough District. | |||||||
| Clarence. | Ericaburn | 640 | 158 | 8,300 | 6,300 | Blenheim | 45 |
| Waihopal River | Waihopai Gorge | 130* | 96 | 2,000 | 1,500 | ,, | 28 |
| Nelson and Buller District. | |||||||
| Boulder Lake | Aorere River | 50* | 2,600 | 22,000 | 16,000 | Golden Bay | 10 |
| Rotoiti Lake | Buller River | 200† | 600 | 20,000 | 15,000 | Nelson | 50 |
| Rotoroa Lake | Gowan River | 900† | 400 | 60,000 | 45,000 | ,, | 60 |
| Inangahua River | Blackwater River | 78 | 125 | 8,000 | 6,000 | Westport | 20 |
| Four-mile Creek | Four-mile Creek | 24* | 450 | 2,000 | 1,500 | ,, | 4 |
| Westland District. | |||||||
| Lake Brunner | Stillwater | 1,750 | 200 | 29,000 | 22,000 | Greymouth | 10 |
| Kumara Water-race | Kumara | 87 | 330 | 2,400 | 1,800 | ,, | 12 |
| Otira River | Otira | 40 | 700 | 2,300 | 1,700 | ,, | 52 |
| Rolleston River | ,, | 36 | 700 | 2,000 | 1,500 | ,, | 52 |
| Kanieri Lake | Kanieri River | 100 | 330 | 2,800 | 2,100 | Hokitika | 12 |
| Toaroha River | Toaroha River | 150 | 760 | 10,000 | 7,500 | ,, | 17 |
| Whitcombe River | Hokitika River | 250 | 800 | 16,000 | 12,000 | ,, | 20 |
| Kakapotahi River | Kakapotahi River | 100 | 580 | 4,800 | 3,600 | ,, | 26 |
| Wanganui River | Hende's Ferry | 830 | 580 | 40,000 | 30,000 | ,, | 36 |
| Wataroa River | Wataroa | 1,360 | 700 | 80,000 | 60,000 | ,, | 48 |
| Canterbury District. | |||||||
| Clarence River | Jollie's Puss | 200 | 1,160 | 20,000 | 15,000 | Christchurch | 90 |
| Conway River | 1,150 | 1,050 | 100,000 | 75,000 | ,, | 90 | |
| Waiau-ua River | Culverden | 1,600 | 200 | 27,000 | 20,000 | ,, | 75 |
| Waimakariri River | Gorge Bridge | 1,000* | 90 | 15,000 | 11,000 | ,, | 30 |
| Otarama | 1,000* | 150 | 30,150 | 22,500 | ,, | 42 | |
| Lake Coleridge | Rakaia River | loot | 480 | 8,000 | 6,000 | ,, | 65 |
| Acheron River | ,, | 50† | 480 | 4,000 | 3,000 | ,, | 65 |
| Harper River | ,, | 320† | 480 | 25,000 | 18,000 | ,, | 85 |
| Wilberforce River | ,, | 1,100 | 480 | 44,000 | 33,000 | ,, | 65 |
| Rakaia River | Gorge Bridge | 2,600 | 30 | 6,500 | 4,800 | ,, | 50 |
| Lake Heron | Rakaia River | 300 | 200 | 5,000 | 3,750 | ,, | 88 |
| Opihi River | Opihi Gorge | 200 | 400 | 6,700 | 5,000 | Timaru | 30 |
| Pukaki Lake | Pukaki | 5,000† | 460 | 50,000 | 37,000 | ,, | 85 |
| Tekapo Lake | Fairlie | 5,100† | 900 | 400,000 | 300,000 | ,, | 40 |
| Ohau Lake | Waitaki River | 5,000† | 300 | 125,000 | 90,000 | ,, | 85 |
| Otago and Southland Districts. | |||||||
| Ahuriri River | Waitaki River | 600 | 200 | 10,000 | 7,500 | Oamaru | 62 |
| Waitaki River | ,, | 15,000 | 30 | 37,000 | 28,000 | ,, | 60 |
| Waipori Falls | Waipori River | 230† | 700 | 26,800 | 20,000 | Dunedin | 30 |
| Lee Stream | Outram | 15* | 750 | 1,800 | 1,300 | ,, | 18 |
| Deep Stream | Taieri River | 110 | 900 | 8,400 | 6,300 | ,, | 20 |
| Taieri River | Deep Stream | 700 | 220 | 12,000 | 9,000 | ,, | 44 |
| Talla Burn | Clutha River | 30 | 890 | 2,200 | 1,600 | ,, | 60 |
| Teviot River | Roxburgh | 100† | 1,900 | 30,000 | 21,000 | ,, | 20 |
| Manuherikia River | Chatto Creek | 200 | 350 | 5,800 | 4,400 | ,, | 127 |
| Lake Hawea | Lake Wanaka | 2,500† | 205 | 80,000 | 60,000 | ,, | 170 |
| Shotover | Lake Wakatipu | 500 | 250 | 10,000 | 7,500 | Invercargill | 112 |
| Lake Hall | Doubtful Sound | 220 | 2,625 | 48,000 | 36,000 | On seaboard | .. |
| Lake Cecil | Lake Te Anau | 200 | 900 | 15,000 | 11,200 | ,, | .. |
| Lake Hilda | ,, | 1,550 | 1,190 | 55,000 | 41,080 | ,, | .. |
| Lake Te Anau | George Sound | 12,630 | 694 | 1,600,000 | 1,200,000 | ,, | .. |
| Lake Manapouri | Smith Sound | 8,400† | 600 | 840,000 | 630,000 | ,, | .. |
| Bowen Falls | Milford Sound | 700 | 600 | 35,000 | 25,000 | ,, | .. |
| Lake Monowai | Waiau River | 500† | 160 | 16,000 | 12,000 | Invercargill | 60 |
| Lake Hauroto | Tewaewae Bay | 2,300 | 514 | 100,000 | 75,000 | ,, | 51 |
| Totals, South Island | .. | .. | .. | 4,110,950 | 3,074,430 | ||
Water-power is extensively used for hydraulic mining in New Zealand, and to a smaller extent for hydro-electric transmissions and for water-motors installed to drive mining machinery.
During 1925 water was used for sluicing auriferous alluvium at 248 claims. employing 470 persons, in Otago and Southland and on the West Coast. The quantity of water utilized per claim ranges up to about 40 cubic feet per second. Most of the sources of water-supply are privately owned, but on the West Coast and in Central Otago the Government has constructed, and now maintains, very extensive water-races for the use of miners.
On the West Coast the Waimea-Kumara Government water-races, in length about thirty-nine miles, have a capacity of 182 cubic feet per second. The cost of construction has been approximately £223,262, and the value of gold obtained by use of water is about £1,425,785. In the Mount Ida district (Central Otago) the Government water-races, about twenty-two miles in length, have a capacity of 51 cubic feet per second; the cost of these races to the Government has been about £80,000. Of recent years the cash received for water sold has been less than the cost of the upkeep of the races. The Mount Ida Water-race is now controlled by the Public Works Department, and the intention is that water not used in gold-mining will be utilized for irrigation.
There are several hydro-electric mining transmissions. On the Waikato River the Waihi Gold-mining Company installed a 9,000 h.p. plant at Horahora Falls, near Cambridge, a distance of fifty miles from the mines and reduction-works at Waihi and Waikino. The transmission pressure is 50,000 volts. Portion of this power is utilized for mining purposes at Thames in addition to that used at Waihi and Waikino. This source of supply has been taken over by the Government, which now sells the power to the public.
In addition to the power obtained from the plant at Horahora Falls, the Waihi Gold-mining Company in their plant at Waikino generate by means of pelton wheels 237 h.p. from the Ohinemuri River.
A small portion of the power generated at the Omanawa Falls, 1,000 h.p sixteen miles from Tauranga, and at McLaren Falls, 4,200 h.p., also sixteen miles from Tauranga, for the Tauranga Borough Council, is used for mining purposes. Muir's Reefs Mine, Te Puke, is supplied with electric power from this source.
The Arapuni electric-power plant on the Waikato River is now in course of erection, and no doubt a portion of the power generated will be used for mining purposes.
At Kanieri Forks, near Hokitika, there is an hydro-electric power-station, formerly the property of Ross Goldfields (Limited). The water-supply is carried from Lake Kanieri, and from the pelton wheels at the power-house 850 h.p. is obtainable. This power is now used by the Rimu Gold-dredging Company, also for lighting the Borough of Hokitika.
There are two hydro-electric mining transmissions in Otago at the present time. At St. Bathans, Central Otago, the St. Bathans Gold-mining Company has installed a 135 h.p. plant for winding and pumping. The water-supply is carried in the Scandinavian Water-race from the Manuherikia River. In addition the Shotover Gold-dredging Company is taking water from Stony Creek for hydro-electric power for its gold-dredge on the Shotover River at Maori Point; 300 h.p. is obtainable.
Table of Contents
THE legislation relating to the custody, administration, and audit of the public moneys and securities is contained in the Public Revenues Act, 1910, and amending Acts. All public moneys, excepting those payable to or received by the Post Office Savings-bank, the Government Insurance Office, the Public Trust Office, the Native Trust Office, the Commissioners of the Public Debt Sinking Funds, the State Advances Office, the State Fire and Accident Insurance Office, the Public Service Superannuation Fund, and the National Provident Fund are paid into one account at the bank called the “Public Account,” and are carried to one or other of the following funds or accounts in the books of the Treasury:—
The Consolidated Fund.
The Public Works Fund.
Separate accounts or funds specially created.
The main Consolidated Fund Account records the ordinary public revenue and expenditure. There are certain subsidiary accounts to this fund which come under the third head in the above category. The Public Works Fund Account contains receipts from loans or by way of transfers from the Consolidated Fund and the expenditure on public works, immigration, or special services legally chargeable to that account.
The financial year commences on the 1st day of April and ends on the 31st day of March. The revenue of any financial year is the money received into the Public Account at the bank at Wellington within the year; the expenditure is the money paid at the Treasury within the year, and the money paid by imprestees of which accounts are received at the Treasury within the year. Imprests not accounted for at the end of a financial year are included in the accounts of the following year.
At the end of each financial year the Appropriation Acts lapse, but the Minister of Finance is authorized for a period of three months from the commencement of the next financial year to pay money in respect of any service, provided that the amount does not exceed the unexpended balance voted for that purpose in the previous year, together with an amount equal to one-fourth of such vote.
The usual practice is for Parliament to meet at the end of June in each year, and to vote supplies from month to month until the estimated expenditure for the year has been approved and the annual Appropriation Act is passed.
In the audit of expenditure both the pre-audit and post-audit systems are in operation. Pre-audit is applied to vouchers in respect of payments on account of salaries of new appointees, temporary officers, and officers claiming more than one month's salary at any time; interest, loan transactions, and return of deposits; unauthorized expenditure; or expenditure chargeable against the accounts of local bodies. Post-audit is applied to all other payments.
Vouchers must be certified as correct by the proper officer, and forwarded by him to the Head of his Department for approval. Vouchers subject to pre-audit are then forwarded to the Audit Office, and on being found correct are sent on to the Treasury to be entered on requisitions for payment. Vouchers subject to post-audit are transmitted by the head of the Department direct to the Treasury. Payment is made by the Treasury, and the claim is afterwards submitted for audit.
Section 22 of the Appropriation Act, 1923, introduced an alteration in the treatment of moneys received from the sale of stores or material, or as payment for services, &c. Formerly such moneys were credited to the relative vote, and were deemed to be appropriated to the respective services in addition to the votes for such services. In compiling estimates of expenditure, the sums estimated to be received to the credit of each service were utilized to abate the total estimated expenditure of such service.
The new system, which came into force from the 1st April, 1924, is indicated by the following subsections of section 22 of the Appropriation Act, 1923:—
Moneys received by the Crown from the sale of stores or material, or as payment for services, or as recoveries in respect of expenditure, or as fees, or in respect of interdepartmental charges and adjustments of accounts, may, as the Treasury from time to time determines, be credited to the relative vote, and shall be known as credits in aid of that vote.
In preparing the estimates of the expenditure for any year the sums estimated to be received in that year as credits in aid of any vote shall be deducted from the total estimated expenditure for that vote for the year, and the amounts so estimated to be received as credits in aid shall be appropriated in the Appropriation Act of the year for the services of such vote: Provided that nothing herein shall be deemed to authorize the expenditure from any vote of any moneys in excess of the amounts appropriated for the services of that vote, otherwise than in respect of credits in aid, and (he amount actually received in that year as credits in aid of that vote.
Any surplus in respect of any vote arising either from an excess of the moneys actually received as credits in aid over the amount estimated to be so received, or by way of reduction of expenditure, may, with the approval of the Treasury, be temporarily applied for the purposes of that vote, either in making up any deficiency in the amounts actually received as credits in aid. or in defraying expenditure which is not adequately provided for by appropriation.
The effect of the change is that, by comparison with former years, both receipts and expenditure for the years 1924–25 and 1925–26 are increased by the amount of credits in aid. To enable a proper comparison to be made, the credits have been deducted from both sides in the figures for these two years given throughout this subsection in tables covering a series of years, and in the details of expenditure of the Consolidated Fund and the Public Works Fund for 1925–26 the figures are given both inclusive and exclusive of credits in aid.
The total revenue and expenditure of the Consolidated Fund Account for the financial years ended the 31st March, 1917 to 1926, is shown in the following table, together with the excess of revenue for each year and the amount of such excess transferred to the Public Works Fund in the succeeding year:—
| Year ended 31st March, | Revenue. | Expenditure. | Excess of Revenue over Expenditure. | Amount of Excess transferred to the Public Works Fund. |
|---|---|---|---|---|
*Excess of expenditure over revenue. | ||||
| £ | £ | £ | £ | |
| 1917 | 18,355,194 | 14,058,770 | 4,296,424 | .. |
| 1918 | 20,206,222 | 15,120,288 | 5,085,934 | .. |
| 1919 | 22,352,372 | 18,673,599 | 3,678,773 | .. |
| 1920 | 26,081,340 | 23,781,524 | 2,299,816 | .. |
| 1921 | 34,260,961 | 28,068,730 | 6,192,231 | 500,000 |
| 1922 | 28,127,007 | 28,466,838 | -339,831* | .. |
| 1923 | 27,579,443 | 26,263,760 | 1,315,683 | .. |
| 1924 | 27,960,370 | 26,148,005 | 1,812,365 | 1,000,000 |
| 1925 | 28,643,000 | 27,399,200 | 1,243,800 | 1,000,000 |
| 1926 | 24,725,762 | 23,570,083 | 1,155,679 | 500,000 |
| Totals, ten years | 258,291,671 | 231,550,797 | 26,740,874 | 3,000,000 |
To the amount of excess revenue for the ten years must be added the sum of £2,166,078 brought forward from the financial year ended the 31st March, 1916, and amounts aggregating £679,931 in respect of items not treated as revenue—viz., the balance of the Consols Account, £475,992, transferred to the Consolidated Fund in 1925–26; reparation-moneys from Germany, £186,227 (in 1925–26); sinking funds set free, £12,353 (in 1916–17); amount unclaimed on matured bonds, £200 (in 1924–25); refund of advances to Otago University, £4,000 (in 1924–25); and receipts in connection with Stipendiary Magistrate's pensions, £1,159 (£301 in 1924–25 and £858 in 1925–26), making a total of £29,586,883. From this excess transfers to other funds have been made at various times during the ten years, and to ascertain the balance carried forward as at the 1st April, 1926, deductions require to be made for these amounts—namely, £3,000,000 to the Public Works Fund as shown above, £13,500,000 to the Discharged Soldiers Settlement Account (£13,330,000 in 1920–21 and £170,000 in 1921–22), £200,000 to the Discharged Soldiers Settlement Depreciation Fund Account (£50,000 in each year from 1920–21 to 1923–24). £2,000,000 to the Reserve Fund Securities Account (£1,200,000 in 1920–21 and £800,000 in 1922–23), £100,000 to the Education Loans Account (in 1923–24), £473,392 to the Working Railways Account (in 1925–26) on account of excess railway revenue paid to Consolidated Fund in previous years, and £5,883,403 to the Loans Redemption Account for debt-reduction purposes (£400 in 1919–20, £560,011 in 1921–22, £2,337,360 in 1922–23, £1,367,341 in 1923–24, £1,052,130 in 1924–25, and £566,161 in 1925–26). An item of £204 in respect of charges and expenses of redemptions (in 1925–26), and adjustments totalling £1,792 (£79 in 1924–25 and £1,713 in 1925–26), bring the total to £25,158,791. Deducting this total from the sum of £29,586,883 referred to above, there remains a balance of £4,428,092, which has been carried forward to the current year's account.
The total amount of excess revenue transferred to the Public Works Fund during the thirty five financial years ended the 31st March, 1926, was £13,305,000.
All transfers from the Consolidated Fund to other accounts are not regarded as out of surplus revenue, some items being included in the total of expenditure in the Treasury accounts. Transfers included in expenditure in 1925 26 were—
| £ | |
|---|---|
| To Public Debt Repayment Account | 872,734 |
| To Loans Redemption Account (for reduction of funded debt) | 333,289 |
| To Working Railways Account (losses on isolated sections and branch lines £344,830, interest on liability £1,945) | 346,775 |
| To Main Highways Account (tax on tires on imported cars) | 39,200 |
| To Discharged Soldiers Settlement Depreciation Fund Account | 50,000 |
| To Advances to Other Governments Account | 30,000 |
| Total £1 | 671,998 |
Consequent on the passing of the Government Railways Amendment Act, 1925, the railway receipts and payments no longer form part of the Consolidated Fund, having been transferred to a separate account called the Working Railways Account. The Consolidated Fund is, however, credited with interest on railway capital liability, together with interest on any moneys advanced by way of loan from the Consolidated Fund, as provided for in the Act. On the other hand, the Consolidated Fund is required to transfer to the Working Railways Fund each year such sum, if any, by which the expenditure in respect of the operation and maintenance of any branch line or isolated section, together with the interest payable on the capital moneys expended in connection with its construction and equipment, exceeds the revenue.
For the year 1925–26 receipts by way of interest on railway capital liability totalled £1,913,311, the difference between which sum and the railway revenue credited in 1924–25 (£7,105,106) more than accounts for the fall in the total revenue of the Consolidated Fund between the two years. On the other side of the account, the expenditure on working railways in 1924–25 was £6,456,306, and the amount transferred to the Working Railways Account in respect of losses on isolated sections and branch lines in 1925–26 was £344,830, a non-recurring interest item of £1,945 bringing the expenditure to £346,775. Another non-recurring item which, however, did not rank as expenditure for the year, was the sum of £473,392 which was transferred to the Working Railways Account out of Consolidated Fund surplus moneys in respect of balance of excess of railway revenue paid to Consolidated Fund from the 1st April, 1896, to the 31st March, 1925, after allowing interest on capital at policy rates. The amount payable under this head was £1,327,649, but from this were deducted charges outstanding in favour of the Consolidated Fund, aggregating £854,257.
The change in the system of treatment of railway revenue and expenditure should be taken into account when comparing the receipts and expenditure of the Consolidated Fund for 1925–26 with the figures for previous years.
An analysis of the revenue received by the Consolidated Fund during each of the last ten financial years is made in the next table.
Revenue under the head of “Taxation” includes Customs and excise duties, land-tax, income-tax, death duties, duties on instruments, a tax on bank-note issue, totalizator-tax, and amusements-tax. Revenue from “Crown Lands” consists of rents and (prior to 1923–24) national-endowment net revenue, but does not include proceeds of sales. The principal item included in the receipts from “Other Sources” is interest on public moneys, other items being departmental receipts, registration and other fees, marine charges, revenue from tourist and health resorts, &c.
| CONSOLIDATED FUND.—REVENUE, 1916–17 TO 1925–26. | |||||||
|---|---|---|---|---|---|---|---|
| Year ended 31st. March, | Revenue derived from | Total Revenue. | |||||
| Taxation. | Railways.* | Post and Telegraph. | Crown Lands. | Other Sources. | Including Hallways. | Excluding Railways. | |
* The figure shown for 1925–26 represents interest on railway capital liability only. | |||||||
| £ | £ | £ | £ | £ | £ | £ | |
| 1917 | 10,549,654 | 4,836,275 | 1,809,317 | 301,758 | 858,190 | 18,355,194 | 13,518,919 |
| 1918 | 12,340,853 | 4,668,273 | 1,837,260 | 306,136 | 1,053,700 | 20,206,222 | 15,537,949 |
| 1919 | 13,801,643 | 4,975,445 | 1,982,539 | 311,558 | 1,281,187 | 22,352,372 | 17,376,927 |
| 1920 | 16,251,769 | 5,766,015 | 2,036,565 | 331,597 | 1,695,394 | 26,081,340 | 20,315,325 |
| 1921 | 22,184,414 | 6,918,492 | 2,478,532 | 319,641 | 2,359,882 | 34,260,961 | 27,342,469 |
| 1922 | 16,370,516 | 6,683,236 | 2,748,480 | 303,178 | 2,021,597 | 28,127,007 | 21,443,771 |
| 1923 | 15,594,288 | 6,719,864 | 2,705,030 | 287,343 | 2,272,918 | 27,579,443 | 20,859,579 |
| 1924 | 16,416,870 | 6,954,469 | 2,681,240 | 222,378 | 1,685,413 | 27,960,370 | 21,005,901 |
| 1925 | 16,172,306 | 7,105,106 | 2,706,882 | 211,749 | 2,446,957 | 28,643,000 | 21,537,894 |
| 1926 | 16,978,496 | 1,913,311 | 3,077,735 | 202,429 | 2,553,791 | 24,725,762 | 22,812,451 |
The second of the two total columns—viz., that excluding railway revenue up to 1924–25 and interest on railway capital liability in 1925–26—affords (he best means of judging the movement in the revenue of the Consolidated Fund over the period. The figures for 1925–26 are, however, inflated somewhat by the operation of the Repayment of the Public Debt Act, 1925, under which the Consolidated Fund is credited with the earnings of the Public Debt Redemption Fund (£897,756 in 1925–26), which are applied towards meeting the charge against the Consolidated Fund in respect of amounts set aside to cover redemptions. Part of this money was already being credited to the Consolidated Fund by way of interest on public moneys, so that the net increase on this account for 1925–26 as compared with 1924–25 is only £314,697.
The principal factor in the increase in the total receipts in 1925–26 was the rise in Customs revenue, which amounted to £8,383,877, as compared with £7,569,389 in 1924–25. Postal and Telegraph revenue increased from £2,706,882 in 1924–25 to £3,077,735 in 1925–26.
Expenditure out of the Consolidated Fund is grouped under two main headings by the Treasury, “Permanent” and “Annual.” Permanent appropriations, as the name implies, are those fixed by special Acts of the Legislature. Annual appropriations are voted each year by resolution of Parliament, and include the cost of the business undertakings of the State. In the following table this grouping has not been adopted, as it is considered more desirable to show the growth of the main items of expenditure during the last ten financial years:—
| Year ended 31st March, | Amount expended on | Total Expenditure, | |||||
|---|---|---|---|---|---|---|---|
| Railways. | Post and Telegraph. | Education. | Public Debt Services. | Other Expenses. | Including Railways. | Excluding Railways. | |
* Losses on isolated sections and branch lines. | |||||||
| £ | £ | £ | £ | £ | £ | £ | |
| 1917 | 2,871,977 | 1,368,490 | 1,525,106 | 4,032,885 | 4,260,312 | 14,058,770 | 11,186,795 |
| 1918 | 3,067,658 | 1,487,145 | 1,640,988 | 4,430,779 | 4,493,718 | 15,120,288 | 12,052,630 |
| 1919 | 3,415,595 | 1,699,701 | 1,737,036 | 6,086,769 | 5,734,498 | 18,673,599 | 15,258,004 |
| 1920 | 4,305,965 | 1,941,494 | 2,190,587 | 7,249,426 | 8,094,052 | 23,781,524 | 19,475,559 |
| 1921 | 6,211,011 | 2,588,360 | 2,633,977 | 7,8631,593 | 8,803,789 | 28,068,730 | 21,857,719 |
| 1922 | 6,478,234 | 2,448,688 | 2,652,299 | 8,442,278 | 8,450,339 | 28,466,838 | 21,993,604 |
| 1923 | 4,946,181 | 2,112,543 | 2,581,601 | 8,899,957 | 7,723,478 | 26,263,760 | 21,317,579 |
| 1924 | 5,153,141 | 2,117,952 | 2,604,508 | 8,881,877 | 7,390,527 | 26,148,005 | 20,994,864 |
| 1925 | 5,636,583 | 2,413,436 | 2,777,271 | 8,862,644 | 7,709,266 | 27,399,200 | 21,762,617 |
| 1926 | 344,830* | 2,406,791 | 2,879,719 | 9,342,164 | 8,596,579 | 23,570,083 | 23,225,253 |
Excluding railway expenditure, an increase of nearly £1,500,000 in expenditure is shown for 1925–26 as compared with 1924–25, the increase being common to all items of importance with the exception of Post and Telegraph expenditure, which shows a slight decrease. The largest increase, that in respect of public-debt services, is due in part to the operation of the Repayment of the Public Debt Act, though interest payments also showed a substantial increase.
Public-debt charges absorbed 40.91 per cent. of revenue, excluding railway revenue, in 1925–26, as compared with 31.83 per cent. in 1915–16. If, however, the receipts from the Working Railways Account in respect of interest on railway capital liability (£1,913,311) be set against interest payments from the Consolidated Fund the proportion for 1925–26 reduces to 32.56 per cent.
In addition to the amounts shown as having been expended on education out of the Consolidated Fund during the last three years, 70 per cent. of the net revenue of the National Endowment Account has also been applied for education purposes. Prior to 1923–24 the net revenue of the National Endowment Account was transferred to the Consolidated Fund, where it was included on the receipts side with the revenue from Crown Lands, and apportioned on the expenditure side between education and old-age pensions in the proportions of 70 per cent. and 30 per cent. respectively. From 1923–24, however, the apportionment is made direct from the National Endowment Account without the net revenue being first transferred to the Consolidated Fund. By comparison with 1922–23 and previous years the revenue from Crown lands in 1923–24 and subsequent years is thus understated, while expenditure on education and on old-age pensions is similarly understated.
| The amounts concerned in the respective years are:— | |||
|---|---|---|---|
| Year ended 31st March. | National Endowment Net Revenue. | Amount apportioned to Education. | Amount apportioned to Old-age Pensions. |
| £ | £ | £ | |
| 1924 | 111,125 | 77,788 | 33,337 |
| 1925 | 123,923 | 86,746 | 37,177 |
| 1926 | 125,017 | 87,512 | 37,305 |
Details or receipts and expenditure of the Consolidated Fund during the year ended the 31st March, 1926, are given. The items of receipts are not grouped in the same form as is followed in the public accounts, on account of the desirability of showing all taxation items together. It should be explained that the amount shown for revenue from taxation is exclusive of the proceeds of tire-tax and of license fees under the Motor-vehicles Act, which are paid into the Main Highways Account and not into the Consolidated Fund.
| CONSOLIDATED FUND.—RECEIPTS, 1925–26. | ||
|---|---|---|
| £ | £ | |
| From taxation— | ||
| Customs revenue | 8,383,877 | |
| Excise duty | 629,558 | |
| Land-tax | 1,266,659 | |
| Income-tax | 3,368,516 | |
| Death duties | 1,484,189 | |
| Duty on instruments | 604,675 | |
| Bank composition | 203,264 | |
| Totalizator revenue | 659,642 | |
| Amusements-tax | 64,162 | |
| Other taxation | 313,954 | |
| 16,978,496 | ||
| Postal | 1,414,081 | |
| Telegraph | 683,371 | |
| Telephone | 980,283 | |
| Registration and other fees | 195,681 | |
| Marine | 106,696 | |
| Interest on public moneys | 605,061 | |
| Interest on railway capital liability | 1,913,311 | |
| Interest on Public Debt Redemption Fund | 897,756 | |
| Local Bodies' Loans Act (refund of cost of roads and bridges proceeds of disposal of lands) | from 19,961 | |
| Rents of buildings | 23,571 | |
| Tourist and health resorts | 56,734 | |
| Territorial revenue | 202,429 | |
| Departmental and other receipts | 648,331 | |
| Net total | 24,725,762 | |
| Credits in aid and in reduction | 3,897,193 | |
| Gross total | £28,622,955 | |
| CONSOLIDATED FUND.—EXPENDITURE, 1925–26. | |||
|---|---|---|---|
| Gross. | Credits. | Net. | |
| £ | £ | £ | |
| Permanent charges— | |||
| Civil List | 29,084 | .. | 29,084 |
| Interest on public debt | 10,184,281 | 2,054,483 | 8,129,798 |
| Amortization of debt | 1,213,023 | 657 | 1,212,366 |
| Pensions | 2,400,296 | 2,508 | 2,397,788 |
| Subsidies to superannuation funds | 154,000 | 60,851 | 93,149 |
| Subsidies to Hospital Boards, &c. | 585,777 | 585,777 | |
| Subsidies, &c., to local bodies | 231,202 | 231,202 | |
| Losses on isolated railway sections and branch lines | 344,830 | 344,830 | |
| Other | 587,242 | 24,309 | 562,933 |
| Total, permanent charges | 15,729,735 | 2,142,808 | 13,586,927 |
| Annual appropriations— | |||
| Legislative Departments | 91,702 | 3,235 | 88,467 |
| Treasury Department | 41,701 | 5,329 | 36,372 |
| Land and Income Tax Department | 69,442 | 3,501 | 65,941 |
| Stamp Duties Department | 107,153 | 16,420 | 90,733 |
| National Provident and Friendly Societies Department | 22,544 | 15 | 22,529 |
| Post and Telegraph working-expenses | 3,050,350 | 643,559 | 2,406,791 |
| Public buildings | 180,516 | 82,281 | 98,235 |
| Government and other domains | 5,792 | 29 | 5,763 |
| Maintenance and improvement of roads | 91,716 | 2,700 | 89,016 |
| Maintenance of irrigation-works | 5,080 | 49 | 5,031 |
| Native Department | 38,710 | 9,417 | 29,293 |
| Department of External Affairs | 26,578 | 981 | 25,597 |
| Cook Islands | 42,799 | 12,716 | 30,083 |
| Department of Industries and Commerce | 145,127 | 39,755 | 105,372 |
| Department of Justice | 147,934 | 12,157 | 135,777 |
| Prisons Department | 152,794 | 79,099 | 73,695 |
| Crown Law Office | 6,447 | 1,465 | 4,932 |
| Police Department | 4,14,300 | 6,265 | 108,035 |
| Pensions Department | 186,226 | 3,269 | 182,857 |
| Mines Department | 47,858 | 1,163 | 46,697 |
| Department of Internal Affairs | 429,467 | 55,031 | 374,436 |
| Audit Department | 44,449 | 20,209 | 24,240 |
| Public Service Commissioner's Office | 10,161 | 2,299 | 7,862 |
| Printing and Stationery | 236,698 | .. | 236,698 |
| Mental Hospitals | 400,464 | 128,259 | 272,205 |
| Department of Health | 358,026 | 94,026 | 264,000 |
| Naval defence | 455,645 | 14,442 | 441,203 |
| Defence | 480,687 | 21,394 | 459,293 |
| Customs Department | 158,675 | 2,301 | 156,374 |
| Marine Department | 128,579 | 6,578 | 122,001 |
| Department of Labour | 50,844 | 1,161 | 49,683 |
| Department of Lands and Survey | 291,027 | 114,140 | 176,887 |
| Scenery preservation | 20,548 | 5 | 20,543 |
| Valuation | 59,573 | 7,788 | 51,785 |
| Electoral | 103,655 | 1,946 | 101,709 |
| Department of Agriculture | 388,086 | 95,893 | 292,193 |
| Tourist and Health Resorts | 71,634 | 840 | 70,794 |
| Education Department | 3,120,209 | 240,490 | 2,879,719 |
| Services not provided for | 54,445 | 24,180 | 30,265 |
| Total, annual appropriations | 11,737,541 | 1,754,385 | 9,983,156 |
| Grand total, expenditure | 27,467,276 | 3,897,193 | 23,570,083 |
If to the gross revenue for the year (£28,622,955) be added a balance of £4,150,806 brought forward from the previous year and amounts totalling £663,077 in respect of sundry items not classed as revenue (reparation-moneys received from Germany, £186,227; balance of New Zealand Consols Account, £475,992; and receipts in respect of Stipendiary Magistrates' pensions, £858), the total receipts become £33,436,838. In addition to the gross expenditure shown (£27,467,276), there were transfers to other accounts aggregating £1,539,553—viz., £566,161 to the Loans Redemption Account, £500,000 to the Public Works Fund, and £473,392 to the Working Railways Account—together with two other small items amounting to £1,917. The deduction of the resultant total (£29,008,746) from the total receipts (£33,436,838) leaves a balance of £4,428,092, which has been carried forward to the current year.
Included in the figures dealt with under the head of “Public Works Fund” are the Public Works Fund General Purposes Account and the separate subsidiary accounts established at various times for special public works. These subsidiary accounts are in general not of a permanent nature, and either become merged in the General Purposes Account or are eventually withdrawn from the Public Works Fund altogether. At present the only subsidiary accounts of the Public Works Fund are tin-Electric Supply Account and the Waihou and Ohinemuri Rivers Improvement Account.
The receipts of the Public Works Fund consist mainly of the proceeds of loans raised for the construction of public works. From time to time the fund has been aided by substantial transfers of surplus revenue from the Consolidated Fund Account. The receipts for the last ten years are shown in the next table:—
| PUBLIC WORKS FUND.—RECEIPTS, 1916–17 TO 1925–26. | ||||||
|---|---|---|---|---|---|---|
| Year ended 31st March, | Amounts received. | Recoveries on account of Expenditure of Previous Years. | Receipts from other Sources. | Total Receipts. | ||
| From Loans. | Transfers from Consolidated Fund. | Receipts from Sales of Electric Energy. | ||||
* To Electric Supply Account. | ||||||
| £ | £ | £ | £ | £ | £ | |
| 1917 | 1,095,000 | 5,712 | 5,125 | 1,105,837 | ||
| 1918 | 1,025,100 | 16,415 | 43,492 | 6,188 | 1,091,195 | |
| 1919 | 1,180,000 | 35,063 | 20,170 | 5,441 | 1,240,080 | |
| 1920 | 2,082,000 | 42,761 | 112,864 | 5,764 | 2,243,389 | |
| 1921 | 4,433,000 | 500,000 | 52,896 | 19,627 | 6,633 | 5,012,156 |
| 1922 | 9,639,682 | 64,700 | 11,610 | 76,918 | 9,792,916 | |
| 1923 | 3,476,890 | 250,000* | 92,431 | 40,175 | 109,069 | 3,968,565 |
| 1924 | 3,061,901 | 1,000,000 | 118,949 | 9,291 | 85,773 | 4,275,914 |
| 1925 | 3,598,996 | 1,000,000 | 135,587 | 40,795 | 57,902 | 4,833,280 |
| 1926 | 5,174,906 | 500,000 | 234,439 | 28,469 | 19,064 | 5,956,878 |
The principal regular item under the heading of “Receipts from other Sources” was until recently receipts under sections 17 and 18 of the Waihou and Ohinemuri Rivers Improvement Act, 1910, which includes payments from the Consolidated Fund, payments from gold-mining companies, and an allotment from gold duty in fixed proportions but varying amounts, together with interest on securities. Another standing item covers receipts in connection with the Ellesmere and Forsyth reclamation; and, commencing with 1917–18, there have been miscellaneous receipts (other than from sales) under section 8 of the State Supply of Electrical Energy Act, 1917. Included in the amounts shown for the last five years are sums of £68,417, £98,828, £79,919, £46,272, and £10,367 respectively, representing interest on investments of the Electric Supply Account.
The next table shows the expenditure from the Public Works Fund, for each of the last ten financial years, upon services which are charged to the fund. As will be seen farther on, the whole of what may be termed public works are not included in this account.
| EXPENDITURE ON SERVICES PROVIDED FOR BY THE PUBLIC WORKS FUND. | |||||||||
|---|---|---|---|---|---|---|---|---|---|
| Year ended 31st March, | Immigration. | Railways. | Roads. | Telegraph Extension. | Development of Water Power. | Public Buildings. | Debt and Loan Charges. | Other Items. | Total. |
| £ | £ | £ | £ | £ | £ | £ | £ | £ | |
| 1917 | 3,533 | 846,983 | 219,794 | 203,311 | 49,030 | 251,431 | 3,539 | 194,892 | 1,775,513 |
| 1913 | 3,856 | 607,931 | 135,642 | 213,955 | 26,734 | 229,288 | 3,502 | 180,929 | 1,401,837 |
| 1919 | Cr. 12,018 | 467,737 | 226,073 | 198,611 | 39,125 | 235,846 | 43,093 | 189,194 | 1,387,601 |
| 1920 | Cr. 62,561 | 812,082 | 388,562 | 219,379 | 58,970 | 469,195 | 24,891 | 262,297 | 2,232,815 |
| 1921 | Cr. 7,308 | 1,428,982 | 538,574 | 336,468 | 356,451 | 502,211 | 35,262 | 468,098 | 3,658,240 |
| 1922 | 247,510 | 3,265,879 | 564,159 | 579,899 | 834,060 | 361,109 | 567,830 | 455,190 | 6,875,636 |
| 1923 | 90,612 | 2,164,934 | 648,006 | 512,656 | 472,873 | 272,420 | 285,974 | 282,204 | 4,729,679 |
| 1924 | 92,600 | 1,776,413 | 749,737 | 717,410 | 812,972 | 196,344 | 518,688 | 294,128 | 5,158,272 |
| 1925 | 136,353 | 1,878,729 | 606,723 | 957,291 | 847,478 | 225,281 | 448,825 | 381,386 | 5,482,069 |
| 1926 | 107,521 | 1,988,614 | 568,628 | 931,661 | 945,573 | 274,284 | 561,922 | 496,110 | 5,874,313 |
The expenditure on roads out of the Public Works Fund does not comprise all of the moneys spent under that head by the General Government. Between 1896–97 and 1910–11, out of the moneys raised for loans to local bodies, the sum of £469,236 was expended on construction of roads to open up Crown lands, and further sums have been spent from time to time for this purpose and for the opening-up of national-endowment lands out of the Land for Settlements and National Endowment Accounts respectively. A new account has now been introduced from which payments are made for the construction, maintenance, and repair of the main highways of the Dominion.
The roading of lands purchased for closer settlement is made a charge upon the Land for Settlements Account, and is included in the value upon which the rentals of those lands are based. The reclamation by drainage and the opening up by means of roads of an area of the Hauraki Plains are provided for out of moneys borrowed for that purpose and shown in a separate account.
The receipts and expenditure of the Public Works Fund and its subsidiary accounts during the financial year ended 31st March, 1926, were as under:—
| PUBLIC WORKS FUND.—RECEIPTS, 1925–26. | ||
|---|---|---|
| £ | £ | |
| Balance, 1st April, 1925 | 621,069 | |
| Consolidated stock under Aid to Public Works and Land Settlement Act. 1922 | 1,084,009 | |
| Consolidated stock under Finance Act, 1923, section 2 (Public Works) | 1,084,009 | |
| Consolidated stock under Finance Act, 1924, section 2 (Public Works) | 1,626,014 | |
| Inscribed stock under Finance Act, 1924, section 2 (Public Works) | 347,550 | |
| Debentures under Finance Act. 1924, section 2 (Public Works) | 92,320 | |
| Debentures under Waihou and Ohinemuri Rivers Improvement Act, 1910, and Finance Act, 1922, section 16 | 14,000 | |
| Debentures under Waihou and Ohinemuri Rivers Improvement Act, 1910, and Finance Act. 1924, section 6 | 55,000 | |
| Consolidated stock under Electric-power Works Loan Act, 1919 | 542,004 | |
| Inscribed stock under Finance Act. 1920, section 15 (Electric-power Works) | 195,550 | |
| Debentures under Finance Act, 1920, section 15 (Electric-power Works) | 134,450 | |
| 5,174,906 | ||
| Transfer from Consolidated Fund | 500,000 | |
| Interest on overdue instalments of loans | 25 | |
| Recoveries on account of expenditure of previous years | 28,469 | |
| Receipts in connection with Ellesmere and Forsyth Reclamation and Akaroa Railway Trust Account | 1,672 | |
| Sales of electric energy | 234,439 | |
| Miscellaneous receipts under the Slate Supply of Electrical Energy Act, 1917 | 3,791 | |
| Interest on securities held by Investment Account under the State Supply of Electrical Energy Act, 1917 | 10,367 | |
| Receipts under the Waihou and Ohinemuri Rivers Improvement Act, 1910 | 3,209 | |
| 281,972 | ||
| Net total | 6,577,947 | |
| Credits in aid and in reduction | 790,945 | |
| Gross total | £7,368,892 | |
| PUBLIC WORKS FUND.—EXPENDITURE, 1925–26. | |||
|---|---|---|---|
| Gross. | Credits. | Net. | |
| £ | £ | £ | |
| Public works, departmental | 203,394 | 76,919 | 126,475 |
| Railways | 2,179,385 | 190,771 | 1,988,614 |
| Public buildings— | |||
| General | 29,568 | 199 | 29,369 |
| Courthouses | 7,215 | 6 | 7,209 |
| Prisons | 24,906 | 710 | 24,196 |
| Police-stations | 16,594 | .. | 16,594 |
| Postal and Telegraph | 90,063 | 197 | 89,866 |
| Agricultural | 7,934 | 2 | 7,932 |
| Mental hospitals | 78,386 | 552 | 77,834 |
| Hospitals and charitable institutions | 32,502 | 1,325 | 31,177 |
| Timber-supply, sawmills, &c. | 10,435 | 20,328 | Cr. 9,893 |
| Quarries | 48,001 | 35,650 | 12,351 |
| Lighthouses | 5,693 | 2 | 5,691 |
| Harbour-works | 3,717 | .. | 3,717 |
| Tourist and health resorts | 43,814 | 328 | 43,486 |
| Immigration | 288,573 | 181,052 | 107,521 |
| Roads, &c. | 579,362 | 14,668 | 564,694 |
| Roads on gold-fields | 3,934 | .. | 3,934 |
| Telegraph extension | 1,045,014 | 113,353 | 931,661 |
| Motor transport service | 4,994 | .. | 4,994 |
| Contingent defence | 89,763 | 93 | 89,670 |
| Lands, miscellaneous | 77,103 | 6,610 | 70,493 |
| Irrigation and water-supply | 58,795 | 2,568 | £227 |
| Waihou and Ohinemuri Rivers improvement | 49,204 | 1,297 | £907 |
| Development of water-power | 982,161 | 36,588 | 94,573 |
| Plant, material, and stores | 91,055 | 57,602 | 33,453 |
| Subsidy to Ellesmere Drainage Board | 483 | .. | 483 |
| Services not provided for | 51,264 | 50,125 | 1,139 |
| Charges of raising loans | 339,959 | .. | 339,959 |
| Recoupment of interest and management charges | 221,963 | .. | 221,963 |
| Adjustment of loan premiums incorrectly credited in 1922–23 | 24 | .. | 24 |
| 6,665,258 | 790,945 | 5,874,313 | |
| Balance, 31st March, 1926 | 703,634 | .. | 703,634 |
| Totals | £7,368,892 | 790,945 | 6,577,947 |
The total net expenditure of the Public Works Fund proper since its inception in 1870 has been £97,248,957, spread over the various classes of public works as follows:—
| NET EXPENDITURE OF PUBLIC WORKS FUND, GENERAL PURPOSES ACCOUNT, 1870 TO 31ST MARCH, 1926. | |
|---|---|
| Class. | Amount. |
| £ | |
| Immigration | 2,932,491 |
| Public works, departmental | 2,293,023 |
| Railways | 48,581,119 |
| Roads | 15,684,081 |
| Land-purchases | 2,061,738 |
| Development of mining | 882,975 |
| Telegraph extension | 8,108,366 |
| Public buildings | 9,604,987 |
| Lighthouses, harbour-works, and defences | 1,206,692 |
| Contingent defence | 1,208,132 |
| Rates on Native lands | 68,672 |
| Thermal springs | 14,600 |
| Development of tourist resorts | 392,628 |
| Lands improvement | 300,151 |
| Plant, material, and stores | 384,631 |
| Charges and expenses of raising loans | 2,339,954 |
| Coal-mines | 10,835 |
| Interest and sinking fund | 218,500 |
| Irrigation and water-supply | 677,408 |
| Timber-supply, sawmills, &c. | 4,172 |
| Acquisition and operation of quarries | 14,167 |
| Motor transport service | 33,635 |
| Transfer to Main Highways Account Construction Fund | 226,000 |
| Total | £97,248,957 |
The total receipts of the fund to 31st March, 1926, were £97,775,378, of which £82,356,695 represented the proceeds of loans, and £14,305,000 transfers from the Consolidated Fund. The largest item in the residue of £1,113,683 was an amount of £506,820 in respect of sinking funds set free. The balance of the fund at 31st March, 1926, was £526,421.
The accounts included under this heading in some cases comprise revenue of different kinds mixed up with loan-money, while others are merely records of transactions which of their nature cannot be considered as properly belonging to the. Public Accounts. Among the former may be counted the State Forests and State Coalmines Accounts, and among the latter the accounts of local bodies, which consist of revenue collected on behalf of and paid over to local authorities, and the Deposit Accounts, consisting partly of moneys held in trust and partly of moneys held in suspense for various reasons. As further indicating the function of these special accounts one or two of more recent creation may be mentioned: the War Expenses Account, which was called into existence by the war; the Education Loans Account, originated in 1919 for the purpose of raising money for acquisition of land and construction of buildings for educational purposes; and the Main Highways Account, created in 1923 for the purpose of providing finance for the construction and improvement of the main highways of the Dominion.
While in some instances transactions in the accounts have been on a fairly large scale, yet from the nature of the subject it will readily be seen that most of the receipts and expenditure have been directly concerned with the special matters which were the objects of the creation of the separate funds. In the table following a summary is given of the receipts and expenditure of each separate account, together with the balances at the beginning and end of the financial year respectively. In order that the summary may the more completely indicate the main, transactions of the whole of the public moneys, the main totals of the Consolidated and Public Works Funds, which have been treated earlier in this section, have also been included. All figures shown are gross amounts.
| RECEIPTS AND EXPENDITURE OF ACCOUNTS, 1925–26, WITH BALANCES AT 1ST APRIL, 1925, AND 31ST MARCH, 1926. | |||||
|---|---|---|---|---|---|
| Account. | Balance, 1st April, 1925. | Receipts. | Expenditure. | Balance 31st March, 1926 | |
| In Cash and Imprests. | In Investments. | ||||
| £ | £ | £ | £ | £ | |
| Consolidated Fund (proper) | 4,150,806 | 30,661,032 | 30,383,746 | 2,569,518 | 1,858,574 |
| State Coal-mines | 22,075 | 237,085 | 240,588 | 1,072 | 17,500 |
| State Coal-mines Sinking Fund | 41,669 | 6,530 | .. | 319 | 47,880 |
| Nauru and Ocean Islands | 41,717 | 37,766 | 76,357 | 3,126 | .. |
| Nauru and Ocean Islands Sinking Fund | 13,539 | 6,630 | 20,150 | 19 | .. |
| Local Bodies | 10,562 | 22,458 | 22,556 | 10,464 | .. |
| Deposits | 417,157 | 1,698,524 | 1,762,061 | 8,170 | 345,450 |
| Public Works (General Purposes) | 379,439 | 6,141,131 | 5,994,149 | 467,421 | 59,000 |
| Waihou and Ohinemuri Rivers Improvement | 273 | 73,506 | 52,069 | 21,710 | .. |
| Electric Supply | 229,248 | 1,157,652 | 1,248,788 | 48,112 | 90,000 |
| Electric Supply Sinking Fund | 12,108 | 5,283 | .. | 1 | 17,390 |
| Advances to Other Governments | 437 | 332,064 | 300,989 | 31,512 | .. |
| Bank of New Zealand | 875,000 | .. | .. | .. | 875,000 |
| Cheviot Estate | 223,950 | 26,332 | 45,376 | 73,686 | 131,220 |
| Conversion | 6,074 | .. | 6,074 | .. | .. |
| Deteriorated Lands | .. | 2,000 | 272 | 1,728 | .. |
| Discharged Soldiers Settlement | 178,011 | 1,642,159 | 1,693,897 | 26,454 | 99,819 |
| Discharged Soldiers Settlement Loans Act 1920 Depreciation Fund | 271,735 | 61,876 | 38,564 | 18,197 | 276,850 |
| Education Loans | 126,455 | 484,874 | 571,174 | 40,155 | .. |
| General Purposes Relief | 18,169 | 6,067 | 2,922 | 6,314 | 15,000 |
| Hauraki Plains Settlement | 5,907 | 103,121 | 75,522 | 33,506 | .. |
| Howard Estate | .. | 243 | 243 | .. | .. |
| Hunter Soldiers' Assistance Trust | 2,548 | 663 | 127 | 334 | 2,750 |
| Kauri-gum Industry | 2,435 | 15,594 | 14,587 | 3,442 | .. |
| Land Assurance | 86,699 | 4,181 | 10,121 | 2,359 | 78,400 |
| Land for Settlements | 60,903 | 581,751 | 509,486 | 6,168 | 127,000 |
| Account. | Balance, 1st April, 1925. | Receipts. | Expenditure. | Balance 31st March, 1926. | |
|---|---|---|---|---|---|
| In Cash and Imprests. | In Investments. | ||||
| £ | £ | £ | £ | £ | |
| Laud for Settlements (Discharged Soldiers Settlement) | 7,632 | 85,372 | 21,731 | 21,273 | 50,000 |
| Land for Settlements (Opening up Crown Lands) | 4,182 | 27,760 | 25,339 | 6,603 | .. |
| Loans Redemption (net) | 66,962 | .. | 48,453 | 18,509 | .. |
| Main Highways Account Revenue | 581,373 | 381,660 | 308,424 | 2,609 | 652,000 |
| Main Highways Account Construction | 546 | 607,981 | 488,423 | 30,104 | 90,000 |
| -Mining Advances | 11,857 | 789 | .. | 2,646 | 10,000 |
| National Endowment | 126,655 | 149,332 | 149,494 | 26,393 | 100,100 |
| National Endowment Trust | 16,637 | 5,342 | 1,773 | 516 | 19,690 |
| Native Land Settlement | 158,012 | 119,128 | 172,808 | 41,332 | 63,000 |
| Public Debt Repayment | .. | 872,734 | 870,638 | 2,096 | .. |
| Railways Improvement | 577,601 | 565,731 | 862,671 | 43,761 | 236,900 |
| Rangitaiki Land Drainage | 49,014 | 2,190 | 27,020 | 4,184 | 20,000 |
| Reserve Fund | 2,000,000 | .. | .. | .. | 2,000,000 |
| Samoan Loan | .. | 15,000 | 15,000 | .. | .. |
| State Advances Loan | 344,786 | 6,518,080 | 4,570,177 | 151,474 | 2,141,215 |
| State Forests | 169,399 | 173,011 | 214,549 | 2,361 | 125,500 |
| Swamp Land Drainage | 32,866 | 36,694 | 57,058 | 12,502 | .. |
| War Expenses | 8,480 | 31,962 | 40,442 | .. | .. |
| Westport Harbour | 55,315 | 56,983 | 42,277 | 21,521 | 48,500 |
| Working Railways | .. | 9,267,908 | 8,469,758 | 623,150 | 175,000 |
| New Zealand Consols | 475,992 | .. | 475,992 | .. | .. |
| Totals | 11,864,225 | 62,226,179 | 59,931,845 | 4,384,821 | 9,773,738 |
The State Advances Account, covering State advances to settlers, workers, and local authorities, together with several minor accounts dealing with advances for various purposes, which are administered directly by the State Advances Board, are not included in the above statement, and only the balances of the Loans Redemption Account have been utilized. In addition, there are the funds of the Government Life Insurance Department, the State Fire and Accident Insurance Department, and the Public Trust Office, which are administered by the Departments concerned. Reference to the working of these Departments will be found elsewhere in this book.
In the totals of receipts and expenditure given in the foregoing table, the figures represent gross amounts—i.e., inclusive of credits is Aid and credits in reduction. A statement of the amounts involved in each account, which gives a good indication as to the extent to which comparisons with years prior to 1924–25 are disturbed, is appended:—
| Account or Fund. | £ |
|---|---|
| Consolidated | 3,897,193 |
| State Coal-mines | 1,395 |
| Public Works | 753,061 |
| Waihou and Ohinemuri Rivers Improvement | 1,297 |
| Electric Supply | 36,588 |
| Discharged Soldiers Settlement | 28,778 |
| Education Loans | 6,225 |
| Hauraki Plains Settlement | 10,546 |
| Kauri-gum Industry | 69 |
| Land for Settlements | 24,816 |
| Land for Settlements (Discharged Soldiers Settlement) | 4,283 |
| Land for Settlements (Opening-up Crown Lands for Settlement) | 13 |
| Main Highways Account Revenue | 5,228 |
| Main Highways Account Construction | 15,967 |
| Native Land Settlement | 159 |
| Railways Improvement | 23,088 |
| Rangitaiki Land Drainage | 1,038 |
| State Forests | 1,545 |
| Swamp Land Drainage | 650 |
| War Expenses | 6,363 |
| Westport Harbour | 62 |
| Working Railways | 574,793 |
| Total | £5,393,157 |
The aggregate of credits in aid and credits in reduction in the previous year was £5,857,214.
Of the total gross receipts for 1925–26, amounting to £62,226,179, the proceeds of new loans represented £18,374,539, against which, however, should be taken into account the sum of £2,005,444, utilized from various accounts for the redemption of loans. The figures for the various accounts are:—
| Account or Fund. | Loan-money received. | Amount paid out for Redemptions. |
|---|---|---|
| £ | £ | |
| Consolidated | .. | 899,449 |
| Nauru and Ocean Islands | .. | 40,000 |
| Nauru and Ocean Islands Sinking Fund | .. | 20,150 |
| Public Works (General Purposes) | 4,233,902 | .. |
| Waihou and Ohinemuri Rivers Improvement | 69,000 | .. |
| Electric Supply | 872,005 | .. |
| Cheviot Estate | .. | 35,613 |
| Conversion | .. | 6,074 |
| Deteriorated Lands | 2,000 | .. |
| Discharged Soldiers Settlement | .. | 13,250 |
| Discharged Soldiers Settlement Loans Act 1920 Depreciation Fund | .. | 38,371 |
| Education Loans | 478,650 | .. |
| Hauraki Plains Settlement | 70,000 | .. |
| Land for Settlements | .. | 22,575 |
| Main Highways Account Construction | 542,004 | .. |
| Native Land Settlement | .. | 2,400 |
| Public Debt Repayment | .. | 870,638 |
| Railways Improvement | 542,005 | .. |
| Samoan Loan | 15,000 | .. |
| State Advances Loan | 6,514,973 | .. |
| Swamp Land Drainage | 35,000 | .. |
| War Expenses | .. | 33,217 |
| West port Harbour | .. | 23,707 |
| Totals, all accounts | £13,374,539 | £2,005,444 |
The £2,005,444 shown as paid out of accounts for redemptions does not represent the whole of the loan-money paid off during the year, £328,264 of loans having been redeemed from other sources, as shown in Subsection C of this section. The £15,000 of new money received by the Samoan Loan Suspense Account was advanced to the Samoan Treasury, and of the £6,514,973 paid into the State Advances Loan Account £4,385,000 was paid over to the State Advances Office during the year.
Of the total of £13,374,539 new loan-money, £588,064 was raised to cover charges and expenses of raising loans, allocated as follows:—
| Account or Fund. | Amount. |
|---|---|
| £ | |
| Public Works (General Purposes) | 294,032 |
| Electric Supply | 42,005 |
| Main Highways Account Construction | 42,004 |
| Railways Improvement | 42,005 |
| State Advances Loan | 168,018 |
| Total | £588,064 |
Stock issued to cover charges and expenses of raising loans, while adding to the public debt, does not increase the available moneys of the accounts concerned, which are debited with the charges and expenses involved. Another charge which has to be met by the accounts is in respect of stamp duty on transfers of stock. The figures for the various accounts for charges and expenses of raising loans or in connection with transfers of stock are as follows for the year 1925–26:—
| Account or Fund. | Amount. |
|---|---|
| £ | |
| Consolidated | 204 |
| Public Works (General Purposes) | 297,181 |
| Electric Supply | 42,778 |
| Discharged Soldiers Settlement | 1,849 |
| Discharged Soldiers Settlement Loans Act 1920 Depreciation Fund | 193 |
| Education Loans | 83 |
| Land for Settlements | 26 |
| Main Highways Account Construction | 42,008 |
| Native Land Settlement | 331 |
| Railways Improvement Authorization | 42,008 |
| State Advances Loan | 185,177 |
| State Forests | 95 |
| Swamp Land Drainage | 44 |
| War Expenses | 242 |
| Total | £612,219 |
Another small item of expenditure in respect of loans is that in respect of recoupment of management expenses of consolidated stock, which totalled £914 in 1925–26, spread over eight accounts. Finally there are the interest payments, which are dealt with under the next heading.
During the year ended 31st March, 1926, the huge total of £10,184,281 was paid out of the Consolidated Fund by way of interest on the public debt. Of this amount £2,054,483 was recovered from other accounts or funds and ranked as credits in reduction, while the sum of £1,913,311 interest on railway capital liability, which was transferred to the Consolidated Fund from the Working Railways Account, may also be regarded as a set-off against the interest payments on account of public debt. Interest on public moneys (£605,061) is in a somewhat different category, and interest on the Public Debt Redemption Fund (£897,756) is utilized entirely for debt-repayment purposes.
Of the £2,054,483 credits in reduction of interest payments on the public debt, £1,102,246 was recovered from other accounts or funds included in the public accounts, the details being—
| Account or Fund. | Interest recouped to Consolidated Fund. |
|---|---|
* Not including £540,000 paid as interest on money transferred from Consolidated Fund and credited to item “Interest on Public Debt Redemption Fund.” | |
| £ | |
| State Coal-mines | 9,252 |
| Nauru and Ocean Islands | 30,000 |
| Waihou and Ohinemuri Rivers Improvement | 2,865 |
| Electric Supply | 218,728 |
| Cheviot Estate | 8,866 |
| Discharged Soldier Settlement | 340,691* |
| Land for Settlements | 355,065 |
| Land for Settlements (Opening up Crown Lands for settlement) | 8,146 |
| Main Highways Account Revenue | 14,500 |
| Native Land Settlement | 76,750 |
| State Forests | 28,004 |
| Swamp Land Drainage | 9,379 |
| Total | £1,102,246 |
Two important classes of transfers between accounts, which go to swell the aggregate revenue and expenditure, have been dealt with—viz., the interest recoupments to the Consolidated Fund (£1,102,246, or, including interest on railway capital liability, £3,015,557), and the transfers of amounts (aggregating £1,134,806) to the Loans Redemption Account for the redemption of loan-money or the reduction of the funded debt. To the latter should be added the sum of £872,734 paid out of the Consolidated Fund to the Public Debt Repayment Account, to be also used for debt-reduction purposes.
These items by no means cover the full amount of transfers between accounts. as will be seen from the following list of further transfers, aggregating £2,927,585 The £540,000 transferred from the Discharged Soldiers Settlement Account to the Consolidated Fund was by way of interest at 4 per cent. on the £13,500,000 of surplus revenue of the Consolidated Fund transferred to the Discharged Soldiers Settlement Account in 1920–21 and 1921–22, and now forming part of the Public Debt Redemption Fund.
| Account or Fund from which transferred. | Account or Fund to which transferred. | Amount. |
|---|---|---|
| £ | ||
| Consolidated | Working Railways | 820,168 |
| ,, | Public Works | 500,000 |
| ,, | Public Works (temporary) | 125,000 |
| ,, | Waihou and Ohinemuri Rivers Improvement | 83 |
| ,, | Advances to Other Governments | 30,000 |
| ,, | Kauri-gum Industry | 10,000 |
| ,, | Discharged Soldiers Settlement Loans Act 1920 Depreciation Fund | 50,000 |
| ,, | Main Highways Account Revenue | 35,000 |
| ,, | Main Highways Account Revenue (tire-tax) | 39,200 |
| State Coal-mines | State Coal-mines Sinking Fund | 4,552 |
| Nauru and Ocean Islands | Nauru and Ocean Islands Sinking Fund | 5,849 |
| Public Works | Consolidated (refund of temporary transfer) | 125,000 |
| ,, | Main Highways Account Construction (temporary) | 50,000 |
| Electric Supply | Electric Supply Sinking Fund | 4,748 |
| Advances to Other Governments | Consolidated | 10,168 |
| Cheviot Estate | ,, | 859 |
| Discharged Soldiers Settlement | ,, | 540,000 |
| Hauraki Plains Settlement | ,, | 3 |
| Land for Settlements | ,, | 657 |
| ,, | Public Works | 850 |
| ,, | Land for Settlements (Opening up Crown Lands for Settlement) | 10,000 |
| ,, | Discharged Soldiers Settlement | 15,504 |
| Land for Settlements (Discharged Soldiers Settlement) | ,, | 6,408 |
| Main Highways Account Construction | Public Works (refund of temporary transfer) | 50,000 |
| National Endowment | National Endowment Trust | 53 |
| National Endowment Trust | Land for Settlements | 1,746 |
| Native Land Settlement | Consolidated | 3,973 |
| ,, | Discharged Soldiers Settlement | 2,031 |
| State Forests | National Endowment | 9,741 |
| New Zealand Consols | Consolidated | 475,992 |
| Total | £2,927,585 | |
Altogether a total sum of £7,950,682 is shown to have been transferred between accounts, for one purpose or another, during the year. In addition the £15,000 borrowed for the Samoan Loan Suspense Account was advanced to the Samoan Treasury, and £4,385,000 of the £6,514,973 loan-money paid into the State Advances Loan Account was transferred to the State Advances Office.
The receipts and payments of the Deposits Account (£1,698,524 and £1,762,061 respectively) and of the Accounts of Local Bodies (£22,458 and £22,556) do not represent revenue and expenditure of the State, the receipts consisting merely of moneys held on deposit, and not available for expenditure on Governmental services. The Advances to Other Governments Account covers payment on behalf of Governments of other countries (£290,821 in 1925–26), and recoveries in respect of these payments (£302,064 in 1925–26).
Included in the expenditure of some accounts are advances made for the purpose of providing financial assistance to settlers and others, while the receipts side is swelled by the inclusion of interest payments on the money advanced and of repayments of principal moneys. Another item of revenue which comes within the same category is interest on the investment of cash balances and other public moneys, and still another is that covering rents and royalties obtained in respect of the public estate.
It should again be pointed out that the public accounts of the Treasury do not cover the operations of the State Advances Department, and that consequently the figures shown in the table following do not cover interest on and repayments of money advanced under the schemes of advances to settlers, workers, and local authorities, which are dealt with in Subsection D of this section.
| ADVANCES MADE AND RECEIPTS FROM ADVANCES AND OTHER INVESTMENTS, 1925–26. | |||||
|---|---|---|---|---|---|
| Account or Fund. | Advances made. | Repayments of Principal.* | Interest. | Rents, Royalties, and Rates. | |
| From Advances. | From Investment Account and other Sources. | ||||
* Including recoveries on account of expenditure of previous years. † Contribution by British Phosphate Commission towards interest and sinking fund. | |||||
| £ | £ | £ | £ | £ | |
| Consolidated | .. | 70,603 | .. | 1,502,817 | 231,374 |
| State Coal-mines | .. | 223 | .. | 755 | .. |
| State Coal-mines Sinking Fund | .. | .. | .. | 1,978 | .. |
| Nauru and Ocean Islands | .. | .. | .. | 1,918 | 35,849† |
| Nauru and Ocean Islands Sinking Fund | .. | .. | .. | 781 | .. |
| Public Works (General Purposes) | .. | 27,475 | .. | 22 | 1,671 |
| Electric Supply | .. | 994 | .. | 9,832 | .. |
| Electric Supply Sinking Fund | .. | .. | .. | 535 | .. |
| Cheviot Estate | .. | .. | .. | 9,089 | 17,179 |
| Deteriorated Lands | 272 | .. | .. | .. | .. |
| Discharged Soldiers Settlement | 727,094 | 877,449 | 657,717 | 11,224 | 20,364 |
| Discharged Soldiers Settlement Loans Act 1920 Depreciation Fund | .. | .. | .. | 11,876 | .. |
| General Purposes Relief | 2,922 | 3,672 | 1,720 | 675 | .. |
| Hauraki Plains Settlement | .. | .. | .. | 111 | 20,329 |
| Hunter Soldiers' Assistance Trust | .. | .. | .. | .. | 664 |
| Land Assurance | .. | .. | .. | 3,446 | 735 |
| Land for Settlements | .. | 3,195 | 29,169 | 364,009 | |
| Land for Settlements (Discharged Soldiers Settlement) | .. | .. | .. | 1,235 | 75,548 |
| Land for Settlements (Opening up Crown Lands for Settlement) | .. | .. | .. | .. | 17,747 |
| ADVANCES MADE AND RECEIPTS FROM ADVANCES AND OTHER INVESTMENTS, 1925–26 | |||||
|---|---|---|---|---|---|
| Account or Fund. | Advances made. | Repayments of Principal.* | Interest. | Rents, Royalties, and Rates. | |
| From Advances. | From Investment Account and other Sources. | ||||
* Including recoveries on account of expenditure of previous years. † Excluding wharfage and port charges. | |||||
| £ | £ | £ | £ | £ | |
| Main Highways Account Revenue | .. | .. | 26,039 | .. | |
| Main Highways Account Construction | .. | 7 | .. | 3 | .. |
| Mining Advances | .. | 620 | 169 | .. | .. |
| National Endowment | .. | .. | .. | 4,893 | 134,698 |
| National Endowment Trust | .. | .. | .. | 161 | .. |
| Native Land Settlement | .. | 484 | 646 | 13,837 | 50,207 |
| Rangitaiki Land Drainage | .. | .. | .. | 919 | 76 |
| State Forest | .. | 201 | .. | 7,178 | 145,522 |
| Swamp Land Drainage | .. | .. | .. | 633 | 410 |
| War Expenses | .. | 25,599 | .. | .. | .. |
| Westport Harbour | .. | .. | .. | 2,021 | 25,467† |
| Working Railways | .. | .. | .. | 435 | .. |
| Totals | 730,288 | 1,010,522 | 660,252 | 1,641,582 | 1,141,849 |
Absolute accuracy in compiling the above statement is not claimed, as it has been found impossible in some cases to distinguish between revenue from rents and from land sales. Under the heading of repayments for the Consolidated Fund are included recoveries on account of expenditure of previous years and receipts under section 76 of the Local Bodies' Loans Act, 1908, which provides for recoupment of the cost of roads and bridges out of the proceeds of disposal of land. The item “Rents,” &c., is composed of territorial revenue (rents and royalties), rents of buildings, and marine receipts on account of foreshore rents and royalties.
ALL revenue collected by means of taxation was until the end of the financial year 1921–22 paid into the Consolidated Fund and applied to general purposes. From 1922–23 onwards, however, part of the Customs revenue—i.e., that derived from the duty on tires—is being paid into the Main Highways Account Revenue Fund to help to defray the cost of improving and maintaining roads; and, commencing with the year 1924–25, taxation derived from the licensing of motor-vehicles is also paid into the Main Highways Account Revenue Fund for a similar purpose.
Customs duties on imported goods, excise duties on beer and tobacco, land and income taxes, death duties, duties on instruments, licensing fees under the Motor-vehicles Act, a tax on bank-note issues, a tax on totalizator investments, and an amusements-tax are the main sources of revenue by taxation.
Particulars of the collections during the last ten years, under the main headings, are shown in the following table. The figures for 1925–26 include sums of £189,511 in respect of tire-tax and £86,681 in respect of licensing fees under the Motor-vehicles Act, which amounts were paid direct into the Main Highways Account Revenue Fund. The total taxation for the year differs by these amounts from that shown in the preceding subsection as having been paid into the Consolidated Fund from taxation.
| Year ended 31st March. | Amount of Taxation derived from | Total. | |||||
|---|---|---|---|---|---|---|---|
| Customs and Excise Duties. | Land-tax. | Income-tax. | Death Duties. | Totalizator Taxes. | Other Taxes. | ||
| £ | £ | £ | £ | £ | £ | £ | |
| 1917 | 4,037,628 | 713,118 | 4,262,126 | 570,040 | 251,436 | 715,306 | 10,549,654 |
| 1918 | 3,601,383 | 1,385,708 | 5,619,561 | 805,511 | 213,932 | 714,758 | 12,340,853 |
| 1919 | 4,104,016 | 1,512,693 | 6,219,336 | 869,371 | 229,273 | 866,954 | 13,801,643 |
| 1920 | 5,185,728 | 1,557,903 | 6,369,765 | 978,095 | 413,654 | 1,746,624 | 16,251,769 |
| 1921 | 8,769,251 | 1,688,979 | 8,248,945 | 1,106,925 | 497,961 | 1,872,353 | 22,184,414 |
| 1922 | 5,554,334 | 1,637,816 | 6,002,987 | 1,512,754 | 515,249 | 1,147,376 | 16,370,516 |
| 1923 | 6,765,512 | 1,541,502 | 3,831,932 | 1,829,852 | 607,657 | 1,138,925 | 15,715,380 |
| 1924 | 7,993,877 | 1,426,463 | 3,781,532 | 1,517,315 | 618,425 | 1,202,826 | 16,540,438 |
| 1925 | 8,339,576 | 1,335,251 | 3,386,052 | 1,520,749 | 590,385 | 1,377,596 | 16,549,609 |
| 1926 | 9,202,946 | 1,266,659 | 3,368,516 | 1,484,189 | 659,642 | 1,272,736 | 17,254,688 |
The increase of £705,079 in the total for 1925–26 as compared with 1924–25 is more than accounted for by the increase in Customs revenue. With the exception of totalizator revenue, all other important heads of taxation revenue show decreases.
The percentage under each heading to the total amount collected for each of the last ten years is as under:—
| Year ended 31st March. | Proportion per Cent. derived from | |||||
|---|---|---|---|---|---|---|
| Customs and Excise Duties. | Land-tax. | Income-tax. | Death Duties. | Totalizator Taxes. | Other Taxes. | |
| Per Cent. | Per Cent. | Per Cent. | Per Cent. | Per Cent. | Per Cent. | |
| 1917 | 38.27 | 6.76 | 40.40 | 5.40 | 2.38 | 6.79 |
| 1918 | 29,18 | 11.23 | 45.54 | 6.53 | 1.73 | 5.79 |
| 1919 | 29.74 | 10.96 | 45.06 | 6.30 | 1.66 | 6.28 |
| 1920 | 31.91 | 9.59 | 39.19 | 6.02 | 2.55 | 10.74 |
| 1921 | 39.53 | 7.61 | 37.18 | 4.99 | 2.24 | 8.45 |
| 1922 | 33.93 | 10.00 | 36.67 | 9.24 | 3.15 | 7.01 |
| 1923 | 43.05 | 9.81 | 24.38 | 11.64 | 3.87 | 7.25 |
| 1924 | 48.33 | 8.62 | 22.86 | 9.18 | 3.74 | 7.27 |
| 1925 | 50.39 | 8.07 | 20.46 | 9.19 | 3.57 | 8.32 |
| 1926 | 53.34 | 7.34 | 19.52 | 8.60 | 3.82 | 7.38 |
Some remarkable alterations in percentages are noticed during the last few-years, these being due partly to war and post-war conditions, with consequential alterations in the relative incidence of taxation, and partly to the fluctuations in the volume of imports, which materially affect the position of Customs revenue, now the principal class of taxation.
The revenue from taxation per head of mean population, including Maoris, during the last ten years is shown in the next table:—
| Year ended 31st March. | Rate per Head. | ||
|---|---|---|---|
| £ | s. | d. | |
| 1917 | 9 | 3 | 7 |
| 1918 | 10 | 14 | 1 |
| 1919 | 11 | 17 | 1 |
| 1920 | 13 | 11 | 1 |
| 1921 | 17 | 14 | 4 |
| 1922 | 12 | 14 | 8 |
| 1923 | 11 | 19 | 8 |
| 1924 | 12 | 8 | 0 |
| 1925 | 12 | 3 | 5 |
| 1926 | 12 | 7 | 11 |
In spite of much higher imports (with consequential higher Customs revenue), and the imposition of a new class of taxation in the shape of licensing fees under the Motor-vehicles Act, a slight fall is recorded in 1925–26 as compared with 1923–24. The 1925–26 rate per head, exclusive of motor-license fees, would have been £12 6s. 8d.
The amount of revenue derived from Customs and excise duties during each of the last ten years is shown below. The figures shown for the Main Highways Account Revenue Fund refer only to tire-tax paid direct into that fund. In addition to the amount of £189,511 shown under this head in 1925–26, the sum of £39,200, tax in respect of tires on imported cars, is included in the amount of £8,383,877 shown as Customs revenue of the Consolidated Fund, having been paid into that fund and subsequently transferred to the Main Highways Account Revenue Fund.
| Year ended 31st March. | Customs Duties. | Excise Duties. | Total. | |
|---|---|---|---|---|
| Consolidated Fund. | Main Highways Account Revenue Fund. | |||
| £ | £ | £ | £ | |
| 1917 | 3,849,675 | .. | 187,953 | 4,037,628 |
| 1918 | 3,364,308 | .. | 237,075 | 3,601,383 |
| 1919 | 3,830,682 | .. | 273,334 | 4,104,016 |
| 1920 | 4,830,325 | .. | 355,403 | 5,185,728 |
| 1921 | 8,408,726 | .. | 360,525 | 8,769,251 |
| 1922 | 5,095,436 | .. | 458,898 | 5,554,334 |
| 1923 | 6,032,292 | 121,092 | 612,128 | 6,765,512 |
| 1924 | 7,238,215 | 123,568 | 632,094 | 7,993,877 |
| 1925 | 7,569,389 | 119,803 | 650,384 | 8,339,576 |
| 1926 | 8,383,877 | 189,511 | 629,558 | 9,202,946 |
The revenue from Customs duties in 1915–16 was £3,366,171, and the increase under that head for the ten years is therefore 155 per cent. In the ten calendar years corresponding to the above period the value of imports (excluding specie) increased from £20,658,720 to £52,425,757, or by 154 per cent.
The abnormally high Customs revenue collected in 1920–21 was the direct outcome of the large importations resulting from the fulfilment of delayed orders of a very considerable quantity and value. As was to be expected, the revenue fell almost to its former level in 1921–22, but increased again after that year. The figure for 1925–26 (£8,573,388) is the highest ever recorded. Excise revenue has nearly doubled since 1920–21, owing to a corresponding increase in the rate of beer duty.
Generally speaking, in spite of slight increases in Customs duties as part of the war taxation, the average rate of duty has not increased greatly during recent years. The increase in the total Customs duties collected is thus almost entirely due to the increased prosperity of the country as reflected by its trade.
For a fuller discussion of Customs taxation than can be given here the reader is referred to the section of this book dealing with “External Trade.”
Except in regard to minor details, the system of land and income taxation in force in 1915 had remained unaltered for many years. Probably the only noteworthy point was the gradual hardening-up of the graduated land-tax, designed to prevent aggregation of land and to compel the cutting-up of large estates rather than to secure additional revenue.
The war taxation of 1915, however, not only included increased rates of 33 ½ per cent. in the case of income-tax, ¼d. in the pound in the case of land-tax payable on mortgages, and 50 per cent. in the case of graduated land-tax. but also involved an important change of principle. Among the incomes previously exempt from income-tax were those derived directly from land, but in 1915 income-tax was made payable on such incomes.
With the exception of the abolition of the land-tax on mortgages and the substitution of an income-tax in its place, the principles of land-tax assessment were not altered in 1916, nor were the rates increased, but an entirely new scheme known as the excess-profits tax was brought into operation in respect of income-tax, the 1915 system remaining also, with increased rates, for ordinary income-tax. The excess-profits tax being found inequitable and otherwise unsatisfactory, a system of progressive land and income tax, with a special war tax on incomes, was adopted in 1917.
In 1920 a complete revision of the rates of taxation was made. The new rates became effective on assessments for the year commencing on the 1st April. 1921, and for following years. A feature of the new legislation was the introduction of a deduction from the amount of tax payable of 10 per cent. in respect of tax assessed on “earned income.”
In 1923 further alterations were made, the principal being the restoration of the exemption from income-tax of incomes derived from the direct use or cultivation of land. Reductions in the rates of taxation were also made, and are referred to in detail under the heading of “Income-tax” farther on.
Further reductions in income-tax rates were made in 1924 and 1925, and other alterations in respect of exemptions, method of assessment, &c., were also made.
The 1925 number of this book contains a summary of the recommendations of a Royal Commission which was appointed in April, 1924, to inquire into “the present system of land and income taxation in New Zealand in all its aspects, including the scope, rates, and incidence of the several taxes; allowances and reliefs; assessment, appeal, and collection; and prevention of evasion.”
Sections XXXIII and XXXIV of this book contain some interesting statistics showing the incidence of land and income tax, and the distribution of land values and incomes.
Land-tax is assessed on the unimproved value of land after deductions provided for by statute have been made by way of special exemption. These exemptions are referred to hereunder.
The basis of taxation prior to 1917 was a double system of ordinary and graduated tax. For some years the ordinary rate had been 1d. for each pound of unimproved value, while the graduated tax ranged at a varying rate from 1/32d. to 5 5/6d. in the pound, according as to whether the value of the land was from £5,000 to £200,000 or more. Tills system of taxation was abolished in 1917, and in its place was instituted a single progressive tax.
As the amended law operated for the four financial years 1917–18 to 1920–21, the scale of taxation ranged from 1d. to 7d. in the pound. The 1d. rate applied in cases where the unimproved value on which tax was payable did not exceed £1,000, and the rate was increased by 1/32000 of a penny for every pound in excess of £1,000 up to a maximum of 7d. These rates, however, proved to be merely nominal, as for the four years concerned a super-tax of 50 per cent. virtually increased the minimum to 1 ½d. and the maximum to 10 ½d. in the pound. A further 50-per-cent. increase on the total amount assessed is imposed in the case of absentees, including shareholders in companies, but not in the case of companies themselves.
Further alteration in the rate of land-tax was made by the Legislature in 1920, and became effective for assessments after the 1st April, 1921. The scale of taxation of land the unimproved value of which does not exceed £1,000 remained as before at the rate of a penny in the pound, but the rate thereafter was increased by ½0000 of a penny for every pound in excess of £1,000 up to a maximum of 7 17/20d. For the year 1921–22 the rate of super-tax was reduced to 33 ⅓ per cent., and on the whole of the land-tax a rebate of 10 per cent. was allowed for prompt payment. The super-tax was continued for the year 1922–23 at the rate of 10 per cent. only, without any rebate, and for the year 1923–24 was removed altogether, while for 1924–25 and 1925–26 a deduction of 5 per cent. from the tax computed according to the scale rates mentioned has been provided.
The special exemptions deductible from the unimproved value for the purpose of arriving at the taxable balance have not been materially altered by recent legislation. Under the law as it has operated since the 1st April, 1917, an owner of land the unimproved value of which does not exceed £1,500 is allowed an exemption of £500, and where the unimproved value lies between £1,500 and £2,500 there is a similar exemption, diminished, however, by £1 for every £2 over the £1,500 mark, so that no exemption is allowed when £2,500 is reached.
Where the land is subject to a registered mortgage an alternative scale is provided —viz., £10,000 in cases where the unimproved value does not exceed £10,000, the exemption of £10,000 to be diminished by £2 for every £1 above the margin of £10,000 of unimproved value. Where the capital value of the mortgage is less than the amount of deduction provided, such capital value is to he deducted instead. Prior to 1921 the mortgage exemption was £1,500 in cases where the unimproved value did not exceed £3,000, and from then to 1924, £4,000 up to a maximum of £6,000 unimproved value. A deduction of £1 for every £2 of unimproved value above the maximum was provided under the former scale, and of £2 for every £1 under the latter; so that the exemptions disappeared altogether at £6,000 and £8,000 respectively, as compared with £15,000 at present.
No special exemption is allowed in the case of land not situated in a borough, which has been owned by a person for three years and not improved to the extent of £1 per acre or equal to one-third of the unimproved value, when in the opinion of the Commissioner of Taxes it should have been so improved. In the case of such land, also, the rate of land-tax is 50 per cent. more than the ordinary rate.
In lieu of the special exemptions set out above, the Commissioner of Taxes has discretionary powers to grant relief in certain specified cases of hardship. Subject to deductions provided, lessees and life tenants are liable to tax, and joint owners are to be assessed jointly as regards the land held in conjunction, and also severally in respect of each owner's interest in such land and any other land. This liability for joint assessment also applies to companies owning land if half of the paid-up capital or half (in nominal value) of the allotted shares of each company is held by or on behalf of shareholders in the other.
It has for some years been the law that in case of default by a taxpayer in respect of land-tax the amount of tax may be demanded from his successor in title, from a tenant of the taxpayer or his successor, or from a mortgagee of the estate or interest concerned. Section 11 of the Land and Income Tax Amend-£ Act, 1924, declares land-tax to constitute a charge on the land, and, not withstanding any disposition of it, such land continues to be liable in the hands of a purchaser or other holder thereof for the payment of the tax so long as the charge remains in force. Registration of the charge is required, and no disposition of the land or of any interest in it may be registered while the charge remains in force. Relief in cases of hardship is provided for by the Land and Income Tax Amendment Act, 1925.
Income-tax is payable on the full incomes of registered companies and of absentees, and in other cases on incomes in excess of £300 per annum. Between £600 and £900 the exemption is reduced by £1 for every £1 above £600, and no exemption at all is allowed for incomes above £900. Certain specified incomes are wholly exempt from taxation, and a further £50 is deductible from assessable income for each child or grandchild under eighteen years of age who is dependent on the taxpayer, as are also amounts up to £50 contributed towards the support of the taxpayer's widowed mother. A maximum exemption of 15 per cent. is allowed for life-insurance premiums. National Provident Fund, superannuation, and similar contributions, and there is an exemption of 5 per cent. of the capital value of land used exclusively for the purpose of the taxpayer's business or for the purpose of deriving rent, royalties, or other profits. Income derived by the owner of land in respect of profits from the direct use or cultivation thereof is wholly exempt from income-tax. Income-fax is, however, payable by losses of Crown pastoral leases, small grazing-runs, &c., no land-tax being payable in these cases.
For the four financial years 1917–18 to 1920–21 the rates of progressive income-tax ranged from 6d. to 3s. in the case of persons and firms, and from 1s. to 3s. for companies. The 6d. rate for persons and firms applied where the taxable income was not more than £400, and the 1s. rate for companies where the taxable income did not exceed £1,600, the rates being increased by ½00 of a penny for every additional pound until the maximum tax of 3s. in the pound was reached. Income derived by holders of company debentures from such debentures bore a uniform tax of 1s., plus a special war tax of 1s. 6d.
The special war tax also applied to assessable income in excess of £300 of all other income-tax payers. For incomes up to £400 the rate of special war tax was 9d. in the pound, and this was increased by ¾00 of a penny for every additional pound of income, but so as not to exceed 4s. 6d. in the pound. The maximum total rate of income-tax was thus 7s. 6d. in the pound.
New rates of income-tax were enacted in 1920. On the income of persons and firms the rate was fixed at 1s. in the pound up to a £400 limit of income, and between £400 and £6,000 the tax was increased by 1/100 of a penny for each pound of income in excess of £400. On incomes exceeding £6,000 the rate was made 5s. 8d. in the pound, increased by ½00 of a penny for each pound in excess of £6,000, with a maximum tax of 7s. 4d. in the pound. In addition to these rates a super-tax of 20 per cent. was levied in 1921–22, and the whole of the income-tax was made subject to a rebate of 5 per cent. for prompt payment. Both super-tax and rebate were in 1922–23 discontinued.
A new principle of taxation was introduced in the 1920 Act with regard to “earned income,” which is defined to mean the salary or wages (including bonuses) received by the taxpayer in relation to his employment, and further includes all income derived by a taxpayer (other than a company or local body) by reason of his personal exertions. The tax on such income is, up to a limit of £2,000, subject to a reduction of 10 per cent.
For the year commencing with the 1st April, 1923, income-tax rates were reduced by 20 per cent., and in the following year by 33 ⅓ per cent., in all cases except in respect of income from debentures, for which special rates apply. For the year commencing on the 1st April, 1925, the rate of tax is 7d. in the pound for incomes not exceeding £300, the rate being increased by 2/300d. for every £1 in excess of £300 up to a maximum of £6,000. Above £6,000 the rate is 3s. 9d. in the pound, increased by 1/300 for every £1 in excess of £6,000, but with a limit of 4s. 6d. in the pound.
Under the Act of 1920 a fiat rate of 3s. in the pound was levied on income derived from company debentures, and of 2s. 6d. in the pound on income from debentures issued by local bodies in the Dominion. These rates still apply in respect of debentures issued prior to the 29th August, 1923, but for debentures (whether company or local body) issued after that date a uniform rate of 4s. 6d. in the pound was fixed as from the 1st April, 1924.
It should be noted that the rates referred to—2s. 6d., 3s., or 4s. 6d., as the case may be—are maximum rates, and therefore that investment in local- or public-authority debentures is a favoured one so far as income-tax is concerned. A person whose income carries the present maximum rate of tax, 4s. 6d., would pay only 2s. 6d. or 3s., as the case may be, on such portion of it as is derived from debentures issued prior to the 29th August, 1923; on the other hand, the person whose income from debentures is less than £300 would pay no income-tax at all in respect of debentures; while a person whose income carries a less rate than 2s. 6d., 3s., or 4s. 6d., as the case may be, would be charged only such lesser rate on debenture interest. Any deduction for tax which may be made by the local or public authority is adjusted later by the Land and Income Tax Department.
A holder, if resident outside New Zealand, of stock or debentures issued by the Government of New Zealand, or any local or public authority, or by the Public Trustee as agent of a land-settlement association, the interest on which is payable out of New Zealand, is not liable in New Zealand for income-tax on such interest.
The law dealing with these classes of duty is embodied in the Death Duties Act, 1921, as subsequently amended. The main heads of taxation are estate and succession duties, which are generally referred to by the collective title of “death duties.” In addition to these there is provision for a gift duty and a Native succession duty.
Estate and succession duties are due and payable to the Commissioner of Stamp Duties on asesssment, an additional 5 per cent. penalty, together with interest at 6 per cent. per annum being payable if duty is not paid within three months. Gift duties are payable at the time the gift is made, and Native succession duties before the registration of the succession order by the Native Land Court. Generally the decision of the Commissioner of Stamp Duties in regard to matters of fact incidental to the assessment of duty is final, but there is an appeal on points of law or of fact by way of a case stated to the Supreme Court. An appeal on a question of law may be referred to the Court of Appeal.
The net revenue received from death duties, including gift and Native succession duties, during each of the last ten years was—
| Year ended 31st March, | Amount. |
|---|---|
| £ | |
| 1917 | 570,040 |
| 1918 | 805,511 |
| 1919 | 869,371 |
| 1920 | 978,095 |
| 1921 | 1,106,925 |
| 1922 | 1,512,754 |
| 1923 | 1,829,852 |
| 1924 | 1,517,315 |
| 1925 | 1,520,749 |
| 1926 | 1,484,189 |
| The total for the year ended 31st March, 1926, is made up as follows:— | |
|---|---|
| £ | |
| Estate duty | 1,128,695 |
| Succession duty | 304,498 |
| Gift duty | 50,996 |
| Total | £1,484,189 |
When the final balance of the dutiable estate of a deceased person, estimated as at the date of his death, exceeds £1,000 an estate duty is levied on the amount thereof. In the case of any estate the final balance of which does not exceed £10,000 any interest acquired by the wife of the deceased up to the value of £5,000 is exempt from estate duty. The value of any life-insurance policy or policies comprised in the estate is also deductible up to a maximum of £1,000, irrespective of the amount of the estate. The rate of duty on the whole estate must, however, be determined before any deduction is made under either head.
Up to 1920 duty was leviable on property in excess of £500, and the scale of duties ranged from 1 per cent. in cases where the net estate was between £500 and £1,000 to a maximum of 15 per cent. for large estates. The amendment made to the scale in 1920 considerably increased the duty payable, and the rates, which are now embodied in the Act of 1921, run from 1 per cent. on estates not exceeding £2,000 in value to 20 per cent. on estates of more than £100,000. The scale of duties is shown in the table below.
| SCALE OF ESTATE DUTY. | |
|---|---|
| Final Balance of Estate. | Rate per Cent. |
| £ | £ |
| 1,000 to 2,000 | 1 |
| 2,000 to 3,000 | 2 |
| 3,000 to 4,000 | 3 |
| 4,000 to 6,000 | 4 |
| 6,000 to 8,000 | 5 |
| 8,000 to 10,000 | 6 |
| 10,000 to 15,000 | 7 |
| 15,000 to 20,000 | 8 |
| 20,000 to 25,000 | 9 |
| 25,000 to 30,000 | 10 |
| 30,000 to 35,000 | 11 |
| 35,000 to 40,000 | 12 |
| 40,000 to 45,000 | 13 |
| 45,000 to 50,000 | 14 |
| 50,000 to 60,000 | 15 |
| 60,000 to 70,000 | 16 |
| 70,000 to 80,000 | 17 |
| 80,000 to 90,000 | 18 |
| 90,000 to 100,000 | 19 |
| Exceeding 100,000 | 20 |
In addition to the estate duty referred to above, a succession duty is payable by any person who acquires a beneficial interest in the estate of a deceased person either by will or by intestacy. An exemption from duty is made in favour of charitable trusts, and special provision is made that the wife lineal descendant, or lineal ancestor of a soldier who has met his death on account of the late war is allowed an additional £5,000 exemption to the amounts shown below.
The rates of duty vary according to the nearness of kin of the beneficiary to the deceased person. The rates shown below were introduced in amending legislation in 1920, and, as in the case of the estate duties, are embodied in the 1921 consolidating Act.
| SCALE OF SUCCESSION DUTY. | ||
|---|---|---|
| If Successor is | Value of Estate. | Rate per Cent. |
| £ | ||
| Wife | Up to 10,000 | Nil. |
| 10,000 to 20,000 | 2 | |
| Over 20,000 | 4 | |
| Husband | Up to 500 | Nil. |
| 500 to 1,500 | 1 | |
| 1,500 to 2,500 | 2 | |
| Over 2,500 | 3 | |
| Brother or sister | Up to 500 | Nil. |
| 500 to 20,000 | 5 | |
| Over 20,000 | 10 | |
| Child or lineal descendant | Up to 1,000 | Nil. |
| 1,000 to 5,000 | 1 | |
| 5,000 to 10,000 | 2 | |
| 10,000 to 15,000 | 3 | |
| 15,000 to 20,000 | 3 ½ | |
| Over 20,000 | 4 | |
| Other relative to 4th degree | Up to 500 | Nil. |
| 500 to 10,000 | 5 | |
| Over 10,000 | 10 | |
| Other person | Up to 500 | Nil. |
| 500 to 20,000 | 10 | |
| Over 20,000 | 20 | |
In respect to moneys exceeding £1,000 that may be payable to persons domiciled out of New Zealand, and where the beneficiary is not the husband or wife of the deceased or a relative of the deceased within the third degree of consanguinity, there is an additional rate equal to 10 per cent. of the excess over £1,000.
Where any succession order is made by the Native Land Court on the death of a Native, no death duty in the ordinary way is payable on the property included in it, but a Native succession duty of 2 per cent. is payable on the value of the property, with a general exemption of £200.
A gift means any disposition of property which is made otherwise than by will. whether with or without an instrument in writing, without full and adequate consideration in money or its equivalent. No duty is payable on a gift which, together with the value of all other gifts (not exempt from duty by reason of their nature) made at the same time or within twelve months previously or subsequently by the same donor to the same or any other beneficiary, otherwise than by way of a charitable trust, does not exceed the value of £1,000, and exemption from gift duty is provided in cases of the voluntary discharge of a mortgage debt where the donor and beneficiary are not connected by ties of blood or marriage. Various other exemptions were made by the Death Duties Amendment Act, 1923.
The amount of the gift duty is payable by either the donor or the beneficiary, but the beneficiary is entitled to be indemnified, by the donor unless the terms of the gift provide otherwise. Particulars of any gift made are required to be furnished for assessment of duty within one month of the date of the gift, and in default an additional duty of 50 per cent. is payable. Where duty is payable, the rate is based on the following scale:—
| Value of Gift. | Rate of Duty. |
|---|---|
| £1,000 to £5,000 | 5 per cent. |
| £5,000 to £10,000 | 7 ½ ,, |
| Over £10,000 | 10 ,, |
These rates, which were introduced in 1920, superseded the flat rate then in force of 5 per cent., on all gifts exceeding £1,000 in value. The revenue from gift duty amounted to £50,996 for the financial year ended 31st March, 1926, the figures for the last ten years being as follows:—
| Year ended 31st March. | £ |
|---|---|
| 1917 | 32,671 |
| 1918 | 36,551 |
| 1919 | 31,736 |
| 1920 | 54,160 |
| 1921 | 74,885 |
| 1922 | 70,440 |
| 1923 | 48,556 |
| 1924 | 61,660 |
| 1925 | 73,602 |
| 1926 | 50,996 |
These amounts, it should be noted, are included under the revenue shown previously under the head of “Death Duties.”
The term “stamp duties” covers a miscellany of items of taxation imposed by the Stamp Duties Act, 1923, as amended in 1924 and 1925. An important group of stamp duties—those payable by racing clubs on totalizator investments, dividends, and stakes—is dealt with under a separate heading later on in this subsection. The principal of the remaining duties under the Stamp Duties Act are as shown in the following schedule:—
| Item. | Rate of Duty. |
|---|---|
* Or fractional part thereof. | |
| Conveyance duty— | |
| Conveyances not expressly made subject to any other rate of conveyance duty or not expressly exempted from such duty | 10s. for every £50.* |
| Transfers of mortgages, debentures, or money payable or to become payable, or anything in action, or any interest in a trust fund | 5s. for every £100.* |
| Transfers of moneys in respect of supply of milk, cream, or other dairy produce to a factory— | |
| If over £20 | 5s. for every £100* (maximum duty, 12s. 6d.) |
| If not exceeding £20 | 2d. |
| Transfers of shares or of any equitable interest in shares | 3s. for every £50.* |
| Transfers of mining property or of any legal or equitable interest in mining property | 3s. for every £50.* |
| Mortgage duty— | |
| Registration of a mortgage on land | 2s. 6d. |
| Discharge of a mortgage | 2s. 6d. |
| Item. | Rate of Duty. |
|---|---|
* Or fractional part thereof. | |
| Duty on leases or licenses | 3s. for every £50* of annual rent. |
| Duty on bills of exchange or promissory notes— | |
| Bills of exchange or promissory notes payable on demand | 2d. |
| Bills of exchange payable otherwise than on demand | 1s. for every £50.* |
| Promissory notes payable otherwise than on demand— | |
| For sum not exceeding £25 | 6d. |
| For sum between £25 and £50 | 1s. |
| For sum exceeding £50 | 1s. for every £50.* |
| Bank-note duty (based on average amount of banknotes in circulation during quarter) | 15s. (quarterly) for every £100.* |
| Duty on sales of shares in mining companies— | |
| Where contract-note does not exceed £100 | 1s. |
| Where contract-note exceeds £100 | 2s. 6d. |
| Duty on agreements (where £20 or over concerned) | 1s. 3d. |
| Duty on appraisements (according to amount of appraisement or valuation)— | |
| £20 or under | 1s. |
| £20–£50 | 2s. 6d. |
| £50–£100 | 5s. |
| £100–£200 | 10s. |
| £200–£500 | 15s. |
| Over £500 | £1. |
| Duty on awards (according to amount or value of matter in dispute)— | |
| £20 or under | 1s. |
| £20–£50 | 2s. 6d. |
| £50–£100 | 5s. |
| £100–£200 | 10s. |
| £200–£500 | 15s. |
| £500–£1,000 | £1. |
| Over £1,000, and in cases not otherwise provided for | £1 15s. |
| Duty on bills of lading (executed in New Zealand in respect of carriage of goods from New Zealand to overseas countries) | 1s. |
| Duty on incorporation of companies | £6. |
| Duty on charter-parties | 1s. |
| Duty on declarations under Justices of Peace Act | 3s. |
| Duty on deeds of assignment | £3. |
| Duty on deeds not otherwise charged | 12s. 6d. |
| Duty on duplicates and counterparts of dutiable instruments | 3s. (or same duty as original instrument if under 3s.). |
| Duty on marine policies— | |
| On a voyage policy, or on a time policy for a period not exceeding six months | 3d. for every £100.* |
| On a time policy for a period exceeding six months | 6d. for every £100.* |
| Duty on receipts (for amounts of £2 or over) | 2d. |
| Duty on annual licenses of companies— | |
| New Zealand companies | 1s. for every £100* of nominal capital (maximum duty £200). |
| Overseas insurance or banking companies | £200. |
| British companies (other than insurance or banking companies) not employing the whole or substantially the whole of their actual capital in New Zealand | 6d. for every £100* of nominal capital (maximum duty £100, minimum £10). |
| Other overseas companies | 1s. for every £100* of nominal capital (minimum duty £10). |
| Duty on instruments of guarantee (where £20 or over involved) | 2s. 6d. |
There are numerous exemptions from certain classes of stamp duties, as well as various special provisions, which cannot be given in detail here.
The Government tax on totalizator investments is 2 ½ per cent. of the gross amount passed through the machines. Prior to the 1st March, 1910, the percentage was 1 ½. Commencing with the racing-year 1925–26, a refund of 1 ¼ per cent. (up to a limit of £250) may be made to any club which during the year concerned has expended (or incurred liability to expend) an amount not less than the amount of refund, in the permanent improvement of its racecourse by the erection of buildings, &c.
From the 1st November, 1915, a tax of 1 per cent. was imposed on the total value of all stakes, and a tax of 2 ½ per cent. on totalizator dividends, in addition to the tax on totalizator investments. From the 22nd December, 1921, the tax on stakes was increased to 10 per cent., and that on dividends to 5 per cent. From the 1st April, 1924, the tax on stakes was reduced to 5 per cent.
The following figures, taken from successive annual reports of the Inspector of Totalizators and covering the last five years, relate to the racing-year, which ends on the 31st July:—
| — | Year ended 31st July. | ||||
|---|---|---|---|---|---|
| 1922. | 1923. | 1924. | 1925. | 1926. | |
* Retained by the clubs, except for the period 1st July to 21st December, 1921, during which the unpaid fractions were payable into the Consolidated Fund. | |||||
| Number of racing-days | 286 | 287 | 289 | 320 | 326 |
| Number of races | 2,263 | 2,269 | 2,285 | 2,527 | 2,578 |
| £ | £ | £ | £ | £ | |
| Amount of stakes | 653,285 | 612,667 | 593,064 | 624,165 | 640,798 |
| Totalizator investments | 8,141,457 | 7,848,392 | 7,724,393 | 8,445,859 | 8,605,582 |
| Amount paid in dividends | 6,986,238 | 6,675,907 | 6,569,386 | 7,183,135 | 7,317,752 |
| Government taxes— | |||||
| On totalizator investments | 203,552 | 196,210 | 193,110 | 211,147 | 215,140 |
| On dividends | 303,301 | 353,301 | 347,651 | 380,124 | 387,312 |
| On stakes | 46,265 | 61,267 | 51,655 | 31,208 | 32,040 |
| Totals | 553,118 | 610,778 | 592,416 | 622,479 | 634,492 |
| 7 ½ per cent. of totalizator investments retained by clubs | 610,656 | 587,729 | 579,330 | 633,439 | 615,419 |
| Unpaid fractions* | 37,709 | 35,245 | 34,916 | 38,014 | 39,959 |
The totalizator revenue accruing to the State during the 1925–26 racing-year is seen to have totalled £634,492. For the financial year ended the 31st March. 1926, the amount was £659,642.
A form of tax first introduced in 1917 is the amusements-tax, payable on payments for admission to entertainments. “Entertainment” is defined as “any exhibition, performance, amusement, game, or sport to which persons are admitted for payment.” Formerly tax was payable where the charge for admission exceeded 9d. (later 1s.), but no tax is now payable where the charge for admission is not more than 2s. When the charge exceeds 2s. a tax of 1d. is imposed on each shilling or part of a shilling, and, in addition to the tax so calculated, a further sum of 1d. is payable where the price for admission exceeds 3s. 6d. Provision is made for exemption in certain specified cases—viz., shows promoted by agricultural, pastoral, horticultural, or poultry societies, meetings held for educational, scientific, patriotic, or philanthropic purposes, and swimming-sports.
Since the introduction of the tax the following amounts have been collected:—
| Year ended 31st March. | Amount collected. |
|---|---|
| £ | |
| 1918 | 16,093 |
| 1919 | 39,845 |
| 1920 | 68,064 |
| 1921 | 79,921 |
| 1922 | 103,815 |
| 1923 | 137,546 |
| 1924 | 115,039 |
| 1925 | 78,877 |
| 1926 | 64,163 |
Local governing authorities have power under various Acts of the Legislature to impose taxes for general or special purposes as set out in another section of this book. The amount of revenue collected for local purposes during the ten years ended 31st March, 1925, is shown below:—
| Year ended 31st March. | Local Revenue derived from | Total. | ||
|---|---|---|---|---|
| General Rates. | Special and Separate Rates. | Licenses and other Taxes. | ||
| £ | £ | £ | £ | |
| 1916 | 1,607,764 | 747,391 | 187,065 | 2,542,220 |
| 1917 | 1,695,572 | 838,967 | 185,611 | 2,720,150 |
| 1918 | 1,791,028 | 883,513 | 192,482 | 2,867,023 |
| 1919 | 2,028,151 | 911,455 | 199,366 | 3,138,972 |
| 1920 | 2,106,397 | 1,037,816 | 245,078 | 3,389,291 |
| 1921 | 2,338,539 | 1,211,051 | 264,320 | 3,813,910 |
| 1922 | 2,501,949 | 1,277,946 | 276,990 | 4,056,885 |
| 1923 | 2,742,828 | 1,534,953 | 285,969 | 4,563,750 |
| 1924 | 2,775,986 | 1,669,641 | 313,090 | 4,758,717 |
| 1925 | 2,922,003 | 1,746,881 | 344,248 | 5,013,132 |
Of recent years there has been great activity in local enterprise, the necessary funds being provided partly out of general rates, not mainly by borrowing, interest on loans and payments to sinking funds being soured in most cases by special rates. The increase in the amount of general rates collected during the ten years 1914–15 to 1924–25 was £1,437,573, or 97 per cent.; special and separate rates increased by £1,091,386, or 167 per cent.; and total rates by £2,528,959, or 118 per cent. Licenses and other taxes show an increase for the ten years of £158,679, or 86 per cent., and total local taxation an increase of £2,687,638, or 116 per cent.
A table is given setting out in greater detail the taxation by local authorities during the year ended the 31st March, 1925.
| REVENUE FROM LOCAL TAXATION, 1924–25. | |||||
|---|---|---|---|---|---|
| Local Districts. | Rates. | Licenses. | Other Taxes. | Total. | |
| General. | Special and Separate. | ||||
| £ | £ | £ | £ | £ | |
| Counties | 1,410,129 | 386,966 | 54,607 | 7,705 | 1,859,407 |
| Boroughs | 1,074,995 | 1,273,883 | 143,632 | 127,421 | 2,619,931 |
| Town districts | 52,176 | 36,584 | 8,099 | 61 | 96,920 |
| Road districts | 55,223 | 14,205 | 1,822 | 262 | 71,512 |
| River districts | 46,389 | 8,797 | .. | .. | 55,186 |
| Land-drainage districts | 27,788 | 15,769 | .. | .. | 43,557 |
| Electric-power districts | 10,470 | 499 | 45 | .. | 11,014 |
| Water-supply districts | 3,099 | 550 | .. | .. | 3,649 |
| City and suburban drainage districts | 113,094 | 9,628 | 594 | .. | 123,316 |
| Local railway districts | 321 | .. | .. | .. | 321 |
| Harbour Boards | 128,319 | .. | .. | .. | 128,319 |
| Totals | 2,922,003 | 1,746,881 | 208,799 | 135,449 | 5,013,132 |
The figures quoted above are exclusive of wharfage dues, charges, fees, and tolls received by Harbour Boards.
EARLY in the history of the settlement of New Zealand the necessity for financial assistance to open up the forest-clad rugged country was made apparent. In the year 1856 the first Loan Act was passed by the General Assembly, and under that authority £500,000 was raised. In addition to the requirements for necessary initial public works, the opposition to settlement by the Maoris, resulting in active hostilities, compelled £able borrowing. At the conclusion of the Maori War the work of road and railway construction was mainly carried on under the administration of the Provincial Councils, who exercised control over expenditure within their respective districts, the General Government being responsible for undertakings of a national character. Under this system of divided responsibility no general and comprehensive scheme of public works could be carried out.
Up to the end of the year 1870 the General Government had borrowed £4,543,316, while the debt of the Provincial Councils amounted to £3,298,575. In that year the General Government brought forward a public-works and immigration policy by which it was proposed to raise a loan of ten millions for the construction of main trunk railways, roads, and other public works of importance to the country as a whole, as well as for the promotion of settlement on a large scale, the expenditure to be spread over a period of ten years. This policy was accepted by the Legislature, and embodied in the Immigration and Public Works Act, 1870. The necessity for local railways and other works soon caused the original proposals to be exceeded, and to a far greater amount than was at first contemplated. Broadly stated, the system of opening up the lands in advance of settlement was adopted, the State retaining the ownership and control of facilities for transport and communication.
In 1892 the General Government began the repurchase of lands already alienated. The money required for this purpose has been borrowed, but the rentals obtained by the leasing of the lands are sufficient for the payment of interest and amortization charges on the amount raised. In 1894 the Advances to Settlers Act was passed, authorizing the raising of loans for advances on the security of real estate. This was followed by the Advances to Workers Act in 1906. Provision was also made for local bodies to borrow from the Advances Office, including power to borrow for workers' dwellings. Both interest and sinking fund charges are met by interest received from borrowers, and are thus not a charge on the Consolidated Fund. Until early in the war period money raised for the use of the State Advances Office formed a comparatively large part of the public indebtedness, amounting at the 31st March, 1914, to approximately 30 per cent. of the total debt.
By far the most rapid increase in the national indebtedness, however, has taken place as a result of activities necessitated by the European War. Of the total gross debt of nearly 239 millions of pounds at the 31st March, 1926, 139 millions have been incurred since 1914, including over 75 millions attributable to loan-money required for the European War; and this latter amount does not include 9 ¾ millions raised by the Government for the settlement of discharged soldiers.
The Minister of Finance may raise loans, when authorized by Parliament so to do, by the issue of debentures, or scrip, or stock, in New Zealand or elsewhere at his discretion, and may prescribe the mode and conditions of repayment of loans, the rates of interest (not exceeding the maximum rate fixed by the authorizing Act), and the times and places of payment of principal and interest respectively. Power is given to convert debentures or scrip into consolidated stock, and the Minister may specify the terms of conversion at the time when a loan is raised, or arrange that terms shall be subsequently agreed upon. For the purpose of paying off or renewing at maturity any debenture, scrip, or other security, new debentures or other securities may be issued and disposed of if necessary. Authority also exists for the conversion of loan-money which has not yet matured, as well as for the redemption and cancellation of securities before maturity.
During the war period provision was made for the issue to the public of “Post Office investment certificates” of a nominal value of £1 and upwards, and in 1920 legislation was enacted which sanctioned a continuous issue of these certificates, with a currency of five years or more. Receipts from this source are utilized for the purposes of any loan which may be authorized by Parliament.
The money composing the public debt has been borrowed on the security of the public revenues of the Dominion. No portion of the public estate is pledged-for payment of either principal or interest.
The gross indebtedness of the General Government and the rate of indebtedness per head of population (inclusive of Maoris), for each of the last twenty years, are given in the following table:—
| GROSS INDEBTEDNESS, 1906–07 TO 1925–26. | ||||
|---|---|---|---|---|
| As at 31st March. | Amount. | Per Head of Population. | ||
| £ | £ | s. | d. | |
| 1907 | 64,179,040 | 66 | 14 | 10 |
| 1908 | 66,453,897 | 67 | 8 | 11 |
| 1909 | 70,938,534 | 69 | 16 | 4 |
| 1910 | 74,890,645 | 72 | 6 | 10 |
| 1911 | 81,078,122 | 76 | 15 | 3 |
| 1912 | 84,353,913 | 78 | 0 | 3 |
| 1913 | 90,060,763 | 81 | 0 | 5 |
| 1914 | 99,730,427 | 87 | 10 | 2 |
| 1915 | 100,059,910 | 86 | 19 | 7 |
| 1916 | 109,637,397 | 95 | 6 | 4 |
| 1917 | 129,836,105 | 112 | 16 | 2 |
| 1918 | 150,840,055 | 130 | 12 | 11 |
| 1919 | 176,076,260 | 149 | 8 | 5 |
| 1920 | 201,170,755 | 162 | 12 | 9 |
| 1921 | 206,324,319 | 162 | 15 | 7 |
| 1922 | 219,054,385 | 168 | 6 | 10 |
| 1923 | 218,953,324 | 165 | 4 | 2 |
| 1924 | 221,616,361 | 164 | 8 | 5 |
| 1925 | 227,814,647 | 165 | 2 | 11 |
| 1926 | 238,855,478 | 169 | 8 | 6 |
On only two occasions in the history of New Zealand has a reduction in the gross public debt been effected during the financial year. The first occasion was in 1890–91, when the debt was reduced by £117,282, and the second in 1922–23, when another slight reduction (£101,061) was recorded.
In 1923–24 the large sum of £2,679,450 was loaned out of accumulated surpluses and other accounts to the State Advances Office, and as the securities issued by that Office are charged against the debt an increase in the public debt to that amount was disclosed by the accounts. It may be pointed out that this amount more than accounts for the increase of £2,663,037 during the year ended the 31st March, 1924, and that if it were not treated as a debt a decrease of £16,413 in the gross debt would have been recorded for that year.
The movement of the gross public debt—total and per head of population—since 1880 is shown in. the diagram on the opposite page. This strikingly brings out the great increase in indebtedness occasioned by the war of 1914–19.
The history of the public debt in New Zealand may conveniently and with advantage be divided into four distinct periods—viz., (1) Up to the end of the financial year 1890–91; (2) from the 31st March, 1891, to the 31st March, 1914; (3) from the 31st March, 1914, to the 31st March, 1920; and from the 31st March, 1920, to date.
Up to the 31st March, 1891, loan expenditure had been chiefly concerned with railways and roads, the taking-over of the loan liabilities of the Provincial Governments on their abolition, and the Maori War.
The year 1891 marks the beginning of a period during which the functions of the State have been widely extended, most notably as regards financial assistance to settlers, workers, and local bodies, the repurchase of alienated lands, the working of coal-mines, and the establishment of State fire- and accident-insurance offices. In every department these new activities, as well as the old, have been directly successful, while the indirect benefits are incapable of measurement. A considerable portion of the annual interest on the debt, although paid out of the Consolidated Fund, does not fall upon the whole of the taxpaying community, the revenue derived from several of the more important under -takings being sufficient to meet the interest on the money borrowed in respect of them.
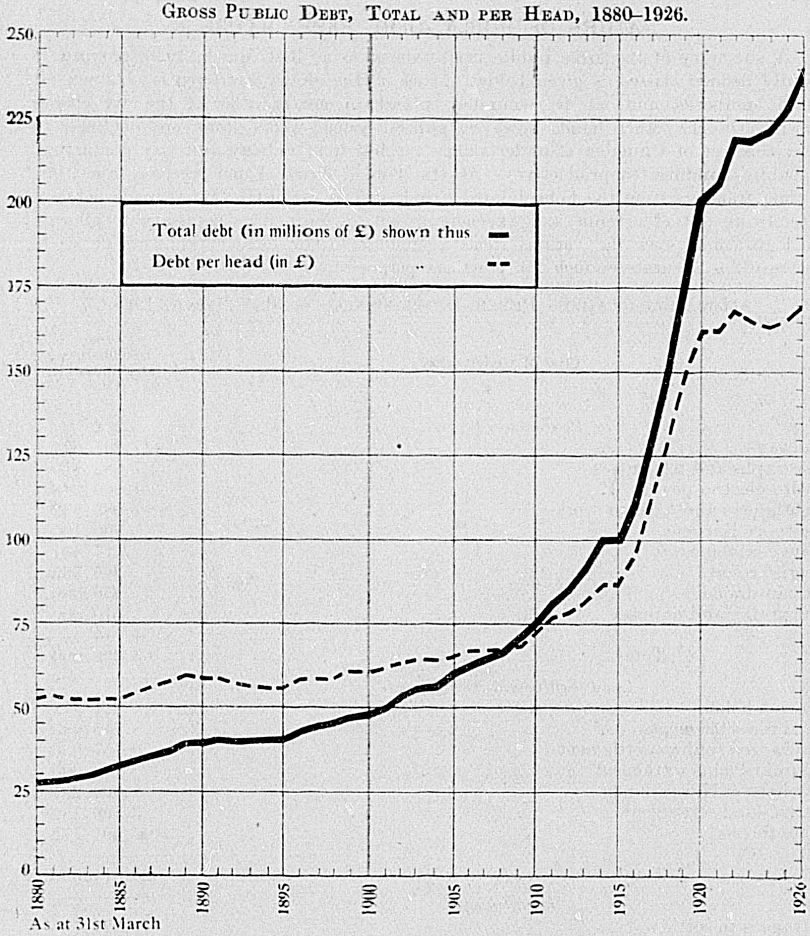
The advent of the European War created a second point of demarcation in the history of the loan expenditure of the General Government, necessitating as it did the postponement of all public works, &c., except those of pressing necessity. Expenditure of an unproductive nature occasioned by the war was necessarily continued for some time after the Armistice, but the end of the financial year 1919–20 may be fairly regarded as concluding this period. Although in the years immediately following the period 1914–15 to 1919–20 considerable sums have been provided by loan-money for purposes directly arising out of the war—for example, discharged soldiers' settlement—yet the bulk of such money has been expended in undertakings in the nature of investments, and so should not be regarded as partaking of the nature of unproductive war expenditure.
The gross indebtedness at the 31st March, 1891, 1914, 1920, and 1926, with the increase between these dates, is as follows:—
| £ | |
|---|---|
* Excluding £4,976,600 raised in March, 1914, for redemptions in April, 1914. | |
| At 31st March, 1891 | 38,830,350 |
| Increase to 31st March, 1914 | 55,923,477* |
| At 31st March, 1914 | 94,753,827* |
| Increase to 31st March, 1920 | 106,416,928 |
| At 31st March, 1920 | 201,170,755 |
| Increase to 31st March, 1926 | 37,684,723 |
| At 31st March, 1926 | 238,855,478 |
A summary of the gross public indebtedness as at 31st March, 1926, grouped in broadly defined classes, is given below. Much of the money borrowed is obtained for specific purposes, and can be accurately placed in one or other of the five classes shown. On the other hand, however, general public-works loans are obtained to cover the cost of a number of undertakings ranging from railways (directly productive) to public buildings (unproductive). As the Public Works Fund receives from time to time transfers from the Consolidated Fund, and as no distinction is made between expenditure out of revenue and expenditure out of loan, it is necessary to allocate the loan-money over the various items according to the total expenditure on each. The result is accurate enough for practical purposes.
| ALLOCATION OF GROSS PUBLIC INDEBTEDNESS AT 31ST MARCH, 1926. | |
|---|---|
| Class of Undertaking. | Gross Indebtedness, at 31st March, 1926.£ |
| Productive Works. | |
| Railways | 47,867,634 |
| Telegraphs and telephones | 7,282,810 |
| Hydro-electric power | 4,809,248 |
| Lighthouses and harbour-works | 1,083,832 |
| Westport Harbour | 700,100 |
| State coal-mines | 227,601 |
| Tourist resorts | 365,765 |
| Swamp-drainage | 456,000 |
| Rangitaiki land drainage | 510,000 |
| Total | 63,302,990 |
| Land Settlement and Forests. | |
| Cheviot Estate | 211,318 |
| Land for settlements | 8,745,085 |
| Discharged soldiers settlement | 9,757,936 |
| Hauraki Plains settlement | 700,000 |
| Purchase of Native lands | 1,902,297 |
| Native-land settlement | 3,896,782 |
| State forests | 601,172 |
| Total | 25,814,590 |
| Investments. | |
| Advances to settlers | 18,021,786 |
| Advances to workers | 6,978,082 |
| Advances to local authorities | 2,790,293 |
| Loans to local bodies | 3,550,793 |
| Samoan loan | 110,000 |
| Bank of New Zealand shares | 875,000 |
| Mining advances | 55,550 |
| Fruit-preserving industry advances | 65,110 |
| Cold-storage advances | 75,250 |
| General purposes relief advances | 75,000 |
| Fishing industry promotion advances | 5,215 |
| Kauri-gum industry | 75,000 |
| Housing and loans for workers' dwellings | 399,625 |
| Nauru and Ocean Islands | 539,850 |
| Total | 33,616,554 |
| Indirectly Productive Purposes. | |
| Highways, roads, and bridges | 14,933,854 |
| Old provincial liabilities (mostly roads and bridges) | 878,739 |
| Irrigation, land and river improvement | 1,385,028 |
| Development of mining | 802,807 |
| Immigration | 2,633,918 |
| Total | 20,634,346 |
| ALLOCATION OF GROSS PUBLIC INDEBTEDNESS AT 31ST MARCH, 1926 | |
|---|---|
| Class of Undertaking. | Gross Indebtedness at 31st March, 1926.£ |
| Financially Unproductive Purposes. | |
| Public buildings, including schools | 11,029,924 |
| Defence and Maori Wars | 4,607,844 |
| Naval defence | 1,552,624 |
| Great European War | 75,333,648 |
| Revenue deficiencies | 2,952,908 |
| Loans-redemption expenses (unallocated) | 10,050 |
| Total | 95,486,998 |
| Grand total | 238,855,478 |
The proportion of the total debt represented by the five main divisions shown above is as follows:—
| Per Cent. | |
|---|---|
| Productive works | 26.50 |
| Land-settlement and forests | 10.81 |
| Investments | 14.07 |
| Indirectly productive purposes | 8.64 |
| Financially unproductive purposes | 39.98 |
| Total | 10000 |
The increase in the gross public debt since the 31st March, 1891, amounts to £200,025,128. Excluding war expenditure, referred to later, the largest item in the increase is £27,790,161 raised for advances to settlers, workers, and local authorities. In addition to this latter amount, £3,550,793 of the present indebtedness was raised for loans to local bodies prior to the inauguration of the present system of making such loans through the State Advances Office. Another large item is the purchase and roading of land for settlement, the present indebtedness on account of which, including Native land and the Cheviot Estate, aggregates £14,755,482. Of more recent growth is the expenditure on discharged-soldiers settlement (including lands for discharged-soldiers settlement), the indebtedness on this account amounting to £9,757,936 on the 31st March, 1926. These items, as well as a number of smaller ones, represent investments by the Government bearing interest and lent on continually improving security, the principal being repaid by instalments. Other considerable items which may be considered as interest-bearing investments are those under the heads “Hauraki Plains settlement,” “Rangitaiki land-drainage,” “Housing,” and “Bank of New Zealand shares.” An item on which loan-money is being liberally expended is water-power development and electric supply, the gross indebtedness on this account totalling £4,809,248 at 31st March, 1926. Such expenditure is, as in the case of railways, regarded as directly reproductive.
The directly interest-earning portion of the debt as at 31st March, 1926, amounts to 51.38 per cent. of the total debt, and is represented by assets which are of much greater value than the amount of borrowed money spent upon them, a considerable amount of surplus ordinary revenue, as well as other moneys of the nature of special receipts, having been expended from time to time on railways and other public services.
While expenditure on public buildings is, properly speaking, unproductive, the debt on this account is represented by valuable assets, as is also the case with the education loans.
At the 31st March, 1914, the financially unproductive and unclassified debt represented only about 20 per cent. of the total public debt; but during the six years ended 31st March, 1920, war indebtedness aggregating £80,089,025 was responsible for 77 per cent. of the debt incurred during this period being of an unproductive nature. Additional indebtedness on account of war expenditure was incurred during the next two years, the total war loans raised aggregating £82,245,673; but the end of the financial year 1919–20 saw the cessation of expenditure on a huge scale on this account, the moneys borrowed since then having been principally directed towards public works of a reproductive nature and to investments. The war debt has been reduced by nearly seven millions, and now stands at £75,333,648.
New loan-money aggregating £13,374,539 was raised during 1925-26 for the following purposes:—
| £ | |
|---|---|
| Public Works Fund— | |
| General Purposes Account | 4,233,902 |
| Electric Supply Account | 872,005 |
| Waihou and Ohinemuri Rivers Improvement Account | 69,000 |
| Deteriorated Lands Account | 2,000 |
| Education Loans Account | 478,650 |
| Hauraki Plains Settlement Account | 70,000 |
| Main Highways Account | 542,004 |
| Railways Improvement Account | 542,005 |
| Samoan Loan Account | 15,000 |
| Swamp Land Drainage Account | 35,000 |
| State Advances to Settlers Account | 4,920,964 |
| State Advances to Workers Account | 1,584,009 |
| State Advances to Local Authorities Account | 10,000 |
| Total raised | £13,374,539 |
Loans paid off during the year aggregated £2,333,708, the redemption-moneys coming from the following sources:—
| By transfers of cash from— | £ |
|---|---|
* Includes amount from German reparations so applied. | |
| Ordinary Revenue Account | 566,160* |
| ,, (for funded debt) | 333,289 |
| Nauru and Ocean Islands Account | 40,000 |
| Nauru and Ocean Islands Sinking Fund Account | 20,150 |
| Cheviot Estate Account | 35,613 |
| Conversion Account | 6,074 |
| Discharged Soldiers Settlement Account | 13,250 |
| Discharged Soldiers Settlement Loans Act 1920 Depreciation Fund Account | 38,371 |
| Land for Settlements Account | 22,575 |
| Native Land Settlement Account | 2,400 |
| State Advances Office (Settlers) | 100,000 |
| War Expenses Account | 17 |
| Westport Harbour Account | 23,707 |
| By utilizing cash in Public Debt Repayment Account | 870,638 |
| By sinking funds released | 88,771 |
| By loans raised in 1924–25 for redemptions in 1925–26 | 64,680 |
| Miscellaneous war credits applied to reduction of debt | 62,409 |
| Portion of amount advanced to High Commissioner in 1924–25 used for redemption in 1925–26 (Westport Harbour securities) | 3,000 |
| Debentures outstanding for more than ten years removed from debt table | 2,100 |
| Discount on securities redeemed below par | 40,504 |
| £2,333,708 | |
In addition to the foregoing transactions, securities to the amount of £5,266,476 were renewed, £453,250 converted, and £17,786,565 debentures and inscribed stock, and £6,500,000 Treasury bills redeemed—in each case by the issue of fresh securities of an equal face value.
Allocating the various increases and decreases over the classes and headings used in discussing the total public debt, the following distribution is arrived at:—
| Class of Undertaking. | Increase. | Decrease. |
|---|---|---|
| £ | £ | |
| Productive Works. | ||
| Railways | 2,277,771 | .. |
| Telegraphs and telephones | 813,204 | .. |
| Hydro-electric power | 872,005 | .. |
| Lighthouses and harbour-works | 8,213 | .. |
| Westport Harbour | .. | 33,495 |
| Tourist resorts | 37,957 | .. |
| Swamp-drainage | 35,000 | .. |
| Total | 4,010,655 | .. |
| Land Settlement and Forests. | ||
| Cheviot Estate | .. | 42,000 |
| Land for settlements | .. | 23,719 |
| Discharged soldiers settlement | .. | 51,950 |
| Hauraki Plains settlement | 70,000 | .. |
| Native-land settlement | .. | 2,400 |
| Total | .. | 50,069 |
| Investments. | ||
| Advances to settlers | 4,740,964 | .. |
| Advances to workers | 1,584,009 | .. |
| Advances to local authorities | 10,000 | .. |
| Samoan loan | 15,000 | .. |
| Mining advances | .. | 150 |
| Nauru and Ocean Islands | .. | 60,150 |
| New Zealand Consols | .. | 500 |
| Total | 6,289,173 | .. |
| Indirectly Productive Purposes. | ||
| Highways, roads, and bridges | 1,034,906 | .. |
| Irrigation, land and river improvement | 181,608 | .. |
| Development of mining | 3,434 | .. |
| Immigration | 93,851 | .. |
| Total | 1,313,799 | .. |
| Financially Unproductive Purposes. | ||
| Public buildings, including schools | 718,459 | .. |
| Defence and Maori Wars | 78,268 | .. |
| Naval defence | .. | 21,380 |
| Great European War | .. | 1,298,074 |
| Total | .. | 522,727 |
| Grand total | 11,040,831 | .. |
In spite of the fact that of the total indebtedness of £239,000,000 at the 31st March, 1926, no less than £84,000,000 had been incurred for purposes which not only were unproductive but were not represented by assets of any kind, yet, even on the very conservative basis adopted by the Treasury, the following statement shows that the State assets which may be set against the public debt exceed the total gross indebtedness by £9,000,000. Stores and supplies on hand are not included in the assets.
| STATE ASSETS AT 31ST MARCH, 1926. | ||
|---|---|---|
| £ | £ | |
| Cash and investments— | ||
| Cash in Public Account or in hands of officers (less liabilities) | 2,926,190 | |
| Investment of cash balances | 5,738,018 | |
| Reserve Fund (securities at cost) | 1,928,162 | |
| Post Office Savings-bank Reserve Fund | 1,000,000 | |
| Bank of New Zealand shares (nominal value) | 1,875,000 | |
| Public Debt Redemption Fund | 24,725,645 | 38,193,015 |
| Sinking funds accrued | 2,274,262 | |
| Loans and advances outstanding | 31,957,624 | |
| Lands and forests | 72,615,656 | |
| Revenue-earning and trading operations— | ||
| Railways (capital cost, including assets taken over from provinces) | 53,716,455 | |
| Telegraphs (value of assets) | 7,311,422 | |
| Pacific cable (estimated value of Dominion's interest) | 100,000 | |
| Electric-power supply and development (capital cost) | 4,740,425 | |
| Westport harbour-works (value of assets) | 585,195 | |
| Lighthouses and harbour-works (capital expenditure) | 1,206,692 | |
| Tourist and health resorts (capital expenditure) | 407,228 | |
| State coal-mines (value of assets) | 242,421 | |
| Kauri-gum (trading capital) | 85,000 | |
| Nauru and Ocean Islands (purchase price of rights) | 565,040 | |
| 68,959,878 | ||
| Public buildings (including school buildings) | 12,067,784 | |
| Roads | 17,818,392 | |
| Sawmills and quarries | 18,339 | |
| Development of mining (capital expenditure) | 882,975 | |
| Immigration (capital expenditure) | 2,932,491 | |
| Total | £247,720,416 | |
The whole of the public debt, as stated previously, comprises inscribed stock and debentures with varying periods of currency. The following table shows the relative increase of the different classes of securities during the last ten financial years:—
| At 31st March. | Inscribed Stock. | Debentures.* | Total. |
|---|---|---|---|
*Includes funded debt and Treasury bills (£26,257,022 and £1,400,000 respectively, at 31st March, 1926). | |||
| £ | £ | £ | |
| 1917 | 68,689,935 | 61,146,170 | 129,836,105 |
| 1918 | 77,760,485 | 73,079,570 | 150,840,055 |
| 1919 | 87,373,480 | 88,702,780 | 176,076,260 |
| 1920 | 95,095,914 | 106,074,841 | 201,170,755 |
| 1921 | 100,830,507 | 105,493,812 | 206,324,319 |
| 1922 | 108,592,018 | 110,462,367 | 219,054,385 |
| 1923 | 114,594,007 | 104,359,317 | 218,953,324 |
| 1924 | 119,250,189 | 102,366,172 | 221,616,361 |
| 1925 | 127,380,571 | 100,434,076 | 227,814,647 |
| 1926 | 138,332,801 | 100,522,677 | 238,855,478 |
Until comparatively recent years the large proportion of the productive power of the Dominion diverted to the construction of railways, roads, &c., and engaged in the preparation of land for farming necessitated the borrowing of capital from abroad; but of late the accumulation of savings, chiefly of small sums deposited in the savings-banks, has enabled the Government to raise considerable amounts from time to time locally. This was more particularly the case in connection with war loans, some 55 millions of pounds of which were raised in the Dominion. Since the war the tendency has been to go to the London market again.
Between the 31st March, 1916, and the corresponding date in 1926 the amount of New Zealand's public debt domiciled in London increased from 81 ½ to 128 millions, while that domiciled in New Zealand increased from 24 ½ to 107 millions. The amount raised in Australia is negligible and has decreased considerably in recent years, though an increase has been recorded in the last two years. The following table shows, of the total amount outstanding in each of the last ten years, the amount domiciled in London, Australia, and New Zealand:—
| PUBLIC DEBT: WHERE DOMICILED. | ||||||
|---|---|---|---|---|---|---|
| At 31st March. | Inscribed Stock. | Debentures. | ||||
| London. | Australia. | New Zealand. | London. | Australia. | New Zealand. | |
*Includes £26,257,022 funded debt and £1,400,000 Treasury bills. | ||||||
| £ | £ | £ | £ | £ | £ | |
| 1917 | 68,213,943 | .. | 475,992 | 15,663,875 | 3,385,650 | 42,096,645 |
| 1918 | 68,213,943 | .. | 9,546,842 | 20,493,875 | 3,385,650 | 49,200,045 |
| 1919 | 68,213,943 | .. | 19,159,537 | 27,494,386 | 3,385,650 | 57,822,744 |
| 1920 | 68,213,943 | .. | 26,881,972 | 27,494,386 | 3,385,650 | 75,194,804 |
| 1921 | 68,213,943 | .. | 32,616,564 | 31,627,472 | 1,655,450 | 72,210,890 |
| 1922 | 74,112,943 | .. | 34,479,075 | 31,806,216 | 2,287,440 | 76,368,711 |
| 1923 | 78,941,260 | 424,950 | 35,227,797 | 31,727,008 | 1,734,540 | 70,897,769 |
| 1924 | 82,561,755 | 424,450 | 36,263,984 | 32,315,138 | 1,682,150 | 68,368,884 |
| 1925 | 89,497,967 | 1,549,450 | 36,333,154 | 31,320,520 | 1,402,750 | 67,710,806 |
| 1926 | 98,045,528 | 2,197,450 | 38,089,823 | 30,002,131* | 1,445,650 | 69,074,896 |
The following table, showing as at the 31st March of each of the last twenty years the percentage of the total debt domiciled in each of the three countries, illustrates clearly the changes that have occurred during that period:—
| Year ended 31st March. | London. | Australia. | New Zealand. |
|---|---|---|---|
| Per Cent. | Per Cent. | Per Cent. | |
| 1907 | 80.38 | 4.81 | 14.81 |
| 1908 | 76.98 | 5.35 | 17.67 |
| 1909 | 77.01 | 5.46 | 17.53 |
| 1910 | 77.09 | 5.49 | 17.42 |
| 1911 | 76.74 | 5.20 | 18.06 |
| 1912 | 75.88 | 4.99 | 19.13 |
| 1913 | 76.54 | 4.68 | 18.78 |
| 1914 | 78.84 | 4.30 | 16.86 |
| 1915 | 76.36 | 3.98 | 19.66 |
| 1916 | 74.30 | 3.21 | 22.49 |
| 1917 | 64.60 | 2.61 | 32.79 |
| 1918 | 58.81 | 2.24 | 38.95 |
| 1919 | 54.35 | 1.93 | 43.72 |
| 1920 | 47.58 | 1.68 | 50.74 |
| 1921 | 46.39 | 1.64 | 51.97 |
| 1922 | 48.35 | 1.05 | 50.60 |
| 1923 | 50.54 | 0.99 | 48.47 |
| 1924 | 51.84 | 0.95 | 47.21 |
| 1925 | 53.03 | 1.30 | 45.67 |
| 1926 | 53.61 | 1.52 | 44.87 |
A summary of the loans outstanding on the 31st March, 1926, showing the amounts falling due in each financial year, is given.
| Due Date: Year ending 31st March, | Amount. |
|---|---|
* Overdue. † Repayable by annual instalments. The whole amount should be paid off by 31st March, 1959. | |
| £ | |
| 1918 | 1,000* |
| 1921 | 115* |
| 1925 | 100* |
| 1926 | 6,785* |
| 1927 | 4,192,200 |
| 1928 | 8,334,466 |
| 1929 | 14,465,265 |
| 1930 | 41,748,937 |
| 1931 | 21,118,832 |
| 1932 | 1,525,690 |
| 1933 | 4,659,743 |
| 1934 | 600 |
| 1935 | 1,125,000 |
| 1936 | 3,248,475 |
| 1937 | 1,000 |
| 1938 | 3,000 |
| 1939 | 22,537,609 |
| 1940 | 25,096,462 |
| 1941 | 515,865 |
| 1942 | 5,267,630 |
| 1943 | 4,000,000 |
| 1944 | 7,362,000 |
| 1945 | 7,788,064 |
| 1946 | 16,890,888 |
| 1948 | 895,000 |
| 1949 | 1,923,600 |
| 1950 | 1,106,500 |
| 1951 | 2,000,000 |
| 1952 | 5,899,000 |
| 1963 | 10,884,630 |
| Funded debt | 26,257,022† |
| Total | £238,855,478 |
The amounts of loan-money that have matured or will mature during the current financial year, with the months when due, are as follow:—
| Due Date. | £ |
|---|---|
* Overdue. | |
| 1918, January | 1,000* |
| 1920, December | 115* |
| 1925, March | 100* |
| 1925, December | 6,785* |
| 1926, April | 1,325,170 |
| 1926, May | 342,600 |
| 1926, June | 500,000 |
| 1926, July | 159,150 |
| 1926, August | 831,000 |
| 1926, September | 25,200 |
| 1926, October | 39,000 |
| 1926, November | 101,480 |
| 1926, December | 59,900 |
| 1927, January | 458,450 |
| 1927. February | 313,350 |
| 1927, March | 36,900 |
The highest and lowest London prices for the New Zealand 4-, 3 ½-, and 3-percent. stock, taken over a range of twenty years, are quoted.
| QUOTATIONS, NEW ZEALAND STOCK. | ||||||||
|---|---|---|---|---|---|---|---|---|
| Year. | 4-per-Cents. (1943–63.) | 4-per-Cents. (1929.) | 3 ½-per-Cents. (1940.) | 3-per-Cents. (1945.) | ||||
| Highest. | Lowest. | Highest. | Lowest. | Highest. | Lowest. | Highest. | Lowest. | |
| 1906 | .. | .. | 110 ¾ | 104 5/8 | 102 ½ | 98 3/8 | 91 ¼ | 87 ¼ |
| 1907 | .. | .. | 108 ¾ | 103 ¼ | 101 | 98 | 89 ¾ | 84 |
| 1908 | .. | .. | 109 5/8 | 1051 | 101 | 98 ¼ | 901 | 85 ¾ |
| 1909 | .. | .. | 108 3/8 | 104 ¾ | 99 ¾ | 97 3/8 | 88 3/8 | 85 5/8 |
| 1910 | .. | .. | 106 ¾ | 103 | 99 | 94 ¼ | 88 3/8 | 84 ¾ |
| 1911 | .. | .. | 106 ¾ | 1021 | 98 ½ | 95 ¼ | 87 3/8 | 85 |
| 1912 | .. | .. | 105 | 100 | 97 ¾ | 90 3/8 | 87 ¾ | 791 |
| 1913 | 101 | 96 3/8 | 102 ½ | 95 ½ | 91 7/8 | 87 ¾ | 80 ¾ | 76 ¼ |
| 1914 | 100 3/8 | 96 ¼ | 103 ⅛ | 98 | 92 ¾ | 87 | 83 ½ | 77 |
| 1915 | 97 ½ | 95 | 99 ⅛ | 95 | 87 ½ | 83 ¼ | 77 ¾ | 76 |
| 1916 | 95 ⅛ | 77 | 95 | 83 ¾ | 83 3/8 | 69 | 76 | 62 |
| 1917 | 82 5/8 | 76 | 86 ½ | 81 ¼ | 74 ½ | 69 | 64 3/8 | 60 |
| 1918 | 85 ½ | 78 ¼ | 90 7/8 | 84 | 79 | 71 ¾ | 68 ¾ | 61 ¾ |
| 1919 | 86 | 77 ⅛ | 90 | 83 | 79 | 68 ⅛ | 69 ⅛ | 60 |
| 1920 | 79 ½ | 68 ¼ | 86 ¼ | 79 | 70 ¾ | 64 ½ | 62 ½ | 56 ¼ |
| 1921 | 75 7/8 | 68 | 89 | 82 | 72 | 66 | 65 | 57 ½ |
| 1922 | 89 | 72 5/8 | 95 ½ | 88 5/8 | 82 7/8 | 71 5/8 | 74 ½ | 64 |
| 1923 | 93 ¾ | 85 ¾ | 96 ¾ | 91 | 86 ¾ | 80 ½ | 78 | 72 ¾ |
| 1924 | 91 7/8 | 82 ¼ | 97 | 93 ¾ | 86 ½ | 80 3/8 | 77 5/8 | 73 |
| 1925 | 89 ¾ | 84 | 97 25/32 | 94 ¼ | 85 7/8 | 82 | 78 | 74 |
Similar information in respect of stocks of more recent date is given in the following statement:—
| Year. | 6-per-Cents. (1936–51.) | 5-per-Cents. (1935–45.) | 4 ½-per-Cents. (1944.) | 4-per-Cents. (1933–43.) | ||||
|---|---|---|---|---|---|---|---|---|
| Highest. | Lowest. | Highest. | Lowest. | Highest. | Lowest. | Highest. | Lowest. | |
| 1921 | 103 5/8 | 99 | .. | .. | .. | .. | .. | .. |
| 1922 | 111 | 100 7/8 | 102 ¼ | 100 | .. | .. | .. | .. |
| 1923 | 112 ½ | 107 ¼ | 104 ¾ | 100 ⅛ | .. | .. | 91 | 87 ½ |
| 1924 | 111 | 105 ½ | 104 ½ | 99 ½ | 98 ½ | 95 3/8 | 91 ¾ | 86 |
| 1925 | 110 5/8 | 105 5/8 | 103 ½ | 99 ¼ | 98 3/8 | 94 ¼ | 91 ⅛ | 85 |
Of the total amount of public debt outstanding at the end of March, 1926, only £30,225,422, or 12 ½ per cent. of the total, bears interest at a lower rate than 4 per cent., as against 48 per cent. of the total at 31st March, 1914. Four per cent. is payable on £80,295,904, 4 ½ per cent. on £64,879,633, and 5 per cent. on £11,353,462, while a rate of £4 19s. 5.88d. per cent. is payable on the funded debt of £26,257,022. A higher rate than 5 per cent. is payable on £24,436,035. The following are the rates of interest payable on the whole public debt:—
| Rate of Interest. | Amount at each Rate. |
|---|---|
* Including £26,257,022 at £4 19s. 5.88d. per cent. † Discounted at various rates, averaging slightly under 4 ½ per cent. | |
| £ | |
| 6 per cent. | 7,588,170 |
| 5 ½ per cent. | 10,312,515 |
| 5 ¼ per cent. | 6,525,350 |
| 5 ⅛ per cent. | 10,000 |
| 5 per cent. | 37,610,484* |
| 4 ½ per cent. | 64,879,633 |
| 4 per cent. | 80,295,904 |
| 3 ¾ per cent. | 792,500 |
| 3 ½ per cent. | 19,770,132 |
| 3 per cent. | 9,662,790 |
| Overdue | 8,000 |
| Redemption bills† | 1,400,000 |
| Total | £238,855,478 |
The total annual amount of interest payable on the public debt as at 31st March, 1926 (including £1,466 payable direct from the Native Land Settlement Account), is £10,440,452, which gives an average rate of £4 £s. 5d. per £100, an average slightly lower than that for the previous year. On the total public debt outstanding on the 31st March, 1891, the average interest charge was £4 10s. 3d. per £100.
It should be understood that the foregoing relates to the interest payable on the debt outstanding at the various rates specified, and does not represent the payments made during the financial year, nor are sinking-fund charges included.
The actual net interest payments during the last twenty years out of the Consolidated Fund are shown in the following table, together with the rate per head of mean population:—
| NET INTEREST PAYMENTS FROM CONSOLIDATED FUND, 1906–07 TO 1925–26. | ||||
|---|---|---|---|---|
| Year ended 31st March. | Amount. | Rate per Head | ||
| £ | £ | s. | d. | |
| 1907 | 2,074,741 | 2 | 3 | 8 |
| 1908 | 2,105,577 | 2 | 3 | 3 |
| 1909 | 2,166,927 | 2 | 3 | 4 |
| 1910 | 2,302,338 | 2 | 4 | 11 |
| 1911 | 2,404,348 | 2 | 6 | 0 |
| 1912 | 2,457,952 | 2 | 5 | 10 |
| 1913 | 2,514,256 | 2 | 5 | 10 |
| 1914 | 2,666,254 | 2 | 7 | 4 |
| 1915 | 2,823,878 | 2 | 9 | 4 |
| 1916 | 2,933,762 | 2 | 11 | 0 |
| 1917 | 3,705,961 | 3 | 4 | 6 |
| 1918 | 3,936,080 | 3 | 8 | 4 |
| 1919 | 5,409,210 | 4 | 12 | 9 |
| 1920 | 6,352,344 | 5 | 5 | 2 |
| 1921 | 6,805,422 | 5 | 8 | 8 |
| 1922 | 7,390,864 | 5 | 15 | 0 |
| 1923 | 7,904,260 | 6 | 0 | 7 |
| 1924 | 7,877,597 | 5 | 18 | 1 |
| 1925 | 7,865,262 | 5 | 15 | 8 |
| 1926 | 8,129,799 | 5 | 16 | 10 |
The above amounts are net payments out of the Consolidated Fund only, and do not comprise the whole of the interest payments in respect of moneys raised by way of loans. For loans raised for the purposes of State advances to settlers, workers, local authorities, &c., and under the Land for Settlements Act, the interest, although made a charge upon the Consolidated Fund, is recovered from the receipts derived from the leasing of the lands or from instalments paid by borrowers. Other loan-money coming within the same category is that raised for State coal-mines, Native-land settlement, the purchase of the Cheviot Estate, the Rangitaiki-land drainage, the Hauraki Plains settlement, the Waihou and Ohinemuri Rivers improvement, and a number of other purposes.
Such interest does not become a burden upon the taxpayer, and consequently is not included in the figures upon which the rate per head of mean population is calculated.
The gross interest charges borne by the Consolidated Fund during the year ended 31st March. 1926, totalled £10,184,281, of which £2,054,482 was recovered from other accounts.
The provision of sinking funds for the repayment of loans dates back to the flotation of the first New Zealand loan (£500,000) in 1856, a sinking fund of 2 per cent. per annum being provided for the repayment of this loan. The sinking-fund principle was followed for all subsequent loans up to 1870, at which date the total public debt of the colony was £7,556,216, of which £3,208,350 represented Provincial Government indebtedness. The ultimate redemption of the whole £7,556,216 was provided for by sinking funds—part at 2 per cent. and the balance at 1 per cent.
The practice of instituting a sinking fund in connection with each loan issued was abandoned in 1870, although sinking-fund payments continued to be made in respect of earlier loans. Legislation was passed in 1877, and again in 1884, with a view to the release of the sinking funds, this object being achieved to a large extent by converting old loans into inscribed stock. In 1884 also it was provided that the payments to sinking fund would in effect be made by the sale of debentures, which were to be redeemed out of the additions to sinking funds as these became released through conversions.
The abandonment of the sinking-fund policy in 1870 was due to a feeling that sinking funds were unnecessary for the redemption of moneys expended on public works, the value of which in themselves would in the course of thirty or forty years be immensely greater than the amount of money put into them, without taking count of the wealth created through the public works. Gradually this view was modified, and it was recognized that the argument did not at least apply to dead-weight debt. Consequently, in 1906 a special sinking fund for the repayment of Maori War and defence loans was instituted, and under the Naval Defence Act, 1909, a sinking fund was provided for to pay off the loan raised to meet the cost of “H.M.S. New Zealand.”
In 1906, also, sinking funds were instituted in respect of loans raised for State advances to settlers and workers. These sinking funds might more correctly be termed “internal reserve funds,” the accumulations being immediately converted into capital, although kept apart in the accounts. Originally the sinking-fund payment provided for was to be 10 per cent. of the interest received on advances, but later on it was fixed at 1 per cent. of the loan liability, the 1 per cent. sinking-fund payment giving place in 1922 to a provision that any profits. remaining after the constitution of a general reserve fund were to be paid into sinking fund.
By 1910 it was felt that the repayment of the whole debt should be provided for, and a scheme making provision to repay the existing public debt, with application to future borrowings also, was embodied in the Public Debt Extinction Act, 1910. This Act, which provided for a sinking-fund £ in respect of the whole of the public debt for which no special sinking-fund arrangements were made, was superseded in 1925 by the Repayment of the Public Debt Act, 1925, which is referred to in detail below. At the 31st March, 1910, approximately £63,000,000 of the total gross indebtedness of £74,890,645 was not provided with a sinking fund or an internal reserve for its repayment.
Subsequent to the coming into operation of the public-debt-extinction scheme, special sinking funds were provided in respect of certain loans, the most important of which were the loans raised to meet the expenses of the Great War. Other loans which had special sinking-fund provisions included those raised in connection with land for settlement, Native-land settlement, Hauraki Plains settlement, Rangitaiki land-drainage, State coal-mines, electric supply, advances to Samoan Treasury, and purchase of phosphate rights in Nauru and Ocean Islands. The sinking funds in connection with the Westport Harbour loans, which were taken over by the Government, were also kept separate from the Public Debt Extinction Fund. With certain exceptions, mentioned farther on, these sinking funds now form part of the Public Debt Redemption Fund.
The Repayment of the Public Debt Act, 1925, which repealed the Public Debt Extinction Act, 1910, substituted for the long-term sinking-fund system a method whereby the Dominion's debt-reduction resources may be available to purchase and cancel Government securities as the market-price is advantageous, or pay them off at maturity, and so ensure an actual reduction in the public debt annually. For this purpose there is issued annually out of the Consolidated Fund a sum equal to ½ per cent. of the debt affected as at the 31st March, plus ½ per cent. of the total amount previously repaid or redeemed under the provisions of the Act. To this is added a sum equal to interest at 3 ½ per cent. per annum on the debt paid off under the scheme. By this means the bulk of the savings in interest on debt paid off is applied to further repayments of debt, and the debt existing at the commencement of the scheme will be liquidated in about sixty years, while all future loans will be liquidated within a similar period from the date of their inception.
Under the Act of 1925 a capital fund termed “The Public Debt Redemption Fund” was created, consisting of (1) the accumulations of sinking funds, amounting to £11,225,645 (leaving aside the State Advances, Westport Harbour, and other special sinking funds); (2) the amount advanced out of surplus revenue for discharged soldiers settlement, £13,500,000, less any amounts written off as a result of the revaluation of the properties of discharged soldiers. The capital of this fund will be held intact. The earnings therefrom will be credited to the Consolidated Fund and applied towards meeting the charge against that fund created by the Act.
The Act provides for an annual reduction in the amount of the public debt, the amount of reduction increasing from year to year. There will be an annual saving to the Consolidated Fund on the amount of debt redeemed, consisting of that portion of the interest and sinking fund in excess of 4 per cent. which would have been payable had the loans not been redeemed under the provisions of the Act.
The Act does not apply to the whole of the public debt, the following classes being specifically excluded:—
Moneys borrowed on the security of Treasury bills issued under section 39 of the Public Revenues Act, 1910.
Moneys borrowed in respect of the Advances to Settlers, Advances to Workers, and Advances to Local Authorities Branches of the State Advances Office.
Moneys borrowed in respect of the State Coal-mines, Electric-supply, Nauru and Ocean Islands, and Westport Harbour Accounts.
Moneys borrowed under the New Zealand Loan Act. 1863.
Loans funded by agreement with the Imperial Government under the authority of section 8 of the Finance Act, 1922.
Moneys borrowed under the authority of section 26 of the Finance Act, 1921–22 (for loans to Samoan Administration).
Of the total gross indebtedness of £227,814,647 at the 31st March, 1925, £174,128,135 was subject to the operations of the Repayment of the Public Debt Act, 1925. The corresponding figure at the 31st March, 1926, was £177,021,496, the portion of the public debt excluded from the provisions of the Act being at that date—
| £ | |
|---|---|
| Treasury bills | 1,400,000 |
| Advances to settlers | 18,021,786 |
| Advances to workers | 6,978,082 |
| Advances to local authorities | 2,790,293 |
| State coal-mines | 227,601 |
| Electric-supply | 4,809,248 |
| Nauru and Ocean Islands | 539,850 |
| Westport Harbour | 700,100 |
| Funded debt | 26,257,022 |
| Samoan loan | 110,000 |
| Total | £61,833,982 |
During the year ended 31st March, 1926, the sum of £870,641 was paid from the Consolidated Fund into the Public Debt Repayment Account, representing ½ per cent. of the public debt affected by the Act as at the 31st March, 1925. A further amount of £2,093 was also paid over, this being 3 ½ per cent. of the debt cancelled during the year. Of the total amount so transferred £870,638 was utilized to redeem and cancel securities of a nominal value of £889,733. As pointed out earlier in this subsection, the funds in the Public Debt Repayment Account are not the only source from which debt redemptions are made.
At the 31st March, 1922, £27,532,164 of New Zealand's public debt was owing to the British Government, all but £1,191,919 of this being on account of war expenditure.
Section 8 of the Finance Act, 1922, authorized the Minister of Finance to arrange with the Imperial Government for the funding of this debt, and arrangements were accordingly made, and were embodied in a memorandum of agreement dated the 6th September, 1922.
The funding was carried out on an annuity basis of 6 per cent., the total payment each year being £1,651,930. Interest is at the rate of £4 19s. 5.88d. per cent., the balance of the 6 per cent. going to reduction of the debt.
The first half-yearly payment of £825,965 was made to the British Government on the 1st December, 1922. The division between interest and principal in each half-yearly payment to date is as follows:—
| Date of Instalment. | Interest. | Principal. | Balance of Debt outstanding. |
|---|---|---|---|
* Including £200,000 additional, paid off Naval Defence loan. | |||
| £ | £ | £ | |
| 1st December, 1922 | 684,794 | 141,171 | 27,390,993 |
| 1st June, 1923 | 681,282 | 144,683 | 27,246,310 |
| 1st December, 1923 | 677,684 | 148,281 | 27,098,029 |
| 1st June, 1924 | 673,996 | 151,969 | 26,946,060 |
| 1st December, 1924 | 670,216 | 355,749* | 26,590,311 |
| 1st June, 1925 | 661,367 | 164,598 | 26,425,713 |
| 1st December, 1925 | 657,274 | 168,691 | 26,257,022 |
Under the agreement the original amount of £27,532,164 will be automatically discharged from the public debt by the end of the financial year 1958–59. The amount payable for amortization in 1926–27 is £350,074, and will gradually increase per annum as the interest-payment reduces on the lessening debt. An important condition of the agreement with the British Government is that the whole or any part of the funded debt may be redeemed at any time. This condition was taken advantage of when oh 1st December, 1924, £200,000 was paid off the Naval Defence loan.
Particulars of the funded debt, with amounts repaid to 31st March, 1926, and the annual charges on account of interest and repayment, are as follow:—
| PUBLIC DEBT FUNDED IN TERMS OF FINANCE ACT, 1922, SECTION 8. | |||||
|---|---|---|---|---|---|
| — | Amount of Debt funded. | Total Debt repaid to 31st March, 1926. | Annual Charge, 1926–27. | ||
| Interest. | Repayment of Debt. | Total. | |||
| £ | £ | £ | £ | £ | |
| Public Revenues Amendment Act, 1914, section 8 (war expenses) | 2,067,411 | 79,977 | 98,552 | 25,493 | 124,045 |
| Public Revenues Amendment Act, 1915, section 5 (war expenses) | 8,105,992 | 313,577 | 386,406 | 99,954 | 486,360 |
| Finance Act, 1916, section 35 | 4,736,842 | 183,242 | 225,802 | 58,409 | 284,211 |
| War Purposes Loans Act, 1917 | 4,830,000 | 186,846 | 230,242 | 59,558 | 289,800 |
| Finance Act, 1918, section 10 | 6,600,000 | 255,318 | 314,617 | 81,383 | 396,000 |
| Naval Defence Act, 1909 | 963,131 | 247,331 | 35,331 | 22,456 | 57,787 |
| Aid to Public Works and Land Settlement Act, 1910 | 191,010 | 7,389 | 9,105 | 2,355 | 11,460 |
| Land for Settlements Act, 1908 | 37,778 | 1,462 | 1,801 | 466 | 2,267 |
| Totals | 27,532,164 | 1,275,142 | 1,301,856 | 350,074 | 1,651,930 |
The provisions of the Repayment of the Public Debt Act do not apply to the funded debt.
The following table shows the net amounts actually paid out of the Consolidated Fund in respect of debt amortization charges during each of the last ten years. Payments out of surplus revenue to the Loan Redemption Account are not included.
| NET AMORTIZATION CHARGES PAID OUT OF CONSOLIDATED FUND, 1916–17 TO 1925–26. | ||||
|---|---|---|---|---|
| Year ended 31st March. | Payments to Sinking Fund. | Payments in Reduction of Funded Debt. | Payments to Public Debt Repayment Account. | Total. |
| £ | £ | £ | £ | |
| 1917 | 326,924 | .. | .. | 326,924 |
| 1918 | 494,699 | .. | .. | 494,699 |
| 1919 | 677,559 | .. | .. | 677,559 |
| 1920 | 897,082 | .. | .. | 897,082 |
| 1921 | 1,026,171 | .. | .. | 1,026,171 |
| 1922 | 1,051,414 | .. | .. | 1,051,414 |
| 1923 | 854,526 | 141,171 | .. | 995,697 |
| 1924 | 711,709 | 292,571 | .. | 1,004,280 |
| 1925 | 690,076 | 307,306 | .. | 997,382 |
| 1926 | 7,000 | 332,632 | 872,734 | 1,212,366 |
The passing of the Repayment of the Public Debt Act, 1925, has robbed the comparative figures of accrued sinking funds of much of their significance. The following table, showing the growth of the sinking funds up to the 31st March, 1925, is nevertheless of interest.
| ACCRUED SINKING FUNDS, 1906–07 TO 1925–26. | ||
|---|---|---|
| Year ended 31st March. | Accrued Sinking Funds. | |
| Amount. | Proportion of Gross Debt. | |
| £ | Per Cent. | |
| 1907 | 2,042,068 | 3.18 |
| 1908 | 1,268,361 | 1.91 |
| 1909 | 1,479,224 | 2.09 |
| 1910 | 1,503,225 | 2.07 |
| 1911 | 1,754,486 | 2.16 |
| 1912 | 2,160,603 | 2.56 |
| 1913 | 2,603,642 | 2.89 |
| 1914 | 3,063,992 | 3.07 |
| 1915 | 3,178,055 | 3.18 |
| 1916 | 3,679,964 | 3.36 |
| 1917 | 4,263,590 | 3.28 |
| 1918 | 4,971,605 | 3.30 |
| 1919 | 5,951,056 | 3.38 |
| 1920 | 7,257,564 | 3.61 |
| 1921 | 8,763,072 | 4.25 |
| 1922 | 10,655,394 | 4.86 |
| 1923 | 11,879,256 | 5.43 |
| 1924 | 12,974,028 | 5.85 |
| 1925 | 13,462,839 | 5.91 |
| 1926 | 2,274,262 | 0.95 |
It is also interesting to compare, as in the following table, the individual sinking funds at the 31st March, 1910 (prior to the introduction of the Extinction Fund scheme), at 31st March, 1925 (prior to the substitution of the Redemption Fund scheme), and at the 31st March, 1926 (after the inauguration of the Redemption Fund scheme).
| – | At 31st March, 1910. | At 31st March, 1923. | At 31st March. 1926. |
|---|---|---|---|
| £ | £ | £ | |
| Canterbury Loan Ordinance. 1862 | 20,596 | .. | .. |
| New Zealand Loan Act, 1863 | 215,051 | 2,207 | .. |
| Government loans to local bodies | 753,209 | 799,601 | .. |
| War and defence loans | 168,109 | 192,691 | .. |
| State advances to settlers | 346,260 | 1,555,087 | 1,594,104 |
| State advances to workers | 346,260 | 67,117 | 80,983 |
| State advances to local authorities | 346,260 | 308,980 | 342,262 |
| Naval Defence Act. 1909 | .. | 876,380 | |
| War loans (1914–18) | .. | 4,898,934 | .. |
| Land for settlements | .. | 1,179,732 | .. |
| Native-land settlement | .. | 11,977 | .. |
| Guaranteed mining advances | .. | 877 | .. |
| Hauraki Plains settlement | .. | 2,176 | .. |
| Opening up Crown lands for settlement | .. | 3,416 | .. |
| Rangitaiki land-drainage | .. | 904 | .. |
| Public Debt Extinction Act, 1910 | .. | 3,311,144 | .. |
| State coal-mines | .. | 41,669 | 48,198 |
| Nauru and Ocean Islands | .. | 13,539 | 19 |
| Samoan loan | .. | 3,070 | 4,747 |
| Westport Harbour loans | .. | 181,230 | 186,558 |
| Electric supply | .. | 12,108 | 17,391 |
| Totals | 1,503,225 | 13,462,839 | 2,274,262 |
While the sinking funds were annually increasing it was customary to regard the net-indebtedness figures as giving the best comparison between one year and another. The initiation of the new system of amortization has, however, destroyed the comparison on this basis as between 1925–26 and previous years, and the gross figures now afford a. better and more comparable index.
The figures of net indebtedness for the last twenty years are as follows:—
| NET INDEBTEDNESS, 1906–07 TO 1925–26. | ||||
|---|---|---|---|---|
| As at 31st March, | Amount Per Head of Population. | |||
| £ | £ | s. | d. | |
| 1907 | 62,136,972 | 64 | 12 | 4 |
| 1908 | 65,185,536 | 66 | 3 | 2 |
| 1909 | 69,459,310 | 68 | 7 | 3 |
| 1910 | 73,387,420 | 70 | 17 | 10 |
| 1911 | 79,323,636 | 75 | 2 | 0 |
| 1912 | 82,193,310 | 76 | 0 | 3 |
| 1913 | 87,457,121 | 78 | 13 | 7 |
| 1914 | 91,689,835 | 80 | 9 | 1 |
| 1915 | 96,644,455 | 84 | 0 | 3 |
| 1916 | 105,957,433 | 92 | 2 | 4 |
| 1917 | 125,572,515 | 109 | 2 | 1 |
| 1918 | 145,868,450 | 126 | 6 | 1 |
| 1919 | 170,125,204 | 144 | 7 | 5 |
| 1920 | 193,913,191 | 156 | 15 | 5 |
| 1921 | 197,561,222 | 155 | 17 | 4 |
| 1922 | 208,241,121 | 160 | 0 | 8 |
| 1923 | 207,024,048 | 156 | 4 | 2 |
| 1924 | 208,595,743 | 154 | 15 | 3 |
| 1925 | 214,287,128 | 155 | 6 | 9 |
| 1926 | 236,581,216 | 167 | 16 | 3 |
In general the net indebtedness shown in the above table is merely the balance left after deducting the accrued sinking funds from the amount of debentures and stock in circulation. In some years, however, a further deduction has been made on account of loan-money, included in the gross indebtedness, having been raised at the end of the financial year for the redemption of debentures falling due early in the succeeding financial year. The years concerned and the amounts so deducted on this account are:—
| Year ended 31st March, | Amount. |
|---|---|
| £ | |
| 1914 | 4,976,600 |
| 1915 | 237,400 |
| 1921 | 25 |
| 1922 | 157,870 |
| 1923 | 50,020 |
| 1924 | 46,590 |
| 1925 | 64,680 |
The following figures show the gross and net public debt of each State of the Australian Commonwealth, and of the Commonwealth itself, on the 30th June, 1925, and of New Zealand on the 31st March, 1926:—
| State. | Gross Indebtedness. | Accrued Sinking Funds. | Net Indebtedness. | Indebtedness per Head. | |||||
|---|---|---|---|---|---|---|---|---|---|
| Gross. | Net. | ||||||||
* Deduction made for debts counted twice in gross figures. | |||||||||
| £ | £ | £ | £ | s. | d. | £ | s. | d. | |
| New South Wales | 215,331,110 | 578,184 | 214,752,926 | 94 | 15 | 7 | 94 | 10 | 6 |
| Victoria | 131,169,565 | 4,084,796 | 127,084,769 | 78 | 10 | 1 | 76 | 1 | 2 |
| Queensland | 96,389,067 | 1,107,554 | 95,281,513 | 112 | 14 | 2 | 111 | 8 | 3 |
| South Australia | 74,780,835 | 1,270,118 | 73,510,717 | 137 | 13 | 9 | 135 | 7 | 0 |
| Western Australia | 64,493,261 | 10,183,347 | 54,309,914 | 175 | 4 | 10 | 147 | 11 | 5 |
| Tasmania | 23,894,416 | 1,406,952 | 22,487,464 | 112 | 15 | 2 | 106 | 2 | 5 |
| Total, Australian States | 606,058,254 | 18,630,951 | 587,427,303 | 102 | 4 | 3 | 99 | 1 | 5 |
| Commonwealth | 430,948,062 | 2,150,253 | 428,797,809 | 72 | 13 | 8 | 72 | 6 | 4 |
| Total Commonwealth and States | 1,037,006,316 | 20,781,204 | 965,870,844* | 174 | 17 | 11 | 162 | 17 | 11* |
| New Zealand | 238,855,478 | 2,274,262 | 236,581,216 | 169 | 8 | 6 | 167 | 16 | 3 |
The rate of gross indebtedness per head in Australia is now somewhat higher than in the Dominion, though the net rate is lower. If the Commonwealth figure be added to that of each individual State it is found that of the six Australian States only New South Wales and Victoria have lower per-head rates of indebtedness than this Dominion.
As has been shown in Subsection C of this section, an appreciable proportion of the public debt of New Zealand is represented by money borrowed by the State not for its own requirements, but for the purpose of lending out at easy rates of interest for various defined purposes.
As early as 1892 the Government commenced the purchase of lands for cutting up for sale or lease to private individuals, and two years later the passing of the Advances to Settlers Act, 1894, marked the inauguration of a series of schemes for lending money to settlers, workers, &c., for the purchase of homes, the improvement of farms, and the development of resources and of industries. The schemes vary considerably in detail, but all lie in one of two main classes—those in which the money is advanced on security, and those on which the expenditure is incurred by the Government itself in the first place and recouped from sales or leases. Advances to settlers, workers, discharged soldiers, and local authorities are the principal examples of the former class, and the purchase of land for settlements (including the settlement of discharged soldiers) is the principal of the latter.
Of the advances proper, several classes are administered by a separate Department known as the State Advances Department, and the accounts relating to these are not included in the public accounts, nor are they dealt with in Subsection A of this section. The various systems of advances administered by the State Advances Department are dealt with in detail in the present subsection. The system of advances to discharged soldiers for settlement purposes is dealt with in the section of this book dealing with land tenure and settlement, while particulars of advances for mining purposes are given in the section relating to mining.
The Advances to Settlers Office was established by an Act passed in 1894. An administrative officer called the Superintendent was appointed early in the following year, and a Board set up to advise and co-operate with the Superintendent. Advances can be granted only with the consent of the Board.
The capital fund was limited to £3,000,000, which was to be raised within two years after the passing of the Act at an annual rate of interest not higher than 4 per cent. The first issue of £1,500,000 realized £94 8s. 9d. per £100 stock. The minimum advance was fixed at £25, and the maximum at £2,500 (now £3,500), repayable in thirty-six years and a half by half-yearly instalments of 3 per cent. on the amount borrowed.
The legislation has been amended at different times, and is now embodied in the State Advances Act, 1913, and its amendments. It authorizes the borrowing of moneys for the purpose of lending to settlers, workers, and local authorities. Each year there may be borrowed for advances to settlers £5,000,000, to workers £1,500,000. and to local authorities £5,000,000.
Money is advanced to settlers on first mortgage of lands and improvements held under the following classes of tenure, free from all encumbrances, liens, and interests other than leasehold interests:—
Freehold land in fee-simple under the Land Transfer Act.
Freehold land in fee-simple the title to which is registered under the Deeds Registration Act.
Crown land held on perpetual lease under the Land Act.
Crown land held under Part III or Part IV of the Land Act.
Crown land held on lease as a small grazing-run under the Land Act.
Crown land held on agricultural lease under the Mining Act.
Crown land held on lease (not being for mining purposes) under the Westland and Nelson Coalfields Administration Act.
Native land held on lease under the West Coast Settlement Reserves Act.
Land held on lease under the Westland and Nelson Native Reserves Act.
Land held under the Thermal Springs Districts Act.
Educational and other reserves held under leases administered by the Land Boards.
Crown land held by license on the deferred-payment system.
Land held under lease from a leasing authority as defined by the Public Bodies' Leasing-powers Act, or the Public Bodies' Leases Act, and providing for the payment by the incoming tenant of valuation for improvements made upon the land.
Land held under lease from a Maori Land Board under the Maori Land Settlement Act.
Crown lands held on lease for agricultural purposes under the Mining Districts Land Occupation Act, or Part VIII of the Land Act.
Crown lands held on license for residence-sites under the Mining Act.
Crown lands held on lease under section 45, Part III, of the Mining Act.
Maori lands which have been transferred in trust for leasing to and are held under leases from a Maori Land Board under the powers contained in the Native Land Act.
Land held under certain classes of lease granted by a Borough Council under the Municipal Corporations Act.
Land held under certain leases granted by the Wanganui River Trust.
Land held under lease granted by a leasing authority as defined by the Public Bodies' Leases Act, in any case where the lease is for any term not less than fourteen years, with a recurrent right of renewal for further terms of not less than fourteen years.
Crown land or settlement land held on lease or license under section 4 of the Discharged Soldiers Settlement Act.
Crown land held on lease or license for pastoral purposes under Part VI of the Land Art.
Loans can be granted only on the instalment system and for periods not exceeding thirty-six and a half years—
On all freeholds, up to three-fourths of the value of the security:
On leaseholds, up to three-fourths of the value of the lessee's interest in the lease.
Where an advance is required for the purpose of erecting a building, the amount of the loan granted by the Board may be advanced in progress-payments from time to time as the erection of the building proceeds. An inspection and report must be made by an officer of the Valuation Department prior to payment of any progress-payment on account of the loan, and for each such inspection a fee of 15s. is payable by the applicant.
No loan of less than £25 or more than £3,500 can be granted. Applications for loans not exceeding £500 have priority over applications for larger sums. If the applicant has already obtained any advance under the Act and is desirous of obtaining a further advance, the amount of the application, added to the amount of the advances already obtained, must not exceed £3,500. The property which the applicant offers as security for the loan must consist of one or more holdings of the several classes of tenure mentioned previously, and must, of course, be of the necessary value; and, if the property is leasehold, all the covenants and conditions of the lease, including the payment of rent, must have been regularly complied with.
All applications must be accompanied by a valuation fee according to the following scale:—
| £ | s. | d. | |
|---|---|---|---|
| Not exceeding £100 | 0 | 15 | 0 |
| Exceeding £100 but not exceeding £250 | 1 | 11 | 6 |
| ,, £250 ,, £500 | 2 | 2 | 0 |
| ,, £500 ,, £3,500 | 2 | 12 | 6 |
Mortgages are repayable by half-yearly payments of principal and interest combined. They may also be wholly repaid at any time. Very low rates of interest were adopted at the inception of the scheme, the general rate up to the end of 1925 being 5 per cent., reducible to 4 ½ per cent. for prompt payment. Owing to the increase in the rate at which the money has had to be borrowed by the Government, a somewhat higher rate on new loans has now been imposed.
Interest on new loans is charged at the rate of 6 ¼ per cent., reducible to 5 ¾ per cent., save on advances authorized for the purpose of repaying mortgages, in which case the rate is 6 £½ per cent., reducible to 6 per cent., provided that in each case payment is made not later than fourteen days after due date and no arrears in respect of instalments or other payments under the mortgage remain outstanding.
The following table shows, taking a loan of £100 at 6 ¼ per cent. as an instance, how much of each instalment is applied to repaying the principal, and how much is in payment of interest. It shows also the amount of rebate in respect of each instalment, and the balance of principal remaining due after payment of the respective instalments until the loan is entirely repaid.
| TABLE OF PRESCRIBED HALF-YEARLY INSTALMENTS FOR EVERY ONE HUNDRED POUNDS OF THE LOAN AT 6 ¼ PER CENT. | ||||||||||||||
|---|---|---|---|---|---|---|---|---|---|---|---|---|---|---|
| Half-year. | Half-yearly instalment. | Apportioned thus: | ½ per Cent. Rebate of Interest. | Balance of Principal owing. | ||||||||||
| On Account of Interest at 6 ¼ per Cent. | On Account of Principal | |||||||||||||
| £ | s. | d. | £ | s. | d. | £ | s. | d. | s. | d. | £ | s. | d. | |
| Thirty-six-and-a-half-years Term. | ||||||||||||||
| 1 | 3 | 9 | 11 | 3 | 2 | 6 | 0 | 7 | 5 | 5 | 0 | 99 | 12 | 7 |
| 2 | 3 | 9 | 11 | 3 | 2 | 4 | 0 | 7 | 7 | 5 | 0 | 99 | 5 | 0 |
| 3 | 3 | 9 | 11 | 3 | 2 | 1 | 0 | 7 | 10 | 5 | 0 | 98 | 17 | 2 |
| 4 | 3 | 9 | 11 | 3 | 1 | 10 | 0 | 8 | 1 | 4 | 11 | 98 | 9 | 1 |
| 5 | 3 | 9 | 11 | 3 | 1 | 7 | 0 | 8 | 4 | 4 | 11 | 98 | 0 | 9 |
| 6 | 3 | 9 | 11 | 3 | 1 | 3 | 0 | 8 | 8 | 4 | 11 | 97 | 12 | 1 |
| 7 | 3 | 9 | 11 | 3 | 1 | 0 | 0 | 8 | 11 | 4 | 11 | 97 | 3 | 2 |
| 8 | 3 | 9 | 11 | 3 | 0 | 9 | 0 | 9 | 2 | 4 | 10 | 96 | 14 | 0 |
| 9 | 3 | 9 | 11 | 3 | 0 | 6 | 0 | 9 | 5 | 4 | 10 | 96 | 4 | 7 |
| 10 | 3 | 9 | 11 | 3 | 0 | 2 | 0 | 9 | 9 | 4 | 10 | 95 | 14 | 10 |
| 11 | 3 | 9 | 11 | 2 | 19 | 10 | 0 | 10 | 1 | 4 | 9 | 95 | 4 | 9 |
| 12 | 3 | 9 | 11 | 2 | 19 | 7 | 0 | 10 | 4 | 4 | 9 | 94 | 14 | 5 |
| 13 | 3 | 9 | 11 | 2 | 19 | 3 | 0 | 10 | 8 | 4 | 9 | 94 | 3 | 9 |
| 14 | 3 | 9 | 11 | 2 | 18 | 11 | 0 | 11 | 0 | 4 | 9 | 93 | 12 | 9 |
| 15 | 3 | 9 | 11 | 2 | 18 | 6 | 0 | 11 | 5 | 4 | 8 | 93 | 1 | 4 |
| 16 | 3 | 9 | 11 | 2 | 18 | 2 | 0 | 11 | 9 | 4 | 8 | 92 | 9 | 7 |
| 17 | 3 | 9 | 11 | 2 | 17 | 10 | 0 | 12 | 1 | 4 | 8 | 91 | 17 | 6 |
| 18 | 3 | 9 | 11 | 2 | 17 | 5 | 0 | 12 | 6 | 4 | 7 | 91 | 5 | 0 |
| 19 | 3 | 9 | 11 | 2 | 17 | 1 | 0 | 12 | 10 | 4 | 7 | 90 | 12 | 2 |
| 20 | 3 | 9 | 11 | 2 | 16 | 8 | 0 | 13 | 3 | 4 | 6 | 89 | 18 | 11 |
| 21 | 3 | 9 | 11 | 2 | 16 | 3 | 0 | 13 | 8 | 4 | 6 | 89 | 5 | 3 |
| 22 | 3 | 9 | 11 | 2 | 15 | 10 | 0 | 14 | 1 | 4 | 8 | 88 | 11 | 2 |
| 23 | 3 | 9 | 11 | 2 | 15 | 4 | 0 | 14 | 7 | 4 | 5 | 87 | 16 | 7 |
| 24 | 3 | 9 | 11 | 2 | 14 | 11 | 0 | 15 | 0 | 4 | 5 | 87 | 1 | 7 |
| 25 | 3 | 9 | 11 | 2 | 14 | 5 | 0 | 15 | 6 | 4 | 4 | 86 | 6 | 1 |
| 26 | 3 | 9 | 11 | 2 | 14 | 0 | 0 | 15 | 11 | 4 | 4 | 85 | 10 | 2 |
| 27 | 3 | 9 | 11 | 2 | 13 | 6 | 0 | 16 | 5 | 4 | 3 | 84 | 13 | 9 |
| 28 | 3 | 9 | 11 | 2 | 12 | 11 | 0 | 17 | 0 | 4 | 3 | 83 | 16 | 9 |
| 29 | 3 | 9 | 11 | 2 | 12 | 5 | 0 | 17 | 6 | 4 | 2 | 82 | 19 | 3 |
| 30 | 3 | 9 | 11 | 2 | 11 | 10 | 0 | 18 | 1 | 4 | 2 | 82 | 1 | 2 |
| 31 | 3 | 9 | 11 | 2 | 11 | 4 | 0 | 18 | 7 | 4 | 1 | 81 | 2 | 7 |
| 32 | 3 | 9 | 11 | 2 | 10 | 9 | 0 | 19 | 2 | 4 | 1 | 80 | 3 | 5 |
| 33 | 3 | 9 | 11 | 2 | 10 | 1 | 0 | 19 | 10 | 4 | 0 | 79 | 3 | 7 |
| 34 | 3 | 9 | 11 | 2 | 9 | 6 | 1 | 0 | 5 | 4 | 0 | 78 | 3 | 2 |
| 35 | 3 | 9 | 11 | 2 | 8 | 10 | 1 | 1 | 1 | 3 | 11 | 77 | 2 | 1 |
| 36 | 3 | 9 | 11 | 2 | 8 | 3 | 1 | 1 | 8 | 3 | 10 | 76 | 0 | 5 |
| 37 | 3 | 9 | 11 | 2 | 7 | 6 | 1 | 2 | 5 | 3 | 10 | 74 | 18 | 0 |
| 38 | 3 | 9 | 11 | 2 | 6 | 10 | 1 | 3 | 1 | 3 | 9 | 73 | 14 | 11 |
| 39 | 3 | 9 | 11 | 2 | 6 | 1 | 1 | 3 | 10 | 3 | 8 | 72 | 11 | 1 |
| 40 | 3 | 9 | 11 | 2 | 5 | 4 | 1 | 4 | 7 | 3 | 8 | 71 | 6 | 6 |
| 41 | 3 | 9 | 11 | 2 | 4 | 7 | 1 | 5 | 4 | 3 | 7 | 70 | 1 | 2 |
| 42 | 3 | 9 | 11 | 2 | 3 | 10 | 1 | 6 | 1 | 3 | 6 | 68 | 15 | 1 |
| 43 | 3 | 9 | 11 | 2 | 3 | 0 | 1 | 6 | 11 | 3 | 5 | 67 | 8 | 2 |
| 44 | 3 | 9 | 11 | 2 | 2 | 2 | 1 | 7 | 9 | 3 | 4 | 66 | 0 | 5 |
| 45 | 3 | 9 | 11 | 2 | 1 | 3 | 1 | 8 | 8 | 3 | 4 | 64 | 11 | 9 |
| 46 | 3 | 9 | 11 | 2 | 0 | 5 | 1 | 9 | 6 | 3 | 3 | 63 | 2 | 3 |
| 47 | 3 | 9 | 11 | 1 | 19 | 6 | 1 | 10 | 5 | 3 | 2 | 61 | 11 | 10 |
| 48 | 3 | 9 | 11 | 1 | 18 | 6 | 1 | 11 | 5 | 3 | 1 | 60 | 0 | 5 |
| 49 | 3 | 9 | 11 | 1 | 17 | 6 | 1 | 12 | 5 | 3 | 0 | 58 | 8 | 0 |
| 50 | 3 | 9 | 11 | 1 | 16 | 6 | 1 | 13 | 5 | 2 | 11 | 56 | 14 | 7 |
| 51 | 3 | 9 | 11 | 1 | 15 | 6 | 1 | 14 | 5 | 2 | 10 | 55 | 0 | 2 |
| 52 | 3 | 9 | 11 | 1 | 14 | 5 | 1 | 15 | 6 | 2 | 9 | 53 | 4 | 5 |
| 53 | 3 | 9 | 11 | 1 | 13 | 3 | 1 | 16 | 8 | 2 | 8 | 51 | 8 | 0 |
| 54 | 3 | 9 | 11 | 1 | 12 | 2 | 1 | 17 | 9 | 2 | 7 | 49 | 10 | 3 |
| 55 | 3 | 9 | 11 | 1 | 11 | 0 | 1 | 18 | 11 | 2 | 6 | 47 | 11 | 4 |
| 56 | 3 | 9 | 11 | 1 | 9 | 9 | 2 | 0 | 2 | 2 | 5 | 45 | 11 | 2 |
| 57 | 3 | 9 | 11 | 1 | 8 | 6 | 2 | 1 | 5 | 2 | 3 | 43 | 9 | 9 |
| 58 | 3 | 9 | 11 | 1 | 7 | 2 | 2 | 2 | 9 | 2 | 2 | 41 | 7 | 0 |
| 59 | 3 | 9 | 11 | 1 | 5 | 10 | 2 | 4 | 1 | 2 | 1 | 39 | 2 | 11 |
| 60 | 3 | 9 | 11 | 1 | 4 | 6 | 2 | 5 | 5 | 2 | 0 | 36 | 17 | 6 |
| 61 | 3 | 9 | 11 | 1 | 3 | 1 | 2 | 6 | 10 | 1 | 10 | 34 | 10 | 8 |
| 62 | 3 | 9 | 11 | 1 | 1 | 7 | 2 | 8 | 4 | 1 | 9 | 32 | 2 | 4 |
| 63 | 3 | 9 | 11 | 1 | 0 | 1 | 2 | 9 | 10 | 1 | 7 | 29 | 12 | 6 |
| 64 | 3 | 9 | 11 | 0 | 18 | 6 | 2 | 11 | 5 | 1 | 6 | 27 | 1 | 1 |
| 65 | 3 | 9 | 11 | 0 | 16 | 11 | 2 | 13 | 0 | 1 | 4 | 24 | 8 | 1 |
| 66 | 3 | 9 | 11 | 0 | 15 | 3 | 2 | 14 | 8 | 1 | 3 | 21 | 13 | 5 |
| 67 | 3 | 9 | 11 | 0 | 13 | 7 | 2 | 16 | 4 | 1 | 1 | 18 | 17 | 1 |
| 68 | 3 | 9 | 11 | 0 | 11 | 10 | 2 | 18 | 1 | 0 | 11 | 15 | 19 | 0 |
| 69 | 3 | 9 | 11 | 0 | 10 | 0 | 2 | 19 | 11 | 0 | 10 | 12 | 19 | 1 |
| 70 | 3 | 9 | 11 | 0 | 8 | 1 | 3 | 1 | 10 | 0 | 8 | 9 | 17 | 3 |
| 71 | 3 | 9 | 11 | 0 | 6 | 2 | 3 | 3 | 9 | 0 | 6 | 6 | 13 | 6 |
| 72 | 3 | 9 | 11 | 0 | 4 | 2 | 3 | 5 | 9 | 0 | 4 | 3 | 7 | 9 |
| 73 | 3 | 9 | 11 | 0 | 2 | 2 | 3 | 7 | 9 | 0 | 2 | .. | .. | .. |
| Thirty-years Term. | ||||||||||||||
| 1 | 3 | 14 | 3 | 3 | 2 | 6 | 0 | 11 | 9 | 5 | 0 | 99 | 8 | 3 |
| 2 | 3 | 14 | 3 | 3 | 2 | 2 | 0 | 12 | 1 | 5 | 0 | 98 | 16 | 2 |
| 3 | 3 | 14 | 3 | 3 | 1 | 10 | 0 | 12 | 5 | 4 | 11 | 98 | 3 | 9 |
| 4 | 3 | 14 | 3 | 3 | 1 | 5 | 0 | 12 | 10 | 4 | 11 | 97 | 10 | 11 |
| 5 | 3 | 14 | 3 | 3 | 1 | 0 | 0 | 13 | 3 | 4 | 11 | 96 | 17 | 8 |
| 6 | 3 | 14 | 3 | 3 | 0 | 7 | 0 | 13 | 8 | 4 | 10 | 96 | 4 | 0 |
| 7 | 3 | 14 | 3 | 3 | 0 | 2 | 0 | 14 | 1 | 4 | 10 | 95 | 9 | 11 |
| 8 | 3 | 14 | 3 | 2 | 19 | 9 | 0 | 14 | 6 | 4 | 9 | 94 | 15 | 5 |
| 9 | 3 | 14 | 3 | 2 | 19 | 3 | 0 | 15 | 0 | 4 | 9 | 94 | 0 | 5 |
| 10 | 3 | 14 | 3 | 2 | 18 | 10 | 0 | 15 | 5 | 4 | 8 | 93 | 5 | 0 |
| 11 | 3 | 14 | 3 | 2 | 18 | 4 | 0 | 15 | 11 | 4 | 8 | 92 | 9 | 1 |
| 12 | 3 | 14 | 3 | 2 | 17 | 10 | 0 | 16 | 5 | 4 | 8 | 91 | 12 | 8 |
| 18 | 3 | 14 | 3 | 2 | 17 | 4 | 0 | 16 | 11 | 4 | 7 | 90 | 15 | 9 |
| 14 | 3 | 14 | 3 | 2 | 16 | 9 | 0 | 17 | 6 | 4 | 6 | 89 | 18 | 3 |
| 15 | 3 | 14 | 3 | 2 | 16 | 3 | 0 | 18 | 0 | 4 | 6 | 89 | 0 | 3 |
| 16 | 3 | 14 | 3 | 2 | 15 | 8 | 0 | 18 | 7 | 4 | 5 | 88 | 1 | 8 |
| 17 | 3 | 14 | 3 | 2 | 15 | 1 | 0 | 19 | 2 | 4 | 5 | 87 | 2 | 6 |
| 18 | 3 | 14 | 3 | 2 | 14 | 6 | 0 | 19 | 9 | 4 | 4 | 86 | 2 | 9 |
| 19 | 3 | 14 | 3 | 2 | 13 | 10 | 1 | 0 | 5 | 4 | 4 | 86 | 2 | 4 |
| 20 | 3 | 14 | 3 | 2 | 13 | 3 | 1 | 1 | 0 | 4 | 3 | 84 | 1 | 4 |
| 21 | 3 | 14 | 3 | 2 | 12 | 7 | 1 | 1 | 8 | 4 | 2 | 82 | 19 | 8 |
| 22 | 3 | 14 | 8 | 2 | 11 | 11 | 1 | 2 | 4 | 4 | 2 | 81 | 17 | 4 |
| 23 | 3 | 14 | 3 | 2 | 11 | 2 | 1 | 3 | 1 | 4 | 1 | 80 | 14 | 3 |
| 24 | 3 | 14 | 3 | 2 | 10 | 6 | 1 | 3 | 9 | 4 | 0 | 79 | 10 | 6 |
| 25 | 3 | 14 | 3 | 2 | 9 | 9 | 1 | 4 | 6 | 4 | 0 | 78 | 6 | 0 |
| 26 | 3 | 14 | 3 | 2 | 9 | 0 | 1 | 5 | 3 | 3 | 11 | 77 | 0 | 9 |
| 27 | 3 | 14 | 3 | 2 | 8 | 2 | 1 | 6 | 1 | 3 | 10 | 75 | 14 | 8 |
| 28 | 3 | 14 | 3 | 2 | 7 | 4 | 1 | 6 | 11 | 3 | 9 | 74 | 7 | 9 |
| 29 | 3 | 14 | 3 | 2 | 6 | 6 | 1 | 7 | 9 | 3 | 9 | 73 | 0 | 0 |
| 30 | 3 | 14 | 3 | 2 | 5 | 8 | 1 | 8 | 7 | 3 | 8 | 71 | 11 | 5 |
| 31 | 3 | 14 | 3 | 2 | 4 | 9 | 1 | 9 | 6 | 3 | 7 | 70 | 1 | 11 |
| 32 | 3 | 14 | 3 | 2 | 3 | 10 | 1 | 10 | 5 | 3 | 6 | 68 | 11 | 6 |
| 33 | 3 | 14 | 3 | 2 | 2 | 11 | 1 | 11 | 4 | 3 | 5 | 67 | 0 | 2 |
| 34 | 3 | 14 | 3 | 2 | 1 | 11 | 1 | 12 | 4 | 3 | 4 | 65 | 7 | 10 |
| 35 | 3 | 14 | 3 | 2 | 0 | 11 | 1 | 13 | 4 | 3 | 3 | 63 | 14 | 6 |
| 36 | 3 | 14 | 3 | 1 | 19 | 10 | 1 | 14 | 5 | 3 | 2 | 62 | 0 | 1 |
| 37 | 3 | 14 | 3 | 1 | 18 | 9 | 1 | 15 | 6 | 3 | 1 | 60 | 4 | 7 |
| 38 | 3 | 14 | 3 | 1 | 17 | 8 | 1 | 16 | 7 | 3 | 0 | 58 | 8 | 0 |
| 39 | 3 | 14 | 3 | 1 | 16 | 6 | 1 | 17 | 9 | 2 | 11 | 56 | 10 | 3 |
| 40 | 3 | 14 | 3 | 1 | 15 | 4 | 1 | 18 | 11 | 2 | 10 | 54 | 11 | 4 |
| 41 | 3 | 14 | 3 | 1 | 14 | 2 | 2 | 0 | 1 | 2 | 9 | 52 | 11 | 3 |
| 42 | 3 | 14 | 3 | 1 | 12 | 11 | 2 | 1 | 4 | 2 | 8 | 50 | 9 | 11 |
| 43 | 3 | 14 | 3 | 1 | 11 | 7 | 2 | 2 | 8 | 2 | 6 | 48 | 7 | 3 |
| 44 | 3 | 14 | 3 | 1 | 10 | 3 | 2 | 4 | 0 | 2 | 5 | 46 | 3 | 3 |
| 45 | 3 | 14 | 3 | 1 | 8 | 11 | 2 | 5 | 4 | 2 | 4 | 43 | 17 | 11 |
| 46 | 3 | 14 | 3 | 1 | 7 | 6 | 2 | 6 | 9 | 2 | 2 | 41 | 11 | 2 |
| 47 | 3 | 14 | 3 | 1 | 6 | 0 | 2 | 8 | 3 | 2 | 1 | 39 | 2 | 11 |
| 48 | 3 | 14 | 3 | 1 | 4 | 6 | 2 | 9 | 9 | 2 | 0 | 36 | 13 | 2 |
| 49 | 3 | 14 | 3 | 1 | 2 | 11 | 2 | 11 | 4 | 1 | 10 | 34 | 1 | 10 |
| 50 | 3 | 14 | 3 | 1 | 1 | 4 | 2 | 12 | 11 | 1 | 8 | 31 | 8 | 11 |
| 51 | 3 | 14 | 3 | 0 | 19 | 8 | 2 | 14 | 7 | 1 | 7 | 28 | 14 | 4 |
| 52 | 3 | 14 | 3 | 0 | 18 | 0 | 2 | 16 | 3 | 1 | 5 | 25 | 18 | 1 |
| 53 | 3 | 14 | 3 | 0 | 16 | 3 | 2 | 18 | 0 | 1 | 4 | 23 | 0 | 1 |
| 54 | 3 | 14 | 3 | 0 | 14 | 5 | 2 | 19 | 10 | 1 | 2 | 20 | 0 | 3 |
| 55 | 3 | 14 | 3 | 0 | 12 | 7 | 3 | 1 | 8 | 1 | 0 | 16 | 18 | 7 |
| 56 | 3 | 14 | 3 | 0 | 10 | 8 | 3 | 3 | 7 | 0 | 10 | 13 | 15 | 0 |
| 57 | 3 | 14 | 3 | 0 | 8 | 8 | 3 | 5 | 7 | 0 | 8 | 10 | 9 | 5 |
| 58 | 3 | 14 | 3 | 0 | 6 | 7 | 3 | 7 | 8 | 0 | 6 | 7 | 1 | 9 |
| 59 | 3 | 14 | 3 | 0 | 4 | 6 | 3 | 9 | 9 | 0 | 4 | 3 | 12 | 0 |
| 60 | 3 | 14 | 3 | 0 | 2 | 3 | 3 | 12 | 0 | 0 | 2 | .. | .. | .. |
| Twenty-years Term. | ||||||||||||||
| 1 | 4 | 8 | 3 | 3 | 2 | 6 | 1 | 5 | 9 | 5 | 0 | 98 | 14 | 3 |
| 2 | 4 | 8 | 3 | 3 | 1 | 8 | 1 | 6 | 7 | 4 | 11 | 97 | 7 | 8 |
| 3 | 4 | 8 | 3 | 3 | 0 | 10 | 1 | 7 | 5 | 4 | 10 | 96 | 0 | 3 |
| 4 | 4 | 8 | 3 | 3 | 0 | 0 | 1 | 8 | 3 | 4 | 10 | 94 | 12 | 0 |
| 5 | 4 | 8 | 3 | 2 | 19 | 1 | 1 | 9 | 2 | 4 | 9 | 93 | 2 | 10 |
| 6 | 4 | 8 | 3 | 2 | 18 | 2 | 1 | 10 | 1 | 4 | 8 | 91 | 12 | 9 |
| 7 | 4 | 8 | 3 | 2 | 17 | 3 | 1 | 11 | 0 | 4 | 7 | 90 | 1 | 9 |
| 8 | 4 | 8 | 3 | 2 | 16 | 3 | 1 | 12 | 0 | 4 | 6 | 88 | 9 | 9 |
| 9 | 4 | 8 | 3 | 2 | 15 | 3 | 1 | 13 | 0 | 4 | 5 | 86 | 16 | 9 |
| 10 | 4 | 8 | 3 | 2 | 14 | 3 | 1 | 14 | 0 | 4 | 4 | 85 | 2 | 9 |
| 11 | 4 | 8 | 3 | 2 | 13 | 2 | 1 | 15 | 1 | 4 | 3 | 83 | 7 | 8 |
| 12 | 4 | 8 | 3 | 2 | 12 | 1 | 1 | 16 | 2 | 4 | 2 | 81 | 11 | 6 |
| 13 | 4 | 8 | 3 | 2 | 10 | 11 | 1 | 17 | 4 | 4 | 1 | 79 | 14 | 2 |
| 14 | 4 | 8 | 3 | 2 | 9 | 9 | 1 | 18 | 2 | 4 | 0 | 77 | 15 | 8 |
| 15 | 4 | 8 | 3 | 2 | 8 | 7 | 1 | 19 | 8 | 3 | 11 | 75 | 16 | 0 |
| 16 | 4 | 8 | 3 | 2 | 7 | 4 | 2 | 0 | 11 | 3 | 9 | 73 | 15 | 1 |
| 17 | 4 | 8 | 3 | 2 | 6 | 1 | 2 | 2 | 2 | 3 | 8 | 71 | 12 | 11 |
| 18 | 4 | 8 | 3 | 2 | 4 | 9 | 2 | 3 | 6 | 3 | 7 | 69 | 9 | 5 |
| 19 | 4 | 8 | 3 | 2 | 3 | 5 | 2 | 4 | 10 | 3 | 6 | 67 | 4 | 7 |
| 20 | 4 | 8 | 3 | 2 | 2 | 0 | 2 | 6 | 3 | 3 | 4 | 64 | 18 | 4 |
| 21 | 4 | 8 | 3 | 2 | 0 | 6 | 2 | 7 | 9 | 3 | 3 | 62 | 10 | 7 |
| 22 | 4 | 8 | 3 | 1 | 19 | 1 | 2 | 9 | 2 | 3 | 2 | 60 | 1 | 5 |
| 23 | 4 | 8 | 3 | 1 | 17 | 6 | 2 | 10 | 9 | 3 | 0 | 57 | 10 | 8 |
| 24 | 4 | 8 | 3 | 1 | 15 | 11 | 2 | 12 | 4 | 2 | 10 | 54 | 18 | 4 |
| 25 | 4 | 8 | 3 | 1 | 14 | 4 | 2 | 13 | 11 | 2 | 9 | 52 | 4 | 5 |
| 26 | 4 | 8 | 3 | 1 | 12 | 7 | 2 | 15 | 8 | 2 | 7 | 49 | 8 | 9 |
| 27 | 4 | 8 | 3 | 1 | 10 | 10 | 2 | 17 | 5 | 2 | 6 | 46 | 11 | 4 |
| 28 | 4 | 8 | 3 | 1 | 9 | 1 | 2 | 19 | 2 | 2 | 4 | 43 | 12 | 2 |
| 29 | 4 | 8 | 3 | 1 | 7 | 3 | 3 | 1 | 0 | 2 | 2 | 40 | 11 | 2 |
| 30 | 4 | 8 | 3 | 1 | 5 | 4 | 3 | 2 | 11 | 2 | 0 | 37 | 8 | 3 |
| 31 | 4 | 8 | 3 | 1 | 3 | 4 | 3 | 4 | 11 | 1 | 10 | 34 | 3 | 4 |
| 32 | 4 | 8 | 3 | 1 | 1 | 4 | 3 | 6 | 11 | 1 | 8 | 30 | 16 | 5 |
| 33 | 4 | 8 | 3 | 0 | 19 | 3 | 3 | 9 | 0 | 1 | 6 | 27 | 7 | 5 |
| 34 | 4 | 8 | 3 | 0 | 17 | 1 | 3 | 11 | 2 | 1 | 4 | 23 | 16 | 3 |
| 35 | 4 | 8 | 3 | 0 | 14 | 10 | 3 | 13 | 5 | 1 | 2 | 20 | 2 | 10 |
| 36 | 4 | 8 | 3 | 0 | 12 | 7 | 3 | 15 | 8 | 1 | 0 | 16 | 7 | 2 |
| 37 | 4 | 8 | 3 | 0 | 10 | 2 | 3 | 18 | 1 | 0 | 10 | 12 | 9 | 1 |
| 38 | 4 | 8 | 3 | 0 | 7 | 9 | 4 | 0 | 6 | 0 | 7 | 8 | 8 | 7 |
| 39 | 4 | 8 | 3 | 0 | 5 | 3 | 4 | 3 | 0 | 0 | 5 | 4 | 5 | 7 |
| 40 | 4 | 8 | 3 | 0 | 2 | 8 | 4 | 5 | 7 | 0 | 3 | .. | ||
The mortgagor may at any time repay the whole balance of principal owing with interest to date of payment, and obtain a discharge of the mortgage on payment of the fee prescribed for such discharge.
The mortgagor may also from time to time pay, in addition to the half-yearly payment, a sum of £5 or a multiple of £5, which, at the next instalment due date, may be applied in one of the following methods, according as he directs:—
In payment of the half-yearly instalments (consisting partly of interest and partly of principal) as they fall due, until the deposit is exhausted; or,
In payment of as many future half-yearly instalments of principal (but not of interest) as it will cover, and, as far as such instalments are concerned, the corresponding interest will not be charged. On the next half-yearly date, however, the mortgagor will be required to continue his payments as before, the advance payment having the effect of reducing the period during which he would have to pay such instalments. For instance, a mortgagor has a loan of £100 at 6 ½ per cent. for a term of 36 ½ years. On the due date of his eighth half-yearly instalment he pays, in addition to the amount due, a sum of £5, This is applied in payment of his ninth, tenth, eleventh, twelfth, thirteenth, fourteenth, fifteenth, sixteenth, and seventeenth instalments of principal—9s. 5d., 9s. 9d., 10s. 1d., 10s. 4d., 10s. 8d., 11s., 11s. 5d. 11s. 9d., 12s. 1d., making a total of £4 16s. 6d.; and the corresponding interest—£3 0s. 6d., £3 0s. 2d., £2 19s. 10d., £2 19s. 7d., £2 19s. 3d., £2 18s. 11d., £2 18s. 6d., £2 18s. 2d., £2 17s. 10d. (which has not begun to accrue)—is not charged. A balance of 3s. 6d. remains in his favour. Then on the next due date he has to make the half-yearly payment as usual (less 3s. 6d.), but instead of being the ninth it counts as the eighteenth instalment, and by this means the whole loan is repaid four and a half years earlier than it otherwise would be.
On the due date of any instalment, after at least one-tenth of the loan has been repaid by means of the half-yearly instalments or of moneys repaid in advance, or both, the mortgagor (provided he is not in arrear with any instalment or other payment due under the mortgage) may, with the consent of the Superintendent, readjust the loan by treating the balance of principal then unpaid, if not less than £100, as a fresh loan duly granted on that date for a fresh term.
Following is the scale of fees payable for preparation of mortgages:—
| Mortgages under the Land Transfer Act.Law-costs of perusing title, preparing, completing, and registering mortgage (to be deducted from the advance):— | |||
|---|---|---|---|
| £ | s. | d. | |
| If advance be not exceeding £250 | 0 | 7 | 6 |
| Exceeding £250 but not exceeding £500 | 0 | 10 | 0 |
| £500 ,, £750 | 0 | 15 | 0 |
| £750 ,, £1,000 | 1 | 1 | 0 |
| £1,000 ,, £1,500 | 1 | 6 | 0 |
| £1,500 ,, £2,000 | 1 | 11 | 6 |
| £2,000 ,, £3,500 | 1 | 17 | 6 |
| With cash disbursements, which are the same in every case, namely:— | |||
| Mortgage forms | 0 | 2 | 0 |
| Search fee (with an additional 2s. for every certificate of title after the first) | 0 | 2 | 0 |
| Registration (with an additional 2s. for every certificate of title after the first) | 0 | 10 | 0 |
| Mortgages under the Deeds Registration Act.Law-costs of perusing title, preparing, completing, and registering mortgage (to be deducted from the advance):— | |||
|---|---|---|---|
| £ | s. | d | |
| If advance be not exceeding £150 | 0 | 18 | 0 |
| Exceeding £150 but not exceeding £250 | 1 | 0 | 6 |
| ,, £250 ,, £500 | 1 | 5 | 0 |
| ,, £500 ,, £750 | 1 | 13 | 0 |
| ,, £750 ,, £1,000 | 2 | 3 | 0 |
| ,, £1,000 ,, £1,500 | 2 | 13 | 0 |
| ,, £1,500 ,, £2,000 | 3 | 13 | 0 |
| ,, £2,000 ,, £3,500 | 4 | 13 | 0 |
| With cash disbursements:— | |||
| Mortgage form | 0 | 1 | 0 |
| Fee chargeable by solicitor not residing in registration centre for employing agent to register mortgage | 0 | 5 | 0 |
| Fee for partial or total discharge of mortgage | 0 | 5 | 0 |
| Fee for execution of consent by the Superintendent to any document | 0 | 5 | 0 |
| Fee for production of title-deeds held by the Superintendent | 0 | 5 | 0 |
Advances may also be made on the security of stock and farm implements. Every advance must be secured by a mortgage of land or chattels either with or without any collateral security to be approved by the Board of the Office. Not more than £500 may be advanced to any one borrower, the term of the loan not to exceed five years. The principal moneys comprised in any advance are repayable by instalments as follow:—
| (a.) 10 per cent. at the end of the first year. |
| (b.) 15 ,, ,, second year. |
| (c.) 20 ,, ,, third year. |
| (d.) 25 ,, ,, fourth year. |
| (e.) 30 ,, ,, fifth year. |
Interest on the amount of the loan for the time being outstanding is payable at the rate of 7 per cent. per annum, reducible to 6 ½ per cent. par annum provided that the half-yearly instalments of principal and interest are paid within fourteen days of due date.
Every application must be accompanied by a valuation fee according to the following scale:—
| £ | s. | d. | |
|---|---|---|---|
| On application for loan not exceeding £250 | 2 | 2 | 0 |
| On application for loan exceeding £250 but not exceeding £500 | 2 | 12 | 6 |
The fees for searching Chattels Register-book, and of preparing, completing, and registering instrument by way of security (exclusive of cash disbursements), are—
| £ | s. | d. | |
|---|---|---|---|
| For advance not exceeding £250 | 1 | 1 | 0 |
| For advance exceeding £250 | 1 | 17 | 6 |
From the inception of the scheme of advances to settlers in 1894, the Advances Board has authorized loans aggregating £37,314,037 to 71,164 applicants, the total actual payments to 31st March, 1926, being £32,903,095, of which £16,186,144 has been repaid in respect of principal, leaving £16,716,951 still outstanding to 26,023 settlers. A table is given showing the business to date and for each of the last ten years.
| ADVANCES TO SETTLERS, 1916–17 TO 1925–26, | ||||
|---|---|---|---|---|
| Year ended 31st March, | Loans authorized. | Amount advanced. | Amount repaid. | |
| Number. | Amount. | |||
| £ | £ | £ | ||
| 1917 | 1,412 | 515,270 | 589,975 | 643,751 |
| 1918 | 984 | 353,465 | 367,160 | 501,009 |
| 1919 | 986 | 363,875 | 350,140 | 529,023 |
| 1920 | 2,219 | 1,031,855 | 808,180 | 1,118,486 |
| 1921 | 2,085 | 1,107,430 | 1,060,260 | 1,065,003 |
| 1922 | 1,524 | 773,375 | 805,975 | 552,269 |
| 1923 | 2,140 | 1,209,035 | 945,900 | 611,480 |
| 1924 | 6,204 | 5,416,987 | 3,904,150 | 1,009,499 |
| 1925 | 3,321 | 4,289,875 | 3,516,130 | 846,771 |
| 1926 | 4,747 | 5,409,310 | 3,905,900 | 1,010,355 |
| Totals to 31st March, 1926 | 71,164 | 37,314,037 | 32,903,095 | 16,186,144 |
The effect of the State Advances Amendment Act of 1923, providing for additional borrowing of money for the purposes of advances, and widening the scheme in the direction of enabling larger amounts to be advanced in individual cases, is apparent in the figures for the last three years. The loans authorized and the amount actually advanced show substantially higher totals in each of these three years than in any year prior to 1923–24. It is also noticeable that the annual amount repaid each year has now reached a considerable figure. This money is, of course, available for further advances.
Not all the advances to settlers are made by the Advances to Settlers Branch of the State Advances Office. Part of the business shown in the foregoing table relates to the Public Debt Sinking Funds Branch and the Advances Office Sinking Fund Branch. The advances to settlers authorized by the three branches during 1925–26 are as follow:—
| Branch. | Advances authorized. | |
|---|---|---|
| Number. | Amount. | |
| £ | ||
| Advances to Settlers | 4,623 | 5,306,090 |
| Public Debt Sinking Funds | 103 | 99,030 |
| Advances Office Sinking Fund | 21 | 4,190 |
| Totals | 4,747 | £5,409,310 |
The advances authorized in each provincial district during the financial year, and the total to 31st March, 1926, are next shown:—
| Provincial District. | Advances authorized, 1925–26. | Total Advances authorized to 31st March, 1926. | ||
|---|---|---|---|---|
| Number. | Amount. | Number. | Amount. | |
| £ | £ | |||
| Auckland | 2,231 | 2,561,695 | 26,217 | 14,256,570 |
| Hawke's Bay | 198 | 213,325 | 3,643 | 1,811,650 |
| Taranaki | 352 | 470,105 | 6,679 | 3,937,009 |
| Wellington | 769 | 823,560 | 15,913 | 7,961,163 |
| Marlborough | 56 | 60,755 | 1,626 | 846,270 |
| Nelson | 104 | 92,895 | 1,260 | 573,595 |
| Westland | 46 | 26,165 | 1,175 | 377,085 |
| Canterbury | 485 | 515,980 | 7,096 | 3,461,545 |
| Otago— | ||||
| Otago portion | 200 | 213,800 | 3,291 | 1,627,855 |
| Southland portion | 306 | 431,030 | 4,264 | 2,461,295 |
| Totals | 4,747 | 5,409,310 | 71,164 | 37,314,037 |
Of the £5,409,310 authorized to be advanced to settlers during the year ended the 31st March, 1926, £444,030, or 8.21 per cent., was for the actual erection of dwellings. The number of loans for the erection of dwellings was 501, the average advance authorized for this purpose being £886.
Dealing now only with the operations of the Advances to Settlers Branch, it is seen that during the year 1925-26 the advances authorized numbered 4,623, representing a total amount of £5,306,090. The number of borrowers and the sums actually advanced during the year, classified according to amount, were—
| Category. | Number of Advances. | Amount advanced. |
|---|---|---|
| £ | ||
| Not exceeding £500 | 632 | 232,750 |
| Exceeding £500 but not exceeding £1,000 | 1,160 | 841,280 |
| ,, £1,000 ,, £2,000 | 768 | 1,190,680 |
| ,, £2,000 ,, £3,500 | 466 | 1,307,605 |
| Totals | 3,026 | £3,572,315 |
The nature of the security upon which these advances were made was as follows:—
| Security. | Number of Advances. | Amount advanced. |
|---|---|---|
| £ | ||
| Freehold | 2,599 | 3,090,975 |
| Leasehold | 396 | 432,460 |
| Freehold and leasehold combined | 31 | 48,880 |
| Totals | 3,026 | £3,572,315 |
The average freehold advance made during the year was £1,190, the average leasehold advance £1,092, and the average of advances secured on both freehold and leasehold combined £1,577. Corresponding figures for the year ended the 31st March. 1923 (prior to the passing of the State Advances Amendment Act, 1923), were—Freehold, £510; leasehold, £534; and combined freehold and leasehold, £680.
The number and amount of advances from the Advances to Settlers Branch which were outstanding at the 31st March, 1926, were, classified according to amount. as follows:—
| Category. | Number of Advances. | Amount. outstanding. |
|---|---|---|
| £ | ||
| Not exceeding £500 | 14,075 | 3,189,142 |
| Exceeding £500 but not exceeding £1,000 | 5,385 | 4,272,067 |
| ,, £1,000 ,, £2,000 | 3,001 | 4,007,782 |
| ,, £2,000 ,, £3,500 | 1,032 | 3,239,835 |
| Totals | 23,493 | £14,708,826 |
The nature of the security for the total amount of advances outstanding on the 31st March, 1926, was—
| Security. | Number of Advances. | Amount outstanding. |
|---|---|---|
| £ | ||
| Freehold | 15,416 | 11,317,113 |
| Leasehold | 7,831 | 3,185,979 |
| Freehold and leasehold combined | 246 | 205,734 |
| Totals | 23,493 | £14,708,826 |
The number and amounts of current advances on rural and on urban and suburban land are—
| Number. | Amount. | |
|---|---|---|
| £ | ||
| On rural land | 13,923 | 9,360,162 |
| On urban and suburban land | 9,570 | 5,348,664 |
| Totals | 23,493 | £14,708,826 |
The gross profits of the Settlers Branch of the State Advances Office for the year ended the 31st March, 1926, were £78,536, and the cost of management and expenses of the branch £28,527, being 0.147 per cent., or 2s. 11d. per £100 of the capital employed. Loss on the realization of securities, and the writing-down of doubtful securities and of office equipment, accounted for £12,709. The net profits amounted to £37,300, of which £11,081 was utilized towards the writing-down of loan-flotation charges. The balance of £26,219, together with £224 income-tax provided for the previous year but not now required, was invested in the Advances Office Sinking Fund Account.
The sinking fund established under the State Advances Act, 1913, after redemption of loans totalling £126,700, amounts to £1,594,103.
The liabilities and assets of the Settlers Branch at the 31st March, 1926, were—
| £ | |
|---|---|
| Liabilities. | |
| Sundry loans | 18,009,930 |
| Temporary advances from Public Debt sinking Funds Branch | 205,000 |
| Temporary advances from Advances Office Sinking Fund Account | 375,000 |
| Temporary advances from Miscellaneous Business Branch | 93,775 |
| Held for investment on behalf of Housing Insurance Fund | 3,984 |
| Advances Suspense Account | 54,914 |
| Fire Loss Suspense Account | 8,736 |
| Suspense Account | 2,375 |
| Income-tax Suspense Account | 4,906 |
| Sundry creditors | 2,158 |
| Interest payable on loans accrued but not due | 163,984 |
| Reserve for bad debts | 22,290 |
| Sinking Fund | 1,235,439 |
| Reserve Fund | 25,000 |
| £20,207,491 | |
| Assets. | |
| Investment Account—Principal owing by mortgagors | 14,708,826 |
| Interest overdue | 83,916 |
| Interest on mortgages accrued but not due | 169,163 |
| Temporary advances to Local Authorities Branch | 441,500 |
| Temporary advances to Workers Branch | 680,000 |
| Temporary investments | 2,158,060 |
| Interest on temporary investments, accrued | 32,811 |
| Office Furniture and Equipment Account | 6,156 |
| Sundry debtors | 22,894 |
| Loan Charges Account | 196,860 |
| Sinking Fund held by Advances Office Sinking Fund Account | 1,594,104 |
| Cash in hand and in bank at 31st March, 1926 | 113,201 |
| £20,207,491 | |
A Commission was set up in 1925 to inquire into the question of the necessity or expediency of passing legislation for the purpose of affording further financial assistance to farmers than is now provided. In the course of its investigations the Commission visited various American and European countries, and on its return to the Dominion presented a comprehensive report giving particulars of its inquiries and making recommendations for the provision by the State of intermediate rural credits as well as the extension of the present system of long-term advances. The recommendations are too lengthy to repeat here, but the full text of these and of the report will be found in Parliamentary Paper B.-5 of the 1926 session.
As an outcome of the Commission's inquiries and recommendations, the Rural Advances Act was passed in the session of 1926. This Act establishes, as from the 1st April, 1927, a separate branch of the State Advances Office, to be known as the Rural Advances Branch, and to be controlled by the State Advances Board, to which for the purposes of the Act may be added an additional member representative of the interests of persons engaged in primary production.
The business of the Rural Advances Branch is to make advances, under the special provisions of the Act, on the security of first mortgages of the various classes of land specified on page 635, exclusive of urban and suburban lands. Advances may be made not exceeding £5,500, inclusive of any amounts granted under the Advances to Settlers or Advances to Workers schemes. Advances must not exceed two-thirds of the value of the security in the case of freehold land or two-thirds of the value of the lessee's interest in the case of leasehold land.
The Act is only a short one, and beyond the limitations referred to in the preceding paragraph, does not define the details of the scheme—as, for instance, in regard to such matters as the purpose or term of the advances, or as to whether advances will be made to individuals only or also to co-operative or other rural associations; these and other matters being left to be dealt with by regulation.
To provide funds wherewith to make rural advances, the Superintendent of the State Advances Office may issue bonds or stock or other securities, which will constitute a floating charge on all the assets of the Rural Advances Branch, including all mortgages for the time being securing loans granted under the Act. Such bonds, &c., will not be secured on the public revenues, and will not form part of the public debt.
The system of advances to workers, instituted in 1906, is on much the same general lines as that of the advances to settlers. Advances are made on first mortgage of lands and improvements held under the various classes of tenure enumerated at the beginning of this subsection. The scales of charges and of payments of principal and interest, and the provisions for paying off the whole or part of the principal outstanding, apply to the workers' scheme as well as to the settlers'.
A worker is defined as a person of either sex engaged (whether as an employee or on his or her own account) in manual or clerical work who is not in receipt of an annual income exceeding £300, increased by £25 in respect of each child or other person dependent on him, and is not the owner of any land other than that offered as security.
Originally the scheme of advances to workers was confined to persons in receipt of not more than £200 per annum, and the maximum amount that could be advanced to any applicant was £450. Legislation passed in 1923, however, greatly enlarged the scope of the scheme.
Not more than £1,250 may now be granted to any one borrower; and an advance must not exceed 95 per cent. of the total value of the security in the case of freehold land, or 95 per cent. of the value of the lessee's interest in the case of leasehold laud, or where the loan is to provide for the erection of a dwellinghouse, 95 per cent. of the cost of the dwellinghouse inclusive of the cost of the land and improvements. No advance can be made to any applicants who do not take up their permanent residence on the property. Married applicants must make the declaration on the application form jointly with wife or husband, as the case may require.
Where an advance is required for the purpose of erecting a dwelling, the application form must be accompanied by evidence in the form of sale-note, receipt, agreement, or otherwise as to the purchase price of the section and tender accepted or contract entered into for the erection of the dwelling. The amount of the loan granted by the Board may be advanced in progress-payments as the erection of the building proceeds. An inspection and report must be made by an officer of the Valuation Department prior to any progress-payment being made on account of the loan, and for each such inspection a fee of 10s. 6d. is payable by the applicant. The Department requires that not less than three inspections be made, and that the fencing be completed before all the loan is paid over.
If the applicant's title is free from encumbrance, mortgages under the Land Transfer Act are prepared and completed free of charge to the mortgagor, with the exception of the repayment of cash disbursements, which are deducted from the advance. In all other respects the scale of costs and fees is the same as under the advance-to-settlers scheme.
Advances to workers authorized during 1925–26 numbered 3,299, representing a total amount of £2,759,400. This amount is £1,397,030 in excess of the figure for the preceding year, and is easily the highest amount ever authorized in any one year The total number of loans and the aggregate amount authorized in each provincial district are as follow:—
| Provincial District. | Advances authorized, 1925–26. | Total Advances authorized to 31st March, 1926. | ||
|---|---|---|---|---|
| Number. | Amount. | Number. | Amount. | |
| Auckland | 1,443 | 1,226,780 | 9,005 | 4,549,325 |
| Hawke's Bay | 93 | 67,645 | 1,683 | 695,930 |
| Taranaki | 76 | 56,935 | 754 | 316,675 |
| Wellington | 932 | 840,865 | 6,903 | 3,445,405 |
| Marlborough | 36 | 23,885 | 583 | 208,020 |
| Nelson | 45 | 33,080 | 367 | 147,505 |
| Westland | 18 | 8,325 | 248 | 69,365 |
| Canterbury | 403 | 323,355 | 5,475 | 2,363,995 |
| Otago— | ||||
| Otago portion | 134 | 95,445 | 1,545 | 601,340 |
| Southland portion | 119 | 83,085 | 877 | 375,260 |
| Totals | 3,299 | 2,759,400 | 27,440 | 12,772,820 |
Of the £2,759,400 authorized for advances to workers during 1925–26, £2,460,214, or 89.16 per cent., was for the actual erection of dwellings. The total number of loans for this purpose was 2,738, and the average advance £899.
The total of the actual money advanced to workers up to the 31st March, 1926 (including moneys repaid and again advanced), was £10,976,370. The actual number of advances and the aggregate amount outstanding at the same date were 15,912 and £7,483,857 respectively.
The following table gives particulars of the transactions for each of the last ten years, and the total transactions since the passing of the Government Advances to Workers Act on the 29th October, 1906:—
| ADVANCES TO WORKERS, 1916–17 TO 1925–26. | ||||
|---|---|---|---|---|
| Year ended 31st March, | Loans authorized. | Amount advanced. | Amount repaid. | |
| Number. | Amount. | |||
| £ | £ | £ | ||
| 1917 | 658 | 210,995 | 214,965 | 127,450 |
| 1918 | 411 | 129,710 | 125,855 | 139,485 |
| 1919 | 372 | 119,555 | 87,590 | 147,791 |
| 1920 | 1,083 | 420,465 | 225,055 | 368,597 |
| 1921 | 1,556 | 718,630 | 660,790 | 388,469 |
| 1922 | 987 | 449,220 | 407,580 | 207,843 |
| 1923 | 1,748 | 871,805 | 724,830 | 234,092 |
| 1924 | 3,243 | 2,198,310 | 1,803,630 | 458,264 |
| 1925 | 1,873 | 1,362,370 | 1,351,785 | 334,830 |
| 1926 | 3,299 | 2,759,400 | 2,241,860 | 516,156 |
| Totals from inception to 3 1/3/1926 | 27,440 | 12,772,820 | 10,976,370 | 3,492,513 |
There has been a considerable increase in the total amount advanced during the last three years. The amounts paid over during these three years have aggregated no less a sum than £5,397,275, or nearly one-half of the total amount advanced since the inception of the scheme to the 31st March, 1926. This increase is consequent on the passing of the State Advances Amendment Act in 1923, when provision was made for the addition of more capital and for the enlargement of the scheme to enable larger advances to be made to applicants. The average advance made during the three years was £786, whereas prior to the passing of the 1923 Act the figure never exceeded £450.
Of the advances outstanding at 31st March, 1926, 15,651 to the amount of £7,344,397 had been advanced from the Advances to Workers Account, 118 (£65,395) from the Public Debt Sinking Fund, and 143 (£74,065) from the Advances Office Sinking Fund. Dealing only with the operations of the Advances to Workers Branch the advances actually paid during the year numbered 2,580 for an aggregate of £2,133,820. The tenures upon which these loans were made were—
| Tenure. | Number of Loans. | Aggregate Amount. |
|---|---|---|
| £ | ||
| Freehold | 2,540 | 2,105,360 |
| Leasehold | 2,580 | 28,460 |
| Totals | £2,133,820 | |
The net amount outstanding at the end of the financial year was £7,344,397, secured upon the following tenures:—
| Tenure. | Number of Loans outstanding. | Aggregate Amount outstanding. |
|---|---|---|
| £ | ||
| Freehold | 14,620 | 6,839,774 |
| Leasehold | 1,031 | 504,623 |
| Totals | 15,651 | £7,344,397 |
For the year ended 31st March, 1926, there was a loss of £5,576. The cost of management and expenses of the branch were £5,318, being 0.075 per cent., or 1s. 6d. per £100 of capital employed. The Sinking Fund, after redemption of loans totalling £187,000, amounts to £80,983.
The financial position of the Advances to Workers Branch of the State Advances Office as on the 31st March, 1926, is shown in the following statement:—
| ADVANCES TO WORKERS BRANCH: LIABILITIES AND ASSETS, 31ST MARCH, 1926. | |
|---|---|
| £ | |
| Liabilities. | |
| Sundry loans | 6,975,707 |
| Temporary loans from Settlers Branch | 680,000 |
| Interest on loans accrued but not due | 59,450 |
| Advances Suspense Account | 135,832 |
| Fire Loss Suspense Account | 6 |
| Suspense Account | 231 |
| Sundry creditors | 632 |
| Reserve for bad debts | 87 |
| Sinking Fund | 59,892 |
| £7,961,837 | |
| Assets. | |
| Investment Account—Principal owing by mortgagors | 7,344,397 |
| Temporary investments | 134,629 |
| Interest on temporary investments accrued | 1,925 |
| Interest on mortgages overdue | 25,457 |
| Interest on mortgages accrued | 78,113 |
| Sundry debtors | 333 |
| Loan Charges Account | 254,040 |
| Profit and Loss Account | 25,969 |
| Sinking Funds held by Advances Office Sinking Fund Account | 80,983 |
| Cash in hand and in hank at 31st March, 1926 | 15,986 |
| £7,961,337 | |
The administration of the Workers' Dwellings Act, 1910, and the Housing Act, 1919, was transferred to the State Advances Department in 1923, as part of a scheme to consolidate the various systems of State advances. The purchaser of a dwelling-house pursuant to an agreement under either of the Acts mentioned may, on application in that behalf made by him on the prescribed form, agree with the Superintendent to surrender his rights under the agreement and to accept a loan under Part III of the State Advances Act, 1913. On any such surrender the Superintendent shall cancel the agreement.
In any such case the land and dwellinghouse to which the agreement relates shall cease to be subject to any restrictions under the Workers' Dwellings Act, 1910, or section 21 or section 22 of the Housing Act, 1919, and the land shall not thereafter be deemed to be set apart for the purposes of the Workers' Dwellings Act, 1910, or of Part I of the Housing Act, 1919 (as the case may be).
On the cancellation of any such agreement as aforesaid the land to which the agreement relates shall be transferred or granted in fee-simple to the purchaser, subject to a mortgage to secure a loan under Part III of the State Advances Act, 1913, of such amount, not exceeding 95 per cent. of the purchase-money mentioned in the agreement, as the Board may approve.
Since the system of State advances to local authorities was initiated in 1910, loans authorized, 2,437 in number, have aggregated £6,694,714, of which £6,323,995 has been actually advanced. Repayments to the 31st March, 1926, have totalled £860,441, leaving an indebtedness of £5,463,554 in respect of principal moneys. Figures for each of the last ten years and to date are as follow:—
| ADVANCES TO LOCAL AUTHORITIES, 1916–17 TO 1925–26. | ||||
|---|---|---|---|---|
| Year ended 31st March, | Loans authorized. | Amount advanced. | Amount repaid. | |
| Number. | Amount. | |||
| £ | £ | £ | ||
| 1917 | 103 | 127,135 | 152,310 | 38,874 |
| 1918 | 109 | 158,055 | 128,150 | 41,681 |
| 1919 | 119 | 214,300 | 130,575 | 46,615 |
| 1920 | 229 | 717,160 | 311,880 | 49,034 |
| 1921 | 194 | 689,225 | 444,825 | 53,926 |
| 1922 | 246 | 725,730 | 780,410 | 138,591 |
| 1923 | 213 | 478,035 | 711,375 | 78,694 |
| 1924 | 194 | 444,805 | 438,205 | 90,075 |
| 1925 | 127 | 227,330 | 338,805 | 93,432 |
| 1926 | 112 | 157,520 | 198,630 | 103,660 |
| Totals from inception to 3 1/3/26 | 2,437 | 6,694,714 | 6,323,995 | 860,441 |
As is the case with advances to settlers, a very small part of the loans authorized is for the erection of dwellings. During the year 1924–25 only 11 loans, of a value of £32,945, were authorized for this purpose. The average loan works out at £2,995, which is considerably higher than the average for the other two classes, but this is explained by the fact that each loan to a local authority may be for the erection of two or more dwellings, whereas in the case of advances to settlers and workers it is only in exceptional cases that the loan is for the erection of more than one dwelling.
As in the case of advances to settlers and workers, advances to local authorities are made from three distinct sources—viz., the funds of the Advances to Local Authorities Branch of the State Advances Office, the Public Debt Sinking Funds, and the Advances Office Sinking Fund. Of the £198,630 advanced in 1925–26 as shown above, £147,450 came from the Local Authorities Branch, the Advances Office Sinking Fund contributing £13,475, and the Public Debt Sinking Funds £37,705. Of the amount outstanding at the 31st March, 1926, the Public Debt Sinking Funds claimed £2,173,860, and the Advances Office Sinking Fund £424,775.
A statement of the liabilities and assets of the Local Authorities Branch as at the 31st March, 1926, is appended.
| £ | |
|---|---|
| Liabilities. | |
| Sundry loans | 2,785,529 |
| Loan-moneys—Unexpended balances | 3,988 |
| Temporary advances from Settlers Branch | 441,500 |
| Suspense Account | 1,432 |
| Interest on loan-moneys accounted but not due | 36,554 |
| Sinking Fund | 114,052 |
| £3,383,055 | |
| Assets. | |
| Investment Account—principal owing by local bodies | 2,864,919 |
| Interest on debentures—Overdue | 8,330 |
| Accrued but not due | 24,918 |
| Loan Charges Account | 28,869 |
| Sinking funds held by Advances Office Sinking Fund Account | 342,262 |
| Profit and Loss Account | 110,590 |
| Cash in hand and in bank at 31st March, 1926 | 3,167 |
| £3,383,055 | |
A net loss of £7,954 was recorded by the Local Authorities Branch for the year ended 31st March, 1926.
In terms of the Repatriation Act, 1918, provision was made for the granting of financial assistance by the State to discharged soldiers and nurses, and to the widows and widowed mothers of discharged soldiers, for the purpose of purchasing or establishing businesses and obtaining furniture, tools, and equipment. A special report covering transactions up to the 31st December, 1922, showed that a total of 6,366 business loans had been lent on security to an aggregate amount of £1,160,536. The number of cases and the amount granted for the purchase of furniture, tools, equipment. &c., totalled 15,915 and £758,626 respectively. No loans have been authorized subsequent to that date, the sole operations of the branch being now confined to the collection of repayments. During the year 1925–26 the sum of £76,041 in respect of principal moneys was repaid. In regard to business loans, 1,737 borrowers are now indebted to the extent of £247,306, while furniture loans still unpaid at the end of the year amounted to £171,032 in respect of 7,418 borrowers. The total amount, therefore, still outstanding at the 31st March, 1926, in relation to principal moneys was £418,338.
Repatriation advances should not be confused with the system of advances to discharged soldiers to enable them to acquire farms and homes. Discharged soldiers' settlement advances are dealt with in Section XVI of this book.
In the 1923 and preceding numbers of the Year-book appeared an account of the system initiated to cope with the serious shortage of houses due to war conditions. The Housing Act, 1919, provided for the erection of dwellings not only by the State, but also by local authorities, employers, associations of public servants, and public-utility societies, the State advancing the money. A synopsis of the Act, as amended in 1920, will be found in the 1923 Year-book.
The administration of the Housing Act was originally placed in the hands of a Housing Board and Housing Superintendent, but was transferred to the State Advances Department by the State Advances Amendment Act, 1922, the Housing Account being incorporated in the State Advances Account. The position of the Housing Account as at 31st March, 1926, is shown by the following balance-sheet:—
| HOUSING ACCOUNT.—LIABILITIES AND ASSETS. | |
|---|---|
| £ | |
| Liabilities. | |
| Debentures | 395,650 |
| Expended from Public Works Fund | 319,918 |
| Total loans | 715,568 |
| Suspense Account | 3,639 |
| Sundry creditors | 1,035 |
| Interest on loans accrued but not due | 4,031 |
| Insurance Fund | 3,984 |
| Sinking Fund | 395 |
| Reserve for losses on realization and bad debts | 9,602 |
| Assets. | |
| Principal owing on dwellings purchased | 530,782 |
| Principal owing on sections purchased | 5,601 |
| Principal owing on advances | 445 |
| Principal owing on mortgages | 498 |
| Temporary advances to Settlers Branch | 51,650 |
| Completed dwellings | 9,651 |
| Dwellings let | 27,576 |
| Uncompleted contracts | 1,697 |
| Freehold land | 51,443 |
| Properties acquired | 2,673 |
| Public Debt Sinking Fund | 3,586 |
| Public Debt Redemption Fund | 164 |
| Insurance Fund investment | 3,984 |
| Sundry debtors | 171 |
| Interest on dwellings and land overdue | 6,429 |
| Interest on dwellings and land accrued | 107 |
| Rent overdue | 1,817 |
| Insurance premiums overdue | 504 |
| Insurance premiums paid in advance | 608 |
| Profit and Loss Account | 37,872 |
| Cash in hand and in bank at 31st March, 1926 | 996 |
| £738,254 | |
The activities of this branch have now been almost entirely transferred to the Workers Branch. During the year ended 31st March, 1926, only three houses were built, while twenty-two were disposed of. The ordinary expenditure for the year, apart from interest payments and expenses of management, was £1,542, including £843 spent on the maintenance of dwellings. In addition, erection of dwellings cost £2,732, preparing land for dwellings, £994. and acquiring land £369.
Up to the 31st March, 1926, loans to the value of £3,975 had been borrowed for advances to employers for workers' dwellings. The amount of principal still owing by borrowers was £3,226, while £465 had been temporarily transferred to the Settlers Branch.
The Fruit-preserving Industry Act of 1913 and its amendments authorize the raising of a sum not exceeding £40,000 in any one year for the purpose of granting advances for the promotion of the fruit industry. A sum not exceeding £9,000 in any case may be advanced for establishing or extending fruit-packing sheds, cold stores for fruit, fruit-canning works, and other works in connection with the packing, grading, or preservation of fruit. The total amount borrowed by the State for this purpose was £69,610, of which £4,500 has been paid off. The total amount owing to the State in respect of advances made under the Act was at the end of the financial year 1925–26 £47,533. The balance-sheet of the Fruit-preserving Industry Advances Account is given below:—
| FRUIT-PRESERVING INDUSTRY ADVANCES ACCOUNT. | |
|---|---|
| £ | |
| Liabilities. | |
| Sundry loans | 65,110 |
| Suspense Account | 421 |
| Interest on loans accrued but not due | 1,295 |
| Rent accrued but not due | 28 |
| Sinking Fund | 76 |
| Reserves for losses on realization and bad debts | 5,030 |
| £71,960 | |
| Assets. | |
| Principal owing by mortgagors | 47,583 |
| Properties acquired | 5,213 |
| Temporary advances to Settlers Branch | 9,850 |
| Public Debt Sinking Fund | 658 |
| Public Debt Redemption Fund | 30 |
| Interest on mortgages overdue | 1,591 |
| Interest on mortgages accrued | 343 |
| Sundry debtors | 35 |
| Profit and Loss Account | 5,803 |
| Cash in hand and in bank at 31st March, 1926 | 904 |
| £71,960 | |
A loss of £675 was recorded for the year 1925–26, the excess of interest payments (£2,642) over interest receipts (£2,295) being £347 and the expenses of management (£100), expenses on the realization of assets (£43), and losses on realization of securities (£185).
In order to afford some relief in the way of providing financial assistance to the listing industry, the Fishing Industry Promotion Act was passed in 1919. A sum of £25,000 may be annually set aside for this purpose. Advances, not to exceed £5,000 in any ease, may be made to any person or persons for establishing cool-storage plants, preserving fish by canning or otherwise, purchasing and equipping fishing-boats, and otherwise in assisting generally the fishing industry. Advances are adequately secured by a first mortgage of the freehold or leasehold interest in the site of the proposed plant in the case of cool-storage sheds and fish-canning works, and in the case of fishing-boats and their equipment a first mortgage of or instrument over such boats and gear. In addition (but not in substitution) there are various other classes of security that may be accepted. Very few applications for loans under this heading have been received, the amount outstanding on account of principal owing on bills of sale being £1,844 at 31st March, 1926, to which date the amount borrowed by the Government and not paid off was only £5,215. The balance-sheet for the year ended 31st March, 1926, is as follows:—
| FISHING INDUSTRY PROMOTION ACCOUNT. | |
|---|---|
| £ | |
| Liabilities. | |
| Sundry loans | 5,215 |
| Sundry creditors | 2 |
| Reserve for losses on realization and bad debts | 677 |
| Interest on loans accrued but not due | 77 |
| Sinking Fund | 5 |
| £5,976 | |
| Assets. | |
| Principal owing on bills of sale | 1,814 |
| Temporary advances to Settlers Branch | 2,330 |
| Public Debt Sinking Fund | 44 |
| Public Debt Redemption Fund | 2 |
| Interest on bills of sale overdue | 25 |
| Interest on bills of sale accrued | 25 |
| Sundry debtors | 541 |
| Profit and Loss Account | 1,063 |
| Cash in hand and in bank at 31st March, 1926 | 99 |
| £5,976 | |
Interest moneys received during the year 1925–26 amounted to £182, while interest on loans involved an expenditure of £234, and management expenses £18, loss on the realization of securities (£677) bringing the total loss for the year to £747.
Under the Appropriation Act, 1917, section 22, authority was given for the raising of certain sums of money (not exceeding a total of £120,000) from time to time, to be utilized in the form of advances for cold-storage purposes. Section 30 of the Finance Act, 1918 (No. 2), repealed the former measure and increased the amount that could be borrowed for the purpose of providing additional cold storage in New Zealand to an aggregate sum of £270,000. The total amount raised under the authority of the above Act was £120,750, of which £45,500 has been redeemed, leaving a balance at the end of 1925–26 of £75,250. Of this sum the amount actually owing by mortgagors in respect of principal advanced was £42,547, while temporary advances to the Settlers Branch accounted for £29,480. The balance-sheet showing the position as at the 31st March, 1926, is given below:—
| COLD-STORAGE ADVANCES ACCOUNT. | |
|---|---|
| £ | |
| Liabilities. | |
| Sundry loans | 75,250 |
| Interest on loans accrued but not due | 217 |
| Sundry creditors | 376 |
| Sinking Fund | 498 |
| £76,371 | |
| Assets. | |
| Principal owing by mortgagors | 42,547 |
| Temporary Advances to Settlers Branch | 29,480 |
| Public Debt Sinking Fund | 1,002 |
| Public Debt Redemption Fund | 422 |
| Interest on mortgages | 1,832 |
| Profit and Loss Account | 1,020 |
| Cash in hand and in bank at 31st March, 1926 | 68 |
| £76,371 | |
This account showed a net profit of £569 for the year ended 31st March, 1926, interest receipts amounting to £3,765, interest payments on loan-money to £3,081, and management expenses to £115.
Table of Contents
THE history of old-age pensions in New Zealand dates back to 1898, in which year was passed the original Old-age Pensions Act, which provided for a pension of £18 per annum to persons of sixty-five and over who had twenty-five years' continuous residence in the country and complied with the requirements in other respects. The law relating to old-age pensions is now contained in the Pensions Act, 1926, which is a consolidation of previous enactments on the subject.
The qualifications for the old-age pension are briefly as follows:—
The applicant, if a male, must have reached the age of sixty-five, or, if a female, must have reached the age of sixty, except in cases where the applicant is the parent of two or more children under fifteen years of age who are dependent on him (or her). The pension age in such cases is sixty, for men and fifty-five for women, and the pension payable may be any sum up to £13 per annum, in addition to the ordinary pension payable as set out hereunder.
The applicant must be resident in New Zealand, and must have resided continuously in the Dominion for the past twenty-five years. Continuous residence is not interrupted by absences not exceeding two years in the aggregate. An additional six months' period of absence is allowed for every additional year's residence in excess of the twenty-five years immediately preceding the date of application, provided that the applicant has resided in New Zealand during the twelve months immediately preceding the date of establishment of his claim to a pension. In the case of a seaman continuous residence is not interrupted by absences on board a ship trading to and from New Zealand, and either registered or owned in the Dominion, provided the applicant establishes the fact that during such absences his family or home was in New Zealand.
The applicant must not during the past twelve years have been imprisoned for four months or on four occasions for an offence punishable by twelve months' imprisonment and dishonouring him in the public estimation.
The applicant must not during the past twenty-five years have been imprisoned for five years for any offence dishonouring him in the public estimation.
The applicant must not during the past twelve years have deserted his wife (or husband, as the case may be) or his children under the age of fifteen years.
The applicant must have lived a sober and reputable life during the past year.
The yearly income of the applicant, if single, must not reach £97 10s., and, if married, £143.
The net value of accumulated property, as defined by the Act, must be under £460.
The applicant must not have deprived himself or herself of property or income to qualify for a pension.
All residents of New Zealand who fulfil the necessary conditions are eligible for the old-age pension, with the exception of—
Maoris who receive votes other than pensions out of the grant appropriated by the Civil List Act, 1908.
Aliens.
Naturalized subjects who have not been naturalized one year.
Chinese or other Asiatics, whether naturalized or not, and whether British subjects by birth or not.
The term “alien” is deemed not to include a woman who ceased to be a British subject by reason of marriage with an alien who is since deceased, or from whom she is legally separated.
The original Act of 1898 provided for a pension of £18 per annum, or 6s. 11d. per week. This amount was, however, increased to £26 per annum (i.e., 10s. a week, or £2 3s. 4d. a month) by the Amendment Act of 1905. Under the Finance Act, 1917, every person in receipt of an old-age pension was paid an additional 5s. a week, or £13 per annum, by way of war bonus, and, in terms of the provisions of the Finance Act, 1920, this bonus was incorporated in the statutory pension, bringing it to 15s. a week, or £39 per annum. The Pensions Amendment Act, 1924, provided an additional 2s. 6d. per week in cases where the pensioner was without property and had no income other than his pension, and the Pensions Amendment Act, 1925, extended this increase to all pensioners, making the present general rate £45 10s. per annum. The full pension of £45 10s. is reducible by—
£1 for every complete £1 of income over £52.
£1 for every complete £10 of net capital value of accumulated property.
A further deduction of £1 for every year or part of a year by which the age of a woman pensioner is less than 65 is also made, except in cases where the pensioner is the mother of two or more children under 15 years of age who are dependent on her.
The income of a married applicant for pension purposes is considered to be half of the joint incomes of husband and wife. The joint incomes of a married couple must not exceed, with pension added, the sum of £143.
Income includes free board and lodging up to £26 per annum, but does not include—
Sick allowance or funeral benefit from a registered friendly society, or benefit payable under the National Provident Fund Act.
Any money received on the sale or exchange of land or property.
Any money received under an insurance policy on the destruction or damage by fire or otherwise of a building or other property.
Capital expended for the benefit of the applicant or the wife or husband or dependent children of the applicant.
Any principal or capital sum received on the intestacy or under the will of a deceased husband or wife.
Any moneys raised by public subscription for the benefit of the applicant, or of his wife (or her husband) or dependent children.
Any moneys, not exceeding £100, received by way of compensation or damages in respect of the death of any person.
The income chargeable is that received during the twelve months ending on the first day of the month immediately preceding the month in which the claim is admitted, the Magistrate dealing with the application having power to exempt personal earnings in cases where it is shown to his satisfaction that owing to loss of employment or any other cause such earnings have ceased.
Net accumulated property is the capital value (reduced by £50) of all real and personal property owned by an applicant, other than any property on which he permanently resides, or life-assurance policies and annuities, or other life interests in the capital sum of which the applicant has no interest beyond the income derived therefrom. The net accumulated property of a husband or wife for pension purposes is half of the total net accumulated properties of both.
The exemption of the value of the home in the computation of net accumulated property was not provided for prior to 1925.
The number of old-age pensions in force on the 31st March, 1926, was 22,905, an increase of 843 on the figure for the previous year. The annual liability was £981,886, being an average of £42 17s. per pension. The total payment in respect of old-age pensions during the year was £903,577. A decennial summary is—
| At 31st March. | Pensioners. | Amount paid during Year. |
|---|---|---|
| £ | ||
| 1917 | 19,697 | 480,230 |
| 1918 | 19,960 | 643,177 |
| 1919 | 19,872 | 743,063 |
| 1920 | 19,993 | 732,968 |
| 1921 | 19,837 | 731,343 |
| 1922 | 20,491 | 743,620 |
| 1923 | 21,181 | 755,324 |
| 1924 | 21,468 | 767,805 |
| 1925 | 22,062 | 806,953 |
| 1926 | 22,905 | 903,577 |
The total payments to the 31st March, 1926, aggregated £12,637,410, and the total amount credited against this figure in respect of national-endowment revenue is £466,464.
The Widows' Pensions Act, 1911, came into operation on the 1st January, 1912. The scope of this Act, which is embodied in its amended form in the Pensions Act., 1926, has been widened from time to time by various amendments.
Applicants for widows' pensions must be British subjects of good character, with at least one child under fifteen, and applications require to be lodged with the local Registrar of Pensions, and to be investigated by a Magistrate, who alone has power to grant pensions. The term “widow” includes a woman whose husband is detained in a mental hospital.
The pension payable is £52 per annum to a widow with one child under fifteen years of age, with £26 per annum added for each additional child under fifteen, the maximum pension payable being £208 per annum. The term “child” includes a stepchild or a child legally adopted during the lifetime of the husband of the applicant.
The number of widows' pensions in force on the 31st March, 1926, was 3,833, covering in addition 8,664 children. The annual value of these pensions was £301,121, and the gross payments during the year were £286,450.
The figures for the last five years are as follow:—
| Year ended 31st March. | Number at End of Year. |
|---|---|
| 1922 | 3,343 |
| 1923 | 3,411 |
| 1924 | 3,526 |
| 1925 | 3,598 |
| 1928 | 3,833 |
| Annual Value. | Annual Payments. |
| £ | £ |
| 207,029 | 186,£57 |
| 195,747 | 188,021 |
| 209,739 | 202,818 |
| 281,141 | 236,378 |
| 301,121 | 286,450 |
The average pension as at 31st March, 1926, was £78 11s. The total widows' pension payments since the inauguration of the scheme in 1912 have been £1,720,150.
The Military Pensions Act, 1912, was enacted to provide for payment of an annual pension of £36 (now £49) to veterans of the Maori War who were awarded the New Zealand War Medal for active service in that war. This Act is now embodied in the Pensions Act of 1926.
The qualifications of an applicant are as follows:—
He must have resided in New Zealand for the ten years immediately preceding the date of his application.
He must not have been imprisoned during the same period for any offence punishable by imprisonment for two years.
He must not during the same period have deserted or failed to provide for his wife and children.
He must be of good moral character and sober habits.
A person in receipt of a military pension in respect of Maori War service is not thereby debarred from applying for and receiving an old-age pension, in addition to his military pension.
| Year ended 31st March, | Number at End of Year. |
|---|---|
| 1922 | 740 |
| 1923 | 669 |
| 1924 | 589 |
| 1925 | 519 |
| 1926 | 444 |
| 36,260 | 37,737 |
| 32,781 | 34,004 |
| 28,861 | 30,350 |
| 25,431 | 26,848 |
| 21,756 | 23,067 |
The number of pensions in force on the 31st March, 1926, was 444, representing an annual value of £21,756 (£49 per pension). The payments on account of military pensions during the year aggregated £23,067. The figures for five years are—
The number of pensioners of this class is rapidly decreasing, having fallen from 1,323 in 1916 to 444 in 1926, while the annual value fell during the same period from £47,628 to £21,756. The grand total paid in pensions of this class since the institution of the scheme in 1912–13 has been £513,217.
Part IV of the Pensions Act, 1926, which incorporates the Miner's Phthisis Act, 1915, as amended by the Finance Acts, 1919 and 1920, provides for a pension to any miner who is totally incapacitated for work owing to miner's phthisis (pneumoconiosis) contracted while working as a miner in New Zealand. The rates of pension payable are—
To a married man or to a widower with children under fourteen years of age, £1 15s. a week.
To a single man, £1 5s. a week.
The qualifications for this class of pension are—
The applicant must have been a British subject for one year.
He must have resided in New Zealand for five years immediately prior to his application.
He must have been employed as a miner in New Zealand for two years and a half.
He must not have deserted or failed to provide for his wife or children, nor have been convicted for any offence punishable by imprisonment for two years.
He must be of sober habits and good moral character.
The widow of any miner who is entitled to a pension under the Act and dies of miner's phthisis is entitled to claim a pension of 17s. 6d. a week during widowhood. The actual reasonable expenses (not exceeding £20) of the funeral of a miner dying of miner's phthisis is also payable.
The number of pensions in force at 31st March, 1926, was 640, representing an annual liability of £40,462, the average pension being £63 5s. Pension payments during the year totalled £40,239, bringing the aggregate from the commencement of the scheme to £259,238. Against this the amount of £35,732 has been credited in respect of gold duty.
A summary is given showing the position as at the 31st March of each year of the period 1922 26.
| Year ended 31st March, | Number. | Annual Liability. | Annual Payment. |
|---|---|---|---|
| £ | £ | ||
| 1922 | 506 | 31,505 | 31,212 |
| 1923 | 544 | 33,826 | 33,447 |
| 1924 | 580 | 36,634 | 36,084 |
| 1925 | 607 | 37,934 | 38,506 |
| 1926 | 640 | 40,462 | 40,239 |
The total pensions granted since 1916 have been 1,259. Of these 434 have been discontinued on account of death, and 185 for other causes. Of the total of 640 pensions in force at the 31st March. 1926, 101 were granted to unmarried miners, 206 to married miners, and 333 to widows of miners. The average pensions payable were £65, £91, and £45 10s. respectively.
The War Pensions Act, 1915, as amended, provides for the payment of pensions on certain conditions—
To disabled members of the New Zealand Forces:
To dependants of disabled, deceased, or missing members of the New Zealand Forces.
“Member of the Forces” may include—
A member of any New Zealand Expeditionary Force raised for service beyond New Zealand in the late war:
A member of any New Zealand Naval Force raised for service beyond New Zealand in the late war:
A member of the New Zealand Army Nursing Service who, while domiciled in New Zealand, served beyond New Zealand in the late war and was in the pay of the New Zealand Government:
A member of the New Zealand Defence or Naval Forces temporarily attached to any other portion of His Majesty's Forces who served beyond New Zealand in the late war and was in receipt of pay from the Imperial Government:
Any person, not being a member of any New Zealand Expeditionary or Naval Force, who, while domiciled in New Zealand, served beyond New Zealand in the late war and was in receipt of pay from the New Zealand Government:
Any person, not being a member of any New Zealand Expeditionary Force, who was engaged on active military service in any capacity in New Zealand in connection with the late war.
A “dependant” may be wife, child, father, mother, grandfather, grandmother, stepfather, stepmother, grandchild, brother, sister, or mother-in-law, and, except wife or child, must have been wholly or in part dependent upon a member of the Forces at any time during the twelve months immediately preceding the date on which the said member joined the Forces.
A “dependant” may, however, include a father or mother who was not actually dependent during the said twelve months, but is without adequate means of support.
A “child” means a person under the age of sixteen years, being a son, daughter, stepson, stepdaughter, or illegitimate child of a member of the Forces, or a child legally adopted by such member before he became a member of the Forces.
The death or disablement of any member of the Forces must have occurred in the course of his military service in connection with the late war. but may have taken place either in New Zealand or after departure from New Zealand.
The pension may be refused to a disabled applicant if any wilful misconduct contributed to the disablement.
The full scale of pensions was published in the 1920 issue of this book.
The gross annual value of the pensions in force at the 31st March, 1926, was £1,122,843. A summary follows:—
| SUMMARY OF ANNUAL LIABILITY AT 31ST MARCH, 1926. | ||||
|---|---|---|---|---|
| Class of Pension. | Number of Pensioners. | Number of Children. | Annual Value. | Average Pension. |
| £ | £ | |||
| Soldiers (permanent) | 8,194 | .. | 395,692 | 48 |
| Soldiers (temporary) | 4,174 | .. | 269,270 | 64 |
| Dependants of disabled soldiers | 747 | 1,323 | 61,117 | 82 |
| Widows (without children) | 583 | .. | 51,158 | 88 |
| Widows (with children) | 801 | 1,271 | 125,121 | 156 |
| Other dependants of deceased soldiers— | ||||
| Parents | 5,492 | 16 | 193,311 | 35 |
| Other adult dependants | 149 | 27 | 6,037 | 41 |
| Guardians of children | 576 | 783 | 21,137 | 37 |
| Totals | 20,716 | 3,420 | 1,122,843 | 54 |
Information as to number and rate of war pensions in force at 31st March, 1926, is given in the following table:—
| WAR PENSIONS IN FORCE AT EACH RATE ON 31ST MARCH, 1926. | |||||
|---|---|---|---|---|---|
| Rate (nearest £1). | Soldiers (Permanent).£ | Soldiers (Temporary). | Wives and Parents (on Account of Disablement). | On Account of Death. | |
| Widows (including Children's Pensions). | Parents and other Dependants. | ||||
| 301–340 | 3 | 3 | .. | .. | .. |
| 261–300 | 4 | 4 | .. | 3 | .. |
| 234–260 | 27 | 1 | 3 | 18 | .. |
| 201–233 | 18 | 3 | 7 | 60 | 1 |
| 191–200 | 1 | 6 | .. | 28 | .. |
| 181–190 | 98 | 396 | 15 | 106 | .. |
| 171–180 | 16 | 3 | 1 | 5 | .. |
| 161–170 | 71 | 94 | 2 | 71 | 1 |
| 151–160 | 33 | 69 | 27 | 152 | 2 |
| 141–150 | 28 | 59 | 4 | 19 | .. |
| 131–140 | 33 | 8 | 7 | 49 | .. |
| 121–130 | 75 | 128 | 68 | 307 | 14 |
| 111–120 | 39 | 23 | 15 | 58 | 11 |
| 101–110 | 107 | 136 | 110 | 30 | 21 |
| 91–100 | 309 | 51 | 23 | 7 | 43 |
| 81–90 | 310 | 5 | 17 | 35 | 11 |
| 71–80 | 352 | 165 | 130 | 430 | 215 |
| 61–70 | 288 | 126 | 36 | 1 | 83 |
| 51–60 | 1,196 | 453 | 141 | 1 | 590 |
| 41–60 | 314 | 199 | 19 | .. | 69 |
| 31–40 | 1,454 | 582 | 41 | 2 | 1,555 |
| 21–30 | 2,395 | 1,411 | 69 | 1 | 3,521 |
| 6–20 | 1,023 | 249 | 12 | 1 | 80 |
| Totals | 8,194 | 4,174 | 747 | 1,384 | 6,217 |
The total payments on war pensions to the 31st March, 1926, were £12,569,640, the figures for each year being—
| Year ended 31st March. | Pension Payments. |
|---|---|
| £ | |
| 1916 | 13,910 |
| 1917 | 180,389 |
| 1918 | 515,445 |
| 1919 | 1,199,755 |
| 1920 | 1,812,419 |
| 1921 | 1,886,952 |
| 1922 | 1,726,174 |
| 1923 | 1,489,392 |
| 1924 | 1,315 560 |
| 1925 | 1,244,483 |
| 1926 | 1,185,161 |
By an amendment of the War Pensions Act, 1915, provision was made for the payment of economic pensions to soldiers or their dependants. An “economic pension” is defined under the Act as a supplementary pension granted on economic grounds, and being in addition to any pension payable as a right in respect of the death or disablement of a member of the Force.
Economic pensions consist of three classes, viz.,—
A maximum pension of £1 10s. weekly to disabled soldiers.
A maximum pension of 10s. weekly to widows of soldiers with one child, with an additional 2s. 6d. weekly for each child in excess of one.
A maximum pension of £1 weekly to widowed mothers of deceased soldiers.
In each case the income of the pensioner affects the grant. Pensions payable under Class (1) have taken the place of the previously payable supplementary grants of £1 a week under section 4 of the 1917 Act, and the 10s. a week granted under the Finance Act, 1920, and are also payable under certain conditions to soldiers whose disablement is of such a nature as to militate against their obtaining or following remunerative employment. Soldiers pensioned for minor disabilities do not receive economic pensions.
Payments in respect of economic pensions are included in the general total of war pensions above.
Section 13 of the Finance Act, 1919, provides that every person permanently resident in New Zealand who on the passing of that Act was in receipt of a pension or allowance under Part IX of the Defence Act, 1909, in respect of military service in South Africa shall be entitled to a pension under the War Pensions Act, 1915, in the same manner as if ho had been a member of the Forces within the meaning of that Act. Any pension under this section is not to be of such amount that the total amount receivable (including any Imperial pension) would be more than the pension payable if he had been a member of the Forces within the War Pensions Act, 1915.
The total number of pensions in force under this heading at the 31st March, 1926, was sixty, corresponding to an annual liability of £2,445. The amount actually paid out on claims during the year was £2,902.
In addition to the war pensions granted to South African veterans, old-age pensioners who served in the South African War may now receive additional old-age pension of 5s. per week in cases where total income, including pension, does not exceed £97 10s. per annum.
Section 34 of the Finance Act, 1926, provides for pensions to be paid in the event of the death or disablement of members of the New Zealand Defence or Naval Forces by reason of misadventure suffered in the performance of their duties. The pensions rates under this section are not to exceed the corresponding pension rates under the War Pensions Act, and all applications for pensions of this class are to be dealt with by the War Pensions Board.
To relieve distress arising out of the influenza epidemic of 1918 a system of pensions was instituted. The number of pensions in force at the 31st March, 1926, was 313, representing an annual liability of £11,802, the average pension being £37 14s. The amount paid during the financial year 1925–26 in respect of epidemic pensions was £14,522, and the total amount paid since the commencement of the scheme £416,567.
The number of pensions is rapidly decreasing, having fallen during the past year by 52, or since the 31st March, 1920, by 626.
Part III of the Pensions Act, 1926, which incorporates legislation passed in 1924 and amended in 1925, provides for the payment of a pension of £45 10s. per annum to blind people over the age of twenty. To be eligible for a pension an applicant must (1) have been born blind in New Zealand, or (2) have become blind while permanently resident in New Zealand, or (3) have been permanently resident in New Zealand for at least ten years before the 29th October, 1924, or twenty-five years before the date of applying for the pension. Ten years' continuous residence in the Dominion is required in every case.
Similar provisions apply in regard to property and unearned income as in the case of old-age pensions. In regard to earned income, however, an additional pension equal to 25 per cent. of earnings is granted, with a proviso that total income and pension must not exceed £3 12s. 6d. per week.
The number of pensions in force at the 31st March, 1926, was 196, representing an annual liability of £9,396 or an average of £47 18s. per annum. The amount of pension-money paid under this head to the 31st March, 1926, was £8,053.
In addition to the various classes of pensions enumerated in the foregoing part of this section, the Pensions Department is charged with the payment of pensions under the Civil Service Act, 1908, and other miscellaneous pensions and annuities.
The total number and the gross annual value of pensions in force under the Civil Service Act at the 31st March, 1926, were 55 and £15,278 respectively. The total payments during the year amounted to £16,855. There were at the same date 102 other pensions and annuities of various forms, of a total annual value of £9,292, the amount actually paid out during the year being £8,752.
A summary showing the total amount of pensions administered by the Pensions Department during the two years ended 31st March. 1925 and 1926. follows:—
| Class of Pension. | Annual Value. | Gross Payments. | ||
|---|---|---|---|---|
| 1924–25. | 1925–26. | 1924–25. | 1925–26. | |
| £ | £ | £ | ||
| War | 1,140,168 | 1,122,843 | 1,244,483 | 1,185,161 |
| Old-age | 850,795 | 981,886 | 806,953 | 903,577 |
| Widows' | 281,141 | 301,121 | 236,378 | 286,450 |
| Maori War | 25,431 | 21,756 | 26 848 | 23,067 |
| Miners' | 37,934 | 40,462 | 38,506 | 40,239 |
| Epidemic | 16,226 | 11,802 | 22,881 | 14,522 |
| Blind | 4,485 | 9,396 | 1,036 | 8,053 |
| Boer War | 2,949 | 2,445 | 3,071 | 2,902 |
| Civil Service Act | 17,776 | 15,278 | 19,115 | 16,855 |
| Other pensions and annuities | 10,380 | 9,292 | 9,327 | 8,752 |
| Totals | 2,387,285 | 2,516,281 | 2,408,598 | 2,489,578 |
The Family Allowances Act was passed in the session of 1926, to provide for the granting of allowances towards the maintenance of children by parents of limited income. The Act comes into force on the 1st April, 1927.
The allowance to be made is at the rate of 2s. per week for each child in excess of two, the average weekly income of the applicant and his wife and children. including allowance, not to exceed £4, plus 2s. for each child in excess of two. For the purposes of the Act the term “child” means a child under the age of fifteen, being a son, daughter, stepson, or stepdaughter of the applicant, and includes a child legally adopted by the applicant or his wife, but not an illegitimate child. A child who is not in fact maintained as a member of the family, or in respect of whom a pension out of public moneys is otherwise payable, is also excluded. In certain cases the allowance may be continued after a child has attained the age of fifteen.
In the computation of income for the purpose of deciding the eligibility of an applicant for an allowance the following are to be taken into account:—
All money or money's worth received within the period of one year immediately preceding the date of the application from all sources by any member of the family for his own use or benefit or for the use or benefit of any member of the family:
Interest at the rate of five per cent. per annum (or such higher rate as may actually be received) on the value of the beneficial interest of any member of the family in any real or personal property (other than furniture and personal effects in the possession of the family).
In special cases anticipated increases or decreases in income may be taken into account. Deduction from income as above computed is to be made in respect of expenditure incurred in the production of the income.
The application for the allowance is to be made by the father, but in general the allowance is to be paid to the mother, provision being made for payment to the father in certain exceptional cases.
Apart from the conditions as to income and children, the applicant and (except in cases where the allowance is not payable to the wife) his wife must have been resident in New Zealand for not less than one year, and the children in respect of whom the allowance is payable must either have been born in the Dominion or have been resident therein for one year. Except with the direction of the Minister in Charge of the Pensions Department, no allowance may be paid in the case of aliens or of Asiatics, whether British subjects or not. An application for an allowance may be refused if the applicant or his wife is of notoriously bad character, or has been guilty of any offence or misconduct dishonouring him or her in the public estimation. Refusal may also be made if the applicant or his wife has directly or indirectly deprived himself or herself of property or income in order to obtain the benefits of the scheme. The allowance is required to be applied toward the maintenance or education of the children concerned, and may be refused unless it is shown that it will be so applied.
The question of providing pensions for the public and semi-public servants of the Dominion on their retirement has received a good deal of attention in recent years. The schemes now in force embrace the State Railways, Public Service (including Police), Teachers, and Stipendiary Magistrates, while the various local bodies are empowered to establish schemes under the Local Authorities Superannuation Act, 1908.
The Public Service Superannuation Act, 1907, now embodied in the Public Service Classification and Superannuation Act, 1908, which with its amendments includes all branches of the Public Service except the Railways Department and that part of the Education service which comes under the operations of the teachers' superannuation scheme, came into force on the 1st January. 1908. The scheme, although optional on the part of public servants permanently employed at that date, is compulsory on all persons appointed thereafter.
The Police Provident Fund, which was established on the 1st December, 1899, under the Police Provident Act, 1899, was merged in the Public Service Superannuation Fund on the 1st April. 1910.
The fund is administered by a Board consisting of eleven members, comprising a Minister of the Crown, four permanent heads of Departments, and six members elected by contributors—two by those in the Post and Telegraph Department, one by those in the Police Force, and three by those in other Departments. Elected members hold office for three years, with the right of offering themselves for re-election.
The fund consists of contributions from contributors, interest on investments, Government subsidy, fines imposed on public servants, and proceeds of sales of unclaimed property.
The contributors to the fund are of two classes—“original” and “new.” In the first class are those who. on the initiation of the fund, were allowed the option of joining the fund, of effecting life insurance, or of paying 5 per cent. of their salaries into the Public Trust Office Common Fund for their future benefit; while in the second class are the compulsory contributors—i.e., all officers who have been permanently appointed since the Act came into force. The latter class includes temporary employees made permanent by reason of five years' continuous service, which service must, however, have commenced on or prior to the 25th November, 1907, that being the date of the passing of the original Act.
The contributions vary with the age on joining the fund: For ages under thirty they are 5 per cent. of the salary; ages thirty and under thirty-five. 6 per cent.; thirty-five and under forty, 7 per cent.; forty and under forty-five, 8 per cent.; forty-five and under fifty, 9 per cent.; fifty and over. 10 per cent.
The principal benefits are—
A pension for every year of service equal to one-sixtieth of the average annual salary for the last three years, payable (a) after forty years' service, or (b) at age sixty-five, or (c) on retirement owing to ill health. The maximum pension is not to exceed two-thirds of the salary, or, in the case of entrants after the 24th December, 1909, £300 per annum.
A pension of £31 per annum to the widow of a contributor or pensioner during widowhood, and £26 per annum for each child under the age of fourteen. Prior to the 1st April, 1925, widows' and children's pensions were £18 and £13 per annum respectively.
Females may retire after thirty years' service or at the age of fifty-five, while the retiring-age may be reduced in certain cases for both males and females. Special pensions may be given in the case of members of the Police Force for injuries received on duty.
On the 31st March, 1926, there were 16,328 contributors paying £238,996 per annum into the fund. The pensioners at the same date numbered 2,522, and were entitled to £314,214 per annum, made up as follows:—
| Number. | Pension. | |
|---|---|---|
| Retired for age or length of service | 1,346 | 271,340 |
| Retired for ill health | 153 | 12,520 |
| Police injured on duty | 8 | 1,069 |
| Widows | 579 | 17,949 |
| Children | 436 | 11,336 |
| 2.522 | £314,214 |
The following table contains particulars of the public servants who were contributing to the fund at the 31st March. 1926, grouped according to their respective rates of contribution:—
| Rate per Cent. of Contribution. | Number. | Annual Salary. | Annual Contribution. | ||
|---|---|---|---|---|---|
| Male. | Female. | Total. | |||
| 5 | 10,654 | 1,660 | 12,314 | 2,937,523 | 146,876 |
| 6 | 1,611 | 155 | 1,766 | 578,268 | 34,696 |
| 7 | 1,059 | 110 | 1,169 | 386,883 | 27,082 |
| 8 | 626 | 78 | 704 | 234,028 | 18,722 |
| 9 | 273 | 23 | 296 | 99,325 | 8,939 |
| 10 | 74 | 5 | 79 | 26,809 | 2,681 |
| Totals | 14,297 | 2,031 | 16,328 | 4,262,836 | 238,996 |
Accumulated funds at the 31st March. 1926, amounted to £2,317,399, of which £2,317,309 was invested—£1,710,692 in mortgage securities, and £606,617 in New Zealand Government securities.
The classes of security in which the moneys of the fund may be invested are—
Securities of the New Zealand Government.
Debentures issued by a local authority and secured upon general or special rates, or partly by rates and partly in some other manner.
Advances by way of first mortgage on the security of any real, estate held in fee-simple in New Zealand, to an amount not exceeding three-fifths of the estimated value of such estate, according to a valuation approved by the Board.
Deposits in any bank of issue in New Zealand, or in the Post Office Savings-bank.
Any other securities that may from time to time be authorized by the Governor-General in Council on the recommendation of the Board.
The report of the Superannuation Board for the twelve months ended 31st March. 1926, shows that officers who retired during the period, and who possessed compensation rights under the Civil Service Act, 1866, would have been entitled to receive the sum of £29,086, the amount of compensation accrued to the date when they joined the Superannuation Fund, had they not become participants in the benefits of the fund. The total amount of such compensation for which the fund became liable since the initiation of the scheme is £543,058. To this amount must be added accretions to the date of retirement, approximately £130,000, for which the Consolidated Fund would otherwise have been liable, and the whole may be fairly set against the total subsidies paid to the fund, amounting to £1,204,500.
An examination of the Public Service Superannuation Fund is made once in every three years by an Actuary appointed for the purpose by the Governor-General. The actuarial examination was made as at the 31st December in each third year up to and including 1919, but by section 53 of the Finance Act, 1922, the examination which would otherwise have been due at the 31st December, 1922, was postponed to the 31st March, 1924, future examinations to be made as at the 31st March in each third year from 1927 onwards.
The Actuary's report must show the state of the fund at the close of the triennium, having regard to the prospective liabilities and assets, and the probable annual sums required by the fund to provide the retiring and other allowances falling due within the ensuing three years, without affecting or having recourse to the actuarial reserve appertaining to the contributors' contributions—in other words, without trenching on the moneys paid by existing contributors to be invested for the purpose of providing their allowances when they retire.
When an original contributor retires on superannuation his retiring-allowance may be divided—although in practice it is not so divided—into two parts: i.e., that part which relates to his service prior to joining the fund and for which he was not required to contribute, and that part subsequent to joining the fund and for which he did contribute. It is mainly in respect of the first part, together with the supplementary benefits to widows and children, that a subsidy is required from the State.
The Government subsidy to the fund was originally £20,000 per annum, rising in 1910 to £22,500, and in the next two years to £23,000. In 1913 it was increased to £48,000, and in 1919 to £86,000. The Finance Act, 1925, which increased the pensions payable to widows and children, provided for the additional charge to be met by the Consolidated Fund.
The actuarial report for the triennium 1917–19 shows that on the basis of valuation adopted the subsidies paid for 1911 and 1912 were too low by £25,000 per annum; for the three years 1914–16, too low by £18,000 per annum; and for 1917 and 1918, too low by £38,000 per annum; making a total shortage to 1919 of £180,000, or, with accumulations at 4 per cent. to 1922, £237,264. The valuation of the fund as at the 31st December, 1919, gave the following results:—
| £ | ||
|---|---|---|
| Present value of the liability for benefits | 7,486,981 | |
| Present value of contributions receivable from members | £2,055,794 | |
| Funds in hand | 1,288,198 | |
| 3,343,992 | ||
| Present value of total liability of State | 4,142,989 | |
| Less present value of existing subsidy of £86,000 | 2,150,000 | |
| Value of future subsidies to be provided for by the State over and above present subsidy of £86,000 | £1,992,989 | |
The actuarial report estimated that, apart from making provision for the shortages of past years, an additional £24,000 should be paid by way of subsidy for each of the three years 1920–22. Extraordinary retirements in 1922 were estimated to require a further £15,000 in that year, or £5,000 per annum, and it was stated that at least £10,000 per annum should be added to the subsidy to meet the deficiency in past subsidy payments.
In consequence of the position disclosed by the Actuary, an additional amount of £100,000 was contributed to the fund by the Government, divided between the years 1923–24 and 1924–25.
It should be pointed out that the valuation of the fund was made on the basis of interest at 4 per cent., it not being considered prudent to anticipate a higher rate for the long period covered by a pension fund. The rate adopted is, however, much lower than that at present being received, the average rate of interest earned on the mean funds during recent years being:—
| Year ended 31st December, | Average Rate per Cent. | ||
|---|---|---|---|
| 1916 | 5 | 1 | 2 |
| 1917 | 5 | 3 | 3 |
| 1918 | 5 | 4 | 1 |
| 1919 | 5 | 5 | 10 |
| 1920 | 5 | 3 | 1 |
| 1921 | 5 | 6 | 0 |
| 1924 | 5 | 16 | 3 |
| 1925 | 5 | 18 | 7 |
| 1926 | 6 | 1 | 5 |
The total revenue of the fund for the year ended 31st March, 1926, was £496,889, including members' contributions £257,378, interest on investments and on contributions £136,798, and Government subsidy £99,269, the last-mentioned including a special payment of £13,269 on account of increased benefits to widows and children. The total amount expended during the year was £376,868, comprising retiring and other allowance £316,400, refunds of contributions £53,415, transfers to other funds £185, and cost of administration £6,868.
A table is now given showing the progress of the fund since its inception —
| Year ended | Number of Contributors. | Total Amount of Contributions. | Interest received from Investments. | Contributions from Government. | Annual Value of Allowances. | Accumulated Fund. |
|---|---|---|---|---|---|---|
*Fifteen months. | ||||||
| £ | £ | £ | £ | £ | ||
| 31st December, 1908 | 7,235 | 79,831 | 1,295 | 20,000 | 8,881 | 71,481 |
| 31st December, 1910 | 8,371 | 90,215 | 10,212 | 22,500 | 39,944 | 263,948 |
| 31st December, 1912 | 10,027 | 109,840 | 16,257 | 23,000 | 53,385 | 423,556 |
| 31st December, 1914 | 11,803 | 128,930 | 25,607 | 48,000 | 70,399 | 655,811 |
| 31st December, 1916 | 13,313 | 141,844 | 42,314 | 48,000 | 88,392 | 896,568 |
| 31st December. 1918 | 13,784 | 146,039 | 49,378 | 48,000 | 100,389 | 1,015,603 |
| 31st December, 1920 | 15,387 | 241,639 | 71,950 | 106,000 | 142,719 | 1,502,906 |
| 31st March, 1923* | 14,989 | 217,409 | 121,330 | 107,500 | 224,598 | 1,869,028 |
| 31st March, 1924 | 15,021 | 217,692 | 113,608 | 136,000 | 251,894 | 2,039,043 |
| 31st March, 1925 | 15,782 | 230,603 | 122,510 | 136,000 | 264,146 | 2,211,555 |
| 31st March. 1926 | 16,328 | 238,996 | 132,993 | 99,269 | 314,214 | 2,317,399 |
Since the passing of the Public Service Classification and Superannuation Amendment Act, 1908, the benefits of the Teachers' Superannuation Fund have been brought into line with those of the Public Service Superannuation Fund. Existing contributors had, however, the right of electing to remain subject to the provisions formerly in force.
There are a few slight differences between the Public Service and the Teachers' Funds, the chief being that where back service is recognized it need not be continuous, and that a contributor is not deemed to have retired from the Education service by reason of unemployment unless the unemployment extends for twelve months or unless the contributor deliberately retires from the service as distinct from a particular position in the service. Under certain circumstances the period of twelve months can be extended by the Board. No pensions are payable on retirement for ill health unless the service exceeds fifteen years.
Under the provisions of section 54 of the Finance Act, 1922, the financial year now closes on the 31st January instead of on the 31st December as formerly.
The total amount standing to the credit of the fund at the 31st January, 1926, was £1,008,823, an increase of £66,068 during the year. The revenue for the year was £263,196, including members' contributions £127,671, interest £64,844, and Government subsidy £70,681. The total amount of Government subsidy paid into the fund to the 31st January, 1926, is £538,097. The expenditure of the fund for the year ended 31st January, 1926, was £197,129, of which retiring-allowances represented £169,258, and refund of contributions £20,672.
On the 31st January, 1926, there were 7,968 contributors, the annual contributions amounting to £127,671.
The retiring and other allowances were 1,197, representing a charge of £152,422 per annum, made up of—
| Number. | Amount of Pension. | |
|---|---|---|
| Retired for age or length of service | 814 | 128,786 |
| Retired for ill health | 126 | 16,086 |
| Widows | 171 | 5,314 |
| Children | 86 | 2,236 |
| 1,197 | £152,422 |
The progress of the fund during the last ten years is well shown in the following table:—
| Year ended | Number of Contributors. | Total Amount of Contributions. | Interest received. | Government Subsidy. | Total Amount paid in Allowances. | Accumulated Fund. |
|---|---|---|---|---|---|---|
* Thirteen months. | ||||||
| £ | £ | £ | £ | £ | ||
| 31st December, 1916 | 4,653 | 56,038 | 16,466 | 17,000 | 42,001 | 381,158 |
| 31st December, 1917 | 4,792 | 58,070 | 18,289 | 17,000 | 45,122 | 420,225 |
| 31st December, 1918 | 4,894 | 60,160 | 22,666 | 17,000 | 48,354 | 458,056 |
| 31st December, 1919 | 5,019 | 72,297 | 26,686 | 43,000 | 57,489 | 526,702 |
| 31st December, 1920 | 5,174 | 87,310 | 30,295 | 43,000 | 66,589 | 599,303 |
| 31st December, 1921 | 5,872 | 96,391 | 35,146 | 43,000 | 74,315 | 681,777 |
| 31st January 1923* | 6,296 | 100,309 | 45,041 | 71,583 | 100,132 | 779,636 |
| 31st January, 1924 | 6,858 | 101,632 | 48,725 | 63,833 | 112,861 | 858,662 |
| 31st January, 1925 | 7,443 | 111,025 | 53,689 | 68,000 | 126,232 | 942,755 |
| 31st January, 1926 | 7,968 | 127,671 | 64,844 | 70,681 | 169,258 | 1,008,823 |
The Government Railways Superannuation Fund was established on the 1st January, 1903, by the Government Railways Superannuation Fund Act, 1902, now embodied in the Government Railways Act, 1926.
The pension is here also one-sixtieth of the annual rate of pay for every year of service, but the retiring-age is sixty for both males and females, instead of ages sixty-five and fifty-five respectively as in the Public Service. The only other differences of importance are that the annual allowances to widows and children are paid only on the death of contributors before retiring on a pension, and that the pension is computed on the last salary, except where the contributor has served in a lower grade within the previous five years, in which case the average for seven years is taken.
The total amount standing to the credit of the Government Railways Superannuation Fund at the close of the financial year ended 31st March, 1926, was £862,139, an increase of £128,027 on the balance to the credit of the fund for the previous year.
Prior to the 1st April, 1924, the moneys belonging to the fund formed part of the Common Fund of the Public Trust Office, and bore interest at the rate of 5 per cent. on the daily credit balance. From the date mentioned, however, they have been separately invested by the Public Trustee. At the 31st March, 1926, £512,046 was invested in mortgages, £195,415 in local bodies' debentures, and £93,000 in Government securities. The average rate of interest earned during the year was 5.76 per cent.
The revenue for the year totalled £380,542, including members' contributions £153,903, interest £43,751, subsidy from Railway Department £145,000, Government subsidy £25,000, fines and donations &c., £12,888. The expenditure during the year amounted to £252,783, of which retiring-allowances represented £198,890, allowances to widows and children £27,065, and refunds of contributions &c., £26,828.
At the 31st March, 1926, the liability of the fund to contributors in respect of amounts paid by them was £1,161,717. There were 2,332 persons on the fund at the 31st March, 1926, involving an annual liability of £220,093.
Section 39 of the Finance Act, 1924, made special provision for retiring-allowances in the case of Stipendiary Magistrates, who (with the exception of those in office at the 6th November, 1924, who elected within two months to remain contributors to the Public Service Fund) were removed from the operation of Part II of the Public Service Classification and Superannuation Act, 1908.
The scheme for Magistrates provides for the same rates of contribution as under the Public Service scheme, but gives an annual retiring-allowance for each year of service (whether continuous or not) equal to one-fortieth of the annual salary receivable at the date of retirement, with, however, a limit of twenty-five fortieths. The retiring-age is also increased to sixty-eight, instead of sixty-five.
Members' contributions during the year ended the 31st March, 1926, totalled £2,107, and interest on investments brought in £900. Administration expenses during the year Mere only £28, and the fund at the 31st March, 1926, amounted to £16,756.
The Local Authorities Superannuation Act, 1908, which came into force on the 10th October, 1908, applies to Borough Councils, County Councils, Town Boards, Road Boards, Harbour Boards, tramway companies, or any body possessing rating-powers over any district.
Statistical information as to the various funds which have been initiated under the authority of this statute is not available.
The National Provident Fund was established by Act in 1910, and came into operation on the 1st March, 1911. The fund is administered by a Board composed of the Minister of Finance as Chairman and four members appointed by the Governor-General, one of whom is the Superintendent of the fund.
The system is open to any person between the ages of sixteen and fifty years residing in New Zealand whose average income during the three years prior to joining has not exceeded £300 per annum. There is no medical examination on entry, and the method of joining is extremely simple, the applicant having merely to fill in a form at a postal money-order office or local office of the fund, and pay a first weekly contribution.
The following benefits are payable:—
After contributing for twelve months, a payment not exceeding £6 for medical attendance and nursing on the birth of a contributor's child or children.
After contributing for five years, an allowance, after three months' incapacity to work, of 7s. 6d. per week for each child of a contributor under fourteen years of age; payable independent of any allowances due from friendly societies. No contributions payable while in receipt of incapacity allowance.
After contributing for five years, an allowance, on the death of a contributor, of 7s. 6d. per week for each child under fourteen years of age, and 7s. 6d. for the widow so long as any child is under fourteen years of age.
On reaching age sixty, a pension of 10s., 20s., 30s., or 40s. per week, according to the scale of contributions. The receipt of a pension under the National Provident Fund Act does not affect a person's claim to the old-age pension under the Pensions Act.
The maternity allowance is payable only if the combined income of a contributor and wife or husband does not exceed £300 per annum at the time of claim, but this limitation does not debar from the other benefits. The incapacity allowance is not to exceed the pecuniary loss which, in the opinion of the Board, the contributor has probably suffered during incapacity, and the income of a contributor during incapacity, independent of the fund, is not to exceed the rate of £4 per week.
The contributions for each 10s. of weekly pension range from 9d. per week in the case of persons joining at age sixteen to 9s. 4d. per week for persons joining at age fifty.
In the event of a contributor leaving the fund or dying, all contributions (less any benefits received) are returnable. If a contributor dies before the first five years are completed his representatives receive the contributions he has paid, less anything he received during lifetime. Should he die after age sixty, before receiving in benefits a sum equal to the contributions paid in during his lifetime, the difference is returnable to his representatives; and, further, if the allowances paid for widow and children do not exhaust the contributions his representatives are entitled to the residue. If a contributor dies before age sixty, leaving a widow and no children, all the contributions are returnable, less benefits paid out.
The benefits under the Act are guaranteed by the State, which subsidizes the contributions to the extent of one-fourth of the amount paid into the fund.
An important extension of the fund was made in 1914, when it was provided that the employees of local authorities, &c., could be enrolled in the fund for superannuation purposes. A further extension was trade in 1916, whereby members of approved friendly societies were granted maternity allowances and offered annuities on reduced terms and under special tables.
In 1925 provision was made for the payment out of the National Provident Fund of retiring-allowances to nurses and other members of the permanent staffs of Hospital Boards. The National Provident Fund Act, 1926, which is a consolidation of previous legislation on the subject, imposes on Hospital Boards the obligation to contribute to the Fund on behalf of their permanent officers, and thus places Hospital Boards in a different category to other local bodies, who are empowered, but not obliged, to become contributors.
Since the inauguration of the fund in 1911, 53,497 persons (48,827 males and 4,670 females) have entered, and of these 27,734 (males 24,379, females 3,355) have discontinued for one reason or another, leaving 25,763 (males 24,448, females 1,315) on the books at the 31st December, 1925. Of 3,427 discontinuances in 1925, only 52 were on account of death and 29 on account of having attained the pension-age.
The numbers of contributors for the various pension rates as at 31st December, 1925, were as follows, male and female contributors being shown separately:—
| Pension Rate. | Males. | Females. | Total. |
|---|---|---|---|
| 10s. | 18,370 | 792 | 19,162 |
| 20s. | 2,927 | 288 | 3,215 |
| 30s. | 260 | 30 | 290 |
| 40s. | 363 | 46 | 409 |
| Other | 2,528 | 159 | 2,687 |
| Totals | 24,448 | 1,315 | 25,763 |
During the year 1925 maternity allowances aggregating £38,538 were paid out, including £31,650 claimed for members of approved friendly societies. In addition, £6,941 was granted by way of allowances to widows and children, £4,832 by way of refund of contributions on account of death, £11,851 on retirement, and £1,877 in respect of incapacity.
The growth of the National Provident Fund scheme during the fifteen years it has been in existence is indicated in the following table:—
| At End of | Number of Contributors. | Annual Rate of Contribution payable. | Amount of Fund. |
|---|---|---|---|
| £ | £ | ||
| 1911 | 550 | 3,172 | 1,826 |
| 1912 | 2,660 | 11,727 | 10,038 |
| 1913 | 5,791 | 22,719 | 29,327 |
| 1914 | 6,858 | 26,520 | 53,718 |
| 1915 | 8,101 | 31,875 | 83,000 |
| 1916 | 9,847 | 38,664 | 122,361 |
| 1917 | 12,124 | 56,707 | 176,210 |
| 1918 | 13,410 | 69,486 | 246,901 |
| 1919 | 16,154 | 91,450 | 338,729 |
| 1920 | 19,724 | 129,003 | 473,361 |
| 1921 | 21,713 | 142,269 | 632,525 |
| 1922 | 22,118 | 144,971 | 793,144 |
| 1923 | 23,230 | 158,456 | 969,946 |
| 1924 | 24,231 | 163,181 | 1,165,284 |
| 1925 | 25,763 | 175,357 | 1,377,967 |
The Revenue Account of the fund for the year ended the 31st December, 1925, is as follows:—
| REVENUE ACCOUNT FOR THE YEAR 1925. | |
|---|---|
| £ | |
| Revenue. | |
| Amount of fund at beginning of year | 1,165,284 |
| Contributions | 161,416 |
| Interest | 70,561 |
| Fines | 843 |
| Government contribution under Act | 40,636 |
| Refund of maternity claims by the State | 38,538 |
| Benefits refunded | 3,443 |
| Contributions overpaid | 18 |
| Miscellaneous receipts | 1 |
| £1,480,740 | |
| Expenditure. | |
| Maternity claims (general) | 6,888 |
| Maternity- claims (approved friendly societies) | 31,650 |
| Refund of contributions on lapse. reduction, and withdrawal | 38,715 |
| Incapacity allowances | 1,877 |
| Refund of contributions on death | 4,832 |
| Allowances to widows and children | 6,941 |
| Allowances on retirement | 11,851 |
| Refund of overpaid contributions | 19 |
| Amount of fund at end of year | 1,377,967 |
| £1,480,740 | |
The balance-sheet of the fund as at the end of the year 1925 is also given.
| BALANCE-SHEET AS AT 31ST DECEMBER, 1925. | |
|---|---|
| £ | |
* Included in Revenue Account. | |
| Liabilities. | |
| Fund as per Revenue Account | 1,377,967 |
| Claims due and in course of payment* | 3,641 |
| Refunds in suspense | 24,476 |
| Deposits on incomplete applications | 1 |
| Suspense Account | 82 |
| Contributions prepaid | 5,390 |
| Investment fluctuation reserve | 9,623 |
| £1,421,180 | |
| Assets. | |
| In hands of Public Trustee— | |
| Invested | 1,308,383 |
| Uninvested | 14,127 |
| Balance with Post Office | 3,387 |
| Balances in transit | 10,289 |
| Contributions outstanding or in course of transmission*— | |
| Contributions due but not overdue | 11,870 |
| Contributions overdue | 3,341 |
| Government subsidy due under Act* | 40,636 |
| Refund due in respect of maternity claims* | 4,330 |
| Fines due | 417 |
| Interest due | 5,655 |
| Interest accrued but not due* | 18,745 |
| £1,421,180 | |
The third (and at present the latest available) actuarial investigation of the National Provident Fund was made as at 31st December, 1919, when the valuation balance-sheet disclosed the following position:—
| MAIN FUND AND APPROVED-FRIENDLY-SOCIETIES SECTION. | ||
|---|---|---|
| £ | £ | |
| Liabilities. | ||
| Value of allowances already granted to widows and children | 14,698 | |
| Value of deferred pensions to survivors of existing contributors | 648,471 | |
| Value of return of contributions (less benefits) on death or withdrawal, in respect of past and future contributions | 208,648 | |
| Value of allowance benefits (widows', children's, and incapacity), immediate to 4,672 members, and vesting five years after entry in the case of 10,220 members | 207,077 | |
| Value of return of balance of contributions where allowances or pensions fall short of the total contributions paid, and of sundry minor benefits | 3,850 | |
| 1,082,744 | ||
| LOCAL-AUTHORITIES SECTION. | ||
|---|---|---|
| £ | £ | |
| Value of allowances already granted | 14,903 | |
| Value of prospective pensions in respect of past and future service | 420,176 | |
| Value of prospective pensions to widows and children | 55,431 | |
| Value of return of contributions on death or withdrawal | 22,762 | |
| Value of return of balance of contributions where allowances or pensions fall short of the total contributions paid, and of sundry minor benefits | 10,475 | |
| 523,747 | ||
| £1606,491 | ||
| Assets. | ||
| Accumulated funds | 338,729 | |
| Value of future contributions | 1,013,439 | |
| Value of future State subsidies (assumed to be received a year later than contributions) | 248,389 | |
| Balance (deficiency) | 5,934 | |
| £1,606,491 | ||
The assets and liabilities are seen to be virtually equal, the debit balance, however, having increased from £234 at the first triennial investigation (as at 31st December. 1913) to £5,934. The amounts required to provide maternity allowances are voted by Parliament annually, and these allowances are accordingly regarded as being outside the actuarial aspects of the scheme.
Table of Contents
LOCAL government throughout New Zealand is exercised by a number of local authorities constituted under various Acts of Parliament. These Acts provide for the creation of districts over which the local bodies exercise jurisdiction. Different types of district are distinguishable, each type being identified with a specific function or group of functions, details of which are given later in this section. Geographically, the Dominion is divided into 129 counties, which comprise its total area. Administratively, boroughs and independent town districts, which are contained within the areas of the several counties, are regarded as separate entities. From an administrative point of view, therefore, the fundamental districts are counties, boroughs, and independent town districts. Upon this foundation a considerable superstructure of districts of other types has been erected. These overlapping districts may be divided into two broad classes: (1) Districts formed from parts of counties—e.g., road districts; and (2) those which are comprised of a group of adjacent districts of other types united for a common purpose—e.g., electric-power districts. The number of local bodies actively functioning at the 31st March, 1925, was 665, made up as follows: County Councils, 123; Borough Councils, 118; Town Boards (independent), 39; Town Boards (dependent), 32; Road Boards, 35; River Boards, 38; Land-drainage Boards, 55; City and Suburban Drainage Boards, 3; Water-supply Boards, 5; Fire Boards, 43; Local Railway Boards, 5; Harbour Boards, 41; Electric-power Boards, 34; Hospital Boards, 44; Tramway Board, 1; Gas-lighting Board, 1; and Rabbit Boards, 48. In addition to the foregoing there were 18 District Councils of the Main Highways Board constituted under the Main Highways Act, 1922. These, although not local bodies in the strict sense of the word, are nevertheless intimately connected with certain aspects of local government, and have power to make recommendations of great importance.
In the 1925 number of the Year-book a special article was included covering the history and extent of local government in New Zealand. The present section contains information concerning the various classes of local authorities now in existence, setting out their natures, activities, powers, and duties. The latter portion of the section is devoted to a résumé of the finances of local authorities.
Boroughs are constituted under the Municipal Corporations Act, 1920. The Governor-General may, on the petition of not less than one-fifth of the residents qualified to vote, proclaim as a borough any part of the Dominion comprising in a continuous area not more than nine square miles, having no points distant more than six miles from each other, and having a population of not less than 1,000. The petition is referred to a Commission consisting of a Magistrate, the Commissioner of Crown Lands for the district, and the District Officer of the Valuation Department. If after due inquiry the Commission presents a report favourable to the proposal a poll is taken, and if this results in the proposal being carried the area is then constituted a borough. A borough containing a population of 20,000 or upwards may be proclaimed a city by the Governor-General, although the Corporation remains unaltered. Contiguous boroughs may be united, or adjacent town districts or road districts may be added to a borough, notwithstanding that the united borough may exceed the area or distance between points above mentioned. Any portion of a borough may be merged in another district. For purposes of representation and rating a borough may be divided into wards not exceeding five in number and each containing a population of not less than 1,000.
Any person of twenty-one years and over who possesses any one of the following qualifications is entitled to he enrolled on the district electors roll:—
Freehold qualification—meaning thereby the possessor of a freehold estate in land of the capital value of not less than £25, situated in the borough, notwithstanding that any other person is the occupier thereof.
Rating qualification—may be held by any person whose name appears as the occupier of any rateable property within the borough.
Residential qualification—twelve months' residence in New Zealand, and residence during the last three months in the borough to which the roll relates.
Occupier's qualification—a person is deemed to hold such a qualification if he is, and for at least three months last past has been, in occupation as a tenant of a tenement in the borough the rental of which is not less than £10 per annum, or as a subtenant or joint tenant of such a tenement the rental of which is at least £10 per annum for each of the several subtenants or joint tenants.
The affairs of a borough are administered by a Mayor and Council, which, where the population does not exceed 30,000, may consist of not fewer than six nor more than twelve Councillors; where the population exceeds 30,000 the number of Councillors may be not less than twelve nor more than twenty-one. The election of both Mayor and Councillors is biennial.
Generally any person whose name appears on the district roll may be elected to the office of Mayor or Councillor. The following persons, however, are incapable of being so elected:—
Any person who is not an elector.
Any person disqualified from holding the office of Mayor or Councillor under any Act.
An alien.
A person of unsound mind.
An undischarged bankrupt
A person convicted of any offence for which he has not either served his sentence or received a free pardon.
Any person holding any office or place of profit, other than that of Mayor or Deputy Mayor, under or in the gift of the Council.
Any person who is concerned or interested (otherwise than as a member of an incorporated company in which there are more than twenty members and of which he is not the general manager) in any contract made by the Council where the sum involved exceeds £5 in the case of a single contract, or £10 altogether in any financial year in the case of two or more contracts. Any interest in any lease granted or loan raised by the Council, however, does not constitute a disqualification.
The Counties Act. 1920, is the principal Act relative to this class of local body. No new county may be constituted otherwise than by the union of two or more counties, except by a special Act of Parliament. Counties are divided into ridings not exceeding twelve in number, which include road districts, town districts (dependent), and outlying districts. The affairs of a county are administered by a County Council consisting of not fewer than six nor more than twelve members, there being at least one Councillor for each riding. The Council is elected triennially by the ratepayers, the value of rateable property determining the number of votes to which an elector is entitled. Where the value of the property does not exceed £1,000, one vote is allowed; over £1,000 but not more than £2,000, two votes; exceeding £2,000, three votes.
The qualifications and disqualifications for office are practically the same as for boroughs.
Under the Town Boards Act, 1908, a town district may be constituted by the Governor-General on the petition of not less than two-thirds of the resident householders in any locality outside a borough, not exceeding two square miles in area, in which no two points are more than four miles distant, and in which there are not less than fifty resident householders. On such a petition the Governor-General may, if he thinks fit, set up a Commission to inquire as to the suitability of the proposed area for municipal control.
Town districts are of two classes, dependent and independent. A dependent town district forms part of the county in which it is situated, and is subject to the control of the County Council. Such control, however, is practically confined to the main roads and county roads therein, and the Council's power of rating as regards general rates is limited to 1 £½d. in the pound on the capital value. An independent town district is entirely free of county control and operates as a separate entity. The franchise is the same as for boroughs, although for county electoral purposes in the case of dependent districts it is that of the county—namely, a ratepaying one.
The affairs of a town district are conducted by a Town Board consisting of from five to seven members, who are elected biennially. The qualifications and disqualifications for office are the same, mutatis mutandis, as for boroughs.
Road districts are constituted under the Road Boards Act, 1908. The Council of any county has power by special order to constitute a new district from parts of existing districts situated in the county and forming a continuous area. A petition must be presented to the Council, signed by two-thirds of the ratepayers of the area concerned, and setting forth the boundaries of the proposed new district. The petition must be publicly notified not less than one month before presentation to the Council. The affairs of a road district are managed by a Board consisting of not fewer than four nor more than nine members elected triennially by the ratepayers of the district. The franchise and the qualifications and disqualifications for office are the same as for counties.
River districts are constituted under the River Boards Act, 1908. On the petition of a majority of the ratepayers of any part of New Zealand which is bounded or intersected by any river or rivers likely to cause damage by overflow the Governor-General may proclaim such part to be a river district. The petition must describe the boundaries and areas of the proposed district, and must be publicly notified not less than one month before presentation.
The business of a river district is managed by a River Board consisting of not fewer than five nor more than nine members elected triennially. The qualifications and disqualifications for office, as well as the franchise, are the same as for counties.
On the petition of a majority of the ratepayers in any part of the Dominion the Governor-General may constitute that part to be a land-drainage district. No borough or part of any borough shall be included in any such district. On a similar petition any district may be abolished, or any area may be added to or excluded from the district.
The management of a land-drainage district is conducted by a Board of Trustees consisting of not fewer than five nor more than seven members elected in the same manner and for the same term as members of a County Council. The qualifications and disqualifications for office are the same as for counties.
In addition to the carrying-out of drainage-works by a Drainage Board, the Counties Act, 1920, provides that a County Council may declare by special order the whole of the county or portion thereof to be a district for the purpose of the construction of drainage-works therein. The boundaries of such district may be altered by any subsequent special order. The above special orders may be made only on presentation of a petition signed by not less than two-thirds of the ratepayers within the proposed district.
In any such district the Council may purchase or make, and maintain or enlarge, and from time to time alter, extend, or repair, any drainage-works.
Under the Water-supply Act, 1908, the Council of any county may by special order declare the whole county or any part thereof to be a water-race district. Before making such an order the Council shall cause a plan of the proposed district to be deposited in its office for inspection by the general public, at least fourteen days before the adoption of the resolution to make the special order. No town district shall be included unless on a separate petition signed by at least one-half of the ratepayers representing at least three-fifths of the rateable value of the rateable property of the town district.
Where the Counties Act is not in force the Governor-General may, by Proclamation on receipt of a resolution passed by any two or more Road Boards representing adjoining districts, declare the whole or any part of such road districts to be a water-supply district.
The affairs of a water-supply district are administered by a Water-supply Board consisting of not less than five nor more than nine members, of whom at least one and not more than three shall be elected by each component road district.
The qualifications and disqualifications for office are the same as for counties, and the term of office is for three years.
These districts are constituted by special Act of Parliament. Each district is defined by its enactment, and consists of a number of adjoining local authorities with a large city as the centre.
A Drainage Board administers the affairs of each district, and is elected by the electors of the component districts.
The only tramway district now in existence, which consists of a number of adjoining local districts, is also constituted by special enactment.
The management of affairs is entrusted to a Tramway Board consisting of nine members elected triennially on a franchise similar to that of boroughs. The qualifications and disqualifications for office are also the same as for boroughs.
On the petition of not less than one-fourth of the ratepayers of any continuous area, the Governor-General may, if he thinks fit, proclaim a railway district. The petition must describe the boundaries of the proposed district, and be publicly notified, not less than one month before presentation, in a newspaper circulating within the district.
Administration is placed in the hands of a Railway Board of from five to nine members elected triennially by the ratepayers.
The qualifications and disqualifications for office are the same as for boroughs.
Any area may be constituted an electric-power district by the Governor-General on the petition of one-fourth of the ratepayers of the proposed district. The petition must contain a description of the boundaries of the area; the names of the counties, boroughs, town districts, and road districts included in the area; the number of ratepayers, and the value, improved and unimproved, of all rateable properties within such constituent districts; and the number of members proposed to constitute a Board. Public notification of the petition must be given in a newspaper circulating within the district, not less than one month before presentation, and a copy of the notice served on the local authority of each component district. Before proclaiming a district, the Governor-General may make such alterations in the boundaries as he thinks fit.
The affairs of an electric-power district are administered by a Board consisting of not less than five nor more than nine members elected triennially by the electors of the constituent districts. The qualifications and disqualifications for office are the same as for boroughs.
The most important harbours in New Zealand are controlled and managed by public bodies known as Harbour Boards, which are constituted by special Act of Parliament in subordination to a general Act. The special Act of constitution fixes the number of members for each Board, which varies from six to fifteen.
Accession to office may be in three different ways—(1) Election by the electors of the constituent counties, boroughs, road districts, or town districts forming a specially constituted harbour district, in which case the term of office is the same as for members of the local authorities of the constituent districts; (2) appointment by the Governor-General for a term of three years; (3) election by shipowners and payers of dues.
The qualifications and disqualifications for office are the same as for boroughs.
On the request of the Council of any county bordering on any navigable river, estuary, or arm of the sea, not under the control of a Harbour Board, the Governor-General may, by Order in Council gazetted, declare that such County Council shall exercise all the powers of a Harbour Board, and shall be deemed to be a Harbour Board, as if constituted by special Act.
The Dominion is divided into eighteen main highway districts, each consisting of a number of complete counties. The District Council for each district consists of one representative from each of the constituent counties, with the District Engineer of the Public Works Department.
The existing hospital districts are constituted under the Hospitals and Charitable Institutions Act, 1926 (a consolidating statute), and no new district may be created, otherwise than by the union of two or more districts, except by special legislation. The management of affairs is entrusted to Hospital Boards, consisting of one or more representatives of each of the districts comprising the hospital area. Members are elected at the ordinary general election of the contributory authorities. The qualifications and disqualifications for office are practically the same as for boroughs.
The Governor-General may, by Order in Council, on the application of any Borough Council, County Council, Town Board, or Road Board, declare the district within the jurisdiction of such authority to be a fire district. No application may be made unless the population of the district exceeds 1,000, and unless a proposal for constituting such a district has been carried by a majority of the ratepayers at a poll held for the purpose. The affairs of a fire district are administered by a Fire Board consisting of five members, of whom one is appointed by the Governor-General, two are elected by the contributory local authority, and two by the fire-insurance companies carrying on business within the district. Where the population of the fire district is over 20,000, the Board may be increased to seven members, one of the two additional members being elected by the local authority concerned and the other by the fire-insurance companies. The elections are biennial, and the qualifications and disqualifications for office are practically the same as for other local authorities.
Provision is also made for the constitution of united fire districts on the application of two or more authorities, provided the population of the united area exceeds 2,500 and the proposal has been approved by a majority of the ratepayers at a poll held in each district. The Board then consists of one member appointed by the Governor-General, one by each of the uniting authorities (with provision for two in case of any particular body where this is agreed to by the uniting local authorities), and a number by the insurance companies equal to the total number appointed by the uniting authorities.
Rabbit districts may be constituted in three different ways:—
On the petition of a majority of the stockowners of any area, each owning or in charge of more than one hundred sheep or twenty head of cattle, the Governor-General may, by Order in Council gazetted, declare a rabbit district. The management of affairs is entrusted to a Board of Trustees consisting of six members, one of whom must be the Government Inspector of Stock in charge of the district in which the rabbit district is included. The remaining five are elected triennially by the stockowners, who may exercise from one to five votes according to the number of stock owned. Any stockowner who possesses a voting qualification is eligible for office. The following are incapable of being elected trustees:—An undischarged bankrupt.
A person attainted of treason or convicted of crime punishable by imprisonment with hard labour for three years or upwards, or convicted of perjury or of any infamous crime. A person of unsound mind.
A person pursuing the occupation of destroying rabbits.
On the petition of a majority of the ratepayers of any area not less than 2,000 acres in extent and containing the holdings of not less than ten ratepayers, the Governor-General may, by Order in Council gazetted, declare a rabbit district. Administration is conducted by a Board of Trustees consisting of from six to eight members, of whom one must be the Inspector of Stock for the locality. The qualifications and disqualifications for office are the same as for County Councils, and the term of office is for three years.
The Governor-General has also power to declare a rabbit-proof-fencing district on the petition of a majority of the ratepayers of any area comprising not less than 1,000 acres and containing not less than. three ratepayers. The Board of Trustees consists of from three to seven members, and is elected triennially. The qualifications and disqualifications for office are the same as for County Councils.
The affairs of the one district in existence are managed by a Gas-lighting Board of seven members. The electors of each of the two boroughs included in the district elect three members biennially at the municipal elections, the seventh member being appointed by the elected members, or, in the event of their failing to agree, by the Governor-General in Council. The franchise and the qualifications and disqualifications for election are the same as in the case of boroughs.
Local authorities in New Zealand derive their powers from the Acts under which they are constituted, and also from special empowering Acts. In nearly all cases there is a general Act under which all authorities of the same type are constituted. In the case of Harbour Boards there is, in addition to a general Harbours Act, a special Act for each Board, which is subordinate to the general Act.
Certain types of local authority—City and suburban drainage districts, local railway districts, the tramway district, and the gas-lighting district—derive their principal powers from special constituting Acts.
Local authorities are empowered to raise special loans for the construction of any public work, the purchase of land or buildings, or for engaging in any undertaking which a local authority may lawfully enter into. The consent of the ratepayers must first be obtained by means of a poll, and if at least three-fifths of the valid votes recorded are in favour of the proposal it is deemed to be carried. Notices of the result of the poll must be gazetted.
In the case of boroughs and town districts a bare majority only is necessary.
In order that local authorities may enjoy the credit of the State and a low rate of interest, the State Advances Board is empowered to grant loans on debentures issued by local authorities for a period not exceeding fifty years, principal and interest to be repaid by equal half-yearly instalments. The Board is restricted to lending money for the construction of roads, streets, bridges, waterworks, drainage and sanitary works, and workers' dwellings. In addition, no local authority may receive more than £60,000 within three years.
For the further benefit of local bodies the Governor-General may, on the recommendation of the Superintendent of the State Advances Board, guarantee the loan of any local authority. The total amount guaranteed for all bodies in one year must not exceed £2,000,000.
As explained later on in this section, much of the revenue of local authorities is derived from rates, and the rating-powers of the various classes of authorities are defined by statute. Three broad classes of rates are distinguished:—
General—for general purposes.
Separate rates are levied for the construction of public works, for the acquisition of land or buildings, or for engaging in any undertaking for the benefit of the whole or part of a local district.
A special rate is imposed to secure the repayment of loan-money, being sufficient to produce interest and sinking fund, or interest and instalment of principal, as the case may be. Special rates can be levied only by resolution gazetted.
The maximum rating-powers of each type of local authority are set out in detail farther on in this section. Some classes (e.g., Harbour Boards) have no rating-powers except under the authority of a special Act. Hospital Boards do not have powers to rate, but obtain part of their revenue from contributory local bodies, which impose rates for the purpose.
The several local authorities may make by-laws for the effective carrying-out of the provisions of the Acts relating to them. Various classes of by-laws require to be approved by the Governor-General or by a Minister of the Crown, as the case may be. Provision is also made in the By-laws Act, 1910, for the confirmation of by-laws by the Minister of Internal Affairs. The certificate given by the Minister confirms the actual making of the by-laws, and it is not necessary when giving any such certificate to consider whether the provisions of the by-laws are repugnant to the laws of New Zealand, or unreasonable, or ultra vires of the local authority by which they are made.
The Local Authorities Superannuation Act, 1908, provides that any local authority may by special resolution establish a superannuation fund for the benefit of persons in the service of that local authority. The resolution does not take effect until confirmed by the Governor-General in Council, and such resolution must specify what class of employees is entitled to become contributors to the fund, and what class, if any, shall be bound to become contributors, and the amount the local body undertakes to pay into the fund by way of subsidy.
Any two or more local authorities may establish a united superannuation fund. Contributions towards the fund are made by a contributor on a percentage of his salary ranging from 5 to 10 per cent., according to his age on joining the fund.
On retirement from the service of the local authority a contributor may be paid an annual allowance not exceeding two-thirds of his salary in proportion to the length of service of the contributor. If a contributor or annuitant dies, an annual allowance may be paid to the widow or children of the deceased person.
Local authorities are required to keep their accounts in the manner prescribed by the Act under which they are created. They are also obliged to furnish statistics to the Government Statistician when called upon to do so.
Under the Health Act, 1920, every local authority is obliged to do everything necessary to promote and conserve the public health within its district, and when directed by the Board of Health must provide sanitary works, appoint sanitary inspectors, furnish reports to the Health Officer, and make any necessary by-laws.
For the prevention of fires every Borough Council is required to fix fire-plugs in the main pipes of the waterworks in the borough, at distances not more than 100 yards from one another.
Local authorities have general powers of entering into contracts for any of the purposes for which they are constituted; of selling and leasing land; and of taking or purchasing any land which may be necessary or convenient for any public work.
Special functions and powers of the various classes of local authorities are mentioned in the following paragraphs.
The principal function of a County Council is the construction, maintenance, and control of roads within the county, and the bridges connected therewith. Power is given to undertake water-supply and drainage works, supply electric lighting and power, establish markets, construct or acquire harbour-works, erect workers' dwellings. and initiate other public services which the Council considers beneficial.
Borough Councils exercise full control in the construction and maintenance of streets and footways. Particular powers are given in regard to drainage and sanitation, water-supply, libraries, baths, cemeteries, workers' dwellings, and other public utilities. In addition, Councils may enter into such businesses as the supply of gas and electric lighting and power, public conveyance, &c. Councils may make such by-laws, subject to the Municipal Corporations Act, as are necessary for the good government of the borough.
Town Boards exercise most of the powers and functions of Borough Councils. This is especially true of Boards independent of county control. In the case of dependent town districts the County Council has control of the main roads therein. and has power to levy a general rate up to 1 ½d. in the pound on the capital value of the rateable property of the district.
A Road Board has the care and management of all district roads within its district, and has full power to construct, improve, and maintain all such roads and the bridges and ferries thereon. Power is also given to construct and maintain such drainage, irrigation, or water-supply works as are considered beneficial to the district.
All rivers, streams, and watercourses within any river district are subject to the jurisdiction of the Board so far as may be necessary for the construction or maintenance of any works required to prevent any possible damage which may result from overflow or from the breaking of banks.
The Board may, without any previous agreement with the owner or occupier of any land, take possession after twenty-four hours' notice.
Drainage Boards have power to maintain in a state of efficiency any watercourse, or bank or defence against water, to effect any improvements thereto, or to make any new works necessary for the drainage of the district. Power is given to purchase land and to enter upon any land without any previous agreement with the owner. provided twenty-four hours' notice is given.
A Water-supply Board has power to enter upon any lands through which any of the water-races under its control run, for the purpose of constructing works and carrying out any necessary repairs, and generally to control the water-races in the district as it deems best for providing a water-supply.
The powers and functions of City and Suburban Drainage Boards are determined by special enactment, and do not differ substantially from those given under “Land Drainage Districts.”
The powers and functions of the one Tramway Board in existence are laid down by its special Act, and follow generally those conferred on municipalities in relation to tramways. Power is given to supply electricity to the Government and to local authorities, and in certain cases to individuals; to run drags; and to work quarries.
The consent of the Governor-General in Council is necessary before a Board enters upon the construction or acquisition of a railway. When authorized to commence the work the Board may enter upon and take such land as is necessary for the work. The Board has power, subject to the terms of the order authorizing the railway, to make by-laws fixing fares, freight, and storage rates, and generally for regulating the traffic on the railway, and the conduct of all persons employed thereon
Electric-power Boards have power to construct all works necessary for the generation and transmission of electric energy, to acquire water rights, to purchase electric energy in bulk, and to sell electric energy in bulk or otherwise. Power is also given, with the consent of the Governor-General in Council, to establish electrochemical, electro-metallurgical, or other industries especially adapted to the use of electricity.
A Harbour Boar£ empowered to do any of the following:—
Construct and maintain any works necessary for the improvement, protection, management, or utilization of the harbour, such as wharves, piers, jetties, docks, slips, breakwaters, excavations, &c. (reclamation of land may also be undertaken, but this requires the sanction of a special Act of Parliament):
Build warehouses, sheds, and other structures necessary for the accommodation of goods shipped or unshipped at the harbour:
Erect and carry on freezing-works and cool chambers:
Provide cranes, public weighbridges, and other requisite appliances:
Carry on the business of wharfinger or warehouse-keeper:
Provide for the storage and conveyance of fuel oil, and for the supplying of water for shipping purposes.
Harbour Boards are also empowered to enact by-laws relating to a wide range of activities. The most important have reference to—
The mooring, anchoring, and laying-up of vessels:
The landing of passengers; the unshipping, warehousing, stowing, and depositing of cargo:
The levying and collecting by the Board of fees, tolls, dues, and other charges on vessels and goods:
The general regulation of the use of such utilities as wharves, docks, cranes, buildings, &c.:
The control of pilotage operations within the harbour.
The by-laws must not conflict with the general Harbour Regulations which the Governor-General is empowered to make, and are subject to the Governor-General's right of veto at any time within six months.
Each District Highway Council is required each year to submit to the Main Highways Board recommendations as to the following:—
Any public highways within the district which it considers should be declared main highways:
The works of construction, reconstruction, maintenance, or repair of highways to be undertaken during the year, and whether such should be undertaken by the Board, or by the several local authorities of the district, or by any two or more of them, on behalf of the Board.
It shall also submit with its recommendations (a) an estimate of the amount required during the year for the works recommended, and (b) a scale showing the amounts to be paid to the Board by the several local authorities where the work is to be undertaken by the Board, the amounts to be paid by the Board to the several local authorities where the work is to be undertaken by such local authorities, and the amounts to be paid by the several local authorities to any other local authority for any work to be undertaken by the latter.
A Hospital Board has power to establish, control, and manage any of the following institutions: Hospitals, charitable institutions, maternity homes, convalescent homes, sanatoria, habitual inebriates' homes, reformatory institutions for the reception of women and girls, and any other institutions for any purpose which the Governor-General by Order in Council may declare to be a public charitable purpose. It may also make by-laws, subject to the approval of the Minister of Health, regarding all matters affecting the management, care, control, and superintendence of any institution under its jurisdiction.
It is the duty of every Hospital Board to provide and maintain such hospitals as the Inspector-General of Hospitals considers necessary in any part of the district for (a) the reception, relief, &c., of any persons suffering from infectious diseases; (b) the reception, &c., of persons suffering from other than infectious diseases.
Fire Boards have power to establish and maintain fire brigades as they think fit. They may also use, free of charge, the water-mains, &c., of any local authority having jurisdiction in the fire district. Power is given to make by-laws, the chief of which have reference to the enrolment and control of volunteer fire brigades; the establishment of fire-alarm circuits; the regulation of the storage of kerosene, explosives, and other inflammable substances; and the payment of inspection fees. A Fire Board may also direct that the coroner hold an inquest on any fire in its district.
A Rabbit Board is empowered to do all things that appear necessary to ensure the destruction of rabbits in the district or to prevent the increase of rabbits therein, and for that purpose may offer rewards or bonuses for the destruction of rabbits, or pay for the erection and maintenance of protective fences. Power is given to enter upon Crown or private lands after seven days' notice, and to construct any rabbit-proof fences considered necessary. The Board may also direct the destruction of rabbits in any areas within the district, and, failing compliance with such order, may take measures itself to cause the destruction, and charge the cost thereof to the occupies£ of the land.
This district was created to provide for the extension of the gas supply of one borough to an adjacent borough. The Act of constitution vests in the Board the whole of the property of both Borough Councils used for the supply of gas, the Board being required to issue debentures in exchange. The Board has the same powers as a Borough Council in regard to the manufacture and sale of gas.
The local authority of any district (other than a district wherein the system of rating on the unimproved value is in force) may from time to time by resolution determine whether the system of rating or the annual value or the capital value shall be in force in the district. The system of rating on the unimproved value can be adopted only by a poll of the ratepayers, and after three years the ratepayers may, by another poll, revert to the system previously in force in the district.
When the union of two or more boroughs takes place the rating system in force in the borough having the largest population is to be observed throughout the united borough, unless otherwise agreed between the Councils of the boroughs concerned.
The system of rating in the Dominion is upon the basis that 1s. in the pound on the annual value is deemed to be equivalent to ¾d. in the pound on the capital value of rateable property; or where in a district not rating on the annual value it is necessary for any purpose to ascertain the annual value of any rateable property, then the annual value thereof is equal to 6 per cent. of the capital value of such property. Rating on the unimproved value must be so adjusted as to equal as nearly as may be, but not to exceed, in producing-capacity the limit of rating-power on the capital or annual value, as the case may be, a rate on the annual value being for this purpose first transposed into one oft the capital value on the basis above mentioned.
Prior to 1911 the system of rating on the unimproved value did not apply to water rates, gas rates, electric-light rates, sewage rates, or hospital and charitable-aid rates, which could be levied on the annual or capital value only; but by the Rating Amendment Act, 1911, now incorporated in the Rating Act, 1925, it was provided that the system should apply to these rates. This provision is not retrospective, but a poll in any district where the system was previously in force is, on petition, to be taken on the proposal that it shall apply to them.
The annual value is deemed to be the letting-value, less 20 per cent. in case of houses, buildings, and other perishable property, and 10 per cent. of land, but in no case is the rateable value to be less than 5 per cent. of the value of the fee-simple. The capital value is deemed to be the selling-value of the land, including improvements, at the time of valuation. The unimproved value is deemed to be the selling-value of the land at the time of valuation, excluding the value of any existing improvements.
Local authorities are largely dependent for funds to carry out their activities on revenue from rates, and even loans raised for special purposes are ultimately liquidated by such revenues–known then as special rates. As, however, the revenue from rates is not usually received till about half of the financial year has elapsed, the law has for many years allowed local bodies to borrow money in anticipation of the year's revenue. This borrowed money in many cases tended to become a permanent debt, and from time to time power had to be given to local bodies to raise a loan for the purpose of paying off such debts. This was done in 1913, but since then the debts again accumulated, and many local bodies were in financial difficulties. Consequently, in 1921, the Legislature dealt with the matter by passing the Local Bodies' Finance Act, 1921–22, which compelled any local body which had an overdraft or temporary deposits to capitalize its liability, forming what is known as an “antecedent liability,” and to pay off this liability either (a) by seven annual instalments out of revenue, or (b) by a direct loan, or (c) by levying a special rate in each of seven years sufficient to cover each annual instalment. The powers of a local body to borrow by overdraft or by temporary deposit were also limited to three-fourths of its total revenue for the preceding year, and at the end of a year there is not to be owing a greater sum than the amount of revenue then outstanding. This will, of course, compel local bodies to live within their income, and will also ensure that money borrowed by overdraft or temporary deposit will simply be a temporary expedient in anticipation of revenue.
A synopsis of the statutory rating-powers of the various local authorities is now given.
Under the Municipal Corporations Act, 1920, cities and boroughs have conferred on them the following rating-powers, which represent, the maximum a Council is empowered to levy in any one financial year:—
General Rate.—2s. 6d. in the pound on the annual value, or 2d. in the pound on the capital value of all rateable property, or its equivalent on the unimproved value. In divided boroughs the rate levied may vary in different wards, but must not in any case exceed the above limit.
General Separate Rates for Special Works.—¾d. in the pound in any one year on the capital value, or 1s. in the pound on the annual value, or its equivalent on the unimproved value of the rateable property. These rates can be made only on a petition of a majority of the ratepayers, and are known as general separate rates, in contradistinction to particular separate rates now immediately referred to.
Water-supply.—Ordinary supply, 10s. per annum where the annual value does not exceed £12 10s.; in excess of £12 10s., 6 per cent. Where rating on unimproved value in respect of water-supply is in force the charge must not exceed the equivalent of 1d. in the pound on the capital value, with a minimum of 10s. Half-rates only are to be levied on stores or warehouses, and all land and buildings to which water can be but is not supplied, situate within 100 yards from any part of the waterworks. The rate or charge for extraordinary supply may be fixed by the Council.
Lighting Streets and Public Buildings.—6d. in the pound on the annual value.
Sanitation.—A rate, or in lieu thereof a uniform annual fee, may be levied of such an amount that the total proceeds shall be sufficient to meet the estimated expenditure on the service for the year.
Drainage.—6d. in the pound on the annual value of property served by a public drain.
Library.—1d. in the pound on the annual value.
Harbour.—Any Council appointed a Harbour Board may, for the purpose of constructing or maintaining harbour-works, levy a rate not to exceed in any one year ¾d. in the pound on the capital value.
In addition to the rating-power referred to above, certain Acts of the Legislature have conferred powers on Borough Councils to levy further separate rates for the purposes now indicated.
Hospital and Charitable Aid.—Under the Hospitals and Charitable Institutions Act, 1926, section 52, a rate sufficient to produce the amount of contribution for which the borough may be liable.
Fire.—By the Fire Brigades Act, 1926, section 30, a Borough Council within a fire district may, in order to raise the amount required to be contributed to the Fire Board, levy a separate rate, on the value of the buildings only, within the fire district.
Small-birds Nuisance.—Borough Councils are by the Injurious Birds Act, 1908, section 18, empowered to raise funds for the destruction of injurious birds by levying a general rate not exceeding 1/16d. in the pound on the capital value, or its equivalent on the annual or unimproved value.
Health.—The Health Act, 1920, section 140, enables a separate rate to be levied to meet the expenses of carrying out the provisions of the Act.
Special Rates (Payment of Loan Charges).—Rates under this head are termed “special,” and are levied for the purpose of producing interest, or interest and sinking fund, upon any special loan. They are not limited by statute. A special rate shall be made a continuing rate for a period of years equal to the currency of the loan. With certain exceptions no special loan may be raised without the consent of a majority of the ratepayers affected. Special rates are subject to the provisions of the Local Bodies' Loans Act, 1926.
In certain exceptional cases a Council's power may be subject to one or more of the three conditions referred to below.
Increase of Rating-power authorized where Revenue lost in consequence of the Reduction or Prohibition of Licenses.—A Borough Council which suffers loss of revenue from license fees under the Licensing Act in consequence of the reduction or prohibition of licenses in the district may, by section 41 of the Licensing Act, 1908, make good such loss by an equivalent sum to be levied and collected by an increase of the general rate in the district.
Rates on Native Land.—By the provisions of Part II of the Rating Act, 1925, Native land that has become freehold and is held under individual title is liable to full rates, subject to certain exemptions. Lands held by Natives under Native custom are, however, totally exempt from rating.
Rating of Mining Property in the South Island.—All mining property held by an occupier in any borough within a mining district in the South Island of the Dominion is liable to be rated by the Borough Council in the same manner as other rateable property in the district, but subject to special provisions of the Rating Act, 1925, sections 48 to 50.
The maximum general and separate rates that may be levied by the Board of a town district in any one year are set forth in the Town Boards Act, 1908, and amendments, indicated below.
General Rate.—By the Finance Act, 1921, section 34, a Town Board may levy a rata of 2d. in the pound on the capital value or its equivalent on the unimproved value, or 2s. 6d. in the pound on the annual value. In the case of town districts which are also subject to county control, however, the County Council has power to levy in addition a general rate up to 1 ½d. in the pound on the capital value.
Particular Separate Rates.—On petition from a majority of the ratepayers in any portion of the district for a special work to be undertaken, the Board may by special order define such portion and make and levy a separate works rate not exceeding in any one year 1s. in the pound on the annual value or its equivalent.
The provisions of the Municipal Corporations Act, 1920, relating to water-supply, lighting, sanitation, drainage, and library rates, as already referred to under the head of “Boroughs,” apply equally to town districts. In like manner Town Boards may levy separate hospital and charitable-aid, fire, small-birds nuisance, and health rates under the statutory provisions indicated.
Special Rates.—The powers of Town Boards are the same as those of Borough Councils.
In the same way as they operate in boroughs the provisions relating to the rates on Native land, rating on mining property in the South Island, and the increase of the rating-power consequent on reduction or prohibition of licenses apply to town districts.
Most of the provisions relating to the rating-powers of County Councils are included in the Counties Act, 1920. These are now briefly referred to.
General Rate.—In counties where there are no road or town districts a maximum rate of 3d. in the pound, or where there are road or town districts 3d. in the pound in outlying districts, and in all other parts of the county 1 ½d. in the pound on the capital value of rateable property, or its equivalent on the unimproved or annual value. The total amount of the general and separate rates together, however, must not exceed the maximum rate above, with the exception that the drainage rate may be additional to the maximum mentioned.
Special-works (Separate) Rates.—These rates may be levied on the county or a portion of the county upon a majority petition of ratepayers; the total amount that may be levied in one year is ¾d. in the pound on the capital value or its equivalent.
Particular separate rates which may be levied by County Councils refer to the following matters:—
Water-supply and Drainage.—For the purposes of any constructional work a rate of 1d. in the pound on the capital value on the county or subdivision, as the case may be. To provide for maintenance after construction a rate of ¾d. in the pound may be levied.
Sanitation and Harbours.—The provisions relating to boroughs apply, mutatis mutandis, to counties.
Library.—1d. in the pound on the annual value or its equivalent. The rate is levied by virtue of the Libraries and Mechanics' Institutes Act, 1908, and applies only whore the library is managed by the County Council.
Other Separate Rates.—The expenses of a county in connection with lighting, &c., which come within its jurisdiction are met from either the General Account of the county or the Separate Accounts of the ridings. In regard to hospital and charitable-aid, health, injurious-birds, and fire rates, the provisions of the statutes as noted above under the head of “Boroughs” apply.
Special Rates.—The provisions of the Local Bodies' Loans Act, 1926, apply in the same manner as indicated for Borough Councils above. Special rates to provide interest, or interest, and sinking fund, on loans are not limited by statute as to amount.
Bridge Rate.—In addition to other special rating-powers referred to a special rate of ¾d. in the pound on the capital value may be levied under section 24 of the Local Bodies' Loans Act, 1926, for reconstruction of bridges.
In the same way as they operate in boroughs the provisions relating to the rates on Native land, rating on mining property in the South Island, and the increase of the rating-power consequent on reduction or prohibition of licenses apply to counties.
For the main statutory provisions in regard to the rating-powers of Road Boards it is necessary to refer to the Road Boards Act, 1908. A summary of these, as amended by various statutes, is given below.
General Rate.—1 ½d. in the pound on the capital value or its equivalent on the unimproved value, or 2s. in the pound on the annual value, as the case may be. In the event of a Receiver being appointed, the power is extended by 3/8d. in the pound if the Counties Act is suspended, or 3/16d. in the pound if the Act is in force, upon the capital value.
Separate Rates (in Subdivided Road Districts).—May be levied over any or every subdivision of the district, but must not, together with the general rate, exceed the limit of 1 ½d. in the pound on the capital value or its equivalent.
Special Rates for Particular Works.—¾d. in the pound on the capital value over the whole or any portion of the district.
Water-supply for Domestic Use and Irrigation.—Water-supply is according to the scale prescribed for boroughs, as indicated above. This applies only to certain Road Boards specially authorized. With regard to irrigation, the provisions of the Water-supply Act, 1908, and amendments provide that where the Counties Act is not in operation, or is suspended, two or more adjoining road districts may amalgamate for the purpose of forming a water-supply district, with the full rating-powers of such districts. Any Road Board which had constructed water-races or irrigation-works prior to 1891 may continue to exercise in this respect the same rating-powers as a County Council.
Library.—1d. in the pound on the annual value or its equivalent, only where the public library is managed by the Road Board in terms of the Libraries and Mechanics' Institutes Act, 1908.
Harbour.—Should a Road Board be declared a Harbour Board, it may, by consent of the ratepayers, levy a special rate for the construction or maintenance of harbour-works, such rate not to exceed in any one year 3/8d. in the pound on the capital value or its equivalent.
Other Particular Separate Rates.—The provisions of special statutes with regard to hospital and charitable-aid, health, injurious-birds, and fire rates apply to road districts in the same manner as to boroughs.
Special Rates.—The powers of Road Boards are the same as those of Borough Councils.
In the same way as they operate in boroughs the provisions relating to the rates on Native land, rating on mining property in the South Island, and the increase of the rating-power consequent on reduction or prohibition of licenses apply to road districts.
General and Separate Rates.—The Electric-power Boards Act, 1925, provides that when the expenditure of a Board exceeds the amount of income in any year the balance, or part of it, may be raised by a general or separate rate over the whole or part of the district. The Power Board may collect the rate itself, or may request the local authority in whose district the rate is levied to recover the amount on its behalf.
Special Rates.—.The provisions of the Local Bodies' Loans Act, 1926, apply to Power Boards, and the Electric-power Boards Act, 1925, also allows of a uniform rate being levied over the whole district to secure money borrowed for the preliminary work and expenses of a Board.
For any purpose connected with a harbour, or for interest, or interest and sinking fund, on loans, authority is contained in sections 82 and 83 of the Harbours Act, 1923, to levy a rate not exceeding the maximum specified in any special Act authorizing the Board to levy a rate, or, if no such limit is fixed, a maximum rate of ¾d. in the pound on the capital value, or its equivalent on the annual or unimproved value.
General Rate.—By section 87 of the River Boards Act, 1908 (and amendments), a River Board may levy a general rate of 1 ½d. in the pound on the capital value or its equivalent, leviable on a uniform scale or graduated according to the classification of lands in the district.
Separate Rates.—These shall not, together with the general rates levied, exceed the amount limited in respect to general rates.
Special Rates.—Not limited by statute as to amount; may be levied to secure the interest and provide a fund for the repayment of loans.
General Rate.—The Land Drainage Act, 1903, section 31, provides for the levying of a general rate, according to the classification of the lands in the district, not exceeding 1 ½d. in the pound on the capital value. By the Amendment Act of 1913 this rate may be increased to 3d. in the pound on a ratepayers' petition representing a majority of three-quarters in number and half in rateable property.
Special Rates.— As in the case of river districts.
Special Rate.—By the Water-supply Act. 1908, section 34, a special rate may be levied on all lands in a water-supply district or subdivision to pay interest and provide for the repayment of any loan. The rate is levied according to a classification of the rateable lands.
The special Act of constitution for each district fixes a maximum general rate, which varies from district to district. Provision is also made for raising special rates to secure the repayment of interest and sinking fund on loans.
The Local Railways Act, 1914, provides that in any year in which the estimated expenditure of a Board exceeds the estimated income, the deficit shall be made good by a rate on all rateable property within the district. Rating is levied on a graduated scale according to land-classification, which is based on varying benefits accruing from the railway.
The District Councils for these districts have no rating-powers, but have power to recommend to the Main Highways Board as to what proportion of the proposed expenditure each year shall be borne by each constituent County Council.
No rating-powers are given to Hospital Boards, but under the Hospital and Charitable Institutions Act, 1926, the estimated net expenditure of a Board is apportioned by the Board among the contributory local authorities within its district in proportion to the capital value of the rateable property in each contributory district.
As in the case of the previous type of local authority, Fire Boards have no rating-powers, but derive a certain proportion of their revenue from contributory local authorities.
Where the Board is elected by the stockowners a maximum general rate of 1d. per sheep and 5d. per head of cattle is permitted; provided that where such a rate would produce less than 10s. a maximum of 10s. may be levied. A Rabbit Board elected by the ratepayers may levy up to 1d. in the pound on capital value, with a maximum of 1s. per acre for each holding affected. A Rabbit-proof Fencing Board may levy a general rate of ¼d. in the pound on capital value.
The Rating on Unimproved Value Act, 1896, was passed by the General Assembly to afford local bodies the opportunity of adopting the principle of rating which is expressed in the title of the measure. The Act is now incorporated in the Rating Act, 1925. It is entirely at the option of the bodies to adopt the system, and provision is made for a return to the old system of rating, if desired, after three years' experience of the new one. The Act provides that a proportion of the ratepayers on the roll, varying from 25 per cent. where the total number does not exceed 100, to 15 per cent. where the number exceeds 300, may by demand in writing, delivered to the Chairman or Mayor of the district, require that a proposal to rate property on the basis of the unimproved value may be submitted to the ratepayers, whose votes shall be taken between twenty-one and twenty-eight days after delivery of the demand. The poll is to be taken in the same manner as in the case of a proposal to raise a loan in the district under the Local Bodies' Loans Act, 1926.
Under the original Act it was necessary for a minimum number of one-third of the ratepayers to vote, and a majority of their votes carried the proposal. Now the question of adoption or otherwise is decided by a bare majority of the valid votes recorded, irrespective of the number of ratepayers who have voted.
A rescinding proposal can be carried at a poll by the same means as one for adoption, but not until after three years have elapsed; and, vice versa, rejection of a proposal bars its being brought forward for a similar period.
The valuation roll is supplied to the local authority by the Valuer-General under the provisions of the Valuation of Land Act, 1925, and the definitions of “capital value,” “improvements,” “unimproved value,” and “value of improvements” found in that Act apply also to rating on unimproved value. Provision is made for adjustment of rating-powers given under previous Acts by fixing equivalents. Thus a rate of 1s. in the pound on the annual value under former Acts is to be considered equal to ¾d. in the pound on the capital value.
The adjustments are to be made so that the rates on the unimproved value shall be such as to produce as much as, but not more than, the rates under the Rating Act, 1925. For instance, supposing a local authority has a rating-power up to ¾d. in the pound on the capital value, then it can levy any rate in the pound on the unimproved value of land in its district so long as the producing-capacity of such rate is not greater than would be the producing-capacity of a ¾d. rate on the capital value of the district. When a fixed rate, under the older system of rating, is security for a loan, the Controller and Auditor-General is given power to fix the new rate himself if of opinion that the new rate on the unimproved value does not afford equally good security as the one to be given up.
It should be noted that some local authorities automatically adopt rating on unimproved value. For example, a town district, borough, or another county formed from part of a county which itself rates on unimproved values, automatically rates on the system in force in the county; also two boroughs amalgamating adopt the system in force in the district with the greater population, unless their Councils agree to the contrary.
Local districts in which a poll on the question of rating on unimproved value has been taken since the 31st March, 1920, are as shown below. The results of all polls taken since the passing of the Act of 1896 are given in the “Local Authorities Handbook.”
| RESULTS OF RATING POLLS, 1920–26. | |||||
|---|---|---|---|---|---|
| Local District. | Date of Poll. | Result of Poll. | Votes recorded | ||
| For. | Against. | Informal. | |||
* For rescission. † Now part of Gisborne Borough. | |||||
| Avondale Borough | 17 Feb., 1923 | Carried | 282 | 150 | 5 |
| Bay of Islands County | 17 Nov., 1920 | ,, | 490 | 187 | .. |
| Cambridge Borough* | 8 Nov., 1922 | Rating on U.V. remains | 90 | 166 | 1 |
| Eltham County | 9 May, 1923 | Carried | 361 | 274 | 9 |
| Featherston Borough* | 29 April, 1925 | Rating on U.V. remains | 84 | 134 | 8 |
| Geraldine Borough | 29 April, 1921 | Carried | 179 | 100 | 14 |
| Glen Eden Town District | 13 Oct., 1923 | ,, | 120 | 60 | .. |
| Greytown Borough | 27 June, 1922 | Rejected | 62 | 198 | 4 |
| Hauraki Plains County | 10 Mar., 1921 Carried | 301 | 14 | .. | |
| Havelock North Town District | 3 Nov., 1920 | 107 | 79 | .. | |
| Henderson Town District | 14 July, 1923 | ,, | 54 | 32 | .. |
| Hutt County | 12 May, 1926 Rejected | 817 | 954 | 50 | |
| Inglewood County | 16 Mar., 1921 | Carried | 160 | 25 | 2 |
| Mangapapa Town District† | 1 July, 1920 | ,, | 244 | 80 | 4 |
| Manurewa Town District | 19 Nov., 1921 | Rejected | 66 | 108 | .. |
| Manurewa Town District | 26 Nov., 1925 | ,, | 151 | 190 | 2 |
| Mataura Borough | 21 Feb., 1923 | Carried | 186 | 166 | 1 |
| Milton Borough* | 1 Nov., 1922 | Rating on U.V. remains | 137 | 216 | 10 |
| Nelson City | 3 Dec., 1924 | Rejected | 420 | 1,150 | 51 |
| New Lynn Town District | 5 Dec., 1923 | Carried | 264 | 86 | 3 |
| Ngaruawahia Borough | 21 Mar., 1921 | ,, | 47 | 7 | .. |
| Northcote Borough | 22 Aug., 1922 | ,, | 260 | 150 | .. |
| Ostend Road District | 20 Dec., 1922 | Rejected | 29 | 50 | .. |
| Otamatea County | 6 May, 1922 | Carried | 505 | 312 | .. |
| Otorohanga County | 9 May, 1923 | ,, | 321 | 42 | .. |
| Patangata County | 12 May, 1926 | ,, | 477 | 102 | 3 |
| Rangiora Borough | 7 Mar., 1923 | ,, | 266 | 87 | .. |
| Rangiora Borough* | 23 Mar., 1926 | Rating on U.V. remains | 133 | 269 | .. |
| Rodney County | 21 April, 1921 | Carried | 520 | 433 | .. |
| Stewart Island County | 23 Sept., 1925 | ,, | 35 | 17 | .. |
| Taumarunui County | 9 Mar., 1926 | ,, | 162 | 2 | 6 |
| Taupo Road District | 14 Mar., 1924 | ,, | 16 | 1 | .. |
| Tauranga Borough | 6 Oct., 1920 | Rejected | 147 | 295 | 6 |
| Tauranga Borough | 7 Mar., 1924 | Carried | 295 | 282 | 4 |
| Te Awamutu Borough | 14 Feb., 1923 | Rejected | 120 | 198 | .. |
| Thames Borough* | 12 Dec., 1922 | Rating on U.V. remains | 236 | 407 | 8 |
| Timaru Borough | 27 April, 1921 Carried | 1,532 | 838 | 73 | |
| Uawa County | 26 May, 1920 | ,, | 260 | 89 | .. |
| Wairau Road District | 20 Aug., 1923 | ,, | 251 | 11 | .. |
| Waitara Borough | 3 Sept., 1924 | Rejected | 170 | 279 | .. |
| Waitomo County | 8 June, 1922 | Carried | 752 | 73 | 11 |
| Wanganui City | 29 April, 1925 | 2,280 | 1,733 | 87 | |
| Whangaroa County | 5 Mar., 1924 | 114 | 49 | .. | |
The unimproved value of land is the basis on which some 41 per cent. of the local authorities (excluding Harbour Boards) functioning during 1924–25, assessed their rates for that year. A comparative table is—
| SYSTEMS OF RATING IN FORCE, 1924–25. | |||||||
|---|---|---|---|---|---|---|---|
| — | System of Rating. | Total. | |||||
| Unimproved value. | Capital Value. | Capital and Unimproved Values. | Annual Value. | Acreage Basis. | Nil. | ||
*Includes one on annual basis also. | |||||||
| Counties | 49 | 73 | 1 | .. | .. | .. | 123 |
| Boroughs | 72* | 18 | 1 | 27 | .. | 118 | |
| Town districts | 33 | 32 | .. | 6 | .. | 71 | |
| Road districts | 1 | 34 | .. | .. | .. | 35 | |
| River districts | 13 | 17 | 1 | 1 | 2 | 1 | 35 |
| Land-drainage districts | 24 | 30 | .. | .. | .. | 54 | |
| Electric-power districts | 8 | 19 | .. | .. | 1 | 28 | |
| Water-supply districts | .. | 5 | .. | .. | .. | 5 | |
| City and suburban drainage districts | .. | 2 | .. | 1 | .. | .. | 3 |
| Tramway districts | .. | 1 | .. | .. | .. | .. | 1 |
| Local railway districts | .. | 3 | .. | .. | .. | 3 | |
| Totals | 200 | 234 | 3 | 35 | 2 | 2 | 476 |
Although the figures referred to indicate that the number of local authorities rating on the unimproved value is approximately 41 per cent. of the total, yet on a population basis the figures reveal that in reality a larger proportion of the ratepayers are being so rated. The position in regard to the four major classes of local bodies at 1st April, 1925, was as follows:—
| POPULATION (EXCLUDING MAORIS) RATED ON UNIMPROVED VALUE. | ||||||
|---|---|---|---|---|---|---|
| Districts. | Rating on Unimproved Value. | Total for Dominion.* | Ratio of Unimproved Value to Dominion. | |||
| No. | Population. | No. | Population. | No. | Population. | |
* Exclusive of migratory, &c., population of 6,790. | ||||||
| Per Cent. | Per Cent. | |||||
| Counties (excluding all town districts) | 51 | 188,230 | 123 | 498,319 | 41.46 | 37.77 |
| Boroughs | 74 | 508,487 | 118 | 773,597 | 62.71 | 65.73 |
| Town districts (dependent) | 17 | 5,536 | 31 | 11,306 | 54.84 | 48.97 |
| Town districts (independent) | 18 | 18,785 | 40 | 35,025 | 4500 | 53.63 |
A study of the finance of local governing bodies from their incipient stages to the present time reveals a process of evolution from a state of semi-dependence on the Central Government to a stage where, with the exception of subsidies on rates and occasional grants for special works, all expense is borne locally. While local bodies were the proper authorities to deal with such matters as the construction of roads and bridges, it was recognized that work of this nature was to a large extent of national significance, and governmental aid was freely accorded. This is evidenced by a consideration of the fact that under various Acts, including the Roads. and Bridges Construction Act, 1882, advances were made under which the recipient body, although bound to pay a half-yearly interest for a number of years, the period varying inversely with the rate of interest, was relieved from all further liability. ipso facto, on payment of the last instalment. With the increase in population and growth of prosperity, however, the opinion grew that local authorities should, in all fairness, bear the greater part of the expense of their own activities. This resulted in the withdrawal of such advantageous conditions, and at the present time, although the credit of the State is still available for the benefit of those local bodies requiring loans, and such assistance as indicated above is given, they are to all intents and purposes self-supporting.
The sources from which the various classes of local bodies secure the moneys necessary to exercise their functions vary greatly according to the nature of the statutory duties of the local body concerned. Generally, however, receipts fall under one of three main classes—viz., rates, licenses and fees, and receipts which cannot properly be regarded as revenue. These three classes are dealt with in detail below, where the nature and relative importance of each is more particularly referred to.
The tables given in this section cover the operations of all local authorities which furnish statistical returns to the Census and Statistics Office. Hospital Boards supply their returns to the Inspector-General of Hospitals, and their financial statistics are given in Section VII of this volume. Fire Boards and Rabbit Boards have not as yet furnished financial statistics, although arrangements have now been made for a collection of data from these authorities.
The figures given in the tables are for the year ended 31st March, except in the case of certain Harbour Boards whose own financial year is taken in each case. The financial year of the Wellington Harbour Board ends on the 30th September (six months before the usual financial year); for the Coromandel, Greymouth, Half-moon Bay and Horseshoe Bay, Kaikoura. Kawhia, Mangonui, and Wairoa Harbour Boards the year ends on the 31st March, but in all other cases the Harbour Board year ends on the 31st December, or three months prior to the usual financial year.
Local governing bodies received by way of rates in the financial year 1924–25 a total amount of £4,668,884, of which £2,922,003 consisted of general rates and £1,746,881 of special and separate rates. The sum of £208,799 was raised by licenses, and £135,449 by other taxes, making £5,013,132 altogether from taxation, which sum is equivalent to £3 13s. 8d. per head of the mean population, as compared with £3 11s. 4d. for 1923–24.
Revenue derived from rates increased from £2,355,155 in 1915–16 to £4,668,884 in 1924–25. Revenue from the Government increased in the same period from £262,083 to £298,774. Receipts other than “revenue” were £2,469,275 in 1915–16 and £7,613,399 in 1924–25; but these figures vary from year to year according to circumstances, such as large operations by way of construction of works, for which money has to be specially raised.
The receipts of local governing bodies, divided into the various groups shown above, are given for each of the last ten years.
| Financial Year. | Revenue from | Receipts not Revenue. | Total Receipts. | |||
|---|---|---|---|---|---|---|
| Rates. | Licenses, Fees, Rents, and other Sources. | Government. | Total Revenue. | |||
| £ | £ | £ | £ | £ | £ | |
| 1915–16 | 2,355,155 | 2,705,562 | 262,083 | 5,322,800 | 2,469,275 | 7,792,075 |
| 1916–17 | 2,534,539 | 3,001,324 | 242,618 | 5,778,481 | 1,411,422 | 7,189,903 |
| 1917–18 | 2,674,541 | 3,034,894 | 248,855 | 5,958,290 | 1,250,047 | 7,208,337 |
| 1918–19 | 2,939,606 | 3,184,741 | 267,330 | 6,391,677 | 942,780 | 7,334,457 |
| 1919–20 | 3,144,213 | 4,219,608 | 266,974 | 7,630,795 | 3,329,003 | 10,959,798 |
| 1920–21 | 3,549,590 | 5,048,791 | 287,583 | 8,885,964 | 3,429,662 | 12,315,626 |
| 1921–22 | 3,779,895 | 5,757,252 | 317,530 | 9,854,677 | 5,486,912 | 15,341,589 |
| 1922–23 | 4,277,781 | 5,942,927 | 301,024 | 10,521,732 | 7,399,674 | 17,921,406 |
| 1923–24 | 4,445,627 | 6,403,378 | 300,766 | 11,149,771 | 5,685,107 | 16,834,878 |
| 1924–25 | 4,668,884 | 7,213,306 | 298,774 | 12,180,964 | 7,613,399 | 19,794,363 |
A summary of receipts for the year 1924–25 is given below. The total revenue of the local bodies for the financial year was £12,180,964, and they further received a sum of £7,613,399 which could not properly be termed “revenue.” making altogether a grand total of receipts amounting to £19,794,363. The rates formed 38.3 per cent. of the revenue proper; licenses, rents, and other sources yielded 59.2 per cent.; and 2.5 per cent. was granted by the General Government.
Of the revenue proper of counties, which amounted to £2,283,982, no less a sum than £1,797,095, or 79 per cent., was raised by way of rates. Town districts, road districts, river districts, land-drainage districts, and city and suburban drainage districts also rely on their taxing-powers for the greater part of their income. In the case of boroughs and Harbour Boards, on the other hand, licenses, rents, &c., form the bulk of revenue. During 1924–25 this source of income accounted for 65 per cent. of the total revenue of boroughs, the corresponding proportion for Harbour Boards being as high as 91 per cent.
| LOCAL GOVERNING BODIES.—RECEIPTS, 1924–25. | |||||
|---|---|---|---|---|---|
| — | Revenue from | Receipts not Revenue. | Total Receipts. | ||
| Rates. | Licenses, Rents, &c. | Government. | |||
| £ | £ | £ | £ | £ | |
| Counties | 1,797,095 | 264,536 | 222,351 | 1,022,548 | 3,306,530 |
| Boroughs | 2,348,878 | 4,472,862 | 43,035 | 3,450,062 | 10,314,837 |
| Town districts | 88,760 | 46,988 | 5,574 | 103,140 | 244,462 |
| Road districts | 69,428 | 21,560 | 5,888 | 117,097 | 213,973 |
| River districts | 55,186 | 17,959 | 1,543 | 18,358 | 93,046 |
| Land-drainage districts | 43,557 | 1,331 | 208 | 20,951 | 66,047 |
| Electric-power districts | 10,969 | 617,328 | .. | 1,815,864 | 2,444,161 |
| Water-supply districts | 3,649 | 141 | .. | 99 | 3,889 |
| City and suburban drainage districts | 122,722 | 7,881 | .. | 50,869 | 181,472 |
| Tramway district | .. | 266,071 | .. | 25,573 | 291,644 |
| Railway districts | 321 | 31,590 | .. | 475 | 32,386 |
| Gas-lighting district | .. | 39,552 | .. | .. | 39,552 |
| Harbour Boards | 128,319 | 1,425,507 | 20,175 | 988,363 | 2,562,364 |
| Totals | 4,668,884 | 7,213,306 | 298,774 | 7,613,399 | 19,794,363 |
As stated above, rates contributed in 1924–25 the sum of £4,668,884 to the revenue of local governing bodies. General rates levied brought in £2,922,003, and special and separate rates £1,746,881. Of the latter, £1,273,883 was received by boroughs and £386,966 by counties. The whole of the rates collected by Harbour Boards were general rates.
General rates bring in somewhat less than two-thirds of the total revenue from rates. The proportion shows a tendency to decline, having fallen from 68 per cent. in 1915–16 to 63 per cent. in 1924–25.
| RATES COLLECTED BY LOCAL GOVERNING BODIES, 1915–16 TO 1924–25. | |||
|---|---|---|---|
| Financial Year. | General. | Special and Separate. | Total. |
| £ | £ | £ | |
| 1915–16 | 1,607,764 | 747,391 | 2,355,155 |
| 1916–17 | 1,695,572 | 838,967 | 2,534,539 |
| 1917–18 | 1,791,028 | 883,513 | 2,674,541 |
| 1918–19 | 2,028,151 | 911,455 | 2,939,606 |
| 1919–20 | 2,106,397 | 1,037,816 | 3,144,213 |
| 1920–21 | 2,338,539 | 1,211,051 | 3,549,590 |
| 1921–22 | 2,501,949 | 1,277,946 | 3,779,895 |
| 1922–23 | 2,742,828 | 1,534,953 | 4,277,781 |
| 1923–24 | 2,775,987 | 1,669,646 | 4,445,627 |
| 1924–25 | 2,922,003 | 1,746,881 | 4,668,884 |
Separate rates are of two classes—“general” and “particular.” General separate rates are levied for the construction, maintenance, &c., of any public work, for the acquisition of land or buildings, or for engaging in any undertaking for the benefit of the whole or part of a local district. Particular separate rates are levied in respect of water-supply, lighting, sanitation, and libraries. Special rates are those levied as security for the repayment of loans.
It is of interest to note that for the year 1924–25 the total of all rates collected by counties was equal to £5.48 per £1,000 of rateable capital value (land and improvements). In boroughs it was £11.85; in independent town districts, £10.72; and in town districts forming parts of counties, £6.84.
Rates are not the only form of local taxation. Local authorities derive a certain amount of revenue from publicans' licenses, auctioneers' and hawkers' licenses, abattoir fees, dog-taxes, pound-taxes, tolls, &c. Sources of revenue not classed as taxation are—Rents; fines and penalties; market dues; sales of material; sales of light and power from gasworks and electric-supply works; tramway receipts; interest on deposits; wharf dues, &c.
Revenue received from the Government comprises—Rates on Crown and Native lands; timber and flax royalties; goldfields revenue and gold duty; fees and fines; subsidy on rates; one-third of receipts from lands sold on deferred payment and from perpetual leases; one-fourth of rents from small grazing-runs; other. In addition there are special grants from the General Government for various local works of a public or semi-public character. These are not considered revenue, and are included with “Receipts not revenue.”
A further class of receipts from the Government is provided by loans under the various Government Loans to Local Bodies Acts and from the State Advances Office.
A statement of all receipts by controlling bodies of local districts from the Government during the last five financial years is given in the next table:—
| LOCAL GOVERNING BODIES.—RECEIPTS FROM GOVERNMENT.—QUINQUENNIAL SUMMARY. | |||||
|---|---|---|---|---|---|
| — | Year ended 31st March. | ||||
| 1921. | 1922. | 1923. | 1924. | 1925. | |
| £ | £ | £ | £ | £ | |
| Rates on Crown and Native lands | 9,834 | 7,990 | 8,216 | .. | 101 |
| One-third receipts from land sold on deferred payment and from perpetual leases | 42,737 | 44,381 | 23,860 | 25,162 | 28,061 |
| One-fourth of rents from small grazing-runs | 7,568 | 6,068 | 5,795 | 5,527 | 6,107 |
| Timber and flax royalties | 4,900 | 5,197 | 4,476 | 4,243 | 7,378 |
| Goldfields revenue and gold duty | 20,672 | 17,095 | 21,648 | 24,622 | 23,107 |
| Subsidies on rates | 192,241 | 200,722 | 203,448 | 202,322 | 202,254 |
| Fees and fines | 4,010 | 3,729 | 4,476 | 5,619 | 4,323 |
| Other receipts | 21,030 | 32,348 | 29,105 | 33,271 | 27,443 |
| Total Revenue Account | 302,992 | 317,530 | 301,024 | 300,766 | 298,774 |
| Loans from Government under Government Loans to Local Bodies Acts and from State Advances Office | 1,130,371 | 1,005,160 | 1,171,515 | 938,245 | 1,097,818 |
| Grants for special works &c. | 304,233 | 338,594 | 236,071 | 379,728 | 616,777 |
| Total receipts from Government | 1,737,596 | 1,661,284 | 1,708,610 | 1,618,739 | 2,013,369 |
Of the total of £2,013,369 for 1924–25, counties received £902,537, and boroughs £558,864.
The expenditure of local governing bodies during each of the last twenty years is as follows:—
| Financial Year. | Expenditure. £ |
|---|---|
| 1905–06 | 3,601,506 |
| 1906–07 | 3,897,515 |
| 1907–08 | 4,491,113 |
| 1908–09 | 4,800,711 |
| 1909–10 | 4,898,482 |
| 1910–11 | 5,360,261 |
| 1911–12 | 6,074,372 |
| 1912–13 | 6,537,769 |
| 1913–14 | 6,796,314 |
| 1914–15 | 6,806,567 |
| 1915–16 | 6,920,736 |
| 1916–17 | 6,758,593 |
| 1917–18 | 7,103,073 |
| 1918–19 | 7,320,277 |
| 1919–20 | 10,883,586 |
| 1920–21 | 12,761,690 |
| 1921–22 | 15,091,875 |
| 1922–23 | 15,695,507 |
| 1923–24 | 16,520,950 |
| 1924–25 | .19,422,833 |
The expenditure of the various classes of local governing bodies during 1924–25 is shown below in more detail:—
| LOCAL GOVERNING BODIES.—EXPENDITURE, 1924–25. | ||||||
|---|---|---|---|---|---|---|
| — | Public Works. | Hospitals and Charitable Aid. | Management. | Interest on Loans and Overdraft. | Other. | Total Expenditure. |
* Included in “Public works.” | ||||||
| £ | £ | £ | £ | £ | £ | |
| Counties | 2,344,973 | 298,320 | 256,219 | 303,290 | 96,367 | 3,299,169 |
| Boroughs | 7,322,848 | 192,481 | 318,113 | 1,267,704 | 681,077 | 9,782,223 |
| Town districts | 162,367 | 6,708 | 26,978 | 30,786 | 11,025 | 237,864 |
| Road districts | 189,368 | 4,736 | 11,666 | 18,669 | 6,519 | 230,958 |
| River districts | 53,821 | .. | 11,723 | 9,441 | 6,902 | 81,887 |
| Land-drainage districts | 62,023 | .. | 8,714 | 18,526 | 3,725 | 92,988 |
| Electric-power districts | 2,230,127 | .. | * | 293,044 | 240,347 | 2,763,518 |
| Water-supply districts | 2,541 | .. | 500 | 732 | 181 | 3,954 |
| City and suburban drainage districts | 154,072 | .. | 15,767 | 79,418 | 13,289 | 262,546 |
| Tramway district | 195,030 | .. | * | 50,666 | 40,582 | 286,278 |
| Railway districts | 14,864 | .. | 15,292 | 4,323 | 1,900 | 36,379 |
| Gas-lighting district | 38,222 | .. | 1,264 | 3,778 | 597 | 43,861 |
| Harbour Boards | 1,486,631 | .. | 177,210 | 442,926 | 194,441 | 2,301,208 |
| Totals | 14,256,887 | 502,245 | 843,446 | 2,523,303 | 1,296,952 | 19,422,833 |
Of a total expenditure of £19,422,833 during 1924–25, an amount of £14,256,887, or 73.4 per cent., was expended on public works, and £2,523,303 (13.0 per cent.) on debt charges. The item “Management expenses” does not rank very high in the aggregate, though the table following shows that in some classes of local bodies the expenses of management account for a fair percentage of the revenue:—
| — | Management Expenses as Percentage of | ||
|---|---|---|---|
| Revenue. | Total Receipts. | Expenditure. | |
| Per Cent. | Per Cent. | Per Cent. | |
| Counties | 11.22 | 7.75 | 7.77 |
| Boroughs | 4.63 | 3.09 | 3.25 |
| Town districts (independent) | 18.82 | 10.84 | 10.89 |
| Town districts (dependent) | 20.28 | 11.90 | 13.67 |
| Road districts | 12.04 | 5.45 | 5.05 |
| River districts | 15.69 | 12.60 | 14.32 |
| Land-drainage districts | 19.32 | 13.19 | 9.37 |
| Water-supply districts | 13.19 | 12.86 | 12.65 |
| City and suburban drainage districts | 12.07 | 8.69 | 6.01 |
| Harbour Boards | 11.26 | 6.92 | 7.70 |
The tendency of the rate of management expenses to vary inversely with the magnitude of operations is strikingly illustrated in the foregoing. Boroughs, with their multifarious activities involving the receipt and expenditure of huge sums of money, show the comparatively low rate of 4.63 per cent. (on revenue), while in the case of town districts (dependent), the finances of which are on a much smaller scale, the rate is as high as 20.28 per cent. Other smaller local authorities also show a high administrative rate.
The table following gives, in respect of boroughs only, the expenditure out of loan-money during the last ten years, classified under various heads:—
| EXPENDITURE OUT OF LOANS.—BOROUGHS ONLY, 1915–16 TO 1924–25. | |||||||||
|---|---|---|---|---|---|---|---|---|---|
| Year ended 31st March. | Streets, Footways, and Bridges. | Drainage and Sanitation. | Waterworks | Tramways. | Abattoirs, Slaughterhouses, and Pounds. | Lighting and Power Services. | Other Public Works. | Management, Interest, and Sundries | Total. |
| £ | £ | £ | £ | £ | £ | £ | £ | £ | |
| 1916 | 175,248 | 98,366 | 86,864 | 45,390 | 3,860 | 235,071 | 78,398 | 17,818 | 741,015 |
| 1917 | 98,595 | 92,677 | 84,012 | 21,497 | 14,970 | 130,489 | 60,902 | 16,794 | 519,936 |
| 1918 | 72,290 | 86,346 | 45,917 | 6,880 | .. | 104,359 | 57,086 | 12,571 | 385,449 |
| 1919 | 92,923 | 62,710 | 40,593 | .. | 671 | 68,276 | 34,014 | 5,163 | 304,350 |
| 1920 | 109,858 | 77,471 | 49,383 | 1,231,571 | .. | 84,283 | 100,248 | 286 | 1,653,100 |
| 1921 | 227,774 | 118,730 | 95,107 | 93,113 | 5,141 | 158,473 | 128,152 | 8,437 | 834,927 |
| 1922 | 229,495 | 217,503 | 174,514 | 116,799 | 52 | 405,019 | 107,142 | 47,347 | 1,497,871 |
| 1923 | 455,105 | 295,920 | 194,472 | 99,750 | 1,616 | 814,177 | 276,810 | .. | 2,137,850 |
| 1924 | 389,840 | 306,089 | 163,942 | 192,655 | 22,273 | 514,312 | 292,145 | .. | 1,881,256 |
| 1925 | 706,380 | 317,868 | 309,033 | 217,557 | 12,177 | 540,540 | 310,332 | .. | 2,413,887 |
The assets and liabilities of local governing bodies at the end of the financial year 1924–25 are as shown in the table following. The figures shown in the column “Other assets” are taken from the respective balance-sheets, but are far from complete, In a number of cases no assets whatever are shown, while in others nothing is included for the reserves held. These totals can be taken as an approximate and conservative indication only of the property held in addition to the actual cash assets.
| — | Assets. | Liabilities. | ||||
|---|---|---|---|---|---|---|
| Cash Assets. | Other Assets (as estimated in published Balance-sheets). | Loans—Net Indebtedness (excluding Government Loans and those from the State Advances Office). | Loans from State Advances Office. (Net Indebtedness on 31st March, 1925.) | Inscribed Stock, i.e., Loans from Treasury under Loans to Local Bodies Acts. (Estimated Present Indebtedness.) | Liabilities other than the Loans included in preceding Columns (Bank Overdrafts, Temporary Loans, Outstanding Accounts, &c.). | |
| £ | £ | £ | £ | £ | £ | |
| Counties | 1,281,526 | 1,573,350 | 2,181,200 | 2,284,227 | 580,502 | 399,400 |
| Boroughs | 4,165,499 | 24,270,470 | 20,685,480 | 2,399,808 | 446,496 | 734,859 |
| Town districts | 85,777 | 492,543 | 375,922 | 236,529 | 5,554 | 50,062 |
| Road districts | 74,717 | 180,320 | 267,294 | 67,224 | 22,215 | 21,587 |
| River districts | 39,767 | 46,296 | 75,290 | 43,907 | 30,541 | 14,558 |
| Land-drainage districts | 39,380 | 50,192 | 116,832 | 176,314 | 42,756 | 14,322 |
| Electric-power districts | 818,639 | 6,095,337 | 6,297,181 | .. | .. | 391,899 |
| City and suburban drainage districts | 151,084 | 753,086 | 1,435,171 | 151 | .. | 48,451 |
| Water-supply districts | 506 | 1,350 | 14,657 | 1,457 | 488 | 258 |
| Tramway district | 385,161 | 1,203,649 | 967,786 | .. | .. | |
| Railway districts | 5,052 | 134,275 | 44,526 | .. | 22,794 | |
| Gas-lighting district | .. | 83,129 | 61,937 | .. | .. | 9,933 |
| Harbour Boards | 1,829,414 | 13,415,930 | 8,247,251 | 150,457 | .. | 366,135 |
| Totals | 8,876,522 | 48,299,927 | 40,770,527 | 5,360,074 | 1,128,552 | 2,074,258 |
In the following table details of the estimated assets (other than cash assets) of boroughs are given for the five years 1921–25.
| ESTIMATED ASSETS (EXCLUDING CASH ASSETS) OF BOROUGHS, 1921–25. | |||||
|---|---|---|---|---|---|
| Assets. | Year ended 31st March. | ||||
| 1921. | 1922. | 1923. | 1924. | 1925. | |
| £ | £ | £ | £ | £ | |
| Reserves, public parks, gardens, &c. | 1,631,277 | 1,840,149 | 2040,103 | 1,983,622 | 2,121,568 |
| Endowments | 2,226,999 | 2,236,505 | 2,314008 | 2,327,339 | 2,447,026 |
| Town halls, libraries, and fittings | 799,310 | 855,144 | 842909 | 922,204 | 943,177 |
| Other premises, plant, tools, and implements | 815,872 | 886,734 | 1,015901 | 1,057,932 | 1,271,617 |
| Gasworks | 1,112,373 | 1,200,539 | 1,184,195 | 1,174,001 | 1,233,710 |
| Electrical works | 2,290,727 | 3,125,99 | 2,796,322 | 3,248,975 | 3,878,259 |
| Tramways | 2,818,650 | 3,129,018 | 3,264,632 | 3,557,113 | 3,568,288 |
| Abattoirs and saleyards | 197,437 | 188,468 | 187,064 | 224,050 | 235,056 |
| Drainage, sewerage, and water systems | 4,673,602 | 4,963,930 | 5,361,674 | 6,191,211 | 6,665,605 |
| Other assets | 1,803,627 | 1,890,275 | 1,744,560 | 1,846,655 | 1,906,164 |
| Totals | 18,369,874 | 20,316,753 | 20,751,368 | 22,536,102 | 24,270,470 |
During the five years 1920–21 to 1924–25 the fixed assets of boroughs have increased by £5,900,596, or 32 per cent. The growth is seen to pertain chiefly to gas and electrical works, tramways, and drainage and water systems, thus indicating the modern trend of municipal activity.
The total indebtedness at the end of 1924–25, excluding loans from the State Advances Office and the inscribed debt under the Government Loans to Local Bodies Acts (the latter including stock exchanged for debentures under the Roads and Bridges Construction Act), was £45,720,794. Against this were sinking funds amounting to £4,950,267, leaving the net indebtedness, other than to the State, £40,770,527. The annual charge for interest was £2,396,824, and for sinking fund £523,876. The net indebtedness to the State Advances Office was £5,360,074, representing loans originally amounting to £6,029,965. The instalments of principal and interest on this amounted to an annual charge of £326,260. The section of this book dealing with State advances contains further information regarding State advances to local authorities.
The estimated not indebtedness under the Government Loans to Local Bodies Acts, including inscribed stock exchanged for debentures under the Roads and Bridges Construction Act, 1882, was £1,128,552 at the end of the year. This debt is decreasing yearly, and will be extinguished in course of time. The amount outstanding is repayable by annual instalments of £84,203.
The outstanding loans of local bodies at the end of each of the last twenty years are shown in the following table:—
| As at 31st March. | Debentures and Stock in Circulation. | Loans from State Advances Office. | Inscribed Debt. | Total Debt. | ||||
|---|---|---|---|---|---|---|---|---|
| Gross Debt. | Net Debt. | Gross Debt. | Net Debt. | Gross Debt. | Present Indebtedness. | Gross Debt. | Net Debt. | |
| £ | £ | £ | £ | £ | £ | £ | £ | |
| 1906 | 10,718,051 | 9,722,081 | .. | .. | 2,155,114 | 1,679,958 | 12,873,165 | 11,402,039 |
| 1907 | 11,616,048 | 10,536,565 | .. | .. | 2,287,105 | 1,748,086 | 13,903,153 | 12,284,651 |
| 1908 | 12,532,334 | 11,343,352 | .. | .. | 2,399,017 | 1,798,834 | 14,931,351 | 13,142,186 |
| 1909 | 13,303,622 | 12,184,409 | .. | .. | 2,617,135 | 1,943,728 | 15,920,757 | 14,128,137 |
| 1910 | 14,937,685 | 13,765,802 | .. | .. | 2,872,232 | 2,119,023 | 17,809,917 | 15,884,825 |
| 1911 | 15,727,613 | 14,462,770 | 405,195 | 404,163 | 2,972,795 | 2,173,293 | 19,105,603 | 17,040,226 |
| 1912 | 16,590,877 | 15,161,727 | 1,195,680 | 1,186,611 | 2,985,998 | 2,169,447 | 20,772,555 | 18,517,785 |
| 1913 | 17,483,332 | 15,882,926 | 1,740,925 | 1,711,737 | 2,988,298 | 2,168,252 | 22,212,555 | 19,762,975 |
| 1914 | 18,923,482 | 17,202,764 | 2,063,005 | 2,007,797 | 2,842,150 | 2,079,570 | 23,828,637 | 21,290,131 |
| 1915 | 19,454,475 | 17,602,669 | 2,399,420 | 2,312,754 | 2,780,492 | 1,975,860 | 24,634,387 | 21,891,283 |
| 1916 | 20,754,168 | 18,822,896 | 2,680,245 | 2,562,970 | 2,728,174 | 1,872,990 | 26,162,587 | 23,258,856 |
| 1917 | 21,432,767 | 19,277,706 | 2,836,055 | 2,676,407 | 2,690,412 | 1,795,080 | 26,959,234 | 23,749,193 |
| 1918 | 22,260,537 | 19,782,845 | 2,962,190 | 2,762,900 | 2,630,244 | 1,681,330 | 27,852,971 | 24,227,075 |
| 1919 | 22,673,712 | 19,922,153 | 3,095,740 | 2,846,837 | 2,554,401 | 1,552,423 | 28,323,853 | 24,321,413 |
| 1920 | 24,608,293 | 21,917,235 | 3,406,290 | 3,108,458 | 2,471,191 | 1,466,727 | 30,485,774 | 26,492,420 |
| 1921 | 26,186,960 | 23,230,084 | 3,852,465 | 3,492,374 | 2,425,623 | 1,415,567 | 32,165,048 | 28,138,025 |
| 1922 | 30,266,204 | 27,018,370 | 4,557,545 | 4,097,095 | 2,331,790 | 1,328,174 | 37,205,539 | 32,443,639 |
| 1923 | 36,079,382 | 32,164,674 | 5,262,400 | 4,770,135 | 2,341,667 | 1,244,969 | 43,683,449 | 38,179,778 |
| 1924 | 39,110,000 | 34,625,414 | 5,701,835 | 5,113,529 | 2,314,304 | 1,190,870 | 47,126,139 | 40,929,813 |
| 1925 | 45,720,794 | 40,770,527 | 6,029,965 | 5,360,074 | 2,272,598 | 1,128,552 | 54,023,357 | 47,259,153 |
The net indebtedness of local governing bodies on account of outstanding loans has increased in the twenty years 1904–05 to 1924–25 from £9,005,196 to £40,770,527, exclusive of moneys borrowed from the Government, which represented a further indebtedness of £6,488,626 at the end of March, 1925, made up as follows: Inscribed debt—i.e., debentures under the Roads and Bridges Construction Act, 1882, converted—amounts borrowed from the Treasury under the Government Loans to Local Bodies Acts, £1,128,552; and loans from the State Advances Office, £5,360,074.
Of the total net indebtedness of £47,259,153 at the 31st March, 1925, boroughs wore responsible for no loss than £23,878,518, which represents 12.05 per cent. of their rateable capital value. In the case of counties, which have a much less per capita expenditure on public works, the percentage is only 1.75. As may be expected, it is higher in independent town districts, the figure being 7.85.
The following table shows, per head of the population, the gross debt of local governing bodies and the annual charge thereon for the years 1895–96 to 1924–25: —
| Year ended 31st March. | Estimated or Census Population. | Gross Debt. | Annual Loan Charge. | ||||||
|---|---|---|---|---|---|---|---|---|---|
| Amount. | Rate per Head. | Amount. | Rate per Head. | ||||||
| £ | £ | s. | d. | £ | £ | s. | d. | ||
| 1896 | 743,376 | 7,547,511 | 10 | 3 | 0 | 439,253 | 0 | 11 | 10 |
| 1897 | 757,503 | 7,675,814 | 10 | 2 | 8 | 439,057 | 0 | 11 | 7 |
| 1898 | 771,568 | 7,783,445 | 10 | 1 | 10 | 442,676 | 0 | 11 | 5 |
| 1899 | 786,530 | 7,995,400 | 10 | 3 | 3 | 446,697 | 0 | 11 | 4 |
| 1900 | 798,471 | 8,149,272 | 10 | 4 | 1 | 453,186 | 0 | 11 | 4 |
| 1901 | 815,862 | 8,785,303 | 10 | 15 | 4 | 474,163 | 0 | 11 | 7 |
| 1902 | 833,139 | 9,245,364 | 11 | 1 | 11 | 497,565 | 0 | 11 | 11 |
| 1903 | 857,993 | 9,886,676 | 11 | 10 | 5 | 516,670 | 0 | 12 | 0 |
| 1904 | 882,100 | 10,756,062 | 12 | 3 | 10 | 556,193 | 0 | 12 | 7 |
| 1905 | 908,116 | 12,056,736 | 13 | 5 | 6 | 617,147 | 0 | 13 | 7 |
| 1906 | 933,114 | 12,873,165 | 13 | 15 | 11 | 654,500 | 0 | 14 | 0 |
| 1907 | 961,598 | 13,903,153 | 14 | 9 | 2 | 704,335 | 0 | 14 | 8 |
| 1908 | 985,320 | 14,931,351 | 15 | 3 | 1 | 752,949 | 0 | 15 | 3 |
| 1909 | 1,016,063 | 15,920,757 | 15 | 13 | 4 | 803,194 | 0 | 15 | 9 |
| 1910 | 1,035,212 | 17,809,917 | 17 | 4 | 1 | 895,059 | 0 | 17 | 3 |
| 1911 | 1,056,199 | 19,105,603 | 18 | 1 | 9 | 960,810 | 0 | 18 | 2 |
| 1912 | 1,081,344 | 20,772,555 | 19 | 4 | 2 | 1,064,251 | 0 | 19 | 8 |
| 1913 | 1,111,589 | 22,212,555 | 19 | 19 | 8 | 1,104,474 | 0 | 19 | 10 |
| 1914 | 1,139,668 | 23,828,637 | 20 | 18 | 2 | 1,195,288 | 1 | 0 | 11 |
| 1915 | 1,150,386 | 24,634,387 | 21 | 8 | 3 | 1,238,065 | 1 | 1 | 6 |
| 1916 | 1,150,250 | 26,162,587 | 22 | 16 | 8 | 1,339,420 | 1 | 3 | 3 |
| 1917 | 1,150,938 | 26,959,234 | 23 | 8 | 6 | 1,393,394 | 1 | 4 | 2 |
| 1918 | 1,154,559 | 27,852,971 | 24 | 2 | 6 | 1,459,606 | 1 | 5 | 3 |
| 1919 | 1,178,406 | 28,323,853 | 24 | 0 | 9 | 1,489,890 | 1 | 5 | 3 |
| 1920 | 1,236,915 | 30,485,774 | 24 | 12 | 11 | 1,633,341 | 1 | 6 | 5 |
| 1921 | 1,267,498 | 32,465,048 | 25 | 12 | 3 | 1,755,951 | 1 | 7 | 7 |
| 1922 | 1,301,251 | 37,205,539 | 28 | 11 | 10 | 2,133,764 | 1 | 12 | 9 |
| 1923 | 1,325,301 | 43,683,449 | 32 | 18 | 11 | 2,579,571 | 1 | 18 | 11 |
| 1924 | 1,347,853 | 47,126,139 | 34 | 19 | 3 | 2,798,645 | 2 | 1 | 6 |
| 1925 | 1,379,487 | 54,023,357 | 39 | 3 | 2 | 3,331,163 | 2 | 8 | 3 |
Since 1898 there has been an uninterrupted increase not only in the total debt but also in the rate per head. The annual charge for loans shows a similar growth. Within the last ten years the local-body debt has more than doubled, while the increase during 1924–25 (£6,897,218) was greater than in any previous year. Boroughs with nearly four millions, and Electric-power Boards with over one and a half millions, were the principal contributories to this phenomenal increase.
The table below is of interest as showing the increase of loan indebtedness in each of the principal types of local authority. The figures represent the gross liability on all loans other than Government loans.
| As at 31st March. | Counties. | Boroughs. | Town Districts. | Road Districts. | River Districts. | Land-drainage Districts. | Electric-power Districts. | Harbour Boards. | Other Districts. | Total. |
|---|---|---|---|---|---|---|---|---|---|---|
| £ | £ | £ | £ | £ | £ | £ | £ | £ | £ | |
| 1910 | 265,091 | 11,086,719 | 217,628 | 112,050 | 29,250 | 15,840 | .. | 7,014,390 | 2,013,200 | 20,754,168 |
| 1917 | 286,679 | 11,606,485 | 246,560 | 66,050 | 34,530 | 17,120 | .. | 7,151,743 | 2,023,600 | 21,432,767 |
| 1918 | 421,214 | 12,150,384 | 252,520 | 71,886 | 44,620 | 23,270 | .. | 7,268,993 | 2,027,650 | 22,260,537 |
| 1919 | 537,415 | 12,365,958 | 287,270 | 75,781 | 46,000 | 25,920 | .. | 7,301,143 | 2,034,225 | 22,673,712 |
| 1920 | 752,176 | 13,944,507 | 311,208 | 51,916 | 46,620 | 29,220 | .. | 7,377,142 | 2,095,504 | 24,608,293 |
| 1921 | 1,046,378 | 14,575,825 | 372,788 | 62,146 | 58,900 | 29,735 | 147,750 | 7,528,288 | 2,365,150 | 26,186,960 |
| 1922 | 1,328,297 | 16,282,960 | 351,065 | 79,891 | 58,000 | 56,680 | 1,480,000 | 8,110,911 | 2,518,400 | 30,266,204 |
| 1923 | 1,802,633 | 19,501,988 | 377,306 | 152,461 | 78,530 | 62,077 | 3,052,300 | 8,437,987 | 2,614,100 | 36,079,382 |
| 1924 | 1,870,078 | 19,819,437 | 408,580 | 207,671 | 73,915 | 98,565 | 4,740,865 | 9,020,188 | 2,870,641 | 39,110,000 |
| 1925 | 2,332,461 | 23,483,057 | 411,859 | 273,450 | 80,734 | 119,132 | 6,514,757 | 9,600,203 | 2,905,141 | 45,720,794 |
During the twelve months ended the 31st March, 1925, the gross indebtedness (excluding loans from Government) of all local authorities increased by £6,610,794—the greatest increase ever recorded during any one year. The principal contributories to this growth were: Boroughs, £3,663,560; electric-power districts, £1,773,892; Harbour Boards, £580,015; and counties, £462,383. During the last decade the debt has more than doubled, boroughs being responsible for over £13,000,000 of the £25,000,000 increase. Electric-power districts do not appear until 1921, since when the debt has grown steadily to over six and a half millions in 1925.
The loans outstanding, other than Government loans, at the end of the financial year 1924–25 are shown below, classified according to various rates of interest and as to whether domiciled in New Zealand or abroad: —
| Rate of Interest. | Domiciled in New Zealand. | Domiciled in United Kingdom. | Domiciled in Australia. | Total. |
|---|---|---|---|---|
| Per Cent. | £ | £ | £ | £ |
| Under 4 | 32,347 | 300 | .. | 32,647 |
| 4 | 1,555,126 | 2,351,518 | 760,000 | 4,666,644 |
| 4 ¼ | 915,800 | 168,800 | 85,000 | 1,169,600 |
| 4 ½ | 3,937,001 | 1,870,025 | 403,250 | 6,210,276 |
| 4 ¾ | 107,050 | .. | 319,790 | 426,840 |
| 5 | 3,695,063 | 3,364,647 | 237,095 | 7,296,805 |
| 5 ⅛ | 63,000 | .. | .. | 63,000 |
| 5 ¼ | 5,129,249 | .. | 21,250 | 5,150,499 |
| 5 ½ | 4,835,987 | 2,278,200 | 615,165 | 7,729,352 |
| 5 5/8 | .. | 50,000 | 50,000 | |
| 5 ¾ | 1,497,613 | .. | 380,399 | 1,878,012 |
| 6 | 6,389,136 | 1,723,250 | 556,348 | 8,668,734 |
| 6 ¼ | 7,500 | .. | .. | 7,500 |
| 6 ½ | 1,143,535 | 823,000 | 162,850 | 2,129,385 |
| 7 | 104,500 | .. | 137,000 | 241,500 |
| Totals | 29,412,907 | 12,579,740 | 3,728,147 | 45,720,794 |
A further table is given showing for each of the last twenty years the amount of the debt domiciled in New Zealand and elsewhere, other than loans from the General Government. Columns are added showing the interest payable and the average rate of interest per cent. It will be noticed that the amount of outstanding loans shown to have been raised in New Zealand was only a small percentage of the total at the end of the first of the twenty financial years shown, but increased gradually at first, and rapidly later, till at the end of the year 1912–13 it was nearly £3,000,000 in excess of the amount domiciled abroad. From 1914–15 the proportion domiciled in New Zealand mounted rapidly, until at the 31st March, 1925, it represented 64 per cent. of the total.
| INDEBTEDNESS AND INTEREST CHARGES. | |||||
|---|---|---|---|---|---|
| Financial Year. | Domiciled in New Zealand. | Domiciled Abroad. | Total Indebtedness. | Annual interest Payable. | Average Rate per Cent. |
| £ | £ | £ | £ | £ | |
| 1905–06 | 5,250,551 | 5,467,500 | 10,718,051 | 515,188 | 4.81 |
| 1906–07 | 6,145,548 | 5,470,500 | 11,616,048 | 548,387 | 4.72 |
| 1907–08 | 7,246,834 | 5,285,500 | 12,532,334 | 587,564 | 4.69 |
| 1908–09 | 7,785,922 | 5,517,700 | 13,303,622 | 616,330 | 4.63 |
| 1909–10 | 7,967,385 | 6,970,300 | 14,937,685 | 684,630 | 4.58 |
| 1910–11 | 8,254,313 | 7,473,300 | 15,727,613 | 715,289 | 4.55 |
| 1911–12 | 9,574,527 | 7,016,350 | 16,590,877 | 748,805 | 4.51 |
| 1912–13 | 10,134,782 | 7,348,550 | 17,483,332 | 787,827 | 4.51 |
| 1913–14 | 10,106,082 | 8,817,400 | 18,923,482 | 855,063 | 4.52 |
| 1914–15 | 10,998,775 | 8,455,700 | 19,454,475 | 870,992 | 4.48 |
| 1915–16 | 12,793,543 | 7,960,625 | 20,754,168 | 948,511 | 4.57 |
| 1916–17 | 13,218,617 | 8,214,150 | 21,432,767 | 983,408 | 4.59 |
| 1917–18 | 14,096,187 | 8,164,350 | 22,260,537 | 1,034,272 | 4.64 |
| 1918–19 | 14,749,763 | 7,923,949 | 22,673,712 | 1,048,999 | 4.63 |
| 1919–20 | 16,854,725 | 7,753,570 | 24,608,295 | 1,137,057 | 4.62 |
| 1920–21 | 17,737,891 | 8,449,069 | 26,186,960 | 1,221,549 | 4.66 |
| 1921–22 | 21,196,094 | 9,070,110 | 30,266,204 | 1,462,039 | 4.83 |
| 1922–23 | 25,688,390 | 10,370,992 | 36,059,382 | 1,827,992 | 5.06 |
| 1923–24 | 26,668,533 | 12,441,467 | 39,110,000 | 1,992,220 | 5.09 |
| 1924–25 | 29,412,907 | 16,307,887 | 45,720,794 | 2,396,824 | 5.24 |
Of the total annual interest payable on the debt as at 31st March, 1925, £635,822 was payable in New Zealand, £1,568,608 in the United Kingdom, and £192,394 in Australia.
From tables presented earlier in this section it is evident that the loan liabilities of local authorities during recent years have risen very considerably. Within the last decade the total net indebtedness has more than doubled, having risen from £21,891,283 in 1915 to £47,259,153 in 1925. All classes of local bodies have participated in this great increase, although boroughs, which are responsible for practically half of the total debt, show the greatest movement. As against this growing debt, however, it should not be overlooked that the assets of local authorities have undergone at least as great an augmentation. This is brought out in the table below, which shows (a) for all local bodies, and (b) for boroughs only, both the actual and relative increase in the net indebtedness on account of loans and in assets since 1915. For the purpose of showing relative movements each item in 1915 is represented as 1,000: and subsequent increases or decreases are shown as a proportion of this base number. In the case of boroughs, the amount of inscribed debt, which is not available separately for the earlier years of the table, has been omitted. The net liability under this heading at 31st March, 1925, was £446,496. A further point to be noted is that a considerable proportion of the expenditure of certain local governing bodies is made on roads and streets, for which no valuation is available. Assets of this nature, therefore, are not included in the table.
| NET LOAN INDEBTEDNESS AND ASSETS, 1915–25. | ||||||||
|---|---|---|---|---|---|---|---|---|
| Year ended 31st March | (a) All Local Bodies. | (b) Boroughs only. | ||||||
| Net Loan Indebtedness. | Index No. | Assets. | Index No. | Net Loan Indebtedness. | Index No. | Assets. | Index No. | |
| £ | £ | £ | £ | |||||
| 1915 | 21,891,283 | 1000 | 26,149,182 | 1000 | 10,492,268 | 1000 | 13,900,549 | 1000 |
| 1916 | 23,258,856 | 1063 | 28,468,179 | 1089 | 11,406,126 | 1089 | 15,286,325 | 1100 |
| 1917 | 23,749,193 | 1086 | 29,946,457 | 1145 | 11,831,780 | 1128 | 16,335,731 | 1176 |
| 1918 | 24,227,075 | 1107 | 29,263,695 | 1119 | 12,194,940 | 1163 | 16,584,774 | 1193 |
| 1919 | 24,321,413 | 1111 | 28,606,307 | 1094 | 12,275,657 | 1171 | 15,800,458 | 1137 |
| 1920 | 26,492,420 | 1210 | 31,940,487 | 1221 | 13,721,374 | 1308 | 18,176,050 | 1308 |
| 1921 | 28,138,025 | 1286 | 36,546,900 | 1397 | 14,275,988 | 1362 | 19,682,278 | 1416 |
| 1922 | 32,443,639 | 1482 | 41,521,136 | 1587 | 16,156,017 | 1540 | 22,302,836 | 1604 |
| 1923 | 38,179,778 | 1744 | 47,190,428 | 1804 | 19,422,886 | 1852 | 24,610,151 | 1770 |
| 1924 | 40,929,813 | 1870 | 51,670,293 | 1976 | 19,599,017 | 1868 | 26,286,710 | 1891 |
| 1925 | 47,259,153 | 2159 | 57,176,449 | 2187 | 23,085,288 | 2200 | 28,435,969 | 2046 |
The net debt of all local bodies in 1915 on account of debentures and stock in circulation was £17,602,669, and in 1925 £40,770,527. Loans from the Government. in the same years amounted to £4,288,614 and £6,488,626. In all, therefore, the net debt has risen during the period from £21,891,283 to £47,259,153, an increase of 116 per cent. Assets, on the other hand, have grown from £26,149,182 in 1915 to £57,176,449 in 1925, representing an advance of 119 per cent. Turning to boroughs, it is seen that the loan, indebtedness has increased by £12,593,020 (120 per cent.), and assets by £14,535,420 (104 per cent.). It is obvious from the foregoing that in the case of all local bodies the increase in assets has been greater than in loans. As regards boroughs, however, the net loan indebtedness shows the greater relative increase.
Graphing the above figures relating to all local bodies, the following result is obtained: —
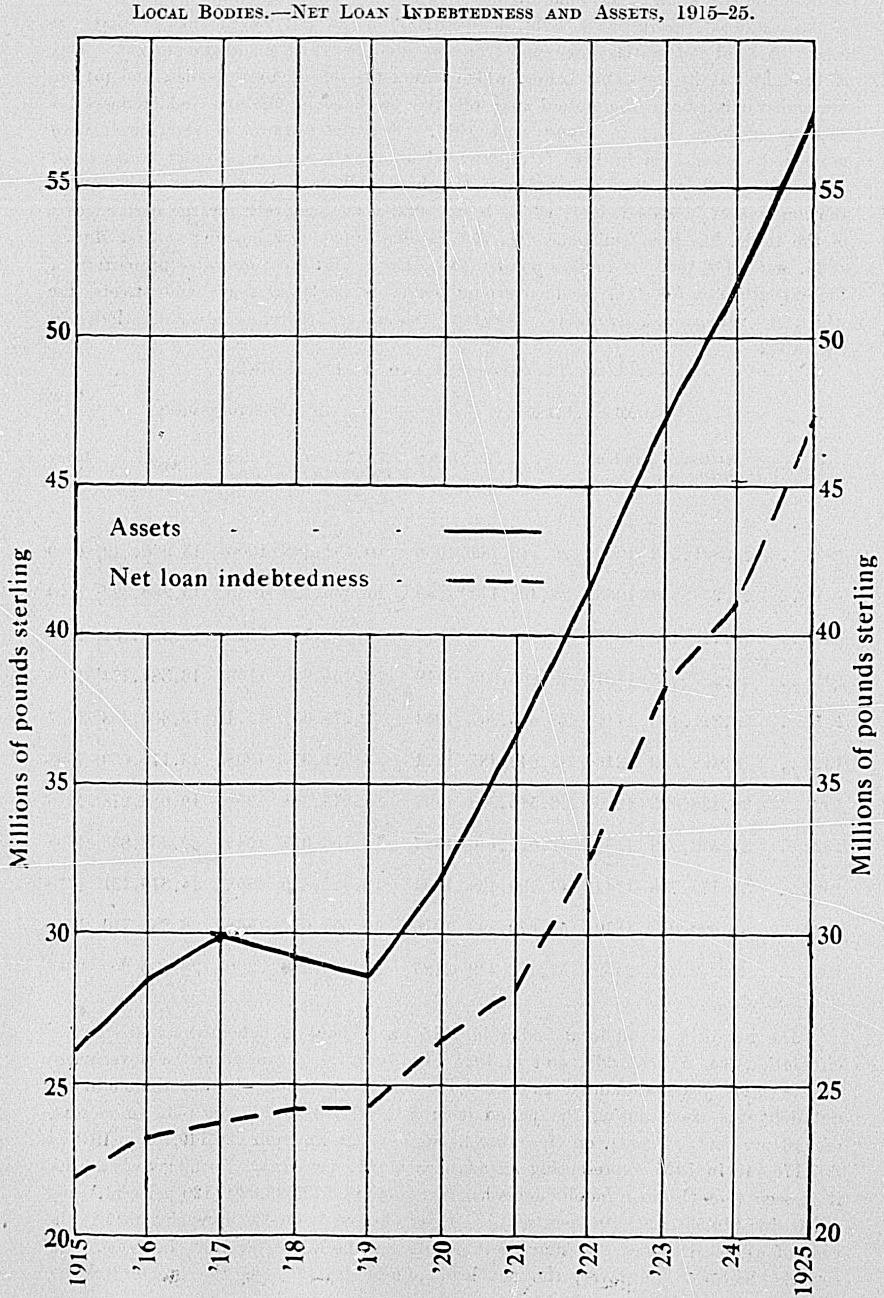
Broadly speaking, the curves representing loan indebtedness and assets are seen to follow a practically identical course, the steeper grade in the latter since 1922 indicating the greater relative increase in assets. The slight fall in assets between 1917 and 1919 is due to small cash balances as compared with previous years.
Some indication of the character of the assets which have contributed most to the advance may be obtained from a perusal of the table of assets given on page 689. The greatest development is seen to have occurred in drainage, sewerage, and water systems, electrical works, and tramway services.
Although the yearly loan statistics compiled from the annual returns of local governing bodies are on a high plane of completeness, no information has hitherto been available in regard to current borrowing activities throughout the year. Neither was it possible to ascertain the amount of unexpended loan balances held by local authorities at any given date. To cope with the demand for information under these headings a system of quarterly loan statistics was recently instituted, rendering it incumbent upon local authorities to furnish particulars of amounts raised during each quarter. A summary of the results obtained from a collection of these statistics for the financial year 1925–26 is given below.
| LOAN TRANSACTIONS, 1925–26. | ||||||
|---|---|---|---|---|---|---|
| Class of Local Body. | Unexpired and Unexercised Authorities at 31st March, 1925. | Amount Authorized during Year ended 31st March, 1926. | Total of two Preceding Columns. | Amount raised during Year ended 31st March., 1926. | Authorities cancelled or expired during Year ended 31st March, 1926. | Balance Unexpired and Unexercised at 31st March. 1926. |
| £ | £ | £ | £ | £ | £ | |
| Counties | 1,165,478 | 1,006,017 | 2,171,495 | 822,776 | 107,726 | 1,240,993 |
| Boroughs | 3,968,726 | 1,851,694 | 5,820,420 | 2,476,566 | 29,388 | 3,314,466 |
| Town districts | 124,693 | 60,575 | 185,268 | 73,630 | 150 | 111,488 |
| Road districts | 193,000 | 39,210 | 232,210 | 100,390 | .. | 131,820 |
| River districts | 31,485 | 5,500 | 36,985 | 11,000 | .. | 25,985 |
| Land-drainage districts | 50,278 | 157,750 | 208,028 | 23,350 | .. | 184,678 |
| City and suburban drainage districts | 605,900 | 25,000 | 630,900 | 269,500 | .. | 361,400 |
| Tramway district | 15,150 | 20,000 | 35,150 | 20,000 | .. | 15,150 |
| Electric-power district | 1,990,721 | 1,972,050 | 3,962,771 | 1,876,350 | 115,000 | 1,971,421 |
| Harbour Boards | 2,382,850 | 765,000 | 3,147,850 | 479,500 | .. | 2,668,350 |
| Totals | 10,528,281 | 5,902,796 | 16,431,077 | 6,153,062 | 252,264 | 10,025,751 |
Of the unexpired loan balance of £10,025,751 at 31st March, 1926, boroughs wore responsible for £3,314,466, or 33 per cent.; Harbour Boards for £2,668,350 (26 per cent.); electric-power districts for £1,971,421 (19 per cent.); and counties for £1,240,993 (12 per cent.).
Table of Contents
THE system of separately assessing the value of the land itself and the value of the buildings and improvements effected thereon was first put into practice in New Zealand for the purposes of State taxation on the passing of the Land-tax Act, 1878, under which a tax was levied on land-values, the impost being ½d. in the pound on the capital value of real estate, less the assessed value of the improvements.
The Land-tax Act, 1878, was superseded by the Property-tax Act, 1879, which provided for the levy of a uniform tax of 1d. in the pound on the capital value of all property—real and personal—above the amount of £500 in value.
The Property-tax Act, 1379, was in its turn superseded by the Land and Income Assessment Act, 1891. Under this enactment a land-tax was imposed on land and mortgages of land, with an exemption for improvements on land up to £3,000. An exemption from income-tax was also allowed on all incomes derived from land and mortgages of land.
Two years later, under the provisions of the Land and Income Assessment Acts Amendment Act, 1893, all improvements on land were entirely exempted.
An endeavour to extend the principle of general exclusion of improvements to local taxation resulted in the passing of the Rating on Unimproved Value Act, 1896, which gave ratepayers of local districts the option of deciding that equivalent rates on the unimproved values of lands in their district should be substituted for the rates levied on the full capital values or on the annual values.
The valuing of land up to the year 1896 was not conducted on a uniform basis. Each State Department and each local authority worked quite independently, and employed as valuers whom it thought lit. The Land-tax Department periodically employed a small army of temporary valuers when it required a new valuation of lands for taxation purposes, and each local authority had its own particular method of making up its roll for the levying of rates. Estimates of values arrived at by various authorities varied to a dangerous degree. Some values were very high, being based on speculative prices, while many were extremely low Frequently the same property had several values assigned to it.
In order to overcome as far as possible the obvious defects of the old system it was decided to establish a new system of valuation, by which all valuations required by State Departments—whether for loan, taxation, or other purposes—and by local authorities that rate on the capital or unimproved value, should be made by valuers employed by the State at fixed salaries and responsible to the Government alone.
The Government Valuation of Land Act, 1896, was in due course passed. This Act provided for the setting-up of a separate Department of State charged with the duty of estimating the values of real estate in the Dominion for taxation and other purposes of the General Government, and for local-rating purposes.
The existing law relating to the valuation of land in New Zealand is contained in the Valuation of Land Act, 1925 (which is a consolidation of previous legislation on the subject), and its amendment of 1926.
The work of the Valuation Department is directed by the Valuer-General. The actual work of valuation is done by District Valuers and assistant valuers. The former are permanent officers, while the latter are temporarily employed to make valuations at such times and on such terms and conditions as are found necessary Assistant valuers are remunerated by fees.
A valuation made by an assistant valuer or local valuer is subject to endorsement by the District Valuer before it is accepted by the Valuer-General.
The essential qualifications of a valuer who is employed in a country district are local knowledge of land-values and a practical knowledge of farming pursuits, both agricultural and pastoral, and of values of improvements. A valuer who is employed in a city or suburban district must have a special knowledge of building-construction and of the values of all kinds of improvements in addition to a knowledge of land-values.
The Dominion is divided for administrative purposes into convenient valuation districts, to each of which is assigned a District Valuer, whose functions are not, however, confined to a specific district, but may be exercised in such districts as the Valuer-General from time to time directs.
The duty of a valuer is to examine each property and to estimate to the best of his ability (1) the unimproved value of the land contained therein, (2) the value of the buildings (if any) or other improvements (if any) upon such land, and (3) the “capital value” of the property.
The definition of “land” in the Valuation of Land Act, 1925, as amended in 1926, is as follows: “‘Land' means all land, tenements, and hereditaments, whether corporeal or incorporeal, in New Zealand, and all chattel or other interests therein, and all trees or flax growing or standing thereon: Provided that the value of any trees that have been planted (other than fruit-trees or live hedges), and the value of any trees that have been preserved for shelter or ornamental purposes, shall not be included in any valuation appearing in a valuation roll supplied by the Valuer-General to a local authority pursuant to section 38 hereof.”
“Unimproved value” is defined in the Valuation of Land Act, 1925, as follows: “‘Unimproved value' of any land means the sum which the owner's estate or interest therein, if unencumbered by any mortgage or other charge thereon, might be expected to realize at the time of valuation if offered for sale on such reasonable terms and conditions as a bona fide seller might be expected to impose, and if no improvements had been made on the said land.”
Under the New Zealand law the increased value attaching to any piece of land which is due to the successful working of other lands in the district, or to State or local body expenditure on public works, or to the general prosperity and development of the country, forms portion of the “unimproved value.” Any increased value, however, which is represented by the improvements effected by the individual possessor, either past or present, does not form part of the “unimproved value.”
Valuers are enjoined not to strain after high values, nor to accept isolated “boom” prices, values involved in exchanges of land, or special prices paid for land under exceptional circumstances, as a standard of value, but to determine the value neither above nor below the fair selling-value in view of the many and diverse purposes for which the values are used.
The Valuation of Land Act defines “improvements” as follows: “‘Improvements' on land means all work done or material used at any time on or for the benefit of the land by the expenditure of capital or labour by any owner or occupier thereof in so far as the effect of the work done or material used is to increase the value of the land, and the benefit thereof is unexhausted at the time of valuation; but does not include work done or material used on or for the benefit of the land by the Crown or by any statutory public body, except so far as the same has been paid for by the owner or occupier either by way of direct contribution or by way of special rates on loans raised for the purpose of constructing within a county any road, bridge, irrigation-works, water-races, drainage-works, or river-protection works: Provided that the value of improvements made out of loan-moneys raised for the purpose of constructing within a county any road, bridge, irrigation-works, water-races, drainage-works, or river-protection works as aforesaid shall not exceed the amount of principal estimated by the Valuer-General to have been repaid by the owner in respect of any such loan by way of special rates.”
Subject to the limitations contained in the above definition, all buildings, fencing, planting, draining, constructing of private roads and water-races, clearing of timber, &c., permanent grassing, and all other work of a permanent nature effected upon or for the benefit of land are improvements. No work can, however, be considered an improvement if the benefit thereof is exhausted at the date of valuation.
The Valuation of Land Act defines “value of improvements” as “the added value which at the date of valuation the improvements give to the land.”
“Capital value” is defined as follows: “‘Capital value' of land means the sum which the owner's estate or interest therein, if unencumbered by any mortgage or other charge thereon, might be expected to realize at the time of valuation if offered for sale on such reasonable terms and conditions as a bona fide seller might be expected to require.”
The capital value is the fair selling-value in the open market, but not the auction value or value derivable at a forced sale.
Land containing or supposed to contain oil, coal, or other mineral deposits is valued as for the surface use only, and is of the same unimproved value as similar land in the neighbourhood (always without any regard to speculative mineral value) until the oil or minerals are produced, when the profits (if any) will be duly valued.
The Valuation of Land Act directs that a valuation roll shall be prepared for each district setting forth in respect of each separate property the following particulars: —
The name of the owner of the land and the nature of his estate or interest therein, together with the name of the beneficial owner in the case of land held in trust:
The name of the occupier within the meaning of the Rating Act.:
The situation, description, and area of the land:
The nature and value of the improvements on the land:
The unimproved value of the land:
The capital value of the land:
Such other particulars as are prescribed.
The district valuation roll so long as it continues in force is by law the roll from which the valuation roll of every local authority rating on the capital or on the unimproved value is framed.
The district valuation rolls may be revised by the Valuer-General as at such date or dates as the Governor-General in Council from time to time directs, and the revision may relate either to all the properties on a valuation roll or to any of them. There are no fixed periods between one general revision and the next, the periods varying considerably as between recently-settled and old-established districts. The necessity for revision really depends upon the extent to which values have moved since the last revision.
After the values in a district have been revised a new valuation roll is prepared, and the Valuer-General addresses to each person whose name appears thereon a notice setting forth the values at which his property is entered, and naming a date on or before which all objections to the values must be lodged. An objection to the valuation must be made in writing.
The Valuer-General refers objections to values to the District Valuer to enable him to review valuations before the sitting of the Assessment Court. If after careful reconsideration by the District Valuer it is decided that an objection shall be allowed or a reasonable compromise effected, the valuation is altered accordingly. On the other hand, if the Valuer-General is in possession of evidence that the valuer's estimates are fair, but the objector will not accept them, the objection is heard and determined by the Assessment Court.
The Assessment Court consists of three members, of whom one—the President—is a barrister or solicitor of the Supreme Court of New Zealand, appointed by the Governor-General in Council. Of the other two members of the Court, one member is appointed by the Governor-General in Council, and the other by the local authority of the district whose roll has been revised, or by two or more local authorities acting in unison, provided the appointee is not a member or a paid officer of any local authority. If the local authority fails to appoint an assessor, then the appointment is made by the Governor-General in Council. If the objection is allowed, the reduction is immediately entered on the valuation roll. If the objection is disallowed, the owner may, within fourteen days after the hearing by the Assessment Court, give notice to the Valuer-General that he requires the capital value to be reduced to the value which he (the objector) considers to be the fair selling-value as specified in his notice, or the land to be acquired on behalf of His Majesty at that value.
If the Valuer-General is of opinion that the Assessment Court has made an unfair reduction in a valuation he may, within fourteen days of the hearing, require the owner to consent to what he (the Valuer-General) considers is the fair selling capital value, and, failing such consent being given within thirty days after notice is delivered at his address, he may, with the approval of the Governor-General in Council, acquire the property at that value on behalf of His Majesty.
The decision of the Assessment Court on any objection before it is subject to appeal to the Supreme Court on a question of law. On all other questions the decision of the Assessment Court is final.
General valuations of land for the whole of New Zealand were made periodically up to the year 1897–98. Since that year no general valuations for the whole Dominion have been made, but portions are revalued from time to time. The figures in the following table, showing valuations over a number of years, therefore represent general valuations up to 1897 only, while for subsequent years the figures have been revised to include the latest valuations of small divisions.
In the twenty-four years from 1878 to 1902 the value, both of land and of improvements, increased by slightly over 50 per cent. In the eighteen years from 1902 to 1920, as the effect of a long period of prosperity, the total valuations more than trebled, while in the five years that have elapsed since 1920 unimproved values have increased by over £48,000,000 and capital values by over £117,000,000.
| CAPITAL AND UNIMPROVED VALUES, 1878–1925. | ||
|---|---|---|
| Year. | Capital Value (Land and Improvements). | Unimproved Value of Land (included in previous Column). |
| £ | £ | |
| 1878 | 99,566,679 | 62,573,868 |
| 1882 | 101,000,000 | .. |
| 1885 | 113,270,649 | .. |
| 1888 | 111,137,714 | 75,497,379 |
| 1891 | 122,225,029 | 75,832,465 |
| 1897 | 138,591,347 | 84,401,244 |
| 1902 | 154,816,132 | 94,847,727 |
| 1905 | 197,684,475 | 122,937,126 |
| 1907 | 236,644,536 | 149,682,689 |
| 1909 | 271,516,022 | 172,759,948 |
| 1910 | 277,630,083 | 175,289,861 |
| 1911 | 293,117,065 | 184,062,798 |
| 1912 | 315,503,213 | 199,184,261 |
| 1913 | 340,559,728 | 212,963,468 |
| 1914 | 365,342,237 | 228,493,376 |
| 1915 | 371,076,683 | 230,705,147 |
| 1916 | 389,164,729 | 241,322,255 |
| 1917 | 405,466,071 | 251,087,708 |
| 1918 | 421,383,373 | 260,921,812 |
| 1919 | 445,533,445 | 275,988,409 |
| 1920 | 470,093,697 | 290,880,264 |
| 1921 | 518,584,318 | 317,631,245 |
| 1922 | 544,503,376 | 329,174,337 |
| 1923 | 553,403,794 | 330,790,991 |
| 1924 | 568,500,653 | 333,869,581 |
| 1925 | 587,349,575 | 339,310,260 |
Information covering the last ten years as to the gross capital and unimproved values in the North and South Islands and in the whole Dominion is given in the following table, which also shows the separate totals for counties, boroughs, and town districts (independent of county jurisdiction).
| GROSS VALUES, 1916–25. | |||||||
|---|---|---|---|---|---|---|---|
| Year. | Number. | North Island. | South Island.* | New Zealand. | |||
| Capital Value (Land and Improvements). | Unimproved Value of Land (included in previous Column). | Capital Value (Land and Improvements). | Unimproved Value of Land (included in previous Column). | Capital Value (Land and Improvements). | Unimproved Value of Land (included in previous Column). | ||
* Including Stewart Island and Chatham Islands. | |||||||
| £ | £ | £ | £ | £ | £ | ||
| Counties. | |||||||
| 1916 | 125 | 146,242,118 | 97,379,015 | 96,811,084 | 71,199,250 | 243,053,202 | 168,578,265 |
| 1917 | 125 | 154,477,641 | 102,981,689 | 100,636,688 | 74,108,106 | 255,114,329 | 177,089,795 |
| 1918 | 125 | 164,928,221 | 109,611,569 | 103,714,879 | 76,670,835 | 268,643,100 | 186,282,404 |
| 1919 | 127 | 182,705,967 | 120,687,776 | 108,086,615 | 80,086,519 | 290,792,582 | 200,774,295 |
| 1920 | 129 | 192,504,367 | 126,201,659 | 114,988,297 | 85,947,072 | 307,492,664 | 212,148,731 |
| 1921 | 129 | 206,439,797 | 134,007,675 | 125,642,531 | 93,566,567 | 332,082,328 | 227,574,242 |
| 1922 | 129 | 210,502,471 | 135,866,105 | 127,069,782 | 94,059,679 | 337,572,253 | 229,925,784 |
| 1923 | 129 | 212,365,004 | 136,619,976 | 125,801,994 | 93,108,293 | 338,166,998 | 229,728,269 |
| 1924 | 129 | 214,571,989 | 137,323,119 | 126,047,703 | 93,131,206 | 340,619,692 | 230,454,325 |
| 1925 | 129 | 217,347,187 | 138,452,089 | 126,696,666 | 93,162,705 | 344,043,853 | 231,614,794 |
| Boroughs. | |||||||
| 1916 | 116 | 92,902,160 | 50,443,309 | 48,313,999 | 20,050,424 | 141,216,159 | 70,493,733 |
| 1917 | 115 | 96,207,345 | 51,510,819 | 48,770,852 | 20,018,500 | 144,978,197 | 71,529,319 |
| 1918 | 118 | 97,648,139 | 51,772,269 | 49,660,419 | 20,353,456 | 147,308,558 | 72,130,725 |
| 1919 | 117 | 98,520,644 | 51,910,886 | 50,615,526 | 20,737,636 | 149,136,170 | 72,648,522 |
| 1920 | 116 | 103,409,093 | 53,707,077 | 52,511,730 | 21,877,277 | 155,920,823 | 75,584,354 |
| 1921 | 117 | 119,091,896 | 61,297,945 | 60,050,052 | 25,330,805 | 179,141,948 | 86,628,750 |
| 1922 | 118 | 137,157,309 | 70,173,035 | 62,096,949 | 25,594,465 | 199,254,258 | 95,767,500 |
| 1923 | 118 | 142,049,548 | 71,059,184 | 64,572,622 | 26,200,198 | 206,622,170 | 97,259,382 |
| 1924 | 118 | 153,284,674 | 73,591,427 | 67,069,287 | 26,435,569 | 220,353,961 | 100,026,996 |
| 1925 | 118 | 165,944,934 | 77,762,005 | 69,402,512 | 26,505,881 | 235,347,446 | 104,267,886 |
| Independent Town Districts. | |||||||
| 1916 | 35 | 4,273,975 | 1,989,761 | 621,393 | 260,496 | 4,895,368 | 2,250,257 |
| 1917 | 36 | 4,732,948 | 2,207,633 | 640,597 | 260,961 | 5,373,545 | 2,468,594 |
| 1918 | 36 | 4,820,083 | 2,255,646 | 611,632 | 253,037 | 5,431,715 | 2,508,683 |
| 1919 | 37 | 4,941,519 | 2,301,302 | 663,174 | 264,290 | 5,604,693 | 2,565,592 |
| 1920 | 39 | 5,979,357 | 2,851,680 | 700,853 | 295,499 | 6,680,210 | 3,147,179 |
| 1921 | 36 | 6,663,746 | 3,126,936 | 696,296 | 301,317 | 7,360,042 | 3,128,253 |
| 1922 | 36 | 6,944,401 | 3,175,747 | 732,464 | 305,306 | 7,676,865 | 3,481,053 |
| 1923 | 41 | 7,747,912 | 3,457,862 | 866,714 | 345,478 | 8,614,626 | 3,803,340 |
| 1924 | 39 | 6,644,556 | 3,042,977 | 862,444 | 345,283 | 7,527,000 | 3,388,260 |
| 1925 | 40 | 7,043,127 | 3,081,319 | 915,149 | 346,261 | 7,958,276 | 3,427,580 |
| Grand Totals. | |||||||
| 1916 | .. | 243,418,253 | 149,812,085 | 145,746,476 | 91,510,170 | 389,164,729 | 241,322,255 |
| 1917 | .. | 255,417,934 | 156,700,141 | 150,048,137 | 94,387,567 | 405,466,071 | 251,087,708 |
| 1918 | .. | 267,396,443 | 163,639,484 | 153,986,930 | 97,282,328 | 421,383,373 | 260,921,812 |
| 1919 | .. | 286,168,130 | 174,899,964 | 159,365,315 | 101,088,445 | 445,533,445 | 275,988,409 |
| 1920 | .. | 301,892,817 | 182,760,416 | 168,200,880 | 108,119,848 | 470,093,697 | 290,880,264 |
| 1921 | .. | 332,195,439 | 198,432,556 | 186,388,879 | 119,198,689 | 518,584,318 | 317,631,245 |
| 1922 | .. | 354,604,181 | 209,214,887 | 189,899,195 | 119,959,450 | 544,503,376 | 329,174,337 |
| 1923 | .. | 362,162,464 | 211,137,022 | 191,241,330 | 119,653,969 | 553,403,794 | 330,790,991 |
| 1924 | .. | 374,501,219 | 213,957,523 | 193,999,434 | 119,912,058 | 568,500,653 | 333,869,581 |
| 1925 | .. | 390,335,248 | 219,295,413 | 197,014,327 | 120,014,847 | 587,349,575 | 339,310,260 |
The values shown in the preceding table are, as stated, the gross values; they include the value not only of rateable properties, but also of churches, schools, unoccupied Crown lands, and other lands exempt from local rating. A summary of rateable values for the year 1925 is next given.
| RATEABLE VALUES, 1925.—SUMMARY. | ||||||
|---|---|---|---|---|---|---|
| — | North Island. | South Island.* | New Zealand. | |||
| Capital Value (Land and Improvements). | Unimproved Value of Land (included in previous Column). | Capital Value (Land and Improvements). | Unimproved Value of Land (included in previous Column). | Capital Value (Land and Improvements). | Unimproved Value of Land (included in previous Column). | |
* Including Stewart Island and Chatham Islands. | ||||||
| £ | £ | £ | £ | £ | £ | |
| Counties | 208,912,325 | 132,563,322 | 121,733,154 | 90,024,448 | 330,645,479 | 222,587,770 |
| Boroughs | 150,044,984 | 69,063,076 | 62,630,715 | 23,796,031 | 212,675,699 | 92,859,107 |
| Town districts (independent) | 6,569,060 | 2,896,906 | 842,454 | 323,719 | 7,411,514 | 3,220,625 |
| Totals | 365,526,369 | 204,523,304 | 185,206,323 | 114,144,198 | 550,732,692 | 318,667,502 |
As has been pointed out previously, the figures shown for 1925 and other years subsequent to 1898 do not represent general revaluations of the whole Dominion in the years shown. Revaluations are made, district by district, as circumstances permit, or as the progress of the district renders advisable. An analysis of the gross capital value shown for the year 1925 gives the following results: —
| GROSS CAPITAL VALUES.—YEAR OF VALUATION. | ||||
|---|---|---|---|---|
| Last revised as at April in Year | Counties. | Boroughs. | Town Districts (Independent). | Total. |
| £ | £ | £ | £ | |
| 1897 | 161,629 | .. | .. | 161,629 |
| 1898 | 17,984 | 76,567 | .. | 94,491 |
| 1902 | .. | 25,311 | .. | 25,311 |
| 1904 | .. | 31,027 | .. | 31,027 |
| 1905 | .. | 310,902 | .. | 310,902 |
| 1906 | .. | 313,477 | .. | 313,477 |
| 1907 | .. | 875,248 | .. | 875,248 |
| 1908 | .. | 341,858 | 62,943 | 404,801 |
| 1909 | .. | 42,775 | .. | 42,775 |
| 1910 | .. | 260,741 | .. | 260,741 |
| 1911 | .. | 892,585 | .. | 892,585 |
| 1912 | .. | 120,137 | 361,738 | 481,875 |
| 1913 | 6,479,964 | 174,537 | 33,771 | 6,688,272 |
| 1914 | 5,026,537 | 3,078,860 | 1,004,280 | 9,109,677 |
| 1915 | 3,901,375 | 6,505,525 | .. | 10,406,900 |
| 1916 | 12,382,423 | 10,075,877 | 122,454 | 22,580,754 |
| 1917 | 22,838,605 | 5,238,020 | 168,205 | 28,244,830 |
| 1918 | 30,973,602 | 2,975,701 | 559,197 | 34,508,500 |
| 1919 | 64,111,273 | 4,351,934 | 130,760 | 68,593,967 |
| 1920 | 43,550,444 | 14,757,734 | 596,774 | 58,904,952 |
| 1921 | 99,705,197 | 88,947,152 | 2,517,911 | 191,170,260 |
| 1922 | 29,925,351 | 56,507,475 | 739,975 | 87,172,801 |
| 1923 | 1,742,640 | 7,542,522 | 157,085 | 9,442,247 |
| 1924 | 7,962,239 | 8,410,043 | 1,068,568 | 17,440,850 |
| 1925 | 15,264,590 | 23,491,498 | 434,615 | 39,190,703 |
| Totals | 344,043,853 | 235,347,446 | 7,958,276 | 587,349,575 |
It should be explained that in those few cases where a borough, town district, or local division of a county has been valued partly in one year and partly in another, and information is not available as to the amounts represented by the valuations in the respective years, the whole district has been included in the latest of the years shown. Napier Borough, for instance, was revised partly in 1914 and partly in 1917, but is wholly included in the 1917 figures shown above.
Those districts which have not been revalued during, say, the last ten years may be regarded as having made little or no progress since the last valuation, which has accordingly been allowed to stand. Fiord County, with a gross capital value of £144,295 and a rateable capital value of only £15,831, has not been revalued since 1897, nor have certain islands.
The gross capital and unimproved values for each county, borough, and independent town district as in 1925 are next given. The particulars for component parts of administrative counties—viz., road districts, dependent town districts, and portions of outlying country—are given in the “Local Authorities Handbook of New Zealand.”
| TABLE SHOWING GROSS CAPITAL AND UNIMPROVED VALUES OF EACH COUNTY IN NEW ZEALAND. | ||
|---|---|---|
| County. | Capital Value (Land and Improvements). | Unimproved Value of Land (included in previous Column). |
| £ | £ | |
| Mongonui | 919,510 | 550,356 |
| Whangaroa | 285,686 | 179,824 |
| Bay or Islands | 1,890,772 | 1,085,945 |
| Hokianga | 1,267,922 | 759,593 |
| Whangarei | 4,758,184 | 2,279,557 |
| Hobson | 2,162,647 | 1,287,003 |
| Otamatea | 1,732,324 | 962,362 |
| Rodney | 1,794,519 | 934,658 |
| Waitemata | 4,054,717 | 2,703,407 |
| Eden | 6,456,111 | 3,403,231 |
| Manukau | 4,282,349 | 2,940,940 |
| Franklin | 5,660,469 | 3,791,098 |
| Great Barrier Island | 133,758 | 108,440 |
| Islands— | ||
| Little Barrier, Waiheke, &c. | 547,567 | 368,647 |
| Waikato | 4,849,471 | 3,395,470 |
| Raglan | 3,701,846 | 2,370,837 |
| Waipa | 5,870,311 | 3,976,560 |
| Coromandel | 689,658 | 391,620 |
| Thames | 653,591 | 439,104 |
| Hauraki Plains | 1,714,450 | 1,372,340 |
| Ohinemuri | 724,867 | 457,000 |
| Tauranga | 1,825,024 | 1,070,350 |
| Piako | 3,808,230 | 2,588,840 |
| Matamata | 3,115,185 | 1,919,929 |
| Rotorua | 1,073,938 | 648,342 |
| Whakatane | 2,400,057 | 1,484,502 |
| Taupo | 707,130 | 485,074 |
| Taumarunui | 989,559 | 720,724 |
| Ohura | 1,983,276 | 1,166,955 |
| Kawhia | 991,982 | 581,965 |
| Waitomo | 3,648,615 | 2,233,657 |
| Otorohanga | 2,166,175 | 1,469,760 |
| Islands—Motiti | 33,120 | 19,150 |
| Opotiki | 2,408,494 | 1,323,849 |
| Matakaoa | 1,065,895 | 583,984 |
| Waiapu | 3,802,030 | 2,008,872 |
| Uawa | 1,742,640 | 1,128,930 |
| Waikohu | 5,107,984 | 3,105,522 |
| Cook | 6,504,289 | 4,376,666 |
| Wairoa | 3,838,960 | 2,454,190 |
| Hawke's Bay | 10,967,799 | 8,197,579 |
| Waipawa | 2,972,985 | 2,112,214 |
| Waipukurau | 915,432 | 681,849 |
| Dannevirke | 3,389,249 | 2,232,947 |
| Woodville | 2,040,990 | 1,471,627 |
| Patangata | 4,635,952 | 3,604,621 |
| Weber | 739,810 | 487,007 |
| Clifton | 1,515,467 | 851,375 |
| Taranaki | 2,765,571 | 1,528,768 |
| Inglewood | 1,439,363 | 679,551 |
| Egmont | 1,661,765 | 880,581 |
| Stratford | 3,343,488 | 2,105,089 |
| Whangamomona | 1,035,259 | 558,363 |
| Waimate West | 2,101,522 | 1,540,464 |
| Eltham | 3,027,662 | 1,772,529 |
| Hawera | 4,247,520 | 3,076,004 |
| Patea | 3,615,511 | 2,383,946 |
| Waitotara | 2,730,781 | 1,841,379 |
| Waimarino | 2,371,281 | 1,375,873 |
| Wanganui | 3,161,745 | 1,865,949 |
| Rangitikei | 10,024,412 | 6,274,344 |
| Kiwitea | 3,412,067 | 2,218,526 |
| Pohangina | 1,778,492 | 1,139,755 |
| Kaitieke | 1,496,909 | 981,748 |
| Manawatu | 3,620,810 | 2,561,053 |
| Oroua | 3,112,938 | 2,138,108 |
| Kairanga | 4,853,785 | 3,363,880 |
| Horowhenua | 5,387,713 | 3,719,716 |
| Islands— | ||
| Kapiti, Mana, and Somes | 17,984 | 13,378 |
| Chatham Islands | 285,864 | 195,893 |
| Pahiatua | 2,546,785 | 1,434,335 |
| Akitio | 1,184,367 | 606,485 |
| Castlepoint | 827,807 | 534,278 |
| Eketahuna | 1,851,447 | 1,007,612 |
| Mauriceville | 539,800 | 303,375 |
| Masterton | 4,330,779 | 2,730,223 |
| Wairarapa South | 3,021,598 | 1,768,262 |
| Featherston | 4,687,984 | 2,992,229 |
| Hutt | 3,517,354 | 1,777,408 |
| Makara | 1,091,692 | 507,406 |
| Collingwood | 457,640 | 277,507 |
| Takaka | 712,307 | 396,802 |
| Waimea | 3,189,857 | 1,764,354 |
| Sounds | 799,717 | 482,309 |
| Marlborough | 5,058,768 | 3,687,983 |
| Awatere | 2,242,808 | 1,756,424 |
| Buller | 1,447,223 | 766,630 |
| Murchison | 726,753 | 440,300 |
| Inangahua | 764,723 | 400,619 |
| Grey | 1,041,643 | 640,159 |
| Westland | 1,178,100 | 825,842 |
| Kaikoura | 1,682,443 | 1,217,209 |
| Cheviot | 1,764,293 | 1,438,257 |
| Amuri | 2,603,069 | 2,107,602 |
| Waipara | 4,311,754 | 3,698,281 |
| Ashley | 1,139,696 | 914,675 |
| Kowai | 1,672,753 | 1,372,085 |
| Oxford | 1,162,012 | 950,401 |
| Rangiora | 1,816,482 | 1,477,863 |
| Eyre | 1,717,370 | 1,392,135 |
| Waimairi | 3,315,097 | 1,694,145 |
| Paparua | 2,361,861 | 1,569,491 |
| Malvern | 2,587,986 | 2,044,590 |
| Tawera | 576,414 | 477,954 |
| Heathcote | 1,506,128 | 730,370 |
| Halswell | 857,664 | 684,029 |
| Selwyn | 1,733,302 | 1,396,497 |
| Springs | 1,267,275 | 1,034,425 |
| Ellesmere | 2,780,377 | 2,319,317 |
| Mount Herbert | 730,240 | 661,358 |
| Wairewa | 1,541,289 | 1,271,574 |
| Akaroa | 2,701,488 | 2,296,308 |
| Ashburton | 11,718,929 | 9,800,469 |
| Geraldine | 3,539,865 | 2,874,674 |
| Levels | 3,671,703 | 2,966,190 |
| Mackenzie | 2,984,533 | 2,286,873 |
| Waimate | 6,759,201 | 5,544,216 |
| Waitaki | 5,304,960 | 4,082,875 |
| Maniototo | 1,475,916 | 1,035,669 |
| Waihemo | 820,538 | 599,214 |
| Waikouaiti | 1,266,526 | 800,989 |
| Peninsula | 666,464 | 345,022 |
| Taieri | 2,338,937 | 1,655,909 |
| Tuapeka | 2,523,234 | 1,674,648 |
| Bruce | 1,794,470 | 1,186,526 |
| Clutha | 3,197,920 | 1,982,143 |
| Islands— | ||
| Quarantine and Goat | 3,454 | 900 |
| Vincent | 1,620,497 | 1,058,070 |
| Lake | 551,453 | 405,614 |
| Fiord | 144,295 | 137,513 |
| Wallace | 3,703,591 | 2,563,105 |
| Southland | 14,628,701 | 9,650,728 |
| Stewart Island | 230,200 | 174,090 |
| Islands— | ||
| Antipodes, &c. | 13,880 | 13,880 |
| TABLE SHOWING GROSS CAPITAL AND UNIMPROVED VALUES OF EACH BOROUGH IN NEW ZEALAND. | ||
|---|---|---|
| Borough. | Capital Value (Land and Improvements). | Unimproved Value of Land (included in previous Column). |
| £ | £ | |
| Whangarei | 2,299,627 | 996,486 |
| Dargaville | 740,523 | 264,395 |
| Birkenhead | 783,733 | 362,593 |
| Devonport | 2,430,944 | 1,009,301 |
| AUCKLAND CITY— | ||
| City Portion | 27,095,118 | 16,331,180 |
| Parnell ,, | 2,005,940 | 1,052,175 |
| Grey Lynn ,, | 2,317,232 | 822,392 |
| Arch Hill ,, | 446,515 | 184,290 |
| Eden Terrace ,, | 532,345 | 223,200 |
| Point Chevalier ,, | 928,620 | 442,475 |
| Epsom ,, | 2,592,105 | 1,174,740 |
| Remuera ,, | 4,848,558 | 2,229,043 |
| Total of City | 40,766,433 | 22,459,495 |
| Newmarket | 1,436,939 | 806,200 |
| Onehunga | 1,570,536 | 522,101 |
| Takapuna | 2,073,596 | 1,044,110 |
| Northcote | 577,430 | 280,860 |
| Mount Albert | 3,582,405 | 1,271,372 |
| Avondale | 985,638 | 185,662 |
| Mount Eden | 5,075,168 | 2,094,378 |
| Otahuhu | 682,024 | 274,070 |
| Pukekohe | 887,675 | 468,552 |
| Hamilton | 6,330,552 | 3,027,091 |
| Cambridge | 743,258 | 340,233 |
| Ngaruawahia | 199,533 | 93,463 |
| Te Awamutu | 614,461 | 322,951 |
| Thames | 922,224 | 331,586 |
| Tauranga | 791,797 | 416,552 |
| Paeroa | 412,685 | 188,699 |
| Waihi | 309,907 | 41,842 |
| Morrinsville | 631,270 | 290,365 |
| Te Aroha | 634,825 | 288,510 |
| Rotorua | 1,661,158 | 1,007,989 |
| Whakatane | 466,353 | 191,055 |
| Taumarunui | 454,762 | 201,204 |
| Te Kuiti | 596,812 | 333,189 |
| Opotiki | 365,488 | 184,920 |
| Gisborne | 5,565,465 | 2,455,905 |
| Wairoa | 696,867 | 364,710 |
| Napier | 3,937,457 | 1,683,445 |
| Hastings | 3,051,639 | 1,525,872 |
| Dannevirke | 1,296,341 | 500,507 |
| Woodville | 174,537 | 60,616 |
| Waipawa | 275,703 | 141,969 |
| Waipukurau | 395,855 | 160,914 |
| New Plymouth | 4,290,194 | 1,740,512 |
| Hawera | 1,734,082 | 770,390 |
| Patea | 158,255 | 57,541 |
| Waitara | 260,741 | 84,439 |
| Inglewood | 227,057 | 88,179 |
| Stratford | 1,006,533 | 455,041 |
| Eltham | 568,482 | 200,854 |
| Wanganui City | 7,605,743 | 3,404,992 |
| Marton | 730,894 | 215,707 |
| Raetihi | 289,393 | 121,625 |
| Ohakune | 143,126 | 47,368 |
| Taihape | 645,169 | 332,537 |
| Feilding | 1,078,483 | 422,517 |
| Palmerston North | 6,153,223 | 2,433,225 |
| Foxton | 300,365 | 114,698 |
| WELLINGTON CITY— | ||
| City Portion | 24,646,344 | 13,760,136 |
| Wadestown ,, | 698,031 | 243,220 |
| Northland ,, | 742,241 | 224,508 |
| Melrose— | ||
| Kilbirnie | 3,947,098 | 991,388 |
| Island Bay ,, | 1,231,370 | 353,505 |
| Ohiro | 2,098,350 | 570,031 |
| Onslow ,, | 887,168 | 297,756 |
| Karori ,, | 745,397 | 299,001 |
| Miramar ,, | 1,668,294 | 524,809 |
| Total of City | 36,664,293 | 17,264,354 |
| Shannon | 207,780 | 88,249 |
| Levin | 636,796 | 219,586 |
| Otaki | 368,239 | 181,654 |
| Pahiatua | 313,477 | 96,947 |
| Masterton | 2,363,332 | 856,786 |
| Carterton | 341,858 | 102,470 |
| Greytown | 284,519 | 100,610 |
| Lower Hutt | 2,358,179 | 1,005,541 |
| Petone | 1,958,252 | 624,560 |
| Eketahuna | 162,459 | 45,432 |
| Featherston | 187,988 | 46,834 |
| Eastbourne | 484,402 | 146,195 |
| Richmond | 248,989 | 118,452 |
| Nelson City | 2,081,059 | 862,297 |
| Picton | 352,375 | 152,360 |
| Blenheim | 1,539,195 | 590,928 |
| Motueka | 318,447 | 156,839 |
| Westport | 740,193 | 358,651 |
| Greymouth | 892,585 | 266,219 |
| Brunner | 76,507 | 17,505 |
| Kumara | 31,027 | 6,315 |
| Hokitika | 396,611 | 89,022 |
| Ross | 25,311 | 7,662 |
| Runanga | 56,484 | 18,741 |
| Rangiora | 545,425 | 170,445 |
| Kaiapoi | 330,038 | 89,663 |
| CHRISTCHURCH CITY— | ||
| St. Albans Portion | 3,999,424 | 1,313,333 |
| North Richmond ,, | 329,134 | 74,190 |
| Papanui ,, | 662,725 | 246,795 |
| Richmond ,, | 289,440 | 96,965 |
| North-east ,, | 940,547 | 379,000 |
| North-west ,, | 3,002,630 | 1,630,565 |
| South-east | 2,130,170 | 986,728 |
| South-west ,, | 4,899,460 | 2,789,958 |
| Sydenham ,, | 2,464,439 | 829,180 |
| Opawa ,, | 249,610 | 98,800 |
| St. Martin's ,, | 165,210 | 58,080 |
| Beckenham-Fisherton ,, | 329,134 | 74,190 |
| Linwood ,, | 1,883,262 | 585,660 |
| Avonside ,, | 217,085 | 70,595 |
| Bromley Ward ,, | 111,620 | 33,936 |
| Spreydon Portion ,, | 1,148,370 | 342,345 |
| Woolston ,, | 782,655 | 265,651 |
| Total of City | 23,604,915 | 9,875,970 |
| New Brighton | 806,526 | 282,246 |
| Sumner | 780,950 | 322,747 |
| Lyttelton | 647,745 | 231,680 |
| Akaroa | 166,828 | 74,541 |
| Riccarton | 932,330 | 268,808 |
| Ashburton | 703,221 | 274,394 |
| Timaru | 4,009,275 | 1,591,812 |
| Geraldine | 193,005 | 50,790 |
| Temuka | 404,465 | 130,980 |
| Waimate | 472,835 | 129,170 |
| Oamaru | 1,605,035 | 553,770 |
| Hampden | 32,277 | 9,657 |
| Naseby | 20,863 | 2,583 |
| Palmerston | 118,293 | 29,718 |
| Waikouaiti | 113,182 | 39,818 |
| Port Chalmers | 375,981 | 120,778 |
| West Harbour | 240,567 | 73,692 |
| DUNEDIN CITY— | ||
| Valley Portion | 893,896 | 285,749 |
| Maori Hill ,, | 812,221 | 239,875 |
| Roslyn ,, | 1,517,513 | 476,900 |
| Mornington ,, | 972,114 | 258,880 |
| Leith ,, | 4,224,413 | 1,817,041 |
| Central ,, | 4,903,512 | 2,199,010 |
| Caversham and South Dunedin Portion | 2,235,961 | 662,420 |
| Anderson's Bay Portion | 750,050 | 213,116 |
| Total of City | 16,309,680 | 6,152,990 |
| St. Kilda | 1,600,270 | 395,170 |
| Green Island | 396,725 | 85,490 |
| Mosgiel | 286,475 | 95,730 |
| Roxburgh | 42,790 | 6,004 |
| Lawrence | 111,254 | 29,754 |
| Tapanui | 42,775 | 9,075 |
| Milton | 226,423 | 55,991 |
| Balclutha | 317,540 | 111,082 |
| Kaitangata | 112,521 | 31,538 |
| Cromwell | 81,904 | 16,212 |
| Alexandra | 96,053 | 15,070 |
| Arrowtown | 21,519 | 3,375 |
| Queenstown | 65,608 | 14,575 |
| Gore | 975,739 | 326,101 |
| Mataura | 320,030 | 91,310 |
| Winton | 155,813 | 55,475 |
| Invercargill | 4,521,078 | 1,746,206 |
| South Invercargill | 336,786 | 136,185 |
| Riverton | 166,865 | 49,750 |
| Bluff | 352,125 | 110,545 |
| TABLE SHOWING GROSS CAPITAL AND UNIMPROVED VALUES OF EACH TOWN DISTRICT (OUTSIDE THE JURISDICTION OF ANY COUNTY) IN NEW ZEALAND. | ||
|---|---|---|
| Town District. | Capital Value (Land and Improvements). | Unimproved Value of Land (included in previous Column). |
| £ | £ | |
| Kaitaia | 157,085 | 73,375 |
| Hikurangi | 118,095 | 32,960 |
| Warkworth | 97,590 | 27,695 |
| Helensville | 228,315 | 82,395 |
| Henderson | 179,539 | 92,449 |
| New Lynn | 443,925 | 160,165 |
| Glen Eden | 161,338 | 66,193 |
| Ellerslie | 626,963 | 264,837 |
| Waiuku | 259,209 | 126,718 |
| Howick | 148,478 | 71,998 |
| Papatoetoe | 505,428 | 236,936 |
| Manurewa | 352,007 | 162,489 |
| Papakura | 441,605 | 223,936 |
| Tuakau | 158,115 | 78,545 |
| Huntly | 236,144 | 87,644 |
| Leamington | 130,760 | 75,190 |
| Te Puke | 307,540 | 144,095 |
| Matamata | 434,615 | 198,460 |
| Otorohanga | 97,082 | 51,312 |
| Taradale | 244,560 | 135,742 |
| Havelock North | 314,637 | 136,416 |
| Opunake | 142,083 | 62,677 |
| Manaia | 122,454 | 44,324 |
| Waverley | 105,526 | 41,916 |
| Rangataua | 33,771 | 9,550 |
| Mangaweka | 58,294 | 22,295 |
| Hunterville | 101,917 | 37,085 |
| Bull's | 62,943 | 24,959 |
| Manunui | 71,123 | 25,823 |
| Martinborough | 195,426 | 51,556 |
| Johnsonville | 218,562 | 100,757 |
| Upper Hutt | 287,998 | 130,827 |
| Tahunanui | 134,573 | 48,848 |
| Leeston | 146,850 | 39,795 |
| Tinwald | 137,620 | 74,565 |
| Pleasant Point | 118,135 | 51,750 |
| Nightcaps | 67,735 | 14,925 |
| Otautau | 132,578 | 50,277 |
| Lumsden | 54,024 | 15,251 |
| Wyndham | 123,634 | 50,850 |
Table of Contents
THE Banking Act, 1908, consolidates the law of New Zealand relating to the general business of banking in the Dominion. The Act provides that the incorporation of banks by Royal Charter shall be as effectual within New Zealand as Acts of the General Assembly. The number of directors is prescribed, and authority is given to any bank to increase its capital on a resolution of the shareholders Transfers of shares on which there is any liability must be approved by the directors or their duly appointed attorney or attorneys. Every bank trading in the Dominion is required to furnish quarterly statements of its business, for publication in the Gazette. A sworn copy of an entry in the books of a bank shall in all legal proceedings be evidence of such entry, and a bank is not required in any legal proceedings to which it is not a party to produce its books before a Court, unless ordered by a Judge for special cause. Provision is made for bank holidays, and for the destruction of cheques, drafts, bills of exchange, or promissory notes after the expiration of ten years from the date or duo date of such documents.
Part II of the Bills of Exchange Act, 1908, consolidates the law relating to cheques on a bank.
The Companies Act, 1908, with the exception of Part IX (re companies incorporated outside New Zealand), and also of the provisions relating to branch registers, does not apply to banking companies formed within and operating only within the Dominion.
There are six banks of issue trading in New Zealand, two of these institutions, the Bank of New Zealand and the National Bank of New Zealand, being incorporated by special Acts of the General Assembly of the Dominion. The Bank of New Zealand has branches in London, Australia, Fiji, and Samoa, while its branches and agencies within the Dominion number 223. The other five banks have between them 276 establishments within the Dominion, making a total of 499, or an average of one bank to every 2,808 inhabitants.
The paid-up capital of the above banks, their reserve funds, and the rate and amount of their last dividend as on the 31st December, 1925, were as follow:—
| Bank. | Paid-up Capital. | Rate per Cent. per Annum of Last Dividend and Bonus. | Amount of Last Half-yearly Dividend and Bonus. | Amount of Reserved Profits at Time of declaring Dividend. |
|---|---|---|---|---|
* Interest payable for half-year. † Dividend for full year. | ||||
| £ | Per Cent. | £ | £ | |
| Bank of New Zealand— | ||||
| 4-per-cent. stock guaranteed by New Zealand Government | 529,988 | .. | 10,599* | .. |
| “A” preference shares issued to the Crown (Act of 1920) | 500,000 | 10 | 50,000† | 3,088,299 |
| ‘B” preference shares issued to the Crown (Act of 1920) | 1,375,000 | 11 ¼ | 112,500† | |
| Ordinary shares | 3,750,000 | 13 ⅓ | 400,000† | |
| Union Bank of Australia (Limited) | 3,500,000 | 15 | 225,000 | 3,765,003 |
| Bank of New South Wales | 6,000,000 | 10 | 600,000 | 4,400,000 |
| Bank of Australasia | 4,000,000 | 10 and bonus of 3 per cent. | 260,000 | 3,830,332 |
| National Bank of New Zealand (Limited) | 2,000,000 | 12 per cent. per annum for half-year, and bonus of 2 per cent. | 120,000 | 1,776,697 |
| Commercial Bank of Australia (Limited)— | ||||
| Ordinary | 808,726 | 15 per cent. per annum for half-year. | 47,159 | 767,570 |
| Preference | 2,117,350 | 4 (preference only) | 42,347 | |
A consideration of the table below indicates that the development of banking in New Zealand since the year 1857 has been very great. Such a growth has been possible only through a corresponding expansion of trade and industry concomitant with a progressive increase in the population of the country. The figures for each year given below have been arrived at by taking the average of the four quarterly returns of the banks of issue. Deposits include amounts on fixed and current deposit and Government deposits. Advances comprise notes and bills discounted and debts due to the banks (exclusive of debts abandoned as bad).
| DEPOSITS, ADVANCES, ASSETS, AND LIABILITIES, 1857–1925. | ||||
|---|---|---|---|---|
| Year. | Deposits. | Advances. | Assets. | Liabilities. |
| £ | £ | £ | £ | |
| 1857 | 343,316 | .. | 419,860 | 432,494 |
| 1870 | 3,127,769 | 4,334,820 | 6,315,354 | 3,819,670 |
| 1880 | 8,538,935 | 11,228,865 | 14,220,275 | 9,550,177 |
| 1890 | 12,368,610 | 13,996,086 | 17,735,259 | 13,356,598 |
| 1900 | 15,570,610 | 11,343,411 | 17,314,535 | 16,964,582 |
| 1910 | 24,968,761 | 18,439,999 | 26,398,927 | 26,742,081 |
| 1920 | 59,405,341 | 38,241,932 | 56,111,433 | 67,818,469 |
| 1921 | 49,397,411 | 50,607,541 | 68,701,282 | 58,808,439 |
| 1922 | 45,913,394 | 44,768,178 | 61,779,570 | 53,868,834 |
| 1923 | 49,039,482 | 43,322,242 | 59,641,235 | 56,204,292 |
| 1924 | 49,502,499 | 44,559,661 | 61,325,865 | 57,131,235 |
| 1925 | 52,207,202 | 45,298,955 | 62,128,808 | 60,219,697 |
In 1880 deposits represented an average of £16.46 per head of the mean population; in 1890, £18.66; in 1900, £19.41; in 1910, £23.99; and in 1911, £25.16. In 1912. however, the average fell to £23.53, and in 1913 (the strike year) a further fall was recorded, the rate per head being £23.01. The years 1914 and 1915 showed a recovery, the rates being £24.24 and £27.35 respectively; while for 1916 the rate jumped to £32.63. In 1917 it rose to £37.36, and each successive year showed a substantial increase on the previous year until 1920, when the rate was £47.81. A fall to £38.69 in 1921 and £35.17 in 1922 was succeeded by rates of £36.94 in 1923, £36.59 in 1924, and £37.71 in 1925. The ratio of advances to deposits, which was 131.50 per cent. in 1880, reached its maximum in 1883, when it stood at 171.16 per cent. The proportion since that year fell, till in 1903 it was only 70.67 per cent. The 1916 ratio (66.42 per cent.) was lower than in any previous year. The ratio then remained fairly constant until a rise to 102.45 occurred in 1921. The years 1922 and 1923 witnessed a drop to 97.51 and 88.34 respectively, followed by an advance to 90.01 in 1924, and a further fall to 86.77 in 1925.
In 1886 the average amount of advances made by the banks was £15,834,877, equal to £25.36 per head of the mean population. The advances gradually declined in amount and in proportion to population until 1891, when they were in value £11,448,745, or £17.04 per head. In 1897 advances stood at £10,020,640, or £13.16 per head, which is the lowest average since the year 1872. There was then a continuous rise both in amounts of advances and in rates per head of population until 1908, for which year the figures were £21,172,808, or £21.32 per head. After 1908 the amounts fluctuated, but the tendency was still to rise. During the two years 1917 and 1918 the total amount advanced by the banks increased by nearly seven millions, totalling in the latter year £31,711,350. Subsequent years showed further increases, the amount for 1921 reaching the record figure of £50,607,541. Since 1921 the amount has hovered round £44,000,000, the rate per head for 1925 being £32.72.
The largest amount of discounts in any year was £6,061,959, in 1879, a rate of £12.32 per head. In the previous year had occurred the highest rate—£12.88 per head. From 1879 there was a fall, year by year, until 1896, when the sum was £1,756,791, or £2.35 per head, since when there have been further successive falls in the amount per head, which reached the low figure of £1.09 in 1918, rising, however, to £1.21 in 1919, £1.41 in 1920, and £1.93 in 1921, after which it gradually fell away to reach £1.18 in 1925.
The liabilities of the banks of issue for the last ten years are shown in the table following, the figures given referring to New Zealand business only. The liabilities shown represent the average of the four quarters of the year.
| LIABILITIES, 1916–25. | |||||
|---|---|---|---|---|---|
| Year. | Notes in Circulation. | Bills in Circulation. | Balances due to other Banks. | Deposits. | Total Liabilities. |
| £ | £ | £ | £ | £ | |
| 1916 | 4,049,529 | 96,468 | 73,707 | 37,507,915 | 41,727,619 |
| 1917 | 5,410,957 | 105,895 | 94,396 | 42,930,713 | 48,541,961 |
| 1918 | 6,266,768 | 123,344 | 95,681 | 45,562,939 | 52,048,732 |
| 1919 | 7,087,545 | 173,722 | 110,682 | 50,489,444 | 57,861,393 |
| 1920 | 7,890,418 | 239,877 | 282,833 | 59,405,341 | 67,818,469 |
| 1921 | 7,569,319 | 191,273 | 1,650,436 | 49,397,411 | 58,808,439 |
| 1922 | 7,019,220 | 266,963 | 669,257 | 45,913,394 | 53,868,834 |
| 1923 | 6,593,068 | 307,419 | 264,323 | 49,039,482 | 56,204,292 |
| 1924 | 6,587,546 | 315,601 | 725,589 | 49,502,499 | 57,131,235 |
| 1925 | 6,775,470 | 312,983 | 924,042 | 52,207,202 | 60,219,697 |
Within the decennium total liabilities have advanced from £41,727,619 to £60,219,697, an increase of 44 per cent. While it cannot be denied that expansion of trade has played an important part in the increase, it should be borne in mind that currency inflation has been a not inconsiderable factor in this remarkable growth. A striking feature is the extraordinary rise in the note - issue, which rose from £2,846,275 in 1915 to its zenith of £7,890,418 in 1920. Since then a gradual process of deflation has been in operation, the note-circulation in 1925 being £6,775,470.
The next table shows the total liabilities for each quarter during the same period: —
| QUARTERLY LIABILITIES, 1916–25. | |||||
|---|---|---|---|---|---|
| Year. | March Quarter. | June Quarter. | September Quarter. | December Quarter. | Average of Quarters. |
| £ | £ | £ | £ | £ | |
| 1916 | 39,445,072 | 42,615,925 | 42,269,257 | 42,580,222 | 41,727,619 |
| 1917 | 46,573,206 | 49,755,803 | 49,014,887 | 48,823,947 | 48,541,961 |
| 1918 | 51,343,979 | 56,454,086 | 51,258,666 | 49,138,199 | 52,048,732 |
| 1919 | 53,661,066 | 58,103,513 | 58,977,222 | 60,703,773 | 57,861,393 |
| 1920 | 67,659,577 | 71,310,711 | 68,648,656 | 63,655,033 | 67,818,469 |
| 1921 | 62,815,649 | 62,255,474 | 56,946,858 | 53,215,773 | 58,808,439 |
| 1922 | 54,350,336 | 55,365,324 | 53,845,543 | 51,914,132 | 53,868,834 |
| 1923 | 55,888,101 | 59,459,267 | 55,968,705 | 53,501,095 | 56,204,292 |
| 1924 | 58,860,057 | 58,673,343 | 55,347,458 | 55,644,080 | 57,131,235 |
| 1925 | 61,309,075 | 62,215,238 | 59,194,684 | 58,160,391 | 60,219,697 |
A considerably greater range is apparent than in the yearly totals, the limits of variation being £39,445,072 in the March quarter of 1916 and £71,310,711 in the June quarter of 1920, while the yearly limits which occurred in the same years were £41,727,619 and £67,818,469.
Details of liabilities for each of the quarters of 1925 are now given.
| LIABILITIES, 1925. | |||||
|---|---|---|---|---|---|
| Quarter. | Notes in Circulation. | Bills in Circulation. | Balances due to other Banks. | Deposits. | Total Liabilities. |
| £ | £ | £ | £ | £ | |
| March | 6,694,046 | 393,285 | 1,130,902 | 53,090,842 | 61,309,075 |
| June | 6,893,348 | 313,882 | 456,193 | 54,551,315 | 62,215,238 |
| September | 6,566,309 | 268,712 | 899,311 | 51,459,752 | 59,194,084 |
| December | 6,947,677 | 276,053 | 1,209,764 | 49,726,897 | 58,160,391 |
| Average | 6,775,470 | 312,983 | 924,042 | 52,207,202 | 60,219,697 |
Assets are now presented in a manner similar to that in which liabilities are shown.
| ASSETS, 1916–25. | ||||||
|---|---|---|---|---|---|---|
| Year. | Coin and Bullion. | Notes and Bills discounted. | Debts due, exclusive of Bad Debts. | Balances due from other Banks. | All other Assets. | Total Assets. |
| £ | £ | £ | £ | £ | £ | |
| 1916 | 7,393,917 | 1,484,355 | 23,427,562 | 147,514 | 4,562,137 | 37,015,485 |
| 1917 | 8,072,279 | 1,414,586 | 27,433,164 | 96,712 | 7,962,875 | 44,979,616 |
| 1918 | 8,085,961 | 1,261,204 | 30,450,147 | 153,091 | 8,619,724 | 48,570,127 |
| 1919 | 8,017,159 | 1,446,299 | 30,271,421 | 211,291 | 8,669,039 | 48,615,209 |
| 1920 | 7,728,942 | 1,753,072 | 36,488,860 | 344,451 | 9,796,108 | 56,111,433 |
| 1921 | 7,660,532 | 2,463,396 | 48,144,145 | 1,634,975 | 8,798,234 | 68,701,282 |
| 1922 | 7,822,562 | 1,643,730 | 43,124,448 | 1,143,957 | 8,044,873 | 61,779,570 |
| 1923 | 7,900,594 | 1,609,302 | 41,712,940 | 717,575 | 7,700,824 | 59,641,235 |
| 1924 | 7,816,145 | 1,589,763 | 42,969,898 | 725,589 | 8,224,470 | 61,325,865 |
| 1925 | 7,722,917 | 1,639,168 | 43,659,787 | 1,214,321 | 7,892,615 | 62,128,808 |
As in the case of liabilities, the growth in assets during the decade has been very considerable, the 1916 figure of £37,015,485 comparing with £62,128,808 in 1925 and £68,701,282 in the peak year of 1921. Debts due, which loom largely in the total each year, increased from £23,427,562 in 1916 to £43,659,787 in 1925.
| QUARTERLY ASSETS, 1916–25. | |||||
|---|---|---|---|---|---|
| Year. | March Quarter. | June Quarter. | September Quarter. | December Quarter. | Average of Quarters. |
| £ | £ | £ | £ | £ | |
| 1916 | 34,123,760 | 35,470,548 | 36,938,878 | 41,528,754 | 37,015,485 |
| 1917 | 43,401,701 | 43,885,636 | 44,834,310 | 47,796,817 | 44,979,616 |
| 1918 | 45,507,363 | 49,441,629 | 48,898,699 | 50,432,818 | 48,570,127 |
| 1919 | 49,217,272 | 49,184,582 | 46,757,710 | 49,301,272 | 48,615,209 |
| 1920 | 50,096,529 | 52,469,358 | 56,403,894 | 65,475,952 | 56,111,433 |
| 1921 | 71,097,423 | 71,664,585 | 66,378,428 | 65,664,691 | 68,701,282 |
| 1922 | 64,666,809 | 63,352,322 | 59,343,196 | 59,755,951 | 61,779,570 |
| 1923 | 59,335,217 | 58,313,692 | 58,797,007 | 62,119,023 | 59,641,235 |
| 1924 | 61,523,985 | 60,243,834 | 60,258,641 | 63,276,999 | 61,325,865 |
| 1925 | 61,199,186 | 60,452,029 | 61,340,146 | 65,523,870 | 62,128,808 |
Again the range is seen to be considerably greater in the quarterly than in the yearly figures, the limits in the former being £34,123,760 and £71,664,585, and in the latter £37,015,485 and £68,701,282.
In the next table details of assets are given for each of the quarters of 1925:—
| ASSETS, 1925. | ||||||
|---|---|---|---|---|---|---|
| Quarter. | Coin and Bullion. | Notes and Bills discounted. | Debts due, exclusive of Bad Debts. | Balances due from other Banks. | All other Assets. | Total Assets. |
| £ | £ | £ | £ | £ | £ | |
| March | 7,727,904 | 1,704,312 | 42,025,950 | 1,627,575 | 8,113,445 | 61,199,186 |
| June | 7,699,316 | 1,514,721 | 42,421,050 | 966,572 | 7,850,370 | 60,452,029 |
| September | 7,724,228 | 1,410,283 | 43,565,077 | 927,968 | 7,712,590 | 61,340,146 |
| December | 7,740,219 | 1,927,357 | 46,627,069 | 1,335,170 | 7,894,055 | 65,523,870 |
| Average | 7,722,917 | 1,639,138 | 43,659,787 | 1,214,321 | 7,892,615 | 62,128,808 |
The total amount of deposits, the amount per head of mean population, the total advances, and the ratio of advances to deposits, taking the average of the four quarters for each of the last ten years, are as follow: —
| DEPOSITS AND ADVANCES, 1916–25. | ||||||
|---|---|---|---|---|---|---|
| Year. | Deposits. | Advances. | ||||
| Total Amount. | Per Head of Population. | Total Amount. | Ratio to Deposits. | |||
| £ | £ | s. | d. | £ | Per Cent. | |
| 1916 | 37,507,915 | 32 | 12 | 9 | 24,911,706 | 66.42 |
| 1917 | 42,930,713 | 37 | 7 | 4 | 28,847,749 | 67.19 |
| 1918 | 45,562,939 | 39 | 10 | 5 | 31,711,350 | 69.59 |
| 1919 | 50,489,444 | 42 | 6 | 8 | 31,717,720 | 62.82 |
| 1920 | 59,405,341 | 47 | 16 | 3 | 38,241,932 | 64.37 |
| 1921 | 49,397,411 | 38 | 13 | 10 | 50,607,541 | 102.45 |
| 1922 | 45,913,394 | 35 | 3 | 7 | 44,768,178 | 97.51 |
| 1923 | 49,039,482 | 36 | 18 | 5 | 43,322,242 | 88.34 |
| 1924 | 49,502,499 | 36 | 11 | 11 | 44,559,661 | 90.01 |
| 1925 | 52,207,202 | 37 | 14 | 2 | 45,298,955 | 86.77 |
As in the case of liabilities and assets, deposits and advances have increased greatly during the ten years. The peak years of 1919 and 1920, in the case of deposits, indicate the high-water mark of the short-lived prosperity associated with the war and post-war period. Advances reached the maximum figure of £50,607,541 in 1921, when, as the result of the trade depression, the assistance of the banks was freely sought.
| QUARTERLY DEPOSITS, 1916–25. | |||||
|---|---|---|---|---|---|
| Year. | March Quarter. | June Quarter. | September Quarter. | December Quarter. | Average of Quarters. |
| £ | £ | £ | £ | £ | |
| 1916 | 36,129,992 | 38,523,449 | 37,758,538 | 37,619,681 | 37,507,915 |
| 1917 | 41,713,657 | 44,696,003 | 43,133,349 | 42,179,841 | 42,930,713 |
| 1918 | 45,212,446 | 50,101,352 | 44,782,761 | 42,155,199 | 45,562,939 |
| 1919 | 46,904,666 | 50,623,748 | 51,368,191 | 53,061,173 | 50,489,444 |
| 1920 | 59,408,136 | 62,977,257 | 60,659,079 | 54,576,891 | 59,405,341 |
| 1921 | 53,455,135 | 53,699,628 | 47,101,630 | 43,333,250 | 49,397,411 |
| 1922 | 44,866,839 | 47,399,600 | 46,957,703 | 44,429,434 | 45,913,394 |
| 1923 | 48,659,637 | 52,091,994 | 48,983,798 | 46,422,497 | 49,039,482 |
| 1924 | 51,693,551 | 51,606,632 | 47,853,800 | 46,856,013 | 49,502,499 |
| 1925 | 53,090,842 | 54,551,316 | 51,459,751 | 49,726,897 | 52,207,202 |
The following table shows the three different classes of deposits for each quarter during the last five years:—
| Year. | March Quarter. | June Quarter. | September Quarter. | December Quarter. |
|---|---|---|---|---|
| Government. | ||||
| £ | £ | £ | £ | |
| 1921 | 6,299,404 | 8,188,535 | 3,655,966 | 2,397,630 |
| 1922 | 4,506,449 | 6,010,714 | 4,995,838 | 3,325,014 |
| 1923 | 5,193,822 | 6,409,041 | 5,044,962 | 3,592,320 |
| 1924 | 4,660,259 | 3,977,321 | 2,731,774 | 2,179,514 |
| 1925 | 3,193,614 | 3,087,680 | 3,706,327 | 3,696,534 |
| Non Interest-bearing. | ||||
| 1921 | 30,785,205 | 29,264,632 | 26,773,326 | 24,380,432 |
| 1922 | 24,138,746 | 25,046,473 | 24,498,151 | 23,542,868 |
| 1923 | 26,445,502 | 28,276,204 | 25,800,739 | 24,261,042 |
| 1924 | 28,436,162 | 28,336,760 | 25,220,639 | 24,776,888 |
| 1925 | 29,765,517 | 30,497,210 | 26,811,762 | 25,189,554 |
| Interest-bearing. | ||||
| 1921 | 16,370,526 | 16,246,462 | 16,672,338 | 16,555,188 |
| 1922 | 16,221,644 | 16,342,414 | 17,463,714 | 17,561,552 |
| 1923 | 17,020,314 | 17,406,749 | 18,138,098 | 18,569,135 |
| 1924 | 18,597,130 | 19,292,552 | 19,901,386 | 19,899,611 |
| 1925 | 20,131,711 | 20,966,426 | 20,941,662 | 20,840,809 |
Deposits as a whole show a general trend to be at their maximum in the June quarter. This tendency is particularly pronounced in the case of Government deposits by reason of the receipt of income-tax in the earlier months of the year, after which the amount dwindles away to reach a minimum in the December quarter. Interest - bearing deposits show but little variation from quarter to quarter. In the non-interest-bearing class, which is made up of current accounts, the lowest level is generally associated with the final quarter of the year, and the highest with the second quarter, a state of affairs probably due largely to the seasonal influence of sheep-farming among the Dominion's productive activities.
The table following shows the amount of advances quarterly during the last ten years, together with the ratio to deposits: —
| QUARTERLY ADVANCES AND RATIO TO DEPOSITS, 1916–25. | ||||||||
|---|---|---|---|---|---|---|---|---|
| Year. | Total Advances. | Percentage of Advances to Deposits. | ||||||
| March. | June. | September. | December. | March. | June. | September. | December. | |
| £ | £ | £ | £ | |||||
| 1916 | 23,733,892 | 24,268,341 | 24,677,965 | 26,966,630 | 65.69 | 62.99 | 65.35 | 71.68 |
| 1917 | 27,694,931 | 28,280,303 | 28,415,451 | 31,000,316 | 66.39 | 63.27 | 65.87 | 73.49 |
| 1918 | 29,317,895 | 32,807,810 | 31,646,634 | 33,073,061 | 64.84 | 65.48 | 70.66 | 78.45 |
| 1919 | 32,203,646 | 32,410,706 | 30,149,773 | 32,106,755 | 68.65 | 64.04 | 58.69 | 60.50 |
| 1920 | 32,042,043 | 34,789,581 | 39,017,808 | 47,118,295 | 53.93 | 55.24 | 64.32 | 86.33 |
| 1921 | 52,446,341 | 54,385,486 | 48,039,610 | 47,558,727 | 98.11 | 101.27 | 101.98 | 109.75 |
| 1922 | 46,491,316 | 46,155,933 | 42,994,448 | 43,431,017 | 103.62 | 97.37 | 91.56 | 97.65 |
| 1923 | 42,521,571 | 41,711,273 | 42,826,728 | 46,229,395 | 87.38 | 80.07 | 87.43 | 99.58 |
| 1924 | 44,403,524 | 43,975,587 | 43,923,081 | 45,936,453 | 85.90 | 85.04 | 91.79 | 98.36 |
| 1925 | 43,730,262 | 43,935,771 | 44,975,360 | 48,554,426 | 82.37 | 80.54 | 87.40 | 97.64 |
It is difficult to discern any definite seasonal variation in the amount of advances, although prior to the abnormal demands upon the banks which commenced towards the end of 1920, the amount generally attained a maximum in the final quarter of each year. The ratio of advances to deposits shows a considerable range, from 53.93 per cent. in the first quarter of 1920, to 109.75 per cent. in the December quarter of the following year.
Deposits per head of population in banks of issue in each of the Australian States during the second quarter of each of the last five years are shown. Figures for New Zealand are given by way of comparison.
| DEPOSITS PER HEAD IN JOINT STOCK BANKS OF AUSTRALIA AND IN BANKS OF ISSUE IN NEW ZEALAND, 1921–25 (JUNE QUARTER). | |||||||||||||||
|---|---|---|---|---|---|---|---|---|---|---|---|---|---|---|---|
| State. | 1921. | 1922. | 1923. | 1924. | 1925. | ||||||||||
| £ | s. | d. | £ | s. | d. | £ | s. | d. | £ | s. | d. | £ | s. | d. | |
| New South Wales | 40 | 17 | 0 | 40 | 10 | 7 | 42 | 19 | 4 | 40 | 13 | 4 | 43 | 9 | 6 |
| Victoria | 49 | 5 | 0 | 48 | 17 | 1 | 53 | 1 | 6 | 51 | 9 | 0 | 51 | 6 | 8 |
| Queensland | 34 | 4 | 6 | 34 | 4 | 9 | 35 | 11 | 2 | 36 | 1 | 7 | 36 | 16 | 9 |
| South Australia | 38 | 4 | 7 | 36 | 13 | 10 | 35 | 16 | 8 | 38 | 1 | 3 | 37 | 5 | 7 |
| Western Australia | 26 | 13 | 0 | 25 | 2 | 10 | 26 | 9 | 5 | 25 | 15 | 5 | 24 | 19 | 1 |
| Tasmania | 27 | 18 | 6 | 23 | 5 | 8 | 24 | 16 | 3 | 26 | 8 | 6 | 24 | 12 | 7 |
| Northern Territory | 58 | 18 | 2 | 50 | 7 | 0 | 49 | 3 | 2 | 52 | 1 | 6 | 54 | 13 | 9 |
| Total, Commonwealth | 40 | 13 | 10 | 40 | 1 | 0 | 42 | 8 | 9 | 41 | 7 | 9 | 42 | 7 | 0 |
| New Zealand | 42 | 9 | 10 | 36 | 12 | 1 | 39 | 10 | 0 | 38 | 9 | 2 | 39 | 15 | 10 |
It should be noted that the figures for each of the Australian States and also for the whole Commonwealth are exclusive of deposits at the Commonwealth Bank. Excluding savings-bank deposits (which are included in the comparative table of savings-banks which appears towards the end of this section), deposits with the Commonwealth Bank for June quarter of 1925 represented £4 7s. 11d. per head of population.
The overdraft rates and the rates of discount current in the Dominion were ½ per cent. higher in 1920 than the corresponding rates ruling prior to the European War. A further increase of ½ per cent., following a period when importations had been made on a larger scale than at any previous time in the Dominion's history, was made in January, 1921, the demand on banks for money being very considerable. Another aspect of the position, which is apparent from the figures given earlier in this section, was the rapid diminution—from twenty millions to two millions—in the excess of deposits (other than Government) over advances during the closing six months of 1920. It is not surprising accordingly to find a further increase in the overdraft (and the discount) rates as from March, 1921. There was no further alteration in the rate until January, 1923, when the overdraft rate was reduced to 6 ½ per cent. Since that date the rate has remained the same.
Below is given the overdraft rates charged on “best” accounts, and the rates of discount current in New Zealand for best mercantile paper of a currency not exceeding three months: —
| Overdraft Rate, per Cent. | Rate of Discount, per Cent. | |
|---|---|---|
| At end of 1913 | 5 ½ | 5 |
| At end of 1921 | 7 | 6 ½ |
| At end of 1922 | 7 | 6 ½ |
| At end of 1923 | 6 ½ | 6 ½ |
| At end of 1924 | 6 ½ | 6 ½ |
| At end of 1925 | 6 ½ | 6 ½ |
| January, 1926, to date (October) | 6 ½ | 6 ½ |
The Banking Act, 1908, deals with the issue of notes generally. The Governor-General may empower any bank to issue and circulate notes, subject to the provisions and restrictions contained in the charter or letters patent under which such bank is incorporated; all such notes to be payable in gold only at the office of the bank at the place of issue, and to be a first charge on all assets of the bank.
The private Act of the Bank of New Zealand contains the following clause: “That the total amount of promissory notes payable on demand, issued and in circulation within the Dominion, shall not at any time exceed the amount of coin, bullion, and public securities which shall for the time being be held by the said corporation within the Dominion of New Zealand or within the United Kingdom, nor three times the amount of the coin for the time being held by the said corporation within the said Dominion.” Similar provision exists relating to the National Bank of New Zealand (Limited).
On the 5th August, 1914, immediately after the outbreak of the late war, an amendment to the Banking Act was passed empowering the Governor-General in Council, from time to time, to make a Proclamation declaring “that the notes payable on demand by any bank therein named, and then issued or thereafter to be issued or reissued within New Zealand under any lawful authority in that behalf, shall during the period limited by the Proclamation be everywhere within New Zealand a good and legal tender of money to the amount therein expressed to be payable.” Conditions governing the issue of such Proclamation are laid down, and the bank may be required to give adequate security that it will redeem the notes in gold on the expiration of the period covered by the Proclamation. Provision is also made for payment by the State Treasury in case of default by the bank. During the period any such Proclamation is in force coined gold must not be exported except with the consent of the Minister of Finance. During the period between 5th August, 1914, and 5th November, 1919, this prohibition also applied to uncoined gold.
Immediately on the passing of the amendment referred to, a Proclamation was gazetted declaring notes of all six banks of issue doing business in New Zealand to be legal tender from the 6th August to the 6th September, 1914. Further extensions were made from time to time, and the present authority expires on 10th January, 1928.
It should be noted that the figures of notes in circulation given under a previous heading relate to liabilities only, and exclude notes held by the issuing bank. On account of the banking returns in New Zealand being published only in the form of a statement of liabilities and assets, statistics as to the number of notes created and remaining uncancelled are not available.
In connection with the Post Office in New Zealand a savings-bank has been conducted since the 1st February, 1867. The minimum deposit receivable, except in certain specified cases, is 1s., and no interest is given on any sum less than £1 or in excess of £5,000. Interest on sums up to £500 is paid at the rate of 4 per cent. per annum, and on sums between £500 and £5,000 at the rate of 3 ¼ per cent for the amount over £500.
The Postmaster-General may pay deposits to a maximum of £200 to the legal representative of a deceased depositor without requiring him to take out letters of administration or to prove the will. This provision, together with another provision whereby a depositor may nominate one or more persons to receive part or all of the amount at credit after the depositor's death, enables a widow or orphan to obtain possession of perhaps much-needed funds without either delay or cost.
The number of post-offices open for the transaction of savings-bank business at the 31st March, 1926, was 870.
There were 104,447 new accounts opened during the year ended the 31st March, 1926, and 81,440 accounts were closed during the period. The total number of open accounts at the 31st March, 1926, was 758,155, or one to every 1.86 of the population, including Maoris.
The deposits received during the year amounted to £31,833,622, and the withdrawals to £32,602,506. The total sum standing at credit of all accounts on the 31st March, 1926, was £47,911,322, which gave an average of £63 3s. 11d. to the credit of each open account. Information for each of the last ten years is given below.
| POST OFFICE SAVINGS-BANK, 1916–25. | ||||||
|---|---|---|---|---|---|---|
| Year. | Number of Depositors at End of Year. | Total Amount of Deposits during Year. | Total Amount of Withdrawals during Year. | Excess of Deposits over Withdrawals. | Interest. | Total Amount to Credit of Depositors at End of Year. |
*Fifteen months ended 31st March, 1921. †Year ended 31st March following. The minus sign (-) represents excess of withdrawals over deposits. | ||||||
| £ | £ | £ | £ | £ | ||
| 1916 | 538,072 | 15,576,408 | 12,957,420 | 2,618,988 | 817,856 | 25,603,209 |
| 1917 | 566,351 | 17,106,529 | 14,461,169 | 2,645,360 | 947,821 | 29,196,390 |
| 1918 | 590,205 | 18,101,105 | 14,938,842 | 3,162,263 | 1,059,472 | 33,418,125 |
| 1919 | 630,783 | 29,758,447 | 25,962,377 | 3,796,070 | 1,178,935 | 38,393,130 |
| 1920* | 664,819 | 44,302,852 | 41,162,486 | 3,140,366 | 1,818,535 | 43,352,031 |
| 1921† | 678,930 | 29,125,997 | 30,236,231 | -1,110,234 | 1,599,907 | 43,841,704 |
| 1922† | 690,790 | 26,682,427 | 27,769,263 | -1,086,836 | 1,605,525 | 44,360,393 |
| 1923† | 710,157 | 29,598,372 | 29,510,321 | 88,051 | 1,649,976 | 46,098,421 |
| 1924† | 735,148 | 29,582,897 | 30,413,609 | -830,712 | 1,680,920 | 46,948,628 |
| 1925† | 758,155 | 31,833,622 | 32,602,506 | -768,884 | 1,731,578 | 47,911,322 |
The Post Office Savings-bank commenced operations on the 1st February, 1867, and the progress of the establishment since that date is shown on the next page in graphical representation, the curves representing number of open accounts, total amount to credit, and average amount to credit respectively.
This diagram shows clearly the large increase in the business of the Post Office Savings-bank during recent years.
The amount standing to credit of depositors has increased from £1,813,085 in 1887 to £47,911,322 at the 31st March, 1926, and in no year since 1887 has there been a decrease as compared with the preceding year. There was a corresponding steady increase in the average amount standing to the credit of each depositor up to the 31st March, 1921, but a slight fall has been recorded since then.
The huge increase in the amount at deposit in recent years has been accompanied by an oven greater proportionate increase in interest payments, owing to the rate of interest having substantially advanced. The total interest credited to depositors from the 1st February, 1867, to the 31st March, 1926, has aggregated £21,954,596, a sum equal to 46 per cent. of the total amount remaining on deposit at the 31st March, 1926.
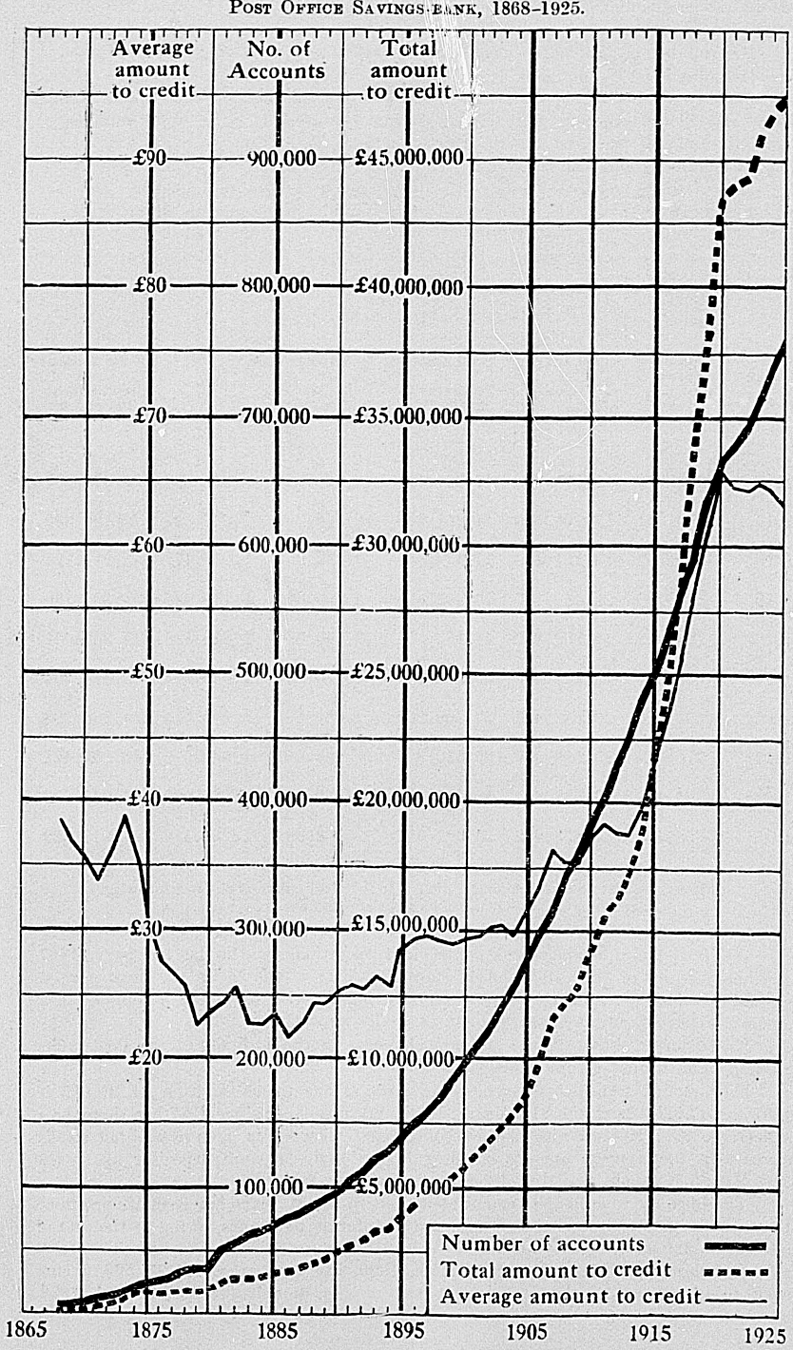
In the next two tables quarterly deposits and withdrawals are shown for the years 1916–25:—
| DEPOSITS, 1916–25. | ||||
|---|---|---|---|---|
| Year. | March Quarter. | June Quarter. | September Quarter. | December Quarter. |
| £ | £ | £ | £ | |
| 1916 | 3,754,392 | 4,079,256 | 3,995,329 | 3,747,431 |
| 1917 | 4,330,270 | 4,525,229 | 4,183,934 | 4,067,096 |
| 1918 | 4,434,731 | 4,597,665 | 4,678,476 | 4,390,233 |
| 1919 | 5,865,478 | 6,674,007 | 7,084,959 | 10,134,003 |
| 1920 | 9,271,609 | 9,025,516 | 8,639,396 | 9,472,973 |
| 1921 | 7,893,358 | 8,220,843 | 7,631,891 | 6,897,019 |
| 1922 | 6,376,244 | 6,742,626 | 6,902,755 | 6,342,609 |
| 1923 | 6,694,437 | 7,635,031 | 6,818,734 | 7,827,378 |
| 1924 | 7,317,230 | 7,597,610 | 7,333,455 | 7,110,970 |
| 1925 | 7,540,862 | 8,290,799 | 8,779,105 | 7,430,183 |
| WITHDRAWALS, 1916–25. | ||||
|---|---|---|---|---|
| Year. | March Quarter. | June Quarter. | September Quarter. | December Quarter. |
| £ | £ | £ | £ | |
| 1916 | 2,773,599 | 3,091,852 | 4,006,344 | 3,085,625 |
| 1917 | 3,031,649 | 3,076,616 | 5,146,247 | 3,206,657 |
| 1918 | 3,349,323 | 4,407,089 | 3,761,620 | 3,420,810 |
| 1919 | 4,829,473 | 6,174,872 | 7,146,243 | 7,811,789 |
| 1920 | 8,358,598 | 7,859,479 | 8,070,403 | 9,372,291 |
| 1921 | 7,501,715 | 7,945,158 | 8,087,725 | 7,436,040 |
| 1922 | 6,767,308 | 7,170,649 | 6,948,683 | 6,850,689 |
| 1923 | 6,799,242 | 7,094,447 | 7,116,024 | 8,285,283 |
| 1924 | 7,014,568 | 7,812,881 | 7,774,402 | 7,691,041 |
| 1925 | 7,135,286 | 7,756,878 | 9,063,086 | 8,372,822 |
In the March quarter of 1916 was recorded the lowest amount of both deposits and withdrawals during the decade, the figures being £3,754,392 and £2,773,599 respectively. The final quarter of 1919 claims the highest deposits with £10,134,003, while the greatest withdrawals occurred in the same quarter of the following year, when £9,372,291 was accounted for. The figures for the next three years witnessed a decline, or rather a return to more stable conditions. A steady growth was recorded in both 1924 and 1925.
The number of open accounts at the end of each of the last five years, classified according to amounts at credit, is as follows:—
| CLASSES OF ACCOUNTS OPEN AT 31ST MARCH, 1922–26. | |||||
|---|---|---|---|---|---|
| Amount. | 1922. | 1923. | 1924. | 1925. | 1926. |
| Not exceeding £20 | 447,883 | 465,924 | 481,861 | 500,951 | 525,064 |
| Exceeding £20 and up to £50 | 67,812 | 66,492 | 69,640 | 70,365 | 70,894 |
| ,, £50 ,, £100 | 50,488 | 48,815 | 48,842 | 50,875 | 49,645 |
| ,, £100 ,, £200 | 46,520 | 44,333 | 43,521 | 46,088 | 44,960 |
| ,, £200 ,, £300 | 23,831 | 22,951 | 22,557 | 22,621 | 22,744 |
| ,, £300 ,, £400 | 14,431 | 13,693 | 13,324 | 13,544 | 13,697 |
| ,, £400 ,, £500 | 9,090 | 8,959 | 9,328 | 9,479 | 9,396 |
| ,, £500 ,, £600 | 6,625 | 6,537 | 6,656 | 6,626 | 6,759 |
| ,, £600 | 12,250 | 13,086 | 14,428 | 14,599 | 14,996 |
| Totals | 678,930 | 690,790 | 710,157 | 785,148 | 758,155 |
Accounts above the £600 mark at the 31st March, 1926, included 4,128 between £600 and £700, 2,672 between £700 and £800, 1,894 between £800 and £900, 1,410 between £900 and £1,000, and 4,892 over £1,000.
The securities standing in the name of the Postmaster-General on account of the Post Office Savings-bank Fund on the 31st March, 1926, represented a nominal value of £8,264,438. Most of this fund is invested in Government securities. A summary of the investments is as follows:—
| £ | |
|---|---|
| In New Zealand Government securities | 47,199,586 |
| In local bodies' securities | 519,400 |
| In other securities | 545,452 |
| £48,264,438 |
There are five savings-banks not connected with the Post Office. The total amount deposited in them during the year ended the 31st March, 1926, was £5,392,729. The withdrawals reached the sum of £5,022,121. The total amount to the credit of depositors at the 31st March, 1926, was £6,364,383. Figures for ten years are as follow:—
| PRIVATE SAVINGS-BANKS, 1916–17 TO 1925–26. | ||||||
|---|---|---|---|---|---|---|
| Year ended 31st March. | Number of Depositors at End of Year. | Total Amount of Deposits during Year. | Total Amount of Withdrawals during Year. | Excess of Deposits over Withdrawals, | Interest. | Total Amount to Credit of Depositors at End of Year. |
The minus sign (-) represents excess of withdrawals over deposits. | ||||||
| £ | £ | £ | £ | £ | ||
| 1917 | 81,900 | 1,631,065 | 1,374,114 | 256,951 | 82,912 | 2,412,465 |
| 1918 | 85,191 | 1,764,723 | 1,551,836 | 212,887 | 95,357 | 2,720,709 |
| 1919 | 89,203 | 2,058,360 | 1,775,531 | 282,829 | 107,991 | 3,111,529 |
| 1920 | 95,472 | 3,308,628 | 2,981,887 | 326,741 | 119,625 | 3,557,895 |
| 1921 | 100,342 | 3,555,871 | 3,410,456 | 145,415 | 137,774 | 3,841,084 |
| 1922 | 104,395 | 3,191,181 | 3,265,338 | -74,157 | 150,501 | 3,917,428 |
| 1923 | 110,077 | 4,076,876 | 3,511,038 | 565,838 | 180,435 | 4,663,701 |
| 1924 | 117,442 | 4,492,881 | 4,145,848 | 347,033 | 205,845 | 5,216,579 |
| 1925 | 124,731 | 4,823,839 | 4,526,652 | 297,187 | 226,366 | 5,740,132 |
| 1926 | 135,074 | 5,392,729 | 5,022,121 | 370,608 | 253,643 | 6,364,383 |
The following table shows the results of the transactions of each of the private savings-banks during the twelve months ended 31st March, 1926.
| Bank. | Date of Establishment. | Number of Depositors at End of Year. | Total Amount of Deposits during Year. | Total Amount of Withdrawals during Year. | Excess of Deposits over Withdrawals. | Total Amount to Credit of Depositors at End of Year. |
|---|---|---|---|---|---|---|
| £ | £ | £ | £ | |||
| Auckland | 1847 | 108,421 | 3,876,114 | 3,762,356 | 113,758 | 4,453,291 |
| Now Plymouth | 1850 | 4,641 | 204,196 | 173,937 | 30,259 | 212,498 |
| Hokitika | 1866 | 1,591 | 42,196 | 40,039 | 2,157 | 100,485 |
| Dunedin | 1864 | 13,945 | 723,067 | 542,039 | 181,028 | 1,221,501 |
| Invercargill | 1864 | 6,476 | 547,156 | 503,750 | 43,406 | 376,608 |
| Totals | .. | 135,074 | 5,392,729 | 5,022,121 | 370,608 | 6,364,383 |
The deposits in the savings-banks of the Commonwealth and of New Zealand on the 31st March, 1926, are shown in the table following. The Australian figures, which are inclusive of deposits in the branches of the Commonwealth Savings-bank in the various States, are taken from the Quarterly Summary of Australian Statistics issued by the Commonwealth Statistician.
| State. | Number of Depositors. | Amount on Deposit. | Average Amount per Depositor. | Deposits to Credit per Head of Population. | ||||
|---|---|---|---|---|---|---|---|---|
| £ | £ | s. | d. | £ | s. | d. | ||
| New South Wales | 1,428,454 | 70,525,206 | 49 | 7 | 5 | 30 | 9 | 7 |
| Victoria | 1,380,020 | 60,525,487 | 43 | 17 | 2 | 35 | 15 | 8 |
| Queensland | 415,348 | 21,897,311 | 52 | 14 | 5 | 25 | 4 | 10 |
| South Australia | 484,406 | 20,544,040 | 42 | 8 | 3 | 36 | 19 | 4 |
| Western Australia | 287,956 | 8,571,081 | 29 | 15 | 4 | 22 | 19 | 11 |
| Tasmania | 134,579 | 4,571,616 | 33 | 19 | 5 | 21 | 11 | 0 |
| Northern Territory | 935 | 33,652 | 35 | 19 | 10 | 9 | 1 | 10 |
| Total, Commonwealth | 4,131,698 | 186,668,393 | 45 | 3 | 7 | 31 | 0 | 5 |
| New Zealand | 893,229 | 54,275,705 | 60 | 15 | 3 | 33 | 10 | 0 |
The average deposits standing to the credit of depositors in the banks of issue for (he quarter ended 31st March, 1926, were £51,314,674, and if to this figure be added the deposits in the Post Office and private savings-banks at the same date the grand total amounts to £105,590,379, representing an average of £74 18s. 1d. per head of population. In addition there are the deposits with the building societies, referred to farther on in this book, and there are also deposits with financial companies of which no particulars are collected.
Table of Contents
THE statutory provisions affecting life insurance in New Zealand are in the main contained in the Life Insurance Act, 1908, and Amendment Act, 1921–22. Any association other than a friendly society which issues policies or grants annuities on human life in New Zealand comes within the scope of the enactments. Two classes of companies are recognized—namely, local and foreign, the latter including all offices the principal place of which is situated beyond the Dominion. In both instances securities are required to be deposited with the Public Trustee before business can be carried on. Before the passing of the amending Act of 1921–22 the maximum deposit required from a New Zealand company was £20,000, with a minimum of £5,000, regulated according to the volume of business done, while for a company incorporated overseas the maximum went to £50,000. Both classes of offices, however, are now on the same basis. Every life company carrying on business at the time of the coming into operation of the amending Act, or which commences business thereafter, must, deposit with the Public Trustee money or securities of the statutory character to the value of £5,000; and, in addition to that, for every £100,000 or part there of that the total amount assured by its policies current in New Zealand exceeds £100,000, a further £5,000 until a maximum of £50,000 is reached. In other respects New Zealand and overseas companies are placed on the same footing as regards deposits.
In the case of composite offices, provision is made for the receipts of life and annuity business to be treated as a separate fund, and the Act safeguards the interest of the policyholder by making such funds available only for liabilities arising from life business.
The law bearing on industrial assurance has received the attention of the Legislature in the Life Insurance Amendment Act, 1920. In this class of insurance the premiums must be payable at shorter intervals than three months. Provision is made for the control by regulation of the activities of this class of business. Companies are required to deposit with the Minister of Finance forms of policy tables, rates, and other documents, and policies must contain only such conditions as have been approved by the Governor-General in Council. Restrictions are placed on the forfeiture of policies in default of payments or other requirements.
Annual returns of life assurance are required to be deposited with the Minister of Finance. It is from these returns that the statistical matter following has been compiled.
The outstanding features of life-assurance business as disclosed by the tables given in the succeeding pages is the remarkable increase that has taken place in the amount of new assurances effected during recent years. The growth characterizes both the ordinary life department and the industrial side. No doubt this is in a large measure a reflection of the prosperous condition of the country. A further reason for the growth of new business is probably furnished by the diminished purchasing-power of the sovereign, and the consequent deprecation of the value of policies on a pre-war basis. It is well known, too, that with the increased probate and succession duties payable on large estates life-insurance policies are a means used to provide ready cash when other assets may not be convertible at an advantage. It may be added, in passing, that the substantial growth of business evident is general not only in New Zealand, but also in Australia, the United Kingdom, and the United States of America.
At the close of 1924 twelve life-assurance offices were represented in New Zealand, but of these two no longer issue new policies, and are merely engaged in administering the business of the policies already in existence. Of the twelve offices represented only two were purely New Zealand institutions — namely, the Government Life Insurance Office and the Provident Life Assurance Company. Seven of the other societies have their head offices in Australia, two in England, and one in the United States of America. The Provident Life Assurance Company and four of the Australian offices transact both ordinary life and industrial business. Several of the companies have branches for assurance against accident. This class of insurance is dealt with in Subsection B of this section.
The statistics here given relate exclusively to business transacted in the Dominion.
Details of the policies issued and discontinued during the year 1924 by the respective offices are contained in the following table. The aggregate net increase in the sum assured is £4,686,602, and in the annual premiums payable thereon £154,246. The corresponding figures for 1923 were £4,457,028 and £144,486 respectively.
| ORDINARY LIFE ASSURANCE.—POLICIES ISSUED AND DISCONTINUED, 1924. | ||||||
|---|---|---|---|---|---|---|
| Office. | Policies issued. | Policies discontinued. | ||||
| Number. | Sum assured. | Annual Premiums. | Number. | Sum assured. | Annual Premiums. | |
* Ten months only. | ||||||
| £ | £ | £ | £ | |||
| Australian Temperance and General | 2,795 | 571,604 | 22,875 | 1,440 | 256,958 | 10,229 |
| Australian Mutual Provident | 6,334 | 3,281,609 | 104,259 | 2,894 | 997,669 | 32,739 |
| Australian Provincial | 1,517 | 497,596 | 18,495 | 1,124 | 371,734 | 13,777 |
| Colonial Mutual | 2,132 | 591,456 | 21,348 | 1,042 | 202,236 | 7,716 |
| Mutual Life and Citizens' | 1,351 | 449,435 | 14,161 | 1,364 | 367,955 | 12,062 |
| National Mutual | 2,097 | 885,589 | 33,801 | 1,401 | 455,701 | 18,765 |
| New York Life | 2 | 925 | 79 | 91 | 25,684 | 1,311 |
| Norwich Union | 510 | 409,023 | 12,840 | 275 | 196,922 | 5,578 |
| Provident Life | 877 | 229,085 | 5,690 | 558 | 120,252 | 3,033 |
| Southern Cross* | 1,021 | 380,499 | 14,893 | 652 | 256,340 | 10,028 |
| Yorkshire | 1 | 500 | 11 | 3 | 600 | 39 |
| New Zealand Government Life | 5,149 | 1,718,842 | 54,197 | 3,890 | 1,077,510 | 33,126 |
| Totals | 23,786 | 9,016,163 | 302,649 | 14,734 | 4,329,561 | 148,403 |
In the case of the new business transacted during 1924, the average sum assured under each policy issued was £379, and the average premium £3 7s. 2d. per cent.
The next table presents an interesting review of the progress of ordinary life-assurance business over a period of ten years. The amount of new policies issued shows a considerable increase since 1917, with, however, a slight falling-off in 1921, and a much more marked decline in 1922, followed by a phenomenal rise of over £2,000,000 in 1923. Compared with 1923, the increase during 1924 shows a considerable falling off, and amounted to a little over £600,000. Discontinuances in 1922 exceeded those in 1921, due to an increase in the number of lapsed policies, but the figures for 1923 show a decrease in discontinuances of over £500,000 compared with the preceding year. During the year under review, however, an increase in discontinuances is again recorded. Although discontinuances in 1922 exceeded those in 1921 the not result of the operations for 1922 allowed of a considerable amount-being added to the accumulated funds of the companies, and a further increase has taken place as a result of the operations for 1923 and also for 1924. It should be added, however, that this follows on a period when, consequent on the ravages of influenza and the toll of war, the discontinuances by death were particularly heavy. amounting in the aggregate to £966,866 for 1918, as compared with the figure of £394,672 in 1921, £435,585 in 1922, £394,098 in 1923, and £451,636 in 1924.
| ORDINARY LIFE ASSURANCE.—PROGRESS OF BUSINESS, 1915–24. | |||||||||
|---|---|---|---|---|---|---|---|---|---|
| Year. | Policies Issued. | Policies discontinued. | Policies existing at End of Year. | ||||||
| Number. | Sum assured. | Annual Premiums. | Number. | Sum assured. | Annual Premiums. | Number. | Sum assured. | Annual Premiums. | |
| £ | £ | £ | £ | £ | £ | ||||
| 1915 | 15,524 | 3,947,566 | 131,532 | 11,174 | 2,635,204 | 86,262 | 160,568 | 10,967,147 | 1,274,667 |
| 1916 | 14,336 | 3,717,981 | 141,531 | 10,659 | 2,531,713 | 85,342 | 164,245 | 42,153,415 | 1,330,856 |
| 1917 | 12,272 | 3,303,123 | 131,944 | 12,374 | 2,571,106 | 90,523 | 164,143 | 42,885,432 | 1,372,277 |
| 1918 | 16,517 | 5,233,669 | 228,533 | 11,571 | 2,776,081 | 153,529 | 169,089 | 45,343,020 | 1,447,261 |
| 1919 | 18,581 | 6,411,362 | 245,939 | 10,664 | 2,681,975 | 114,757 | 177,006 | 49,072,407 | 1,578,463 |
| 1920 | 19,998 | 6,856,128 | 225,680 | 10,816 | 2,738,502 | 91,390 | 186,188 | 53,190 033 | 1,712,753 |
| 1921 | 19,926 | 6,778,258 | 226,728 | 11,772 | 3,229,942 | 112,765 | 194,342 | 56,738,349 | 1,826,716 |
| 1922 | 17,686 | 6,376,813 | 210,680 | 14,910 | 4,453,186 | 149,610 | 197,118 | 58,661,976 | 1,887,786 |
| 1923 | 22,248 | 8,408,585 | 278,775 | 13,649 | 3,951,557 | 134,289 | 205,717 | 63,119,004 | 2,032,272 |
| 1924 | 23,786 | 9,016,163 | 302,649 | 14,734 | 4,329,561 | 148,403 | 214,769 | 67,805,306 | 2,186,518 |
The number of ordinary life policies in force at the end of 1914 was 156,218, representing a sum assured of £39,654,784; so that the increases in number and value during the decennium have been 37 per cent. and 71 per cent. respectively, as compared with an increase of total population of approximately 20 per cent. in the same period.
A statement of the income and outgo of all the companies operating in the Dominion, so far as ordinary business only is concerned, further illustrates the increase in the business for the ten years. The ratio of management expenses to premium and total receipts is also given.
| ORDINARY LIFE ASSURANCE.—NEW ZEALAND BUSINESS.—INCOME AND OUTGO. | ||||||
|---|---|---|---|---|---|---|
| Year. | Receipts and Expenditure. | Expenses of Management. | ||||
| Total Receipts, excluding Transfers. | Total Expenditure, excluding Transfers. | Excess of Receipts. | Amount. | Proportion to Premium Receipts. | Proportion to Total Receipts. | |
| £ | £ | £ | £ | Per Cent. | Per Cent. | |
| 1915 | 1,922,485 | 1,397,434 | 525,051 | 176,715 | 14.05 | 9.19 |
| 1916 | 2,016,607 | 1,558,320 | 458,287 | 174,683 | 13.20 | 8.66 |
| 1917 | 2,091,512 | 1,804,647 | 286,865 | 173,407 | 12.63 | 8.29 |
| 1918 | 2,225,897 | 2,054,409 | 171,488 | 215,351 | 14.55 | 9.67 |
| 1919 | 2,348,263 | 1,716,049 | 632,214 | 253,257 | 16.18 | 10.78 |
| 1920 | 2,513,707 | 1,527,017 | 986,690 | 278,886 | 16.50 | 11.09 |
| 1921 | 2,648,715 | 1,661,405 | 987,310 | 286,833 | 16.00 | 10.83 |
| 1922 | 2,763,729 | 1,839,932 | 923,797 | 282,603 | 15.13 | 10.23 |
| 1923 | 3,003,179 | 1,871,971 | 1,131,208 | 302,960 | 15.18 | 10.22 |
| 1924 | 3,115,142 | 2,062,961 | 1,052,181 | 352,180 | 16.33 | 11.31 |
From 1920 to 1923 there was a downward trend in the percentage of management expenses to total receipts. This would appear to reflect the general economy campaign of that period. During 1924, however, there was an increase of over 1 per cent. over 1923, and the percentage disclosed for 1924 is the highest during the decade under review.
A summary of the receipts and expenditure under the various heads is now given in a five-years table. New premiums, which amounted to £245,238 in 1919, have during the succeeding quinquennium increased by 17 per cent. On the expenditure side the payment of death claims, which was unusually high during the war period, has now shown a return to normal conditions, although the amount paid out under this heading during 1924 shows an increase of nearly £100,000 over the previous year.
| ORDINARY LIFE ASSURANCE.—NEW ZEALAND BUSINESS.—RECEIPTS AND EXPENDITURE (EXCLUDING TRANSFERS), 1920–24. | |||||
|---|---|---|---|---|---|
| — | 1920. | 1921. | 1922. | 1923. | 1924. |
| £ | £ | £ | £ | £ | |
| Revenue. | |||||
| Renewal premiums | 1,477,403 | 1,585,101 | 1,667,572 | 1,743,019 | 1,866,883 |
| New premiums | 212,370 | 207,196 | 199,792 | 253,009 | 286,128 |
| Consideration for annuities | 44,043 | 25,665 | 19,386 | 17,346 | 23,282 |
| Interest | 764,677 | 826,475 | 874,478 | 911,249 | 931,101 |
| Increase in value of investment | 15,096 | .. | 2,176 | 277 | .. |
| Other revenue | 118 | 4,278 | 325 | 78,279 | 7,748 |
| Total revenue | 2,513,707 | 2,648,715 | 2,763,729 | 3,003,179 | 3,115,142 |
| Expenditure. | |||||
| Claims by death | 582,253 | 577,031 | 687,888 | 669,628 | 768,481 |
| Claims by maturity | 423,672 | 485,363 | 507,090 | 524,267 | 541,440 |
| Annuities | 36,012 | 38,289 | 38,822 | 38,446 | 38,786 |
| Surrenders | 147,559 | 183,343 | 232,895 | 246,897 | 263,935 |
| Cash bonuses | 14,972 | 35,853 | 30,279 | 21,492 | 33,950 |
| Management | 278,886 | 286,833 | 282,603 | 302,960 | 352,180 |
| Taxes | 39,702 | 47,635 | 53,725 | 47,148 | 44,888 |
| Depreciation in investments | 3,591 | 3,674 | 2,624 | 17,849 | 13,629 |
| Other expenditure | 370 | 3,384 | 4,006 | 4,284 | 5,672 |
| Total expenditure | 1,527,017 | 1,661,405 | 1,839,932 | 1,871,971 | 2,062,961 |
Looking now at the other phase of life assurance, the next table shows for 1924 to what extent industrial business was undertaken by each of the offices transacting this class of assurance in the Dominion.
| INDUSTRIAL ASSURANCE.—NEW ZEALAND BUSINESS, 1924. | ||||||
|---|---|---|---|---|---|---|
| Office. | Policies Issued. | Policies discontinued. | ||||
| Number. | Sum assured. | Annual Premiums. | Number. | Sum assured. | Annual Premiums. | |
| £ | £ | £ | £ | |||
| Australian Temperance and General | 15,911 | 864,590 | 57,937 | 9,104 | 471,705 | 32,463 |
| Australian Mutual Provident | 5,946 | 397,849 | 20,374 | 2,896 | 178,261 | 10,601 |
| Colonial Mutual | 8,235 | 400,201 | 22,198 | 4,859 | 226,571 | 12,721 |
| Mutual Life and Citizens | 1,546 | 89,906 | 4,572 | 1,934 | 87,462 | 4,865 |
| Provident Life | 6,067 | 240,217 | 15,192 | 4,226 | 165,375 | 10,667 |
| Totals | 36,705 | 1,992,763 | 120,273 | 23,019 | 1,129,374 | 71,317 |
A summary of the progress of industrial business is given in the following table, covering the ten years 1915 to 1924. This class of insurance has only during the last few years attained any magnitude in New Zealand.
| INDUSTRIAL LIFE ASSURANCE.—PROGRESS OF BUSINESS, 1915–24. | |||||||||
|---|---|---|---|---|---|---|---|---|---|
| Year. | Policies issued. | Policies discontinued. | Policies existing at End of Year. | ||||||
| Number. | Sum assured. | Annual Premiums. | Number. | Sum assured. | Annual Premiums. | Number. | Sum assured. | Annual Premiums. | |
| £ | £ | £ | £ | £ | £ | ||||
| 1915 | 22,937 | 752,729 | 54,905 | 16,685 | 540,379 | 36,537 | 99,740 | 2,811,255 | 181,533 |
| 1916 | 25,608 | 845,042 | 60,295 | 15,681 | 476,286 | 35,333 | 109,667 | 3,180,011 | 206,495 |
| 1917 | 24,733 | 888,915 | 64,551 | 15,577 | 536,853 | 37,425 | 118,823 | 3,532,073 | 233,621 |
| 1918 | 26,906 | 1,020,008 | 73,326 | 16,038 | 553,827 | 40,378 | 129,691 | 3,996,254 | 266,569 |
| 1919 | 29,783 | 1,283,489 | 87,819 | 18,399 | 670,177 | 47,860 | 141,075 | 4,611,566 | 306,528 |
| 1920 | 29,724 | 1,463,720 | 93,039 | 18,299 | 761,350 | 49,586 | 152,500 | 5,313,936 | 349,981 |
| 1921 | 27,799 | 1,459,762 | 84,437 | 17,500 | 821,658 | 50,169 | 162,799 | 5,952,040 | 384,249 |
| 1922 | 29,483 | 1,524,342 | 91,399 | 19,637 | 919,049 | 57,428 | 172,645 | 6,557,333 | 418,220 |
| 1923 | 30,516 | 1,659,395 | 99,442 | 19,820 | 949,905 | 61,193 | 183,341 | 7,266,823 | 456,469 |
| 1924 | 36,705 | 1,992,763 | 120,273 | 23,019 | 1,129,374 | 71,317 | 197,027 | 8,130,212 | 505,425 |
In striking contrast with ordinary life insurance, where the increase in new business was considerably less than that of 1923, the industrial branch discloses an outstanding increase over the previous year, nearly double that shown in any previous year during the period under review.
The increase in the sum assured in respect of policies issued during the year amounted in 1924 to £333,368, the increase in the annual premiums to £20,831, and in the number of policies to 6,189. Between 1914 and 1924 the number of policies in force has increased by 103,539, and the amount held at risk by £5,531,307.
The total income and outgo for industrial assurance, summarized for the ten years 1915–24, are as follow: —
| INDUSTRIAL ASSURANCE.—NEW ZEALAND BUSINESS.—INCOME AND OUTGO, 1915–24. | ||||||
|---|---|---|---|---|---|---|
| Year. | Receipts and Expenditure. | Expenses of Management. | ||||
| Total Receipts, excluding Transfers. | Total Expenditure, excluding Transfers. | EXCESS of Receipts. | Amount. | Proportion to Premium Receipts. | Proportion to Total Receipts. | |
| £ | £ | £ | £ | Per Cent. | Per Cent. | |
| 1915 | 177,319 | 93,973 | 83,346 | 66,041 | 39.22 | 37.24 |
| 1916 | 200,903 | 109,452 | 91,451 | 71,778 | 37.79 | 35.72 |
| 1917 | 232,895 | 128,468 | 104,427 | 77,921 | 35.49 | 33.16 |
| 1918 | 264,000 | 156,618 | 107,382 | 88,071 | 35.51 | 33.36 |
| 1919 | 303,568 | 180,070 | 123,498 | 107,504 | 37.82 | 35.41 |
| 1920 | 347,825 | 195,038 | 152,787 | 121,600 | 37.52 | 34.95 |
| 1921 | 394,098 | 194,798 | 199,300 | 130,615 | 35.96 | 33.15 |
| 1922 | 434,957 | 223,345 | 211,612 | 136,260 | 34.35 | 31.33 |
| 1923 | 485,362 | 253,101 | 232,261 | 148,307 | 33.93 | 30.56 |
| 1924 | 539,409 | 291,282 | 248,127 | 169,347 | 35.30 | 31.39 |
A table giving for each of the last five years the main details in connection with the income and outgo referred to above is appended, and affords interesting comparisons in the fluctuation of the various heads of receipts and expenditure. Premium receipts show a steady increase over the whole period. In 1919 this source of income produced £284,243, and the increase over the five years is accordingly 69 per rent. The expenses of management, which in this class of business are relatively high, amounted in 1924 to 35 per cent. of the premium receipts, as compared with 43 per cent. ten years earlier.
| INDUSTRIAL LIFE ASSURANCE.—NEW ZEALAND BUSINESS.—RECEIPTS AND EXPENDITURE (EXCLUDING TRANSFERS), 1920–24. | |||||
|---|---|---|---|---|---|
| — | 1920. | 1921. | 1922. | 1923. | 1924. |
| £ | £ | £ | £ | £ | |
| Revenue. | |||||
| Premiums | 324,031 | 363,227 | 396,628 | 437,144 | 479,687 |
| Interest | 21,330 | 28,172 | 35,549 | 44,708 | 52,320 |
| Other revenue | 2,464 | 2,699 | 2,780 | 3,510 | 7,402 |
| Total revenue | 347,825 | 394,098 | 434,957 | 485,362 | 539,409 |
| Expenditure. | |||||
| Claims by death | 29,067 | 27,323 | 34,060 | 38,253 | 48,089 |
| Claims by maturity | 31,315 | 27,072 | 39,577 | 51,731 | 51,530 |
| Surrenders | 2,567 | 3,236 | 5,269 | 6,686 | 10,777 |
| Management | 121,600 | 130,645 | 136,260 | 148,307 | 169,347 |
| Taxes | 3,187 | 3,327 | 3,886 | 4,261 | 3,989 |
| Depreciation in investments | 849 | 744 | 1,139 | 955 | 1,010 |
| Other payments | 6,453 | 2,451 | 3,154 | 2,908 | 6,540 |
| Total expenditure | 195,038 | 194,798 | 223,345 | 253,101 | 291,282 |
The balance-sheets of the companies transacting industrial business do not in every case apportion their liabilities and assets over ordinary and industrial business, for although the legislation in force requires separate statements to be furnished for receipts and expenditure, policies issued and discontinued, &c., no such requirement exists in regard to balance-sheets.
The figures presented below accordingly refer to both classes of insurance, and, as indicated earlier in this subsection, relate to New Zealand business only.
Dealing first with liabilities, the position of the various offices over a period of five years is shown.
| LIFE ASSURANCE.—NEW ZEALAND LIABILITIES, 1920–24. | |||||
|---|---|---|---|---|---|
| Office. | 1920. | 1921. | 1922. | 1923. | 1924. |
* Includes accident. † Includes fire, marine, and accident. ‡ Discontinued New Zealand business. | |||||
| £ | £ | £ | £ | £ | |
| Australian Temperance and General | 511,499 | 644,602 | 799,339 | 978,203 | 1,207,523 |
| Australian Mutual Provident | 6,689,332 | 6,979,937 | 7,152,808 | 7,055,110 | 7,145,412 |
| Australian Provincial* | 83,332 | 131,334 | 174,270 | 192,476 | 181,281 |
| Colonial Mutual* | 475,924 | 503,971 | 568,221 | 654,457 | 752,671 |
| Equitable Life of U.S.A. | 41,762 | 76,774 | ‡ | ‡ | ‡ |
| Mutual Life and Citizens'* | 1,504,913 | 1,534,366 | 1,542,800 | 1,567,111 | 1,602,841 |
| National Mutual | 1,829,496 | 1,920,020 | 2,042,261 | 2,218,010 | 2,401,572 |
| New York Life | 76,932 | 79,493 | 62,159 | 48,419 | 27,912 |
| Norwich Union | 66,849 | 69,029 | 96,655 | 141,020 | 198,265 |
| Provident Life | 234,169 | 265,982 | 297,812 | 333,855 | 371,955 |
| Southern Cross | .. | .. | .. | .. | 42,909 |
| Yorkshire† | 56,308 | 71,843 | 99,886 | 115,820 | 123,000 |
| New Zealand Government Life | 5,927,557 | 6,090,101 | 6,276,019 | 6,489,868 | 6,712,888 |
| Totals | 17,514,549 | 18,367,452 | 19,112,230 | 19,794,349 | 20,768,229 |
The aggregate capital and liabilities at the end of 1924, as compared with 1923, and 1922 were as follow:—
| 1922. | 1923. | 1924. | |
|---|---|---|---|
| £ | £ | £ | |
| Paid-up capital | 96,072 | 94,954 | 95,782 |
| Life assurance and annuity funds | 18,173,674 | 18,901,932 | 19,746,411 |
| Depreciation, reserve, and other special funds | 352,500 | 287,623 | 281,545 |
| Claims admitted but not paid | 183,820 | 167,133 | 188,683 |
| Other liabilities | 306,164 | 342,707 | 455,808 |
| Totals | £19,112,230 | £19,794,349 | £20,768,229 |
The assets during the five years 1920–24 are as follow: —
| LIFE ASSURANCE.—NEW ZEALAND ASSETS, 1920–24. | |||||
|---|---|---|---|---|---|
| Assets. | 1920. | 1921. | 1922. | 1923. | 1924. |
* Included for the most part with “Railway and other stocks” and “Other investments.” | |||||
| £ | £ | £ | £ | £ | |
| Mortgages on property | 5,858,439 | 5,981,469 | 6,047,352 | 6,002,102 | 6,018,042 |
| Loans on policies | 2,068,875 | 2,385,591 | 2,602,451 | 2,812,378 | 2,995,776 |
| New Zealand Government securities | 6,181,818 | 6,307,590 | 6,424,932 | 6,603,884 | 6,619,062 |
| Indian and colonial securities | 8,831 | 18,056 | 16,028 | 15,435 | 16,085 |
| Railway and other stocks | 953,806 | 1,148,725 | 1,181,183 | 575,677 | 35,632 |
| Municipal and local bodies securities | * | * | * | 2,365,660 | |
| Landed and house property | 511,583 | 473,431 | 520,935 | 559,031 | 626,920 |
| Other investments | 311,578 | 309,780 | 319,027 | 1,203,627 | 3,777 |
| Loans on personal security | 1,464 | 3,091 | 4,799 | 5,169 | 8,397 |
| Agents' balances | 9,708 | 14,330 | 19,008 | 24,768 | 20,055 |
| Outstanding premiums | 172,032 | 197,040 | 206,293 | 202,978 | 230,301 |
| Interest accrued, &c. | 201,491 | 243,635 | 272,429 | 281,550 | 291,433 |
| Cash | 248,987 | 239,695 | 436,015 | 405,272 | 336,385 |
| Other assets | 985,937 | 1,045,019 | 1,061,778 | 1,102,478 | 1,200,704 |
| Totals | 17,514,549 | 18,367,452 | 19,112,230 | 19,794,349 | 20,768,229 |
Although there is a slight increase in the amount invested in mortgages at the end of 1924, as compared with 1923, there has been a considerable falling-off in this class of investment during the quinquennium, the decrease for 1924 as compared with 1919 being £188,219. The most striking feature of the figures, however, is the phenomenal increase in the amount invested in securities of the New Zealand Government during recent years. The amount invested under this heading amounted in 1919 to £5,167,436, and the increase during the five years is therefore over 28 per cent. This is an illustration of the greater extent to which the New Zealand Government has borrowed locally during the last few years than previously, but it may be accounted for to some extent by the fact that interest on mortgages is taxed on a sliding scale, while the other form of income is taxed on a fixed scale and is capable of estimation. Certain of the Government loans also are free of income-tax and thus yield a very remunerative rate of interest for gilt-edged securities.
The Life Insurance Department of the Government of New Zealand was founded in 1869, at a time when New-Zealanders had comparatively poor facilities for the insurance of their lives. The institution possesses the unique advantage of being based on the solid principle of State security, payment of all policies being guaranteed by the Government of the Dominion. Industrial insurance is not transacted by the Department.
During 1925 some 5,830 new policies insuring £1,910,013 were issued, compared with the previous years figures of 5,149, and £1,718,842, respectively. At the end of 1925 there were 63,775 policies in force bearing an annual premium income of £549,956, and the amount in force exclusive of bonus was £18,008,402. The average sum assured per policy in force was £282, compared with £278 in 1924 and £273 in 1923.
The following table gives a synopsis of the activities of the Department for the last ten years in so far as the amount of business transacted is concerned:—
| STATE LIFE INSURANCE.—PROGRESS, 1916–25. | ||||||||
|---|---|---|---|---|---|---|---|---|
| Year. | Now Business. | Policies in Force at End of Year. | ||||||
| Number of Policies. | Premiums. | Sum assured. | Number of Policies. | Premiums. | Value of Business. | |||
| Sum assured. | Bonuses. | Total. | ||||||
| £ | £ | £ | £ | £ | £ | |||
| 1916 | 3,276 | 28,948 | 883,396 | 53,208 | 383,948 | 12,874,754 | 1,384,618 | 14,259,372 |
| 1917 | 2,898 | 28,237 | 784,600 | 53,058 | 387,377 | 12,884,531 | 1,304,243 | 14,188,774 |
| 1918 | 4,235 | 46,778 | 1,252,538 | 53,803 | 404,965 | 13,257,682 | 1,512,861 | 14,770,543 |
| 1919 | 4,983 | 58,569 | 1,617,795 | 55,770 | 423,065 | 14,123,728 | 1,423,016 | 15,546,744 |
| 1920 | 4,872 | 51,221 | 1,659,660 | 57,321 | 449,123 | 14,924,147 | 1,335,163 | 16,259,310 |
| 1921 | 4,963 | 50,734 | 1,631,250 | 59,189 | 474,151 | 15,721,088 | 1,558,646 | 17,279,734 |
| 1922 | 3,797 | 40,071 | 1,286,609 | 59,487 | 483,734 | 15,995,235 | 1,453,866 | 17,449,101 |
| 1923 | 4,754 | 48,815 | 1,581,722 | 60,545 | 501,321 | 16,549,451 | 1,357,161 | 17,906,612 |
| 1924 | 5,149 | 54,197 | 1,718,842 | 61,804 | 522,391 | 17,190,783 | 1,696,381 | 18,887,164 |
| 1925 | 5,830 | 60,951 | 1,910,013 | 63,775 | 549,956 | 18,008,402 | 1,584,927 | 19,593,329 |
The total income of the Department for 1925 was £910,148—viz., premium income, £537,574; interest income (less land and income tax), £349,783; annuity purchase-money, £22,791. Each of these items of income, as well as the total, constitutes a record in the Department's operations. The total income for 1925 was £55,557 in excess of the figure for the preceding year.
During the year 1925, policies (including bonus additions) to the value of £251,781 matured, and policies became claims by death of the holders to the total amount of £182,131. Expenses of management totalled £59,308.
The total assurance, annuity, and endowment funds, apart from a special investment reserve of £204,323, amounted at the end of 1925 to £6,731,118, an increase of £282,460 during the year.
The Department's balance-sheet on the 31st December, 1925, showed that the total assets amounted to ££6,994,229, and were invested as shown in the following statement, which also gives the distribution of the assets at the end of the previous year for purposes of comparison: —
| Class of Investment. | At 31st December, 1924. | At 31st December, 1925. | ||
|---|---|---|---|---|
| Amount. | Percentage of Total Assets. | Amount. | Percentage of Total Assets. | |
| £ | £ | |||
| Mortgages on freehold property | 2,592,867 | 38.6 | 2,520,340 | 36.0 |
| Loans on policies | 890,403 | 13.3 | 915,231 | 13.1 |
| Government securities | 2,177,270 | 32.4 | 2,176,470 | 31.1 |
| Local bodies debentures | 688,173 | 10.2 | 1,056,846 | 15.1 |
| Landed and house property | 140,851 | 2.1 | 144,175 | 2.1 |
| Miscellaneous assets | 157,626 | 2.4 | 162,982 | 2.3 |
| Cash in hand and on current account | 65,698 | 1.0 | 18,185 | 0.3 |
| Totals | 6,712,888 | 100.0 | 6,994,229 | 100.0 |
A statement of the liabilities and assets as at the 31st December, 1925, is also given.
| STATE LIFE INSURANCE.—LIABILITIES AND ASSETS AT 31ST DECEMBER, 1925. | |
|---|---|
| Liabilities. | £ |
| Total Assurance, Annuity, and Endowment Funds (as per Revenue Account) | 6,731,118 |
| Claims admitted, proofs not yet completed | 46,194 |
| Annuities | 459 |
| Commission | 1,504 |
| Medical fees | 521 |
| Premium and other deposits | 4,619 |
| Sundry accounts owing | 3,451 |
| Accident and Fidelity Fund | 2,040 |
| Investment Fluctuation Reserve | 204,323 |
| £6,994,229 | |
| £ | £ | |
|---|---|---|
| Assets. | ||
| Loans on policies | 915,231 | |
| Government securities | 2,176,470 | |
| Municipal Corporation debentures | 217,460 | |
| County securities | 53,974 | |
| Harbour Board debentures | 31,300 | |
| Town Board debentures | 38,024 | |
| Road Board debentures | 21,800 | |
| Drainage Board debentures | 1,899 | |
| Power Board debentures | 692,389 | |
| Landed and house property | 130,868 | |
| Landed and house property (leasehold) | 1,506 | |
| Mortgages on property | 2,520,340 | |
| Properties acquired by foreclosure | 11,801 | |
| Overdue premiums on policies In force | 8,106 | |
| Outstanding premiums due but not overdue | 48,902 | |
| 57,008 | ||
| Overdue Interest | 4,299 | |
| Outstanding interest duo but not overdue | 7,295 | |
| Interest accrued but not due | 88,126 | |
| 99,720 | ||
| Agents' balances | 4,280 | |
| Sundry debtors | 1,974 | |
| Cash in hand and on current account | 18,185 | |
| £6,994,229 | ||
The triennial valuation of the Department's liabilities and assets as at the 31st December, 1923, revealed a surplus of assets over liabilities amounting to £336,350. Of this sum £317,563 was allotted in the shape of compound reversionary bonuses upon the sum assured and the bonuses in force, thus giving increasing bonuses to those policyholders who had maintained their previous bonuses intact. This amount was greater by £99,857 (or nearly 50 per cent.) than the amount divided at the preceding triennial investigation. Due consideration was given to the difference between the present rates of premium and those charged before 1900 and to the more favourable mortality experienced in the Temperance Section, and a differential rate of bonus was allotted to secure equity as far as possible between the various classes of assurance in both the General and Temperance Sections. The result is that new assurance and endowment-assurance policies affected during the triennium received simple reversionary bonuses of 26s. and 30s. per cent. per annum on the sum assured in the General and Temperance Sections respectively, and business effected prior to that date—if existing bonuses had been left intact—bonuses increasing with the duration of the policy to £2 3s. per cent. per annum in the case of the older policies. Double endowment assurances received simple reversionary bonuses ranging from £1 1s. to £1 7s. per cent. of the sum assured.
These bonuses, although materially higher than the Department had ever declared in the past, could be allotted without straining its resources in any way. It is claimed that no office in Australia or New Zealand adopts a stronger valuation basis than the Department, quite apart from the amount held in the Investment Fluctuation Reserve, of which little short of the whole will ultimately be available for retransfer. The Department was able in a single triennium to step from a 3 ½ per cent. to a 3 per cent. net premium valuation of its policy liabilities.
The actuarial investigation discloses the progress of the Department during the triennium 1921–23, and the following figures are given in conjunction with those for the five preceding triennia.
| STATE LIFE INSURANCE.—TRIENNIAL INVESTIGATIONS. | |||||||
|---|---|---|---|---|---|---|---|
| Triennium. | New Business of Triennium. | In Force at End of Triennium. | |||||
| Number of Policies. | Sums assured. | Annual Premiums. | Number of Policies. | Sums assured. | Reversionary Bonuses. | Annual Premiums. | |
| £ | £ | £ | £ | £ | |||
| 1906–08 | 9,739 | 2,261,767 | 72,803 | 47,033 | 10,955,749 | 1,068,950 | 331,830 |
| 1909–11 | 10,476 | 2,487,472 | 77,477 | 49,376 | 11,514,657 | 1,168,620 | 348,285 |
| 1912–14 | 11,721 | 3,197,694 | 89,715 | 52,273 | 12,550,465 | 1,246,610 | 370,882 |
| 1915–17 | 10,129 | 2,709,163 | 90,017 | 53,058 | 12,884,531 | 1,304,243 | 387,377 |
| 1918–20 | 14,189 | 4,529,993 | 156,568 | 57,321 | 14,924,147 | 1,335,163 | 449,123 |
| 1921–23 | 13,537 | 4,499,581 | 139,620 | 60,545 | 16,549,451 | 1,357,161 | 501,321 |
From the above it will be seen that there has been a slight decrease in 1921–23 as compared with 1918–20, but a steady progress is shown over the whole period in the amount of Dew business.
The rate of interest realized on the mean funds of the Department, after deduction of land and income tax from interest, was as follows for each of the ten years 1916–25:—
| STATE LIFE INSURANCE.—RATE OF INTEREST. | |||
|---|---|---|---|
| £ | s. | d. | |
| 1916 | 4 | 15 | 1 |
| 1917 | 4 | 16 | 2 |
| 1918 | 4 | 13 | 8 |
| 1919 | 5 | 2 | 4 |
| 1920 | 4 | 19 | 2 |
| 1921 | 5 | 3 | 5 |
| 1922 | 5 | 3 | 11 |
| 1923 | 5 | 6 | 8 |
| 1924 | 5 | 7 | 7 |
| 1925 | 5 | 9 | 1 |
IN terms of the Accident Insurance Companies Act, 1908, accident-insurance policies may be issued by any association, whether incorporated or not, provided such association is not established under any Act relating to friendly societies. The principal contingencies for which policies may be issued are in respect of—
Accident, disease, or mental or physical disability;
Employers' liability under statutory or common law;
Charges under the Workers' Compensation for Accident Act taking precedence of incumbrances, mortgages, or charges lawfully existing.
With the huge increase in motor-traffic in recent years an important class of policy—viz., motor-car comprehensive, has come into existence, and has increased rapidly. Other important classes of accident-insurance policies are in respect of plate-glass insurance and fidelity-guarantee insurance.
As a security to the public transacting business with accident-insurance offices, a substantial deposit is required to be made with the Public Trustee by any company whose head office is situated overseas. No deposit is necessary in the case of compares incorporated in the Dominion under the New Zealand laws. The amount of the deposit required is dealt with in the next subsection in discussing the cognate matter of fire insurance, to which reference should be made.
The principal Act provides for annual returns to be deposited with the Minister of Finance, and, as in the case of life insurance, these have been utilized as a means of statistical information, and the following matter has been compiled therefrom. Unfortunately, these returns do not distinguish between the various classes of accident insurance, and in order to remedy this deficiency regulations providing for the collection of returns by the Government Statistician were recently gazetted under the Census and Statistics Act. The first collection under this Act will be for the year 1925, and provision has been made to obtain particulars of employers' liability insurance as distinct from other forms of accident business.
The number of insurance offices transacting accident business in New Zealand in 1924 was 36. The principal registered offices of these companies, all of which are British companies, were distributed as follows: England, 16; Australia, 9; Hong Kong, 1; New Zealand, 10. Returns for the financial years ended during 1924 have been received from all offices, the figures in each case being confined to accident business done in the Dominion.
The total premiums received for 1924 amounted to £851,682, and of this amount £341,364, or 40 per cent., represented the business of the ten companies established within the Dominion. During the year claims amounting to £440,759 were paid, of which £188,748, or approximately 43 per cent., was the contribution of the New Zealand establishments. It will accordingly be seen that the local companies accounted for a very considerable proportion of the accident insurance transacted in the Dominion. The following table gives a summary of the income and outgo of the various offices for 1924, distinguishing the amount received for premiums and the amount paid out on claims:—
| ACCIDENT INSURANCE.—INCOME AND OUTGO, 1924. | |||||
|---|---|---|---|---|---|
| Name of Company. | Income. | Outgo. | Per Cent. of Claims to Premiums. | ||
| Premiums. | Total Receipts. | Claims. | Total Expenditure. | ||
| £ | £ | £ | £ | £ | |
| Overseas Companies. | |||||
| Alliance | 27,362 | 27,362 | 12,791 | 21,659 | 46.75 |
| Atlas | 11,891 | 11,891 | 6,481 | 11,749 | 54.50 |
| Australian Provincial Association | 5,604 | 5,604 | 2,029 | 5,272 | 36.21 |
| British Traders' | 8,146 | 8,146 | 3,584 | 7,403 | 44.00 |
| Colonial Mutual | 6,050 | 6,924 | 2,270 | 5,170 | 37.52 |
| Commerical Union | 33,430 | 33,430 | 17,579 | 33,256 | 52.58 |
| Eagle, Star, and British Dominions | 23,044 | 23,044 | 14,363 | 26,434 | 62.33 |
| Guardian | 16,370 | 17,245 | 8,260 | 15,919 | 50.46 |
| Insurance Office of Australia | 16,696 | 17,696 | 8,495 | 17,877 | 50.88 |
| Liverpool and London and Globe | 13,152 | 13,152 | 6,597 | 11,425 | 50.16 |
| London and Lancashire | 30,918 | 31,847 | 20,045 | 34,090 | 64.83 |
| Mutual Life and Citizens | 20,090 | 20,090 | 9,141 | 17,559 | 45.50 |
| North British and Mercantile | 11,695 | 11,695 | 4,319 | 8,766 | 36.93 |
| Northern | 17,758 | 19,967 | 11,572 | 19,596 | 65.16 |
| Norwich and London | 19,729 | 20,745 | 14,138 | 23,496 | 71.66 |
| Ocean | 55,890 | 55,890 | 27,576 | 47,864 | 49.34 |
| Phoenix | 20,467 | 20,467 | 8,080 | 16,057 | 39.48 |
| Queensland | 18,304 | 19,304 | 5,857 | 13,231 | 32.00 |
| Royal | 34,527 | 34,527 | 16,097 | 28,382 | 46.62 |
| Royal Exchange | 21,387 | 21,387 | 8,885 | 17,945 | 41.54 |
| Southern Cross | 2,853 | 2,931 | 666 | 3,109 | 23.31 |
| Southern Union | 9,830 | 9,830 | 3,517 | 8,839 | 35.78 |
| Sun | 12,826 | 12,826 | 7,949 | 13,345 | 61.98 |
| Union | 16,404 | 16,404 | 8,745 | 17,014 | 53.30 |
| United | 9,637 | 9,637 | 3,119 | 9,570 | 32.36 |
| Victoria | 24,478 | 24,478 | 12,725 | 24,302 | 51.99 |
| Yorkshire | 21,780 | 21,780 | 7,131 | 16,766 | 32.74 |
| Totals | 510,318 | 518,299 | 252,011 | 476,095 | 49.38 |
| New Zealand Companies. | |||||
| Farmers' Co-operative | 12,870 | 12,870 | 5,201 | 10,261 | 40.44 |
| National | 32,170 | 32,170 | 12,770 | 27,490 | 39.70 |
| New Zealand | 92,442 | 92,442 | 55,144 | 86,166 | 59.65 |
| Provident Life | 2,773 | 2,948 | 1,014 | 2,148 | 36.58 |
| Sawmillers' Mutual | 13,477 | 14,195 | 9,032 | 14,174 | 67.01 |
| South British | 92,725 | 92,725 | 55,120 | 91,005 | 59.44 |
| Standard | 53,900 | 53,900 | 25,139 | 46,528 | 46.64 |
| Taranaki Farmers' | 1,393 | 1,393 | 564 | 1,069 | 40.42 |
| New Zealand Government Office | 39,614 | 47,987 | 24,764 | 36,517 | 62.51 |
| Totals | 341,364 | 350,630 | 188,748 | 315,358 | 55.29 |
| Grand totals | 851,682 | 868,929 | 440,759 | 791,453 | 51.75 |
In 1924 the ratio of the total expenses to premiums received averaged 93 per cent., or to total receipts, including premiums, 91 per cent.
The table next presented gives in a summary form the aggregate receipts and expenditure for the last decade. During that period the amount of accident business put through the books has increased by over 150 per cent. The number of offices transacting business increased by nine.
| RECEIPTS AND EXPENDITURE, 1915–24. | |||||||||
|---|---|---|---|---|---|---|---|---|---|
| Year. | Number of Offices. | Receipts. | Expenditure. | ||||||
| Premiums. | Other Receipts. | Total. | Claims. | Commission. | Salaries. | Other Expenses. | Total. | ||
| £ | £ | £ | £ | £ | £ | £ | £ | ||
| 1915 | 27 | 337,733 | 6,907 | 344,640 | 172,049 | 45,941 | 36,715 | 36,929 | 291,634 |
| 1916 | 30 | 349,230 | 6,059 | 355,289 | 168,521 | 50,613 | 40,675 | 42,595 | 302,204 |
| 1917 | 31 | 351,103 | 5,377 | 356,480 | 179,514 | 51,879 | 41,134 | 48,500 | 321,027 |
| 1913 | 34 | 359,962 | £,711 | 363,673 | 183,291 | 52,984 | 40,048 | 50,401 | 326,724 |
| 1919 | 35 | 449,784 | 6,270 | 456,054 | 228,032 | 64,976 | 47,336 | 58,192 | 398,536 |
| 1920 | 34 | 533,316 | 7,235 | 540,551 | 240,337 | 84,299 | 51,822 | 78,483 | 454,941 |
| 1921 | 35 | 706,014 | 8,561 | 714,575 | 337,190 | 108,289 | 72,611 | 100,728 | 618,818 |
| 1922 | 35 | 706,370 | 11,876 | 718,246 | 361,527 | 105,049 | 72,726 | 112,629 | 651,931 |
| 1923 | 36 | 752,995 | 14,248 | 767,243 | 388,903 | 118,372 | 76,599 | 123,594 | 707,468 |
| 1924 | 36 | 851,682 | 17,248 | 868,930 | 440,759 | 137,751 | 85,902 | 127,041 | 791,453 |
Since 1919 the premium income has increased from £449,784 to £851,682—having nearly doubled itself in five years. The increase in the 1924 figure over that of the previous year was £98,687 compared with the previous year's increase of £46,625. As against the increase in premium income must be considered the augmentation in claims, which have shown a slightly greater proportionate increase, having grown from £228,032 in 1919 to £440,759 in 1924.
An interesting review of the expenses incurred in transacting accident insurance is contained in the table following. The fluctuations over a period of ten years are shown in percentages of income to outgo under six different heads. In this connection the fact that the Government Insurance Department has in the past systematically tabulated the experience of the whole of the workers' compensation insurance business in New Zealand upon a scientific actuarial basis has placed that Office in a position to regulate effectively the premiums charged in the Dominion in respect of this class of business.
| ACCIDENT INSURANCE.—EXPENSE RATIO, 1915–24. | ||||||
|---|---|---|---|---|---|---|
| Year. | Ratio per Cent. of | |||||
| Claims to Premiums. | Commission to Premiums. | Salaries to Premiums. | Other Expenses to Premiums. | Total Expenses to Premiums. | Total Expenses to Total Receipts. | |
| 1915 | 50.94 | 13.60 | 10.87 | 10.93 | 86.35 | 84.62 |
| 1916 | 48.20 | 14.49 | 11.65 | 12.20 | 86.54 | 85.06 |
| 1917 | 51.13 | 14.77 | 11.72 | 13.80 | 91.43 | 90.05 |
| 1918 | 50.92 | 14.72 | 11.13 | 14.00 | 90.77 | 89.84 |
| 1919 | 50.70 | 14.44 | 10.52 | 12.94 | 88.61 | 87.39 |
| 1920 | 45.06 | 15.80 | 9.72 | 14.72 | 85.30 | 84.16 |
| 1921 | 47.76 | 15.34 | 10.28 | 14.27 | 87.64 | 86.59 |
| 1922 | 51.18 | 14.87 | 10.30 | 15.94 | 92.29 | 90.77 |
| 1923 | 51.65 | 15.72 | 10.17 | 16.41 | 93.95 | 92.21 |
| 1924 | 51.75 | 16.17 | 10.09 | 14.92 | 92.93 | 91.08 |
From 1915 until 1917 the percentage of claims and the expenditure under other headings showed a general increase, but a falling-off in 1918 and subsequent years ensued until 1921, when the percentage again showed an upward trend, which was maintained until 1923, The year under review, however, despite an increase in the percentage of claims, reveals a slight falling-off as regards total expenditure.
The appropriation for unexpired risks at the end of 1924 amounted for all offices to £297,455, as compared with £259,777 at the end of 1923 and £242,382 at the end of 1922.
In the year 1901 the Government Insurance Department opened an Accident Branch. Arrangements were made under which the funds, assets, and liabilities were kept separate and distinct from the main life-insurance business, and powers were vested in the Governor-General to make regulations in regard to tables fixing rates of premium and other details for the conduct of the Accident Insurance Branch. On the 1st January, 1925, the whole of the accident business was transferred to the control of the State Fire Insurance Office, and is now carried on in conjunction with that establishment. Although the greater part of the year 1925 was taken up with the transfer and the necessary organization work consequent thereon, the results achieved during the year would indicate that the association of the Fire and Accident Branches will prove advantageous to both the insuring public and to the State Office.
General accident business is undertaken, but the branch was opened more especially with a view to relieve employers of labour of the liability imposed upon them by the Workers' Compensation for Accidents Act. The policies cover the full liability of an employer to his workmen under the Workers' Compensation Act, and the liability under common law to the extent of £1,000 per man. Policies protecting mortgagees from loss through the charge of an injured workman taking precedence of a mortgage are issued at premiums varying from 1s. per cent. for small mortgages to 6d. per cent. for large mortgages. Personal - accident policies are also issued securing amounts for accidental death and permanent total or partial disablement, and weekly allowances during temporary disablement, whether caused by accident or sickness. Under the Government Accident Insurance Amendment Act of 1924 the Department is authorized to underwrite all classes of accident insurance accepted by accident insurance companies and the Branch now accepts motor-car comprehensive, plate-glass, and fidelity-guarantee insurance.
The premium income and claims of the Accident Branch since the commencement of business have been as follows: —
| STATE ACCIDENT INSURANCE.—PREMIUMS AND CLAIMS. | ||
|---|---|---|
| Year. | Net Premium Income. | Claims. |
* From 7th June to 31st December. | ||
| £ | £ | |
| 1901* | 11,856 | 2,428 |
| 1902 | 14,100 | 7,364 |
| 1903 | 24,381 | 13,230 |
| 1904 | 23,768 | 12,105 |
| 1905 | 23,970 | 11,242 |
| 1906 | 20,815 | 13,720 |
| 1907 | 21,477 | 11,288 |
| 1908 | 20,898 | 11,926 |
| 1909 | 26,337 | 12,805 |
| 1910 | 21,364 | 12,522 |
| 1911 | 20,756 | 10,497 |
| 1912 | 23,513 | 12,016 |
| 1913 | 23,277 | 11,492 |
| 1914 | 22,090 | 9,633 |
| 1915 | 23,265 | 9,092 |
| 1916 | 22,350 | 10,698 |
| 1917 | 22,058 | 9,270 |
| 1918 | 21,630 | 10,830 |
| 1919 | 25,285 | 13,150 |
| 1920 | 29,852 | 14,975 |
| 1921 | 35,932 | 16,786 |
| 1922 | 33,348 | 20,330 |
| 1923 | 35,268 | 22,402 |
| 1924 | 39,614 | 24,764 |
| 1925 | 49,967 | 30,552 |
The ratio of claims to premiums for the year 1925 worked out at 61.2 per cent. as against the previous year's percentage of 62.5, while the average for the quinquennium 1921–25 was 59.2. The ratio of working-expenses to premiums for 1925 was 26.6 per cent. compared with 26.7 for 1924.
The following is the Revenue Account for the year ended 31st December, 1925: —
| STATE ACCIDENT INSURANCE REVENUE ACCOUNT, 1925. | ||
|---|---|---|
| £ | £ | |
| Premiums after deduction of reinsurances | 49,967 | |
| Interest | £8,983 | |
| Less land and income tax | 1,875 | 7,108 |
| £57,075 | ||
| Free year bonus on personal-accident policies | 197 | |
| Claims | 30,552 | |
| Commission | 5,590 | |
| Salaries | 6,025 | |
| Contribution to Superannuation Fund | 145 | |
| Expenses of management | 1,515 | |
| Further appropriation for unearned premiums | 4,660 | |
| Amount of accident funds, 31st December, 1925 | 8,391 | |
| £57,075 | ||
The liabilities and assets on the 31st December, 1925, were as follow: —
| STATE ACCIDENT INSURANCE.—LIABILITIES AND ASSETS. | ||
|---|---|---|
| £ | £ | |
| Liabilities. | ||
| Accident Funds, as per Revenue Account | 8,391 | |
| Claims admitted (proofs not yet completed) | 12,000 | |
| Government taxes | 1,229 | |
| Commission | 685 | |
| Premium and other deposits | 101 | |
| Sundry creditors | 54 | |
| Officers' Fidelity Fund | 500 | |
| Reserve for unearned premiums | 22,485 | |
| Investment Fluctuation Reserve | 3,000 | |
| Reserve Fund constituted under section 20 of the Government Accident Insurance Act, 1908 | 153,558 | |
| £202,003 | ||
| Debentures issued under authority of the Finance Act, 1915 | 10,000 | |
| New Zealand Inscribed stock—War loans | 100,500 | |
| New Zealand inscribed stock | 3,000 | |
| Local authority securities | 26,000 | |
| Mortgages on property | 49,030 | |
| Overdue Interest | £27 | |
| Outstanding Interest due but not overdue | 30 | |
| Interest accrued but not due | 2,342 | |
| 2,399 | ||
| Agents' balances | 212 | |
| Sundry debtors | 6,819 | |
| Cash in hand and on current account | 4,043 | |
| £202,003 | ||
The total assets at the end of the year amounted to £202,003, compared with £187,836 at the end of 1924. New Zealand Government securities represent 56 per cent. of the total assets, while mortgages on property and local-authority securities account for 24 and 13 per cent. respectively. The Reserve Fund, which stood at £115,020 at the end of 1924, has been increased to £153,558.
IN the Dominion's legislation four separate classes of fire-insurance offices are distinguished—namely, (1) Local insurance companies established within the limits of New Zealand; (2) foreign insurance companies established beyond New Zealand; (3) British offices similarly established; and (4) mutual fire-insurance associations. To these may be added the State Fire Insurance Office, established under a separate Act of Parliament. The Companies Act, 1908, provides for the incorporation with limited liability of local insurance companies formed for the insurance of property other than that of shareholders. Such a company requires a paid-up capital of £50,000 intact, and if the amount of paid-up capital falls below this sum incorporation can be effected only with unlimited liability. Insurance companies established or incorporated overseas require to have a like paid-up capital intact. The transaction of business by such companies is, however, subject to special legislation as set out below. Mutual associations are dealt with by the Mutual Fire Insurance Act, 1908, and are referred to specially at a later stage in this subsection.
Prior to the passing of the Insurance Companies' Deposits Act, 1921–22, and its amendment of 1922, no deposit whatever was required by companies carrying on the business of fire insurance, and practically none was required in respect of the business of employers' liability insurance. Now, however, deposits in cash are to be made with the Public Trustee by fire and accident offices, varying according as to whether the company concerned is established or incorporated in a British country (other than New Zealand) or has its chief office in a foreign country. No deposit is required from a company constituted in New Zealand under the New Zealand laws.
The actual amounts of the deposits required to be made in accordance with the statutory provision of the principal Act were: For British companies carrying on operations in New Zealand—in respect of fire-insurance business, £15,000; in respect of employers' liability business, £15,000; and in respect of all other classes of business (except life and marine), £5,000. Foreign companies were required to deposit a sum of £35,000, which covered all classes of business (except life and marine). Overseas companies becoming established in New Zealand after the passing of the principal Act are required to make deposits on a somewhat higher scale than the foregoing. British offices must deposit the sum of £22,500 on account of fire business, the same amount for employers' liability insurance business, and £5,000 in respect of all other classes (other than life and marine) of insurance business. A newly established foreign company must deposit the sum of £50,000, and this covers all classes of business other than life and marine.
The amount held by the Public Trustee on the 31st March, 1926, under the Insurance Companies' Deposits Act was £1,051,877, including interest accrued but not disbursed. In terms of the Act the whole of these moneys are invested in the Common Fund of the Public Trust Office, and interest is payable to the respective companies at the rate payable from time to time on investments held in that fund.
Statistics of fire insurance are collected annually by the Census and Statistics Office. The principal heads of inquiry relate to—(a) Stability of the company as shown by the balance-sheet for whole-world business; (b) the extent to which the office has assets in the Dominion; (c) the amount of business transacted during the year under review; (d) fires and losses; (e) revenue and expenditure; and (f) working-expenses. Statistics wore first collected for the financial year of each company ended nearest the 31st December, 1918.
For 1924, statistics were collected from 42 offices carrying on business in New Zealand. The head offices of these were distributed as follow: England, 20; New Zealand, 13; Australia, 6; Hong Kong, 1; United States of America, 2. Included in the 13 New Zealand companies were 4 mutual fire-insurance associations and the State Fire Office.
The statistics for the year 1924 cover for the first time two new companies which have recently entered the fire-insurance field in New Zealand. These are the Mercantile and General Insurance Company (Limited) and the Dominion Co-operative Society, two local concerns which commenced business in April, 1924, and August, 1923, respectively. The name of the Australian Provincial Assurance Company (Limited) disappears from the list, its fire business having been taken over by the Union Assurance Society.
The following table indicates generally the extent to which fire-insurance offices have funds available to meet losses and liabilities. Funds of life departments are added for completeness, but by the Life Insurance Act, 1908 (which follows the provisions of the Imperial statute on the subject), life funds must be accounted for separately, and form a security for life-policy holders which is not available to other phases of insurance transacted. The amount of funds (other than life) both in New Zealand and elsewhere is, it will be seen, over 227 millions.
| FIRE INSURANCE.—LIABILITIES AND ASSETS, 1924. | ||||
|---|---|---|---|---|
| — | Liabilities. | Total Assets. | ||
| Overseas Companies. | Local Offices. | Mutual Associations. | ||
* These figures in the case of mutual associations relate to premium-note capital. | ||||
| £ | £ | £ | £ | |
| Paid-up capital | 22,863,283 | 2,284,550 | 145,776* | 25,293,609 |
| Reserves | 150,173,924 | 3,755,288 | 24,695 | 153,953,907 |
| Other liabilities | 47,061,230 | 1,046,622 | 13,054 | 48,120,906 |
| Totals | 220,098,437 | 7,086,460 | 183,525 | 227,368,422 |
| Life funds | 306,915,536 | .. | .. | 306,915,536 |
| Grand totals | 527,013,973 | 7,086,460 | 183,525 | 534,283,958 |
New Zealand assets of all offices transacting business amounted in 1924 to £7,718,528. In the following table the figures for the amount of assets in New Zealand under various heads are given for the last three years. In 1921 the total was £4,703,594, so that the increase during the three years was £3,014,934. The huge increase in New Zealand Government and local-authority securities during 1923 was due in a large measure to the holdings of these investments by the Prudential Insurance Company (Limited), which commenced business in New Zealand during that year. The results of operations for 1924 disclose decreases in the amounts invested in New Zealand war-loan securities, mortgages, and “cash and other assets,” but this is more than compensated for by the increased holdings in New Zealand Government “ordinary” securities, and to a lesser extent by local-authority securities and house and landed property.
| FIRE INSURANCE.—ASSETS IN NEW ZEALAND, 1922–24. | |||
|---|---|---|---|
| Assets in New Zealand. | 1922. | 1923. | 1924. |
| £ | £ | £ | |
| Houses and landed property | 556,784 | 608,079 | 665,284 |
| New Zealand Government securities—Ordinary | 346,298 | 1,428,256 | 1,708,996 |
| New Zealand Government securities—War loan | 1,872,264 | 1,675,155 | 1,670,170 |
| New Zealand local-authority securities | 512,186 | 1,080,506 | 1,188,629 |
| Mortgages, &c. | 328,382 | 359,287 | 337,919 |
| Cash and other assets in New Zealand | 2,143,334 | 2,184,047 | 2,147,530 |
| Total New Zealand assets | 5,759,248 | 7,335,330 | 7,718,528 |
Looking now at the general progress of fire-insurance business in the Dominion, a comparison of recent operations is afforded by the table below for 1922, 1923, and 1924.
| FIRE INSURANCE.—AMOUNTS UNDERWRITTEN, PREMIUMS, AND LOSSES, 1922–24. | |||
|---|---|---|---|
| — | 1922. | 1923. | 1924. |
* Excluding reinsurances accepted from other offices. | |||
| Offices in New Zealand. | |||
| Number of separate companies | 41 | 41 | 42 |
| Number of towns in which branches established | 148 | 148 | 154 |
| Number of towns in which agencies exist | 8,708 | 9,540 | 9,961 |
| Number of separate agencies in New Zealand | 10,852 | 11,571 | 12,268 |
| Amounts underwritten. | |||
| Gross amount of insurance cover in force in New Zealand on 31st December* | £293,646,272 | £309,740,593 | £332,959,709 |
| Number of policies representing the foregoing* | 583,792 | 603,303 | 631,009 |
| Gross amount of new and renewal business underwritten during year* | £328,417,438 | £347,677,896 | £372,954,821 |
| Number of policies representing the foregoing* | 636,671 | 660,485 | 695,498 |
| Premiums. | |||
| Total gross premiums charged on business (new and renewal) underwritten during year | £1,924,476 | £1,911,328 | £1,912,707 |
| Percentage of gross premiums to total amount of business underwritten | 0.59 | 0.55 | 0.51 |
| Total premiums (as shown above), less premiums refunded to insured other than to other offices | £1,785,308 | £1,780,463 | £1,772,924 |
| Losses. | |||
| Total number of separate fire losses with which offices were concerned | 4,030 | 4,269 | 5,038 |
| Gross losses | £739,076 | £796,281 | £1,046,328 |
| Percentage of gross loss to amount underwritten (new and renewal) during year (as shown above) | 0.22 | 0.23 | 0.28 |
| Percentage of gross loss to total premiums, less refunds to insured (as shown above) | 41.40 | 44.72 | 59.02 |
| Average loss per fire | £181 | £187 | £208 |
It is interesting to note that on the 31st December, 1924, the fire-insurance cover on property in New Zealand totalled £332,959,709. The corresponding figure in 1919 was £207,731,768, the increase during the quinquennium being thus over 60 per cent. The total amount underwritten during 1924 increased by some twenty-five and a quarter millions over the 1923 total, while the percentage increase during the last five years was 50.56. The amount charged to the insuring public by way of premiums during 1924 was £1,912,707, or, less refunds, £1,772,924. The insurance companies, on the other hand, paid out in losses £1,046,328, this being easily the largest amount ever paid out in one year in the Dominion. The percentage of losses to premium income in 1924 (59) is the highest since 1911.
The table set out below shows for the years 1898 to 1924 the premium income and the fire losses, together with the percentage of loss in each year, in five-yearly periods, and in ten-yearly periods. As previously stated, statistics of fire insurance have been collected only since 1918, and the figures prior to that date have kindly been supplied by the Council of the Fire Underwriters' Associations of New Zealand, and refer only to those insurance offices in New Zealand which are members of the Council of the Fire Underwriters' Associations. The official figures from 1918 to 1924 (inclusive) refer to all offices, and these facts must not be lost sight of when comparisons are being made.
| FIRE INSURANCE: PREMIUM INCOME AND LOSSES, 1898–1924, | |||||
|---|---|---|---|---|---|
| Year. | Premium Income. | Fire Losses. | Percentage of Loss. | ||
| Yearly Periods. | Five-yearly Periods. | Ten-yearly Periods. | |||
* Seven years. | |||||
| £ | £ | ||||
| 1898 | 382,284 | 302,490 | 79.1 | ||
| 1899 | 399,110 | 185,210 | 46.4 | ||
| 1900 | 432,944 | 254,006 | 58.6 | 62.2 | |
| 1901 | 453,583 | 385,609 | 85.0 | ||
| 1902 | 490,722 | 215,500 | 43.8 | 64.0 | |
| 1903 | 527,861 | 223,000 | 42.2 | ||
| 1904 | 565,000 | 427,874 | 75.7 | 65.4 | |
| 1905 | 494,822 | 322,496 | 65.2 | ||
| 1906 | 508,222 | 407,869 | 80.3 | ||
| 1907 | 538,076 | 341,444 | 63.4 | ||
| 1908 | 578,222 | 544,606 | 94.2 | ||
| 1909 | 596,769 | 415,951 | 69.6 | ||
| 1910 | 637,856 | 368,887 | 57.8 | 66.8 | |
| 1911 | 688,820 | 424,194 | 61.6 | ||
| 1912 | 733,945 | 406,385 | 55.3 | 57.9 | |
| 1913 | 790,525 | 450,970 | 57.0 | ||
| 1914 | 813,469 | 434,310 | 53.3 | ||
| 1915 | 854,509 | 433,467 | 50.7 | 51.2 | |
| 1916 | 912,222 | 373,896 | 40.9 | ||
| 1917 | 969,186 | 531,121 | 54.8 | ||
| 1918 | 1,241,829 | 472,247 | 38.0 | ||
| 1919 | 1,351,083 | 390,598 | 28.9 | ||
| 1920 | 1,622,048 | 448,656 | 27.7 | 35.9 | |
| 1921 | 1,768,416 | 738,638 | 41.8 | 40.9* | |
| 1922 | 1,785,308 | 739,076 | 41.4 | ||
| 1923 | 1,780,463 | 796,281 | 44.7 | ||
| 1924 | 1,772,924 | 1,046,328 | 59.0 | ||
A statement of the total income and outgo, both gross and net, of all offices in respect of New Zealand business is now given. The gross reserve for unexpired risks, it should be noted, is calculated on the assumption that it bears the same proportion to gross premium income as does the net.
| FIRE INSURANCE.—INCOME AND OUTGO, 1922–24. | ||||||
|---|---|---|---|---|---|---|
| — | 1922. | 1923. | 1924. | |||
| Gross. | Net. | Gross. | Net. | Gross. | Net. | |
* The gross figures are exclusive of reinsurance premiums from other offices. | ||||||
| £ | £ | £ | £ | £ | £ | |
| Income. | ||||||
| Reserve to meet unexpired risks as at beginning of year | 806,027 | 534,076 | 797,639 | 536,352 | 783,880 | 531,889 |
| Reserve, additional to foregoing | 20,749 | 20,749 | 29,496 | 29,496 | 30,057 | 30,057 |
| Amount of fire premiums receivable during year* | 1,924,476 | 1,300,001 | 2,139,601 | 1,283,259 | 1,912,707 | 1,267,216 |
| Interest and dividends on stock, mortgages, &c. | 90,685 | 90,685 | 102,185 | 102,185 | 115,162 | 115,162 |
| Rents | 15,955 | 15,955 | 16,615 | 16,615 | 29,801 | 29,801 |
| Other revenue | 2,053 | 2,053 | 3,321 | 3,321 | 3,341 | 3,341 |
| Totals | 2,859,945 | 1,963,519 | 3,088,857 | 1,971,228 | 2,874,948 | 1,977,466 |
| Outgo. | ||||||
| Amount of fire losses incurred during year, including adjustment and other expenses of settlement, but less salvage and amounts covered by reinsurance | 739,076 | 486,609 | 796,281 | 582,017 | 1,043,328 | 634,072 |
| New Zealand Government taxes | 150,630 | 141,842 | 100,066 | 99,618 | 79,148 | 71,154 |
| Local-authority rates | 2,880 | 2,880 | 3,201 | 3,201 | 3,276 | 2,902 |
| License fees | 5,214 | 4,983 | 5,423 | 5,366 | 5,107 | 5,036 |
| Fire Board levies | 37,518 | 29,749 | 36,736 | 30,615 | 42,819 | 36,076 |
| Rents | 22,289 | 20,130 | 23,514 | 21,434 | 24,257 | 22,811 |
| Allowances and commissions on premiums to agents, sub-agents, and others | 244,066 | 156,027 | 229,532 | 146,071 | 245,739 | 158,623 |
| Salaries and wages, including commissions on profits or bonuses | 221,895 | 193,316 | 217,435 | 186,973 | 223,280 | 204,188 |
| Other expenses of management | 121,693 | 102,298 | 117,171 | 93,206 | 126,619 | 106,490 |
| Reserve to meet unexpired risks as at the end of the year | 797,640 | 536,225 | 783,880 | 529,880 | 760,719 | 530,501 |
| Reserve, additional to foregoing | 29,496 | 29,496 | 30,057 | 30,057 | 30,158 | 30,158 |
| Other expenditure | 1,717 | 1,717 | 19,268 | 8,271 | 7,803 | 7,803 |
| Totals | 2,374,114 | 1,705,272 | 2,362,564 | 1,736,709 | 2,595,253 | 1,809,814 |
In so far as the net income was concerned, there was a decrease of £16,742 in the net premiums for 1923, and of £32,785 for 1924, when compared with 1922. These decreases are due to the special bonus rebate which came into operation on the 1st August, 1923, and has been in operation ever since, with, however, altered rates. The State Fire Office had for many years had the intention of returning some of its accumulated profits by way of a bonus to its policyholders. It was found, however, that the cost involved in paying a bonus in the manner usually followed by life-insurance offices would prove very costly, and in order to allow policyholders to benefit to the greatest possible extent the State Fire Insurance Act was amended to enabl the Board of the Office to allow a rebate to insurers. Accordingly a rebate of 15 per cent. was declared from the above-mentioned date, and all other fire offices fell into line and declared a similar rebate. On the expiry of that period the Board reviewed the position and declared a continuance of the rebate at the rate of 10 per cent. for a further period of twelve months. This rate was continued until the 31st December, 1925, when it was increased to 12 ½ per cent.
During the period covered by the returns for 1923 that the rebate was in force the insuring public benefited to the extent of £141,794, and during 1924 by £271,440, making a total concession to the insuring public of £413,234 to the end of 1924. Regard should be had to the foregoing when comparisons with previous years are attempted. Notwithstanding the rebate, the total net income increased by £7,709 in 1923 and £6,238 in 1924, compared with £76,050 in 1922 and £197,752 in 1921. With regard to outgo, losses in 1921, 1922, 1923, and 1924 show a very great increase as compared with 1920, and this is reflected in the percentage which the gross loss bears to the total premiums received.
The reserve set aside to meet unexpired risks is in only one instance under 40 per cent. of the net premium income, and in five cases 50 per cent. has been allowed.
The net premiums and net losses for 1924 are sot out for each office in the following table. The total receipts and expenditure are also given in each case.
| FIRE INSURANCE.—REVENUE AND EXPENDITURE, 1924. | ||||
|---|---|---|---|---|
| Name of Fire-insurance Office. | Net Revenue. | Net Expenditure. | ||
| Premiums. | Total. | Fire Losses. | Total. | |
| £ | £ | £ | £ | |
| Overseas Companies. | ||||
| Alliance | 44,889 | 63,917 | 23,547 | 56,690 |
| Atlas | 36,732 | 51,599 | 16,892 | 53,890 |
| Australian Alliance | 4,731 | 7,664 | 3,387 | 8,032 |
| British Traders' | 14,180 | 23,870 | 8,784 | 23,762 |
| Commercial Union | 48,423 | 71,447 | 25,018 | 62,902 |
| Eagle, Star, and British Dominions | 38,219 | 53,256 | 17,286 | 50,161 |
| Excess | 22,323 | 31,879 | 13,885 | 32,835 |
| Guardian | 29,717 | 46,490 | 21,101 | 52,730 |
| Hartford | 8,315 | 13,746 | 5,914 | 13,894 |
| Home | 14,165 | 22,280 | 5,400 | 19,078 |
| Insurance Office of Australia | 12,775 | 19,507 | 9,349 | 18,898 |
| Liverpool and London and Globe | 30,679 | 46,900 | 16,357 | 43,267 |
| London Assurance Corporation | 5,340 | 8,750 | 5,747 | 10,794 |
| London and Lancashire | 22,311 | 32,725 | 8,333 | 29,646 |
| North British and Mercantile | 14,957 | 21,035 | 6,331 | 21,595 |
| Northern Assurance | 22,238 | 35,008 | 13,545 | 32,551 |
| Norwich Union | 20,020 | 29,823 | 10,894 | 42,064 |
| Ocean | 12,292 | 17,864 | 6,187 | 15,677 |
| Phoenix | 36,792 | 53,410 | 15,838 | 47,395 |
| Prudential | 5,504 | 7,725 | 958 | 6,347 |
| Queensland | 24,485 | 37,796 | 14,124 | 36,183 |
| Royal | 49,329 | 40,496 | 21,501 | 103,202 |
| Royal Exchange | 25,588 | 104,121 | 13,254 | 36,460 |
| Southern Union | 6,827 | 8,747 | 4,162 | 8,776 |
| Sun | 45,752 | 63,749 | 27,075 | 60,804 |
| Union | 24,567 | 34,269 | 12,226 | 38,541 |
| United | 29,373 | 42,366 | 16,149 | 44,496 |
| Victoria | 45,337 | 66,801 | 22,269 | 66,626 |
| Yorkshire | 15,179 | 23,763 | 9,736 | 32,210 |
| Total (overseas companies) | 711,039 | 1,080,005 | 375,249 | 1,069,506 |
| Local Companies. | ||||
| Dominion Co-operative | 700 | 699 | 6 | 802 |
| Farmers' Co-operative | 18,951 | 30,678 | 7,585 | 22,460 |
| Mercantile and General | 5,252 | 8,406 | 1,509 | 12,279 |
| National | 59,639 | 95,923 | 27,567 | 83,455 |
| New Zealand | 132,704 | 209,923 | 70,448 | 171,442 |
| New Zealand Medical | 1,112 | 1,769 | 262 | 1,208 |
| South British | 122,999 | 223,363 | 66,786 | 178,499 |
| Standard | 60,569 | 84,004 | 19,683 | 71,232 |
| State | 143,065 | 229,960 | 60,817 | 189,829 |
| Total (local companies) | 544,991 | 884,725 | 254,663 | 731,206 |
| Mutual Associations. | ||||
| Hawke's Bay Farmers' | 126 | 174 | 35 | 173 |
| Otago Farmers' Union | 3,366 | 3,862 | 1,250 | 2,932 |
| Taranaki Farmers' | 3,778 | 4,484 | 1,439 | 3,115 |
| Wellington Farmers' | 3,916 | 4,216 | 1,436 | 2,882 |
| Total (mutual associations) | 11,186 | 12,736 | 4,160 | 9,102 |
| Total (all offices) | 1,267,216 | 1,977,466 | 634,072 | 1,809,814 |
A favourable result accrued to fire offices in the Dominion as a result of business for the two years 1919 and 1920, and this was so notwithstanding the increased costs of management under every head. For the next four years, however, particularly in 1924, considerably heavier fire losses resulted in comparatively bad years of business.
The next table, covering the last three years, shows the percentage of working-expenses to premium income (net and gross) and total net income. The ratios are given both with and without taxes included as a working-expense, and although it is recognized that taxes are in no sense a working-expense, yet they are undoubtedly a heavy recurring call on the profits of an institution. The expenses are increased by at least 10 per cent. on this account. For 1923 and 1924 the working-expenses ratios have been much affected by the special bonus rebates previously mentioned. It is desirable, therefore, to adjust the figures in terms of the rebate, showing one set of percentages worked on the actual figures and one on the adjusted figures.
| FIRE INSURANCE.—WORKING-EXPENSES, 1923 AND 1924. | ||||
|---|---|---|---|---|
| Items. | 1923. | 1924. | ||
| Actual. | Adjusted for Rebate. | Actual. | Adjusted for Debate. | |
| Per Cent. | Per Cent. | Per Cent. | Per Cent. | |
| Net working-expenses (excluding taxes) to net premium income | 38.60 | 36.05 | 42.92 | 37.43 |
| Net working-expenses (including taxes) to net premium income | 46.35 | 43.29 | 48.54 | 42.83 |
| Gross working-expenses (excluding taxes) to gross premium income (including reinsurances from other offices) | 29.95 | 28.09 | 33.56 | 29.56 |
| Net working-expenses (excluding taxes) to total net income (excluding reserve for unexpired risks at beginning of year) | 35.25 | 33.11 | 38.43 | 33.96 |
| Net working-expenses (including taxes) to total net income (excluding reserve for unexpired risks at beginning of year) | 42.32 | 39.75 | 43.45 | 38.41 |
The net fire losses for 1924 were £634,072, as compared with £582,017 for 1923 and £486,609 for 1922. In 1924 there were 4,083 fires and 41 conflagrations (cases where three or more buildings are affected). The corresponding figures for the previous year were 3,636 and 51. It should be noted here, however, that the figures for 1924 refer to the calendar year, and not the period covered by the accounts of the various offices, as was previously the case. The total gross loss in 1924 represented 59.02 per cent. of the premiums charged (less refunds to insured other than fire offices), and 0.28 per cent. of the total risk covered. The corresponding figures for 1923 were 44.72 per cent. and 0.23 per cent. The following table shows for each of the four principal urban areas and the remainder of the Dominion the fires and losses for 1924: —
| FIRE INSURANCE.—FIRES AND LOSSES, 1924. | ||||||
|---|---|---|---|---|---|---|
| — | Separate Fires. | Conflagrations. | Buildings affected. | Gross Cover.* | Gross Loss. | Ratio of Loss to Cover.* |
* On buildings affected. | ||||||
| £ | £ | Per Cent. | ||||
| Urban areas— | ||||||
| Auckland | 457 | 8 | 517 | 794,612 | 148,407 | 18.68 |
| Wellington | 418 | 7 | 478 | 976,686 | 114,173 | 11.69 |
| Christchurch | 324 | 1 | 347 | 531,530 | 157,236 | 29.58 |
| Dunedin | 257 | 1 | 272 | 331,259 | 36,686 | 11.07 |
| Rest of Dominion | 2,627 | 24 | 2,791 | 1,734,534 | 552,244 | 31.84 |
| Totals | 4,083 | 41 | 4,405 | 4,368,621 | 1,008,746 | 23.09 |
The lower loss ratio in the cases of the principal urban areas as compared with the rest of the Dominion is to be expected in view of the greater fire-brigade facilities for handling fires in the larger centres. Companies usually allow this factor to influence the premium' required.
Mutual associations are dealt with by the Mutual Fire Insurance Act, 1908, which allows at least 100 owners of isolated or farm property to subscribe to a declaration and form themselves into a mutual association to insure against loss by fire to an amount in the aggregate of not less than £40,000. Such associations effect insurance on the premium-note principle, and accept premium notes to be assessed for losses in the proportion of the total amount of such notes. The amount of a member's premium notes limits his liability.
In addition to furnishing returns to the Government Statistician, each mutual association is required to furnish to the Public Trustee a statement of the condition of the association as at the 31st March in each year. During the period covered by the foregoing general statistics there were four such mutual associations operating in New Zealand, but one has since ceased to exist. The following particulars are taken from the statements furnished to the Public Trustee for the year ended 31st March, 1926: —
| — | Taranaki Farmers' Mutual Fire Insurance Association. | Wellington Farmers' Mutual Fire Insurance Association. | Otago Farmers' Mutual Fire Insurance Association. |
|---|---|---|---|
| £ | £ | £ | |
| Assets— | |||
| Cash in hand and in bank | 3,421 | 1,018 | 305 |
| Fixed deposits | 2,000 | 7,200 | .. |
| Outstanding premium notes | 58,810 | 57,137 | 41,665 |
| Other investments | 12,158 | .. | 10,955 |
| Other assets | 512 | 132 | 676 |
| Total assets | 76,901 | 65,487 | 53,601 |
| Liabilities— | |||
| Existing claims | 972 | .. | 246 |
| Policies in force | 1,000,802 | 610,571 | 1,923,850 |
| Reserves | 1,180 | .. | .. |
| Total liabilities | 1,002,954 | 610,571 | 1,924,096 |
| Income— | |||
| Premium notes | 5,527 | 4,118 | 6,862 |
| Interest | 783 | 446 | 488 |
| Other receipts | .. | 103 | .. |
| Total income | 6,310 | 4,667 | 7,350 |
| Expenditure— | |||
| Losses paid | 4,514 | 2,854 | 1,474 |
| Expenses | 2,289 | 1,460 | 145 |
| Reinsurance | 439 | 464 | 446 |
| Other payments and expenditure | 215 | .. | 174 |
| Total expenditure | 7,457 | 4,778 | 2,239 |
In the year 1903 an Act was passed “to establish a State Fire Insurance Office and to make other provisions for the insurance and protection of insurable property in New Zealand against loss or damage by fire.” This Act came into operation on the 4th January, 1905, when the State Fire Insurance Office opened for public business with an advance of £2,000 borrowed from the Treasury.
At the end of the first year the Office showed an income of £13,135 and a net surplus of £481. From this the progress of the Office may be gauged from the figures for 1925, which show an annual income of £207,418, and assets of over £600,000.
As has been mentioned earlier in this subsection, under the State Fire Insurance Amendment Act, 1922, provision is made that when the Board considers that the funds of the Office are sufficient to meet liabilities it may direct that a rebate be allowed to insurers in respect of premiums thereafter becoming payable. In 1923 the State Fire Office declared a rebate to policyholders, which took the form of a 15-per-cent. reduction on all premiums falling due between the 1st August, 1923, and 31st July, 1924. On the expiry of the period for which the first rebate was granted the Board considered that the financial position of the Office justified the declaration of a further rebate to apply for twelve months from the 1st August, 1924, the rate in this case, however, to be 10 per cent. instead of 15 per cent. as in the first case. This rate was continued until the 31st December, 1925, when it was increased to 12 ½ per cent. The amount granted in rebates to State Fire policyholders during 1925 was £17,405, which, added to the amounts granted in 1923 and 1924, makes a total concession to policyholders of £50,406.
As a consequence of the operations of the State Fire Office the rates on trade risks and the like have been reduced by 10 per cent., and those on dwellings, offices, and similar risks by 33 ½ per cent. These reductions, together with the institution of the rebate system, have saved the insuring public at least £4,000,000 in the last twenty years. The State Fire Office has also paid over £140,000 in income-tax during the last nine years.
The premium income, after deducting premiums on reinsurances, during the ten years 1916–25 has been as follows:—
| Year. | Amount of Net Premium Income. |
|---|---|
| £ | |
| 1916 | 77,609 |
| 1917 | 85,321 |
| 1918 | 90,077 |
| 1919 | 100,764 |
| 1920 | 124,538 |
| 1921 | 136,429 |
| 1922 | 142,592 |
| 1923 | 154,164 |
| 1924 | 165,070 |
| 1925 | 176,664 |
The net income from all sources in 1925 amounted to £207,418, and the net premium income to £176,664, compared with the previous year's figures of £190,300 and £165,070 respectively. The surplus for the year, after making provision for rebates, reserves, and depreciation and writing down of Office premises, was £35,917.
The net losses were £56,997, as compared with £60,817 for 1924, the ratio to net premium income being 36.26 per cent. and 36.84 per cent. respectively.
The balance-sheet of the State Fire Insurance Office as at the 31st December, 1925, is appended.
| £ | £ | |
|---|---|---|
| Liabilities. | ||
| Capital authorized by the State Fire Insurance Act, 1908 | 100,000 | |
| Less not raised | 100,000 | Nil. |
| Reserve Fund | 412,979 | |
| Investments Fluctuation Reserve Fund | 10,000 | |
| Reserve for unearned premiums | 70,666 | |
| Bonus rebate reserve | 23,500 | |
| Reinsurance Reserve Fund | 15,000 | |
| Premiums and other deposits | 998 | |
| Outstanding Are losses | 4,156 | |
| Government taxes | 10,243 | |
| Sundry creditors | 6,447 | |
| Other amounts owing by the Office— | ||
| Reinsurance premiums due | £11,353 | |
| Commission | 1,743 | |
| Rent | 78 | |
| Printing, stationery, and advertising | 51 | |
| Postages and sundry charges | 960 | |
| 14,190 | ||
| Fire-insurance funds, as per Revenue Account | 35,917 | |
| £604,096 | ||
| Assets. | ||
| Government war-loan securities | 138,471 | |
| Other Government securities | 93,550 | |
| Local-authority securities | 30,200 | |
| Fixed deposits and at short call | 55,000 | |
| Land and buildings | 224,876 | |
| Outstanding premiums | 8,606 | |
| Interest accrued but not due | 3,668 | |
| Rent accrued or due | 92 | |
| Cash In Bank of New Zealand at Wellington, or in transit to Wellington | £48,614 | |
| Imprest Account balances | 1,019 | |
| 49,633 | ||
| £604,096 | ||
Exclusive of Government taxes, which amounted to 5.8 per cent., the working-expense ratio to premium income was 28.14 per cent., and without Fire Board contributions and depreciation of Office premises only 23.8 per cent.
The accumulated funds at the close of 1925 amounted to £568,061, a substantial increase of £69,054 over the figure for the previous year (£499,007); while the assets as at the 31st December, 1925, totalled £604,096.
At the 31st December, 1925, there were 163 fire brigades (including branches) in New Zealand, with a total of 411 officers and 2,029 men. Figures for each of the last five years are—
| Year. | Stations. | Officers. | Men. | Total Personnel. |
|---|---|---|---|---|
| 1921 | 156 | 400 | 1,984 | 2,384 |
| 1922 | 160 | 417 | 2,057 | 2,474 |
| 1923 | 159 | 410 | 2,037 | 2,447 |
| 1924 | 158 | 400 | 2,021 | 2,421 |
| 1925 | 163 | 411 | 2,029 | 2,440 |
Table of Contents
THE legislation dealing with friendly societies is contained in the Friendly Societies Act, 1909, and its amendments of 1911, 1914, 1915, and 1922. Provision is made for the registration of all societies and branches with a central Government officer entitled the Registrar of Friendly Societies, and also for the general oversight by the Government of the administration of the funds of the societies. The powers, duties, and obligations of societies are set out, as is also a schedule of offences and of penalties therefor.
A scheme for the extension of State benefits to members of friendly societies, on special terms, was introduced by the Finance Act, 1916 (Part IX), and extended and amended by the National Provident Fund Amendment Act, 1919, which is now embodied in the National Provident Fund Act, 1926. Information concerning the scheme is given in Section XXIV of this book, in the article dealing with the National Provident Fund.
At the 31st December, 1925, there were 962 lodges, courts, &c., on the Register of Friendly Societies, a net increase of thirty-five during the year. The figures for the various orders are as follow:—
| Name of Order. | Registrations at 1st January, 1925. | Established. | Closed. | Registrations at 31st December, 1925. |
|---|---|---|---|---|
| Manchester Unity Independent Order of Oddfellows | 219 | 8 | .. | 227 |
| Independent Order of Oddfellows | 143 | 20 | .. | 163 |
| National Independent Order of Oddfellows | 3 | .. | .. | 3 |
| British United Order of Oddfellows | 1 | .. | .. | 1 |
| Ancient Order of Foresters | 158 | 2 | .. | 160 |
| Ancient Order of Shepherds | 1 | .. | .. | 1 |
| United Ancient Order of Druids | 141 | 1 | 2 | 140 |
| Independent Order of Rechabites | 65 | 3 | 1 | 67 |
| Sons and Daughters of Temperance | 11 | .. | .. | 11 |
| Hibernian Australasian Catholic Benefit Society | 70 | 2 | 2 | 70 |
| Protestant Alliance Friendly Society of Australasia | 13 | .. | .. | 13 |
| Grand United Order of Oddfellows | 8 | 3 | .. | 11 |
| Isolated friendly societies | 50 | 2 | .. | 52 |
| Working-men's clubs | 16 | .. | .. | 16 |
| Independent Order of Good Templars | 11 | .. | .. | 11 |
| Specially authorized societies | 17 | .. | 1 | 16 |
| Totals | 927 | 41 | 6 | 962 |
Annual returns of receipts, expenditure, &c., are required by law, but it would appear that many lodges do not comply with the requirements. For the year 1925 the Registrar of Friendly Societies received returns from 817 lodges, with an aggregate membership of 91,353 at the end of the year, as compared with 782 lodges and 87,433 members for 1924. The following table shows the membership at the beginning and end of the year, with the accretions and losses of members during the year, in respect of the 817 lodges returned in 1925: —
| Number of members, 1st January | 87,433 | |
|---|---|---|
| Number admitted by— | ||
| Initiation, &c. | 9,330 | |
| Clearance | 1,142 | |
| 10,472 | ||
| 97,905 | ||
| Number who died | 648 | |
| Number left by— | ||
| Clearance | 1,178 | |
| Arrears, &c. | 4,726 | |
| 6,552 | ||
| Number of members at 31st December | 91,353 | |
The above figures show an increase in membership equal to 4.48 per cent., as compared with 3.81 per cent. for 1924.
The figures of membership of lodges furnishing returns during each of the last ten years are as follows: —
| Year. | Number of Lodges tabulated. | Number of Members. |
|---|---|---|
| 1916 | 727 | 70,360 |
| 1917 | 730 | 68,771 |
| 1918 | 731 | 67,527 |
| 1919 | 735 | 70,598 |
| 1920 | 732 | 74,210 |
| 1921 | 731 | 77,814 |
| 1922 | 746 | 80,777 |
| 1923 | 774 | 84,228 |
| 1924 | 782 | 87,433 |
| 1925 | 817 | 91,353 |
The figures are of use for comparative purposes, in spite of the comparatively large proportion of lodges which do not furnish returns, as it is found that with few exceptions the same lodges are the delinquents each year.
In the following statement of the mortality experience for the last five years no account has been taken of age incidence:—
| Year. | Deaths of Members. | Deaths of Members' Wives. | ||
|---|---|---|---|---|
| Number. | Per 1,000 Members at Risk. | Number. | Per 1,000 Members at Risk. | |
| 1921 | 615 | 8.08 | 261 | 3.43 |
| 1922 | 649 | 8.18 | 296 | 3.73 |
| 1923 | 684 | 8.29 | 328 | 3.98 |
| 1924 | 674 | 8.09 | 295 | 3.54 |
| 1925 | 648 | 7.22 | 328 | 3.66 |
The number of members sick during 1925 was 14,602, representing 17.9 per cent. of members at risk. The sickness experienced during 1925 aggregated 161,320 weeks, equal to eleven weeks per sick member, and two weeks for each member at risk.
The total funds of the societies and branches as on the 31st December, 1925, amounted to £3,136,237, made up as follows: Sick and Funeral Funds (inclusive of amounts transferred to special funds out of surplus), £2,915,141: Medical and Management Funds, goods, &c., £144,316; Widow and Orphans' Funds, £23,036; and Distress, Benevolent Funds, &c., £53,744. Dividing the total funds by the number of members at the end of the year it is found that the average capital per member is £34 6s. 7d. There has been a continual increase in the amount of accumulated funds standing to the credit of friendly societies during the ten years 1916–25. The average capital per member also shows a growing tendency to increase, the increase over the ten years amounting to 24 per cent., in spite of an increase in membership of 30 per cent.
The total funds and the average capital per member at the end of each of the last ten years were as under:—
| Year. | Total Funds. | Average Capital. | ||
|---|---|---|---|---|
| £ | £ | s. | d. | |
| 1916 | 1,954,940 | 27 | 15 | 8 |
| 1917 | 2,052,753 | 29 | 17 | 0 |
| 1918 | 2,100,443 | 31 | 2 | 1 |
| 1919 | 2,184,653 | 30 | 18 | 11 |
| 1920 | 2,321,176 | 31 | 5 | 7 |
| 1921 | 2,445,843 | 31 | 8 | 8 |
| 1922 | 2,593,692 | 32 | 2 | 2 |
| 1923 | 2,747,952 | 32 | 12 | 6 |
| 1924 | 2,955,340 | 33 | 16 | 0 |
| 1925 | 3,136,237 | 34 | 6 | 7 |
These sums are held against the societies' liabilities under their sickness and funeral insurances, and actuarial valuations made by the Friendly Societies Office from time to time indicate how far they are sufficient or otherwise.
The following statement shows the disposal of the total funds (including those of the central bodies) as on the 31st December, 1925:—
| £ | |
|---|---|
| Funds. | |
| Sick and Funeral Funds | 2,724,840 |
| Surplus Appropriation Funds, &c | 190,301 |
| Management Funds, goods, &c | 144,316 |
| Widow and Orphans' Funds | 23,036 |
| Distress, Benevolent Funds, &c. | 53,744 |
| £3,136,237 | |
| Assets. | |
| Investments at interest | 2,685,251 |
| Value of land and buildings | 307,537 |
| Cash not bearing interest | 93,721 |
| Value of goods | 20,272 |
| Owing by Management Funds | 7,554 |
| Other assets | 21,902 |
| £3,136,237 | |
The net income from investments credited to the Sick and Funeral Funds for 1925 amounted to £149,228, the average rate being 4.5 15s. per cent., as against £5 12s. 7d. in 1924. The figures of Sick and Funeral Funds and of interest earnings thereon during 1925 are given for each order in the following table: —
| Order. | Total Worth of Sick and Funeral Funds as on | Interest earned during 1925. | Average Rate per Cent. | |
|---|---|---|---|---|
| 1st January, 1925. | 31st December, 1925. | |||
| £ | £ | £ | £ | |
| M.U.I.O.O.F. | 982,984 | 988,423 | 54,321 | 5.67 |
| I.O.O.F | 198,203 | 211,564 | 11,963 | 6.01 |
| N.I.O.O.F. | 5,504 | 5,721 | 241 | 4.39 |
| B.U.O.O.F. | 4,920 | 5,137 | 293 | 6.00 |
| A.O.F | 590,286 | 617,177 | 33,150 | 5.65 |
| A.O.S | 1,412 | 1,431 | 75 | 5.42 |
| U.A.O.D | 529,724 | 571,797 | 30,583 | 5.71 |
| I.O.R | 126,762 | 134,288 | 7,455 | 5.88 |
| S.D.T | 31,302 | 31,618 | 1,734 | 5.67 |
| H.A.C.B.S. | 65,526 | 70,973 | 4,178 | 6.31 |
| P.A.F.S.A. | 34,000 | 35,852 | 2,034 | 6.00 |
| G.U.O.O.F. | 273 | 474 | 2 | 0.54 |
| Other societies | 47,430 | 50,385 | 3,199 | 6.76 |
| Totals | 2,61£,326 | 2,724,840 | 149,228 | 5.75 |
The receipts and expenditure of the Sick and Funeral Funds for the year 1925 totalled £400,926 and £294,412 respectively, made up as follows:—
| SICK AND FUNERAL FUNDS, 1925. | |
|---|---|
| £ | |
| Receipts. | |
| Members' contributions | 164,450 |
| Interest and rent | 149,228 |
| Repayments by central body | 42,711 |
| Other receipts | 44,537 |
| £400,926 | |
| Expenditure. | |
| Sick-pay | 104,148 |
| Funeral donations | 28,192 |
| Contributions and levies to central body | 93,669 |
| Other expenditure | 68,403 |
| £294,412 | |
Members' contributions averaged £1 16s. 10d. per member, and interest and rent receipts amounted to £1 13s. 5d. per member, reckoned on the mean number of members for the year. Sickness benefits paid averaged £7 2s. 8d. per member sick, or £1 3s. 4d. when averaged over all members, while funeral benefits represented 6s. 4d. per member.
The receipts' of the Medical and Management Expenses Funds for 1925 totalled £199,953, and the expenditure was £191,158, the details being as follow:—
| MEDICAL AND MANAGEMENT EXPENSES FUNDS, 1925. | |
|---|---|
| £ | |
| Receipts. | |
| Members' contributions | 181,530 |
| Interest and rent | 3,789 |
| Other receipts | 14,634 |
| £199,953 | |
| Expenditure. | |
| Medical attendance and medicine | 122,726 |
| Management expenses | 45,808 |
| Levies to central body | 14,350 |
| Other expenditure | 8,274 |
| £191,158 | |
A comparison of the latest available statistics showing the number of members of friendly societies, the amount of their accumulated capital, and the average capital per member in each of the Australian States and in the Dominion of New Zealand is given in the next table. It is seen that the average amount of capital per member in the Dominion greatly exceeds the average for any of the Australian States.
| State or Dominion. | Date of Return. | Number of Lodges. | Number of Members. | Amount of Funds. | Capital per Member. | ||
|---|---|---|---|---|---|---|---|
| £ | £ | s. | d. | ||||
| New Zealand | 31/12/1925 | 817 | 91,353 | 3,136,237 | 34 | 6 | 7 |
| Victoria | 30/6/1924 | 1,469 | 153,840 | 3,838,052 | 24 | 19 | 0 |
| South Australia | 31/12/1923 | 632 | 72,454 | 1,749,332 | 24 | 2 | 11 |
| Queensland | 31/12/1923 | 615 | 59,649 | 1,227,043 | 20 | 11 | 5 |
| Western Australia | 31/12/1923 | 290 | 19,590 | 349,928 | 17 | 17 | 3 |
| New South Wales | 30/6/1921 | 2,198 | 219,118 | 2,904,432 | 13 | 5 | 1 |
| Tasmania | 31/12/1923 | 190 | 24,660 | 315,367 | 12 | 15 | 9 |
Table of Contents
THE law relating to building societies incorporated in the Dominion is contained in the Building Societies Act, 1908, and is mainly a consolidation of legislation that has been operative since 1880. The Assistant Registrar of Companies in each district acts as Registrar of Building Societies, and before a society can be incorporated the formalities prescribed by the Act and regulations must be completed. Rules, as well as subsequent alterations thereof, must before registration be certified to as conforming to legal requirements by a Revising Barrister appointed by the Governor-General for the purpose. A fee of £5 5s. is payable by the society concerned for this service, but no second fee is payable for amendments made within five years following. The fee payable to the Registrar of Building Societies on incorporation is £3 3s., but no stamp duties are payable on any instruments or documents made under the Act.
Building societies are afforded all the powers of an ordinary mortgagee, and where a mortgagor makes default in payment of moneys the society may exercise the usual power of sale through the Registrar of the Supreme Court. No reconveyance is needed to discharge a mortgage made under the Act, a receipt endorsed being a sufficient discharge for this purpose.
The two classes of building and investment societies — viz., permanent and terminating—are distinguished according as to whether the society is by its rules to terminate at a fixed date or when a specified result is attained.
Returns of each society's operations are furnished annually to the Census and Statistics Office. The dates upon which the societies close their accounts vary considerably within the year, but the figures given below may be taken as corresponding approximately to the financial years ended on the 31st March of the years shown.
The number of societies in existence in 1925–26 was 88. Of these, 44 were permanent and 44 terminating, the latter being comprised of 166 groups. The following table shows the number of societies in operation over a period of five years:—
| NUMBER OF BUILDING SOCIETIES, 1921–22 TO 1925–26. | |||
|---|---|---|---|
| Year. | Number of Permanent Societies. | Number of Terminating Societies. | |
| Societies. | Groups. | ||
| 1921–22 | 37 | 44 | 125 |
| 1922–23 | 38 | 43 | 131 |
| 1923–24 | 37 | 44 | 140 |
| 1924–25 | 41 | 45 | 155 |
| 1925–26 | 44 | 44 | 166 |
There has been a tendency for individual societies to enlarge their activities rather than for the number of societies to increase. Although the number of terminating societies shows no increase over the five years under review, the number of groups has increased substantially.
A synopsis of the extent to which investments have been made in building-society shares during the last five years is contained in the table next presented: —
| BUILDING SOCIETIES.—SHARES AND MEMBERS, 1921–22 TO 1925–26. | |||||
|---|---|---|---|---|---|
| — | 1921–22. | 1922–23. | 1923–24. | 1924–25. | 1925–26. |
| Investing Shares. | |||||
| Number of shares | 132,343 | 147,127 | 161,072 | 191,551 | 222,507 |
| Members holding | 31,764 | 34,375 | 38,322 | 44,776 | 48,220 |
| Aggregate value | £1,729,514 | £1,757,286 | £1,850,822 | £2,046,805 | £2,262,551 |
| Paid-up Shares. | |||||
| Number of shares | 70,859 | 74,432 | 84,234 | 163,863 | 200,741 |
| Members holding | 2,094 | 2,291 | 2,368 | 3,077 | 3,385 |
| Aggregate value | £506,349 | £643,086 | £578,987 | £685,379 | £755,975 |
The average value in 1925–26 of each investing share paying periodic subscription was £10 3s. 4d., as compared with £13 1s. 4d. in 1921–22, and of each paid-up share £3 15s. 4d., as compared with £7 2s. 11d. five years ago. A comparison of the distribution of share-money and the number of holders of shares between permanent and terminating societies yields the following result:—
| BUILDING SOCIETIES, PERMANENT AND TERMINATING, 1925–26. | |||
|---|---|---|---|
| — | Permanent. | Terminating. | Total. |
| Investing Shares. | |||
| Number of shares | 101,280 | 121,227 | 222,507 |
| Members holding | 9,626 | 38,594 | 48,220 |
| Aggregate value | £898,904 | £1,363,647 | £2,262,551 |
| Paid-tip Shares. | |||
| Number of shares | 199,486 | 1,255 | 200,741 |
| Members holding | 3,017 | 368 | 3,385 |
| Aggregate value | £732,930 | £23,045 | £755,975 |
Of the total aggregate value of both investing and paid-up shares, amounting to £3,018,526, 54 per cent. is held in permanent societies and 46 per cent. in terminating societies. On the other hand, the number of members holding shares in permanent societies is only 24 per cent. of the total, the terminating societies' shareholders representing 76 per cent. It should be pointed out, however, that one person may hold shares in several groups of a terminating society.
The numbers of loans and borrowers, both of permanent and of terminating societies, are as follows:—
| BUILDING SOCIETIES.—LOANS AND BORROWERS, 1921–22 TO 1925–26. | ||||||
|---|---|---|---|---|---|---|
| Year. | Permanent Societies. | Terminating Societies. | Total. | |||
| Borrowers. | Amount. | Borrowers. | Amount. | Borrowers. | Amount. | |
| £ | £ | £ | ||||
| 1921–22 | 4,902 | 2,275,218 | 5,106 | 1,310,522 | 10,008 | 3,585,740 |
| 1922–23 | 5,086 | 2,364,325 | 5,099 | 1,344,608 | 10,185 | 3,708,933 |
| 1923–24 | 5,345 | 2,582,721 | 4,982 | 1,428,389 | 10,327 | 4,011,110 |
| 1924–25 | 5,870 | 2,970,235 | 5,896 | 1,554,597 | 11,766 | 4,524,832 |
| 1925–26 | 6,560 | 3,273,714 | 5,461 | 1,713,097 | 12,021 | 4,986,811 |
Since 1921–22 there has been an increase of 2,013 in the number of borrowers and of £1,401,071 in the amount borrowed. Permanent societies show the greater advance in money advanced to borrowers, while the bulk of new borrowers belong to terminating societies.
| BUILDING SOCIETIES.— AVERAGE AMOUNT BORROWED, 1921–22 TO 1925–26. | |||||||||||||||
|---|---|---|---|---|---|---|---|---|---|---|---|---|---|---|---|
| Class. | 1921–22. | 1922–23. | 1923–24. | 1924–25. | 1925–26. | ||||||||||
| £ | s. | d. | £ | s. | d. | £ | s. | d. | £ | s. | d. | £ | s. | d. | |
| Permanent societies | 464 | 2 | 10 | 464 | 17 | 4 | 483 | 4 | 0 | 506 | 0 | 1 | 499 | 0 | 10 |
| Terminating societies | 256 | 13 | 3 | 263 | 14 | 0 | 286 | 14 | 2 | 263 | 13 | 4 | 313 | 13 | 11 |
| All societies | 358 | 5 | 9 | 364 | 3 | 1 | 388 | 8 | 2 | 384 | 11 | 4 | 414 | 16 | 10 |
Building societies have experienced a continued demand for money available for household property, partly owing to the high prices ruling for dwellings and partly because of the acute shortage of houses from which the Dominion has suffered as a whole during recent years. The figures in the table below are accordingly of more than usual interest in so far as they reflect the extent of advances made to shareholders.
| BUILDING SOCIETIES.—INCOME AND OUTGO, 1921–22 TO 1925–26. | |||||
|---|---|---|---|---|---|
| 1921–22. | 1922–23. | 1923–24. | 1924–25. | 1925–26. | |
| £ | £ | £ | £ | £ | |
| Income. | |||||
| Investors' subscriptions and paid-up shares | 364,268 | 352,220 | 395,861 | 498,788 | 577,847 |
| Advances repaid | 578,618 | 521,290 | 561,429 | 680,317 | 761,604 |
| Deposits received | 979,733 | 928,533 | 1,079,655 | 1,252,155 | 1,524,998 |
| Interest received | 141,675 | 139,539 | 154,114 | 174,793 | 196,440 |
| Other receipts | 77,848 | 51,992 | 72,992 | 95,229 | 91,096 |
| Total income | 2,142,142 | 1,993,574 | 2,264,051 | 2,701,282 | 3,151,985 |
| Outgo. | |||||
| Withdrawals | 232,311 | 295,774 | 272,810 | 271,019 | 297,209 |
| Advances | 653,646 | 648,163 | 867,229 | 1,060,029 | 1,174,174 |
| Expenses of management | 36,717 | 37,524 | 41,212 | 46,792 | 50,733 |
| Deposits repaid | 1,074,174 | 835,558 | 961,227 | 1,171,092 | 1,386,923 |
| Interest, dividends, and other expenditure | 155,931 | 135,664 | 144,412 | 187,805 | 217,633 |
| Total outgo | 2,152,779 | 1,952,683 | 2,286,890 | 2,736,737 | 3,126,672 |
The decrease in operations during the years 1921–22 and 1922–23 reflects the caution displayed by lending institutions during the period of the trade depression. A substantial recovery is evident in the figures for subsequent years.
The liabilities and assets of building and investment societies for each of the years 1921–22 to 1925–26 are as follows:—
| LIABILITIES OF BUILDING AND INVESTMENT SOCIETIES, 1921–22 TO 1925–26. | ||||
|---|---|---|---|---|
| Year. | To Shareholders (Including Reserve Funds and Undivided Profits). | Deposits. | To Hankers and other Creditors. | Total Liabilities |
| £ | £ | £ | £ | |
| 1921–22 | 2,679,035 | 1,012,626 | 164,483 | 3,856,144 |
| 1922–23 | 2,750,940 | 1,105,161 | 142,116 | 3,998,217 |
| 1923–24 | 2,912,090 | 1,211,687 | 186,115 | 4,309,892 |
| 1924–25 | 3,253,576 | 1,292,224 | 267,107 | 4,812,907 |
| 1925–26 | 3,602,294 | 1,555,468 | 184,411 | 5,342,173 |
| ASSETS OF BUILDING AND INVESTMENT SOCIETIES, 1921–22 TO 1925–26. | ||||
|---|---|---|---|---|
| Year. | Advances on Mortgage. | Other Investments. | Cash in Hand and on Deposit. | Total Assets. |
| £ | £ | £ | £ | |
| 1921–22 | 3,585,740 | 136,105 | 134,299 | 3,856,144 |
| 1922–23 | 3,708,933 | 151,419 | 137,865 | 3,998,217 |
| 1923–24 | 4,011,111 | 143,627 | 155,154 | 4,309,892 |
| 1924–25 | 4,524,832 | 140,693 | 147,382 | 4,812,907 |
| 1925–26 | 4,986,811 | 147,718 | 207,644 | 5,342,173 |
Under section 46 of the Finance Act, 1920, a building society might be approved by the Governor-General as an institution for the investment of trust funds. This section has now been repealed, with a saving as to existing investments and their renewal.
At the end of the year 1925–26 there were nine societies so approved, six of which held trust funds to the value of £39,619. In the case of the other societies the amount was not available.
The extent to which building and investment societies are supported in the Dominion is apparent from the table below of similar activities in the Commonwealth of Australia for 1924–25: —
| BUILDING SOCIETIES.—OPERATIONS IN 1924–25. | |||||
|---|---|---|---|---|---|
| State. | Number of Societies. | Number of Shareholders. | Number of Shares. | Number of Borrowers. | Amount advanced during Year. |
* Not available. † For year 1924. ‡ For eighteen months ended 30th June 1925. | |||||
| New South Wales | 7 | * | * | * | ‡ |
| Victoria† | 27 | 9,707 | * | 9,936 | 1,022,272 |
| Queensland | 12 | 5,455 | 1,055,147 | 3,096 | 174,811 |
| South Australia | 22 | 15,844 | 53,867 | 2,656 | 159,706 |
| Western Australia‡ | 15 | 8,139 | 26,503 | 1,601 | 148,347 |
| Tasmania | 4 | 3,662 | 29,537 | 1,300 | 93,644 |
| New Zealand | 86 | 47,853 | 355,414 | 11,766 | 1,060,029 |
Table of Contents
UNDER the Property Law Act a “mortgage” is defined as including a charge on any property for securing money or money's worth; and “mortgage-money” means money or money's worth secured by a mortgage. Under the Land Transfer Act “mortgage” means and includes any charge on land created under the provisions of that Act for securing—
The repayment of a loan or satisfaction of an existing debt;
The repayment of future advances, or repayment or satisfaction of any future or unascertained debt or liability, contingent or otherwise;
The payment to the holders for the time being of any bonds, debentures, promissory notes or other securities, negotiable or otherwise, made or issued by the mortgagor before or after the creation of such charge;
The payment to any person or persons by yearly or periodical payments or otherwise of an annuity, rent-charge, or sum of money other than a debt.
Where the ownership of land is registered under the Land Transfer Act mortgages on that land are granted by virtue of the provisions of that Act, and take effect as securities and do not operate as transfers of the estate or interest charged. In the case of other land or property a mortgage is granted under what is known as the deeds or deeds-registration system; the mortgage in this instance operating as a conveyance or assignment of the land or property mortgaged, for the mortgagee becomes the registered proprietor of the land, subject to the right of the mortgagor to have the property re-registered in his name on the discharge of his obligations under the mortgage. Although in form a mortgage under the deeds system is a conveyance, in equity it is treated as merely a charge on the land.
Any land covered by the definitions of “land” in the Property Law Act, 1908, and the Land Transfer Act, 1915, may be mortgaged. Where, however, property is subject to restrictions upon alienation, these restrictions usually apply to prevent such property being mortgaged. The following are the main instances in which mortgage of property is forbidden by law: —
Family homes registered under the Family Protection Act, 1908.
Maintenance-moneys under Family Protection Act, 1908.
Inalienable life annuities (Inalienable Life Annuities Act, 1910).
Various pensions (Pensions Act, 1926).
Property subject to restraint upon anticipation, unless by consent of the Supreme Court.
Property subject to restraint upon alienation in accordance with section 24 of the Property Law Act, 1908.
An infant's property, by the infant (Infants Act, 1908, sections 12 and 13).
A memorandum of discharge vacates the mortgage debt and operates as a deed of reconveyance of the estate and interest of the mortgagee in the mortgaged property “to the person for the time being entitled to the equity of redemption”; but the mortgagee may execute a deed of reconveyance “if he thinks fit and the mortgagor requires it.” The Public Trustee is empowered to receive mortgage-moneys on account of absentee mortgagees, and in the case of a deed of mortgage to execute the necessary memorandum of discharge. A mortgagor may redeem in the following cases: —
Before the due date, on payment of interest for the unexpired term of the mortgage.
At the due date, in accordance with the provisions of the mortgage.
After the due date, upon giving three months' notice in writing or paying three months' interest in lieu of notice, except where the mortgagee is or has been in possession or has taken steps to enforce his security, in which case the mortgagor may redeem at any time upon payment of all moneys due.
After default and before sale by the mortgagee. If the mortgagee has entered into possession of the mortgaged land or part of it, the mortgagor loses his right of redemption after twenty years from the date of the mortgagee's entering into possession, or after twenty years from the last written acknowledgement of the mortgagor's title or of his right to redeem.
The Property Law Act abolishes what was formerly known as the doctrine of consolidation of mortgages. Where a mortgagor is liable under more than one mortgage, he may now pay off one mortgage without being called on to pay off any mortgage or mortgages on property not comprised in the mortgage he is paying off.
Under New Zealand law a mortgagee has no power of foreclosure in respect of realty. The following, however, represent his principal rights: —
He is entitled to the custody of the title-deeds of the property mortgaged.
He may sue on the personal covenant contained in the mortgage-deed.
He may enter and take possession. This right is exercisable either by actually entering upon the land or a part of it or by bringing an action for possession. If there is a tenant whose rights are binding on the mortgagee, the latter can give notice to the tenant to pay the rent to him, and this will be equivalent to taking possession.
He may assign his interest, either absolutely or by way of submortgage.
He may sell, either under the express powers (if any) in the mortgage-deed, or under powers implied by statute, if these have not been negatived in the deed.
Instead of selling, as above, a mortgagee entitled to exercise his power of sale may apply to the Registrar of the Supreme Court to conduct the sale. The mortgagee must state in his application the estimated value of the land, and the date of the sale must be not less than one month and not more than three months from the date of the application. He may bid at the sale and become the purchaser of the land, but in such case the amount paid for the land shall not he less than the value of the land as estimated. If it is, the mortgagor must be allowed in account the full amount of the estimate.
The information given below relates to mortgages registered under one or other of the systems referred to above. In addition to these there are numbers of privately arranged advances which are not so registered, and of the amount of which it is not possible to form any estimate. Further, stock and crop liens, bills of sale, and instruments under the Chattels Transfer Act are not included in the figures.
A note on the special legislation included in the Mortgages Extension (Moratorium) Acts is given at the end of this section.
The total amount for which mortgages were registered, both under the deeds-registration system and under the Land Transfer Act, in each registration district during the five years 1921–22 to 1925–26 is given in the subjoined table.
As mortgages of property situated in more than one registration district may be registered for the full amount in each district, there is some degree of duplication. An extreme example of this occurred in the year 1923–24, when an amount of £1,000,000 was registered in each of four districts, the same amount being also registered in a fifth district in the first month of the next financial year. On the other hand, it may be pointed out that, in addition to a total of 46,177 mortgages which represent the aggregate of £47,093,780 for 1925–26, there were 2,528 mortgages in which no amount was shown as secured.
The amount advanced in 1925–26 was nearly £6,000,000 more than in the previous year. The figures for the five years as shown in the following table are arresting, and reflect the extent to which firms and private individuals have found it necessary to borrow during the last few years.
| MORTGAGES.—TOTAL AMOUNT REGISTERED, 1921–22 TO 1925–26. | |||||
|---|---|---|---|---|---|
| District. | 1921–22. | 1922–23. | 1923–24. | 1924–25. | 1925–26. |
| £ | £ | £ | £ | £ | |
| Auckland | 12,087,238 | 8,453,603 | 12,705,750 | 12,649,663 | 12,977,173 |
| Poverty Bay | 1,942,687 | 931,994 | 1,983,295 | 1,127,989 | 1,127,002 |
| Hawke's Bay | 2,104,734 | 1,759,211 | 2,197,860 | 2,794,584 | 2,669,000 |
| Taranaki | 2,152,275 | 1,177,675 | 1,903,101 | 2,234,869 | 3,116,951 |
| Wellington | 8,201,426 | 6,248,604 | 8,607,024 | 9,349,396 | 13,111,219 |
| Nelson | 565,529 | 478,175 | 529,092 | 599,954 | 712,286 |
| Marlborough | 398,412 | 531,980 | 618,392 | 731,220 | 1,453,684 |
| Canterbury | 4,465,252 | 3,628,720 | 6,117,734 | 6,144,836 | 6,718,714 |
| Otago | 1,836,442 | 1,907,276 | 1,915,380 | 3,742,777 | 3,151,244 |
| Southland | 912,236 | 829,046 | 1,168,144 | 1,630,216 | 1,945,716 |
| Westland | 123,093 | 85,312 | 116,647 | 118,462 | 110,791 |
| Totals | 34,789,324 | 26,031,596 | 37,862,419 | 41,123,966 | 47,093,780 |
Seven of the eleven registration districts show increases in the value of mortgages registered during 1925–26 as compared with the previous year, while the aggregate increase for the whole Dominion is approximately 14 per cent. Wellington district shows a noteworthy increase of £3,761,823.
A distribution of the above figures according as to whether the registration was made under the deeds system or the Land Transfer Act is now given. The period taken is the triennium 1923–24 to 1925–26.
| MORTGAGES REGISTERED UNDER DEEDS-REGISTRATION AND LAND-TRANSFER SYSTEMSG, 1923–24 TO 1925–26. | ||||||
|---|---|---|---|---|---|---|
| District. | 1923–24. | 1924–25. | 1925–26. | |||
| Deeds Registration | Land Transfer. | Deeds Land Registration. | Transfer. | Deeds Registration. | Land Transfer. | |
| £ | £ | £ | £ | £ | £ | |
| Auckland | 3,358,773 | 9,346,977 | 3,132,367 | 9,517,296 | 3,202,551 | 9,774,622 |
| Poverty Bay | 28,465 | 1,954,830 | 54,950 | 1,073,039 | 35,725 | 1,091,277 |
| Hawke's Bay | 501,206 | 1,696,654 | 733,479 | 2,061,105 | 545,995 | 2,123,005 |
| Taranaki | 244,202 | 1,658,899 | 211,026 | 2,023,843 | 347,781 | 2,769,170 |
| Wellington | 1,060,729 | 7,546,295 | 1,395,394 | 7,954,002 | 1,131,971 | 11,979,248 |
| Nelson | 135,617 | 393,476 | 148,008 | 451,946 | 163,560 | 548,726 |
| Marlborough | 177,857 | 440,535 | 195,074 | 536,146 | 733,827 | 719,857 |
| Canterbury | 333,191 | 5,784,543 | 435,906 | 5,708,930 | 403,264 | 6,315,450 |
| Otago | 404,788 | 1,510,592 | 580,024 | 3,162,753 | 536,692 | 2,614,552 |
| Southland | 134,474 | 1,033,670 | 156,102 | 1,474,114 | 169,758 | 1,775,958 |
| Westland | 10,990 | 105,657 | 8,997 | 109,465 | 5,460 | 105,331 |
| Totals | 6,390,292 | 31,472,127 | 7,051,327 | 34,072,639 | 7,276,584 | 39,817,196 |
It will be noted that of the total of £47,093,780 registered in 1925–26, £39,817,196 came under the Land Transfer Act. This represents approximately 84 per cent. of the total amount registered as advanced on mortgage. This proportion has altered very little over a number of years.
Of the total amount of £47,093,780 registered for the financial year 1925–26, mortgages up to £500 in value represented 14 per cent. of the total value registered, from £501 to £1,000 23 per cent., from £1,001 to £5,000 37 per cent., and above £5,000 26 per cent. of the total value registered. The following table gives the number and amount in each registration district according to the sum advanced:—
| MORTGAGES.—NUMBER AND AMOUNT ACCORDING TO SUM ADVANCED, 1925–26. | ||||||||
|---|---|---|---|---|---|---|---|---|
| District. | £500 and under. | £501 to £1,000. | £1,001 to £5,000. | Over £6,000. | ||||
| Number. | Amount. | Number. | Amount. | Number | Amount. | Number. | Amount. | |
| £ | £ | £ | £ | |||||
| Auckland | 7,330 | 2,134,368 | 5,091 | 3,828,234 | 2,648 | 5,060,954 | 173 | 1,953,617 |
| Poverty Bay | 303 | 84,501 | 203 | 159,020 | 185 | 402,527 | 44 | 480,954 |
| Hawke's Bay | 926 | 258,910 | 656 | 489,279 | 430 | 946,801 | 88 | 974,010 |
| Taranaki | 695 | 215,464 | 679 | 519,497 | 754 | 1,688,437 | 85 | 693,533 |
| Wellington | 4,999 | 1,674,877 | 3,446 | 2,626,973 | 2,255 | 4,532,712 | 436 | 4,276,657 |
| Nelson | 586 | 141,298 | 279 | 207,482 | 136 | 244,156 | 12 | 119,350 |
| Marlborough | 210 | 59,497 | 97 | 74,381 | 113 | 252,261 | 23 | 1,067,545 |
| Canterbury | 3,451 | 950,262 | 2,150 | 1,640,108 | 1,059 | 2,326,564 | 173 | 1,801,780 |
| Otago | 2,575 | 679,004 | 1,076 | 796,944 | 434 | 916,747 | 52 | 758,549 |
| Southland | 1,108 | 276,265 | 538 | 392,217 | 423 | 916,047 | 45 | 361,187 |
| Westland | 147 | 38,157 | 49 | 34,845 | 13 | 24,514 | 2 | 13,275 |
| Totals | 22,330 | 6,512,623 | 14,264 | 10,768,980 | 8,450 | 17,311,720 | 1,133 | 12,500,457 |
In addition to the above, there were 2,528 mortgages registered for which no amount was shown. Excluding these, the average advance for each mortgage registered was £1,020, as compared with £999 in 1924–25.
Figures are available in the case of Land Transfer registrations showing for each registration district the amount advanced on urban and rural properties. No similar data are available in regard to mortgages registered under the deeds system, but bearing in mind that the latter constituted in 1925–26 but 16 per cent of the total it will be evident that the figures given approximately indicate the character of the securities. The distinction is between “town and suburban” and “country'” holdings, but information is not always available to enable a strictly accurate classification to be made. Generally, however, town and suburban mortgages are regarded as such if secured on properties situated within cities or boroughs, and include also mortgages secured on small holdings in the nature of building allotments which are not definitely distinguishable as country properties. From the table on the next page it will be seen that mortgages classified as town and suburban are secured on areas averaging considerably less than half an acre in extent, as compared with an average area, in 1925–26, of some 324 acres in the ease of “country” securities.
Utilizing percentages, which may then be taken as indicative of the position in regard to all mortgages registered, including those under the deeds system, some interesting results are yielded by the figures given. The value of mortgages on country property registered in 1925–26 constitutes 55 per cent. of the total amount secured, and on town and suburban property 45 per cent. The position is, however, reversed when the number of mortgages registered is considered, the figures being in the case of country property 33 per cent., and for town and suburban areas 67 per cent., of the total number registered. The acreage on which these advances are secured represents in the case of country mortgages 97.2 per cent. of the total, and on town and suburban property 2.8 per cent. only. On the other hand, the average amount secured per acre on rural holdings is £5 1s. 2d., as against £1,429 in the ease of town and suburban properties, this, of course, being the natural corollary of the higher valuations ruling in the more populous areas. The average amount of each mortgage on country property is £1,642, as compared with £664 on town and suburban holdings.
| MORTGAGES UNDER THE LAND TRANSFER ACT, 1925–26. | ||||||
|---|---|---|---|---|---|---|
| District. | Town and Suburban. | Country. | ||||
| Number. | Area. | Amount secured. | Number. | Area. | Amount secured. | |
| Acres. | £ | Acres. | £ | |||
| Auckland | 8,805 | 3,456 | 5,698,256 | 3,267 | 854,717 | 4,076,366 |
| Poverty Bay | 456 | 267 | 302,862 | 356 | 293,319 | 788,415 |
| Hawke's Bay | 1,036 | 570 | 620,353 | 685 | 208,950 | 1,502,652 |
| Taranaki | 920 | 350 | 710,903 | 1,093 | 266,545 | 2,058,267 |
| Wellington | 6,741 | 1,462 | 5,251,877 | 3,543 | 776,705 | 6,727,371 |
| Nelson | 400 | 131 | 173,794 | 353 | 158,050 | 374,932 |
| Marlborough | 149 | 139 | 392,945 | 183 | 216,133 | 326,912 |
| Canterbury | 4,841 | 119,042 | 2,920,598 | 2,047 | 771,729 | 3,394,852 |
| Otago | 2,559 | 499 | 1,341,857 | 763 | 413,198 | 1,272,695 |
| Southland | 1,118 | 325 | 571,906 | 901 | 329,721 | 1,204,052 |
| Westland | 131 | 29 | 47,903 | 71 | 13,591 | 57,428 |
| Totals | 27,156 | 126,270 | 18,033,254 | 13,262 | 4,302,658 | 21,783,942 |
A table showing information for each of the last ten years is also given.
| MORTGAGES UNDER LAND TRANSFER ACT, 1916–17 TO 1925–26. | |||||||
|---|---|---|---|---|---|---|---|
| Year ended 31st March. | Number. | Area. | Amount secured. | ||||
| Town and Suburban. | Country. | Total. | Town and Suburban. | Country. | Total. | ||
| Acres. | Acres. | Acres. | £ | £ | £ | ||
| 1917 | 18,803 | 4,342 | 3,714,395 | 3,718,737 | 4,215,266 | 13,389,258 | 17,604,524 |
| 1918 | 15,899 | 4,118 | 3,559,517 | 3,563,635 | 3,280,235 | 11,599,405 | 14,879,640 |
| 1919 | 16,069 | 18,742 | 2,830,260 | 2,849,002 | 3,351,593 | 12,539,684 | 15,891,277 |
| 1920 | 35,632 | 43,398 | 6,050,551 | 6,093,949 | 9,726,821 | 30,948,328 | 40,675,149 |
| 1921 | 46,803 | 66,224 | 6,821,808 | 6,888,032 | 16,133,642 | 39,948,328 | 56,031,970 |
| 1922 | 33,409 | 8,971 | 5,469,212 | 5,478,183 | 10,743,765 | 17,744,501 | 28,488,266 |
| 1923 | 27,438 | 7,404 | 4,172,054 | 4,179,458 | 9,544,791 | 11,819,043 | 21,363,834 |
| 1924 | 32,537 | 7,680 | 3,249,656 | 3,257,336 | 15,541,664 | 15,930,463 | 31,472,127 |
| 1925 | 35,217 | 8,189 | 4,066,690 | 4,074,879 | 16,294,629 | 17,778,010 | 34,072,639 |
| 1926 | 40,418 | 126,220 | 4,302,658 | 4,428,878 | 18,033,254 | 21,783,942 | 39,817,196 |
The total amount of mortgages discharged for the years 1923–24, 1924–25, and 1995–26 is as follows:—
| MORTGAGES.—NUMBER AND AMOUNT DISCHARGED, 1923–24 TO 1925–26. | ||||||
|---|---|---|---|---|---|---|
| District. | Year ended 31st March, 1924. | Year ended 31st March 1925. | Year ended 31st March, 1926. | |||
| Number. | Amount. | Number. | Amount. | Number. | Amount. | |
| £ | £ | £ | ||||
| Auckland | 9,813 | 6,827,989 | 10,481 | 8,677,061 | 12,219 | 9,450,483 |
| Poverty Bay | 523 | 580,116 | 610 | 1,074,734 | 782 | 1,083,809 |
| Hawke's Bay | 1,269 | 1,629,188 | 1,773 | 2,596,921 | 1,909 | 2,306,763 |
| Taranaki | 1,697 | 1,445,348 | 2,027 | 1,955,691 | 2,202 | 2,016,607 |
| Wellington | 5,627 | 5,114,766 | 7,000 | 7,138,788 | 8,792 | 9,464,167 |
| Nelson | 721 | 474,135 | 860 | 573,332 | 982 | 644,226 |
| Marlborough | 285 | 329,531 | 370 | 628,628 | 342 | 828,209 |
| Canterbury | 4,181 | 3,551,425 | 4,610 | 3,888,430 | 5,109 | 4,236,339 |
| Otago | 2,607 | 1,376,941 | 2,965 | 1,835,925 | 3,212 | 2,256,743 |
| Southland | 1,305 | 870,140 | 1,663 | 1,311,115 | 1,921 | 1,572,962 |
| Westland | 119 | 46,933 | 141 | 53,258 | 170 | 97,836 |
| Totals | 28,147 | 22,246,512 | 32,500 | 29,733,883 | 37,640 | 33,958,144 |
Of the total amount released in 1925–26, £28,587,276 was under the Land Transfer Act and £5,370,868 under the deeds-registration system. The corresponding figures for the previous year wore £24,829,868 and £4,904,015 respectively.
The monthly totals of mortgages registered and discharged during each month from January, 1924, to September, 1926, are next given.
| MORTGAGES.—TRANSACTIONS EACH MONTH, JANUARY, 1924, TO SEPTEMBER, 1926. | ||||
|---|---|---|---|---|
| Month. | Mortgages registered. | Mortgages discharged. | ||
| Number, | Amount. | Number. | Amount. | |
* An amount of £1,000,000 was registered in one district in February, la three districts in March, and In a fifth district in April. | ||||
| £ | £ | |||
| 1924. | ||||
| January | 2,420 | 2,020,486 | 1,817 | 1,540,168 |
| February | 2,999 | 3,704,988* | 2,273 | 2,005,367 |
| March | 3,496 | 6,007,916* | 2,623 | 1,955,528 |
| April | 2,997 | 3,835,092* | 2,235 | 2,009,467 |
| May | 3,984 | 3,578,830 | 2,814 | 2,272,977 |
| June | 3,543 | 3,347,453 | 2,612 | 2,555,915 |
| July | 3,980 | 3,966,547 | 2,935 | 2,655,433 |
| August | 3,799 | 3,499,658 | 2,825 | 2,448,299 |
| September | 3,537 | 3,410,567 | 2,663 | 2,436,019 |
| October | 3,743 | 3,251,703 | 2,791 | 2,489,229 |
| November | 3,411 | 2,846,367 | 2,480 | 2,308,264 |
| December | 3,922 | 3,516,106 | 2,847 | 2,412,807 |
| 1925. | ||||
| January | 2,222 | 2,154,538 | 1,820 | 1,788,561 |
| February | 3,736 | 3,643,266 | 3,038 | 2,722,748 |
| March | 4,274 | 4,073,839 | 3,440 | 3,634,164 |
| April | 3,335 | 3,261,279 | 2,631 | 2,542,954 |
| May | 4,289 | 4,356,210 | 3,371 | 3,307,754 |
| June | 4,605 | 4,208,378 | 3,612 | 3,557,906 |
| July | 5,055 | 5,195,462 | 4,058 | 3,834,464 |
| August | 4,333 | 4,588,483 | 3,650 | 3,064,722 |
| September | 4,260 | 5,099,401 | 3,379 | 3,338,233 |
| October | 4,174 | 3,706,454 | 3,259 | 2,764,624 |
| November | 3,655 | 3,390,113 | 2,703 | 2,521,242 |
| December | 4,254 | 3,682,758 | 3,125 | 2,705,257 |
| 1926. | ||||
| January | 2,238 | 2,188,449 | 1,754 | 1,433,079 |
| February | 3,594 | 3,095,527 | 2,665 | 2,176,116 |
| March | 4,913 | 4,321,266 | 3,433 | 2,711,793 |
| April | 3,466 | 3,374,512 | 2,660 | 2,423,526 |
| May | 4,552 | 4,235,264 | 3,360 | 3,087,906 |
| June | 4,321 | 4,082,079 | 3,329 | 3,223,538 |
| July | 4,500 | 3,925,224 | 3,473 | 3,189,499 |
| August | 4,170 | 3,814,886 | 2,839 | 2,625,772 |
| September | 4,067 | 3,433,227 | 2,837 | 2,751,561 |
There has been a progressive increase in both classes of transaction right throughout the period covered by the table. Particularly striking are the 1925 figures from May to September, reflecting, no doubt, the increased activity resulting from the expiration of the moratorium.
The total amount of mortgages under both registration systems outstanding on the 31st March, 1926, was £282,733,589. This represents a net increase of £13,135,636 during the year, the amount of mortgages paid off since the 1st April, 1925, being £33,958,144, as against mortgages registered to the amount of £47,093,780, as shown in the first table in this section. These transactions are distributed over registrations under the Deeds Registration and Land Transfer Acts respectively, as follows: —
| MORTGAGES.—AGGREGATE AMOUNT ON REGISTER ON 31ST MARCH, 1926. | ||||
|---|---|---|---|---|
| Act. | Remaining on Register at 31st March, 1925. | Registered during Year ended 31st March, 1926. | Discharged during Year ended 31st March. 1926. | Remaining on Register at 31st March, 1926. |
| £ | £ | £ | £ | |
| Land Transfer | 242,391,460 | 39,817,196 | 28,587,276 | 253,621,380 |
| Deeds Registration | 27,206,493 | 7,276,584 | 5,370,868 | 29,112,209 |
| Totals | 269,597,953 | 47,093,780 | 33,958,144 | 282,733,589 |
A table showing the amount remaining on the register at the end of each of the last ten years is given. In view of the fact that the figures cover a term of years, they perhaps afford a better indication of the amount of money borrowed than do the yearly tables of mortgages registered, in which no account is taken, because of the absence of suitable data, of the period for which the capital sums are borrowed.
The figures shown, however, should be accepted with a measure of reserve, as doubtless a proportion of the total value of mortgages remaining on the register on the 31st March, 1926, includes registration of advances that have subsequently been paid off but not formally registered as discharged. This perhaps more particularly arises when second or other farther mortgages have been registered and the first mortgagee has sold the security.
| MORTGAGES.—AMOUNTS REMAINING ON REGISTER AT 31ST MARCH, 1917–26. | |||
|---|---|---|---|
| As at 31st March. | Under the Land Transfer Act. | Under the Deeds-registration System. | Total. |
| £ | £ | £ | |
| 1917 | 127,638,984 | 4,632,856 | 132,271,840 |
| 1918 | 132,875,722 | 5,906,525 | 138,784,247 |
| 1919 | 139,747,166 | 7,003,470 | 146,750,636 |
| 1920 | 161,151,740 | 10,955,049 | 172,106,789 |
| 1921 | 192,838,993 | 16,764,152 | 209,603,145 |
| 1922 | 210,826,032 | 20,314,072 | 231,140,104 |
| 1923 | 220,112,551 | 22,479,382 | 242,591,933 |
| 1924 | 233,148,689 | 25,059,181 | 258,207,870 |
| 1925 | 242,391,460 | 27,206,493 | 269,597,953 |
| 1926 | 253,621,380 | 29,112,209 | 282,733,589 |
In regard to mortgages under the Land Transfer Act, a table is added showing by registration districts the amount remaining on the register on the 31st March, 1926. No similar data are available in regard to mortgages under the deeds-registration system.
| MORTGAGES.—AMOUNT REMAINING UNDER THE LAND TRANSFER ACT ON 31ST MARCH, 1926. | |
|---|---|
| District. | Amount. |
| £ | |
| Auckland | 63,016,620 |
| Poverty Bay | 11,439,023 |
| Hawke's Bay | 20,418,060 |
| Taranaki | 19,806,422 |
| Wellington | 59,382,661 |
| Nelson | 3,864,709 |
| Marlborough | 4,210,286 |
| Canterbury | 43,859,259 |
| Otago | 14,419,937 |
| Southland | 12,309,047 |
| Westland | 8£5,356 |
| Total | 253,621,380 |
Classified according to the various rates of interest, the amounts in the mortgage-deeds registered during 1924–25 and 1925–26 were—
| MORTGAGES.—RATES OF INTEREST, 1924–25 AND 1925–26. | ||
|---|---|---|
| Rate per Cent. | 1924–25. | 1925–26. |
| £ | £ | |
| 0 | .. | 3,365 |
| ½ | 200 | .. |
| 1 | .. | 1,050 |
| 1 ¼ | 3,779 | .. |
| 2 | .. | 4,838 |
| 2 ½ | 1,854 | 3,399 |
| 3 | 6,158 | 9,492 |
| 3 ¼ | .. | 600 |
| 3 3/8 | 3,120 | .. |
| 3 ½ | 555 | .. |
| 3 ¾ | .. | 500 |
| 4 | 60,765 | 85,995 |
| 4 ¼ | .. | 2,750 |
| 4 ⅓ | .. | 850 |
| 4 ½ | 55,483 | 58,035 |
| 4 ¾ | .. | 600 |
| 5 | 3,012,073 | 3,151,300 |
| 5 ¼ | 18,031 | 5,900 |
| 5 ½ | 1,903,432 | 2,785,177 |
| 5 ¾ | 94,204 | 93,168 |
| 5 5/6 | .. | 3,843 |
| 6 | 12,180,245 | 12,809,272 |
| 6 ¼ | 291,251 | 453,259 |
| 6 ½ | 9,762,675 | 11,594,169 |
| 6 ¾ | 27,530 | 83,860 |
| 7 | 4,520,073 | 5,455,188 |
| 7 ¼ | 1,700 | 6,671 |
| 7 ½ | 459,030 | 537,321 |
| 7 ¾ | .. | 5,400 |
| 8 | 1,019,974 | 1,255,527 |
| 8 ½ | 148,221 | 145,266 |
| 9 | 173,949 | 229,761 |
| 9 ½ | 6,730 | 12,804 |
| 9 ¾ | .. | 75 |
| 10 | 340,426 | 482,894 |
| 10 ½ | 100 | 400 |
| 11 | 2,600 | 3,475 |
| 12 | 4,657 | 2,515 |
| 12 ¼ | .. | 2,350 |
| 12 ½ | 375 | 550 |
| 15 | 1,545 | 1,599 |
| 16 | 250 | .. |
| 20 | .. | 650 |
| 33 | .. | 50 |
| 40 | 100 | .. |
| 50 | .. | 200 |
| Unspecified | 7,022,881 | 7,799,662 |
| Totals | 41,123,966 | 47,093,780 |
It is evident that the great bulk of the money raised by way of mortgage bears interest at rates varying from 5 to 7 per cent., the 6-per-cent. class actually showing the largest amount. Within the last decade there has been a marked increase in the amounts borrowed at higher rates.
The average rate of interest on all mortgages registered during each of the last fourteen years is as follows: —
| Year ended 31st March. | Average Rate per Cent |
|---|---|
| 1913 | 5.76 |
| 1914 | 5.82 |
| 1915 | 5.76 |
| 1916 | 5.74 |
| 1917 | 5.80 |
| 1918 | 5.84 |
| 1919 | 5.84 |
| 1920 | 5.75 |
| 1921 | 5.89 |
| 1922 | 6.42 |
| 1923 | 6.57 |
| 1924 | 6.38 |
| 1925 | 6.30 |
| 1926 | 6.22 |
But little variation is shown during the period from 1913 to 1921. The year, 1921–22, however, witnessed a jump to 6.42 per cent., coinciding with the financial stringency associated with the post-war trade depression. The peak of 6.57 per cent. was reached in the following year, since when there has been a gradual downward trend.
In 1914 the Legislature passed the Mortgages Extension Act, intended to give relief to mortgagors during the currency of the war. This Act was repealed, but re-enacted with modifications in 1919, and by a further amendment made necessary in 1921 by the financial conditions obtaining its provisions were made operative until the close of the year 1924. The Mortgages Final Extension Act, 1924, in effect extended the moratorium until the end of June, 1925, and in certain cases to 31st March, 1927. The protection of the moratorium did not apply to trade mortgages, mortgages made after the passing of the 1919 Act, nor mortgages under the Repatriation Act.
Under the Act of 1924 an order of the Supreme Court might be made, upon the application of the mortgagor, extending the due date of a mortgage. Notice of motion for an extension order required to be made not later than the 31st January, 1926, and in no case could a later date than the 31st March, 1927, be fixed by the Court.
In determining whether any extension order should be made the Court might take into consideration—
The effect of the continuance of the mortgage upon the security thereby afforded to the mortgagee:
The inability of the mortgagor to redeem the property either from his own moneys or by borrowing at a reasonable rate of interest:
The conduct of the mortgagor in respect of any breaches by him of the covenants of the mortgage:
Any hardship that would be inflicted on the mortgagee by the continuance of the mortgage, or upon the mortgagor by the enforcement thereof.
Provision was made for applications for extension orders in certain cases to be referred by a Judge to a Magistrate or other person for hearing.
Until after the 31st March, 1925, it was unlawful for a mortgagee to call up the principal or any part thereof, to exercise a power of sale or enter into possession. or to commence an action for breach of any covenant in the mortgage, except with the leave of the Supreme Court. That Court was empowered to decide whether a mortgagee should be entitled to enforce the terms of his mortgage, and to assess the hardship or otherwise that would be inflicted on the mortgagee by the continuance of the mortgage.
Three months' notice was required to be given the mortgagor before the mortgagee might exercise his powers. In cases where an extension order had been applied for the mortgagee might not exercise his powers until the application had been determined. Where an extension order has been made, action may not be taken by the mortgagee unless and until default is made by the mortgagor in complying with the terms and conditions of the extension order, or of the mortgage as affected by the extension order.
Where the rate of interest provided by a mortgage to which the Act applies or by an agreement in writing or other document subsequently executed was more than 6 per cent., that rate was to continue to be the rate for the further extended term. If the rate was 6 per cent. or less, then interest for the further term brought under the law was to be at the rate of 6 per cent., which thus became a statutory minimum for the mortgages kept alive by the legislation. A trustee mortgagee might, however, come to an agreement with his mortgagor for the extension of the term of the mortgage for not more than five years, at such rate of interest as the trustee mortgagee might think fit, even though a higher rate of interest might be obtainable for a new loan.
The 1921 Act also contained provisions in regard to deposits, the most important feature being contained in several clauses restraining firms and companies from increasing their indebtedness while they still had large liabilities under the protection of the moratorium. It was further provided that firms and bodies holding money on deposit, if they took additional money on deposit, must use it first for the repayment of old deposits. Companies making debenture-issues to secure current accounts with the banks were required to use the proceeds to meet debts incurred by way of borrowing on deposit.
Table of Contents
THE law relating to bankruptcy in New Zealand is contained in the Bankruptcy Act, 1908, which is a consolidation of all previous enactments then in force. The Act of 1908 consists of 176 sections, grouped in fourteen Parts, as follows:—
The Bankruptcy Court.
The Official Assignee.
Proceedings up to Adjudication.
Supervisors of Administration of Bankrupt's Property.
Duties of Bankrupt.
Administration of Bankrupt's Property.
Meetings of Creditors.
Proofs of Debt.
Composition with Creditors.
Distribution of Assets.
Discharge.
Annulling of Adjudication.
Penal Provisions.
Miscellaneous.
Jurisdiction in bankruptcy matters is vested in the Supreme Court. The Governor-General, however, may by Proclamation confer similar jurisdiction on a Magistrate's Court in cases where the liabilities do not exceed £300. The powers of the Court are fully set out in Part I of the Act.
All proceedings in bankruptcy are commenced by a petition filed in the Court. A petition may be filed either by the debtor or by a creditor, a fee of £6 being payable. The filing of a debtor's petition is equivalent to an order of Court adjudging the debtor a bankrupt, no order being required in the case of a debtor's petition. Not less than £30 in the aggregate must be owing by the debtor to the creditor or creditors filing a petition.
Immediately on a debtor's petition being filed or a creditor's petition being adjudicated on, the Registrar of the Court gives notice to the Official Assignee in Bankruptcy, in whom all the property of the bankrupt thereupon vests. Meetings of creditors are provided for, and the bankrupt is required to attend these and submit to examination in respect of his property. He must hand over his books to the Official Assignee, make out balance-sheets, give inventories of his property and debts, and generally assist in the realization of his property.
The Official Assignee is empowered to sell the bankrupt's property, to claim debts due to the bankrupt estate, to carry on the business of the bankrupt so far as is necessary or expedient for its beneficial winding-up, or to divide the property among the creditors. The bankrupt may be appointed by the Official Assignee to manage his estate or carry on his business on behalf of the creditors.
Creditors may accept a composition in satisfaction of the debts duo them. In such a case, after approval of the Court, a deed of composition is executed and filed, and the bankruptcy annulled.
On application being made by the bankrupt, the Court is empowered to grant him an order of discharge, either absolute, suspended, or conditional. The application, which must be made within four months after adjudication, may be opposed either by the Official Assignee or by any creditor who has proved his claim. A public examination of the bankrupt may be demanded by the Assignee or a creditor.
Offences by the bankrupt are dealt with in Part XIII of the Act, which provides a term of imprisonment not exceeding two years for various special offences, including—
Trading on fictitious capital.
Contracting debts without reasonable expectation of being able to pay them.
Failing to keep usual books.
Wilfully omitting to keep proper books, with intent to conceal the true state of his affairs.
Making gifts, transfers, &c., with intent to defraud his creditors.
Concealing or fraudulently removing property.
Furnishing wilfully incorrect statements of his property or the state of his affairs. Absconding.
The number of transactions in bankruptcy during the last ten years was as follows:—
| Year. | Petitions by Debtors. | Adjudications on Petitions by Creditors. | Cases in which Composition accepted. | Orders of Immediate Discharge granted. | Cases in which Orders of Discharge Were suspended. |
|---|---|---|---|---|---|
| 1916 | 267 | 37 | .. | 63 | 21 |
| 1917 | 221 | 44 | 1 | 60 | 10 |
| 1918 | 133 | 31 | 1 | 53 | 9 |
| 1919 | 109 | 32 | 1 | 128 | 13 |
| 1920 | 117 | 27 | .. | 72 | 14 |
| 1921 | 289 | 47 | 1 | 48 | 6 |
| 1922 | 552 | 138 | 2 | 114 | 11 |
| 1923 | 565 | 109 | 2 | 177 | 16 |
| 1924 | 561 | 109 | .. | 200 | 33 |
| 1925 | 535 | 118 | 3 | 221 | 30 |
The number of bankrupties in 1925 (653), although slightly less than during the three preceding years, is still remarkably high. The figures for the last four years are the highest since the “eighties,” when in both 1886 and 1887 the number exceeded 1,000.
Petitions by debtors decreased by twenty-six, as compared with the 1924 figure, while adjudications on creditors' petitions increased by nine.
The figures given above and also further on in this section do not cover private assignments and compositions, particulars respecting such not being available.
Debtors are required to file a statement of the extent of their liabilities and assets, but there is often a marked difference between these statements and the amounts actually realized by the Official Assignee or the debts subsequently proved by creditors. It is the two latter sets of figures that really gauge the extent of financial embarrassment suffered in a community in a time of trade depression.
The following table shows for each of the last ten years the amount of assets as shown in debtors' statements and as realized by the Official Assignee, together with the amounts of debts proved and the amounts paid in dividends and preferential claims: —
| Year. | Number of Bankruptcies. | Debtors' Statements of Assets, excluding Amounts secured to Creditors. | Amounts realized by Official Assignees. | Amount of Debts proved. | Amounts paid in Dividends and Preferential Claims. |
|---|---|---|---|---|---|
| £ | £ | £ | £ | ||
| 1916 | 304 | 123,441 | 56,416 | 172,774 | 29,223 |
| 1917 | 265 | 138,696 | 63,645 | 178,244 | 27,405 |
| 1918 | 164 | 50,356 | 67,729 | 88,607 | 33,176 |
| 1919 | 141 | 43,627 | 54,622 | 59,767 | 24,980 |
| 1920 | 144 | 44,026 | 47,897 | 77,752 | 45,228 |
| 1921 | 336 | 362,601 | 78,271 | 558,504 | 38,646 |
| 1922 | 690 | 344,861 | 126,145 | 834,356 | 63,009 |
| 1923 | 674 | 368,673 | 124,641 | 668,925 | 65,667 |
| 1924 | 670 | 279,602 | 118,641 | 703,995 | 74,878 |
| 1925 | 653 | 235,377 | 98,648 | 471,028 | 80,187 |
The total amount paid in dividends and preferential claims in 1925 represented 17.02 per cent. of the debts proved. In 1924 the corresponding amount represented but 10.63 per cent. of the total debts proved, as against even lower percentages of 9.81 in 1923 and 7.55 in 1922. The proportion is much higher in the earlier years of the table.
The total payments made from the assets realized in 1925 were—
| £ | |
|---|---|
| Dividends to creditors (excluding preferential and secured claims) | 65,298 |
| Preferential claims (rents, wages, &c.) | 14,889 |
| Secured claims | 6,301 |
| Government commission | 9,355 |
| Costs of actions, solicitors' and supervisors' fees | 5,408 |
| Expenses incurred in carrying on estates | 3,828 |
| Other charges | 5,052 |
| Total | £110,131 |
Balances in bank to the credit of estates aggregated £47,594 on 31st December, 1925, a decrease of £10,674 during the year.
The following table shows for each of the last five years the number of bankruptcies of various amounts of liabilities: —
| Liabilities. | 1921. | 1922. | 1923. | 1924. | 1925. |
|---|---|---|---|---|---|
| Under £50 | 7 | 20 | 19 | 23 | 19 |
| £50–£100 | 22 | 41 | 41 | 46 | 37 |
| £100–£250 | 72 | 148 | 147 | 148 | 170 |
| £250–£500 | 74 | 136 | 159 | 162 | 135 |
| £600–£1,000 | 64 | 158 | 136 | 145 | 126 |
| £1,000–£2000 | 57 | 107 | 96 | 80 | 91 |
| £2,000–£5,000 | 22 | 50 | 56 | 44 | 49 |
| £5,000 and over | 17 | 28 | 18 | 22 | 23 |
| Not stated | 1 | 2 | 2 | 3 | |
| Totals | 336 | 690 | 674 | 670 | 653 |
The following table shows in summarized form the occupations of those adjudged bankrupt in the last two years: —
| OCCUPATIONS OF BANKRUPTS, 1924 AND 1925. | ||
|---|---|---|
| Class of Occupation. | 1924. | 1925. |
| Fishing and trapping | .. | 2 |
| Agricultural and pastoral | 195 | 169 |
| Forestry | 7 | 18 |
| Mining and quarrying | 4 | 8 |
| Processes relating to chemicals, animal and vegetable products | 3 | 6 |
| Processes relating to metals, machines, tools, conveyances, jewellery | 29 | 21 |
| Processes relating to minerals | 1 | .. |
| Processes relating to fibrous materials, textiles, and dress | 19 | 9 |
| Class of Occupation. | 1924. | 1925. |
| Processes relating to food, drink, and tobacco | 12 | 12 |
| Processes relating to wood, basketware, furniture, &c. | 8 | 5 |
| Processes relating to paper, stationery, printing, photography | 4 | 1 |
| Construction or repair of buildings, roads, railways, canals | 68 | 69 |
| Transport and communication | 28 | 47 |
| Commerce and finance | 156 | 128 |
| Public administration, clerical, and professional | 13 | 11 |
| Entertainment, sport, and recreation | 4 | 4 |
| Personal or domestic service | 24 | 19 |
| Dependent on public or private support | 6 | 12 |
| Indefinite occupations | 89 | 112 |
| Totals | 670 | 653 |
Of the 1925 total, 96 were employers of labour, 326 were working on their own account, and 230 were working for wages, no information as to grade being available in one case. The farming community was again well represented with 169 failures, while occupations connected with commerce and finance accounted for the considerable total of 128. The principal detailed callings affected are now given (1924 figures in parentheses): Farmers (undefined), 140 (173); labourers, 100 (81); builders, 25 (22); bush sawmillers, 17 (6); butchers, 15 (18); contractors, 12 (17); carriers, 12 (12): shop-assistants, 10 (14).
Table of Contents
ASTATEMENT compiled by the Treasury and showing the value of State assets which may be set off against the public debt is now included in the Financial Statement each year. The latest statement, showing the position as at the 31st March, 1926, is here reproduced as giving the best available information on the subject.
| ESTIMATED STATE ASSETS, 31ST MARCH, 1926. | |||
|---|---|---|---|
| Cash and investments:— | £ | £ | £ |
| Cash in the Public Account and in the hands of officers of the Government | 4,362,072 | ||
| Less liabilities outstanding | 1,435,882 | ||
| 2,926,190 | |||
| Investment of cash balances | 5,738,018 | ||
| Reserve fund (securities at cost) | 1,928,162 | ||
| Post Office Savings-bank Reserve Fund | 1,000,000 | ||
| Bank of New Zealand shares (nominal value) | 1,875,000 | ||
| Public Debt Redemption Fund | 24,725,645 | ||
| 38,193,015 | |||
| Sinking funds accrued— | |||
| State Advances debt | 2,017,348 | ||
| State Coal-mines | 48,199 | ||
| Westport Harbour loans | 186,558 | ||
| Samoan loan | 4,747 | ||
| Nauru and Ocean Islands Sinking Fund Account | 19 | ||
| Electric Supply Sinking Fund Account | 17,391 | 2,274,262 | |
| Loans and advances outstanding— | |||
| Mining purposes | 33,015 | ||
| Local bodies inscribed debt (annuity value of interest receivable) | 1,075,000 | Samoan loan (less sinking fund) | 105,253 |
| Repatriation advances outstanding | 407,016 | ||
| Discharged soldiers' mortgages and property held | 18,493,481 | ||
| Less amount included in Public Debt Redemption Fund | 13,500,000 | ||
| 4,993,481 | |||
| State Advances—mortgages and property held, less sinking funds and investments included elsewhere | 25,292,359 | ||
| General purposes relief—advances outstanding | 51,500 | ||
| 31,957,624 | |||
| Revenue earning and trading accounts— | |||
| Railways (capital cost, including unopened lines and value of assets taken over from provinces) | 53,716,455 | ||
| Telegraphs (value of assets) | 7,311,422 | ||
| Pacific cable (estimated value of Dominion's interest) | 100,000 | ||
| Electric-power supply and development (capital cost) | 4,740,425 | ||
| Westport Harbour-works (value of assets) | 585,195 | ||
| Lighthouses and harbour-works (capital expenditure) | 1,206,692 | ||
| Tourist and health resorts (capital expenditure) | 407,228 | ||
| State coal-mines (value of assets) | 242,421 | ||
| Kauri-gum (trading capital) | 85,000 | ||
| Nauru and Ocean Islands (purchase price of rights) | 565,040 | ||
| 68,959,878 | |||
| Lands and forests— | |||
| Crown lands (estimated value, including settlement lands, Native lands, and education reserves) | 31,552,178 | ||
| Land-drainage schemes (capital invested) | 1,306,070 | ||
| Irrigation and water-supply (capital expenditure) | 677,408 | ||
| Waihou and Ohinemuri Rivers improvement (capital expenditure) | 482,489 | ||
| Lands improvements (capital expenditure) | 300,151 | ||
| Samoan Crown Estates (value of Dominion's interest) | 662,360 | ||
| Howard Estate | 75,000 | ||
| State forests (estimated value of forests, reserves, plantations, and nurseries) | 37,560,000 | ||
| 72,615,656 | |||
| Indirectly productive expenditure— | |||
| Public buildings (including school buildings) | 12,067,784 | ||
| Roads (including roads on Crown lands and main highways | 17,818,392 | ||
| Timber-supply, sawmills, &c. (capital invested) | 4,172 | ||
| Quarries (acquisition and working) | 14,167 | ||
| Development of mining (capital expenditure) | 882,975 | ||
| Immigration (capital expenditure) | 2,932,491 | ||
| 33,719,981 | |||
| Total | £247,720,416 | ||
From the point of view of the purpose for which this statement was compiled, the inclusion of the items “Roads,” “Development of mining,” and “Immigration” is open to no objection. In considering the value of public property, however, it is preferable to omit such items, leaving the total at £226,000,000. The expenditure by the State on roads, immigration, and mining is reflected in the value of property, both public and private.
It may be here stated that, although much of the expenditure of counties, boroughs, town districts, and road districts has been in respect of the construction of streets, roads, and bridges, these items are not included as assets of the respective bodies under the next heading.
The form of return in use for the collection of statistics of local governing authorities provides for particulars of cash assets and an estimate of other assets being supplied. The figures in respect of the latter are far from complete, no assets apart from cash assets being included by some local authorities, while in other cases no value is assigned to reserves. Nevertheless the following total as at 31st March, 1925, may be taken as an approximate though somewhat conservative estimate of the position:—
| Class of Local Authority. | Cash Assets. | Other Assets (estimated). |
|---|---|---|
| £ | £ | |
| Counties | 1,281,526 | 1,573,350 |
| Boroughs | 4,165,499 | 24,270,470 |
| Town districts | 85,777 | 492,543 |
| Road districts | 74,717 | 180,320 |
| River districts | 39,767 | 46,296 |
| Land-drainage districts | 39,380 | 50,192 |
| Electric-power districts | 818,639 | 6,095,337 |
| City and suburban drainage districts | 506 | 1,350 |
| Water-supply districts | 151,084 | 753,086 |
| Tramway district | 385,161 | 1,203,649 |
| Railway districts | 5,052 | 134,275 |
| Gas-lighting district | .. | 83,129 |
| Harbour Boards | 1,829,414 | 13,415,930 |
| Totals | 8,876,522 | 48,299,927 |
Full details of estimated assets of the foregoing classes of local authorities are contained in the Local Authorities Handbook. Naturally the assets vary in nature considerably according to the nature and purpose of the particular class of local authority, and it is impossible to summarize the whole into one table, except in regard to total figures, as in the preceding table. Certain groups may, however, be conveniently taken together, and the next table shows the assets of counties, boroughs, and town districts in fairly well defined categories.
| Class of Assets. | Counties. | Boroughs. | Town Districts. |
|---|---|---|---|
| £ | £ | £ | |
| Cash assets | 1,281,526 | 4,165,499 | 85,777 |
| Halls, libraries, premises, office furniture, &c. | 178,583 | 1,736,403 | 68,739 |
| Plane, tools, stocks, and materials | 482,246 | 478,391 | 20,978 |
| Reserves, public parks, gardens, &c. | 188,620 | 2,121,568 | 39,540 |
| Endowments | 87,500 | 2,447,026 | 9,117 |
| Tramway systems | 27,330 | 3,568,288 | |
| Electrical works | 146,852 | 3,878,259 | 77,381 |
| Gasworks | .. | 1,233,710 | 4,698 |
| Wharves, jetties, and ferry services | 46,910 | 89,218 | |
| Drainage, sewerage, and water systems | 147,207 | 6,665,605 | 244,263 |
| Workers' dwellings, roadmen's cottages, &c. | 198,125 | 253,885 | 23,368 |
| Saleyards, abattoirs. &c. | .. | 235,056 | .. |
| Cemeteries, &c. | .. | 146,627 | .. |
| Quarries | 52,543 | 73,944 | .. |
| Other and unspecified | 17,434 | 1,342,490 | 4,459 |
| Totals | 2,854,876 | 28,435,969 | 578,320 |
Next to the boroughs, Harbour Boards have the highest aggregate of assets among the various classes of local bodies covered by the first table under this head. A summary of assets of Harbour Boards as at 31st December, 1924, is given:—
| Class. | Amount. £ |
|---|---|
| Cash assets | 1,829,414 |
| Wharves, quays, breastworks, &c. | 6,624,164 |
| Ships, docks, &c. | 647,014 |
| Dredges, boats, tugs, &c. | 562,967 |
| Buildings, stores, sheds, &c. | 574,063 |
| Plant, machinery, &c. | 496,703 |
| Endowments | 888,182 |
| Reclaimed land | 3,404,244 |
| Signal stations, reserves, &c. | 24,125 |
| Office furniture | 10,935 |
| Lights, buoys, &c. | 3,753 |
| Railways (including plant, &c.) | 9,470 |
| Other and unspecified | 170,310 |
| Total | £15,245,344 |
The assets of other classes of local bodies which supply returns to the Census and Statistics Office are shown in the following table in such available detail as is common to all classes: —
| Class of Local District. | Cash Assets. | Premises, Office Furniture, Plant, Implements, Tools, &c. | Reserves, Parks, Hardens, Recreation Grounds, &c. | Endowments. | Drainage, Sewerage, and Water Systems. | Other and unspecified. | Total. |
|---|---|---|---|---|---|---|---|
* Dunedin Drainage Board only; Auckland and Christchurch systems not valued. | |||||||
| £ | £ | £ | £ | £ | £ | £ | |
| Road | 74,717 | 32,200 | 16,492 | 99,465 | 32,163 | 255,037 | |
| River | 39,767 | 19,592 | 12,591 | 10,388 | .. | 3,725 | 86,063 |
| Land-drainage | 39,380 | 5,726 | .. | 9,120 | 30,941 | 4,405 | 89,572 |
| Electric-power | 818,639 | 808,356 | .. | .. | .. | 5,286,981 | 6,913,976 |
| Water-supply | 506 | 1,350 | .. | .. | .. | .. | 1,856 |
| City and suburban drainage | 151,084 | 77,654 | .. | .. | 672,453* | 2,979 | 904,170 |
| Tramway | 385,161 | 79,347 | .. | .. | .. | 1,124,302 | 1,588,810 |
| Railway | 5,052 | 2,629 | 1,591 | .. | .. | 130,055 | 139,327 |
| Gas-lighting | .. | .. | .. | .. | .. | 83,129 | 83,129 |
Included in the “Other and unspecified” totals are the following items: —
| Class of Local District. | Nature of Assets. | Amount. |
|---|---|---|
| £ | ||
| Road | Electrical works | 25,667 |
| Electric-power | Electrical works | 5,163,730 |
| Tramway | Tramways system | 1,124,302 |
| Railway | Railways | 123,150 |
| Gas-lighting | Gasworks | 83,129 |
Of the three classes of local authorities not covered by the foregoing figures (hospital districts, fire districts, and rabbit districts), information as to assets has hitherto been available only in the case of Hospital Boards. The assets of Hospital Boards were set down at £4,851,348 at the 31st March, 1925, at which date separate institutions and charitable institutions not under the control of Hospital Boards had further assets aggregating £148,118, so that, apart from Government institutions, the total assets of the public hospital system of the Dominion were £5,000,000. Of this amount £3,695,964 was represented by land, buildings, and equipment, £244,968 by investments, and £78,741 by stores, the balance being cash assets.
Statistics of the finances, &c., of the governing bodies of fire districts and rabbit districts have just recently been instituted, and complete figures of assets are not yet available. Sufficient information is, however, to hand from which to base an estimate, and the assets of fire districts (excluding the recently constituted Wellington district, figures for which are included with those of Wellington City in the borough totals already given) may be set down as approximately £350,000, and of rabbit districts as approximately £50,000. The aggregate assets of all local bodies would thus be in the neighbourhood of £62,500,000.
In arriving at the aggregate public wealth of the. Dominion, as distinct from private wealth, it is necessary to take into account the fact that of the total indebtedness of local bodies at the 31st March, 1925, £6,500,000 was owing to the General Government. The approximate public wealth of the Dominion would thus be £226,000,000, plus £62,500,000, minus £6,500,000, or £282,000,000.
Estimates of the private wealth of the Dominion are arrived at on the assumption that the wealth per head of the living is approximately equal to that left by the average person dying. The fact that the younger and more numerous members of the population do not possess as much accumulated wealth as the older members, taken in conjunction with the fact that the death-rate varies with age, renders it necessary for this purpose to divide the population into quinquennial age-groups. The average wealth of persons dying within any one age-group being known, the average wealth of living persons belonging to that age-group is assumed to be identical, and an estimate of the total private wealth of the Dominion is arrived at by weighting the average wealth of persons in each age-group by the number of persons in that group.
The actual average wealth of deceased persons is obtained by a consideration of the estates certified for stamp duty. For each person whose estate is dealt with by the Stamp Duties Department a return is forwarded to the Census and Statistics Office showing name, age, date of death, and amount of estate certified. The few instances where the ages of deceased persons are not ascertainable are allocated to each age-group in proportion to its contribution to the total.
If the period under review be short, the infrequency of the appearance of large estates may occasion from time to time considerable discrepancies in the results according as many or few large estates appear in the returns. Matters are further complicated by the fact that from six to twelve months usually elapse after the date of death before the estate is finally certified, with the result that an abnormal number of deaths towards the end of any one year may swell the number of deaths for the year without affecting the number of estates certified, thus bringing about a fictitiously low average wealth of deceased persons for that year and a fictitiously high average wealth for the following year. The epidemic of influenza in the last quarter of 1918 produced just this effect. For these reasons it is desirable to extend the estimate over a series of years and to strike an average. On the other hand, owing to the rapid movement in values during the last few years too long a period yields an artificial estimate. In the computation of the latest estimate an average has been taken over the years 1921–25.
It has been found that the number of estates dealt with in any period is usually equal to about one-third only of the total deaths registered during that period; and as most persons leave some estate, however small., it is necessary to make some allowance for estates which have not passed through the Stamp Duties Office. It should be noted in this connection that up to 1920, estates below £500 were exempt from estate duty, and if under £200, from succession duty also. Since 1920 the exemptions have been widened somewhat, and now estates under £1,000 escape estate duty, and if under £500, succession duty. In many cases, however, estates of a lower value than the figures indicated are passed for probate or letters of administration. The method formerly adopted of making a proportionate allowance of 10 per cent. for all unrecorded estates involved a slight weakness, in that it gave too low an amount for persons dying at early ages and too high an amount for persons dying at advanced ages, so that, while these factors balanced each other and did not affect very appreciably the total result, it has been deemed better, in order to ensure closer accuracy, to make a fixed allowance, increasing from £20 for the age-group 15 to 20 years to £100 at ages 35 to 40 and over. In such cases no distinction is made between the wealth of males and that of females. It has been found that the average for males is generally much higher than that for females; and it would appear that slightly greater accuracy still would be obtained by treating the estates of the two sexes separately, making a fixed allowance for unrecorded estates ranging from £30 for males and £10 for females for the age-group 15 to 20 years to £150 for males and £50 for females at ages 35 to 40 and over. No allowance at all is made for estates of persons under 15. The following tables illustrate the results of the two methods.
| ESTIMATED PRIVATE WEALTH, 1925. | ||||||
|---|---|---|---|---|---|---|
| Age, in Years. | Number of Estates certified, 1921–25. | Total Amount, including Allowance for Unrecorded Estates. | Number of Deaths registered, 1921–25. | Average Wealth per Person dying. | Population, 31st December, 1925. | Estimated Private Wealth, 31st December, 1925. |
| £ | £ | £ | ||||
| (a.) Both Sexes taken together. | ||||||
| Under 5 | 13 | 4,761 | 8,169 | 0.5828 | 136,853 | 79,758 |
| 5 and under 10 | 20 | 10,447 | 1,111 | 9.4032 | 130,941 | 1,231,264 |
| 10 ,, 15 | 15 | 6,727 | 791 | 8.5044 | 134,756 | 1,146,019 |
| 15 ,, 20 | 75 | 55,447 | 1,072 | 51.7229 | 124,682 | 6,448,915 |
| 20 ,, 25 | 351 | 240,555 | 1,455 | 165.3299 | 111,473 | 18,429,820 |
| 25 ,, 30 | 607 | 380,827 | 1,512 | 251.8697 | 102,568 | 25,833,771 |
| 30 ,, 35 | 722 | 915,414 | 1,786 | 512.5498 | 97,635 | 50,042,799 |
| 35 ,, 40 | 1,028 | 1,489,784 | 2,168 | 687.1697 | 97,693 | 67,131,670 |
| 40 ,, 45 | 1,273 | 1,981,468 | 2,427 | 816.4269 | 98,981 | 80,810,751 |
| 45 ,, 50 | 1,524 | 3,110,074 | 2,785 | 1,116.7232 | 86,194 | 96,254,839 |
| 50 ,, 55 | 1,748 | 4,423,223 | 3,065 | 1,443.1396 | 68,098 | 98,274,920 |
| 55 ,, 60 | 1,913 | 6,123,187 | 3,161 | 1,937.1044 | 52,093 | 100,909,580 |
| 60 ,, 65 | 2,217 | 7,641,468 | 3,664 | 2,085.5535 | 37,010 | 77,186,335 |
| 65 ,, 70 | 2,770 | 9,843,691 | 4,484 | 2,195.2924 | 27,484 | 60,335,416 |
| 70 ,, 75 | 2,943 | 11,321,529 | 4,835 | 2,341.5779 | 19,704 | 46,138,451 |
| 75 ,, 80 | 2,778 | 11,154,748 | 4,804 | 2,321.9709 | 11,050 | 25,657,778 |
| 80 ,, 85 | 2,344 | 10,670,717 | 4,208 | 2,535.8168 | 6,078 | 15,412,695 |
| 85 ,, 90 | 1,215 | 6,689,199 | 2,548 | 2,625.2743 | 2,196 | 5,765,102 |
| 90 ,, 95 | 333 | 1,485,387 | 720 | 2,063.0375 | 523 | 1,078,969 |
| 95 and over | 81 | 434,884 | 198 | 2,196.3838 | 64 | 140,569 |
| Totals | 23,970 | 77,983,537 | 54,963 | .. | 1,346,076 | 778,309,421 |
| (b.) Sexes taken separately. | ||||||
| MALES. | ||||||
| £ | £ | £ | ||||
| Under 5 | 6 | 1,745 | 4,612 | 0.3784 | 70,043 | 26,504 |
| 5 and under 10 | 12 | 6,855 | 614 | 11.1645 | 66,676 | 744,404 |
| 10 ,, 15 | 8 | 3,339 | 432 | 7.7292 | 68,696 | 530,965 |
| 15 ,, 20 | 59 | 36,435 | 561 | 64.9465 | 63,915 | 4,151,056 |
| 20 ,, 25 | 293 | 195,810 | 766 | 255.6266 | 57,374 | 14,666,321 |
| 25 ,, 30 | 461 | 261,717 | 738 | 354.6301 | 50,706 | 17,981,874 |
| 30 ,, 35 | 523 | 755,694 | 942 | 802.2229 | 46,492 | 37,296,947 |
| 35 ,, 40 | 737 | 1,180,197 | 1,147 | 1,028.9425 | 48,444 | 49,846,090 |
| 40 ,, 45 | 845 | 1,551,965 | 1,365 | 1,136.9707 | 50,834 | 57,796,769 |
| 45 ,, 50 | 1,030 | 2,512,401 | 1,610 | 1,560.4975 | 44,789 | 69,893,123 |
| 50 ,, 55 | 1,109 | 3,313,032 | 1,763 | 1,879.2014 | 36,355 | 68,318,367 |
| 55 ,, 60 | 1,196 | 4,862,175 | 1,815 | 2,678.8843 | 27,889 | 74,711,404 |
| 60 ,, 65 | 1,363 | 6,137,982 | 2,124 | 2,889.8220 | 19,550 | 56,496,020 |
| 65 ,, 70 | 1,723 | 7,785,922 | 2,669 | 2,917.1682 | 14,442 | 42,129,743 |
| 70 ,, 75 | 1,863 | 9,125,771 | 2,786 | 3,275.5818 | 10,645 | 34,868,568 |
| 75 ,, 80 | 1,700 | 8,826,016 | 2,654 | 3,325.5524 | 5,783 | 19,231,670 |
| 80 ,, 85 | 1,524 | 8,525,674 | 2,393 | 3,562.7555 | 3,186 | 11,350,939 |
| 85 ,, 90 | 831 | 5,698,356 | 1,422 | 4,007.2827 | 1,174 | 4,704,550 |
| 90 ,, 95 | 214 | 1,079,564 | 415 | 2,601.3590 | 261 | 678,955 |
| 95 and over | 54 | 358,538 | 113 | 3,172.9027 | 33 | 104,706 |
| Totals for males | 15,551 | 62,219,188 | 30,941 | .. | 687,287 | 565,528,975 |
| FEMALES. | ||||||
| Under 5 | 7 | 3,016 | 3,557 | 0.8479 | 66,810 | 56,648 |
| 5 and under 10 | 8 | 3,592 | 497 | 7.2274 | 64,265 | 464,469 |
| 10 ,, 15 | 7 | 3,388 | 359 | 9.4373 | 66,060 | 623,428 |
| 15 ,, 20 | 16 | 19,082 | 511 | 37.3425 | 60,767 | 2,269,192 |
| 20 ,, 25 | 58 | 41,585 | 689 | 60.3556 | 54,099 | 3,265,178 |
| 25 ,, 30 | 146 | 108,580 | 774 | 140.2842 | 51,862 | 7,275,419 |
| 30 ,, 35 | 199 | 150,680 | 844 | 178.5308 | 51,143 | 9,130,601 |
| 35 ,, 40 | 291 | 293,587 | 1,021 | 287.5485 | 49,249 | 14,161,476 |
| 40 ,, 45 | 428 | 423,803 | 1,062 | 399.0612 | 48,147 | 19,213,599 |
| 45 ,, 50 | 494 | 592,623 | 1,175 | 504.3600 | 41,405 | 20,883,026 |
| 50 ,, 55 | 639 | 1,109,741 | 1,302 | 852.3356 | 31,743 | 27,055,689 |
| 55 ,, 60 | 717 | 1,260,512 | 1,346 | 936.4874 | 24,204 | 22,666,741 |
| 60 ,, 65 | 854 | 1,507,686 | 1,540 | 979.0169 | 17,460 | 17,093,635 |
| 65 ,, 70 | 1,047 | 2,066,669 | 1,815 | 1,138.6606 | 13,042 | 14,850,412 |
| 70 ,, 75 | 1,080 | 2,193,458 | 2,049 | 1,070.5017 | 9,059 | 9,697,675 |
| 75 ,, 80 | 1,078 | 2,322,832 | 2,150 | 1,080.3870 | 5,267 | 5,690,398 |
| 80 ,, 85 | 820 | 2,138,743 | 1,815 | 1,178.3708 | 2,892 | 3,407,848 |
| 85 ,, 90 | 384 | 983,293 | 1,126 | 873.2620 | 1,022 | 892,474 |
| 90 ,, 95 | 119 | 406,573 | 305 | 1,333.0262 | 262 | 349,253 |
| 95 and over | 27 | 76,396 | 85 | 898.7765 | 31 | 27,862 |
| Totals for females | 8,419 | 15,705,839 | 24,022 | .. | 658,789 | 179,075,023 |
| Grand totals | 23,970 | 77,925,027 | 54,963 | .. | 1,346,076 | 744,603,998 |
It is seen that under method (a) the estimated private wealth of the Dominion at the 31st December, 1925, works out at £778,309,421, and under method (b) at £744,603,998, which may be taken as the more correct figure. The discrepancy of £33,705,423 between the two amounts is due to the fact that practically three-quarters of the estates dealt with during the period belonged to males, and, the average wealth per male being higher than that per female, it fellows that under the first method the estimated wealth of the whole population will tend to be somewhat overstated. The estimated wealth per head of the whole population was £553, and per head of persons of twenty years and over (practically the adult population) £909.
Estimates of private wealth have been made annually since 1912. It was originally proposed to adopt a ten-years basis as soon as figures for ten years were available, but the advent of the war and the rapid movement in values made it advisable to adopt a shorter period, at least temporarily. As indicated previously, also, the former system of making a proportionate allowance of 10 per cent. for unrecorded estates was abandoned in 1919 in favour of the present scheme of a fixed allowance varying with age. The latter change will have had little effect on the comparability of the figures, and the former was designed to assist tow. as retaining comparability. In any comparison, however, it is necessary to keep in mind the fact that the greater part of the increase in recent years as compared with earlier is due to inflation of values. Nevertheless, when allowance is made for this on the basis of the best information available—viz., the movement in the wholesale-prices index number—a pronounced increase over the last decennium is still apparent.
An estimate of the private wealth in 1914, taking an average over the years 1908–14, shows £285,485,829; but in this instance the now-abandoned 10-per-cent. method was used, and no distinction between the two sexes was made. The average per head of population shown by the 1914 estimate was £255, or, if only population twenty years of age and over be considered, £424, as compared with corresponding averages of £553 and £909 disclosed by the 1925 estimate. If both sets of figures be converted to the 1909–13 standard of wholesale prices, the 1914 averages become £242 and £402, and the 1925 averages £326 and £536.
It should be explained that the foregoing computations are exclusive of Maoris. The inclusion of Maoris would not affect the per capita rates to any extent, but would involve an addition of 4 or 5 per cent. to the totals shown for the various estimates quoted. An addition of 4 per cent. to the aggregate figure previously given for 1925 would bring the estimated private wealth of the Dominion to £774,500,000.
A table is now given showing the number of estates finally passed during 1924 and 1925, classified according to amount. Estates of Maoris are here included.
| Amount | Number of Estates. | Aggregate Net Value of Estates. | ||
|---|---|---|---|---|
| 1924. | 1925. | 1924. | 1925. | |
| £ | £ | |||
| £ £ Under 500 | 2,042 | 2,050 | 393,134 | 394,749 |
| 500 and under 1,000 | 810 | 820 | 588,513 | 592,658 |
| 1,000 ,, 2,000 | 758 | 702 | 1,102,716 | 1,011,646 |
| 2,000 ,, 3,000 | 386 | 350 | 945,426 | 851,890 |
| 3,000 ,, 4,000 | 227 | 205 | 784,659 | 721,445 |
| 4,000 ,, 5,000 | 132 | 155 | 587,610 | 693,042 |
| 5,000 ,, 7,500 | 222 | 214 | 1,372,241 | 1,315,594 |
| 7,500 ,, 10,000 | 108 | 107 | 926,013 | 920,655 |
| 10,000 ,, 15,000 | 130 | 104 | 1,612,254 | 1,250,256 |
| 15,000 ,, 20,000 | 58 | 62 | 1,022,212 | 1,073,577 |
| 20,000 and over | 132 | 104 | 6,719,538 | 5,887,477 |
| Totals | 5,005 | 4,873 | 16,054,316 | 14,712,989 |
The public wealth of the Dominion has been estimated at approximately £282,000,000, and the private wealth, including that of Maoris, at approximately £774,500,000. In the probate figures used as the basis of computation of private wealth, deductions are made on account of debts, mortgages, and other charges against property. As, however, these in general will rank as assets when estates to which the charges are owing are in their turn passed for probate, the general effect is negligible, except in so far as such items as State advances and debts owing overseas are concerned. The State advances outstanding are included in the public-wealth figure.
In the case of the public wealth the figure given practically represents gross assets, no deduction having, of course, been made on account of indebtedness of the General Government and of local governing bodies. Were the whole of this indebtedness owing outside the Dominion, no deduction on this account would be necessary for the purpose of the present computation, which is merely to ascertain an approximation of the wealth of the Dominion, without taking account of the fact that there are external charges against that wealth. In arriving at the sum of public and private wealth, however, it is necessary to make allowance for the indebtedness of the General Government and of local governing bodies within the Dominion, this being included in the private-wealth estimate.
Of the gross public debt at the 31st March, 1926, £107,000,000 was domiciled in New Zealand, and of the gross debt of local governing bodies a year earlier £29,500,000 was domiciled in the Dominion, exclusive of the £6,500,000 borrowed from the General Government, allowance for which has already been made in the estimation of the approximate public wealth. To arrive at an estimate of the national wealth the sum of £136,500,000 requires to he deducted from the aggregate of the public and private wealth figures previously given, the result being:—
| £ | |
|---|---|
| Approximate public wealth | 282,000,000 |
| Estimated private wealth | 774,500,000 |
| Total | 1,056,500,000 |
| Less public and local-body debt domiciled in Dominion | 136,500,000 |
| Estimated national wealth | £920,000,000 |
It appears scarcely necessary to point out that the estimate given can be regarded at best as a rough approximation only. No practicable system has yet been devised that will permit of a reliably close estimation of national wealth being arrived at, and the difficulties in this respect are enormously increased during a period of changing values, such as have been experienced during the last decade.
The bulk of the wealth of the Dominion is represented by land and improvements thereon, particulars of the valuation of which are given in Section XXVI of this book. Further information concerning the value of land, with particular reference to its utilization and its relative distribution among the population, is obtainable from the annual returns of land which are furnished to the Commissioner of Taxes for the purpose of land-tax assessment. Statistics compiled from these returns are available for the last two years, and afford valuable information not only as to the distribution of land on a value basis, but also as to the incidence of land taxation. The latter aspect properly belongs to the subject of taxation, which is dealt with in Section XXIIIB of this book; but, owing to the close interrelation of the two matters, and the impossibility of discussing one fully without largely bringing in the other, both are covered in the present section.
It should be explained that in the statistical tabulation it has not been found possible to cover each year the whole of the returns for that year, returns under query or not to hand at the time of tabulation being of necessity omitted. Apart from the fact that the actual totals would be somewhat in excess of those shown, the omission of a small percentage does not impair the statistical value of the tables or invalidate conclusions drawn from the figures.
Returns covered by the statistics for 1925–26 numbered 68,218, representing an aggregate unimproved value of £228,522,553, as compared with 66,583 returns and £221,588,455 unimproved value of land tabulated in 1924–25. Owing to the operations of the various exemptions, dealt with later on, the number of holdings on which tax was assessed reduced to 50,063 in 1925–26 and 51,165 in 1924–25.
Of the 68,218 returns covered in 1925–26, no fewer than 45,8£1, or 67 per cent. of the total, were in respect of holdings of a lower value than £2,500, at which amount the ordinary exemption ceases. The aggregate unimproved value of these 45,881 holdings was £53,716,686, or only 23 ½ per cent. of the grand total. On the other hand, the 4,171 returns where the unimproved value was over £10,000 formed only 6 per cent. of the total, but represented 39 per cent. of the total unimproved value.
The following table shows the distribution of holdings according to unimproved value for each of the two years.
| LAND-TAX RETURNS.—SUMMARY BY AMOUNT OF UNIMPROVED VALUE. | ||||||
|---|---|---|---|---|---|---|
| Amount. | Number of Returns. | Number of Taxpayers. | Total Unimproved Value | |||
| 1924–25. | 1925–26. | 1924–25. | 1925–26. | 1924–25. | 1925–26. | |
| £ £ | £ | £ | ||||
| Under 100 | 128 | 17 | 6 | 6 | 7,413 | 1,035 |
| 100– 199 | 139 | 25 | 11 | 9 | 20,734 | 3,895 |
| 200– 299 | 139 | 35 | 9 | 8 | 33,603 | 8,524 |
| 300– 399 | 112 | 38 | 5 | 8 | 38,824 | 13,093 |
| 400– 499106 | 41 | 5 | 6 | 46,502 | 18,596 | |
| 500– 599 | 4,133 | 4,317 | 3,372 | 3,306 | 2,305,220 | 2,437,535 |
| 600– 699 | 5,542 | 5,786 | 4,737 | 4,736 | 3,540,692 | 3,696,626 |
| 700– 799 | 4,580 | 4,690 | 3,746 | 3,681 | 3,395,935 | 3,476,769 |
| 800– 899 | 3,788 | 3,887 | 3,057 | 3,000 | 3,181,478 | 3,266,411 |
| 900– 999 | 3,093 | 3,224 | 2,422 | 2,385 | 2,909,435 | 3,037,010 |
| 1,000– 1,999 | 18,454 | 18,712 | 13,695 | 13,125 | 26,341,450 | 26,406,154 |
| 2,000– 2,499 | 8,480 | 5,109 | 5,800 | 3,408 | 20,579,908 | 11,351,038 |
| 2,500– 2,999 | 3,606 | 2,316 | 9,840,135 | |||
| 3,000– 3,999 | 4,808 | 4,895 | 3,321 | 3,228 | 16,698,865 | 16,857,559 |
| 4,000– 4,999 | 2,901 | 3,160 | 2,139 | 2,073 | 12,917,959 | 14,078,947 |
| 5,000– 5,999 | 2,060 | 2,221 | 1,572 | 1,511 | 11,260,031 | 12,136,380 |
| 6,000– 6,999 | 1,482 | 1,585 | 1,151 | 1,125 | 9,573,222 | 10,223,898 |
| 7,000– 7,999 | 1,077 | 1,188 | 857 | 845 | 8,055,125 | 8,889,700 |
| 8,000– 8,999 | 774 | 827 | 637 | 611 | 6,556,495 | 6,990,428 |
| 9,000– 9,999 | 648 | 684 | 547 | 520 | 6,139,301 | 6,478,287 |
| 10,000–14,999 | 2,776 | 1,909 | 2,763 | 1,894 | 37,942,198 | 23,442,700 |
| 15,000–19,999 | 904 | 904 | 14,913,684 | |||
| 20,000–29,999 | 665 | 702 | 665 | 702 | 16,114,021 | 17,045,234 |
| 30,000–39,999 | 284 | 297 | 284 | 297 | 9,686,018 | 10,122,344 |
| 40,000–49,999 | 138 | 132 | 138 | 132 | 6,053,695 | 5,796,053 |
| 50,000–99,999 | 226 | 189 | 226 | 189 | 18,190,331 | 12,255,547 |
| 100,000 and over | 38 | 38 | 5,734,971 | |||
| Totals | 66,583 | 68,218 | 51,165 | 50,063 | 221,588,455 | 228,522,553 |
A slight difference in classification between the two years is apparent, two of the groups adopted in 1924–25 having been further divided in 1925–26 at the points where the ordinary exemption ceases in the one case and the mortgage exemption in the other. In addition the group “£50,000 and over” has been divided to distinguish cases where the unimproved value is £100,000 or over. Another point of difference is that in 1925–26 holdings under £500 in unimproved value (which, with a few exceptions, are entirely exempt from land-tax) have been excluded to a much greater extent than in the previous year.
It should be understood that the classification by amount is on the basis of the unimproved value of the land, and not, in the case of taxpayers, on the basis of taxable balance. Taking as an example the group “£500–£599” for the year 1925–26, the figures given in the table show that 4,317 returns were received in this category, representing an aggregate of £2,437,535, and that of the 4,317 persons, &c., concerned 3,306 were assessed for land-tax. It may be added that the amount in respect of which tax was assessed was only £223,955. Statistics of taxable balance are given farther on.
Comparing the figures for the different categories as between the two years it is noticed that, while the number of returns and the aggregate unimproved value were in nearly every instance greater in 1925–26 than in 1924–25, the reverse holds in the case of the figures in respect of taxpayers.
In the statistical treatment of the data a distinction is made according to the class of taxpayers, the division being as follows: —
Class I—Persons and firms.
Class II—Deceased persons' estates, trusts, &c.
Class III—Natives, Native Land Boards, Native trusts, &c.
Class IV—Companies.
The figures for the respective classes for the years 1924–25 and 1925–26 are as follows: —
| LAND-TAX RETURNS.—CLASSES, 1924–25 AND 1925–26. | ||||||
|---|---|---|---|---|---|---|
| Class. | Number of Returns. | Number of Taxpayers. | Total Unimproved Value. | |||
| 1924–25. | 1925–26. | 1924–25. | 1925–26. | 1921–25. | 1925–26. | |
| £ | £ | |||||
| I | 57,789 | 59,734 | 43,624 | 42,511 | 178,163,013 | 184,556,517 |
| II | 4,184 | 4,323 | 3,893 | 3,946 | 19,184,649 | 19,106,042 |
| III | 2,805 | 2,288 | 2,267 | 2,191 | 6,275,373 | 6,038,715 |
| IV | 1,805 | 1,873 | 1,381 | 1,415 | 17,965,420 | 18,821,279 |
| Totals | 66,583 | 68,218 | 51,165 | 50,063 | 221,588,455 | 228,522,553 |
The general class covers the overwhelming majority of returns and taxpayers and four-fifths of the aggregate unimproved value. As might be expected, however, the average unimproved value per return is much lower in this class than in that composed of the companies. The averages for the respective classes in 1925–26 are: —
| Class. | Average per Return. £ |
|---|---|
| I | 3,090 |
| II | 4,420 |
| III | 2,639 |
| IV | 10,049 |
| Total | 3,350 |
Reference to the next table, which summarizes returns and their aggregate unimproved value by class in conjunction with amount, will show that the preponderance of the general class of persons and firms is much greater in the lower categories than in the higher.
| LAND-TAX RETURNS.—CLASSES BY AMOUNTS, 1925–26. | ||||||||
|---|---|---|---|---|---|---|---|---|
| Amount. | Number of Returns. | Total Unimproved Value. | ||||||
| Class I. | Class II. | Class III. | Class IV. | Class I. | Class II. | Class III. | Class IV. | |
| £ £ | £ | £ | £ | £ | ||||
| Under 500 | 83 | 21 | 52 | .. | 25,718 | 5,787 | 13,638 | .. |
| 500– 599 | 3,941 | 195 | 151 | 30 | 2,227,578 | 109,016 | 84,139 | 16,802 |
| 600– 699 | 5,203 | 293 | 230 | 60 | 3,323,726 | 187,613 | 147,175 | 38,112 |
| 700– 799 | 4,258 | 207 | 159 | 66 | 3,155,417 | 153,579 | 118,671 | 49,102 |
| 800– 899 | 3,452 | 227 | 131 | 77 | 2,900,044 | 191,357 | 110,733 | 64,277 |
| 900– 999 | 2,864 | 177 | 139 | 44 | 2,697,591 | 166,424 | 131,208 | 41,787 |
| 1,000– 1,999 | 16,537 | 1,070 | 715 | 390 | 23,319,723 | 1,537,164 | 992,943 | 556,324 |
| 2,000– 2,499 | 4,485 | 318 | 164 | 142 | 9,969,985 | 699,449 | 366,043 | 315,561 |
| 2,500– 2,999 | 3,164 | 239 | 104 | 99 | 8,634,849 | 652,992 | 281,970 | 270,324 |
| 3,000– 3,999 | 4,217 | 366 | 154 | 158 | 14,536,744 | 1,243,122 | 529,509 | 548,184 |
| 4,000– 4,999 | 2,728 | 227 | 74 | 131 | 12,171,647 | 1,000,349 | 324,143 | 582,808 |
| 5,000– 5,999 | 1,906 | 172 | 60 | 83 | 10,414,677 | 939,137 | 329,208 | 453,358 |
| 6,000– 6,999 | 1,356 | 129 | 36 | 64 | 8,750,892 | 828,791 | 232,936 | 411,279 |
| 7,000– 7,999 | 992 | 130 | 19 | 47 | 7,432,734 | 969,409 | 140,113 | 347,444 |
| 8,000– 8,999 | 693 | 73 | 22 | 39 | 5,858,649 | 614,991 | 186,143 | 330,645 |
| 9,000– 9,999 | 575 | 57 | 14 | 38 | 5,446,798 | 542,786 | 132,190 | 356,513 |
| 10,000–14,999 | 1,598 | 173 | 24 | 114 | 19,674,346 | 2,082,182 | 289,375 | 1,396,797 |
| 15,000–19,999 | 755 | 75 | 10 | 64 | 12,368,327 | 1,237,007 | 167,741 | 1,090,609 |
| 20,000–29,999 | 519 | 92 | 8 | 83 | 12,600,642 | 2,227,294 | 209,963 | 2,007,335 |
| 30,000–39,999 | 201 | 42 | 7 | 47 | 6,820,414 | 1,467,445 | 247,021 | 1,587,464 |
| 40,000–49,999 | 87 | 21 | 5 | 19 | 3,820,486 | 914,684 | 221,111 | 839,772 |
| 50,000 and over | 120 | 19 | 10 | 78 | 8,405,530 | 1,285,464 | 782,742 | 7,516,782 |
| Totals | 59,734 | 4,323 | 2,288 | 1,873 | 184,556,517 | 19,106,042 | 6,038,715 | 18,821,279 |
Twelve returns in Class I and 23 in Class IV were for amounts of £100,000 and over, the aggregate unimproved value of the former being £1,523,106 and of the latter £3,864,382. Class II had only one return, and Class III two returns, in the group “£100,000 and over.”
It was found impossible to distinguish in the statistics between urban and rural lands, or even to classify the land according to the use to which it is put. In the absence of information on these two points, the best classification possible is that on the basis of occupation of the taxpayer. Seven broad divisions according to occupation have accordingly been adopted, as follows: —
Farming and allied pursuits.
Professional.
Manufacturing and industrial.
Commerce and trade.
Banking, insurance, and finance.
Transportation.
Miscellaneous and unspecified.
While in general the land returned by those in the first six groups will be used for purposes indicated by the occupations of the taxpayers, there are bound to be exceptions, as, for instance, farm lands owned by financial institutions, or urban lands used as business premises though owned by farmers. Undoubtedly, however, group 7 covers much rural land, though it is impossible to even roughly estimate the proportion.
A summary of returns, taxpayers, and unimproved value of land for the various occupational groups is given: —
| LAND-TAX RETURNS.—OCCUPATIONS, 1924–25 AND 1925–26. | ||||||
|---|---|---|---|---|---|---|
| Occupational Group. | Number of Returns. | Number of Taxpayers. | Total Unimproved Value. | |||
| 1924–25. | 1925–26. | 1924–25. | 1925–26. | 1924–25. | 1925–26. | |
| £ | £ | |||||
| 1 | 37,979 | 38,423 | 26,814 | 25,684 | 139,066,878 | 144,220,469 |
| 2 | 3,317 | 3,394 | 2,467 | 2,372 | 6,162,095 | 6,632,003 |
| 3 | 3,238 | 3,308 | 2,615 | 2,586 | 8,789,712 | 8,788,516 |
| 4 | 4,295 | 4,381 | 3,436 | 3,323 | 16,033,885 | 16,316,290 |
| 5 | 29 | 63 | 25 | 50 | 2,092,625 | 2,338,714 |
| 6 | 465 | 455 | 399 | 381 | 880,045 | 804,685 |
| 7 | 17,260 | 18,194 | 15,409 | 15,667 | 48,563,215 | 49,421,876 |
| Totals | 66,583 | 68,218 | 51,165 | 50,063 | 221,588,455 | 228,522,553 |
Well over 50 per cent. of returns and unimproved value are seen to fall in group 1, while group 7 (which, as stated above, covers a proportion of farm land) has four times as many returns and three times as much unimproved value as group 4, which ranks third in both respects. The proportion of returns which are assessed for tax is least in groups 1 and 2, but in spite of the position occupied by group 1 in this respect (due, of course, to a considerable proportion of farmers being either small owners or having their lands comparatively heavily mortgaged) this group actually ranks second in average unimproved value. The banking, insurance, and finance group has easily the highest average of unimproved value, an average almost ten times as high as that shown by the farming group, and more than eleven times the average for all returns. The 1925–26 averages for the various occupational groups are:—
| Occupational Group. | Average per Return. |
|---|---|
| £ | |
| 1 | 3,754 |
| 2 | 1,954 |
| 3 | 2,657 |
| 4 | 3,724 |
| 5 | 37,122 |
| 6 | 1,769 |
| 7 | 2,716 |
| Total | 3,350 |
In the next table a double classification is made for the year 1925–26, the returns and unimproved value for each occupational group being further subdivided according to class:—
| LAND-TAX RETURNS.—OCCUPATION BY CLASS, 1925–26. | ||||||||
|---|---|---|---|---|---|---|---|---|
| Occupational Group. | Number of Returns. | Total Unimproved Value. | ||||||
| Class I. | Class II. | Class III. | Class IV. | Class I. | Class II. | Class III. | Class IV. | |
| £ | £ | £ | £ | |||||
| 1 | 35,870 | 613 | 1,867 | 73 | 134,385,225 | 3,577,696 | 5,153,283 | 1,104,265 |
| 2 | 3,336 | 24 | 20 | 14 | 6,336,169 | 98,114 | 31,433 | 166,287 |
| 3 | 2,632 | 26 | 29 | 621 | 4,480,830 | 52,782 | 52,973 | 4,201,931 |
| 4 | 3,804 | 30 | 18 | 529 | 9,710,933 | 103,405 | 24,592 | 6,477,360 |
| 5 | 28 | .. | .. | 35 | 103,466 | .. | ..2,235,248 | |
| 6 | 417 | 3 | 3 | 32 | 517,758 | 2,280 | 9,242 | 275,405 |
| 7 | 13,647 | 3,627 | 351 | 569 | 29,022,136 | 15,271,765 | 767,192 | 4,360,783 |
| Totals | 59,734 | 4,323 | 2,288 | 1,873 | 184,556,517 | 19,106,042 | 6,038,715 | 18,821,279 |
The companies are, as might be expected, proportionately highest in the groups covering banking, insurance, and finance, and the manufacturing and industrial pursuits, the latter closely followed by commercial and trading occupations. The effect of the inclusion of the companies in the statistics is well seen from a comparison of the average unimproved value for the various groups as between Class I (persons and firms) and Class IV (companies). The figures for 1925–26 are: —
| Occupational Group. | Average Unimproved Value. | |
|---|---|---|
| Class I. | Class IV | |
| £ | £ | |
| 1 | 3,746 | 15,127 |
| 2 | 1,899 | 11,878 |
| 3 | 1,702 | 6,766 |
| 4 | 2,553 | 12,245 |
| 5 | 3,695 | 63,864 |
| 6 | 1,242 | 8,606 |
| 7 | 2,127 | 7,664 |
| Totals | 3,090 | 10,049 |
Full details of amount of unimproved value for each of the twenty-eight divisions made by the double classification of occupation by class will be found in the Miscellaneous Statistical Report issued by the Census and Statistics Office. For the purposes of this section the figures for only the four principal occupational groups, without distinction as to class, can be given.
| LAND-TAX RETURNS.—OCCUPATION BY AMOUNT, 1925–26. | ||||||||
|---|---|---|---|---|---|---|---|---|
| Amount. | Number of Returns. | Total Unimproved Value. | ||||||
| 1. Farming. | 3. Manufacturing and Industrial. | 4. Commerce and Trade. | 7. Miscellaneous. | 1. Farming. | 3.Manufacturing and Industrial. | 4. Commerce and Trade. | 7. Miscellaneous. | |
| £ £ | £ | £ | £ | £ | ||||
| Under 500 | 67 | 7 | 7 | 66 | 19,006 | 2,560 | 2,311 | 19,465 |
| 500– 599 | 1,511 | 343 | 324 | 1,701 | 842,503 | 191,231 | 182,857 | 976,580 |
| 600– 699 | 2,129 | 411 | 460 | 2,229 | 1,364,352 | 262,596 | 291,276 | 1,422,672 |
| 700– 799 | 1,890 | 318 | 381 | 1,696 | 1,104,037 | 236,242 | 282,435 | 1,255,375 |
| 800– 899 | 1,743 | 226 | 322 | 1,282 | 1,465,247 | 189,738 | 270,373 | 1,076,604 |
| 900— 999 | 1,557 | 176 | 233 | 1,026 | 1,467,390 | 166,106 | 219,843 | 965,208 |
| 1,000– 1,999 | 10,696 | 934 | 1,149 | 4,812 | 15,346,879 | 1,290,019 | 1,597,991 | 6,643,420 |
| 2,000– 2,499 | 3,382 | 182 | 267 | 1,088 | 7,525,232 | 404,315 | 590,908 | 2,407,195 |
| 2,500– 2,999 | 2,451 | 145 | 199 | 679 | 6,696,933 | 396,966 | 537,130 | 1,849,283 |
| 3,000– 3,999 | 3,435 | 148 | 245 | 925 | 11,843,723 | 511,565 | 852,300 | 3,159,894 |
| 4,000– 4,999 | 2,227 | 108 | 149 | 584 | 9,932,034 | 480,034 | 666,637 | 2,590,205 |
| 5,000– 5,999 | 1,578 | 59 | 103 | 412 | 8,613,082 | 324,069 | 566,284 | 2,254,522 |
| 6,000– 6,999 | 1,128 | 45 | 76 | 298 | 7,282,522 | 287,270 | 491,657 | 1,920,269 |
| 7,000– 7,999 | 797 | 35 | 58 | 271 | 5,964,256 | 259,242 | 431,920 | 2,024,484 |
| 8,000– 8,999 | 599 | 9 | 45 | 149 | 5,067,773 | 76,121 | 380,014 | 1,254,861 |
| 9,000– 9,999 | 463 | 23 | 43 | 135 | 4,390,163 | 215,899 | 432,188 | 1,280,378 |
| 10,000–14,999 | 1,356 | 50 | 134 | 332 | 16,360,703 | 612,269 | 1,615,628 | 4,416,391 |
| 15,000–19,999 | 608 | 30 | 49 | 193 | 10,409,351 | 500,327 | 852,880 | 2,745,483 |
| 20,000–29,999 | 430 | 30 | 58 | 167 | 10,416,230 | 732,606 | 1,410,690 | 4,055,414 |
| 30,000–39,999 | 183 | 10 | 26 | 69 | 6,199,382 | 344,046 | 852,542 | 2,411,277 |
| 40,000–49,999 | 76 | 4 | 12 | 37 | 3,347,084 | 171,752 | 533,521 | 1,620,061 |
| 50,000–99,999 | 102 | 12 | 29 | 40 | 6,427,923 | 816,148 | 1,922,752 | 2,671,046 |
| 100,000 and over | 15 | 3 | 9 | 3 | 1,834,664 | 317,395 | 1,332,153 | 401,689 |
| Totals | 38,123 | 3,308 | 4,381 | 18,194 | 144,220,469 | 8,788,516 | 16,316,290 | 49,421,876 |
Group 5 (banking, insurance, and finance), which is not included in the above table, is noteworthy on account of the high average unimproved value of land shown by the 63 returns classified in this group. In 7 of the 63 cases the unimproved value was £100,000 or over, in 11 £50,000 or over, and in 19 £10,000 or over. The professional group had only 2 cases, and the transport group only 1 case, where the unimproved value exceeded £50,000.
It is interesting to compare, as between the different groups, the percentage of cases where the unimproved value was under £2,500 (the limit of the ordinary exemption), and the corresponding percentage where the unimproved value was £10,000 or over. A wide range is disclosed by the following figures for the year 1925–26, the most noticeable feature being the extreme variation from the average in the case of the banking, insurance, and finance group: —
| LAND-TAX RETURNS.—CASES UNDER £2,500 AND OVER £10,000, 1925–26. | ||||||||
|---|---|---|---|---|---|---|---|---|
| Occupational Group. | Under £2,500. | £10,000 and over. | ||||||
| Cases. | Total Unimproved Value. | Cases. | Total Unimproved Value. | |||||
| Number. | Percent. of Total. | Amount. | Percent. of Total. | Number. | Per Cent. of Total. | Amount | Per Cent. of Total. | |
| £ | £ | |||||||
| 1 | 22,975 | 60 | 129,434,646 | 20 | 2,770 | 7 | 54,995,337 | 38 |
| 2 | 2,840 | 84 | 2,923,125 | 44 | 77 | 2 | 1,571,595 | 24 |
| 3 | 2,597 | 79 | 2,742,807 | 31 | 139 | 4 | 3,494,543 | 40 |
| 4 | 3,143 | 72 | 3,437,994 | 21 | 317 | 7 | 8,520,166 | 52 |
| 5 | 27 | 43 | 30,127 | 1 | 19 | 30 | 2,210,907 | 95 |
| 6 | 399 | 88 | 381,368 | 47 | 8 | 2 | 196,624 | 24 |
| 7 | 13,900 | 76 | 14,766,619 | 30 | 841 | 5 | 18,321,361 | 37 |
| Totals | 45,881 | 67 | 53,716,686 | 24 | 4,171 | 6 | 89,310,533 | 39 |
Attention need scarcely be drawn to the high proportion of small holdings, the low proportion (numerically) of the more valuable holdings, and the high percentage of the total unimproved value represented by holdings over the £10,000 mark.
As shown in Section XXIIIB of this book, certain deductions and exemptions are provided in the taxation of land. An owner of land the unimproved value of which does not exceed £1,500 is allowed an exemption of £500, and where the unimproved value lies between £1,500 and £2,500 there is a similar exemption, diminished, however, by £1 for every £2 over the £1,500 mark, so that no exemption under this head is allowed when £2,500 is reached. This exemption is that here referred to as the “ordinary” exemption.
Where the land is subject to a registered mortgage an alternative scale is provided —viz., £10,000 in cases where the unimproved value does not exceed that amount, the exemption being diminished by £2 for every £1 above the margin of £10,000 of unimproved value, and disappearing altogether at £15,000. Where the capital value of the mortgage is less than the amount of deduction provided, such capital value is deductible instead.
In lieu of the ordinary and mortgage exemptions, the Commissioner of Taxes has discretionary powers to grant relief in certain specified cases of hardship.
The total exemptions granted in 1925–26 aggregated £83,161,383, or 36 per cent. of the total unimproved value. No less a sum than £69,312,432 (83 per cent. of the total exemptions) was in respect of the mortgage exemption, and practically the whole of the remainder came under the heading of ordinary exemption. Only £168,275 exemption on account of hardship was allowed, all except £5,000 of this being in respect of holdings under £6,000 in unimproved value.
The following table summarizes for 1924–25 and 1925–26 the exemptions granted in respect of each of the four classes of taxpayers: —
| LAND-TAX RETURNS.—EXEMPTIONS BY CLASSES, 1924–25 AND 1925–26. | ||||||||
|---|---|---|---|---|---|---|---|---|
| Class. | 1924–25. | 1925–26. | Percentage of Total Exemption to Total Unimproved Value. | |||||
| Ordinary. | Mortgage. | Hardship. | Ordinary. | Mortgage. | Hardship. | 1924–25. | 1925–26. | |
| £ | £ | £ | £ | £ | £ | |||
| I | 12,278,126 | 53,865,683 | 150,000 | 11,816,568 | 64,616,799 | 148,079 | 37 | 41 |
| IT | 894,301 | 2,202,559 | 19,192 | 897,137 | 2,493,387 | 20,196 | 16 | 18 |
| III | 861,868 | 36,380 | .. | 736,908 | 54,201 | .. | ..14 | 13 |
| IV | 210,428 | 1,876,540 | .. | 220,063 | 2,148,045 | .. | 12 | 13 |
| Totals | 14,244,723 | 57,981,162 | 169,192 | 13,670,676 | 69,312,432 | 168,275 | 33 | 36 |
The mortgage exemption accounts for the whole of the increase in 1925–26 as compared with the previous year; indeed, the totals recorded for the other two heads actually show decreases. As the present scale of exemptions was in force for both years, the increase of over £11,000,000 in mortgage exemptions is apparently wholly attributable to the large increase in mortgages recorded for the two years.
An increase in mortgage exemptions should, in the normal course of events, cause a reduction in the ordinary exemptions for holdings under £2,500. An unencumbered holding of an unimproved value of £1,500, for instance, would be exempted to the extent of £500 in respect of the ordinary exemption. If it became mortgaged to the extent of £750, a mortgage exemption of £750 would take the place of the former ordinary exemption of £500. Presumably the decrease in the ordinary exemption totals for 1925–26 is accounted for in this way.
The general class of persons and firms not only received the great bulk of the total exemption, but, owing to the generally smaller holdings in this class, also have a much higher proportionate remission.
It will be seen from the next table that among the occupational groups, the banking, insurance, and finance group has a much lower percentage of exemptions than the other groups, on account of its high average unimproved value.
| LAND-TAX RETURNS.—EXEMPTIONS BY OCCUPATIONS, 1924–25 AND 1925–26. | ||||||||
|---|---|---|---|---|---|---|---|---|
| Occupational Group. | 1924–25. | 1925–26. | Percentage of Total Exemption to Total Unimproved Value. | |||||
| Ordinary. | Mortgage. | Hardship. | Ordinary. | Mortgage. | Hardship. | 1924–25. | 1925–26. | |
| £ | £ | £ | £ | £ | £ | |||
| 1 | 6,284,379 | 44,209,702 | 54,777 | 5,657,994 | 52,694,234 | 49,647 | 36 | 40 |
| 2 | 869,960 | 1,903,556 | .. | 826,739 | 2,326,499 | 1,573 | 45 | 48 |
| 3 | 897,011 | 1,618,663 | .. | 881,359 | 1,956,919 | .. | 29 | 32 |
| 4 | 1,032,116 | 3,156,269 | .. | 997,128 | 3,696,746 | .. | 26 | 29 |
| 5 | 1,500 | 11,916 | .. | 7,922 | 44,500 | .. | 1 | 2 |
| 6 | 151,348 | 149,778 | .. | 145,097 | 185,190 | .. | 34 | 41 |
| 7 | 5,008,409 | 6,931,278 | 114,415 | 5,154,437 | 8,408,344 | 117,055 | 25 | 28 |
| Totals | 14,244,723 | 57,981,162 | 169,1,92 | 13,670,676 | 69,312,432 | 168,275 | 33 | 36 |
It is interesting to compare the relative incidence of the ordinary and mortgage exemptions over the various groups. In the farming group the figures for 1925–26 show over £9 of mortgage exemption for every £1 of ordinary exemption, as compared with under £7 in the banking, insurance, and finance group, under £4 in the commerce and trade group, between £2 and £3 in the professional and the manufacturing and industrial groups, and between £1 and £2 in the other two groups. The general average shows slightly over £5 of mortgage exemption per £1 of ordinary exemption in 1925–26, as compared with just under £4 in the previous year.
In each of the seven groups the aggregate mortgage exemption granted in 1925–26 is substantially higher than in 1924–25. Apart from group 5 (where the number of returns in 1925–26 was double that for 1924–25) only group 7 shows an increase in ordinary exemptions, and the increase in this case is not commensurate with the increase in the number of returns covered.
A comparison between the two years on the basis of amount of unimproved value, as in the next table, shows that, with the solitary exception of the group £500–£599, there was in each case a fall in the amount of ordinary exemption in the later year, while every group showed a pronounced increase in the mortgage exemption. These figures are illuminating, and throw valuable light on one aspect of the mortgage question.
| LAND-TAX RETURNS.—EXEMPTIONS BY UNIMPROVED VALUE, 1924–25 AND 1925–26. | ||||||||
|---|---|---|---|---|---|---|---|---|
| Amount of Unimproved Value. | 1924–25. | 1923–26. | Percentage of Total Exemption to Total Unimproved Value. | |||||
| Ordinary. | Mortgage. | Ordinary. | Mortgage. | Hardship. | 1924–25. | 1925–26. | ||
* Not available. | ||||||||
| £ £ | £ | £ | £ | £ | £ | £ | ||
| 500– 599 | 1,811,637 | 266,767 | 1,150 | 1,859,846 | 350,874 | 2,664 | 90 | 91 |
| 600– 699 | 2,323,022 | 550,501 | 3,170 | 2,312,077 | 713,697 | 9,396 | 81 | 82 |
| 700– 799 | 1,809,177 | 672,166 | 8,892 | 1,766,028 | 811,413 | 10,872 | 73 | 74 |
| 800– 899 | 1,438,499 | 711,365 | 6,733 | 1,392,408 | 863,079 | 3,718 | 68 | 69 |
| 900– 999 | 1,126,669 | 741,059 | 3,750 | 1,104,324 | 910,393 | 54,845 | 64 | 68 |
| 1,000– 1,999 | 5,243,017 | 9,295,931 | 64,907 | 4,884,271 | 10,443,550 | 28,465 | 55 | 58 |
| 2,000– 2,499 | 358,878 | 9,466,527 | 38,040 | 329,922 | 5,317,413 | 17,290 | 48 | 50 |
| 2,500– 2,999 | .. | 5,130,512 | 21,165 | 52 | ||||
| 3,000– 3,999 | .. | 8,088,584 | 19,550 | .. | 8,647,782 | 8,500 | 49 | 51 |
| 4,000– 4,999 | .. | 6,161,659 | 8,500 | .. | 7,696,790 | 3,500 | 48 | 55 |
| 5,000– 5,999 | .. | 5,034,946 | 14,500 | .. | 6,279,342 | 2,500 | 45 | 52 |
| 6,000– 6,999 | .. | .. | 4,266,604 | .. | 5,274,488 | .. | 45 | 52 |
| 7,000– 7,999 | .. | 3,250,844 | .. | .. | 4,470,178 | 2,500 | 40 | 50 |
| 3,000– 8,999 | .. | 2,311,570 | .. | .. | 3,345,026 | .. | 35 | 48 |
| 9,000– 9,999 | .. | 2,226,894 | .. | .. | 3,059,630 | .. | 36 | 47 |
| 10,000–14,999 | .. | 4,930,575 | .. | .. | 5,933,612 | .. | * | 26 |
The percentage of exemptions, which incidentally was higher throughout in 1925–26 than in 1924–25, remains very high right down to the £10,000 mark.
The operation of the various exemptions had the effect, in 1925–26, of reducing the aggregate unimproved value of £228,522,553 to a taxable balance of £145,371,170, the latter total representing 64 per cent. of the former. The percentage of taxable balance to unimproved value is readily ascertainable for the individual classes, occupational groups, and unimproved-value categories by simply subtracting from 100 the figure showing the corresponding percentage of exemption. The percentage of taxable balance to unimproved value in 1925–26 ranged from 9 in the case of holdings between £500 and £600 to 74 for holdings between £10,000 and £15,000, and, of course, 100 thereafter. Among the occupational groups, the extremes were 52 per cent.—for the professional group—and 98 per cent.—for the banking, insurance, and finance group. Of the four classes, persons and firms had a much smaller percentage (59) of taxable balance than the other three, which had 82, 87, and 87 per cent., respectively.
A progressive scale of land-tax has been in force in New Zealand for several years. At the present time the basic rate is 1d. in the £1 of taxable balance, this rate applying where the taxable balance does not exceed £1,000. The rate after the first £1,000 s increased by ½0000d. for every pound in excess of £1,000, up to a maximum of 7 17/20d. A deduction of 5 per cent. from the tax computed according to these scale rates was in force during both years covered by the statistics.
The total tax assessed in respect of the returns covered by the inquiry was £1,189,689 in 1924–25 and £1,141,643 in 1925–26. These totals may be compared with amounts of £1,335,251 and £1,266,659 actually collected during the corresponding years. As explained earlier, the statistical inquiry did not cover the complete returns for the respective years.
A comparison of total unimproved value, taxable balance, and tax assessed for the two years is given by classes in the following table: —
| LAND-TAX ASSESSED.—BY CLASSES, 1924–25 AND 1925–26. | ||||||
|---|---|---|---|---|---|---|
| Class. | 1924–25. | 1925–26. | ||||
| Unimproved Value. | Taxable Balance. | Tax assessed. | Unimproved Value. | Taxable Balance. | Tax assessed. | |
| £ | £ | £ | £ | £ | £ | |
| I | 178,163,013 | 111,869,204 | 816,925 | 184,556,517 | 107,975,071 | 763,167 |
| II | 19,184,649 | 16,068,597 | 127,029 | 19,106,042 | 15,695,322 | 122,109 |
| III | 6,275,373 | 5,377,125 | 19,736 | 6,038,715 | 5,247,606 | 18,999 |
| IV | 17,965,420 | 15,878,452 | 225,999 | 18,821,279 | 16,453,171 | 237,368 |
| Totals | 221,588,455 | 149,193,378 | 1,189,689 | 228,522,553 | 145,371,170 | 1,141,643 |
A remarkable difference is apparent as between Class IV (companies) and Class I (persons and firms). Whereas the latter showed a somewhat higher unimproved value, but a substantially lower taxable balance and amount of tax assessed, in 1925–26 than in 1924–25, the former, which also showed a slightly higher unimproved value in 1925–26, showed an almost proportionately higher taxable balance and tax. The tax assessed in Class I in 1925–26 represented 14s. 2d. in every £100 of taxable balance, and 8s. 3d. in every £100 of unimproved value, as compared with corresponding proportions of £1 8s. 10d. and £1 5s. 3d. in the case of the companies. Again, the average tax per return was under £13 in the case of persons and firms, and nearly £127 in the case of companies.
A table similar in term to the above, and showing the figures for the various occupational groups, is now given. A comparison between the two years gives similar results for each group—viz., a lower ratio of taxable balance and tax assessed to unimproved value in 1925–26 than in 1924–25.
| LAND-TAX ASSESSED.—BY OCCUPATIONS, 1924–25 AND 1925–26. | ||||||
|---|---|---|---|---|---|---|
| Occupational Group. | 1924–25. | 1925–26. | ||||
| Unimproved Value. | Taxable Balance. | Tax assessed. | Unimproved Value. | Taxable Balance. | Tax assessed. | |
| £ | £ | £ | £ | £ | £ | |
| 1 | 139,066,878 | 88,518,020 | 663,483 | 144,220,469 | 85,818,594 | 622,682 |
| 2 | 6,162,095 | 3,388,579 | 18,743 | 6,632,003 | 3,477,192 | 24,208 |
| 3 | 8,789,712 | 6,274,038 | 58,697 | 8,788,516 | 5,950,238 | 52,011 |
| 4 | 16,033,885 | 11,845,500 | 122,940 | 16,316,290 | 11,622,416 | 124,435 |
| 5 | 2,092,625 | 2,079,209 | 57,327 | 2,338,714 | 2,286,292 | 60,131 |
| 6 | 880,045 | 578,919 | 4,049 | 804,685 | 474,398 | 3,295 |
| 7 | 48,563,215 | 36,509,113 | 264,450 | 49,421,876 | 35,742,040 | 254,881 |
| Totals | 221,588,455 | 149,193,378 | 1,189,689 | 228,522,553 | 145,371,170 | 1,141,643 |
To readily compare the incidence of taxation over the various occupational groups it is desirable to compute averages, as in the following table:—
| LAND-TAX ASSESSED.—AVERAGES BY OCCUPATIONS, 1925–26. | ||||||
|---|---|---|---|---|---|---|
| Occupational Group. | Average Tax assessed. | |||||
| Per Return. | Par Taxpayer. | Per £100 of Unimproved Value. | Per £100 of Taxable Balance. | |||
| £ | £ | s. | d. | s. | d. | |
| 1. Farming, &c. | 16 | 24 | 8 | 8 | 14 | 6 |
| 2. Professional | 7 | 10 | 7 | 4 | 13 | 11 |
| 3. Manufacturing and industrial | 16 | 20 | 11 | 10 | 17 | 6 |
| 4. Commerce and trade | 28 | 37 | 15 | 3 | 21 | 5 |
| 5. Banking, insurance, and finance | 954 | 1,203 | 51 | 5 | 52 | 7 |
| 6. Transportation | 7 | 9 | 8 | 2 | 13 | 11 |
| 7. Miscellaneous | 14 | 16 | 10 | 4 | 14 | 3 |
| Totals | 17 | 23 | 10 | 0 | 15 | 8 |
The figures give, from still another aspect, an idea of the high average value of land owned by the banking, insurance, and finance group relatively to other groups. The important farming group occupies a position in the table which coincides fairly closely with the general average.
The next and final table shows, similarly to the above, the average tax figures for holdings of the various categories on the basis of amount of unimproved value. The averages move comparatively slowly until the larger amounts are reached, when they rise steeply, a position clue partly to the higher value itself, partly to a reduction in the proportion of exemption and the ultimate disappearance of the exemption, and partly to the progressive scale of taxation in force.
| LAND-TAX ASSESSED.—BY AMOUNT OF UNIMPROVED VALUE, 1925–26. | ||||||||||||
|---|---|---|---|---|---|---|---|---|---|---|---|---|
| Amount of Unimproved Value. | Taxable Balance. | Tax assessed. | Average Tax assessed. | |||||||||
| Per Return. | Per Taxpayer. | Per £100 of Unimproved Value. | Per £100 of Taxable Balance. | |||||||||
| £ £ | £ | £ | £ | s. | d. | £ | s. | d. | s. | d. | s, | d. |
| Under 500 | 8,794 | 31 | 0 | 4 | 0 | 0 | 16 | 9 | 1 | 4 | 7 | 1 |
| 500– 599 | 223,955 | 868 | 0 | 4 | 0 | 0 | 5 | 3 | 0 | 9 | 7 | 9 |
| 600– 699 | 668,188 | 2,615 | 0 | 9 | 0 | 0 | 11 | 1 | 1 | 5 | 7 | 10 |
| 700– 799 | 889,932 | 3,469 | 0 | 14 | 10 | 0 | 18 | 10 | 2 | 0 | 7 | 10 |
| 800– 899 | 1,000,052 | 3,913 | 10 | 1 | 1 | 6 | 1 | 2 | 5 | 7 | 10 | |
| 900– 999 | 1,018,575 | 4,012 | 1 | 4 | 11 | 1 | 13 | 8 | 2 | 8 | 7 | 11 |
| 1,000– 1,999 | 11,025,488 | 42,958 | 2 | 5 | 11 | 3 | 5 | 6 | 3 | 3 | 7 | 10 |
| 2,000– 2,499 | 5,675,238 | 22,766 | 4 | 9 | 1 | 6 | 13 | 7 | 4 | 0 | 8 | 0 |
| 2,500– 2,999 | 4,692,333 | 19,488 | 5 | 8 | 1 | 8 | 8 | 3 | 4 | 0 | 8 | 3 |
| 3,000– 3,999 | 8,188,612 | 34,629 | 7 | 1 | 6 | 10 | 14 | 7 | 4 | 1 | 8 | 5 |
| 4,000– 4,999 | 6,373,657 | 27,890 | 8 | 16 | 6 | 13 | 9 | 1 | 4 | 0 | 8 | 9 |
| 5,000– 5,999 | 5,853,538 | 26,711 | 12 | 0 | 6 | 17 | 13 | 7 | 4 | 5 | 9 | 2 |
| 6,000– 6,999 | 4,946,910 | 23,110 | 14 | 11 | 7 | 20 | 10 | 10 | 4 | 6 | 9 | 4 |
| 7,000– 7,999 | 4,419,522 | 21,280 | 17 | 18 | 3 | 25 | 3 | 8 | 4 | 9 | 9 | 8 |
| 8,000– 8,999 | 3,642,902 | 18,204 | 27 | 0 | 3 | 29 | 15 | 10 | 5 | 2 | 10 | 0 |
| 9,000– 9,999 | 3,418,657 | 17,698 | 25 | 17 | 6 | 34 | 0 | 8 | 5 | 5 | 10 | 4 |
| 10,000–14,999 | 17,459,088 | 99,502 | 52 | 2 | 5 | 52 | 10 | 8 | 8 | 1 | 11 | 5 |
| 15,000–19,999 | 14,911,580 | 104,517 | 115 | 12 | 4 | 115 | 12 | 4 | 14 | 0 | 14 | 0 |
| 20,000–29,999 | 17,045,234 | 142,829 | 209 | 9 | 2 | 203 | 9 | 2 | 16 | 9 | 16 | 9 |
| 30,000–39,999 | 10,122,344 | 101,325 | 341 | 3 | 3 | 341 | 3 | 3 | 20 | 0 | 20 | 0 |
| 40,000–49,999 | 5,796,053 | 70,466 | 533 | 16 | 8 | 533 | 16 | 8 | 24 | 4 | 24 | 4 |
| 50,000–99,999 | 12,255,547 | 199,782 | 1,057 | 0 | 11 | 1,057 | 0 | 11 | 32 | 7 | 32 | 7 |
| 100,000 and over | 5,734,971 | 153,580 | 4,041 | 11 | 7 | 4,041 | 11 | 7 | 53 | 7 | 53 | 7 |
| Totals | 145,371.170 | 1,141,643 | 16 | 14 | 8 | 22 | 16 | 1 | 10 | 0 | 15 | 8 |
Table of Contents
NO complete statistics of annual income are available for New Zealand, nor has any official investigation of the total income of the Dominion been attempted. Very valuable data, however, exist in regard to incomes of those furnishing returns to the Commissioner of Taxes for the purpose of income-tax assessment, and statistics of incomes have been compiled from these at various times in the past by the Land and Income Tax Department. A system of annual statistics on the subject was inaugurated in 1923, and the detailed results have since been published by the Census and Statistics Office in one of its annual statistical reports.
As, with certain exceptions, the annual returns of income are not required where the income is less than £250 (and are generally not furnished where the income is between £250 and £300), these returns are confined to a comparatively small minority of the population, and do not permit of statistics being compiled covering the great majority of incomes. This deficiency has been remedied to a great extent by the inclusion of a question in the schedule used at the census of 1926 asking in the case of each individual in the Dominion for an indication of the “income category” within which he or she lies. These income categories were adopted in preference to actual income to obviate as far as possible objections to the question as being inquisitorial. They provided for a distinguishing letter being shown according to whether the annual income was—
| Nil. |
|---|
| Under £52. |
| £52 and under £156. |
| £156 and under £208. |
| £208 and under £260. |
| £260 and under £312. |
| £312 and under £364. |
| £364 and over. |
At the appropriate stage of the census tabulation, statistics will be compiled showing the distribution of the population in the various income categories, according to sex, age, occupation, occupational status, number of dependants, &c. Taken in conjunction with the income statistics already in existence, the census data will also enable a close approximation of the national income to be arrived at.
Information concerning the system of income-tax in New Zealand is given in Section XXIIIB of this book. To permit of a proper understanding of the statistics given in the present section it is as well to briefly recapitulate the system, as in the following paragraphs:—
Income-tax is payable on the full incomes of registered companies and of absentees, and in other cases on incomes in excess of £300 per annum. Between £600 and £900 the exemption is reduced by £1 for every £1 above £600, and no exemption is allowed for incomes above £900. An absentee is defined as a person whose home has not been in New Zealand during any part of the income year.
An exemption of 5 per cent. of the capital value of land from which the income is derived is provided. A deduction of £50 is made from assessable income for each child or grandchild under eighteen years of age who is dependent on the taxpayer, and amounts up to £50 contributed towards the support of the taxpayer's widowed mother are also deductible from income.
The remaining class of exemptions is in respect of premium payments on insurances effected by the taxpayer on his own life, and of payments to the National Provident Fund, a superannuation fund, or the insurance fund of a friendly society. Deductions under this head may not exceed 15 per cent. of the earned income or, where the total income does not exceed £2,000, 15 per cent., of total income.
Certain specified incomes are exempt from taxation, included among these since 1923–24 being practically all incomes derived from the direct use or cultivation of land.
Earned income, the tax on which is subject to a reduction of 10 per cent. up to a limit of income of £2,000, is defined as the salary or wages (including bonuses) received by the taxpayer in relation to his employment, and includes all income derived by a taxpayer (other than a company or local body) by reason of his personal exertions. The difference between the totals for earned income and assessable income represents income from sources not defined as “earned.”
Part of the statistical information given in this section (that relating to income-tax) more properly belongs to Section XXIIIB, but for reasons similar to those which apply in the case of the statistics of land holdings, it is preferable to treat the figures relating to incidence of tax with those showing the distribution of the incomes on which the tax is assessed.
It should be explained that the incomes returned in any year are those received during the previous year. The figures given throughout this section in respect of 1925–26 returns, for instance, relate approximately to incomes received during the twelve months ended 31st March, 1925.
Statistics have now been compiled for four years, and the following table briefly summarizes the main items of information for each of the four years:—
| SUMMARY, 1922–23 TO 1925–26. | ||||
|---|---|---|---|---|
| Item. | 1922–23. | 1923–24. | 1924–25. | 1925–26. |
* 5 per cent. of unimproved value. | ||||
| Number of returns | 92,106 | 74,750 | 79,551 | 80,369 |
| Number of taxpayers | 38,571 | 36,091 | 41,680 | 43,822 |
| £ | £ | £ | £ | |
| Earned income | 28,667,898 | 24,420,870 | 27,035,344 | 28,402,162 |
| Assessable income | 46,353,941 | 44,738,064 | 49,947,009 | 52,632,488 |
| Exemptions— | ||||
| 5 per cent. of capital value | 2,493,154* | 2,195,521 | 2,567,670 | 2,715,597 |
| Ordinary (under section 74) | 19,613,016 | 16,823,766 | 17,788,001 | 17,791,691 |
| Children, &c. | 2,164,753 | 2,033,275 | 2,238,389 | 2,315,990 |
| Life insurance premiums, &c. | 612,656 | 616,135 | 708,970 | 776,902 |
| Taxable balance | 21,470,362 | 23,069,367 | 26,643,979 | 29,052,308 |
| Tax assessed | 3,639,603 | 3,335,205 | 3,173,085 | 3,190,277 |
The figures for 1922–23 are not properly comparable with those for subsequent years, on account of income derived from the direct use and cultivation of land being (with certain insignificant exceptions) exempted from income-tax after that year. Nevertheless the inclusion of the figures for 1922–23 enables the effect of this exemption to he readily seen. It is of particular interest to note that, owing to the exclusion of this source of income in 1923–24, the amount of exemption in respect of the capital value of land in that year actually aggregated less than did the corresponding exemption in 1922–23, when the amount was on the basis of unimproved value. The fall in tax assessed, in spite of the increase in taxable balance, first as between 1922–23 and 1923–24 and then as between 1923–24 and 1924–25, is a testimony to the reductions in the rate of income-tax.
For the financial year 1925–26 returns received by the Commissioner of Taxes and showing any income totalled 80,369. Of these 2,922 were in respect of companies, 1,200 were furnished by non-resident traders, and 294 by agents for debenture-holders, the remaining 75,953 (94 ½ per cent. of the total) being in the general class of taxpayers, which includes absentees other than non-resident traders.
Of 75,953 persons in the general class dealt with, no fewer than 20,250 had an income of less than £300, and only 1,416 of these—absentees or trustees, or otherwise not entitled to exemption under section 74—were assessed for tax. Of 55,703 persons and firms with incomes of £300 or over, 38,111 were assessed as having to pay income-tax, the remaining 17,592 having no taxable balance left after the various exemptions and deductions had been taken into account.
Of the 2,922 companies covered by the statistics for 1925–26, 121 escaped taxation through the application of the capital-value exemption, the number of taxpayers in this class being 2,801. The whole of the 1,200 non-resident traders and of the 294 agents for debenture-holders were required to pay income-tax, no exemptions being applicable to these two classes.
A classification of returns and taxpayers on the basis of class is given in the following table for each of the four years for which statistics have been compiled:—
| RETURNS AND TAXPAYERS, BY CLASSES, 1922–23 TO 1925–26. | ||||||||
|---|---|---|---|---|---|---|---|---|
| Class. | 1922–23. | 1923–24. | 1924–25. | 1925–26. | ||||
| Returns | Taxpayers. | Returns | Taxpayers. | Returns | Tax-payers. | Returns | Taxpayers. | |
* Not grouped separately. | ||||||||
| I. Persons, firms, &c. | 89,075 | 35,574 | 71,113 | 32,523 | 75,328 | 37,584 | 75,953 | 39,527 |
| II. Companies | 2,164 | 2,130 | 2,483 | 2,414 | 2,762 | 2,635 | 2,922 | 2,801 |
| III. Agents for debenture-holders | * | * | 279 | 279 | 295 | 295 | 294 | 294 |
| IV. Non-resident traders | 867 | 867 | 875 | 875 | 1,166 | 1,166 | 1,200 | 1,200 |
| Totals | 92,106 | 38,571 | 74,750 | 36,091 | 79,551 | 41,680 | 80,369 | 43,822 |
The general class represents throughout the period the great majority of the returns, and it occupies a similar position in regard to taxpayers, though in this respect its proportion of the total is considerably less—viz. (in 1925–26), 90 per cent., as compared with the 94 ½ per cent. shown previously as its proportion of the returns. When attention is turned to aggregate assessable income, the percentage of this class to the total is still further reduced, being in 1925–26 only 75 per cent.
In the next table the total assessable income shown by the returns as classified above is given, together with the average per return in each class. The overwhelming superiority of the class covering companies is the most noticeable feature of the averages.
| ASSESSABLE INCOME, BY CLASSES, 1922–23 TO 1925–26. | ||||||||
|---|---|---|---|---|---|---|---|---|
| Class. | Aggregate. | Average. | ||||||
| 1922–23. | 1923–24. | 1921–25. | 1925–26. | 1922–23 | 1923–24 | 1924–25 | 1925–26 | |
*Not grouped separately. | ||||||||
| £ | £ | £ | £ | £ | £ | £ | £ | |
| I | 37,522,867 | 33,612,632 | 37,201,596 | 39,270,534 | 421 | 473 | 494 | 517 |
| II | 8,359,815 | 10,373,728 | 11,624,109 | 12,250,685 | 3,863 | 4,178 | 4,209 | 4,193 |
| III | * | 437,751 | 601,380 | 590,552 | * | 1,569 | 2,039 | 2,009 |
| IV | 471,259 | 313,953 | 519,924 | 520,717 | 544 | 359 | 446 | 438 |
| Totals | 46,353,941 | 44,738,064 | 49,947,009 | 52,632,488 | 503 | 599 | 628 | 655 |
In the compilation of the statistics a distinction is made as to the source from which the income is derived, incomes being divided into ten groups according to source, as follows: —
| Group No. | Source. |
|---|---|
| 0 | Salary or wages. |
| 1 | Professional occupations (on own account). |
| 2 | Commerce, trade, or business. |
| 3 | Industry or manufacture. |
| 4 | Farming. |
| 5 | Provision of transport or communication. |
| 6 | Building and construction. |
| 7 | Mining or extraction. |
| 8 | Investments and the like. |
| 9 | Provision of or engaging in entertainment, sport, or recreation. |
Actual figures as to the amount of income derived from various sources are not available on account of the fact that in a considerable proportion of cases income has been obtained from more than one source. The rule followed in such cases in compiling the statistics has been to include the whole income under the principal source from which it was derived. As an indication of the extent to which the figures are affected, attention may be drawn to the inclusion of approximately 4 per cent. of earned income in the total assessable income of the source “Investments and the like.”
Of the ten classes of source from which income is derived, source 0, “Salary or wages,” is the most important as regards number of incomes, number of taxpayers, amount of assessable income, and amount of earned income. It may he added that this source also leads in the matter of exemptions—so much so, in fact, that its total of £16,510,119 assessable income in 1925–26 shrank to a comparatively insignificant taxable balance of £4,675,545, which yielded only £222,185 of tax.
The following table shows the number of returns and of taxpayers classified according to source for each of the four years 1922–23 to 1925–26:—
| RETURNS AND TAXPAYERS, BY SOURCE OF INCOME, 1922–23 TO 1925–26. | ||||||||
|---|---|---|---|---|---|---|---|---|
| Source. | 1922–23. | 1923–24. | 1924–25. | 1925–26. | ||||
| Returns. | Tax-payers. | Returns. | Tax-payers. | Returns. | Taxpayers. | Returns. | Taxpayers. | |
| 0 | 37,583 | 16,400 | 36,333 | 15,092 | 37,288 | 16,869 | 37,144 | 18,434 |
| 1 | 2,824 | 2,222 | 2,951 | 2,191 | 3,214 | 2,486 | 3,467 | 2,709 |
| 2 | 14,277 | 7,212 | 15,792 | 7,733 | 17,273 | 9,278 | 17,425 | 8,886 |
| 3 | 1,340 | 1,034 | 1,300 | 1,032 | 1,485 | 1,147 | 1,454 | 1,138 |
| 4 | 19,613 | 2,894 | .. | .. | 397 | 200 | 624 | 400 |
| 5 | 478 | 249 | 591 | 276 | 680 | 376 | 746 | 411 |
| 6 | 955 | 514 | 1,071 | 517 | 1,390 | 758 | 1,432 | 880 |
| 7 | 70 | 51 | 66 | 38 | 126 | 75 | 138 | 73 |
| 8 | 14,796 | 7,817 | 16,555 | 9,164 | 17,610 | 10,441 | 17,856 | 10,835 |
| 9 | 170 | 148 | 91 | 48 | 88 | 50 | 83 | 56 |
| Totals | 92,106 | 38,571 | 74,750 | 36,091 | 79,551 | 41,680 | 80,369 | 43,822 |
Source 4, “Farming,” ranked second to source 0 in 1922–23 as regards number of returns. For the year 1923–24 income derived, from the direct use or cultivation of land was wholly exempted from income-tax, but the tax was reimposed in the following year in the case of Crown lands held as small grazing-runs or on pastoral lease, which would otherwise have escaped both land- and income-tax.
A classification of assessable income on the foregoing basis is next given, the average assessable income being also shown for each source:—
| ASSESSABLE INCOME, BY SOURCE, 1922–23 TO 1925–26. | ||||||||
|---|---|---|---|---|---|---|---|---|
| Source. | Aggregate. | Average. | ||||||
| 1922–23. | 1923–24. | 1924–25. | 1925–26. | 1922–23. | 1923.24. | 1924–25. | 1925–26. | |
| £ | £ | £ | £ | £ | £ | £ | £ | |
| 0 | 15,152,293 | 15,031,028 | 16,062,065 | 16,510,119 | 403 | 414 | 431 | 444 |
| 1 | 2,295,504 | 2,403,949 | 2,739,887 | 3,072,742 | 813 | 815 | 852 | 886 |
| 2 | 11,158,80712,805,764 | 14,799,074 | 15,749,987 | 782 | 811 | 857 | 904 | |
| 3 | 3,121,727 | 3,455,693 | 3,885,907 | 3,622,773 | 2,329 | 2,658 | 2,617 | 2,492 |
| 4 | 5,263,367 | .. | 296,503 | 551,187 | 268 | .. | 747 | 883 |
| 5 | 671,664 | 973,142 | 998,221 | 854,396 | 1,405 | 1,647 | 1,468 | 1,145 |
| 6 | 520,817 | 522,003 | 750,954 | 902,369 | 545 | 487 | 540 | 630 |
| 7 | 138,558 | 318,755 | 139,097 | 189,967 | 1,979 | 4,830 | 1,104 | 1,377 |
| 8 | 7,827,437 | 9,144,886 | 10,189,198 | 11,075,875 | 529 | 552 | 579 | 620 |
| 9 | 203,767 | 82,844 | 86,103 | 103,073 | 1,199 | 910 | 978 | 1,242 |
| Totals | 46,353,941 | 44,738,064 | 49,947,009 | 52,632,488 | 503 | 599 | 628 | 655 |
Source 0, “Salary or wages,” is seen to have the greatest aggregate, but the lowest average. Easily the highest average is shown for source 3, “Industry or manufacture.”
A third principle of classification followed in the compilation of the statistics of incomes and income-tax is according to size of income. An annual report published by the Census and Statistics Office gives full details of incomes of the various sizes in conjunction with source of income and class of taxpayer. These details cannot be repeated here, but the following table showing the number of returns and of taxpayers for the various categories in each of the last four years gives a good indication of the relative distribution of incomes over £300 per annum throughout the community.
| RETURNS AND TAXPAYERS, BY SIZE OF INCOMES, 1922–23 TO 1925–26. | ||||||||
|---|---|---|---|---|---|---|---|---|
| Size of Income.£ £ | 1922–23. | 1923–24. | 1924–25. | 1925–26. | ||||
| Returns. | Taxpayers. | Returns. | Taxpayers. | Returns. | Taxpayers. | Returns. | Taxpayers. | |
| Under 300 | 38,015 | 2,566 | 24,817 | 2,758 | 24,676 | 3,372 | 22,131 | 3,218 |
| 300– 399 | 23,204 | 9,464 | 20,205 | 7,645 | 21,226 | 8,535 | 21,042 | 7,632 |
| 400– 499 | 10,912 | 7,831 | 10,134 | 7,036 | 11,165 | 8,289 | 12,135 | 8,973 |
| 500– 599 | 6,012 | 5,252 | 5,561 | 4,966 | 6,051 | 5,434 | 6,792 | 6,123 |
| 600– 699 | 4,219 | 4,003 | 3,548 | 3,396 | 4,113 | 3,946 | 4,630 | 4,479 |
| 700– 799 | 2,294 | 2,198 | 2,198 | 2,143 | 2,558 | 2,511 | 2,842 | 2,780 |
| 800– 899 | 1,453 | 1,395 | 1,433 | 1,405 | 1,689 | 1,643 | 1,860 | 1,815 |
| 900– 999 | 975 | 944 | 1,025 | 1,005 | 1,212 | 1,189 | 1,348 | 1,321 |
| 1,000– 1,999 | 3,230 | 3,143 | 3,918 | 3,849 | 4,572 | 4,494 | 5,007 | 4,923 |
| 2,000– 2,999 | 902 | 892 | 892 | 879 | 1,064 | 1,050 | 1,231 | 1,217 |
| 3,000– 3,999 | 335 | 334 | 386 | 379 | 436 | 433 | 484 | 477 |
| 4,000– 4,999 | 154 | 152 | 162 | 160 | 221 | 220 | 244 | 244 |
| 5,000– 5,999 | 93 | 90 | 97 | 96 | 126 | 124 | 150 | 148 |
| 6,000– 6,999 | 61 | 61 | 61 | 61 | 71 | 71 | 90 | 90 |
| 7,000– 7,999 | 29 | 28 | 49 | 49 | 58 | 58 | 63 | 63 |
| 8,000– 8,999 | 29 | 29 | 31 | 31 | 40 | 39 | 39 | 39 |
| 9,000– 9,999 | 21 | 21 | 23 | 23 | 23 | 22 | 26 | 25 |
| 10,000–19,999 | 90 | 90 | 106 | 108 | 124 | 124 | 128 | 128 |
| 20,000–29,999 | 26 | 26 | 33 | 33 | 49 | 49 | 44 | 44 |
| 30,000–39,999 | 14 | 14 | 20 | 20 | 18 | 18 | 24 | 24 |
| 40,000–49,999 | 10 | 10 | 10 | 10 | 11 | 11 | 14 | 14 |
| 50,000 and over | 28 | 28 | 41 | 41 | 48 | 48 | 45 | 45 |
| Totals | 92,106 | 38,571 | 74,750 | 36,091 | 79,551 | 41,680 | 80,369 | 43,822 |
Only 36 per cent. of those with incomes between £300 and £400 were required to pay any income-tax in 1925–26. The proportion of taxpayers to returns rapidly increases and reaches 90 per cent. in the category £500–£599.
Of the 80,369 persons, companies, &c., dealt with in 1925–26, 22,131, or 27 ½ percent., had incomes of less than £300, their aggregate incomes being £4,456,714, or only 8 ½ per cent. of the total. Incomes under £1,000 aggregated £28,563,118, or 54 per cent. of the total, but represented 90 per cent. of the returns. Only 255 (less than ⅓ per cent. of those who furnished returns) showed incomes of £10,000 or over, but their total incomes amounted to £9,162,980, or 17 ½ per cent. of the grand total of £52,632,488.
Information as to aggregate incomes within the various categories is given in the next table. A column is added showing for 1925–26 separate figures for the general class of taxpayers (Class I).
It may be mentioned that, almost without exception, the average income in each group falls a little below the half-way mark of the group.
| AGGREGATE ASSESSABLE INCOME, BY SIZE OF INCOME, 1922–23 TO 1925–26. | |||||
|---|---|---|---|---|---|
| Size of Income. | Aggregate Assessable Income. | ||||
| 1922–23. | 1923–24. | 1924–25. | 1925–26. | ||
| Total. | Class I. | ||||
| £ £ | £ | £ | £ | £ | £ |
| Under 300 | 7,040,007 | 5,202,402 | 5,166,677 | 4,456,714 | 4,257,795 |
| 300–399 | 7,867,044 | 6,924,103 | 7,314,106 | 7,284,133 | 7,197,140 |
| 400–499 | 4,778,714 | 4,445,236 | 4,888,075 | 5,261,347 | 5,191,376 |
| 500–599 | 3,226,329 | 2,991,244 | 3,261,330 | 3,652,836 | 3,565,420 |
| 600–699 | 2,745,797 | 2,266,719 | 2,626,569 | 2,949,107 | 2,847,196 |
| 700–799 | 1,702,478 | 1,636,666 | 1,906,116 | 2,114,901 | 2,028,844 |
| 800–899 | 1,238,020 | 1,211,842 | 1,422,621 | 1,568,464 | 1,491,362 |
| 900–999 | 922,614 | 969,771 | 1,146,543 | 1,275,616 | 1,194,378 |
| 1,000–1,999 | 4,996,443 | 5,240,230 | 6,176,476 | 6,752,083 | 5,937,974 |
| 2,000–2,999 | 2,187,745 | 2,151,575 | 2,555,650 | 2,980,985 | 2,328,814 |
| 3,000–3,999 | 1,161,059 | 1,304,617 | 1,494,773 | 1,662,697 | 1,125,808 |
| 4,000–4,999 | 695,789 | 722,071 | 978,434 | 1,070,514 | 748,000 |
| 5,000–5,999 | 512,464 | 522,457 | 685,628 | 810,567 | 397,968 |
| 6,000–6,999 | 393,059 | 402,439 | 457,749 | 580,737 | 201,349 |
| 7,000–7,999 | 216,657 | 366,439 | 434,317 | 473,646 | 158,856 |
| 8,000–8,999 | 247,250 | 264,250 | 338,660 | 329,577 | 134,253 |
| 9,000–9,999 | 199,318 | 216,732 | 216,697 | 245,584 | 47,711 |
| 10,000–19,999 | 1,243,752 | 1,480,077 | 1,676,314 | 1,743,746 | 315,411 |
| 20,000–29,999 | 595,370 | 836,469 | 1,197,570 | 1,039,750 | 100,879 |
| 30,000–39,999 | 488,498 | 695,196 | 614,900 | 809,510 | 100,879 |
| 40,000–49,999 | 439,791 | 455,003 | 484,764 | 615,711 | 100,879 |
| 50,000 and over | 3,455,743 | 4,432,526 | 4,903,040 | 4,954,263 | 100,879 |
| Totals | 46,353,941 | 44,738,064 | 49,947,009 | 52,632,488 | 39,270,534 |
Class I represents 97 per cent. of aggregate assessable income in cases where the income is under £1,000, but only 4 ½ per cent. among incomes of £10,000 or over.
Of the gross assessable income of £52,632,488 in 1925–26, £28,402,162, or 54 per cent. of the total, ranked as earned income, and as such became entitled to a reduction of 10 per cent. in taxation. Earned income is, of course, practically confined to the general class of taxpayers, no part of the income of companies and of agents for debenture-holders, and only a very small proportion of that of non-resident traders, coming within the definition of earned income. A comparison of aggregate assessable income and earned income for the four years 1922–23 to 1925–26 is here given:—
| ASSESSABLE AND EARNED INCOME, BY CLASSES, 1922–23 TO 1925–26. | ||||||
|---|---|---|---|---|---|---|
| Year. | Persons and Firms. | Non-resident Traders. | Totals of all Classes. | |||
| Assessable Income. | Earned Income. | Assessable Income. | Earned Income. | Assessable Income. | Earned Income. | |
| £ | £ | £ | £ | £ | £ | |
| 1922–23 | 37,522,867 | 28,648,205 | 471,259 | 19,693 | 46,353,941 | 28,667,898 |
| 1923–24 | 33,612,632 | 24,410,999 | 313,953 | 9,871 | 44,738,064 | 24,420,870 |
| 1924–25 | 37,201,596 | 27,017,388 | 519,924 | 17,956 | 49,947,009 | 27,035,344 |
| 1925–26 | 39,270,534 | 28,376,760 | 520,717 | 25,402 | 52,632,488 | 28,402,162 |
The effect of the exemption after 1922–23 of income derived from the direct use or cultivation of the land is indicated by a comparison of the earned-income figures for 1922–23 and 1923–24. As a matter of fact, the earned income of the farming group in 1922–23 (£4,653,608) was somewhat greater than the difference between the two years. The distribution of earned income over the various sources, both absolutely and in proportion to assessable income, is shown in the next table.
| EARNED INCOME, BY SOURCE, 1922–23 TO 1925–26. | ||||||||
|---|---|---|---|---|---|---|---|---|
| Source. | Earned Income. | Proportion of Assessable Income. | ||||||
| 1922–23. | 1923–24. | 1924–25. | 1925–26. | 1922–23 | 1923–24 | 1924–25 | 1925–26 | |
| £ | £ | £ | £ | Per Cent. | Per Cent. | Per Cent. | Per Cent. | |
| 0 | 14,639,667 | 14,430,433 | 15,340,892 | 15,753,979 | 97 | 96 | 96 | 95 |
| 1 | 2,128,825 | 2,237,091 | 2,535,288 | 2,827,789 | 93 | 93 | 93 | 92 |
| 2 | 5,723,796 | 6,389,765 | 7,073,391 | 7,244,499 | 51 | 50 | 48 | 46 |
| 3 | 413,647 | 348,771 | 467,304 | 513,910 | 13 | 10 | 12 | 14 |
| 4 | 4,653,608 | .. | 259,049 | 496,180 | 88 | .. | 87 | 90 |
| 5 | 142,296 | 176,333 | 245,575 | 273,055 | 21 | 18 | 25 | 32 |
| 6 | 437,057 | 474,516 | 657,567 | 773,375 | 84 | 91 | 88 | 86 |
| 7 | 31,136 | 18,932 | 43,982 | 45,116 | 22 | 6 | 32 | 24 |
| 8 | 472,184 | 327,593 | 401,158 | 450,025 | 6 | 4 | 4 | 4 |
| 9 | 25,682 | 17,436 | 11,138 | 24,234 | 13 | 21 | 13 | 24 |
| Totals | 28,667,898 | 24,420,870 | 27,035,344 | 28,402,162 | 62 | 55 | 54 | 54 |
Source 0, “Salary or wages,” as might be expected, shows the highest percentage of earned income, the inability of this group to reach the 100 per cent. being due to the inclusion of incomes over £2,000 and also of amounts derived by salary or wage earners from other sources, principally saving-banks deposits and other investments. The tightening-up of the requirements to include interest on bank deposits and suchlike additions to income is at least partially responsible for the slight decrease in the proportion of earned income to assessable income which has occurred in this group and also in sources 1 (professional occupations on own account), 2 (commerce or trade), and 6 (building and construction). Source 8 (investments and the like) which might be expected to include no earned income, nevertheless shows a small percentage of such, this being due to the fact that the classification of each return is made on the basis of the source from which the income is principally derived.
The next table shows the amount of earned income included in the total assessable income for the various categories according to amount of assessable income:—
| EARNED INCOME BY AMOUNT OF ASSESSABLE INCOME, 1922–23 TO 1925–26. | ||||||||
|---|---|---|---|---|---|---|---|---|
| Amount of Assessable Income. | Earned Income. | Proportion of Assessable Income. | ||||||
| 1922–23. | 1923–24. | 1924–25. | 1925–26. | 1922–23 | 1923–24 | 1924–25 | 1925–26 | |
| £ £ | £ | £ | £ | £ | Per Cent. | Per Cent. | Per Cent. | Per Cent. |
| Under 300 | 5,649,439 | 3,860,010 | 3,831,942 | 3,210,186 | 80 | 74 | 74 | 72 |
| 300–399 | 6,881,174 | 5,844,982 | 6,161,472 | 6,134,203 | 87 | 84 | 84 | 84 |
| 400–499 | 4,016,569 | 3,488,315 | 3,819,069 | 4,173,808 | 84 | 78 | 78 | 80 |
| 500–599 | 2,506,282 | 2,192,526 | 2,415,335 | 2,736,398 | 78 | 73 | 74 | 75 |
| 600–699 | 2,096,882 | 1,576,232 | 1,857,311 | 2,080,222 | 76 | 70 | 71 | 71 |
| 700–799 | 1,196,761 | 1,081,489 | 1,252,778 | 1,449,065 | 70 | 66 | 66 | 69 |
| 800–899 | 817,443 | 768,459 | 912,506 | 1,009,105 | 66 | 63 | 64 | 64 |
| 900–999 | 606,309 | 575,190 | 690,075 | 796,254 | 66 | 59 | 60 | 62 |
| 1,000–1,999 | 2,888,993 | 2,852,450 | 3,365,986 | 3,793,140 | 58 | 54 | 54 | 56 |
| 2,000–2,999 | 993,010 | 960,184 | 1,139,434 | 1,391,974 | 45 | 45 | 45 | 47 |
| 3,000–3,999 | 410,695 | 455,814 | 542,064 | 584,802 | 35 | 35 | 36 | 35 |
| 4,000–4,999 | 220,021 | 192,768 | 351,398 | 406,067 | 32 | 27 | 36 | 38 |
| 5,000–5,999 | 119,561 | 119,187 | 194,104 | 185,644 | 23 | 23 | 28 | 23 |
| 6,000–6,999 | 67,849 | 112,664 | 120,847 | 97,469 | 17 | 28 | 26 | 17 |
| 7,000–7,999 | 29,856 | 50,564 | 86,495 | 54,534 | 14 | 14 | 20 | 12 |
| 8,000–8,999 | 20,325 | 53,490 | 84,450 | 53,929 | 8 | 20 | 25 | 16 |
| 9,000–9,999 | 19,909 | 46,139 | 27,133 | 1,149 | 10 | 21 | 13 | .. |
| 10,000–19,999 | 75,001 | 114,055 | 121,855 | 147,219 | 6 | 8 | 7 | 8 |
| 20,000 and over | 51,819 | 76,352 | 61,090 | 96,994 | 1 | 1 | 1 | 1 |
| Totals | 28,667,898 | 24,420,870 | 27,035,344 | 28,402,162 | 62 | 55 | 54 | 54 |
The proportion of earned income to assessable income falls rapidly as income increases, but the fall is not altogether steady, nor is it uniform as between one year and another. The lower percentage for the group “under £300” as compared with incomes between £300 and £600 is due to the fact that all companies must furnish returns, while in the case of persons and firms incomes under £250 need not he returned.
A summary of exemptions during the four years 1922–23 to 1925–26 is given under a previous heading, the total amount allowed under each form of exemption being shown. In the following table the aggregate exemptions to each of the four classes of taxpayers are shown:—
| EXEMPTIONS, BY CLASSES OF INCOMES, 1922–23 TO 1925–26. | ||||||||
|---|---|---|---|---|---|---|---|---|
| Class of Income. | Aggregate Exemptions. | Proportion of Assessable Income. | ||||||
| 1922–23. | 1923–24. | 1924–25. | 1925–26. | 1922–23 | 1923–24 | 1924–25 | 1925–26 | |
| £ | £ | £ | £ | Per Cent. | Per Cent. | Per Cent. | Per Cent. | |
| I | 24,544,354 | 20,759,886 | 22,169,045 | 22,375,624 | 65 | 62 | 60 | 57 |
| II | 332,818 | 908,811 | 1,133,985 | 1,204,556 | 4 | 9 | 10 | 10 |
| III | .. | .. | .. | .. | .. | .. | .. | .. |
| IV | 6,407 | .. | .. | .. | 1 | .. | .. | .. |
| Totals | 24,883,579 | 21,668,697 | 23,303,030 | 23,580,180 | 54 | 48 | 47 | 45 |
The whole of the exemption shown in the case of companies was in respect of the capital-value provision. Of the £22,375,624 exemptions to persons and firms in 1925–26, £17,771,691 was allowed as ordinary exemption (£300), £1,511,041 in respect of the capital value of land used in the production of income, £2,315,990 on account of allowances for children and widowed mothers, and £776,902 on account of life-insurance premiums, payments to superannuation funds, &c.
The exemptions are next shown spread over incomes derived from the various sources set out earlier in this section:—
| EXEMPTIONS, BY SOURCE OF INCOME, 1922–23 TO 1925–26. | ||||||||
|---|---|---|---|---|---|---|---|---|
| Source of Income. | Aggregate Exemptions. | Proportion of Assessable Income. | ||||||
| 1922–23. | 1923–24. | 1924–25. | 1925–26. | 1922–23 | 1923–24 | 1924–25 | 1925–26 | |
| £ | £ | £ | £ | Per Cent. | Per Cent. | Per Cent. | Per Cent. | |
| 0 | 11,832,343 | 11,408,930 | 11,926,916 | 11,834,574 | 78 | 76 | 74 | 72 |
| 1 | 743,678 | 793,581 | 872,380 | 911,888 | 32 | 33 | 32 | 30 |
| 2 | 3,574,581 | 4,103,352 | 4,598,228 | 4,685,453 | 32 | 32 | 31 | 30 |
| 3 | 284,199 | 507,232 | 553,280 | 529,281 | 9 | 15 | 14 | 15 |
| 4 | 4,269,347 | .. | 117,992 | 177,155 | 81 | .. | 40 | 32 |
| 5 | 103,412 | 163,170 | 194,616 | 220,118 | 15 | 17 | 19 | 26 |
| 6 | 263,189 | 306,710 | 396,229 | 405,953 | 51 | 59 | 53 | 45 |
| 7 | 13,380 | 14,507 | 30,447 | 40,274 | 10 | 5 | 22 | 21 |
| 8 | 3,773,032 | 4,343,251 | 4,583,736 | 4,743,366 | 48 | 47 | 45 | 43 |
| 9 | 26,418 | 27,964 | 29,212 | 32,118 | 13 | 34 | 34 | 31 |
| Totals | 24,883,579 | 21,668,697 | 23,303,030 | 23,580,180 | 54 | 48 | 47 | 45 |
The highest percentage of exemptions is recorded for source 0, which, as previously demonstrated, has the lowest average income. Sources 3 (industry or manufacture), and 7 (mining), which have a large proportion of companies, show the lowest percentage of exemptions.
As a percentage of assessable income, exemptions naturally show a decrease as income increases, as is well brought out in the proportion columns of the next table.
| EXEMPTIONS, BY SIZE OF INCOME, 1922–23 TO 1925–26. | ||||||||
|---|---|---|---|---|---|---|---|---|
| Size of Income. | Aggregate Exemptions. | Proportion of Assessable Income. | ||||||
| 1922–23. | 1923–24. | 1924–25. | 1925–26. | 1922–23 | 1923–24 | 1924–25 | 1925–26 | |
| £ £ | £ | £ | £ | £ | Per Cent. | Per Cent. | Per Cent. | Per Cent. |
| Under 300 | 6,786,316 | 4,921,521 | 4,855,552 | 4,143,798 | 96 | 95 | 94 | 93 |
| 300–399 | 7,452,964 | 6,538,950 | 6,886,443 | 6,822,152 | 95 | 94 | 94 | 94 |
| 400–499 | 3,973,948 | 3,660,792 | 4,016,148 | 4,313,093 | 83 | 82 | 83 | 82 |
| 500–599 | 2,291,227 | 2,103,026 | 2,282,909 | 2,547,821 | 71 | 70 | 70 | 70 |
| 600–699 | 1,476,652 | 1,234,556 | 1,418,201 | 1,548,616 | 54 | 54 | 54 | 53 |
| 700–799 | 641,414 | 587,199 | 680,729 | 750,927 | 38 | 36 | 36 | 36 |
| 800–899 | 301,995 | 267,140 | 338,446 | 351,509 | 24 | 22 | 24 | 22 |
| 900–999 | 188,002 | 172,116 | 203,123 | 211,211 | 20 | 18 | 18 | 17 |
| 1,000–1,999 | 859,575 | 828,004 | 982,757 | 1,058,257 | 17 | 16 | 16 | 16 |
| 2,000–2,999 | 335,975 | 323,058 | 360,099 | 400,250 | 15 | 15 | 14 | 13 |
| 3,000–3,999 | 144,825 | 200,307 | 203,866 | 233,542 | 12 | 15 | 14 | 14 |
| 4,000–4,999 | 91,598 | 111,128 | 133,391 | 123,561 | 13 | 15 | 14 | 12 |
| 5,000–5,999 | 75,915 | 80,432 | 104,463 | 115,810 | 15 | 15 | 15 | 14 |
| 6,000–6,999 | 19,628 | 44,709 | 45,620 | 87,527 | 5 | 11 | 10 | 15 |
| 7,000–7,999 | 26,623 | 38,493 | 48,744 | 65,678 | 12 | 11 | 11 | 14 |
| 8,000–8,999 | 21,299 | 26,072 | 40,078 | 48,637 | 9 | 10 | 12 | 15 |
| 9,000–9,999 | 14,371 | 27,815 | 35,090 | 53,705 | 7 | 13 | 16 | 22 |
| 10,000–19,999 | 101,804 | 156,384 | 194,840 | 168,411 | 8 | 10 | 12 | 10 |
| 20,000–29,999 | 18,061 | 54,601 | 114,501 | 120,596 | 3 | 7 | 10 | 12 |
| 30,000–39,999 | 11,316 | 56,363 | 39,607 | 84,400 | 2 | 8 | 6 | 10 |
| 40,000–49,999 | 4,514 | 16,774 | 45,808 | 66,298 | 1 | 4 | 9 | 18 |
| 50,000 and over | 45,557 | 219,257 | 272,615 | 264,381 | 1 | 5 | 6 | 5 |
| Totals | 24,883,579 | 21,668,697 | 23,303,030 | 23,580,180 | 54 | 48 | 47 | 45 |
There has been a decided movement between 1924–25 and 1925–26, the lower income groups generally showing a fall in the percentage of exemption to assessed income, and the higher groups a rise. This movement is associated with a similar movement in the capital-value exemption, and appears to be due principally to higher values of premises used for business and industrial undertakings.
Figures for the four classes of exemptions for the year 1925–26 are given in the next table, which also shows the average exemption per return:—
| EXEMPTIONS BY NATURE OF EXEMPTION AND SIZE OF INCOME, 1925–26. | ||||||||
|---|---|---|---|---|---|---|---|---|
| Size of Income. | Total Exemptions. | Average Exemptions per Income returned. | ||||||
| 5 per Cent. Of Capital Value. | Section 74 Value (£300) | Children, &c. | Life Insurance, &c. | 5 per Cent. of Capital Value. | Section 74 (£300). | Children, &c. | Life Insurance, &c. | |
| £ £ | £ | £ | £ | £ | £ | £ | £ | £ |
| Under 300 | 44,452 | 4,098,047 | 1,276 | 23 | 2 | 185 | .. | .. |
| 300–399 | 77,055 | 6,189,105 | 450,129 | 105,863 | 4 | 294 | 21 | 5 |
| 400–499 | 99,336 | 3,508,176 | 581,110 | 124,471 | 8 | 289 | 48 | 10 |
| 500–599 | 108,447 | 1,956,349 | 381,047 | 101,978 | 16 | 288 | 56 | 15 |
| 600–699 | 83,244 | 1,167,936 | 224,191 | 73,245 | 18 | 252 | 48 | 16 |
| 700–799 | 101,220 | 437,492 | 153,862 | 58,353 | 36 | 154 | 54 | 20 |
| 800–899 | 80,872 | 124,595 | 102,568 | 43,474 | 43 | 67 | 55 | 23 |
| 900–999 | 75,372 | 27,438 | 76,305 | 32,096 | 56 | 20 | 57 | 24 |
| 1,000–1,999 | 484,681 | 158,761 | 261,881 | 152,934 | 97 | 32 | 52 | 31 |
| 2,000–2,999 | 252,049 | 52,938 | 52,855 | 42,408 | 205 | 43 | 43 | 34 |
| 3,000–3,999 | 170,025 | 29,298 | 15,166 | 19,053 | 351 | 61 | 31 | 40 |
| 4,000–4,999 | 96,765 | 7,010 | 9,400 | 10,386 | 397 | 29 | 38 | 43 |
| 5,000–5,999 | 100,776 | 7,420 | 2,850 | 4,764 | 672 | 49 | 19 | 32 |
| 6,000–6,999 | 81,426 | 2,216 | 1,200 | 2,685 | 905 | 25 | 13 | 30 |
| 7,000–7,999 | 62,813 | 300 | 250 | 2,315 | 997 | 5 | 4 | 37 |
| 8,000–8,999 | 45,316 | 1,492 | 650 | 1,179 | 1,162 | 38 | 17 | 30 |
| 9,000–9,999 | 53,532 | .. | .. | 173 | 2,059 | .. | .. | 6 |
| 10,000–19,999 | 162,804 | 3,118 | 1,000 | 1,489 | 1,272 | 24 | 8 | 12 |
| 20,000–29,999 | 120,333 | .. | 250 | 13 | 2,735 | .. | 6 | .. |
| 30,000–39,999 | 84,400 | .. | .. | .. | 3,517 | .. | .. | .. |
| 40,000–49,999 | 66,298 | .. | .. | .. | 4,736 | .. | .. | .. |
| 50,000–99,999 | 145,440 | .. | .. | 5,196 | .. | .. | .. | |
| 100,000 and over | 118,941 | .. | .. | 6,997 | .. | .. | .. | |
| Totals | 2,715,597 | 17,771,691 | 2,315,990 | 776,902 | 34 | 221 | 29 | 9 |
As would naturally be expected in the case of any percentage remission, the average exemption under the 5-per-cent. provision increases rapidly and steadily with the size of the income. It should be added that, if taken as a percentage of total income, this exemption shows a steady rise from slightly over 1 per cent. of incomes between £300 and £400 to nearly 22 per cent. of incomes between £9,000 and £10,000. An abrupt fall then occurs, the 5-per-cent. exemption representing only 11 ½ per cent. of incomes between £20,000 and £30,000, and less than ½ per cent. of incomes over £50,000.
The £300 exemption, which is reduced on incomes above £600 and does not apply at all to those above £900, averaged in 1925–26 £294 for incomes between £300 and £400, £289 for incomes between £400 and £500, £288 between £500 and £600, and £252 between £600 and £700. Thereafter the average diminishes rapidly, but does not altogether disappear until the £20,000 class is reached, this being due to the inclusion in large trust returns of small amounts the recipients of which come within the provisions of the £300 exemption.
The other two classes of exemptions call for little comment. Each shows a more or less steady rise, followed by a fall at the higher income groups, where the companies predominate.
After all exemptions have been deducted from the assessable income the balance of income (if any) is taxed in accordance with the schedule in force at the time. Figures of taxable balance are readily ascertained from a study of the corresponding totals of assessable income and of exemptions, and will be given here under one system of classification only—viz., that on the basis of amount of assessable income.
| TAXABLE BALANCE, BY SIZE OF INCOME, 1922–23 TO 1925–26. | ||||||||
|---|---|---|---|---|---|---|---|---|
| Size of Income. | Aggregate Taxable Balance. | Proportion of Assessable Income. | ||||||
| 1922–23. | 1923–24. | 1924–25. | 1925–26. | 1922–23. | 1923–24. | 1924–25. | 1925–26. | |
| £ £ | £ | £ | £ | £ | Per Cent. | Per Cent. | Per Cent. | Per Cent. |
| Under 300 | 253,691 | 280,881 | 311,125 | 312,916 | 4 | 5 | 6 | 7 |
| 300–399 | 414,080 | 385,153 | 427,663 | 461,981 | 5 | 6 | 6 | 6 |
| 400–499 | 804,766 | 784,444 | 871,927 | 948,254 | 17 | 18 | 17 | 18 |
| 500–599 | 935,102 | 888,218 | 978,421 | 1,105,015 | 29 | 30 | 30 | 30 |
| 600–699 | 1,269,145 | 1,032,163 | 1,208,368 | 1,400,491 | 46 | 46 | 46 | 47 |
| 700–799 | 1,061,064 | 1,049,467 | 1,225,387 | 1,363,974 | 62 | 64 | 64 | 64 |
| 800–899 | 936,025 | 944,702 | 1,084,175 | 1,216,955 | 76 | 78 | 76 | 78 |
| 900–999 | 734,612 | 797,655 | 943,420 | 1,064,405 | 80 | 82 | 82 | 83 |
| 1,000–1,999 | 4,136,868 | 4,412,226 | 5,193,719 | 5,693,826 | 83 | 84 | 84 | 84 |
| 2,000–2,999 | 1,851,770 | 1,828,517 | 2,195,551 | 2,580,735 | 85 | 85 | 86 | 87 |
| 3,000–3,999 | 1,016,234 | 1,104,310 | 1,290,907 | 1,429,155 | 88 | 85 | 86 | 86 |
| 4,000–4,999 | 604,191 | 610,943 | 845,043 | 946,953 | 87 | 85 | 86 | 88 |
| 5,000–5,999 | 436,549 | 442,025 | 581,165 | 694,757 | 85 | 85 | 85 | 86 |
| 6,000–6,999 | 373,431 | 357,730 | 412,129 | 493,210 | 95 | 89 | 90 | 85 |
| 7,000–7,999 | 190,034 | 327,946 | 385,573 | 407,968 | 88 | 89 | 89 | 86 |
| 8,000–8,999 | 225,951 | 238,178 | 298,582 | 280,940 | 91 | 90 | 88 | 85 |
| 9,000–9,999 | 184,947 | 188,917 | 181,607 | 191,879 | 93 | 87 | 84 | 78 |
| 10,000–19,999 | 1,141,948 | 1,323,693 | 1,481,474 | 1,575,335 | 92 | 90 | 88 | 90 |
| 20,000–29,999 | 577,309 | 781,868 | 1,083,069 | 919,154 | 97 | 93 | 90 | 88 |
| 30,000–39,999 | 477,182 | 638,833 | 575,293 | 725,110 | 98 | 92 | 94 | 90 |
| 40,000–49,999 | 435,277 | 438,229 | 438,956 | 549,413 | 99 | 96 | 91 | 82 |
| 50,000 and over | 3,410,186 | 4,213,269 | 4,630,425 | 4,689,882 | 99 | 95 | 94 | 95 |
| Totals | 21,470,362 | 23,069,367 | 26,643,979 | 29,052,308 | 46 | 52 | 53 | 55 |
The fall in the percentage of taxable income at the higher groups as between 1922–23 and later years is due to the substitution of capital value for the former unimproved value in computing the exemption on account of land used in the production of the income. In spite of the fall here, however, the general tendency is for the proportion of taxable income to increase.
The next table enables an interesting comparison to be made between taxable balance per return and taxable balance per taxpayer, as well as affording a comparison in these two respects between the various years, and for incomes of different sizes.
| AVERAGE TAXABLE BALANCE, 1922–23 TO 1925–26. | ||||||||
|---|---|---|---|---|---|---|---|---|
| Size of Income. | Taxable Balance per Return. | Taxable Balance per Taxpayer. | ||||||
| 1922–23. | 1923–24. | 1924–25. | 1925–26. | 1922–23. | 1923–24. | 1924–25 | 1925–26. | |
| £ £ | £ | £ | £ | £ | £ | £ | £ | £ |
| Under 300 | 7 | 12 | 13 | 14 | 99 | 102 | 92 | 97 |
| 300–399 | 18 | 19 | 21 | 22 | 44 | 50 | 50 | 61 |
| 400–499 | 74 | 78 | 78 | 78 | 103 | 111 | 105 | 106 |
| 500–599 | 156 | 160 | 162 | 163 | 178 | 179 | 180 | 180 |
| 600–699 | 301 | 291 | 294 | 303 | 317 | 304 | 306 | 313 |
| 700–799 | 462 | 478 | 479 | 480 | 483 | 490 | 488 | 491 |
| 800–899 | 644 | 660 | 642 | 654 | 671 | 675 | 660 | 670 |
| 900–999 | 752 | 778 | 778 | 790 | 778 | 794 | 793 | 806 |
| 1,000–1,999 | 1,281 | 1,126 | 1,136 | 1,137 | 1,316 | 1,146 | 1,156 | 1,157 |
| 2,000–2,999 | 2,053 | 2,050 | 2,064 | 2,096 | 2,076 | 2,080 | 2,091 | 2,121 |
| 3,000–3,999 | 3,034 | 2,861 | 2,961 | 2,953 | 3,043 | 2,914 | 2,981 | 2,996 |
| 4,000–4,999 | 3,923 | 3,771 | 3,823 | 3,881 | 3,975 | 3,818 | 3,841 | 3,881 |
| 5,000–5,999 | 4,694 | 4,567 | 4,612 | 4,632 | 4,851 | 4,604 | 4,687 | 4 694 |
| 6,000–6,999 | 6,122 | 5,864 | 5,805 | 5,480 | 6,122 | 5,864 | 5,805 | 5,480 |
| 7,000–7,999 | 6,553 | 6,693 | 6,648 | 6,476 | 6,787 | 6,693 | 6,648 | 6,476 |
| 8,000–8,999 | 7,791 | 7,683 | 7,464 | 7,204 | 7,791 | 7,683 | 7,656 | 7,204 |
| 9,000–9,999 | 8,807 | 8,214 | 7,896 | 7,380 | 8,807 | 8,214 | 8,255 | 7,675 |
| 10,000–19,999 | 12,688 | 12,488 | 11,947 | 12,307 | 12,688 | 12,488 | 11,947 | 12,307 |
| 20,000–29,999 | 22,204 | 23,690 | 22,103 | 20,890 | 22,204 | 23,690 | 22,103 | 20,890 |
| 30,000–39,999 | 34,084 | 31,942 | 31,961 | 30,213 | 34,084 | 31,942 | 31,961 | 30,213 |
| 40,000–49,999 | 43,528 | 43,823 | 39,905 | 39,244 | 43,528 | 43,823 | 39,905 | 39,244 |
| 50,000 and over | 121,792 | 102,763 | 96,467 | 104,220 | 121,792 | 102,763 | 96,467 | 104,220 |
| Totals | 233 | 309 | 335 | 361 | 557 | 639 | 639 | 663 |
In spite of a lower average in 1925–26 at the higher incomes, the general average shows a distinct increase over that for the previous year, whether on the basis of taxable balance per return or per taxpayer.
The revenue from income-tax during the financial year ended the 31st March, 1926, was £3,368,516. This amount is £178,239 in excess of the total tax assessed for the same year (£3,190,277), the difference being due partly to the imposition of an additional 5 per cent. in the event of late payment and partly to the inclusion of arrears in the total of tax collected.
A summary of assessments of tax during each of the last four years gives the following results:—
| INCOME TAX ASSESSED, 1922–23 TO 3925–26. | |||||||||||
|---|---|---|---|---|---|---|---|---|---|---|---|
| Year. | Total Tax assessed. | Average Tax assessed. | |||||||||
| Per Income. | Per Taxpayer. | Per £1 of Assessable Income. | Per £1 of Taxable Balance. | ||||||||
| £ | £ | s. | d. | £ | s. | d. | s. | d. | s. | d. | |
| 1922–23 | 3,639,603 | 39 | 10 | 4 | 94 | 7 | 3 | 1 | 7 | 3 | 5 |
| 1923–24 | 3,335,205 | 44 | 12 | 4 | 92 | 8 | 3 | 1 | 6 | 2 | 11 |
| 1924–25 | 3,173,085 | 39 | 17 | 9 | 76 | 2 | 7 | 1 | 3 | 2 | 5 |
| 1925–26 | 3,190,277 | 39 | 13 | 11 | 72 | 16 | 0 | 1 | 3 | 2 | 2 |
The table gives a good indication of the effect of tax-reductions during the period. The maximum tax has fallen from 7s. 4d. in the £1 in 1922–23 to 4s. 6d. in the £1 in 1925–26.
In 1925–26 the 2,801 taxpaying companies were assessed for £2,062,671 income-tax, the 294 agents for debenture-holders for £92,105, and the 1,200 non-resident traders for £30,874. The remaining £1,004,627 was divided among 39,527 taxpayers in the general class—persons, firms, &c. The following table shows the tax assessed in the case of each of the four classes during the last four years, and also contrasts the incidence of the assessment between the classes in 1925–26:—
| INCOME-TAX ASSESSED, BY CLASSES, 1922–23 TO 1925–26. | ||||||||||
|---|---|---|---|---|---|---|---|---|---|---|
| Class. | Total Tax assessed. | Average Tax assessed, 1925–26. | ||||||||
| 1922–23. | 1923–24. | 1924–25. | 1925–26. | Per Income. | Per Taxpayer. | Per £1 of Assessable Income. | Per £1 of Taxable Balance. | |||
* Not grouped separately. | ||||||||||
| £ | £ | £ | £ | £ | £ | s. | d. | s. | d. | |
| I | 1,143,875 | 949,223 930,107 | 1,004,627 | 13 | 25 | 0 | 6 | 1 | 2 | |
| II | 2,406,729 | 2,278,795 | 2,109,435 | 2,062,671 | 706 | 736 | 3 | 4 | 3 | 9 |
| III | * | 64,566 | 91,359 | 92,105 | 313 | 313 | 3 | 1 | 3 | 1 |
| IV | 88,999 | 42,621 | 42,184 | 30,874 | 26 | 26 | 1 | 2 | 1 | 2 |
| 3,639,603 | 3,335,205 | 3,173,085 | 3,190,277 | 40 | 73 | 1 | 3 | 2 | 2 | |
The figures refer, of course, only to incomes for which returns have been furnished to the Commissioner of Taxes. All persons and companies in business are required to furnish returns, but returns are not required from persons whose incomes are derived from salary, wages, interest, rent, annuity, or other annual payment, if the total income is under £250 per annum. It must be remembered, therefore in considering the figures given in the tables belonging to the general class covering “Persons, firms, &c.,” that there will be large numbers of individuals in the Dominion with incomes under £300 per annum who have not furnished returns, whereas in the case of the other three classes this will not be the case, as all companies, agents for debenture-holders, and non-resident traders are required to furnish returns irrespective of the size of their incomes. Bearing this in mind, the effect of the non-application of the £300 exemption and of the progressive rates of the income-tax is strikingly brought out in the case of the companies. The companies paid in 1925–26 64 ½ per cent. of the tax assessed, while the average percentage of tax paid to assessable income returned was nearly seven times more than in the case of persons, firms, &c., and over three times as great on the basis of the taxable balance.
A table on the same lines as the foregoing is now given showing the figures for each of the ten groups of sources:—
| INCOME-TAX ASSESSED, BY SOURCE OF INCOME, 1922–23 TO 1925–26. | ||||||||||
|---|---|---|---|---|---|---|---|---|---|---|
| Source. | Total Tax assessed. | Average Tax assessed, 1925–26. | ||||||||
| 1922–23. | 1923–24. | 1924–25. | 1925–26. | Per Income. | Per Taxpayer. | Per £1 of Assessable Income. | Per £1 of Taxable Balance. | |||
| £ | £ | £ | £ | £ | £ | s. | d. | s. | d. | |
| 0 | 220,358 | 207,103 | 201,058 | 222,185 | 6 | 12 | 0 | 3 | 0 | 11 |
| 1 | 139,545 | 114,902 | 118,194 | 133,251 | 39 | 49 | 0 | 10 | 1 | 3 |
| 2 | 1,677,367 | 1,584,963 | 1,537,588 | 1,573,241 | 90 | 177 | 2 | 0 | 2 | 10 |
| 3 | 840,701 | 696,214 | 654,545 | 561,955 | 386 | 494 | 3 | 1 | 3 | 8 |
| 4 | 78,761 | .. | 13,496 | 27,265 | 44 | 68 | 1 | 0 | 1 | 5 |
| 5 | 175,446 | 208,626 | 162,623 | 108,503 | 145 | 264 | 2 | 6 | 3 | 5 |
| 6 | 23,588 | 18,410 | 23,494 | 34,527 | 24 | 39 | 0 | 9 | 1 | 5 |
| 7 | 36,994 | 83,274 | 19,476 | 26,867 | 195 | 368 | 2 | 11 | 3 | 7 |
| 8 | 417,172 | 415,821 | 434,297 | 493,748 | 28 | 46 | 0 | 11 | 1 | 7 |
| 9 | 29,671 | 5,892 | 8,314 | 8,735 | 105 | 156 | 1 | 8 | 2 | 6 |
| Totals | 3,639,603 | 3,335,205 | 3,173,085 | 3,190,277 | 40 | 73 | 1 | 3 | 2 | 2 |
Easily the lowest average tax assessed is shown for income derived from source 0 (salary or wages), an average of only 3d. in the £1 of total assessable income, or 11d. in the £1 of taxable balance, being assessed, as compared with corresponding averages of 3s. 1d. and 3s. 8d. in the case of source 3 (industry or manufacture). Next to the latter, sources 7 (mining or extraction), 5 (provision of transport and communication), and 2 (commerce, trade, or business) have the highest averages of tax assessed.
The wide range between the different sources is due to the great variation in the average income derived from the respective sources, combined with the fact that the rate of taxation in the £1 increases with increasing taxable balance, the minimum rate being now 7d. in the £1, and the maximum 4s. 6d. The effect of the progressive rates of income-tax can be better seen from the next table, which gives information according to size of assessable income. Figures for 1922–23 and 1923–24 are not fully available.
| INCOME-TAX ASSESSED, BY SIZE OF INCOME, 1924–25 AND 1925–26. | ||||||||
|---|---|---|---|---|---|---|---|---|
| Size of Income. | Total Tax assessed. | Average Tax assessed 1925–26. | ||||||
| 1924–25. | 1925–26. | Per Income. | Per Taxpayer. | Per £1 of Assessable Income. | Per £1 of Taxable Balance. | |||
* 11s. 2d. †13s. 7d. | ||||||||
| £ £ | £ | £ | £ | £ | s. | d. | s. | d. |
| Under 300 | 13,054 | 12,365 | * | 4 | 0 | 1 | 0 | 9 |
| 300–399 | 14,571 | 14,256 | † | 2 | . | 0 | 7 | |
| 400–499 | 28,855 | 27,301 | 2 | 3 | 0 | 1 | 0 | 7 |
| 500–599 | 31,815 | 31,757 | 5 | 5 | 0 | 2 | 0 | 7 |
| 600–699 | 39,724 | 42,366 | 9 | 9 | 0 | 3 | 0 | 7 |
| 700–799 | 43,273 | 46,475 | 16 | 17 | 0 | 5 | 0 | 8 |
| 800–899 | 42,501 | 45,737 | 25 | 25 | 0 | 7 | 0 | 9 |
| 900–999 | 40,081 | 44,267 | 33 | 34 | 0 | 8 | 0 | 10 |
| 1,000–1,999 | 279,927 | 297,644 | 59 | 60 | 0 | 11 | 1 | 1 |
| 2,000–2,999 | 174,952 | 202,620 | 165 | 166 | 1 | 4 | 1 | 7 |
| 3,000–3,999 | 132,054 | 144,550 | 299 | 303 | 1 | 9 | 2 | 0 |
| 4,000–4,999 | 105,756 | 116,947 | 479 | 479 | 2 | 2 | 2 | 6 |
| 5,000–5,999 | 86,873 | 103,659 | 691 | 700 | 2 | 7 | 3 | 0 |
| 6,000–6,999 | 71,285 | 84,005 | 933 | 933 | 2 | 11 | 3 | 5 |
| 7,000–7,999 | 72,016 | 73,598 | 1,168 | 1,168 | 3 | 1 | 3 | 7 |
| 8,000–8,999 | 58,342 | 54,221 | 1,390 | 1,390 | 3 | 3 | 3 | 10 |
| 9,000–9,999 | 38,022 | 37,170 | 1,430 | 1,487 | 3 | 0 | 3 | 10 |
| 10,000–19,999 | 328,775 | 333,085 | 2,602 | 2,602 | 3 | 10 | 4 | 3 |
| 20,000–29,999 | 251,252 | 201,746 | 4,812 | 4,812 | 3 | 11 | 4 | 5 |
| 30,000–39,999 | 126,775 | 147,450 | 6,144 | 6,144 | 3 | 8 | 4 | 1 |
| 40,000–49,999 | 103,280 | 120,708 | 8,622 | 8,622 | 3 | 11 | 4 | 5 |
| 50,000–99,999 | 1,089,902 | 353,293 | 12,618 | 12,618 | 3 | 11 | 4 | 3 |
| 100,000 and over | 1,089,902 | 655,057 | 38,533 | 38,533 | 4 | 2 | 4 | 4 |
| Totals | 3,173,035 | 3,190,277 | 40 | 73 | 1 | 3 | 2 | 2 |
The average income between £300 and £400 paid in 1924–25 only 13s. 7d., or less than ½d. in the £1 of total assessable income returned, as compared with £59, or 11d. in the £1, for incomes between £1,000 and £2,000. Incomes over £100,000 paid in 1925–26 slightly less on the average than the maximum—4s. 6d. in the £1—provided by the progressive rates now in force.
Table of Contents
RETAIL-PRICES quotations, from which index numbers are regularly calculated, are collected each month in twenty-five towns of the Dominion, selected as being representative of New Zealand as a whole. These twenty-five towns are distributed over both Islands, from Whangarei in the North to Invercargill in the South, and are representative of both coastal and inland districts, and of both large and small centres. Returns of prices are collected by local Inspectors of Factories for the most part from representative retailers, and from these data index numbers are computed in the Census and Statistics Office, Wellington. Average retail-price quotations for each commodity in each town are published in the Monthly Abstract of Statistics at the end of each quarter, while index numbers appear in each month's issue.
The commodities for which monthly prices are collected and monthly index numbers compiled are almost exclusively articles of food, divided into three groups—groceries (including a few minor items of general groceries other than foods), dairy-produce, and meat. Fuel and light prices have also been collected at monthly, and house-rents at six-monthly, intervals since the inauguration of price statistics in 1914. More recently the inquiry has been extended to cover clothing and miscellaneous items, figures for which are now collected at quarterly intervals. A full list of the commodities covered will be found in the “Report on Prices, &c.,” for 1924 and following years.
Separate series of index numbers of retail prices are compiled and published for the following groups:—
Group I.—Groceries.
Group II.—Dairy-produce.
Group III.—Meat. Group
IV.—Housing.
Group V.—Fuel and light.
Group VI.—Clothing (including drapery and footwear).
Group VII.—Miscellaneous items.
In addition, index numbers are compiled and published for the food (that is, the first three) groups combined, and also for all groups combined.
The “base” originally adopted in the case of Groups I to V was the average aggregate annual cost of a fixed “regimen” (or list of articles in common household use, with the relative quantities of each consumed by the average household) in the four chief centres over the five-yearly period 1909–13. This cost is equated to 1000, which is the price-index for the four chief centres in the base period. Price-indexes for dates other than the base period are computed by ascertaining the ratio borne by the total cost of the fixed regimen at such other date to the total cost of the same regimen in the base period, and multiplying by 1000. Price-indexes are thus computed separately for each town, the resulting index numbers being subsequently combined to form a single index number. Separate price-indexes for Groups I to V are also computed on the base: prices in July, 1914 = 1000. The only base in the case of Groups VI and VII is the average of prices in July. 1914, in the four chief centres, equated to 1000.
The following table gives a general survey of the course of retail food-prices from 1891 to the year of the outbreak of the Great War. Index numbers have been computed for each of the four chief centres for each year, and these figures are simply averaged, the price-index for each centre receiving the same weight or importance in the averaging process as that for any other centre. The index numbers for each of the four chief centres have been compiled from the records of prices of the commodities coming under each of the three separate food groups in such a manner that the index numbers for each group are in the combining process accorded their proper relative importance.
| THREE FOOD GROUPS.—INDEX NUMBERS FOR FOUR CHIEF CENTRES, 1891–1914.(Base: Average aggregate annual expenditure, four chief centres, 1909–13 = 1000.) | |
|---|---|
| Year. | Index Number. |
* Average of Auckland, Wellington, and Dunedin. Full data for Christchurch for years prior to 1899 are not available. The index number for Christchurch in 1899 (897) was, however, almost identical with the average of the remaining chief centres. | |
| 1891 | 913* |
| 1892 | 915* |
| 1893 | 934* |
| 1894 | 932* |
| 1895 | 905* |
| 1896 | 904* |
| 1897 | 899* |
| 1898 | 960* |
| 1899 | 896 |
| 1900 | 906 |
| 1901 | 928 |
| 1902 | 954 |
| 1903 | 946 |
| 1904 | 935 |
| 1905 | 990 |
| 1906 | 1003 |
| 1907 | 993 |
| 1908 | 994 |
| 1909 | 972 |
| 1910 | 991 |
| 1911 | 983 |
| 1912 | 1017 |
| 1913 | 1037 |
| 1914 | 1082 |
The following table shows the index numbers for each centre, and also the unweighted average of the four centres, and the Dominion weighted average during the war and post-war years:—
| THREE FOOD GROUPS.—INDEX NUMBERS, 1914–25.(Base: Average aggregate annual expenditure, four chief centres, 1909–13 = 1000) | ||||||
|---|---|---|---|---|---|---|
| Year. | Auckland. | Wellington. | Christchurch. | Dunedin. | Average of Four Centres. | Dominion Weighted Average. |
| 1914 | 1110 | 1100 | 1044 | 1074 | 1082 | 1087 |
| 1915 | 1206 | 1216 | 1176 | 1191 | 1197 | 1203 |
| 1916 | 1291 | 1290 | 1249 | 1244 | 1268 | 1276 |
| 1917 | 1369 | 1397 | 1346 | 1328 | 1360 | 1370 |
| 1918 | 1496 | 1521 | 1438 | 1488 | 1486 | 1491 |
| 1919 | 1552 | 1575 | 1531 | 1563 | 1555 | 1561 |
| 1920 | 1769 | 1789 | 1806 | 1811 | 1794 | 1794 |
| 1921 | 1747 | 1751 | 1745 | 1771 | 1754 | 1756 |
| 1922 | 1490 | 1529 | 1538 | 1507 | 1516 | 1521 |
| 1923 | 1507 | 1543 | 1537 | 1526 | 1528 | 1530 |
| 1924 | 1605 | 1592 | 1562 | 1577 | 1584 | 1587 |
| 1925 | 1640 | 1597 | 1578 | 1606 | 1605 | 1615 |
It will be noted that food-prices in the four centres, as recorded by the above index numbers, move with considerable uniformity, although the extent of the movement varies as between the different cities.
The data of the tables are comparable both horizontally and vertically, since each column has the same base.
To obtain a general estimate of the course of prices for the whole Dominion it has been necessary to obtain a weighted average of the index numbers for each of the twenty-five representative towns. It is obvious that it would not be correct to obtain a simple average of the prices in Alexandra, with a population of barely 600, and in Auckland, with a population of over 190,000: although such a simple average was quite legitimate when an index number for the four chief centres alone was in question, since for most practical purposes each of these four chief centres might be deemed of equal importance. For purposes of the Dominion weighted-average index number, therefore, price-indexes for each town have been weighted in accordance with the number of people in the respective centres, and a composite index number has been obtained, which, though necessarily artificial, represents accurately enough the average level of retail prices in the Dominion.
The twenty-five towns considered have a total population of approximately half that of New Zealand, and they are therefore more or less completely representative of the Dominion. The four chief centres, which include well over a third of the Dominion's population, account for about 70 per cent. of the population of the twenty-five towns, so that their influence in the Dominion index number is naturally predominating. This however, can be defended on the ground that the chief centres not only comprise a great part of the people of the Dominion but also set the standard which is generally followed throughout the country.
The highest monthly figure for the three food groups combined was 1915, representing a level 79 per cent. above that of July, 1914: this was recorded in December, 1920. Apart from British India, where currency conditions are special and peculiar, New Zealand's peak level for retail prices was lower than the peak level in any other country.
Attention may be drawn in passing to the comparatively small differences recorded between the average figures for the four chief centres and the Dominion weighted averages. In this respect, as will be shown later on in this section, each of the food groups stands in marked contrast to the rent group.
Index numbers for each town during each of the years 1924 and 1925, and during each of the last six quarters, are appended. The quarterly figures are based on the average prices of the three months in the quarter, so that it is possible for them to differ materially from the prices current at the end of the quarter. Comparisons relating to different quarters of the year should allow for the influence of seasonal fluctuations, not only in prices but in amounts consumed. The method adopted presupposes a fixed consumption, the quantities consumed being arrived at on an annual basis. In the case of some important commodities, notably potatoes and eggs amongst foods, such seasonal fluctuations are considerable.
| THREE FOOD GROUPS.—INDEX NUMBERS FOR TWENTY-FIVE TOWNS.(Base: Average aggregate annual expenditure, four chief centres, 1909–13 = 1000.) | ||||||||
|---|---|---|---|---|---|---|---|---|
| Town. | Average of Average of Four Quarters, 1924. | Average of Quarters, 1925. | First Quarter, 1925. | Second Quarter, 1925. | Third Quarter, 1925. | Fourth Quarter, 1925. | First Quarter, 1926. | Second Quarter, 1926. |
| Auckland | 1605 | 1640 | 1585 | 1633 | 1661 | 1681 | 1649 | 1610 |
| Wellington | 1592 | 1597 | 1576 | 1579 | 1590 | 1641 | 1604 | 1617 |
| Christchurch | 1562 | 1578 | 1559 | 1578 | 1585 | 1590 | 1587 | 1562 |
| Dunedin | 1577 | 1606 | 1541 | 1563 | 1640 | 1680 | 1686 | 1658 |
| Whangarei | 1628 | 1699 | 1626 | 1668 | 1738 | 1763 | 1732 | 1724 |
| Hamilton | 1577 | 1664 | 1607 | 1681 | 1671 | 1696 | 1636 | 1615 |
| Rotorua | 1619 | 1630 | 1608 | 1616 | 1635 | 1662 | 1631 | 1629 |
| Waihi | 1620 | 1623 | 1591 | 1614 | 1605 | 1682 | 1666 | 1695 |
| Gisborne | 1630 | 1701 | 1667 | 1705 | 1701 | 1730 | 1743 | 1751 |
| Napier | 1502 | 1549 | 1517 | 1547 | 1546 | 1585 | 1569 | 1619 |
| Dannevirke | 1558 | 1621 | 1537 | 1622 | 1652 | 1673 | 1629 | 1640 |
| New Plymouth | 1576 | 1602 | 1560 | 1588 | 1586 | 1674 | 1596 | 1592 |
| Wanganui | 1491 | 1585 | 1526 | 1554 | 1597 | 1663 | 1634 | 1622 |
| Taihape | 1673 | 1724 | 1685 | 1742 | 1735 | 1734 | 1663 | 1684 |
| Palmerston North | 1500 | 1535 | 1502 | 1509 | 1535 | 1595 | 1562 | 1555 |
| Masterton | 1676 | 1699 | 1689 | 1705 | 1697 | 1704 | 1652 | 1664 |
| Blenheim | 1727 | 1706 | 1682 | 1692 | 1714 | 1734 | 1719 | 1723 |
| Nelson | 1692 | 1721 | 1687 | 1706 | 1732 | 1758 | 1759 | 1762 |
| Greymouth | 1707 | 1693 | 1665 | 1697 | 1707 | 1703 | 1680 | 1691 |
| Ashburton | 1671 | 1635 | 1618 | 1647 | 1641 | 1635 | 1653 | 1636 |
| Timaru | 1619 | 1596 | 1592 | 1566 | 1579 | 1645 | 1681 | 1607 |
| Oamaru | 1569 | 1583 | 1518 | 1560 | 1554 | 1701 | 1668 | 1590 |
| Alexandra | 1701 | 1701 | 1694 | 1675 | 1684 | 1750 | 1767 | 1693 |
| Gore | 1623 | 1647 | 1624 | 1612 | 1644 | 1708 | 1657 | 1576 |
| Invercargill | 1614 | 1663 | 1659 | 1601 | 1662 | 1729 | 1653 | 1612 |
| Dominion weighted average | 1587 | 1615 | 1576 | 1600 | 1624 | 1658 | 1635 | 1616 |
Food-prices rose steadily throughout the year 1925, the Dominion index number for the three food groups showing a rise each quarter, and the total Dominion increase from the March to the December quarter being 82 points. Each of the twenty-five towns shares in this increase, the greatest rise being recorded in Oamaru (183 points), and the smallest in Masterton (15 points). Of the four chief centres Dunedin shows the greatest rise (139 points), and Christchurch the smallest (31 points).
The nature of these rises will be clearer on a consideration of each of the three food groups separately.
Index numbers of retail prices of groceries in each of the four chief centres in each year from 1914 to 1925 are given in the following table, which also shows the unweighted average of the four centres and the Dominion weighted average.
| GROCERIES.—INDEX NUMBERS, 1914–25.(Base: Average aggregate annual expenditure, four chief centres, 1909–13 = 1000.) | ||||||
|---|---|---|---|---|---|---|
| Year. | Auckland. | Wellington. | Christchurch. | Dunedin. | Average of Four Centres. | Dominion Weighted Average. |
| 1914 | 1035 | 1082 | 1046 | 1056 | 1055 | 1064 |
| 1915 | 1172 | 1227 | 1210 | 1219 | 1207 | 1206 |
| 1916 | 1196 | 1269 | 1197 | 1192 | 1214 | 1219 |
| 1917 | 1268 | 1395 | 1279 | 1248 | 1298 | 1305 |
| 1918 | 1461 | 1579 | 1417 | 1503 | 1490 | 1488 |
| 1919 | 1535 | 1644 | 1530 | 1560 | 1567 | 1570 |
| 1920 | 1890 | 1991 | 1913 | 1904 | 1925 | 1925 |
| 1921 | 1951 | 2004 | 1973 | 1975 | 1976 | 1988 |
| 1922 | 1784 | 1819 | 1769 | 1783 | 1789 | 1810 |
| 1923 | 1692 | 1736 | 1690 | 1743 | 1715 | 1730 |
| 1924 | 1740 | 1765 | 1714 | 1764 | 1746 | 1760 |
| 1925 | 1712 | 1706 | 1640 | 1719 | 1694 | 1716 |
The outstanding feature illustrated by this table is, of course, the substantial increase in prices since the outbreak of war, the price-indexes for 1920 and 1921 representing the peak period in the movement of prices since 1914. The highest monthly figure recorded in this group was 2089, in January, 1921, with 2080 in the previous month a close second. The decline which then set in was checked when the index number had fallen to 1687, in March, 1923. From then on till an index number of 1823 was recorded in January, 1924, prices for this group rose. A fall to 1697 in October, 1924, was then recorded, followed by a sharp rise to 1802 in December, since when the index number has again fallen considerably. The index numbers for this group showed during 1925 a lower level than any recorded since 1919.
The factors underlying the fluctuations in the groceries group will be more clearly understood when it is remembered that the items comprising the group are varied in nature, and may be treated in three subgroups as under:—
Group IA.—Groceries, excluding bread, flour, oatmeal, potatoes, onions, and sugar.
Group IB.—Bread, flour, oatmeal, potatoes, and onions.
Group IC.—Sugar.
The fundamental distinction is that the items comprising Group IA are almost wholly imported from overseas, while those in the second are almost wholly produced in the country. Sugar is not strictly a product of New Zealand, the raw material being imported and refined at Auckland: and it is interesting to note that the index numbers for this commodity, broadly speaking, vary in proportion to the distance of the towns concerned from the refinery.
| GROCERIES SUBGROUPS.—INDEX NUMBERS, 1914–25. | |||||
|---|---|---|---|---|---|
| (Base: Average aggregate annual expenditure on items comprised by respective subgroups, four chief centres, 1909–13 = 1000.) | |||||
| Year. | Auckland. | Wellington. | Christchurch. | Dunedin. | Average of Four Centres. |
| Group 1a.—General Groceries. | |||||
| 1914 | 994 | 1097 | 1047 | 1114 | 1063 |
| 1915 | 989 | 1066 | 1115 | 1132 | 1078 |
| 1916 | 1035 | 1121 | 1115 | 1132 | 1101 |
| 1917 | 1171 | 1227 | 1203 | 1219 | 1205 |
| 1918 | 1367 | 1493 | 1388 | 1459 | 1427 |
| 1919 | 1488 | 1624 | 1541 | 1590 | 1561 |
| 1920 | 1897 | 2037 | 2041 | 2032 | 2002 |
| 1921 | 1850 | 1758 | 1845 | 1880 | 1833 |
| 1922 | 1720 | 1745 | 1739 | 1804 | 1752 |
| 1923 | 1671 | 1685 | 1693 | 1763 | 1703 |
| 1924 | 1703 | 1646 | 1660 | 1742 | 1688 |
| 1925 | 1687 | 1603 | 1628 | 1676 | 1649 |
| Group 1b.—Bread, Flour, Oatmeal, Potatoes, and Onions. | |||||
| 1914 | 1114 | 1173 | 1033 | 1074 | 1098 |
| 1915 | 1364 | 1408 | 1293 | 1356 | 1355 |
| 1916 | 1367 | 1416 | 1252 | 1220 | 1314 |
| 1917 | 1430 | 1588 | 1356 | 1249 | 1406 |
| 1918 | 1634 | 1733 | 1463 | 1567 | 1599 |
| 1919 | 1665 | 1727 | 1549 | 1551 | 1623 |
| 1920 | 1790 | 1834 | 1636 | 1640 | 1725 |
| 1921 | 1872 | 1871 | 1794 | 1732 | 1817 |
| 1922 | 1793 | 1830 | 1720 | 1736 | 1770 |
| 1923 | 1730 | 1800 | 1642 | 1715 | 1722 |
| 1924 | 1749 | 1857 | 1737 | 1745 | 1772 |
| 1925 | 1862 | 1898 | 1714 | 1808 | 1820 |
| Group 1c.—Sugar. | |||||
| 1914 | 983 | 1055 | 1145 | 1025 | 1052 |
| 1915 | 1191 | 1211 | 1290 | 1228 | 1230 |
| 1916 | 1208 | 1310 | 1304 | 1294 | 1279 |
| 1917 | 1219 | 1399 | 1344 | 1354 | 1329 |
| 1918 | 1266 | 1428 | 1359 | 1423 | 1369 |
| 1919 | 1314 | 1470 | 1444 | 1497 | 1431 |
| 1920 | 2153 | 2338 | 2383 | 2285 | 2290 |
| 1921 | 2781 | 2857 | 2875 | 2919 | 2858 |
| 1922 | 1955 | 1940 | 2005 | 1893 | 1948 |
| 1923 | 1662 | 1709 | 1820 | 1776 | 1742 |
| 1924 | 1825 | 1879 | 1851 | 1998 | 1888 |
| 1925 | 1413 | 1434 | 1472 | 1584 | 1476 |
The above figures show clearly that while imported items were principally responsible for the huge increase in the groceries index number for 1920, their influence largely neutralized the increases for the other subgroups in 1921; while from the peak till 1923 the rate of decrease of these items (and of sugar) has been considerably greater than that of commodities produced locally. In 1924 and 1925 general groceries continued on the whole to fall, while there was a phenomenal drop in sugar during 1925: these falls were, however, to a limited extent, counteracted by rises in the “home products” subgroup.
Group IB invariably shows an exceptionally high price-level during the summer months, owing to seasonal scarcities of potatoes and onions, so that, in the absence of fluctuations in Groups IA and IC, the index numbers for December and January for the groceries group as a whole would be somewhat higher than the corresponding index numbers for other months of the year.
Details are appended for each town for the years 1924 and 1925, for each quarter of 1925, and the first two quarters of 1926.
| GROCERIES.—INDEX NUMBERS FOR TWENTY-FIVE TOWNS.(Base: Average aggregate annual expenditure, four chief centres, 1909–13 = 1000.) | ||||||||
|---|---|---|---|---|---|---|---|---|
| Town. | Average of Four Quarters, 1924. | Average of Four Quarters, 1925. | First Quarter, 1925. | Second Quarter, 1925. | Third Quarter, 1925. | Fourth Quarter, 1925. | First Quarter, 1926. | Second Quarter, 1926. |
| Auckland | 1740 | 1712 | 1706 | 1699 | 1704 | 1738 | 1682 | 1673 |
| Wellington | 1765 | 1706 | 1759 | 1687 | 1653 | 1723 | 1691 | 1672 |
| Christchurch | 1714 | 1640 | 1648 | 1649 | 1628 | 1634 | 1715 | 1625 |
| Dunedin | 1764 | 1719 | 1703 | 1704 | 1713 | 1754 | 1843 | 1720 |
| Whangarei | 1901 | 1874 | 1843 | 1845 | 1885 | 1924 | 1885 | 1864 |
| Hamilton | 1867 | 1868 | 1850 | 1878 | 1865 | 1879 | 1847 | 1817 |
| Rotorua | 1922 | 1870 | 1877 | 1861 | 1863 | 1878 | 1897 | 1850 |
| Waihi | 1871 | 1804 | 1813 | 1787 | 1793 | 1824 | 1789 | 1767 |
| Gisborne | 1916 | 1877 | 1859 | 1883 | 1868 | 1897 | 1925 | 1867 |
| Napier | 1783 | 1773 | 1775 | 1777 | 1740 | 1799 | 1764 | 1776 |
| Dannevirke | 1857 | 1882 | 1858 | 1883 | 1897 | 1890 | 1858 | 1820 |
| New Plymouth | 1760 | 1739 | 1749 | 1763 | 1735 | 1710 | 1678 | 1660 |
| Wanganui | 1717 | 1772 | 1753 | 1759 | 1762 | 1812 | 1750 | 1728 |
| Taihape | 1868 | 1888 | 1849 | 1875 | 1862 | 1964 | 1861 | 1901 |
| Palmerston North | 1706 | 1703 | 1698 | 1697 | 1692 | 1726 | 1714 | 1672 |
| Masterton | 1851 | 1808 | 1817 | 1801 | 1786 | 1827 | 1818 | 1787 |
| Blenheim | 1914 | 1850 | 1849 | 1822 | 1844 | 1885 | 1901 | 1846 |
| Nelson | 1813 | 1790 | 1786 | 1790 | 1767 | 1818 | 1829 | 1744 |
| Greymouth | 1782 | 1689 | 1734 | 1671 | 1654 | 1696 | 1705 | 1655 |
| Ashburton | 1724 | 1608 | 1642 | 1624 | 1586 | 1580 | 1690 | 1693 |
| Timaru | 1745 | 1628 | 1684 | 1636 | 1598 | 1592 | 1729 | 1616 |
| Oamaru | 1762 | 1632 | 1676 | 1657 | 1517 | 1678 | 1786 | 1644 |
| Alexandra | 1932 | 1853 | 1916 | 1835 | 1816 | 1845 | 1963 | 1844 |
| Gore | 1834 | 1747 | 1784 | 1722 | 1705 | 1777 | 1850 | 1691 |
| Invercargill | 1840 | 1776 | 1883 | 1720 | 1714 | 1787 | 1825 | 1697 |
| Dominion weighted average | 1760 | 1716 | 1728 | 1708 | 1696 | 1733 | 1739 | 1688 |
It will be apparent from the above table that all but four of the towns shared in the fall recorded in this group from 1924 to 1925. The largest fall was recorded in Oamaru (130 points), while Christchurch showed the greatest fall of the four chief centres (74 points).
The fall in the prices of groceries appears to have been generally greater in the South Island than in the North, and the four centres which showed increases (Wanganui, Dannevirke, Taihape, and Hamilton) are all in the North Island.
The prices of commodities included in the dairy-produce group have shown an almost continuous increase since 1891—an increase which was considerably accelerated on the outbreak of the Great War. A particularly sharp rise during 1920, continuing daring the early months of the following year until a peak was reached in May (at an index number of 1978), was more than neutralized by a phenomenal drop at the end of 1921, since when (except for a slight rise during 1924) there has been astonishingly little movement in this group either in individual towns or for the Dominion as a whole. It is interesting, however, to note in passing that Wellington's index number for dairy-produce has in general maintained a level considerably higher, and that of Christchurch a level considerably lower, than those for the other two chief centres.
| DAIRY-PRODUCE.—INDEX NUMBERS, 1914–25.(Base: Average aggregate annual expenditure, four chief centres, 1909–13 = 1000.) | ||||||
|---|---|---|---|---|---|---|
| Year. | Auckland. | Wellington. | Christchurch. | Dunedin. | Average of Four Centres. | Dominion Weighted Average. |
| 1914 | 1019 | 1114 | 1016 | 1065 | 1054 | 1045 |
| 1915 | 1140 | 1196 | 1133 | 1146 | 1154 | 1153 |
| 1916 | 1288 | 1350 | 1251 | 1263 | 1288 | 1274 |
| 1917 | 1362 | 1425 | 1318 | 1351 | 1364 | 1353 |
| 1918 | 1443 | 1476 | 1328 | 1432 | 1420 | 1415 |
| 1919 | 1518 | 1553 | 1434 | 1529 | 1508 | 1504 |
| 1920 | 1776 | 1800 | 1723 | 1763 | 1766 | 1755 |
| 1921 | 1906 | 1891 | 1730 | 1814 | 1835 | 1838 |
| 1922 | 1456 | 1501 | 1425 | 1397 | 1445 | 1445 |
| 1923 | 1457 | 1540 | 1458 | 1464 | 1480 | 1479 |
| 1924 | 1560 | 1645 | 1464 | 1572 | 1560 | 1543 |
| 1925 | 1562 | 1591 | 1486 | 1560 | 1550 | 1537 |
Details for each town for the years 1924 and 1925 are appended, together with corresponding figures for each quarter of 1925 and the first two quarters of 1926.
| DAIRY-PRODUCE.—INDEX NUMBERS FOR TWENTY-FIVE TOWNS.(Base: Average aggregate annual expenditure, four chief centres, 1909–13 = 1000.) | ||||||||
|---|---|---|---|---|---|---|---|---|
| Town | Average of Four Quarters, 1924. | Average of Four Quarters, 1925. | First Quarter, 1925. | Second Quarter, 1925. | Third Quarter, 1925. | Fourth Quarter, 1925. | First Quarter, 1926. | Second Quarter, 1926. |
| Auckland | 1560 | 1562 | 1477 | 1624 | 1607 | 1539 | 1620 | 1706 |
| Wellington | 1645 | 1591 | 1512 | 1641 | 1644 | 1567 | 1562 | 1710 |
| Christchurch | 1464 | 1486 | 1428 | 1517 | 1504 | 1495 | 1482 | 1566 |
| Dunedin | 1572 | 1560 | 1481 | 1562 | 1629 | 1570 | 1536 | 1666 |
| Whangarei | 1546 | 1581 | 1480 | 1632 | 1654 | 1558 | 1551 | 1631 |
| Hamilton | 1530 | 1508 | 1444 | 1549 | 1516 | 1524 | 1516 | 1603 |
| Rotorua | 1564 | 1549 | 1495 | 1578 | 1569 | 1555 | 1574 | 1651 |
| Waihi | 1420 | 1454 | 1386 | 1533 | 1460 | 1435 | 1428 | 1589 |
| Gisborne | 1624 | 1637 | 1592 | 1694 | 1642 | 1621 | 1658 | 1859 |
| Napier | 1503 | 1501 | 1486 | 1530 | 1494 | 1493 | 1516 | 1687 |
| Dannevirke | 1499 | 1462 | 1283 | 1571 | 1523 | 1471 | 1513 | 1628 |
| New Plymouth | 1475 | 1473 | 1432 | 1520 | 1490 | 1451 | 1444 | 1528 |
| Wanganui | 1469 | 1490 | 1417 | 1513 | 1527 | 1504 | 1494 | 1603 |
| Taihape | 1600 | 1591 | 1497 | 1688 | 1630 | 1549 | 1519 | 1680 |
| Palmerston North | 1374 | 1359 | 1299 | 1384 | 1380 | 1372 | 1360 | 1497 |
| Masterton | 1521 | 1527 | 1462 | 1563 | 1550 | 1533 | 1513 | 1627 |
| Blenheim | 1608 | 1607 | 1529 | 1631 | 1643 | 1625 | 1588 | 1708 |
| Nelson | 1543 | 1548 | 1496 | 1569 | 1579 | 1548 | 1549 | 1690 |
| Greymouth | 1615 | 1639 | 1481 | 1737 | 1723 | 1616 | 1623 | 1798 |
| Ashburton | 1559 | 1477 | 1343 | 1500 | 1540 | 1523 | 1505 | 1584 |
| Timaru | 1589 | 1565 | 1513 | 1595 | 1603 | 1547 | 1486 | 1575 |
| Oamaru | 1493 | 1503 | 1434 | 1513 | 1529 | 1537 | 1513 | 1574 |
| Alexandra | 1544 | 1539 | 1482 | 1548 | 1568 | 1559 | 1539 | 1599 |
| Gore | 1514 | 1524 | 1458 | 1520 | 1557 | 1559 | 1473 | 1604 |
| Invercargill | 1431 | 1442 | 1360 | 1458 | 1472 | 1478 | 1464 | 1594 |
| Dominion weighted average | 1543 | 1537 | 1464 | 1576 | 1576 | 1531 | 1542 | 1654 |
The dairy-produce group exhibits definite seasonal fluctuations, mainly owing to the high autumn and winter prices of eggs and milk.
The index numbers for the meat group show a steady increase up to 1920, in December of which year the peak for this group was reached, at an index number of 1690. By March of the following year the index had dropped to 1471, largely owing to the fact that with the cessation of control by the Imperial Government large stocks of meat were liberated on the London market. By December, 1921, the monthly index number had fallen to 1233. From the low level of 1198 recorded in the spring of 1922 there was a sharp rise of approximately 200 points till the next spring; from when on till late in 1924 the index number remained remarkably steady. About the end of 1924 a rise set in, however, which continued until the index number was in November, 1925, within 16 points of the post-war peak, since when a falling tendency has manifested itself.
| MEAT.—INDEX NUMBERS, 1914–25.(Base: Average aggregate annual expenditure, four chief centres, 1909–13 = 1000.) | ||||||
|---|---|---|---|---|---|---|
| Year. | Auckland. | Wellington. | Christchurch. | Dunedin. | Average of four Centres. | Dominion Weighted Average. |
| 1914 | 1266 | 1112 | 1099 | 1103 | 1145 | 1150 |
| 1915 | 1293 | 1205 | 1191 | 1190 | 1220 | 1235 |
| 1916 | 1413 | 1274 | 1313 | 1283 | 1321 | 1348 |
| 1917 | 1500 | 1380 | 1449 | 1417 | 1437 | 1463 |
| 1918 | 1575 | 1476 | 1540 | 1507 | 1525 | 1545 |
| 1919 | 1596 | 1504 | 1607 | 1588 | 1574 | 1591 |
| 1920 | 1611 | 1529 | 1726 | 1727 | 1648 | 1657 |
| 1921 | 1384 | 1337 | 1469 | 1485 | 1419 | 1410 |
| 1922 | 1145 | 1183 | 1324 | 1235 | 1222 | 1211 |
| 1923 | 1310 | 1302 | 1398 | 1294 | 1326 | 1314 |
| 1924 | 1468 | 1340 | 1437 | 1346 | 1398 | 1400 |
| 1925 | 1603 | 1464 | 1564 | 1495 | 1532 | 1539 |
Details for each town for the years 1924 and 1925, and the last six quarters, are given in the following table:—
| MEAT.—INDEX NUMBERS FOR TWENTY-FIVE TOWNS.(Base: Average aggregate annual expenditure, four chief centres, 1909–13 = 1000.) | ||||||||
|---|---|---|---|---|---|---|---|---|
| Town. | Average of Four Quarters, 1924. | Average of Four Quarters, 1925. | First Quarter, 1925. | Second Quarter, 1925. | Third Quarter, 1925. | Fourth Quarter, 1925. | First Quarter 1926. | Second Quarter, 1926. |
| Auckland | 1468 | 1603 | 1507 | 1555 | 1644 | 1705 | 1628 | 1465 |
| Wellington | 1340 | 1464 | 1391 | 1400 | 1474 | 1590 | 1523 | 1483 |
| Christchurch | 1437 | 1564 | 1536 | 1531 | 1587 | 1601 | 1496 | 1481 |
| Dunedin | 1346 | 1495 | 1376 | 1386 | 1556 | 1661 | 1592 | 1576 |
| Whangarei | 1403 | 1559 | 1453 | 1470 | 1611 | 1700 | 1665 | 1611 |
| Hamilton | 1244 | 1514 | 1413 | 1525 | 1534 | 1584 | 1453 | 1370 |
| Rotorua | 1275 | 1385 | 1347 | 1334 | 4395 | 1465 | 1336 | 1337 |
| Waihi | 1440 | 1512 | 1453 | 1453 | 1469 | 1674 | 1672 | 1675 |
| Gisborne | 1273 | 1523 | 1476 | 1488 | 1532 | 1596 | 1572 | 1531 |
| Napier | 1152 | 1300 | 1214 | 1269 | 1338 | 1377 | 1360 | 1375 |
| Dannevirke | 1222 | 1401 | 1306 | 1328 | 1433 | 1538 | 1421 | 1422 |
| New Plymouth | 1415 | 1517 | 1409 | 1413 | 1464 | 1780 | 1597 | 1549 |
| Wanganui | 1225 | 1416 | 1315 | 1325 | 1437 | 1585 | 1585 | 1502 |
| Taihape | 1494 | 1610 | 1608 | 1612 | 1647 | 1572 | 1511 | 1414 |
| Palmerston North | 1327 | 1444 | 1393 | 1358 | 1444 | 1582 | 1509 | 1448 |
| Masterton | 1563 | 1679 | 1682 | 1682 | 1685 | 1668 | 1538 | 1536 |
| Blenheim | 1574 | 1593 | 1575 | 1571 | 1603 | 1621 | 1582 | 1579 |
| Nelson | 1642 | 1751 | 1691 | 1694 | 1792 | 1826 | 1813 | 1835 |
| Greymouth | 1675 | 1736 | 1705 | 1704 | 1762 | 1772 | 1687 | 1663 |
| Ashburton | 1679 | 1777 | 1775 | 1776 | 1780 | 1778 | 1707 | 1712 |
| Timaru | 1482 | 1576 | 1529 | 1459 | 1539 | 1778 | 1755 | 1616 |
| Oamaru | 1380 | 1577 | 1376 | 1470 | 1617 | 1843 | 1626 | 1535 |
| Alexandra | 1511 | 1619 | 1560 | 1560 | 1597 | 1760 | 1673 | 1569 |
| Gore | 1430 | 1606 | 1535 | 1538 | 1627 | 1723 | 1540 | 1413 |
| Invercargill | 1456 | 1671 | 1582 | 1549 | 1725 | 1828 | 1565 | 1517 |
| Dominion weighted average | 1400 | 1539 | 1463 | 1479 | 1566 | 1649 | 1567 | 1501 |
Comparing 1924 and 1925, meat was the only food group to show a rise, and this rise (of 139 points) was sufficient to neutralize falls in each of the other two food groups. In no town was a fall recorded; while the following centres actually showed rises of over 200 points: Hamilton (270), Gisborne (250). Invercargill (215). The smallest rise (19 points) was recorded in Blenheim.
For purposes of all the foregoing tables the base period has been taken as the average of the years 1909–13. For many purposes, however, interest centres on the increase in prices over those prevailing immediately prior to the outbreak of the Great War. One of the advantages of the aggregate expenditure method is that it enables index numbers computed on one base to be rigorously converted by a simple application of the rule of proportion to some other base regarded as desirable for some special purpose, thus obviating the necessity for the laborious recomputation of the index numbers on the new base ab initio. July, 1914, is a particularly desirable base, representing as it does conditions immediately prior to the outbreak of the Great War. The following table shows Dominion weighted average increases in food-prices between July, 1914, and each quarter of 1925:—
| INCREASE IN FOOD-PRICES BETWEEN 1914 (JULY) AND 1925. | ||||||||||
|---|---|---|---|---|---|---|---|---|---|---|
| Group. | First Quarter, 1925. | Second Quarter, 1925. | Third Quarter, 1925. | Fourth Quarter, 1925. | Average of Year 1925. | |||||
| Index Number. | Percentage Increase.* | Index Number. | Percentage Increase.* | Index Number. | Percentage Increase.* | Index Number. | Percentage Increase.* | Index Number. | Percentage Increase.* | |
* Over July, 1914. | ||||||||||
| Groceries (index number, July, 1914: 1033) | 1728 | 67.3 | 1708 | 65.3 | 1696 | 64.2 | 1733 | 67.8 | 1716 | 66.1 |
| Dairy-produce (index number, July, 1914: 1057) | 1464 | 38.5 | 1576 | 49.1 | 1576 | 49.1 | 1531 | 44.8 | 1537 | 45.4 |
| Meat (index number, July, 1914: 1127) | 1463 | 29.8 | 1479 | 31.2 | 1566 | 390 | 1649 | 46.3 | 1539 | 36.6 |
| Three food groups (index number, July, 1914: 1070) | 1576 | 47.3 | 1600 | 49.5 | 1624 | 51.8 | 1658 | 550 | 1615 | 50.9 |
The accompanying table exhibits recent retail-price quotations, in London and in Wellington, of certain articles in common household consumption. In the case of the dairy-produce and meat quotations, the London prices given are those of the English-produced commodity; for, the London market being occasionally quite bare of supplies of the New-Zealand-produced article, it is impossible to obtain continuous quotations of the retail price in London of New Zealand beef, mutton, butter, and cheese. Generally speaking, however, it may be taken as roughly correct that, during the period covered by the table, the London retail price of New Zealand rib beef was slightly less than half the price of the locally produced article; of New Zealand rump steak, slightly more than half; of New Zealand legs of mutton, about two-thirds that of the locally produced article; and of New Zealand butter and cheese, about 4d. per pound less than that of the English commodity.
| RETAIL PRICES OF CERTAIN COMMODITIES, LONDON AND WELLINGTON, 1923–25. | ||||||||||||||
|---|---|---|---|---|---|---|---|---|---|---|---|---|---|---|
| — | Bread (2 lb. Loaf). | Sugar, Granulated (per Pound). | Rib Beef (per Pound). | Leg Mutton (per Pound). | Rump Steak (per Pound). | Butter (per Pound). | Cheese (per Pound). | |||||||
| Wgtn. | London. | Wgtn. | London. | Wgtn. | London. | Wgtn. | London. | Wgtn. | London. | Wgtn. | London. | Wgtn. | London. | |
| 1923. | d. | d. | d. | d. | d. | d. | d. | d. | d. | d. | d. | d. | d. | d. |
| January | 6 ½ | 4 ½ | 3 ¾ | 6 ½ | 5 ¼ | 22 | 7 ½ | 21 | 10 ¾ | 30 ½ | 20 ¾ | 28 | 11 ¾ | 19 |
| April | 6 ½ | 4 ½ | 4 | 7 ½ | 5 ½ | 21 | 8 ¼ | 20 | 10 ¾ | 30 | 20 ¾ | 28 | 11 ¾ | 18 |
| July | 6 ½ | 4 ½ | 4 | 7 | 5 ½ | 22 | 8 ½ | 20 | 10 ½ | 30 | 19 ¾ | 24 | 11 ¾ | 18 |
| October | 6 ½ | 4 ½ | 4 | 7 | 6 | 22 | 9 ¼ | 18 | 11 | 32 | 20 ½ | 28 | 11 ¾ | 18 ½ |
| 1924. | ||||||||||||||
| January | 6 | 4 | 4 ½ | 7 | 5 ¾ | 20 | 9 | 18 | 11 | 28 | 21 ¾ | 30 | 12 ¼ | 19 |
| April | 6 ½ | 4 | 4 ¾ | 7 ¼ | 5 ¾ | 19 | 9 | 18 | 11 | 27 | 19 ¼ | 25 ½ | 11 ½ | 19 |
| July | 6 ½ | 4 ¼ | 4 ¾ | 4 ¾ | 5 ¾ | 20 | 8 ½ | 18 ½ | 11 | 28 | 19 ¾ | 27 ½ | 11 ¾ | 20 |
| October | 6 ½ | 4 ¾ | 4 ¼ | 4 ¾ | 5 ¾ | 21 | 84 | 18 | 11 | 27 | 21 ¾ | 29 ½ | 12 | 19 |
| 1925. | ||||||||||||||
| January | 6 ½ | 5 | 3 ¾ | 4 ¼ | 6 ¼ | 20 | 9 ¼ | 19 | 11 | 30 | 19 ¼ | 28 | 12 | 19 |
| February | 6 ½ | 5 ¼ | 3 ½ | 4 | 6 ¼ | 19 | 94 | 19 | 11 | 31 | 18 ½ | 26 ½ | 12 | 19 |
| March | 7 | 5 ¼ | 3 ½ | 4 ¼ | 6 ½ | .. | 9 | .. | 11 ½ | .. | 18 ½ | 27 ½ | 11 ¾ | 19 |
| April | 7 | 5 ¼ | 3 ½ | 4 | 6 ½ | 19 | 9 | 21 | 11 ½ | 31 | 18 ½ | 27 ½ | 11 ¾ | 19 ½ |
| May | 6 ½ | 5 | 3 ½ | 4 | 6 ½ | 19 | 9 | 20 ½ | 11 ½ | 31 | 18 ½ | 26 ½ | 11 ¾ | 20 |
| June | 6 ½ | 5 | 3 ½ | 4 ¼ | 6 ½ | 20 | 9 | 20 ½ | 11 ½ | 32 | 19 ¼ | 26 ½ | 11 ¾ | 20 |
| July | 6 ½ | 5 | 3 | 4 | 6 ½ | 21 ½ | 9 | 20 ½ | 11 ½ | 33 | 20 ¼ | 28 | 124 | 20 |
| August | 6 ½ | 5 | 3 | 4 | 6 ¾ | 21 | 9 ½ | 19 | 11 ½ | 33 | 21 ¼ | 29 ½ | 12 ¼ | 20 |
| September | 6 ½ | 5 | 3 | 4 | 7 | 20 | 10 | 19 | 11 ¾ | 32 | 21 ½ | 29 ½ | 12 ¼ | 20 |
| October | 6 ½ | 4 ¾ | 3 | 4 | 7 ¾ | 20 | 10 | 18 | 12 | 31 | 22¼ | 30 ½ | 12 ¼ | 20 |
| November | 6 ½ | 4 ½ | 3 | 3 ½ | 7 ¾ | 19 | 10 | 17 ½ | 12 | 31 | 20 ¾ | 30 ½ | 12 ½ | 20 |
| December | 6 ½ | 5 | 3 | 3 ½ | 7 ½ | 20 | 9 ¾ | 17 | 12 | 30 | 20 | 29 | 12 ½ | 20 |
In the case of the meat and dairy-produce articles covered by the table, it must be noted that these commodities differ from the rest in that they are staple exports of the Dominion, their New Zealand retail prices being determined largely by world conditions of supply and demand (of which the London retail price may be regarded as a fairly good barometer), less the cost of shipment and the deterioration in the value of the commodities through shipment and through other causes tending to render it inferior to the English-produced articles. The difference between the London and Wellington prices is least in the case of butter (with cheese a close second), and most in the case of beef. As a matter of fact, the Wellington price of cheese is generally lower than the corresponding price in other centres of the Dominion; so that the effect of having taken Wellington to represent the Dominion is somewhat to exaggerate the differences in retail quotations between this country and the Homeland.
The price of sugar in New Zealand is determined largely by conditions of cane-sugar production in Fiji (and to a lesser degree in Java and Australia). Sugar is imported into New Zealand in the raw state, and refined at Auckland. The price of sugar in London is determined rather by conditions of production of cane-sugar in the West Indies, and beet-sugar in Western Europe. The sharp drop in the London retail price since the spring of 1924 was attributable to increased production in the face of an absence of demand, coupled with a cut of 1 ½d. per pound in the import duties.
In the case of bread, it must be remembered that New Zealand is now normally self-sufficing as regards wheat and flour, but no more than self-sufficing. Prior to 1895 wheat was, it is true, an important item in the exports of the Dominion; but with the advent of refrigeration, the farmer has gradually switched over from agriculture (in the narrow sense) to pasturing and dairying. Occasionally still there is a small surplus of wheat for export: on the other hand, in years of shortage, it has been found necessary to remove the war-time and post-war embargo on the importation of wheat and flour, and to make good the local deficiency by importation. It is noteworthy that although New Zealand produces the bulk of its local requirements in wheat, while Great Britain is mainly dependent on imports, the price of bread in New Zealand is nevertheless higher than in London. In this connection it should be mentioned that the difference between the London and New Zealand prices is slightly exaggerated by the fact that Wellington quotations have been selected for comparison. In the South Island centres (which are adjacent to New Zealand's principal wheat-producing areas—viz., Canterbury and North Otago) the price of the 2 lb. loaf is normally about ½d. less than in the northern centres.
Comparisons have recently been effected between the prices of selected samples of a large number of items of food in New Zealand and in other countries. Using the weights used in the compilation of the New Zealand food price-index, attempts have been made to determine the relation between food-prices in New Zealand and in other countries, experiments having shown that the use of the weights employed in the computation of the index numbers of the other countries respectively does not greatly affect the result in the cases of comparisons between countries with not essentially dissimilar standards of living. The commodities included, though few, cover the most important foodstuffs. The data shown in the first column of figures below are the results, taking food-prices in New Zealand (Dominion weighted average) in February, 1926, as 100.
| Country. | Percentage of Food Prices to New Zealand Food Prices, | |
|---|---|---|
| February, 1926. | July, 1914. | |
| United States | 141 | 129 |
| Canada | 127 | 125 |
| Australia | 106 | 105 ½ |
| South Africa | 108 | 141 |
The data in the last column of this table have been arrived at by working back from the results shown in the previous column on the basis of the published index numbers respectively for the countries concerned.
In investigating changes in the cost of housing the Census and Statistics Office has deemed it sufficient to trace the movements of house-rent over a series of years, on the grounds that such provide a reasonably accurate indication of movements in housing-costs in general, not only for those classes of persons who may be paying rent, but also for those who own or partially own the dwellings they occupy.
By reason of the fact that leases, infrequent changes of residence, and the difficulty of departing from customary rents all tend to make the movement of the general level of rents comparatively slow, it has not been deemed necessary to attempt to measure the changes over short periods. The data from which the rent figures given hereafter have been compiled are therefore collected semi-annually only in the months of February and August. Annual index numbers for rent are computed on the assumption that the February index number represents conditions prevailing during the first four and a half months of the year, the August number conditions prevailing during the next six months, and the number for February of the following year conditions prevailing during the last one and a half months of the year. Though somewhat arbitrary, this assumption gives a truer picture of conditions prevailing during the year than a straight-out simple unweighted average of the February and August index numbers for the year under investigation.
| RENT.—INDEX NUMBERS, 1914–25.(Base: Average aggregate annual expenditure, four chief centres, 1909–13 = 1000.) | ||||||
|---|---|---|---|---|---|---|
| Year. | Auckland. | Wellington. | Christchurch. | Dunedin. | Average of Four Centres. | Dominion Weighted Average. |
| 1914 | 1036 | 1173 | 962 | 969 | 1035 | 985 |
| 1915 | 1005 | 1191 | 965 | 965 | 1056 | 994 |
| 1916 | 985 | 1217 | 951 | 963 | 1029 | 989 |
| 1917 | 980 | 1249 | 967 | 949 | 1036 | 1008 |
| 1918 | 1010 | 1296 | 1016 | 984 | 1077 | 1037 |
| 1919 | 1055 | 1321 | 1060 | 994 | 1108 | 1067 |
| 1920 | 1175 | 1311 | 1113 | 1012 | 1153 | 1124 |
| 1921 | 1279 | 1348 | 1276 | 1071 | 1244 | 1236 |
| 1922 | 1363 | 1439 | 1355 | 1192 | 1337 | 1335 |
| 1923 | 1481 | 1602 | 1499 | 1309 | 1473 | 1460 |
| 1924 | 1605 | 1823 | 1612 | 1287 | 1582 | 1575 |
| 1925 | 1720 | 1904 | 1727 | 1389 | 1685 | 1664 |
It is advisable to stress that the index numbers in respect of rent indicate the movement in the average rentals of a large number of houses already let, in many cases for some time, and that they do not purport to convoy any statement as to the price at which housing accommodation has been obtainable from time to time by would-be occupants of houses then being relet.
The following table shows the average rents ruling for houses of various numbers of rooms in each of the four chief centres in February and August, 1925, and February, 1926:—
| Number of Rooms. | Auckland. | Wellington. | Christchurch. | Dunedin. | ||||||||||||||||||||
|---|---|---|---|---|---|---|---|---|---|---|---|---|---|---|---|---|---|---|---|---|---|---|---|---|
| Feb., 1925. | Aug., 1925. | Feb., 1926. | Feb., 1925. | Aug., 1925. | Feb., 1926. | Feb., 1925. | Aug., 1925. | Feb., 1926. | Feb., 1925. | Aug., 1925. | Feb., 1926. | |||||||||||||
| s. | d. | s. | d. | s. | d. | s. | d. | s. | d. | s. | d. | s. | d. | s. | d. | s. | d. | s. | d. | s. | d. | s. | d. | |
| 4 | 18 | 0 | 19 | 7 | 20 | 4 | 20 | 7 | 20 | 10 | 21 | 9 | 18 | 2 | 19 | 4 | 19 | 4 | 14 | 0 | 14 | 0 | 14 | 5 |
| 5 | 24 | 4 | 24 | 7 | 25 | 7 | 26 | 7 | 30 | 5 | 29 | 9 | 25 | 10 | 26 | 5 | 26 | 3 | 19 | 4 | 20 | 10 | 21 | 9 |
| 6 | 31 | 5 | 32 | 1 | 32 | 7 | 31 | 8 | 34 | 8 | 35 | 7 | 29 | 10 | 32 | 0 | 31 | 3 | 25 | 10 | 26 | 0 | 27 | 3 |
| 7 | 40 | 2 | 37 | 8 | 39 | 10 | 43 | 7 | 42 | 11 | 40 | 1 | 37 | 9 | 36 | 10 | 39 | 4 | 31 | 5 | 32 | 1 | 33 | 1 |
Index numbers for each of the twenty-five towns at each of the dates of collection in 1924 and 1925 and at February, 1926, are appended, along with yearly index numbers for 1924 and 1925:—
| HOUSE-RENT.—INDEX NUMBERS FOR TWENTY-FIVE REPRESENTATIVE TOWNS.(Base: Average aggregate annual expenditure, four chief centres, 1909–13 = 1000.) | |||||||
|---|---|---|---|---|---|---|---|
| Town. | Yearly Average, 1924. | Yearly Average, 1925. | February, 1924. | August, 1924. | February, 1925. | August, 1925. | February, 1926. |
| Auckland | 1605 | 1720 | 1541 | 1630 | 1697 | 1723 | 1778 |
| Wellington | 1823 | 1904 | 1781 | 1856 | 1819 | 1955 | 1954 |
| Christchurch | 1612 | 1727 | 1579 | 1619 | 1686 | 1751 | 1752 |
| Dunedin | 1287 | 1389 | 1282 | 1274 | 1357 | 1397 | 1454 |
| Whangarei | 1729 | 1795 | 1649 | 1792 | 1717 | 1825 | 1909 |
| Hamilton | 2105 | 1986 | 2142 | 2081 | 2087 | 1916 | 1964 |
| Rotorua | 1630 | 1510 | 1639 | 1671 | 1441 | 1483 | 1825 |
| Waihi | 804 | 792 | 816 | 803 | 774 | 804 | 796 |
| Gisborne | 1497 | 1488 | 1486 | 1511 | 1473 | 1495 | 1508 |
| Napier | 1485 | 1519 | 1466 | 1495 | 1500 | 1537 | 1500 |
| Dannevirke | 1361 | 1394 | 1455 | 1301 | 1320 | 1418 | 1521 |
| New Plymouth | 1696 | 1749 | 1686 | 1719 | 1632 | 1799 | 1909 |
| Wanganui | 1537 | 1607 | 1541 | 1528 | 1562 | 1603 | 1755 |
| Taihape | 1621 | 1614 | 1626 | 1614 | 1631 | 1599 | 1625 |
| Palmerston North | 1693 | 1792 | 1639 | 1711 | 1784 | 1807 | 1753 |
| Masterton | 1480 | 1558 | 1411 | 1520 | 1529 | 1588 | 1527 |
| Blenheim | 1467 | 1451 | 1498 | 1449 | 1449 | 1476 | 1356 |
| Nelson | 1222 | 1391 | 1149 | 1262 | 1284 | 1459 | 1440 |
| Greymouth | 992 | 1037 | 1043 | 953 | 997 | 1048 | 1115 |
| Ashburton | 1349 | 1470 | 1231 | 1424 | 1405 | 1514 | 1489 |
| Timaru | 1522 | 1605 | 1483 | 1551 | 1524 | 1650 | 1667 |
| Oamaru | 1219 | 1295 | 1173 | 1249 | 1237 | 1345 | 1271 |
| Alexandra | 871 | 934 | 869 | 857 | 996 | 937 | 912 |
| Gore | 1042 | 1085 | 1048 | 1031 | 1070 | 1087 | 1119 |
| Invercargill | 1304 | 1417 | 1211 | 1355 | 1379 | 1414 | 1545 |
| Dominion weighted average | 1575 | 1664 | 1538 | 1590 | 1622 | 1682 | 1714 |
A noteworthy feature of the statistics of house-rent disclosed by the foregoing table is the position occupied by Hamilton, where rents have since 1922 been considerably higher than those of any of the four chief centres, though for most of the war and the early post-war years Wellington stood highest in this respect.
In 1925 Wellington was lower than Auckland on the showing of the three food groups. The effect of the combination of the three food groups and the rent group index numbers in such a manner as to give each index number an importance proportionate to that which it possesses in the expenditure of the average New Zealand household is, however, to reverse completely the relative positions of these two cities. Similarly, Dunedin was higher than Christchurch on the showing of the three food groups, but the effect of the combination of food and rent would be to reverse the relative positions of the two southern cities.
Generally speaking, apart from the consideration of different rates of population-increase, the chief centres have higher rentals than the minor centres. The following table, showing a comparison between price-levels during 1925 in the four chief centres and in the twenty-one smaller towns from which information is collected, is illuminative in this connection:-
| Group. | Yearly Average, 1925. | Yearly Average, 1924. | |||
|---|---|---|---|---|---|
| Weighted Average of Four Chief Centres. (a.) | Weighted Average of Twenty-one Smaller Centres. (b.) | Excess of (a) over (b). | Dominion Weighted Average. | Dominion Weighted Average. | |
* Excess of (b) over (a). | |||||
| Groceries | 1695 | 1768 | -73* | 1716 | 1760 |
| Dairy-produce | 1551 | 1505 | 46 | 1537 | 1543 |
| Meat | 1542 | 1534 | 8 | 1539 | 1400 |
| Three food groups | 1609 | 1627 | -18* | 1615 | 1587 |
| House-rent | 1712 | 1549 | 163 | 1664 | 1575 |
In this respect rent is similar to dairy-produce and meat prices, and quite different from groceries prices. The difference between country towns on the one hand and the more closely populated cities is, however, much more marked in the case of rent than in that of any of the food groups.
An alternative statement of the difference in price-levels as between each of the twenty-five towns considered is given in the next table. Similar figures may easily be compiled for the various quarters by working from the index numbers and equating 1000 to 20s. The retail-price indexes in the average of the five years 1909–13 in the four centres are taken as bases and equated to 20s., and the sums of money shown in the following table bear the same proportion to 20s. as the corresponding price-index bears to 1000. The amounts displayed in the table may be compared vertically but not horizontally, since the various groups have different bases.
| AMOUNTREQUIREDTO PURCHASEIN TWENTY-FIVE REPRESENTATIVE TOWNSIN 1925 WHATWOULDHAVECOST 20s. INthe AVERAGE of THE FOUR CHIEF CENTRES, 1909–13. | ||||||||||
|---|---|---|---|---|---|---|---|---|---|---|
| Town. | Group I: Groceries. | Group II: Dairy-produce. | Group III: Meat. | Groups I-III. Food Groups. | Group IV: House-rent. | |||||
| s. | d. | s. | d. | s. | d. | s. | d. | s. | d. | |
| Auckland | 34 | 3 | 31 | 3 | 32 | 1 | 32 | 9 | 34 | 5 |
| Wellington | 34 | 1 | 31 | 10 | 29 | 3 | 31 | 11 | 38 | 1 |
| Christchurch | 32 | 9 | 29 | 9 | 31 | 3 | 31 | 7 | 34 | 6 |
| Dunedin | 34 | 5 | 31 | 2 | 29 | 11 | 32 | 1 | 27 | 9 |
| Whangarei | 37 | 6 | 31 | 7 | 31 | 2 | 34 | 0 | 35 | 11 |
| Hamilton | 37 | 4 | 30 | 2 | 30 | 3 | 33 | 3 | 39 | 9 |
| Rotorua | 37 | 5 | 31 | 0 | 27 | 9 | 32 | 7 | 30 | 2 |
| Waihi | 36 | 1 | 29 | 1 | 30 | 3 | 32 | 6 | 15 | 10 |
| Gisborne | 37 | 6 | 32 | 9 | 30 | 6 | 34 | 0 | 29 | 9 |
| Napier | 35 | 6 | 30 | 0 | 26 | 0 | 31 | 0 | 30 | 5 |
| Dannevirke | 37 | 8 | 29 | 3 | 28 | 0 | 32 | 5 | 27 | 11 |
| New Plymouth | 34 | 9 | 29 | 6 | 30 | 4 | 32 | 0 | 35 | 0 |
| Wanganui | 35 | 5 | 29 | 9 | 28 | 4 | 31 | 9 | 32 | 2 |
| Taihape | 37 | 9 | 31 | 10 | 32 | 2 | 34 | 6 | 32 | 3 |
| Palmerston North | 34 | 1 | 27 | 2 | 28 | 11 | 30 | 9 | 35 | 10 |
| Masterton | 36 | 2 | 30 | 6 | 33 | 7 | 34 | 0 | 31 | 2 |
| Blenheim | 37 | 0 | 32 | 2 | 31 | 10 | 34 | 1 | 29 | 0 |
| Nelson | 35 | 9 | 31 | 0 | 35 | 0 | 34 | 5 | 27 | 10 |
| Greymouth | 33 | 9 | 32 | 9 | 34 | 9 | 33 | 10 | 20 | 9 |
| Ashburton | 32 | 2 | 29 | 6 | 35 | 6 | 32 | 9 | 29 | 5 |
| Timaru | 32 | 7 | 31 | 4 | 31 | 6 | 31 | 11 | 32 | 1 |
| Oamaru | 32 | 8 | 30 | 1 | 31 | 6 | 31 | 8 | 25 | 11 |
| Alexandra | 37 | 1 | 30 | 9 | 32 | 5 | 34 | 0 | 18 | 8 |
| Gore | 34 | 11 | 30 | 6 | 32 | 1 | 32 | 11 | 21 | 9 |
| Invercargill | 35 | 6 | 28 | 10 | 33 | 5 | 33 | 3 | 28 | 4 |
| Dominion weighted average | 34 | 4 | 30 | 9 | 30 | 9 | 32 | 4 | 33 | 3 |
Considerable difficulties are met with in any attempt to follow accurately the course of prices in the fuel and light group. It has, in fact, been found impossible to settle on any list of commodities used in anything like comparable proportions as between the four chief centres at any one time, or indeed in any one centre over any great length of time. Not only do the comparative usages of coal, electricity, gas, kerosene, and candles vary greatly even between the four centres, but the first commodity presents a very special difficulty for comparative purposes by reason of the several different qualities of it used in the various towns.
However, a small group of seven items—coal, coke, firewood, kerosene, gas for lighting, electricity for lighting, and candles—has been considered, and prices for the four chief centres have been collected for as many past years as possible (from 1907 onwards). It was found impossible to extend even this list to the remaining twenty-one centres covered by the retail - prices investigation: Alexandra, for example, installed electric lighting only during 1925, and a gas-supply has never been available in that little town. Blenheim has long enjoyed gas, but has not as yet an electricity-supply.
The peak in the fuel and light group (as shown by the monthly index numbers) was attained in July, 1921, the price-index for that month being 2109. Details for each of the war-time and post-war years, and for each quarter since the beginning of 1925, are appended.
| FUEL AND LIGHT.—INDEX NUMBERS, 1914–26.(Base: Average aggregate annual expenditure, four chief centres, 1909–13 = 1000.) | |||||
|---|---|---|---|---|---|
| Period. | Auckland. | Wellington. | Christchurch. | Dunedin. | Average of Four Centres. |
| Yearly. | |||||
| 1914 | 1035 | 1139 | 1150 | 916 | 1600 |
| 1915 | 1025 | 1134 | 1136 | 955 | 1063 |
| 1916 | 1147 | 1190 | 1219 | 1062 | 1155 |
| 1917 | 1335 | 1292 | 1459 | 1201 | 1322 |
| 1918 | 1442 | 1393 | 1559 | 1319 | 1428 |
| 1919 | 1555 | 1498 | 1690 | 1489 | 1558 |
| 1920 | 1902 | 1853 | 1914 | 1807 | 1869 |
| 1921 | 2133 | 2028 | 2311 | 1889 | 2090 |
| 1922 | 1969 | 1934 | 2066 | 1714 | 1921 |
| 1923 | 1919 | 1791 | 1982 | 1645 | 1834 |
| 1924 | 1947 | 1771 | 1972 | 1614 | 1826 |
| 1925 | 1916 | 1796 | 1951 | 1652 | 1829 |
| Quarterly. | |||||
| First, 1925 | 1917 | 1796 | 1890 | 1637 | 1810 |
| Second, 1925 | 1899 | 1795 | 1968 | 1648 | 1828 |
| Third, 1925 | 1911 | 1798 | 1971 | 1657 | 1834 |
| Fourth, 1925 | 1936 | 1795 | 1976 | 1666 | 1843 |
| First, 1926 | 1976 | 1808 | 1956 | 1649 | 1847 |
| Second, 1926 | 1978 | 1804 | 1953 | 1660 | 1849 |
Over the average of the four centres a considerable advance in the index numbers of this group has been noticeable, the highest annual figure (average of four chief centres) being considerably above the highest recorded in any of the four preceding groups, or any of their subgroups except Group Ic (sugar). This movement has been common to all four cities, and was particularly rapid as between 1919 and 1920, when the general index number increased by 311 points. There was a further considerable increase during 1921, since when considerable decreases have been recorded in all four centres.
Prices prevailing for coal exercise a preponderating influence on the price-indexes for this group. Of the four chief centres, Auckland and Dunedin alone possess coal resources in their immediate vicinity: hence fuel and lighting price-indexes have been fairly consistently lower for these than for the remaining two chief centres. Both Christchurch and Wellington are obliged to obtain their coal from a distance, and the fact that the supplies necessarily come part of the distance by land in the former case and almost wholly by water in the latter is doubtless responsible for Christchurch having easily the highest showing.
In regard to the method of treatment of the clothing and miscellaneous groups, it is to be explained that, as in the case of fuel and light, the inquiry is in general restricted to the four chief centres; further, except as regards fares, in respect of which accurate weights based on usage in the base period are available, enabling the aggregate-expenditure method to be employed, no satisfactory information is available or procurable which would enable individual weights to be allotted to each item. For this reason the same measure of precision is not possible in the treatment of these groups, but by selective balancing of representative items and arranging them in representative subgroups a measure of weighting is secured, each subgroup being treated as a separate unit. The ratios of prices at the date under investigation to prices in July, 1914, for the various items comprising the different subgroups are first averaged geometrically, and the results so obtained are then combined in order to arrive at the price ratio for the group. The weights allotted to the subgroups for this latter purpose are in a measure arbitrary, but are based on the best information available.
| Group and Subgroup. | Weight. |
|---|---|
| VI. Clothing— | |
| (a.) Clothing and drapery | 11.00 |
| (b.) Footwear | 2.89 |
| 13.89 | |
| VII. Miscellaneous— | |
| (a.) Household furnishings | 3.00 |
| (b.) Household ironmongery and brushware | 2.00 |
| (c.) Crockery | 2.00 |
| (d.) Train and tram fares | 3.50 |
| (e.) Newspapers and periodicals | 2.50 |
| (f.) Personal expenditure | 0.95 |
| 13.95 | |
Prior to November, 1925, price quotations in connection with the commodities of Groups VI and VII were collected semi-annually only, in January and July, annual figures being computed in the same manner, mutatis mutandis, as annual index numbers for rent. Since the date mentioned, however, they have been collected quarterly.
The movement of prices of clothing and miscellaneous items from year to year may be traced in the table under the next heading.
From a collection of household budgets by the Labour Department in 1910–11 the average household expenditure under various heads was found to be as follows:—
| Per Cent. | |
|---|---|
| Food | 34.13 |
| Housing | 20.31 |
| Clothing, drapery, and footwear | 13.89 |
| Fuel and light | 5.22 |
| Miscellaneous | 26.45 |
| 100.00 |
These weights are applied to the index numbers of the different groups in the process of arriving at the “all groups” retail price-index, with the exception that the weight applied to the miscellaneous group is 13.95 and not 26.45. Thus 87 ½ per cent. of household expenditure is covered by the index number. The remaining 12 ½ per cent. represents miscellaneous items for which it has so far been found impossible to obtain reliable price-quotations. Their omission has the effect of giving them the same general average price-movement as the 87 ½ per cent. covered.
The following table shows the index numbers for all groups for each year from 1914 onwards. It should be noted that the annual index numbers given represent the average price-level during each year, not at any of the particular points during the year at which the prices for the respective groups were collected:—
| ALL GROUPS INDEX NUMBERS, 1914–25.(Base: Dominion weighted average of prices in July, 1914, in twenty-five centres incase of Groups I to V, and average of prices in July, 1914, in four chief centres-in case of Groups VI and VII = 1000.) | |||||||||
|---|---|---|---|---|---|---|---|---|---|
| — | Food Groups. | Rent. | Fuel and Light. | Clothing, Drapery, and Footwear. | Miscellaneous. | All Groups combined. | |||
| Groceries. | Dairy-produce. | Meat. | Three Food Groups. | ||||||
* January figure. † July figure. ‡ Interpolated. | |||||||||
| July, 1914 | 1000 | 1000 | 1000 | 1000 | 1000 | 1000 | 1000 | 1000 | 1000 |
| Year—1915 | 1167 | 1091 | 1096 | 1124 | 1010 | 1013 | 1089 | 1035 | 1072 |
| 1916 | 1180 | 1205 | 1196 | 1193 | 1005 | 1101 | 1274 | 1216 | 1160 |
| 1917 | 1263 | 1280 | 1298 | 1280 | 1024 | 1260 | 1563 | 1423 | 1287 |
| 1918 | 1440 | 1339 | 1371 | 1393 | 1054 | 1361 | 1790 | 1733 | 1426 |
| 1919 | 1520 | 1423 | 1412 | 1459 | 1084 | 1485 | 2163 | 2003 | 1567 |
| 1920 | 1864 | 1660 | 1470 | 1677 | 1142 | 1782 | 2450 | 2305 | 1776 |
| 1921 | 1924 | 1739 | 1251 | 1641 | 1256 | 1992 | 2256 | 2327 | 1774 |
| 1922 | 1752 | 1367 | 1075 | 1421 | 1357 | 1831 | 1879 | 2040 | 1597 |
| 1923 | 1675 | 1399 | 1166 | 1430 | 1484 | 1781 | 1756 | 1867 | 1580 |
| 1924 | 1704 | 1460 | 1242 | 1483 | 1601 | 1741 | 1675 | 1795 | 1604 |
| 1925 | 1661 | 1454 | 1366 | 1509 | 1690 | 1744 | 1641 | 1740 | 1622 |
| Feb., 1925 | 1637 | 1362 | 1305 | 1456 | 1648 | 1716 | 1664* | 1764* | 1596 |
| Aug., 1925 | 1645 | 1494 | 1390 | 1520 | 1709 | 1733 | 1646† | 1743† | 1631 |
| Nov., 1925 | 1679 | 1447 | 1485 | 1558 | 1726‡ | 1743 | 1599 | 1699 | 1636 |
| Feb., 1926 | 1677 | 1465 | 1394 | 1527 | 1742 | 1763 | 1573 | 1688 | 1624 |
For purposes of this table the index numbers for the first five groups are converted to July, 1914, base by dividing the index numbers on base 1909–13 = 1000 by the following correction divisors, being in each case the index number for July, 1914, on base 1909–13 = 1: Groceries, 1.033; dairy-produce, 1.057; meat, 1.127; three food groups, 1.070; rent, 0.984; fuel and light, 1.049.
The following table, which is based on the average of the index numbers of the four chief centres as set out in the preceding table, gives an indication (in money figures) of the extent to which prices have risen during the period 1914–25. The table shows the amount necessary, on the average, to purchase in successive war-time and post-war years the same quantity of various types of commodities as would have cost 20s. in July, 1914.
| — | Food Groups. | Rent. | Fuel and Light. | Clothing. Drapery, and Footwear. | Miscellaneous. | All Groups combined. | ||||||||||||
|---|---|---|---|---|---|---|---|---|---|---|---|---|---|---|---|---|---|---|
| Groceries | Dairy-produce. | Meat. | Three Food Groups. | |||||||||||||||
* January figure. † July figure. ‡ Interpolated. | ||||||||||||||||||
| s. | d. | s. | d. | s. | d. | s. | d. | s. | d. | s. | d. | s. | d. | s. | d. | s. | d. | |
| July, 1914 | 20 | 0 | 20 | 0 | 20 | 0 | 20 | 0 | 20 | 0 | 20 | 0 | 20 | 0 | 20 | 0 | 20 | 0 |
| Year—1915 | 23 | 4 | 21 | 10 | 21 | 11 | 22 | 6 | 20 | 2 | 20 | 4 | 21 | 9 | 20 | 8 | 21 | 5 |
| 1916 | 23 | 7 | 24 | 1 | 23 | 11 | 23 | 10 | 20 | 1 | 22 | 0 | 25 | 6 | 24 | 4 | 23 | 2 |
| 1917 | 25 | 3 | 25 | 7 | 26 | 0 | 25 | 7 | 20 | 6 | 25 | 3 | 31 | 3 | 28 | 6 | 25 | 9 |
| 1918 | 28 | 10 | 26 | 9 | 27 | 5 | 27 | 10 | 21 | 1 | 27 | 3 | 35 | 10 | 34 | 8 | 28 | 7 |
| 1919 | 30 | 5 | 28 | 6 | 28 | 3 | 29 | 2 | 21 | 8 | 29 | 9 | 43 | 3 | 40 | 1 | 31 | 5 |
| 1920 | 37 | 3 | 33 | 2 | 29 | 5 | 33 | 6 | 22 | 10 | 35 | 8 | 49 | 0 | 46 | 1 | 35 | 7 |
| 1921 | 38 | 6 | 34 | 9 | 25 | 0 | 32 | 10 | 25 | 1 | 39 | 5 | 45 | 1 | 46 | 6 | 35 | 6 |
| 1922 | 35 | 0 | 27 | 4 | 21 | 6 | 28 | 5 | 27 | 2 | 36 | 6 | 37 | 7 | 40 | 10 | 31 | 11 |
| 1923 | 33 | 6 | 28 | 0 | 23 | 4 | 28 | 7 | 29 | 8 | 34 | 11 | 35 | 1 | 37 | 4 | 31 | 6 |
| 1924 | 34 | 1 | 29 | 2 | 24 | 10 | 29 | 8 | 32 | 0 | 34 | 8 | 33 | 6 | 35 | 11 | 32 | 0 |
| 1925 | 33 | 3 | 29 | 1 | 27 | 4 | 30 | 2 | 33 | 8 | 34 | 9 | 32 | 10 | 34 | 10 | 32 | 5 |
| Feb., 1925 | 32 | 9 | 27 | 3 | 26 | 1 | 29 | 1 | 33 | 0 | 34 | 4 | 33 | 3* | 35 | 3* | 31 | 11 |
| Aug., 1925 | 32 | 11 | 29 | 11 | 26 | 2 | 30 | 5 | 34 | 2 | 34 | 8 | 32 | 11† | 34 | 10† | 32 | 7 |
| Nov., 1925 | 33 | 7 | 28 | 11 | 29 | 8 | 31 | 2 | 34 | 6‡ | 34 | 10 | 32 | 0 | 34 | 0 | 32 | 9 |
| Feb., 1926 | 33 | 6 | 29 | 4 | 27 | 11 | 30 | 6 | 34 | 10 | 35 | 3 | 31 | 5 | 33 | 9 | 32 | 6 |
The general increase in prices since the outbreak of the Great War has materially reduced the purchasing - power of the £1 note, as is shown by the following table, which sets out the relative “worth” in terms of commodities (but stated for convenience in terms of money) represented by 20s. during the years 1914–25. The average “worth” in July, 1914, has been taken as a base and equated to 20s.
| Date | Food Groups. | Rent. | Fuel and Light. | Clothing. Drapery, and Footwear. | Miscellaneous. | All Groups combined. | ||||||||||||
|---|---|---|---|---|---|---|---|---|---|---|---|---|---|---|---|---|---|---|
| Groceries | Dairy-produce. | Meat. | Three Food Groups. | |||||||||||||||
* January figure. † July figure. ‡ Interpolated. | ||||||||||||||||||
| s. | d. | s. | d. | s. | d. | s. | d. | s. | d. | s. | d. | s. | d. | s. | d. | s. | d. | |
| July, 1914 | 20 | 0 | 20 | 0 | 20 | 0 | 20 | 0 | 20 | 0 | 20 | 0 | 20 | 0 | 20 | 0 | 20 | 0 |
| Year—1915 | 17 | 2 | 18 | 4 | 18 | 3 | 17 | 10 | 19 | 10 | 19 | 8 | 18 | 4 | 19 | 4 | 18 | 8 |
| 1916 | 16 | 11 | 16 | 7 | 16 | 9 | 16 | 9 | 19 | 11 | 18 | 2 | 15 | 8 | 16 | 5 | 17 | 3 |
| 1917 | 15 | 10 | 15 | 8 | 15 | 5 | 15 | 8 | 19 | 6 | 15 | 10 | 12 | 10 | 14 | 1 | 15 | 6 |
| 1918 | 13 | 11 | 14 | 11 | 14 | 7 | 14 | 4 | 19 | 0 | 14 | 8 | 11 | 2 | 11 | 6 | 14 | 0 |
| 1919 | 13 | 2 | 14 | 1 | 14 | 2 | 13 | 8 | 18 | 5 | 13 | 5 | 9 | 3 | 10 | 0 | 12 | 9 |
| 1920 | 10 | 9 | 12 | 1 | 13 | 7 | 11 | 11 | 17 | 6 | 11 | 2 | 8 | 2 | 8 | 8 | 11 | 3 |
| 1921 | 10 | 5 | 11 | 6 | 16 | 0 | 12 | 2 | 15 | 11 | 10 | 2 | 8 | 10 | 8 | 7 | 11 | 3 |
| 1922 | 11 | 5 | 14 | 8 | 18 | 7 | 14 | 1 | 14 | 9 | 10 | 11 | 10 | 8 | 9 | 10 | 12 | 6 |
| 1923 | 11 | 11 | 14 | 4 | 17 | 2 | 14 | 0 | 13 | 6 | 11 | 6 | 11 | 5 | 10 | 9 | 12 | 8 |
| 1924 | 11 | 9 | 13 | 8 | 16 | 1 | 13 | 6 | 12 | 6 | 11 | 6 | 11 | 11 | 11 | 2 | 12 | 6 |
| 1925 | 12 | 0 | 13 | 9 | 14 | 8 | 13 | 3 | 11 | 10 | 11 | 6 | 12 | 2 | 11 | 6 | 12 | 4 |
| Feb., 1925 | 12 | 2 | 14 | 8 | 15 | 4 | 13 | 9 | 12 | 2 | 11 | 8 | 12 | 1* | 11 | 4* | 12 | 6 |
| Aug., 1925 | 12 | 2 | 13 | 5 | 14 | 5 | 13 | 2 | 11 | 8 | 11 | 6 | 12 | 2† | 11 | 6† | 12 | 3 |
| Nov., 1925 | 11 | 11 | 13 | 10 | 14 | 2 | 12 | 10 | 11 | 7‡ | 11 | 6 | 12 | 6 | 11 | 9 | 12 | 3 |
| Feb., 1926 | 11 | 11 | 13 | 8 | 14 | 4 | 13 | 1 | 11 | 6 | 11 | 4 | 12 | 9 | 11 | 10 | 12 | 4 |
In the consideration of this last table care must be taken that the figures are given their correct significance. Briefly, they represent—in money figures—the worth (or purchasing-power) of 20s. expended in purchasing the commodities shown at the heads of the columns, as compared with 20s. of full pre-war purchasing-power in July, 1914.
Another fact which must be noted is that the figures shown in this table will not rise or fall to equal extent with any movements shown in the index number, and the percentage rise or fall will not be the same in this table as the corresponding percentage fall or rise respectively in the table of price-indexes. When a price-index rises from 1000 to 1600, as that for all groups did from July, 1914, till the year 1924, it then costs 32s. to buy what 20s. bought before. The purchasing-power of 20s. was in 1924 equal to the purchasing-power of five-eighths of 20s. (that is, 12s. 6d.) in July, 1914. A rise of 60 per cent. in the price-level had as its counterpart a fall of but 37 ½ per cent. in the purchasing-power of the monetary unit. On the other hand, a falling index number moves relatively less rapidly than the corresponding figure representing the increasing purchasing-power of the pound.
The year showing the highest average level for all groups (78 per cent. above July, 1914) is 1920, although according to half-yearly price-collections the highest point reached by the all groups index number was recorded in the collection for February, 1921 (at 85 per cent. above the July, 1914, level). Probably the peak for all groups was in fact reached in December, 1920, when prices began to break, falling sharply during 1921, the decline being offset to some extent by the rapidly increasing rent-index.
In the early years of the war the clothing and miscellaneous groups (especially the former) exhibited price-levels much higher than those of the other groups. The clothing group index number reached its peak in August, 1920, at a level approximately 150 per cent. above that of July, 1914; food in December, 1920, at a level approximately 80 per cent. above that of July, 1914; the miscellaneous group in February, 1921, at a level approximately 140 per cent. above that of July, 1914; and fuel and light (which lagged behind other groups except rent, as regards the time at which a change in direction was initiated, though by no means as regards the rate of change when once a movement in any direction was initiated), in July, 1921, at a price-level almost exactly double that of July, 1914. Rent, which lagged behind most of all during the upward movement, is still rising. The clothing group has fallen much more rapidly than the miscellaneous-items group, which, with the exception of the fuel and light group, now has the highest relative price-level.
In connection with the diagram on the opposite page it must be noted that index numbers for rent are computed semi-annually only, and that, until recently, the same position has obtained in the case of the clothing and miscellaneous groups, index numbers for which are now computed quarterly. The data have accordingly been plotted for purposes of this diagram at six-monthly intervals only, even though in the case of food index numbers for intermediate dates have been available. The effect is to cause the peak as regards food prices to appear to have come in February, 1921, instead of (as was in fact the case) at a slightly higher level in December, 1920. To have plotted food price-indexes month by month would, however, have made the diagram convey the misleading impression that movements in food-prices are much more halting, erratic, and uncertain than movements of retail prices generally.
With the exception of the six-monthly period from August, 1925, to February, 1926, the figures for “all groups” have consistently moved in the same direction as those for food-prices, though the extent of the movement has varied considerably between the two sets of index-numbers.
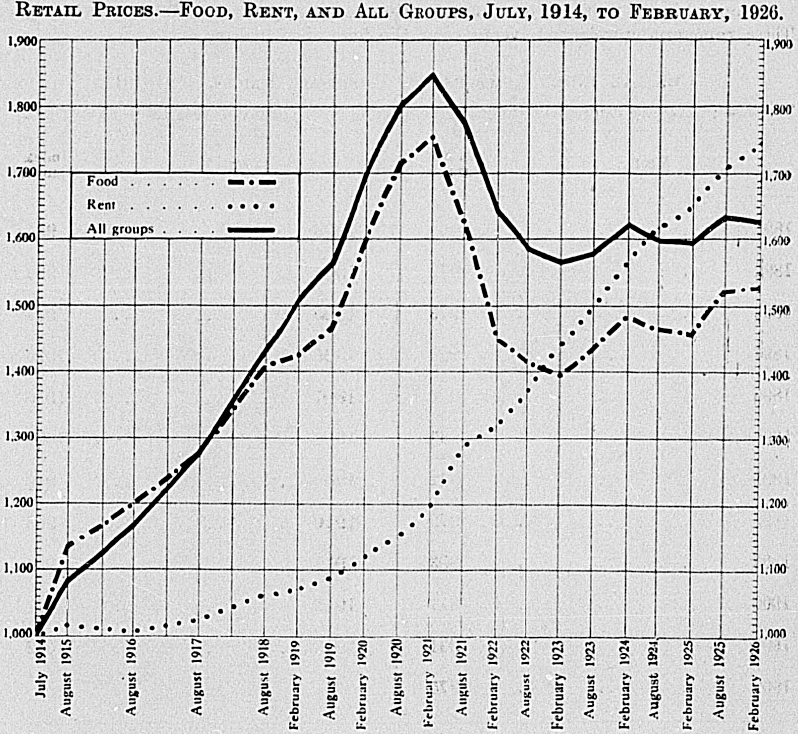
In most countries index numbers of wholesale prices are compiled from the price data available in trade journals or from the published reports of wholesale markets. In New Zealand wholesale markets scarcely exist, and consequently price data for the wholesale-prices investigation have been collected from wholesale merchants and traders, who from the volume of the business they transact are able to supply representative information.
Since 1917 such wholesale-price quotations have been collected monthly, the inquiry being for the most part confined to the four chief centres. In the case of a few commodities (e.g., newsprint), of which there is a local consumption so large that the article can scarcely be omitted from the price-index, yet for which no actual local market exists, the inclusion of the commodity in the index number has been rendered possible by ascertaining movements of prices from the import statistics. Statistics of imports and exports as a source of price data have, however, been avoided as far as possible, on the ground that where quotations are obtained from traders care can be taken to ensure that the grade, &c., quoted for is kept constant. In the price data obtained from statistics of imports and exports, changes in the qualities of goods bought and sold are liable to lurk undetected. A considerable volume of data as to wholesale prices has also been secured from merchants and traders (and in a few cases from import figures) by means of retrospective investigations covering the years 1891 to 1917, and sufficient information has been secured to permit of the compilation for each year from 1891 onwards of a “general wholesale index number” based on the prices of 106 commodities.
General index numbers of wholesale prices for each year from 1891 to 1913 follow. These represent unweighted averages for the four chief centres.
| GENERAL INDEX NUMBERS OF WHOLESALE PRICES, 1891–1913.(Base: Average aggregate annual expenditure, four chief centres, 1909–13 = 1000.) | |
|---|---|
| Year. | Index Number. |
| 1891 | 994 |
| 1892 | 972 |
| 1893 | 973 |
| 1894 | 927 |
| 1895 | 920 |
| 1896 | 943 |
| 1897 | 942 |
| 1898 | 972 |
| 1899 | 893 |
| 1900 | 917 |
| 1901 | 931 |
| 1902 | 975 |
| 1903 | 954 |
| 1904 | 922 |
| 1905 | 994 |
| 1906 | 1016 |
| 1907 | 1016 |
| 1908 | 1006 |
| 1909 | 949 |
| 1910 | 983 |
| 1911 | 994 |
| 1912 | 1041 |
| 1913 | 1032 |
From 1909 onwards still more detailed information has been secured, and separate index numbers for each year from 1913 onwards are published for a number of different groups and classes of commodities, the total number of items covered being approximately 180.
During 1926 a revision of the wholesale price-index was effected, specially designed, inter alia, to permit of the inclusion in the index number of several such items as benzine, gasoline, &c., the importance of which has increased enormously of late years. As the maximum usefulness of the revised wholesale index number will no doubt be found in future comparisons rather than in comparisons with the past, such new commodities have been allotted weights proportioned not to their 1909–13 consumption, but to their present-day consumption divided by a figure representing the ratio of the present-day population to that of the years 1909–13. The list of commodities represents a wide range, covering articles of home production and of foreign production, of farm, mine, marine, factory, &c., origin, and representing all stages of production.
For purposes of computing wholesale-price indexes, a cross-classification of the commodities covered is now adopted. On the basis of the nature and origin of the commodity there are now seven groups, and on the basis of the purpose of the commodity there are five classes, while a third basis of classification yields a separate index number for imported articles. This system of division into classes has been introduced in response to demands for information as to fluctuations in prices of the raw materials and equipment utilized in the leading types of industry (e.g., farming, building, &c.), and as to fluctuations in the prices of imported articles as distinct from home products, &c. Three of the groups are further subdivided into subgroups, the basis of subdivision being sometimes the nature and origin of the commodities, sometimes the degree of manufacture.
In a few cases (e.g., wax vestas, spades) some doubt arose as to the group in which the commodity should be placed, and such problems have been solved as far as possible on the basis of trade usage in such matters—a spade, for example, being treated as a metal and not as a wood product, because it is usually sold by ironmongers; and so on.
This system of cross-classification by groups and classes is at once more logical and more informative than that used in connection with the index numbers published in previous issues of this book. It is of interest to set forth briefly the relations between the old and the new groupings of commodities. The old Groups I (agricultural produce) and 2 (flour, bran, pollard, and oatmeal) now become Groups 1A and 1c respectively. The commodities of the old Group 3 (wool, tallow, hides, butter, cheese, &c.), with the exception of butter and cheese (which form part of the new Group 4D), constitute the new Group 4B. The commodities of the old Group 4 (general merchandise) have been fairly evenly divided mainly between the new Groups 1D and 4D according as they are of vegetable or of animal origin. The commodities of the old Group 5 (building materials) have been allocated mainly to the new Groups 3, 5, or 6c, according to their origin; but the new Class 4 corresponds closely with the old Group 5 as regards the commodities included, though there are important differences of weighting, inasmuch as in the old Group 5 each commodity was weighted according to its total local consumption, while in the present Class 4 the same commodity is weighted only according to its consumption in the building trade, the balance of its former weight being allotted whore necessary to some other class. The old Group 6 (leather) and the new Group 4c are identical. The old Group 7 (chemicals and manures) differs from the new Group 7 only by the inclusion in the latter of three new commodities of relatively minor importance as regards their effect on the value of the index number. The old Group 8 (coal) and the new Group 6B are identical. Groups 1B, 2, 4A, and 6A consist almost wholly of new commodities which it has now been found desirable and possible to add to the index number. Their inclusion is the main cause of the differences that will be found to exist between the old general wholesale-price index number and the new all-groups wholesale-price index number. To preserve the continuity of the index number the compilations have been carried back on the new basis, so that comparable index numbers are available for each year from 1913 onwards. The figures quoted in future as “the wholesale index number” will, except where this is expressly negatived by the context, be the new all-groups wholesale figures.
Details with regard to each of the new groups are as follow:—
Group 1A: Fifteen items, covering four varieties of wheat, three of oats, and two each of barley and ryegrass, with maize, cocksfoot, potatoes, and onions.
Group IB: Five items, comprising apples, oranges, bananas, cabbage, and cauliflower. As several of these commodities are not continuously on the markets it has not been found practicable to compile index numbers each month or quarter for this subgroup, while the annual figures are based, in the cases of certain of the commodities included, on the quotations for those months only during which it is normal for these commodities respectively to be found regularly on the market.
Group IC: Four items, comprising flour, bran, pollard, and oatmeal.
Group ID: Twenty-five items, ranging from honey, sugar, golden syrup, and treacle, to rice, coffee, mustard, and a number of lines of tinned and dried fruits. Other important items included in the subgroup are linseed-oil, tobacco, ale, and whisky.
Group II: Seventeen items, including rope; two lines of linoleums: two lines of calico; sheeting; galatea; several lines of suiting-materials, representing both imported and local standard brands; blankets; cornsacks; and woolpacks.
Group III: Sixteen items, covering fourteen lines of timber (representing both local and imported varieties), also turpentine and newsprint.
Group IVA: Five items.
Group IVB: Twelve items, comprising tallow, three grades of wool, and eight lines of hides.
Group IVC: Seven items, covering both local and imported lines.
Group IVD: Seven items—viz., butter, cheese, candles, soap, sardines, salmon, and herrings.
Group V: Fourteen items, ranging from bar iron and tin plates on the one hand to sewing-machines and cream-separators on the other.
Group VIA: Five items.
Group VIB: Four items, three being local lines and one imported.
Group VIC: Sixteen items, including common and table salt, cream of tartar, carbonate of soda, lime, cement, bricks, glass dispensing-bottles, and eight lines of crockery.
Group VII: Twenty-five items, including (inter alia) calcium carbide, sheep-dip, and wax vestas.
The line of distinction drawn between Groups VIc and VII is to a certain extent unscientific, being based mainly on trade usage rather than on any inherent differences in the natures of the commodities included.
The wholesale-price index is purely a commodity index, no attempt having been made to cover the wholesale prices of services such as the supply of electric power, transportation, &c.
For purposes of the wholesale inquiry recourse was had to a modification of the method of the retail-prices investigation—the aggregate expenditure method. In the retail-prices inquiry the quantities of the various commodities used annually for household consumption throughout the Dominion determined the weights; in the wholesale-prices inquiry the total quantities consumed in the Dominion annually, whether in households or in industry, were substituted. These two quantities frequently differ appreciably—e.g., the amount of coal consumed in households is fairly small in proportion to the total (domestic plus industrial) consumption. Some authorities have advocated instead the adoption of weights proportioned to the actual quantities marketed locally; or, what amounts to much the same thing, weights proportioned to local production or local consumption, whichever is the greater. In the case of any given commodity the quantity marketed exceeds the amount consumed by the amount of local production for exports: this difference being considerable for New Zealand in the cases of such staple items of export as kauri-gum, phormium, meats, dairy-produce, wool, &c. A separate index number for the prices of exported commodities is available, however: so it was thought better to adhere to the consumption standard for assessing weights—a standard which incidentally yields a wholesale index number which at once permits of more satisfactory comparison with movements of retail prices in New Zealand and at the same time is more comparable with the wholesale-price indexes of adjacent countries in the Southern Hemisphere, all of which have adopted the same system of weighting.
Data as to the appropriate weights (local production plus imports, minus exports) were checked where possible by inquiries instituted of wholesale merchants as to the amounts of the commodities included in the investigation sold for local consumption. No attempt was made to avoid double counting in allotting weights—e.g., to reduce the weight for wheat on the ground that portion of the wheat would be encountered again in the form of flour, or to reduce the weight of flour on the ground that it had already been partly accounted for in dealing with wheat. It was felt that the practical difficulties in the way of making such an allowance with any degree of precision in every case are insuperable, while in any event the theoretical case in favour of avoiding double counting is by no means impregnable. The effect of adopting a system of weighting that involves double counting is to exaggerate the importance of raw materials in the New Zealand index number as compared with their importance in the index number of a country which does seek to avoid double counting. In a country like New Zealand, where raw materials are relatively very important in the total economy of the country, this exaggeration is by no means necessarily a fault.
One more step in weighting was deemed necessary in order to ensure accurate results. It is not sufficient that each commodity should be made to exercise a proper influence on the result for each group; but an investigation was also made in order to determine whether or not each group, as a whole exercised its proper, and no more than its proper, influence on the total result—a consideration the answer to which depends on whether or not each group's base aggregate expenditure bears its proper ratio to the total base aggregate expenditure for all groups combined. If in the total base-period consumption of the country, metal and metal products account for 5 per cent. of the total outlay of the people (domestically plus industrially), then the base aggregate expenditure for metals and metal products in the index number should bear the ratio of one-twentieth to the total base aggregate expenditure for all the 180 commodities. In order to have each group exert its proper influence on the total result it was found necessary in the case of three groups to multiply the group aggregate expenditure by certain numbers which may be termed group weights to distinguish them from individual commodity weights. For example, the difficulty of obtaining a wide range of standard articles in the textiles group necessitated what was in effect the application of a group weight of 2 to the aggregate expenditure thereof. In practice the same result was achieved by multiplying instead all the weights for the individual items in this group by this factor—an expedient which simplifies the actual compilation of the index numbers.
The percentage represented by each group or subgroup in the base aggregate expenditure was as follows:—
| Group or Subgroup. | Percentage |
|---|---|
| IA | 10.7 |
| IB | 2.1 |
| IC | 4.3 |
| ID | 11.9 |
| II | 12.7 |
| III | 5.5 |
| IVA | 11.0 |
| IVB | 1.7 |
| IVC | 1.1 |
| IVD | 5.1 |
| V | 14.3 |
| VIA | 6.8 |
| VIB | 7.1 |
| VIC | 29 |
| VII | 2.8 |
The base adopted for purposes of the wholesale-price inquiry is the average of the wholesale prices in the four chief centres during 1909 to 1913, the price quotations from the various merchants being so combined that each return from any given town has the same weight in the averaging process as any other return from that town, while in obtaining Dominion average prices for any given commodity each of the four centres is given the same weight.
The allotting of identical weights to quotations for each of the four chief towns in the course of the averaging process is justified by the fact that exhaustive tests have established that the effect on the value of the index number of weighting quotations for each town in proportion to the consuming populations concerned, instead of giving them equal weights is rarely a matter of more than one or two points (i.e., rarely more than one or two tenths of 1 per cent.). The population of no one town of the four differs by more than, at the most, 40 per cent. of its own population from the average of the four. In practice, moreover, it is found that the differences in prices of a given commodity as between the different centres are rarely of great magnitude save in cases of one or two bulky commodities whose production is strictly localized (e.g., kauri). Price-differences between the four towns are usually, in any case, relatively constant for any one commodity; and so long as this is strictly the case for all the commodities included in a group, that group's index number—which is, after all, a device for measuring price-movements from time to time—is unaffected by the system of weighting adopted as between the different towns covered. The only circumstances under which this constancy is not substantially achieved are those rare cases when coastal or railway freights have moved very differently from the prices of the commodities concerned, or where the operation of temporary cut-throat competition, for example, within a special locality, may have for a space affected the situation. No statistician has ever seriously claimed that his index number accurately reflects price-movements within the limits of 1 or 2 per mille: the facts that the index number is based on certain sample commodities taken as being representative of each group, and that the price data are obtained from certain sample establishments alone, accounting for some failure on the part of the index number to measure price-movements with perfect accuracy. To strain after precision through weighting each town according to its consuming population would therefore merely result in the achievement of a spurious accuracy at the cost of a considerable augmentation of the labour of computation. of the possibility of arithmetical error (owing to the more complicated character of the computations) and of the certainty of delay in the publication of the results.
The following tables show annual wholesale index numbers by groups and by classes respectively. The latter table also shows the separate index number for imported items; alongside which, for purposes of convenience of comparison, are set the index numbers for export prices. It should be noted that the export-price index is computed by a method entirely distinct to that adopted in connection with the computing of the wholesale-price index. Monthly wholesale-price indexes are compiled and published regularly in the Monthly Abstract of Statistics.
| WHOLESALE PRICES.—INDEX NUMBERS BY GROUPS, 1913–25.(Base: Average annual aggregate expenditure, four chief centres, 1909–13 = 1000.) | |||||||
|---|---|---|---|---|---|---|---|
| Group. | 1913. | 1914. | 1915. | 1916. | 1917. | 1918. | 1919. |
| 1. Foodstuffs, &c., of vegetable origin— | |||||||
| A. Agricultural produce | 967 | 1021 | 1580 | 1487 | 1517 | 1845 | 1868 |
| B. Fresh fruit and vegetables | 1031 | 1057 | 999 | 1178 | 1269 | 1233 | 1712 |
| C. Milled agricultural products | 982 | 1121 | 1557 | 1312 | 1442 | 1550 | 1535 |
| D. Other vegetable foodstuffs and groceries | 1010 | 1022 | 1119 | 1181 | 1290 | 1433 | 1546 |
| A.-D. Four subgroups combined | 991 | 1039 | 1345 | 1313 | 1394 | 1587 | 1675 |
| 2. Textile manufactures | 1020 | 1047 | 1089 | 1315 | 1616 | 2453 | 2750 |
| 3. Wood and wood products | 1072 | 1124 | 1130 | 1210 | 1333 | 1530 | 1732 |
| 4. Animal products— | |||||||
| A. Meats | 1111 | 1294 | 1591 | 1619 | 1776 | 1802 | 1817 |
| B. Raw animal products (not foods) | 1085 | 1104 | 1312 | 1517 | 1532 | 1523 | 1662 |
| C. Leather | 1126 | 1184 | 1348 | 1470 | 1806 | 1900 | 2066 |
| D. Manufactured foodstuffs and groceries of animal origin | 1030 | 1119 | 1258 | 1361 | 1477 | 1541 | 1563 |
| A.-D. Four subgroups combined | 1088 | 1224 | 1462 | 1532 | 1676 | 1713 | 1750 |
| 5. Metals and their products | 932 | 917 | 888 | 1051 | 1293 | 1524 | 1448 |
| 6. Non-metallic minerals and their products— | |||||||
| A. Mineral oils | 1004 | 1009 | 943 | 1035 | 1256 | 1472 | 1517 |
| B. Coals | 1037 | 1003 | 1018 | 1144 | 1367 | 1476 | 1646 |
| C. Other non-metallic minerals and their products | 1026 | 1045 | 1130 | 1267 | 1432 | 1846 | 1853 |
| A.-C. Three subgroups combined | 1022 | 1013 | 1007 | 1121 | 1333 | 1538 | 1629 |
| 7. Chemicals and manures | 1030 | 1067 | 1210 | 1436 | 1681 | 2040 | 1961 |
| All groups combined | 1055 | 1098 | 1235 | 1328 | 1511 | 1778 | 1858 |
| Group. | 1920. | 1921. | 1922. | 1923. | 1924. | 1925. |
|---|---|---|---|---|---|---|
| 1. Foodstuffs, &c., of vegetable origin— | ||||||
| A. Agricultural produce | 1987 | 1590 | 1429 | 1526 | 1752 | 1716 |
| B. Fresh fruit and vegetables | 1381 | 1539 | 1464 | 1264 | 1583 | 1365 |
| C. Milled agricultural products | 1713 | 1968 | 1773 | 1571 | 1599 | 1844 |
| D. Other vegetable foodstuffs and groceries | 1961 | 1980 | 1904 | 1852 | 1860 | 1726 |
| A.-D. Four subgroups combined | 1891 | 1803 | 1678 | 1648 | 1761 | 1714 |
| 2. Textile manufactures | 3359 | 2623 | 2343 | 2201 | 2179 | 2182 |
| 3. Wood and wood products | 2124 | 2359 | 2172 | 2183 | 2192 | 2145 |
| 4. Animal products— | ||||||
| A. Meats | 1869 | 1654 | 1172 | 1387 | 1415 | 1598 |
| B. Raw animal products (not foods) | 1744 | 813 | 1109 | 1402 | 1724 | 1455 |
| C. Leather | 2973 | 2105 | 1773 | 1681 | 1605 | 1579 |
| D. Manufactured foodstuffs and groceries of animal origin | 1756 | 1906 | 1488 | 1540 | 1550 | 1539 |
| A.-D. Four subgroups combined | 1894 | 1674 | 1287 | 1447 | 1490 | 1568 |
| 5. Metals and their products | 1752 | 1672 | 1268 | 1129 | 1151 | 1175 |
| 6. Non-metallic minerals and their products— | ||||||
| A. Mineral oils | 1943 | 1915 | 1458 | 1089 | 1026 | 1006 |
| B. Coals | 2050 | 2226 | 2121 | 1935 | 1920 | 1889 |
| C. Other non-metallic minerals and their products | 2208 | 2436 | 2121 | 1886 | 1836 | 1785 |
| A.-C. Three subgroups combined | 2034 | 2136 | 1852 | 1583 | 1506 | 1512 |
| 7. Chemicals and manures | 2318 | 1915 | 1510 | 1408 | 1365 | 1296 |
| All groups combined | 2181 | 2025 | 1736 | 1666 | 1739 | 1697 |
| WHOLESALE PRICES.—INDEX NUMBERS BY CLASSES.(Base: Average annual aggregate expenditure, four chief centres, 1909–13 = 1000.) | ||||||||
|---|---|---|---|---|---|---|---|---|
| Year. | Consumers' Goods. | Producers' Materials, &c. | All Classes combined. | Index Number of Imported Items. | Index Number of Export prices. | |||
| Class I: Foodstuffs. | Class II: Non-Foods. | Class III: Materials for Farming Industry. | Class IV. Materials for Building and Construction. | Class V. Materials for other Industries. | ||||
* No export price index computed for this year. | ||||||||
| 1913 | 1039 | 1044 | 1068 | 1134 | 1055 | 1055 | 1084 | * |
| 1914 | 1129 | 1032 | 1081 | 1189 | 1095 | 1098 | 1089 | 1108 |
| 1915 | 1343 | 1006 | 1279 | 1347 | 1238 | 1235 | 1107 | 1315 |
| 1916 | 1420 | 1116 | 1298 | 1622 | 1319 | 1328 | 1280 | 1529 |
| 1917 | 1501 | 1317 | 1467 | 2026 | 1543 | 1511 | 1556 | 1744 |
| 1918 | 1634 | 1759 | 1714 | 2496 | 1786 | 1778 | 2017 | 1798 |
| 1919 | 1698 | 1957 | 1781 | 2280 | 1878 | 1858 | 2114 | 1851 |
| 1920 | 1806 | 2367 | 2202 | 2737 | 2286 | 2181 | 2594 | 1823 |
| 1921 | 1749 | 2175 | 1794 | 2637 | 2140 | 2025 | 2268 | 1687 |
| 1922 | 1496 | 1951 | 1476 | 2261 | 1802 | 1736 | 1909 | 1270 |
| 1923 | 1565 | 1795 | 1426 | 2175 | 1649 | 1666 | 1718 | 1554 |
| 1924 | 1592 | 1790 | 1615 | 2151 | 1677 | 1739 | 1693 | 1769 |
| 1925 | 1611 | 1742 | 1556 | 2127 | 1703 | 1697 | 1673 | 1886 |
Of the total base aggregate expenditure, Class I represented 30.1 per cent., Class II 20.5 per cent., Class III 11.8 per cent., Class IV 7.4 per cent., and Class V 30.2 per cent., while the imported items aggregated 42.8 per cent. of the total.
By using these figures (and those previously given for the groups) as weights, index numbers can be averaged for different groups or classes so as to arrive at special index numbers that may be desired for any purpose. A combination of the index numbers for Groups ID and IVD, for example, yields an excellent figure for the wholesale prices of groceries; a combination of the index numbers for Classes I and II yields an excellent figure for the wholesale prices of “consumption goods”; and so on.
On the outbreak of the Great War those raw materials and semi-manufactured products that form the staple exports of the Dominion rose most rapidly. It is probable that many wholesale houses held considerable stocks of imported commodities, and that this, with other factors, retarded the upward movement of the import price-index until about 1918, when the import index number began rapidly to overhaul the export index number, attaining at its peak in 1920 a level much higher than the peak level of any other general price-index. The export items were also the first to fall, this price-index showing a slight drop in 1920, while the wholesale and import price-indexes were still continuing their upward rise wholly unchecked. Similarly, the postwar slump is reflected a full year earlier in the export price-index than in the wholesale price-index; while at the present time the export price-index has for long been showing a marked falling tendency, which is only just beginning to be reflected in the wholesale price-index. A fuller study of the group peaks will be found in the 1926 issue of the Year-book.
Since the Armistice the export price-index has shown much wider fluctuations than the other price-indexes. This is probably due rather to the fact that our staple exports are for the most part easily graded commodities, and therefore a fit object for speculation, than to the differences in the methods of compiling the price-indexes.
Broadly speaking, the peaks for groups comprising mainly exported articles represented a lower level than the peaks for groups comprising mainly imported articles. The prices both of New Zealand's staple exports and of her staple imports are, in general, determined by world-market conditions; so that, roughly, the prices in New Zealand of articles of export represent world prices minus the cost of transport, insurance, duties, &c., while the prices in the Dominion of articles of import represent world prices plus the cost of transport, insurance, duties, &c.; all of which items during the war period increased considerably more rapidly than did the prices of commodities.
There is no substantial difference between the price movements exhibited by consumers' goods on the one hand and producers' goods on the other. Farming-materials, however, appear to have risen less and building materials more than any other classes. The great rise in building-materials is by no means unconnected with the fact that of all the groups that representing wood and wood-products shows the greatest rise, with the solitary exception of the textile-manufactures group. Mineral oils show the smallest rise, and metals and their products the next smallest. Both these groups represent in a large degree commodities where the consumer is receiving the benefit of the economies of mass production.
Speaking generally, the movements of the index numbers for retail and for wholesale prices have been similar, though there has been a tendency for rises in retail prices to lag behind rises in wholesale prices, owing to the effects of retail friction, maximum-price legislation, and similar factors. Thus, the peak for wholesale prices (general index number) was reached in October, 1920, while that for retail prices (all groups) was not reached till at least two months later. The peak of the general wholesale-price index was, moreover, about 270 points higher than the peak index number for retail prices.
As in the case of retail prices, the peak level of wholesale prices in New Zealand (recorded at 2291 in October, 1920) represented a lower peak level than that of any other country publishing price statistics, with the solitary exception of India.
The prosperity of New Zealand is so closely bound up with the prices realized for the commodities exported that great interest necessarily centres on a special index number of wholesale prices based solely on the prices of exported commodities. Annual index numbers of export prices based on prices prevailing in the “nineties” were formerly compiled from data supplied by the Customs Department, and for many years were published in the Year-book. A new series of export-price indexes with the average prices of the years 1909–13 as base (= 1000) has recently been instituted; and in this new series monthly as well as annual figures are available, while the commodities are also grouped according to their nature. Certain staple export commodities are considered; the recorded values of the exports of these commodities for the month or year under investigation are divided by the values the same quantities of these commodities as were exported during this period would have had if prices had remained as in the base period, and the price indexes are obtained by multiplying this quotient by 1000. The fewness and substantial homogeneity of the commodities which may be regarded as New Zealand's staple exports render this procedure eminently simple and satisfactory.
The twenty-five commodities covered account for about 95 per cent. of the total exports, leaving only 5 per cent. unaccounted for. The effect of the exclusion of this small residuum is to give it a price-movement similar to that of the items covered. Substantial accuracy for the index number may therefore reasonably be claimed.
The following table shows annual figures for export prices from 1914 onwards. The miscellaneous group includes apples, peas, phormium-fibre, kauri-gum, and certain important kinds of timber.
| INDEX NUMBERS OF EXPORT PRICES, 1914–25.(Base: Average export prices of years 1909–13 = 1000.) | ||||||
|---|---|---|---|---|---|---|
| Year. | Group I: Dairy-produce. | Group II: Meat. | Group III: Wool. | Group IV: Hides, Skins, and Tallow. | Group V: Miscellaneous. | All Groups combined. |
| 1914 | 1038 | 1218 | 1101 | 1089 | 1037 | 1108 |
| 1915 | 1203 | 1468 | 1362 | 1133 | 1078 | 1315 |
| 1916 | 1349 | 1509 | 1723 | 1394 | 1361 | 1529 |
| 1917 | 1562 | 1761 | 1768 | 2187 | 1700 | 1744 |
| 1918 | 1574 | 1777 | 1780 | 2383 | 2060 | 1798 |
| 1919 | 1747 | 1780 | 1816 | 2426 | 1781 | 1851 |
| 1920 | 1806 | 1716 | 1809 | 2098 | 1800 | 1823 |
| 1921 | 2231 | 1766 | 848 | 1539 | 1832 | 1687 |
| 1922 | 1495 | 1522 | 939 | 1522 | 1686 | 1270 |
| 1923 | 1621 | 1875 | 1277 | 1561 | 1634 | 1554 |
| 1924 | 1650 | 1868 | 1906 | 1732 | 1645 | 1769 |
| 1925 | 1515 | 2085 | 2233 | 2061 | 1679 | 1886 |
The outstanding differences between the method of compilation of the index numbers for export prices on the one hand and the index numbers for wholesale and for retail prices on the other hand rests on the fact that the “weights” of the various commodities included in the case of the export-price index are determined by the quantities of the commodities exported during the period under investigation; while in the case of the other price indexes the weights are determined by the quantities of the commodities consumed (domestically only in the case of the retail prices, and domestically plus industrially in the case of the wholesale) during some fixed period, usually the base period. The weights applied to any given commodity are thus constant in the case of the wholesale and the retail-price indexes, while they are variable in the case of the export-price index. There is justification in the facts of the case for this difference. The wholesale- and retail-price indexes are designed to measure-changes in the prices of commodities consumed in the country; and, broadly speaking, consumption does not vary very greatly over long periods; for in respect of what we eat and what we drink and what we wear we are all fast bound by the shackles forged by habit and custom. Nature's moods exhibit more vagaries; so that, as regards any one country, production (and therefore exports) varies more extensively and frequently than does consumption. In a young, developing country like New Zealand, moreover, general economic conditions have often wrought rapid changes in the nature of our staple exports, a fact which will be abundantly clear on a perusal of Section XIB of this publication. To assume a constant exportation of the various commodities included in the export-price index would therefore be to Jose touch with fact.
Each of the two main points of difference between the export-price index on the one hand and the retail- and wholesale-price indexes on the other has an important consequence. The exports of certain of our staple products exhibit a marked and well-defined seasonal cycle, so that certain commodities are scarcely represented in the export-price indexes for certain months, these months being more or less fixed from year to year for each separate commodity. If the commodity thus regularly appearing and disappearing has exhibited a price-movement very different from that of the balance of exported commodities, the price-index for exported commodities as a whole will inevitably exhibit fluctuations from month to month that are in one sense fictitious; for it is possible for a change thus to be recorded in the export-price index although the actual prices per unit of every single commodity included in the index number may not have altered one iota. The same sort of difficulty occurs where an exceptionally large amount of some commodity is regularly shipped at some definite season. Over the period of a year such difficulties will tend to cancel themselves out; but the utmost caution should be observed in effecting month-to-month comparisons of export-price indexes in order that the investigator will not be misled by such conditions. Comparisons of (say) May of one year with May of another are less liable to be dangerous on this account than (say) comparisons of a May with an October; though even here such factors as an exceptionally late season, the occurrence of a shipping strike or lockout, and other more or less fortuitous conditions must be considered where they exist. Generally speaking, it may be taken that the export-price index gives much less satisfactory results for monthly than it does for annual comparisons. Even in the case of annual comparisons, however, since the calendar year splits the main season for moving produce, it is possible that the export-price index may be slightly affected by such factors as a late season, &c.
The second important consequence of the main differences between the export and the other price indexes depends on the fact that in the former case quantities exported, not quantities consumed, determine the weights. New-Zealanders consume only about one-tenth as much lamb as mutton, but they export almost one-and-a-half times as much lamb as mutton by weight. This relatively greater importance of lamb in the export-price index is the main cause of the differences in certain years between the export- and wholesale-price indexes for meats.
The post-war peak for export prices was reached in May, 1920 (index number 2104). A subsidiary peak had already been reached in November, 1919 (index number 2078). Under the influence of speculation in wool (an easily gradable and non-perishable raw material, and therefore a specially suitable object for speculation) a record monthly figure for export prices was reached at 2214 in January, 1925; the index number for the special wool group in that month standing at the phenomenal figure of 2715, and rising a further 24 points the following month, only to fall by 448 points in March, and to drop to 1565 at the end of the year, and to 1372 by April, 1926. Between 1891 and 1914 the annual New Zealand wholesale price of crossbred wool (medium to good) fluctuated between 4 ½d. per pound (in 1901) and 5d. per pound (in 1902) on the one hand and 10d. per pound (in 1906 and again in 1912) and 10 ¼d. per pound (in 1913 and 1914) on the other. In 1916 the price was 1s. 3 ¾d., from 1917 to 1919 1s 3 ½d., in 1920 1s. 2 ¼d., in 1921 only 5 ¾d.; after which the price rose again gradually until it was 1s. 6 ¾d. in 1924; while the average for 1925 dropped to 1s. 2 ¼d. Between 1891 and 1914 the wholesale price of butter fluctuated between the relatively much narrower limits of 10 ¼d. (in 1897, 1899, and 1904) and 1s. 2 ¼d. (in 1914); while the maximum yearly price since 1914 was 1s. 11 ¾d. (in 1921). Cheese fluctuated between 4 ½d. (in 1896, 1898, and 1899) and 7d. (in 1912 and 1914). Its post-war maximum was 1s. 1 ¼d. (in 1921). The greatest post-war rise occurred in the hides, skins, and tallow group, a fact which is closely connected with the one already adverted to in the consideration of wholesale-price indexes, to the effect that the leather group showed the highest peak level. Of the export-prices groups, meat showed the lowest peak level.
Since January, 1925, the general index number for export prices has fallen considerably, the level in September, 1926, being 1554. To this fall all the groups have contributed. Fuller details will be found in the Monthly Abstract of Statistics, where monthly figures have been published since July, 1925.
Table of Contents
PRIOR to the 1923 issue of the Year-book, index numbers of wages were not published officially, although a thesis on this subject, written by Mr. G. W. Clinkard, M.Com., was published as an appendix to the 1919 number of the Year-book. In the following pages index numbers are published for the years 1914 to 1925, the wage rates used for the purpose of computing these wage-indexes being in every case annual averages.
The material from which the index numbers have been compiled has been collected almost entirely from the awards of the Arbitration Court. While it is recognized that the rates specified in such awards are minimum rates, and that wages may in some cases be above the prescribed minima, yet for the purpose of tracing the movement in wage rates over any considerable space of time the award rates form a more reliable basis than any information which could be collected directly from employers or trade-union secretaries as to the ruling or predominant rates in any industry. In the case of two important classes of workers—agricultural and pastoral employees and railway employees—no awards exist. Information has been obtained from the Labour Department as to the ruling rates of wages in the former case, and from the Railway Department in the latter case.
The rates used throughout are those paid to adult workers; but no distinction has been made between male and female workers. In the case of most industries included in the compilations only male workers are employed, but in the textile and weaving group and the domestic-service group (which includes hotel and restaurant workers) female workers predominate. The index numbers for these groups are consequently consistently lower than those for other groups in such tables of index numbers as are based on the “all groups” weighted average wage.
The award rates for the four principal districts— Northern, Wellington, Canterbury, and Otago and Southland—have been taken as representative of the ruling wages throughout the Dominion. For such industries as are carried on in the towns these rates are quite satisfactory; in cases where the important centre of an industry is situated outside the geographical boundaries of the four principal districts the award rates for that centre have been used. For instance, the rates used for coal-mining and sawmilling in the Canterbury District are those prescribed by the awards for the Westland Industrial District.
In weighting the rates extracted from the awards for each district in order to obtain index numbers, the occupations for which rates have been obtained have been grouped into fourteen industrial groups.
Owing to the difficulty of obtaining the requisite data the individual occupations in each group have not hitherto been weighted. A careful selection of representative occupations in each industry has, however, been made so that the movement in the unweighted arithmetic average of wages paid in these occupations gives a fairly reliable indication of the movement in average wages paid in all occupations in the industries included in each group. While this undoubtedly holds good as between the occupations in each group the same method would not be sufficiently accurate in combining groups and districts for the purpose of compiling index numbers. The number of workers recorded on the trade-union rolls for December, 1916, as registered trade-unionists in the various unions were used in weighting between groups and districts. Since the figures thus obtained represented the numbers of workers to whom the various awards applied this source of information was quite satisfactory as regards most occupations included in the compilations.
It was, however, apparent on examination of the rolls that the number enrolled as agricultural and pastoral workers was by no means proportionate to the total number of wage-earners employed in that class of work when compared with the numbers enrolled in other industries. It was found necessary, therefore, to interpolate the weights for this group, using the census figures of 1916 for wage-earners as a basis.
The following table shows the weights adopted for each group:—
| WEIGHTS USED FOR EACH GROUP IN EACH INDUSTRIAL DISTRICT.(00's omitted.) | |||||
|---|---|---|---|---|---|
| Industrial Group. | Northern. | Wellington. | Canterbury. | Otago and Southland. | Dominion. |
| Food, drink, and tobacco | 17 | 21 | 12 | 13 | 63 |
| Clothing, boots, &c. | 13 | 10 | 9 | 10 | 42 |
| Textiles and weaving | 2 | 11 | 2 | 2 | 17 |
| Building and construction | 24 | 29 | 16 | 15 | 84 |
| Wood-manufacture | 11 | 6 | 5 | 11 | 33 |
| Printing, &c. | 4 | 7 | 4 | 3 | 18 |
| Metal-working and engineering | 9 | 5 | 10 | 9 | 33 |
| Other manufactures | 6 | 2 | 10 | 2 | 20 |
| Mining | 19 | .. | 22 | 5 | 46 |
| Agricultural and pastoral | 63 | 46 | 42 | 37 | 188 |
| Land transport | 28 | 34 | 28 | 26 | 116 |
| Shipping and cargo-working | 19 | 32 | 6 | 14 | 71 |
| Hotel, restaurant, and other personal service | 29 | 22 | 5 | 7 | 63 |
| Miscellaneous | 21 | 19 | 14 | 5 | 59 |
| Totals for all groups | 265 | 244 | 185 | 159 | 853 |
The following table shows the nominal-wage index numbers for each group and all groups combined for 1914 and for each year from 1916 to 1925. The base on which the index numbers in this table have been computed is the Dominion weighted average wage for all groups combined for the average of the years 1909–13, equated to 1,000.
| NOMINAL-WAGE INDEX NUMBERS, BY INDUSTRIAL GROUPS, 1914 AND 1916–25.(Base: Dominion weighted average wages for all industrial groups combined, 1909–13 = 1,000.) | |||||||||||
|---|---|---|---|---|---|---|---|---|---|---|---|
| Industrial Group. | 1914. | 1916. | 1917. | 1918. | 1919. | 1920. | 1921. | 1922. | 1923. | 1924. | 1925. |
NOTE.—The index numbers in this table are comparable both vertically and horizontally. Similar index numbers on base 1914 = 1,000 are compiled quarterly and published in the Monthly Abstract of Statistics. | |||||||||||
| Food, drink, and tobacco | 1074 | 1121 | 1169 | 1193 | 1228 | 1498 | 1624 | 1643 | 1628 | 1711 | 1778 |
| Clothing, boots, &c. | 737 | 766 | 815 | 855 | 936 | 1113 | 1215 | 1182 | 1145 | 1162 | 1191 |
| Textiles and weaving | 972 | 1025 | 1083 | 1094 | 1225 | 1309 | 1466 | 1490 | 1553 | 1555 | 1558 |
| Building and construction | 1236 | 1250 | 1312 | 1357 | 1491 | 1764 | 1888 | 1835 | 1773 | 1799 | 1804 |
| Wood-manufacture | 1111 | 1201 | 1204 | 1286 | 1378 | 1617 | 1896 | 1816 | 1754 | 1810 | 1837 |
| Printing, &c. | 1274 | 1276 | 1373 | 1373 | 1552 | 1879 | 2008 | 1895 | 1813 | 1822 | 1967 |
| Metal-working and engineering | 1161 | 1195 | 1236 | 1309 | 1430 | 1721 | 1825 | 1805 | 1779 | 1780 | 1781 |
| Other manufactures | 1087 | 1152 | 1177 | 1231 | 1322 | 1592 | 1820 | 1743 | 1694 | 1702 | 1731 |
| Mining | 1145 | 1185 | 1236 | 1305 | 1334 | 1482 | 1774 | 1766 | 1754 | 1799 | 1820 |
| Agricultural and pastoral | 1011 | 1221 | 1305 | 1374 | 1458 | 1541 | 1550 | 1461 | 1492 | 1486 | 1491 |
| Land transport | 1076 | 1159 | 1186 | 1238 | 1371 | 1644 | 1739 | 1684 | 1644 | 1702 | 1736 |
| Shipping and cargo-working | 1249 | 1429 | 1507 | 1556 | 1642 | 1826 | 2126 | 2087 | 2015 | 2064 | 2106 |
| Hotel, restaurant, and other personal service | 955 | 1048 | 1057 | 1103 | 1145 | 1269 | 1528 | 1526 | 1469 | 1497 | 1502 |
| Miscellaneous | 1021 | 1049 | 1128 | 1179 | 1254 | 1593 | 1669 | 1590 | 1519 | 1553 | 1587 |
| All industrial groups combined | 1073 | 1170 | 1225 | 1278 | 1368 | 1570 | 1703 | 1654 | 1625 | 1651 | 1679 |
On examination of the above table it will be observed that wages rose steadily and in fairly regular gradations from year to year from 1914 to 1918. Between 1918 and 1919 and to an even greater extent in the two years immediately following, sharp increases were recorded, the peak being reached in 1921, when the “all groups” combined index number was 1703. Between 1921 and 1922 a sharp drop was recorded, followed by a smaller decrease in the succeeding year and slight rises in 1924 and 1925.
The reason for the marked fluctuation in the later years of the period under review is no doubt the fact that in time of rising prices wages lag behind. When the provisions of the War Legislation and Statute Law Amendment Act providing for the regulation of wages in accordance with movements in the cost of living came into effect this lag was partially eliminated; consequently sharp increases took place—90 points between 1918 and 1919, 202 points between 1919 and 1920, and 133 points between 1920 and 1921. The effect of the post-war slump thereafter becomes apparent, decreases being recorded in the two subsequent years (1922 and 1923), the nominal wage index for all groups of industries falling from 1703 in 1921 to 1625 in 1923. The rise in wages since 1923 corresponds with the recovery from that slump.
The groups covering (1) clothing, boots, &c., (2) textiles and weaving, and (3) hotel and restaurant workers, show consistently lower index numbers than those of most other groups, the reason being that in the cases enumerated female workers form a large proportion of the total wage-earners. The index numbers for the groups shipping and cargo-working, printing, and building are, in general, higher than is the case in other groups. The high proportion of skilled workers in the printing and building trades would account for the relatively high wages paid in these groups. The group “shipping and cargo-working” includes waterside workers, whose wages per hour are usually somewhat higher than those in other occupations of the same grade, due no doubt to allowance being made, in the fixing of wages, for the casual nature of the occupation. In the case of the remainder of the workers in this group —viz., cooks, stewards, engineers, and seamen—an addition has, for purposes of computing the index numbers, been made to the award rates equivalent to the value of board and lodging supplied.
In the preceding table Dominion index numbers were given for each individual group and for all groups combined, but no attempt was made to differentiate between the four industrial districts. The following table shows the index numbers for all groups combined for each industrial district and the Dominion weighted average for the years 1914 to 1925. From this table comparisons may be made between the index numbers for the four principal industrial districts.
| NOMINAL-WAGE INDEX NUMBERS, FOUR PRINCIPAL INDUSTRIAL DISTRICTS, 1914–25.(Base: Dominion weighted average wages for all industrial groups combined. 1909–13 = 1000.) | |||||
|---|---|---|---|---|---|
| Year. | Northern Industrial District. | Wellington Industrial District. | Canterbury Industrial District. | Otago and Southland Industrial District. | Dominion Weighted Average. |
NOTE.—The wage indexes shown in this table are comparable both vertically and horizontally. | |||||
| 1914 | 1069 | 1072 | 1088 | 1064 | 1073 |
| 1915 | 1428 | 1355 | 1130 | 1269 | 1135 |
| 1916 | 1143 | 1125 | 1162 | 1296 | 1170 |
| 1917 | 1094 | 1203 | 1231 | 1324 | 1225 |
| 1918 | 1257 | 1245 | 1290 | 1348 | 1278 |
| 1919 | 1335 | 1327 | 1399 | 1450 | 1368 |
| 1920 | 1505 | 1528 | 1640 | 1661 | 1570 |
| 1921 | 1677 | 1662 | 1745 | 1761 | 1703 |
| 1922 | 1629 | 1630 | 1672 | 1709 | 1654 |
| 1923 | 1621 | 1600 | 1639 | 1654 | 1625 |
| 1924 | 1647 | 1637 | 1671 | 1676 | 1651 |
| 1925 | 1645 | 1678 | 1692 | 1727 | 1679 |
From the foregoing table it is evident that no considerable differences exist between the index numbers for the four principal districts. In the case of several industries Dominion awards are made which apply to all districts. Such differences as are observed are due to a certain extent to the fact that some industries included in the compilations are not carried on in all districts. For instance, the sugar-refining industry is confined to the Northern District, and, while in the Northern, Canterbury (which for this purpose is deemed to include Westland), and Otago and Southland Districts the mining industry is an important one, coal-mining at least is not carried on in the Wellington Industrial District. This point can be more clearly seen by a study of the following table, which shows for the year 1925 the index numbers for the individual groups in each district as well as the Dominion weighted average index numbers.
| NOMINAL-WAGE INDEX NUMBERS BY INDUSTRIAL GROUPS AND DISTRICTS, 1925.(Base: Dominion weighted average wages for all industrial groups combined, 1909–13 = 1000.) | |||||
|---|---|---|---|---|---|
| Industrial Group. | Index Numbers. | ||||
| Northern Industrial District. | Wellington Industrial District. | Canterbury Industrial District. | Otago and Southland Industrial District. | Dominion Weighted Average. | |
NOTE.—The wage indexes in this table are comparable both vertically and horizontally. | |||||
| Food, drink, and tobacco | 1753 | 1813 | 1701 | 1760 | 1778 |
| Clothing, boots, &c. | 1212 | 1076 | 1206 | 1266 | 1191 |
| Textiles and weaving | 1622 | 1539 | 1565 | 1587 | 1558 |
| Building and construction | 1810 | 1793 | 1824 | 1792 | 1804 |
| Wood-manufacture | 1824 | 1861 | 1901 | 1813 | 1837 |
| Printing, &c. | 1794 | 2085 | 1977 | 1910 | 1967 |
| Metal-working and engineering | 1780 | 1810 | 1807 | 1749 | 1784 |
| Other manufactures | 1767 | 1551 | 1737 | 1688 | 1731 |
| Mining | 1876 | .. | 1838 | 1813 | 1820 |
| Agricultural and pastoral | 1417 | 1413 | 1534 | 1682 | 1491 |
| Land transport | 1760 | 1758 | 1740 | 1727 | 1736 |
| Shipping and cargo-working | 2106 | 2106 | 2106 | 2106 | 2106 |
| Hotel, restaurant, and other personal service | 1526 | 1460 | 1524 | 1475 | 1502 |
| Miscellaneous | 1576 | 1596 | 1583 | 1614 | 1587 |
| All industrial groups combined | 1645 | 1678 | 1692 | 1727 | 1679 |
The following tables show respectively the unweighted averages of award rates for the four principal districts as at 31st March of 1914 and of each year from 1922 to 1926, and the award rates of wages for each occupation in each industrial district as at 31st March, 1926. The estimated value of board and lodging has been added to the wages in those occupations where it is a necessary perquisite of employment.
| AVERAGE MINIMUM WEEKLY ADULT WAGES, 1914 AND 1922–26. | ||||||||||||
|---|---|---|---|---|---|---|---|---|---|---|---|---|
| (NOTE:—The figures given are averages for the four principal industrial districts as at 31st March in the years shown.) | ||||||||||||
| Occupation. | Average Wage (Four Principal Districts) at 31st March. | |||||||||||
| 1914. | 1922. | 1923. | 1924. | 1925. | 1926. | |||||||
| s. | d. | s. | d. | s. | d. | s. | d. | s. | d. | s. | d. | |
| Bakers—Journeymen | 55 | 0 | 95 | 3 | 89 | 6 | 91 | 6 | 97 | 6 | 97 | 6 |
| Labourers | 48 | 0 | 78 | 10 ½ | 72 | 1 ½ | 76 | 0 | 78 | 0 | 78 | 0 |
| Butchers—First shopmen | 72 | 6 | 107 | 10 ½ | 104 | 9 | 102 | 9 | 106 | 7 ½ | 116 | 10 ½ |
| Second shopmen | 62 | 6 | 99 | 1 ½ | 94 | 6 | 94 | 0 | 96 | 0 | 105 | 0 |
| Butter-factory employees— | ||||||||||||
| Churning and buttermaking | 52 | 6 | 79 | 6 | 79 | 4 ½ | 77 | 4 | 77 | 8 | 79 | 4 |
| Flour-milling—Kilnmen | 48 | 0 | 88 | 3 | 82 | 3 | 91 | 0 | 91 | 0 | 92 | 8 |
| Assistant smuttermen | 52 | 0 | 86 | 3 | 80 | 3 | 83 | 0 | 83 | 0 | 84 | 8 |
| Rollermen | 56 | 0 | 93 | 3 | 87 | 3 | 95 | 0 | 95 | 0 | 95 | 0 |
| Meat-freezing— | ||||||||||||
| Freezing-chamber hands | 64 | 0 | 105 | 9 ¾ | 101 | 2 ½ | 101 | 2 ½ | 96 | 3 | 96 | 3 |
| General hands | 54 | 0 | 88 | 6 ½ | 84 | 8 ½ | 84 | 8 ½ | 88 | 0 | 88 | 0 |
| Meat-preserving— | ||||||||||||
| Boners | 62 | 0 | 101 | 2 ½ | 96 | 9 ¾ | 96 | 9 ¾ | 99 | 11 | 99 | 11 |
| Meat-preservers | 59 | 6 | 92 | 9 ¼ | 8 ¾ | 8 ¾ | 88 | 8 ¾ | 93 | 6 | 93 | 6 |
| Sausage-casing makers | 58 | 8 | 90 | 2 ¼ | 80 | 8 | 80 | 8 | 83 | 8 ¼ | 83 | 8 ¼ |
| Aerated-waters and cordial making— | ||||||||||||
| Cordial-makers | 58 | 9 | 88 | 6 | 80 | 6 | 84 | 2 | 84 | 8 | 93 | 0 |
| Bottle-washers | 45 | 0 | 79 | 1 ½ | 71 | 1 ½ | 73 | 10 ½ | 73 | 10 ½ | 83 | 0 |
| Brewing—Labourers | 47 | 7 ½ | 87 | 10 ¾ | 80 | 1 | 80 | 1 | 82 | 10 | 83 | 10 ½ |
| Cellarmen | 55 | 0 | 88 | 3 | 80 | 44 | 80 | 4 ½ | 83 | 0 | .. | |
| Tailors—Journeymen | 53 | 9 | 98 | 0 | 90 | 0 | 90 | 0 | 90 | 0 | 90 | 0 |
| Factory hands | 56 | 0 | 89 | 10 | 81 | 10 | 81 | 10 | 84 | 0 | 84 | 0 |
| Tailoresses (shop)—Coat hands | 30 | 0 | 48 | 2 ½ | 45 | 9 ¾ | 45 | 9 ¾ | 45 | 11 ¼ | 47 | 8 |
| Machinists | 26 | 9 | 48 | 2 ½ | 47 | 6 | 44 | 9 ½ | 45 | 11 ¼ | 47 | 8 |
| Tailoresses (factory)—Journeywomen | 27 | 6 | 45 | 0 | 42 | 6 | 42 | 6 | 44 | 0 | 45 | 0 |
| Boot operators— | ||||||||||||
| Male | 52 | 6 | 91 | 8 | 83 | 8 | 84 | 4 | 84 | 4 | 85 | 3 |
| Female journeywomen | 27 | 6 | 51 | 6 | 47 | 6 | 47 | 6 | 47 | 6 | 48 | 6 |
| Woollen-mills— | ||||||||||||
| Males—Spinners | 51 | 0 | 93 | 9 | 85 | 9 | 85 | 9 | 85 | 9 | 85 | 9 |
| General hands | 46 | 6 | 82 | 6 | 74 | 6 | 74 | 6 | 74 | 6 | 74 | 6 |
| Females—All adults | 26 | 3 | 45 | 0 | 41 | 0 | 41 | 0 | 41 | 0 | 41 | 0 |
| Building and construction— | ||||||||||||
| Bricklayers | 68 | 5 ¼ | 107 | 11 ¼ | 99 | 11 ¼ | 99 | 11 ¼ | 99 | 11 ¼ | 99 | 11 ¼ |
| Carpenters | 64 | 3 ½ | 101 | 1 | 93 | 0 ¾ | 97 | 2 | 97 | 2 | 97 | 2 |
| Joiners | 64 | 3 ½ | 101 | 1 | 93 | 0 ¾ | 97 | 2 | 97 | 2 | 97 | 2 |
| Plasterers | 67 | 9 ½ | 105 | 7 ¼ | 96 | 10 ¼ | 96 | 10 ¼ | 96 | 10 ¼ | 96 | 10 ¼ |
| Plumbers (competent) | 66 | 0 | 102 | 5 ¼ | 94 | 5 ¼ | 94 | 5 ¼ | 95 | 4 | 95 | 4 |
| Bricklayers' labourers | 55 | 0 | 87 | 1 | 79 | 1 | 79 | 1 | 84 | 0 | 86 | 7 |
| Other builders' labourers | 52 | 6 ½ | 6 ½ | 84 | 6 ¾ | 76 | 6 ¾ | 76 | 6 ¾ | 79 | 0 83 | 5 |
| Sawmilling— | ||||||||||||
| Engine-drivers (first-class) | 54 | 0 | 96 | 6 | 88 | 6 | 88 | 5 | 95 | 0 | 104 | 6 |
| Sawyers | 53 | 0 ¼ | 99 | 11 ¾ | 91 | 11 ¼ | 94 | 11 ¼ | 100 | 0 ¼ | 110 | 7 ½ |
| Tailers-out | 43 | 9 | 92 | 1 ¼ | 83 | 11 ¾ | 83 | 11 ¾ | 88 | 3 ¼ | 96 | 0 |
| Yardmen | 55 | 8 ¾ | 88 | 7 ½ | 80 | 7 ½ | 82 | 4 ¾ | 91 | 7 | 99 | 3 |
| General hands | 51 | 0 | 88 | 1 ¾ | 80 | 2 | 80 | 5 | 83 | 4 ¼ | 89 | 6 |
| Boatbuilding—Shipwrights | 62 | 8 | 96 | 5 ¾ | 88 | 5 ¾ | 95 | 7 | 100 | 4 ¼ | 100 | 4 ¼ |
| Boatbuilders | 58 | 9 | 91 | 11 ¾ | 83 | 11 ¾ | 92 | 4 ½ | 92 | 4 ½ | 92 | 4 ½ |
| Metal-works, &c.— | ||||||||||||
| Blacksmiths, farriers | 61 | 7 | 81 | 3 | 74 | 9 | 89 | 10 ¾ | 89 | 10 ¾ | 95 | 4 |
| Boilermaking—Journeymen | 62 | 8 | 102 | 1 ½ | 94 | 3 | 94 | 3 | 95 | 4 | 95 | 4 |
| Iron and brass moulders | 64 | 7 ½ | 101 | 4 ½ | 93 | 9 ½ | 91 | 11 ½ | 95 | 4 | 95 | 4 |
| Tinsmiths—Journeymen | 62 | 8 | 104 | 0 ¾ | 94 | 2 ¼ | 94 | 2 ¼ | 95 | 4 | 95 | 4 |
| Engineering— | s. | d. | s | d. | s. | d. | s. | d. | s. | d. | s. | d. |
| Fitters, &c. | 64 | 7 ½ | 100 | 10 | 94 | 5 | 94 | 5 | 95 | 4 | 95 | 4 |
| Electrical workers | 61 | 10 ½ | 101 | 9 | 94 | 1 | 94 | 1 | 95 | 4 | 95 | 4 |
| Motor mechanics | 64 | 11 ½ | 101 | 9 | 94 | 5 | 94 | 5 | 95 | 1 ¼ | 95 | 4 |
| Skin and leather workers— | ||||||||||||
| Curriers | 58 | 0 | 100 | 0 | 92 | 0 | 95 | 8 | 95 | 0 | 95 | 0 |
| Pelt-fleshers | 54 | 6 | 90 | 8 ½ | 83 | 11 ½ | 97 | 0 | 95 | 0 | 95 | 0 |
| General hands | 49 | 6 | 85 | 9 | 79 | 0 | 79 | 0 | 84 | 4 | 84 | 4 |
| Mineral and stone workers— | ||||||||||||
| Brickmakers | 53 | 11 ½ | 101 | 8 | 99 | 0 | 99 | 0 | 100 | 0 | 100 | 0 |
| General hands | 46 | 9 ¾ | 91 | 0 | 83 | 0 | 83 | 0 | 84 | 0 | 84 | 0 |
| Mining (coal)— | ||||||||||||
| Surface—Tippers | 53 | 7 ½ | 89 | 8 | 86 | 8 | 84 | 2 | 85 | 10 | 85 | 10 |
| Labourers | 54 | 3 ¾ | 89 | 8 | 86 | 8 | 86 | 10 | 85 | 10 | 85 | 10 |
| Winchmen | 55 | 0 | 90 | 6 | 87 | 6 | 87 | 6 | 92 | 2 | 92 | 1 |
| Miners | 63 | 3 | 104 | 1 ¾ | 101 | 1 ¾ | 103 | 4 | 99 | 9 | 99 | 9 |
| Truckers | 55 | 11 | 95 | 4 ¾ | 92 | 4 ¾ | 92 | 8 | 91 | 7 ¾ | 91 | 7 ¾ |
| Mining (gold)— | ||||||||||||
| Dry-shaft battery workers | 59 | 0 | 80 | 7 ¼ | 74 | 2 | 84 | 6 | 84 | 1 | 88 | 11 |
| Wet-shaft battery workers | 60 | 0 | 81 | 7 | 75 | 2 | 87 | 6 | .. | .. | ||
| Cyanide-workers | 57 | 0 | 84 | 2 ½ | 84 | 10 | 86 | 4 ½ | 86 | 4 ½ | 87 | 7 |
| Quarrymen | 52 | 8 ½ | 87 | 10 ½ | 78 | 3 | 80 | 2 | 85 | 3 ¼ | 85 | 3 ¼ |
| Agricultural and pastoral workers— | ||||||||||||
| General farm hands | 41 | 8 | 50 | 4 ½ | 51 | 6 ¾ | 51 | 6 ¾ | 50 | 11 ¼ | 50 | 11 ¼ |
| Harvesters | 64 | 4 | 90 | 6 | 105 | 5 | 105 | 5 | 101 | 10 | 101 | 10 |
| Ploughmen | 45 | 8 | 54 | 1 ½ | 60 | 11 ¼ | 60 | 11 ¼ | 57 | 6 | 57 | 6 |
| Musterers | 53 | 10 | 112 | 9 | 102 | 1 ¼ | 102 | 1 ½ | 105 | 0 | 105 | 0 |
| Shepherds | 46 | 6 | 56 | 7 ½ | 55 | 5 | 55 | 5 | 56 | 8 | 56 | 8 |
| Wool-pressers | 48 | 0 | 99 | 0 | 87 | 1 | 72 | 9 | 79 | 5 | 79 | 5 |
| Railways— | ||||||||||||
| Engine-drivers | 75 | 0 | 107 | 8 | 108 | 1 ¼ | 108 | 1 ½ | 109 | 11 ¼ | 109 | 11 ½ |
| Firemen | 60 | 0 | 90 | 3 | 93 | 9 | 93 | 9 | 90 | 3 | 90 | 3 |
| Guards | 63 | 0 | 102 | 2 | 100 | 0 | 100 | 0 | 106 | 8 | 106 | 8 |
| Tramways—Motormen | 53 | 6 | 83 | 7 ½ | 86 | 6 | 86 | 6 | 90 | 0 | 92 | 3 |
| Conductors | 47 | 7 ½ | 79 | 10 ½ | 82 | 6 | 82 | 6 | 85 | 6 | 85 | 0 |
| Shipping and cargo-working— | ||||||||||||
| Assistant stewards, first class | 40 | 4 ½ | 94 | 7 ½ | 86 | 6 | 86 | 0 | 89 | 3 | 89 | 3 |
| Assistant stewards, second class | 33 | 5 ½ | 92 | 3 ¾ | 83 | 8 | 83 | 8 | 86 | 11 | 86 | 11 |
| Chief cooks | 75 | 0 | 133 | 10 | 122 | 8 | 122 | 8 | 126 | 1 ½ | 126 | 1 ½ |
| Second cooks | 51 | 11 | 108 | 5 ½ | 99 | 10 | 99 | 10 | 103 | 0 | 103 | 0 |
| A.B. seamen | 50 | 4 ½ | 96 | 11 | 95 | 0 | 95 | 0 | 97 | 8 | 97 | 8 |
| Ordinary seamen, first class | 41 | 1 ¾ | 73 | 10 | 68 | 6 | 68 | 6 | 74 | 3 | 74 | 3 |
| Waterside workers—Ordinary cargo | 62 | 4 | 99 | 0 | 92 | 4 | 92 | 4 | 97 | 2 | 97 | 2 |
| Hotel workers—Chefs (male) | 86 | 10 ½ | 120 | 0 | 114 | 1 ½ | 116 | 7 ½ | 145 | 0 | 145 | 0 |
| Waiters (male) | 53 | 0 | 95 | 0 | 87 | 0 | 88 | 7 ½ | 87 | 0 | 87 | 0 |
| Cooks (female) | 46 | 3 | 82 | 6 | 78 | 6 | 78 | 6 | 78 | 6 | 78 | 6 |
| Housemaids | 34 | 10 ½ | 65 | 0 | 61 | 0 | 61 | 0 | 61 | 0 | 61 | 0 |
| Waitresses | 39 | 1 ¾ | 67 | 6 | 63 | 8 ¼ | 63 | 1 ½ | 61 | 0 | 61 | 0 |
| Miscellaneous— | ||||||||||||
| Soft-goods assistants (male) | 55 | 0 | 86 | 6 | 79 | 10 ½ | 81 | 3 | 92 | 6 | 93 | 14 |
| Warehouse storemen | 51 | 3 ¼ | 93 | 7 ½ | 77 | 0 | 77 | 0 | 85 | 0 | 85 | 0 |
| Grocers' assistants | 50 | 0 | 92 | 3 | 82 | 6 | 88 | 1 ½ | 91 | 11 | 93 | 14 |
| MINIMUM WEEKLY ADULT WAGES IN EACH INDUSTRIAL DISTRICT, 31ST MARCH, 1926. | ||||||||
|---|---|---|---|---|---|---|---|---|
| Occupation. | Northern. | Wellington. | Canterbury. | Otago and Southland. | ||||
| s. | d. | s. | d. | s. | d. | s. | d. | |
| Bakers—Journeymen | 97 | 6 | 97 | 6 | 97 | 6 | 97 | 6 |
| Labourers | 78 | 0 | 78 | 0 | 78 | 0 | 78 | 0 |
| Butchers—First shopmen | 117 | 6 | 117 | 6 | 117 | 6 | 115 | 0 |
| Second shopmen | 105 | 0 | 105 | 0 | 105 | 0 | 105 | 0 |
| Butter-factory employees— | ||||||||
| Churning and buttermaking | 77 | 0 | .. | 80 | 0 | 81 | 0 | |
| Flour-milling—Kilnmen | 91 | 0 | .. | 91 | 0 | 96 | 0 | |
| Assistant smuttermen | 83 | 0 | .. | 83 | 0 | 88 | 0 | |
| Rollermen | 95 | 0 | .. | 95 | 0 | 100 | 0 | |
| Meat-freezing— | ||||||||
| Freezing-chamber hands | 96 | 3 | 96 | 3 | 96 | 3 | 96 | 3 |
| General hands | 88 | 0 | 88 | 0 | 88 | 0 | 88 | 0 |
| Meat-preserving— | ||||||||
| Boners | 99 | 11 | 99 | 11 | 99 | 11 | 99 | 11 |
| Meat-preservers | 93 | 6 | 93 | 6 | 93 | 6 | 93 | 6 |
| Aerated-waters and cordial making— | ||||||||
| Cordial-makers | .. | .. | 93 | 0 | .. | |||
| Bottle-washers | .. | .. | 83 | 0 | .. | |||
| Brewing—Labourers | 86 | 3 | 83 | 6 | 83 | 0 | 83 | 0 |
| Cellarmen | .. | .. | 98 | 0 | .. | |||
| Tailors—Journeymen | 90 | 0 | 90 | 0 | 90 | 0 | 90 | 0 |
| Factory hands | 84 | 0 | 84 | 0 | 84 | 0 | 84 | 0 |
| Tailoresses (shop)—Coat hands | 47 | 6 | .. | 48 | 0 | 47 | 6 | |
| Machinists | 47 | 6 | .. | 48 | 0 | 47 | 6 | |
| Tailoresses (factory)—Journeywomen | 45 | 0 | 45 | 0 | 45 | 0 | 45 | 0 |
| Boot operatives— | ||||||||
| Male | 85 | 3 | 85 | 3 | 85 | 3 | 85 | 3 |
| Female journeywomen | 48 | 6 | 48 | 6 | 48 | 6 | 48 | 6 |
| Woollen-mills— | ||||||||
| Males—Spinners | 85 | 9 | 85 | 9 | 85 | 9 | 85 | 9 |
| General hands | 74 | 6 | 74 | 6 | 74 | 6 | 74 | 6 |
| Females—All adults | 41 | 0 | 41 | 0 | 41 | 0 | 41 | 0 |
| Building and construction— | ||||||||
| Bricklayers | 99 | 3 | 99 | 3 | 102 | 0 | 99 | 3 |
| Carpenters | 97 | 2 | 97 | 2 | 97 | 2 | 97 | 2 |
| Joiners | 97 | 2 | 97 | 2 | 97 | 2 | 97 | 2 |
| Plasterers | 96 | 6 | 99 | 3 | 92 | 0 | 99 | 8 |
| Plumbers (competent) | 95 | 4 | 95 | 4 | 95 | 4 | 95 | 4 |
| Bricklayers' labourers | 88 | 0 | 85 | 2 ¼ | .. | .. | ||
| Other builders' labourers | .. | 85 | 2 ¼ | 84 | 4 | 80 | 8 | |
| Sawmilling— | ||||||||
| Engine-drivers (first-class) | 105 | 0 | .. | .. | 104 | 0 | ||
| Sawyers | 102 | 0 | 104 | 0 | 116 | 6 | 120 | 0 |
| Tailers-out | 93 | 0 | .. | 96 | 0 | 99 | 0 | |
| Yardmen | 99 | 0 | 99 | 0 | 99 | 0 | 100 | 0 |
| General hands | 91 | 0 | 90 | 0 | 88 | 0 | 90 | 0 |
| Boatbuilding—Shipwrights | 93 | 9 | 110 | 10 | .. | 96 | 6 | |
| Boatbuilders | 88 | 3 | .. | .. | 96 | 6 | ||
| Metal-works, &c.— | ||||||||
| Boilermaking—Journeymen | 95 | 4 | 95 | 4 | 95 | 4 | 95 | 4 |
| Iron and brass moulders | 95 | 4 | 95 | 4 | 95 | 4 | 95 | 4 |
| Tinsmiths—Journeymen | 95 | 4 | 95 | 4 | 95 | 4 | 95 | 4 |
| Metal-works, &c. | ||||||||
| Engineering— | ||||||||
| Fitters, &c. | 95 | 4 | 95 | 4 | 95 | 4 | 95 | 4 |
| Electrical workers | 95 | 4 | 95 | 4 | 95 | 4 | 95 | 4 |
| Motor mechanics | 95 | 4 | 95 | 4 | 95 | 4 | 95 | 4 |
| Skin and leather workers— | ||||||||
| Curriers | 93 | 0 | .. | .. | 97 | 0 | ||
| Pelt-fleshers | 91 | 0 | .. | 97 | 0 | 97 | 0 | |
| General hands | 85 | 0 | .. | 84 | 0 | 84 | 0 | |
| Mineral and stone workers— | ||||||||
| Brickmakers | 100 | 0 | 100 | 0 | 100 | 0 | 100 | 0 |
| General hands | 84 | 0 | 84 | 0 | 84 | 0 | 84 | 0 |
| Mining (coal)— | ||||||||
| Surface—Tippers | 88 | 7 | .. | 85 | 0 | 83 | 11 | |
| Labourers | 88 | 7 | .. | 85 | 0 | 83 | 11 | |
| Winchmen | 92 | 2 | .. | .. | 92 | 0 | ||
| Miners | 99 | 6 ¼ | .. | 102 | 6 | 97 | 3 | |
| Truckers | 93 | 3 | .. | 90 | 0 | 91 | 8 ¼ | |
| Mining (gold)— | ||||||||
| Dry-shaft battery workers | 85 | 10 | .. | 92 | 0 | .. | ||
| Cyanide workers | 82 | 6 | .. | 89 | 4 | 91 | 0 | |
| Quarrymen | 90 | 9 | 81 | 1 ¼ | 84 | 0 | .. | |
| Agricultural and pastoral workers— | ||||||||
| General farm hands | 55 | 0 | 47 | 6 | 50 | 0 | 51 | 3 |
| Harvesters | 109 | 0 | .. | 96 | 0 | 100 | 6 | |
| Ploughmen | 55 | 0 | 60 | 0 | 55 | 0 | 60 | 0 |
| Musterers | .. | .. | 105 | 0 | 105 | 0 | ||
| Shepherds | 55 | 0 | .. | 62 | 6 | 52 | 6 | |
| Wool-pressers | 62 | 6 | 82 | 6 | 85 | 0 | 87 | 6 |
| Railways— | ||||||||
| Engine-drivers | 109 | 11 ½ | 109 | 11 ½ | 109 | 11 ½ | 109 | 11 ½ |
| Firemen | 90 | 3 | 90 | 3 | 90 | 3 | 90 | 3 |
| Guards | 106 | 8 | 106 | 8 | 106 | 8 | 106 | 8 |
| Tramways—Motormen | 96 | 0 | 96 | 0 | 92 | 0 | 85 | 0 |
| Conductors | 92 | 0 | 88 | 0 | 88 | 0 | 82 | 0 |
| Shipping and cargo-working— | ||||||||
| Assistant stewards, first class | 89 | 3 | 89 | 3 | 89 | 3 | 89 | 3 |
| Assistant stewards, second class | 86 | 11 | 86 | 11 | 86 | 11 | 86 | 11 |
| Chief cooks | 126 | 1 ½ | 126 | 1 ½ | 126 | 1 ½ | 126 | 1 ½ |
| Second cooks | 103 | 0 | 103 | 0 | 103 | 0 | 103 | 0 |
| A.B. seamen | 97 | 8 | 97 | 8 | 97 | 8 | 97 | 8 |
| Ordinary seamen, first class | 74 | 3 | 74 | 3 | 74 | 3 | 74 | 3 |
| Waterside workers—Ordinary cargo | 97 | 2 | 97 | 2 | 97 | 2 | 97 | 2 |
| Hotel workers—Chefs (male) | 145 | 0 | 145 | 0 | 145 | 0 | 145 | 0 |
| Waiters (male) | 87 | 0 | 87 | 0 | 87 | 0 | 87 | 0 |
| Cooks (female) | 78 | 6 | 78 | 6 | 78 | 6 | 78 | 6 |
| Housemaids | 61 | 0 | 61 | 0 | 61 | 0 | 61 | 0 |
| Waitresses | 61 | 0 | 61 | 0 | 61 | 0 | 61 | 0 |
| Miscellaneous— | ||||||||
| Soft-goods assistants (male) | 92 | 6 | 92 | 6 | 95 | 0 | 92 | 6 |
| Warehouse storemen | 85 | 0 | 85 | 0 | 85 | 0 | 85 | 0 |
| Grocers' assistants | 92 | 6 | 92 | 6 | 95 | 0 | 92 | 6 |
The index numbers quoted in the foregoing pages relate to nominal wages—that is, they are based on actual money rates without any allowance being made for changes known to have occurred in the purchasing-power of the monetary unit during the period under review. It is obvious that this factor is of considerable importance; for a rise in wages may be offset by a fall in the purchasing-power of the monetary unit, while, on the other hand, a fall in money wages may be offset by a rise in the purchasing-power of the monetary unit. Changes in the index numbers of retail prices are inversely proportional to changes in the purchasing-power of the pound note; and index numbers of effective (or “real”) wages can be arrived at by dividing the index numbers for nominal wages by the corresponding index numbers for retail prices covering all groups of domestic expenditure. To this end the index numbers of nominal wages on the base 1909–13 = 1000 are first converted to base 1914 by dividing them by the correction factor 1.073, the index number of nominal wages for 1914 on the former base being 1073. The resulting nominal wage index numbers on the new base are then divided by the retail price indexes (“all groups”) on base July 1914 = 1000, and the resulting quotient multiplied by 1000 yields the effective wage-indexes for the dates concerned on the base of the purchasing-power of 1914 average wages for all industrial groups combined equated to 1000.
In the compilation of index numbers of effective wages no allowance has been made for changes in the hours of labour or in other miscellaneous factors affecting the distinction between real and nominal wages.
| EFFECTIVE WAGE-INDEX NUMBERS, 1914 AND 1916–25.(Base: Purchasing-power of Dominion weighted average wages for all industrial groups combined, 1914 = 1000.) | |||||||||||
|---|---|---|---|---|---|---|---|---|---|---|---|
| Industrial Group. | 1914. | 1916. | 1917. | 1918. | 1919. | 1920. | 1921. | 1922. | 1923. | 1924. | 1925. |
NOTE.—The index numbers in this table are comparable horizontally and vertically. | |||||||||||
| Food, drink, and tobacco | 1001 | 901 | 846 | 778 | 729 | 784 | 853 | 959 | 962 | 997 | 1022 |
| Clothing, boots, &c. | 687 | 616 | 591 | 558 | 555 | 583 | 638 | 690 | 677 | 677 | 685 |
| Textiles and weaving | 906 | 823 | 784 | 714 | 727 | 685 | 770 | 870 | 918 | 906 | 896 |
| Building and construction | 1152 | 1004 | 950 | 885 | 885 | 924 | 992 | 1071 | 1048 | 1048 | 1037 |
| Wood-manufacture | 1035 | 965 | 872 | 839 | 818 | 847 | 995 | 1060 | 1037 | 1054 | 1056 |
| Printing, &c. | 1187 | 1025 | 995 | 896 | 921 | 984 | 1054 | 1107 | 1072 | 1061 | 1131 |
| Metal-working and engineering | 1082 | 960 | 895 | 854 | 849 | 901 | 958 | 1054 | 1051 | 1037 | 1026 |
| Other manufactures | 1013 | 926 | 852 | 803 | 785 | 834 | 955 | 1018 | 1001 | 991 | 995 |
| Mining | 1067 | 952 | 895 | 851 | 792 | 776 | 931 | 1031 | 1037 | 1048 | 1046 |
| Agricultural and pastoral | 942 | 981 | 945 | 896 | 866 | 807 | 814 | 853 | 881 | 866 | 857 |
| Land transport | 1003 | 931 | 859 | 808 | 814 | 861 | 913 | 983 | 971 | 992 | 998 |
| Shipping and cargo-working | 1164 | 1148 | 1091 | 1015 | 975 | 956 | 1116 | 1219 | 1191 | 1203 | 1211 |
| Hotel, restaurant, and other personal service | 890 | 842 | 765 | 719 | 680 | 665 | 802 | 891 | 868 | 872 | 863 |
| Miscellaneous | 952 | 843 | 817 | 769 | 745 | 834 | 876 | 929 | 898 | 904 | 912 |
| All industrial groups combined | 1000 | 940 | 887 | 833 | 812 | 822 | 894 | 966 | 960 | 959 | 965 |
The diagram which follows shows the movement in retail prices, nominal wages, and effective wages since 1914. Nominal wages are seen to have lagged behind prices while the latter were rising, and to have continued to rise between 1920 an 1921 while prices were declining. The result is a steady fall in effective wages until 1920, and a sharp rise between 1921 and 1922, followed by a slight fall between 1922 and 1924. A slight increase was recorded between 1924 and 1925.
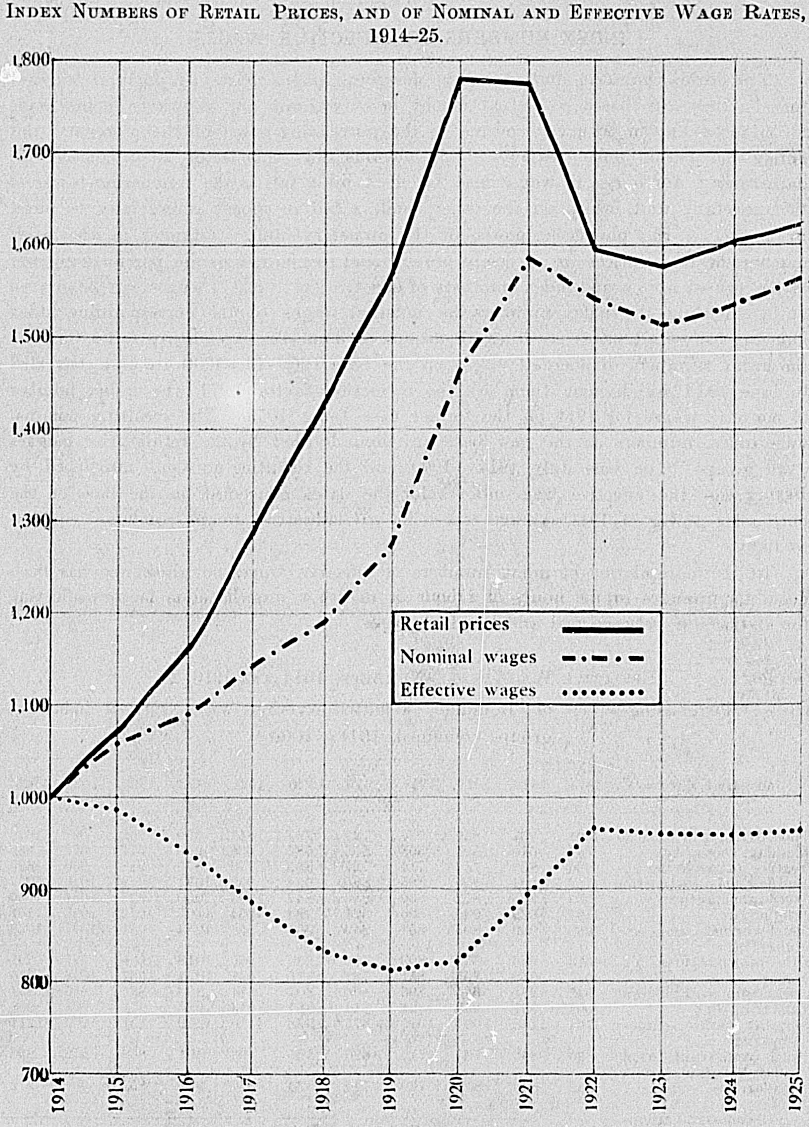
The index numbers in the preceding tables being all on a common base, comparisons between movements in the various groups cannot be readily made; an increase of (say) 10 per cent. in the group “clothing and boots,” in which the index numbers are consistently low being considerably smaller numerically than an increase of the same percentage in (say) the printing trade, where the index numbers are considerably higher. The following tables bring out the movements in the various groups more clearly, the 1914 index number for each group being taken as base in each case. Care must be exercised in drawing inferences from these tables, for, while horizontal comparisons are quite valid, the vertical comparison between the various groups is valid only in so far as it shows in which groups the greater or the smaller increases have been observed since the base period (1914 in this case). For example, although nominal wages in the textile and weaving group show in 1925 an increase of 60 per cent. since 1914, while those in the group “mining” have increased by only 56 per cent., nevertheless wages were higher in the latter group in 1925 since they were considerably higher in 1914—the base year.
| NOMINAL-WAGE INDEX NUMBERS, EACH INDUSTRIAL GROUP AND “ALL GROUPS” COMBINED, 1914 and 1916–25.(Bases: Dominion average wages for each industrial group respectively, 1914 = 1000.) | |||||||||||
|---|---|---|---|---|---|---|---|---|---|---|---|
| Industrial Group. | 1914. | 1916. | 1917. | 1918. | 1919. | 1920. | 1921. | 1922. | 1923. | 1924. | 1925. |
NOTE.—Vertical comparisons are indicative merely of the relative percentage increases of wages in the different industrial groups since 1914, not (as in the case of previous tables) of the actual relative levels of wages in the different industries. | |||||||||||
| Food, drink, and tobacco | 1000 | 1044 | 1088 | 1111 | 1143 | 1395 | 1512 | 1530 | 1516 | 1593 | 1655 |
| Clothing, boots, &c. | 1000 | 1039 | 1106 | 1160 | 1270 | 1510 | 1649 | 1604 | 1554 | 1577 | 1616 |
| Textiles and weaving | 1000 | 1055 | 1114 | 1126 | 1260 | 1347 | 1508 | 1533 | 1598 | 1600 | 1603 |
| Building and construction | 1000 | 1011 | 1061 | 1098 | 1206 | 1427 | 1528 | 1485 | 1434 | 1455 | 1460 |
| Wood-manufacture | 1000 | 1081 | 1084 | 1158 | 1240 | 1455 | 1707 | 1635 | 1579 | 1629 | 1653 |
| Printing, &c. | 1000 | 1002 | 1078 | 1078 | 1218 | 1475 | 1576 | 1487 | 1423 | 1430 | 1544 |
| Metal-working and engineering | 1000 | 1029 | 1065 | 1127 | 1232 | 1482 | 1572 | 1555 | 1532 | 1533 | 1537 |
| Other manufactures | 1000 | 1060 | 1083 | 1132 | 1216 | 1465 | 1674 | 1603 | 1558 | 1566 | 1592 |
| Mining | 1000 | 1035 | 1079 | 1140 | 1165 | 1294 | 1549 | 1542 | 1532 | 1571 | 1560 |
| Agricultural and pastoral | 1000 | 1208 | 1291 | 1359 | 1442 | 1524 | 1533 | 1445 | 1476 | 1470 | 1475 |
| Land transport | 1000 | 1077 | 1102 | 1151 | 1274 | 1528 | 1616 | 1565 | 1528 | 1582 | 1613 |
| shipping and cargo-working | 1000 | 1144 | 1207 | 1246 | 1315 | 1462 | 1702 | 1671 | 1613 | 1653 | 1686 |
| Hotel, restaurant, and other personal service | 1000 | 1097 | 1107 | 1155 | 1199 | 1329 | 1600 | 1598 | 1538 | 1568 | 1573 |
| Miscellaneous | 1000 | 1027 | 1105 | 1155 | 1228 | 1560 | 1635 | 1557 | 1488 | 1521 | 1554 |
| All industrial groups combined | 1000 | 1090 | 1142 | 1191 | 1275 | 1463 | 1587 | 1541 | 1514 | 1539 | 1565 |
| EFFECTIVE-WAGE INDEX NUMBERS IN EACH GROUP AND “ALL GROUPS” COMBINED 1914 and 1916–25.(Bases: Purchasing - powers of Dominion average wages for each industrial group respectively, 1914 = 1000.) | |||||||||||
|---|---|---|---|---|---|---|---|---|---|---|---|
| Industrial Group. | 1914. | 1916. | 1917. | 1918. | 1919. | 1920. | 1921. | 1922. | 1923. | 1924. | 1925. |
NOTE.—Vertical comparisons are indicative merely of the relative percentage increases of wages in the different industrial groups since 1914, not of the actual relative levels of wages in the different industries. | |||||||||||
| Food, drink, and tobacco | 1000 | 900 | 845 | 777 | 728 | 783 | 852 | 958 | 961 | 996 | 1021 |
| Clothing, boots, &c. | 1000 | 897 | 860 | 812 | 808 | 849 | 929 | 1004 | 985 | 985 | 997 |
| Textiles and weaving | 1000 | 908 | 865 | 788 | 802 | 756 | 850 | 960 | 1013 | 1000 | 989 |
| Building and construction | 1000 | 872 | 825 | 768 | 768 | 802 | 861 | 930 | 910 | 909 | 900 |
| Wood-manufacture | 1000 | 932 | 843 | 811 | 790 | 818 | 961 | 1024 | 1002 | 1018 | 1019 |
| Printing, &c. | 1000 | 865 | 838 | 755 | 776 | 829 | 888 | 933 | 903 | 894 | 952 |
| Metal-working and engineering | 1000 | 887 | 827 | 789 | 785 | 833 | 885 | 974 | 971 | 958 | 947 |
| Other manufactures | 1000 | 914 | 841 | 793 | 775 | 823 | 943 | 1005 | 988 | 978 | 981 |
| Mining | 1000 | 892 | 839 | 798 | 742 | 727 | 873 | 966 | 972 | 982 | 962 |
| Agricultural and pastoral | 1000 | 1041 | 1003 | 951 | 919 | 857 | 864 | 906 | 935 | 919 | 910 |
| Land transport. | 1000 | 928 | 856 | 806 | 812 | 858 | 910 | 980 | 968 | 988 | 994 |
| Shipping and cargo-working | 1000 | 986 | 937 | 872 | 838 | 821 | 959 | 1047 | 1023 | 1034 | 1039 |
| Hotel, restaurant and other personal service | 1000 | 946 | 860 | 808 | 764 | 747 | 901 | 1001 | 975 | 980 | 970 |
| Miscellaneous | 1000 | 886 | 858 | 808 | 783 | 876 | 920 | 976 | 943 | 950 | 958 |
| All industrial groups combined | 1000 | 940 | 887 | 833 | 812 | 822 | 894 | 966 | 960 | 959 | 965 |
The outstanding facts brought out by this last table are the considerable decreases, comparatively speaking, in the groups “building,” “printing,” and “agricultural and pastoral.” The decline in effective wages among the agricultural and pastoral employees is not really as great as the figures indicate, since the index numbers of retail prices, which have been compiled on a basis of town prices, probably overestimate the increase since 1914 in the cost of living of country workers, whose expenditure on such items as rent and fuel and light is considerably lower than in the case of town workers. It is noteworthy that in two of the groups mentioned above as showing comparatively low increases since 1914—building and printing—skilled workers predominate in numbers.
Apart from the cases mentioned, the movements in the various groups have been remarkably even.
The following table shows index numbers of hours worked in the various industrial groups for 1914 and for each year from 1916 to 1925. The material from which the index numbers have been compiled has been taken from the awards of the Arbitration Court in most cases; but, whore hours are not prescribed in the awards, reference has been made to the Factories Act and the Shops and Offices Act. The agricultural and pastoral workers group has been omitted from the computations.
| INDEX NUMBERS OF AVERAGE HOURS WORKED, 1914 AND 1916–25.(Base: Dominion weighted average hours worked in all industrial groups combined, 1909–13 = 1000.) | |||||||||||
|---|---|---|---|---|---|---|---|---|---|---|---|
| Industrial Group. | 1914. | 1916. | 1917. | 1918. | 1919. | 1920. | 1921. | 1922. | 1923. | 1924. | 1925. |
NOTE.—The index numbers in the above table are comparable both horizontally and vertically. | |||||||||||
| Food, drink, and tobacco | 993 | 988 | 981 | 982 | 982 | 958 | 951 | 949 | 948 | 945 | 945 |
| Clothing, boots, &c. | 928 | 927 | 923 | 930 | 929 | 914 | 905 | 901 | 901 | 901 | 901 |
| Textiles and weaving | 976 | 976 | 976 | 976 | 976 | 957 | 937 | 934 | 934 | 934 | 934 |
| Building and construction | 910 | 903 | 901 | 903 | 901 | 902 | 903 | 900 | 900 | 901 | 901 |
| Wood-manufacture | 951 | 930 | 921 | 920 | 918 | 918 | 914 | 914 | 914 | 917 | 917 |
| Printing &c | 978 | 979 | 975 | 975 | 958 | 940 | 892 | 889 | 890 | 890 | |
| Metal-working and engineering | 958 | 952 | 952 | 951 | 952 | 922 | 911 | 910 | 908 | 908 | 908 |
| Other manufactures | 973 | 969 | 963 | 958 | 966 | 971 | 949 | 947 | 946 | 945 | 945 |
| Mining | 958 | 937 | 939 | 950 | 934 | 929 | 898 | 908 | 908 | 920 | 920 |
| Land transport | 1002 | 1000 | 999 | 999 | 999 | 999 | 933 | 930 | 929 | 952 | 952 |
| Shipping and cargo-working | 1054 | 1078 | 1066 | 1102 | 1150 | 1110 | 1098 | 1098 | 1098 | 1098 | 1098 |
| Hotel, restaurant, and other personal service | 1203 | 1202 | 1202 | 1203 | 1203 | 1152 | 1013 | 982 | 982 | 982 | 982 |
| Miscellaneous | 955 | 965 | 965 | 961 | 960 | 923 | 912 | 901 | 897 | 890 | 890 |
| All industrial groups combined | 995 | 994 | 992 | 993 | 999 | 979 | 975 | 943 | 942 | 946 | 946 |
The index numbers in the above table being all on a common base, comparisons between movements in the different groups cannot be readily made. The following table brings out the movements in the various groups more clearly, the 1909–13 hours worked in the case of each group being taken as the base in each case for that group. Care must be exercised in drawing inferences from this table; for while horizontal comparisons can be rigorously effected vertical comparisons are of value only for the purpose of indicating which groups have shown the greatest and which the smallest decreases since the base period.
| INDEX NUMBERS OF AVERAGE HOURS WORKED, 1914 AND EACH YEAR, 1916–25.(Base: Dominion weighted average hours worked in each industrial group respectively, 1909–13 = 1000.) | ||||||||||||
|---|---|---|---|---|---|---|---|---|---|---|---|---|
| Industrial Group. | 1909–13. | 1914. | 1916. | 1917. | 1918. | 1919. | 1920. | 1921. | 1922. | 1923. | 1924. | 1925. |
NOTE.—Vertical comparisons are indicative merely of the relative percentage changes in hours worked in the different industries since the base period, not of the actual respective number of hours worked in the different industrial groups. | ||||||||||||
| Ford, drink, and tobacco | 1000 | 995 | 990 | 983 | 985 | 985 | 960 | 953 | 951 | 950 | 947 | 947 |
| Clothing, boots, &c. | 1000 | 997 | 996 | 991 | 999 | 998 | 982 | 972 | 968 | 968 | 968 | 968 |
| Textiles and weaving | 1000 | 1000 | 1000 | 1000 | 1000 | 1000 | 981 | 960 | 957 | 957 | 957 | 957 |
| Building and construction | 1000 | 993 | 986 | 984 | 986 | 984 | 985 | 986 | 983 | 983 | 984 | 984 |
| Wood-manufacture | 1000 | 1000 | 978 | 968 | 967 | 965 | 965 | 961 | 961 | 961 | 964 | 964 |
| Paper - manufacture, printing, &c. | 1000 | 1000 | 1001 | 997 | 997 | 980 | 961 | 912 | 909 | 909 | 910 | 910 |
| Metal-working and engineering | 1000 | 997 | 991 | 991 | 990 | 991 | 959 | 948 | 947 | 945 | 945 | |
| Other manufactures | 1000 | 999 | 995 | 989 | 984 | 992 | 997 | 974 | 972 | 971 | 970 | 970 |
| Mining | 1000 | 1000 | 978 | 980 | 992 | 975 | 970 | 937 | 948 | 948 | 960 | 960 |
| Land transport | 1000 | 999 | 997 | 996 | 996 | 996 | 996 | 930 | 927 | 926 | 949 | 949 |
| Shipping and cargo working | 1000 | 980 | 1002 | 991 | 1024 | 1069 | 1032 | 1020 | 1020 | 1020 | 1020 | 1020 |
| Hotel, restaurant, and other personal service | 1000 | 990 | 989 | 989 | 990 | 990 | 948 | 834 | 808 | 808 | 808 | 808 |
| Miscellaneous | 1000 | 962 | 972 | 972 | 968 967 | 930 | 918 | 907 | 903 | 896 | 896 | |
| All industrial groups combined | 1000 | 995 | 994 | 992 | 993 | 999 | 979 | 975 | 913 | 942 | 946 | 946 |
The outstanding feature of the table is the gradual and almost uninterrupted decline in the index number. The increase recorded between 1923 and 1924 is due almost exclusively to an increase in the hours of labour in certain branches of the Railway service.
The following tables show the index numbers for the various districts. In spite of the fact that certain industries are more or less confined to certain districts and that, consequently, fluctuations arise from this fact alone, the index numbers show remarkably little variation as between district and district.
The second table shows in detail the index numbers for the various groups in the different districts for the year 1925.
| INDEX NUMBERS OF AVERAGE HOURS WORKED: FOUR PRINCIPAL INDUSTRIAL DISTRICTS, 1914–25.(Base: Dominion weighted average hours worked for all industrial groups combined, 1909–13 = 1000.) | |||||
|---|---|---|---|---|---|
| Year. | Northern Industrial District. | Wellington Industrial District. | Canterbury Industrial District. | Otago and Southland Industrial District. | Dominion Weighted Average. |
NOTE.—The index numbers in the above table are comparable both horizontally and vertically. | |||||
| 1914 | 1004 | 1004 | 973 | 987 | 995 |
| 1915 | 1006 | 998 | 967 | 982 | 991 |
| 1916 | 1003 | 1015 | 962 | 983 | 994 |
| 1917 | 1009 | 1018 | 966 | 991 | 992 |
| 1918 | 989 | 990 | 950 | 977 | 993 |
| 1919 | 1000 | 1006 | 968 | 981 | 999 |
| 1920 | 1005 | 1005 | 964 | 987 | 979 |
| 1921 | 942 | 957 | 943 | 944 | 975 |
| 1922 | 937 | 958 | 930 | 947 | 943 |
| 1923 | 936 | 955 | 928 | 946 | 942 |
| 1924 | 940 | 958 | 933 | 951 | 946 |
| 1925 | 940 | 958 | 933 | 951 | 946 |
| INDEX NUMBERS OF AVERAGE HOURS WORKED, BY INDUSTRIAL GROUPS AND DISTRICTS. 1925.(Base: Dominion weighted average hours worked for all industrial groups combined 1909–13 = 1000.) | |||||
|---|---|---|---|---|---|
| Industrial Group | Northern Industrial District. | Wellington Industrial District. | Canterbury Industrial District. | Otago and Southland Industrial District. | Dominion Weighted Average. |
NOTE.—The index numbers in the above table are comparable both horizontally and vertical. | |||||
| Food, drink, and tobacco | 958 | 928 | 935 | 964 | 945 |
| Clothing, boots, &c. | 895 | 909 | 895 | 904 | 901 |
| Textiles and weaving | 938 | 936 | 926 | 926 | 934 |
| Building and construction | 895 | 912 | 895 | 895 | 901 |
| Wood-manufacture | 919 | 924 | 924 | 907 | 917 |
| Printing, &c. | 888 | 885 | 885 | 910 | 890 |
| Metal-working and engineering | 911 | 911 | 902 | 912 | 908 |
| Other manufactures | 936 | 924 | 952 | 951 | 945 |
| Mining | 907 | 956 | 928 | 936 | 920 |
| Land transport | 952 | 952 | 952 | 952 | 952 |
| Shipping and cargo-working | 1098 | 1098 | 1098 | 1098 | 1098 |
| Hotel, restaurant, and other personal service | 976 | 976 | 976 | 1025 | 982 |
| Miscellaneous | 863 | 916 | 909 | 853 | 890 |
| All industrial groups combined | 940 | 958 | 933 | 951 | 946 |
The following tables show the hours worked as at 31st March in each case in certain important occupations selected from the list from which index numbers have been compiled. The figures given in the first table are unweighted averages of hours worked in the four principal industrial districts.
| AVERAGE HOURS WORKED PER WEEK, 1914 AND 1922–26.(NOTE.—The figures shown relate to the averages of the four principal industrial districts, as at 31st March in the years shown.) | ||||||
|---|---|---|---|---|---|---|
| Occupation. | 1914. | 1922. | 1923. | 1924. | 1925. | 1926. |
| Bakers- | 48 | 48 | 47 ½ | 44 ½ | 46 | 46 |
| Butchers—Shopmen | 56 | 48 | 48 | 48 | 48 | 48 |
| Butter-factory employees | 48 | 48 ½ | 48 ¼ | 68 ½ | 48 ½ | 48 ½ |
| Flour-mill employees | 48 | 48 | 48 | 48 | 48 | 48 |
| Freezing-works employees | 48 | 44 | 44 | 44 | 44 | 44 |
| Aerated-water and cordial making employees | 46 ½ | 46 | 46 | 46 | 46 | 46 |
| Brewery workers | 46 ¼ | 45 ¼ | 45 | 45 | 44 ¼ | 44 ¼ |
| Tailors | 48 | 44 | 44 | 44 | 44 | 44 |
| Tailoresses | 45 | 44 | 44 | 44 | 44 | 44 |
| Boot operatives, male and female | 45 | 44 | 44 | 44 | 45 | 45 |
| Woollen-mills employees— | ||||||
| Male | 48 | 45 | 45 | 45 | 45 | 45 |
| Female | 48 | 45 | 45 | 45 | 45 | 45 |
| Bricklayers | 45 | 44 | 44 | 44 | 44 | 44 |
| Carpenters | 44 ¾ | 44 | 44 | 44 | 44 | 44 |
| Joiners | 44 ¾ | 44 | 44 | 44 | 44 | 44 |
| Plasterers | 44 | 44 | 44 | 44 | 44 | 44 |
| Plumbers | 44 | 44 | 44 | 44 | 44 | 44 |
| Sawmill hands | 46 ½ | 45 ¾ | 45 ¾ | 46 ¾ | 46 ¼ | 46 ¼ |
| Boatbuilders and shipwrights | 47 | 44 | 44 | 44 | 44 | 44 |
| Blacksmiths | 46 ¼ | 45 | 45 | 45 | 45 | 45 |
| Boilermakers | 47 ¾ | 44 ¼ | 44 | 44 | 44 | 44 |
| Tinsmiths | 47 | 45 ½ | 44 ¾ | 44 ¾ | 44 ¾ | 44 ¾ |
| Skin and leather workers | 48 | 48 ½ | 48 | 48 | 48 | 48 |
| Mineral and stone workers | 47 | 47 ¾ | 47 ¾ | 47 ¾ | 47 ¾ | 47 ¾ |
| Miners (coal)— | ||||||
| Surface | 43 ¼ | 43 | 43 | 45 | 44 | 44 |
| Underground | 43 ¼ | 43 | 43 | 43 ¾ | 43 ¾ | 43 ¾ |
| Miners (gold) | 47 ½ | 45 ¼ | 45 ¼ | 45 ¼ | 45 ¼ | 45 ¼ |
| Quarrymen | 47 ¾ | 46 ¾ | 46 ¾ | 46 ¾ | 46 ¾ | 46 ¾ |
| Railway employees— | ||||||
| Engine-drivers and firemen | 48 | 44 | 44 | 44 | 44 | 44 |
| Guards | 48 | 44 | 44 | 44 | 48 | 48 |
| Tramway employees — Conductors and | 48 | 48 | 48 | 48 | 48 | 48 |
| motormen | ||||||
| Shipping— | ||||||
| Stewards | .. | 60 | 60 | 60 | 60 | 60 |
| Cooks | .. | 60 | 60 | 60 | 60 | 60 |
| Seamen | 56 | 56 | 56 | 56 | 56 | 56 |
| Waterside workers | 44 | 44 | 44 | 44 | 44 | 44 |
| Hotel workers— | ||||||
| Male | 65 | 48 | 48 | 48 | 48 | 48 |
| Female | 65 | 48 | 48 | 48 | 48 | 48 |
| Soft-goods assistants | 48 | 48 | 48 | 48 | 48 | 48 |
| Warehouse storemen | 45 ¾ | 44 | 44 | 44 | 44 | 44 |
| Grocers' assistants | 52 | 49 ¾ | 48 ¾ | 47 | 47 | 47 |
| Restaurant workers— | ||||||
| Male | 61 ¼ | 51 | 51 | 51 | 51 | 51 |
| Female | 52 | 48 | 48 | 48 | 48 | 48 |
| AVERAGE HOURS WORKED PER WEEK IN EACH OF THE PRINCIPAL INDUSTRIAL DISTRICTS, 31ST MARCH, 1926. | ||||
|---|---|---|---|---|
| Occupation. | Northern. | Wellington. | Canterbury. | Otago and Southland |
| Bakers | 46 | 46 | 46 | 46 |
| Butchers—Shopmen | 48 | 48 | 48 | 48 |
| Butter-factory employees | 48 ½ | .. | .. | .. |
| Flour-mill employees | 48 | .. | 48 | 48 |
| Freezing-works employees | 44 | 44 | 44 | 44 |
| Aerated-water and cordial making employees | 46 ½ | 45 | 46 ½ | 46 ½ |
| Brewery workers | 45 | 44 | 44 | 44 |
| Tailors | 44 | 44 | 44 | 44 |
| Tailoresses | 44 | 44 | 44 | 44 |
| Boot operatives, male and female | 45 | 45 | 45 | 45 |
| Woollen-mills employees— | ||||
| Male | 45 | 45 | 45 | 45 |
| Female | 45 | 45 | 45 | 45 |
| Bricklayers | 44 | 44 | 44 | 44 |
| Carpenters | 44 | 44 | 44 | 44 |
| Joiners | 44 | 44 | 44 | 44 |
| Plasterers | 44 | 44 | 44 | 44 |
| Plumbers | 44 | 44 | 44 | 44 |
| Sawmill hands | 47 | 46 | 48 | 44 |
| Boatbuilders and shipwrights | 44 | 44 | 44 | 44 |
| Blacksmiths | 47 | 44 | .. | 44 |
| Boilermakers | 44 | 44 | .. | 44 |
| Tinsmiths | 44 | 47 | 44 | 44 |
| Skin and leather workers | 48 | .. | 48 | 48 |
| Mineral and stone workers | 48 | 46 ½ | 48 | 48 |
| Miners (coal)— | ||||
| Surface | 45 | .. | 44 | 44 |
| Underground | 44 | .. | 44 | 43 |
| Miners (gold) | 44 | .. | 44 | 48 |
| Quarrymen | 44 | 47 | 48 | 48 |
| Railway employees— | ||||
| Engine-drivers and firemen | 44 | 44 | 44 | 44 |
| Guards | 48 | 48 | 48 | 48 |
| Tramway employees—Conductors and motormen | 48 | 48 | 48 | 48 |
| Shipping— | ||||
| Stewards | 60 | 60 | 60 | 60 |
| Cooks | 60 | 60 | 60 | 60 |
| Seamen | 56 | 56 | 56 | 56 |
| Waterside workers | 44 | 44 | 44 | 44 |
| Hotel workers— | ||||
| Male | 48 | 48 | 48 | 48 |
| Female | 48 | 48 | 48 | 48 |
| Soft-goods assistants | 48 | 48 | 48 | 48 |
| Warehouse storemen | 44 | 44 | 44 | 44 |
| Grocers' assistants | 48 | 46 | 46 | 48 |
| Restaurant workers— | ||||
| Male | 48 | 48 | 48 | 48 |
| Female | 48 | 48 | 48 | 48 |
Table of Contents
AT a very early stage in the economic history of New Zealand legislative enactments, designed for the protection of the wage-earner and the amelioration of social conditions generally, were placed on the statute-book. It is not surprising that such Acts as the Trade-unions Act of 1878 and the Master and Apprentices Act of 1865 found places among the laws of this country so early in its history, since experience in the older countries in a more advanced state of economic development had proved the necessity for a certain amount of State regulation of the terms of the wage contract. But legislators of New Zealand were not content merely to follow in the wake of their more conservative brethren overseas; and we find the State, in its endeavour to improve social conditions generally, not only regulating industry by a rapidly growing code of labour laws but also venturing into the economic field itself when it considered such participation in the public interest. The establishment of a Government Life Insurance Department in 1869 and a Public Trust Office in 1873, and in later years the establishment of a State Fire Insurance Office, are examples of this.
In addition to the Master and Apprentices Act and the Trade-unions Act certain sections of other early Acts deal with labour conditions. Section 23 of the Offences against the Person Act of 1867 protected servants and apprentices from ill-treatment by their employers, while a considerable portion of the Shipping and Seamen's Act of 1877 regulated conditions of life aboard ship, payment of wages, &c. The Inspection of Machinery Act of 1882 provided for the inspection of machinery in factories, &c., and required that persons in charge of boilers should be properly qualified. An Employers' Liability Act was passed in 1882, this Act legislating in the matter of industrial accidents with the object of mitigating the consequences to the worker without recourse to expensive litigation at common law.
Although until recent times factory production was of very minor importance in New Zealand when compared with that of the agricultural and pastoral industries, nevertheless, even in the “eighties” and early “nineties” it was apparent that some of the evils experienced in the early stages of the development of factory production in the older countries already existed in New Zealand; and, during the lean years between 1885 and 1891 (during which period there was an excess of emigration over immigration of about 20,000), the grim spectre of unemployment hovered over the erstwhile prosperous colony. In 1889 it was alleged that “sweating” existed in New Zealand, especially in the clothing trades; and, although a Commission set up to inquire into the matter declared it could find no traces of this evil, a minority report did not fully agree with this view, and it was admitted that conditions were unsatisfactory in various respects.
An important measure affecting labour passed during this period of stress was the Electoral Act of 1889, which established the principle of “one man one vote.” This enactment prevented property owners with holdings in several electorates from voting in each electorate. The extension of the franchise to women in 1893 ensured that future Parliaments should be truly representative of the nation as a whole.
The maritime strike of 1890, which caused great distress throughout the country, proved to the trade-unions that they were not sufficiently strong to obtain their demands by direct action; and, at the same time, aroused public interest and caused the Legislature to consider measures designed to prevent the recurrence of such industrial strife in the future. It is not surprising, therefore, to find labour legislation occupying the attention of Parliament during the years immediately following. A brief résumé of the enactments affecting labour passed during the period 1890–98 is given below.
The Truck Act of 1891 ensured to the worker the payment of his wages in full in coin of the realm; the Wages Attachment Act of 1895 limited a creditor's right to obtain orders of Court attaching forthcoming earnings; the Factories Act of 1891 provided for the inspection of factories and the regulation of conditions of employment therein; and the Shop and Shop Assistants Act of 1892 provided similarly for the benefit of workers in shops. Trade-unionists, who were protected by an Act passed in 1878 from prosecution for conspiracy by reason merely that they were in restraint of trade, were still further protected by the Conspiracy Law Amendment Act of 1894, which deemed that any act by a union in furtherance of a trade dispute should not be deemed unlawful so as to render such persons liable to criminal prosecution for conspiracy, if such act committed by one person would not be deemed unlawful. This removed a very serious handicap under which unionists up to this time had suffered. The Servants Registry Act of 1895 provided for the inspection of servants registry-offices and regulated the fees charged therein. The Shipping and Seamen's Act Amendment Act, 1894, contained, inter alia, clauses improving conditions aboard ship. The Coal-mines Act of 1891 contained, in addition to clauses aiming at the improvement of working-conditions, provision for a fund—to be established by a levy on all coal sold—for the relief of the families of miners killed or injured during the course of their employment. The inspection of accommodation provided for shearers was dealt with in the Shearers' Accommodation Act of 1898, which also gave the Inspectors authority to demand that, where necessary, improvements should be made. The scope of this Act was extended to include agricultural labourers and flax and sawmill hands in 1907. Other important measures affecting workers passed during these years were the Old-age Pensions Act of 1898, which provided for the payment of a yearly pension to every person (with only a limited number of exceptions) over sixty-five years of age with twenty-five years residence in the country; and the State Advances to Settlers Act of 1894, which, by providing for the advancing of money to settlers on the land, gave the poorer classes an opportunity of acquiring rural holdings.
The most important of the labour laws passed during this period was the Industrial Conciliation and Arbitration Act of 1894, which was designed for the peaceful settlement of industrial disputes by conciliation and arbitration. This Act is dealt with in some detail farther on in this section.
Another interesting experiment brought into operation at this time was the construction of public works under the co-operative system, which was adopted by the Government in 1891. Works such as road and railway formation have been carried out by this system, the plant, explosives, &c., being supplied to the men by the State at cost price or at low hire. A modified form of the system then adopted is still followed in public works construction.
The enactments passed during the period 1890–98 form the nucleus of the labour code at present in force in this country, although in some cases administrative experience has found defects in the working of certain sections of these Acts and rendered subsequent amendments necessary; while the rapid economic development of the country and the growth of new ideas on the subject of labour legislation has led to many additions to the enactments passed during that period. In two important respects the legislation passed in the “nineties” has since been considerably altered. The Factory and Shop Assistants Acts of these years referred in the main to the protection of working women, girls, and boys, the Acts prior to 1901 taking no cognizance of the working-hours of men. Again, later Factory Acts prescribed minimum rates of wages for women and girls, a feature lacking in these earlier Acts. The development of the principal enactments affecting labour is shown in the latter portion of this section, where each is treated in some detail. The passing of the Labour Department Act in 1903, giving statutory recognition and powers to the Department of Labour, which had been formed in 1891, was an important milestone in the progress of labour legislation in New Zealand. The duties of the Department are to administer the labour laws and to furnish information in all industrial matters, while power is given to collect statistics with the authority wherewith a commission of inquiry is invested. The annual reports of the Department contain a wealth of information concerning industrial matters in the Dominion.
The question of housing for workers in the larger centres of population has for a long time past presented a difficult problem. In 1905 a Workers' Dwelling Act was passed authorizing the Minister of Labour to erect dwellings to be let to bona fideworkers at a rental of 5 per cent. per annum of the capital value of such dwellings. and in the following year a system of advances to workers for the purpose of acquiring homes was instituted. Later statutes dealing with the same subject were the Housing Acts of 1910 and 1919 and the State Advances Act of 1913, which, as amended in 1923, is the now existing law on the subject. Under the latter Act advances to workers receiving a salary of £300 per annum or under, with an allowance of £25 per annum for each child, are made for the purpose of erecting dwellings, while provision is made for repayment in instalments over a maximum period of thirty-six and a half years. Certain sections of the War Legislation Amendment Act of 1916 dealt with house rents; the maximum rent being fixed by statute at 8 per cent. per annum of the capital value of the dwelling, except in eases where the dwelling had been erected. improved, or structurally altered since the commencement of the Great War, This restriction is still in force, but material alterations in the law will take effect from 1st August, 1927.
In order to encourage the principle of profit-sharing among workers the Companies-Empowering Act was passed in 1924, which empowered any company registered under the Companies Act, 1908, to issue labour shares to its employees. Such shares, which are not transferable, have no nominal value, and do not form part of the ordinary capital of the company. Except as otherwise provided, these shares entitle the holders to the same privileges as the ordinary shareholders. The Arbitration Court is empowered to adjudicate as to whether in any particular case the scheme is of benefit to the workers, and if in its recommendation the issue of labour shares is revoked, the shares already issued shall he paid for in cash or capital shares. In the event of an employee leaving his employment or dying, the shares shall be surrendered in cash or capital shares to him or to his heirs.
In 1910 an Act was passed establishing a National Provident Fund subsidized by the State: and in the following year the Widows' Pensions Act was placed on the statute-book. In 1926 a scheme of allowances to parents of three or more children was provided for by the Family Allowances Act. Details respecting these enactments-will be found in Section XXIV of this book.
With but few exceptions, the labour legislation on the New Zealand statute-book is designed for the protection of individual sections of workers; for example, the Factories Act applies to factory workers, the Shops and Offices Act to employees in shops and offices, the labour clauses of the Shipping and Seamen's Act to seamen, and the Coal-mines Act to miners, &c. The Arbitration Act has a wider scope in that awards are made under it covering almost every type of industry carried on in the country. From another point of view, however, it is specific in application, in that only unions registered under the Act come under its provisions, and that each award applies to a particular body of workers in a particular trade and usually in a definite district or locality. Acts like the Workers' Compensation Act are more general in their application, but it is only such enactments as the Wages Protection and Liens Act (which has replaced the old Wages Protection Acts), as well as other statutes on cognate subjects, which are quite general in application. Certain sections of the Companies and the Bankruptcy Acts, which give priority of payment for wages or salaries of workers in preference to certain other debts in the case of the winding-up of a company and of the bankruptcy of an employer, fall in. the same category.
In no case do the provisions laid down by any particular labour law cancel the worker's rights at common law; but since, naturally enough, better conditions are laid down by statute than the worker is entitled to at common law, it is unusual to find in these days litigation under the common law affecting master and servant. It sometimes happens, however, notably in workers' compensation cases, that appeal is made at common law instead of under the Act, since there are no limits to the damages which may be obtained at common law.
Since, with the exception of such of the labour statutes as are of general application, no labour legislation exists affecting certain classes of workers—e.g., domestic servants. —their relations with their employers are still governed mainly by the common law affecting master and servant.
In the following pages the principal Acts in New Zealand affecting labour are-dealt with in some detail.
The present law on the subject of workers' compensation is embodied in the Workers' Compensation Act. 1922, and its amendment of 1926. The principal provisions of this Act are as follow:—
“Worker,” for purposes of the Act, means any person who has entered into, or works under, a contract of service or apprenticeship with an employer, whether by way of manual labour, clerical work, or otherwise, and whether remunerated by wages, salary, or otherwise; but does not include any person employed otherwise than by way of manual labour whose remuneration exceeds £400 per annum. The Act applies only to the employment of a worker under a contract of service or apprenticeship either in and for the purposes of any trade or business carried on by the employer, or in any of the following occupations, most of them hazardous, irrespective of whether or not carried on for purposes of the employer's trade: mining; quarrying; excavation; cutting of standing timber and scrub; clearing land; erection or demolition of buildings and other structures; manufacture and use of explosives; handling power machinery in motion; driving vehicles; domestic service (engagement for not less than three days); and any occupation in which a worker incurs a risk of falling any distances exceeding 12 ft., if the injury to or death of the worker results from such a fall. For purposes of this provision, an employer may have more than one trade or business. In general, persons working as independent contractors are not under contracts of service or apprenticeship, and are consequently not workers. But by way of exception persons who have contracted to perform any work in a gold- or a coal-mine, or to cut standing timber or scrub, or to clear land of stumps or logs, and who do not sublet the contract or employ labour (or who, if they do employ labour, actually perform part of the work themselves), though not “workers,” are yet covered by the Act.
The worker is not entitled to compensation unless he sustains by accident arising out of and in the course of his employment, and happening within New Zealand or on a New Zealand ship, personal injury incapacitating him from carrying on his occupation. No compensation is payable in respect of any accident as above defined which is attributable to the serious and wilful misconduct of the worker injured, unless the injury results in death or serious and permanent disablement. No compensation is payable in respect of the death of a worker following on, or incapacity resulting from or aggravated by, unreasonable refusal to submit to medical or surgical treatment. Except under certain safeguarding restrictions, “contracting out” is forbidden.
Certain defined diseases are deemed to he personal injuries by accident if they arose within twelve months previous to the date of disablement and are due to the nature of the employment. There is power under the Act for the list of such diseases to be added to from time to time by regulation, as circumstances warrant the adoption of such a course.
Generally speaking, the employer is the person liable to pay compensation; and for this purpose “employer” includes any body of persons, corporate or unincorporate, (with certain minor exceptions) the Crown, and the representatives of a deceased employer. Where a person (the principal), in the course of and for the purposes of his trade or business, contracts with another (the contractor) for the execution by the latter of work undertaken by the former, a workman employed by the contractor on meeting with an accident may claim compensation from either the principal or the contractor, except in certain cases. If the principal pays, he may, however (with certain minor exceptions), recover the sum paid from the contractor. The principal is not liable, however, unless the accident occurs in, on, or about his land, premises, or ship; or in or about land, premises, or ship, on or in which the principal has contacted to do the work in connection with which the accident happens. Where the injury for which compensation is payable has resulted under circumstances creating a legal liability in some person other than the employer to pay damages in respect thereof, the person by whom the compensation is paid or payable is entitled to indemnification by the person so liable.
The Workers' Compensation Amendment Act. 1926, amended the Act of 1922 in the direction of raising the limits of compensation. The compensation payable from 1st January, 1927, on which date the amendment comes into force, is as follows:—
In case of death: Reasonable expenses of medical or surgical attendance, including first aid, and of his funeral (maximum £50), less any sums paid by way of compensation for the accident prior to the death of the person injured; but plus—
Where he leaves total dependants, a sum equal to 208 times his average weekly earnings, or the sum of £300, whichever is the larger, but not exceeding £1,000; or
Where he leaves partial dependants only, a sum reasonable and proportionate to the injury to those dependants, but not exceeding the sums specified in (a.)
In case of injury: At the discretion of the Court, either—
During total incapacity, weekly payments amounting to 66 2/3 per cent. of the worker's average weekly earnings at the time of the accident (maximum £4 per week; minimum in cases where ordinary rate of pay was not less than £1 10s. per week, £1); during partial incapacity, weekly payments amounting to 66 2/3 per cent. of the difference between the amount of the average weekly earnings before the accident and the average weekly amount which the worker is earning or able to earn in suitable employment or business after the accident, but not exceeding £4 per week; or
A lump sum equal to the present value at 5 per cent. per annum compound interest of the aggregate weekly payments which, in the opinion of the Court, would probably become payable to the worker under (a.)
Weekly payments are not to extend over a longer aggregate period than six years, and the aggregate amount is not to exceed £1,000.
In addition to 2 (a) and 2 (b) above, a sum not exceeding £1 is payable in respect of medical and surgical attendance and first aid to the worker in respect of his injury. No compensation is payable if incapacity lasts less than three days. In the case of certain injuries involving permanent disability (e.g., dismemberment or loss of use). compensation is to be assessed according to a special scheme representing an aliquot part (varying according to the nature of the dismemberment) of the compensation payable in the case of total incapacity. In the case of injury to workers whose earnings at the date of the accident are low by reason of their being at the time under twenty-one, or of their being apprenticed to a trade, &c., and in certain other specified cases, special provisions exist in order to prevent hardships.
Proceedings under the Act in respect of compensation for injuries are not maintainable by a worker unless written notice of the accident has been given to the employer as soon as possible after its occurrence: though the Court has power to excuse failure, due to reasonable causes, to give that notice, on the part of the person injured, or if it is clear that the absence of such notice has not prejudiced the employer's position. Except where the Court excuses delay resulting from mistake or other reasonable cause, proceedings must be taken within six months of the date of the accident or the date of the last payment of compensation in respect of injury, or the date of the death of the person injured, whichever is the later. Such proceedings are taken in the Arbitration Court; though in certain cases they will be heard in the Magistrate's Court. The Court may accept, admit, and call for such evidence as in equity and in good conscience it thinks fit, irrespective of whether strictly legal evidence or not. Costs lie in the discretion of the Court. There is no right of appeal; but for good cause orders or agreements in respect of compensation may be reviewed and even set aside by the Court at any time.
The right of a dependant who survives a worker to receive compensation for the death of that worker survives the dependant: and compensation can be recovered by the representative of that dependant.
This Act is a consolidation of statutes previously known as the Truck Act, 1891; the Contractors and Workmen's Lien Act, 1892; the Workmen's Wages Act, 1893; the Threshing-machine Owners' Lien Act, 1895; the Wages Attachment Act, 1895; and the Wages Protection Act, 1899. The consolidated Act of 1908 guards the interests of workers in several directions, principally in that it secures the regular payment of wages.
In cases of contracts between employers and contractors who employ wages-men, or between contractors and subcontractors who likewise employ wages-men, the Act permits the attachment of moneys in the hands of the employers for the payment of wages in arrear. The person for whom the contract is being performed is deemed to be the employer.
The attachment of a worker's wages for debt is prohibited, except in the case of any surplus exceeding £2 per week. (This, however, has been affected by section 20 of the Industrial Conciliation and Arbitration Amendment Act, 1908, under which, in the case of a penalty for a breach of that Act, the surplus above £1 per week earned by unmarried men may be attached by judgment in the Magistrate's Court.)
The Act prohibits payment for wages being made in goods (truck), or in any other way than in money or by approved cheque; and also prohibits any stipulation as to how the wages-money is to be expended. The truck provisions do not. however, apply where the employer supplies house accommodation, board and lodging, fuel, medical assistance, materials, tools, and the like required for the work, nor to seamen or farm-workers.
A contractor, subcontractor, and any worker is entitled to obtain liens on the lands or chattels of the employer upon giving due notice, and the employer must then retain in his hands sufficient of the contract-moneys to satisfy and guarantee payment of the claimant's dues. This is subject to the limitations stated. For example, the worker's earnings are limited to thirty days' pay, and so long as the employer retains 25 per cent. of the contract-money for the purpose till the expiration of thirty-one days after the completion of the contract the employer is not liable for any further payment; but if any additional amount has not been paid by him to the contractor when a lien is lodged the employer shall retain enough of such amount to meet the lien. When any part of the contract-money has been duly withheld by the employer pursuant to the Act the contractor has no claim on the employer for that money, except so far as that amount is not required for the purposes of the Act. Liens are given priority in the order of workers, subcontractors, and contractors. There are exemptions made in favour of mortgages on the employer's land if registered prior to the lodging of the lien, unless the mortgagee is a party to the contract. In the case of the death of a lien-holder the right passes to his personal representative.
If the cost of threshing a crop is not paid to the workers employed in threshing it the cost of threshing can be made a charge on the proceeds of the realization of such crop.
No deduction from workers' wages may be made for purposes of insurance against compensation for accident.
Liens to be imposed as security for miners' wages or earnings are dealt with under the Mining Act, 1908, and the Coal-mines Act, 1908.
As mentioned earlier in this Section, the original Industrial Conciliation and Arbitration Act was placed on the New Zealand statute-book in 1894. Its object was to encourage the formation of industrial unions and associations, and to facilitate the settlement of industrial disputes by conciliation and arbitration. It provided for the registration as “industrial unions” of societies of workers or employers in the various industrial districts, and, as “industrial associations,” of any council or other body representing any number of such unions; for the making of industrial agreements pursuant to the Act, and the filing of such in the Supreme Court; for the formation of industrial districts, the election of Boards of Conciliation, and the setting-up of a Court of Arbitration.
The original Act and its amendments were consolidated in 1900; a compiling Act was passed in 1905; and a further consolidation was effected in 1908. Following is a brief summary of the more important amendments: In 1898 an amendment was passed empowering the Court in its award to prescribe minimum rates of wages, with special provision for a lower rate being paid in the case of workers unable to earn the prescribed minimum. An important amendment was passed in 1903 prohibiting any employer, worker, union of workers, or union of employers from taking proceedings to defeat any of the provisions of an award during its currency. It forbade an employer to dismiss any employee merely because he happened to be entitled to the benefit of an award or merely because he was a member of a union.
In 1905 an amendment was passed providing for the punishment by fine of any employer or worker bound by an award or industrial agreement affecting an industry who takes part in a strike or lockout in that industry. In 1908 an additional penalty was added in the case of certain “public utility” industries, such as gas-manufacture, the supply of milk or meat, tramway services, &c. By this amendment the constitution of Conciliation Boards was altered to provide for the appointment of four Conciliation Commissioners, whose duty it is to call together representatives of employers and employees in the event of a dispute arising, and to sit with these representatives as a Conciliation Council to endeavour to effect a settlement. The decision of the Council is not binding, but disputes must be referred to a Council before they may be referred to the Arbitration Court.
A further amendment in 1911 empowered the Court to make an industrial agreement into an award, provided such agreement does not conflict with an existing award or is not contrary to the public interest. It also provided that recommendations of Conciliation Councils shall become in effect industrial agreements if none of the parties to a dispute disagrees with such recommendations.
There have been no major amendments to the Act since 1911, and the law as it existed in 1925 was consolidated in that year. Its administration is in the hands of the Labour Department, and Inspectors of Factories are charged with the duty of seeing that the provisions of awards and agreements are carried out.
The following paragraphs indicate the procedure followed in regard to industrial disputes under the Industrial Conciliation and Arbitration Act:—
An industrial union (or association of unions) of workers registered under the Act may cite a union or association of unions of employers, or an employer, or a number of employers, before a Council of Conciliation for the hearing of an industrial dispute before a Commissioner and assessors appointed from either side.
An industrial union (or association of unions) of employers registered under the Act, or an individual employer, or employers, may cite a union of workers in a similar manner. The workers may compel any of their employers to come under the Act; but the employers cannot compel their workers to come under it, unless the latter have registered as an industrial union or association thereunder; registration is voluntary.
If an agreement is arrived at and is signed by the parties, it may be filed by any party as an “industrial agreement” and be enforced accordingly; or if the assessors only have signed an agreement—termed a “recommendation” in the Act (which is usually more convenient where the parties are scattered)—that recommendation may be forwarded to the Clerk of Awards, who gives notice of it to the parties. If within the following month no objection is received, the recommendation becomes binding in the same manner as an industrial agreement.
In the event of no agreement or of a partial agreement only being arrived at, the whole matter is referred to the Arbitration Court. After hearing argument upon the matters not agreed upon, the Court makes its award, which becomes binding upon the employers specified in the award, upon any employers commencing business in the district subsequently to the date of the award, and upon all persons working for such employers. In many cases even where a “recommendation” has been arrived at in the Conciliation Council, instead of following the procedure mentioned in the preceding paragraph the parties find it more convenient to have the recommendation made into an award, and, as the Court has no jurisdiction in the case of complete agreement, it has become the practice to disagree fro forma on one or more clauses. This enables the Court to make an award in accordance with the recommendation.
Until a few years ago it was the practice for unions of workers to cite the employers as parties to a dispute, and it was only in very rare cases that the employers took the initiative, but of late several cases have occurred where the employers have cited the workers' unions before Conciliation Councils—for example, freezing-workers, cooks and stewards, seamen, watersiders, coal-miners, dairy employees, and shearers.
In all cases where an industrial agreement or accepted recommendation or award is filed it becomes binding on all the parties, and a strike or lockout becomes unlawful. In a few cases the workers concerned have objected to the award, and have struck work rather than accept the conditions fixed.
It is interesting to trace the development of the powers conferred on the Court formed under this Act. The original purpose of the Act—the settlement of industrial disputes by the peaceful methods of conciliation and arbitration—has at no time been lost sight of; but, naturally enough, it has been found necessary from time to time to expand the scope of the awards in order to achieve this object. The 1898 amendment empowering the Court to prescribe minimum rates of wages added very considerably to the powers wielded by the Court; and, indeed, the scope of the awards has widened to include provisions regulating conditions of employment in minute detail. Since the working conditions laid down by the awards are better than those prescribed by the Factory Acts, &c., these Acts have in practice become a dead-letter as affecting workers under the jurisdiction of the Court. In most awards a preference clause is inserted, which gives unionists registered under the Act preference over non-unionists for employment with such employers as are registered as parties to any particular award.
Section 18 of the War Legislation and Statute Law Amendment Act, 1918, empowered the Court to amend during the term of an award or industrial agreement the provisions of the award or agreement, in so far as they related to rates of remuneration or hours of employment. In varying the conditions, the Court was to take into account the movement in the cost of living, and any changes in the special conditions affecting the industry concerned. This measure, which was designed to meet the abnormal conditions caused by the Great War, remained in force till 1923.
In addition to the powers mentioned above, the administration of the Apprentices Act of 1923 is placed in the hands of the Court.
The Labour Disputes Investigation Act, which was passed in 1913, applies to all disputes to which the Industrial Conciliation and Arbitration Act does not relate—viz., where there is no award or industrial agreement or accepted recommendation thereunder in force.
Under this Act if a dispute concerning wages and other conditions of employment arises between a society or societies of workers, whether registered or not, that are not bound by any award or industrial agreement, and their employers, the society must, before it may strike, give to the Minister of Labour formal notice of the dispute, setting forth the names of the parties to the dispute and the claims made by the society. The Minister then refers the dispute to a Conciliation Commissioner to call a conference, or to a “Labour Disputes Committee” for investigation and recommendation. Such a committee consists of not less than one nor more than three members chosen from each side, with an independent chairman. In the event of no settlement being arrived at a secret ballot is taken by the Registrar of Industrial Unions among the members of the society as to whether, in the case of no recommendation having been made, a strike should eventuate; or, in the case of a recommendation having been made, as to whether the recommendation should be adopted. Seven days' notice must be given to the employers should a strike be decided upon.
Similar provisions apply with reference to the filing of a dispute and to a lockout by the employers.
In the event of an agreement being arrived at it may be filed with the Clerk of Awards. It is then enforceable in the same manner as an industrial agreement under the Industrial Conciliation and Arbitration Act.
By this Act the principle of settlement of industrial disputes by conciliation and arbitration is extended to workers outside the scope of the Arbitration Court, so that definite restrictions on the right to strike or to lockout exist over the whole field of industry in New Zealand. The powers under this Act are not, of course, as far-reaching as those under the Arbitration Act, its main object being that workers or employers should take time for consideration of the points at issue and not precipitate themselves into industrial strife.
The original Factories Act, which was passed in 1891, provided for the registration as a factory of any office, building, or place in which three or more persons were engaged in working for hire or reward, in any handicraft, or in preparing or manufacturing articles for trade or sale, and for the inspection of such factories. Other provisions dealt with sanitation in factories, the protection of women and children as regards hours of employment, and the notification of accidents in factories to the Inspectors appointed under the Act. No boy under thirteen years of age, or girl under fourteen, was permitted to be employed in any factory. This Act was repealed in 1894, the Act of that year containing several new features, notably provision for the labelling of work sent out from the factory and manufactured in private houses; a forty-eight-hour week was prescribed for women and boys, who were further protected by a clause prohibiting their employment between the hours of 6 p.m. and 7.45 a.m. without the written consent of the Inspector, who was empowered to permit a limited amount of overtime. The definition of a factory was widened to include establishments where two people were employed. In one respect the Act of 1894 compared unfavourably with the previous enactment. Under the 1891 Act women and youths had worked an eight-hour day with a weekly half-holiday; but the 1894 Act, by merely prescribing a forty-eight hour week, meant that they had, by law, to take a half-holiday at their own expense. Under the 1901 Act this fault was rectified; and, in addition, cognizance was made of the working-hours of men—the hours being fixed at forty-eight hours per week for men, with a maximum of eight and three-quarter hours per day, and forty-five per week for women and youths, with a maximum of eight and a quarter hours per day. Overtime was permitted with extra payment; but, in the case of women and girls, the number of hours per day and the number of days per year were limited. Boys and girls could not be employed without payment or at a lower wage than 5s. per week. There have been no major amendments since 1901, although the law has been consolidated in 1908 and 1921–22. The statutory half-holiday for women and girls, which was fixed for Saturday, may be altered to the day fixed for the closing of shops and offices in the district, consequent on a poll of the electors thereof. Before a girl or a boy under sixteen may be employed in a factory a certificate of fitness must be obtained, which may be granted by the Inspector, having regard to age, standard of education, and general fitness for employment.
The Shops and Offices Act, 1921–22, is a consolidation of former legislation which originated in 1892. The Act regulates the hours of assistants in shops, and provides for the fixing of the hours of closing of shops. The former are in most cases as follows: Except in certain exempted trades, and in small towns for which later hours are prescribed, work must cease at 6 p.m. on four nights of the week, at 9 p.m. on one night, and at 1 p.m, on the day of the weekly half-holiday. The hours must not in any case exceed forty-eight per week, or nine per day, with the exception of eleven on one day in the week. Limited overtime, to be paid for, may, however, be worked for stocktaking and other special occasions.
In regard to the closing of shops, a weekly half-holiday from 1 p.m. is compulsory, with a few exceptions—e.g., fishmongers and fruiterers. The closing-day is chosen in each district by the local authority, except where it is fixed by a poll of the electors taken on petition of a certain number. Even in the exempted trades a half-holiday must be given to each assistant on a day to be fixed by the occupier.
The closing-hours of shops in any district the other days of the week have for many years been fixed pursuant to the Act by “requisition” of a majority of the shopkeepers if desired either in the whole of the local district or in any trade in the local district. The hours of closing have been thus determined in very many trades and districts.
In 1920 an amendment of the Act prescribed compulsory closing-hours at 6 p.m. on four days of the week and 9 p.m. on one day in the well-populated areas, except in certain exempted trades, thus incorporating by statute the closing-hours as already determined by “requisition” in many cases. The Court of Arbitration under the Industrial Conciliation and Arbitration Act is also now empowered, when making an award in any trade, to fix not only reduced hours of employment of assistants (which has been done in many trades), but also earlier closing-hours of all shops in that trade in the locality, whether or not assistants are employed therein, with authority to make exemptions in cases of hardship, and this provision has also been acted on.
Each trade in any district may also, by a majority vote, obtain an order of the Minister of Labour prohibiting the sale in such district, during the time the shops in such trade are required to be closed, of the goods the sale of which is comprised in such trade. This is inserted to meet those cases where the trades of various shopkeepers overlap one another, some of whom only are required to close at a certain hour. The provision enabling a majority of the shopkeepers in any trade to fix the closing-hours for that trade applies only to those who are principally engaged therein: if the latter are desirous that other shopkeepers carrying on the trade as a minor portion of their business should cease selling the same goods at the closing-hours fixed they may apply to the Minister in the manner above indicated for an order prohibiting such sales.
The Act fixes a minimum wage of 10s. per week, with an annual increase of not less than 5s. per week until £1 10s. per week is reached. As in the case of factories, higher rates of wages are, in the case of many shop-assistants, fixed by awards or industrial agreements under the Industrial Conciliation and Arbitration Act.
All assistants employed in hotels and restaurants are brought under special provisions as to holidays, hours (which must not exceed forty-eight per week nor ten per day), overtime, &c.
The Act also makes provision for the comfort, health, and safety of assistants—viz., in regard to ventilation, heating, sanitation, hygiene, and sitting-accommodation.
The law relating to shipping and seamen is contained in the Shipping and Seamen Act, 1908, as amended in 1909, 1911, 1912, 1913, 1922, and 1924. Owing to certain provisions of the Acts having an international interest, it is usual to reserve such Acts for the Royal assent. The principal provisions of the law in so far as they affect the working-conditions of the crews and the safety of crews and passengers are referred to below.
Home-trade steamships of 60 tons register and upwards, and home-trade sailing-ships of 100 tons register, must carry certificated mates, and such ships of 100 tons register and upwards trading more than 300 miles between terminal ports must have second mates. A foreign-going ship is required to carry two certificated mates.
It is an offence for the master or owner of a ship to engage a certificated officer for the purpose only of enabling a ship to clear, and not for the purpose of making the voyage.
Foreign-going certificated second mates are entitled to ship as mates in the home trade, and all candidates for certificates are to be British subjects.
Provision is made for issuing certificates of competency to second mates of home-trade ships, and for recognizing as valid in the Dominion certificates of masters, mates, and engineers granted in any part of the British Dominions.
Any master or mate may, at any time, be required by the shipowner or by the Minister of Marine to be examined in the sight tests by Government Examiners.
It is unlawful for any person other than the owner, master, mate, or engineer of a ship, or a Superintendent of Mercantile Marine, to engage or supply seamen for ships, and only such seamen as have a knowledge of the English language are to he allowed to ship.
British foreign-going ships of not less than 1,000 tons gross register must carry certificated cooks. Sanitary, hospital, and lavatory accommodation, including bath rooms, with an adequate supply of hot water for the crew employed in connection with the engines, is to be provided, and a minimum of space to be provided in the seamen's quarters is laid down.
Desertion is defined, and deserters who cannot be dealt with before their ship sails can afterwards be prosecuted by the owner or agent, and copies of the agreement and the entries in the log-book are to be accepted by Courts as evidence. Forfeited wages are to be paid into the Public Account instead of to the shipowner.
Masters and officers who assault seamen on the high seas are made liable to imprisonment or fine.
The clearances of foreign-going ships which are required to pay the coastal rate of wages are to be withheld until such wages are paid.
Intercolonial in addition to home-trade ships are made liable to pay the wages, maintenance, and medical expenses of seamen taken ill in the service of the ship for the remainder of the agreement, not exceeding three months, and, in the case of intercolonial ships, if the agreement expires within one month from the commencement of the illness, payment is to be made for one month after the expiry. The illness which is to entitle a man to the benefits provided for is one which requires medical treatment for fourteen days. Power is given to the Minister to define restricted limits for steamers and vessels propelled by oil, gas, &c. The adjustment of compasses is to be carried out under regulations made by the Marine Department. Power is given to the Governor in Council to make regulations as to the loading and stowage of ballast, and the loading of grain cargo in bulk. It is made an offence to ship wool, flax, tow, or skins in such a condition as to be liable to spontaneous combustion.
The law as to inquiries into shipping casualties is on the lines of the Imperial Merchant Shipping Act, and provision is made for rehearings, for Superintendents of Mercantile Marine taking part in such inquiries, and for Magistrates ordering a change of venue. Inquiries are not to be held in Police Courts unless other suitable buildings are not available; and in cases where there has been loss of life but no injury to the ship the inquiries may be held by Coroners.
Intercolonial and home-trade agreements are to be transmitted to a Superintendent of Mercantile Marine within twenty-one days of their expiration.
As early as 1909 power was given for the framing of regulations requiring ships registered in New Zealand and carrying passengers to be provided with wireless telegraphy apparatus, and such regulations were duly made. In 1922 the scope of this provision was substantially widened by the omission of the words “and carrying passengers” and in 1924 authority was given to make regulations in this respect covering any class or classes of ships registered in New Zealand, or any class or classes of home-trade ships, whether registered in New Zealand or not. The Royal assent to the amending Act of 1924 was notified on 22nd May, 1925, the amendment coming into force from 1st June, 1925, and new regulations were gazetted on 24th June, to come into force from 1st January, 1926. The regulations apply to all vessels registered in New Zealand and to all home-trade vessels not so registered which are of 1,600 tons gross registered tonnage or over, or which carry more than twelve passengers or more than twenty-five persons. Vessels being towed or plying solely on lakes, rivers, or harbours, or within river or extended-river limits are exempted, and power is given the Minister of Marine to exempt a vessel in cases where compliance is impracticable or the provision of an installation is unnecessary or unreasonable. The regulations define the nature of the installations and service and the number and grade of operators in different classes of vessels, and provide for inspection.
Owing to the special hazards to which workers in mines are subject, and the technical nature of the work of inspection, conditions of employment in mines are governed by certain sections of the Mining Acts. The Mining Act, 1926, which consolidates no less than fifteen previous enactments on the subject, lays down, inter alia, in considerable detail, regulations governing working-conditions in all mines except coal-mines. Inspectors of Mines are appointed under the Act. It requires that a person acting in the capacity of mine-manager of any mine where there are twelve men or more employed at any one time above ground, or six or more underground, should hold a certificate granted after examination by a Board of Examiners empowered under the Act to grant such certificates. Provision is made for proper ventilation in mines; special care is required to be taken in handling explosives; dangerous places must be property timbered; special regulations are made as to hauling machinery, &c. No female and no male person under the age of fourteen years may be employed in or about a mine, except in a clerical capacity. The employment of manual labour on Sundays without the previous written consent of an Inspector of Mines is prohibited. Overtime must be paid for any time worked in excess of eight hours a day, counting from the time the miner enters the underground workings until he leaves them. Time worked on Sundays and holidays must be paid for at time-and-a-half rates. All machinery used to supply motive power is subject to the provisions of the Inspection of Machinery Act, 1908, as far as these provisions apply. A sufficient supply of water must be supplied where it is necessary for the laying of dust in a mine. No youth may be employed in a mine for more than eight hours per day or forty-eight hours per week, except in cases of emergency.
Conditions of employment in coal-mines are dealt with in the Coal-mines Act. In general the provisions of this Act resemble those of the Mining Act, though, of course, to combat the special risks of coal-mining additional regulation is necessary. For every coal-mine there must be a duly qualified manager, who shall be either the owner of the mine or some person appointed by the owner, and who shall be responsible for the control, management, and direction of the mine. Inspectors of Coal-mines are appointed who must hold certificates as first-class mine-managers under the Act. Certain sections of the Act deal with the prevention of coal-dust, the use of safety-lamps, the prohibition of work in places where the presence of gas is suspected, and the inspection of the mine before the commencement of work, &c. Suitable housing accommodation must be supplied for workers if required by notice of the Minister of Mines.
A levy of a halfpenny per ton on every ton of marketable coal raised from the mine is made under the terms of the Act; such moneys to form a relief fund for the relief of miners injured in the course of employment and of their dependants in the ease of death.
Information as to miners' pensions, provided for originally by the Miners' Phthisis Act of 1915, is contained in Section XXIV of this book.
The Scaffolding and Excavation Act, 1922, which superseded the original Act of 1906, makes provision for the protection of workers employed on any building-work, including the erection, alteration, or demolition of a building, and including scaffolding, cranes, gear, &c. The Act also applies to certain excavations made in connection with building-work. For the purpose of enforcement Inspectors of Scaffolding are appointed. Notice of the intention to commence building-work that will involve the risk of a fall of 12 ft. or more, or to make an excavation or set up a crane, must be given to the Inspector. The Inspector is empowered to order work to cease, to brand or destroy unsafe gear, and generally to see that the life and health of workers are safeguarded.
The Apprentices Act, 1923, largely supersedes the Master and Apprentice Act of 1865. The latter Act had become somewhat out of date, and most of the conditions of employment of apprentices had for many years been fixed in awards and industrial agreements under the Industrial Conciliation and Arbitration Act. In view of the feeling that the fixing of the conditions of employment of apprentices should not be the subject of an industrial dispute between employers and unions of workers, and that the shortage of apprentices and skilled workers necessitated special attention, the Apprentices Act was passed in 1923. The employment of apprentices is accordingly now controlled by special orders of the Court of Arbitration, acting independently of its powers under the Industrial Conciliation and Arbitration Act, and by Apprenticeship Committees to be set up in the various industries and localities. The Court may delegate many of its powers to these committees, but aggrieved persons have the right of appeal to the Court, whose decision is final.
In addition to the usual authority to restrict employers to a maximum number or proportion of apprentices to the number of journeymen, power is now given to compel employers to take and teach a minimum number, in order to ensure as far as possible that the future requirements of the industries may be met. Full power is also given to ensure that both the employers and the apprentices carry out their obligations. These powers include cancellation of apprenticeships, transfer, examination, and technical-school attendance of apprentices, also power to prohibit certain employers from taking apprentices. All contracts of apprenticeship and all voluntary transfers and cancellations of apprenticeships must now be registered, and it is the duty of the District Registrars to see before registering apprenticeships that the conditions are in accordance with the Act and orders thereunder, and are otherwise just to both parties. There is, however, a right of appeal from their decisions to the Court. The Registrar and District Registrars are also charged with the duty of seeing that the Act and decisions thereunder are generally complied with.
Provision is made to enable employers in intermittent trades, such as building, who perhaps cannot continuously employ apprentices, to take them jointly, in which case they are jointly liable; also to enable adults and others already possessing a knowledge of an industry to enter into apprenticeships under such conditions, other than those generally provided for apprentices, as the committee or Court may approve.
In order to encourage young persons to enter the skilled trades and avoid “blind-alley” occupations, the Act provides for collaboration with the head teachers in the various schools, who are required to watch the progress of the children under their care, and to report to the District Registrars of Apprentices as to the character. aptitude, and attainments of the various children leaving the schools. On receipt of such reports it is the duty of the District Registrars to give such advice as may be in their power to assist the children or their parents or guardians to decide on the most suitable employments. Juvenile employment bureaux have also been opened free of charge to all parties concerned.
With a view to assisting the Director of Education in shaping the courses of education so that the labour requirements of the various industries of the Dominion may, so far as possible, be met, the Act also provides that the Director shall be apprised from time to time of the number of persons employed in skilled industries, with information as to the prospects of future employment therein.
Table of Contents
IN New Zealand dual provision for the registration and protection of unions of employers and workers exists in the Trade-unions Act and the Industrial Conciliation and Arbitration Act. A brief résumé of these enactments is given in the section of this Year-book dealing with labour laws.
It will be observed from a study of the laws to which reference has been made that while special provision is made for the publication of an annual statement showing the numerical strength of the various unions registered under the Industrial Conciliation and Arbitration Act, no such provision exists in regard to unions registered under the Trade-unions Act. Although returns regarding membership were required under the latter Act, such particulars, in deference to the desire of the unions not to have their affairs made public, were not published. Consequently it is impossible to obtain any data as to the numerical strength of the unions, only the numbers of unions registered being available. Although in 1900 37 unions registered under the Trade-unions Act were on the books, this number dropped to as low as 15 in 1908, and was at the 31st December, 1925, only 27. As no machinery exists for the regular purging of the rolls, a union remains on the books, in spite of its failure to furnish returns, until the Registrar has definite information that such union is defunct. Accordingly, oven the data regarding numbers of unions under the Trade-unions Act are not altogether reliable.
It seems fairly evident that the Trade-unions Act has, by reason of the operation of the Industrial Conciliation and Arbitration Act, fallen largely into desuetude, especially inasmuch as many unions on the rolls under the earlier Act are also registered under the later Act.
Provision was made under section 7, subsection (17), of the Industrial Conciliation and Arbitration, Act of 1900 (re-enacted in 1908), which amended and consolidated the original Act of 1894, for the furnishing of an annual return showing the number and membership of unions registered under the Act. It is from this return, published in the Annual Report of the Department of Labour (parliamentary paper H.-11) that the tables in this section have been compiled. As the powers of the administrator of this Act are considerably wider than was the case in regard to the Trade-unions Act, while the penalties for infringement are at the same time more severe, the roll published in the report is complete.
The numbers and memberships of industrial unions of employers registered under the Industrial Conciliation and Arbitration Act as at the end of each year from 1900 onwards are shown in the tables on the following page.
| NUMBERS OF INDUSTRIAL UNIONS OF EMPLOYERS. 1900–25. | |||||||||
|---|---|---|---|---|---|---|---|---|---|
| As at 31st December. | Industrial District. | Totals. | |||||||
| Northern. | Wellington. | Canterbury. | Otago and Southland. | Taranaki. | Marlborough | Nelson. | Westland. | ||
| 1900 | 10 | 15 | 7 | 7 | 1 | .. | 3 | 43 | |
| 1901 | 16 | 17 | 13 | 18 | 1 | .. | 3 | 68 | |
| 1902 | 17 | 20 | 18 | 21 | 2 | 2 | 4 | 84 | |
| 1903 | 20 | 24 | 26 | 23 | 3 | 3 | 1 | 3 | 103 |
| 1904 | 22 | 28 | 25 | 24 | 3 | 3 | 1 | 3 | 109 |
| 1905 | 25 | 30 | 23 | 24 | 4 | 3 | 1 | 3 | 113 |
| 1906 | 27 | 25 | 24 | 24 | 3 | 2 | 1 | 3 | 109 |
| 1907 | 31 | 26 | 26 | 26 | 4 | 2 | 2 | 3 | 120 |
| 1908 | 32 | 30 | 27 | 23 | 4 | 2 | 1 | 3 | 122 |
| 1909 | 32 | 27 | 26 | 24 | 4 | 2 | 1 | 4 | 120 |
| 1910 | 34 | 24 | 26 | 23 | 4 | 2 | 1 | 4 | 118 |
| 1911 | 36 | 24 | 24 | 23 | 4 | 2 | 2 | 3 | 118 |
| 1912 | 34 | 24 | 25 | 26 | 5 | 2 | 2 | 5 | 123 |
| 1913 | 36 | 28 | 26 | 31 | 5 | 2 | 2 | 4 | 134 |
| 1914 | 41 | 33 | 28 | 33 | 6 | 2 | 2 | 4 | 149 |
| 1915 | 38 | 33 | 25 | 32 | 6 | 2 | 1 | 4 | 141 |
| 1916 | 39 | 32 | 27 | 31 | 6 | 1 | 1 | 4 | 141 |
| 1917 | 40 | 33 | 26 | 33 | 6 | 1 | 2 | 4 | 145 |
| 1918 | 42 | 35 | 23 | 34 | 6 | 1 | 2 | 2 | 145 |
| 1919 | 39 | 30 | 25 | 34 | 6 | 1 | 2 | 2 | 139 |
| 1920 | 39 | 35 | 25 | 33 | 6 | 1 | 3 | 2 | 144 |
| 1921 | 40 | 35 | 25 | 30 | 5 | 1 | 3 | 2 | 141 |
| 1922 | 37 | 33 | 24 | 30 | 6 | 1 | 3 | 2 | 136 |
| 1923 | 35 | 33 | 27 | 28 | 6 | 1 | 3 | 3 | 136 |
| 1924 | 36 | 31 | 29 | 30 | 5 | 1 | 3 | 3 | 138 |
| 1925 | 37 | 31 | 28 | 31 | 8 | 2 | 4 | 4 | 145 |
| MEMBERSHIP OF INDUSTRIAL UNIONS OF EMPLOYERS, 1900–25. | |||||||||
|---|---|---|---|---|---|---|---|---|---|
| As at 31st December. | Industrial District. | Totals. | |||||||
| Northern. | Wellington. | Canterbury. | Otago and Southland. | Taranaki. | Marlborough | Nelson. | Westland. | ||
| 1900 | 256 | 379 | 252 | 97 | 29 | .. | 3 | 1,016 | |
| 1901 | 346 | 452 | 437 | 549 | 37 | .. | 3 | 1,824 | |
| 1902 | 387 | 519 | 833 | 622 | 86 | 23 | 27 | 2,497 | |
| 1903 | 471 | 507 | 1,164 | 776 | 72 | 55 | 9 | 26 | 3,080 |
| 1904 | 554 | 566 | 1,160 | 837 | 84 | 52 | 9 | 30 | 3,292 |
| 1905 | 599 | 562 | 1,050 | 822 | 99 | 48 | 9 | 27 | 3,216 |
| 1906 | 613 | 526 | 1,218 | 846 | 48 | 40 | 19 | 27 | 3,337 |
| 1907 | 689 | 660 | 1,266 | 815 | 77 | 63 | 48 | 22 | 3,640 |
| 1908 | 802 | 745 | 1,394 | 793 | 78 | 66 | 11 | 29 | 3,918 |
| 1909 | 764 | 611 | 1,313 | 789 | 66 | 55 | 13 | 88 | 3,699 |
| 1910 | 969 | 760 | 1,434 | 919 | 68 | 53 | 13 | 46 | 4,262 |
| 1911 | 1,035 | 746 | 1,310 | 933 | 104 | 52 | 23 | 48 | 4,251 |
| 1912 | 1,043 | 737 | 1,397 | 981 | 116 | 51 | 16 | 69 | 4,410 |
| 1913 | 1,135 | 800 | 1,446 | 1,093 | 110 | 53 | 16 | 47 | 4,700 |
| 1914 | 1,229 | 921 | 2,012 | 1,401 | 121 | 68 | 15 | 52 | 5,819 |
| 1915 | 1,247 | 826 | 2,389 | 1,013 | 133 | 59 | 8 | 43 | 5,718 |
| 1916 | 1,244 | 745 | 2,458 | 884 | 125 | 44 | 10 | 44 | 5,554 |
| 1917 | 1,208 | 812 | 2,140 | 994 | 127 | 45 | 14 | 50 | 5,390 |
| 1918 | 1,230 | 866 | 2,157 | 883 | 123 | 49 | 15 | 23 | 5,346 |
| 1919 | 1,204 | 762 | 2,028 | 939 | 111 | 57 | 21 | 24 | 5,146 |
| 1920 | 1,439 | 1,082 | 1,638 | 999 | 114 | 55 | 33 | 23 | 5,383 |
| 1921 | 1,488 | 1,032 | 1,669 | 923 | 106 | 56 | 34 | 28 | 5,336 |
| 1922 | 1,301 | 966 | 1,651 | 940 | 131 | 57 | 32 | 56 | 5,134 |
| 1923 | 1,490 | 1,098 | 1,708 | 859 | 129 | 73 | 37 | 89 | 5,483 |
| 1924 | 1,346 | 1,032 | 1,641 | 900 | 106 | 75 | 36 | 69 | 5,205 |
| 1925 | 1,356 | 1,071 | 1,596 | 899 | 175 | 73 | 40 | 68 | 5,278 |
It will be noticed from a study of the foregoing tables that the number of unions of employers and their membership rose gradually to a maximum of 149 unions, with 5,819 members, in 1914, the year following that of the prolonged waterside workers' strike. Since that year many slight ups and downs have been recorded, the net result being a decrease to 145 unions, with 5,278 members, at the 31st December, 1925.
The figures for the individual districts contain some points of interest. Of the four chief districts, the Northern has the greatest number of unions of employers, followed by Wellington and Otago and Southland, in each of which districts 31 unions of employers are registered, while the Canterbury District follows next in order. Canterbury, however, in spite of being the lowest of the four principal districts in respect of numbers of unions, has the highest membership, followed by Auckland, Wellington, and Otago and Southland. Prior to 1920 Wellington had consistently the lowest membership among the four principal districts.
Industrial unions of workers and their membership are shown in the two following tables as at the end of each of the last twenty-six years. It should be explained that the “Total” column includes the Amalgamated Society of Railway Servants, and from 1922 onwards the Engine-drivers, Firemen's, and Cleaners' Association, the figures for both of which organizations are not included in the district totals.
It should also be emphasized that the statistics cover only unions registered under the Industrial Conciliation and Arbitration Act, and that all unions are not so registered.
| NUMBERS OF INDUSTRIAL UNIONS OF WORKERS, 1900–25. | |||||||||
|---|---|---|---|---|---|---|---|---|---|
| As at 31st December. | Industrial District. | Totals. | |||||||
| Northern. | Wellington. | Canterbury. | Otago and Southland. | Taranaki. | Marlborough. | Nelson. | Westland. | ||
* Including unions of railway employees—one from 1900 to 1921, and two from 1922 onwards—not. included in figures for any district. | |||||||||
| 1900 | 29 | 45 | 41 | 46 | 4 | 2 | 7 | 175 | |
| 1901 | 37 | 46 | 50 | 52 | 5 | 2 | 9 | 202 | |
| 1902 | 40 | 47 | 52 | 56 | 6 | 3 | 10 | 215 | |
| 1903 | 50 | 57 | 56 | 54 | 6 | 2 | 5 | 11 | 242 |
| 1904 | 55 | 59 | 61 | 54 | 6 | 2 | 6 | 12 | 256 |
| 1905 | 55 | 55 | 56 | 55 | 4 | 2 | 6 | 11 | 245 |
| 1906 | 53 | 59 | 63 | 56 | 4 | 2 | 9 | 11 | 258 |
| 1907 | 62 | 70 | 67 | 59 | 7 | 3 | 9 | 12 | 290 |
| 1908 | 69 | 76 | 69 | 60 | 4 | 3 | 7 | 13 | 302 |
| 1909 | 74 | 73 | 69 | 61 | 4 | 4 | 6 | 16 | 308 |
| 1910 | 72 | 80 | 66 | 62 | 3 | 4 | 8 | 12 | 308 |
| 1911 | 75 | 80 | 60 | 62 | 7 | 4 | 7 | 10 | 306 |
| 1912 | 86 | 82 | 63 | 61 | 9 | 4 | 6 | 10 | 322 |
| 1913 | 96 | 96 | 69 | 76 | 12 | 4 | 7 | 11 | 372 |
| 1914 | 100 | 104 | 66 | 83 | 13 | 8 | 8 | 20 | 403 |
| 1915 | 96 | 96 | 65 | 84 | 12 | 6 | 8 | 21 | 389 |
| 1916 | 98 | 92 | 60 | 84 | 13 | 5 | 7 | 8 | 368 |
| 1917 | 98 | 85 | 65 | 89 | 12 | 7 | 7 | 18 | 382 |
| 1918 | 96 | 84 | 59 | 85 | 13 | 5 | 8 | 19 | 370 |
| 1919 | 98 | 83 | 64 | 88 | 16 | 5 | 10 | 17 | 382 |
| 1920 | 101 | 87 | 66 | 96 | 17 | 6 | 13 | 19 | 406 |
| 1921 | 103 | 87 | 67 | 98 | 20 | 6 | 15 | 21 | 418 |
| 1922 | 103 | 85 | 67 | 99 | 19 | 7 | 13 | 20 | 415 |
| 1923 | 105 | 83 | 66 | 101 | 18 | 7 | 13 | 20 | 415 |
| 1924 | 103 | 81 | 64 | 100 | 16 | 8 | 14 | 14 | 402 |
| 1925 | 104 | 80 | 64 | 98 | 16 | 8 | 13 | 12 | 397 |
| MEMBERSHIP OF INDUSTRIAL UNIONS OF WORKERS, 1900–25. | |||||||||
|---|---|---|---|---|---|---|---|---|---|
| As at 31st December. | Industrial District. | Totals. | |||||||
| Northern. | Wellington. | Canterbury. | Otago and Southland. | Taranaki. | Marlborough. | Nelson. | Westland. | ||
* Including members of unions of railway employees—not included in figures for any district. | |||||||||
| 1900 | 3,521 | 3,196 | 2,851 | 4,236 | 76 | 1,366 | 17,989 | ||
| 1901 | 5,133 | 4,439 | 4,329 | 5,186 | 98 | 84 | 1,633 | 23,768 | |
| 1902 | 4,308 | 4,820 | 4,758 | 4,803 | 111 | 96 | 1,813 | 23,816 | |
| 1903 | 5,816 | 5,893 | 5,313 | 5,181 | 157 | 92 | 222 | 1,971 | 27,640 |
| 1904 | 7,099 | 6,371 | 5,759 | 5,271 | 141 | 88 | 250 | 2,072 | 30,271 |
| 1905 | 6,914 | 6,770 | 5,307 | 5,056 | 47 | 67 | 359 | 1,833 | 29,869 |
| 1906 | 7,437 | 8,841 | 6,305 | 5,287 | 94 | 121 | 400 | 2,189 | 34,978 |
| 1907 | 10,027 | 13,182 | 8,178 | 5,639 | 209 | 146 | 425 | 2,614 | 45,614 |
| 1908 | 10,785 | 15,129 | 8,370 | 6,310 | 136 | 132 | 286 | 2,611 | 49,347 |
| 1909 | 13,075 | 14,163 | 9,549 | 8,209 | 76 | 264 | 183 | 2,581 | 54,519 |
| 1910 | 14,311 | 14,520 | 10,422 | 9,167 | 81 | 212 | 213 | 2,084 | 57,091 |
| 1911 | 12,301 | 13,547 | 10,701 | 10,282 | 307 | 328 | 150 | 1,929 | 55,629 |
| 1912 | 14,686 | 15,337 | 11,371 | 9,829 | 382 | 346 | 145 | 1,412 | 60,622 |
| 1913 | 18,472 | 19,452 | 11,858 | 10,810 | 515 | 250 | 432 | 1,646 | 71,544 |
| 1914 | 18,005 | 20,004 | 11,416 | 11,025 | 655 | 489 | 378 | 3,772 | 73,991 |
| 1915 | 15,897 | 18,677 | 9,854 | 10,317 | 533 | 268 | 334 | 3,364 | 67,661 |
| 1916 | 19,301 | 19,544 | 9,827 | 11,018 | 469 | 279 | 297 | 2,848 | 71,587 |
| 1917 | 21,057 | 18,446 | 10,052 | 11,191 | 455 | 312 | 275 | 2,966 | 72,873 |
| 1918 | 20,239 | 19,102 | 9,449 | 10,635 | 605 | 214 | 288 | 3,086 | 71,447 |
| 1919 | 22,932 | 21,437 | 12,425 | 13,363 | 809 | 214 | 428 | 3,011 | 82,553 |
| 1920 | 25,728 | 25,435 | 15,010 | 15,950 | 1,087 | 316 | 611 | 3,587 | 96,350 |
| 1921 | 26,914 | 24,747 | 15,368 | 14,815 | 1,315 | 348 | 663 | 4,054 | 97,719 |
| 1922 | 26,545 | 22,320 | 15,761 | 14,631 | 1,350 | 378 | 602 | 3,803 | 96,838 |
| 1923 | 25,816 | 21,854 | 15,249 | 13,937 | 1,089 | 344 | 560 | 3,996 | 94,438 |
| 1924 | 27,656 | 22,540 | 15,402 | 14,430 | 1,035 | 363 | 611 | 2,821 | 96,822 |
| 1925 | 28,004 | 24,495 | 16,182 | 15,319 | 1,463 | 454 | 581 | 2,840 | 100,540 |
In drawing inferences from the preceding tables allowance must be made for the fact that, as these figures represent the numbers on the rolls of the various unions, a certain amount of duplication takes place, it being quite possible for a worker to be a member of two or more unions at the one time, especially in the case of a casual occupation such as waterside working. It is quite impossible to form any idea as to what extent such duplication takes place; but it is very unlikely that it occurs to such an extent as to affect materially the total figures.
As is quite evident from even a cursory glance at the foregoing tables, there has been a gradual increase in both numbers of workers' unions and membership thereof during the period under review. With one or two minor interruptions a steady increase both in numbers and in membership was recorded up to the year 1914, when there were 403 registered unions with 73,991 members. The effect of the war is very marked, a sudden drop of 6,330 members being recorded in 1915, followed by a slight increase in 1916 and 1917 and a drop in 1918, the membership at 31st December, 1918, being 71,447. Very considerable increases were recorded during the next three years, the membership rising to 82,553 in 1919, to 96,350 in 1920, and to 97,719 in 1921. Decreases were recorded during the two succeeding years, followed by a slight increase in membership from 1923 to 1924, and a material increase from 1924 to 1925, the total membership as at 31st December, 1925 (100,540), being the highest on record. In spite of the relatively high membership in 1925 the number of unions has dropped to 397, the lowest on record since 1919.
Until the year 1916 the Wellington District held pride of place both in regard to the number of workers' unions registered and on the basis of membership; but since that year the number of unions has gradually diminished, while the number of members has not risen to the same extent as has been the case, in the Northern District; with the result that since 1916 the latter district has displaced Wellington from its position. This is doubtless partly a reflection of the phenomenally rapid population-increase in the Auckland Provincial District during recent years. In recent years the number of unions in the Otago and Southland District has been consistently higher than in Canterbury, though in each of the last five years the membership has-been lower. Westland shows a much higher membership than the other three minor districts, but is still a long away behind any of the four major districts.
In the following table industrial unions of workers are classified according to membership:—
| INDUSTRIAL UNIONS OF WORKERS.—CLASSIFICATION ACCORDING TO NUMBER OF MEMBERS, 1901 AND 1921–25. | ||||||||||
|---|---|---|---|---|---|---|---|---|---|---|
| Year. | Under 50. | 50 and under 100. | 100 and under 200. | 200 and under 300. | 300 and under 500. | 500 and under 1000. | 1,000 and under 2,000. | 2,000 and under 3,000. | 3,000 and over. | Totals. |
| Number of Unions. | ||||||||||
| 1901 | 99 | 43 | 30 | 19 | 5 | 4 | 1 | 1 | 202 | |
| 1921 | 139 | 100 | 70 | 36 | 28 | 28 | 11 | 3 | 3 | 418 |
| 1922 | 139 | 90 | 66 | 40 | 37 | 25 | 13 | 4 | 1 | 415 |
| 1923 | 144 | 81 | 75 | 34 | 41 | 25 | 11 | 3 | 1 | 415 |
| 1924 | 135 | 83 | 69 | 35 | 35 | 27 | 14 | 3 | 1 | 402 |
| 1925 | 125 | 86 | 66 | 34 | 37 | 29 | 16 | 3 | 1 | 397 |
| Membership. | ||||||||||
| 1901 | 2,759 | 3,018 | 4,032 | 4,815 | 2,073 | 2,520 | 1,651 | 2,900 | .. | 23,768 |
| 1921 | 4,147 | 7,075 | 9,708 | 9,182 | 11,066 | 18,527 | 14,580 | 7,433 | 16,001 | 97,719 |
| 1922 | 3,899 | 6,434 | 9,070 | 9,617 | 14,385 | 16,802 | 16,842 | 10,216 | 9,573 | 96,838 |
| 1923 | 3,738 | 5,582 | 10,467 | 8,162 | 16,365 | 17,990 | 15,440 | 6,916 | 9,778 | 94,438 |
| 1924 | 3,744 | 5,649 | 9,951 | 8,240 | 13,428 | 17,489 | 20,832 | 7,482 | 10,007 | 96,822 |
| 1925 | 3,478 | 6,048 | 9,352 | 8,195 | 14,522 | 19,569 | 22,462 | 7,697 | 9,217 | 100,540 |
| Percentage of Total Membership. | ||||||||||
| 1901 | 11.61 | 12.70 | 16.96 | 20.26 | 8.72 | 10.60 | 6.95 | 12.20 | .. | 100.00 |
| 1921 | 4.24 | 7.24 | 9.94 | 9.40 | 11.32 | 18.96 | 14.92 | 7.61 | 16.37 | 100.00 |
| 1922 | 4.03 | 6.64 | 9.37 | 9.93 | 14.85 | 17.35 | 17.39 | 10.55 | 9.89 | 100.00 |
| 1923 | 3.96 | 5.92 | 11.08 | 8.64 | 17.33 | 19.05 | 16.35 | 7.32 | 10.35 | 100.00 |
| 1924 | 3.87 | 5.83 | 10.28 | 8.50 | 13.87 | 18.06 | 21.52 | 7.73 | 10.34 | 100.00 |
| 1925 | 3.46 | 6.02 | 9.30 | 8.15 | 14.44 | 19.46 | 22.34 | 7.66 | 9.17 | 100.00 |
The steady growth in the average size of industrial unions of workers is brought out in the above table. It is noteworthy that while the actual number of unions has increased from 202 unions in 1901 to 397 in 1925, an increase of 96 per cent., the membership has increased from 23,768 to 100,540, an increase of 323 per cent. The increase in membership in unions containing 500 members and over is particularly marked, while the numbers in the lowest class have actually decreased during the last four years.
From successive numbers of the Annual Report of the Labour Department it is possible to compile statistics of the distribution of unions of employers and workers, and of their membership, according to the industries with which they are connected. This has been done for the years 1924 and 1925, and a summary is first given showing the number of industrial associations of employers and workers in each industrial group, with the number of affiliated unions in each case.
| INDUSTRIAL DISTRIBUTION OF ASSOCIATIONS AND UNIONS, 31ST DECEMBER, 1924 AND 1925. | ||||||||
|---|---|---|---|---|---|---|---|---|
| Industrial Group. | Employers. | Workers. | ||||||
| Associations. | Affiliated Unions. | Associations. | Affiliated Unions. | |||||
| 1924. | 1925. | 1924. | 1925. | 1024. | 1925. | 1924. | 1925. | |
| Food, drink, &c. | .. | 1 | .. | 2 | 3 | 3 | 16 | 17 |
| Clothing, boots, &c. | .. | .. | .. | .. | 2 | 2 | 14 | 12 |
| Textiles and weaving | 1 | 1 | 4 | 4 | 1 | 1 | 5 | 5 |
| Building and construction | 2 | 2 | 16 | 15 | 4 | 4 | 48 | 50 |
| Wood-manufacture | 2 | 2 | 12 | 12 | 3 | 3 | 12 | 13 |
| Paper-manufacture and printing | 2 | 2 | 18 | 18 | 2 | 3 | 10 | 13 |
| Metal-works and engineering | 1 | 1 | 4 | 4 | 3 | 3 | 13 | 15 |
| Other manufactures | .. | .. | .. | .. | 1 | 1 | 4 | 4 |
| Agricultural and pastoral | 1 | 1 | 2 | 4 | 1 | 1 | 2 | 2 |
| Land transport | .. | .. | .. | .. | 3 | 2 | 24 | 17 |
| Shipping and cargo-working | 1 | 1 | 6 | 7 | 4 | 4 | 29 | 30 |
| Hotels, restaurants, &c. | .. | .. | .. | .. | 1 | 1 | 8 | 8 |
| Miscellaneous | 1 | .. | 4 | .. | 5 | 5 | 31 | 35 |
| Totals | 11 | 11 | 66 | 66 | 33 | 33 | 216 | 221 |
The building and construction group is seen to have the largest number of affiliated unions of workers, and the second largest in the case of employers. In the group covering paper-manufacturing and printing a peculiar position is disclosed, in that the number of affiliated unions of employers is not only greater than the corresponding number of workers' unions, but also exceeds the total number of registered unions of employers. Presumably some unions are affiliated with both of the associations of employers in this industry.
In the next table industrial unions of employers are classified as to both numbers and membership according to their distribution in industries and in districts.
| INDUSTRIAL UNIONS OF EMPLOYERS AS AT 31ST DECEMBER, 1925. | |||||||||
|---|---|---|---|---|---|---|---|---|---|
| Industrial Group. | Industrial District. | ||||||||
| Northern. | Wellington. | Canterbury. | Otago and Southland. | Taranaki. | Marlborough. | Nelson. | Westland. | Totals. | |
| Number of Unions. | |||||||||
| Food, drink, &c. | 5 | 4 | 4 | 5 | 1 | .. | 1 | .. | 20 |
| Clothing, boots, &c. | 4 | 2 | 3 | 4 | 1 | .. | 1 | .. | 15 |
| Textiles and weaving | .. | .. | .. | .. | .. | .. | .. | .. | .. |
| Building and construction | 7 | 7 | 3 | 5 | 2 | .. | .. | .. | 24 |
| Wood-manufacture | 3 | 3 | 3 | 1 | .. | .. | .. | .. | 10 |
| Paper - manufacture and printing | 4 | 3 | 4 | 2 | 1 | .. | 1 | .. | 15 |
| Metal-works and engineering | 3 | 3 | 2 | 3 | .. | .. | .. | .. | 11 |
| Other manufactures | .. | .. | 1 | 1 | .. | .. | .. | .. | 2 |
| Mining, &c. | 1 | .. | .. | 1 | .. | .. | .. | 1 | 3 |
| Agricultural and pastoral | 2 | 2 | 3 | 2 | 1 | 1 | .. | .. | 11 |
| Land transport | 1 | 1 | 1 | 1 | .. | .. | .. | 1 | 5 |
| Shipping and cargo-working | 3 | 2 | 2 | 2 | 1 | 1 | 1 | 1 | 13 |
| Hotels, restaurants, &c. | 2 | 1 | 2 | .. | 1 | .. | .. | 1 | 7 |
| Miscellaneous | 2 | 3 | .. | 4 | .. | .. | .. | .. | 9 |
| Totals | 37 | 31 | 28 | 31 | 8 | 2 | 4 | 4 | 145 |
| Number of Members. | |||||||||
| Food, drink, &c. | 219 | 102 | 126 | 110 | 40 | .. | 11 | .. | 608 |
| Clothing, boots, &c. | 123 | 46 | 43 | 74 | 18 | .. | 10 | .. | 314 |
| Textiles and weaving | |||||||||
| Building and construction | 329 | 369 | 189 | 227 | 28 | .. | .. | .. | 1,142 |
| Wood-manufacture | 64 | 53 | 42 | 6 | .. | .. | .. | 165 | |
| Paper - manufacture and printing | 76 | 41 | 30 | 41 | 12 | .. | 12 | .. | 212 |
| Metal-works and engineering | 62 | 26 | 58 | 49 | .. | .. | .. | .. | 195 |
| Other manufactures | .. | .. | 11 | 5 | .. | .. | .. | .. | 16 |
| Mining, &c. | 1 | .. | .. | 11 | .. | .. | .. | 2 | 14 |
| Agricultural and pastoral | 126 | 324 | 875 | 202 | 59 | 65 | .. | .. | 1,651 |
| Land transport | 29 | 70 | 19 | 37 | .. | .. | .. | 8 | 163 |
| Shipping and cargo-working | 13 | 22 | 29 | 14 | 7 | 8 | 7 | 7 | 107 |
| Hotels, restaurants, &c. | 184 | 12 | 174 | .. | 11 | .. | .. | 51 | ..432 |
| Miscellaneous | 130 | 6 | .. | 123 | .. | .. | .. | .. | 259 |
| Totals | 1,356 | 1,071 | 1,596 | 899 | 175 | 73 | 40 | 68 | 5,278 |
The most noteworthy feature of this table is the extremely high membership of unions of agricultural and pastoral employers. As will be seen from the tables immediately following, this is in marked contrast to the position respecting unions of workers. This is no doubt due to the fact that a large number of small farmers belong to the employers' unions. The workers, on the other band, are almost entirely seasonal workers, especially in the case of the majority of those unionized—viz., the shearers and the threshing-mill employees. In these cases the workers travel round and work for several employers in the one season.
It is worthy of note that the Canterbury District, while the lowest of the four principal districts in respect to number of unions of employers, has actually the highest number of members. This is due to the facts mentioned in the preceding paragraph, 875 out of a total of 1,596 members belonging to the “Agricultural and pastoral” group. The number of members of unions of employers in the building trade is particularly high in all the major districts, the highest membership (369) being recorded in the Wellington District.
Similar information to that given above for industrial unions of employers is now given for workers' unions.
| INDUSTRIAL UNIONS OF WORKERS AS AT 31ST DECEMBER, 1925. | |||||||||
|---|---|---|---|---|---|---|---|---|---|
| Industrial District. | Industrial Group. | ||||||||
| Northern. | Wellington. | Canterbury. | Otago and Southland. | Taranaki. | Marlborough. | Nelson. | Westland. | Totals. | |
* Including 2 unions of railway employees, with a total membership of 11,202. | |||||||||
| Numbers of Unions. | |||||||||
| Food, drink, &c. | 12 | 7 | 7 | 12 | 4 | 1 | 1 | .. | 44 |
| Clothing, boots, &c. | 4 | 4 | 4 | 7 | 1 | .. | 1 | 1 | 22 |
| Textiles and weaving | 2 | 2 | 2 | 3 | .. | .. | .. | .. | 9 |
| Building and construction | 13 | 20 | 13 | 10 | 4 | 1 | 4 | 1 | 66 |
| Wood-manufacture | 5 | 4 | 4 | 6 | 1 | .. | .. | 1 | 21 |
| Paper - manufacture and printing | 6 | 4 | 1 | 4 | .. | .. | 1 | 1 | 17 |
| Metal - works and engineering | 10 | 6 | 5 | 9 | .. | .. | .. | 2 | 33 |
| Other manufactures | 10 | 7 | 6 | 10 | .. | .. | .. | .. | 34 |
| Mining, &c. | 7 | .. | .. | 6 | .. | .. | .. | 2 | 15 |
| Agricultural and pastoral | 1 | 1 | 3 | 5 | .. | 2 | .. | .. | 12 |
| Land transport | 4 | 6 | 3 | 4 | 2 | 1 | 1 | .. | 23* |
| Shipping and cargo-working | 13 | 7 | 3 | 5 | 1 | 1 | 2 | 33 | |
| Hotels, restaurants, &c. | 1 | 2 | 2 | 2 | 1 | 1 | 1 | 1 | 11 |
| Miscellaneous | 16 | 10 | 11 | 15 | 2 | 1 | 1 | 1 | 57 |
| Totals | 104 | 80 | 64 | 98 | 16 | 8 | 13 | 12 | 397* |
| Number of Workers. | |||||||||
| Food, drink, &c. | 3,030 | 3,592 | 2,510 | 1,807 | 664 | 74 | 19 | .. | 11,696 |
| Clothing, boots, &c. | 2,036 | 891 | 1,656 | 1,424 | 8 | .. | 21 | 25 | 6,061 |
| Textiles and weaving | 138 | 862 | 279 | 617 | .. | .. | .. | .. | 1,896 |
| Building and construction | 4,691 | 4,119 | 2,950 | 2,451 | 243 | 70 | 152 | 63 | 14,739 |
| Wood-manufacture | 1,403 | 1,071 | 685 | 1,378 | 41 | .. | .. | 1,489 | 6,067 |
| Paper - manufacture and printing | 769 | 971 | 460 | 498 | .. | .. | 7 | 21 | 2,726 |
| Metal-works and engineering | 2,053 | 1,211 | 1,219 | 1,223 | .. | .. | 55 | 102 | 5,863 |
| Other manufactures | 809 | 306 | 363 | 401 | .. | .. | 69 | .. | 1,948 |
| Mining, &c. | 2,074 | .. | .. | 684 | .. | .. | .. | 457 | 3,215 |
| Agricultural and pastoral | 267 | 461 | 1,334 | 698 | .. | 143 | .. | .. | 2,903 |
| Land transport | 1,435 | 1,428 | 1,191 | 724 | 75 | 12 | 36 | .. | 16,103* |
| Shipping and cargo-working | 3,241 | 4,685 | 875 | 1,361 | 224 | 60 | 97 | 278 | 10,821 |
| Hotels, restaurants, &c. | 2,705 | 2,508 | 1,496 | 654 | 125 | 66 | 79 | 226 | 7,859 |
| Miscellaneous | 3,353 | 2,390 | 1,164 | 1,399 | 83 | 29 | 46 | 179 | 8,643 |
| Totals | 28,004 | 24,495 | 16,182 | 15,319 | 1,463 | 454 | 581 | 2,840 | 100540* |
The highest numbers of unions registered in single groups are found in the groups “Building and construction” (66 unions) and “Miscellaneous” (57 unions). The greatest number of workers on the rolls, however, is found in the group “Land transport” (16,103 members), followed by the group “Building and construction” (14,739 members). Unionism has not advanced to any great extent among workers in agricultural and pastoral pursuits, the fact that the workers are widely scattered no doubt being largely responsible. In fact, the shearers' unions are the only important unions in this class of employment. The group “Textiles and weaving” has the lowest actual number of unionists (1,896), but this is no doubt due to the fact that this class of industry accounts for only a small proportion of wage-earners in New Zealand.
The group “Land transport” includes members of the Amalgamated Society of Railway Servants and of the Engine-drivers', Firemen's, and Cleaners' Association, totalling 11,202 workers, all of whom are registered under the Act. The total of 14,739 for the building trade must be regarded as very high for an industry with such widely scattered branches and activities. The unions under the head of “Shipping and cargo-working” have also a high aggregate membership (10,821). As will be seen in a later table, this group has the highest percentage of registered unionists to total wage-earners.
The Northern Industrial District contains the greatest number of registered unionists (28,004), followed by Wellington District (24,495). This is no doubt due largely to the fact that Auckland City and its environs comprise by far the largest centre of population in the Dominion, and it is a well-known economic fact that, unless there are some special counteracting influences, unionism tends to flourish better the more concentrated the population. The Westland Industrial District has considerably more registered unionists than other minor districts; a remarkable fact in this instance being that, of a total of 2,840 members of unions registered under the Arbitration Act, no fewer than 1,489 belong to the group “Wood-manufacture.” This total is 86 in advance of that for the corresponding group in the Northern District, and considerably greater than the total for any other district. The majority of the coal-miners in the Westland district do not belong to unions registered under the Industrial Conciliation and Arbitration Act.
The following table, showing the proportion of workers belonging to unions registered under the Industrial Conciliation and Arbitration Act to the total number of wage-earners in the country, is of interest as manifesting the movement in unionism during the period under review, with a rough idea of its extent. It must be remembered that the figures given for total wage-earners at the census include professional and business classes in which unionism does not exist, and agricultural and pastoral employees where it is practically non-existent. Moreover, females are included in both sets of figures, and the proportion of women unionized is always small.
| Year. | Total Wage-earners. | Year. | Number of Workers on Rolls of Registered Unions. | Percentage of Wage-earners on Rolls of Registered Unions. |
|---|---|---|---|---|
| 1901 (March) | 224,346 | 1900 (December) | 17,989 | 8 |
| 1906 (April) | 269,039 | 1905 | 29,869 | 11 |
| 1911 (April) | 304,272 | 1910 | 57,091 | 19 |
| 1916 (October) | 302,161 | 1916 | 71,587 | 24 |
| 1921 (April) | 370,692 | 1920 | 96,350 | 26 |
This table gives some idea of the increase in the proportion of wage-earners belonging to registered unions during the period under review; but perhaps a better idea can be gained from the following table, where index numbers are employed to show the movement since 1901, the totals on the rolls being adjusted to make allowance for the increases in the number of wage-earners. To put it more clearly. the table shows the movement assuming a constant total number of wage-earners during the period.
| Census Year. | Index. |
|---|---|
| 1901 | 100 |
| 1906 | 137 |
| 1911 | 234 |
| 1916 | 295 |
| 1921 | 324 |
The following table shows the percentage of registered unionists to total wage-earners in several industrial groups. The idea given is only approximate, in that the groups do not exactly coincide in some cases; in fact, the group “Miscellaneous” was omitted altogether, in view of the heterogeneous nature of the constituent industries in the group.
| Industrial Group. | Wage-earners (Census, April, 1921). | Number on Rolls of Registered Unions, 31st December, 1920. | Percentage of Wage-earners on Rolls of Registered Unions. |
|---|---|---|---|
| Food, drink, &c. | 19,127 | 12,467 | 65 |
| Clothing and drapery manufacture | 15,848 | 6,846 | 43 |
| Textiles and weaving | 3,427 | 1,618 | 47 |
| Building and construction | 18,480 | 9,914 | 54 |
| Sawmilling, forestry, &c. | 12,904 | 4,656 | 36 |
| Paper-manufacture and printing | 6,366 | 2,279 | 36 |
| Metal-working and engineering | 10,838 | 5,111 | 47 |
| Other manufactures | 10,757 | 2,026 | 19 |
| Mining and quarrying | 7,485 | 4,049 | 54 |
| Agricultural and pastoral | 55,549 | 1,798 | 3 |
| Hotels, restaurants, &c. | 36,058 | 8,757 | 24 |
| Land transport | 24,161 | 13,150 | 54 |
| Shipping and cargo-working | 16,474 | 14,079 | 85 |
The group “Shipping and cargo-working” shows a remarkably large percentage of unionists, the figure being as high as 85 per cent. The figure for the group of industries coming under the heading of “Food, drink, &c.” (64 per cent.) is high when the importance of that group is considered, it ranging third in order of importance as regards number of wage-earners. Agricultural and pastoral workers, who covered the huge total, comparatively speaking, of 55,549 workers, had only 1,798, or 3 per cent., of their number on the union rolls.
Table of Contents
PROBABLY never in the history of the world has unemployment been so acute and so widespread as in the years that have followed the boom that culminated shortly after the conclusion of the Great War. The result has been a great stimulus to the collection and compilation of adequate statistics dealing with the phenomenon; while an International Conference of Labour Statisticians, held at Geneva in April, 1925, under the auspices of the League of Nations, passed a number of important resolutions designed to secure some measure of international uniformity in respect of such statistics.
The report of the Conference sets forth certain principal desiderata for statistics of unemployment. In the first place, such statistics should provide evidence as to the extent of unemployment. Now, as the volume of unemployment varies considerably, not only from year to year but also with the seasons, it is important that the phenomenon should be studied more or less continuously. Furthermore, as the volume of unemployment varies also as between different industries and occupations, it is desirable that the data should be classified as far as possible along these lines. Finally, as in so many branches of statistics, mere absolute numbers are of relatively small value; what is required, if possible, being the relative amount, or “rate,” of unemployment—the number of persons unemployed per 1,000 persons subject to the risk of unemployment—i.e., per 1,000 persons of the wage-earning class.
The statistics should furnish data for determining the causes of unemployment. Here again “a series of figures relating to short periods is essential to enable comparisons to be made with similar series dealing with other social phenomena,” and to ascertain the presence or absence of concomitances of variation on which to base inferences concerning causal relations existing between unemployment and these phenomena. Similarly, an examination of the fluctuations of unemployment, based on frequent statistics, enables prior impressions in respect of the seasonal or cyclical nature of certain fluctuations in unemployment to be checked by definite data. A study of the available data as to unemployment in different countries, for example, elicits the fact that the special conditions prevailing in many industries in winter have merely the slightest effect on the labour-market as a whole in Great Britain, Italy, Switzerland, and Australia; while they have considerable effects in the Netherlands, in Scandinavian countries, in Canada, and in New Zealand. Similarly, a study of the special causes of unemployment in certain industries or occupations would be considerably facilitated by the existence of statistics of unemployment, compiled according to industry or occupation. For the study of causal connections between unemployment and other phenomena, however, absolute figures for unemployment are not essential; some figure which is known to move up and down, barometer-like, in sympathy with the absolute numbers of the unemployed will often serve equally well for this purpose.
Finally, statistics of unemployment should shed light on the efficiency of measures adopted for the prevention and relief of unemployment. Here again there is a strong case for collection and compilation of unemployment statistics at frequent intervals, and for their grouping according to industry or occupation; while there is also a case, though not so urgent a one, for the obtaining of absolute numbers and of “rates.” Here again some barometer-like index will frequently suffice.
The 1926 issue of this book enumerated the various possible sources of statistics of unemployment and examined in some detail the extent to which the statistics available from different sources fulfil the above-mentioned desiderata.
Virtually the only statistics of unemployment available in New Zealand prior to 1925 were derived from the following sources:—
The unemployment inquiry included quinquennially since 1896 in the census questionnaire. This information relates only to the position at a definite point of time—viz., the date of the census; though it provides considerable wealth of detail as regards the relation between unemployment and other phenomena.
The continuous records of the Labour Department's Employment Bureaux, extending back to the date of the creation of that Department in June, 1891, mainly indeed on account of the surplus of unemployed labour then existing in most of the chief towns. Occasional figures relating to State relief of unemployment in times of more or less acute depression.
Commencing with the last quarter of 1925, statistics of unemployment based on estimates made by trade unions at three-monthly intervals have been published in. the Monthly Abstract of Statistics.
Except for occasional returns relating to State unemployment relief which have been laid on the table of the House from time to time, practically no direct statistical evidence as to the extent of unemployment in New Zealand prior to 1892 is available, but the figures for external migration provide statistics bearing indirectly on the matter; while further evidence on the employment situation is available from sundry non-statistical sources of history.
In general, as was natural in a newly settled country, labour was more or less chronically in short supply during the early years of settlement. Unemployment, however, is, on the other hand, well known to have been acute in the middle and late “sixties,” owing to the paralysing effect of the Maori wars in the North and to the collapse of the alluvial gold booms in Otago and Westland. At no time, however, during the depression of the late “sixties” does there appear to have been any unemployment amongst females; at the depths of the 1868 depression the dearth of domestic assistance having been a matter of comment in the House. With the inauguration at the beginning of the “seventies” of the Vogel policy of public works and assisted immigration, employment was available for large numbers of new arrivals, but, mainly owing to the highly seasonal nature of the demand for labour in connection with the grain crops (at that date relatively more important in New Zealand than now), it was soon found necessary so to arrange passages that few immigrants arrived in the colony during the winter months, and so to draft the programmes of public-works construction that additional labourers were taken on at that season. At the beginning of the “eighties” scarcity of funds for the prosecution of public works necessitated, along with other considerations, the checking for a space of the stream of assisted immigrants. By 1883 the position had materially improved; but unemployment once more became serious in the late “eighties” and early “nineties,” mainly owing to the fall in the prices that New Zealand's products (notably wool) were fetching in the world's markets, and to a further slackening of the rate of prosecution of public works. During both these periods the unemployment position was so acute as to be responsible for a considerable exodus of male population to Australia and elsewhere; this phenomenon being reflected in a fall of the male net immigration (arrivals minus departures) to the low point for a new country of —602 in 1868, a variable which again became algebraically negative in each of the years 1888, 1890, and 1891; the lowest point (-5,936) being reached in 1888. The later depression was sufficient, moreover, to account for a negative figure for female net immigration in each of the years 1888 to 1891, the lowest point being reached at —3,239 in 1888. Except for the period 1915–18, during which the departure of troops for the seat of war caused a large excess of departures over arrivals, such negative figures are unique in the history of the country.
Statistics of State relief afforded to unemployed workpeople lack comparability at different dates owing to changes in the conditions under which relief has been granted. While the statistics may show for any given date the actual number of unemployed who have been in receipt of relief, they do not show (nor can they reasonably be expected to show) the percentage which that number represents of the working population covered. They certainly measure the effort made by the authorities to relieve unemployment where no adequate system of insurance is established. They rarely, however, provide continuous information spread over a long series of years, for on the cessation of the circumstances which have called forth the measures of relief they naturally automatically cease. The mere existence of such figures from time to time in the past in New Zealand must be regarded as symptomatic of unfavourable conditions as regards employment; and in this respect they are sometimes of value when information on the subject is not readily available from other sources.
According to monthly figures published in order to show the numbers of persons employed on relief works (mainly road and railway construction) it would appear that the most acute position in the late “eighties” was reached during August or September, 1888, there being at the end of the former month no fewer than 727 persons so employed. Seasonal demands for labour in private employment were thereafter responsible for activities on the relief works being gradually relaxed. By the end of April, 1889, the figure had fallen to 117; and, although it rose again (under seasonal influences) to 247 by the end of September of that year, by February, 1890, the need for relief works had passed away. Nevertheless, with the continued fall in the prices of New Zealand produce in the world's markets, and with the contraction of public-works expenditure, particularly in the South Island, consequent on the exhaustion of external loans, the position again became acute in the winter of 1891, and it was this depression which was mainly responsible for the coming into being of the Labour Department on the 1st day of June in that year.
If (which is probably not really desirable on general grounds) unemployed persons were obliged to register at a public employment exchange, and if those workers who desired merely to change their employment were not permitted to register, a valuable statistic would be created; for there would exist a convenient and efficient system of estimating the total numbers unemployed. The requisite conditions for the achievement of this statistical ideal are partially realized where compulsory insurance and registration at public employment exchanges go hand in hand. But where these conditions do not exist, the exact numbers of the unemployed are not registered; for many seek jobs through private employment bureaux (where, as in New Zealand, such are permitted to exist), through “want ads,” through the good offices of friends or relatives, through direct application from factory to factory, &c.; and some who are still in posts but who desire a change register with employment exchanges. Even so, however, statistics of the activities of Government employment exchanges are valuable as indexes of fluctuations in the labour-market, despite the fact that unemployment rates (i.e., the number of unemployed per 1,000 wage-earners) cannot in such cases be accurately computed.
In New Zealand public employment exchanges exist, with private bureaux operating alongside them. Weekly figures relating to the activities of the former are compiled from the records of the district offices of the Labour Department, and are published regularly in the Monthly Abstract of Statistics. These figures do not show the full volume of unemployment, but they may safely be regarded as roughly symptomatic of the general unemployment situation, rising when unemployment increases and falling when it decreases, though not necessarily in the same mathematically rigorous proportion. For example, the extent to which there is duplicate registration of an unemployed person with the State and with private bureaux probably varies considerably with the condition of the labour-market; as does also the extent to which jobless men avail themselves of different means of getting into touch with manless jobs—viz., employment agencies, “want ads,” direct applications at the factory-gates, &c.
The following table shows the numbers of the unemployed assisted to employment from year to year by the Labour Department. The figures exclude the operations of the Women's Employment Branch of the Department, which was twice created (not under identical names) on those somewhat rare occasions when there has been a dearth of employment for women, and twice abandoned as urgency passed:—
| Year ended 31st March. | Number assisted. |
|---|---|
| 1892 | 2,533 |
| 1893 | 3,874 |
| 1894 | 3,371 |
| 1895 | 3,030 |
| 1896 | 2,871 |
| 1897 | 1,718 |
| 1898 | 2,035 |
| 1899 | 2,115 |
| 1900 | 2,147 |
| 1901 | 3,124 |
| 1902 | 1,830 |
| 1903 | 3,704 |
| 1904 | 2,860 |
| 1905 | 3,130 |
| 1906 | 6,712 |
| 1907 | 7,393 |
| 1908 | 6,305 |
| 1909 | 10,391 |
| 1910 | 8,506 |
| 1911 | 7,102 |
| 1912 | 5,735 |
| 1913 | 5,848 |
| 1914 | 5,645 |
| 1915 | 7,515 |
| 1916 | 5,978 |
| 1917 | 2,966 |
| 1918 | 2,952 |
| 1919 | 3,199 |
| 1920 | 4,205 |
| 1921 | 3,364 |
| 1922 | 4,989 |
| 1923 | 3,987 |
| 1924 | 3,877 |
| 1925 | 3,890 |
| 1926 | 3,397 |
The total number of men for whom employment has been found by the Department of Labour up to 31st March, 1926, is 152,358, the dependants of these numbering 184,570. Of the 152,358 men assisted, private employment was found for 73,447, while the remaining 78,911 went to works of various lands for the General Government.
The fluctuations revealed by the figures in past years seem to be closely bound up with the success of the local harvest (the grain crops were relatively much more important factors in the total economy of New Zealand twenty years ago than they are to-day); with the prices realized by New Zealand's export produce in the world's markets; with the loan funds available for the construction of public works; and with the volume of male net immigration. Thus the high unemployment figures of 1893–95 corresponded with the world-wide depression then prevailing; with a consequent fall in the prices realized by New Zealand's export products, notably kauri-gum, and, to a lesser degree, wool; with resulting local bank failures, causing widespread difficulties in commercial and industrial circles; with the stoppage of the Midland Railway works; also with a wave of immigration from Australia, where industrial conditions were apparently even more acute.
About 1894–95 the world prices of New Zealand's principal exports ceased to fall, and later began to rise, while already for some years the commercial success of refrigeration had been enabling a considerable export trade in frozen meat and dairy-produce to be built up. By 1896 the unemployment situation was greatly relieved, and the previously familiar countryside spectacle of “swaggers” had almost ceased for the time being to exist. The North Island gold boom of 1897 further helped matters, though with its collapse in the following year, synchronizing with a temporary slump in the price of wool, something in the nature of a set-back occurred.
The high figure for 1900–01 may have been partly due to dislocations brought about by the Boer War; it is probably, however, largely fictitious, this year having been one of greatly increased activity in connection with the prosecution of the North Island Main Trunk, the Otago Central, the Midland, the Cheviot, the Kawakawa, the Stratford-Ongarue, and other railways, and persons seeking employment on such works as artisans and labourers were obliged to register with the Labour Department. The increased figures for 1902–03 and following years may be ascribed to a collapse of the dredging boom in Otago, with its consequent adverse reactions on the Dunedin engineering trades; to a wave of immigration following droughts in Australia in 1903 and 1904, and to further similar waves in 1906 and in 1908: these factors apparently being sufficient to outweigh the effects of a now rapidly rising export price-level. The high figures for 1908–09 are partly a reflex, too, of the Wall Street panic of 1907 and the consequent shortage of purchasing-power in the hands of New Zealand's customers. They also followed an especially serious fall in the demand for phormium-fibre, and the throwing out of employment of many labourers and artisans on the completion in 1908 of the North Island Main Trunk Railway.
The great improvement in the unemployment situation between 1891–92 and 1904–05 is reflected by the fact that the average duration in months of unemployment fell from 2.4 in 1891–92 to 1.8 in 1893–94. By 1895–96 it had temporarily risen to 2.0; but it fell again, at first rapidly and then more slowly, to 1.3 in 1900–01 and 1901–02. In 1902–03 it was 1.4; in 1903–04, 0.8; and in 1904–05, 0.7.
On the outbreak of the Great War many firms adopted a policy of rigorous retrenchment, and private building came almost to a standstill, with the result that applications for employment increased rapidly till a maximum was attained in September, 1914. Among building artisans and labourers, especially in the South Island, unemployment was particularly rife. The position was relieved by the establishment of relief works of a public character in the chief and secondary centres of population, in many instances by the municipal authorities. After September the position quickly improved, as a result of an increased seasonal demand for labour; through the removal of much labour-power to non-economic spheres, viz., to military service; through war-begotten demands for increased supplies of clothing, boots, saddlery, and the like; through a considerably augmented demand for labour in connection with the fitting-out of troopships, &c. The shortage of labour then ushered in continued till about the end of 1920; but after that date over-importation and consequent financial stringency (due partly to a fall in the export price-level) were responsible for a serious slump. The situation was most acute during the week ended 24th June, 1922, at the end of which there were no fewer than 1,825 unfilled applications still remaining on the books of the Labour Department. The position was relieved by the provision of employment on public works of secondary importance, which otherwise, in accordance with the post-war policy of “concentration” in public-works construction, would have been obliged to wait their turn for a few years —especially on railway-works.
The following table shows the position at quarterly intervals for the five years commencing with the middle of 1921.
It should be mentioned that in the compilation of these data care is taken to exclude from the figures of applications remaining on the books all cases of applicants for employment from whom the Department of Labour has not heard for fourteen days; it being assumed that such applicants have obtained employment through other means, such as private employment bureaux, newspaper advertisements, the good offices of friends and relatives, &c.
The highest levels (in heavy type) for each year from 1921 onwards are also included in the table.
| ACTIVITIES OF LABOUR DEPARTMENT's EMPLOYMENT BUREAUX, BY DISTRICTS, MIDDLE WEEK OF EACH QUARTER, 1921–26. | ||||||||
|---|---|---|---|---|---|---|---|---|
| Week ended | Number of Placements during Week. | Number of Placements in government Employment included in Foregoing. | Applications still pending at End of Week. | |||||
| Auckland. | Wellington. | Christchurch. | Dunedin. | Other Branch Offices. | Total. | |||
| 20 Aug., 1921 | 174 | 64 | 268 | 406 | 103 | 104 | 264 | 1,145 |
| 17 Sept., 1921 | 140 | 36 | 227 | 728 | 98 | 63 | 186 | 1,302 |
| 19 Nov., 1921 | 100 | 16 | 218 | 412 | 159 | 153 | 179 | 1,121 |
| 18 Feb., 1922 | 101 | 12 | 366 | 327 | 76 | 100 | 319 | 1,188 |
| 20 May, 1922 | 189 | 71 | 432 | 491 | 123 | 72 | 439 | 1,557 |
| 24 June, 1922 | 84 | 27 | 502 | 507 | 254 | 73 | 489 | 1,825 |
| 19 Aug., 1922 | 140 | 56 | 420 | 403 | 196 | 75 | 256 | 1,350 |
| 18 Nov., 1922 | 53 | 18 | 207 | 306 | 170 | 59 | 142 | 884 |
| 17 Feb., 1923 | 82 | 22 | 223 | 184 | 70 | 27 | 112 | 616 |
| 19 May, 1923 | 66 | 36 | 242 | 212 | 125 | 18 | 170 | 767 |
| 16 June, 1923 | 78 | 56 | 239 | 221 | 138 | 18 | 337 | 953 |
| 20 Aug., 1923 | 68 | 33 | 200 | 161 | 55 | 17 | 122 | 555 |
| 19 Nov., 1923 | 47 | 14 | 152 | 103 | 35 | 10 | 84 | 384 |
| 18 Feb., 1924 | 114 | 54 | 135 | 76 | 39 | 20 | 100 | 370 |
| 19 May, 1924 | 65 | 21 | 173 | 168 | 28 | 43 | 98 | 510 |
| 4 Aug., 1924 | 123 | 79 | 204 | 151 | 59 | 21 | 194 | 629 |
| 18 Aug., 1924 | 90 | 50 | 190 | 154 | 43 | 10 | 99 | 496 |
| 17 Nov., 1924 | 61 | 8 | 149 | 99 | 36 | 9 | 58 | 351 |
| 16 Feb., 1925 | 67 | 10 | 120 | 90 | 15 | 9 | 63 | 297 |
| 18 May, 1925 | 35 | 1 | 171 | 98 | 23 | 32 | 98 | 422 |
| 27 July, 1925 | 66 | 3 | 200 | 115 | 274 | 38 | 165 | 792 |
| 17 Aug., 1925 | 96 | 24 | 181 | 91 | 60 | 14 | 105 | 451 |
| 16 Nov., 1925 | 72 | 17 | 214 | 58 | 32 | 19 | 99 | 422 |
| 15 Feb., 1926 | 57 | 4 | 186 | 99 | 48 | 35 | 98 | 466 |
| 17 May, 1926 | 52 | 7 | 263 | 130 | 55 | 69 | 194 | 711 |
| 21 June, 1926 | 317 | 142 | 837 | 313 | 262 | 203 | 632 | 2,247 |
| 16 Aug., 1926 | 239 | 64 | 639 | 278 | 341 | 255 | 302 | 1,815 |
Fuller data were published in the 1926 issue of this book; while still more detailed information can be found on reference to the Annual Statistical Report on Prices, &c.
A second table shows the position during the middle week of each month from January, 1925, onwards:—
| ACTIVITIES OF LABOUR DEPARTMENT's EMPLOYMENT BUREAUX AND APPLICANTS REMAINING ON THE BOOKS, BY DISTRICTS, MIDDLE WEEK OF EACH MONTH, FROM JANUARY, 1925. | |||||||||
|---|---|---|---|---|---|---|---|---|---|
| Middle Week of | Number of New Applications for Employment during week. | Number of Placements during week. | Number of Placements in Government employment included in foregoing. | Number of Applications remaining on Hooks at End of Week. | |||||
| Auckland. | Wellington. | Christchurch. | Dunedin. | Other Branch Offices. | Total. | ||||
*Not available. | |||||||||
| 1925. | |||||||||
| January | * | 89 | 24 | 137 | 67 | 56 | 7 | 72 | 339 |
| February | * | 67 | 10 | 120 | 90 | 15 | 9 | 63 | 297 |
| March | * | 67 | 10 | 134 | 120 | 28 | 13 | 66 | 361 |
| April | * | 47 | 14 | 142 | 84 | 22 | 27 | 67 | 342 |
| May | * | 35 | 1 | 171 | 98 | 23 | 32 | 98 | 422 |
| June | * | 49 | 4 | 189 | 132 | 20 | 25 | 127 | 493 |
| July | * | 58 | 3 | 206 | 125 | 189 | 33 | 162 | 715 |
| August | * | 96 | 24 | 181 | 91 | 60 | 14 | 105 | 451 |
| September | 272 | 85 | 19 | 189 | 81 | 106 | 20 | 123 | 519 |
| October | 234 | 56 | 8 | 181 | 83 | 67 | 21 | 77 | 429 |
| November | 237 | 72 | 17 | 214 | 58 | 32 | 19 | 99 | 422 |
| December | 180 | 66 | 8 | 182 | 49 | 29 | 27 | 57 | 344 |
| 1926. | |||||||||
| January | 213 | 72 | 6 | 183 | 77 | 28 | 39 | 95 | 422 |
| February | 244 | 57 | 4 | 186 | 99 | 48 | 35 | 98 | 466 |
| March | 231 | 54 | 2 | 181 | 91 | 33 | 38 | 137 | 480 |
| April | 281 | 75 | 27 | 206 | 96 | 39 | 43 | 187 | 571 |
| May | 377 | 52 | 7 | 263 | 130 | 55 | 69 | 194 | 711 |
| June | 918 | 317 | 142 | 837 | 313 | 262 | 203 | 632 | 2,247 |
| July | 744 | 301 | 86 | 656 | 172 | 242 | 143 | 506 | 1,719 |
| August | 814 | 239 | 64 | 639 | 278 | 341 | 255 | 302 | 1,815 |
Unemployment, as revealed by these figures, would appear to have been much more acute latterly in the North than in the South Island. During the serious depression of the winter months of 1922 the figure for Dunedin was very low indeed; but this is partly due to the fact that several public works of secondary importance were available in the more or less immediate vicinity of that city to absorb the surplus of labour. Another point that must be remembered in this connection is that overseas steamers, generally speaking, now call first at North Island ports: so that immigrants who have no settled work to proceed to naturally apply to the bureaux in that Island. Owing, moreover, to the fact that development has been proceeding more rapidly in the North than in the South, it may be that there is a tendency for southerners out of a job to drift northwards in search of employment, though it would be rash to dogmatize on this point.
The numbers of applications remaining on the books from time to time since September, 1921, are next shown in the form of a curve, which shows the movement at a glance. The diagram is based on the figures at the end of the first week of the successive months shown.
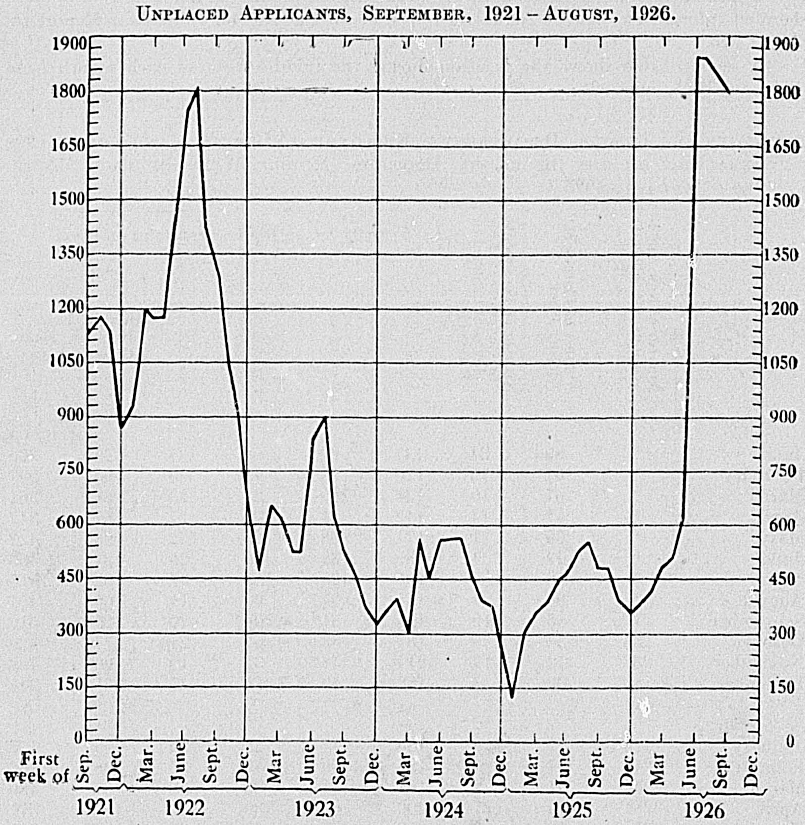
A marked seasonal fluctuation will be observed. The number of unplaced applicants is always lowest during the summer portion of the year, mainly owing to the greater demands for farm labour at that time. Unemployment continues to be low until the conclusion of the grain and threshing seasons; but after March, with the closing of many of the freezing-works, the tendency to rise is greatly augmented, until the maximum for the year is reached some time in June or July, about which months it is customary for the Public Works Department to engage additional labourers on its more important undertakings in order to help relieve the position.
During the summer months the proportion of labourers to total persons on the books of the Labour Department falls from its winter level of about 60 per cent. (during the first week of July, 1923, and again of August, 1923, it was actually 69 per cent.) to 50 per cent. or lower (during the first week of both January and February, 1925, it was actually as low as 46 per cent.). The average duration of unemployment of unskilled labourers “placed” also (as might be expected) varies with the seasons. From about 27 days in the first weeks of July, August, and September, 1924, it fell, for example, to about 17 days in the first week of December of that year, and to 16 days in the first week of February, 1925, rising again to as high as 51 days in the first week of July, 1925.
The following table shows in greater detail the occupations of persons whose applications remained on the books at the end of the middle week of May, 1925, and of each month from August, 1925, onwards:—
| OCCUPATIONS OF APPLICANTS REMAINING ON THE BOOKS, MIDDLE WEEK OF MAY, 1925, AND OF EACH MONTH FROM AUGUST, 1925. | ||||||||||||
|---|---|---|---|---|---|---|---|---|---|---|---|---|
| Middle Week of | Unskilled Labour, | Laud Transport. | Ocean Transport. | Hotel and Domestic. | Salesmen. | Clerks. | Building Trades. | Farming and Gardening. | Mining and Quarrying. | Engineering and Mechanical Trades. | Others. | Totals. |
| 1925. | ||||||||||||
| May | 225 | 31 | 8 | 24 | 11 | 23 | 16 | 21 | 1 | 26 | 36 | 422 |
| August | 233 | 31 | 10 | 30 | 16 | 23 | 19 | 24 | 3 | 38 | 24 | 451 |
| September | 261 | 32 | 10 | 37 | 15 | 21 | 20 | 27 | 2 | 43 | 51 | 519 |
| October | 229 | 22 | 11 | 31 | 12 | 16 | 9 | 25 | 9 | 32 | 33 | 429 |
| November | 215 | 23 | 23 | 25 | 6 | 12 | 3 | 29 | 5 | 45 | 36 | 422 |
| December | 190 | 20 | 12 | 18 | 7 | 11 | 7 | 24 | 6 | 27 | 22 | 344 |
| 1926. | ||||||||||||
| January | 236 | 26 | 15 | 18 | 8 | 14 | 17 | 30 | 5 | 34 | 19 | 422 |
| February | 242 | 29 | 9 | 30 | 10 | 21 | 15 | 40 | 3 | 37 | 30 | 466 |
| March | 243 | 21 | 9 | 22 | 16 | 18 | 14 | 51 | 6 | 43 | 37 | 480 |
| April | 322 | 33 | 14 | 34 | 13 | 18 | 24 | 36 | 4 | 41 | 32 | 571 |
| May | 376 | 43 | 15 | 48 | 23 | 27 | 26 | 45 | 3 | 57 | 48 | 711 |
| June | 1,299 | 115 | 31 | 104 | 44 | 69 | 125 | 124 | 18 | 160 | 158 | 2,247 |
| July | 1,067 | 85 | 19 | 88 | 25 | 41 | 108 | 75 | 26 | 101 | 84 | 1,719 |
| August | 1,036 | 110 | 18 | 89 | 48 | 55 | 81 | 103 | 14 | 133 | 128 | 1,815 |
As is quite evident from a survey of the preceding tables the unemployment situation was acute during the winter of 1926, the applications remaining on the books of the Labour Department's bureaux at 21st June reaching the alarming total of 2,247. That the position at the latest available date, 16th August, was still serious is evidenced by the fact that the unplaced applications totalled 1,815, a decrease of 432 as compared with the peak figure; but nevertheless an increase of 96 as compared with that for 19th July, the sudden drop from 2,247 to 1,719 not being maintained. The close correlation between a high rate of unemployment and a falling level of export prices will be apparent on a careful study of the tables relating to these two series of statistics.
No statistics are available as to the activities of the private employment bureaux, of which there were 29 on the 31st March, 1926. These private bureaux were, under the Servants' Registry Offices Act, 1895 (re-enacted in 1908), placed under the control of the Labour Department instead of the municipal authorities, under whose supervision they had been since the first legislation on the subject was passed in 1892. All registry offices carried on for profit are required to be registered, a condition precedent to registration being the obtaining by the proposed licensee of a certificate of character from a Magistrate. Maximum fees chargeable to employers and workers are prescribed. Records and accounts of the engagements made have to be kept, and the offices are open to inspection by officers of the Labour Department. Registry-office keepers are forbidden to keep lodging-houses for servants or to have any interest in such houses.
The volume of work performed by the private bureaux is not such that their exclusion from the statistics seriously detracts from their value. Partly on this account but mainly to avoid duplication, it has not been thought worth while to take the necessary stops to have figures for the activities of private bureaux included.
The great disadvantage of the census inquiry regarding unemployment is that it provides data only at long intervals—in New Zealand, quinquennially. Moreover, as successive population censuses are not always held in the same month, and as unemployment is in many countries (including New Zealand) subject to a very high seasonal variation, figures for unemployment at successive census dates are liable to exhibit fictitious fluctuations. Further difficulties emerge when one census-taking happens to correspond-with a period when a large number of workers are unemployed as a result of an industrial dispute.
On the other hand, the census source of information as to unemployment is exceedingly valuable in certain respects. It provides data as to unemployment in conjunction with such interesting relevant facts as conjugal condition, nationality, length of residence, age, religion, &c.—combinations of data which are not readily available from other sources of information as to unemployment. Another point is this: in countries such as New Zealand, where the available statistics do not show the total numbers of unemployed, the census fills the gap, and incidentally provides some criterion whereby, on the basis of the ratio between the census and the other available unemployment data at the date of the former, interpolations to yield the total number of unemployed at intercensal dates may be effected with some tolerable claim to precision.
The census of the night of 17th April, 1921, provides data as to unemployment at that date, though no attempt was made to separate persons out of work through scarcity of employment from those out of work as a result of illness, accident, old age, industrial disputes, or other circumstances.
At the date of the 1921 census the unemployed represented 3–95 per cent. of the male and 3–56 per cent. of all wage-earners. The situation is set forth by industrial groups in the following table:—
| Industrial Group. | Number out of Employment. | Percentage of Unemployed among Total Wage-earners. | ||||
|---|---|---|---|---|---|---|
| Males. | Females. | Totals. | Males. | Females. | Totals. | |
| Primary production | 2,848 | 14 | 2,862 | 414 | 0.45 | 3.98 |
| Industrial | 3,199 | 433 | 3,632 | 3.94 | 2.45 | 3.68 |
| Transport and communication | 1,237 | 21 | 1,258 | 2.59 | 0.80 | 2.50 |
| Commercial | 1,302 | 343 | 1,645 | 3.09 | 195 | 2.75 |
| Professional | 432 | 442 | 874 | 1.76 | 2.47 | 206 |
| Domestic | 314 | 697 | 1,011 | 4.97 | 2.34 | 2.80 |
| Other groups | 1,729 | 204 | 1,933 | 18.36 | 10.46 | 1700 |
| Total unemployed | 11,061 | 2,154 | 13,215 | 3.95 | 2.38 | 3.56 |
The next table shows more readily the position between the different industrial groups:—
| Industrial Group. | Percentage of Wage-earners to Total Wage-earners. | Percentage of Unemployed to Total Unemployed. | ||||
|---|---|---|---|---|---|---|
| Males. | Females. | Total. | Males. | Females. | Total. | |
| Primary production | 24.57 | 3.46 | 19.41 | 25.75 | 0.65 | 21.66 |
| Industrial | 28.95 | 19.50 | 26.64 | 28.92 | 20.10 | 27.48 |
| Transport and communication | 17.03 | 2.91 | 13.57 | 11.18 | 0.98 | 9.52 |
| Commercial | 15.06 | 19.39 | 16.12 | 11.77 | 15.92 | 12.45 |
| Professional | 8.78 | 19.75 | 11.46 | 3.91 | 20.52 | 6.61 |
| Domestic | 2.25 | 32.84 | 9.73 | 2.84 | 32.36 | 7.65 |
| Other groups | 3.36 | 2.15 | 3.07 | 15.63 | 9.47 | 14.63 |
| Totals | 100.00 | 100.00 | 100.00 | 100.00 | 100.00 | 100.00 |
The figures used in arriving at the proportions of wage-earners were the total wage-earners in each class, whether unemployed or not.
The “primary production” class, as far as male workers are concerned, has a percentage of unemployed slightly in excess of its normal proportion. A similar state of affairs is shown for the “domestic” class. The abnormal position as regards “other groups” is accounted for in the main by labourers, &c., whose industry was unspecified. The majority of these would, no doubt, had they been in employment, have been classified under the “industrial” class. It is submitted, therefore, that it can be safely assumed that the figures for this latter class are understated. The remaining classes show up in a very favourable light as far as the unemployment problem is concerned. For females the “industrial” and “professional” classes have slightly more than their share of unemployed, while the remaining classes, with the exception of the residual “other groups,” have less. Similar factors apply here as in the case of the males, with the exception that the unspecified cases cannot be quite so safely allotted to any particular class.
The census inquiry relating to unemployment required the period for which the wage-earner had been out of employment since the termination of the last engagement to be stated in weeks. A brief summary of this aspect of unemployment statistics is contained in the next table:—
| Duration of Unemployment, in Complete Weeks. | Males. | Females. | Both Sexed. | |||
|---|---|---|---|---|---|---|
| Numbers. | Proportion per Cent. | Numbers. | Proportion per Cent. | Numbers. | Proportion per Cent. | |
| 1 | 840 | 8.13 | 135 | 6.87 | 975 | 7.92 |
| 2 | 1,731 | 16.75 | 274 | 13.94 | 2,005 | 16.30 |
| 3 | 1,283 | 12.41 | 210 | 10.68 | 1,493 | 12.13 |
| 4 | 1,312 | 12.69 | 255 | 12.97 | 1,567 | 12.74 |
| 5.8 | 1,906 | 18.44 | 373 | 18.97 | 2,279 | 18.52 |
| 9–13 | 1,069 | 10.34 | 261 | 13.28 | 1,330 | 10.81 |
| 14–25 | 939 | 9.08 | 249 | 12.66 | 1,188 | 9.66 |
| 26–51 | 560 | 5.42 | 115 | 5.85 | 675 | 5.49 |
| 52 and over | 697 | 6.74 | 94 | 4.78 | 791 | 6.43 |
| Total specified | 10,337 | 100.00 | 1,966 | 100.00 | 12,303 | 100.00 |
In approximately 8 per cent. of the specified cases the duration was for less than two complete Weeks, and in nearly 50 per cent. for a period less than five weeks. In the majority of cases where the duration was for six months or over, apparently influences other than the paucity of employment were relatively more important than in cases of shorter durations.
The next table contains particulars of the proportion of the total of unemployed wage-earners to be found in each age-group:—
| Age-group. | Employed Wage-earners. | Unemployed Wage-earners. | ||
|---|---|---|---|---|
| Males. | Females. | Males. | Females. | |
| Under 21 | 1913 | 36.08 | 14.23 | 29.03 |
| 21–24 | 11.33 | 19.72 | 11.70 | 20.76 |
| 25–29 | 11.67 | 14.66 | 11.52 | 14.96 |
| 30–34 | 11.43 | 8.80 | 9.77 | 9.57 |
| 35–44 | 21.55 | 12.02 | 18.81 | 13.23 |
| 45–54 | 14.30 | 6.03 | 14.71 | 7.15 |
| 55–64 | 7.26 | 2.13 | 11.21 | 3.53 |
| 65 and over | 3.33 | 0.56 | 8.05 | 1.77 |
| Total specified | 100.00 | 100.00 | 100.00 | 100.00 |
In most instances the proportion differed comparatively little from the proportion of employed wage-earners in the corresponding age-groups. Generally speaking, however, unemployment is relatively more prevalent amongst old than amongst young persons.
Further light on the conditions conducive to unemployment is shed by the following table:—
| NUMBER OF UNEMPLOYED MALES PER 1,000 MALE WAGE-EARNERS, EMPLOYED AND UNEMPLOYED, CENSUS, 1921. | ||||||||
|---|---|---|---|---|---|---|---|---|
| Duration of Unemployment, in Complete Weeks. | Ages in Years Last Birthday. | |||||||
| Under | 21–24. | 25–34. | 35–44. | 45–54. | 55–64. | 65 and over. | Total. | |
| 1 | 31 | 3.2 | 3.1 | 2.7 | 2.6 | 3.4 | 3.9 | 30 |
| 2 | 5.8 | 7.7 | 5.5 | 5.8 | 6.0 | 7.8 | 7.7 | 6.2 |
| 3 | 4.6 | 5.1 | 3.9 | 3.9 | 4.8 | 6.2 | 6.4 | 4.6 |
| 4 | 4.2 | 4.9 | 4.2 | 4.2 | 4.8 | 7.0 | 7.9 | 4.7 |
| 5–8 | 5.5 | 7.2 | 6.5 | 6.2 | 6.9 | 8.8 | 14.4 | 6.8 |
| 9–12 | 2.1 | 3.3 | 3.2 | 3.3 | 3.5 | 6.3 | 10.3 | 3.5 |
| 13–25 | 1.3 | 2.7 | 3.3 | 2.8 | 4.7 | 7.1 | 15.9 | 3.6 |
| 26–51 | 0.6 | 1.5 | 1.9 | 1.6 | 2.1 | 4.6 | 9.1 | 2.0 |
| 52 and over | 0.4 | 1.9 | 2.4 | 2.0 | 2.7 | 5.8 | 12.5 | 2.5 |
| Not stated | 1.6 | 3.3 | 2.4 | 2.0 | 2.6 | 4.0 | 7.4 | 2.6 |
| Total | 29.2 | 40.8 | 36.4 | 34.5 | 40.7 | 61.0 | 95.5 | 39.5 |
The modal, or most frequent, duration of unemployment amongst males will be seen to be 2 and fewer than 3 weeks for all ages of wage-earners; but there is a definite tendency for the duration of unemployment to be prolonged amongst the older wage-earners. The rate of unemployment is at a minimum at ages under 21. It is fairly high at 21 and under 25, due perhaps to the termination of periods of apprenticeship and subsequent difficulty in obtaining employment in one's trade; perhaps somewhat to the fact that at that age persons who have been employed in blind-alley occupations find themselves out of a job when they come to expect a man's wage; perhaps partly to the fact that about those ages there is amongst many men a period of irresponsibility and shiftlessness, lasting until the advent of some inducement to “settle down” in a permanent home. From the very early “forties” there-is a tendency for unemployment rates to increase with age; a man is becoming too old for certain jobs, while health is frequently not so good.
Another interesting feature of unemployment statistics from a social point of view is in connection with the conjugal condition of those affected. The percentages thus classified are as under, the figures quoted referring only to persons 16 years of age and upwards:—
| Conjugal Condition. | Employed Wage-earners. | Unemployed Wage-earners | ||
|---|---|---|---|---|
| Males. | Females. | Males. | Females. | |
| Never married | 47.17 | 87.36 | 52.35 | 88.03 |
| Married | 49.54 | 7.38 | 42.13 | 4.66 |
| Widowed | 2.98 | 4.72 | 5.03 | 6.35 |
| Divorced | 0.31 | 0.54 | 0.49 | 0.96 |
| Total specified | 100.00 | 100.00 | 100.00 | 100.00 |
Married men, while representing 49 ½ per cent. of the total employed wage earners 16 years of age and upwards, make up only just over 42 per cent. of the unemployed, the remaining three classes having a proportion above the normal. A somewhat similar state of affairs is revealed in the case of females.
In connection with the 1926 census, some attempt was made to distinguish various types of unemployment according to the cause. The following inquiries were included in the questionnaire:—
Grade of Occupation.—Enter W.N. (except in cases of leave of absence) if unemployed for more than a week immediately prior to the census.
Unemployment and Sickness.—State number of working-days lost during the twelve months immediately preceding the census: (1) through sickness, accident, or injury (a) received in course of employment, (b) received otherwise than in course of employment; (2) through lack of employment not due to strikes or lockouts in your industry.
The tabulation of the results of this inquiry will not be available for some considerable time.
As mentioned previously in this section, estimates of unemployment amongst trade-unionists have since the middle week of November, 1925, been furnished quarterly by secretaries of rather more than 200 unions to the Census and Statistics Office, where the information supplied is tabulated for insertion regularly in the Monthly Abstract of Statistics. Like the unemployment statistics available from the census, and unlike those available from the Labour Department's employment bureaux, the statistics thus collected permit of the computation of unemployment “rates,” relating the number of persons unemployed to the number subject to the risk of unemployment. It should be stressed that, for purposes of these statistics, only those persons are counted as unemployed who were out of work as a result of scarcity of employment for more than three days during the week concerned: persons idle for three days or less, or idle because of illness, accident, or strikes or lockouts directly concerning their trade, &c., are not taken into account. The effect of counting as “unemployed” only those persons out of work as above for more than three days is to eliminate from the numbers of unemployed virtually all persons working short-time. If, as has been suggested by some statisticians, the numbers not working on a specific single typical day were counted as the unemployed there would somewhat illogically be included as unemployed a fair proportion of workers on short-time taking the form of working a reduced number of days per week, but no workers at all on short-time taking the form of reduced hours per day. There would also be included as unemployed a fair number of workers who for sundry miscellaneous reasons had not worked on that specific day although still under an employment contract. The fundamental distinction (both from the legal and from the economic standpoint) is between the totally unemployed worker on the one hand and the person still under an employment contract on the other. The New Zealand method of collecting unemployment statistics does no violence to this distinction. Furthermore, the task of selecting a “typical” day is by no means the easy one it might at first appear to be.
Despite the exclusion from the inquiry of those industries in which the work is highly seasonal (e.g., freezing), or in which employment is essentially permanent (e.g., tramway operation), or in which employment is highly casual (e.g., watersiding), or in which employment is normally part-time (e.g., performing in orchestras), and although inquiries were not addressed to unions with fewer than a score of members, it has yet been found possible to secure returns covering more than half the members of registered industrial unions throughout the Dominion. The figures, though not presenting a complete picture, yet probably constitute a reasonably fair sample of conditions regarding unemployment, and may be claimed to represent the position as regards the labour-market throughout the Dominion with a fair degree of accuracy. Somewhat less accuracy can be claimed for the figures for individual industrial groups and for individual industrial districts, which may be affected to a considerable extent (especially where the numbers concerned are small) by chance differences in the nature of the unions constituting the sample. The different character of the industries carried on in the different districts is also likely to affect comparisons; for very different conditions as regards the labour-market may be expected to exist in a predominantly mining district like Westland from those in a predominantly dairying district such as Taranaki.
Movements from time to time in the figures for the same groups or districts may (by reason of constancy in the nature of the sample) be reasonably expected to yield reliable pictures of changes in the employment situation in so far as those groups or districts are concerned. If the statistics as a whole are subject to a definite bias in any one direction it £ probably towards an overestimation of the amount of unemployment (as above defined): this being due to the fact that some unionists are members of more than one union but obviously cannot be employed in more than one trade at once. The estimates of the trade-union secretaries are no doubt in individual cases subject to errors on account of absence of complete information, for it is only in those fairly numerous cases where there is some inducement for members out of work to report their condition promptly (e.g., provision in the rules for a reduction of union dues, or for a payment in the case of unemployment of benefits out of funds held by the union) that “live” unemployment registers are kept: in all other cases the estimates of the numbers unemployed rest on the individual judgments (based always, of course, on more or less close knowledge of the facts) of the union secretaries, such judgments probably on the whole being equally liable to errors of excess as of defect.
| UNEMPLOYMENT AS ESTIMATED BY TRADE-UNIONS. | ||||||||||||
|---|---|---|---|---|---|---|---|---|---|---|---|---|
| Membership of Reporting Unions: Week ended | Persons unemployed for more than Three Days during the Week on account of Lack of Employment: Week ended | Percentage of Unemployed to Total Members: Week ended | ||||||||||
| 21 Nov., 1925. | 20 Feb., 1926. | 15 May, 1926. | 14 Aug., 1926. | 21 Nov., 1925. | 20 Feb., 1926. | 15 May, 1926. | 14 Aug., 1926. | 21 Nov., 1925. | 20 Feb., 1926. | 15 May, 1926. | 14 Aug., 1926. | |
* Including principally salesmen, storemen and packers, gardeners, &c. † Figures for the Taranaki District are included in the totals but not shown separately, on account of the small number of workers included in the returns obtained from that district. ‡ Owing to small numbers of unions in these two industrial districts they are combined for purposes of unemployment statistics. | ||||||||||||
| (a.) Industrial Groups. | ||||||||||||
| Food, drink, and tobacco | 2,930 | 2,861 | 2,912 | 2,583 | 73 | 46 | 96 | 80 | 25 | 1.6 | 3.2 | 31 |
| Clothing and drapery | 2,084 | 3,495 | 3,338 | 3,157 | 121 | 158 | 155 | 296 | 5.8 | 4.5 | 4.6 | 9.4 |
| Textiles and weaving | 791 | 666 | 679 | 779 | 20 | 19 | 14 | 53 | 2.5 | 2.9 | 21 | 6.8 |
| Building and construction | 7,676 | 7,825 | 8,068 | 7,941 | 223 | 384 | 549 | 928 | 2.9 | 4.9 | 6.8 | 11.7 |
| Sawmilling and wood manufacture | 3,844 | 3,743 | 3,548 | 3,498 | 189 | 184 | 250 | 404 | 49 | 49 | 7.0 | 11.5 |
| Paper manufacture and printing | 1,528 | 2,428 | 2,075 | 2,455 | 16 | 42 | 57 | 42 | 1.1 | 1.7 | 2.3 | 1.7 |
| Metal working and engineering | 4,678 | 5,584 | 5,746 | 5,980 | 320 | 392 | 402 | 440 | 6.8 | 6.9 | 7.0 | 7.4 |
| Other manufactures | 909 | 989 | 1,275 | 1,132 | 73 | 88 | 179 | 132 | 8.0 | 8.9 | 140 | 11.7 |
| Mining | 2,497 | 2,653 | 2,591 | 3,038 | 80 | 33 | 38 | 147 | 3.2 | 1.2 | 15 | 4.8 |
| Land transport | 1,591 | 1,722 | 1,509 | 1,630 | 15 | 29 | 30 | 27 | 0.9 | 1.7 | 2.0 | 1.7 |
| Shipping | 2,104 | 1,222 | 1,223 | 1,227 | 379 | 270 | 229 | 319 | 18.0 | 22.1 | 18.7 | 260 |
| Hotel, restaurant, and other personal service | 7,823 | 7,768 | 7,784 | 7,793 | 357 | 308 | 451 | 380 | 4.6 | 4.0 | 5.8 | 4.9 |
| Miscellaneous* | 6,089 | 5,879 | 5,713 | 5,929 | 561 | 406 | 599 | 664 | 9.2 | 6.9 | 10.5 | 11.2 |
| Totals | 44,544 | 46,835 | 46,461 | 47,142 | 2,427 | 2,359 | 3,049 | 3,912 | 54 | 5.0 | 6.6 | 8.3 |
| (b.) Industrial Districts. | ||||||||||||
| Northern | 14,790 | 15,211 | 15,464 | 15,734 | 981 | 1,341 | 1,500 | 1,833 | 6.6 | 8.8 | 9.7 | 11.6 |
| Wellington | 10,464 | 11,033 | 10,956 | 11,202 | 476 | 356 | 564 | 568 | 45 | 3.2 | 5.1 | 5.1 |
| Canterbury | 6,333 | 7,972 | 7,880 | 7,869 | 180 | 197 | 223 | 428 | 2.8 | 2.5 | 2.8 | 5.4 |
| Otago and Southland | 10,119 | 10,479 | 10,085 | 10,242 | 588 | 351 | 688 | 929 | 5.8 | 34 | 6.8 | 9.1 |
| Taranaki | 825 | 282 | † | † | 111 | 36 | † | † | 13.4 | 12.7 | † | † |
| Marlborough Nelson | 578 | 526 | 601 | 601 | 10 | 24 | 13 | 20 | 1.7 | 4.5 | 2.2 | 3.3 |
| Westland | 1,435 | 1,332 | 1,323 | 1,349 | 81 | 54 | 51 | 124 | 5.6 | 41 | 2.9 | 9.2 |
| Totals | 44,544 | 46,835 | 46,461 | 47,142 | 2,427 | 2,359 | 3,049 | 3,912 | 54 | 50 | 6.6 | 8.3 |
The increase in unemployment during the winter months is clearly brought out by the above table, the percentage of unemployed falling from 5.4 in November, 1925, to 5.0 in February, 1926, and rising again to 6.6 in May and 8.3 in August. The analysis of the position as regards individual industries shows that this increase did not distribute itself at all evenly over the field of industry. The shipping group shows an abnormally high rate of unemployment in each of the four periods, and this despite the fact that waterside workers are not included in view of the casual nature of their employment. It is quite evident that the phenomenon is not in this case due entirely to seasonal influences, since an actual decrease is recorded between February and May, while the May figure is only 0.7 per cent. higher than that for November, 1925. The increases in the cases of the groups “food, drink, and tobacco,” and “land transport” are no doubt almost entirely caused by seasonal influences, the percentage of unemployed still being abnormally low. It is hard to account for the increase from 8.9 to 14.0 per cent. in the group “other manufactures” by ascribing the increase to seasonal influences, since the constituent industries in this group are least subject to such influences. External evidence, however, points to the fact that the figures quoted reveal a true picture of the position in respect to these industries. The increase from 4.9 to 7.0 per cent. in the group “sawmilling and wood manufacture” is duo no doubt partially to the competition of foreign timbers causing unemployment in sawmills. The increase from 6.9 in February to 10.5 in May in the miscellaneous group is no doubt due mainly to seasonal influences.
A marked increase in unemployment in the building trade as between May and August has been recorded, the rate increasing from 6.8 per cent. in the former month to 11.7 in the latter. A study of the table showing the number of unplaced applications on the books of the Labour Department during the period leads to the conclusion that this increase, though prodigious, is largely seasonal, since the number of unplaced applicants in the building trade rose from 26 in May to 125 in June, then dropped to 108 in July and 81 in August, the position being apparently even more acute in the earlier winter months than in August.
The comparison between industrial districts reveals the fact that during the months of May and August unemployment was most severe in the Northern Industrial District, followed by Otago and Southland and Westland, in which districts the rate was practically identical in each case.
The above statistics relate of course only to unemployment arising from scarcity of jobs. Quarterly data are, however, collected in New Zealand also in regard to unemployment amongst unionists arising from sickness, accident; and other causes. Of 24,993 male unionists in connection with whom such returns were obtained, it was found that 233 were unemployed for more than three days during the middle week of the last quarter of 1925 on account of sickness, 200 on account of accident, and 155 on account or other causes. Just over 2 ⅓ per cent. of unionists were therefore unemployed on account of these factors.
A table comparing the position in New Zealand with that in certain other countries where similar data are available is added, with the warning that, owing to possible variations in methods of collecting and compiling the statistics and in the industrial structures of the countries concerned, international comparisons in this field are to be effected with the utmost diffidence and caution. It should also be remembered in interpreting the figures that data for a single week do not necessarily reflect a typical state of affairs, especially in view of the fact that unemployment varies considerably with the seasons in many countries.
| Country. | Percentage of Unionists unemployed to Total Unionists. | |||
|---|---|---|---|---|
| Date. | Percentage. | Date. | Percentage. | |
* Including persons absent through sickness, accident, and other minor causes, but not strikes and lockouts. | ||||
| United Kingdom | August, 1925 | 11.4 | February, 1926 | 10.4 |
| Sweden | August, 1925 | 7.7 | February, 1926 | 14.8 |
| Denmark | August, 1925 | 9.8 | February, 1926 | 28.3 |
| Belgium | August, 1925 | 0.9 | February, 1926 | 1.6 |
| Canada | August, 1925 | 4.4 | February, 1926 | 8.1 |
| Australia | 1st Quarter, 1926 | 8.2* | 3rd Quarter, 1925 | 7.9* |
| New Zealand | February, 1926 | 5.0 | August, 1926 | 8.3 |
Table of Contents
THE collection of information regarding industrial disputes was initiated by the Census and Statistics Office at the beginning of the year 1920. Information concerning disputes prior to that year was obtained by examination of the records of the Labour Department, fairly complete data being available from this source with regard to the number of disputes, their nature, causes, methods of settlement, and results. In many instances, however, it was impracticable to ascertain the duration of disputes and the number of workers involved in them, and it has been impossible to estimate the number of working-days lost or the loss in wages caused by disputes prior to 1920.
Under the system originated in 1920 returns furnished by Inspectors of Factories form the main source from which information is obtained. It is considered that the statistics based on these reports are less liable to bias than would be the case if parties to the dispute or other private persons were relied on to furnish the information. It is the duty of an Inspector, during the course of a dispute in his industrial district, to collect all available particulars relating to it. The Inspectors have power to demand information from the parties concerned in the dispute, and by exercising this power when necessary they can obtain complete information.
On the termination of a dispute the Inspector in the district in which it has taken place is required to fill in and forward to the Census and Statistics Office and to the Head Office of the Labour Department a return showing—(a) The location of the dispute; (b) its nature—whether direct strike, sympathetic strike, partial strike, or lockout; (c) the number of workers directly and indirectly concerned in the dispute; (d) the dates of commencement and termination of the dispute; (e) the cause, the method of settlement, and the result of the dispute; (f) the estimated loss in wages caused by the dispute; (g) the names of the firms affected and the industry in which the dispute has taken place. If the dispute results in a change of wages or hours, then the hours and wages before and after the dispute are to be shown.
Broadly speaking, industrial disputes may be divided into two main classes—strikes and lockouts. Strikes may be further subdivided into three classes—direct strikes, sympathetic strikes, and partial strikes. A direct strike is a concerted refusal on the part of a body of workers to continue work, for the purpose of forcing their demands on an employer or of resisting demands made by him. A stop-work meeting does not necessarily constitute a strike; it may be held merely to discuss certain matters relating to conditions of employment, &c., or to decide whether or not a strike shall take place. A sympathetic strike occurs when the workers strike, not to force their own demands on their employer, but in sympathy with the claims of other workers. A partial strike is a strike which does not involve a complete stoppage of work; a “go-slow” policy adopted by a body of workers may be classified as a partial strike, provided that the fact that they are adopting a “go-slow” policy is soundly established. A lockout occurs when an employer or a body of employers refuses work to a body of workers in order to force certain demands on them or to resist demands made by them.
In these tabulations the term “industrial dispute” refers only to those disputes which result in a strike or a lockout. Many disputes are, of course, settled without recourse to such measures; these are not recorded for statistical purposes.
At a comparatively early date in the economic history of New Zealand the desirability of mitigating the severity of industrial disputes by legislative enactment became apparent to the Legislature; and the distress caused by the maritime strike of 1890–91 led up to the passing in 1894 of the Industrial Conciliation and Arbitration Act, which was designed to facilitate the peaceful settlement of industrial disputes by conciliation and arbitration. This Act, however, applies only to such industrial unions as are registered under the Act, and such registration is voluntary. To such bodies of workers as are not so registered the Labour Disputes Investigation Act, passed in 1913, applies. This enactment requires, inter alia, that the workers in the case of a strike, or the employers in the case of a lockout, should notify the Minister of Labour of the points at issue before any actual cessation of work takes place. Fuller details of these Acts will be found in Section XXXVII of this book.
In all 83 disputes occurred during the year 1925, which figure is the highest for any individual year on record. Of this total, no fewer than 52 disturbances were recorded in the group “Shipping and cargo-working,” although it must be mentioned that the majority of cases were of a trivial nature; in fact, 26 of the 52 disputes were settled in one day or less.
In the third quarter of the year a strike broke out among British overseas seamen, which affected New Zealand as well as other parts of the Empire, and, indeed, was by far the most serious upheaval occurring in this country during 1925. Although the matter at issue (a reduction of £1 per month in wages) did not directly concern New Zealand workers, the men on strike having in every case signed on under British articles, a considerable amount of unemployment was caused by the holding-up of the Dominion's overseas trade during the strike. A total of 1,400 men in New Zealand ports were directly involved in the strike, which lasted from the beginning of September until early in November, the crews of most British vessels reaching these shores between those dates leaving their ships on arrival in port. The strike collapsed in November, the men returning to work unconditionally. The loss in wages to the strikers in New Zealand waters is estimated at approximately £20,000.
The effect of this strike on New Zealand's overseas trade is quite apparent from a study of the tables of exports and imports for the months concerned:—
| Month. | Exports. | Imports. | ||
|---|---|---|---|---|
| 1924. | 1925. | 1924. | 1925. | |
| £ | £ | £ | £ | |
| August | 2,384,505 | 2,479,888 | 4,653,091 | 4,675,602 |
| September | 2,309,630 | 1,235,541 | 4,682,662 | 4,217,881 |
| October | 2,927,098 | 1,958,691 | 4,082,671 | 4,745,369 |
| November | 2,716,956 | 4,498,839 | 3,797,360 | 4,834,480 |
| December | 5,911,449 | 4,613,488 | 4,509,816 | 4,641,751 |
The enormous drop in the export trade and the subsequent rapid recovery immediately on the conclusion of the dispute are clearly shown in the above table. Imports were not affected to any great extent during the months of the strike, the ships arriving from England but not leaving New Zealand. In the months in which the strike took place (September, October, and the beginning of November) the new season's primary produce usually commences to move; and consequently the position became critical, as is shown by the following table showing exports of certain of the principal items of New Zealand produce:—
| Month | Butter. | Frozen Beef. | Lamb (Whole Carcases). | Mutton (Whole Carcases). | Cheese. | |||||
|---|---|---|---|---|---|---|---|---|---|---|
| 1924. | 1925. | 1924. | 1925. | 1924. | 1925. | 1924. | 1925. | 1924. | 1925. | |
| Cwt. | Cwt. | Cwt. | Cwt. | Cwt. | Cwt. | Cwt. | Cwt. | Cwt. | Cwt. | |
| Aug. | 30,489 | 13,671 | 59,504 | 25,332 | 115,769 | 109,841 | 99,383 | 147,412 | 52,591 | 25,598 |
| Sept. | 30,092 | 15,346 | 70,948 | 24,920 | 35,139 | 28,472 | 138,527 | 42,716 | 15,998 | 1,144 |
| Oct. | 130,208 | 90,753 | 25,277 | 35,192 | 22,688 | 7,065 | 118,276 | 34,282 | 49,008 | 8,154 |
| Nov. | 123,591 | 194,633 | 106884 | 35,507 | 40,056 | 4,057 | 122,321 | 31,259 | 121,973 | 202,063 |
| Dec. | 244,738 | 143,749 | 51,459 | 133,825 | 28,914 | 46,636 | 67,555 | 90,339 | 222,521 | 159,881 |
The shrinkage during the months of September and October is particularly marked in the case of cheese, the exports of this important commodity falling off from 26,698 cwt. in August to only 1,144 cwt. in September and 8,154 cwt. in October, the stocks of New Zealand and Australian cheese in store at London, Bristol, and Liverpool as at 9th November, 1925, being 3,300 crates, as compared with 25,100 crates on the same date in 1924. The effect of the shrinkage of supplies is reflected in a rise in prices of butter and cheese on the London markets, followed by a considerable fall, when, owing to the arrival of abnormally heavy shipments consequent on the termination of the strike, a temporary glut of these commodities was caused. Following are the official quotations for butter and cheese on the London markets during the months affected:—
| Date. | Butter, New Zealand (Finest salted), per lb. | Cheese, New Zealand, per lb. | ||||
|---|---|---|---|---|---|---|
* No official quotations, markets being out of supplies. | ||||||
| s. | d. | s. | d. | s. | d. | |
| 12th September | 1 | 9 ¼ to 1 | 9 ½ | 0 | 11 ½ | |
| 10th October | 2 | 0 ½ to 2 | 1 | 1 | 0 ¾ | |
| 14th November | 1 | 9 ¾ to 1 | 10 ¼ | * | ||
| 29th December | 1 | 5 ¼ to 1 | 5 ¾ | 0 | 10 ¾ | |
| 9th January | 1 | 6 to 1 | 6 ½ | 0 | 10 ½ to 10 ¾d. | |
The phenomena referred to in the preceding paragraph are clearly shown in the above table.
From the passing of the Industrial Conciliation and Arbitration Act in 1894 till the end of 1905 there were no industrial disputes dealt with under the Act; indeed, New Zealand may be said to have been almost entirely free from industrial disputes during that period.
The following table shows the nature and magnitude of disputes during each of the years 1906–25. Unfortunately, particulars are not available as to the number of working-days lost for years prior to 1920; and, indeed, the figures showing the number of workers involved are incomplete in many cases. Consequently only a rough idea of the magnitude of disputes occurring in a given year can be gleaned from the table, although the number of disputes and their classification are complete.
| NATURE AND MAGNITUDE OF DISPUTES, 1906–25. | |||||||||||
|---|---|---|---|---|---|---|---|---|---|---|---|
| Year. | Nature of Dispute. | Number of Firms affected. | Number of Workers Involved.* | ||||||||
| Direct Strike. | Sympathetic Strike. | Partial Strike. | Lockout. | Total. | Direct Strike. | Sympathetic Strike. | Partial Strike. | Lock-out. | Total. | ||
* Prior to 1921 figures are incomplete in most years. | |||||||||||
| 1906 | .. | .. | .. | 1 | 1 | 1 | .. | .. | .. | 88 | 88 |
| 1907 | 3 | 3 | .. | .. | 6 | 7 | 471 | 87 | .. | .. | 558 |
| 1908 | 2 | .. | .. | .. | 2 | 2 | 63 | .. | .. | .. | 63 |
| 1909 | 1 | .. | .. | .. | 1 | 1 | .. | .. | .. | .. | .. |
| 1910 | 11 | .. | 2 | 2 | 15 | 15 | 237 | .. | 12 | 6 | 255 |
| 1911 | 19 | 3 | .. | .. | 22 | 22 | 1,361 | 14 | .. | .. | 1,375 |
| 1912 | 21 | 2 | 1 | .. | 24 | 29 | 4,964 | 759 | 23 | .. | 5,746 |
| 1913 | 33 | 39 | .. | 1 | 73 | 162 | 3,455 | 9,925 | .. | 20 | 13,400 |
| 1914 | 4 | 15 | 1 | .. | 20 | 20 | 529 | 3,560 | .. | .. | 4,089 |
| 1915 | 7 | .. | 1 | .. | 8 | 8 | 295 | .. | .. | .. | 295 |
| 1916 | 12 | 1 | 2 | .. | 15 | 21 | 696 | 160 | 43 | .. | 899 |
| 1917 | 32 | 3 | 10 | .. | 45 | 53 | 2,509 | .. | 225 | .. | 2,734 |
| 1918 | 33 | .. | 6 | .. | 40 | 44 | 3,984 | .. | 39 | 33 | 4,056 |
| 1919 | 32 | 1 | 12 | .. | 45 | 59 | 2,938 | .. | 1,092 | .. | 4,030 |
| 1920 | 71 | 4 | 2 | .. | 77 | 107 | 9,491 | 5,309 | 338 | .. | 15,138 |
| 1921 | 63 | 5 | 9 | .. | 77 | 112 | 8,534 | 917 | 982 | .. | 10,433 |
| 1922 | 53 | 4 | 1 | .. | 58 | 67 | 5,778 | 376 | 260 | .. | 6,414 |
| 1923 | 45 | 2 | . 2 | .. | 49 | 79 | 6,659 | 207 | 296 | .. | 7,162 |
| 1924 | 33 | .. | 1 | .. | 34 | 58 | 14,791 | .. | 24 | .. | 14,815 |
| 1925 | 73 | 6 | 2 | 2 | 83 | 93 | 7,694 | 1,229 | 47 | 935 | 9,905 |
| Totals | 548 | 88 | 52 | 7 | 695 | 960 | 74,449 | 22,543 | 3,381 | 1,082 | 101,455 |
From this table it will be seen that the number of disputes in any one year was very small until the year 1913, when the number suddenly rose to 73 disputes. There was an epidemic of strikes in the shipping and cargo-working group in that year, the number of sympathetic strikes being particularly large. The number of disturbances recorded in 1925 (83) is in excess of that for any previous year; but in many cases the disputes were of a very trivial nature, as is apparent from a study of the numbers of workers involved, the number of participants for 1925 (9,905) being exceeded in 1924 (when there were 14,815 workers involved in only 34 disputes), in 1921 (10,433), in 1920 (15,138), and in 1913 (13,400).
It is noteworthy that in 1925, as in 1913, there were many strikes in the shipping and cargo-working group, in each case the number in that group being more than the total of all other groups.
The following table shows the nature and magnitude of disputes in each industrial district for the year 1925. The number of working-days lost is shown in this table, and is calculated by multiplying the number of workers involved by the number of days lost (exclusive of Sundays and public holidays). It is assumed that work would have been continuous if no dispute had taken place, and no allowance is made for loss of work from unemployment or other causes which might have occurred even if there had been no dispute. In some cases, such as shearing, there is a definite amount of work to be done, and a stoppage of work does not decrease the total amount of work done, but only postpones its completion. In those cases the figures are perhaps more or less fictitious, but in the great majority of cases they represent a real loss.
| NATURE AND MAGNITUDE OF DISPUTES IN EACH INDUSTRIAL DISTRICT, 1925. | ||||||||
|---|---|---|---|---|---|---|---|---|
| — | Northern. | Taranaki. | Wellington. | Nelson. | Westland. | Canterbury. | Otago and Southland. | Totals. |
| Number of Disputes. | ||||||||
| Direct strike | 17 | 1 | 18 | 1 | 15 | 10 | 11 | 73 |
| Sympathetic strike | .. | .. | .. | .. | 6 | .. | .. | 6 |
| Partial strike | .. | .. | 1 | .. | .. | .. | 1 | 2 |
| Lockout | .. | .. | 2 | .. | .. | .. | .. | 2 |
| Totals | 17 | 1 | 21 | 1 | 21 | 10 | 12 | 83 |
| Number of Firms affected. | ||||||||
| Totals | 20 | 1 | 25 | 1 | 21 | 12 | 13 | 93 |
| Number of Workers involved. | ||||||||
| Direct strike | 1,494 | 81 | 1,905 | 8 | 3,260 | 574 | 372 | 7,694 |
| Sympathetic strike | .. | .. | .. | .. | 1,229 | .. | .. | 1,229 |
| Partial strike | .. | .. | 28 | .. | .. | .. | 19 | 47 |
| Lockout | .. | .. | 935 | .. | .. | .. | .. | 935 |
| Totals | 1,494 | 81 | 2,868 | 8 | 4,489 | 574 | 391 | 9,905 |
| Number of Working-days lost. | ||||||||
| Direct strike | 14,289 | 2,430 | 23,309 | 8 | 20,483 | 3,123 | 4,264 | 67,906 |
| Sympathetic strike | .. | .. | .. | .. | 1,229 | .. | .. | 1,229 |
| Partial strike | .. | .. | .. | .. | .. | .. | 57 | 57 |
| Lockout | .. | .. | 5,360 | .. | .. | .. | .. | 5,360 |
| Totals | 14,289 | 2,430 | 28,669 | 8 | 21,712 | 3,123 | 4,321 | 74,552 |
Several disputes occurred in the coal-mines in the Westland District, but in only one case was the dispute of any considerable magnitude.
The following table shows the duration of the disputes which occurred during the years 1906–25. Several disputes have been classified as of indefinite duration owing to the lack of full information. In other cases it has been found possible to assign disputes to a class although the exact duration could not be ascertained.
| DURATION AND MAGNITUDE OF INDUSTRIAL DISPUTES, 1906–25. | |||||||
|---|---|---|---|---|---|---|---|
| Duration. | 1906–20. | 1921. | 1922. | 1923. | 1924. | 1925. | Totals. |
* Prior to 1921 figures are incomplete in most years. | |||||||
| Number of Disputes. | |||||||
| 1 day and less | 94 | 20 | 23 | 26 | 19 | 40 | 222 |
| 2 days and more than 1 day | 33 | 4 | 8 | 4 | 2 | 9 | 60 |
| 3 days and more than 2 days | 23 | 8 | 2 | 6 | 5 | 7 | 51 |
| Over 3 days to 1 week | 26 | 10 | 1 | 1 | 1 | 9 | 48 |
| 1 week to 2 weeks | 36 | 9 | 5 | 3 | 4 | 7 | 64 |
| 2 weeks to 4 weeks | 63 | 19 | 2 | 1 | 2 | 2 | 89 |
| 4 weeks to 6 weeks | 16 | 4 | 5 | 1 | 1 | 3 | 30 |
| 6 weeks to 8 weeks | 16 | .. | 5 | .. | .. | 2 | 23 |
| 8 weeks and over | 33 | 3 | 7 | 7 | .. | 4 | 54 |
| Indefinite | 54 | 1 | .. | .. | .. | .. | 54 |
| Totals | 394 | 77 | 58 | 49 | 34 | 83 | 695 |
| Number of Workers involved.* | |||||||
| 1 day and less | 6,261 | 1,436 | 2,244 | 2,098 | 1,670 | 3,496 | 17,205 |
| 2 days and more than 1 day | 6,809 | 79 | 526 | 593 | 32 | 947 | 8,986 |
| 3 days and more than 2 days | 1,656 | 527 | 287 | 1,203 | 163 | 778 | 4,614 |
| Over 3 days to 1 week | 3,502 | 1,590 | 75 | 35 | 25 | 1,516 | 6,743 |
| 1 week to 2 weeks | 5,824 | 799 | 1,161 | 349 | 12,521 | 867 | 21,521 |
| 2 weeks to 4 weeks | 11,340 | 5,614 | 299 | 111 | 154 | 420 | 17,938 |
| 4 weeks to 6 weeks | 2,152 | 292 | 301 | 257 | 250 | 520 | 3,772 |
| 6 weeks to 8 weeks | 3,778 | .. | 887 | .. | .. | 128 | 4,793 |
| 8 weeks and over | 9,137 | 96 | 634 | 2,516 | .. | 1,233 | 13,616 |
| Indefinite | 2,267 | .. | .. | .. | .. | .. | 2,267 |
| Totals | 52,726 | 10,433 | 6,414 | 7,162 | 14,815 | 9,905 | 101,455 |
From the foregoing table it will be seen that during the period 1906–25 222 disputes, out of a total of 695, lasted for only one day or for less than one day.
In 1925, 40 disputes out of a total of 83 were for one day or less, while 65 were of a duration of less than one week. Only 4 disputes attained really serious proportions as regards duration, each case being a strike of British overseas seamen.
| INDUSTRIAL DISPUTES IN EACH INDUSTRIAL DISTRICT CLASSIFIED ACCORDING TO DURATION, 1925. | ||||||||
|---|---|---|---|---|---|---|---|---|
| Duration. | Northern. | Taranaki. | Wellington. | Nelson. | Westland. | Canterbury. | Otago and Southland. | Totals. |
| Number of Disputes. | ||||||||
| 1 day and less | 11 | .. | 10 | 1 | 10 | 5 | 3 | 40 |
| 2 days and more than 1 day | 2 | .. | 4 | 1 | .. | 2 | 9 | |
| 3 days and more than 2 days | 2 | .. | 1 | 2 | 2 | 7 | ||
| Over 3 days and less than 1 week | .. | .. | 3 | .. | 4 | 1 | 1 | 9 |
| 1 week and less than 2 weeks | .. | .. | 2 | .. | 2 | 1 | 2 | 7 |
| 2 weeks and less than 4 weeks | .. | .. | .. | .. | 2 | ... | .. | 2 |
| 4 weeks and less than 6 weeks | 1 | .. | 1 | .. | 1 | .. | .. | 3 |
| 6 weeks and less than 8 weeks | .. | .. | .. | .. | .. | 1 | 1 | 2 |
| 8 weeks and over | 1 | 1 | 1 | .. | .. | .. | 1 | 4 |
| Totals | 17 | 1 | 21 | 1 | 21 | 10 | 12 | 83 |
| Number of Workers involved. | ||||||||
| 1 day and less | 567 | .. | 275 | 8 | 2,293 | 238 | 115 | 3,496 |
| 2 days and more than 1 day | 131 | .. | 512 | .. | 250 | .. | 54 | 947 |
| 3 days and more than 2 days | 338 | .. | .. | .. | 228 | 180 | 32 | 778 |
| Over 3 days and less than 1 week | .. | .. | 961 | .. | 496 | 39 | 20 | 1,516 |
| 1 week and less than 2 weeks | .. | .. | 285 | .. | 447 | 27 | 108 | 867 |
| 2 weeks and less than 4 weeks | .. | .. | .. | .. | 420 | .. | .. | 420 |
| 4 weeks and less than 6 weeks | 80 | .. | 85 | .. | 355 | .. | .. | 520 |
| 6 weeks and less than 8 weeks | .. | .. | .. | .. | .. | 90 | 38 | 128 |
| 8 weeks and over | 378 | 81 | 750 | .. | .. | .. | 24 | 1,233 |
| Totals | 1,494 | 81 | 2,868 | 8 | 4,489 | 574 | 391 | 9,905 |
| Number of Working-days lost. | ||||||||
| 1 day and less | 567 | .. | 255 | 8 | 2,057 | 238 | 115 | 3,240 |
| 2 days and more than 1 day | 262 | .. | 1,024 | .. | 500 | .. | 108 | 1,894 |
| 3 days and more than 2 days | 1,014 | .. | .. | .. | 684 | 540 | 96 | 2,334 |
| Over 3 days and less than 1 week | .. | .. | 4,665 | 2,379 | 156 | 80 | 7,280 | |
| 1 week and less than 2 weeks | .. | .. | 1,365 | .. | 4,227 | 189 | 1,072 | 6,853 |
| 2 weeks and less than 4 weeks | .. | .. | .. | .. | 505 | .. | .. | 505 |
| 4 weeks and less than 6 weeks | 2,240 | .. | 1,110 | .. | 11,360 | .. | .. | 14,710 |
| 6 weeks and less than 8 weeks | .. | .. | .. | .. | .. | 2,000 | 1,482 | 3,482 |
| 8 weeks and over | 10,206 | 2,430 | 20,250 | .. | .. | .. | 1,368 | 34,254 |
| Totals | 14,289 | 2,430 | 28,669 | 8 | 21,712 | 3,123 | 4,321 | 74,552 |
| Estimated Loss in Wages. | ||||||||
| 1 day and less | 410 | .. | 29 | 5 | 1,627 | 49 | 40 | 2,160 |
| 2 days and more than 1 day | 256 | .. | 1,031 | 440 | .. | 90 | 1,817 | |
| 3 days and more than 2 days | 693 | .. | .. | .. | 684 | 294 | 50 | 1,721 |
| Over 3 days and less than 1 week | .. | .. | 3,260 | .. | 1,840 | 150 | 50 | 5,300 |
| 1 week and less than 2 weeks | .. | .. | .. | .. | 4,000 | 64 | 355 | 4,419 |
| 2 weeks and less than 4 weeks | .. | .. | 1,205 | .. | 4,264 | .. | .. | 5,469 |
| 4 weeks and less than 6 weeks | 1,632 | .. | 750 | .. | 8,520 | .. | .. | 10,902 |
| 6 weeks and less than 8 weeks | .. | .. | .. | .. | .. | 1,000 | 961 | 1,961 |
| 8 weeks and over | 4,500 | 1,200 | 9,000 | .. | .. | .. | 700 | 15,400 |
| Totals | 7,491 | 1,200 | 15,275 | 5 | 21,375 | 1,557 | 2,246 | 49,149 |
The following table shows the number of disputes in each industrial district for the years 1906–25, and also the number of workers involved:—
| NUMBER AND MAGNITUDE OF DISPUTES IN EACH INDUSTRIAL DISTRICT, 1906–25. | |||||||||
|---|---|---|---|---|---|---|---|---|---|
| Year. | Northern. | Taranaki. | Wellington. | Marlborough. | Nelson. | Westland. | Canterbury. | Otago and Southland. | Totals.* |
* The figures in the “total” column include the 1920 and 1924 railway strikes, which cannot be allocated to Industrial districts. It may, however, be mentioned that the railway strikes of 1920 were confined to the North Island. † Prior to 1921 figures are incomplete in most years. | |||||||||
| Number of Disputes. | |||||||||
| 1906 | .. | .. | .. | .. | .. | 1 | .. | .. | 1 |
| 1907 | 2 | .. | 1 | .. | .. | 1 | 2 | .. | 6 |
| 1908 | .. | .. | 2 | .. | .. | .. | .. | .. | 2 |
| 1909 | .. | .. | .. | .. | .. | 1 | .. | .. | 1 |
| 1910 | 4 | .. | 3 | .. | .. | .. | 6 | 2 | 15 |
| 1911 | 7 | .. | 8 | .. | .. | .. | 5 | 2 | 22 |
| 1912 | 9 | 1 | 5 | .. | .. | 1 | 5 | 3 | 24 |
| 1913 | 21 | 3 | 22 | 3 | 2 | 6 | 7 | 9 | 73 |
| 1914 | 2 | .. | 2 | .. | 3 | 12 | .. | 1 | 20 |
| 1915 | 1 | .. | 5 | .. | .. | .. | 2 | .. | 8 |
| 1916 | 1 | .. | 4 | 1 | 1 | 5 | .. | 3 | 15 |
| 1917 | 8 | .. | 14 | 1 | 2 | 15 | 2 | 3 | 45 |
| 1918 | 9 | .. | 6 | .. | 1 | 19 | 1 | 4 | 40 |
| 1919 | 10 | 1 | 8 | .. | 3 | 15 | 3 | 5 | 45 |
| 1920 | 22 | .. | 12 | .. | 1 | 25 | 9 | 6 | 77* |
| 1921 | 21 | 1 | 15 | .. | 2 | 15 | 4 | 19 | 77 |
| 1922 | 10 | 1 | 11 | .. | 1 | 16 | 10 | 9 | 68 |
| 1923 | 15 | 3 | 6 | .. | .. | 13 | 1 | 11 | 49 |
| 1924 | 5 | 3 | 5 | .. | .. | 6 | 5 | 9 | 34* |
| 1925 | 17 | 1 | 21 | .. | 1 | 21 | 10 | 12 | 83 |
| Totals | 164 | 14 | 150 | 5 | 17 | 172 | 72 | 98 | 695* |
| Number of Workers involved.† | |||||||||
| 1906 | .. | .. | .. | .. | .. | 88 | .. | .. | 88 |
| 1907 | 46 | .. | 121 | .. | .. | 350 | 41 | .. | 558 |
| 1908 | .. | .. | 63 | .. | .. | .. | .. | .. | 63 |
| 1909 | .. | .. | .. | .. | .. | .. | .. | .. | |
| 1910 | 179 | .. | 60 | .. | .. | .. | 9 | 7 | 255 |
| 1911 | 404 | .. | 663 | .. | .. | .. | 218 | 90 | 1,375 |
| 1912 | 3,262 | 6 | 1,574 | .. | .. | 543 | 128 | 233 | 5,746 |
| 1913 | 7,576 | 101 | 1,281 | 194 | 146 | 1,526 | 610 | 1,966 | 13,400 |
| 1914 | 510 | .. | 455 | .. | 144 | 2,874 | .. | 106 | 4,089 |
| 1915 | 200 | .. | 68 | .. | .. | .. | 27 | .. | 295 |
| 1916 | 10 | .. | 412 | .. | .. | 434 | 43 | 899 | |
| 1917 | 504 | .. | 269 | 35 | 58 | 1,704 | 150 | 14 | 2,734 |
| 1918 | 422 | .. | 75 | .. | .. | 3,499 | 60 | 4,056 | |
| 1919 | 394 | .. | 118 | .. | 111 | 2,306 | 880 | 221 | 4,030 |
| 1920 | 2,991 | 1,081 | .. | 10 | 5,106 | 260 | 164 | 15,138* | |
| 1921 | 3,829 | 44 | 2,373 | .. | 63 | 2,319 | 312 | 1,493 | 10,433 |
| 1922 | 703 | 53 | 940 | 49 | 2,771 | 1,010 | 888 | 6,414 | |
| 1923 | 1,592 | 164 | 636 | .. | .. | 3,998 | 115 | 657 | 7,162 |
| 1924 | 315 | 131 | 126 | .. | .. | 1,235 | 437 | 732 | 14,815* |
| 1925 | 1,494 | 81 | 2,868 | .. | 8 | 4,489 | 574 | 391 | 9,905 |
| Totals | 24,431 | 580 | 13,183 | 229 | 589 | 33,242 | 4,771 | 7,065 | 101,455* |
In the two following tables industrial disputes are classified according to the industries in which disputes took place. In the table for the period 1906–25 the totals for the Dominion only are given; but a more detailed table is also added giving fuller particulars for the disputes during the year 1925. The classification into industrial groups is the same as that used in the compilation of wage statistics. “Wood-manufacture” includes both sawmilling and the secondary stages of manufacture (cabinetmaking, &c.). “Domestic service” includes in addition to employees in hotels, restaurants, &c., workers in laundries and in hairdressing saloons. “Metal-working” includes all the engineering trades, brassmoulding, fitting. &c. The designations given to the other groups are self-explanatory.
| INDUSTRIAL DISPUTES CLASSIFIED ACCORDING TO INDUSTRIAL GROUPS, 1906–25. | |||||||
|---|---|---|---|---|---|---|---|
| Industrial Group. | 1906–20 | 1921. | 1922. | 1923. | 1924. | 1925. | Totals, 1906–25. |
*Prior to 1921 figures are incomplete In most years. | |||||||
| Number of Disputes. | |||||||
| I. Food, drink, &c. | 65 | 6 | 22 | 4 | 1 | 4 | 102 |
| II. Clothing | 6 | .. | .. | .. | .. | .. | 6 |
| III. Textiles and weaving | 10 | .. | .. | .. | .. | 2 | 12 |
| IV. Building and construction | 15 | .. | .. | 1 | .. | 1 | 17 |
| V. Wood-manufacture | 9 | 5 | 1 | 1 | .. | .. | 16 |
| VI. Paper-manufacture and printing | 1 | .. | .. | .. | .. | .. | 1 |
| VII. Metal-working | 4 | 1 | .. | .. | 1 | .. | 6 |
| VIII. Other manufactures | 9 | 2 | .. | .. | 2 | .. | 13 |
| IX. Mining | 135 | 37 | 19 | 16 | 13 | 22 | 242 |
| X. Agricultural and pastoral | 8 | 1 | .. | .. | .. | .. | 9 |
| XI. Land transport | 20 | .. | .. | .. | 1 | .. | 21 |
| XII. Shipping and cargo-working | 86 | 23 | 15 | 26 | 13 | 52 | 215 |
| XIII. Domestic service, &c. | 5 | 1 | .. | .. | 1 | .. | 7 |
| XIV. Miscellaneous | 21 | 1 | 1 | 1 | 2 | 2 | 28 |
| Totals | 394 | 77 | 58 | 49 | 34 | 83 | 695 |
| Number of Workers involved.* | |||||||
| I. Food, drink, &c. | 4,257 | 586 | 2,453 | 163 | 24 | 144 | 7,627 |
| II. Clothing | 111 | .. | .. | .. | .. | .. | 111 |
| III. Textiles and weaving | 1,054 | .. | .. | .. | .. | 365 | 1,419 |
| IV. Building and construction | 2,012 | .. | .. | 25 | .. | 100 | 2,137 |
| V. Wood-manufacture | 688 | 87 | 12 | 68 | .. | .. | 855 |
| VI. Paper-manufacture and printing | 23 | .. | .. | .. | .. | .. | 23 |
| VII. Metal-working | 899 | 22 | .. | .. | 13 | .. | 934 |
| VIII. Other manufactures | 385 | 37 | .. | .. | 14 | .. | 436 |
| IX. Mining | 26,026 | 4,972 | 3,104 | 4,599 | 1,983 | 5,101 | 45,785 |
| X. Agricultural and pastoral | 27 | 2 | .. | .. | .. | .. | 29 |
| XI. Land transport | 7,334 | .. | .. | .. | 11,839 | .. | 19,173 |
| XII. Shipping and cargo-working | 6,762 | 4,704 | 839 | 2,293 | 852 | 4,157 | 19,607 |
| XIII. Domestic service, &c. | 883 | 6 | .. | .. | 5 | .. | 894 |
| XIV. Miscellaneous | 2,265 | 17 | 6 | 14 | 85 | 38 | 2,425 |
| Totals | 52,726 | 10,433 | 6,414 | 7,162 | 14,815 | 9,905 | 101,455 |
| INDUSTRIAL DISPUTES IN EACH INDUSTRIAL DISTRICT, CLASSIFIED ACCORDING TO INDUSTRIAL GROUPS, 1925. | |||||||
|---|---|---|---|---|---|---|---|
| Industrial District and Group. | Number of Disputes. | Number of Firms affected. | Number of Workers Involved. | Number of Working-days lost. | Estimated Loss in Wages. | ||
| Directly. | Indirectly. | Total. | |||||
| Northern Industrial District. | £ | ||||||
| I. Food, drink, &c. | 2 | 2 | 97 | .. | 97 | 2,257 | 1,652 |
| IX. Mining | 3 | 3 | 615 | .. | 615 | 1,272 | 1,023 |
| XII. Shipping and cargo-working | 12 | 15 | 782 | .. | 782 | 10,760 | 4,816 |
| Totals | 17 | 20 | 1,494 | .. | 1,494 | 14,289 | 7,491 |
| Taranaki Industrial District. | |||||||
| XII. Shipping and cargo-working | 1 | 1 | 81 | .. | 81 | 2,430 | 1,200 |
| Totals | 1 | 1 | 81 | .. | 81 | 2,430 | 1,200 |
| Wellington Industrial District. | |||||||
| I. Food, drink, &c. | 1 | 1 | 28 | .. | 28 | .. | .. |
| III. Textiles and weaving | 2 | 2 | 365 | .. | 365 | 2,430 | 1,905 |
| IV. Building and construction | 1 | 1 | 100 | .. | 100 | 100 | .. |
| XII. Shipping and cargo-working | 15 | 16 | 2,337 | .. | 2,337 | 26,101 | 13,359 |
| XIV. Miscellaneous | 2 | 5 | 38 | .. | 38 | 38 | 11 |
| Totals | 21 | 25 | 2,868 | .. | 2,868 | 28,669 | 15,275 |
| Nelson Industrial District. | |||||||
| XII. Shipping and cargo-working | 1 | 1 | 8 | .. | 8 | 8 | 5 |
| Totals | 1 | 1 | 8 | .. | 8 | 8 | 5 |
| Westland Industrial District. | |||||||
| IX. Mining | 18 | 18 | 3,219 | 1,229 | 4,448 | 21,588 | 21,321 |
| XII. Shipping and cargo-working | 3 | 3 | 41 | .. | 41 | 124 | 54 |
| Totals | 21 | 21 | 3,260 | 1,229 | 4,489 | 21,712 | 21,375 |
| Canterbury Industrial District. | |||||||
| XII. Shipping and cargo-working | 10 | 12 | 574 | .. | 574 | 3,123 | 1,557 |
| Totals | 10 | 12 | 574 | 574 | 3,123 | 1,557 | |
| Otago and Southland Industrial District. | |||||||
| I. Food, drink, &c. | 1 | 1 | 19 | .. | 19 | 57 | 35 |
| IX. Mining | 1 | 1 | 38 | .. | 38 | 1,482 | 961 |
| XII. Shipping and cargo-working | 10 | 11 | 334 | .. | 334 | 2,782 | 1,250 |
| Totals | 12 | 13 | 391 | .. | 391 | 4,321 | 2,246 |
| Totals. | |||||||
| I. Food, drink, &c. | 4 | 4 | 144 | .. | 144 | 2,314 | 1,687 |
| III. Textiles and weaving | 2 | 2 | 365 | .. | 365 | 2,430 | 1,905 |
| IV. Building and construction | 1 | 1 | 100 | .. | 100 | 100 | .. |
| IX. Mining | 22 | 22 | 3,872 | 1,229 | 5,101 | 24,342 | 23,305 |
| XII. Shipping and cargo-working | 52 | 59 | 4,157 | .. | 4,157 | 45,328 | 22,241 |
| XIV. Miscellaneous | 2 | 5 | 38 | .. | 38 | 38 | 11 |
| Grand totals | 83 | 93 | 8,676 | 1,229 | 9,905 | 74,552 | 49,149 |
From the foregoing tables it will be observed that, during the whole period under review, the greatest number of disputes occurred in the group “Mining,” closely-followed by the group “Shipping and cargo-working.” In 1925 there were 52 disputes in the latter group and 22 in the former out of a total of 83 disputes in all groups combined.
In the following table the causes of disputes occurring during the years 1906–25 are shown. Under the heading “Wages” are included disputes concerning a reduction or increase in the rates of wages in industries where time rates are paid, or concerning an increase or decrease in the rates for piecework in industries where piece rates are paid. Disputes concerning an increase or decrease in the rates for overtime are also included in this class.
Disputes concerning the number of hours of work are classified under the heading “Hours.”
Disputes concerning the employment or non-employment of certain classes of persons are included under the heading “Employment.” This question usually arises in connection with trade-union affairs—the employment of non-unionists, or the dismissal of men when, in the opinion of the other workers, their dismissal is due merely or mainly to the fact that they are prominent in union activities.
The heading “Other working - conditions” includes all causes of disputes relating to conditions of work, &c.
Under the heading “Sympathy” are included all disputes caused by workers striking not on account of a grievance with their own particular employer, but in sympathy with the demands of other workers.
“Other causes” refers to all causes of disputes not included in the above classes.
| CAUSES OF INDUSTRIAL DISPUTES, 1906–25. | |||||||
|---|---|---|---|---|---|---|---|
| Cause. | 1906–20. | 1921. | 1922. | 1923. | 1924. | 1925. | Totals, 1906–25. |
*Prior to 1921 figures are incomplete in most years. | |||||||
| Number of Disputes. | |||||||
| Wages | 153 | 21 | 26 | 13 | 12 | 34 | 259 |
| Hours | 19 | 5 | 2 | 4 | .. | .. | 30 |
| Employment | 70 | 8 | 8 | 9 | 12 | 13 | 120 |
| Other working-conditions | 66 | 20 | 18 | 20 | 7 | 26 | 157 |
| Sympathy | 70 | 12 | 4 | 2 | .. | 6 | 94 |
| Other causes | 12 | 11 | .. | 1 | 3 | 4 | 31 |
| Not stated | 4 | .. | .. | .. | .. | .. | 4 |
| Totals | 394 | 77 | 58 | 49 | 34 | 83 | 695 |
| Number of Workers involved.* | |||||||
| Wages | 18,811 | 2,643 | 2,722 | 2,824 | 12,545 | 4,757 | 44,302 |
| Hours | 725 | 2,229 | 351 | 193 | .. | .. | 3,498 |
| Employment | 8,557 | 994 | 1,244 | 1,558 | 1,120 | 1,175 | 14,648 |
| Other working-conditions | 7,510 | 1,240 | 1,721 | 2,130 | 553 | 2,355 | 15,509 |
| Sympathy | 15,279 | 2,080 | 376 | 207 | 1,229 | 19,171 | |
| Other causes | 1,844 | 1,247 | .. | 250 | 597 | 389 | 4,327 |
| Not stated | .. | .. | .. | .. | .. | .. | .. |
| Totals | 52,726 | 10,433 | 6,414 | 7,162 | 14,815 | 9,905 | 101,455 |
It will be noticed that almost twice as many disputes arose out of questions concerning wages than from any other cause. Of the relatively large number of sympathetic strikes during the period 39 occurred in 1913. Fuller particulars for the year 1913 as well as for other years prior to 1920 were given in the 1923 Year-book.
The following table shows in more detail the causes of disputes reported during the year 1925:—
| CAUSES OF DISPUTES IN EACH INDUSTRIAL DISTRICT DURING THE YEAR 1925. | ||||||||
|---|---|---|---|---|---|---|---|---|
| Cause. | Northern. | Taranaki. | Wellington. | Nelson. | Westland. | Canterbury. | Otago and Southland. | Totals. |
| Number of Disputes. | ||||||||
| Wages | 6 | 1 | 10 | 2 | 6 | 9 | 34 | |
| Employment | 2 | .. | 3 | 1 | 5 | .. | 2 | 13 |
| Other working-conditions | 8 | .. | 5 | 8 | 4 | 1 | 26 | |
| Sympathy | .. | .. | .. | 6 | .. | .. | 6 | |
| Other causes | 1 | .. | 3 | .. | . | .. | 4 | |
| Totals | 17 | 1 | 21 | 1 | 21 | 10 | 12 | 83 |
| Number of Workers involved. | ||||||||
| Wages | 716 | 81 | 2,527 | .. | 723 | 376 | 334 | 4,757 |
| Employment | 238 | .. | 61 | 8 | 829 | .. | 39 | 1,175 |
| Other working-conditions | 270 | .. | 161 | .. | 1,708 | 198 | 18 | 2,355 |
| Sympathy | .. | .. | .. | .. | 1,229 | .. | .. | 1,229 |
| Other causes | 270 | .. | 119 | .. | .. | .. | .. | 389 |
| Totals | 1,494 | 81 | 2,868 | 8 | 4,489 | 574 | 391 | 9,905 |
| Number of Working-days lost. | ||||||||
| Wages | 10,811 | 2,430 | 27,869 | .. | 2,667 | 2,808 | 4,166 | 50,751 |
| Employment | 238 | 157 | 8 | 1,937 | .. | 137 | 2,477 | |
| Other working-conditions | 2,430 | 473 | .. | 15,879 | 315 | 18 | 19,115 | |
| Sympathy | .. | .. | .. | .. | 1,229 | .. | .. | 1,229 |
| Other causes | 810 | .. | 170 | .. | .. | .. | .. | 980 |
| Totals | 14,289 | 2,430 | 28,669 | 8 | 21,712 | 3,123 | 4,321 | 74,552 |
| Estimated Loss in Wages. | ||||||||
| £ | £ | £ | £ | £ | £ | £ | £ | |
| Wages | 5,052 | 1,200 | 14,817 | .. | 2,850 | 1,362 | 2,153 | 27,434 |
| Employment | 255 | .. | 130 | 5 | 5,320 | .. | 85 | 5,795 |
| Other working-conditions | 1,651 | .. | 213 | .. | 12,084 | 195 | 8 | 14,151 |
| Sympathy | .. | .. | .. | .. | 1,121 | .. | .. | 1,121 |
| Other causes | 533 | .. | 115 | .. | .. | .. | .. | 648 |
| Totals | 7,491 | 1,200 | 15,275 | 5 | 21,375 | 1,557 | 2,246 | 49,149 |
The methods of settlement of industrial disputes may be classified as follows:—
By negotiations under the Industrial Conciliation and Arbitration Act:
By negotiations under the Labour Disputes Investigation Act:
By private negotiations between the employers and workers, resulting in the framing of a compromise:
By the substitution or other workers for strikers:
By other methods. Under this head are included cases in which the men return to work without definitely settling the points at issue; or where the employers or workers give way without placing the matter before a Labour Disputes Committee or a Conciliation Council; or any other method by which a strike may be settled which does not come under the four preceding heads.
Following is a table showing the methods of settlement of disputes for the years 1906–25. It will be noted that there were no cases of settlement under heads (a), (b), or (d) during 1925.
| METHODS OF SETTLEMENT OF INDUSTRIAL DISPUTES, 1906–25. | |||||||
|---|---|---|---|---|---|---|---|
| Method of Settlement. | 1906–20. | 1921. | 1922. | 1923. | 1924. | 1925. | Totals, 1906–25. |
* Prior to 1921 figures are incomplete in most years. | |||||||
| Number of Disputes. | |||||||
| Negotiations under the Industrial Conciliation and Arbitration Act | 28 | 12 | .. | 3 | .. | .. | 43 |
| Negotiations under the Labour Disputes Investigation Act | 4 | .. | .. | .. | .. | .. | 4 |
| Compromise between parties to the dispute | 75 | 6 | 5 | 9 | 11 | 15 | 121 |
| Substitution | 59 | 8 | 12 | 1 | 2 | .. | 82 |
| Otherwise | 182 | 51 | 41 | 36 | 21 | 68 | 399 |
| Not stated | 46 | .. | .. | .. | .. | .. | 46 |
| Totals | 394 | 77 | 58 | 49 | 34 | 83 | 695 |
| Number of Workers involved.* | |||||||
| Negotiations under the Industrial Conciliation and Arbitration Act | 4,069 | 674 | .. | 260 | .. | .. | 5,003 |
| Negotiations under the Labour Disputes Investigation Act | 415 | .. | .. | .. | .. | .. | 415 |
| Compromise between parties to the dispute | 7,016 | 524 | 504 | 2,887 | 1,169 | 1,210 | 13,310 |
| Substitution | 4,984 | 203 | 1,312 | 98 | 10 | .. | 6,607 |
| Otherwise | 30,591 | 9,032 | 4,598 | 3,917 | 13,636 | 8,695 | 70,469 |
| Not stated | 5,651 | .. | .. | .. | .. | .. | 5,651 |
| Totals | 52,726 | 10,433 | 6,414 | 7,162 | 14,815 | 9,905 | 101,455 |
The following table shows the methods of settlement of disputes in each industrial district for the year 1925:—
| METHODS OF SETTLEMENT OF DISPUTES, 1925. | ||||||||
|---|---|---|---|---|---|---|---|---|
| Method of Settlement. | Northern. | Taranaki. | Wellington. | Nelson. | Westland. | Canterbury. | Otago and Southland. | Totals. |
| Number of Disputes. | ||||||||
| Compromise | 3 | .. | 4 | 1 | 3 | 3 | 1 | 15 |
| Otherwise | 14 | 1 | 17 | .. | 18 | 7 | 11 | 68 |
| Totals | 17 | 1 | 21 | 1 | 21 | 10 | 12 | 83 |
| Number of Workers involved. | ||||||||
| Compromise | 412 | .. | 176 | 8 | 368 | 230 | 16 | 1,210 |
| Otherwise | 1,082 | 81 | 2,692 | .. | 4,121 | 344 | 375 | 8,695 |
| Totals | 1,494 | 81 | 2,868 | .. | 4,489 | 574 | 391 | 9,905 |
| Number of Working-days lost. | ||||||||
| Compromise | 1,069 | .. | 148 | 8 | 2,582 | 672 | 32 | 4,511 |
| Otherwise | 13,220 | 2,430 | 28,521 | .. | 19,130 | 2,451 | 4,289 | 70,041 |
| Totals | 14,289 | 2,430 | 28,669 | 8 | 21,712 | 3,123 | 4,321 | 74,552 |
| Estimated Loss in Wages. | ||||||||
| £ | £ | £ | £ | £ | £ | £ | £ | |
| Compromise | 768 | .. | 8 | 5 | 2,690 | 254 | 40 | 3,765 |
| Otherwise | 6,723 | 1,200 | 15,267 | 18,685 | 1,303 | 2,206 | 45,384 | |
| Totals | 7,491 | 1,200 | 15,275 | 5 | 21,375 | 1,557 | 2,246 | 49,149 |
The results of all industrial disputes are classified under one of the four heads used in the table on the following pages. The system of classification is more fully explained by the following notes:—
In favour of workers. All disputes where the demands of the workers are totally conceded come under this category.
In favour of employers. Disputes are classified under this head when the workers give way on the points at issue.
Compromise. Disputes where the demands of the workers are partially but not wholly conceded come under this head.
Disputes are classified as “indeterminate” when work is resumed without any definite settlement of the questions out of which the trouble arose.
In the following table is given a summary of results of industrial disputes occurring during the period 1906–25:—
| RESULTS OF INDUSTRIAL DISPUTES, 1906–25. | |||||||
|---|---|---|---|---|---|---|---|
| Result. | 1906–20. | 1921. | 1922. | 1923. | 1924. | 1925. | Totals, 1906–25. |
* Prior to 1921 figures are incomplete in most years. | |||||||
| Number of Disputes. | |||||||
| In favour of workers | 81 | 15 | 7 | 2 | 11 | 19 | 135 |
| In favour of employers | 118 | 16 | 24 | 16 | 7 | 21 | 202 |
| Compromise | 43 | 14 | 9 | 10 | 9 | 17 | 102 |
| Indeterminate | 152 | 32 | 18 | 21 | 7 | 26 | 256 |
| Totals | 394 | 77 | 58 | 49 | 34 | 83 | 695 |
| Number of Workers involved.* | |||||||
| In favour of workers | 13,189 | 514 | 648 | 118 | 741 | 1,200 | 16,410 |
| In favour of employers | 21,598 | 1,043 | 3,187 | 1,612 | 12,196 | 4,179 | 43,815 |
| Compromise | 3,754 | 1,600 | 784 | 2,998 | 1,078 | 1,879 | 12,093 |
| Indeterminate | 14,185 | 7,276 | 1,795 | 2,434 | 800 | 2,647 | 29,137 |
| Totals | 52,726 | 10,433 | 6,414 | 7,162 | 14,815 | 9,905 | 101,455 |
Fuller details of results of disputes occurring during 1925, by industrial districts, follow:—
| INDUSTRIAL DISPUTES IN EACH INDUSTRIAL DISTRICT, 1925, CLASSIFIED ACCORDING TO RESULTS. | ||||||||
|---|---|---|---|---|---|---|---|---|
| Result. | Northern. | Taranaki. | Wellington. | Nelson. | Westland. | Canterbury. | Otago and Southland. | Total. |
| Number of Disputes. | ||||||||
| In favour of workers | 3 | .. | 6 | .. | 4 | 2 | 4 | 19 |
| In favour of employers | 5 | 1 | 6 | .. | 4 | 3 | 2 | 21 |
| Compromise | 3 | .. | 4 | 1 | 5 | 3 | 1 | 17 |
| Indeterminate | 6 | .. | 5 | .. | 8 | 2 | 5 | 26 |
| Totals | 17 | 1 | 21 | 1 | 21 | 10 | 12 | 83 |
| Number of Workers involved. | ||||||||
| In favour of workers | 200 | .. | 112 | .. | 654 | 119 | 115 | 1,200 |
| In favour of employers | 458 | 81 | 2,311 | .. | 1,101 | 146 | 82 | 4,179 |
| Compromise | 412 | .. | 176 | 8 | 1,037 | 230 | 16 | 1,879 |
| Indeterminate | 424 | .. | 269 | .. | 1,697 | 79 | 178 | 2,647 |
| Totals | 1,494 | 81 | 2,868 | 8 | 4,489 | 574 | 391 | 9,905 |
| Number of Working-days lost. | ||||||||
| In favour of workers | 336 | .. | 132 | .. | 3,600 | 236 | 1,623 | 5,927 |
| In favour of employers | 10,300 | 2,430 | 26,674 | .. | 1,924 | 2,136 | 1,890 | 45,354 |
| Compromise | 1,069 | .. | 148 | 8 | 3,486 | 672 | 32 | 5,415 |
| Indeterminate | 2,584 | .. | 1,715 | .. | 12,702 | 79 | 776 | 17,856 |
| Totals | 14,289 | 2,430 | 28,669 | 8 | 21,712 | 3,123 | 4,321 | 74,552 |
There were no disputes involving stoppage of work in the Marlborough Industrial District during 1925.
In the following table the causes and results of disputes occurring during 1925 are shown in conjunction:—
| INDUSTRIAL DISPUTES, 1925, CLASSIFIED ACCORDING TO CAUSES AND RESULTS. | ||||||
|---|---|---|---|---|---|---|
| Result. | Causes. | |||||
| Wages. | Employment. | Other Working Conditions. | Sympathy. | Other Causes. | Total. | |
| Number of Disputes. | ||||||
| In favour of workers | 7 | 3 | 9 | .. | .. | 19 |
| In favour of employers | 14 | 4 | 3 | .. | .. | 21 |
| Compromise | 9 | 2 | 4 | .. | 2 | 17 |
| Indeterminate | 4 | 4 | 10 | 6 | 2 | 26 |
| Totals | 34 | 13 | 26 | 6 | 4 | 83 |
| Number of Workers involved. | ||||||
| In favour of workers | 323 | 34 | 843 | .. | .. | 1,200 |
| In favour of employers | 3,455 | 667 | 57 | .. | .. | 4,179 |
| Compromise | 754 | 103 | 724 | .. | 298 | 1,879 |
| Indeterminate | 225 | 371 | 731 | 1,229 | 91 | 2,647 |
| Totals | 4,757 | 1,175 | 2,355 | 1,229 | 389 | 9,905 |
| Number of Working-days lost. | ||||||
| In favour of workers | 1,929 | 112 | 3,886 | .. | .. | 5,927 |
| In favour of employers | 43,761 | 1,536 | 57 | .. | .. | 45,354 |
| Compromise | 3,273 | 388 | 944 | .. | 810 | 5,415 |
| Indeterminate | 1,788 | 441 | 14,228 | 1,229 | 170 | 17,856 |
| Totals | 50,751 | 2,477 | 19,115 | 1,229 | 980 | 74,552 |
Table of Contents
AS a result of an international conference of official statisticians held at Geneva in 1923, under the auspices of the International Labour Office set up by the League of Nations, the collection and compilation of statistics of industrial accidents on substantially uniform lines is now being undertaken in virtually all countries. From the administrative standpoint the principal types of industrial accidents occurring in New Zealand may be classified under the various heads which follow.
The following is the definition of a “factory” according to the Factories Act, 1921–22:—
Any building, office, or place in which two or more persons are employed directly or indirectly, in any handicraft, or in preparing or manufacturing goods for trade or sale, including any building, office, or place in which work such as is ordinarily performed in a factory is performed for or on behalf of any local authority whether for trade or sale or not; but not including any building in course of erection, nor any temporary workshop or shed for workmen engaged in the erection of such building; but (what ever the number of persons employed therein) including
Every bakehouse . . .; and also
Every building or place in which steam or other mechanical power or appliance is used for the purpose of preparing or manufacturing goods for trade or sale, or packing such goods for transit; and also
Every building or place in which electrical energy is generated or transformed as an illuminant or a motive power for trade or sale, or in which coal-gas or any other form of gas is produced for the like purposes; and also
Every laundry; and also
Every building or place in which any Asiatic is directly or indirectly employed or occupied in laundry-work or any other handicraft, or in preparing or manufacturing goods for trade or sale, or in packing them for transit.
It should be noted that a factory as above defined is not identical with a factory as defined for purposes of the factory production inquiry (Section XXI).
Section 39 of the Factories Act prescribes certain safety devices for the protection of machine workers in factories, and provides penalties for default on the part of factory occupiers.
Section 41 requires the reporting to Inspectors of Factories (who are officers of the Labour Department, which administers the Act) of all accidents likely to incapacitate the injured person for at least forty-eight hours. Reports are compiled by Inspectors of Factories in connection with each such accident causing loss of work amounting to three days or upwards. These are retained in the District Offices of the Labour Department until the 31st January of the calendar year following that in which the accident occurred, when they are forwarded to the Head Office of the Labour Department. Up to and including the year 1923 statistics were compiled in that office for inclusion in parliamentary paper H.-11, the Annual Report of the Labour Department; but since then the individual reports of accidents have, after scrutiny in the Labour Department's Head Office, been forwarded to the Census and Statistics Office for statistical analysis.
“SCAFFOLDING” ACCIDENTS.
The Scaffolding and Excavation Act, 1922, which supersedes the original Act of 1902, does not apply to mines or quarries, or to any ship, boat, or other vessel, or to any excavation made by any local authority or public body, or to any work in connection with a tramway. The Act makes similar provisions to the Factories Act for the appointment of officers of the Labour Department as Inspectors, for the provision of safety-devices and precautionary measures, and for the prompt reporting of all accidents likely to incapacitate the sufferer for at least forty-eight hours, in connection with any building-work, scaffolding, crane, or excavation. For this purpose “building-work” is defined as “any work in connection with the construction, alteration, repair, painting, renewal, or demolition of any erection, edifice, structure, bridge, viaduct, wall, fence, or chimney”; “scaffolding” as “any structure or framework used for the support or protection of workmen engaged in any building-work, and including any swinging stage used or intended to be used for any of the purposes aforesaid”; “excavation” as “any work in connection with preparing or excavating foundations for buildings, or for sewerage, gas, water, or electric supply when such work is more than 5 ft. in depth from the top of the excavation”; and “crane” as including “any engine, hoist, lift, derrick, apparatus, or contrivance of a like kind used on any building for the hoisting, lowering, carrying, or removing from place to place of material, goods, or workmen, and worked by steam, electric, or hand power, or in any other manner”: but the term does not include any machine or boiler by which the motive power of a crane is generated, if a certificate for such machine or boiler is required under the Inspection of Machinery Act, 1908.
The procedure adopted in connection with the compilation of statistics of scaffolding accidents is identical with that in connection with factory accidents. The scaffolding accidents were for the first time handled by the Census and Statistics Office for the year 1925, but detailed tables have not been compiled owing to insufficiency of data.
Statistics of accidents to railway employees have long been compiled in the Railways Head Office from returns received from District Offices and published in the Railways Statement, parliamentary paper D.-2. Commencing with accidents occurring on the 1st July, 1925, individual reports of all accidents involving loss of work for three days or upwards have been supplied by the Railways Head Office to the Census and Statistics Office for more detailed analysis and tabulation.
Commencing on the 1st January, 1925, reports have been compiled by district officers in connection with each accident involving loss of work amounting to at least three days. These are forwarded to the Head Office of the Public Works Department, and thence to the Census and Statistics Office for compilation, after the 31st January of the calendar year following that in which the accidents occurred.
The same remarks apply as in the case of accidents to employees of the Public Works Department.
Particulars of accidents to employees in metalliferous mines, in coal-mines, and in quarries and other places under the Stone-quarries Act, are given in successive numbers of the Mines Statement, parliamentary paper C.-2. Summarized figures are given in Section XX of this book.
There are numerous types of industrial accidents for which it has not as yet been found practicable to collect and compile statistics. The principal classes of such accidents are those occurring to persons engaged in land transport (other than railway operation), in “watersiding,” in bushfelling, and in marine navigation. Accidents of the last-mentioned type are reportable to the Marine Department under the Shipping and Seamen Act.
According to the English common law relating to torts, a person injured by the wilful act, negligence, or omission of another person might recover damages by legal action. It was considered to be the duty of the employer to use reasonable care in protecting his employees against injury while engaged in his service: an employer might thus become liable because the premises, plant, machinery, or other gear supplied by him were unsafe or inadequate; because he employed an incompetent servant who through lack of skill was responsible for the accident; &c. This duty imposed on the employer called, however, merely for the guarding of those dangerous conditions which the employer knew of, or should have known of by the exercise of reasonable care. Accidents will, however, happen in the best-regulated establishments, through the fault of no one—through the inherent hazards of industry. Such risks the worker was deemed to shoulder on accepting employment, the presumption being that wages became adjusted to a higher level in especially hazardous industries as a compensation to the worker for the extra risks involved.
The common-law remedy applied only in cases of negligence on the part of the master, and it became so encrusted with exceptions grafted upon it by judicial interpretation that only in rare cases was a worker successful in a common-law action against his employer for damages for injuries received in the course of employment. An employer so sued for damages at common law might in particular escape liability by setting up successfully the defence of—
Contributory negligence, according to the doctrine laid down in Butterfield v. Forrester (1809). Any negligence on the part of the injured worker, however slight, would suffice to cause him to lose his case, so long as without that negligence that accident would not have occurred. Such negligence was deemed to exist where an employee continued to work under conditions apparently dangerous, which a reasonably prudent man would seek to avoid.
Common employment, according to the doctrine laid down in Priestley v. Fowler (1837). A servant was deemed to shoulder the risks naturally incidental to the employment undertaken by him; one of these being that of injury resulting from negligence or incompetence of fellow-servants in the same undertaking, although an employer would be held liable for failure to use reasonable care in choosing competent and careful servants, or to dismiss those who proved themselves incompetent and careless.
The plight of the injured worker was aggravated by the fact that the burden of proof rested on him, and by the fact that almost without exception the legal and financial resources of his employer were far superior to any which he was able to command.
The English law on the subject became the law in New Zealand, on the foundation of the colony, except in so far as it was modified by local legislation.
With the continued growth of industrialism there arose a demand for legislation which would mitigate the asperities of the plight of the injured worker and his family in the numerous cases where they were unable to obtain relief under the common law. The first instalment of reform in New Zealand came with the passing of the Employers' Liability Act, 1882 (modelled largely on the lines of the corresponding English Act of two years earlier); which, with its amendments, moderated some of the harsher effects of the fellow-servant (or common-employment) doctrine, and imposed a higher standard of responsibility on employers in connection with the prevention of industrial accidents. This Act also marks an important advance in that the common-law rule that a personal action dies with the injured person was abrogated in favour of the deceased worker's dependants.
This Act was repealed in New Zealand in 1908. Meanwhile a new principle, that of workmen's compensation, had been developed, by which the inherent hazards of industry have been made a charge upon the industry concerned (and in most cases, through the industry, upon the consumers of the goods and services supplied by that industry). A Workmen's Compensation for Accidents Act was passed in New Zealand in 1900, and (with sundry amendments) consolidated in 1908. In the same year this Act was replaced by the Workers' Compensation Act, 1908, now (with certain fairly extensive amending Acts) consolidated in the corresponding Act of 1922. Under the present law the employer is, quite independently of whether or not he has been at fault at all, liable to pay compensation in respect of all accidents arising out of and in the course of employment, except those due to the serious and wilful misconduct of the person injured, and even in respect of such accidents if they result in serious and permanent disablement.
Information concerning the Workers' Compensation Act is given in Section XXXVII of this book.
Some measure whereby the frequency of accidents in different industries or occupations, or districts, or countries, may be rigorously compared, or whereby some unequivocal indication may be obtained as to whether accidents are or are not increasing in frequency, is highly desirable. Because hours worked are not fully standardized for industry generally the number of accidents occurring in a given time per 1,000 employees cannot but be regarded as an unsatisfactory measure of frequency. A difference in hours worked entails a difference in industrial risk. For the purpose of computing frequency rates in New Zealand, data as to the number of employees in establishments coming under the heading of various industries have accordingly been compiled in the Census and Statistics Office from returns furnished for the purpose by the Labour Department's Inspectors of Factories; while information as to the hours worked has been ascertained from the awards, and supplemented by the statistics of short-time and overtime compiled from data collected in connection with the annual census of factory production taken by the Census and Statistics Office. Similar data have been obtained from the records of the Post and Telegraph, Public Works, and Railway Departments. Taking one hour's work performed by one man as the unit, and calling this unit a “man-hour,” it is then a simple matter to find the total number of man-hours worked in each industry, enabling frequency rates of factory accidents to be computed on the basis of number of accidents per 100,000 man-hours worked.
The following table shows, in respect of industrial accidents tabulated for the year 1925, the frequency rates for each industrial group, together with compensation paid (including medical and surgical expenses):—
| INDUSTRIAL ACCIDENTS, 1925.—FREQUENCY RATES AND COMPENSATION. | |||||
|---|---|---|---|---|---|
| Industry. | Number of Accidents. | Accidents per 100,000 Man-hours worked. | Number of Accidents where Particulars are available as to Compensation paid. | Total Amount of Compensation or Damages paid in such Cases. | Average Compensation per Case where Compensation known. |
* Six months only. * Six months only. | |||||
| £ | £ | ||||
| Food, drink, and tobacco— | |||||
| Baking | 3 | 0.030 | 3 | 22.8 | 7.6 |
| Flourmilling | 4 | 0.400 | 4 | 67.0 | 16.8 |
| Biscuitmaking | 76 | 1.315 | 76 | 1,108.5 | 14.6 |
| Brewing, aerated waters | 18 | 0.487 | 18 | 673.8 | 37.4 |
| Butchering | 14 | 0.350 | 14 | 509.5 | 36.4 |
| Meat freezing and preserving | 1,050 | 12.500 | 1,050 | 9,329.5 | 8.8 |
| Butter and cheese factories | 29 | 0.354 | 29 | 1,365.1 | 47.1 |
| Other | 47 | 1.022 | 47 | 673.8 | 14.3 |
| Totals | 1,241 | 2.976 | 1,241 | 13,750.0 | 11.1 |
| Clothing, boots, &c.— | |||||
| Dressmaking, tailoring, &c. | 5 | 0.020 | 5 | 27.9 | 5.6 |
| Bootmaking and repairing | 22 | 0.324 | 22 | 335.3 | 15.2 |
| Other | 8 | 0.195 | 8 | 35.2 | 4.4 |
| Totals | 35 | 0.097 | 35 | 398.4 | 11.4 |
| Textiles and weaving— | |||||
| Woollen-mills | 34 | 0.607 | 34 | 737.4 | 21.7 |
| Flax-mills | 12 | 0.800 | 12 | 526.1 | 43.8 |
| Rope and twine works | 4 | 0.800 | 4 | 25.3 | 6.3 |
| Other | 4 | 0.800 | 4 | 17.3 | 4.3 |
| Totals | 54 | 0.675 | 54 | 1,306.1 | 24.2 |
| Public Works— | |||||
| Railway-construction | 390 | 5.132 | 380 | 4,740.1 | 12.5 |
| Road-construction | 83 | 2.184 | 83 | 2,541.4 | 30.6 |
| Hydro-electric works | 128 | 5.120 | 128 | 2,063.5 | 16.1 |
| Public buildings | 6 | 0.667 | 6 | 102.0 | 17.0 |
| Other | 67 | 3.526 | 65 | 1,111.6 | 17.1 |
| Totals | 674 | 4.036 | 662 | 10,558.6 | 15.9 |
| Other construction— | |||||
| Joinery | 64 | 1.778 | 64 | 1,176.7 | 18.4 |
| Building | 12 | 0.235 | 12 | 132.5 | 11.0 |
| Plumbing | 10 | 0.227 | 10 | 175.5 | 17.6 |
| Totals | 86 | 0.656 | 86 | 1,484.7 | 17.3 |
| Wood-manufacture— | |||||
| Sawmilling | 183 | 1.679 | 183 | 4,188.5 | 22.9 |
| Coachbuilding | 18 | 0.439 | 18 | 80.4 | 4.5 |
| Furniture-making | 73 | 1.237 | 73 | 1,484.7 | 20.3 |
| Boatbuilding | 1 | 0111 | 1 | 3.9 | 3.9 |
| Other | 23 | 0.177 | 23 | 868.0 | 37.8 |
| Totals | 298 | 1.296 | 298 | 6.625.5 | 22.2 |
| Paper-manufacture and printing— | |||||
| Paper-manufacture | 10 | 2.500 | 10 | 250.6 | 25.1 |
| Printing—Government | 8 | 0.727 | .. | .. | .. |
| Other than Government | 57 | 0.594 | 57 | 772.8 | 13.6 |
| Other | 14 | 7.000 | 14 | 155.2 | 11.8 |
| Totals | 89 | 0.781 | 81 | 1,178.6 | 14.7 |
| Metal-working and engineering— | |||||
| Foundries | 91 | 1.785 | 91 | 1,216.0 | 13.4 |
| Engineering—General | 141 | 1.343 | 141 | 2,398.3 | 17.0 |
| Electrical | 10 | 0.238 | 10 | 92.5 | 9.3 |
| Cycle and motor | 43 | 0.512 | 43 | 547.6 | 12.7 |
| Other | 90 | 0.243 | 90 | 901.1 | 10.0 |
| Totals | 375 | 1.176 | 375 | 5,155.5 | 13.8 |
| Other manufactures— | |||||
| Brickmaking | 83 | 1.407 | 83 | 1,037.9 | 12.5 |
| Gas-manufacture | 19 | 0.655 | 19 | 2,412.4 | 127.0 |
| Electric-lighting | 3 | 0.500 | 3 | 754.3 | 251.4 |
| Leather-making | 15 | 0.231 | 15 | 287.0 | 19.1 |
| Soap and starch works | 12 | 0.600 | 12 | 92.7 | 7.7 |
| Jewellery | .. | .. | .. | .. | .. |
| Chemical and manure works | 54 | 2.572 | 54 | 511.5 | 9.5 |
| Other | 23 | 0.377 | 23 | 1,304.3 | 56.7 |
| Totals | 209 | 0.765 | 209 | 6.400.1 | 30.6 |
| Transport and communication— | |||||
| Railways*— | |||||
| Permanent-way employees | 178 | 5.742 | 178 | 5,117.8 | 28.7 |
| Locomotive workshop employees | 234 | 6.158 | 233 | 2,331.9 | 10.0 |
| Maintenance workshop employees | 36 | 2.769 | 36 | 443.6 | 12.3 |
| Engine-drivers and firemen | 46 | 2.556 | 46 | 1,324.6 | 28.8 |
| Other locomotive employees | 40 | 3.077 | 39 | 273.2 | 7.0 |
| Guards | 15 | 2.500 | 15 | 157.4 | 10.5 |
| Shunters | 52 | 13.000 | 52 | 2,844.7 | 54.7 |
| Signalmen, storemen, &c. | 156 | 4.952 | 155 | 2,874.5 | 18.5 |
| Totals | 757 | 4.900 | 754 | 15,367.7 | 20.4 |
| Postal employees— | |||||
| Clerical officers | 5 | 0.096 | .. | .. | .. |
| Tradesmen | 19 | 1.583 | .. | .. | .. |
| Storemen | 2 | 1.000 | .. | .. | .. |
| Telegram-sorters, &c. | .. | .. | .. | .. | .. |
| Exchange clerks and attendants | 3 | 0.107 | .. | .. | .. |
| Overseers, foremen, &c. | 30 | 2.308 | .. | .. | .. |
| Linesmen and labourers | 168 | 3.170 | .. | .. | .. |
| Chauffeurs | 9 | 3.000 | .. | .. | .. |
| Postmen | 12 | 0.800 | .. | .. | .. |
| Messengers | 3 | 0.500 | .. | .. | .. |
| Message-boys and girls | 20 | 1.000 | .. | .. | .. |
| Totals | 271 | 1.316 | .. | .. | .. |
| Tram-car construction and repair— | |||||
| Tram-car construction and repair | 9 | 4.500 | 9 | 43.7 | 4.9 |
| Personal service— | |||||
| Laundry-work | 9 | 0.321 | 9 | 489.5 | 54.4 |
| Miscellaneous— | |||||
| Miscellaneous minor industries | 24 | 0.533 | 24 | 624.4 | 26.0 |
| Summary. | |||||
| Factory accidents | 2,429 | 1.213 | 2,421 | 37,456.5 | 15.5 |
| Railway accidents* | 757 | 4.900 | 754 | 15,367.7 | 20.4 |
| Public Works accidents | 674 | 4.036 | 662 | 10,558.6 | 15.9 |
| Post Office accidents | 271 | 1.316 | .. | .. | .. |
| Grand totals | 4,131 | 1.821 | 3,837 | 63,382.8 | 16.5 |
The inclusion for the year 1925 of accidents occurring to employees of the Railways, Public Works, and Post and Telegraph Departments has resulted in the group covering accidents to men engaged on railways showing the highest frequency rate. Of those groups covered by the definition of “factories” the “food and drink” group is highest—due to the exceptionally high rate in the meat-freezing industry—followed by the wood-manufacturing group. The “clothing, boots, and shoes” group shows the lowest frequency rate.
With regard to the extent and degree of the disability sustained, it is usual to distinguish fatal accidents, accidents causing temporary disability, accidents causing permanent partial disability, and accidents causing permanent total disability. In the actual compilation of the statistics difficulty occasionally arises as to whether a particular injury should be regarded as temporary or permanent; and in cases of doubt the conservative practice has been adopted of debiting the injury to the temporary-disability class.
As the reports covering scaffolding accidents were not sufficiently. complete in the date supplied, it has not been deemed advisable to incorporate the results in the combined tables; similarly, as the period covered by reports from the Railway Department covered the last six months only of 1925, these are not included in the following detailed table.
| INDUSTRIAL ACCIDENTS, 1925.—CAUSES OF ACC£DENTS BY EXTENT OF DISABILITY.(NOTE.—This table covers only accidents in factories, and to employees of Public Works and Post and Telegraph Departments.) | |||||
|---|---|---|---|---|---|
| Cause. | Extent of Disability. | ||||
| Temporary Disability. | Permanent Partial Disability. | Fatality. | Total. | Percentage of Total Accidents. | |
| Machinery— | |||||
| Prime movers | 9 | 1 | .. | 10 | 18.0 |
| Transmission | 40 | 2 | 3 | 45 | |
| Lifting-machinery | 44 | 4 | 1 | 49 | |
| Power-working machines | 407 | 98 | .. | 505 | |
| Vehicles | 119 | 1 | 2 | 122 | 3.6 |
| Explosions and fires | 31 | 2 | 1 | 34 | 1.0 |
| Poisonous, hot, and corrosive substances | 114 | .. | .. | 114 | 34 |
| Electricity | 16 | 1 | .. | 17 | 0.5 |
| Falls of persons— | |||||
| From elevations | 158 | 3 | .. | 161 | 12.3 |
| Into excavations | 9 | 1 | .. | 10 | |
| Slipping and stumbling on the level | 241 | 4 | .. | 245 | |
| Stepping on or striking against fixed objects— | |||||
| Stepping on | 21 | .. | 1 | 22 | 2.8 |
| Striking against | 72 | 1 | .. | 73 | |
| Falling objects not being handled by the person injured | 76 | 1 | .. | 79 | 24 |
| Falls of earth | 43 | 2 | 1 | 46 | 1.4 |
| Handling of objects— | |||||
| Heavy | 638 | 13 | 1 | 652 | 27.4 |
| Sharp | 227 | 5 | .. | 232 | |
| Hand-trucks, &c. | 41 | .. | .. | 41 | |
| Hand tools— | |||||
| In hands of injured— | |||||
| Glancing of tool | 548 | 9 | .. | 557 | 19.9 |
| Breaking of tool | 4 | .. | .. | 4 | |
| Flying particles | 65 | .. | .. | 66 | |
| Other | 29 | .. | .. | 29 | |
| In hands of other than person injured | 14 | .. | .. | 14 | |
| Animals (including vehicle accidents due to animals) | 42 | .. | .. | 42 | 1.2 |
| Miscellaneous— | |||||
| Strains, sprains, and septic wounds undefined as to cause (sustained while slaughtering) | 101 | .. | .. | 101 | 6.1 |
| Doors, windows, covers, gates (excluding elevators) | 18 | 1 | .. | 19 | |
| Other, | 80 | 5 | .. | 85 | |
| Summary. | |||||
| Factories | 2,287 | 136 | 6 | 2,429 | .. |
| Public Works | 653 | 15 | 6 | 674 | .. |
| Post Office | 267 | 4 | .. | 271 | .. |
| Totals | 3,207 | 155 | 12 | 3,374 | 100.0 |
Of the factory accidents resulting in permanent partial disability—136 in all—104 were due to machinery. This is to be expected from the nature of the work, for though all factory accidents resulting from machinery bear a much smaller proportion to total factory accidents—i.e., 576 to 2,429—there is far more likelihood of permanent partial disability through dismemberment or loss of power of a limb, or part of a limb, occurring when dealing with machinery.
In the Public Works Department machinery accidents were few in comparison with the total (26), and but 1 accident of these resulted in permanent disability. Out-of-door accidents—due to slipping and falling, and to vehicles—are more common, and the cases included in the group “handling of objects” show the greatest number of accidents resulting in permanent partial disability—5 out of the 15 cases.
As would be expected, the groups “handling of objects,” “falls of persons,” and “vehicles” show the highest figures as causes of accidents to postal employees, although 2 of the 4 cases of permanent partial disability are due to the handling of tools.
The natures of the injuries sustained during 1925 in the different classes of accidents were—
| INDUSTRIAL ACCIDENTS, 1925.—NATURE OF INJURY BY CLASS OF ACCIDENT. | |||||
|---|---|---|---|---|---|
| Nature of Injury. | Class of Accident. | ||||
| Factory. | Scaffolding. | Postal. | Public Works. | Railways.* | |
* Six months only. | |||||
| Contusions and a brasions | 490 | 72 | 72 | 277 | 151 |
| Burns and scalds | 112 | 6 | 9 | 14 | 27 |
| Concussions | 7 | 3 | 2 | 1 | 6 |
| Cuts and lacerations | 944 | 37 | 53 | 74 | 228 |
| Punctures | 149 | 27 | 4 | 32 | 31 |
| Amputations | 116 | 6 | .. | 8 | 16 |
| Dislocations | 14 | 5 | 3 | 5 | 2 |
| Fractures | 68 | 25 | 18 | 41 | 25 |
| Sprains and strains | 304 | 43 | 68 | 173 | 217 |
| Asphyxiation | .. | .. | .. | 1 | .. |
| Drowning | .. | 1 | .. | .. | .. |
| Others and ill-defined | 225 | 29 | 42 | 48 | 54 |
| Totals | 2,429 | 254 | 271 | 674 | 757 |
It will be observed that the natures of the injuries sustained vary considerably as among the different classes of accidents. Cuts and lacerations figure exceptionally largely amongst factory accidents, 431 cases out of the 944 recorded under this head being due to glancing of tools or work, and 294 to machine operation. Contusions and abrasions figure largely amongst all classes of accidents, and are duo to a wide variety of causes, none of which can be regarded as outstanding. Strains and sprains are also deserving of notice as ranking high amongst the different types of injury; a large proportion of these injuries being traceable to the handling of heavy objects (154 out of 304 in the case of factory accidents, and a further 21 cases of rupture, necessitating cessation of work), 19 out of 43 in the case of scaffolding accidents, 23 out of 68 in the case of postal accidents, 59 of the 173 cases among Public Works employees, and 72 in the case of the 217 Railway Department accidents.
Sufficient particulars were not obtainable in all cases to give tabular information as to the incidence of septic poisoning following injury, but in the case of factory accidents, 360 of the 2,429 were wounds of a septic nature, mainly as the result of the glancing of tools (77), handling in slaughtering operations (72), and undefined cases of septic poisoning in slaughtering operations (62). Septic poisoning usually follows on minor injuries such as cuts, abrasions, and punctures, which are therefore likely to be neglected.
Similarly, in the Railway Department, 77 cases (over 10 per cent. of those recorded) were shown to have resulted in septic poisoning. Here they were due to knocking against fixed objects and the handling of sharp or rough objects, the consequent punctures and abrasions being hut slight and tending to be neglected.
Informative figures showing the number of cases in which the different parts of the body were affected by industrial accidents occurring in 1925 are given in the following table:—
| INDUSTRIAL ACCIDENTS, 1925.—PART OF BODY AFFECTED. | |||||
|---|---|---|---|---|---|
| Part of Body affected. | Class of Accident. | ||||
| Factory. | Scaffolding. | Postal. | Public Works. | Railways.* | |
* Six months only. | |||||
| Head | 37 | 19 | 12 | 20 | 15 |
| Byes | 71 | 6 | 12 | 19 | 40 |
| Rest of face | 41 | 2 | 5 | 10 | 17 |
| Neck | 11 | 1 | 4 | 2 | 3 |
| Back | 119 | 16 | 22 | 90 | 77 |
| Thorax and contents | 56 | 9 | 10 | 38 | 34 |
| Abdomen and contents | 30 | 8 | 5 | 20 | 34 |
| External genitals | 2 | 1 | .. | 1 | 2 |
| Upper limbs— | |||||
| Collarbone and shoulder | 34 | 7 | 14 | 18 | 10 |
| Arms | 174 | 16 | 16 | 36 | 35 |
| Hands and wrists | 461 | 42 | 34 | 90 | 83 |
| Fingers and thumbs | 998 | 35 | 45 | 109 | 166 |
| Lower limbs— | |||||
| Pelvis, hip, and thigh | 30 | 5 | 4 | 28 | 22 |
| Legs | 155 | 29 | 33 | 93 | 73 |
| Ankles and feet | 198 | 45 | 52 | 93 | 143 |
| Undefined | 12 | 13 | 3 | 7 | 3 |
| Totals | 2,429 | 254 | 271 | 674 | 757 |
Notable differences among the different classes of accidents are disclosed. As might have been expected, injuries to hands and fingers rank high amongst factory accidents. Of 461 injuries to the hands no fewer than 109 were due to glancing of tools or work and 68 to power-working machinery, while of 998 injuries to the fingers and thumbs no fewer than 318 wore due to glancing of tools or work and 345 to power-working machines. Amongst scaffolding accidents injuries to ankles and feet rank highest; the principal cause of such injuries being stepping on sharp objects.
As to postal employees, ankles and feet are again the scat of more injuries than any other part of the body, 12 out of the 52 cases being due to objects dropped and 10 to falls of workers from ladders.
On considering Railway employees, it is found that the 166 cases of injuries to fingers and thumbs are fairly evenly distributed as to cause, and the next largest group, injuries to ankles and feet, has as the main factor the handling of heavy objects.
Again, with these accidents in the Public Works Department, handling of objects had the largest individual number of cases of injuries to fingers and thumbs—which type of injury predominated among this class of employees.
Further tabulations were made for the 1925 year correlating nature of injury with part of body affected. This showed that the most common type of accident was to the fingers and thumbs, resulting in cuts or lacerations: of the 3,374 accidents in factories. Public Worts Department, and Post and Telegraph Department, 661 came under this category. of the 124 cases of amputations also, 89 resulted in loss of some part of lingers or thumbs. Contusions of fingers and thumbs numbered 230, and cuts and lacerations of the hand 216. Of the 511 sprains, 188 resulted in injury to the back, and sprained ankles accounted for a further 75.
A further measure of the extent of disability is furnished in the cases of temporary disability by data as to duration of absence from work as the result of the accident. A summary of this aspect of the matter—giving actual numbers and ratios to all accidents in each division—is given below. The average duration of incapacity in cases of temporary disability was 20.6 days for factory accidents, 23.5 days for accidents to Public Works employees, 18.9 days for accidents to Post and Telegraph employees, and 20.5 days for accidents to Railway employees.
| Duration. | Factories. | Public Works. | Postal. | Railways.* | ||||
|---|---|---|---|---|---|---|---|---|
| Number. | Proportion per Cent. | Number. | Proportion per Cent. | Number. | Proportion per Cent. | Number. | Proportion per Cent. | |
* Six months only. | ||||||||
| 1 week or under | 494 | 20.4 | 91 | 135 | 83 | 30.6 | 151 | 19.9 |
| 1 week to 2 weeks | 722 | 29.7 | 167 | 24.8 | 78 | 28.8 | 240 | 31.7 |
| 2 weeks to 4 weeks | 675 | 27.8 | 208 | 309 | 63 | 23.3 | 201 | 26.6 |
| 4 weeks to 6 weeks | 182 | 7.5 | 83 | 12.3 | 23 | 8.5 | 62 | 8.2 |
| 6 weeks to 13 weeks | 149 | 6.1 | 63 | 9.3 | 15 | 5.5 | 71 | 9.4 |
| 13 weeks to 6 months | 29 | 1.2 | 9 | 1.3 | 3 | 1.1 | 10 | 1.3 |
| Over 6 months | 12 | 0.5 | 2 | 0.3 | 2 | 0.7 | .. | .. |
| Total specified cases of temporary disability | 2,263 | 93.2 | 623 | 92.4 | 267 | 98.5 | 735 | 97.1 |
| Cases where employee did not return or time not stated | 24 | 1.0 | 30 | 4.5 | .. | .. | .. | .. |
| Permanent partial disability | 136 | 5.6 | 15 | 2.2 | 4 | 1.5 | 15 | 2.0 |
| Fatality | 6 | 0.2 | 6 | 0.9 | .. | .. | 7 | 0.9 |
| Totals | 2,429 | 100.0 | 6/4 | 100.0 | 271 | 100.0 | 757 | 100.0 |
Scaffolding accidents were not included in this table, as in nearly half of the cases information as to time lost was not given.
The Post and Telegraph Department shows the lowest average duration due to the exceedingly high proportion of cases resulting in temporary incapacity—caused through vehicles, falls, and the handling of objects. The most prolific source of serious injury in regard to factories—i.e., machinery—was almost wholly absent, there being but 7 cases due to this cause.
The next lowest average duration was recorded in the Railway Department's figures, though there is a relatively high proportion of fatal accidents, all occurring through being struck by vehicles. Accidents resulting in permanent partial disability were few, scattered over various causes.
Factory accidents show the lowest proportion of fatalities, but those resulting in permanent partial disability are very high proportionately. This is explained by the presence of machinery to the greatest extent here, the majority of cases resulting in permanent disability—through loss of, or loss of the use of, part of a limb—being incurred while handling machinery.
In the case of Public Works accidents, the percentage of cases of temporary disability is lowest, and the average duration highest. The majority of accidents are not of a very serious nature.
By the 31st January of the calendar year following that in connection with which factory accidents under investigation occurred, there must always necessarily be a number of employees injured during the previous calendar year who have not yet returned to work. In order to render the statistics of time lost and compensation paid as complete as possible supplementary reports on such outstanding cases are prepared by Inspectors of Factories for the Census and Statistics Office in June of the year following that in which the accidents occurred. By June most outstanding cases can be cleared up, although there remains a not altogether inconsiderable residuum of cases where employees fail to return to their former work — especially through having taken up other employment or through the seasonal closing down of the industry (e.g., freezing) in connection with which the accident occurred, so that they cannot be traced. The cases still outstanding at the end of January must naturally be the severer cases, and, as the severest cases of all are still outstanding in June, the toll of time lost as a result of factory accidents must be slightly underestimated in the statistics. The June clearing-up accounts for a few minor discrepancies existing between the statistics of factory accidents published in this volume and those published in the Annual Report of the Department of Labour.
The mere number of industrial accidents per 100,000 man-hours worked is not a measure of hazard, for it takes no account of the severity of accidents. In the electric-lighting industry accidents are few, but those which do occur are apt to prove fatal. In the meat-freezing industry, on the other hand, accidents are frequent, but few of them are very severe. A single death usually inflicts a greater economic loss upon the victim's family or upon the community than does a large number of minor temporary disabilities. Yet both types of accident count for one, and for one only, in statistics of accidents and of accident rates. A misleading picture is therefore liable to be painted so long as attention is focussed solely on frequency rates.
What is required, then, is some common denominator in terms of which can be expressed the total volume of accidental injuries per unit of exposure—a single expression which is capable of combining the number with the severity of industrial accidents. The only satisfactory measure of severity for this purpose would appear to be time lost; the physical or physiological results patently cannot be expressed in terms of a common denominator, nor can the cost in terms of human suffering be estimated in standard units. Obviously again, compensation paid is not a very satisfactory measure of the economic cost of industrial accidents; for (probably mainly as a precaution against malingering) no system gives full compensation for the worker's immediate economic loss; moreover, systems of compensation have frequently been varied from time to time within a country, while they almost invariably differ at the same time as between different countries, with the result that comparisons of severity-rates computed on this basis are liable to prove an unsafe guide not only in the case of time comparisons within a country, but also in the case of simultaneous international comparisons. Likewise, wages lost would not prove a satisfactory index of the severity of different occupational hazards, since wages vary appreciably from occupation to occupation, as well as from time to time, from district to district, and according to the age and sex and experience of the worker.
Time lost is, on the other hand, a fairly definite and stable conception. It relates definitely to the physiological results of the accident; perhaps rather less definitely to the psychic and nervous effects of such an accident, which sometimes are far from being negligible. Calendar days lost are probably a better measure of severity than working-days lost, the former being an identical unit for all industries, the latter varying considerably: thus tramwaymen work usually 13 days per fortnight, miners only 11 days. In each industry the average time lost on account of temporary disability is assumed to be identical, where no data are available on this point, with that lost in the case of accidents occurring in that industry for which the time lost is available. As pointed out previously, the effect of this expedient is probably somewhat to understate the real toll in time lost of factory accidents. So far it has not been found practicable to allow for temporary partial disability in cases where the victim of an industrial accident returns to duty after a period of total temporary disability, but for a space is able to perform only light work. Steps are now, however, being taken which it is hoped will permit of such allowance being made in the future.
When time lost is, however, adopted as a measure of the severity of accidents the problem of dealing with cases of death and of permanent disability presents some initial difficulty. Death clearly entails total cessation of labour-power; so that the time lost is manifestly identical with the working-life expectancy of the individual concerned—a period which is less than the total life expectancy of the individual under consideration by the interval, if any, between the date at which voluntary or enforced retirement from gainful employment would have taken place and the date at which death would have ensued subsequent to that retirement but for the injuries which resulted in his premature demise. While it is recognized that significant differences exist in the average ages of workmen in different industries, and in different occupations within the same industry, and while it cannot be gainsaid that more labour power is on the average lost by the death of a worker aged 20 than by that of a worker aged 50, yet it would seem that the age of the individual killed is not particularly relevant to the character of the hazard from which the injury has resulted. If severity weights in the case of death were made to vary with the ages of the persons injured the resultant severity rates would be distorted by purely fortuitous age-variations amongst the victims of industrial accidents. Accordingly, as a measure of severity rates, it has been assumed that deaths of workers through industrial accidents result in New Zealand in a loss of 60,000 working-hours in each case, a round figure which is arrived at (deeming a normal working year to comprise 50 weeks of 44 hours each) on the basis of the average expectation of working-life (which is assumed not in any case to extend beyond 65)—as ascertained from the New Zealand life tables—of a male worker meeting with an accident at the average age at which accidents to male workers occur in New Zealand factories. For the inherent interest attaching, however, to data as to the potential working-hours lost by individuals meeting with death, &c., through industrial accidents, similar statistics have also been compiled taking into account the actual age and sex at the date of the accident of the persons injured. again assuming a normal working-year to be one of 2,200 hours; or 50 weeks of 44 hours each. For this purpose separate tables for males and females have been compiled in the Census and Statistics Office, showing the average expectation of working-life—under the age of 65 for males and 60 for females—at each year of life). It is interesting to note that this figure of 60,000 working-hours on the basis of an eight-hour day gives an identical figure to that arrived at independently by the Swedish authorities—viz., 7,500 working-days.
In the case of injuries resulting in permanent total incapacity the same device would be adopted as in the case of death. Permanent total disability usually imposes a greater economic burden upon the victim's family and upon the community than does a death: though, on the other hand, a person who technically is permanently and totally incapacitated may sometimes still be capable of performing, on however small a scale, services which reduce the total family expenditure. The question is, however, one of measuring industrial hazard rather than economic loss; and it seems on the whole expedient to treat fatalities and permanent total disabilities in an identical manner.
In a large number of countries, including New Zealand, compensation scales in the case of permanent partial disability are based mainly on the loss or disability of specific bodily members rather than on the actual impairment of earnings. The latter, but not the former, will clearly differ according to the industry to which the person sustaining the injury is attached: such differences are nevertheless not, significant from the standpoint of accident severity or industrial hazard. The scales for assessing compensation for permanent partial disabilities differ, moreover, from country to country. It is therefore essential, lest international comparisons be vitiated, to adopt a standard system for dealing with such disabilities from the standpoint of measuring industrial hazards. This takes the form of assessing time lost on account of permanent partial disability on the basis of a proportional part of the time lost in connection with injuries resulting in death, the proportion being fixed according to an estimate of the average degree of physical disability resulting from the particular bodily impairment involved. The international scheme (slightly amended) is as follows: Loss, or loss of use of, both eyes, 100 per cent.; dismemberment or loss of use of leg from above knee, or arm from above elbow, 75 per cent.; dismemberment or loss of use of arm from at or below elbow, 60 per cent.; dismemberment or loss of use of hand, 50 per cent.; dismemberment or loss of use of leg from at or below knee, 50 per cent.; loss of hearing of both ears, 50 per cent.: dismemberment or loss of use of foot, 40 per cent.; permanent disability of thumb and four fingers, 40 per cent.; permanent disability of thumb and three fingers, 33 1/31 per cent.; loss of sight of one eye, 30 per cent.; permanent disability of four fingers, 30 per cent.; permanent disability of thumb and two fingers, 25 per cent.; permanent disability of thumb and one finger, 20 per cent.; permanent disability of three fingers, 20 per cent.; permanent disability of two fingers, 12 ½ per cent.; permanent disability of thumb, 10 per cent.; loss of hearing of one ear, 10 per cent.; permanent disability of great toe, 5 per cent.; permanent disability of any two or more toes, 5 per cent.; permanent disability of one finger, 5 per cent. The figures for time lost so arrived at in cases of permanent partial disability have been used as a measure of accident severity, without the addition of the time actually lost by the patient. Thus such cases will be permanently accounted for, as regards severity, in connection with the statistics for the year of their occurrence. In this way a common basis is arrived at for accident experience, duly weighted according to severity, thus rendering possible rigorous comparison from country to country, from year to year, from industry to industry, and from establishment to establishment.
Detailed results in respect of industrial accidents (other than scaffolding) during 1925 are appended:—
| INDUSTRIAL ACCIDENTS, 1925.—EXTENT OF DISABILITY AND SEVERITY RATES, BY INDUSTRIES. | ||||||||
|---|---|---|---|---|---|---|---|---|
| Industry. | Total discs of Accidents resulting In— | Toll of Calendar Days lost per Accident. | Toll of Hours lost per 100,000 Man-hours worked. | |||||
| Temporary Disability. | Permanent Partial Disability. | Fatality. | Total. | Where Fixed Allowance is made in case of Fatality or Permanent Disability. | Where Age is taken into account in case of Fatality or Permanent Disability. | Where Fixed Allowance is made in case of Fatality or Permanent Disability. | Where Age is taken into account in case of Fatality or Permanent Disability. | |
* Six months only. | ||||||||
| Food, drink, and tobacco— | ||||||||
| Baking | 3 | .. | .. | 3 | 413 | 41.3 | 13 | 13 |
| Flour-milling | 4 | .. | .. | 4 | 29.0 | 29.0 | 73 | 73 |
| Biscuitmaking | 72 | 4 | .. | 76 | 114.7 | 102.0 | 945 | 840 |
| Brewing, aerated waters | 16 | 2 | .. | 18 | 285.7 | 387.5 | 874 | 1,185 |
| Butchering | 10 | 4 | .. | 14 | 318.9 | 472.8 | 702 | 1,040 |
| Meat freezing and preserving | 1037 | 13 | .. | 1050 | 29.6 | 27.2 | 2,329 | 2,139 |
| Butter and cheese making | 22 | 6 | 1 | 29 | 706.3 | 835.2 | 1,570 | 1,857 |
| Other | 46 | 1 | .. | 47 | 47.4 | 39.8 | 304 | 256 |
| Totals | 1,210 | 30 | 1 | 1,241 | 58.3 | 61.5 | 1,091 | 1,150 |
| Clothing, boots, &c.— | ||||||||
| Dressmaking, tailoring, &c. | 5 | .. | .. | 5 | 16.4 | 16.4 | 2 | 2 |
| Bootmaking and repairing | 21 | 1 | .. | 22 | 91.0 | 114.6 | 185 | 233 |
| Other | 7 | 1 | .. | 8 | 77.4 | 101.8 | 95 | 125 |
| Totals | 33 | 2 | .. | 35 | 77.2 | 97.7 | 47 | 60 |
| Textiles and weaving— | ||||||||
| Woollen-mills | 29 | 5 | .. | 34 | 252.3 | 295.8 | 963 | 1,129 |
| Flax-mills | 10 | 2 | .. | 12 | 494.9 | 503.5 | 2,489 | 2,532 |
| Rope and twine works | 4 | .. | .. | 4 | 18.5 | 18.5 | 93 | 93 |
| Other | 4 | .. | .. | 4 | 13.0 | 13.0 | 65 | 65 |
| Totals | 47 | 7 | .. | 54 | 271.1 | 300.5 | 1,154 | 1,275 |
| Public works— | ||||||||
| Railway-construction | 381 | 5 | 4 | 390 | 164.4 | 163.6 | 5,301 | 5,276 |
| Road-construction | 78 | 4 | 1 | 83 | 213.8 | 143.7 | 2,935 | 1,973 |
| Hydro-electric works | 123 | 4 | 1 | 128 | 1370 | 125.3 | 4,207 | 4,033 |
| Public buildings | 6 | .. | .. | 6 | 40.8 | 40.8 | 171 | 171 |
| Other | 65 | 2 | .. | 67 | 114.7 | 115.7 | 2,542 | 2,564 |
| Totals | 653 | 15 | 6 | 674 | 158.0 | 148.0 | 4,009 | 3,755 |
| Other construction— | ||||||||
| Joinery | 55 | 9 | .. | 64 | 122.8 | 132.3 | 1,372 | 1,479 |
| Building | 12 | .. | 12 | 22.9 | 22.9 | 34 | 34 | |
| Plumbing | 9 | 1 | 10 | 81.6 | 108.3 | 117 | 155 | |
| Totals | 76 | 10 | 86 | 104.1 | 114.3 | 429 | 471 | |
| Wood-manufacture— | ||||||||
| Sawmilling | 164 | 18 | 1 | 183 | 215.3 | 178.1 | 2,272 | 1,880 |
| Coachbuilding | 18 | .. | 18 | 14.7 | 14.7 | 40 | 40 | |
| Furniture-making | 61 | 12 | 73 | 228.6 | 238.9 | 1,778 | 1,858 | |
| Boatbuilding | 1 | .. | 1 | 7.0 | 7.0 | 5 | 5 | |
| Other | 17 | 6 | 23 | 347.4 | 499.8 | 3,864 | 5,559 | |
| Totals | 261 | 36 | 1 | 298 | 215.9 | 207.4 | 1,759 | 1,689 |
| Paper-manufacture and printing— | ||||||||
| Paper-manufacture | 9 | 1 | .. | 10 | 214.0 | 252.7 | 3,363 | 3,971 |
| Printing— | ||||||||
| Government | 8 | .. | .. | 8 | 13.3 | 13.3 | 61 | 61 |
| Other than Government | 52 | 5 | .. | 57 | 178.6 | 239.1 | 666 | 892 |
| Other | 11 | 3 | .. | 14 | 121.9 | 142.2 | 5,365 | 6,258 |
| Totals | 80 | 9 | .. | 89 | 158.8 | 205.1 | 779 | 1,006 |
| Metal-working and engineering— | ||||||||
| Foundries | 85 | 6 | .. | 91 | 67.2 | 71.3 | 754 | 799 |
| Engineering— | ||||||||
| General | 130 | 10 | 1 | 141 | 186.6 | 236.8 | 1,575 | 1,999 |
| Electrical | 8 | 2 | .. | 10 | 445.9 | 480.0 | 667 | 718 |
| Cycle and motor | 42 | 1 | .. | 43 | 46.8 | 60.7 | 151 | 195 |
| Other | 85 | 5 | .. | 90 | 100.6 | 122.7 | 1,539 | 1,876 |
| Totals | 350 | 24 | 1 | 375 | 127.9 | 155.5 | 945 | 1,149 |
| Other manufactures— | ||||||||
| Brickmaking | 78 | 4 | 1 | 83 | 195.2 | 202.3 | 1,726 | 1,789 |
| Gas-manufacture | 15 | 3 | 1 | 19 | 717.2 | 527.2 | . 2,954 | 2,171 |
| Electric lighting | 2 | 1 | .. | 3 | 2,394.0 | 2,124.7 | 7,524 | 6.678 |
| Leather-working | 12 | 3 | .. | 15 | 113.5 | 147.5 | 165 | 214 |
| Soap and starch works | 12 | .. | .. | 12 | 23.3 | 23.3 | 88 | 88 |
| Jewellery | .. | .. | .. | .. | .. | .. | .. | .. |
| Chemical and manure works | 53 | 1 | .. | 54 | 32.9 | 24.0 | 531 | 388 |
| Other | 20 | 2 | 1 | 23 | 660.1 | 639.3 | 1,565 | 1,515 |
| Totals | 192 | 14 | 3 | 209 | 267.7 | 247.3 | 1,288 | 1,190 |
| Transport and communication— | ||||||||
| Railways*— | ||||||||
| Permanent-way employees | 172 | 3 | 3 | 178 | 189.7 | 121.7 | 6,846 | 4,392 |
| Locomotive workshop employees | 229 | 5 | .. | 234 | 39.7 | 41.3 | 1,539 | 1,600 |
| Maintenance workshop employees | 35 | 1.. | 36 | 50.4 | 48.2 | 877 | 839 | |
| Engine-drivers and firemen | 44 | 2 | .. | 46 | 225.2 | 229.4 | 3,618 | 3,685 |
| Transport, &c.—continued, | ||||||||
| Railways* | ||||||||
| Other locomotive employees | 38 | 2 | .. | 40 | 39.4 | 42.4 | 762 | 820 |
| Guards | 15 | .. | .. | 15 | 23.6 | 23.6 | 371 | 371 |
| Shunters | 49 | 1 | 2 | 52 | 478.4 | 458.7 | 39,091 | 37,482 |
| Signalmen, storemen, &c. | 153 | 1 | 2 | 156 | 150.6 | 176.2 | 4,688 | 5,486 |
| Totals | 735 | 15 | 7 | 757 | 139.4 | 128.2 | 4,294 | 3,947 |
| Postal employees— | ||||||||
| Clerical officers | 5 | .. | .. | 5 | 7.2 | 7.2 | 4 | 4 |
| Tradesmen | 19 | .. | .. | 19 | 11.2 | 11.2 | 111 | 111 |
| Storemen | 2 | .. | .. | 2 | 15.5 | 15.5 | 115 | 115 |
| Telegram-sorters, &c. | ||||||||
| Exchange clerks, attendants | 3 | .. | .. | 3 | 36.7 | 36.7 | 25 | 25 |
| Overseers, foremen, &c. | 30 | .. | .. | 30 | 29.0 | 29.0 | 420 | 420 |
| Linesmen, labourers | 164 | 4 | .. | 168 | 69.5 | 69.7 | 1,385 | 1,389 |
| Chauffeurs | 9 | .. | .. | 9 | 9.2 | 9.2 | 186 | 186 |
| Postmen | 12 | .. | .. | 12 | 11.3 | 11.3 | 57 | 57 |
| Messengers | 3 | .. | .. | 3 | 28.0 | 28.0 | 85 | 85 |
| Message boys and girls | 20 | .. | .. | 20 | 19.5 | 19.5 | 122 | 122 |
| Totals | 267 | 4 | .. | 271 | 50.3 | 50.4 | 416 | 417 |
| Tram-car construction and repair— | ||||||||
| Tram-car construction and repair | 9 | .. | .. | 9 | 11.0 | 11.0 | 311 | 311 |
| Personal service— | ||||||||
| Laundry-work | 6 | 3 | .. | 9 | 9671 | 1,252.1 | 1,954 | 2,530 |
| Miscellaneous— | ||||||||
| Miscellaneous minor industries | 23 | 1 | .. | 24 | 100.3 | 85.2 | 336 | 286 |
| Summary. | ||||||||
| Factory accidents | 2237 | 136 | 6 | 2429 | 120.3 | 127.3 | 918 | 971 |
| Railway accidents* | 735 | 15 | 7 | 757 | 139.4 | 128.2 | 4,294 | 3,947 |
| Public Works accidents | 653 | 15 | 6 | 674 | 158.0 | 148.0 | 4,009 | 3,755 |
| Post Office accidents | 267 | 4 | .. | 271 | 50.3 | 50.4 | 416 | 417 |
| Grand totals | 3,942 | 170 | 194 | 4,131 | 125.4 | 125.8 | 1,460 | 1,444 |
The greatest number of average days lost—considering groups first—is found in the “personal service” group. One very serious accident in a laundry puts this group in this position, although in 1924 it recorded the lowest average number of days lost. Then follows the “textiles and weaving” and “other manufactures” groups. Two new groups “tram-car construction” and “postal services” come at the foot of the list in this respect, the next lowest being that dealing with the manufacture of food and drink. Of the subgroups, workers connected with electric-power-generating and repair have suffered most heavily. There were but 3 accidents, but 1 resulted in such severe incapacity that it was regarded as involving a 75-per-cent. disability. In the case of laundry-workers, who conic next highest, permanent disability seldom results, but is usually very severe when it does occur. Conspicuously low is the number of days lost in the subgroup “chauffeurs” in the Post and Telegraph Department's employ, the average number being only 9.
As to severity rates two new groups, “Public Works accidents” and “Railway accidents” take the greatest toll. Of factory accidents, data concerning which were also supplied for 1924, the “personal service” group shows the greatest number of hours lost. The “clothing” group, in which there were few accidents and only 2 cases of minor permanent partial disability, has the lowest number of hours lost. Apart from the subgroups “telegram-sorters, &c.” and “jewellery workers,” for which not a single accident was recorded, this group also contains the lowest subgroup—“dressmaking”—with “boat-building” in close proximity. By far the highest subgroup is that of “shunting” in the Railways group. There were comparatively few accidents, taking actual numbers, but of these 2 were fatal, and 1 case resulted in a 50-per-cent. disability. Of factory accidents, 3 of the 14 accidents in the “other” subgroup of the “printing” group were serious. This, combined with the fact that there are only a small number of employees, gives it precedence as to the greatest number of man-hours lost. In the “Public Works” group, the 4 fatal accidents in the “railway-construction” subgroup account for the showing of 5,301 hours lost.
In interpreting the figures, and making a comparison from year to year, it must be remembered that the adventitious element—as to the number of fatal and severe accidents in any individual year or group—has a great influence in assessing severity rates andcalendar days lost.
An analysis of machinery accidents occurring in factories during 1925 shows that 21 per cent. of the total occurring on week-days took place on Mondays, 21 per cent. on Tuesdays, 16 per cent. on Wednesdays, 17 per cent. on Thursdays, 19 per cent. on Fridays, and only 6 per cent. on Saturdays.
There is £no evidence in the New Zealand figures of the existence of a seasonal cycle in the frequency of factory accidents.
The effects of fatigue are brought out by a tabulation of industrial accidents according to the hours of occurrence. The following table omits railway and scaffolding accidents.
| INDUSTRIAL ACCIDENTS, 1925.—ACCORDING TO CAUSE AND HOUR OF OCCURRENCE. | |||||||||
|---|---|---|---|---|---|---|---|---|---|
| Time of Occurrence to nearest Hour. | Machinery Accidents. | Falls of Persons. | Handling Objects. | Hand Tools. | Other. | Totals. | |||
| Adjusting Machine, Tool, or Work. | Starting, Stopping, and Operating. | Other. | Totals. | ||||||
| 8 a.m. | 4 | 3 | 10 | 17 | 18 | 18 | 23 | 27 | 103 |
| 9 a.m. | 7 | 38 | 20 | 65 | 33 | 76 | 74 | 66 | 314 |
| 10 a.m. | 5 | 57 | 27 | 89 | 46 | 122 | 80 | 102 | 439 |
| 11 a.m. | 7 | 51 | 37 | 95 | 58 | 155 | 88 | 95 | 491 |
| 12 noon | 1 | 25 | 19 | 45 | 23 | 72 | 55 | 52 | 247 |
| 1 p.m. | 2 | 12 | 7 | 21 | 8 | 15 | 18 | 24 | 86 |
| 2 p.m. | 4 | 29 | 10 | 43 | 34 | 75 | 63 | 49 | 264 |
| 3 p.m. | 6 | 51 | 32 | 89 | 56 | 129 | 94 | 74 | 442 |
| 4 p.m. | 6 | 52 | 23 | 81 | 50 | 89 | 78 | 71 | 369 |
| 5 p.m. | 4 | 13 | 10 | 27 | 30 | 64 | 37 | 78 | 236 |
| Other hours | 1 | 8 | 9 | 18 | 19 | 32 | 12 | 39 | 120 |
| Not stated | .. | 7 | 12 | 19 | 41 | 78 | 48 | 77 | 263 |
| Totals | 47 | 346 | 216 | 609 | 416 | 925 | 670 | 754 | 3,374 |
This table shows the latter part of the morning—11 a.m. to the nearest hour—as being the time when most accidents occur, but it is apparent that the Saturday half-holiday reduces materially the number of accidents occurring in the late afternoon, and this should be considered in its interpretation. Finally, most establishments are idle between noon and 1 p.m. When these facts are allowed for, it would appear that for most classes of accidents there is a tendency for the risk to increase (in sympathy with increasing fatigue) with each additional hour of the working half-day, the midday and the night-time rest eliminating the cumulated effects of such fatigue. In the case of some causes of accidents, the increased risk with the number of hours continuously worked is much greater than in other cases: the increase, as the working half-day progresses, in the number of accidents caused by falls of persons in particular is exceptionally marked.
Railway accidents were dealt with similarly—but a more definite indication is given by considering the length of time the employee had worked of his shift when the accident occurred. This shows that after three hours on duty there is the greatest tendency for accidents to occur—116 out of 757 reported—a sharp decrease in the next two groups (over four and over five hours respectively) being due to the necessary break for meals; again, the strain increases after six hours on duty. Almost as many accidents occurred after seven hours duty—111—as after three.
The average ages of workers meeting with accidents where the age was reported were as follows:—
| Males. Years. | Females. Years. | Total. Years | |
|---|---|---|---|
| Factories | 32.05 | 20.53 | 31.52 |
| Public Works | 37.34 | .. | 37.34 |
| Post Office | 29.76 | 32.50 | 29.80 |
| Railways | 35.09 | 18.00 | 35.09 |
| All reported accidents | 33.17 | 20.94 | 32.82 |
The average age of males injured in industrial accidents is just slightly less than the average age of male wage-earners as returned at the 1921 census—viz., 34.0. In the case of females, however, the census average age for all wage earners (27.0 years) is substantially higher than the average for those injured; and it would appear that women employees in factories are, in general, younger than those engaged in other forms of employment. The very much younger ages for females than for males is accounted for by the fact that males normally spend the whole of their working-lives in factories, &c., while for the majority of women employees remunerated employment is terminated at a comparatively early age by marriage.
Table of Contents
THE Public Trust Office is designed mainly to afford, at low rates of commission, a secure and convenient recourse in every case where a person residing either in New Zealand or abroad, and desiring to draw a will, form a trust, or appoint an agent or attorney in the Dominion, may be in doubt or difficulty as to the choice of a trustee, executor, agent, or attorney. The Office aims also to relieve those who for various reasons may be unable or unwilling to commence or continue the administration of trust property to which they may have been appointed.
Operations were commenced in 1873, at the end of which year 257 estates, of a total value of £17,500, were being administered by the Office. By the 31st March, 1920, the number of estates had risen to 14,679, and the value of estates and funds to £20,860,686. The transfer of Native accounts to the Native Trust Office and the completion of the administration of deceased soldiers' estates led to a fall (to 10,175) in the number of estates at the 31st March, 1921, but in spite of this the value of estates and funds had increased to £22,364,319 at that date. Since then there has been a progressive increase in both number and value of estates administered, the records at 31st March, 1926, showing 13,087 estates of a value of £38,009,480.
The following table shows the growth of the Public Trust Office during the last ten years:—
| Year ended 31st March. | Total Value of Estates in Office, including Unrealized Assets. | Funds at Credit of Estates and Accounts. | Interest credited to Estates. | Bonus granted to Estates. | Gross Income. | Office Reserves. |
|---|---|---|---|---|---|---|
| £ | £ | £ | £ | £ | £ | |
| 1917 | 15,065,583 | 8,058,886 | 287,818 | 27,000 | 129,008 | 295,234 |
| 1918 | 17,153,031 | 9,004,057 | 317,633 | 30,000 | 162,614 | 345,871 |
| 1919 | 19,242,347 | 10,065,027 | 352,783 | 33,100 | 194,452 | 393,377 |
| 1920 | 20,360,686 | 11,911,290 | 420,526 | 38,000 | 240,469 | 418,640 |
| 1921 | 22,364,319 | 13,918,906 | 537,890 | .. | 244,090 | 437,414 |
| 1922 | 25,497,779 | 15,329,125 | 556,587 | .. | 220,794 | 451,585 |
| 1923 | 28,904,798 | 17,466,787 | 642,447 | .. | 246,692 | 491,775 |
| 1924 | 32,404,724 | 19,215,388 | 691,768 | .. | 257,623 | 541,473 |
| 1925 | 35,570,642 | 20,864,356 | 729,666 | .. | 299,439 | 605,274 |
| 1926 | 38,009,480 | 24,426,009 | 832,721 | .. | 282,386 | 621,948 |
New estates which came into the Office during the year ended 31st March, 1926, numbered 3,353, and represented a value of £4,651,447. The classification of these and of the estates under administration at 31st March, 1926, is as follows:—
| — | New Estates during 1925–26. | Estates under Administration at 31st March, 1926. | ||
|---|---|---|---|---|
| Number. | Value. | Number. | Value. | |
| £ | £ | |||
| Wills estates | 923 | 2,102,811 | 2,972 | 8,663,960 |
| Trust estates | 255 | 636,905 | 2,000 | 6,110,145 |
| Intestate estates | 625 | 429,352 | 2,134 | 1,468,542 |
| Mental patients' estates | 346 | 406,444 | 1,233 | 1,425,557 |
| Miscellaneous estates | 1,204 | 985,935 | 4,748 | 20,341,276 |
| Totals | 3,353 | 4,651,447 | 13,087 | 38,009,480 |
The capital funds of the Public Trust Office invested on the 31st March, 1926, amounted to £24,316,6.37, made up as follows:—
| £ | |
|---|---|
| Government securities | 1,654,592 |
| Local bodies' debentures | 7,414,066 |
| Land Settlement Finance Act debentures | 45,606 |
| Other debentures and shares | 10,789 |
| Mortgages | 14,823,270 |
| Properties acquired by foreclosure (less reserve) | 28,587 |
| Savings-bank accounts | 374 |
| Overdrafts by way of advances to estates and beneficiaries | 332,695 |
| Advances for protection of securities acquired or in possession | 6,658 |
| Total | £24,316,637 |
The gross income during the financial year 1925–26 was £282,386, this representing a decrease of £17,053 as compared with the previous year. This decrease is more than accounted for by substantial concessions made during the year by way of reduced charges on the one hand and increased rates of interest on the other.
The working expenses during 1925–26 were £219,993, and depreciation on office premises, &c., accounted for £14,909, leaving a net profit of £47,484. The net profits of the Office during each of the last ten years are shown below:—
| Year ended 31st March. | Net Profits. £ |
|---|---|
| 1917 | 58,862 |
| 1918 | 68,602 |
| 1919 | 70,156 |
| 1920 | 78,246 |
| 1921 | 10,691 |
| 1922 | 11,053 |
| 1923 | 58,700 |
| 1924 | 65,542 |
| 1925 | 90,522 |
| 1926 | 47,484 |
A variety of causes contributed to the phenomenal fall in 1920–21 and 1921–22, the main factors being the granting of increased benefits to beneficiaries and the necessary provision for the cost-of-living bonus to members of the staff.
The Office reserves, which have been built up out of the profits made by the Office in successive years, amounted on the 31st March, 1926, to the considerable sum of £621,948. They consist of—
| £ | |
|---|---|
| Assurance and Reserve Fund | 427,346 |
| Investment fluctuation | 120,278 |
| Reserve for protection of mortgage securities and provision against possible loss in realization | 63,660 |
| General Legal Expenses Account | 10,664 |
| Total | £621,948 |
An outstanding feature of the work of the Office at the present time is the rapid increase in the number of wills deposited, which affords convincing evidence of the growing confidence on the part of testators in the appointment of the Public Trustee as executor and trustee of their estates. The number of wills on deposit at the 31st March, 1914, was 6,427; by 1920 it had increased to 25,792; while at 31st March, 1926, it had risen to 48,957.
During the year ended 31st March, 1926, 5,807 wills were deposited with the Public Trustee, and 952 were withdrawn on account of the death of the testator or for other reasons, the net increase for the year being 4,855.
During the year ended the 31st December, 1925, 621 joint-stock companies were registered, with a total nominal capital of £14,760,398, including 494 private companies, with a nominal capital of £3,223,154, and 17 overseas companies with an aggregate of £7,066,694. In addition to the total of 621 there were 3 companies limited by guarantee.
In the following table companies registered in 1925 are classified according to the amount of their nominal capital. The greatest number of private companies occurred in the £1,000–£2,000 group, while public companies were most frequent in the £20,000–£50,000 class. It is of interest to note that 81 per cent. of private concerns were registered with capitals of less than £10,000, while companies of larger denominations, although representing but 19 per cent. of the total in point of numbers, claimed 59 per cent. of the aggregate capital. Sixty-one per cent. of the public companies had nominal capitals of £10,000 or over, the aggregate capital of these amounting to 99 per cent. of the total. Nine of the 17 overseas companies had a nominal capital of over £50,000, while all but three were over the £10,000 mark.
| COMPANIES REGISTERED, BY GLASS AND BY AMOUNT OF NOMINAL CAPITAL, 1925. | ||||||
|---|---|---|---|---|---|---|
| Amount. | Private Companies. | Public Companies. | Foreign Companies. | |||
| Number. | Aggregate Nominal Capital. | Number. | Aggregate Nominal Capital. | Number. | Aggregate Nominal Capital. | |
| £ | £ | £ | ||||
| Under £1,000 | 60 | 26,896 | 2 | 1,000 | .. | .. |
| £1,000 and under £2,000 | 95 | 113,633 | 3 | 3,200 | .. | .. |
| £2,000 ,, £3,000 | 68 | 147,511 | 5 | 10,100 | 1 | 2,000 |
| £3,000 ,, £4,000 | 44 | 138,275 | 7 | 21,000 | .. | .. |
| £4,000 ,, £5,000 | 36 | 150,048 | 3 | 12,000 | .. | .. |
| £5,000 ,, £6,000 | 47 | 237,000 | 11 | 55,500 | 2 | 10,000 |
| £6,000 ,, £7,000 | 20 | 123,385 | 3 | 18,000 | .. | .. |
| £7,000 ,, £8,000 | 9 | 64,746 | 2 | 14,500 | .. | .. |
| £8,000 ,, £9,000 | 11 | 88,000 | 2 | 16,000 | .. | .. |
| £9,000 ,, £10,000 | 8 | 72,500 | .. | .. | .. | .. |
| £10,000 ,, £15,000 | 39 | 418,500 | 17 | 183,000 | .. | .. |
| £15,000 ,, £20,000 | 15 | 239,050 | 7 | 114,250 | 2 | 34,818 |
| £20,000 ,, £50,000 | 36 | 903,000 | 26 | 667,000 | 3 | 65,000 |
| £50,000 and over | 6 | 500,610 | 22 | 3,355,000 | 9 | 6,954,876 |
| Totals | 494 | 3,223,154 | 110 | 4,470,550 | 17 | 7,066,694 |
The next table gives figures of total registrations during each of the last three years, classified according to amount of nominal capital.
| COMPANIES REGISTERED BY AMOUNT OF NOMINAL CAPITAL, 1923 TO 1925. | ||||||
|---|---|---|---|---|---|---|
| Amount. | 1923. | 1924. | 1925. | |||
| Number. | Aggregate Nominal Capital. | Number. | Aggregate Nominal Capital. | Number. | Aggregate Nominal Capital. | |
| £ | £ | £ | ||||
| Under £1,000 | 40 | 15,299 | 55 | 24,389 | 62 | 27,896 |
| £1,000 and under £2,000 | 68 | 82,715 | 73 | 89,476 | 98 | 116,833 |
| £2,000 ,, £3,000 | 71 | 152,750 | 72 | 155,695 | 74 | 159,611 |
| £3,000 ,, £4,000 | 44 | 136,875 | 49 | 154,250 | 51 | 159,275 |
| £4,000 ,, £5,000 | 31 | 129,611 | 39 | 160,700 | 39 | 162,048 |
| £5,000 ,, £6,000 | 45 | 225,904 | 55 | 277,200 | 60 | 302,500 |
| £6,000 ,, £7,000 | 23 | 140,281 | 29 | 175,700 | 23 | 141,385 |
| £7,000 ,, £8,000 | 14 | 101,750 | 20 | 146,450 | 11 | 79,246 |
| £8,000 ,, £9,000 | 4 | 32,000 | 12 | 96,500 | 13 | 104,000 |
| £9,000 ,, £10,000 | 9 | 82,250 | 4 | 36,280 | 8 | 72,500 |
| £10,000 ,, £15,000 | 65 | 686,650 | 61 | 646,400 | 56 | 601,500 |
| £15,000 ,, £20,000 | 14 | 218,500 | 24 | 382,600 | 24 | 388,118 |
| £20,000 ,, £50,000 | 47 | 1,209,500 | 46 | 1,197,500 | 65 | 1,635,000 |
| £50,000 and over | 27 | 9,792,000 | 26 | 17,824,170 | 37 | 10,810,486 |
| Totals | 502 | 13,006,085 | 565 | 21,367,310 | 621 | 14,760,398 |
With the exception of the year 1924, when the huge aggregate of £17,824,170 nominal capital was shown for the 26 companies in the “£50,000 and over” class, the aggregate nominal capital of companies registered in 1925 constitutes a record. The number of registrations is even higher than in 1924, which previously held the record in this respect.
In comparing one year with another, as in the following table, it should not be overlooked that re-registrations on account of reconstruction of companies or for other reasons are included. Such re-registrations may have a considerable effect on the year's total, when a large company is concerned.
| COMPANIES REGISTERED, 1906–25. | ||
|---|---|---|
| Year. | Number. | Aggregate Nominal Capital. |
| £ | ||
| 1906 | 263 | 5,175,515 |
| 1907 | 290 | 6,405,295 |
| 1908 | 283 | 4,364,952 |
| 1909 | 290 | 3,224,656 |
| 1910 | 283 | 2,663,968 |
| 1911 | 327 | 3,673,759 |
| 1912 | 316 | 3,591,362 |
| 1913 | 282 | 6,658,722 |
| 1914 | 226 | 4,987,526 |
| 1915 | 304 | 4,431,830 |
| 1916 | 258 | 4,072,803 |
| 1917 | 261 | 5,367,201 |
| 1918 | 200 | 3,055,351 |
| 1919 | 328 | 5,942,605 |
| 1920 | 501 | 9,563,933 |
| 1921 | 337 | 3,498,208 |
| 1922 | 417 | 13,125,494 |
| 1923 | 502 | 13,006,085 |
| 1924 | 565 | 21,367,310 |
| 1925 | 621 | 14,760,398 |
There were 2,046 applications for letters patent during 1925; 1,105 were filed with provisional specifications, and 941 with complete specifications; while 282 complete specifications were lodged in respect of applications with which provisional specifications had been previously filed.
The total number of applications received up to the 31st December, 1925, was 55,617, and the patents in force in New Zealand at that date numbered 7,205. The number of patent agents on the register was 19.
In the following table are shown the countries of residence of persons who applied for patents in New Zealand during the last three years. Owing to applications being received from joint applicants resident in different countries, also from applicants giving two addresses, the figures total more than the actual number of applications received.
| APPLICATIONS FOR PATENTS IN NEW ZEALAND, 1923–25. | |||
|---|---|---|---|
| Country. | 1923. | 1924. | 1925. |
| New Zealand | 1,262 | 1,233 | 1,183 |
| Australia | 305 | 302 | 295 |
| United Kingdom | 287 | 285 | 279 |
| United States | 129 | 235 | 180 |
| France | 15 | 10 | 22 |
| Germany | 3 | 19 | 20 |
| Netherlands | 5 | 18 | 16 |
| Canada | 19 | 10 | 12 |
| Italy | 7 | 8 | 12 |
| Sweden | 13 | 2 | 10 |
| Denmark | 6 | 17 | 8 |
| Switzerland | 2 | 5 | 7 |
| Belgium | 6 | 8 | 4 |
| British South Africa | 6 | 3 | 4 |
| Norway | 2 | 1 | 3 |
| Japan | 1 | 1 | 3 |
| India | 1 | .. | 3 |
| Argentine | 3 | 3 | 2 |
| Austria | .. | 2 | 1 |
| Hungary | .. | .. | 1 |
| Kenya | .. | .. | 1 |
| Northern Nigeria | .. | .. | 1 |
| Czecho-Slovakia | 2 | 2 | .. |
| Hawaii | .. | 1 | .. |
| Cuba | .. | 1 | .. |
| Java | .. | 1 | .. |
| Federated Malay States | .. | 1 | .. |
| Finland | 1 | .. | .. |
| Russia | 1 | .. | .. |
The total number of applications during 1925 in respect of trade-marks was 1,332, and the fees received totalled £4,094.
Of the 1,332 applications, 510 were made by residents of New Zealand, 332 came from Great Britain, 114 from Australia, and 200 from the United States.
The number of applications for registration of designs totalled 203, as compared with 185 in 1924. Sixteen applications came from Australia, 45 from the United Kingdom, 10 from the United States, and the balance from New Zealand
The following table shows the number of applications for patents and for the registration of trade-marks and designs in 1890, 1900, 1910, 1915, and each of the last ten years:—
| Year. | Patents. | Trade-marks. | Designs. |
|---|---|---|---|
| 1890 | 616 | 160 | 5 |
| 1900 | 1,009 | 348 | 15 |
| 1910 | 1,831 | 818 | 46 |
| 1915 | 1,299 | 565 | 89 |
| 1916 | 1,261 | 666 | 113 |
| 1917 | 1,329 | 619 | 83 |
| 1918 | 1,386 | 695 | 53 |
| 1919 | 1,880 | 1,272 | 74 |
| 1920 | 2,193 | 1,391 | 109 |
| 1921 | 2,115 | 995 | 141 |
| 1922 | 2,183 | 1,103 | 214 |
| 1923 | 2,075 | 1,163 | 183 |
| 1924 | 2,085 | 1,338 | 185 |
| 1925 | 2,046 | 1,332 | 203 |
The Inspection of Machinery Act makes provision for the inspection of all steam boilers and digesters, of hydraulic, electric, and other lifts, and of any prime movers such as gas, oil, and air engines used to drive machinery on land, also of machinery used on vessels afloat that are not self-propelled.
It also provides for the issue of certificates to those who pass the prescribed examinations for land engineers and engine-drivers in charge of boilers and machinery, for winding-engine drivers for mining purposes, for drivers employed on locomotives working on railway-lines not under the control of the Government Working Railways Department, and for the drivers of traction-engines on roads. Certificates are also issued to electric-tram drivers as provided by the Tramways Amendment Act, 1910. The issue of these certificates is controlled by a Board of Examiners set up by the Act, the Chairman being the Chief Inspector of Machinery.
During the year ended 31st March, 1926, inspections of machinery to the number of 34,634 were carried out, as compared with 27,853 during the p£roceding twelve months. The class of machinery examined is shown by the following statement:—
| Class. | Number. |
|---|---|
| Hydraulic lifts | 119 |
| Electric lifts | 1,042 |
| Gas-lifts | 6 |
| Oil-lifts | 1 |
| Steam-lifts | 25 |
| Gas, hydraulic, and electric-motor hoists | 1,219 |
| Water-engines, peltons, turbines, and water-wheels | 451 |
| Oil-engines | 15,162 |
| Gas-engines | 849 |
| Electric motors | 15,739 |
| Miscellaneous | 21 |
| Total | 34,634 |
Electric motors were first shown separately in the returns in 1922–23, in which year the number examined was 8,013. The figure for 1925–26 (15,739) represents an increase of 7,726, or 96 per cent., in only three years.
Annual inspections of boilers during the year ended 31st March, 1926, numbered 7,895, as follows:—
| Class. | Not exceeding 5 Horse-power. | Exceeding 5 but not exceeding 10 Horse-power. | Exceeding 10 Horse-power. | Total. |
|---|---|---|---|---|
| Stationary | 3,222 | 689 | 2,293 | 6,204 |
| Portable | 216 | 1,025 | 450 | 1,691 |
| Totals | 3,438 | 1,714 | 2,743 | 7,895 |
In addition to the annual inspections of boilers, new boilers to the number of 342, and representing an aggregate of 3,426 horse-power, were inspected and tested before being used. Of these, 169, of a horse-power of 1,713, had been made in New Zealand, the others being imported.
During the year ended 31st March, 1926, 470 certificates were issued to land-engineers, engine-drivers, and electric-tram drivers, on their passing the necessary examinations. The certificates were classified as follows:—
| Service— | |
|---|---|
| First-class engine-driver | 3 |
| Second-class engine-driver | 1 |
| Locomotive- and traction-engine driver | 1 |
| Competency— | |
| First-class engine-driver | 27 |
| Second-class engine-driver | 215 |
| Steam-winding-engine driver | 4 |
| Locomotive- and traction-engine driver | 68 |
| Locomotive-engine driver | 9 |
| Traction-engine driver | 55 |
| Electric-tram driver | 87 |
| Total | 470 |
The number of labourers and artisans employed on public works during each month of the year ended the 31st March, 1926, was as follows:—
| EMPLOYEES ON PUBLIC WORKS. | ||||||
|---|---|---|---|---|---|---|
| Month. | Railways. | Roads. | Hydroelectric Works. | Public Buildings. | Other Works. | Total. |
| 1925-April | 3,198 | 1,687 | 1,009 | 455 | 1,020 | 7,369 |
| May | 3,289 | 1,792 | 1,001 | 473 | 1,207 | 7,762 |
| June | 3,208 | 1,652 | 1,035 | 456 | 1,244 | 7,595 |
| July | 3,188 | 1,688 | 1,022 | 457 | 1,333 | 7,688 |
| August | 3,537 | 1,586 | 1,196 | 351 | 515 | 7,185 |
| September | 3,432 | 1,485 | 1,239 | 389 | 498 | 7,043 |
| October | 3,465 | 1,455 | 1,171 | 324 | 457 | 6,872 |
| November | 3,531 | 1,620 | 1,149 | 334 | 470 | 7,104 |
| December | 3,014 | 1,659 | 1,112 | 336 | 413 | 6,534 |
| 1926—January | 3,086 | 1,598 | 1,020 | 359 | 381 | 6,444 |
| February | 3,113 | 1,540 | 1,237 | 245 | 499 | 6,634 |
| March | 3,056 | 1,650 | 1,277 | 301 | 451 | 6,735 |
| Averages | 3,260 | 1,618 | 1,122 | 373 | 707 | 7,080 |
The (monthly) average number of men employed in 1895, 1900, 1905, 1910, 1915, 1920, and each of the last five years was as follows:—
| Year ended 31st March. | Roads. | Railways, Buildings, &c. | Total. |
|---|---|---|---|
| 1895 | 1,103 | 962 | 2,065 |
| 1900 | 1,825 | 1,243 | 3,068 |
| 1905 | 1,407 | 2,119 | 3,526 |
| 1910 | 1,762 | 3,929 | 5,691 |
| 1915 | 2,494 | 2,234 | 4,728 |
| 1920 | 1,495 | 2,498 | 3,993 |
| 1922 | 1,062 | 4,016 | 5,078 |
| 1923 | 1,009 | 5,188 | 6,197 |
| 1924 | 1,210 | 4,876 | 086 |
| 1925 | 1,614 | 5,151 | 6,765 |
| 1926 | 1,618 | 5,462 | 7,080 |
The co-oparative contract system adopted in connection with the construction of public works in New Zealand is somewhat as follows: When a length of railway or road is to be constructed on the co-operative principle the formation work is divided into sections, the size of which depends upon the difficulty of the work. Plans and a simple specification of the work are prepared, also an estimate of the cost based on the rate of wages ruling in the district for similar work. The work, at a price reckoned at so much per unit of quantity or measurement, is offered to a party of men. who, if they accept, become the contractors. The work done by the men is measured periodically, and full payment made to the party, who divide the money amongst themselves according to the time worked by each workman. The engineer in charge of the work has a certain amount of discretion. and control in respect of the character of the men employed, the progress of the work, hours of labour, &c.
The constitution of the party is left very much to the men themselves, and they have power, subject to the approval of the engineer, to ballot out any member who proves himself undesirable or inefficient. The Department supplies the men with materials, explosives, &c., at cost price.
When the work is let by direct contract tenders are publicly invited, but the sections of work included in each contract are more extensive than under the co-operative system, yet not in general too large to enable parties of working. contractors to tender.
In 1915 the Census and Statistics Office compiled figures as to the total number of employees of the State and of local governing bodies, the results being published in the 1915 number of the Year-book. The total arrived at could be regarded as approximate only, estimates having to be made in respect of certain groups of employees for which figures were not available. The aggregate number of State and local-body employees was sot down for 1915 at approximately 60,000 with an aggregate annual remuneration of about £8,000,000.
After a lapse of ten years a similar investigation was made into the position as at the 31st March, 1925. The results, for which absolute accuracy is not claimed (though estimation has had to be resorted to in a much smaller percentage of cases than in 1915) are given in this section.
With a few exceptions the permanent employees of the State are divided into three divisions—viz., officers of the Railway Department, officers of the Post and Telegraph Department, and officers of Departments under the control of the Public Service Commissioner. In addition there are the Defence, Naval, and Police Forces; officers of Parliament and of the Legislative Department; administrative officers of Departments under the Public Service Commissioner; Judges and Magistrates; and a few others. There is also a considerable floating staff of temporary and casual employees.
Permanent officers of the Railway Department at the 31st March, 1925, numbered 12,788, the total salaries and wages paid during the preceding twelve months being £3,359,504. Wages paid to temporary and casual employees during the year accounted for a further £1,025,600. Temporary employees at the 31st March, 1925, numbered 4,458, the average employed during the year being 3,970. The total employees of the Department at the 31st March, 1925, were thus 17,246, and the wages bill for the twelve months was £4,385,104.
The employees of the Post and Telegraph Department at the 31st March, 1925, numbered 10,384, of whom 7,835 were permanent officers and 2,549 casual or temporary employees. Salaries and wages paid to permanent officers during the preceding twelve months aggregated £1,767,623, while a total of £384,287 was paid to temporary and casual employees, the average of whom over the year was 1,897. Altogether £2,151,910 was paid by the Department in salaries and wages during the year, without taking into account the remuneration of non-permanent country Postmasters and Postmistresses, mail contractors, &c.
Classified officers of Government Departments under the control of the Public Service Commissioner numbered 7,385 at the 31st March, 1925, as compared with 5,869 at the corresponding date in 1915. Their aggregate annual salaries were £1,133,835 for the year 1915–16, and £2,064,119 for 1925–26.
A list of Departments, with their classified staffs at the 31st March, 1925, and the annual salaries of these, is given:—
| Department. | Officers. | Salaries. |
|---|---|---|
| £ | ||
| Agriculture | 497 | 166,141 |
| Audit | 120 | 38,970 |
| Census and Statistics | 57 | 13,075 |
| Crown Law | 7 | 4,670 |
| Customs | 295 | 89,325 |
| Defence | 50 | 12,130 |
| Dominion Laboratory | 17 | 6,705 |
| Dominion Museum | 7 | 2,855 |
| Education | 277 | 95,952 |
| Native-school teachers (year 1924–25) | 262 | 53,820 |
| External Affairs | 5 | 1,335 |
| Government Life Insurance | 127 | 36,022 |
| Health | 357 | 100,872 |
| Immigration | 12 | 3,270 |
| Industries and Commerce | 14 | 4,875 |
| Internal Affairs | 268 | 65,818 |
| Justice | 236 | 63,960 |
| Labour | 94 | 26,895 |
| Land and Deeds | 136 | 35,772 |
| Land and Income Tax | 156 | 35,980 |
| Land for Settlements | 2 | 1,192 |
| Lands and Survey | 624 | 174,490 |
| Marine and Machinery | 202 | 65,495 |
| Mental Hospitals | 782 | 176,441 |
| Mines | 62 | 21,876 |
| National Provident Fund and Friendly Societies | 41 | 9,550 |
| Native | 62 | 18,570 |
| Native Trust | 20 | 5,685 |
| Patents | 10 | 2,760 |
| Pensions | 97 | 22,940 |
| Police (not including Police Force) | 6 | 1,775 |
| Printing and Stationery | 347 | 91,632 |
| Prisons | 208 | 57,471 |
| Private Secretaries | 9 | 4,325 |
| Public Service Commissioner | 12 | 4,620 |
| Public Service Superannuation | 9 | 2,660 |
| Public Trust | 547 | 151,199 |
| Public Works | 667 | 206,271 |
| Registrar-General | 40 | 10,245 |
| Stamp Duties | 81 | 19,900 |
| State Advances | 75 | 19,105 |
| State Fire and Accident Insurance | 119 | 29,685 |
| State Forests | 91 | 29,322 |
| Tourist and Health Resorts | 108 | 26,648 |
| Treasury | 85 | 21,610 |
| Valuation | 85 | 30,210 |
| Totals | 7,385 | 2,064,119 |
Most of the Departments shown in the foregoing list employ temporary and other unclassified officers, some of whom are under the direct jurisdiction of the Public Service Commissioner. In certain Departments, however, casual and temporary employees on other than clerical work are outside of the control of the Commissioner.
Information as to the number of temporary officers under the control of the Public Service Commissioner as at the 31st March, 1925, is not available, but at the 31st March, 1926, the number was 1,262, of whom approximately 560 were females. Assuming these numbers to have been about the same in 1924–25, and allowing average wages of £200 per annum for males and ££100 for females, the total wages for this class of temporary officers may be taken as approximately £196,000 for the year.
The Government Printer has, in addition to his permanent staff, a large staff of what may be termed permanent casuals—that is, employees who, not being permanent officers, are put off when there is insufficient work in hand, but who are actually engaged for a considerable part of every year. It becomes necessary, at times, to temporarily engage further assistance outside of the usual casual employees. At the 31st March, 1925, 166 casual and temporary employees wore on the pay-sheets of the Printing and Stationery Department. The average number employed during the preceding twelve months was 181, and the wages paid to casual and temporary employees during the year amounted to £31,220.
The Public Works Department employs a largo number of temporary hands, who are engaged either on daily wages or under the co-operative system. The figures for the year ended 31st March, 1925, are as follows:—
| Co-operative Employees. | Other Unclassified Employees. | |
|---|---|---|
| Number at 31st March, 1925 | 1,821 | 4,762 |
| Average number during 1924–25 | 1,693 | 4,782 |
| Total earnings during 1924–25 | £337,622 | £936,416 |
The Department of Health, in addition to its classified officers, has a considerable number of unclassified employees engaged in the various sanatoria, maternity homes, and other institutions conducted by the Department. The number of such officers was 450 at the 31st March, 1925, the average for the year was 452, and the total salaries and wages paid amounted to £77,774 for the twelve months ended 31st March, 1925.
Before turning to Departments and services not under the control of the Public Service Commissioner, it is as well to take cognizance of the administrative heads of these Departments. The number of officers in the Administrative Division at the 31st March, 1925, was 32, with aggregate salaries amounting to £32,264. With. these may be grouped certain statutory and unattached officers (including the Solicitor-General, the Controller and Auditor-General, and the Public Service Commissioner) bringing the total to 40, and the aggregate salaries to approximately £42,000 per annum.
Judges of the Supreme Cour£number 9, Judges of the Native Land Court 8, and Stipendiary Magistrates 31. These, with the Judge and members of the Arbitration Court, receive an aggregate of £52,079 per annum.
The permanent employees under the jurisdiction of the Clerk of Parliaments and the Clerk of the House of Representatives at the 31st March, 1925, numbered 69, and their annual salaries amounted to £23,421. A number of casual employees are engaged during session-time, amounting to 154 during the session of 1924, their wages totalling £14,733.
Three important classes of public servants who are not under the control of the Public Service Commissioner are (1) the Navy, (2) the Permanent Defence Force, and (3) the Police Force. The total personnel of the New Zealand Division of the Royal Navy at the 31st March, 1925, was 640, and their aggregate rates of pay amounted to £121,205 per annum. The Permanent Defence Force at the same date had 482 officers and men, with pay aggregating £158,430 per annum. In addition, 40 casual employees were attached to the Defence Department, and a total of £8,352 was paid to casuals (average 43) during the preceding twelve months. The Police Force numbered 1,025 of all ranks, £300,185 being the amount represented by the aggregate of their annual rates of pay. Temporary employees, who numbered 56 at the 31st March, 1925, and averaged 53 for the twelve months ended 31st March, 1925, received wages totalling £10,268 during the year.
Officers and employees of the State who have not been included above are the High Commissioner and his staff; the Resident Commissioners in the Cook Islands and Niue, with their staffs; officers in the employ of the Samoan Administration; canvassers of the State Insurance Offices; and the officers (other than masters) and crews of Government steamers.
No account is taken of part-time officers of State Departments who are allowed to perform work for remuneration outside the Government. Crown Solicitors, Registrars of Births, &c., and non-permanent Postmasters and Postmistresses come into this category.
Teachers and others engaged in the Education service of the State receive their salaries from the Consolidated Fund, but in general rank as employees of the various Education Boards, University colleges, &c. The total number of employees under this head, including full - time teachers, professors, lecturers, pupil - teachers, probationers, training - college students, and clerical and other employees of local educational bodies, at the 31st December, 1924, was 9,845, and their annual salaries aggregated £2,371,000. No information is available concerning temporary employees of educational bodies, but their number is small.
With the exception of Hospital Boards and a few minor local authorities, statistics of employees of local bodies are annually collected and compiled, the full details being published in the Annual Statistical Report on Local Government. A summary for the year 1924–25 is here given:—
| LOCAL BODIES.—EMPLOYEES AND WAGES, 1924–25. | |||||
|---|---|---|---|---|---|
| Local Bodies. | Permanent Employees. | Temporary Employees. | |||
| Number. | Salaries and Wages. | Number at End of Year. | Average Number for Year. | Wages paid during Year. | |
| £ | £ | ||||
| County Councils | 2,087 | 474,979 | 2,775 | 1,773 | 372,764 |
| Borough Councils | 7,953 | 2,018,522 | 3,378 | 2,801 | 626,775 |
| Town Boards | 199 | 31,452 | 103 | 51 | 9,949 |
| Road Boards | 119 | 23,483 | 138 | 69 | 15,079 |
| River Boards | 83 | 13,227 | 144 | 77 | 18,406 |
| Land-drainage Boards | 71 | 10,257 | 139 | 83 | 19,922 |
| Electric-power Boards | 734 | 132,472 | 960 | 848 | 224,259 |
| Water-supply Boards | 8 | 1,401 | 5 | 4 | 754 |
| City and Suburban Drainage Boards | 83 | 23,835 | 261 | 194 | 33,156 |
| Tramway Board | 579 | 147,797 | .. | .. | .. |
| Local Railway Boards | 38 | 7,659 | 2 | 1 | 205 |
| Gas-lighting Board | 31 | 8,105 | 7 | 12 | 2,888 |
| Harbour Boards | 1,044 | 304,505 | 1,861 | 1,521 | 412,993 |
| Totals | 13,029 | 3,197,694 | 9,773 | 7,434 | 1,737,150 |
The total employees of the above classes of local authorities were thus 22,802 at the 31st March, 1925, and the total amount paid in salaries and wages during the preceding twelve months was £4,934,844. Hospital Boards at the 31st March, 1925, had 3,898 employees, with an aggregate annual remuneration of £452,222, bringing the totals of all local bodies to 26,700 and £5,387,066 respectively.
Of the employees of Hospital Boards, 153 were officers whose full time was not devoted to the service of the Board. Similarly, the 13,029 permanent employees of other local bodies include 578 part-time officers.
In the following summary, covering both State and local-government employees, part-time officers are excluded throughout, though in the case of local bodies their salaries are included:—
| Class. | Permanent Employees. | Temporary Employees | ||
|---|---|---|---|---|
| Number. | Annual Salaries and Wages. | Number. | Amount paid in Wages during Year. | |
* Included amongst permanent employees. | ||||
| £ | £ | |||
| Railway Department | 12,788 | 3,359,504 | 4,458 | 1,025,600 |
| Post and Telegraph Department | 7,835 | 1,767,623 | 2,549 | 384,287 |
| Officers under Public Service Commissioner | 7,385 | 2,064,119 | 1,262 | 196,000 |
| Government Printing Office | .. | .. | 166 | 31,220 |
| Public Works Department— | ||||
| Co-operative employees | .. | .. | 1,821 | 337,622 |
| Other unclassified employees | .. | .. | 4,762 | 936,416 |
| Health Department | .. | .. | 450 | 77,774 |
| Administrative officers, &c. | 40 | 42,000 | .. | .. |
| Judges and Magistrates | 51 | 52,079 | .. | .. |
| Legislative Department | 69 | 23,421 | 154 | 14,733 |
| Naval Forces | 640 | 121,205 | .. | .. |
| Defence Forces | 482 | 158,430 | 40 | 8,352 |
| Police Force | 1,025 | 300,185 | 56 | 10,268 |
| Education Service | 9,845 | 2,371,000 | .. | .. |
| Hospital Boards | 3,745 | 452,222 | * | * |
| Other local bodies | 12,451 | 3,197,694 | 9,773 | 1,737,150 |
| Totals | 56,356 | 13,909,482 | 25,491 | 4,759,422 |
The huge total of nearly 82,000 is shown as the number of persons employed by the State and by local governing authorities, the annual wages bill amounting to over £18,500,000.
Notwithstanding many statistical pitfalls, figures showing the total value of production are of interest and of great value if assessed on a uniform system throughout. In the compilation of statistics of value of production for New Zealand, the results of which are given below, wholesale prices have been used in all cases as being the nearest values at present obtainable to the value at the source of production. An allowance has been made for such items as grass-seed, of which practically all the unexported production is returned to the soil. Deductions have also been made from Group I for items the inclusion of which would lead to duplication in the aggregate. Items of this nature are chaff, hay, fodder, and root crops, &c. These are produced for the purpose of adding value to live-stock, &c., the accretions in value of which are accounted for in Groups II and III. The output of factories has been taken as the total value of output at the factory, less the cost of materials used or operated on. The gross output of freezing-works has been included in Group II, whilst Group III includes the gross output of butter, cheese, and preserved-milk factories. An attempt has been made to estimate the approximate value of production by builders, labourers, road and railway workers, industrial workers not in Group V, dressmakers, &c. In and subsequent to 1922–23, figures of building permits are available, and from then on these have been used for estimating the production of the building trade.
It should be noted that every effort has been made to avoid duplication, but this is not entirely possible on the data available. It is considered, however, that in the aggregate the figures are conservative. No allowance is made for the production on small holdings of under one acre, kitchen-gardens, &c., nor of home products of which dressmaking, jam-making, &c., would alone comprise something very considerable in the aggregate.
The following table is submitted subject to the foregoing remarks:—
| TOTAL VALUE OF PRODUCTION, BY CLASSES, IN THE DOMINION FOR THE SEASONS 1900–01, 1905–06, 1910–11, AND 1915–16 TO 1924–25. | |||||||||
|---|---|---|---|---|---|---|---|---|---|
| Year. | Group I: Agricultural Products. | Group II: Pastoral Products. | Group III: and Bees | Group IV: Mining Products. | Group V: Factory Products. | Group VI: Fisheries. | Group VII: Forest Products. | Group VIII: Production of Builders, Labourers, and Industrial Workers, &c. | Total. |
| £ | £ | £ | £ | £ | £ | £ | £ | £ | |
| 1900–01 | 4,088,108 | 11,000,972 | 2,783,666 | 2,703,147 | 5,307,531 | 86,530 | 2,101,666 | 3,907,210 | 31,978,830 |
| 1905–06 | 4,318,664 | 112,474,853 | 3,942,516 | 3,871,991 | 6.403,274 | 92,068 | 3,220,221 | 5,076,180 | 39,399,767 |
| 1910–11 | 4,026,526 | 20,169,907 | 6,352,245 | 3,774,898 | 8,143,334 | 219,463 | 3,465,778 | 5,752,351 | 51,904,442 |
| 1915–16 | 7,566,704 | 32,390,322 | 12,081,850 | 3,374,477 | 9,739,070 | 342,363 | 2,658,122 | 5,986,060 | 74,138,968 |
| 1916–17 | 6,338,897 | 35,417,330 | 12,959,649 | 2,978,918 | 10,603,853 | 208,062 | 2,902,109 | 7,109,800 | 78,518,618 |
| 1917–18 | 7,491,846 | 38,821,732 | 13,991,403 | 2,523,630 | 11,468,636 | 227,103 | 3,102,605 | 7,928,630 | 85,555,585 |
| 1918–19 | 8,153,668 | 36,008,709 | 15,519,973 | 3,593,916 | 12,333,419 | 306,152 | 3,174,001 | 9,096,600 | 88,186,438 |
| 1919–20 | 8,967,933 | 38,595,940 | 19,270,181 | 3,778,682 | 15,557,618 | 386,059 | 3,912,964 | 9,151,600 | 99,620,977 |
| 1920–21 | 8,951,714 | 27,543,108 | 25,659,266 | 3,431,391 | 19,125,946 | 435,671 | 5,621,258 | 9,201,258 | 99,969,612 |
| 1921–22 | 9,796,425 | 22,678,171 | 21,614,244 | 2,727,205 | 17,590,926 | 465,470 | 5,412,638 | 9,574,500 | 89,359,579 |
| 1922–23 | 8,365,530 | 28,398,110 | 25,584,391 | 2,761,078 | 18,419,600 | 363,140 | 5,432,883 | 9,771,390 | 99,096,122 |
| 1923–24 | 7,226,592 | 32,918,313 | 25,169,625 | 3,088,246 | 19,648,748 | 472,765 | 5,961,849 | 11,472,801 | 105,958,939 |
| 1924–25 | 8,424,421 | 39,007,145 | 26,519,824 | 3,074,094 | 20,941,141 | 491,102 | 6,589,387 | 11,172,789 | 116,220,203 |
From the table it is seen that the value of production has now reached a new level, being assessed at over £116,000,000 for 1924–25. As shown in the table, the largest group is that of pastoral products, followed closely (in recent years) by the group which includes dairying, poultry, and bees. Secondary industries show steady growth, as indicated by the figure for Group V, whilst the great increase in building activity is largely responsible for the high figure now shown for Group VIII. If agriculture is credited with the production of all crops (including pasture grasses) this group takes second place, and in some years actually takes precedence of the pastoral group, as the following table shows:—
| VALUE OF AGRICULTURAL PRODUCTS. | ||
|---|---|---|
| Year. | Gross Value (including Pasture Grasses. Fodder Crops, &c). | Net Value. |
| £ | £ | |
| 1900–01 | 11,636,593 | 4,088,108 |
| 1905–06 | 12,809,594 | 4,318,664 |
| 1910–11 | 14,381,332 | 4,026,526 |
| 1915–16 | 29,573,500 | 7,566,704 |
| 1916–17 | 28,035,034 | 6,338,897 |
| 1917–18 | 29,866,104 | 7,491,846 |
| 1918–19 | 31,074,966 | 8,153,668 |
| 1919–20 | 32,994,037 | 8,967,933 |
| 1920–21 | 33,115,205 | 8,951,714 |
| 1921–22 | 33,736,484 | 9,796,425 |
| 1922–23 | 32,036,732 | 8,365,530 |
| 1923–24 | 30,214,170 | 7,226,592 |
| 1924–25 | 32,161,854 | 8,424,421 |
It has been shown in the External Trade Section of this book that the increase in the total value of exports during recent years is attributable more to increased prices than to the greater volume of commodities shipped. What is true of exports—the country's surplus production—is also found to apply in the case of production as a whole, the quadrupling of the annual value between 1900–01 and 1924–25 being due partly to the increased volume of production, but more to the great advance in prices in the Latter year as compared with the earlier. It should be added that the increase in the volume of production is proportionately slightly greater than the increase in population.
From the figures of total value of production it is possible, by taking into account the increase of population and the movement in wholesale prices of New Zealand produce, to compile a series of index numbers of relative productive activity, which afford the only satisfactory basis of comparison. The index numbers are given in the following table:—
| INDEX NUMBERS OF RELATIVE PRODUCTIVE ACTIVITY, 1900–01 TO 1924–25. | ||||||
|---|---|---|---|---|---|---|
| Year. | Mean Population for Twelve Months ended 30th June (including Maoris). | Value of Production. | Relative Value of Production per Head (1910–11 = 1000). | Index Number of Wholesale Prices of New Zealand Produce (1910–11 = 1000). | Relative Productive Activity (1910–11 = 1000). | |
| Total. | Per Head of Mean Population. | |||||
| £ | £ | £ | ||||
| 1900–01 | 811,028 | 31,978,830 | 39.43 | 796 | 934 | 852 |
| 1905–06 | 922,074 | 39,399,767 | 42.73 | 863 | 1017 | 849 |
| 1910–11 | 1,047,670 | 51,904,442 | 49.54 | 1000 | 1000 | 1000 |
| 1915–16 | 1,150,372 | 74,138,968 | 64.45 | 1301 | 1360 | 957 |
| 1916–17 | 1,148,578 | 78,518,618 | 68.36 | 1380 | 1435 | 961 |
| 1917–18 | 1,151,235 | 85,555,585 | 74.32 | 1500 | 1554 | 965 |
| 1918–19 | 1,174,628 | 88,186,438 | 75.08 | 1516 | 1650 | 919 |
| 1919–20 | 1,217,150 | 99,620,977 | 81.85 | 1652 | 1788 | 924 |
| 1920–21 | 1,259,869 | 99,969,612 | 79.35 | 1602 | 1877 | 853 |
| 1921–22 | 1,291,413 | 89,859,579 | 69.58 | 1405 | 1742 | 807 |
| 1922–23 | 1,317,154 | 99,096,122 | 75.24 | 1519 | 1633 | 930 |
| 1923–24 | 1,339,786 | 105,958,939 | 79.33 | 1601 | 1684 | 951 |
| 1924–25 | 1,367,978 | 116,220,203 | 84.96 | 1715 | 1737 | 987 |
As indicated above, two main factors have been considered—namely, population and price. Obviously, if population increases, one would expect production to increase in the aggregate unless some other factor were introduced to counteract this increase in population. Similarly, price plays an important part in the question. To produce (say) £1,000,000 in goods requires less when prices are high than when low prices rule. The method of allowing for the various factors is not necessarily absolute, and is subject to certain shortcomings. For instance, a temporary falling-off in the production per head of population is not necessarily a serious matter, particularly in a year when the population has increased rapidly by natural increase or even by migration. Numerous workers may arrive in the country, but it requires some time for these to be absorbed into industry. A truer index would be the production per head of persons in actual employment rather than per head of population. The use of wholesale prices as a determining factor is subject to a certain amount of criticism, particularly in secondary industries. It has been found in some countries that wages (a determining factor in industry) have actually increased, whilst wholesale prices have decreased. These divergences will tend to become smoothed out in the long-run, but must, of course, affect the results for individual years, and even for several successive years.
Taking the figures on their face value, it is seen that relative production (1910–11 = 1000) fell off considerably from the base period until 1920–21, when a slight recovery was attained compared with the previous period. Since 1919–20 there has been a steady rise in the index number of relative productive activity, until in 1924–25 the figure is only 13 points below the base index. The volume of production in relation to population is shown to have been considerably greater in 1924–25 than in either year for which information is available prior to 1910–11. It should again be stressed, however, that these figures are only the “best available,” and subject to some criticism on account of their shortcomings. Absolute reliance should not be placed upon the result obtained, but the figures may be reasonably accepted as indicating tendencies which are accurately portrayed so far as the data available will permit.
The increased use of hydro-electric power and of machinery is no doubt a factor in the continued increase in productive activity in the last few years.
By taking the total production figures and adding or subtracting the not imports or exports a result is obtained which gives approximately the total quantity available for home consumption. In the following table an attempt has been made to gauge the extent to which the undermentioned commodities are consumed in New Zealand. In order to eliminate the fluctuation which would naturally occur if a single year were taken—this is especially noticeable in the case of exports and imports—the figures relate to an average of the last three-years. It should be mentioned here that in the case of potatoes and onions no attempt has been made to estimate the total quantity raised in home gardens for local consumption.
| CONSUMPTION OF CERTAIN ARTICLES OF FOODSTUFFS. | ||||||
|---|---|---|---|---|---|---|
| Article. | Production. | Imports. | Exports. | Excess of Imports over Exports | Amount available for Home Consumption. | |
| Quantity. | Per Head. | |||||
* Excess of exports over imports. | ||||||
| lb. | lb. | lb. | lb. | lb. | lb. | |
| Butter | 181,657,666 | 7,205 | 140,550,976 | -140,549,771* | 41,107,895 | 30.34 |
| Cheese | 153,717,312 | 6,645 | 146,053,152 | -146,046,507* | 7,670,805 | 5.82 |
| Ham and bacon | 18,500,459 | 1,289 | 447,562 | -446,273* | 18,054,186 | 13.32 |
| Preserved meat | 9,528,064 | 57,531 | 6,511,083 | -6,453,552* | 3,074,512 | 2.27 |
| Fresh meat— | ||||||
| Beef | 361,867,467 | 187 | 79,213,717 | -79,213,530* | 282,653,937 | 208.59 |
| Mutton | 183,089,400 | 187 | 107,035,264 | -107,035,077* | 76.054,323 | 56.13 |
| Lamb | 183,733,968 | .. | 166,104,549 | -166.104,549* | 17,629,419 | 13.01 |
| Pork | 45,426,723 | .. | 3,994,667 | -3,994,667* | 41,432,056 | 30.58 |
| Flour | 305,643,893 | 5,472,333 | 48,033 | 5,424,300 | 311,068,193 | 229.56 |
| Maizena and cornflour | .. | 2,337,760 | 2,318 | 2,335,442 | 2,335,442 | 1.72 |
| Oatmeal, rolled oats, &c. | 14,194,507 | 358,080 | 109,078 | 249,002 | 14,443,509 | 10.66 |
| Potatoes | 255,032,960 | 5,998,720 | 4,732,373 | 1,266.347 | 256,299,307 | 189.14 |
| Onions | 9,899,307 | 9,222,080 | 1,187,947 | 8,034,133 | 17,933,440 | 13.23 |
| Arrowroot | .. | 401,019 | 701 | 400,318 | 400,318 | 0.30 |
| Desiccated coconut | .. | 767,148 | .. | 767,148 | 767,148 | 0.57 |
| Dried apples and apricots | .. | 552,838 | 7,661 | 545,177 | 545,177 | 0.40 |
| Currants | .. | 1,675,428 | 6,066 | 1,669,362 | 1,669,362 | 1.23 |
| Dates | .. | 2,962,576 | 22,776 | 2,939,800 | 2,939,800 | 2.17 |
| Figs | .. | 719,999 | 92 | 719,907 | 719,907 | 0.53 |
| Prunes | .. | 1,572,861 | 2,234 | 1,570,627 | 1,570,627 | 1.16 |
| Raisins | .. | 7,751,314 | 16,839 | 7,734,475 | 7,734,475 | 5.71 |
| Other dried fruits | .. | 157,120 | 4,423 | 152,697 | 152,697 | 0.11 |
| Apples | 59,058,653 | 1,493,776 | 8,072,622 | -6,578,846* | 52,479,807 | 38.73 |
| Pears | 9,645,317 | 345 | 108,737 | -108,392* | 9,536,925 | 7.04 |
| Lemons | 684,405 | 1,055,175 | 75 | 1,055,100 | 1,739,505 | 1.28 |
| Bananas | .. | 18,051,851 | .. | 18,051,851 | 18,051,851 | 13.32 |
| Oranges | 138,614 | 4,509,322 | 1,195 | 4,508,127 | 4,646,741 | 3.43 |
| Rice | 7,618,763 | 83,477 | 7,535,286 | 7,535,286 | 5.56 | |
| Macaroni and vermicelli | .. | 502,655 | 322 | 502,333 | 502,333 | 0.37 |
| Mustard | .. | 244,943 | 10 | 244,933 | 244,933 | 0.18 |
| Peel | 48,832 | 620,059 | 624 | 619,435 | 668,267 | 0.49 |
| Sago and tapioca | .. | 3,267,870 | 3,099 | 3,264,771 | 3,264,771 | 2.41 |
| Spices | .. | 749,753 | 664 | 749,089 | 749,089 | 0.55 |
| Sugar | .. | 152,070,987 | 843,285 | 151,227,702 | 151,227,702 | 111.60 |
| Tea | .. | 10,529,795 | 77,600 | 10,452,195 | 10,452,195 | 7.71 |
| Tobacco | .. | 4,284,853 | 48,448 | 4,236,405 | 4,236.405 | 313 |
| Gallons. | Gallons. | Gallons. | Gallons. | Gallons. | Gallons. | |
| Ale and beer | 13,252,068 | 51,669 | 16,656 | 35,013 | 13,287,081 | 9.81 |
| Spirits | .. | 741,085 | 3,367 | 737,718 | 737,718 | 0.54 |
| Wine | .. | 206.330 | 1,819 | 204,511 | 204,511 | 0.15 |
Statistics of the principal sports in the Dominion have been collected by the Census and Statistics Office since 1924. The initial collection covered at the same time both winter and summer sports, but in subsequent collections information has been sought of the winter sports at the close of the winter months and of the summer sports in the autumn. This arrangement was based on experience derived from the first collection. It is thought that it will allow sports bodies ample time to gather information regarding membership, &c., for the current season, and thus permit of the information supplied being both reasonably accurate and up to date.
The inquiries have not covered sports where the lack of organization would make it impossible to obtain the necessary information. Only those bodies having reasonably accurate records of participants, &c., have been approached. The collections, which have been conducted on a voluntary basis, called for the following data from the governing body in each case:—
Number of district or local governing bodies affiliated.
Number of clubs affiliated.
Number of active club members (males, females, total).
Number of members included above who belong to school clubs or teams—if available (males, females, total).
No attempt has been made in the tables given hereunder to separate persons engaged in more than one sport, or belonging to more than one club in the same branch of sport, with the result that many persons returned under one sport may be included under others as well, or duplicated within the same sport. The figures should not be made use of, therefore, without due attention being paid to this limitation.
The particulars obtained in the last collection regarding summer sports are set out in the following table, while the membership figures recorded in the previous collection are also given for comparative purposes:—
| SUMMER SPOUTS. | ||||||
|---|---|---|---|---|---|---|
| Sport. | Number of District or Local Governing Bodies. | Number of Clubs affiliated. | Membership, 1925–26. | Total Membership, 1924–25. | ||
| Males. | Females. | Total. | ||||
* Excludes membership of hunt clubs. † Incomplete. ‡ Separate figures (male and female) not available. § 1926 figures not available. | ||||||
| Horse-racing— | ||||||
| Galloping | .. | 120 | 17,757 | 150 | 17,907* | 18,244† |
| Trotting | .. | 38 | 7,133 | 25 | 7,158 | 6,797 |
| Tennis | 16 | 366 | .. | .. | 23,319£ | 19,351† |
| Bowling | 19 | 290 | 15,200 | .. | 15,200 | 15,055 |
| Cricket | 22 | 263 | 6,670 | .. | 6,670 | 10,851 |
| Swimming | 13 | 94 | 7,120£ | 6,668† | ||
| Athletics— | ||||||
| Amateur£ | 5 | 72 | .. | .. | .. | 1,948 |
| Professional | 11 | 267 | 4,400 | 81 | 4,481 | .. |
| Boxing | 40 | .. | 2,970 | .. | 2,970 | .. |
| Croquet | 9 | 112 | 60 | 2,495 | 2,555 | 2,480 |
| Rowing | 8 | 50 | 1,895 | .. | 1,895 | 1,916 |
| Shooting (gun clubs) | .. | 80 | 1,326 | .. | 1,326 | 1,100 |
| Polo | .. | 15 | 300 | .. | 300 | 160 |
In the case of cricket and tennis the figures given represent the membership of clubs affiliated with the New Zealand Cricket Council and the New Zealand Lawn Tennis Association respectively. Persons playing either of these sports, but who are not members of affiliated clubs, are not included in the figures. In both cases the number of such persons is considerable, and the figures must be regarded as being understated to this extent.
Upon comparison between the figures for the 1925–26 and the previous season, it will be noted that decreases are shown in the memberships of galloping and rowing clubs only. In the case of galloping tills diminution is due to the fact that the membership of hunt clubs has been excluded this year, thus preventing comparison with 1924–25 figures. The large increases in the cases of tennis and swimming are probably duo to the fact that the 1924–25 figures for these two sports were incomplete. Bowling added 145 to its membership, while polo, although its following is comparatively small, allows a large proportionate increase.
In order of popularity, the sports do not show any difference from previous years. Horse-racing still possesses the greatest numerical strength (25,065), closely followed by tennis (23,319), while bowling (15,200), swimming (7,120), cricket (6,670), and athletics (6,429) are next in order. Boxing, croquet, rowing/shooting, and polo follow in that sequence.
With regard to horse-racing, attention should be drawn to the fact that the figures in this connection do not include (except in so far as they may be members) active participants such as owners, jockeys, riders, and trainers. The following table, however, shows the number of such participants, together with the number of horses registered for 1925 and 1926.
| — | 1926. | 1925. | ||||
|---|---|---|---|---|---|---|
| Galloping. | Trotting. | Totals. | Galloping. | Trotting. | Totals. | |
| Owners | 2,337 | 2,566 | 4,903 | .. | 2,550 | .. |
| Trainers | 420 | 1,072 | 1,492 | 450 | 1,118 | 1,568 |
| Jockeys and riders | 423 | 1,174 | 1,597 | 502 | 1,228 | 1,730 |
| Totals | 3,180 | 4,812 | 7,992 | .. | 4,896 | .. |
| Horses | 2,142 | 3,000 | 5,142 | 2,343 | 3,000 | 5,343 |
In New Zealand there is greater diversion in summer than in winter sports. although statistics show that the actual number of participants in the different sports in the two seasons is about the same.
Information collected regarding winter sports for the winters of 1925 and 1926, where available, are given hereunder:—
| WINTER SPORTS. | ||||||
|---|---|---|---|---|---|---|
| Sport. | Number of District or Local Governing Bodies. | Number of Clubs affiliated. | Membership, 1926. | Total Membership, 1925. | ||
| Males. | Females. | Total. | ||||
* 1924 figures. † Incomplete. | ||||||
| Football— | ||||||
| Rugby | 25 | 670 | 40,000 | .. | 40,000 | 40,000 |
| Association | 18 | 440 | 6,250 | .. | 6,250 | 6,000 |
| League | 9 | 84 | 4,614 | .. | 4,614 | 3,818 |
| Golf | .. | 109 | 6,148 | 4,023 | 10,171 | 9,115 |
| Hockey— | ||||||
| Men | 15 | 147 | 3,096 | .. | 3,096* | .. |
| Women | 19 | 252 | .. | 3,383 | 3,383 | .. |
| Hunting | .. | 15 | 1,623 | 223 | 1,846 | 1,770 |
| Tramping | .. | 14 | 480 | 256 | 736† | 893 |
Rugby football has pride of place, as regards number of participants, for both winter and summer sports. This sport enjoys more popularity than any other in the Dominion. Unfortunately there are no actual figures concerning the number of footballers, but the estimate of 40,000 has been accepted as being reasonably accurate. Second place in point of numerical strength among winter sports is, according to the latest figures, occupied by golf, which claimed 10,171 followers in 1926 against 9,115 in 1925. Of the former 6,148 were males and 4,023 females. Hockey follows golf with a total membership of 6,479. This total comprises 3,096 men and 3,383 women players. Next to golf and tennis, the sport of hockey claims more female adherents than any other sport in the Dominion.
Association and Rugby League football, with memberships totalling 6,250 and 4,614 respectively in 1926, came next after hockey. It is interesting to note that the association figure shows an increase of approximately 4 per cent. as compared with that for the previous year, while the total for Rugby League in 1926 is approximately 20 per cent. greater than the figure returned in 1925.
It is doubtful whether tramping is correctly included as a winter sport. Many tramping clubs operate the whole year round, while mountaineering is carried on mainly about February or March. Against this, there are certain “ski-ing” clubs which become active in winter and early spring. It has been thought best, however, to include particulars of tramping clubs among the winter sports.
A general election of parliamentary representatives was held in November, 1925—for Maori electorates on the 3rd, and for European electorates on the 4th. Dealing with the latter only, it is found that out of a total roll number of 754,113 some 678,877 (90 per cent.—or excluding Bay of Plenty, where no contest was held, 91 per cent.) exercised their votes. A summary for the last three general elections is as follows:—
| 1919 | 1922. | 1925. | |
|---|---|---|---|
| Number of votes recorded for candidates elected | 279,373 | 313,699 | 380,231 |
| Number of votes recorded for candidates defeated | 263,367 | 300,371 | 291,740 |
| Number of informal votes | 7,587 | 6,580 | 6,906 |
| Total number of electors who voted at the election | 550,327 | 620,650 | 678,877 |
| Percentage of votes recorded for candidates elected to total valid votes recorded | 51.47 | 51.09 | 57.17 |
| Total number of electors on roll | 683,420 | 700,111 | 754,113 |
| Percentage of electors on roll who voted | 80.53 | 88.65 | 90.02 |
| Percentage of votes recorded for candidates elected to total number of electors on roll | 40.88 | 44.81 | 50.42 |
| Total population of Dominion at last census (excluding Maoris) | 1,142,081 | 1,218,913 | 1,218,913 |
The population figures for 1919 are inclusive of 42,632 soldiers in camp and abroad who were allocated over the various districts in accordance with section 3 of the Parliamentary Elections Postponement Act, 1916. In 1919 the population of the Chatham Islands, which prior to 1922 were in no electoral district, was excluded.
The relative interest in the poll evinced by men and women may be measured by the percentage of votes recorded to the number on the roll—viz., men 92.10 per cent., women 89.71 per cent. (in 1925). Both percentages are worked from figures which exclude the Bay of Plenty Electorate, where no contest was held.
A statement of the voting in individual electorates in 1925 is given.
| RESULT OF THE GENERAL ELECTION, 1925. | |||
|---|---|---|---|
| Electoral District and Names of Candidates. | Number of Votes recorded. | Number of Electors on Roll. | Population at Census, 1921. |
* Elected unopposed. | |||
| Bay of Islands— | |||
| Bell, A. | 4,211 | ||
| Sweeney, H. J. | 1,424 | ||
| Bisset, A. E. | 1,268 | ||
| Wrathall, R. T. | 311 | ||
| Hornblow. R. E. | 273 | ||
| Informal | 75 | ||
| 7,562 | 8,401 | 14,748 | |
| Mar£— | |||
| Jones, W. | 4,038 | ||
| Murdo£, A. J. | 3,387 | ||
| Richards, A. S. | 897 | ||
| Informal | 55 | ||
| 8,377 | 9,229 | 15,163 | |
| Kaipara— | |||
| Coates, J. G. | 6,307 | ||
| Barnard, W. E. | 1,472 | ||
| Informal | 117 | ||
| 7,896 | 8,790 | 15,457 | |
| Waitemata— | |||
| Harris. A. | 7,101 | ||
| Osborne, A. G. | 3,524 | ||
| Lamont, T. | 1,653 | ||
| Informal | 63 | ||
| 12,341 | 13,610 | 18,212 | |
| Eden— | |||
| Parr. C. J. | 7,158 | ||
| Mason, H. G. R. | 4,822 | ||
| Grigg, F. W. | 118 | ||
| Informal | 113 | ||
| 12,211 | 13,379 | 16,385 | |
| Auckland East— | |||
| Lee, J. A. | 4,477 | ||
| Stewart, J. | 4,189 | ||
| Browne, H. O. | 1,293 | ||
| Informal | 110 | ||
| 10,069 | 11,573 | 18,261 | |
| Auckland Central— | |||
| Parry, W. E. | 5,672 | ||
| Wilson, C. A. | 2,172 | ||
| Morton, F. S. | 991 | ||
| Informal | 91 | ||
| 8,926 | 10,279 | 18,366 | |
| Auckland West— | |||
| Savage, M. J. | 5,677 | ||
| Oldfield, S. | 5,201 | ||
| Informal | 122 | ||
| 11,000 | 12,283 | 18,304 | |
| Grey Lynn— | |||
| Bartram, F. N. | 6,061 | ||
| Melville, E. | 5,296 | ||
| Informal | 152 | ||
| 11,509 | 12,674 | 18,369 | |
| Roskill— | |||
| Potter, V. H. | 7,301 | ||
| Skelton, A. H. | 4,388 | ||
| Yarnall, J. W. | 1,399 | ||
| Informal | 79 | ||
| 13,167 | 14,518 | 17,934 | |
| Parnell— | |||
| Dickson, J. S. | 8,497 | ||
| Way, R. F. | 3,610 | ||
| Informal | 303 | ||
| 12,410 | 13,939 | 18,145 | |
| Manukau— | |||
| Jordan, W. J. | 6,748 | ||
| Massey, J. | 5,964 | ||
| Informal | 79 | ||
| 12,791 | 13,925 | 17,268 | |
| Franklin— | |||
| McLennan, E. D. | 6,714 | ||
| McClymont, D. | 1,660 | ||
| Rea, J. | 1,136 | ||
| Informal | 228 | ||
| 9,738 | £0,979 | 15,735 | |
| Raglan— | |||
| Bollard, R. F. | 4,470 | ||
| Piggott, E. | 1,614 | ||
| Lye, S. C. G. | 965 | ||
| Duxfield, R. D. | 222 | ||
| Informal | 56 | ||
| 7,327 | 8,154 | 13,954 | |
| Thames— | |||
| Rhodes, T. W. | 5,112 | ||
| Willy, W. E. G. | 1,805 | ||
| Ross, A. A. | 409 | ||
| Whiteside, A. J. | 232 | ||
| Informal | 94 | ||
| 7,652 | 8,508 | 15,087 | |
| Ohinemuri— | |||
| Samuel, A. M. | 3,541 | ||
| Poland, H.3,433 | |||
| Informal | 33 | ||
| 7,007 | 7,637 | 14,087 | |
| Tauranga— | |||
| Macmillan, C. E. do la B. | 5,387 | ||
| Coulter, R. | 3,077 | ||
| Informal | 103 | ||
| 8,567 | 9,608 | 15,725 | |
| Hamilton— | |||
| Young. J. A. | 6,830 | ||
| Martin, W. L. | 2,105 | ||
| Milner, E. W. | 996 | ||
| Informal | 100 | ||
| 10,031 | 11,286 | 17,023 | |
| Waikato— | |||
| Reid. D. S. | 3,916 | ||
| Lye, F. | 2,998 | ||
| Lawson, F. C. S. | 139 | ||
| Informal | 49 | ||
| 7,102 | 7,888 | 14,327 | |
| Rotorua— | |||
| Hockly, F. F. | 4,384 | ||
| Clinkard, C. H. | 1,608 | ||
| Sumner, J. W. | 1,148 | ||
| Colbeck, F. | 204 | ||
| Informal | 42 | ||
| 7,386 | 8,258 | 13,818 | |
| Bay of Plenty— | |||
| Williams, K. S. | * | 7,428 | 13,928 |
| Waitomo— | |||
| Rolleston, J. C. | 4,531 | ||
| Broadfoot, W. J. | 3,096 | ||
| Informal | 60 | ||
| 7,687 | 8,482 | 14,640 | |
| Gisborne— | |||
| Lysnar, W. D. | 4,652 | ||
| Coleman, D. W. | 2,980 | ||
| Smith, G. | 1,522 | ||
| Informal | 91 | ||
| 9,245 | 10,266 | 17,477 | |
| Hawke's Bay— | |||
| Campbell, H. McL. | 4,348 | ||
| McKay, G. | 3,622 | ||
| Ogilvy. A. L. | 1,766 | ||
| Informal | 73 | ||
| 9,809 | 10,955 | 16,992 | |
| Napier— | |||
| Mason, J. | 5,169 | ||
| McIlvride, L. | 4,596 | ||
| Informal | 96 | ||
| 9,861 | 10,732 | 17,693 | |
| Waipawa— | |||
| Hunter, G. | 4,486 | ||
| Chambers, W. A. | 2,705 | ||
| Informal | 90 | ||
| 7,281 | 8,078 | 13,841 | |
| Pahiatua— | |||
| Ransom, E. A. | 3,800 | ||
| McNicol, A. | 3,687 | ||
| Informal | 34 | ||
| 7,521 | 8,203 | 14,548 | |
| Masterton— | |||
| Sykes, G. R. | 4,403 | ||
| Andrews, J. W. | 3,481 | ||
| Informal | 85 | ||
| 7,969 | 8,678 | 15,334 | |
| Wairarapa— | |||
| McLeod, A. D. | 4,282 | ||
| Arkle, F. T. | 2,858 | ||
| Informal | 67 | ||
| 7,207 | 7,915 | 13,252 | |
| Stratford— | |||
| Walter, E. | 3,593 | ||
| Masters, R. | 3,324 | ||
| Informal | 42 | ||
| 6,959 | 7,415 | 14,114 | |
| Taranaki— | |||
| Bellringer, C. E. | 4,615 | ||
| Smith, S. G. | 4,565 | ||
| Sheat, W. A. | 792 | ||
| Informal | 56 | ||
| 10,028 | 10,807 | 16,378 | |
| Egmont— | |||
| Hawken, O. J. | 4,086 | ||
| Green, W.C.G. | 2,796 | ||
| Informal | 64 | ||
| 6,946 | 7,574 | 14,143 | |
| Patea— | |||
| Dickie, H. G. | 4,501 | ||
| Corrigan, J. R. | 3,226 | ||
| Informal | 95 | ||
| 7,822 | 8,542 | 14,956 | |
| Wanganui— | |||
| Veitch, W. A. | 4,339 | ||
| Coull, J. | 3,448 | ||
| Rogers, W. J. | 2,240 | ||
| Informal | 69 | ||
| 10,096 | 10,996 | 17,771 | |
| Waimarino— | |||
| Smith, R. W. | 3,751 | ||
| Langstone, F. | 3,611 | ||
| Informal | 36 | ||
| 7,398 | 8,229 | 14,587 | |
| Oroua— | |||
| Eliott, J. G. | 3,545 | ||
| Cobbe, R. | 3,075 | ||
| Taylor, J. H. | 760 | ||
| Informal | 61 | ||
| 7,441 | 8,147 | 15,024 | |
| Rangitikei— | |||
| Glenn, W. S. | 4,613 | ||
| Duggan, C. J. | 2,650 | ||
| Lyon, A. | 1,211 | ||
| Informal | 52 | ||
| 8,526 | 9,421 | 15,896 | |
| Manawatu— | |||
| Linklater, J. | 4,428 | ||
| Roberts, B. | 2,354 | ||
| Hollings, P. L. | 504 | ||
| Informal | 55 | ||
| 7,341 | 8,262 | 14,148 | |
| Palmerston— | |||
| Nash, J. A. | 6,584 | ||
| Bromley, W. | 3,344 | ||
| Informal | 211 | ||
| 10,139 | 11,297 | 17,858 | |
| Otaki— | |||
| Field, W. H. | 4,256 | ||
| Semple, R. | 2,199 | ||
| Harkness, C. I. | 480 | ||
| Informal | 55 | ||
| 6,990 | 7,791 | 14,601 | |
| Hutt— | |||
| Wilford, T. M. | 6,080 | ||
| Nash, W. | 4,286 | ||
| Informal | 92 | ||
| 10,458 | 11,487 | 17,135 | |
| Wellington North— | |||
| Luke, J. P. | 5,712 | ||
| Combs, H. E. | 3,766 | ||
| McGrath, J. J. | 1,528 | ||
| Informal | 127 | ||
| 11,133 | 12,558 | 17,915 | |
| Wellington Central— | |||
| Fraser, P. | 5,893 | ||
| Sloane, A. D. | 3,346 | ||
| Informal | 114 | ||
| 9,353 | 10,689 | 18,198 | |
| Wellington East— | |||
| Forsyth, T. | 6,191 | ||
| Monteith, A. L. | 4,996 | ||
| Informal | 193 | ||
| 11,380 | 12,723 | 18,173 | |
| Wellington South— | |||
| McKeen, R. | 5,903 | ||
| Sievwright, A. B. | 4,429 | ||
| Informal | 151 | ||
| 10,483 | 11,505 | 18,230 | |
| Wellington Suburbs | |||
| Wright, R. A. | 6,881 | ||
| Chapman, C. H. | 5,339 | ||
| Informal | 174 | ||
| 12,394 | 13,641 | 18,055 | |
| Nelson— | |||
| Atmore, H. | 4,951 | ||
| Gilbert, A. | 2,485 | ||
| Brindle, T. | 1,100 | ||
| Informal | 64 | ||
| 8,600 | 9,462 | 16,011 | |
| Motueka— | |||
| Hudson. R. P. | 4,356 | ||
| Fagan, M. | 2,254 | ||
| Informal | 30 | ||
| 6,640 | 7,291 | 13,532 | |
| Buller— | |||
| Holland, H. E. | 4,704 | ||
| Beilby, C. S. | 3,172 | ||
| Informal | 68 | ||
| 7,944 | 8,458 | 14,240 | |
| Westland— | |||
| Seddon, T. E. Y. | 4,175 | ||
| O'Brien, J. | 4,163 | ||
| Informal | 4,175 | ||
| 8,476 | 8,958 | 15,171 | |
| Wairau— | |||
| Girling, W. J. | 4,014 | ||
| McCallum, R. | 2,065 | ||
| Cooke, B. J. | 1,916 | ||
| Informal | 51 | ||
| 8,046 | 8,758 | 15,150 | |
| Hurunui— | |||
| Forbes, G. W. | 3,989 | ||
| Armstrong, J. G. | 3,178 | ||
| Informal | 67 | ||
| 7,234 | 7,980 | 13,540 | |
| Kaiapoi— | |||
| Buddo, D. | 3,594 | ||
| Brook, W. | 3,038 | ||
| Williams, C. M. | 1,185 | ||
| Informal | 64 | ||
| 7,881 | 8,599 | 14,525 | |
| Christchurch North | |||
| Holland, H. | 6,228 | ||
| Thacker. H. T. J. | 3,318 | ||
| Cooke, F. R. | 2,290 | ||
| Informal | 96 | ||
| 11,932 | 13,122 | 18,365 | |
| Christchurch East— | |||
| Armstrong,H.T. | 6,385 | ||
| Dennehy, D. F. | 3,990 | ||
| Informal | 249 | ||
| 10,624 | 11,844 | 18,304 | |
| Christchurch South | |||
| Howard, E. J. | 5,947 | ||
| Ell, H. G. | 4,378 | ||
| Informal | 210 | ||
| 10,535 | 11,743 | 17,995 | |
| Riccarton— | |||
| Kyle, H. S. S. | 5,088 | ||
| Cole, W. | 2,828 | ||
| Langdale-Hunt, A. E. | 1,735 | ||
| Informal | 84 | ||
| 9,735 | 10,592 | 17,355 | |
| Avon— | |||
| Sullivan, D. G. | 6,377 | ||
| Leadley, W. E. | 4,588 | ||
| Informal | 107 | ||
| 11,072 | 12,088 | 18,381 | |
| Lyttelton— | |||
| McCombs, J. | 4,900 | ||
| Lyons, M. E. | 4,889 | ||
| Informal | 106 | ||
| 9,895 | 10,859 | 18,064 | |
| Ellesmere— | |||
| Jones, D. | 4,014 | ||
| Connolly, J. | 3,380 | ||
| Informal | 143 | ||
| 7,537 | 8,121 | 13,730 | |
| Ashburton— | |||
| Nosworthy, W. | 3,982 | ||
| Harle, J. N. | 1,864 | ||
| Galbraith, R. | 1,134 | ||
| Jones, H. M. | 417 | ||
| Informal | 69 | ||
| 7,466 | 8,108 | 14,268 | |
| Timaru— | |||
| Rolleston, F. J. | 6,140 | ||
| Vinnell, P. C. | 3,654 | ||
| Informal | 81 | ||
| 9,875 | 10,673 | 17,859 | |
| Temuka— | |||
| Burnett, T. D. | 3,883 | ||
| Talbot, C. J. | 3,348 | ||
| Informal | 38 | ||
| 7,269 | 7,759 | 13,213 | |
| Waitaki— | |||
| Bitchener, J. | 4,211 | ||
| Barclay, G. | 3,709 | ||
| Informal | 49 | ||
| 7,969 | 8,573 | 15,197 | |
| Oamaru— | |||
| Lee, E. P. | 4,805 | ||
| Macpherson, J.A. | 3,708 | ||
| Informal | 63 | ||
| 8,576 | 9,161 | 15,626 | |
| Dunedin North— | |||
| Tapley, H. L. | 5,363 | ||
| Munro, J. W. | 5,101 | ||
| Informal | 89 | ||
| 10,553 | 11,387 | 17,840 | |
| Dunedin West— | |||
| Stewart, W. D. | 6,305 | ||
| Harrison, R. | 3,827 | ||
| Informal | 113 | ||
| 10,245 | 11,304 | 17,997 | |
| Dunedin Central— | |||
| Statham, C. E. | 6,616 | ||
| Gilchrist, J. | 4,017 | ||
| Informal | 110 | ||
| 10,743 | 11,571 | 17,965 | |
| Dunedin South— | |||
| Sidey, T. K. | 6,259 | ||
| MacManus, J. E. | 4,038 | ||
| Informal | 115 | ||
| 10,412 | 11,270 | 17,192 | |
| Chalmers— | |||
| Dickson, J. McC. | 4,321 | ||
| Connelly, M. | 2,728 | ||
| Informal | 52 | ||
| 7,101 | 7,869 | 15,024 | |
| Clutha— | |||
| Waite, F. | 3,943 | ||
| Edie, J. | 2,290 | ||
| Fenton, J. W. | 1,428 | ||
| Informal | 70 | ||
| 7,731 | 8,493 | 15,038 | |
| Wakatipu— | |||
| Horn, J. | 3,455 | ||
| Ritchie, J. | 2,612 | ||
| Ashworth, A. | 797 | ||
| Informal | 47 | ||
| 6,911 | 7,486 | 13,610 | |
| Mataura— | |||
| Anderson, G. J. | 5,062 | ||
| Hinchey, W. | 2,398 | ||
| Informal | 38 | ||
| 7,498 | 8,283 | 15,043 | |
| Wallace— | |||
| Hamilton, A. | 4,001 | ||
| MacKenzie, J.M. | 2,673 | ||
| Edie, G. S. | 432 | ||
| Gilfedder, P. | 277 | ||
| Informal | 102 | ||
| 7,485 | 8,038 | 14,925 | |
| Invercargill— | |||
| Ward, J. G. | 4,957 | ||
| Hargest, J. | 4,798 | ||
| Hickey, P. H. | 811 | ||
| Informal | 55 | ||
| 10,621 | 11,332 | 17,434 | |
| Awarua— | |||
| Hamilton, J. R. | 3,962 | ||
| de la Perrelle, P. A. | 3,742 | ||
| Informal | 31 | ||
| 7,735 | 8,192 | 15,064 | |
The votes polled for each candidate in the four Maori Electoral Districts at the general election of 1925 were as follows —
| Electoral District and Names of Candidates. | Number of Votes recorded. |
|---|---|
| Northern Maori— | |
| Tau Henare | 2,434 |
| Hone Wi Kaitaia | 825 |
| Poratene Ripi Wi Hongi | 611 |
| Total | 3,870 |
| Eastern Maori— | |
| Apirana Turupa Ngata | 4,468 |
| Hone Mokena | 864 |
| Total | 5,332 |
| Western Maori— | |
| Maui Ngatata, Pomare | 4,010 |
| Rangi Mawhete | 1,28,7 |
| Tuwhakaririka Patena | 110 |
| Total | 5,407 |
| Southern Maori— | |
| Henare Whakatau Uru | 211 |
| Tuiti MacDonald | 195 |
| Teone Matapura Erihana | 157 |
| Wereta Tainui Pitama | 114 |
| John Topi Patuki | 28 |
| Total | 705 |
A by-election in the Eden Electorate was necessitated by the appointment of the sitting member—the Hon. Sir C. J. Parr, K.C.M.G.—to the position of High Commissioner in London. The voting at the by-election, which was held on 15th April, 1926, was as follows:—
| Candidate | Votes. |
|---|---|
| Mason, H. G. R. | 4,589 |
| Gunson, J. H. | 4,163 |
| Melville, E. | 2,197 |
| Informal | 99 |
| Total | 11,048 |
During the year ended the 31st March, 1925, 1,781 licenses for the sale of intoxicating liquors were granted. Of these, 1,115 were publicans' and accommodation licenses, 60 New Zealand wine, 32 packet, 146 wholesale, 382 conditional licenses, and 46 club charters. The fees paid amounted to £41,079, and formed part of the revenue of the local governing bodies of the districts in which the licenses were issued. Particulars are given in the following table:—
| NUMBER OF LICENSES GRANTED DURING THE YEAR 1924–25, AND THE AMOUNT OF FEES PAID TO LOCAL BODIES THEREFOR. | ||||
|---|---|---|---|---|
| Licenses. | In Counties. | In Boroughs. | In Town Districts. | Total. |
| Publicans' licenses | 307 | 600 | 41 | 948 |
| Accommodation licenses | 153 | 11 | 3 | 167 |
| Total licensed houses | 460 | 611 | 44 | 1,115 |
| New Zealand wine licenses | 41 | 19 | .. | 60 |
| Packet licenses | 8 | 24 | .. | 32 |
| Wholesale licenses | 3 | 141 | 2 | 146 |
| Conditional licenses | 232 | 150 | .. | 382 |
| Club charters | 1 | 45 | .. | 45 |
| Total licenses granted | 745 | 990 | 46 | 1,781 |
| Amount of license fees paid to local bodies | £10,913 | £28,448 | £1,718 | £41,079 |
The number of publicans' and accommodation licenses granted in counties, boroughs, and independent town districts during each of the last ten years is here given, together with the total amount of fees paid for all licenses for the sale of intoxicating liquor:—
| Year ended 31st March. | Counties. | Boroughs. | Town Districts. | Total. | Total Fees, All Licenses. |
|---|---|---|---|---|---|
| £ | |||||
| 1916 | 557 | 598 | 44 | 1,199 | 42,978 |
| 1917 | 536 | 598 | 49 | 1,183 | 46,164 |
| 1918 | 540 | 598 | 46 | 1,184 | 41,208 |
| 1919 | 507 | 606 | 43 | 1,156 | 39,817 |
| 1920 | 496 | 611 | 49 | 1,156 | 40,337 |
| 1921 | 481 | 613 | 47 | 1,141 | 40,538 |
| 1922 | 480 | 615 | 40 | 1,135 | 40,593 |
| 1923 | 474 | 611 | 40 | 1,125 | 40,975 |
| 1924 | 468 | 610 | 45 | 1,123 | 41,276 |
| 1925 | 460 | 611 | 44 | 1,115 | 41,079 |
The average number of persons (excluding Maoris) to each licensed house in counties, boroughs, and independent town districts respectively for 1924–25 is next shown:—
| — | Number of Licensed Houses.* | Population. | Number of Persons to each Licensed House. |
|---|---|---|---|
* i.e., houses holding publicans or accommodation licenses. | |||
| Counties | 460 | 510,265 | 1,109 |
| Boroughs | 611 | 773,597 | 1,266 |
| Town districts | 44 | 34,385 | 781 |
| Totals | 1,115 | 1,318,247 | 1,182 |
That the proportion of licensed houses to population has declined steadily in the last decade is evidenced by the following figures:—
| Year ended 31st March. | Average Persons to a Licensed House. |
|---|---|
| 1916 | 920 |
| 1917 | 918 |
| 1918 | 946 |
| 1919 | 964 |
| 1920 | 1,004 |
| 1921 | 1,062 |
| 1922 | 1,069 |
| 1923 | 1,125 |
| 1924 | 1,146 |
| 1925 | 1,182 |
The above proportions are based on the population exclusive of Maoris. If Maoris be included the number of persons to each licensed house as at the 31st March, 1925, is found to be 1,237.
The annual fees payable for licenses are,—
| (1.) For a publican's license— | £ |
|---|---|
| (a.) Within the limits of a borough or town district | 40 |
| (b.) Outside the aforesaid limits | 25 |
| (2.) For a New Zealand wine license | 1 |
| (3.) For an accommodation license, a sum to be determined by the Licensing Committee, not exceeding | 20 |
| (4.) For a packet license— | |
| (a.) For a vessel exceeding 50 tons register | 10 |
| (b.) For a vessel not exceeding 50 tons register | 5 |
| (5.) For a wholesale license | 20 |
| (6.) For a conditional license, according to duration of license, a sum not exceeding | 30 |
The approximate capital value of the licensed houses in the counties for the year ended 31st March, 1925, was stated at £742,601, in the boroughs at £3,389,182, and in the town districts at £136,167. There was, besides, an annual value of £105,956 for licensed houses in other boroughs and town districts, which, capitalized at 6 per cent., would represent £1,765,933. The capital value of all licensed houses may therefore be put down at approximately £6,000,000. Caution should be exercised in this connection, as some of the valuations on which the above total is based are by no means recent.
The licensing poll of the 4th November, 1925, held in conjunction with the parliamentary elections, was the third at which the three issues—national continuance, State purchase and control, and national prohibition (without compensation)—were submitted to the electors. As in 1919 and 1922, none of the three issues secured in 1925 the requisite minimum of half the total votes cast, and national continuance is deemed to have been carried.
| 1919. | 1922. | 1925. | |
|---|---|---|---|
| For national continuance | 241,251 | 282,669 | 299,590 |
| For State purchase and control | 32,261 | 35,727 | 56,037 |
| For national prohibition | 270,250 | 300,791 | 319,450 |
The voting in each licensing district in 1925 was as follows:—
| District. | For National Continuance. | For State Purchase and Control. | For National Prohibition. |
|---|---|---|---|
| Bay of Islands | 3,426 | 726 | 3,317 |
| Marsden | 3,362 | 707 | 4,209 |
| Kaipara | 3,446 | 624 | 3,686 |
| Waitemata | 4,769 | 1,338 | 6,109 |
| Eden | 4,392 | 1,092 | 6,534 |
| Auckland | 14,373 | 2,492 | 12,739 |
| Grey Lynn | 4,400 | 920 | 5,951 |
| Roskill | 4,069 | 1,046 | 7,878 |
| Parnell | 4,544 | 1,412 | 6,279 |
| Manukau | 5,032 | 1,067 | 6,540 |
| Franklin | 3,700 | 687 | 5,204 |
| Raglan | 3,125 | 681 | 3,483 |
| Thames | 3,657 | 449 | 3,440 |
| Ohinemuri | 3,148 | 648 | 3,000 |
| Tauranga | 3,572 | 761 | 4,115 |
| Hamilton | 3,500 | 1,184 | 5,243 |
| Waikato | 2,973 | 683 | 3,372 |
| Rotorua | 3,131 | 749 | 3,431 |
| Bay of Plenty | 3,114 | 443 | 2,368 |
| Waitomo | 4,309 | 568 | 2,702 |
| Gisborne | 4,356 | 632 | 4,128 |
| Hawke's Bay | 4,982 | 640 | 4,061 |
| Napier | 4,520 | 1,030 | 4,206 |
| Waipawa | 3,574 | 656 | 2,972 |
| Pahiatua | 3,688 | 461 | 3,289 |
| Masterton | 3,655 | 561 | 3,544 |
| Wairarapa | 3,537 | 515 | 3,057 |
| Stratford | 3,132 | 324 | 3,399 |
| Taranaki | 4,214 | 588 | 5,104 |
| Egmont | 3,441 | 278 | 3,140 |
| Patea | 3,562 | 477 | 3,693 |
| Wanganui | 4,561 | 767 | 4,652 |
| Waimarino | 4,168 | 743 | 2,396 |
| Oroua | 3,212 | 690 | 3,452 |
| Rangitikei | 4,102 | 568 | 3,796 |
| Manawatu | 3,456 | 500 | 3,312 |
| Palmerston | 4,351 | 652 | 5,018 |
| Otaki | 3,322 | 737 | 2,870 |
| Hutt | 4,154 | 1,303 | 4,849 |
| Wellington | 15,221 | 3,364 | 12,973 |
| Wellington S. | 4,497 | 945 | 4,855 |
| Wellington Suburbs | 4,906 | 1,270 | 6,055 |
| Nelson | 3,991 | 777 | 3,739 |
| Motueka | 3,813 | 535 | 2,236 |
| Buller | 4,120 | 481 | 3,200 |
| Westland | 4,637 | 441 | 3,194 |
| Wairau | 3,760 | 639 | 3,532 |
| Hurunui | 3,675 | 623 | 2,826 |
| Kaiapoi | 3,314 | 630 | 3,816 |
| Christchurch | 14,160 | 3,053 | 15,478 |
| Riccarton | 4,221 | 892 | 4,535 |
| Avon | 4,369 | 871 | 5,695 |
| Lyttelton | 4,239 | 722 | 4,781 |
| Ellesmere | 3,672 | 589 | 3,089 |
| Ashburton | 3,558 | 628 | 3,111 |
| Timaru | 4,077 | 771 | 4,918 |
| Temuka | 3,535 | 460 | 3,181 |
| Waitaki | 3,573 | 428 | 3,850 |
| Oamaru | 3,297 | 619 | 4,373 |
| Dunedin | 11,768 | 2,514 | 16,729 |
| Dunedin South | 3,976 | 679 | 5,573 |
| Chalmers | 2,814 | 403 | 3,774 |
| Clutha | 3,090 | 577 | 3,895 |
| Wakatipu | 3,479 | 396 | 2,970 |
| Mataura | 2,880 | 649 | 3,762 |
| Wallace | 3,608 | 418 | 3,350 |
| Invercargill | 4,072 | 876 | 5,432 |
| Awarua | 3,239 | 388 | 3,990 |
| Totals | 299,590 | 56,037 | 319,450 |
In the no-license districts an additional issue is submitted—viz., local restoration—three-fifths of the valid votes cast being required for the carrying of the proposal. For the first time on record one district— Ohinemuri—registered in 1925 the necessary three-fifths majority in favour of restoration. The voting figures for each of the twelve districts concerned were as follows:—
| District. | License to be restored. | License be not restored. |
|---|---|---|
| Eden | 4,245 | 7,368 |
| Grey Lynn | 4,379 | 6,573 |
| Roskill | 3,818 | 8,721 |
| Ohinemuri | 4,114 | 2,663 |
| Masterton | 3,671 | 4,058 |
| Wellington South | 4,552 | 5,460 |
| Wellington Suburbs | 4,552 | 7,261 |
| Ashburton | 3,920 | 3,391 |
| Oamaru | 3,495 | 4,743 |
| Clutha | 3,143 | 4,283 |
| Mataura | 3,366 | 3,794 |
| Invercargill | 4,723 | 5,543 |
| Totals | 47,978 | 63,858 |
THE following are brief summaries of the more important enactments of the parliamentary sessions of 1925 and 1926:—
The Cook Islands Amendment Act (1925, No. 2) authorizes the compulsory transfer of lepers from the Cook Islands to the special leper hospital maintained by the Government of Fiji in the Island of Makogai.
The Iron and Steel Industries Amendment Act (1925, No. 3) increases to £1 10s. a ton the rate at which bounty shall be payable in respect of pig iron (produced after the 1st January, 1925) and extends to the 31st March, 1934, the time after which bounties under the Iron and Steel Industries Act, 1914, in respect of pig iron, puddled bar iron, or steel, shall cease to be payable.
The Massey Burial-ground Act (1925, No. 5) makes provision for the dedication of certain land to be the burial-ground of the late Right Honourable William Ferguson Massey, P.C., and of his widow.
The Housing Amendment Act (1925, No. 7) repeals the provisions of the Housing Act, 1919, imposing restrictions on freehold titles acquired in respect of workers' dwellings under that Act or the Workers' Dwellings Act, 1910.
The Rent Restriction Continuance Act (1925, No. 9) further continues (until the 31st August, 1926) the operation of Part I of the War Legislation Amendment Act, 1916, and its amendments (relating to the restriction of rent).
The Nurses and Midwives Registration Act (1925, No. 10) consolidates with amendments the Midwives Act, 1908, and the Nurses Registration Act, 1908, and their amendments. It is divided into Parts as follows:—
Part I.—Nurses and Midwives Registration Board.
Part II.—Registration of Nurses.
Part III.—Registration and Training of Midwives and Maternity Nurses.
Part IV.—General.
The Stamp Duties Amendment Act (1925, No. 11) amends in various particulars the Stamp Duties Act, 1923. Section 3 limits the definition of the term “mortgage.” Section 4 simplifies the law relating to duty on mortgages. The only duty payable in respect of mortgages executed after the passing of this Act is one of 2s. 6d. on execution, and one of 2s. 6d. on discharge, and it is provided that no further duty shall be charged in respect of any mortgage executed before the commencement of this Act and in respect of which the mortgage duty chargeable by the law in force at the date of its execution has been paid before or after the commencement of this Act. Section 5 exempts from stamp duty instruments of dedication of highways.
The Land and Income Tax Amendment Act (1925, No. 12) amends in various particulars the Land and Income Tax Act, 1923. Section 2 makes provision in relief of hardships arising from the operation of section 11 of the Land and Income Tax Amendment Act, 1924, relating to registration of charges in respect of unpaid land-tax. Section 3 authorizes the Commissioner to make a special assessment of land-tax in certain cases. Section 4 exempts from income-tax the income of co-operative dairy companies if and so far only as it is distributed solely amongst the suppliers of milk in proportion to the quantity of milk or butterfat supplied by them. Section 6 provides that interest payable in respect of income-tax paid in advance may be paid without specific appropriation.
The Land and Income Tax (Annual) Act (1925, No. 13) fixes the rates at which land-tax and income-tax shall be assessed, levied, and paid for the year commencing on the 1st April, 1925.
The National Provident Fund Amendment Act (1925, No. 14) amends in numerous particulars the National Provident Fund Act, 1910. Sections 3 to 11 make special provision for pensions on retirement of permanent officers of Hospital Boards. An obligation is imposed on every Board to apply to be accepted as a contributor to the fund on behalf of its permanent staff, and in the event of its failing so to apply there is provision for making it a contributor, with terms as favourable as if it had voluntarily applied. Sections 12 to 25 contain miscellaneous amendments of the principal Act, mainly in the direction of extending its benefits or modifying limitations.
The Land for Settlements Act (1925, No. 15) is a consolidation with amendments of the Land for Settlements Act, 1908, and the various Acts amending the same. The amendments are for the most part of a purely machinery nature.
The Repayment of the Public Debt Act (1925, No. 16) makes better provision for the repayment of the public debt, and incidentally repeals the Extinction of the Public Debt Act, 1910, and other Acts. Section 3 constitutes a Public Debt Commission (consisting of the Minister of Finance, the Speaker of the House of Representatives, the Paymaster-General, the Solicitor-General, the Public Trustee, and one other person to be appointed by the Governor-General), which is charged with the administration of the Repayment Account established by this Act, and the duty of determining when and how the moneys in that account shall be invested or used towards the redemption of the public debt. Section 7 requires the Audit Office to furnish annually to the Commission a certificate as to the amount of the public debt and as to redemption. Section 8 constitutes the Public Debt Redemption Fund, and declares what moneys are capital moneys of that fund. Section 10 provides for the investment of the capital moneys of the Redemption Fund. Section 11 provides the following annual appropriations from the Consolidated Fund for the benefit of the Public Debt Repayment Account, viz.:—
A sum equal to ½ per centum of the public debt outstanding at the end of the previous financial year, and an additional amount of ½ per centum of the total amount of debt theretofore repaid or redeemed under the provisions of this Act.
A sum equal to 3 ½ per centum of the public debt repaid or redeemed under this Act as at the end of the previous financial year, together with an amount computed at the rate of 3 ½ per centum per annum of the amount so repaid or redeemed during the current financial year for the period elapsing between the date of repayment or redemption and the end of the current financial year.
Section 12 provides for certain revenues (principally moneys derived from the investment of capital moneys in the Redemption Fund) to be paid to the Consolidated Fund in compensation for the appropriations from that fund under section 11. Section 13 provides that moneys in the Repayment Account shall, as the Commission determines, without further appropriation, be applied in reduction of the public debt, and for the investment of moneys in that account not immediately required for repayment purposes. By section 14 the Commission is required to keep accounts, and to submit annually to Parliament a statement thereof, together with an account of its proceedings and the Controller and Auditor-General's certificate.
The Pensions Amendment Act (1925, No. 17) amends the Pensions Act, 1913. Section 3 increases to £45 10s. per annum the maximum rate of old-age pension. Section 4 provides that personal earnings for the past year may be excluded from income if the applicant has ceased to receive such earnings. Section 5 exempts from the definition of “income” moneys raised by public subscription for the benefit of the applicant or the applicant's wife or husband, and also (up to £100) compensation or damages in respect of the death of any person. Section (i provides that the value of the permanent home of an old-age or widow pensioner is not to be taken into account in computing his or her pension. Section 7 amends section 7 of the principal Act to extend benefits of pensions in respect of children to apply to children not over fifteen years of age. Section 8 confers on Maori War pensioners the right to receive old-age pensions. Section 9 extends the classes of persons to whom pensions may be granted in respect of blindness. Section 10 makes an increase in the rate of pensions to the blind, corresponding to the increase in amount of old-age pensions. Section 11 provides for applications for renewals of pensions to be determined by the Commissioner of Pensions instead of by a Magistrate.
The Government Railways Amendment Act (1925, No. 18) amends the Government Railways Act, 1908. Section 2 constitutes a Government Railways Board of three persons, which, subject to the control of the Minister, is charged with the administration of the Railways Department. Sections 3 to 9 establish a special account within the Public Account, to be called the Working Railways Account; declare what moneys are to belong to that account, and the purposes for which they may be expended; authorize the investment of surplus moneys; and define the powers of the Governor-General with reference to that account. Section 10 extends the power to collect and deliver goods outside the limits of the railway. Section 11 authorizes the Minister to act as consignor's agent in respect of the collection of the price of goods delivered. Section 12 empowers the Minister to undertake the carnage of passengers and goods otherwise than by railway.
The District Courts Abolition Act (1925, No. 19) repeals the District Courts Act, 1908, and abolishes all District Courts existing under that Act.
The Land Transfer Amendment Act (1925, No. 20) amends in various particulars the Land Transfer Act, 1915. Section 2 makes special provision in cases where a Registrar's requisition is not complied with. Section 3 provides for the issue of certificates of title in respect of leasehold interests. Section 4 confers authority to destroy instruments of title in certain cases after expiration of twenty years from registration. The schedule contains a number of miscellaneous amendments of the principal Act.
The Chattels Transfer Amendment Act (1925, No. 21) amends the Chattels Transfer Act, 1924. Section 2 amends section 4 of the principal Act to provide that registration of an instrument shall not in itself constitute notice of that instrument or its contents to the grantee of any prior registered instrument relating to the same chattels or to any of them. Section 4 provides that the principal Act shall bind the Crown in respect of all instruments to which it is a party, executed on or after the 1st January, 1926.
The Child Welfare Act (1925, No. 22) was enacted to make better provision with respect to the maintenance, care, and control of children who are specially under the control of the State, and to provide generally for the protection and training of indigent, neglected, or delinquent children. It is divided into Parts as follows:—
Part I.—Administration.
Part II.—Establishment of Receiving-homes and other Institutions for Purposes of Child-welfare Work.
Part III.—Admission to Institutions under this Act and the Guardianship and Control of Inmates.
Part IV.—Children's Courts.
Part V.—Financial Provisions.
Part VI.—Miscellaneous.
Part I: Sections 3 to 6 establish a Child Welfare Branch of the Department of Education, and provide for the appointment of a Superintendent, Deputy Superintendent, and other officers.
Part II: Sections 7 to 9 provide for the establishment by the State of receiving-homes and other institutions, and the closing of institutions. Section 10 recognizes certain private institutions for the purposes of this Act. Section 11 authorizes certain persons to inspect institutions.
Part III: Sections 12 to 14 deal with admission to State institutions, children being admitted by agreement with parents or guardians, or on committal by Children's, Courts. An order of committal must specify the religious denomination in whose faith and doctrine the child shall be educated. Section 15 imposes conditions as to transfer of children to recognized private institutions. Sections 16 and 17 provide for the Superintendent to be guardian of all children committed to his charge. Section 18 revives the rights of the parent or guardian in certain cases on a child ceasing to be an inmate. Sections 19 and 20 provide for a boarding-out system, whereby, save in exceptional cases, children are not to be permanently maintained in institutions, but to be placed in suitable homes or situations subject to approved conditions. Sections 21 to 23 deal with the discharge of inmates, the principle being that, save in exceptional cases, inmates are to be discharged on attaining the age of twenty-one years. Section 24 creates certain offences—ill-treating or neglecting inmates, having sexual intercourse with female inmates, &c. Section 25 enables absconders from institutions to be arrested without warrant.
Part IV: Sections 26 to 34 empower the Governor-General to establish Children's Courts, in which only Magistrates and Justices specially appointed may exercise jurisdiction, and which are to be held in rooms separate from other Court premises. Proceedings specially affecting children are to be heard by Children's Courts, the proceedings in which are not to be open to the public. Special provision is made for referring to Children's Courts charges against persons not more than eighteen years of age. Children are not to be required to give evidence on oath in Children's Courts.
Part V: Sections 35 to 38 make financial provisions with respect to the cost of establishment and maintenance of institutions, the recovery of the cost of maintenance of inmates (for which purpose the Destitute Persons Act, 1910, is applied), and the earnings and other property of inmates.
Part VI: Section 39 applies the Justices of the Peace Act, 1908, to proceedings under this Act. Section 40 enables a Court, in the absence of evidence, to fix the age of a child. Section 41 requires notification of birth of illegitimate children to be given to approved Child Welfare Officers. Section 45 empowers the Governor-General to make regulations, inter alia regulating the employment of children (whether inmates of institutions or not) in street trading and places of public entertainment, and also regulating and restricting the attendance of children at places of entertainment.
The Electrical Wiremen's Registration Act (1925, No. 23) provides for the registration of electrical wiremen and Inspectors of electrical-wiring work, and for the regulation of that work. Section 3 constitutes an Electrical Wiremen's Registration Board of five persons, of whom one shall be the Chief Electrical Engineer of the Public Works Department, cue an Electrical Engineer to an Electric-power Board or a Borough Council, one appointed on the recommendation of insurance companies, one (who shall be a registered electrical engineer) on the recommendation of electrical traders or contractors, and one on the recommendation of electrical wiremen. Section 8 prescribes the qualifications of applicants for registration. Section 13 makes provision for cancellation of registration. Section 16 authorizes the issue of provisional licenses for a period not exceeding six months at any one time, which enable the holders to carry out work as if they were registered. Section 18 prohibits any person not authorized by this Act from being engaged in the work of wiring any premises for electric lighting, heating, or power purposes. Section 19 requires electrical-supply authorities to inspect wring of premises before they are connected with the source of supply, and to report defects to the Board, which may cancel registration, &c., of the person doing the work. Section 20 provides for the registration and licensing of Inspectors of electrical wiring. Section 22 provides for the investigation of complaints as to the inspection of wiring-work. Section 23 provides for appeals against decisions of the Board. Section 25 makes it an offence to use improperly words, initials, &c., implying registration or licensing, or to knowingly employ or permit any person to do electrical - wiring work contrary to the provisions of this Act. Section 28 saves the right of registered electrical engineers to do electrical - wiring work, or to be appointed as Inspectors, without being registered as electrical wiremen, but renders them subject to the disciplinary provisions.
The Industrial Conciliation and Arbitration Act (1925, No. 24) consolidates, with slight amendment, the provisions of the Industrial Conciliation and Arbitration Act, 1908, and the various Acts amending it.
The Life Insurance Amendment Act (1925, No. 25) amends the Life Insurance Act, 1908, principally in the direction of making clear the provisions of sections 65 and 66 of the principal Act as amended by this Act. Section 5 makes special provision for vesting policies of limited value in persons who prove their titles thereto, without requiring probate or letters of administration.
The Weights and Measures Act (1925, No. 26) repeals the Weights and Measures Act, 1908, and brings into line with that of other British possessions the New Zealand law relating to weights and measures. In general, this Act is modelled on the New South Wales Weights and Measures Act, 1915, certain provisions of the New Zealand Act of 1908 being retained. Other provisions are based on Imperial and South African legislation. One section that may be particularly noted is section 23, which makes it an offence to supply short weight or measure. The power to make regulations given by section 39 (inter alia) authorizes the prohibition of the sale by retail of packages of specified goods otherwise than of prescribed net weights or measures, and special provision is made with respect to bottles and other containers used in the sale of milk and cream and the testing thereof.
The Main Highways Amendment Act (1925, No. 27) amends in various particulars the Main Highways Act, 1922. Section 2 contains provisions as to apportionment of expenditure incurred prior to declaration of a main highway. Sections 3 to 5 make further provision with respect to the construction and maintenance of main highways. Section 6 empowers the Main Highways Board to revoke or vary a delegation of its powers under section 9 of the principal Act. Section 7 authorizes the application of sections 119 and 120 of the Public Works Act, 1908, in respect of bridges and other works on main highways. Section 8 provides for payment of allowances to members of District Councils, and section 9 amends sections 11, 18, and 19 of the principal Act to provide that the powers of the Board as to apportionment of cost of main highways shall not be governed by recommendations of District Councils. Section 10 authorizes the Board to sell roadmaking plant to local authorities charged with the construction or maintenance of main highways. The effect of section 11 is to make discretionary, instead of mandatory, the exercise of the Board's power to classify main highways.
The Mutual Fire Insurance Amendment Act (1925, No. 29) amends the Mutual Fire Insurance Act, 1908, to enable associations to make by-laws providing for retirement of directors in rotation and to remove directors from office.
The Rating Act (1925, No. 30) consolidates without amendment the Rating Act, 1908, and the various Acts amending it.
The Valuation of Land Act (1925, No. 31) consolidates without amendment the Valuation of Land Act, 1908, and the various Acts amending it.
The Death Duties Amendment Act (1925, No. 32) amends the Death Duties Act, 1921. Section 2 exempts insurance-moneys up to £1,000 from estate duty. Section 3 makes provision as to the method of apportioning estate duty among successors. Section 5 extends the right of appeal from assessments made by the Commissioner for the purposes of the principal Act. Section 6 removes a doubt as to the proper construction of section 70 of the principal Act.
The Hutt Valley Lands Settlement Act (1925, No. 33) makes special provision for the administration and disposal of certain lands in the Hutt Valley acquired by the Crown for settlement or other purposes. Section 3 provides for the application of the Act to certain land. Sections 5 to 8 make special provision for the subdivision and sale of the land subject to this Act. Except in special cases, the fee-simple is to be disposed of and sales may be for cash or on special systems of deferred payments. Disposal by way of lease is governed by the special provisions of section 8. Section 9 authorizes the Minister of Finance to provide up to £50,000 in any year for the purpose of making advances under the State Advances Act, 1913, for the erection of dwellings on land, subject to this Act. Section 11 establishes the Hutt Valley Lands Settlement Account, and specifies and provides for payments out of that account. Section 13 excludes the operation of certain provisions of the Land for Settlements Act with respect to lands subject to this Act.
The Kauri-gum Control Act (1925, No. 34) makes provision (in general), on the lines of previous Control Acts, for the control of the trade in and the export of kauri-gum.
The Local Elections and Polls Act (1925, No. 35) consolidates without amendment the Local Elections and Polls Act, 1908, and the various Acts amending it.
The Apprentices Amendment Act (1925, No. 36) amends the Apprentices Act, 1923. Section 2 amends section 3 of the principal Act, defining the application of that Act. Section 3 defines the term “contract of apprenticeship” for the purposes of the principal Act. Section 4 provides that contracts of apprenticeship shall be read subject to orders of Court with which they are inconsistent. Section 5 amends section 8 of the principal Act as to registration of apprenticeship. Section 6 provides that all contracts for apprenticeship of adults shall be subject to supervision of the Court or Apprenticeship Committees.
The Forests Amendment Act (1925, No. 37) amends the Forests Act, 1921–22, in various particulars. Section 2 enables settlement land to be set apart as State forests. Section 4 authorizes the acquisition by way of exchange of land required for State forests. Sections 5 and 6 make further provisions with respect to fire districts. Sections 7 to 10 restrict or limit the granting by the Minister or Wardens of certain leases, rights, or other privileges in respect of land in State forests. Section 12 authorizes the sale or destruction of cattle found trespassing in State forests.
The Electric-power Boards Act (1925, No. 38) consolidates with slight amendments the Electric-power Boards Act, 1918, and the various Acts amending it.
The Coal-mines Act (1925, No. 39) consolidates and extensively amends the Coal-mines Act, 1908, and its various amendments. In so far as the Act is a consolidation, its object is to set out in logical order the law relating to the taking-up of coal-mining rights and the actual working-conditions in coal-mines, and to that end the existing law has been rearranged. In general the new provisions are directed to the safety and well-being of miners.
The Act is divided into Parts as follows:—
Part I.—Administration of Public Coal-bearing Lands (sections 3–32).
Part II.—Regulation of Coal-mines (sections 33–166).
Part III.—State Coal-mines (sections 167–191). Part IV.—General (sections 192–207).
The Native Land Amendment and Native Land Claims Adjustment Act (1925, No. 40) further amends the laws relating to Native lands. It provides for the determining of certain claims and disputes in relation to Native lands, and confers jurisdiction with respect to certain matters upon the Native Land Court and the Native Appellate Court.
The Ashley River Improvement Act (1925, No. 41) constitutes a special trust, on which are conferred certain powers of both River and Drainage Boards, and certain special powers, for the purpose of improving the waterway of the Ashley River and protecting certain land in Canterbury. The district of the trust comprises the whole of the watershed of the river and its tributaries.
The Deteriorated Lands Act (1925, No. 42) makes provision for the relief of occupiers of certain Crown and other lands in respect of hardship due to the deterioration of such lands or to their natural lack of productivity. Section 3 provides that the Act shall apply only to such lands as the Governor-General by Proclamation declares to be subject thereto. Section 4 provides for the appointment by the Minister of Special Revaluation Committees, to which are to be referred applications for relief under section 3. These applications must be made before the 30th June, 1926. Section 6 provides that the rent or price of land may be reduced on revaluation. Section 7 empowers the Minister to remit rent or interest, or to postpone payment of rent, interest, or purchase-money. Section 8 empowers Land Boards to classify or reclassify lands for the purpose of giving effect to recommendations of committees. Section 10 applies the Act to lands subject to mortgages to the Crown. Section 11 provides for the granting of financial assistance by way of loan to owners of land subject to this Act for the purchase of fencing-materials, lime, or manure, or to assist the occupiers to defray any capital expenditure. Section 12 authorizes the Minister of Finance to borrow £100,000 for the purpose of making advances under this Act.
The Harbours Amendment Act (1925, No. 43) amends in various particulars the Harbours Act, 1923. Section 2 prescribes the accounts that are to be kept in connection with the Harbour Fund. Section 4 makes further provision with respect to the annual statement of accounts to be prepared by Harbour Boards. Section 6 contains provisions as to hypothecation of debentures. Section 8 confers additional power to make by-laws. Section 9 authorizes Boards to establish an Imprest Account for payment of casual wages and of emergency expenditure. Section 10 empowers Boards to enter into special agreements to provide cool or refrigerated accommodation for fruit. Section 12 enables the Minister of Marine to grant permits to occupy foreshore vested in the Crown for the purpose of erecting thereon and using boat-sheds, landing-places, or wharves.
The Public Reserves and Domains Amendment Act (1925, No. 44) amends the Public Reserves and Domains Act, 1908, in various particulars. Section 2 authorizes the Minister of Lands to permit increased charges (not exceeding 2s.) to be made for admission to recreation-grounds or public domains. Section 3 allows the Governor-General to authorize the application of moneys derived from any domain for the purposes of any other specified domain. Section 4 makes provision for the union of domains. Section 7 provides that a County Council may pay its contribution towards the expenses of a domain out of the separate account for any riding. Section 10 makes provision for apportionment of the cost of improvement and maintenance of domains in certain cases.
The Hospitals and Charitable Institutions Amendment Act (1925, No. 45) amends the Hospitals and Charitable Institutions Act, 1909. Section 2 disqualifies certain persons from becoming members of committees of management appointed under section 64 of the principal Act. Section 4 permits a Board to arrange with its contributory local authorities as to dates of payment of contributions. Section 6 restricts the application of section 72 of the principal Act, which provides for the recovery by Hospital Boards of the cost of relief afforded to residents of other hospital districts.
The Public Works Amendment Act (1925, No. 47) amends the Public Works Act, 1908. Section 2 makes special provision for the class of motor-vehicles defined as “six-wheeled motor-lorries,” and exempts them from the operation of section 17 of the Amendment Act of 1924. Section 3 makes provision for payment of compensation to owners of motor-vehicles debarred from full use thereof by reason of the provisions of the said section 17. Section 4 authorizes the taking of quarries or gravel-pits when required for the construction of public works or the taking of stone or gravel. Section 5 extends the existing powers of dealing with water-races held under the Mining Act and used for irrigation purposes.
The Legislature Amendment Act (1925, No. 48) amends the Legislature Act, 1908. Section 2 in effect provides that absence at the seat of Government for any period for the purpose of attending meetings of either House of Parliament shall not affect a member's right to enrolment as an elector for the district for which he is enrolled. Section 3 protects the electoral rights of members of the Executive Council. Section 4 provides that the nomination or election of any person shall not be invalidated by reason of his being enrolled for the wrong district.
The Counties Amendment Act (1925, No. 49) amends the Counties Act, 1920, in various particulars. Sections 2 to 6 make further provision with respect to union of counties and the alteration of county boundaries. Section 7 authorizes a Council to establish an Imprest Account for the payment of casual wages and of emergency expenditure. Section 9 provides that the restrictive provisions of the Local Bodies' Finance Act shall not he applicable to riding accounts. Section 11 empowers Councils to purchase or lease existing cattle-dips. Section 12 allows a Council to recover as a rate the cost of rabbit-proof wire netting supplied by it. Section 13 extends the powers of Councils with respect to the licensing of vehicles plying for hire.
The Land Laws Amendment Act (1925, No. 50) amends the Land Act, 1924. Section 2 confers authority on Land Boards to extend, with the approval of the Minister, the term of licenses of land selected for occupation with right of purchase. Section 4 authorizes the disposal of flax leases without auction. Section 5 makes provision for extension of leases of grazing farms in the Cheviot Estate held by discharged soldiers.
The Finance Act (1925, No. 51), which makes provision with respect to public finance and other matters, is divided into Parts as follows:—
Part I.—Public Revenues and Loans.
Part II.—Superannuation Funds.
Part III.—Local Authorities and Public Bodies.
Part IV.—New Zealand and South Seas Exhibition.
Part I (Public Revenues and Loans): Section 2 empowers the Minister of Finance to borrow £4,000,000 for certain public works. Section 3 authorizes the issue in any year of securities to the extent of £500,000 to be available for the payment of death duties. Section 4 empowers the Minister of Finance to borrow £32,000 for the purpose of making advances to the Samoan Treasury. Section 5 contains an additional authority to borrow for the purposes of the Hauraki Plains Act, 1908. Section 6 fixes at £100,000 the annual amount that may be expended in excess of appropriation for working railways, and at £150,000 the amount for all other services. Section 7 increases to £1,500 the annual Government subsidy payable to the New Zealand Institute. Section 8 authorizes the Minister of Finance to refund to racing clubs portion of totalizator duty to be expended for permanent improvement of racecourses. Section 10 prescribes further purposes for which moneys borrowed under the Railways Improvement Authorization Act, 1914, may be applied. Section 11 repeals the New Zealand Consols Act, 1908. Section 12 provides that for purposes of taxation the renewal of debentures shall be deemed to be the issue of new debentures. Section 16 authorizes the State Advances Board to fix, with the approval of the Minister of Finance, rates of interest payable on moneys borrowed from the State Advances Office. Section 23 extends the business of the Government Life Insurance Department, inter alia, to enable the Commissioner to issue sinking-fund and capital-redemption insurance policies, and local authorities are empowered to take out such sinking-fund policies and to appoint the Commissioner to be the sole Sinking Fund Commissioner. Section 25 empowers the Government Insurance Commissioner to hypothecate securities in respect of his Department's investments for the purpose of obtaining advances. Section 26 reduces the interval between distributions of surplus of Government Life Insurance profits.
Part II (Superannuation Funds): Section 27 makes provision for increased benefits for widows and children of deceased contributors to certain Superannuation Funds established in connection with the Government Service. Section 28 saves the rights of those contributors to Superannuation Funds who elected pursuant to the Public Expenditure Adjustment Act, 1921–22, to contribute on the basis of salary received prior to reduction under that Act. Section 29 provides that salaries of contributors to certain Superannuation Funds shall include certain allowances, &c., for the purpose of fixing contributions to the fund and of computing retiring-allowances. Section 33 makes provision as to superannuation rights of certain persons connected with the Government Railway Service. Section 34 extends the provisions of section 39 of the Finance Act, 1924, with reference to the grant of retiring-allowances to Magistrates.
Part III (Local Authorities and Public Bodies): Section 36 authorizes the payment of honoraria to Chairmen of Education Boards. Section 42 makes provision for unauthorized expenditure by the Senate of the New Zealand University, and by the controlling authorities of the four affiliated institutions. Section 44 makes provision as to apportionment of liability for loans as between local authorities in cases of merger, &c. Section 45 increases to £100 per annum the limit of unauthorized expenditure of Education Boards. Section 47 provides that a local authority having established a Superannuation Fund may by special resolution increase benefits payable to widows and children.
Part IV (New Zealand and South Seas Exhibition): Section 48 authorizes the Minister of Finance to lend £25,000 to the Exhibition Company. Section 49 authorizes local authorities to borrow for the purpose of contributing to the cost of the Exhibition. Section 50 extends section 73 of the Finance Act, 1924, relating to suspension for the purposes of the Exhibition of certain Acts fixing labour conditions.
The Appropriation Act (1925, No. 52) appropriates for the use of His Majesty the moneys required for the purposes of the current financial year. In addition it contains a number of miscellaneous provisions. Section 15 makes provision for the payment of New Zealand's proportion of the cost of maintenance of overseas war graves and war memorials. Section 16 authorizes the disposal (by way of gift to the New Zealand Sheepowners' Acknowledgment of Debt to British Seamen Fund) of the unclaimed balance of bonus paid by the Imperial Government in respect of the purchase of New Zealand wool. Section 22 applies section 9 of the Maintenance Orders (Facilities for Enforcement) Act, 1921, to orders made out of New Zealand, and modifies that section to a certain extent.
The Samoa (Shipping) Act (1925, No. 53) (reserved for Royal assent), provides for the application to Samoa of the Shipping and Seamen Act, 1908.
The Shipping and Seamen Amendment Act (1925, No. 54) (reserved for Royal assent), amends the Shipping and Seamen Act, 1908. Section 3 amends section 188 of the principal Act to exempt farmers' launches from survey. Section 4 increases from £100 to £1,000 the penalty for submerging the load-line of a ship.
The Local Authorities Empowering (Relief of Unemployment) Act (1926, No. 2) authorizes local authorities, as defined by the Local Bodies' Loans Act, 1913, to borrow at any time before the 30th June, 1927, without the consent of ratepayers, moneys for the purpose of providing relief works for unemployed.
The Census and Statistics Act (1926, No. 3) repeals the Census and Statistics Act, 1910, and its amendments of 1915. It simplifies the procedure with respect to the taking of the quinquennial census and the furnishing of statistics generally, and widens the powers of the Government Statistician.
The Death Duties Amendment Act (1926, No. 4) amends the Death Duties Act, 1921. The penalty for late payment of death duties is reduced from 10 to 5 per cent. The time within which refunds may be made of duty paid in excess is extended. Provision is made for registration of charges in respect of Native succession duty.
The Evidence Amendment Act (1926, No. 5) amends the Evidence Act, 1908, to enable an accused person and the wife or husband of such person to give evidence in proceedings before Justices in indictable offences, and to authorize the calling as a witness of the wife or husband of a person charged with bigamy.
The Justices of the Peace Amendment Act (1926, No. 7) amends the Justices of the Peace Act, 1908, in various particulars. Section 2 provides that a woman shall not be disqualified by sex or marriage from being a Justice of the Peace. Section 3 prescribes a form of Criminal Record Book. Section 4 extends the period for which persons accused of indictable offences may be remanded by Justices. Sections 5 and 6 are consequential on the provision in the Evidence Amendment Act, 1926, allowing a person accused of an indictable offence to give evidence in proceedings before Justices. Section 7 empowers Justices to impose fines in all cases triable by them where the only penalty provided by law is one of imprisonment. Section 8 extends the powers of the Supreme Court on appeals from Justices. Section 10 provides that a person convicted of mischief may be ordered to pay compensation to the owner of property destroyed or damaged. Section 15 makes provision for summonses upon informations for matters triable summarily being served by registered letter.
The Nurses and Midwives Registration Amendment Act (1926, No. 8) reduces from twenty-three to twenty-two years the limitation as to age of applicants for registration under the Nurses and Midwives Registration Act, 1925.
The Destitute Persons Amendment Act (1926, No. 10) amends in various particulars the Destitute Persons Act, 1910. The amount for which a maintenance order may be made against a near relative of a destitute person is increased from £1 1s. to £2 2s. a week. The limitation of £3 a week on the amount for which a maintenance order may be made against a husband or wife is removed. The liability of parents in respect of the cost of maintenance of children in public or charitable institutions is extended by “child” being defined to include any person under the age of twenty-one years. The penalty for a breach of a maintenance order is imprisonment for six months, and, in addition to or in lieu of imprisonment, a fine of £20. Orders for maintenance made by the Supreme Court in divorce or other matrimonial proceedings may be enforced as maintenance orders under the principal Act. Officers of Court may be appointed to facilitate recovery of arrears of moneys payable under maintenance orders. The clearing of the Court during proceedings under the principal Act is authorized.
The Fire Brigades Act (1926, No. 11) consolidates with numerous amendments the Fire Brigades Act, 1908, and the various Acts amending the same. The principal new provisions are section 26, which provides a new scale of Government contributions to Fire Board funds; section 33, empowering Boards to establish sinking funds for repayment of loans; sections 34 to 41, empowering Boards to establish capital-expenditure funds, and section 42, empowering Boards to establish funds to provide gratuities or pensions on retirement of officers. No servant or agent of an insurance company may hold office as the secretary of a Fire Board. The occupier of a public building is required to keep passages in and exits from such building free from obstructions.
The Police Offences Amendment Act (1926, No. 12) amends the Police Offences Act, 1908. Section 2 makes it an offence to obtain admission to any place without paying the fee lawfully charged for admission thereto. The effect of section 3, which amends section 41 of the principal Act, is to make punishable under that Act the offence of doing any indecent Act in any place intending thereby to insult or offend any person. Hitherto such an offence, even if of a minor character, could only be punished under the Crimes Act. Section 4, which is in substitution for paragraph (a) of section 49 of the principal Act, makes fresh provision with respect to the arrest of persons without lawful means of support. Section 5 amends section 7 of the Police Offences Amendment Act, 1924, to make it an offence to be found at any time on property without lawful excuse, but not under circumstances disclosing criminal intent.
The Local Bodies' Loans Act (1926, No. 14) consolidates with few amendments the Local Bodies' Loans Act, 1913, and the various Acts amending the same. Moneys due under debentures may be made payable free of exchange, and overdue interest, &c., on debentures may be recoverable with interest thereon. These are two new provisions.
The Dairy-produce Export Control Amendment Act (1926, No. 19) amends the Dairy-produce Export Control Act, 1923, principally in the direction of making fresh provision with respect to the election of producers' representatives on the Board established under the principal Act. Section 2 divides New Zealand into nine wards for the purpose of election of producers' representatives. Section 6 provides that in every ward an election shall be conducted by post. The voting-papers are arranged by the Returning Officer with reference to the factories to which the producers are suppliers, and he then ascertains with respect to each factory separately the number of valid votes recorded in favour of the several candidates. He then ascertains separately with respect to each company by which any factory as aforesaid is owned or occupied the number of valid votes recorded in favour of the several candidates. By section 7 it is provided that when the Returning Officer has ascertained in respect of each company the number of valid votes recorded in favour of the several candidates, he shall then proceed to ascertain the quantity of butter and cheese exported by each company from factories within the ward during the last preceding twelve months, and allot to each such company a number of tonnage votes ascertained as provided in the Second Schedule to the Act. Then by section 8 it is provided that the candidate who has received from the suppliers to the factories of any company the greatest number of valid votes shall be entitled to receive all the tonnage votes allotted to that company. The candidate who receives the greatest number of tonnage votes is declared elected. Section 9 provides that the cost of election of producers' representatives shall be borne by the Board. Section 10 allows members of the Board to be appointed to its London agency.
The Scenery Preservation Amendment Act (1926, No. 20) amends the Scenery Preservation Act, 1908. The Minister may authorize the taking or killing of certain animals or birds in scenic reserves. Licenses to occupy portions of scenic reserves for short terms may be granted. Land acquired or reserved for scenic purposes under other Acts may be proclaimed reserves under the principal Act. Local authorities are empowered to contribute towards the cost of acquisition of land for and improvement of reserves.
The Cook Islands Amendment Act (1926, No. 21) makes section 28 of the Cook Islands Act, 1915, apply to all service in the Cook Islands for the purpose of computing for superannuation purposes the length of service of officers of the New Zealand Public Service employed in the Cook Islands Public Service.
The Cinematograph-film Censorship Amendment Act (1926, No. 22) enables the Governor-General in Council to make regulations for the censorship of posters and other advertising-matter in connection with the exhibition of cinematograph-films.
The Cemeteries Amendment Act (1926, No. 23) amends in various particular the Cemeteries Act, 1908. The administration of the principal Act is transferred to the Minister of Health. The principal provisions deal with the subject of cremation—broadly speaking, in the direction of bringing New Zealand legislation into line with the Imperial Act of 1902. Section 45 of the principal Act is amended to enable cemetery trustees to make special provision for the burning of any human remains according to the rites of any religious denomination elsewhere than in a crematorium. This provision was made to meet the case of Hindus, of whom there is now a fairly large number settled in the North Island.
The Land and Income Tax Amendment Act (1926, No. 24) amends the Land and Income Tax Act, 1923. A person absent from New Zealand in the service of the Government, and the wife of such person, are not deemed to be absentees for the purposes of those sections of the principal Act which provide an increase of land-tax and income-tax in the ease of absentee taxpayers. Section 71 of the principal Act is amended to limit the taxation of Native land by reference to the revenue therefrom. Special provisions are made for the computation of income derived from the sale or other disposal of trading stock. A taxpayer is entitled to an allowance under section 83 of the principal Act in respect of improvements in use during the income-year notwithstanding that such improvements may not then have been valued. Employers in New Zealand of non-resident taxpayers are empowered to deduct amount of tax from salaries of such employees, and the deduction of tax from pensions or retiring-allowances is also authorized. Section 122 of the principal Act is amended to impose on the agent in New Zealand of a non-resident trader the obligations of his principal. No fee is chargeable in respect of the registration of any charge under section 11 of the Amendment Act of 1924, but fees are fixed in respect of the registration of the release of any such charge.
The Samoa Amendment Act (1926, No. 25) amends in various particulars the Samoa Act of 1921. Polynesians of mixed descent, but having the status of Europeans, may be declared Samoans. Provision is made for reduction in the number of official members of the Legislative Council of Western Samoa. The jurisdiction of the High Court in matters matrimonial is extended to suits for restitution of conjugal rights. The Legislative Council of Western Samoa is empowered to make ordinances dealing with divorce and other matters matrimonial applicable to Samoans only. Provision is made for the application of profits accrued or accruing in the New Zealand Reparation Estates Account.
The Industrial Societies Amendment Act (1926, No. 26) amends the Industrial Societies Act, 1908, by making provision for the change of name of an incorporated Society and for the dissolution of societies, and transfers the administration of the principal Act to the Minister of Industries and Commerce.
The Oil in Territorial Waters Act (1926, No. 27) is based on and generally follows the scheme of the Imperial Act 12 & 13 Geo. V, c. 39, but is wider in its application. Section 3 imposes a fine of £500 for the offence of discharging or allowing oil to escape into territorial waters from ships, places on land, and certain apparatus, and in addition provides for the offender paying the cost of removal of oil. Section 4 makes provision for the detention of ships in cases of damage to property by the discharge of oil, until security is given to abide the event of any action in respect of such damage. Section 5 requires masters of overseas vessels carrying oil to notify the Harbourmaster at New Zealand ports before arrival thereat. Section 6 provides that liquid contained in any space used for the carriage of oil shall be deemed to be oil for the purposes of this Act. Section 7 makes the cost of removing oil discharged or which has escaped into territorial waters a debt due to the Crown or to a Harbour Board, as the case may be. Section 8 allows fines to be applied towards the cost of removing oil or making good damage. Section 9 confers power to inspect premises and ships, and section 10 deals with legal proceedings. A Collector of Customs may detain a ship in territorial waters, notwithstanding that clearance has been granted, if he has reason to believe that an offence against this Act has been committed.
The Scientific and Industrial Research Act (1926, No. 28). makes provision for the promotion and organization of scientific research, and for its application to the primary and secondary industries of New Zealand. A Department of Scientific and Industrial Research is constituted. It is charged with the maintenance and administration of such scientific services and laboratories as may be transferred to it, or as may be hereafter created or established and placed under its charge; and it is also charged with the duty of advising the Government on all questions of policy relating to scientific matters that may be referred to it. Section 6 establishes an Advisory Council of Scientific and Industrial Research, to consist of a chairman and not more than six other persons (not being officers in the service of the Government) to be appointed by the Governor-General for a term not exceeding four years. Sections 7, 8, and 9 contain machinery provisions dealing with meetings of the Council, its functions and duties, and payment of allowances and expenses of the Council and committees. Section 10 provides that discoveries, inventions, &c., made by officers of the Department or persons in receipt of departmental grants for research and arising out of such research shall be vested in the Crown as its sole property, and shall be made available for use on such conditions (including payment of fees or royalties) as the Minister determines. Bonuses or grants may be made to officers and such other persons in respect of such discoveries or inventions. Section 11 empowers the Department to charge fees for carrying out special investigations. Section 12 makes provision for National Research Scholarships.
The Family Allowances Act (1926, No. 30) makes provision for the grant of allowances towards the maintenance of children by parents with limited incomes. By section 2 the following are excluded from the definition of “child” for the purposes of this Act: an illegitimate child; a child who is not in fact maintained as a member of the family of the applicant; any child in respect of whom a pension out of public moneys is payable under the Pensions Act, 1926, or the War Pensions Act, 1915, or other enactment; or any child over the age of fifteen years. Section 3 makes provision for the payment of an allowance under this Act to any person being the father of three or more children, at the rate of 2s. a week for every child in excess of two, but so that the average weekly income from all sources of the family of the applicant, including an allowance payable under this Act, shall not exceed £4, together with 2s. for each child of the applicant in excess of two. Section 4 lays down how the average weekly income of any person shall he computed for the purposes of this Act Section 5 provides for an extension of the benefits of the Act in respect of totally incapacitated children who are over the age of fifteen years. By section 6 allowances are, save in exceptional cases, to be paid to the wife of the applicant. By section 7 no allowances shall be payable unless the applicant and his wife (where the allowance is payable to her) have been permanently resident in New Zealand for not less than one year or have been born in New Zealand. Section 8, provides that aliens or Asiatics (whether British subjects or not) shall not receive allowances save by the direction in writing of the Minister, and allows the Commissioner by direction of the Minister to refuse to grant allowances in certain cases. By section 10 allowance-moneys are to be expended exclusively towards the maintenance of dependent children. Section 11 provides that in no case shall any allowance payable under this Act be in any way assigned or, charged or pass to any person by operation of law.
The Peel Forest Act (1926, No. 31) authorizes the reservation of certain lands situated in and adjoining Peel Forest for the preservation of natural scenery, and provides for the control and management thereof. In general it follows the scheme of the Egmont National Park Act, 1924, and the Tongariro National Park Act, 1922.
The Guardianship of Infants Act (1926, No. 32) which is deemed to be part of Part I of the Infants Act, 1908, is a close adaptation of the Imperial Guardianship of Infants Act. 1925.
The Fisheries Amendment Act (1926, No. 33) enables special licenses to be issued in respect of fishing in part of the Rotorua Acclimatization District.
The Local Railways Amendment Act (1926, No. 34) amends the Local Railways Act, 1914. Section 2 authorizes the subdivision of railway districts into wards for purposes of representation. Section 3 amends section 13 of the principal Act to substitute triennial for biennial elections of Railway Boards. Section 4 provides machinery for the abolition of railway districts. Section 5 makes provision with respect to the filling of casual vacancies on Railway Boards. Section 6 provides that, for purposes of inspection, locomotives in use on district railways shall be deemed to belong to the Government.
The Dairy Industry Amendment Act (1926, No. 35) amends the Dairy Industry Act, 1908. Section 2 extends the powers of Inspectors under section 6 of the principal Act to order defects to be remedied. Section 3 makes provision for the apportionment between landlords and tenants of expenditure on buildings or other permanent farm improvements which is rendered necessary by reason of an order of an Inspector made pursuant to sections 6 and 7 of the principal Act. Section 4 amends section 12 of the principal Act to widen the prohibition on the keeping, &c., of pigs near dairies. Section 5 amends section 16 of the principal Act to enable the manner of cooling milk to be prescribed, and extends it to include the cooling of cream. Section 6 amends section 21 of the principal Act to prohibit the export of butter containing less than 80 per cent. of butterfat. Section 7 enables the making of regulations requiring owners of dairy factories to pay different prices for different grades of milk or cream supplied to such factories for manufacture, and fixing the minimum amounts by which the prices shall vary for the different grades. Section 8 prohibits dairy companies from describing themselves as co-operative unless they actually are so.
The Rent Restriction Act (1926, No. 36) amends Part I of the War Legislation Act, 1916 (relating to restriction of rent) and continues its operation, and marks a further stage in the development of that legislation. Section 2 continues the existing legislation until the 1st August, 1927. Section 4 effects a radical change in the policy of the rent-restriction legislation, the general principle of the change being that the legislation shall cease to apply to any dwellinghouse or part of a dwellinghouse after the said 1st August, 1927. But subsection (2) provides that at any time before that date a tenant may apply to a Stipendiary Magistrate for an order declaring that the said Part I and its amendments, as amended by this Act, shall continue to apply to the specified dwellinghouse after that date. Subsection (3) provides that at any time after that date application may be made by a tenant for an order that the said enactments shall be reapplied to the specified dwellinghouse. By subsection (4) the Magistrate is directed to take into consideration the hardships that would be caused by either the granting or the refusal of the application, and only if it is proved to his satisfaction that the tenant would suffer greater hardship by refusal than the landlord would suffer by the granting of the application the Magistrate may make an order. Section 5 provides that the whole of the rent-restriction legislation shall expire on the 1st January, 1928.
The Lights on Vehicles Amendment Act, (1926, No. 37) amends the Lights on Vehicles Act, 1915, by providing that the principal Act shall have no application to motor-vehicles that are for the time being subject to regulations as to lighting made under the Motor-vehicles Act, 1924, and that every bicycle (not being a motor-vehicle) shall be equipped with a red reflector.
The Hauraki Plains Act (1926, No. 39) consolidates with numerous amendments the Hauraki Plains Act, 1908, and its amendments. For the most part it is designed to give legislative authority to the departmental scheme of administering the repealed Acts, but sections 16, 17, and 19 confer many new powers. The total amount that may be borrowed for the purpose of rendering the Hauraki Plains fit for settlement is increased to £900,000.
The Magistrates' Courts Amendment Act (1926, No. 40) amends the Magistrates' Courts Act, 1908. The salary of the principal Magistrate in each of the four cities of Auckland, Wellington, Christchurch, and Dunedin is raised to £1,000 per annum. All other Magistrates are to be paid at the rate of £900 per annum. Section 3 amends the principal Act to enable attachment orders to be made by a Magistrate, or, where no Magistrate is available, by two Justices. Section 4 provides that money paid into Court pursuant to an attachment order shall not be paid out except pursuant to an order of a Magistrate. Section 5 amends section 153 of the principal Act to provide that notices of appeal shall be in writing and be served on the opposite party, and that a duplicate of such notice shall be left with the Clerk of the Court.
The Marriage Amendment Act (1926, No. 41) enables the Minister of Internal Affaire to exercise proper control over the recognition as officiating ministers of persons not attached to recognized religious organizations.
The Local Elections and Polls Amendment Act (1926, No. 42) amends the Local Elections and Polls Act, 1925, in various particulars. Section 5 provides a new-form of voting-paper for both elections and polls—the parliamentary system of striking out names being substituted for the present system of marking with a cross, and all voting-papers are to be provided with a counterfoil. Section 12 makes provision for certain persons voting by declaration whose names are not on the roll prepared for the purposes of any election or poll. Section 13 makes provision for voting by bodies corporate and unincorporated societies or associations of persons, or any firm, co-partnership, or joint tenants. Section 17 repeals, and re-enacts as part of the principal Act, sections 11 and 12 of the War legislation Act, 1917, dealing with local electoral rights of aliens. The definition of “local authority” is extended.
The Main Highways Amendment Act (1926, No. 43) amends the Main Highways Act, 1922. Section 2 provides that the Main Highways Board may, out of its Revenue Fund, advance moneys to local authorities to provide a proportion of the cost of construction of main highways. Section 3 amends section 8 of the principal Act to enable the constitution of such number of highway districts as may be thought fit, instead of rendering it necessary to divide the whole of New Zealand into highway districts. Section 4 amends section 23 of the principal Act to increase the authority of the Main Highways Board to contribute towards the cost of maintenance of streets being continuations but not parts of main highways. Section 5 authorizes the Board to contribute up to three-fifths, instead of one-half as ah present, of the cost of maintenance of main highways.
The Dentists Amendment Act (1926, No. 44) makes provision for the examination and registration under the Dentists Act, 1908, of certain unregistered dentists.
The Finance Act (1926, No. 46) makes provision with respect to public finance and other matters, and is divided into Parts as follows:—Part I.—Public Revenues and Loans. Part II.—Superannuation Funds and Pensions. Part III.—Miscellaneous.
Part I (Public Revenues and Loans): Loan authorities contained in this Part are as follows: Public Works, £5,000,000; Railways Improvement, £2,000,000; Samoan Treasury, £16,000; Deteriorated Land Act, 1925, £200,000; Forests Act, 1921–22, £500,000; Waihou and Ohinemuri Rivers Improvement Act, 1910, £100,000.
Section 10 authorizes the conversion into income-tax-bearing securities of securities issued free of income-tax. Section 11 extends the powers under various Acts appointing persons to exercise in the United Kingdom powers or functions of the Governor-General or the Minister of Finance. Section 12 authorizes the Inspector-General of Mental Hospitals in certain cases to remit moneys due to the Crown under the Mental Defectives Act, 1911. Sections 13 and 14 amend the Land Transfer Act, 1915, and the Property Law Act, 1908, respectively, to make further provision for fees in respect of sales of land through Registrars of the Supreme Court. Section 15 increases from £4 to £8 a day the amount payable by parties under section 159 of the Juries Act, 1908, in respect of the services of jurors in civil proceedings; and section 16 makes provision for refunds where cases are withdrawn. Section 22 provides that the amount of any securities redeemed at any time under the Repayment of the Public Debt Act, 1925, shall be a liability of the appropriate account to the Consolidated Fund. Section 23 makes special provision with regard to payment of stamp duty in respect of transfers of certain stock. Section 24 makes certain concessions to members of the General Assembly in respect of travelling by service cars. Section 27 makes further provision regarding the disposition of fees payable under the Motor-vehicles Act, 1924. Section 28 contains special provisions as to the amount of subsidy payable in cases where two or more counties have been united. Section 29 provides that salary in excess of the prescribed maximum for his division may be paid to any classified officer of the Public Service.
Part II (Superannuation Funds and Pensions): This Part contains a number of miscellaneous amendments and extensions of provisions dealing with Public Service and teachers' superannuation, and in addition section 34 provides that pensions in respect of the death or disablement of members of the New Zealand Defence or Naval Forces may be paid on the scale prescribed in respect of war pensions.
Part III (Miscellaneous): Section 41 authorizes Hospital Boards to deposit with approved local authorities unexpended balances of loan-moneys. Section 43 cancels the authority conferred on Harbour Boards by section 95 of the Harbours Act, 1923, to deposit moneys with building societies, &c.
The Maori Arts and Crafts Act (1926, No. 48) is designed to encourage the dissemination of knowledge of Maori arts and crafts. Section 2 establishes a Board of Maori Arts, the members of which are to be appointed by the Governor-General in Council. Section 3 declares it to be the duty of the Board to foster and encourage the study and practice of Maori arts and crafts. Section 4 empowers the Board, in furtherance of its objects, to establish one or more schools of Maori art or other institutions for the study and practice of the arts and crafts known to and practised by the Maori people, and for that purpose the Board may, inter alia, acquire land and buildings. All such schools are to be controlled and managed by the Board. By section 5 the Board is empowered to deal in articles having distinctive Maori characteristics; to acquire books and publications connected with Maori arts and crafts; and to print or reprint references to Maori traditions, life, or work considered worthy of permanent record. Section 6 empowers the Board to accept the custody and control of Maori antiquities which are the property or are in the possession of the Crown or which may be entrusted to its custody by any Court or person.
The Land Laws Amendment Act (1926, No. 49) extends the right to acquire the freehold of lands of the Crown.
Part I (Purchase of Crown Land on System of Deferred Payments): Section 2 provides that after the passing of this Act no Crown land shall be disposed of by way of occupation with right of purchase under the principal Act (Land Act, 1924), but all Crown lands which might have been so disposed of may be disposed of by way of sale on deferred payments in the manner provided by section 3, which sots out at length special provisions governing such sales. Section 4 enables the Governor-General in Council to impose the special condition on sales under this Part that any land so sold shall not be capable of being transferred until improvements of the prescribed extent and character have been made, or, failing such improvements, until not less than 25 per cent. of the price of such land has been received by the Crown. Section 5 amends section 77 of the principal Act in the direction of applying the foregoing provisions of this Act to purchase at auction on deferred payments under the principal Act. Section 6 contains provisions with respect to the payment of purchase-money by owners of leases in perpetuity who elect to acquire the freehold. Section 7 enables holders of existing licenses to occupy with right of purchase to acquire the fee-simple on deferred payments. Section 8 makes provision for the exchange of existing licenses to occupy land pending completion of purchase for similar licenses granted in terms of this Part of this Act.
Part II (National-endowment Lands): Section 9, which constitutes this Part, makes numerous amendments of provisions of the principal Act relating to national-endowment lands, with the object of enabling the freehold of such lands to be acquired.
Part III (Special Settlement of Inferior Lands): Section 11 extensively amends section 223 of the principal Act with the object of facilitating the disposal of inferior lands.
Part IV (Settlement Lands): Section 12 amends section 82 of the Land for Settlements Act, 1925, to apply the provisions of this Act as to deferred payments to purchases of freehold of settlement land held under leases in perpetuity. Section 13 provides that capital moneys in the Land for Settlements Account shall be charged with interest at 4 per centum per annum, which shall be payable into the Consolidated Fund.
Part V (Miscellaneous): Section 15 empowers owners of renewable leases of land not included in the national endowment to acquire the fee-simple. Section 16 extends the provisions of the principal Act as to relief of Crown tenants by way of remission or postponement of rent, and section 17 makes these extended provisions applicable to purchasers on the deferred-payment system. Section 20 confers authority to vest Crown land in local authorities for afforestation purposes. Section 21 makes applicable to certain lands disposed of to discharged soldiers the provisions of the principal Act as to revaluation of rural lands.
The Veterinary Surgeons Act (1926, No. 50) which provides for the registration of veterinary surgeons, generally follows the scheme of similar registration Acts in recent years. The principal qualification for registration is membership of the Royal College of Veterinary Surgeons at London. Section 14 (2) without enabling registration as veterinary surgeons, authorizes persons to practice as “veterinary practitioners” who have practised in New Zealand for ten years immediately prior to the commencement of this Act and who lodge their names with the Minister of Agriculture not later than twelve months after such commencement.
The Workers' Compensation Amendment Act (1926, No. 51) amends the Workers' Compensation Act, 1922, in the direction of increasing compensation payable in respect of injuries resulting in the death or total or partial incapacity of a worker. The maximum amount henceforth payable in respect of death is £1,000, and a similar maximum is fixed in respect of the aggregate amount of weekly payments in respect of total or partial incapacity.
The Town-planning Act (1926, No. 52) provides for the making and enforcement of town and regional planning schemes. Every town-planning scheme must have for its general purpose the development of the city, borough, or town district to which it relates (including, where necessary, reconstruction of any area already subdivided and built on) in such a way as will most effectively tend to promote its healthfulness, amenity, convenience, and advancement. Every regional planning scheme must have, in relation to the rural area to which it relates, the same general purposes as a town-planning scheme in relation to a borough, but, save in cases where exceptional conditions prevail, every regional scheme is to be primarily prepared and dealt with in relation to and as complementary of the town-planning scheme of any city or borough in the vicinity of the rural area. It is obligatory on the Council of every borough with a population of not less than 1,000 to submit to the Town-planning Board before the 1st January, 1930, a town-planning scheme in respect of all land within the borough; and provision is made for requiring other boroughs to submit schemes. Section 14 extends the Act to apply to certain Road Boards near the City of Auckland, as if they were boroughs. Section 15 makes provision as to the contents of the town-planning scheme. Sections 16 to 21 deal with the submission of town-planning schemes to the Board and their provisional approval, submission, and hearing of objections, and final approval by the Board. Section 22 requires each borough affected to enforce the observance of the requirements of its approved scheme in respect of all new works, and, save with the consent of the Board, not to permit any alteration of existing works if alteration or modification would tend to prevent or delay their being brought into conformity with the tenor of the approved scheme. A Borough Council is given, in addition to powers conferred on it by the Municipal Corporations Act, 1920, all powers and authorities reasonably necessary to enable it to carry out its approved scheme; statutory provisions as to width of streets are declared not to be binding, and provision is made for the Governor-General in Council to exempt it from other statutory limitations. Section 23 provides for modification and elaboration of approved schemes with the consent of the Board. Section 24 defines “rural area,” and makes provision for responsible authorities to be charged with the preparation of schemes. Section 25 provides that a responsible authority shall, on being required so to do by the Governor-General in Council, prepare a regional planning scheme for its area; and also provides for County Councils of their own initiative preparing such schemes. Section 27 makes. provision for the operation of regional schemes, and confers all necessary powers. Section 28 makes provision for joint action by local authorities in the preparation of a combined town and regional planning scheme for the area within their jurisdiction. Section 29 makes full provision with respect to payment of compensation to persons injuriously affected by town or regional planning schemes. Section 30 provides for payment by property-owners of betterment, which is defined to mean in relation to any rateable property such increase in the value of the property as is attributable to the approval of a town or regional planning scheme, or to the carrying-out of any work authorized by the scheme. Section 32 authorizes the Director of Town-planning to certify plans of subdivision of lands for towns as provided for in the Land Act, 1924, and section 33 provides that subdivisions in boroughs may, if approved by the Director, provide for streets of reduced width. Section 34 empowers local authorities, pending the preparation of town-planning schemes, to refuse to allow the erection of buildings or the undertaking of any work that would contravene principles of town-planning.
The Education Amendment Act (1926, No. 53) amends the Education Act, 1914, in various particulars. Section 4 limits to Education Boards the power to expel children from school. Section 6 imposes a disability on a teacher who refuses a position for which he has applied unless he gives sufficient and proper reason, he not being eligible for another appointment for a period of twelve months from the date of his refusal or for such shorter period as the Director of Education fixes. The principal effect of sections 8 to 11 is to reduce the number of National Scholarships but to increase the lodging-allowances to holders. The maximum age for Junior National Scholarship candidates is reduced from fourteen to thirteen years. Section 12 provides that in determining the winners of scholarships consideration may be given to the ages of candidates.
The Rural Advances Act (1926, No. 54), which forms part of the State Advances Act, 1913, establishes a separate branch of the State Advances Act, 1913, with extended authority to grant loans secured on mortgages of rural lands and having power to issue bonds secured on such mortgages. For the purposes of the Rural Advances Branch an additional member of the State Advances Board may be appointed as representative of primary producers. The maximum loan that may be granted is £5,500, no advance to exceed more than two-thirds of the security in the case of freehold lands, or two-thirds of the lessee's interest in his lease in the case of leasehold lands. The State Advances Superintendent is authorized to issue bonds, stock, or other securities to provide funds for the branch. These bonds, &c., are to constitute a floating charge on all the assets of the branch, including therein all mortgages for the time being securing loans granted by the Superintendent under this Act, the aggregate amount not to exceed the capital value of the mortgages for the time being held by the Superintendent as assets of the branch. Securities issued in terms of this Act are not to form part of the public debt. Trust funds may be invested in securities issued under this Act, and such securities may be accepted by the Superintendent in repayment of any loan.
The Bank of New Zealand Act (1926, No. 55) enables the Bank of New Zealand to increase its capital by the creation of 1,406,250 shares of £1 each, and also enables it, with, the approval of the Minister of Finance and the sanction of holders of ordinary shares, from time to time to further increase the capital. Provision is made for the bank to borrow by way of debentures and debenture stock, and to make long-term loans on first mortgage. All shares created pursuant to this Act are to be called “long-term mortgage shares,” divided into two classes —C and D—which are to be created in the proportion of one C share to two D shares, and allotted accordingly. The Crown is given the prior right of subscribing for C shares, and holders of ordinary shares have the prior right of subscribing for D shares in proportion to their holdings. Unsubscribed shares of either class may be allotted by the directors at their discretion. Long-term mortgage shareholders mil have no voting-rights. Provision is made for postal voting by ordinary shareholders on the respective questions of an increase of capital and the cancellation of capital for the purposes of this Act. Special power is conferred on the directors to borrow on behalf of the bank by the issue of debentures or debenture stock having a currency not exceeding thirty-seven years, and these debentures or debenture stock are made a trustee investment. The proceeds of the issue of shares created pursuant to this Act, and of debentures or debenture stock, are to constitute a fund to be called the “Long-term Mortgage Fund,” to be utilized solely for the purpose of making advances on first mortgage of freehold or leasehold lands in New Zealand, and all repayments and recoveries of principal moneys so advanced will belong to that fund and be available for relending. The term of any mortgage is not to exceed thirty-seven years, and the amount of any advance is not to exceed two-thirds the value of the security in the case of freeholds, or one-half the lessee's interest in the case of leaseholds. The directors may establish a special reserve to provide for losses incurred in respect of long-term mortgage loans. Half-yearly meetings of proprietors are abolished, and the procedure for the election of directors is modified. The provisions of the deed of settlement limiting holdings of shares are not to apply to long-term mortgage shares. Provision is made for the transfer of shares held in co-ownership, on the death of one or more of the co-owners.
The Pensions Act (1926, No. 56) consolidates without amendment the Pensions Act, 1913, and other enactments dealing with old-age, widows', blind, miners', and military (Maori and South African Wars) pensions.
The Westport Harbour Amendment Act (1926, No. 57) amends the Westport Harbour Act, 1920. The provisions generally deal with matters of machinery, but section 5 increases the special rate charged on coal shipped at Westport.
The Swamp Drainage Amendment Act (1926, No. 58) amends the Swamp Drainage Act, 1915. The Minister of Lands is authorized to levy an administration and maintenance rate, and additional powers are conferred on him for the purpose of carrying out drainage-works.
The Local Government Loans Board Act (1926, No. 60) establishes a Local Government Loans Board and defines its powers. As far back as 1915 it was made unlawful for local authorities to borrow without the consent of the Governor-General in Council, and this was repeated in section 20 of the Finance Act, 1919. Section 2 of this Act extends the definition of “local authority” to include other bodies than those which were subject to the former enactments, and section 3 prohibits local authorities from borrowing (otherwise than in anticipation of their revenue within the limits of their powers, if any, in that behalf) without the precedent consent of the Governor-General in Council given after compliance with the provisions of this Act. Section 4 constitutes the Local Government Loans Board, which is to consist of the Secretary to the Treasury, the Engineer-in-Chief of the Public Works Department, and five other persons appointed by the Governor-General to hold office during his pleasure. Section 5 requires every local authority which proposes to borrow any moneys otherwise than in anticipation of its revenue to submit to the Board an application and statement giving such information and particulars as the Board requires. The Board may cause to be made such investigations in respect of such application as it thinks fit. The Board may sanction the application, wholly or in part, and either unconditionally or subject to such terms, conditions, and stipulations as it thinks fit; or require the applicant to divide the loan proposal into constituent items, so that ratepayers may vote separately on each item; or refer the application back for modification or amendment; or decline to sanction it. In no case, however, is the Board to sanction any application unless provision is made to its satisfaction for repayment of the loan within such period as it deems reasonable having regard to the probable duration and continuing utility of the works for the purposes of which the loan-moneys are to be expended. An application declined by the Board may not be renewed within twelve months, and no poll of ratepayers is to be taken before the Board's sanction is given. Results of loan polls are to be notified to the Board. Where a proposal is carried the Board notifies the result to the Minister of Finance, who recommends the Governor-General in Council to authorize the raising of the loan. No further steps can be taken by the local authority until the Governor-Generals consent has been given. In cases where the authorizing Act does not require a poll of ratepayers, the consent of the Governor-General in Council may be given on the Board's sanctioning the application. The Governor-General in Council may impose such conditions as he thinks fit with respect to the time at which the moneys may be borrowed, the rate of interest that may be paid, the terms of the ban, and provisions for repayment thereof, and it is unlawful for the local authority to borrow save in accordance with the conditions so imposed, The Act does not apply to authorities to borrow for the purpose of meeting liabilities imposed on any local authority by or pursuant to any Act. The Act applies to renewals of loans, but the Board may not decline to sanction a proposal to renew a loan, though it may impose conditions with respect to repayment by creation of a sinking fund or otherwise. The Minister of Finance may grant exemption from the operation of this Act in cases where steps to raise a loan have been taken before the coming into operation of this Act.
The Stamp Duties Amendment Act (1926, No. 63) amends the Stamp Duties Act, 1923, in various particulars. Section 2 amends the definition of the term “stamp” contained in section 2 of the principal Act, and section 3 amends section 10 of that Act to define the respective uses of impressed and adhesive stamps. The principal effect of these two sections is to abolish the old classification into “revenue” and “postage” stamps. Sections 4 and 5 make provision for the application and apportionment between Departments of State of revenues derived from stamps. Section 6 amends section 16 of the Post and Telegraph Act. 1908 (as to the use of recording-machines for impressing stamp values), to allow of their use for stamping receipts. Section 7 further limits the duty payable on assignments of money owing by dairy companies to suppliers of milk. Section 8 amends section 84 of the principal Act to provide an alternative mode of assessment whore the consideration for a conveyance on a sale is not ascertainable. Section 9 imposes a duty of 2s. 6d. on an instrument varying the terms of a mortgage, and makes the mortgagee the person primarily liable. Section 10 exempts (retrospectively) from stamp duty cheques drawn by trustees of war funds. Section 11 requires every company ceasing to carry on business in New Zealand to notify the Commissioner.
The Native Land Amendment and Native Land. Claims Adjustment Act (1926, No. 64) further amends the laws relating to Native lands, and provides for the determination of certain claims and disputes in relation to Native lands, and confers jurisdiction with respect to certain matters upon the Native Land Court and the Native Appellate Court. It also makes provision with respect to the Taupo waters, vesting the bed of Lake Taupo in the Crown, and making special provision as to fishing in those waters, and for the payment of an annual sum and a proportion of fishing license fees to the Tuwharetoa Trust Board.
The Native Trustee Amendment Act (1926, No. 65) amends the Native Trustee Act, 1920. The Native Trustee is not compelled to assign a mortgage debt in any case where such assigning would assist in evasion of the provisions of the Native Land Act, 1909, with regard to confirmation of alienation by Natives of Native freehold land. Funds accepted for special investment otherwise than in the Common Fund shall not be guaranteed. In the administration of trusts the Native Trustee is exempted from the provisions of the Native Land Act, 1909, limiting the area that may be acquired by any person. The Native Trustee may be appointed as a trustee, executor, agent, or attorney.
The Westland and Nelson Coalfields Administration Amendment Act (1926, No. 66) amends the principal Act of 1877, principally in the direction of providing a better form of tenure in connection with leases of the lands comprised in the Westport Colliery Reserve.
The Motor-omnibus Traffic Act (1926, No. 67) is designed to regulate motor-omnibus traffic. A “motor-omnibus” is defined as meaning a vehicle propelled by mechanical power, and designed solely or principally for the carriage of persons exceeding seven in number, inclusive of the driver, but does not include a vehicle running on rails, or a vehicle which though not running on rails, derives motive power from an overhead wire: “Motor-omnibus service” is defined as meaning the carriage by motor-omnibus of passengers for hire at fares, however computed, not exceeding for each person the sum of 2s. for any journey, counted one way only. Motor-omnibus districts are constituted, for each of which there is to be a licensing authority (to be appointed by the Minister of Public Works) which shall in every case be the Council or Board of a borough, county, or town district situated in whole or in part within the boundaries of the district. A motor-omnibus service may be carried on only pursuant to a license issued under this Act. The licensing authority in determining upon the grant or refusal of a license has to take into consideration any existing or proposed facilities for the transport of passengers within the area proposed to be served, the condition of the roads or streets proposed to be traversed, the normal traffic thereon, and other considerations, and no license is to be granted in respect of any motor-omnibus unless it complies with the requirements. The licensing authority has to give public notice of every application for a license, and give to every local authority in the district, and to every public authority or person engaged in carrying on a tramway or motor-omnibus service in the district, an opportunity to be heard: and every such local or public authority is given a right of appeal from the licensing authority's determination. Provision is made for the license to expire each year on the 31st May, and for renewals of licenses, and no license may be transferred except with the consent of the licensing authority endorsed on the license. The licensing authority is required to fix routes, fares, and time-tables. Fares are to be so fixed that over any route or section thereof they shall (in the case of adult passengers) be at least 2d. more than the corresponding fare charged in respect of the existing service. This obligation does not apply in respect of fares for passengers whose journey begins or ends at a point not less than a quarter of a mile beyond the terminus of any existing tramway or other service, or in respect of a motor-omnibus service carried on by any local or public authority. The owner of any licensed motor-omnibus must not use it for the carriage of passengers unless he has obtained and deposited with the licensing authority a policy or policies of insurance indemnifying him to the prescribed extent against compensation or damages in respect of the death of any person or of injury to any person or property arising out of any accident affecting that motor-omnibus. Notice of accidents must be given to the Minister. The owner of an existing undertaking carried on in competition with a public tramway or other service may require the local authority to purchase the same, and machinery is set up for determining such claims. A local authority so required to purchase any such undertaking may raise a loan for that purpose without the consent of ratepayers. For each district there is constituted a Transport Appeal Board, consisting of five members—two Government representatives, one representative of local authorities or public bodies which have established any passenger motor-omnibus or tramway service within the district, one representative of other local authorities in the district, and one representative of private owners of motor-omnibuses in the district. Special provisions are applicable in cases where transport provision has not been made with respect to any area in a tramway district. Any fifty adult residents of such area may petition any local or public authority which has established a tramway service in the district praying for the establishment of a motor-omnibus service within the said area to or from such tramway, and if the local or public authority does not undertake to establish such a service it is bound to refer the petition, through the licensing authority, to the Transport Appeal Board for inquiry or recommendation. If the Board recommends it, the local or public authority is bound to establish and maintain a service in accordance with the Board's recommendation.
The New Zealand Agricultural College Act (1926, No 68) makes further provision for higher education and research in agriculture and applied science in New Zealand, and constitutes and incorporates the New Zealand College of Agriculture as a college in connection with the University of New Zealand. The Council of the College is to consist of four members to be appointed by the Governor-General, two members to be appointed by the Auckland University College Council, two members to be appointed by the Victoria University College Council, and one member to be appointed by the Board of Agriculture. The Council is authorized to appoint a Principal of the College, who shall ho the academic and administrative head of the College and Chairman of the Professorial Board, which is to consist of certain professors and teachers, and whose functions are to make recommendations to the Council in any matter affecting the College. The Auckland University College Council is authorized to transfer to the Council moneys received by it from the estate of the late Sir John Logan Campbell to endow a chair to be known as the Logan Campbell Chair. Similarly the Victoria University College is authorized to endow a Buchanan Chair. University Scholarships may be held at the College. The Council is authorized to prescribe fees to be paid by students at the College Provision is made for payment out of the Consolidated Fund of subsidies on voluntary contributions received by the Council. An appropriation of £15,000 per annum is to be made from the Consolidated Fund as a fund for maintaining the College. An annual report and statement of accounts prepared by the Council has to be laid before Parliament.
The Forests Amendment Act (1926, No. 69) amends the Forests Act, 1921–22. It empowers the Commissioner of State Forests to act as agent of other Departments of State or of local authorities for the sale of timber or other forest produce. It also empowers the Governor-General to exclude from the national-endowment land comprised in any State forest. The Commissioner may grant licenses to cut timber for mining purposes. Provision is made for the administration of certain timber-bearing reserves in Westland and Nelson as if they were provisional State forests. The right to grant timber-cutting rights is vested in the Commissioner of State Forests (in respect of forest lands) and in Commissioners of Crown Lands (in respect of other lands of the Crown).
The New Zealand University Amendment Act (1926, No. 70), which amends the New Zealand University Act, 1908, reconstitutes the University. Sections 4–14 deal with the constitution of the University Council, its general powers and functions, and its powers to grant degrees and diplomas, and empower it to appoint committees and delegate its powers. Section 6 provides, inter alia, for a Principal of the University, who shall, ex officio, be the Vice-Chancellor. Sections 15 to 19 deal with the constitution of the Academic Board, its meetings and powers, and its power to appoint committees. Section 20 constitutes a University Entrance Board, whose duty shall be to consider the curricula and courses of study at secondary and technical high schools in relation to the educational and other requirements for matriculation at any constituent college. Section 21 provides for subsidies from the Consolidated Fund in respect of voluntary contributions to the University or to any constituent college. Section 22 provides for annual reports and statements of accounts to be furnished by the Council of the University and by the Council of each constituent college, and for their presentation to Parliament. Statutes passed by the Council of the University have also to be laid before Parliament.
The Valuation of Land Amendment Act (1926, No. 71) amends the definition of the term “land” in section 2 of the principal Act to include trees generally, and to exclude from valuations the value of planted trees (other than fruit-trees and live hedges) and the value of trees preserved for shelter or ornamental purposes. It also provides that a valuation made to remedy an omission to value any land or interest therein shall relate back to the preceding 31st March.
The Appropriation Act (1926, No. 72) appropriates for the use of His Majesty the moneys required for the purposes of the current financial year. In addition it contains a number of miscellaneous conditions. Section 14 empowers the Minister of Finance to make payments consequent on the guarantee given in respect of fruit exported from New Zealand. Section 15 authorizes payment of the cost of transport of His Excellency the Governor-General. Section 16 authorizes payment out of the Education Loans Account of the cost of acquisition of land and buildings for the purposes of an agricultural college. Section 17 makes provision for the purchase of “C” long-term mortgage shares to be issued by the Bank of New Zealand. Section 18 contains special provisions for the computation of taxable income of the Bank of New Zealand in relation to its long-term mortgage department. Section 19 contains special provisions for assessment of other banking companies that may establish a long-term mortgage department on substantially the same terms as the Bank of New Zealand. Section 24 appropriates salary for the Minister of the Cook Islands.
Table of Contents
ON page 1 of this book the islands comprising the Dominion of New Zealand are divided into three groups, viz.:—
Islands forming the Dominion proper, for statistical and general practical purposes.
Outlying islands included within the geographical boundaries of New Zealand as proclaimed in 1847.
Annexed islands.
Only the first of these groups has been covered by the preceding sections of this book. The present section deals briefly with the second and third groups, and also with the mandated territories of Western Samoa and Nauru, the Ross Dependency, and the Tokelau or Union Group.
The outlying islands included within the geographical boundaries as proclaimed in 1847 are—
Three Kings Islands.
Auckland Islands.
Campbell Island.
Antipodes Islands.
Bounty Islands.
Snares Islands.
The THREE KINGS ISLANDS (so named by Tasman on account of his having discovered them on the anniversary of the Feast of the Epiphany) are a group of uninhabited islets extending about seven miles in an east-north-east direction, and situated about thirty-eight miles west-north-west of Cape Maria van Diemen, at the northern extremity of the North Island. It was here that the s.s. “Elingamite” was wrecked on the 9th November, 1902, with heavy loss of life.
The AUCKLAND ISLANDS were discovered on the 18th August, 1806, by Captain Abraham Bristow, in the ship “Ocean.” The discoverer, who named the group after Lord Auckland, again visited the islands in 1807 and took formal possession of them. They lie about 290 miles south of Bluff Harbour, their accepted position being given as latitude 50° 32' south and longitude 166° 13' east. They have several good harbours. Port Ross, at the northern end of the principal island, was described by the eminent French commander D'Urville as one of the best harbours of refuge in the known world. At the southern end of the island there is a through passage extending from the east to the west coast. It has been variously named Adams Strait and Carnley Harbour, and forms a splendid sheet of water. The largest of the islands is about twenty-seven miles long by about fifteen miles broad, and is very mountainous, the highest part being about 2,000 ft. above the sea.
CAMPBELL ISLAND, which lies about 150 miles south-east of the Auckland Islands, was discovered in 1810 by Frederick Hazelburgh, master of the brig “Perseverance,” owned by Mr. Robert Campbell, of Sydney. It is mountainous, and of a circumference of about thirty miles. There are several good harbours.
The ANTIPODES ISLANDS are an isolated group, consisting of several detached rocky islands lying nearly north and south over a space of four to five miles: accepted position, 49° 41' 15” south, and longitude 178° 43' east.
The BOUNTY ISLANDS, a little cluster of islets, thirteen in number, and without verdure, were discovered in 1788 by Captain Bligh, R.N., of H.M.S. “Bounty”; position verified by observation, 47° 43' south, longitude 179° 0 ½' east.
The SNARES ISLANDS are situated about fifty-six miles to the south-west of Stewart Island, and comprise six islets of a total area of about 600 acres.
On each group of outlying islands the New Zealand Government maintains a depot of provisions and clothing for the use of castaways.
The KERMADEC ISLANDS, four in number, with some outlying islets, rank as “annexed islands,” having been annexed to New Zealand by Proclamation dated the 21st July, 1887. The islands are situated between the parallels of 29° 10' and 31° 30' south latitude, and between the meridians of 177° 45' and 179° west longitude. The principal island, Sunday, is 600 miles distant from Auckland and lies a little more than half-way to Tonga, but 100 miles to the eastward of the direct steam route to that place. It is 300 miles eastward of the steam route to Fiji, and 150 miles westward of the steam route from Auckland to Rarotonga. Macaulay Island (named after the father of Lord Macaulay) and Curtis Islands were discovered in May, 1788, by Lieutenant Watts, in the “Penrhyn,” a transport ship. The remainder of the group was discovered in 1793 by Rear-Admiral de Bruni, Chevalier d'Entrecasteaux, during the course of his search for the missing La Pérouse. The Admiral gave the name of “Kermadec” to the whole group of islands, after the captain of his consort ship “L'Espérance,” and the name of the Admiral's ship. “La Recherche,” was given to the largest island. The name so given was not continued, but “Raoul” took its place, this name being apparently that of the sailing-master of the “La Recherche,” Joseph Raoul. The name “Sunday,” by which it is now generally known, may have become attached to the island from the fact that it was discovered on a Sunday.
The islands are volcanic, and in two of them signs of activity are still to be seen. The rainfall is plentiful but not excessive. The climate is mild and equable, and slightly warmer than that of the north of New Zealand. The following are the areas of the islands and islets of the group: Sunday Island, 7,200 acres; Herald group of islets, 85 acres; Macaulay Island, 764 acres; Curtis Islands, 128 acres and 19 acres; L'Espérance, 12 acres: total, 8,208 acres. Sunday Island is twenty miles in circumference, roughly triangular in shape, and at the highest point 1,723 ft. above the sea-level. It is rugged and broken over a very large extent of its surface, and, except in a few places, covered with forest. The soil everywhere on the island is very rich, being formed by the decomposition of a dark-coloured pumiceous tuff and a black andesitic lava, with which is closely mixed a fine vegetable mould. The great luxuriance and richness of the vegetation bear witness to the excellence of the soil, which is everywhere—except where destroyed by eruptions and on the steep cliffs—the same rich loam. Want of water is one of the drawbacks. Throe of the four lakes on the island are fresh, but are so difficult of approach as to be practically useless.
The Bell family lived on Sunday Island for several years from 1878 onwards, and a further settlement was attempted in 1889, but was abandoned in the following year. The islands remained uninhabited from 1890 until November, 1926, when a party of three entered into occupation of a Crown grant on Sunday Island.
The COOK ISLANDS, with others included within the extended boundaries of the Dominion as from the 11th June, 1901, are as under:—
RAROTONGA, the most fertile and valuable of the Cook Group, is a magnificent island, rising to a height of 3,000 ft. It is clothed to the tops of the mountains with splendid vegetation, and has abundant streams, considerable tracts of sloping land, and rich alluvial valleys. The two harbours are poor.
MANGAIA, the south-easternmost of the Cook Group, is of volcanic origin, and about thirty miles in circumference. It is second in importance to Rarotonga, and produces large quantities of coconuts, bananas, oranges, limes, citrons, and other fruits.
ATIU resembles Mangaia in appearance and extent. It is a raised mass of coral, steep and rugged, except where there are small sandy beaches and some clefts, where the ascent is gradual. On the highest point of the central ridge coconuts, bananas, oranges, and coffee grow with the utmost luxuriance; and the kumera, one of the most valuable of South Sea vegetables, yields large crops.
MAUKE (or Parry Island) is a low circular island about two miles across, lying to the north-east of Rarotonga. Like Mangaia and Atiu, it is surrounded by an unbroken fringing reef. It is very fertile.
MITIARO is a low-lying island, from three to four miles long and one mile wide.
HERVEY ISLANDS: This group consists of two islands, Manuae and Te Au-o-Tu, surrounded by a reef which is about 10 ½ miles in circumference.
TAKUTEA is a small coral island, about half a square mile in area, some 120 miles distant from Rarotonga.
AITUTAKI presents a most fruitful appearance, its shores being bordered by flat land on which are innumerable coconut and other trees, the higher ground being beautifully interspersed with lawns. It is eighteen miles in circuit.
NIUE for Savage Island), lying about 300 miles to the east of Tonga, is a coral island, thirty-six miles in circumference, rising to a height of 200 ft. It is fertile and has the usual tropical productions. Cotton-growing has been introduced on an experimental scale.
PALMERSTON ISLAND, lying about 450 miles east of Niue and about 220 from the nearest island of the Cook Group (Aitutaki), is remarkable as the “San Pablo” of Magellan, the first island discovered in the South Sea. It has no harbour. The soil is fairly fertile, and there is some good hardwood timber.
SUWARROW ISLAND lies about 500 miles east of Apia, the capital of Western Samoa. It is a coral atoll, of a triangular form, fifty miles in circumference, the reef having an average width of half a mile across, enclosing a land-locked lagoon eight miles by six, which is capable of being made into an excellent harbour. The island is out of the track of hurricanes, but is at present uninhabited, although visited periodically.
PUKAPUKA ISLAND (Danger): Next to the 10th parallel, but rather north of the latitude of the Navigators and east of them, are a number of small atolls. Of these, the nearest to the Samoan Group—about 500 miles—is Danger Island, bearing north-west of Suwarrow about 250 miles.
NASSAU ISLAND is a fine island of about 360 acres, and lies about 45 miles to the south-east of Pukapuka or Danger Island. The area under cultivation (well-planted coconuts) is about 300 acres.
RAKAANGA is an atoll, three miles in length and of equal breadth.
MANIHIKI, lying about 400 miles eastward of Danger Island, is an atoll, about thirty miles in circumference, valuable from the extent of the coconut-groves. The interior lagoon contains a vast deposit of pearl-shell.
PENRHYN ISLAND (Tongareva) lies about 300 miles north-east of Manihiki. It is one of the most famous pearl-islands in the Pacific, and there is a lagoon with two entrances capable of being made into a harbour fit for a large number of vessels. The island grows large quantities of coconuts.
The constitution and laws of the Cook Islands and Niue have been remodelled by the Cook Islands Act, 1915, and its amendments.
Island Councils were continued or established, consisting either wholly or partly of ex officio, elected, or nominated members. Generally, European officials and Arikis or Native chiefs are Councillors ex officio, and nominated members hold office during the pleasure of the Governor-General or for a fixed period not exceeding five years. Women are eligible both as members and as electors of Island Councils. The amending Act of 1921 provided for the election of a European member of the Island Council of Rarotonga as a representative of the European population.
Each Council is empowered to make laws for the good government of the island, with the proviso that such laws must not be repugnant to Acts of the New Zealand Parliament or regulations made thereunder. The maximum penalties imposed by the Ordinance of an Island Council must not exceed three months' imprisonment or a fine of £50. The Council has no power to deal with Customs duties, to borrow money, to establish Courts of Justice, or to appropriate expenditure of revenue other than that raised under authority of their Ordinance. No Ordinance has effect until it has received the assent of the Resident Commissioner or the Governor-General. The Governor-General may, by notice in the Gazette, disallow any Ordinance within one year after the Commissioner has given his assent.
Laws are enforced through the High Court, which has all jurisdiction, civil or criminal, necessary for the administration of justice. Judges and Commissioners of the High Court are appointed by the Governor-General; the Chief Judge to reside at Rarotonga, a second at Niue. A Commissioner may, with some exceptions, exercise the full powers and functions of a Judge, but rules of Court may allow an appeal from his decision to that of a Judge.
A judgment obtained in a civil proceeding in the High Court may be enforced in the Supreme Court of New Zealand. From any decision in the former Court an appeal lies to the Supreme Court in the Dominion.
The manufacture or importation of intoxicating liquor is prohibited absolutely, except that the Resident Commissioner may import liquor to be sold for medicinal, sacramental, or industrial purposes, but for no other purpose. Attempts are made by the Natives to evade the law by illicitly manufacturing “bush-beer,” an offence which the Administration is endeavouring to check.
At the census of the 20th April, 1926, the islands had a population of 13,862, made up as shown in the following statement. Uninhabited islands are not included.
| Island. | Native Population. | Population other than Native. | Totals. | ||||||
|---|---|---|---|---|---|---|---|---|---|
| Males. | Females. | Both Sexes. | Males. | Females. | Both Sexes. | Males. | Females. | Both Sexes. | |
* 1921 figures—returns for 1926 not to hand. | |||||||||
| Aitutaki | 720 | 697 | 1,417 | 7 | 7 | 14 | 727 | 704 | 1,431 |
| Atiu | 474 | 450 | 924 | 5 | 4 | 9 | 479 | 454 | 933 |
| Mangaia | 636 | 605 | 1,241 | 7 | 1 | 8 | 643 | 606 | 1,249 |
| Manihiki | 214 | 199 | 413 | 3 | .. | 3 | 217 | 199 | 416 |
| Manuae and Te Au-o-Tu | 21 | .. | 21 | 1 | .. | 1 | 22 | 22 | |
| Mauke | 263 | 233 | 496 | 8 | 7 | 15 | 271 | 240 | 511 |
| Mitiaro | 113 | 123 | 236 | 2 | . | 2 | 115 | 123 | 238 |
| Palmerston* | 41 | 42 | 83 | .. | .. | .. | 41 | 42 | 83 |
| Penrhyn | 201 | 189 | 390 | 3 | 2 | 5 | 204 | 191 | 395 |
| Pukapuka | 266 | 244 | 510 | 9 | 7 | 16 | 275 | 251 | 526 |
| Rakaanga | 172 | 153 | 325 | 1 | 1 | 2 | 173 | 154 | 327 |
| Rarotonga | 1,969 | 1,762 | 3,731 | 122 | 83 | 205 | 2,091 | 1,845 | 3,936 |
| Totals, Cook and northern islands | 5,090 | 4,697 | 9,787 | 168 | 112 | 280 | 5,258 | 4,809 | 10,067 |
| Niue | 1,763 | 2,000 | 3,763 | 18 | 14 | 32 | 1,781 | 2,014 | 3,795 |
| Grand totals | 6,853 | 6,697 | 13,550 | 186 | 126 | 312 | 7,039 | 6,823 | 13,862 |
The population totals for each of the last five censuses are—
| Island. | 1906. | 1911. | 1916. | 1921. | 1926. |
|---|---|---|---|---|---|
* 1921 figures. † Includes 112 soldiers in camp in New Zealand. | |||||
| Aitutaki | 1,162 | 1,237 | 1,302 | 1,373 | 1,431 |
| Atiu | 918 | 812 | 759 | 837 | 933 |
| Mangaia | 1,531 | 1,471 | 1,245 | 1,230 | 1,249 |
| Manihiki | 521 | 444 | 493 | 432 | 416 |
| Manuae and Te Au-o-Tu | .. | 29 | 23 | .. | 22 |
| Mauke | 446 | 457 | 490 | 578 | 511 |
| Mitiaro | 210 | 199 | 237 | 207 | 238 |
| Niue | 3,822 | 3,943 | 3,880 | 3,750 | 3,795 |
| Palmerston | 82 | 107 | 90 | 83 | 83* |
| Penrhyn | 420 | 335 | 326 | 376 | 395 |
| Pukapuka | 435 | 490 | 474 | 530 | 526 |
| Rakaanga | 352 | 315 | 295 | 310 | 327 |
| Rarotonga | 2,441 | 2,759 | 3,064 | 3,503 | 3,936 |
| Suwarrow | .. | .. | 7 | .. | .. |
| Totals | 12,340 | 12,598 | 12,797† | 13,209 | 13,862 |
A system of compulsory registration of births, deaths, and marriages is now in force in the islands. The latest available figures are given in the “Vital Statistics” section of this book.
In 1916 education in the Cook Islands was placed under the control of the Minister for the Cook Islands, and Government schools in charge of certificated European teachers from New Zealand have since that date been established on all the principal islands of the Lower Cook Group.
In 1923 the Cook Islands Department arranged with the London Missionary Society, in consideration of an annual subsidy of £500, to open schools in the islands of the Northern Cook Group and to provide trained full-time Native teachers. This instruction is given in the vernacular in accordance with the Government syllabus.
Including mission schools in the northern islands (with 370 pupils) there are now 17 schools under the jurisdiction of the Administration in the Cook Islands and the northern islands, with a total of 1,854 pupils on the rolls.
A technical school has been established at Avarua (Rarotonga), with classes in agriculture, drawing, and woodwork, and an advanced class in carpentry. In most of the schools classes for simple cookery and for mat and basket weaving are held.
In Niue there are two Government schools. Special interest is shown in the technical branch, and additional technical classes are given after school hours. The leading pupils are being trained with a view to taking charge of village schools, which it is hoped may soon be established in other districts of Niue.
The roll number of the two Government schools in Niue was 317 at the 31st December, 1925. In addition, there were at the 31st March, 1926, 463 pupils attending nine mission schools.
Scholarships for annual competition, tenable for two years at St. Stephen's College, Auckland, and the Maori College, Otaki, for boys, and Hukarere School, Napier, for girls, have been created by the Administration.
Wireless stations have now been established at the islands of Rarotonga, Aitutaki, Mangaia, and Niue, with a receiving-set at Atiu.
The revenue and expenditure for each of the last ten years are as shown in the table following, separate figures being given for the Cook Islands Administration and the Island of Niue:—
| Year ended 31st March. | Revenue. | Expenditure. | ||||
|---|---|---|---|---|---|---|
| Cook Islands. | Niue. | Total. | Cook Islands. | Niue. | Total. | |
| £ | £ | £ | £ | £ | £ | |
| 1917 | 9,710 | 2,068 | 11,778 | 8,586 | 1,747 | 10,333 |
| 1918 | 11,068 | 2,787 | 13,855 | 12,615 | 2,987 | 15,602 |
| 1919 | 13,847 | 3,604 | 17,451 | 12,343 | 3,111 | 15,454 |
| 1920 | 22,881 | 6,563 | 29,444 | 17,061 | 3,662 | 20,723 |
| 1921 | 27,099 | 6,938 | 34,037 | 27,745 | 5,221 | 32,966 |
| 1922 | 17,719 | 4,293 | 22,012 | 23,528 | 8,893 | 32,421 |
| 1923 | 19,791 | 6,069 | 25,860 | 19,119 | 6,453 | 25,572 |
| 1924 | 19,138 | 4,642 | 23,780 | 18,431 | 4,403 | 22,834 |
| 1925 | 23,536 | 3,598 | 27,134 | 21,554 | 3,449 | 25,003 |
| 1926 | 23,268 | 4,622 | 27,890 | 23,416 | 3,080 | 26,496 |
The principal items contributing to the total receipts of £27,890 for the year ended 31st March, 1926, were: Customs duties, £15,588; copra-export duty, £2,872; stamp-sales, £1,606; Court fees and fines, £1,769; and fruit-inspection fees, £917.
At the 31st March, 1926, the Cook Islands Administration had a credit balance of £5,344, and the Niue Administration £2,903.
The exports of the islands for the year 1925 aggregated £169,368, and imports £149,356, as against corresponding totals of £169,157 and £155,000 for 1924. The figures for each of the last ten years are—
| Year. | Exports. | Imports. | ||||
|---|---|---|---|---|---|---|
| Cook Islands. | Niue. | Total. | Cook Islands. | Niue. | Total. | |
| £ | £ | £ | £ | £ | £ | |
| 1916 | 68,146 | 3,379 | 71,525 | 58,478 | 9,512 | 67,990 |
| 1917 | 60,190 | 9,400 | 69,590 | 80,061 | 13,079 | 93,140 |
| 1918 | 82,708 | 16,537 | 99,245 | 99,632 | 17,258 | 116,890 |
| 1919 | 127,729 | 35,997 | 163,726 | 142,925 | 21,783 | 164,708 |
| 1920 | 94,697 | 13,140 | 107,837 | 177,911 | 20,524 | 198,435 |
| 1921 | 69,361 | 16,721 | 86,082 | 112,974 | 26,339 | 139,313 |
| 1922 | 135,766 | 15,122 | 150,888 | 116,726 | 15,418 | 132,144 |
| 1923 | 118,710 | 13,227 | 131,937 | 131,590 | 18,388 | 149,978 |
| 1924 | 154,554 | 14,603 | 169,157 | 138,202 | 16,798 | 155,000 |
| 1925 | 151,939 | 17,429 | 169,368 | 130,609 | 18,747 | 149,356 |
The principal exports from the Cook Islands and the northern islands are fruit and copra, and from Niue copra and the well-known Niue hats.
Exports of principal items during 1925 were—
| Quantity. | Value. £ | |
|---|---|---|
| Copra | 3,088 tons | 60,379 |
| Oranges | 94,773 cases | 37,085 |
| Bananas | 89,451 ,, | 35,350 |
| Tomatoes | 61,084 ,, | 23,275 |
| Pearls | .. | 9,389 |
| Hats | 2,802 doz. | 1,347 |
Other items are coconuts, pineapples, lemons, kumeras, mangoes, coffee, and arrowroot.
As might naturally be expected, most of the trade of the Group is with New Zealand. The United States has stepped into the second position in recent years. The figures for 1925 are—
| Country. | Exports. | Imports. | ||||
|---|---|---|---|---|---|---|
| From Cook Islands. | From Niue. | Total | Into Cook Islands. | Into Niue. | Total. | |
| £ | £ | £ | £ | £ | £ | |
| New Zealand | 95,362 | 17,320 | 112,682 | 91,506 | 14,953 | 106,459 |
| United States | 41,483 | .. | 41,483 | 17,034 | 62 | 17,096 |
| United Kingdom | 14,784 | .. | 14,784 | 10,949 | 2,056 | 13,005 |
| Australia | .. | .. | .. | 6,043 | 1,550 | 7,593 |
| Tahiti | 310 | .. | 310 | 868 | .. | 868 |
| India | .. | .. | .. | 916 | .. | 916 |
| Switzerland | .. | .. | .. | 826 | .. | 826 |
| Canada | .. | .. | .. | 700 | .. | 700 |
| Japan | .. | .. | .. | 384 | 44 | 428 |
| France | .. | .. | .. | 418 | .. | 418 |
| Germany | .. | .. | .. | 307 | .. | 307 |
| Belgium | .. | .. | .. | 143 | .. | 143 |
| China | .. | .. | .. | 141 | .. | 141 |
| Western Samoa | .. | 109 | 109 | .. | 19 | 19 |
| Czecho-Slovakia | .. | .. | .. | 107 | .. | 107 |
| Sweden | .. | .. | .. | 103 | .. | 103 |
| Norway | .. | .. | .. | 96 | .. | 96 |
| Italy | .. | .. | .. | 41 | .. | 41 |
| Tonga | .. | .. | .. | .. | 37 | 37 |
| Fiji | .. | .. | .. | 4 | 24 | 28 |
| Netherlands | .. | .. | .. | 11 | .. | 11 |
| South Africa | .. | .. | .. | 10 | .. | 10 |
| American Samoa | .. | .. | .. | .. | 2 | 2 |
| Straits Settlements | .. | .. | .. | 2 | .. | 2 |
| Totals | 151,939 | 17,429 | 169,368 | 130,609 | 18,747 | 149,356 |
Four large and many smaller islands, the whole of volcanic origin, form the Group known by its Native name of Samoa. The Native race inhabiting the islands is of typical Polynesian character, with straight hair, brown colouring, good physique, and mild and hospitable disposition.
The first known visit of Europeans to the islands was that of a Dutch expedition, under Jacob Roggeveen, in its voyage around the world in 1721–22. In 1768 De Bougainville called at the islands, and in 1787 La Pérouse, who named them “Navigators Islands,” a name by which they are still frequently called. The first British vessel to pay a visit was H.M.S. “Pandora,” in 1790. Missionaries, who were to play an important part in the development of the country, made their advent in the person of two members of the London Missionary Society, arriving at Savai'i, in 1830.
The first formal recognition of “whites” took place some eight years later. when Captain Bethune, of the British Navy, concluded a commercial treaty with the Native chiefs, by which harbour dues were to be paid and security to European interests guaranteed in return. Next year (1839) Lieutenant Charles Wilkes, in command of a United States exploring expedition, completed a similar treaty.
Three great nations were to have control of the destinies of the Samoans. Great Britain appointed a Consular Agent in 1847, the United States a Commercial Agent in 1853, and Germany her first representative in 1861.
In 1869 one of the frequent internecine wars of the Natives broke out, a war that was to have far-reaching consequences, for the foreign authorities took for the first time direct measures to ensure peace. The trouble arose over rival claimants to the Native chieftainship, and continued, despite several patched-up truces, for several years.
Petitions were presented to Great Britain in 1877, and the United States in 1878, that the islands should be annexed, but the statesmen of those days did not consider it advisable. In 1878, however, the United States were given the privilege of forming a naval and coaling station at Pago Pago, in the island of Tutuila, much the best harbour of the Group. Next year similar privileges were granted the other two Powers—Germany at Saluafata, and Great Britain at a place to be settled later.
Finally, at a conference in Berlin in 1889, an Act was signed by the representatives of the three States, guaranteeing the neutrality and independence of the islands. This arrangement lasted until 1898, when, on the death of King Malietoa Laupepa, disturbances again arose over the succession. In accordance with the recommendation of a joint Commission the kingship was abolished. The Anglo-German agreement of the 14th November, 1899, accepted by the United States in January, 1900, gave to Germany all rights over Western Samoa and to the United States, Tutuila and the other islands of Eastern Samoa.
On the outbreak of war in 1914 between the United Kingdom and Germany a New Zealand Expeditionary Force took possession of Western Samoa, landing at Apia on the 29th August, and remained in occupation until the establishment of Civil government under the ægis of the Dominion.
The islands are now administered by the New Zealand Government under mandate of the League of Nations.
On the 1st May, 1920, by Orders passed by the Governor-General in Council, provision was made for the civil administration of the Territory; and by the Samoa Act, 1921, the constitution and legal system of the Territory were settled. Amendments have been made by the Samoa Amendment Act, 1923.
Western Samoa is administered by an Administrator appointed by the Governor-General of New Zealand, and responsible to the Minister of External Affairs. There is a Legislative Council, consisting of not less than four nor more than six official members appointed by the Governor-General, and three unofficial members who are elected by the European residents. The Administrator, acting with the advice and consent of this Council, is empowered to make Ordinances for the peace, order, and good government of the Territory, subject to disallowance by the Governor-General. A High Court is established, and the Supreme Court of New Zealand is given jurisdiction over Western Samoa.
The Samoan Natives are to a large extent granted domestic self-government.
The Fono of Faipules (Native Parliament, leading chiefs representing every district), who are appointed by the Administrator, meets twice yearly to consider matters affecting the welfare of the Samoan people, and to submit recommendations thereon to the Administrator.
Western Samoa includes the Islands of Upolu, Savai'i, Apolima, and Manono, together with several small islets, lying between the 13th and 15th degrees of south latitude and the 171st and 173rd degrees of longitude west of Greenwich.
The principal islands are Savai'i and Upolu. Savai'i is the larger of the two, with a length of 48 miles, a breadth of 25 miles, and a total area of 703 square miles. The island is mountainous, rising to a height of over 4,000 ft. Upolu, which extends some 45 miles in length and 13 in breadth, measures about 430 square miles in area. Of the two, Upolu is the more fertile and populous, and contains the port and capital of Apia. Rainfall is plentiful throughout the Group.
At the census of the 1st January, 1926, the total population of Western Samoa was returned as 40,231, made up as follows:—
| Males. | Females. | Total. | |
|---|---|---|---|
| Native Samoan population | 18,641 | 18,047 | 36,688 |
| European and half-caste population | 1,300 | 1,198 | 2,498 |
| Chinese indentured labourers | 862 | .. | 862 |
| Chinese (non-indentured) | 28 | .. | 28 |
| Melanesian and Polynesian indentured labourers | 154 | 1 | 155 |
| Totals | 20,985 | 19,246 | 40,231 |
The following figures of the movement of the population relate to the twelve months ended the 31st December, 1925:—
| — | Births. | Deaths. | Marriages. | Immigration. | Emigration. |
|---|---|---|---|---|---|
| Native Samoans | 2,033 | 857 | 853 | 1,495 | 1,512 |
| Europeans and half-castes | 50 | 3 | 34 | 520 | 590 |
| Chinese indentured labourers | .. | 11 | .. | 281 | 134 |
| Melanesian and Polynesian indentured labourers | .. | .. | 1 | .. | 2 |
| Totals | 2,083 | 871 | 888 | 2,296 | 2,238 |
By the Samoa Health Ordinance, 1921, which is on the lines of the New Zealand Health Act, 1920, but remodelled to suit local conditions, the control of the medical and sanitary services was placed in the hands of a Board of Health. A Government hospital is maintained at Apia, and district hospitals have been established at Tuasivi (Savai'i) and Aleiapata (Upolu).
Of the more important tropical diseases only three are prevalent in Western Samoa—viz., uncinariasis (or hookworm disease), frambœsia, and filariasis.
Every effort has been made to stamp out these diseases, particularly hookworm and yaws, and systematic campaigns to this end have been in progress since 1923. These have resulted in a marked improvement in the general health of the Natives.
Frambœsia (yaws) is so common that practically no Samoan reaches adult life without having suffered from the infection.
One difficulty experienced in the earlier part of this campaign was that the Natives were unwilling to produce for treatment those young children in whom the disease was still in the primary stage, there being a popular belief that treatment at that time will only “drive the disease in,” and so injure the child. Latterly this difficulty has largely disappeared. So satisfied are the Natives as to the value of the methods now being used that they have agreed, through the Fono of Faipules, to the introduction of stringent regulations for the control of the disease. They have also agreed to the payment of a tax of £1 per adult male, to meet the expenditure of eradicating yaws and hookworm.
The sanitation of Apia has been considerably improved in recent years. Until 1920 sanitation may be said to have been practically unknown. There were no men with a sufficient knowledge of plumbing and drainlaying, and the work carried out was in most cases crude and unsatisfactory. Sinks and bathrooms discharged their contents on the ground under the floor, or just outside the house. The average pit privy was most insanitary and unsightly. Some of the septic tanks installed prior to that date have worked satisfactorily, but many have required to be remodelled. With the introduction of Civil administration a commencement was made to improve conditions; and regulations, consisting largely of detailed specifications of the standard of work required, were drafted. A Health Inspector with qualifications in plumbing and drainlaying was appointed, and a careful survey was made of the condition of every building in Apia and the immediate vicinity.
As a result of these activities the sanitation of Apia has been rapidly brought up to a reasonable standard. The administration set an example by improving, as rapidly as finance and labour permitted, the conditions prevailing in the buildings under its control. The two largest drainage schemes installed in Apia are at the hospital and at the schools. Most of the work has been done by Native labour under white supervision, with the help of a few Chinese artisans.
The reticulation of Apia with a high-pressure water-supply system has been completed. Water has been piped into several villages from springs in the hills. In other villages where this is not possible large reinforced-concrete tanks are being erected to receive the rain-water from church buildings.
Education in Samoa has hitherto been almost entirely in the hands of the missions, which have done splendid work in teaching practically every Native to read and write in the vernacular. As a consequence, the Samoan is probably the best educated of the Polynesian races. Formerly higher education was not attempted except for the training of pastors, whose duty included that of teaching in the village schools connected with their respective churches. But latterly higher education in the English language has been carried out by the Administration schools at Ifi Ifi, Malifa, and Vaipouli, by the London Missionary Society at Papauta, by the Methodist Mission at Faleula, and by the Marist Brothers and Sisters at Apia. Arrangements have now been made by the Administration for these schools to be annually inspected by one of the Senior Inspectors of the New Zealand Education Department.
The number of Samoans attending schools in December, 1925, was as follows:—
| Mission schools, including theological training institutions, and village schools for infants, under Native pastors | 8,800 |
|---|---|
| Second-grade or district schools, where Government and missions cooperate (teachers paid by Government) | 1,800 |
| Third-grade Government schools, chiefly for boarders (European and Native teachers) | 800 |
| Total | 11,400 |
Second-grade or district schools, established for the purpose of imparting instruction in standards of education in advance of that given in the village mission schools, are yearly increasing, and now number 40.
A syllabus of education drawn up in 1925 makes provision for the following:—
All education to be based upon Native life and not on foreign conditions.
Every pupil to have a thorough knowledge of the Samoan language.
English to be taught as a subject and not to replace the Native language.
Native teachers to be specially trained in the methods of imparting knowledge.
Manual work, agriculture, carpentry, plumbing, &c., to form an important part of the syllabus.
Hygiene, adapted to local needs so as to enable the Natives to better protect themselves from the ravages of hookworm, yaws, and epidemics common to the country, to be treated as an important subject.
Text-books to be adapted to Samoan conditions.
Two scholarships per year to be given to boys to receive higher education in New Zealand.
Native teachers to periodically visit New Zealand to widen their knowledge by seeing some of the Maori and technical schools in that country.
Of a total area of about 725,000 acres in the islands of Savai'i and Upolu, only 143,630 acres have been alienated from the Natives—all prior to the British occupation of the Territory. Of the land remaining to the Natives approximately 348,600 acres are cultivable, the remaining 232,770 acres being waste or inferior land. Of the former, 38,400 acres are in coconut plantations, and 12,000 acres in other crops, mainly bananas and taro, the balance being undeveloped. A small area is devoted to cotton growing.
Land alienated includes 103,630 acres of Crown estates and other Government land, 5,000 acres belonging to the missions, and 35,000 acres owned by European companies or private planters. The mission holdings are partly cultivated, but excluding these only 17,850 acres of alienated land has been developed. An area, of 10,330 acres is in coconuts, 5,770 acres in cacao, and 500 acres in rubber, the balance of the 17,850 acres consisting of 1,250 acres of rubber plantations which have been abandoned by the planters.
The revenue for the financial year ended 31st March, 1926, including a subsidy of £21,400 from the New Zealand Government, was £150,038, of which receipts under the head of Customs and Marine contributed £82,803, other principal items being—Fees and charges (Court, hospital, &c.), £8,149; Native taxes, £20,032 (including £9,186 derived from the medical levy of £1 per adult male Samoan); and Post Office and wireless-telegraphy receipts, £10,800. The ordinary expenditure for the year totalled £145,688. The figures of revenue and expenditure for each of the last five years are—
| Year ended 31st March. | Revenue. | Expenditure. |
|---|---|---|
| £ | £ | |
| 1922 | 135,569 | 137,180 |
| 1923 | 131,250 | 132,658 |
| 1924 | 133,917 | 143,010 |
| 1925 | 130,914 | 135,523 |
| 1926 | 150,038 | 145,688 |
The revenue is augmented by an annual subsidy from the New Zealand Government, the amount (£21,400 in 1925–26) being based on the additional cost of the Medical and Education Departments of Samoa since New Zealand accepted the mandate, and on the cost of the wireless station in excess of revenue.
The figures of expenditure do not include expenditure on public works out of loan account, which to the 31st March, 1926, aggregated £125,000. Some of the principal items are—
| £ | |
|---|---|
| Hospital extensions | 24,835 |
| Roads and bridges (including reclamation for protection of roads) | 23,669 |
| Apia waterworks | 22,136 |
| Hotel purchase and equipment | 13,521 |
| Steam-laundry | 6,170 |
| Native water-supplies | 9,748 |
| District schools | 4,421 |
The public-works expenditure was met out of a loan account fund of £125,000 provided by the New Zealand Government. Of this amount £25,000 was donated as a gift free of charge, the remaining £100,000 being on loan at 5 per cent. and repayable in thirty years. Additional loan-money is to be provided for further public works, principally for Native water-supply purposes.
The exports and imports of Western Samoa (exclusive of specie and military stores) for each of the last ten years are—
| Year. | Exports. | Imports. |
|---|---|---|
| £ | £ | |
| 1916 | 235,415 | 180,340 |
| 1917 | 320,444 | 301,173 |
| 1918 | 306,640 | 309,396 |
| 1919 | 532,500 | 291,368 |
| 1920 | 386,587 | 561,153 |
| 1921 | 241,539 | 408,892 |
| 1922 | 365,610 | 282,939 |
| 1923 | 288,774 | 268,881 |
| 1924 | 361,418 | 274,803 |
| 1925 | 379,388 | 345,989 |
The principal item of export is copra, exports of which in 1925 totalled 14,519 tons, of a value of £331,274. Up to about 1923 the bulk of the copra went to the United States, but the States received only 418 tons in 1925, the balance (with the exception of 166 tons—value, £3,580—to New Zealand) going to the United Kingdom and the Continent of Europe, the exact destination not being known in respect of 7,023 tons, of a value of £157,047. Cocoa-beans of a value of £39,626, representing 664 tons, constituted the only other item of any importance. A recommencement of the rubber industry is reflected in the export of 6,926 lb. of rubber, valued at £1,165.
Of the exports in 1925, £372,544 was the produce of Western Samoa, the remaining £6,844 being re-exports. Of the total of £222,341, for which definite information was available, £104,031 went to the United Kingdom, £44,410 to Germany, £34,244 to the Netherlands, £20,414 to the United States, £12,008 to New Zealand, and £2,499 to Australia. The imports came principally from Australia (£103,748), New Zealand (£91,542), the United Kingdom (£63,885), and the United States (£55,767).
In addition to a scale of import duties, there are export duties on copra (£1 per ton), cocoa (£2 per ton), and rubber (1d. per lb.). The net import duty collected in 1925 was £48,643 export duties collected totalling £15,876.
Eighty-four steam-vessels, of an aggregate tonnage of 85,203, and four sailing-vessels (2,403 tons) were entered inwards at the Port of Apia during 1925. The tonnage of cargo brought by these vessels was 14,343 tons, while cargo entered outwards totalled 16,017 tons.
Barely one-third of a degree south of the Equator, and lying 166° 55' east of Greenwich, is the little phosphate island known as Nauru, or Pleasant Island. Prior to the world-wide conflagration of 1914–19 this rich though little-known island was a German possession. It was surrendered to H.M.A.S. “Melbourne” on the 9th September, 1914, and was included with the rest of the German New Guinea possessions in the capitulation of Herbertshohe. The island was garrisoned with Australian troops on the 6th November, 1914, and a Civil administration was established on the 1st January, 1915. A mandate for the administration of the island was conferred by the Allied and Associated Powers upon the British Empire, to come into operation at the same date as the Treaty of Peace with Germany. The mandate is held jointly by the Imperial Government, the Government of Australia, and the New Zealand Government.
An agreement between the three parties to the mandate was drawn up and completed on the 2nd July, 1919. The administrative control of the island is vested in an Administrator, whose term of appointment is five years.
Under the concession granted by the German Government to the Jaluit Gesellschaft, and transferred by that company to the Pacific Phosphate Company, the rights of which were purchased by the Governments of Great Britain, Australia, and New Zealand for £3,500,000 (including the company's interests in the nearby Ocean Island), and vested by these Governments in the British Phosphate Commission, the Commission holds the exclusive right to work the phosphate-deposits on the island. Up to the 1st July, 1921, the owners of the land (Natives) were paid ½d. per ton royalty for all phosphates shipped from their land. The Native owners complained that this was not adequate remuneration, and representations concerning this were submitted to the three Governments interested, with the result that the Native owners are now paid—(a) £20 per acre for all phosphate lands taken up by the Commission on lease subsequent to the 30th June, 1921; (b) a royalty of 2d. per ton on all phosphate shipped from their respective lands. In addition, a royalty of 1d. per ton is paid to the Administration, to be held in trust for the benefit of the Nauruans generally.
The yearly production of phosphates was for the five years ended the 30th June, 1925, allocated between the three Governments in the following proportions, which coincide with the proportion of capital supplied by each towards the undertaking: Great Britain, 42 per cent.; Australia, 42 per cent.; New Zealand, 16 per cent. Any portion of its share not required by any Government may be disposed of either to the other Governments pro rata, or, if they do not require it, to other countries. The partner countries receive interest at 6 per cent. on their capital invested, and redemption of capital within fifty years is provided for by a sinking fund. At the end of the first quinquennial period the allocation of phosphates was to be readjusted on the basis of actual requirements, similar readjustments to be made every five years in future. Great Britain has hitherto taken very little of its quota, being at present able to obtain phosphates to better advantage from North African sources of supply. New Zealand was importing phosphate from Makatea during the earlier years of the first quinquennium, but is now obtaining all her supplies from Nauru and Ocean Islands. Up to the 31st March, 1926, Great Britain has taken only 1 ½ per cent. of the output, and New Zealand 14 ½ per cent., while 67 per cent. has gone to Australia, and 17 per cent. to other countries, principally Japan. New Zealand's share during the nine months ended 31st March, 1926, was 22 per cent., and Australia's 73 per cent., only 5 per cent. being disposed of elsewhere. The quantities concerned are as follows:—
| DESTINATION OF PHOSPHATE EXPORTS FROM NAURU AND OCEAN ISLANDS, 1920–21 TO 1925–26. | |||||
|---|---|---|---|---|---|
| Year ended 30th June. | Great Britain. | Australia. | New Zealand. | Other Countries. | Totals. |
* Nine months ended 31st March. | |||||
| Tons. | Tons. | Tons. | Tons. | Tons. | |
| 1921 | 16,750 | 265,914 | 17,100 | 64,660 | 364,424 |
| 1922 | 15,550 | 171,286 | 38,500 | 136,150 | 361,486 |
| 1923 | .. | 203,446 | 51,550 | 58,762 | 313,758 |
| 1924 | .. | 320,031 | 60,850 | 71,028 | 451,909 |
| 1925 | .. | 337,298 | 98,790 | 34,635 | 470,723 |
| 1926* | .. | 183,500 | 55,310 | 12,710 | 251,520 |
| Totals, to 31st March, 1926 | 32,300 | 1,481,475 | 322,100 | 377,945 | 2,213,820 |
Of the total exported during the five years ended 30th June, 1925, 1,112,216 tons were produced in Nauru and 850,084 tons in Ocean Island.
Nauru, which is encircled by a road ten miles long, has an area of only 5,000 to 6,000 acres. The island is surrounded by a wide reef. Near the coast is a belt of flat land, covered with coconut-trees, of an area of about 1,400 acres. Behind this rises higher land covering some 4,250 acres, and enclosing a lagoon of almost fresh water. This higher country consists of a mass of phosphate of great richness.
At the 1st April, 1925, there were 1,220 Native inhabitants, who speak a language akin to that of the Gilbert-Islanders. In addition there were 814 Chinese, 14 Gilbert and Ellice Islanders, and 8 Caroline and Marshall Islanders, who have been introduced for the working of the phosphate-deposits. Europeans numbered 118, the total population being thus 2,174.
Imports during 1924 were valued at £100,253, consisting almost entirely of food-supplies and of machinery for the working of the phosphate. In addition to the phosphate a little copra is exported.
Sixty-three vessels, of a total tonnage of 210,300, were entered and cleared in 1924.
Nauru possesses a wireless station, which was erected by the German authorities as part of their chain of wireless stations throughout the Pacific. Wireless telephonic communication between Nauru and Ocean Islands has been instituted.
The revenue of the Nauru Administration for the year 1924 was £18,199, and the expenditure £13,580. The figures for each of the last five years available are—
| Year. | Revenue. | Expenditure. |
|---|---|---|
| £ | £ | |
| 1920 | 10,611 | 4,818 |
| 1921 | 9,519 | 11,851 |
| 1922 | 12,372 | 10,378 |
| 1923 | 11,837 | 10,265 |
| 1924 | 18,199 | 13,580 |
By Imperial Order in Council of the 30th July, 1923, the coasts of the Ross Sea, with the adjacent islands and territories, were proclaimed a British settlement within the meaning of the British Settlements Act, 1887, under the name of the Ross Dependency. The new dependency has been placed under the jurisdiction of the Governor-General of New Zealand. The Order in Council referred to reads as follows:—
Whereas by the British Settlements Act, 1887, it is, amongst other things, enacted that it shall be lawful for His Majesty in Council from time to time to establish all such laws and institutions and constitute such Courts and officers as may appear to His Majesty in Council to be necessary for the peace, order, and good government of His Majesty's subjects and others within any British settlement:
And whereas the coasts of the Ross Sea, with the islands and territories adjacent thereto, between the 160th degree of east longitude and the 150th degree of west longitude, which are situated south of the 60th degree of south latitude, are a British settlement within the meaning of the said Act:
And whereas it is expedient that provision should be made for the government thereof:
Now, therefore, His Majesty, by virtue and in exercise of the powers by the said Act, or otherwise, in His Majesty vested, is pleased, by and with the advice of His Privy Council, to order, and it is hereby ordered, as follows:—
I. From and after the publication of this Order in the Government Gazette of the Dominion of New Zealand that part of His Majesty's Dominions in the Antarctic seas which comprises all the islands and territories between the 160th degree of east longitude and the 150th degree of west longitude which are situated south of the 60th degree of south latitude shall be named the Ross Dependency.
II. Prom and after the publication as aforesaid the Governor-General and Commander-in-Chief of the Dominion of New Zealand for the time being (hereinafter called “the Governor”) shall be the Governor of the Ross Dependency; and all the powers and authorities which by this Order are given and granted to the Governor for the time being of the Ross Dependency are hereby vested in him.
III. In the event of the death or incapacity of the said Governor-General and Commander-in-Chief of the Dominion of New Zealand, or in the event of his absence from the said Dominion, the officer for the time being administering the government of the Dominion shall be Governor for the time being of the Ross Dependency.
IV. The said Governor is further authorized and empowered to make all such rules and regulations as may lawfully be made by His Majesty's authority for the peace, order, and good government of the said dependency, subject, nevertheless, to any instructions which he may from time to time receive from His Majesty or through a Secretary of State.
V. The Governor is authorized to make and execute, on His Majesty's behalf, grants and dispositions of any lands which may lawfully be granted or disposed of by His Majesty within the said dependency, in conformity with such rules and regulations as may from time to time be in force in the dependency.
Regulations respecting the Ross Dependency wore made on the 14th November, 1923, and gazetted on the following day. They read as follows:—
Whereas by His Majesty's Order in Council under the British Settlements Act (Imperial), 1887, dated the thirtieth day of July, one thousand nine hundred and twenty-three, I, John Rushworth, Viscount Jellicoe, Governor-General of the Dominion of New Zealand, was appointed Governor of the Ross Dependency, and all the powers and authorities which by such order were given and granted to the Governor for the time being of such dependency were vested in me, and I was further authorized and empowered to make all such rules and regulations as may lawfully be made by His Majesty's authority for the peace, order, and good government of the said dependency:
Now, therefore, I, acting as Governor of the said dependency, in pursuance of the powers vested in me by the said Order in Council or otherwise, do make the following regulations:—
The laws and usages in force in the Dominion of New Zealand at this date shall be from this date in force in the Ross Dependency in all respects as if the same had been enacted or in force in such dependency by regulation or otherwise, except in so far as the same are inapplicable to the conditions of such dependency.
All laws hereafter enacted by the Legislature of the said Dominion shall, as far as applicable, have the same force and effect as if they had been duly enacted for such dependency, unless disallowed or modified by myself or the Governor for the time being of such dependency.
All persons appointed by myself or the Governor for the time being of such dependency shall have such power and authority as shall be granted them in due course of law, and may be empowered to do such things as are necessary or desirable to ensure that the said laws are duly observed and complied with in every respect, and to do all things necessary or expedient for the peace, order, and good government of such dependency, and to safeguard and preserve His Majesty's rights and sovereignty over and in respect of such dependency.
As witness my hand this 14th day of November, 1923.
JELLICOE, Governor.
An officer appointed as an officer of the Government of the Ross Dependency, with the powers and authorities therein of a Stipendiary Magistrate, visited the dependency at the end of the year 1923 with the whale-fishing fleet which had come out from Norway under an agreement entered into with the Imperial Government prior to the Ross Sea area coming under the jurisdiction of New Zealand. Under the agreement Messrs. Konow and Larsen, of Oslo, are licensed to catch whales in the waters of the dependency for a period of twenty-one years. The license is not an exclusive one, but the licensees were given to understand at the time of its granting that they would be given some opportunity to recoup the heavy initial expenditure arising out of a pioneer expedition. The benefits accruing to the Government under the license are an annual payment of £200 in respect of each floating establishment (factory-ship), and a royalty of 2s. 6d. per barrel of oil taken over and above 20,000 barrels. The expedition is limited to two floating establishments with five catchers to each establishment.
The whale-oil taken in each of the three seasons during which the license has been in operation is as follows:—
| Season. | Gallons. |
|---|---|
| 1923–24 | 711,640 |
| 1924–25 | 1,286,000 |
| 1925–26 | 1,508,100 |
Royalty receipts for the season 1925–26 totalled £2,212, in addition to the annual license fee of £200.
Regulations dated the 1st November, 1926, prohibit the carrying-on of whaling operations within the boundaries of the Ross Dependency without a license, the fee payable for which is £200. The owner or master of a vessel engaged in whaling or used as a floating whale-factory is liable to a fine not exceeding £1,000 for each day on which operations are carried on without a license. A penalty not exceeding £100 per day is provided for in cases of non-compliance with the terms of the license granted in respect of any vessel used for whaling or as a floating factory, and a similar penalty for failure to properly equip a floating factory or to convert a whale into commercial products within 48 hours after delivery at the factory.
Provision is made for the arrest on warrant of any vessel in respect of which an offence against the regulations is committed.
The latest addition to New Zealand's dependencies is the Tokelau or Union Group, which consists of three islands, or groups of islets (Atafu, Nukunono, and Fakaofo), of a total area of 2,550 acres. They are situated between 8° and 10° of south latitude and between 171° and 173° of west longitude, and are distant about 270 miles from Apia, Samoa, which has since 1923 been the port of entry for the group.
These islands were ceded to Great Britain in 1916, from which year up to 1925 they formed part of the Gilbert and Ellice Islands Colony. They were transferred to the jurisdiction of New Zealand as from the 11th February, 1926, and are now administered by the Administrator of Western Samoa on behalf of the New Zealand Government.
The population of the islands at the census of 1926 was 1,033, the figures for the three islands being—Atafu, 360; Nukunono, 229; Fakaofo, 444.
Education is entirely in the hands of the missions, which maintain Native teachers in the islands.
The Natives are Polynesians, and the language is allied to that of Samoa. The islanders are ruled by their own chiefs with the assistance of Native Councils.
The only exportable product of the islands is copra. The total amount of copra available for export in a normal year is estimated to be 365 tons—viz., 65 from Atafu 210 from Nukunono, and 90 from Fakaofo.
| POPULATION.—CALENDAR YEARS. | ||||||
|---|---|---|---|---|---|---|
| Year. | Estimated Population (inclusive of Maoris). | Estimated Mean Population (inclusive of Maoris). | ||||
| Males. | Females. | Total. | Males. | Females. | Total. | |
| 1876 | 250,363 | 194,182 | 444,545 | 244,220 | 188,716 | 432,936 |
| 1877 | 252,464 | 201,624 | 454,088 | 251,414 | 197,903 | 449,317 |
| 1878 | 264,565 | 211,549 | 476,114 | 258,092 | 206,072 | 464,164 |
| 1879 | 281,832 | 225,492 | 507,324 | 273,199 | 218,520 | 491,719 |
| 1880 | 292,302 | 236,157 | 528,459 | 287,067 | 230,825 | 517,892 |
| 1881 | 299,354 | 245,653 | 545,007 | 296,043 | 240,941 | 536,984 |
| 1882 | 307,671 | 254,133 | 561,804 | 303,513 | 249,893 | 553,406 |
| 1883 | 319,033 | 265,941 | 584,974 | 313,352 | 260,037 | 573,389 |
| 1884 | 331,035 | 277,366 | 608,401 | 325,034 | 271,654 | 596,688 |
| 1885 | 336,493 | 282,830 | 619,323 | 333,764 | 280,098 | 613,862 |
| 1886 | 340,486 | 290,869 | 631,355 | 337,726 | 286,549 | 624,275 |
| 1887 | 347,398 | 297,932 | 645,330 | 343,942 | 294,401 | 638,343 |
| 1888 | 347,788 | 301,561 | 649,349 | 347,593 | 299,747 | 647,340 |
| 1889 | 351,428 | 306,593 | 658,021 | 349,608 | 304,077 | 653,685 |
| 1890 | 355,397 | 312,080 | 667,477 | 353,413 | 309,336 | 662,749 |
| 1891 | 359,035 | 317,016 | 676,051 | 357,227 | 314,549 | 671,776 |
| 1892 | 368,007 | 324,419 | 692,426 | 363,521 | 320,718 | 684,239 |
| 1893 | 380,496 | 333,762 | 714,258 | 374,252 | 329,090 | 703,342 |
| 1894 | 386,624 | 341,497 | 728,121 | 383,560 | 337,630 | 721,190 |
| 1895 | 392,586 | 348,113 | 740,699 | 389,605 | 344,805 | 734,410 |
| 1896 | 398,660 | 355,356 | 754,016 | 395,029 | 351,259 | 746,288 |
| 1897 | 406,376 | 362,534 | 768,910 | 402,518 | 358,945 | 761,463 |
| 1898 | 413,797 | 369,520 | 783,317 | 410,087 | 366,027 | 776,114 |
| 1899 | 420,352 | 376,007 | 796,359 | 417,075 | 372,763 | 789,838 |
| 1900 | 425,301 | 382,831 | 808,132 | 422,827 | 379,419 | 802,246 |
| 1901 | 437,343 | 393,457 | 830,800 | 432,046 | 389,065 | 821,111 |
| 1902 | 449,028 | 402,044 | 851,072 | 443,186 | 397,750 | 840,936 |
| 1903 | 462,794 | 412,854 | 875,648 | 455,911 | 407,449 | 863,360 |
| 1904 | 477,112 | 423,570 | 900,682 | 469,953 | 418,212 | 888,165 |
| 1905 | 490,486 | 435,119 | 925,605 | 483,799 | 429,345 | 913,144 |
| 1906 | 507,189 | 449,268 | 956,457 | 500,047 | 443,278 | 943,325 |
| 1907 | 518,187 | 459,028 | 977,215 | 512,688 | 454,148 | 966,836 |
| 1908 | 535,867 | 472,506 | 1,008,373 | 527,027 | 465,767 | 992,794 |
| 1909 | 545,944 | 484,713 | 1,030,657 | 540,906 | 478,609 | 1,019,515 |
| 1910 | 555,466 | 494,944 | 1,050,410 | 550,705 | 489,829 | 1,040,534 |
| 1911 | 566,202 | 509,048 | 1,075,250 | 561,302 | 502,585 | 1,063,887 |
| 1912 | 579,685 | 522,786 | 1,102,471 | 572,944 | 515,917 | 1,088,861 |
| 1913 | 595,582 | 538,924 | 1,134,506 | 587,634 | 530,854 | 1,118,488 |
| 1914 | 594,634 | 551,204 | 1,145,838 | 595,108 | 545,064 | 1,140,172 |
| 1915 | 590,436 | 562,202 | 1,152,638 | 592,535 | 556,703 | 1,149,238 |
| 1916 | 575,835 | 574,504 | 1,150,339 | 577,715 | 571,510 | 1,149,225 |
| 1917 | 563,300 | 584,148 | 1,147,448 | 569,567 | 579,326 | 1,148,893 |
| 1918 | 567,986 | 590,163 | 1,158,149 | 565,643 | 587,155 | 1,152,798 |
| 1919 | 627,828 | 599,353 | 1,227,181 | 597,907 | 594,758 | 1,192,665 |
| 1920 | 643,696 | 613,915 | 1,257,611 | 635,762 | 606,634 | 1,242,396 |
| 1921 | 660,948 | 631,769 | 1,292,717 | 653,306 | 623,346 | 1,276,652 |
| 1922 | 673,772 | 645,112 | 1,318,884 | 666,789 | 638,337 | 1,305,126 |
| 1923 | 685,951 | 657,070 | 1,343,021 | 678,079 | 650,114 | 1,328,193 |
| 1924 | 700,033 | 670,370 | 1,370,403 | 690,401 | 662,217 | 1,352,618 |
| 1925 | 716,371 | 684,859 | 1,401,230 | 707,539 | 676,889 | 1,384,428 |
| POPULATION.—YEARS ENDED 31ST MARCH. | ||||||
|---|---|---|---|---|---|---|
| Year ended 31st March. | Estimated Population (inclusive of Maoris). | Estimated Moan Population (inclusive of Maoris). | ||||
| Males. | Females. | Total. | Males. | Females. | Total. | |
| 1877 | 253,118 | 196,863 | 449,981 | 247,594 | 191,652 | 439,246 |
| 1878 | 262,702 | 205,557 | 468,259 | 257,488 | 200,695 | 458,183 |
| 1879 | 268,730 | 214,861 | 483,591 | 265,716 | 210,209 | 475,925 |
| 1880 | 285,915 | 228,738 | 514,653 | 277,323 | 221,799 | 499,122 |
| 1881 | 294,154 | 238,090 | 532,244 | 290,035 | 233,414 | 523,449 |
| 1882 | 301,417 | 247,630 | 549,047 | 298,001 | 242,896 | 540,897 |
| 1883 | 310,157 | 256,498 | 566,655 | 305,787 | 252,064 | 557,851 |
| 1884 | 322,545 | 269,252 | 591,797 | 316,351 | 262,875 | 579,226 |
| 1885 | 333,599 | 279,601 | 613,200 | 328,072 | 274,427 | 602,499 |
| 1886 | 335,114 | 285,451 | 620,565 | 333,593 | 282,226 | 615,819 |
| 1887 | 342,647 | 292,700 | 635,347 | 338,881 | 289,075 | 627,956 |
| 1888 | 347,665 | 299,249 | 646,914 | 345,156 | 295,975 | 641,131 |
| 1889 | 349,235 | 302,893 | 652,128 | 348,450 | 301,071 | 649,521 |
| 1890 | 355,796 | 309,057 | 664,853 | 352,516 | 305,975 | 658,491 |
| 1891 | 355,716 | 312,878 | 668,594 | 355,756 | 310,968 | 666,724 |
| 1892 | 360,877 | 318,588 | 679,465 | 358,307 | 315,735 | 674,042 |
| 1893 | 371,539 | 326,643 | 698,182 | 366,208 | 322,616 | 688,824 |
| 1894 | 382,854 | 335,886 | 718,740 | 377,197 | 331,264 | 708,461 |
| 1895 | 388,223 | 343,245 | 731,468 | 385,539 | 339,565 | 725,104 |
| 1896 | 393,808 | 349,568 | 743,376 | 391,016 | 346,406 | 737,422 |
| 1897 | 400,540 | 356,963 | 757,503 | 396,580 | 352,790 | 749,370 |
| 1898 | 407,649 | 363,919 | 771,568 | 404,095 | 360,441 | 764,536 |
| 1899 | 415,511 | 371,019 | 786,530 | 411,580 | 367,469 | 779,049 |
| 1900 | 420,930 | 377,541 | 798,471 | 418,221 | 374,280 | 792,501 |
| 1901 | 429,112 | 386,750 | 815,862 | 425,745 | 383,066 | 808,811 |
| 1902 | 437,783 | 395,356 | 833,139 | 433,448 | 391,053 | 824,501 |
| 1903 | 453,611 | 404,382 | 857,993 | 445,697 | 399,869 | 845,566 |
| 1904 | 467,129 | 414,971 | 882,100 | 460,370 | 409,677 | 870,047 |
| 1905 | 481,658 | 426,458 | 908,116 | 474,394 | 420,714 | 895,108 |
| 1906 | 495,136 | 437,978 | 933,114 | 488,397 | 432,218 | 920,615 |
| 1907 | 510,057 | 451,541 | 961,598 | 503,806 | 445,844 | 949,650 |
| 1908 | 523,209 | 462,111 | 985,320 | 516,633 | 456,826 | 973,459 |
| 1909 | 540,108 | 475,955 | 1,016,063 | 531,659 | 469,033 | 1,000,692 |
| 1910 | 548,449 | 486,763 | 1,035,212 | 544,279 | 481,359 | 1,025,638 |
| 1911 | 557,448 | 498,751 | 1,056,199 | 552,949 | 492,757 | 1,045,706 |
| 1912 | 569,376 | 511,968 | 1,081,344 | 563,880 | 505,948 | 1,069,828 |
| 1913 | 584,556 | 527,033 | 1,111,589 | 576,966 | 519,501 | 1,096,467 |
| 1914 | 598,211 | 541,457 | 1,139,668 | 591,383 | 534,245 | 1,125,628 |
| 1915 | 596,014 | 554,372 | 1,150,386 | 597,113 | 547,914 | 1,145,027 |
| 1916 | 585,496 | 564,754 | 1,150,250 | 590,755 | 559,563 | 1,150,318 |
| 1917 | 573,569 | 577,369 | 1,150,938 | 577,715 | 571,510 | 1,149,225 |
| 1918 | 568,036 | 586,523 | 1,154,559 | 570,802 | 581,946 | 1,152,748 |
| 1919 | 585,827 | 592,579 | 1,178,406 | 576,931 | 589,551 | 1,166,482 |
| 1920 | 633,495 | 603,420 | 1,236,915 | 609,661 | 597,999 | 1,207,660 |
| 1921 | 648,659 | 618,839 | 1,267,498 | 641,077 | 611,129 | 1,252,206 |
| 1922 | 664,979 | 636,272 | 1,301,251 | 657,746 | 627,965 | 1,285,711 |
| 1923 | 676,825 | 648,476 | 1,325,301 | 669,867 | 641,514 | 1,311,381 |
| 1924 | 688,020 | 659,833 | 1,347,853 | 681,002 | 653,027 | 1,334,029 |
| 1925 | 705,161 | 674,326 | 1,379,487 | 694,303 | 665,692 | 1,359,995 |
| 1926 | 721,173 | 688,639 | 1,409,812 | 711,583 | 680,490 | 1,392,073 |
| EXTERNAL MIGRATION. | ||||||||
|---|---|---|---|---|---|---|---|---|
| Year. | Arrivals. | Departures. | ||||||
| Males. | Females. | Total. | Race Aliens Included in foregoing Totals.* | Hales. | Females. | Total. | Race Aliens included in foregoing Totals.† | |
* Not available prior to 1897. † Not available prior to 1915. | ||||||||
| 1876 | 11,524 | 6,890 | 18,414 | .. | 4,677 | 1,782 | 6,459 | .. |
| 1877 | 8,104 | 4,883 | 12,987 | .. | 4,696 | 1,915 | 6,611 | .. |
| 1878 | 10,671 | 5,592 | 16,263 | .. | 4,138 | 1,623 | 5,761 | .. |
| 1879 | 15,186 | 8,771 | 23,957 | .. | 3,852 | 1,382 | 5,234 | .. |
| 1880 | 9,564 | 5,590 | 15,154 | .. | 5,816 | 2,107 | 7,923 | .. |
| 1881 | 6,643 | 3,045 | 9,688 | .. | 5,705 | 2,367 | 8,072 | .. |
| 1882 | 7,042 | 3,903 | 10,945 | .. | 5,082 | 2,374 | 7,456 | .. |
| 1883 | 11,218 | 7,997 | 19,215 | .. | 6,230 | 2,956 | 9,186 | .. |
| 1884 | 12,475 | 7,546 | 20,021 | .. | 7,303 | 3,397 | 10,700 | .. |
| 1885 | 10,766 | 5,433 | 16,199 | .. | 7,866 | 3,829 | 11,695 | .. |
| 1886 | 11,068 | 5,033 | 16,101 | .. | 10,442 | 4,595 | 15,037 | .. |
| 1887 | 9,224 | 4,465 | 13,689 | .. | 8,434 | 4,278 | 12,712 | .. |
| 1888 | 9,112 | 4,494 | 13,606 | .. | 15,048 | 7,733 | 22,781 | .. |
| 1889 | 10,158 | 5,234 | 15,392 | .. | 9,493 | 5,685 | 15,178 | .. |
| 1890 | 9,753 | 5,275 | 15,028 | .. | 10,809 | 6,001 | 16,810 | .. |
| 1891 | 9,427 | 5,004 | 14,431 | .. | 11,396 | 6,233 | 17,629 | .. |
| 1892 | 12,131 | 5,991 | 18,122 | .. | 8,469 | 4,695 | 13,164 | .. |
| 1893 | 17,385 | 8,750 | 26,135 | .. | 10,263 | 5,460 | 15,723 | .. |
| 1894 | 16,375 | 8,862 | 25,237 | .. | 15,708 | 7,276 | 22,984 | .. |
| 1895 | 14,181 | 7,681 | 21,862 | .. | 13,746 | 7,221 | 20,967 | .. |
| 1896 | 11,145 | 6,091 | 17,236 | .. | 10,032 | 5,732 | 15,764 | .. |
| 1897 | 12,153 | 6,439 | 18,592 | 57 | 10,250 | 5,590 | 15,840 | .. |
| 1898 | 12,524 | 6,331 | 18,855 | 76 | 10,438 | 5,721 | 16,159 | .. |
| 1899 | 11,862 | 6,644 | 18,506 | 123 | 10,567 | 6,052 | 16,619 | .. |
| 1900 | 11,966 | 6,108 | 18,074 | 111 | 11,043 | 5,200 | 16,243 | .. |
| 1901 | 16,968 | 8,118 | 25,086 | 146 | 12,426 | 6,138 | 18,564 | .. |
| 1902 | 21,522 | 8,771 | 30,293 | 102 | 15,600 | 6,701 | 22,301 | .. |
| 1903 | 20,479 | 10,404 | 30,883 | 166 | 12,983 | 6,625 | 19,608 | .. |
| 1904 | 21,980 | 10,652 | 32,632 | 320 | 14,671 | 7,606 | 22,277 | .. |
| 1905 | 21,344 | 11,341 | 32,685 | 341 | 15,390 | 7,993 | 23,383 | .. |
| 1906 | 25,607 | 13,626 | 39,233 | 454 | 17,211 | 9,174 | 26,385 | .. |
| 1907 | 23,228 | 12,880 | 36,108 | 314 | 19,310 | 11,068 | 30,378 | .. |
| 1908 | 29,342 | 15,628 | 44,970 | 655 | 19,707 | 11,002 | 30,709 | .. |
| 1909 | 24,065 | 14,585 | 38,650 | 442 | 22,244 | 11,687 | 33,931 | .. |
| 1910 | 22,135 | 13,634 | 35,769 | 367 | 20,451 | 11,910 | 32,361 | .. |
| 1911 | 25,333 | 16,056 | 41,389 | 804 | 23,539 | 13,650 | 37,189 | .. |
| 1912 | 26,775 | 17,885 | 44,660 | 803 | 21,914 | 13,819 | 35,733 | .. |
| 1913 | 25,891 | 18,697 | 44,588 | 589 | 18,560 | 11,809 | 30,369 | .. |
| 1914 | 22,526 | 15,120 | 37,646 | 823 | 20,025 | 12,481 | 32,505 | .. |
| 1915 | 14,487 | 11,064 | 25,551 | 322 | 13,318 | 9,158 | 22,476 | 329 |
| 1916 | 11,959 | 9,840 | 21,799 | 1,013 | 11,932 | 9,231 | 21,163 | 569 |
| 1917 | 9,159 | 6,490 | 15,649 | 724 | 7,597 | 6,272 | 13,869 | 708 |
| 1918 | 6,356 | 5,550 | 11,906 | 917 | 6,097 | 5,563 | 11,660 | 404 |
| 1919 | 10,772 | 10,159 | 20,931 | 708 | 11,377 | 8,500 | 19,877 | 322 |
| 1920 | 23,687 | 20,375 | 44,062 | 1,734 | 17,951 | 14,973 | 32,924 | 443 |
| 1921 | 22,446 | 19,436 | 41,882 | 641 | 16,019 | 12,540 | 28,559 | 707 |
| 1922 | 18,811 | 16,422 | 35,233 | 549 | 15,643 | 12,746 | 28,389 | 700 |
| 1923 | 19,445 | 17,043 | 36.488 | 729 | 16,037 | 13,631 | 29,668 | 632 |
| 1924 | 21,719 | 18,096 | 39,815 | 1,017 | 16,489 | 14,104 | 30,593 | 911 |
| 1925 | 23,328 | 18,518 | 41,846 | 1,056 | 15,907 | 13,265 | 29,172 | 905 |
| VITAL STATISTICS. | ||||||||
|---|---|---|---|---|---|---|---|---|
| Year. | Numbers. | Rates per 1,000 of Mean Population. | Deaths under 1 Year per 1,000 Births. | |||||
| Births. | Marriages. | Deaths. | Deaths under 1 Year. | Births. | Marriages. | Deaths. | ||
| 1876 | 16,168 | 3,196 | 4,904 | 1,673 | 41.73 | 8.25 | 12.66 | 103.48 |
| 1877 | 16,856 | 3,114 | 4,685 | 1,527 | 41.28 | 7.62 | 11.47 | 90.59 |
| 1878 | 17,770 | 3,377 | 4,645 | 1,486 | 41.96 | 7.97 | 10.96 | 83.62 |
| 1879 | 18,070 | 3,352 | 5,583 | 1,941 | 40.32 | 7.48 | 12.46 | 107.42 |
| 1880 | 19,341 | 3,181 | 5,437 | 1,805 | 40.78 | 6.71 | 11.46 | 93.33 |
| 1881 | 18,732 | 3,277 | 5,491 | 1,731 | 37.95 | 6.64 | 11.13 | 92.41 |
| 1882 | 19,009 | 3,600 | 5,701 | 1,678 | 37.32 | 7.07 | 11.19 | 88.27 |
| 1883 | 19,202 | 3,612 | 6,061 | 1,995 | 36.28 | 6.82 | 11.45 | 103.90 |
| 1884 | 19,846 | 3,800 | 5,740 | 1,573 | 35.91 | 6.87 | 10.39 | 79.26 |
| 1885 | 19,693 | 3,813 | 6,081 | 1,756 | 34.35 | 6.65 | 10.61 | 89.17 |
| 1886 | 19,299 | 3,488 | 6,135 | 1,899 | 33.15 | 5.99 | 10.54 | 98.40 |
| 1887 | 19,135 | 3,563 | 6,137 | 1,795 | 32.09 | 5.97 | 10.29 | 93.81 |
| 1888 | 18,902 | 3,617 | 5,708 | 1,336 | 31.22 | 5.97 | 9.43 | 70.68 |
| 1889 | 18,457 | 3,632 | 5,772 | 1,456 | 30.17 | 5.94 | 9.44 | 78.89 |
| 1890 | 18,278 | 3,797 | 5,994 | 1,438 | 29.44 | 6.12 | 9.66 | 78.67 |
| 1891 | 18,273 | 3,805 | 6,518 | 1,667 | 29.01 | 6.04 | 10.35 | 91.23 |
| 1892 | 17,876 | 4,002 | 6,459 | 1,594 | 27.83 | 6.23 | 10.06 | 89.17 |
| 1893 | 18,187 | 4,115 | 6,767 | 1,600 | 27.50 | 6.22 | 10.23 | 87.97 |
| 1894 | 18,528 | 4,178 | 6,918 | 1,507 | 27.28 | 6.15 | 10.19 | 81.34 |
| 1895 | 18,546 | 4,110 | 6,863 | 1,637 | 26.78 | 5.94 | 9.91 | 88.27 |
| 1896 | 18,612 | 4,843 | 6,432 | 1,439 | 26.33 | 6.85 | 9.10 | 77.32 |
| 1897 | 18,737 | 4,928 | 6,595 | 1,354 | 25.96 | 6.83 | 9.14 | 72.26 |
| 1898 | 18,955 | 5,091 | 7,244 | 1,510 | 25.74 | 6.91 | 9.84 | 79.66 |
| 1899 | 18,835 | 5,461 | 7,680 | 1,806 | 25.12 | 7.28 | 10.24 | 95.89 |
| 1900 | 19,546 | 5,860 | 7,200 | 1,469 | 25.60 | 7.67 | 9.43 | 75.16 |
| 1901 | 20,491 | 6,095 | 7,634 | 1,563 | 26.34 | 7.83 | 9.81 | 71.40 |
| 1902 | 20,655 | 6,394 | 8,375 | 1,712 | 25.89 | 8.01 | 10.50 | 82.89 |
| 1903 | 21,829 | 6,748 | 8,528 | 1,770 | 26.61 | 8.23 | 10.40 | 81.03 |
| 1904 | 22,766 | 6,983 | 8,087 | 1,616 | 26.94 | 8.26 | 9.57 | 70.98 |
| 1905 | 23,682 | 7,200 | 8,061 | 1,599 | 27.22 | 8.28 | 9.27 | 67.52 |
| 1906 | 24,252 | 7,592 | 8,339 | 1,506 | 27.08 | 8.48 | 9.31 | 62.10 |
| 1907 | 25,094 | 8,192 | 10,066 | 2,228 | 27.30 | 8.91 | 10.95 | 88.79 |
| 1908 | 25,940 | 8,339 | 9,043 | 1,761 | 27.45 | 8.82 | 9.57 | 67.89 |
| 1909 | 26,524 | 8,094 | 8,959 | 1,634 | 27.29 | 8.33 | 9.22 | 61.60 |
| 1910 | 25,984 | 8,236 | 9,639 | 1,760 | 26.17 | 8.30 | 9.71 | 67.73 |
| 1911 | 26,354 | 8,825 | 9,534 | 1,484 | 25.97 | 8.70 | 9.39 | 56.31 |
| 1912 | 27,508 | 9,149 | 9,214 | 1,409 | 26.48 | 8.81 | 8.87 | 51.22 |
| 1913 | 27,935 | 8,813 | 10,119 | 1,653 | 26.14 | 8.25 | 9.47 | 59.17 |
| 1914 | 28,338 | 9,280 | 10,148 | 1,456 | 25.99 | 8.51 | 9.31 | 51.38 |
| 1915 | 27,850 | 10,028 | 9,965 | 1,394 | 25.33 | 9.12 | 9.06 | 50.05 |
| 1916 | 28,509 | 8,213 | 10,596 | 1,446 | 25.94 | 7.47 | 9.64 | 50.70 |
| 1917 | 28,239 | 6,417 | 10,528 | 1,360 | 25.69 | 5.84 | 9.58 | 48.16 |
| 1918 | 25,860 | 6,227 | 16,364 | 1,252 | 23.44 | 5.65 | 14.84 | 48.41 |
| 1919 | 24,483 | 9,519 | 10,808 | 1,108 | 21.42 | 8.33 | 9.46 | 45.26 |
| 1920 | 29,921 | 12,175 | 12,109 | 1,513 | 25.09 | 10.21 | 10.15 | 50.57 |
| 1921 | 28,567 | 10,635 | 10,682 | 1,366 | 23.34 | 8.69 | 8.73 | 47.82 |
| 1922 | 29,006 | 9,556 | 10,977 | 1,215 | 23.17 | 7.63 | 8.77 | 41.89 |
| 1923 | 27,967 | 10,070 | 11,511 | 1,225 | 21.94 | 7.90 | 9.03 | 43.80 |
| 1924 | 28,014 | 10,259 | 10,767 | 1,127 | 21.57 | 7.90 | 8.29 | 40.23 |
| 1925 | 28,153 | 10,419 | 11,026 | 1,125 | 2117 | 7.84 | 8.29 | 39.96 |
| METEOROLOGY (WELLINGTON). | |||||||||
|---|---|---|---|---|---|---|---|---|---|
| Year. | Atmospheric Pressure. | Temperature in Shade. | Rain. | Total Bright Sunshine. | |||||
| Maximum. | Mean. | Minimum. | Maximum. | Mean. | Minimum. | Number of Days. | Total Fall in Year. | ||
| in. | in. | in. | °Fahr. | °Fahr. | °Fahr. | days. | in. | h. m. | |
| 1876 | 30.563 | 29 942 | 28.982 | 80.5 | 56.1 | 33.9 | 147 | 43.37 | .. |
| 1877 | 30.673 | 29.965 | 29.026 | 80.5 | 55.5 | 30.0 | 151 | 51.93 | .. |
| 1878 | 30.594 | 29.873 | 28.819 | 79.7 | 55.1 | 31.5 | 178 | 54.60 | .. |
| 1879 | 30.673 | 29.965 | 29.026 | 80.5 | 55.5 | 30.0 | 151 | 51.93 | .. |
| 1880 | 30.539 | 29.964 | 29.169 | 79.5 | 56.2 | 33.8 | 176 | 46.77 | .. |
| 1881 | 30.559 | 29.965 | 29.091 | 80.0 | 55.9 | 34.0 | 137 | 50.13 | .. |
| 1882 | 30.467 | 29.900 | 29.114 | 79.0 | 55.4 | 36.0 | 166 | 55.69 | .. |
| 1883 | 30.481 | 29.933 | 29.039 | 85.0 | 55.0 | 32.0 | 169 | 51.99 | .. |
| 1884 | 30.592 | 29.905 | 29.041 | 79.0 | 53.6 | 32.0 | 168 | 62.34 | .. |
| 1885 | 30.639 | 30.001 | 29.296 | 76.0 | 54.5 | 33.0 | 162 | 36.81 | .. |
| 1886 | 30.743 | 29.958 | 29.067 | 79.0 | 54.4 | 32.0 | 169 | 54.48 | .. |
| 1887 | 30.579 | 29.931 | 28.909 | 83.0 | 54.9 | 31.0 | 188 | 56.97 | .. |
| 1888 | 30.654 | 29.912 | 29.088 | 73.3 | 54.4 | 35.0 | 186 | 41.00 | .. |
| 1889 | 30.886 | 30.004 | 28.987 | 80.0 | 55.3 | 31.5 | 155 | 31.36 | .. |
| 1890 | 30.606 | 29.978 | 29.132 | 82.0 | 55.8 | 32.0 | 165 | 45.23 | .. |
| 1891 | 30.593 | 29.971 | 29.037 | 81.0 | 54.8 | 31.3 | 166 | 35.13 | .. |
| 1892 | 30.650 | 29.999 | 29.283 | 77.5 | 55.9 | 32.5 | 184 | 67.66 | .. |
| 1893 | 30.492 | 29.963 | 29.073 | 82.0 | 56.7 | 34.0 | 186 | 53.03 | .. |
| 1894 | 30.619 | 29.960 | 29.021 | 80.0 | 56.4 | 33.3 | 175 | 51.00 | .. |
| 1895 | 30.423 | 29.905 | 29.189 | 88.0 | 55.1 | 32.0 | 185 | 66.47 | .. |
| 1896 | 30.533 | 29.939 | 29.176 | 79.0 | 55.4 | 34.0 | 185 | 57.55 | .. |
| 1897 | 30.530 | 29.916 | 29.161 | 81.0 | 55.5 | 31.0 | 184 | 48.96 | .. |
| 1898 | 30.647 | 29.912 | 29.139 | 77.3 | 55.2 | 31.9 | 162 | 41.96 | .. |
| 1899 | 30.561 | 29.966 | 29.019 | 76.3 | 54.7 | 31.0 | 181 | 52.72 | .. |
| 1900 | 30.500 | 29.955 | 29.036 | 79.0 | 55.0 | 34.0 | 191 | 51.00 | .. |
| 1901 | 30.497 | 29.938 | 29.113 | 79.0 | 55.0 | 30.0 | 175 | 41.56 | .. |
| 1902 | 30.594 | 29.928 | 29.073 | 81.0 | 54.1 | 32.0 | 201 | 38.75 | .. |
| 1903 | 30.765 | 30.029 | 29.294 | 79.5 | 54.6 | 31.0 | 161 | 53.80 | .. |
| 1904 | 30.734 | 29.928 | 29.005 | 82.3 | 54.6 | 32.0 | 170 | 60.41 | .. |
| 1905 | 30.580 | 29.939 | 29.076 | 77.0 | 54.5 | 30.5 | 172 | 51.17 | .. |
| 1906 | 30.863 | 29.965 | 29.086 | 75.0 | 53.9 | 33.5 | 151 | 42.31 | .. |
| 1907 | 30.573 | 29.970 | 29.022 | 80.2 | 55.3 | 33.0 | 150 | 44.26 | 1,853 53 |
| 1908 | 30.581 | 29.993 | 29.250 | 79.0 | 54.6 | 33.0 | 141 | 34.93 | 2,009 3 |
| 1909 | 30.521 | 29.982 | 29.120 | 75.2 | 55.9 | 36.0 | 160 | 38.88 | 2,223 31 |
| 1910 | 30.511 | 29.985 | 29.090 | 78.2 | 56.2 | 35.2 | 161 | 45.42 | 2,157 3 |
| 1911 | 30.609 | 29.944 | 29.002 | 76.0 | 55.6 | 35.4 | 180 | 40.85 | 2,276 37 |
| 1912 | 30.570 | 29.921 | 29.013 | 77.8 | 54.6 | 29.2 | 195 | 48.30 | 1,953 17 |
| 1913 | 30.590 | 29.918 | 29.074 | 79.8 | 55.3 | 34.0 | 196 | 52.01 | 1,973 39 |
| 1914 | 30.649 | 29.992 | 29.110 | 79.6 | 55.3 | 31.2 | 156 | 31.90 | 2,172 10 |
| 1915 | 30.579 | 29.972 | 29.140 | 84.0 | 55.7 | 31.2 | 143 | 27.83 | 1,919 32 |
| 1916 | 30.765 | 30.013 | 29.141 | 85.0 | 57.5 | 33.4 | 136 | 37.35 | 2,058 51 |
| 1917 | 30.595 | 29.948 | 28.927 | 81.5 | 57.2 | 33.6 | 164 | 43.82 | 1,957 36 |
| 1918 | 30.487 | 29.904 | 28.980 | 79.3 | 55.5 | 30.1 | 159 | 49.58 | 1,915 8 |
| 1919 | 30.667 | 29.967 | 28.998 | 81.1 | 54.6 | 29.9 | 136 | 28.51 | 2,022 46 |
| 1920 | 30.609 | 29.965 | 29.042 | 79.8 | 54.5 | 28.6 | 150 | 49.28 | 1,885 37 |
| 1921 | 30.571 | 29.984 | 28.902 | 81.6 | 55.1 | 30.3 | 157 | 42.86 | 2,060 4 |
| 1922 | 30.601 | 29.958 | 29.140 | 82.3 | 55.9 | 31.0 | 150 | 29.23 | 1,999 9 |
| 1923 | 30.585 | 29.919 | 29.202 | 77.2 | 55.6 | 30.0 | 164 | 41.02 | 1,939 14 |
| 1924 | 30.656 | 29.980 | 29.213 | 83.6 | 57.1 | 31.5 | 164 | 49.21 | 1,925 37 |
| 1925 | 30.675 | 29.927 | 28.939 | 78.2 | 55.3 | 29.9 | 175 | 52.17 | 2,044 9 |
| EDUCATION. | ||||||||
|---|---|---|---|---|---|---|---|---|
| Year. | Number of Scholars receiving | University Students. | ||||||
| Primary Education at | Secondary Education at | |||||||
| Public Schools. | Registered Private Schools. | Native Village Schools. | Secondary Schools. | District High Schools. | Technical High Schools. | Registered Private Schools. | ||
| 1876 | 51,964 | 9,357 | 1,570 | 654 | .. | .. | .. | .. |
| 1877 | 56,239 | 9,992 | 1,799 | 716 | .. | .. | .. | 173 |
| 1878 | 65,366 | 9,206 | 1,382 | 1,159 | .. | .. | .. | 160 |
| 1879 | 75,556 | 10,234 | 1,618 | 1,417 | .. | .. | .. | 240 |
| 1880 | 82,401 | 11,238 | 1,623 | 1,631 | .. | .. | .. | 211 |
| 1881 | 83,587 | 9,987 | 2,010 | 1,819 | .. | .. | .. | 239 |
| 1882 | 87,179 | 10,002 | 2,024 | 1,899 | .. | .. | .. | 279 |
| 1883 | 92,476 | 11,255 | 1,923 | 2,384 | .. | .. | .. | 361 |
| 1884 | 97,238 | 12,203 | 2,226 | 2,642 | .. | .. | .. | 419 |
| 1885 | 102,407 | 11,989 | 2,161 | 2,659 | .. | .. | .. | 442 |
| 1886 | 106,328 | 12,497 | 2,346 | 2,358 | .. | .. | .. | 490 |
| 1887 | 110,919 | 13,417 | 2,631 | 2,242 | .. | .. | .. | 588 |
| 1888 | 112,685 | 13,893 | 2,512 | 2,120 | .. | .. | .. | 662 |
| 1889 | 115,456 | 13,516 | 2,462 | 2,147 | .. | .. | .. | 588 |
| 1890 | 117,912 | 13,691 | 2,259 | 2,117 | .. | .. | .. | 596 |
| 1891 | 119,523 | 14,176 | 2,231 | 2,205 | .. | .. | .. | 705 |
| 1892 | 122,620 | 14,467 | 2,133 | 2,262 | .. | .. | .. | 695 |
| 1893 | 124,690 | 14,931 | 2,134 | 2,251 | .. | .. | .. | 680 |
| 1894 | 127,300 | 14,649 | 2,418 | 2,454 | .. | .. | .. | 680 |
| 1895 | 129,856 | 14,704 | 2,675 | 2,525 | .. | .. | .. | 742 |
| 1896 | 131,037 | 13,979 | 2,862 | 2,614 | .. | .. | .. | 677 |
| 1897 | 132,197 | 14,524 | 2,864 | 2,709 | .. | .. | .. | 653 |
| 1898 | 131,621 | 14,857 | 2,972 | 2,706 | .. | .. | .. | 667 |
| 1899 | 131,315 | 15,380 | 3,065 | 2,723 | .. | .. | .. | 766 |
| 1900 | 130,724 | 15,602 | 3,109 | 2,792 | .. | .. | .. | 805 |
| 1901 | 131,351 | 15,397 | 3,273 | 2,899 | 662 | .. | .. | 783 |
| 1902 | 132,262 | 15,667 | 3,742 | 3,072 | 1,479 | .. | .. | 864 |
| 1903 | 133,568 | 15,687 | 3,693 | 3,722 | 2,096 | .. | .. | 862 |
| 1904 | 135,475 | 16,445 | 3,754 | 4,038 | 2,330 | .. | .. | 971 |
| 1905 | 137,623 | 16,738 | 3,863 | 4,060 | 2,872 | .. | .. | 1,153 |
| 1906 | 139,302 | 17,217 | 4,174 | 4,270 | 2,594 | .. | .. | 1,332 |
| 1907 | 141,071 | 18,174 | 4,183 | 4,196 | 2,452 | .. | .. | 1,325 |
| 1908 | 147,428 | 16,244 | 4,217 | 4,327 | 2,142 | 699 | .. | 1,634 |
| 1909 | 152,416 | 17,989 | 4,121 | 4,856 | 1,891 | 846 | .. | 1,846 |
| 1910 | 156,324 | 19,052 | 4,280 | 5,176 | 1,916 | 1,253 | .. | 1,862 |
| 1911 | 161,648 | 19,967 | 4,557 | 5,465 | 1,777 | 1,341 | 831 | 1,900 |
| 1912 | 166,264 | 20,350 | 4,694 | 5,831 | 1,815 | 1,526 | 883 | 2,228 |
| 1913 | 172,168 | 21,251 | 4,647 | 6,154 | 1,837 | 1,664 | 545 | 2,318 |
| 1914 | 178,509 | 22,247 | 5,072 | 6,418 | 1,896 | 1,839 | 850 | 2,257 |
| 1915 | 183,214 | 22,477 | 5,191 | 6,488 | 2,102 | 1,955 | 992 | 2,039 |
| 1916 | 185,884 | 23,635 | 5,132 | 7,052 | 2,115 | 2,105 | 1,004 | 1,985 |
| 1917 | 188,174 | 25,685 | 5,173 | 7,590 | 2,180 | 2,347 | 1,206 | 1,977 |
| 1918 | 192,680 | 26,371 | 5,064 | 8,384 | 2,283 | 2,747 | 1,366 | 2,226 |
| 1919 | 193,900 | 20,977 | 5,198 | 9,068 | 2,159 | 2,926 | 1,497 | 3 060 |
| 1920 | 197,645 | 22,193 | 5,508 | 9,196 | 2,157 | 2,766 | 1,439 | 3,822 |
| 1921 | 205,181 | 23,924 | 5,822 | 10,030 | 2,176 | 3,349 | 1,634 | 4,123 |
| 1922 | 210,491 | 24,861 | 6,161 | 10,736 | 2,606 | 4,202 | 1,998 | 3,158 |
| 1923 | 211,960 | 26,010 | 6,186 | 11,619 | 2,818 | 5,054 | 2,134 | 4,202 |
| 1924 | 213,290 | 26,302 | 6,310 | 12,010 | 2,900 | 5,369 | 2,473 | 4,236 |
| 1925 | 214,724 | 25,933 | 6,386 | 12,514 | 3,136 | 5,132 | 2,511 | 4,442 |
| JUSTICE. | ||||||||
|---|---|---|---|---|---|---|---|---|
| Year. | Summary Convictions in Magistrates Courts. | Sentences in Supreme Courts. | Prisoners in Gaol at end of Year. | |||||
| Undergoing Sentence. | Total in Confinement. | |||||||
| Number. | Rate per 1,000 of Mean Population. | Number. | Rate per 1,000 of Mean Population. | Number. | Rate per 10,000 of Population. | Number. | Rate per 10,000 of Population. | |
| 1876 | 16,100 | 37.19 | 249 | 0.58 | 611 | 13.74 | 662 | 14.90 |
| 1877 | 16,293 | 36.26 | 250 | 0.56 | 655 | 14.42 | 705 | 15.53 |
| 1878 | 16,370 | 35.27 | 292 | 0.63 | 596 | 12.52 | 657 | 13.80 |
| 1879 | 16,088 | 32.72 | 296 | 0.60 | 698 | 13.76 | 787 | 15.51 |
| 1880 | 15,025 | 29.01 | 330 | 0.64 | 703 | 13.30 | 871 | 16.48 |
| 1881 | 14,079 | 26.22 | 270 | 0.50 | 641 | 11.76 | 698 | 12.81 |
| 1882 | 16,573 | 29.95 | 265 | 0.48 | 578 | 10.28 | 636 | 11.32 |
| 1883 | 16,944 | 29.55 | 258 | 0.45 | 567 | 9.69 | 613 | 10.48 |
| 1884 | 17,968 | 30.11 | 287 | 0.48 | 560 | 9.20 | 629 | 10.34 |
| 1885 | 17,804 | 29.00 | 266 | 0.43 | 531 | 8.57 | 589 | 9.51 |
| 1886 | 16,705 | 26.76 | 306 | 0.49 | 558 | 8.84 | 625 | 9.90 |
| 1887 | 15,557 | 24.37 | 386 | 0.60 | 633 | 9.81 | 691 | 10.71 |
| 1888 | 14,472 | 22.36 | 308 | 0.48 | 605 | 9.32 | 641 | 9.87 |
| 1889 | 14,082 | 21.54 | 276 | 0.42 | 611 | 9.29 | 633 | 9.62 |
| 1890 | 14,128 | 21.32 | 270 | 0.41 | 517 | 7.75 | 562 | 8.42 |
| 1891 | 13,349 | 19.87 | 283 | 0.42 | 494 | 7.31 | 534 | 7.90 |
| 1892 | 13,583 | 19.85 | 241 | 0.35 | 433 | 6 25 | 476 | 6.87 |
| 1893 | 13,710 | 19.49 | 304 | 0.43 | 463 | 6.48 | 502 | 7.03 |
| 1894 | 12,934 | 17.93 | 371 | 0.51 | 483 | 6.63 | 555 | 7.62 |
| 1895 | 13,383 | 18.22 | 407 | 0.55 | 531 | 7.17 | 582 | 7.86 |
| 1896 | 14,481 | 19.40 | 355 | 0.48 | 493 | 6.54 | 550 | 7.29 |
| 1897 | 15,325 | 20.13 | 366 | 0.48 | 623 | 8.10 | 674 | 8.77 |
| 1898 | 16,991 | 21.89 | 391 | 0.50 | 533 | 6.80 | 595 | 7.60 |
| 1899 | 17,586 | 22.27 | 405 | 0.51 | 508 | 6.38 | 566 | 7.11 |
| 1900 | 19,242 | 23.99 | 427 | 0.53 | 527 | 6.52 | 568 | 7.03 |
| 1901 | 20,724 | 25.24 | 345 | 0.42 | 661 | 8.39 | 713 | 9.05 |
| 1902 | 22,455 | 26.70 | 338 | 0.40 | 602 | 7.45 | 653 | 8.08 |
| 1903 | 25,186 | 29.17 | 398 | 0.46 | 688 | 8.26 | 739 | 8.88 |
| 1904 | 25,672 | 28.90 | 490 | 0.55 | 701 | 7.78 | 750 | 8.33 |
| 1905 | 25,371 | 27.78 | 449 | 0.49 | 760 | 8.21 | 810 | 8.75 |
| 1906 | 27,670 | 29.33 | 427 | 0.45 | 833 | 8.71 | 891 | 9.32 |
| 1907 | 30,901 | 31.96 | 463 | 0.48 | 791 | 8.09 | 847 | 8.67 |
| 1908 | 30,852 | 31.08 | 527 | 0.53 | 815 | 8.08 | 879 | 8.72 |
| 1909 | 31,151 | 30.55 | 536 | 0.53 | 877 | 8.51 | 949 | 9.21 |
| 1910 | 32,435 | 31.17 | 495 | 0.48 | 843 | 8.01 | 881 | 8.38 |
| 1911 | 33,029 | 31.05 | 453 | 0.43 | 802 | 7.46 | 873 | 8.12 |
| 1912 | 36,191 | 33.24 | 480 | 0.44 | 821 | 7.45 | 866 | 7.86 |
| 1913 | 39,685 | 35.48 | 446 | 0.40 | 834 | 7.35 | 919 | 8.10 |
| 1914 | 41,723 | 36.59 | 522 | 0.46 | 981 | 8.56 | 1,045 | 9.12 |
| 1915 | 39,675 | 34.52 | 509 | 0.44 | 941 | 8.16 | 998 | 8.66 |
| 1916 | 35,459 | 30.85 | 448 | 0.39 | 834 | 7.25 | 890 | 7.74 |
| 1917 | 34,189 | 29.76 | 623 | 0.54 | 954 | 8.31 | 1,007 | 8.78 |
| 1918 | 29,252 | 25.37 | 632 | 0.55 | 1,005 | 8.68 | 1,047 | 9.04 |
| 1919 | 32,692 | 27.41 | 808 | 0.68 | 852 | 6.94 | 920 | 7.50 |
| 1920 | 35,517 | 28.59 | 1,011 | 0.81 | 996 | 7.92 | 1,060 | 8.43 |
| 1921 | 37,124 | 29.08 | 1,475 | 1.16 | 1,044 | 8.08 | 1,099 | 8.50 |
| 1922 | 34,513 | 26.44 | 1,417 | 1.09 | 1,052 | 8.32 | 1,114 | 8.90 |
| 1923 | 37,104 | 27.94 | 1,663 | 1.25 | 1,141 | 8.50 | 1,195 | 8.90 |
| 1924 | 39,594 | 29.27 | 1,388 | 1.03 | 1,197 | 8.85 | 1,247 | 9.22 |
| 1925 | 44,017 | 31.79 | 1,465 | 1.06 | 1,285 | 9.17 | 1,333 | 9.51 |
| AGRICULTURE. | ||||||
|---|---|---|---|---|---|---|
| Season. | Wheat for Threshing. | Oats for Threshing. | ||||
| Area. | Yield. | Yield per Acre. | Area. | Yield. | Yield per Acre. | |
* Yield probably overstated for these four seasons, due to total being obtained by applying ascertained averages to areas returned by farmers as sown for threshing. Areas returned in these years as intended for threshing would appear, in many cases, to have been eventually utilized for other purposes. | ||||||
| Acres. | Bushels. | Bushels. | Acres. | Bushels. | Bushels. | |
| 1876–77 | 141,614 | 4,054,377 | 28.63 | 150,718 | 4,707,836 | 31.24 |
| 1877–78 | 243,406 | 6,336,369 | 26.03 | 190,344 | 5,929,962 | 31.15 |
| 1878–79 | 264,861 | 6,076,604 | 22.94 | 278,031 | 8,365,586 | 30.09 |
| 1879–80 | 270,198 | 7,610,012 | 28.16 | 330,208 | 12,062,607 | 36.53 |
| 1880–81 | 324,949 | 8,147,797 | 25.07 | 215,030 | 6,891,961 | 32.05 |
| 1881–82 | 365,715 | 8,297,890 | 22.69 | 243,387 | 6,924,848 | 28.45 |
| 1882–83 | 390,818 | 10,270,591 | 26.28 | 319,858 | 10,520,428 | 32.89 |
| 1883–84 | 377,706 | 9,827,136 | 26.02 | 262,954 | 9,231,339 | 35.11 |
| 1884–85 | 270,043 | 6,866,777 | 25.43 | 354,794 | 12,360,449 | 34.84 |
| 1885–86 | 173,891 | 4,242,285 | 24.40 | 329,488 | 8,603,702 | 26.11 |
| 1886–87 | 253,025 | 6,297,638 | 24.89 | 387,228 | 11,973,295 | 30.92 |
| 1887–88 | 357,359 | 9,424,059 | 26.37 | 336,474 | 10,512,119 | 31.24 |
| 1888–89 | 362,153 | 8,770,246 | 24.22 | 367,225 | 10,977,065 | 29.89 |
| 1889–90 | 335,861 | 8,448,506 | 25.15 | 426,071 | 13,673,584 | 32.10 |
| 1890–91 | 301,460 | 5,723,610 | 18.99 | 346,224 | 9,947,036 | 28.73 |
| 1891–92 | 402,273 | 10,257,738 | 25.50 | 323,508 | 11,009,020 | 34.03 |
| 1892–93 | 381,245 | 8,378,217 | 21.98 | 326,531 | 9,893,989 | 30.30 |
| 1893–94 | 242,737 | 4,891,695 | 20.15 | 376,646 | 12,153,068 | 32.27 |
| 1894–95 | 148,575 | 3,613,037 | 24.32 | 351,352 | 10,221,393 | 29.05 |
| 1895–96 | 245,441 | 6,843,768 | 27.88 | 364,788 | 12,263,540 | 33.62 |
| 1896–97 | 258,608 | 5,926,523 | 22.92 | 372,597 | 11,232,803 | 30.15 |
| 1897–98 | 315,801 | 5,670,017 | 17.95 | 354,819 | 9,738,391 | 27.44 |
| 1898–99 | 399,034 | 13,073,416 | 32.76 | 417,320 | 16,511,388 | 39.56 |
| 1899–1900 | 269,749 | 8,581,898 | 31.81 | 398,243 | 16,325,832 | 40.99 |
| 1900–1 | 206,465 | 6,527,154 | 31.61 | 449,534 | 19,085,837 | 42.45 |
| 1901–2 | 163,462 | 4,046,589 | 24.76 | 405,924 | 15,045,233 | 37.06 |
| 1902–3 | 194,355 | 7,457,915 | 38.37 | 483,659 | 21,766,708 | 45.00 |
| 1903–4 | 230,346 | 7,891,654 | 34.26 | 409,390 | 15,107,237 | 38.57 |
| 1904–5 | 258,015 | 9,123,673 | 35.36 | 342,189 | 14,553,611 | 42.53 |
| 1905–6 | 222,183 | 6,798,934 | 30.60 | 354,291 | 12,707,982 | 35.86 |
| 1906–7 | 206,185 | 5,605,252 | 27.18 | 351,929 | 11,201,789 | 31.83 |
| 1907–8 | 193,031 | 5,567,139 | 28.84 | 386,885 | 15,021,801 | 33.82 |
| 1908–9 | 252,391 | 8,772,790 | 34.75 | 406,908 | 18,906,788 | 46.46 |
| 1909–10 | 311,000 | 8,661,100 | 28.00 | 377,000 | 13,804,000 | 37.00 |
| 1910–11 | 322,167 | 8,290,221 | 25.72 | 302,827 | 10,118,917 | 33.41 |
| 1911–12 | 215,528 | 7,261,138 | 33.69 | 403,668 | 19,662,668* | 48.71 |
| 1912–13 | 189,869 | 5,179,626 | 27.28 | 386,786 | 13,583,924* | 35.12 |
| 1913–14 | 166,774 | 5,231,700 | 31.37 | 361,741 | 14,740,946* | 40.75 |
| 1914–15 | 229,600 | 6,644,336 | 28.94 | 287,561 | 11,436,301* | 39.77 |
| 1915–16 | 329,207 | 7,108,360 | 21.59 | 212,688 | 7,653,208 | 35.98 |
| 1916–17 | 217,743 | 5,051,227 | 23.19 | 177,524 | 5,371,436 | 30.29 |
| 1917–18 | 280,978 | 6,807,536 | 24.23 | 156,202 | 4,942,759 | 31.64 |
| 1918–19 | 208,030 | 6,567,629 | 31.57 | 172,686 | 6,884,609 | 39.87 |
| 1919–20 | 139,611 | 4,559,934 | 32.66 | 179,800 | 6,967,862 | 38.75 |
| 1920–21 | 219,985 | 6,872,262 | 31.24 | 147,559 | 5,225,115 | 35.41 |
| 1921–22 | 352,918 | 10,565,275 | 29.94 | 170,655 | 6,752,663 | 39.56 |
| 1922–23 | 275,775 | 8,395,023 | 30.44 | 143,090 | 5,688,157 | 39.75 |
| 1923–24 | 173,864 | 4,174,537 | 24.01 | 63,842 | 1,964,511 | 30.77 |
| 1924–25 | 166.964 | 5,447,758 | 32.62 | 147,387 | 5,707,174 | 38.72 |
| 1925–26 | 151,673 | 4,617,041 | 30.44 | 102,485 | 4,115,606 | 40.14 |
| LIVE-STOCK. | ||||||
|---|---|---|---|---|---|---|
| Year. | Horses. | Total Cattle. | Dairy Cows. | Sheep. | Pigs. | Goats. |
* Not enumerated. | ||||||
| 1877 | * | * | * | * | * | * |
| 1878 | 137,768 | 578,430 | * | 13,069,338 | 207,337 | 14,243 |
| 1879 | * | * | * | 11,570,847 | * | * |
| 1880 | * | * | * | 11,530,623 | * | * |
| 1881 | 161,736 | 698,637 | * | 12,190,215 | 200,083 | 11,223 |
| 1882 | * | * | * | 12,408,106 | * | * |
| 1883 | * | * | * | 13,306,329 | * | * |
| 1884 | * | * | * | 13,978,520 | * | * |
| 1885 | * | * | * | 14,546,801 | * | * |
| 1886 | 187,382 | 853,358 | * | 15,174,263 | 277,901 | 10,220 |
| 1887 | * | * | * | 15,155,626 | * | * |
| 1888 | * | * | * | 15,042,198 | * | * |
| 1889 | * | * | * | 15,423,328 | * | * |
| 1890 | * | * | * | 16,116,113 | * | * |
| 1891 | 211,040 | 788,919 | * | 17,865,423 | 222,553 | 9,055 |
| 1892 | * | * | * | 18,570,752 | * | * |
| 1893 | * | * | * | 19,380,369 | * | * |
| 1894 | * | 885,305 | * | 20,230,829 | * | * |
| 1895 | * | 964,034 | 257,140 | 19,826,604 | * | * |
| 1896 | 237,418 | 1,047,901 | 276,217 | 19,138,493 | 239,778 | * |
| 1897 | 249,813 | 1,138,067 | 300,219 | 19,687,954 | 209,834 | * |
| 1898 | 252,834 | 1,209,165 | 324,485 | 19,673,725 | 186,027 | * |
| 1899 | 258,115 | 1,203,024 | 333,536 | 19,348,506 | 193,512 | * |
| 1900 | 261,931 | 1,222,139 | 355,256 | 19,355,195 | 249,751 | * |
| 1901 | 266,245 | 1,256,680 | 372,416 | 20,233,099 | 250,975 | * |
| 1902 | 279,672 | 1,361,784 | 381,492 | 20,342,727 | 224,024 | * |
| 1903 | 286,955 | 1,460,663 | 428,773 | 18,954,553 | 193,740 | * |
| 1904 | 298,714 | 1,593,547 | 468,125 | 18,280,806 | 226,591 | * |
| 1905 | 314,322 | 1,736,850 | 498,241 | 19,130,875 | 255,320 | * |
| 1906 | 326,537 | 1,810,936 | 517,720 | 20,108,471 | 249,727 | * |
| 1907 | 342,608 | 1,851,750 | 543,927 | 20,983,772 | 242,273 | * |
| 1908 | 352,832 | 1,816,299 | 541,363 | 22,449,053 | 241,128 | * |
| 1909 | 363,259 | 1,773,326 | 536,629 | 23,480,707 | 245,092 | * |
| 1910 | * | * | * | 24,269,620 | * | * |
| 1911 | 404,284 | 2,020,171 | 633,733 | 23,996,126 | 348,754 | * |
| 1912 | * | * | * | 23,750,153 | * | * |
| 1913 | * | * | * | 24,191,810 | * | * |
| 1914 | * | * | * | 24,798,763 | * | * |
| 1915 | * | * | * | 24,901,421 | * | * |
| 1916 | 371,331 | 2,417,491 | 750,323 | 24,788,150 | 297,501 | 17,601 |
| 1917 | 373,600 | 2,575,230 | 777,439 | 25,270,386 | 283,770 | 18,235 |
| 1918 | 378,050 | 2,869,465 | 793,212 | 26,538,302 | 258,694 | 17,730 |
| 1919 | 363,188 | 3,035,478 | 826,135 | 25,828,554 | 235,347 | 16,924 |
| 1920 | 346,407 | 3,101,945 | 893,454 | 23,919,970 | 266,829 | 14,534 |
| 1921 | 337,259 | 3,139,223 | 1,004,666 | 23,285,031 | 349,892 | 17,367 |
| 1922 | 332,105 | 3,323,223 | 1,137,055 | 22,222,259 | 384,333 | 17,480 |
| 1923 | 330,818 | 3,480,694 | 1,248,643 | 23,081,439 | 400,889 | 17,071 |
| 1924 | 330,430 | 3,563,497 | 1,312,588 | 23,775,776 | 414,271 | 18,196 |
| 1925 | 326,830 | 3,503,744 | 1,323,432 | 24,547,955 | 440,115 | 18,975 |
| 1926 | 314,867 | 3,452,486 | 1,303,856 | 24,904,993 | 472,534 | 21,761 |
| TRADE. | ||||||||||||
|---|---|---|---|---|---|---|---|---|---|---|---|---|
| Year. | Imports. | Exports. | Total Trade. | Rate per Head of Mean Population (including Maoris). | ||||||||
| Imports. | Exports. | Total Trade. | ||||||||||
| £ | £ | £ | £ | s. | d. | £ | s. | d. | £ | s. | d. | |
| 1876 | 6,905,171 | 5,673,465 | 12,578,636 | 15 | 19 | 0 | 13 | 2 | 1 | 29 | 1 | 1 |
| 1877 | 6,973,418 | 6,327,472 | 13,300,890 | 15 | 10 | 5 | 14 | 1 | 8 | 29 | 12 | 1 |
| 1878 | 8,755,663 | 6,015,700 | 14,771,363 | 18 | 17 | 3 | 12 | 19 | 2 | 31 | 16 | 5 |
| 1879 | 8,374,585 | 5,743,126 | 14,117,711 | 17 | 0 | 8 | 11 | 13 | 7 | 28 | 14 | 3 |
| 1880 | 6,162,011 | 6,352,692 | 12,514,703 | 11 | 18 | 0 | 12 | 5 | 4 | 24 | 3 | 4 |
| 1881 | 7,457,045 | 6,060,866 | 13,517,911 | 13 | 17 | 9 | 11 | 5 | 9 | 25 | 3 | 6 |
| 1882 | 8,609,270 | 6,658,008 | 15,267,278 | 15 | 11 | 2 | 12 | 0 | 7 | 27 | 11 | 9 |
| 1883 | 7,974,038 | 7,095,999 | 15,070,037 | 13 | 18 | 2 | 12 | 7 | 6 | 26 | 5 | 8 |
| 1884 | 7,663,888 | 7,091,667 | 14,755,555 | 12 | 16 | 11 | 11 | 17 | 9 | 24 | 14 | 8 |
| 1885 | 7,479,921 | 6,819,939 | 14,299,860 | 12 | 3 | 9 | 11 | 2 | 2 | 23 | 5 | 11 |
| 1886 | 6,759,013 | 6,672,791 | 13,431,804 | 10 | 16 | 6 | 10 | 13 | 9 | 21 | 10 | 3 |
| 1887 | 6,245,515 | 6,866,169 | 13,111,684 | 9 | 15 | 8 | 10 | 15 | 2 | 20 | 10 | 10 |
| 1888 | 5,941,900 | 7,767,325 | 13,709,225 | 9 | 3 | 7 | 12 | 0 | 0 | 21 | 3 | 7 |
| 1889 | 6,308,863 | 9,341,864 | 15,650,727 | 9 | 13 | 0 | 14 | 5 | 10 | 23 | 18 | 10 |
| 1890 | 6,260,525 | 9,811,720 | 16,072,245 | 9 | 8 | 11 | 14 | 16 | 1 | 24 | 5 | 0 |
| 1891 | 6,503,849 | 9,566,397 | 16,070,246 | 9 | 13 | 8 | 14 | 4 | 10 | 23 | 18 | 6 |
| 1892 | 6,943,056 | 9,534,851 | 16,477,907 | 10 | 2 | 11 | 13 | 18 | 8 | 24 | 1 | 7 |
| 1893 | 6,911,515 | 8,985,364 | 15,896,879 | 9 | 16 | 7 | 12 | 15 | 6 | 22 | 12 | 1 |
| 1894 | 6,788,020 | 9,231,047 | 16,019,067 | 9 | 8 | 3 | 12 | 16 | 0 | 22 | 4 | 3 |
| 1895 | 6,400,129 | 8,550,224 | 14,950,353 | 8 | 14 | 4 | 11 | 12 | 10 | 20 | 7 | 2 |
| 1896 | 7,137,320 | 9,321,105 | 16,458,425 | 9 | 11 | 3 | 12 | 9 | 10 | 22 | 1 | 1 |
| 1897 | 8,055,223 | 10,016,993 | 18,072,216 | 10 | 11 | 7 | 13 | 3 | 1 | 23 | 14 | 8 |
| 1898 | 8,230,600 | 10,517,955 | 18,748,555 | 10 | 12 | 1 | 13 | 11 | 1 | 24 | 3 | 2 |
| 1899 | 8,739,633 | 11,938,335 | 20,677,968 | 11 | 1 | 4 | 15 | 2 | 4 | 26 | 3 | 8 |
| 1900 | 10,646,096 | 13,246,161 | 23,892,257 | 13 | 5 | 5 | 16 | 10 | 3 | 29 | 15 | 8 |
| 1901 | 11,817,915 | 12,881,424 | 24,699,339 | 14 | 7 | 7 | 15 | 13 | 9 | 30 | 1 | 4 |
| 1902 | 11,326,723 | 13,644,977 | 24,971,700 | 13 | 9 | 5 | 16 | 4 | 6 | 29 | 13 | 11 |
| 1903 | 12,788,675 | 15,010,378 | 27,799,053 | 14 | 16 | 3 | 17 | 7 | 9 | 32 | 4 | 0 |
| 1904 | 13,291,694 | 14,748,348 | 28,040,042 | 14 | 19 | 4 | 16 | 12 | 1 | 31 | 11 | 5 |
| 1905 | 12,828,857 | 15,655,947 | 28,484,804 | 14 | 1 | 0 | 17 | 2 | 11 | 31 | 3 | 11 |
| 1906 | 15,211,403 | 18,095,137 | 33,306,540 | 16 | 2 | 6 | 19 | 3 | 8 | 35 | 6 | 2 |
| 1907 | 17,302,861 | 20,068,957 | 37,371,818 | 17 | 17 | 11 | 20 | 15 | 2 | 38 | 13 | 1 |
| 1908 | 17,471,284 | 16,317,494 | 33,788,778 | 17 | 12 | 0 | 16 | 8 | 9 | 34 | 0 | 9 |
| 1909 | 15,674,719 | 19,661,996 | 35,336,715 | 15 | 7 | 6 | 19 | 5 | 9 | 34 | 13 | 3 |
| 1910 | 17,051,583 | 22,180,209 | 39,231,792 | 16 | 7 | 9 | 21 | 6 | 4 | 37 | 14 | 1 |
| 1911 | 19,545,879 | 19,028,490 | 38,574,369 | 18 | 7 | 5 | 17 | 17 | 9 | 36 | 5 | 2 |
| 1912 | 20,976,574 | 21,770,581 | 42,747,155 | 19 | 5 | 4 | 19 | 19 | 11 | 39 | 5 | 3 |
| 1913 | 22,288,302 | 22,986,722 | 45,275,024 | 19 | 18 | 7 | 20 | 11 | 0 | 40 | 9 | 7 |
| 1914 | 21,856,096 | 26,261,447 | 48,117,543 | 19 | 3 | 5 | 23 | 0 | 8 | 42 | 4 | 1 |
| 1915 | 21,728,834 | 31,748,912 | 53,477,746 | 18 | 18 | 2 | 27 | 12 | 6 | 46 | 10 | 8 |
| 1916 | 26,339,283 | 33,286,937 | 59,626,220 | 22 | 18 | 5 | 28 | 19 | 4 | 51 | 17 | 9 |
| 1917 | 20,919,265 | 31,587,547 | 52,506,812 | 18 | 4 | 2 | 27 | 9 | 11 | 45 | 14 | 1 |
| 1918 | 24,234,007 | 28,516,188 | 52,750,195 | 21 | 0 | 5 | 24 | 14 | 9 | 45 | 15 | 2 |
| 1919 | 30,671,698 | 53,970,075 | 84,641,773 | 25 | 14 | 4 | 45 | 5 | 0 | 70 | 19 | 4 |
| 1920 | 61,595,828 | 46,441,946 | 108,037,774 | 49 | 11 | 7 | 37 | 7 | 7 | 86 | 19 | 2 |
| 1921 | 42,942,443 | 44,828,827 | 87,771,270 | 33 | 129 | 35 | 2 | 3 | 68 | 15 | 0 | |
| 1922 | 35,012,561 | 42,726,249 | 77,738,810 | 26 | 16 | 6 | 32 | 14 | 9 | 59 | 11 | 3 |
| 1923 | 43,378,493 | 45,967,165 | 89,345,658 | 32 | 13 | 2 | 34 | 12 | 2 | 67 | 5 | 4 |
| 1924 | 48,527,603 | 52,612,711 | 101,140,314 | 35 | 17 | 6 | 38 | 17 | 10 | 74 | 15 | 4 |
| 1925 | 52,456,407 | 55,262,272 | 107,718,679 | 37 | 17 | 10 | 39 | 18 | 4 | 77 | 16 | 2 |
| Year. | Exports of New Zealand Produce. | |||||
|---|---|---|---|---|---|---|
| Wool. | Frozen Meat. | Tallow. | ||||
| Quantity. | Value. | Quantity. | Value. | Quantity. | Value. | |
| lb. | £ | cwt. | £ | cwt. | £ | |
| 1876 | 59,853,454 | 3,395,816 | .. | .. | 61,760 | 109,896 |
| 1877 | 64,481,324 | 3,658,938 | .. | .. | 92,505 | 156,552 |
| 1878 | 59,270,256 | 3,292,807 | .. | .. | 100,380 | 178,502 |
| 1879 | 62,222,810 | 3,126,439 | .. | .. | 92,710 | 145,595 |
| 1880 | 66,860,150 | 3,169,300 | .. | .. | 101,470 | 146,535 |
| 1881 | 59,415,940 | 2,909,760 | .. | .. | 83,155 | 120,611 |
| 1882 | 65,322,707 | 3,118,554 | 15,244 | 19,339 | 108,780 | 165,938 |
| 1883 | 68,149,430 | 3,014,211 | 87,975 | 118,328 | 141,185 | 233,557 |
| 1884 | 81,139,028 | 3,267,527 | 254,069 | 345,090 | 150,770 | 234,829 |
| 1885 | 86,507,431 | 3,205,275 | 296,473 | 373,857 | 138,600 | 176,962 |
| 1886 | 90,853,744 | 3,072,971 | 346,055 | 427,193 | 129,700 | 119,619 |
| 1887 | 88,824,382 | 3,321,074 | 402,107 | 455,870 | 154,720 | 147,233 |
| 1888 | 83,225,733 | 3,115,098 | 552,298 | 628,800 | 136,460 | 124,950 |
| 1889 | 102,227,354 | 3,976,375 | 656,822 | 783,374 | 159,020 | 159,460 |
| 1890 | 102,817,077 | 4,150,599 | 898,894 | 1,087,617 | 173,300 | 162,471 |
| 1891 | 106,187,114 | 4,129,686 | 1,000,307 | 1,194,724 | 175,580 | 173,257 |
| 1892 | 118,180,912 | 4,313,307 | 869,600 | 1,033,377 | 165,220 | 165,513 |
| 1893 | 109,719,684 | 3,774,738 | 903,836 | 1,085,167 | 170,060 | 183,588 |
| 1894 | 144,295,154 | 4,827,016 | 1,025,243 | 1,194,545 | 199,400 | 204,499 |
| 1895 | 116,015,170 | 3,662,131 | 1,134,097 | 1,262,711 | 263,560 | 260,999 |
| 1896 | 129,151,624 | 4,391,848 | 1,103,362 | 1,251,993 | 222,540 | 208,821 |
| 1897 | 135,835,117 | 4,443,144 | 1,407,921 | 1,566,286 | 310,200 | 259,964 |
| 1898 | 149,385,815 | 4,645,804 | 1,551,773 | 1,698,750 | 347,160 | 302,141 |
| 1899 | 147,169,497 | 4,324,627 | 1,865,827 | 2,088,856 | 338,620 | 311,649 |
| 1900 | 140,706,486 | 4,749,196 | 1,844,831 | 2,123,881 | 367,780 | 368,473 |
| 1901 | 146,820,079 | 3,699,103 | 1,857,547 | 2,253,262 | 335,360 | 351,710 |
| 1902 | 160,419,023 | 3,354,563 | 2,138,557 | 2,718,763 | 424,060 | 550,131 |
| 1903 | 155,128,381 | 4,041,274 | 2,378,650 | 3,197,043 | 396,940 | 517,871 |
| 1904 | 144,647,376 | 4,673,826 | 1,912,979 | 2,793,599 | 322,480 | 357,974 |
| 1905 | 139,912,737 | 5,381,333 | 1,690,684 | 2,694,432 | 318,942 | 347,888 |
| 1906 | 154,384,568 | 6,765,655 | 2,025,507 | 2,877,031 | 378,400 | 455,026 |
| 1907 | 171,635,595 | 7,657,278 | 2,354,808 | 3,420,664 | 414,880 | 560,965 |
| 1908 | 162,518,481 | 5,332,781 | 2,120,303 | 3,188,515 | 372,520 | 481,335 |
| 1909 | 189,683,703 | 6,305,888 | 2,572,604 | 3,601,093 | 484,160 | 648,452 |
| 1910 | 204,368,957 | 8,308,410 | 2,654,196 | 3,850,777 | 520,180 | 756,841 |
| 1911 | 169,424,811 | 6,491,707 | 2,250,565 | 3,503,400 | 413,120 | 607,257 |
| 1912 | 188,361,790 | 7,105,483 | 2,573,238 | 3,909,569 | 470,900 | 684,739 |
| 1913 | 186,533,036 | 8,057,620 | 2,578,693 | 4,449,933 | 454,860 | 663,088 |
| 1914 | 220,472,898 | 9,318,114 | 3,229,969 | 5,863,062 | 490,300 | 694,348 |
| 1915 | 196,570,114 | 10,387,875 | 3,591,260 | 7,794,395 | 535,260 | 780,828 |
| 1916 | 185,506,859 | 12,386,074 | 3,326,045 | 7,271,318 | 449,440 | 785,339 |
| 1917 | 178,274,486 | 12,175,366 | 2,446,945 | 5,982,404 | 251,980 | 553,016 |
| 1918 | 108,724,575 | 7,527,266 | 2,036,904 | 4,957,576 | 328,420 | 847,618 |
| 1919 | 274,246,613 | 19,559,537 | 3,822,683 | 9,628,292 | 937,480 | 2,680,006 |
| 1920 | 162,327,176 | 11,863,827 | 4,629,282 | 11,673,696 | 540,820 | 1,748,773 |
| 1921 | 158,714,828 | 5,221,479 | 4,322,754 | 11,164,345 | 554,240 | 867,298 |
| 1922 | 321,533,215 | 11,882,463 | 3,518,004 | 8,387,461 | 529,900 | 750,574 |
| 1923 | 217,566,091 | 10,904,658 | 3,043,910 | 9,012,627 | 504,860 | 785,668 |
| 1924 | 206,189,911 | 15,267,544 | 3,213,574 | 9,499,877 | 479,760 | 799,230 |
| 1925 | 205,726,856 | 17,739,736 | 3,414,205 | 11,174,567 | 500,760 | 895,061 |
| Year. | Exports of New Zealand Produce. | |||||
|---|---|---|---|---|---|---|
| Butter. | Cheese. | Gold. | ||||
| Quantity. | Value. | Quantity. | Value. | Quantity. | Value. | |
| Cwt. | £ | Cwt | £ | Oz. | £ | |
| 1876 | 871 | 3,910 | 885 | 3,488 | 318,367 | 1,268,559 |
| 1877 | 5,206 | 23,458 | 4,999 | 16,713 | 366,955 | 1,476,312 |
| 1878 | 3,106 | 12,111 | 3,019 | 9,368 | 311,437 | 1,244,190 |
| 1879 | 339 | 1,631 | 172 | 628 | 284,100 | 1,134,641 |
| 1880 | 2,717 | 8,350 | 717 | 1,983 | 303,215 | 1,220,263 |
| 1881 | 2,426 | 8,496 | 3,056 | 6,112 | 250,683 | 996,867 |
| 1882 | 11,264 | 52,088 | 3,553 | 10,130 | 230,893 | 921,664 |
| 1883 | 8,869 | 42,020 | 2,519 | 6,892 | 222,899 | 892,445 |
| 1884 | 15,766 | 66,593 | 10,342 | 25,074 | 246,392 | 988,953 |
| 1885 | 24,923 | 102,387 | 15,245 | 35,742 | 222,732 | 890,056 |
| 1886 | 23,175 | 105,537 | 16,429 | 45,657 | 235,578 | 939,648 |
| 1887 | 17,018 | 54,921 | 23,913 | 54,562 | 187,938 | 747,878 |
| 1888 | 29,995 | 118,252 | 36,682 | 78,918 | 229,608 | 914,309 |
| 1889 | 37,955 | 146,840 | 26,558 | 67,105 | 197,492 | 785,490 |
| 1890 | 34,816 | 122,701 | 40,451 | 84,986 | 187,641 | 751,360 |
| 1891 | 39,430 | 150,258 | 39,770 | 86,675 | 251,161 | 1,007,172 |
| 1892 | 53,930 | 227,162 | 41,493 | 91,042 | 237,393 | 951,963 |
| 1893 | 58,149 | 254,645 | 46,201 | 99,626 | 227,502 | 915,921 |
| 1894 | 60,771 | 251,280 | 55,655 | 115,203 | 221,614 | 887,865 |
| 1895 | 57,964 | 227,601 | 76,743 | 150,909 | 293,493 | 1,162,181 |
| 1896 | 71,353 | 281,716 | 71,372 | 130,166 | 263,694 | 1,041,428 |
| 1897 | 99,002 | 402,605 | 77,683 | 150,517 | 251,647 | 980,204 |
| 1898 | 96,801 | 403,690 | 68,711 | 135,776 | 280,175 | 1,080,691 |
| 1899 | 136,086 | 571,799 | 69,440 | 141,818 | 389,570 | 1,513,180 |
| 1900 | 172,583 | 740,620 | 102,849 | 229,111 | 373,614 | 1,439,602 |
| 1901 | 201,591 | 882,406 | 104,294 | 238,685 | 455,558 | 1,753,784 |
| 1902 | 253,998 | 1,205,802 | 74,746 | 163,539 | 507,852 | 1,951,426 |
| 1903 | 285,106 | 1,318,067 | 74,780 | 194,998 | 533,314 | 2,037,832 |
| 1904 | 314,360 | 1,380,460 | 84,526 | 185,486 | 520,323 | 1,987,501 |
| 1905 | 305,722 | 1,408,557 | 88,562 | 205,171 | 520,485 | 2,093,936 |
| 1906 | 320,225 | 1,560,235 | 131,206 | 341,002 | 563,843 | 2,270,904 |
| 1907 | 328,441 | 1,615,345 | 236,833 | 662,355 | 508,210 | 2,027,490 |
| 1908 | 229,971 | 1,171,182 | 280,798 | 783,419 | 506,381 | 2,004,799 |
| 1909 | 321,108 | 1,639,380 | 400,607 | 1,105,390 | 506,371 | 2,006,900 |
| 1910 | 356,335 | 1,811,975 | 451,915 | 1,195,373 | 478,286 | 1,896,318 |
| 1911 | 302,387 | 1,576,917 | 439,174 | 1,192,057 | 454,837 | 1,815,251 |
| 1912 | 378,117 | 2,088,809 | 577,070 | 1,680,393 | 343,163 | 1,345,131 |
| 1913 | 372,258 | 2,061,651 | 611,663 | 1,770,297 | 376,161 | 1,459,499 |
| 1914 | 434,067 | 2,338,576 | 863,776 | 2,564,125 | 227,954 | 895,367 |
| 1915 | 420,144 | 2,700,625 | 817,258 | 2,730,211 | 422,825 | 1,694,553 |
| 1916 | 358,632 | 2,632,293 | 949,416 | 3,514,310 | 292,620 | 1,199,212 |
| 1917 | 254,397 | 2,031,551 | 885,743 | 3,949,251 | 218,624 | 903,888 |
| 1918 | 431,023 | 3,402,223 | 883,430 | 4,087,278 | 11,987 | 42,391 |
| 1919 | 345,818 | 3,080,128 | 1,572,311 | 7,790,990 | 320,207 | 1,334,405 |
| 1920 | 312,009 | 3,022,335 | 1,222,050 | 6,160,840 | 212,973 | 883,748 |
| 1921 | 898,478 | 11,169,530 | 1,368,786 | 8,199,183 | 149,595 | 612,168 |
| 1922 | 1,120,200 | 9,041,554 | 1,161,196 | 4,686,850 | 131,848 | 540,182 |
| 1923 | 1,250,140 | 10,689,200 | 1,441,460 | 6,870,397 | 169,512 | 698,583 |
| 1924 | 1,269,455 | 11,641,668 | 1,594,486 | 7,023,297 | 133,631 | 551,788 |
| 1925 | 1,245,324 | 10,240,132 | 1,376,754 | 5,800,808 | 114,696 | 472,364 |
| Year. | Exports of New Zealand Produce. | |||||
|---|---|---|---|---|---|---|
| Kauri-gum. | Phormium Fibre. | Timber (sawn and hewn). | ||||
| Quantity. | Value. | Quantity. | Value. | Quantity. | Value. | |
| Tons. | £ | Tons. | £ | Sup. ft. | £ | |
| 1876 | 2,888 | 109,234 | 897 | 18,285 | 7,369,146 | 36,444 |
| 1877 | 3,632 | 118,348 | 1,053 | 18,826 | 8,222,329 | 37,675 |
| 1878 | 3,445 | 132,975 | 622 | 10,666 | 4,071,326 | 33,656 |
| 1879 | 3,228 | 147,535 | 445 | 7,874 | 5,103,189 | 24,025 |
| 1880 | 4,725 | 242,817 | 894 | 15,617 | 7,611,576 | 40,321 |
| 1881 | 5,460 | 253,778 | 1,308 | 26,285 | 13,180,280 | 65,119 |
| 1882 | 5,533 | 260,369 | 2,040 | 41,955 | 16,486,901 | 94,493 |
| 1883 | 6,518 | 336,606 | 2,013 | 36,761 | 23,783,521 | 124,898 |
| 1884 | 6,393 | 342,151 | 1,525 | 23,475 | 24,767,156 | 128,924 |
| 1885 | 5,876 | 299,762 | 1,063 | 16,316 | 28,439,013 | 141,355 |
| 1886 | 4,920 | 257,653 | 1,112 | 15,922 | 29,349,789 | 127,905 |
| 1887 | 6,790 | 362,434 | 1,578 | 25,094 | 30,919,464 | 127,108 |
| 1888 | 8,482 | 380,933 | 4,042 | 75,269 | 43,474,434 | 177,877 |
| 1889 | 7,519 | 329,590 | 17,084 | 361,182 | 42,568,600 | 176,608 |
| 1890 | 7,438 | 378,563 | 21,158 | 381,789 | 42,098,863 | 181,689 |
| 1891 | 8,388 | 437,056 | 15,809 | 281,514 | 42,824,365 | 182,431 |
| 1892 | 8,705 | 517,678 | 12,793 | 214,542 | 22,860,551 | 87,581 |
| 1893 | 8,317 | 510,775 | 12,587 | 219,375 | 26,718,046 | 101,082 |
| 1894 | 8,338 | 404,567 | 4,677 | 66,256 | 31,901,415 | 116,116 |
| 1895 | 7,425 | 418,766 | 1,806 | 21,040 | 38,297,905 | 141,892 |
| 1896 | 7,126 | 431,323 | 2,968 | 32,985 | 34,984,414 | 133,511 |
| 1897 | 6,641 | 398,010 | 2,769 | 30,674 | 39,326,396 | 154,169 |
| 1898 | 9,905 | 586,767 | 4,850 | 74,556 | 40,721,632 | 164,723 |
| 1899 | 11,116 | 607,919 | 10,371 | 184,411 | 50,425,741 | 196,749 |
| 1900 | 10,159 | 622,293 | 15,906 | 332,182 | 57,517,085 | 232,174 |
| 1901 | 7,541 | 446,114 | 10,171 | 195,728 | 71,822,369 | 294,699 |
| 1902 | 7,430 | 450,223 | 20,852 | 534,031 | 49,251,549 | 208,005 |
| 1903 | 9,357 | 631,102 | 22,652 | 595,684 | 57,097,990 | 240,713 |
| 1904 | 9,203 | 501,817 | 26,936 | 710,281 | 60,326,992 | 254,021 |
| 1905 | 10,883 | 561,444 | 27,877 | 696,467 | 75,370,136 | 318,895 |
| 1906 | 9,154 | 522,486 | 27,779 | 776,106 | 75,528,899 | 304,941 |
| 1907 | 8,708 | 579,888 | 28,547 | 832,068 | 72,154,417 | 311,862 |
| 1908 | 5,530 | 372,798 | 17,403 | 396,288 | 84,554,414 | 375,235 |
| 1909 | 8,250 | 552,698 | 14,318 | 306,973 | 71,599,318 | 337,740 |
| 1910 | 8,693 | 465,044 | 20,645 | 448,414 | 81,940,062 | 407,658 |
| 1911 | 7,587 | 395,707 | 17,366 | 300,209 | 86,309,570 | 439,353 |
| 1912 | 7,908 | 401,305 | 18,641 | 376,264 | 94,454,491 | 490,508 |
| 1913 | 8,780 | 549,106 | 28,092 | 721,924 | 63,469,105 | 319,055 |
| 1914 | 8,473 | 497,444 | 19,702 | 455,214 | 83,342,949 | 422,864 |
| 1915 | 4,575 | 279,133 | 23,220 | 571,621 | 76,797,161 | 383,883 |
| 1916 | 5,456 | 339,882 | 27,674 | 1,001,725 | 71,503,154 | 381,488 |
| 1917 | 4,594 | 291,917 | 23,516 | 1,197,396 | 71,338,174 | 408,121 |
| 1918 | 2,419 | 157,313 | 25,167 | 1,387,763 | 74,932,815 | 556,309 |
| 1919 | 4,128 | 255,812 | 22,347 | 866,930 | 49,726,670 | 439,935 |
| 1920 | 6,481 | 556,756 | 18,949 | 647,545 | 69,664,014 | 697,608 |
| 1921 | 3,901 | 367,197 | 9,643 | 293,775 | 45,902,627 | 503,785 |
| 1922 | 6,391 | 563,270 | 9,727 | 265,080 | 44,186,848 | 479,447 |
| 1923 | 6,598 | 596,222 | 10,612 | 284,897 | 47,570,490 | 473,752 |
| 1924 | 5,261 | 443,576 | 12,982 | 388,887 | 42,928,726 | 472,120 |
| 1925 | 5,370 | 414,901 | 16,408 | 516,466 | 49,204,676 | 573,882 |
| INDEBTEDNESS OF GENERAL GOVERNMENT. | |||||||||
|---|---|---|---|---|---|---|---|---|---|
| As at 31st March. | Amount of Debentures and Stock in Circulation. | Gross Indebtedness per Head of Population. | Amount of Sinking Fund accrued. | Net Indebtedness. | Net Indebtedness per Head of Population. | ||||
* As at 30th June. † In 1925–26 the sinking funds accrued were, with certain exceptions, transferred to the Public Debt Redemption Fund. | |||||||||
| £ | £ | s. | d. | £ | £ | £ | s. | d. | |
| 1877* | 18,678,111 | 42 | 0 | 4 | 1,289,956 | 17,388,155 | 39 | 2 | 3 |
| 1878* | 20,691,111 | 42 | 11 | 4 | 1,438,838 | 19,252,273 | 42 | 7 | 11 |
| 1879* | 22,608,311 | 47 | 9 | 8 | 1,678,127 | 20,930,184 | 43 | 19 | 2 |
| 1880 | 23,958,311 | 47 | 4 | 6 | 1,805,231 | 22,153,080 | 43 | 13 | 4 |
| 1881 | 28,185,711 | 52 | 19 | 2 | 1,077,442 | 27,108,269 | 50 | 18 | 8 |
| 1882 | 28,479,111 | 51 | 17 | 5 | 1,163,518 | 27,315,593 | 49 | 15 | 0 |
| 1883 | 29,445,011 | 51 | 19 | 3 | 1,305,523 | 28,139,488 | 49 | 13 | 2 |
| 1884 | 31,071,582 | 52 | 10 | 1 | 1,434,949 | 29,636,633 | 50 | 1 | 7 |
| 1885 | 32,195,422 | 52 | 10 | 1 | 1,531,884 | 30,663,538 | 50 | 0 | 1 |
| 1886 | 33,880,722 | 54 | 11 | 11 | 1,617,166 | 32,263,556 | 51 | 19 | 10 |
| 1887 | 35,741,653 | 56 | 5 | 1 | 1,427,199 | 34,314,454 | 54 | 0 | 2 |
| 1888 | 36,758,437 | 56 | 16 | 5 | 1,344,427 | 35,414,010 | 54 | 14 | 10 |
| 1889 | 38,375,050 | 58 | 16 | 11 | 1,390,915 | 36,984,135 | 56 | 14 | 3 |
| 1890 | 38,667,950 | 58 | 3 | 2 | 1,386,186 | 37,281,764 | 56 | 1 | 6 |
| 1891 | 38,830,350 | 58 | 1 | 7 | 1,487,042 | 37,343,308 | 55 | 17 | 1 |
| 1892 | 38,713,068 | 56 | 19 | 6 | 1,037,862 | 37,675,206 | 55 | 9 | 0 |
| 1893 | 39,257,840 | 56 | 4 | 7 | 1,113,770 | 38,144,070 | 54 | 12 | 8 |
| 1894 | 39,826,415 | 55 | 8 | 3 | 951,924 | 38,874,491 | 54 | 1 | 9 |
| 1895 | 40,386,964 | 55 | 4 | 3 | 751,932 | 39,635,032 | 54 | 3 | 9 |
| 1896 | 43,050,780 | 57 | 18 | 3 | 778,891 | 42,271,889 | 56 17 | 4 | |
| 1897 | 44,366,618 | 58 | 11 | 5 | 814,294 | 43,552,324 | 57 | 9 | 11 |
| 1898 | 44,963,424 | 58 | 5 | 6 | 881,903 | 44,081,521 | 57 | 2 | 8 |
| 1899 | 46,938,006 | 59 | 13 | 7 | 857,279 | 46,080,727 | 58 | 11 | 9 |
| 1900 | 47,874,452 | 59 | 19 | 2 | 944,375 | 46,930,077 | 58 | 15 | 6 |
| 1901 | 49,591,245 | 60 | 15 | 8 | 1,033,494 | 48,557,751 | 59 | 10 | 4 |
| 1902 | 52,966,447 | 63 | 11 | 6 | 1,128,816 | 51,837,631 | 62 | 4 | 5 |
| 1903 | 55,899,019 | 65 | 3 | 0 | 1,357,739 | 54,541,280 | 63 | 11 | 4 |
| 1904 | 57,522,215 | 65 | 4 | 3 | 1,500,687 | 56,021,528 | 63 | 10 | 2 |
| 1905 | 59,912,000 | 65 | 19 | 7 | 1,650,718 | 58,261,282 | 64 | 3 | 3 |
| 1906 | 62,191,040 | 66 | 13 | 0 | 1,661,519 | 60,529,521 | 64 17 | 4 | |
| 1907 | 64,179,040 | 66 | 14 | 10 | 2,042,068 | 62,136,972 | 64 | 12 | 4 |
| 1908 | 66,453,897 | 67 | 8 | 11 | 1,268,361 | 65,185,536 | 66 | 3 | 2 |
| 1909 | 70,938,534 | 69 | 16 | 4 | 1,479,224 | 69,459,310 | 68 | 7 | 3 |
| 1910 | 74,890,645 | 72 | 6 | 10 | 1,503,225 | 73,387,420 | 70 | 17 | 10 |
| 1911 | 81,078,122 | 76 | 15 | 3 | 1,754,486 | 79,323,636 | 75 | 2 | 0 |
| 1912 | 84,353,913 | 78 | 0 | 3 | 2,160,603 | 82,193,310 | 76 | 0 | 3 |
| 1913 | 90,060,763 | 81 | 0 | 5 | 2,603,642 | 87,457,121 | 78 | 13 | 7 |
| 1914 | 99,730,427 | 87 | 10 | 2 | 3,063,992 | 91,689,835 | 80 | 9 | 1 |
| 1915 | 100,059,910 | 86 | 19 | 7 | 3,178,055 | 96,644,455 | 84 | 0 | 3 |
| 1916 | 109,637,397 | 95 | 6 | 4 | 3,679,964 | 105,957,433 | 92 | 2 | 4 |
| 1917 | 129,836,105 | 112 | 16 | 2 | 4,263,590 | 125,572,515 | 109 | 2 | 1 |
| 1918 | 150,840,055 | 130 | 12 | 11 | 4,971,605 | 145,868,450 | 126 | 6 | 10 |
| 1919 | 176,076,260 | 149 | 8 | 5 | 5,951,056 | 170,125,204 | 144 | 7 | 5 |
| 1920 | 201,170,755 | 162 | 12 | 9 | 7,257,564 | 193,913,191 | 156 | 15 | 5 |
| 1921 | 206,324,319 | 162 | 15 | 7 | 8,763,072 | 197,561,222 | 155 | 17 | 4 |
| 1922 | 219,054,385 | 168 | 6 | 10 | 10,655,394 | 208,241,121 | 160 | 0 | 8 |
| 1923 | 218,953,324 | 165 | 4 | 2 | 11,879,256 | 207,024,048 | 156 | 4 | 2 |
| 1924 | 221,616,361 | 164 | 8 | 5 | 12,974,028 | 208,595,743 | 154 | 15 | 3 |
| 1925 | 227,814,647 | 165 | 2 | 11 | 13,462,839 | 214,287,128 | 155 | 6 | 9 |
| 1926 | 238,855,478 | 169 | 8 | 6 | 2,274,262† | 236,581,216 | 167 | 16 | 3 |
| REVENUE AND EXPENDITUREOF GENERAL GOVERNMENT. | ||||||
|---|---|---|---|---|---|---|
| Year ended 31st March. | Consolidated Fund. | Public Works Fund. | ||||
| Receipts. | Payments. | Receipts. | Payments. | |||
| From Taxation. | From other Sources. | Total. | Total. | |||
* Year ended 30th June. † Nine months ended 31st March. ‡ Commencing with 1925–26 railway revenue and expenditure are removed from the transactions of the Consolidated Fund. Revenue of the Consolidated Fund, however, now includes interest paid by the Working Railways Account in respect of railway capital liability, while the expenditure covers payment to the Working Railways Account in respect of losses on non-paying branch lines and isolated sections. | ||||||
| £ | £ | £ | £ | £ | £ | |
| 1877* | 1,350,942 | 2,229,352 | 3,580,294 | 4,310,875 | 1,931,697 | 1,600,313 |
| 1878* | 1,343,943 | 2,572,080 | 3,916,023 | 4,212,474 | 2,200,000 | 1,178,041 |
| 1879* | 1,519,505 | 2,648,384 | 4,167,889 | 4,365,275 | 20,541 | 1,519,484 |
| 1880† | 1,447,717 | 1,687,188 | 3,134,905 | 3,845,035 | 3,632 | 2,244,428 |
| 1881 | 1,755,414 | 1,529,628 | 3,285,042 | 4,019,851 | 1,841 | 1,527,807 |
| 1882 | 1,890,679 | 1,866,814 | 3,757,493 | 3,675,797 | 15,211 | 826,790 |
| 1883 | 1,956,557 | 1,960,603 | 3,917,160 | 3,824,736 | 1,004,898 | 897,037 |
| 1884 | 1,957,080 | 1,914,187 | 3,871,267 | 3,924,005 | 945,776 | 1,409,589 |
| 1885 | 1,815,674 | 2,139,514 | 3,955,188 | 4,101,318 | 2,504,113 | 1,336,727 |
| 1886 | 2,016,730 | 2,080,266 | 4,096,996 | 4,282,901 | 198,867 | 1,475,386 |
| 1887 | 1,882,050 | 1,946,412 | 3,828,462 | 4,310,875 | 1,499,500 | 1,333,484 |
| 1888 | 1,876,235 | 1,845,444 | 3,721,679 | 4,212,474 | 500,000 | 966,159 |
| 1889 | 2,031,658 | 2,341,357 | 4,373,015 | 4,226,112 | 1,503,000 | 613,939 |
| 1890 | 2,090,405 | 2,176,714 | 4,267,119 | 4,256,921 | 83,142 | 482,464 |
| 1891 | 2,173,985 | 2,322,043 | 4,496,028 | 4,369,566 | 4,262 | 334,756 |
| 1892 | 2,179,739 | 2,248,791 | 4,428,530 | 4,417,843 | 216,533 | 391,501 |
| 1893 | 2,339,511 | 2,330,040 | 4,669,551 | 4,324,990 | 215,765 | 462,506 |
| 1894 | 2,353,250 | 2,339,213 | 4,692,463 | 4,455,116 | 418,323 | 406,797 |
| 1895 | 2,300,350 | 2,147,549 | 4,447,899 | 4,352,185 | 353,000 | 504,486 |
| 1896 | 2,335,760 | 2,220,255 | 4,556,015 | 4,370,481 | 162,272 | 575,087 |
| 1897 | 2,521,911 | 2,276,797 | 4,798,708 | 4,509,981 | 540,275 | 601,343 |
| 1898 | 2,678,576 | 2,400,654 | 5,079,230 | 4,602,372 | 759,673 | 865,543 |
| 1899 | 2,707,099 | 2,551,129 | 5,258,228 | 4,858,511 | 935,691 | 916,327 |
| 1900 | 2,891,126 | 2,808,492 | 5,699,618 | 5,140,127 | 1,062,116 | 993,223 |
| 1901 | 3,042,890 | 2,864,026 | 5,906,916 | 5,479,704 | 1,401,788 | 1,309,021 |
| 1902 | 3,113,079 | 3,039,760 | 6,152,839 | 5,914,915 | 2,364,796 | 2,143,252 |
| 1903 | 3,277,964 | 3,169,471 | 6,447,435 | 6,214,019 | 1,398,950 | 1,514,445 |
| 1904 | 3,649,601 | 3,480,516 | 7,130,117 | 6,434,281 | 1,875,614 | 1,796,841 |
| 1905 | 3,754,379 | 3,592,818 | 7,347,197 | 6,635,902 | 1,908,683 | 1,354,158 |
| 1906 | 3,841,596 | 3,808,502 | 7,650,098 | 7,122,340 | 1,555,768 | 1,811,819 |
| 1907 | 4,264,555 | 4,214,401 | 8,478,956 | 7,774,926 | 1,918,081 | 2,168,894 |
| 1908 | 4,645,754 | 4,418,235 | 9,063,989 | 8,213,965 | 1,846,054 | 2,109,882 |
| 1909 | 4,377,761 | 4,623,424 | 9,001,185 | 8,785,513 | 3,628,270 | 3,363,895 |
| 1910 | 4,180,516 | 5,058,401 | 9,238,917 | 8,990,922 | 2,093,697 | 2,216,397 |
| 1911 | 4,837,322 | 5,459,951 | 10,297,273 | 9,343,106 | 3,396,648 | 2,058,691 |
| 1912 | 5,296,590 | 5,764,571 | 11,061,161 | 10,340,368 | 1,256,456 | 2,340,380 |
| 1913 | 5,606,829 | 6,127,442 | 11,7£,271 | 11,082,038 | 3,300,729 | 2,548,918 |
| 1914 | 5,918,034 | 6,311,627 | 12,£61 | 11,825,864 | 3,478,751 | 2,760,798 |
| 1915 | 5,880,811 | 6,571,134 | 12,£45 | 12,379,803 | 2,224,491 | 2,737,364 |
| 1916 | 7,266,966 | 7,240,564 | 14,5£,530 | 12,943,107 | 3,187,154 | 2,583,212 |
| 1917 | 10,549,654 | 7,805,540 | 18,355,194 | 14,058,770 | 1,105,837 | 1,775,513 |
| 1918 | 12,340,853 | 7,865,369 | 20,206,222 | 15,120,288 | 1,091,195 | 1,401,837 |
| 1919 | 13,801,643 | 8,550,729 | 22,352,372 | 18,673,599 | 1,240,680 | 1,387,661 |
| 1920 | 16,251,769 | 9,829,571 | 26,081,340 | 23,781,524 | 2,243,389 | 2,232,815 |
| 1921 | 22,184,414 | 12,075,847 | 34,260,261 | 28,068,730 | 5,012,156 | 3,658,240 |
| 1922 | 16,370,516 | 11,756,491 | 28,127,007 | 28,466,838 | 9,792,916 | 6,875,636 |
| 1923 | 15,594,288 | 11,985,155 | 27,579,443 | 26,263,760 | 3,968,565 | 4,729,679 |
| 1924 | 16,416,870 | 11,543,500 | 27,960,370 | 26,148,005 | 4,275,914 | 4,658,272 |
| 1925 | 16,172,306 | 12,470,694 | 28,643,000 | 27,399,200 | 4,833,280 | 5,482,069 |
| 1926‡ | 16,978,496 | 7,747,266 | 24,725,762 | 23,570,083 | 5,956,878 | 5,874,313 |
| LOCAL BODIES. | ||||||
|---|---|---|---|---|---|---|
| Year ended 31st March.h2 | Receipts. | Payments. | Total Gross Indebtedness. | |||
| Revenue. | Other Receipts. | Total. | ||||
| From Rates. | From other Sources. | |||||
| £ | £ | £ | £ | £ | £ | |
| 1878 | 210,916 | 1,313,963 | .. | 1,524,879 | 1,185,972 | 1,069,337 |
| 1879 | 234,988 | 1,127,038 | .. | 1,362,026 | 1,630,869 | 1,259,415 |
| 1880 | 266,938 | 989,256 | .. | 1,256,194 | 1,601,691 | 1,597,204 |
| 1881 | 249,087 | 814,142 | 889,705 | 1,952,934 | 1,871,752 | 3,039,807 |
| 1882 | 297,328 | 694,652 | 419,608 | 1,411,588 | 1,637,337 | 3,277,584 |
| 1883 | 327,128 | 600,450 | 311,466 | 1,239,044 | 1,397,863 | 3,540,046 |
| 1884 | 398,659 | 744,527 | 331,994 | 1,475,180 | 1,499,117 | 4,039,769 |
| 1885 | 401,393 | 841,895 | 430,561 | 1,673,849 | 1,653,706 | 4,436,309 |
| 1886 | 410,639 | 882,618 | 514,728 | 1,807,985 | 1,644,706 | 5,086,044 |
| 1887 | 434,237 | 790,063 | 992,633 | 2,216,933 | 1,885,001 | 5,825,683 |
| 1888 | 433,832 | 795,067 | 511,594 | 1,740,493 | 1,819,787 | 6,015,354 |
| 1889 | 445,929 | 676,428 | 316,139 | 1,438,496 | 1,560,605 | 6,164,901 |
| 1890 | 460,303 | 707,725 | 206,688 | 1,374,716 | 1,476,540 | 6,316,716 |
| 1891 | 463,581 | 662,765 | 236,902 | 1,363,248 | 1,381,320 | 6,427,473 |
| 1892 | 488,824 | 693,296 | 214,124 | 1,396,244 | 1,400,467 | 6,550,183 |
| 1893 | 508,157 | 709,676 | 340,538 | 1,558,371 | 1,482,548 | 6,750,698 |
| 1894 | 551,412 | 681,831 | 623,038 | 1,856,281 | 1,589,124 | 7,253,072 |
| 1895 | 581,868 | 683,857 | 328,798 | 1,594,523 | 1,584,518 | 7,422,306 |
| 1896 | 592,903 | 738,146 | 269,145 | 1,600,194 | 1,627,079 | 7,547,511 |
| 1897 | 598,526 | 765,047 | 246,919 | 1,610,492 | 1,636,716 | 7,675,814 |
| 1898 | 644,552 | 790,602 | 304,645 | 1,739,799 | 1,733,016 | 7,783,445 |
| 1899 | 685,769 | 820,727 | 385,368 | 1,891,864 | 1,778,574 | 7,995,400 |
| 1900 | 714,151 | 848,032 | 372,028 | 1,934,211 | 1,960,073 | 8,149,272 |
| 1901 | 734,023 | 919,831 | 825,039 | 2,478,893 | 2,250,572 | 8,785,303 |
| 1902 | 800,471 | 1,019,024 | 775,432 | 2,594,927 | 2,528,092 | 9,245,364 |
| 1903 | 846,716 | 1,053,582 | 966,087 | 2,866,385 | 2,867,506 | 9,886,676 |
| 1904 | 950,150 | 1,206,069 | 1,142,595 | 3,298,814 | 3,230,712 | 10,756,062 |
| 1905 | 1,019,431 | 1,255,222 | 1,350,631 | 3,625,284 | 3,497,321 | 12,056,736 |
| 1906 | 1,151,219 | 1,392,148 | 1,326,597 | 3,869,964 | 3,601,506 | 12,873,165 |
| 1907 | 1,233,049 | 1,579,391 | 1,227,473 | 4,039,913 | 3,897,515 | 13,903,153 |
| 1908 | 1,356,257 | 1,750,665 | 1,410,994 | 4,517,916 | 4,491,113 | 14,931,351 |
| 1909 | 1,390,698 | 1,934,122 | 1,440,746 | 4,765,566 | 4,800,711 | 15,920,757 |
| 1910 | 1,526,317 | 1,934,034 | 2,362,171 | 5,822,522 | 4,898,482 | 17,809,917 |
| 1911 | 1,592,601 | 2,171,725 | 1,776,958 | 5,541,284 | 5,360,261 | 19,105,603 |
| 1912 | 1,677,877 | 2,298,934 | 2,425,258 | 6,402,069 | 6,074,372 | 20,772,555 |
| 1913 | 1,799,299 | 2,531,686 | 2,383,123 | 6,714,108 | 6,537,769 | 22,212,555 |
| 1914 | 2,005,638 | 2,719,112 | 2,411,575 | 7,136,325 | 6,798,314 | 23,828,637 |
| 1915 | 2,140,086 | 2,861,297 | 2,595,706 | 7,597,089 | 6,806,567 | 24,625,387 |
| 1916 | 2,355,155 | 2 967,645 | 2,469,275 | 7,792,075 | 6,920,736 | 26,162,587 |
| 1917 | 2,534,539 | 3,243,942 | 1,411,422 | 7,189,903 | 6,758,593 | 26,959,234 |
| 1918 | 2,674,541 | 3,283,749 | 1,250,047 | 7,208,337 | 7,103,073 | 27,852,971 |
| 1919 | 2,939,606 | 3,452,071 | 942,780 | 7,334,457 | 7,320,277 | 28,323,853 |
| 1920 | 3,144,213 | 4,486,582 | 3,329,003 | 10,959,798 | 10,883,586 | 30,485,774 |
| 1921 | 3,549,590 | 5,336,374 | 3,429,662 | 12,315,626 | 12,761,690 | 32,465,048 |
| 1922 | 3,779,895 | 6,074,782 | 5,486,912 | 15,341,589 | 15,091,875 | 37,205,539 |
| 1923 | 4,277,781 | 6,243,951 | 7,399,674 | 17,921,406 | 15,695,507 | 43,683,449 |
| 1924 | 4,445,627 | 6,704,144 | 5,685,107 | 16,834,878 | 16,520,950 | 47,126,139 |
| 1925 | 4,668,884 | 7,512,080 | 7,613,399 | 19,794,363 | 19,422,833 | 54,023,357 |
| LOCAL BODIES.—LOAN INDEBTEDNESS. | ||||||
|---|---|---|---|---|---|---|
| As at 31st March. | Counties. | Boroughs. | Harbour Hoards. | Electric-power Districts. | Other. | Total. |
NOTE.—Loans from Government—i.e., Inscribed Debt and Advances from State Advances Office—have not been included. | ||||||
| £ | £ | £ | £ | £ | £ | |
| 1876 | .. | 431,539 | .. | .. | .. | 431,539 |
| 1877 | .. | 502,500 | .. | .. | .. | 502,500 |
| 1878 | .. | 1,056,119 | .. | .. | .. | 1,056,119 |
| 1879 | .. | 1,259,415 | .. | .. | .. | 1,259,415 |
| 1880 | .. | 1,597,304 | .. | .. | .. | 1,597,304 |
| 1881 | .. | 1,844,007 | 1,195,800 | .. | .. | 3,039,807 |
| 1882 | .. | 1,940,684 | 1,336,900 | .. | .. | 3,277,584 |
| 1883 | 7,800 | 1,958,546 | 1,508,900 | .. | 64,800 | 3,540,046 |
| 1884 | 8,110 | 2,107,300 | 1,575,200 | .. | 271,720 | 3,962,330 |
| 1885 | 7,800 | 2,156,455 | 1,872,100 | .. | 276,868 | 4,313,223 |
| 1886 | 3,510 | 2,257,775 | 2,414,945 | .. | 275,280 | 4,951,510 |
| 1887 | 8,700 | 2,452,585 | 2,887,700 | .. | 271,762 | 5,620,747 |
| 1888 | 14,282 | 2,527,353 | 3,006,900 | .. | 264,268 | 5,812,803 |
| 1889 | 23,523 | 2,534,556 | 3,057,118 | .. | 276,853 | 5,892,050 |
| 1890 | 8,505 | 2,541,453 | 3,155,600 | .. | 272,501 | 5,978,059 |
| 1891 | 8,010 | 2,540,390 | 3,226,000 | .. | 268,293 | 6,042,693 |
| 1892 | 9,660 | 2,539,445 | 3,276,300 | .. | 256,529 | 6,081,934 |
| 1893 | 11,660 | 2,567,095 | 3,369,410 | .. | 255,704 | 6,203,869 |
| 1894 | 11,010 | 2,738,184 | 3,610,450 | .. | 255,180 | 6,614,824 |
| 1895 | 10,510 | 2,757,395 | 3,652,350 | .. | 265,255 | 6,685,510 |
| 1896 | 10,510 | 2,777,495 | 3,686,959 | .. | 262,614 | 6,737,578 |
| 1897 | 10,510 | 2,817,378 | 3,703,561 | .. | 261,949 | 6,793,398 |
| 1898 | 11,710 | 2,834,306 | 3,723,380 | .. | 264,965 | 6,834,361 |
| 1899 | 10,500 | 2,881,567 | 3,804,187 | .. | 267,000 | 6,963,254 |
| 1900 | 6,900 | 2,939,025 | 3,845,881 | .. | 265,544 | 7,057,350 |
| 1901 | 6,714 | 3,251,817 | 4,035,331 | .. | 269,207 | 7,563,069 |
| 1902 | 6,714 | 3,435,884 | 4,123,631 | .. | 273,466 | 7,839,695 |
| 1903 | 6,614 | 3,655,436 | 4,256,481 | .. | 298,665 | 8,217,196 |
| 1904 | 6,214 | 4,226,800 | 4,308,851 | .. | 357,045 | 8,898,910 |
| 1905 | 7,800 | 4,863,986 | 4,382,551 | .. | 763,905 | 10,018,242 |
| 1906 | 15,228 | 5,314,173 | 4,554,151 | .. | 834,499 | 10,718,051 |
| 1907 | 31,678 | 5,920,305 | 4,676,551 | .. | 987,514 | 11,616,048 |
| 1908 | 37,138 | 6,540,071 | 4,877,676 | .. | 1,077,449 | 12,532,334 |
| 1909 | 56,534 | 7,016,926 | 5,052,845 | .. | 1,177,317 | 13,303,622 |
| 1910 | 76,877 | 7,687,209 | 5,788,400 | .. | 1,385,199 | 14,937,685 |
| 1911 | 99,038 | 8,159,986 | 6,001,650 | .. | 1,466,939 | 15,727,613 |
| 1912 | 122,418 | 8,507,486 | 6,235,978 | .. | 1,724,995 | 16,590,877 |
| 1913 | 121,911 | 9,084,205 | 6,371,636 | .. | 1,905,580 | 17,483,332 |
| 1914 | 183,936 | 10,083,810 | 6,608,700 | .. | 2,047,036 | 18,923,482 |
| 1915 | 247,694 | 10,206,353 | 6,869,500 | .. | 2,121,928 | 19,445,475 |
| 1916 | 265,091 | 11,086,719 | 7,014,390 | .. | 2,387,968 | 20,754,168 |
| 1917 | 286,679 | 11,606,485 | 7,151,743 | .. | 2,387,860 | 21,432,767 |
| 1918 | 421,214 | 12,150,384 | 7,268,993 | .. | 2,419,946 | 22,260,537 |
| 1919 | 537,415 | 12,365,958 | 7,301,143 | .. | 2,469,196 | 22,673,712 |
| 1920 | 752,176 | 13,944,507 | 7,377,142 | .. | 2,534,468 | 24,608,293 |
| 1921 | 1,046,378 | 14,575,825 | 7,528,288 | 147,750 | 2,888,719 | 26,186,960 |
| 1922 | 1,328,297 | 16,282,960 | 8,110,911 | 1,480,000 | 3,064,036 | 30,266,204 |
| 1923 | 1,802,633 | 19,501,988 | 8,437,987 | 3,052,300 | 3,284,474 | 36,079,382 |
| 1924 | 1,870,078 | 19,819,497 | 9,020,188 | 4,740,865 | 3,659,372 | 39,110,000 |
| 1925 | 2,332,461 | 23,483,057 | 9,600,203 | 6,514,757 | 3,790,316 | 45,720,794 |
| BANKS OF ISSUE (AVERAGE OF FOUR QUARTERS). | ||||||
|---|---|---|---|---|---|---|
| Year. | Assets. | Liabilities. | ||||
| Advances. | Coin and Bullion. | Total (including other Items). | Notes in Circulation. | Deposits. | Total (including other Items). | |
| £ | £ | £ | £ | £ | £ | |
| 1876 | 9,240,058 | 1,614,918 | 11,776,070 | 874,516 | 6,238,471 | 7,221,399 |
| 1877 | 10,194,256 | 1,864,063 | 12,992,104 | 874,827 | 7,185,106 | 8,152,230 |
| 1878 | 12,544,561 | 1,894,865 | 15,393,630 | 965,046 | 8,960,369 | 10,031,009 |
| 1879 | 13,145,185 | 1,915,574 | 16,054,295 | 950,425 | 8,021,073 | 9,057,463 |
| 1880 | 11,228,865 | 2,166,578 | 14,220,275 | 918,297 | 8,538,935 | 9,550,177 |
| 1881 | 11,888,669 | 2,045,915 | 14,863,645 | 916,269 | 9,069,377 | 10,083,188 |
| 1882 | 14,265,567 | 1,900,203 | 17,162,234 | 971,386 | 8,945,346 | 10,015,273 |
| 1883 | 14,821,780 | 1,881,675 | 17,794,761 | 968,520 | 8,659,477 | 9,706,700 |
| 1884 | 14,947,091 | 2,023,088 | 18,442,139 | 971,903 | 9,643,214 | 10,691,599 |
| 1885 | 15,470,275 | 2,101,784 | 18,811,567 | 968,481 | 10,083,296 | 11,130,244 |
| 1886 | 15,834,877 | 2,177,544 | 19,041,827 | 943,075 | 10,579,711 | 11,603,194 |
| 1887 | 15,310,050 | 2,342,052 | 18,799,847 | 896,517 | 11,031,614 | 11,995,495 |
| 1888 | 15,041,897 | 2,319,325 | 18,709,444 | 873,045 | 11,155,778 | 12,108,353 |
| 1889 | 14,272,481 | 2,217,833 | 17,652,915 | 879,440 | 11,528,424 | 12,486,717 |
| 1890 | 13,996,086 | 2,536,529 | 17,735,259 | 903,010 | 12,368,610 | 13,356,598 |
| 1891 | 11,448,745 | 2,405,099 | 16,814,518 | 937,309 | 12,796,098 | 13,820,458 |
| 1892 | 12,128,065 | 2,450,712 | 17,558,168 | 959,943 | 13,587,062 | 14,623,335 |
| 1893 | 12,688,303 | 2,627,367 | 18,255,534 | 973,894 | 14,433,777 | 15,489,633 |
| 1894 | 11,897,740 | 2,896,562 | 17,746,421 | 901,526 | 13,927,217 | 14,930,791 |
| 1895 | 11,600,080 | 3,310,943 | 18,159,781 | 897,919 | 13,544,415 | 14,491,627 |
| 1896 | 10,972,226 | 3,308,392 | 16,900,199 | 946,366 | 14,490,827 | 15,520,431 |
| 1897 | 10,020,640 | 3,093,295 | 17,276,771 | 1,009,038 | 14,290,512 | 15,380,248 |
| 1898 | 10,564,266 | 2,791,081 | 17,013,404 | 1,070,133 | 14,143,229 | 15,299,058 |
| 1899 | 10,954,435 | 2,675,361 | 17,190,433 | 1,163,759 | 14,591,223 | 15,834,858 |
| 1900 | 11,343,411 | 2,739,197 | 17,314,535 | 1,299,825 | 15,570,610 | 16,964,582 |
| 1901 | 12,148,335 | 2,996,345 | 18,422,274 | 1,361,355 | 16,034,848 | 17,490,035 |
| 1902 | 12,747,773 | 3,201,824 | 18,999,180 | 1,375,788 | 17,231,768 | 18,701,063 |
| 1903 | 13,435,993 | 3,608,941 | 19,913,546 | 1,450,267 | 19,011,114 | 20,563,879 |
| 1904 | 14,651,198 | 3,896,195 | 20,893,096 | 1,468,161 | 19,074,960 | 20,643,359 |
| 1905 | 15,496,395 | 4,006,108 | 21,770,525 | 1,468,977 | 20,545,601 | 22,144,166 |
| 1906 | 16,649,329 | 4,593,954 | 23,829,933 | 1,574,254 | 22,422,243 | 24,143,008 |
| 1907 | 18,514,045 | 4,836,718 | 26,584,239 | 1,644,645 | 23,517,111 | 25,334,348 |
| 1908 | 21,172,808 | 4,840,942 | 29,098,567 | 1,615,109 | 21,821,753 | 23,611,903 |
| 1909 | 19,078,032 | 4,947,096 | 26,937,265 | 1,577,558 | 21,996,621 | 23,728,326 |
| 1910 | 18,439,999 | 5,035,764 | 26,398,927 | 1,626,094 | 24,968,761 | 26,742,081 |
| 1911 | 21,259,727 | 5,195,333 | 29,433,614 | 1,677,842 | 26,765,122 | 28,625,803 |
| 1912 | 22,907,656 | 5,338,295 | 31,196,400 | 1,714,667 | 25,622,083 | 27,508,348 |
| 1913 | 22,902,298 | 5,204,266 | 30,708,932 | 1,674,333 | 25,733,187 | 27,591,099 |
| 1914 | 24,250,246 | 5,712,751 | 32,502,312 | 1,998,388 | 27,640,507 | 29,808,349 |
| 1915 | 23,638,970 | 6,781,008 | 33,209,483 | 2,846,275 | 31,433,653 | 34,448,270 |
| 1916 | 24,911,706 | 7,393,917 | 37,015,486 | 4,049,529 | 37,757,917 | 41,977,619 |
| 1917 | 28,847,749 | 8,072,279 | 44,979,615 | 5,410,957 | 42,930,713 | 48,541,961 |
| 1918 | 31,711,350 | 8,085,961 | 48,570,126 | 6,266,768 | 45,562,939 | 52,048,732 |
| 1919 | 31,717,720 | 8,017,159 | 48,615,209 | 7,087,545 | 50,489,444 | 57,861,393 |
| 1920 | 38,241,932 | 7,728,942 | 56,111,433 | 7,890,418 | 59,405,341 | 67,818,469 |
| 1921 | 50,607,541 | 7,660,532 | 68,701,282 | 7,569,319 | 49,397,411 | 58,808,439 |
| 1922 | 44,768,178 | 7,822,562 | 61,779,570 | 7,019,220 | 45,913,394 | 53,868,834 |
| 1923 | 43,322,242 | 7,900,594 | 59,641,235 | 6,593,068 | 49,039,482 | 56,204,292 |
| 1924 | 44,559,661 | 7,816,145 | 61,325,865 | 6,587,546 | 49,502,499 | 57,131,235 |
| 1925 | 45,298,955 | 7,722,917 | 62,128,808 | 6,775,470 | 52,207,202 | 60,219,697 |
| POST OFFICE SAVINGS-BANK. | ||||||
|---|---|---|---|---|---|---|
| Year. | Number of Depositors at end of Year. | Total Amount of Deposits during Year. | Total Amount of Withdrawals during Year. | Excess of Deposits over Withdrawals. | Interest Credited to Depositors. | Total Amount to Credit of Depositors. |
*Fifteen months, 1st January, 1920, to 31st March, 1921. † Year ended 31st March following. ‡ Excess of withdrawals over deposits. | ||||||
| £ | £ | £ | £ | £ | ||
| 1876 | 26,117 | 664,135 | 696,281 | -32,146£ | 28,762 | 723,911 |
| 1877 | 28,761 | 681,294 | 667,023 | 14,271 | 29,194 | 767,376 |
| 1878 | 32,132 | 762,085 | 742,054 | 20,031 | 31,665 | 819,071 |
| 1879 | 34,747 | 812,400 | 876,181 | -63,781£ | 31,716 | 787,006 |
| 1880 | 38,667 | 864,442 | 780,505 | 83,937 | 32,823 | 903,766 |
| 1881 | 51,008 | 1,189,012 | 902,195 | 286,817 | 42,205 | 1,232,788 |
| 1882 | 57,517 | 1,325,852 | 1,142,599 | 183,253 | 54,910 | 1,470,951 |
| 1883 | 61,936 | 1,178,474 | 1,295,720 | -117,246£ | 56,047 | 1,409,752 |
| 1884 | 65,717 | 1,227,910 | 1,195,931 | 31,979 | 57,382 | 1,499,112 |
| 1885 | 69,957 | 1,341,001 | 1,264,305 | 76,696 | 62,228 | 1,638,036 |
| 1886 | 74,871 | 1,248,405 | 1,336,287 | -87,882£ | 65,825 | 1,615,979 |
| 1887 | 79,724 | 1,312,151 | 1,182,409 | 129,742 | 67,364 | 1,813,085 |
| 1888 | 84,488 | 1,544,747 | 1,387,471 | 157,276 | 78,080 | 2,048,442 |
| 1889 | 90,745 | 1,515,282 | 1,457,081 | 58,201 | 84,810 | 2,191,452 |
| 1890 | 97,208 | 1,658,543 | 1,500,437 | 158,106 | 92,319 | 2,441,876 |
| 1891 | 104,467 | 1,842,988 | 1,693,515 | 149,473 | 104,099 | 2,695,448 |
| 1892 | 112,528 | 1,878,270 | 1,821,349 | 56,921 | 111,302 | 2,863,671 |
| 1893 | 122,684 | 2,386,090 | 2,122,522 | 263,568 | 114,760 | 3,241,998 |
| 1894 | 129,423 | 2,252,862 | 2,268,624 | -15,762£ | 114,643 | 3,340,880 |
| 1895 | 137,683 | 2,794,507 | 2,369,333 | 425,174 | 129,490 | 3,895,543 |
| 1896 | 147,758 | 2,881,153 | 2,591,559 | 289,594 | 126,498 | 4,311,635 |
| 1897 | 159,331 | 3,187,219 | 2,891,169 | 296,050 | 137,240 | 4,744,925 |
| 1898 | 169,968 | 3,279,611 | 3,194,894 | 84,717 | 128,129 | 4,957,771 |
| 1899 | 183,046 | 3,644,980 | 3,417,299 | 227,681 | 134,918 | 5,320,371 |
| 1900 | 197,408 | 4,170,429 | 3,827,416 | 343,013 | 146,169 | 5,809,552 |
| 1901 | 212,436 | 4,611,456 | 4,230,193 | 381,263 | 159,198 | 6,350,013 |
| 1902 | 227,465 | 5,069,619 | 4,708,772 | 360,847 | 172,926 | 6,883,787 |
| 1903 | 243,675 | 5,661,593 | 5,343,828 | 317,765 | 187,130 | 7,388,682 |
| 1904 | 259,164 | 5,836,540 | 5,664,770 | 171,770 | 200,930 | 7,761,382 |
| 1905 | 276,066 | 6,625,744 | 5,984,185 | 641,559 | 259,081 | 8,662,023 |
| 1906 | 298,746 | 7,907,155 | 6,907,104 | 1,000,051 | 291,192 | 9,953,266 |
| 1907 | 319,773 | 9,351,664 | 8,125,123 | 1,226,541 | 343,424 | 11,523,231 |
| 1908 | 342,077 | 9,674,075 | 9,417,820 | 256,255 | 379,808 | 12,159,294 |
| 1909 | 359,714 | 9,611,120 | 9,499,320 | 111,800 | 395,804 | 12,666,898 |
| 1910 | 380,585 | 10,708,939 | 9,695,515 | 1,013,424 | 424,668 | 14,104,990 |
| 1911 | 405,566 | 11,627,368 | 10,662,046 | 965,322 | 472,875 | 15,543,187 |
| 1912 | 432,199 | 11,725,183 | 11,449,711 | 275,472 | 511,599 | 16,330,257 |
| 1913 | 458,594 | 11,286,702 | 11,041,454 | 245,248 | 555,908 | 17,131,414 |
| 1914 | 483,262 | 11,904,323 | 10,603,018 | 1,301,305 | 615,310 | 19,048,029 |
| 1915 | 509,085 | 13,706,057 | 11,294,973 | 2,411,084 | 707,252 | 22,166,365 |
| 1916 | 538,072 | 15,576,408 | 12,957,420 | 2,618,988 | 817,856 | 25,603,209 |
| 1917 | 566,351 | 17,106,529 | 14,461,169 | 2,645,360 | 947,821 | 29,196,390 |
| 1918 | 590,205 | 18,101,105 | 14,938,842 | 3,162,263 | 1,059,472 | 33,418,125 |
| 1919 | 630,783 | 29,758,447 | 25,962,377 | 3,796,070 | 1,178,935 | 38,393,130 |
| 1920* | 664,819 | 44,302,852 | 41,162,486 | 3,140,366 | 1,818,535 | 43,352,031 |
| 1921† | 678,930 | 29,125,997 | 30,236,231 | -1,110,234‡ | 1,599,907 | 43,841,704 |
| 1922† | 690,790 | 26,682,427 | 27,769,263 | -1,086,836‡ | 1,605,525 | 44,360,393 |
| 1923† | 710,157 | 29,598,372 | 29,510,321 | 88,051 | 1,649,976 | 46,098,421 |
| 1924† | 735,148 | 29,582,897 | 30,413,609 | -830,712‡ | 1,680,920 | 46,948,628 |
| 1925† | 758,155 | 31,833,622 | 32,602,506 | -768,884‡ | 1,731,578 | 47,911,322 |
| POSTAL. | |||||||
|---|---|---|---|---|---|---|---|
| Year. | Letters posted and delivered. | Newspapers posted and delivered. | Money-orders issued. | Postal Notes Issued.‡ | Postal Revenue.‡ | ||
| Number. | Amount. | Number. | Amount. | ||||
* Received and despatched. † Counted once only. ‡ Year ended 31st March following. | |||||||
| £ | £ | £ | |||||
| 1876 | 11,770,737* | 7,962,748* | 80,255 | 310,268 | .. | .. | 129,263 |
| 1877 | 13,054,870* | 8,066,311* | 90,672 | 334,973 | .. | .. | 143,600 |
| 1878 | 15,524,761* | 9,410,366* | 101,017 | 368,255 | .. | .. | 158,998 |
| 1879 | 20,957,818* | 10,057,944* | 117,999 | 428,673 | .. | .. | 141,448 |
| 1880 | 22,824,468* | 10,272,917* | 135,648 | 465,405 | .. | .. | 149,517 |
| 1881 | 25,557,931* | 12,248,043* | 135,556 | 452,182 | .. | .. | 156,579 |
| 1882 | 30,525,579* | 13,313,099* | 148,162 | 499,368 | .. | .. | 168,325 |
| 1883 | 33,588,408* | 13,030,563* | 172,556 | 541,133 | .. | .. | 172,665 |
| 1884 | 35,257,846* | 14,093,742* | 186,052 | 572,666 | .. | .. | 188,772 |
| 1885 | 35,829,855* | 14,233,878* | 188,622 | 581,395 | 16,442 | 6,910 | 197,456 |
| 1886 | 38,084,592* | 14,324,047* | 155,680 | 547,755 | 92,546 | 37,659 | 206,029 |
| 1887 | 39,377,774* | 15,381,323* | 159,579 | 555,744 | 122,255 | 47,729 | 213,355 |
| 1888 | 40,398,020* | 16,202,849* | 162,387 | 555,996 | 149,879 | 56,842 | 212,247 |
| 1889 | 42,301,233* | 16,721,016* | 172,076 | 589,545 | 175,023 | 65,484 | 222,978 |
| 1890 | 43,917,200* | 17,912,734* | 176,427 | 602,077 | 189,915 | 69,722 | 229,867 |
| 1891 | 47,612,864* | 18,501,912* | 195,239 | 651,990 | 220,683 | 79,326 | 245,395 |
| 1892 | 50,610,742* | 18,557,565* | 199,438 | 694,847 | 247,902 | 87,857 | 252,494 |
| 1893 | 52,085,449* | 19,556,030* | 210,957 | 750,929 | 285,389 | 101,002 | 253,457 |
| 1894 | 52,168,336* | 19,271,590* | 222,678 | 776,783 | 319,368 | 112,308 | 254,800 |
| 1895 | 29,586,949† | 12,675,973† | 243,497 | 812,604 | 349,627 | 123,368 | 242,615 |
| 1896 | 30,442,053† | 13,216,521† | 269,566 | 902,160 | 376,796 | 129,012 | 262,482 |
| 1897 | 33,030,095† | 14,261,345† | 293,659 | 970,831 | 409,866 | 134,378 | 272,163 |
| 1898 | 35,654,947† | 15,095,487† | 318,370 | 1,029,241 | 431,449 | 139,957 | 304,947 |
| 1899 | 38,484,371† | 15,717,388† | 344,664 | 1,118,808 | 461,447 | 147,686 | 325,301 |
| 1900 | 39,898,479† | 17,045,715† | 369,834 | 1,214,853 | 490,506 | 154,436 | 316,858 |
| 1901 | 52,567,560† | 18,973,632† | 405,967 | 1,286,508 | 556,316 | 173,317 | 281,097 |
| 1902 | 57,714,631† | 18,517,276† | 367,207 | 1,277,059 | 616,264 | 191,905 | 302,604 |
| 1903 | 61,687,457† | 19,696,434† | 396,312 | 1,416,225 | 707,044 | 220,070 | 343,207 |
| 1904 | 66,501,434† | 21,500,744† | 407,783 | 1,476,887 | 785,347 | 250,123 | 383,243 |
| 1905 | 71,116,261† | 23,626,362† | 417,441 | 1,541,712 | 875,324 | 276,279 | 410,967 |
| 1906 | 79,084,566† | 23,716,431† | 439,020 | 1,686,231 | 981,642 | 314,053 | 438,729 |
| 1907 | 159,680,654 | 38,862,863 | 441,487 | 1,773,591 | 1,092,631 | 347,300 | 478,388 |
| 1908 | 175,440,111 | 41,358,913 | 488,084 | 2,050,684 | 1,222,280 | 389,143 | 544,642 |
| 1909 | 186,926,337 | 42,561,641 | 538,740 | 2,307,593 | 1,414,752 | 447,619 | 566,990 |
| 1910 | 196,768,968 | 42,305,554 | 569,657 | 2,457,523 | 1,666,959 | 524,943 | 603,150 |
| 1911 | 205,450,627 | 43,801,719 | 607,764 | 2,759,393 | 1,821,566 | 574,980 | 613,252 |
| 1912 | 214,184,119 | 43,460,016 | 666,425 | 3,231,350 | 1,970,643 | 636,473 | 644,637 |
| 1913 | 223,961,200 | 43,572,759 | 690,745 | 3,357,774 | 2,238,842 | 721,743 | 695,136 |
| 1914 | 233,901,320 | 43,779,983 | 691,518 | 3,427,505 | 2,314,327 | 725,118 | 698,898 |
| 1915 | 242,547,859 | 41,311,535 | 664,860 | 3,471,818 | 2,370,079 | 723,314 | 858,583 |
| 1916 | 242,121,361 | 41,807,999 | 669,355 | 3,607,087 | 2,286,463 | 695,819 | 964,793 |
| 1917 | 245,796,945 | 40,366,792 | 642,683 | 3,476,645 | 2,166,597 | 638,246 | 976,027 |
| 1918 | 242,527,369 | 35,476,212 | 638,500 | 3,649,371 | 2,091,051 | 619,605 | 983,585 |
| 1919 | 247,143,183 | 35,498,263 | 690,291 | 4,604,059 | 2,197,520 | 655,910 | 1,068,489 |
| 1920 | 259,743,234 | 37,859,247 | 699,674 | 5,276,776 | 2,280,219 | 705,027 | 1,352,677 |
| 1921 | 253,767,131 | 38,680,982 | 669,383 | 4,850,820 | 2,377,622 | 739,783 | 1,499,304 |
| 1922 | 239,997,081 | 35,635,219 | 659,943 | 4,278,529 | 2,434,506 | 747,025 | 1,378,421 |
| 1923 | 252,021,959 | 38,138,697 | 684,979 | 4,390,159 | 2,652,777 | 804,343 | 1,146,588 |
| 1924 | 272,311,925 | 41,602,497 | 731,511 | 4,692,929 | 2,846,333 | 860,029 | 1,257,942 |
| 1925 | 294,630,760 | 44,717,406 | 766,689 | 4,977,230 | 3,040,722 | 922,873 | 1,320,277 |
| GOVERNMENT RAILWAYS. | |||||||
|---|---|---|---|---|---|---|---|
| Year ended 31st March. | Miles Open for Traffic. | Capital Cost of Open Lines. | Train-mileage. | Passengers carried, excluding Season-ticket Holders. | Goods and Live-stock.* | Revenue. | Expenditure. |
* Equivalent tonnage of live-stock. † Not available. ‡ Includes subsidy from Consolidated Fund in respect of non-paying branch lines and isolated sections. | |||||||
| £ | Tons. | £ | £ | ||||
| 1877 | 718 | † | † | † | † | 311,187 | 224,801 |
| 1878 | 1,052 | 7,284,106 | 1,904,374 | 1,542,695 | 864,947 | 569,898 | 405,896 |
| 1879 | 1,089 | 8,362,332 | 2,488,073 | 2,722,740 | 959,756 | 758,096 | 545,478 |
| 1880 | 1,171 | 8,460,210 | 2,640,898 | 2,967,090 | 1,128,671 | 762,572 | 580,016 |
| 1881 | 1,288 | 9,228,334 | 2,396,765 | 2,849,561 | 1,398,087 | 836,454 | 521,957 |
| 1882 | 1,333 | 9,443,000 | 2,502,804 | 2,911,477 | 1,460,145 | 892,026 | 523,099 |
| 1883 | 1,371 | 10,478,997 | 2,785,685 | 3,283,378 | 1,590,989 | 953,347 | 592,821 |
| 1884 | 1,404 | 11,251,633 | 2,841,745 | 3,272,644 | 1,726,471 | 961,304 | 655,990 |
| 1885 | 1,479 | 11,810,194 | 2,882,422 | 3,232,886 | 1,778,140 | 1,045,712 | 690,026 |
| 1886 | 1,613 | 12,472,814 | 3,020,550 | 3,362,266 | 1,856,733 | 1,047,418 | 690,340 |
| 1887 | 1,721 | 13,017,567 | 3,008,949 | 3,426,403 | 1,783,524 | 998,768 | 699,072 |
| 1888 | 1,753 | 13,352,978 | 2,944,786 | 3,451,850 | 1,770,638 | 994,843 | 687,328 |
| 1889 | 1,777 | 13,472,837 | 2,796,007 | 3,132,803 | 1,954,126 | 997,615 | 647,045 |
| 1890 | 1,809 | 13,899,955 | 2,868,203 | 3,376,459 | 2,112,734 | 1,095,569 | 682,787 |
| 1891 | 1,842 | 14,278,586 | 2,894,776 | 3,433,629 | 2,134,023 | 1,121,701 | 700,703 |
| 1892 | 1,869 | 14,656,691 | 3,010,489 | 3,555,764 | 2,122,987 | 1,115,432 | 706,517 |
| 1893 | 1,886 | 14,733,120 | 3,002,174 | 3,759,044 | 2,258,235 | 1,181,522 | 732,142 |
| 1894 | 1,948 | 15,137,036 | 3,113,231 | 3,972,701 | 2,128,709 | 1,172,792 | 735,359 |
| 1895 | 1,993 | 15,352,613 | 3,221,620 | 3,905,578 | 2,123,343 | 1,150,851 | 732,160 |
| 1896 | 2,014 | 15,425,532 | 3,307,226 | 4,162,426 | 2,175,943 | 1,183,041 | 751,368 |
| 1897 | 2,018 | 15,577,392 | 3,409,218 | 4,439,387 | 2,461,127 | 1,286,158 | 789,054 |
| 1898 | 2,055 | 15,993,903 | 3,666,483 | 4,672,264 | 2,628,746 | 1,376,008 | 857,191 |
| 1899 | 2,090 | 16,404,076 | 3,968,708 | 4,955,553 | 2,744,441 | 1,469,665 | 929,737 |
| 1900 | 2,104 | 16,703,887 | 4,187,893 | 5,468,284 | 3,251,716 | 1,623,891 | 1,052,358 |
| 1901 | 2,212 | 17,207,328 | 4,620,971 | 6,243,593 | 3,461,331 | 1,727,236 | 1,127,848 |
| 1902 | 2,235 | 18,170,722 | 5,066,360 | 7,356,136 | 3,667,039 | 1,874,586 | 1,252,237 |
| 1903 | 2,291 | 19,081,735 | 5,443,333 | 7,575,390 | 3,918,261 | 1,974,038 | 1,343,415 |
| 1904 | 2,328 | 20,692,911 | 5,685,399 | 8,306,383 | 4,259,217 | 2,180,641 | 1,438,724 |
| 1905 | 2,374 | 21,701,572 | 6,107,079 | 8,514,112 | 4,185,467 | 2,209,231 | 1,492,900 |
| 1906 | 2,407 | 22,498,972 | 6,413,573 | 8,826,382 | 4,415,166 | 2,349,704 | 1,621,239 |
| 1907 | 2,458 | 23,504,272 | 6,755,454 | 9,600,786 | 4,824,563 | 2,624,600 | 1,812,482 |
| 1908 | 2,474 | 24,365,647 | 7,051,274 | 9,756,716 | 5,070,176 | 2,761,938 | 1,949,759 |
| 1909 | 2,674 | 27,762,592 | 7,458,236 | 10,457,144 | 5,135,408 | 2,929,526 | 2,114,815 |
| 1910 | 2,717 | 28,513,476 | 7,889,166 | 11,141,142 | 5,490,018 | 3,249,790 | 2,169,474 |
| 1911 | 2,753 | 29,606,546 | 8,141,075 | 11,200,613 | 5,863,674 | 3,494,182 | 2,303,272 |
| 1912 | 2,798 | 30,506,089 | 8,371,687 | 11,891,134 | 5,887,908 | 3,676,509 | 2,465,896 |
| 1913 | 2,851 | 31,611,220 | 9,016,224 | 13,123,879 | 6,246,128 | 3,971,002 | 2,705,609 |
| 1914 | 2,854 | 32,355,087 | 9,319,268 | 13,355,893 | 6,019,633 | 4,043,328 | 2,880,323 |
| 1915 | 2,945 | 34,133,825 | 9,383,420 | 13,565,772 | 6,453,472 | 4,105,457 | 2,920,455 |
| 1916 | 2,960 | 34,857,882 | 9,356,522 | 14,201,506 | 6,370,945 | 4,548,356 | 2,910,883 |
| 1917 | 2,960 | 35,378,664 | 9,146,331 | 14,173,115 | 6,239,173 | 4,800,810 | 2,926,864 |
| 1918 | 2,983 | 36,001,432 | 7,468,646 | 11,408,156 | 5,742,968 | 4,687,700 | 3,042,907 |
| 1919 | 2,983 | 36,167,681 | 7,477,583 | 11,374,521 | 5,611,738 | 4,988,632 | 3,308,575 |
| 1920 | 2,996 | 36,390,115 | 7,408,608 | 12,760,814 | 6,900,279 | 5,752,487 | 4,105,067 |
| 1921 | 3,009 | 37,235,254 | 9,303,392 | 15,315,640 | 6,487,279 | 6,908,531 | 5,636,601 |
| 1922 | 3,021 | 39,309,097 | 8,717,265 | 14,262,440 | 6,321,351 | 6,643,591 | 6,237,727 |
| 1923 | 3,028 | 40,275,161 | 8,346,731 | 14,256,610 | 6,618,588 | 6,727,802 | 5,502,497 |
| 1924 | 3,053 | 41,399,427 | 9,024,503 | 13,836,311 | 6,925,517 | 6,984,211 | 5,403,766 |
| 1925 | 3,085 | 44,570,746 9,083,623 | 12,424,012 | 7,033,459 | 7,112,524 | 5,545,416 | |
| 1926 | 3,138 | 47,608,676 | 10,319,407 | 11,813,480 | 7,256,142 | £8,460,762 | 6,164,570 |
| BANKRUPTCY. | |||||
|---|---|---|---|---|---|
| Year. | Number of Bankruptcies. | Debtors' Statements of Assets, excluding Amounts secured to Creditors. | Amount realized by Official Assignees. | Amount of Debts proved. | Amount paid in Dividends and Preferential Claims. |
* Not available. | |||||
| £ | £ | £ | £ | ||
| 1876 | 549 | 395,547 | * | * | * |
| 1877 | 1,017 | 381,027 | * | * | * |
| 1878 | 1,044 | 406,939 | * | * | * |
| 1879 | 1,836 | 2,113,945 | * | * | * |
| 1880 | 1,483 | 1,198,270 | * | * | * |
| 1881 | 1,412 | 717,381 | * | * | * |
| 1882 | 1,333 | 803,072 | * | * | * |
| 1883 | 1,656 | 1,320,943 | * | * | * |
| 1884 | 846 | 801,150 | 112,539 | 481,222 | 44,118 |
| 1885 | 984 | 297,306 | 109,862 | 332,887 | 94,188 |
| 1886 | 1,089 | 415,953 | 128,370 | 566,291 | 102,966 |
| 1887 | 1,036 | 311,745 | 135,633 | 503,759 | 109,255 |
| 1888 | 881 | 252,322 | 98,213 | 571,741 | 79,843 |
| 1889 | 724 | 441,874 | 187,048 | 755,165 | 95,032 |
| 1890 | 652 | 262,733 | 112,951 | 381,124 | 122,276 |
| 1891 | 605 | 141,971 | 84,341 | 302,712 | 72,572 |
| 1892 | 507 | 122,050 | 66,497 | 238,953 | 43,662 |
| 1893 | 484 | 111,483 | 68,844 | 464,274 | 37,721 |
| 1894 | 626 | 187,785 | 85,538 | 310,078 | 70,889 |
| 1895 | 485 | 133,603 | 88,684 | 239,562 | 70,018 |
| 1896 | 412 | 115,455 | 71,712 | 256,870 | 37,492 |
| 1897 | 419 | 73,466 | 40,942 | 133,345 | 45,015 |
| 1898 | 407 | 90,068 | 45,474 | 285,155 | 30,994 |
| 1899 | 389 | 59,435 | 34,269 | 158,932 | 30,084 |
| 1900 | 304 | 77,689 | 53,415 | 141,800 | 37,411 |
| 1901 | 222 | 58,658 | 49,781 | 84,452 | 30,358 |
| 1902 | 205 | 61,604 | 39,386 | 110,995 | 29,406 |
| 1903 | 204 | 46,767 | 23,761 | 88,019 | 17,618 |
| 1904 | 257 | 86,094 | 43,514 | 125,392 | 28,103 |
| 1905 | 304 | 100,813 | 47,798 | 146,332 | 28,150 |
| 1906 | 347 | 106,376 | 50,761 | 192,927 | 35,448 |
| 1907 | 350 | 77,698 | 59,849 | 158,663 | 42,459 |
| 1908 | 406 | 200,447 | 67,018 | 199,069 | 47,800 |
| 1909 | 471 | 204,187 | 71,351 | 259,017 | 44,110 |
| 1910 | 393 | 127,634 | 79,100 | 176,001 | 47,796 |
| 1911 | 344 | 88,592 | 40,009 | 133,517 | 28,757 |
| 1912 | 312 | 64,398 | 39,965 | 120,325 | 26,825 |
| 1913 | 343 | 155,582 | 42,735 | 228,829 | 25,813 |
| 1914 | 391 | 174,410 | 64,153 | 199,251 | 33,910 |
| 1915 | 294 | 92,876 | 63,310 | 153,926 | 42,374 |
| 1916 | 304 | 123,441 | 56,416 | 172,774 | 29,223 |
| 1917 | 265 | 138,696 | 63,645 | 178,244 | 27,405 |
| 1918 | 164 | 50,356 | 67,729 | 88,607 | 33,176 |
| 1919 | 141 | 43,627 | 54,662 | 59,767 | 24,980 |
| 1920 | 145 | 44,026 | 47,897 | 77,752 | 45,227 |
| 1921 | 336 | 362,601 | 78,271 | 558/504 | 38,646 |
| 1922 | 690 | 344,861 | 126,145 | 834,356 | 63,009 |
| 1923 | 674 | 368,673 | 124,641 | 668,925 | 65,667 |
| 1924 | 670 | 279,602 | 118,641 | 703,995 | 74,878 |
| 1925 | 653 | 235,377 | 98,648 | 471,028 | 80,187 |
Table of Contents
The Construction of Mortality Tables from National Statistics, with Special Reference to some Investigations conducted in respect of the Population of New Zealand, and a Comparison of Mortality-rates between Australia and New Zealand.
By L. S. POLDEN, A.I.A., of the Government Actuary's Department.
(This paper was read before the Actuarial Society of Australasia—at Sydney on the 30th August and at Melbourne on the 3rd September, 1926—and printed in the official organ of the Society.)
1. FOR the purposes of this paper reference will be freely made to a report by Mr. A. T. Traversi, F.I.A., upon the results of a recent investigation into mortality-rates relating to the people of New Zealand. This report was primarily framed for inclusion in the Government Statistician's General Report upon the census of 1921,* and copies have been made available to be read in conjunction with this paper.
In the course of the investigation several difficulties with regard to the tractability of the data had to be surmounted, and the various attempts made at their solution suggested to the writer that perhaps the subject might conveniently form the basis of a paper for submission at a sessional meeting of the society. In particular, the opportunity will be taken to refer to an extremely interesting method of ascertaining the “mean population,” which was devised by Mr. Traversi on the occasion of a previous investigation, and which was found to be a most suitable instrument under the special circumstances attending the recent investigation.
At the outset it should be mentioned that the work was subject to certain limitations respecting departmental arrangements of time and expense, which precluded any opportunities for making an exhaustive analysis of such alternative methods as will be alluded to hereafter. Also, Mr. Traversi deemed that, for comparative purposes, it would be advisable to retain, as far as possible, the methods employed on the previous occasion.
2. The first matter which came up for consideration was the course to be adopted with respect to the treatment of the abnormal conditions of war and epidemic which prevailed during the intercensal period, 1st January, 1916, to 31st December, 1920, and to a small extent during the preceding intercensal period as well.
It is well recognized, I think, that although a great deal of valuable work has been done in developing the census methods of constructing mortality tables, yet they still rest to a very large extent upon weak premises, and that in the present state of our knowledge it is extremely difficult to properly assess the value of the assumptions usually made. Thus, if we had to deal only with a “stationary” population, we could construct a mortality table simply by employing the number of deaths observed at each age in the course of a year; but a modified plan of this kind was used by Dr. Price in the construction of the Northampton table. He was well aware of the dangers attaching to his design, but considered (quite erroneously) that, for his purpose, the population with which he had to deal had been sufficiently stable over a considerable period because the number of burials slightly exceeded the number of christenings—a circumstance mainly due to the presence of a large proportion of Baptists in the town. It is well known how faulty were his deductions, and this classical example points to the fact that in the practical treatment of the subject it is essential to concentrate upon a comparison of the dead with the living. Hence we are led to a study of m (the central death-rate), a function which is analagous in form to μ (the force of mortality), being equal to the differential coefficient of log. L taken negatively, or for our immediate needs to d/L.
* See also New Zealand Official Year-book, 1926—pp. 947–957.
There is usually no difficulty in obtaining d, but it is the ascertainment of the corresponding L which gives rise to some intricate problems. From one or more enumerations of the population we have to estimate as best we can the years of life lived through the period of the observations for the various ages or age-groups, and in doing so we usually take for granted that variations in the population at successive moments of time due to migration, a changing birth-rate in former years, and other disturbances, are not violent in their incidence, but rather are so counter-active as to permit of the population trend being expressed by means of an elementary curve, or by means of a simple mathematical formula. If, however, these disturbances are so exceptional as to be quite outside the normal experience, an allowance must be made for them. In the present instance it was clearly necessary to make adjustments for the movements of troops during the war period, and to allow for the influenza epidemic of 1918. Despite these corrective measures, the experience relating to the four years 1916, 1917, 1919, and 1920 was abnormal. Extended results were therefore not obtained for the second intercensal period.
An alternative plan (similar to that adopted by Mr. George King in the construction of the English Life Tables No. 8), which would have avoided all consideration for adjustments of this nature, but which would have been unlike the method employed at the previous investigation, would have been to estimate the population on the 1st July, 1921, from the results of the 1921 and earlier censuses, and apply it in conjunction with the deaths for, say, the three years 1920, 1921, and 1922. Mr. Charles H. Wickens, I.S.O., F.I.A., F.S.S., Commonwealth Statistician and Actuary, applied a somewhat similar method in the construction of his recent Australian tables. In his paper on “A New Australian Life Table” read before the Science Congress held at Adelaide in August, 1924, he stated:—
“On the completion of the tabulation according to age of the results of the 1921 census the question of compiling on similar lines a life table for the decennium 1911–20 came up for consideration. In spite of the attractiveness of presenting results for a period corresponding to that adopted for the Australian tables mentioned, I felt that a table which eliminated the upheavals of the war period of 1914–18 and the disastrous influenza epidemic of 1919 would serve a more useful purpose than one based on the decennium 1911–20, and would represent more accurately the rates of mortality likely to be experienced in Australia in normal times. If the disturbances due to the war and the epidemic were of so frequent occurrence as to be regarded as part of the usual experience of the community, the omission of the period would lack justification; but under the actual circumstances I think I am right in regarding them as exceptional. I have consequently constructed a table based on the deaths according to age recorded in Australia in the three years 1920–22, and the years of life according to age in the same period deduced from the mean population for the three years and the age-distribution disclosed by the census of 1921.”
In the second portion of this paper I submit the results of an investigation into New Zealand mortality-rates conducted on very similar lines to the above method.
3. Coming now to the main principles upon which the tables were constructed, I might say that the populations and deaths were available for individual ages, but quinquennial groups were operated upon in order to secure the elimination of accidental and other errors.
It may be asked whether any special justification existed for the selection of the groups 5 to 9, 10 to 14, &c. Might not any other system of grouping, such as, say, 4 to 8, 9 to 13, &c., which was adopted by Mr. King in the construction of the English Life Tables No. 8, have more faithfully reflected the important features of the statistics? Mr. King had been asked earlier by the Registrar-General to graduate the numbers of the populations disclosed by the census of 1911, for certain departmental purposes, and Mr. King's report on this matter is known as the “Graduation of Ages.” He found that there were well-defined predilections on the part of the people to state their ages terminating in selected digits, there being a great fondness for even digits, and an objection to odd with the exception of the digit 5; there was a decided preference for the digits 0, 2, 5, and 8. These “minor deliberate errors,” as Mr. King called them, had to be removed by a graduation process which would not, however, disturb special features arising out of any unusual movements in migration or other causes of a sporadic nature. The “major deliberate errors” representing gross misstatements of age were not, he decided, of any importance except at the old ages, and he doubted whether any method of graduation could satisfactorily reach them. Eventually he concluded that “the disturbance introduced by them into the table was inappreciable, and might be neglected.” The formula which he chose for this work was similar in principle, but somewhat different in application, to the one mentioned in the present report, a finite difference formula embracing three quinquennial groups of ages so chosen as to give centrally quinquennial values of the populations (an embryo summation formula, in fact) from age 14 upwards. Intermediate values were supplied by oscillatory interpolation, and the graduation of the young ages was effected by Milne's graphic process. This formula, then, was so adapted that whilst eliminating accidental errors and “minor deliberate errors,” the “inherent” irregularities due to past changes in the birth-rate, the death-rate, and the migration- rate should be undisturbed as far as possible. For instance, a depression at a certain range of ages, say 40 to 45, due to emigration twenty years ago among people aged 20 to 25, should be allowed to remain. Now, the system of grouping adopted was one in which the digits of age 1 and 6 are central, that is (4, 5, 6, 7, 8), (9, 10, 11, 12, 13), (14, 15, 16, 17, 18), &c., and it will be observed that such a system of grouping separates the digits of age 0 and 8, which were the two where there existed the greatest irregularities in excess, and at the same time arranges that in the group with the digit of age 0, where there was the largest irregularity in excess, there should be three odd digits of age, as compared with two in the group with digit of age 8. These groupings gave more satisfactory results on graduation than any other, and when Mr. King was subsequently asked to construct the customary mortality tables he saw every reason why the groupings used in his preliminary work should be retained. Sir Alfred Watson. however, in the discussion following the reading of Mr. King's paper on “The New National Life Tables” (J.I.A.,* Vol. 49, p. 297), thought that “Mr. King had been more anxious than the circumstances really required to correlate the two, and that it was not at all incumbent upon him, having graduated the population column for one particular purpose, to employ the same process in graduating the life table.” Mr. King nevertheless considered that the above features of the experience were sufficiently pronounced to justify the use of a system of grouping which departed from the customary 5 to 9, 10 to 14, &c. It does not appear, however, that any radical differences of practical importance would have resulted from the use of the latter groups, and I have simply alluded to the matter with the idea of indicating that, if great accuracy be desired from a given set of statistics, then it would seem desirable to analyse the data to ascertain whether the “minor deliberate errors” are so pronounced in character as to call for the use of special groupings. In the present instance, Mr. Traversi saw no reason to depart from the groupings used on the occasion of his earlier investigation, which I understand were adopted by him after full consideration of Mr. King's findings.
4. We now come to the consideration of a most important and difficult branch of the subject—namely, the calculation of either the years of life lived through the intercensal periods, or what is commonly called the “mean population.” This part of the subject will always be surrounded with an element of uncertainty until mechanical facilities for the collection of more permanent statistical information regarding the composition of the population is made available. At present we can get reasonably accurate information in this respect at the census enumerations, but comparatively little during the intervals. Briefly stated, then, the problem was to ascertain as correctly as the data would permit the average populations corresponding to the recorded deaths for the various age-groups over a period of five calendar years. The censuses were taken for the nights of the 2nd April, 1911, 15th October, 1916, and 17th April, 1921; and average populations for the two periods 1st January, 1911, to 31st December, 1915, and 1st January, 1916, to 31st December, 1920, had to be determined. In the absence of any precise information regarding the numbers existing between the census enumerations, some convenient assumption as to their movements had to be made. Milne assumed, in the construction of the Carlisle Table, that the progression of the population had been an arithmetical one. The assumption of arithmetical progression is not, however, natural, and it is more reasonable to assume that population begets population, and that, therefore, the progression is geometrical. Even this assumption may at times be very far out, and a falling-off in the marriage-rate, a variation in the death-rate, abnormal migration, and similar causes would invalidate it. One can conceive a population changing from an increasing one to a decreasing one during an intercensal period, and in such a case the assumption of arithmetical progression might be better than that of geometrical progression. The latter, however, seems to be the best of the available makeshifts for general application.
* Journal of the Institute of Actuaries, London.
If we imagine for the sake of simplicity that the censuses are taken on the 1st January every five years, we might say that, given P0 as the total population at the commencement of an intercensal period, and P1 or rP0, say, as the total population at the end, the geometrical mean is r ½ P0, and therefore the total number of years of life is five times this quantity. With the aid of the integral calculus, however, we are able to obtain a truer expression on the assumption of geometrical progression. The “mean” population will be P0 times the definite integral of rt between the limits 0 and 1, and the total number of years of life five times this quantity, or, in symbols. 5P0 M(r-1)/log.r, where M is the common modulus. We might obtain a similar expression for each of the sectional age-groups, but the difficulty arises that unless the various sectional rates of progression are equal, then the sectional years of life will not necessarily add up to the years of life ascertained from the population as a whole. In assuming an arithmetical rate of progression this difficulty does not arise, but, as already mentioned, such an assumption is not regarded as the best available.
A. C. Waters, of the Registrar-General's Department in London, was led to investigate the problem, and he contrived the ingenious device of assuming that the total population only moved in geometrical progression, and then obtained the mean population for the various age-groups by assuming that the proportion of the population in any group to the total varied in arithmetical progression. By this method the sectional years of life will add up to the years of life ascertained from the population as a whole. The demonstration of the formula is contained in an appendix to the Supplement to the 75th Annual Report of the Registrar-General, Part I, Life Tables, and also in Mr. King's paper “On the Construction of Mortality Tables from Census Returns and Records of Deaths” (J.I.A. Vol. 42, p. 259), to either of which reference should be made. The applicability of Waters's formula is not, however, sufficiently elastic to meet the varying conditions that arise in practice, and Mr. Traversi has made a very extensive analysis of the limitations attaching to its use, the results of which are contained in the “Transactions of the Royal Statistical Society” (Vol. 80, pp. 84 and 529). I propose to refer briefly to these articles, but have found it convenient to modify some of Mr. Traversi's original demonstrations. Subsequently I will explain how the results were found to be useful in the present investigation.
5. If we assume, as before, that censuses are taken on the 1st January, that the total populations at the commencement and end of the intercensal period are P0 and P1 respectively, that P1 = rP0 (the movement having been in geometrical progression), and that the corresponding populations in respect of a sectional age-group are π0 and π1 (the proportion of πt to Pt varying in arithmetical progression), then Waters's formula for the mean sectional population may be stated thus:—
where λ stands for the Napierian logarithm.
If now in any particular age-group π0 should be equal to £1 the expression becomes
but the mean population under this condition should, of course, be π0, and the last expression only assumes this value when r, ascertained from the population as a whole, takes the limiting value (as understood in its usual mathematical sense) of unity. For values greater than unity the expression becomes greater than π0, and it is therefore. evident that in some circumstances Waters's method will give a result exceeding that obtained on the basis of an arithmetical progression. For example, if a certain population has increased as a whole in geometrical progression by 50 per cent. (that is, r = 1.5), and the initial and terminal enumerations of a section of it has only increased from 10,000 to 11,000, then by Waters's formula we shall obtain 10,577 as the mean population for that section, and this is in excess of the arithmetical mean, or 10,500. Now, as Mr. Traversi has pointed out, it is against all canons to have a result exceeding the arithmetical mean. It is true that some sections of the population may have shown a tendency to increase and subsequently to decrease, giving an actual mean population in excess of the arithmetical mean. We have, however, postulated for the sake of convenience that the population as a whole is varying in geometrical progression; and, as a geometric mean is less than the arithmetic mean, it would be somewhat inconsistent to admit a result exceeding the arithmetical mean when dealing with the sectional populations.
Mr. Traversi therefore suggested the following method:—
Ascertain the difference between the arithmetical and geometrical means of the whole population—that is
Ascertain the value of
 or, say,
 for each
age-group.
for each
age-group.Split up (a) in proportion to (b).
Deduct the results from the respective arithmetical means of the age-groups.
Looking first at (b), we see that π0 X i'2 represents a joint function of the actual increase in the sectional population and the rate of such increase, and to split up (a) in proportion to such quantities (b) seems right enough on grounds of general reasoning. Some additional justification for this procedure is seen, however, if we put r equal to (1+ i) in (a) and expand the expression within the brackets. Neglecting powers of i higher than the second, we get i2/12, where i for the moment is necessarily small in order that the series might be made convergent. Thus it is seen that the scaling down in (d) is virtually effected in proportion to the approximate difference between the arithmetical and geometrical means of each age-group, and, in the words of Mr. Traversi, “it is simply a process of bracing up the inconsistent geometrical mean to the staunch and reliable arithmetical mean so that, while still essentially true to itself, it partakes of that it clings to.” When the initial and terminal enumerations of a sectional population are identical, the proposed method gives a value equal to them, thus overcoming the objections attaching to Waters's formula; and when they are not identical we shall obtain a result which is something greater than the geometrical mean and less than the arithmetical mean, but still adding in toto to the geometrical mean obtained from the population as a whole.
So far my remarks have applied to the case where the progression at every age-group is in the same direction, and Mr. Traversi proceeds to say that “some light is thrown on the question of mixed progressions by consideration of the extreme case in which the increases at some ages are exactly counterbalanced by the decreases at other ages. The formulas based upon the rate of increase of the whole population would fail in this case. This, as well as other circumstances, suggests that the logical course would be to regard the movement of the population as a whole as consisting of two separate progressions in different directions, each to be dealt with separately.
6. Mr. Traversi employed the above methods in connection with his previous investigation, but on this occasion he largely relied, in the first instance, upon a second method which Waters gave in the Registrar-General's 70th Annual Report, the existence of which had been unknown to Mr. Traversi until it was mentioned by a correspondent, who wrote in regard to Mr. Traversi's first contribution to the Royal Statistical Society.
On the usual assumption of geometrical progression, the total mean population is, as before,

which equal to
or
where I represents the increase in the total population.
Now, Waters's second formula is based upon the assumption that the sectional increase (which we will call I') follows, not its own geometrical curve, but that assumed by the increase in the population as a whole. Hence for the mean sectional population we have the expression
As showing the relation between Mr. Traversi's original plan and this second formula of Waters, it is interesting to note that the results given by the latter are identically reproduced if (a) (vide par. 5) be split up in proportion to the simple quantity π0 x i' or I' instead of the quantity denoted by (b).
The objection to Waters's first formula, that when π0 is equal to π1 the mean population takes another value, does not apply to his second formula, but still it suffers from the defect that under certain conditions it may give a value exceeding the arithmetical mean or falling below the geometrical mean. It has the great practical advantage, however, that only one multiplication is involved in its application, as against two in the application of the other. This consideration induced Mr. Traversi to give Waters's second formula a trial, and for both intercensal periods the results were found on examination to be rational. The formula failed rather badly, however, when applied to the single year 1918 (necessitating a change of the limits of integration in respect of the function of r), which, as already pointed out, was exceptional in character, and had to be separated from the experience of the second intercensal period. It seems that unless the various sectional rates of increase during an intercensal period are fairly uniform the method is not satisfactory when applied to a small portion, such as a year. Even the plan adopted throughout of dividing those sections showing increases from those showing decreases did not prove altogether effective. In some cases the results were in excess of those obtained on the assumption of arithmetical progression, and in a few others the results were actually negative. For this particular portion of the work, therefore, recourse was had to Mr. Traversi's plan of scaling down the arithmetical means, and the years of life for the years 1916, 1917, 1919, 1920 were then ascertained by simply deducting the results from the total years of life for the intercensal period ascertained by means of Waters's second formula.
7. The pivotal values for quinquennial ages 10, 15, &c., in respect of the years of life and the deaths, were obtained by means of a formula which belongs to the following family:—
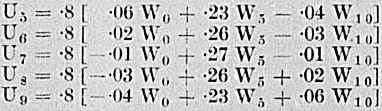
Together they add to W5, as, of course, they should. The expression for U7 may be thrown into the very neat form .2 W5 — .008 Δ2 W0, which is that given by Mr. King in the Supplement to the 75th Annual Report of the Registrar-General. All five values of U are not determined, as that would necessitate a further process of adjustment in order to blend the resulting values of q, but one value only (usually the central), is ascertained and men intermediate values of q that automatically blend are obtained by meant of oscillatory interpolation.
This process of obtaining pivotal values marked a great step in the treatment of the subject. The theoretical objections and practical difficulties attaching to the older methods—viz., (a) the graphical distribution of the grouped years of life and deaths into values for individual ages, (b) the assumption that the rate of mortality deduced for the group was the rate for the central age of the group, (c) the production of populations and deaths for individual ages by various means of ordinary finite difference interpolation from the group values, with the subsequent necessity for independently blending such particular interpolations, &c., are too well known to call for any detailed comment. Suffice it to say that the modern method of obtaining pivotal values assisted by the subsequent process of osculatory interpolation has largely disposed of the empiricism which characterized some of these earlier methods, and materially relieved the results of significant errors. The above formulæ assume that the population curve can be represented for short lengths by a parabolic curve, and they effectually disperse errors. The work is easy, rapid, and mechanical, and very good results are obtained if the data are so extensive (as they usually are) as to give rates of mortality not requiring much adjustment in order to obtain the requisite smoothness.
8. The values of q were directly deduced by means of the formula q = d/(L + ½d), which is based upon the usual assumption that deaths are uniformly distributed over the year of age. The older investigators obtained d/L giving m and then deduced q by means of the relation q = 2m/(2 + m). This relation is based upon exactly the same assumption as to the distribution of deaths, and it is somewhat difficult to understand why this process was chosen in lieu of the former, which is far easier.
9. The next matter which called for special consideration was the treatment of the two ends of the tables, but this is a problem which is not confined to population tables.
At the older ages the chief impediment to the production of regular rates of (mortality is the paucity of data, and it was decided to follow the plan adopted on the previous occasion of combining the data for both census periods. This procedure certainly gave a broader basis upon which to work, but it immediately brings up the question whether the homogeneity of the data was not thereby impaired. The special influences of the second period already referred to did not affect the older ages to any important extent, and may be left out of account. If, however, there is a tendency at these ages for mortality-rates to move progressively in one direction or another. then the rates for the 1911–15 period would obviously be vitiated by the inclusion of data which differed from the general characteristics of the data to which they property belong. Ultimately, it appears that “these two aims (breadth and homogeneity of data) are more or less in conflict, and he (the actuary) will lean to the one side or the other according to the object he has in view” (Hardy's Lectures, p. 16). It was felt, however, that the subject was not of very great importance at these ages, and so the data was combined for ages 75 and upwards. The resulting rates at extreme ages were still somewhat irregular. An examination of the statistics was then made, and it was found that the oldest male and female centenarians recorded at the 1921 census were aged 105 and 106 respectively, but a comparison with the 1916 census raised doubts as to whether these ages were authentic. Eventually it was decided to terminate the table at age 105; so, putting q105 = 1, and combining with the values of q75, q80, and q85, already determined, as the basis of a third difference formula, values for q90, q95 and q100 were obtained. This method is, of course, empirical, but any error arising therefrom is of little practical importance at these very old ages, and, in the absence of sufficient data, some reasonable method has to be adopted in order to bring the tables to a convenient end.
The method employed at the infantile ages, as described in the report, is well known, and calls for little comment. Mr. King's investigations in connection with the construction of the English Life Tables No. 8 indicate that it may be inadvisable to modify the “exposed to risk” obtained from the statistics of births and deaths to correspond with the years of life obtained from the census enumerations. He found that, for some reason or other, a large number of infants under two years of age had apparently escaped enumeration at the censuses of 1901 and 1911 (more so in 1911), and this fact had the effect of overstating the mortality among young children. In the present instance the “exposed to risk” figures obtained from the statistics of births and deaths were not modified.
10. The values of q ascertained in respect of the 1911–15 period by the above processes were now graphed out and adjusted with as little disturbance of their primary positions as possible, consistent with due regard to reasonable smoothness. The rates were found to be fairly smooth, and this was due partly to the large numbers involved and partly because the years of life and the deaths had been distributed in accordance with a mathematical curve. The work was greatly assisted by reference to the contour of the 1906–10 curve, which was also plotted out. Three graphs were prepared, for males and females separately—viz., (1) for infantile ages 0–5 inclusive, (2) for ages 5–50 inclusive, (3) for ages 50 and upwards. Intermediate values were obtained by osculatory interpolation.
In the exposition of the graphical method of adjusting mortality tables given to us by the late Dr. T. B. Sprague, the criterion for smoothness is to obtain the second differences of the values of q and to observe that they do not change sign. A change in sign indicates a point of inflection, and normally calls for an adjustment of the differences if perfect smoothness be required. That perfect smoothness by means of these adjustments has not been purchased at the sacrifice of fidelity to the original facts is measured in the usual way by comparing the “expected deaths” with the “actual deaths.” This test will sometimes call for a further adjustment of the rates. In a process of compiling mortality tables from population statistics on the basis which has been discussed up to the present it is not, however, very convenient to apply the latter test. As one cannot, therefore, take the same liberties as if a subsequent process of trial and error were readily available, it becomes necessary in the actual course of graduation to place more importance upon adherence to the original values of q than would otherwise be the case. This implies that it is imperative to satisfy oneself that any abnormalities do not properly form part of the experience. Furthermore, a population table is not usually applied to the construction of elaborate tables such as those deduced from, say, an experience of assured lives, where smoothness is an essential feature in securing the requisite regularity in published monetary results. In the present instance, therefore, no further adjustment for smoothness was considered necessary.
Beyond making the female values of q35 and q40, 1916-17-19-20, equal, in order to remove an undesirable irregularity, the values of q for the two special experiences of the second intercensal period were not subjected to any further treatment. It was thought that it might be of some interest to submit the crude results of these experiences at quinquennial ages, but that little practical importance would attach to their elaboration.
In connection with the osculatory third difference formula used for interpolation of intermediate values, it might be mentioned that the process gave all values up to age 100. A hypothetical value of 1.5 was assumed for q110, and this enabled the values between ages 100 and 105 to be calculated. The values at these high ages are, of course, of no importance whatever. The values of q for ages 6, 7, 8, and 9 were obtained graphically.
11. Coming now to the calculation of derived functions, it is to be noted that, in the construction of tables of annuities by means of the “continued” process
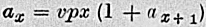
there does not appear to be available a satisfactory “verification” formula for periodically checking values by an entirely independent process. A check, therefore, with the values of the complete expectations as described was found to be very convenient, and to give remarkably close results. For this purpose the continuous annuity was simply taken as equal to the ordinary annuity with an addition of 5 (a similar adjustment was made to the curtate expectations in arriving at the complete expectations, but the error is of only trifling significance except at the extreme old ages). The formula expressing the relation between the annuity and the expectation is not given in either the old or the new Part 2 Text-book, and was deduced by means of a special application of the principle of integration by parts (see J.I.A., Vol. 44, p. 402). The special method is a most powerful and elegant one, and, as applied to life contingencies, seems to have received scant notice. It is briefly touched upon in Henry's “Calculus and Probability,” and it is a pity that it was not developed along the lines for which it is eminently suitable in the hew Part 2 Text-book. In passing, it will be noticed that the famous (39a) formula has been attributed to the late Sir G. F. Hardy, in accordance with what was the accepted belief, but recent correspondence (J.I.A., Vol. 55, p. 105) has shown that the formula was due to Mr. George King.
12. The broad results of the investigation (and those of the special investigation which follows) are in accordance with those elicited elsewhere. They show that rates of mortality in New Zealand at the majority of ages are progressively declining.
This tendency has been recently discussed in its relation to the computation of benefits dependent upon the probabilities of death in connection with the new “Annuitants' Experience of British Offices.” It is hardly within the scope of this paper to touch upon the many phases of the difficult problem that has thus arisen. The problem is all the more difficult when it is considered that a continuous decrease in mortality-rates cannot be counted upon, as mortality-rates seem likely to conform to regular tendencies operating in other domains of human activity, such as the successive rise and fall of interest-rates and the allied phenomenon of waves of prosperity and depression. (See also the latter portion of par. 22, regarding movements in the rate of improvement as applied to age.) Ail these influences are probably reactive upon one another, and suggest the possibility of the existence of a general theorem regulating all human aspirations and motives according to cyclical changes. Those who are interested in this subject of the variation of the rate of mortality in time as distinct from age will find useful information in a most interesting paper thereon by C. D. Rutherford, which recently appeared in the “Transactions of the Actuarial Society of America.” The author shows that mortality-rates had been actually rising prior to the present reduction that commenced about 1870–80.
13. I now proceed to deal with the construction of a mortality table based upon the New Zealand census of the night of the 17th April, 1921, in conjunction with the deaths for adjacent years.
It had been my original intention to employ the deaths for the three years 1920, 1921, and 1922, as was done in the construction of the recent Australian tables (see par. 2), for then a comparison of the mortality-rates of the two countries would have been possible under ideal conditions; but I regret to say that I have been constrained to modify the idea. Upon graphing out the quinquennial values of q, I found that the male curve was almost contiguous with the 1911–15 curve at ages 20 to 40, that the female curve crossed the 1911–15 curve at age 15, recrossing at age 30, and that generally the other portions of the curves approached the 1911–15 curves too closely to be properly representative of the mortality which I conceived had been experienced in the Dominion in very recent years.
The following table is instructive:—
| Year. | Total Deaths. | Crude Death-rate per 1,000 of Mean Population |
|---|---|---|
| 1914 | 10,148 | 9.31 |
| 1915 | 9,965 | 9.06 |
| 1916 | 10,596 | 9.64 |
| 1917 | 10,528 | 9.58 |
| 1918 | 16,364 | 14.84 |
| 1919 | 10,808 | 9.46 |
| 1920 | 12,109 | 10.15 |
| 1921 | 10,682 | 8.73 |
| 1922 | 10,977 | 8.77 |
| 1923 | 11,511 | 9.03 |
| 1924 | 10,767 | 8.29 |
| 1925 | 11,026 | 8.29 |
The deaths for the year 1920 were sufficiently marked to call for special examination, and the statistics for that year showed that the mortality from certain epidemic-diseases (influenza, measles, and whooping-cough) and certain allied diseases of the respiratory system (bronchitis, pneumonia, and pulmonary tuberculosis) had been heavy. A large number of deaths of old people (classified under the comprehensive term “senility”) had also been reported. Mr. Traversi had considered that 1920 should properly form a part of the special experience of the truncated intercensal period 1916–20 (see graphs, p. 13 of report). I have, however, decided for my particular purpose to exclude this year, and to operate upon the deaths for the two years 1921 and 1922, with the census brought down to the 31st December, 1921. It might be contended that this procedure possibly involves the selection of a favourable period, which would not be specifically manifest if it were to form part of a broader basis, and some might therefore prefer to work upon the deaths for the three years 1921, 1922, and 1923, with the census brought down to the 30th June, 1922. A strong objection,, however, against carrying the 1921, census down by over a year is the tact that the censuses were affected as the result of the migration of troops, and the ratios of progression used in estimating the projected population would, of course, be less trustworthy than those relating to a point of time six months earlier. Moreover, the experience of the years 1921 and 1922 does not appear to be at all outstanding in comparison with that of the following years, and I have therefore had no great hesitation in using it as the basis of a table.
14. The population at the census of the 17th April, 1921, was divided into the quinquennial groups 0 to 4, 5 to 9, &c., and the numbers were compared with the corresponding numbers of the census of the 15th October, 1916, enabling the group ratios of progression to be calculated. Then, assuming that the progressions had been geometrical, the number recorded at each age was brought down to the mid-point of the two years 1921 and 1922, or to midnight of the 31st December, 1921, by means of the factor appropriate to its particular group. Thus the total male population of 623,243 at the 1921 census was improved in this way to 636,058; and, similarly, the female population was improved from 595,670 to 603,866. Had the rate of progression been assumed as arithmetical, the improved populations would have been 634,459 and 603,202 respectively.
15. The deaths for the two years 1921 and 1922 were thrown into the same age-groups as the populations.
16. Pivotal values for the central age of each group were then calculated by the formula U7 = .2 W5 — .008 Δ2W0 in respect of populations and deaths, and, after doubling the resulting graduated populations to make them correspond with two-years' deaths, values of q for the ages 12, 17, 22, &c., were obtained.
17. It was then found necessary to eliminate further irregularities due to the comparatively limited character of the data, and so the above values of q were graphed out in two sections, ages 12 to 52 inclusive, and ages 52 upwards, with the corresponding values from the 1911–15 experience. The curves for the older ages were quite smooth up to age 87, and were adopted without any modification whatever. Between the male ages 17 and 27 there was an interesting twist in the curve, and between the female ages 27 and 42 a more interesting twist in duplicate. The curves were otherwise quite regular in character, and I spent some considerable time in endeavouring to elicit the explanation of the presence of these special features. No very convincing conclusions were arrived at, however, and, as the data at the particular ages mentioned were quite as extensive as elsewhere, it was considered necessary to retain these features of the curves as far as possible in the course£ of adjustment.
It was after I had finished the construction of the tables that I received, through the kindness of Mr. Wickens, Part XXVII, Census of the Commonwealth of Australia. 1921, which contains the official Australian tables, and I was interested to find that the second differences of the male q were negative from age 17 to 25, whilst with regard to the female q the second differences were negative from age 17 to 29 and then from age 35 to 39. It would thus appear that Mr. Wickens found that the features I have mentioned were also peculiar to the Australian experience. Instead of retaining the double undulation of the female material as he has done, however, I have simply drawn one extensive sweep of the graduated curve. I have also examined other population tables to see whether these features are at all general. The English Life Table No. 8 (males) shows negative second differences from age 18 to 22, but the female table shows only one short range from ages 14 to 17. In several other tables there are indications that the features were present in the data, but not to the same extent as in the two tables now under discussion.
Great care was needed in the drawing of the graduated curves (which was immensely helped by the employment of pins shuffled about until curves with the requisite contour and smoothness were obtained), because graduated quinquennial values only were thus determined, and, subsequently, intermediate values between all ages from 17 to 105 were filled in by the independent process of osculatory interpolation. The function interpolated was log. (q + .1), as this gives much smoother results than would be obtained by operating upon q alone.
18. At ages over 87 I tried several methods which would take some cognizance of the actual data. Thus various selections of graduated terms were made in conjunction with a reconciliation of the expected deaths with the actual deaths at these ages in order to form an expression of the third degree for the values of m. The difficulty was, however, that the ordinary simple relation m = 2q / (2—q) is not appropriate at advanced ages. As the deaths were comparatively few, I eventually had recourse to the easy and convenient method mentioned in the first part of this paper —that is to say, I assumed q105 = 1, and then employed q77, q82, and q87 to give a third difference formula for q. The formula was protracted to give hypothetical values of q at ages 107 and 112 in order to enable the entire table up to the oldest age to be completed by means of osculatory interpolation.
19. The statistics of births and deaths (without adjustment to agree with the census figures) gave the ungraduated values of q at ages 0 to 4. I then obtained q7 by using pivotal values of the years of life and the deaths derived by means of the formula U4 = ⅓ W3 - ⅛1 Δ2 W0 from the age-groups (3, 4, 5), (6, 7, 8), and (9, 10, 11). The values of q for ages 1, 2, 3, 4, 7, and the graduated values for ages 12, 17, and 22, were then plotted out with the 1911–15 values, and graduated values for the former ages were read off. With the graduated values for ages 2, 7, 12, 17, and 22 it was then easy to supply the values for all ages between 7 and 17 by the further application of osculatory interpolation, and the remaining values for ages 5 and 6 were obtained by employing the graduated values for ages 3, 4, 7, and 8 as the basis of an ordinary third difference formula.
It is as well to mention here that the use of Lagrange's interpolation formula at the younger ages is unsatisfactory on account of the distinctiveness with which the rate of mortality changes. In connection with the construction of the English Life Tables No. 8, Mr. King found that a deviation of some magnitude between the expected and actual deaths resulted at the ages 4 to 8 through the application of this formula. The deviation was allowed to remain and subsequently, in the course of the discussion following the reading of Mr. King's paper on “The New National Life Tables,” the late T. G. Ackland suggested a method based upon an extension of the method of osculatory interpolation—similar to that mentioned above—which gave very satisfactory results, and constituted an improvement, which Mr. King very cordially welcomed.
20. The graduated values of q were now cut down to five places of decimals, and the first, second, and third differences obtained. At several ages quite trifling adjustments were made in the last place of decimals in order to relieve the second differences of undesirable irregularities. After these slight rectifications, negative second differences were only shown in the male table between ages 19 and 23, and in the female table between ages 19 and 29 (representing the special features of the curves already referred to). The third differences were very small, never exceeding one significant figure from the infantile ages right up to about age 70, after which these differences became larger, but their signs alternated regularly between ranges of positive and negative (as was to be expected in view of the method adopted in the completion of the older ages), and it was not thought necessary to seek further smoothness.
A test for adherence to the data by trying a comparison of expected and actual deaths was next made. The values of q were converted into values of m by the formula m = 2q (2—q) (except at age 0, where m was obtained by considering the proportion of deaths under age 1 which had taken place during the first six months of life, as derived from the vital statistics for the years 1921 and 1922), and these were then multiplied into the populations brought down to the 31st December, 1921. At ages 0 to 4 the populations were those obtained from the statistics of births and deaths; also, at the extreme old ages (say, 100 and over), where the above formula breaks down, the expected deaths were taken as being equal to the actual. A total accumulated excess of 42 deaths in an actual total of 12,230 for the two years, or about ⅓ per cent. of the total deaths, was shown in the case of the male table, and, in the case of the female table, the expected deaths agreed exactly with the actual total of 9,429. At no point in either table was there an accumulated deviation of importance, and it was only after age 90 that there was an individual deviation of significant magnitude. The raw facts beyond this age indicated abnormally low rates of mortality, due, perhaps, to gross overstatements of age or to paucity of data. As the rates at these very advanced ages are of little moment, I decided to adhere to the graduated rates as ascertained.
21. I now present the final tables in detail. (I have not thought it necessary to carry the numbers living beyond integral figures at the extreme old ages, consequently the columns of the numbers living and the expectations finish at age 101 in the case of males and at age 102 in the case of females, but this is of no importance).
| NEW ZEALAND MALELIVES, 1921–22: ELEMENTARY VALUES. | |||
|---|---|---|---|
| Age. | Number Living. (l.) | Rate of Mortality per 1,000. (1,000q.) | Complete Expectation of Life. (e + ½.) |
| 0 | 100,000 | 50.17 | 62.764 |
| 1 | 94,983 | 7.07 | 65.052 |
| 2 | 94,311 | 4.62 | 64.512 |
| 3 | 93,875 | 3.13 | 63.810 |
| 4 | 93,581 | 2.60 | 63.009 |
| 5 | 93,338 | 2.26 | 62.171 |
| 6 | 93,127 | 2.03 | 61.311 |
| 7 | 92,938 | 1.83 | 60.435 |
| 8 | 92,768 | 1.63 | 59.545 |
| 9 | 92,617 | 1.46 | 58.641 |
| 10 | 92,482 | 1.41 | 57.726 |
| 11 | 92,352 | 1.42 | 56.806 |
| 12 | 92,221 | 1.45 | 55.886 |
| 13 | 92,087 | 1.50 | 54.967 |
| 14 | 91,949 | 1.62 | 54.049 |
| 15 | 91,800 | 1.77 | 53.135 |
| 16 | 91,638 | 1.92 | 52.228 |
| 17 | 91,462 | 2.07 | 51.328 |
| 18 | 91,273 | 2.22 | 50.433 |
| 19 | 91,070 | 2.38 | 49.545 |
| 20 | 90,853 | 2.55 | 48.662 |
| 21 | 90,621 | 2.71 | 47.785 |
| 22 | 90,375 | 2.83 | 46.914 |
| 23 | 90,119 | 2.91 | 46.046 |
| 24 | 89,857 | 2.96 | 45.178 |
| 25 | 89,591 | 3.00 | 44.311 |
| 26 | 89,322 | 3.05 | 43.443 |
| 27 | 89,050 | 3.14 | 42.574 |
| 28 | 88,770 | 3.27 | 41.707 |
| 29 | 88,480 | 3.43 | 40.842 |
| 30 | 88,177 | 3.60 | 39.981 |
| 31 | 87,860 | 3.78 | 39.123 |
| 32 | 87,528 | 3.96 | 38.269 |
| 33 | 87,181 | 4.14 | 37.420 |
| 34 | 86,820 | 4.32 | 36.573 |
| 35 | 86,445 | 4.51 | 35.730 |
| 36 | 86,055 | 4.71 | 34.889 |
| 37 | 85,650 | 4.92 | 34.052 |
| 38 | 85,229 | 5.15 | 33.218 |
| 39 | 84,790 | 5.38 | 32.387 |
| 40 | 84,334 | 5.63 | 31.560 |
| 41 | 83,859 | 5.90 | 30.736 |
| 42 | 83,364 | 6.20 | 29.915 |
| 43 | 82,847 | 6.52 | 29.099 |
| 44 | 82,307 | 6.87 | 28.286 |
| 45 | 81,742 | 7.25 | 27.478 |
| 46 | 81,149 | 7.65 | 26.675 |
| 47 | 80,528 | 8.07 | 25.877 |
| 48 | 79,878 | 8.49 | 25.084 |
| 49 | 79,200 | 8.92 | 24.294 |
| 50 | 78,494 | 9.38 | 23.508 |
| 51 | 77,758 | 9.92 | 22.726 |
| 52 | 76,987 | 10.56 | 21.949 |
| 53 | 76,174 | 11.28 | 21.178 |
| 54 | 75,315 | 12.07 | 20.413 |
| 55 | 74,406 | 12.96 | 19.657 |
| 56 | 73,442 | 13.99 | 18.908 |
| 57 | 72,415 | 15.20 | 18.169 |
| 58 | 71,314 | 16.62 | 17.442 |
| 59 | 70,129 | 18.23 | 16.728 |
| 60 | 68,851 | 20.01 | 16.030 |
| 61 | 67,473 | 21.95 | 15.347 |
| 62 | 65,992 | 24.03 | 14.680 |
| 63 | 64,406 | 26.24 | 14.029 |
| 64 | 62,716 | 28.61 | 13.394 |
| 65 | 60,922 | 31.16 | 12.773 |
| 66 | 59,024 | 33.96 | 12.168 |
| 67 | 57,020 | 37.04 | 11.578 |
| 68 | 54,908 | 40.44 | 11.004 |
| 69 | 52,688 | 44.13 | 10.447 |
| 70 | 50,363 | 48.15 | 9.906 |
| 71 | 47,338 | 52.50 | 9.382 |
| 72 | 45,421 | 57.20 | 8.874 |
| 73 | 42,823 | 62.21 | 8.382 |
| 74 | 40,159 | 67.55 | 7.905 |
| 75 | 37,446 | 73.35 | 7.441 |
| 76 | 34,699 | 79.78 | 6.991 |
| 77 | 31,931 | 87.01 | 6.554 |
| 78 | 29,153 | 95.04 | 6.130 |
| 79 | 26,382 | 103.87 | 5.722 |
| 80 | 23,642 | 113.68 | 5.327 |
| 81 | 20,954 | 124.72 | 4.946 |
| 82 | 18,341 | 137.25 | 4.580 |
| 83 | 15,824 | 151.71 | 4.228 |
| 84 | 13,423 | 168.25 | 3.895 |
| 85 | 11,165 | 186.76 | 3.582 |
| 86 | 9,080 | 207.01 | 3.290 |
| 87 | 7,200 | 228.74 | 3.018 |
| 88 | 5,553 | 252.23 | 2.765 |
| 89 | 4,152 | 278.01 | 2.529 |
| 90 | 2,998 | 306.00 | 2.311 |
| 91 | 2,081 | 336.06 | 2.108 |
| 92 | 1,382 | 367.96 | 1.922 |
| 93 | 873 | 401.89 | 1.751 |
| 94 | 522 | 438.24 | 1.592 |
| 95 | 293 | 476.99 | 1.445 |
| 96 | 153 | 518.09 | 1.310 |
| 97 | 74 | 561.42 | 1.176 |
| 98 | 32 | 607.09 | 1.063 |
| 99 | 13 | 655.32 | 0.885 |
| 100 | 4 | 706.15 | 0.750 |
| 101 | 1 | 759.59 | 0.500 |
| 102 | .. | 815.62 | .. |
| 103 | .. | 874.30 | .. |
| 104 | .. | 935.72 | .. |
| 105 | .. | 1,00000 | .. |
| 0 | 100,000 | 38.50 | 65.433 |
| 1 | 96,150 | 6.13 | 67.033 |
| 2 | 95,561 | 4.20 | 66.443 |
| 3 | 95460 | 2.80 | 65.721 |
| 4 | 94,894 | 2.27 | 64.904 |
| 5 | 94,679 | 1.89 | 64.050 |
| 6 | 94,500 | 1.62 | 63.170 |
| 7 | 94,347 | 1.40 | 62.272 |
| 8 | 94,215 | 1.49 | 61.359 |
| 9 | 94,103 | 1.11 | 60.431 |
| 40 | 93,999 | 1.42 | 59.497 |
| 11 | 93,894 | 1.47 | 58.563 |
| 12 | 93,784 | 1.24 | 57.631 |
| 43 | 93,668 | 1.32 | 56.702 |
| 14 | 93,544 | 1.45 | 55.777 |
| 15 | 93,408 | 1.61 | 54.857 |
| 46 | 93,258 | 1.77 | 53.945 |
| 47 | 93,093 | 1.93 | 53.039 |
| 48 | 92,913 | 2.09 | 52.141 |
| 19 | 92,719 | 2.26 | 51.249 |
| 20 | 92,509 | 2.44 | 50.364 |
| 21 | 92,283 | 2.61 | 49.487 |
| 22 | 92,042 | 2.76 | 48.615 |
| 23 | 91,788 | 2.90 | 47.748 |
| 24 | 91,522 | 3.03 | 46.885 |
| 25 | 91,245 | 3.16 | 46.026 |
| 26 | 90,957 | 3.27 | 45.170 |
| 27 | 90,660 | 3.37 | 44.317 |
| 28 | 90,354 | 3.44 | 43.465 |
| 29 | 90,043 | 3.50 | 42.613 |
| 30 | 89,728 | 3.55 | 41.761 |
| 31 | 89,409 | 3.60 | 40.908 |
| 32 | 89,087 | 3.67 | 40.054 |
| 33 | 88,760 | 3.74 | 39.200 |
| 34 | 88,428 | 3.82 | 38.345 |
| 35 | 88,090 | 3.91 | 37.491 |
| 36 | 87,746 | 4.01 | 36.636 |
| 37 | 87,394 | 4.43 | 35.781 |
| 38 | 87,033 | 4.27 | 34.928 |
| 39 | 86,661 | 4.43 | 34.075 |
| 40 | 86,277 | 4.60 | 33.225 |
| 41 | 85,880 | 4.80 | 32.376 |
| 42 | 85,468 | 5.03 | 31.530 |
| 43 | 85,038 | 5.29 | 30.687 |
| 44 | 84,588 | 5.56 | 29.847 |
| 45 | 84,118 | 5.87 | 29.011 |
| 46 | 83,624 | 6.22 | 28.180 |
| 47 | 83,104 | 6.64 | 27.353 |
| 48 | 82,552 | 7.11 | 26.532 |
| 49 | 81,965 | 7.65 | 25.719 |
| 50 | 81,338 | 8.24 | 24.913 |
| 51 | 80,668 | 8.86 | 24.116 |
| 52 | 79,953 | 9.52 | 23.327 |
| 53 | 79,192 | 10.49 | 22.547 |
| 54 | 78,385 | 10.89 | 21.774 |
| 55 | 77,531 | 11.63 | 21.008 |
| 56 | 76,629 | 12.44 | 20.249 |
| 57 | 75,676 | 13.31 | 19.498 |
| 58 | 74,669 | 14.21 | 18.754 |
| 59 | 73,608 | 15.12 | 18.017 |
| 60 | 72,495 | 16.13 | 17.286 |
| 61 | 71,326 | 17.30 | 16.561 |
| 62 | 70,092 | 18.72 | 15.844 |
| 63 | 68,780 | 20.35 | 15.137 |
| 64 | 67,380 | 22.16 | 14.441 |
| 65 | 65,887 | 24.20 | 13.757 |
| 66 | 64,293 | 26.56 | 13.086 |
| 67 | 62,585 | 29.33 | 12.429 |
| 68 | 60,749 | 32.55 | 11.790 |
| 69 | 58,772 | 36.20 | 11.169 |
| 70 | 56,644 | 40.28 | 10.570 |
| 71 | 54,362 | 44.77 | 9.993 |
| 72 | 51,928 | 49.67 | 9.438 |
| 73 | 49,349 | 55.10 | 8.905 |
| 74 | 46,630 | 61.15 | 8.395 |
| 75 | 43,779 | 67.70 | 7.909 |
| 76 | 40,815 | 74.62 | 7.447 |
| 77 | 37,769 | 81.65 | 7.007 |
| 78 | 34,685 | 88.70 | 6.586 |
| 79 | 31,608 | 95.76 | 6.178 |
| 80 | 28,581 | 103.25 | 5.780 |
| 81 | 25,630 | 111.79 | 5.388 |
| 82 | 22,765 | 122.07 | 5.003 |
| 83 | 19,986 | 134.52 | 4.629 |
| 84 | 17,297 | 149.03 | 4.271 |
| 85 | 14,719 | 165.50 | 3.931 |
| 86 | 12,283 | 183.78 | 3.612 |
| 87 | 10,026 | 203.64 | 3.312 |
| 88 | 7,984 | 225.47 | 3.032 |
| 89 | 6,184 | 249.82 | 2.769 |
| 90 | 4,639 | 276.64 | 2.524 |
| 91 | 3,356 | 305.75 | 2.298 |
| 92 | 2,330 | 336.88 | 2.090 |
| 93 | 1,545 | 370.35 | 1.898 |
| 94 | 973 | 406.68 | 1.720 |
| 95 | 577 | 445.84 | 1.557 |
| 96 | 320 | 487.75 | 1.406 |
| 97 | 164 | 532.23 | 1.268 |
| 98 | 77 | 579.52 | 1.136 |
| 99 | 32 | 629.98 | 1.031 |
| 100 | 12 | 683.61 | 0.917 |
| 101 | 4 | 740.36 | 0.750 |
| 102 | 1 | 800.12 | 0.500 |
| 103 | .. | 862.87 | .. |
| 104 | .. | 928.80 | .. |
| 105 | .. | 1,000.00 | .. |
For the purposes of comparison, I now sot out the New Zealand figures in abridged form with figures from the Official Australian Tables to correspond. (It should be pointed out, as a matter of theoretical interest, that Mr. Wickens has seemingly employed the more accurate expression e + ½ - 1/12 μ for the complete expectation of life.)
| MALES. | |||
|---|---|---|---|
| Age. | NEW ZEALAND, 1921–22. | ||
| Number Living. | Rate of Mortality per 1,000. | Complete Expectation of Life. | |
| 0 | 100,000 | 50.17 | 62.764 |
| 1 | 94,983 | 7.07 | 65.052 |
| 2 | 94,311 | 4.62 | 64.512 |
| 3 | 93,875 | 3.13 | 63.810 |
| 4 | 93,581 | 2.60 | 63.009 |
| 5 | 93,338 | 2.26 | 62.171 |
| 10 | 92,482 | 1.41 | 57.726 |
| 15 | 91,800 | 1.77 | 53.135 |
| 20 | 90,853 | 2.55 | 48.662 |
| 25 | 89,591 | 3.00 | 44.311 |
| 30 | 88,177 | 3.60 | 39.981 |
| 35 | 86,445 | 4.51 | 35.730 |
| 40 | 84,334 | 5.63 | 31.560 |
| 45 | 81,742 | 7.25 | 27.478 |
| 50 | 78,494 | 9.38 | 23.508 |
| 55 | 74,406 | 12.96 | 19.657 |
| 60 | 68,851 | 20.01 | 16.030 |
| 65 | 60,922 | 31.16 | 12.773 |
| 70 | 50,363 | 48.15 | 9.906 |
| 75 | 37,446 | 73.35 | 7.441 |
| 80 | 23,642 | 113.68 | 5.327 |
| 85 | 11,165 | 186.76 | 3.582 |
| 90 | 2,998 | 306.00 | 2.311 |
| 95 | 293 | 476.99 | 1.445 |
| 100 | 4 | 706.15 | 0.750 |
| AUSTRALIA, 1920–22. | ||
|---|---|---|
| Number Living. | Rate of Mortality per 1,000. | Complete Expectation of Life. |
| 100,000 | 71.32 | 59.148 |
| 92,868 | 14.60 | 62.673 |
| 91,512 | 6.25 | 62.597 |
| 90,940 | 4.23 | 61.988 |
| 90,555 | 3.00 | 61.249 |
| 90,283 | 2.52 | 60.432 |
| 89,389 | 1.56 | 56.014 |
| 88,685 | 1.84 | 51.439 |
| 87,697 | 2.84 | 46.988 |
| 86,318 | 3.55 | 42.697 |
| 84,743 | 3.90 | 38.444 |
| 82,992 | 4.75 | 34.201 |
| 80,813 | 6.17 | 30.053 |
| 78,040 | 8.44 | 26.028 |
| 74,330 | 11.58 | 22.196 |
| 69,650 | 15.52 | 18.514 |
| 63,386 | 24.07 | 15.082 |
| 54,886 | 35.52 | 12.014 |
| 44,332 | 52.90 | 9.261 |
| 31,911 | 83.40 | 6.870 |
| 18,614 | 133.40 | 5.001 |
| 7,916 | 195.80 | 3.622 |
| 2,141 | 283.00 | 2.598 |
| 306 | 384.00 | 1.864 |
| 17 | 530.00 | 1.170 |
| FEMALES. | |||
|---|---|---|---|
| Age. | NEW ZEALAND, 1921–22. | ||
| Number Living. | Rate of Mortality per 1,000. | Complete Expectation of Life. | |
| 0 | 100,000 | 38.50 | 65.433 |
| 1 | 96,150 | 6.13 | 67.033 |
| 2 | 95,561 | 4.20 | 66.443 |
| 3 | 95,160 | 2.80 | 65.721 |
| 4 | 94,894 | 2.27 | 64.904 |
| 5 | 94,679 | 1.89 | 64.050 |
| 10 | 93,999 | 1.12 | 59.497 |
| 15 | 93,408 | 1.61 | 54.857 |
| 20 | 92,509 | 2.44 | 50.364 |
| 25 | 91,245 | 3.16 | 46.026 |
| 30 | 89,728 | 3.55 | 41.761 |
| 35 | 88,090 | 3.91 | 37.491 |
| 40 | 86,277 | 4.60 | 33.225 |
| 45 | 84,118 | 5.87 | 29.011 |
| 50 | 81,338 | 8.24 | 24.913 |
| 55 | 77,531 | 11.63 | 21.008 |
| 60 | 72,495 | 16.13 | 17.286 |
| 65 | 65,887 | 24.20 | 13.757 |
| 70 | 56,644 | 40.28 | 10.570 |
| 75 | 43,779 | 67.70 | 7.909 |
| 80 | 28,581 | 103.25 | 5.780 |
| 85 | 14,719 | 165.50 | 3.931 |
| 90 | 4,639 | 276.64 | 2.524 |
| 95 | 577 | 445.84 | 1.557 |
| 100 | 12 | 683.61 | 0.917 |
| AUSTRALIA, 1920–22. | ||
|---|---|---|
| Number Living. | Rate of Mortality per 1,000. | Complete Expectation of Life. |
| 100,000 | 55.68 | 63.311 |
| 94,432 | 12.51 | 66.030 |
| 93,251 | 5.23 | 65.862 |
| 92,763 | 3.67 | 65.206 |
| 92,423 | 2.98 | 64.444 |
| 92,148 | 2.40 | 63.635 |
| 91,314 | 1.27 | 59.196 |
| 90,753 | 1.44 | 54.546 |
| 89,906 | 2.52 | 50.034 |
| 88,640 | 3.27 | 45.712 |
| 87,086 | 3.87 | 41.482 |
| 85,330 | 4.50 | 37.283 |
| 83,279 | 5.24 | 33.138 |
| 81,024 | 6.06 | 28.990 |
| 78,313 | 8.08 | 24.903 |
| 74,793 | 11.03 | 20.952 |
| 70,150 | 15.71 | 17.166 |
| 63,857 | 24.26 | 13.597 |
| 54,771 | 40.90 | 10.412 |
| 42,214 | 68.20 | 7.733 |
| 27,170 | 112.30 | 5.611 |
| 13,118 | 172.00 | 4.056 |
| 4,238 | 251.00 | 2.911 |
| 774 | 347.00 | 2.072 |
| 62 | 501.00 | 1.240 |
The foregoing tables tell their own story, and at once show the superiority of New Zealand mortality. Reference to Mr. Traversi's report will enable comparisons with other tables to be made (including the English Life Tables No. 8, which were constructed upon the principles mentioned in this paper). The Australian figures given in that report are based upon a preliminary graduation, but the differences between them and the official figures are immaterial. In the following paragraph I endeavour to measure the relative mortality of the two countries.
22. Dealing first with the male ages 5–99, I multiplied the population existing at the New Zealand census of 1921 by the values of m computed from both the New Zealand and Australian tables. The total annual deaths thus obtained were 5,065 and 5,718 respectively, showing that if the population of New Zealand had been subject during the years 1921 and 1922 to the Australian rates of mortality shown (strictly, these are six months older than the New Zealand rates, but for the purposes in hand the effect of this distinction is slight), the combined mortality would have been 12.9 per cent. heavier than it actually was. It may be objected than the result is based upon a specific distribution of population, and so I also applied the same values of m to the population recorded at the Australian census of 1921. The total annual deaths were 20,745 and 23,510 respectively, giving an excess mortality of 13.3 per cent.
At the same ages the females showed an excess mortality of only 2.9 per cent. of the New Zealand mortality if distributed according to the New Zealand census (annual deaths of 3,885 and 3,998), and of 2.5 per cent. if distributed according to the Australian census (annual deaths of 17,364 and 17,801).
The same New Zealand population was now multiplied by the values of m computed from the 1906–10 table (see the report), and the results were as follows:—
| Ages. | Annual Deaths (1906–10 Mortality). | Annual Deaths (1921–22 Mortality). | Percentage Reduction. |
|---|---|---|---|
| 5 to 14 | 227 | 215 | 5.3 |
| 15 to 29 | 478 | 386 | 19.2 |
| 30 to 49 | 1,170 | 1,024 | 12.5 |
| 50 to 74 | 2,265 | 2,053 | 9.4 |
| 15 and over | 1,444 | 1,387 | 3.9 |
| 5 to 99 | 5,584 | 5,065 | 9.3 |
This reduction of 9.3 per cent. may be taken to apply to the interval 30th Juno. 1908, to 31st December, 1921, or a period of 13 ½ years, giving an annual rate of reduction of 0.72 per cent.
The female figures were:—
| Ages. | Annual Deaths (1906–10 Mortality). | Annual Deaths (1921–22 Mortality). | Percentage Reduction. |
|---|---|---|---|
| 5 to 14 | 206 | 167 | 18.9 |
| 15 to 29 | 503 | 401 | 20.3 |
| 30 to 49 | 1,000 | 803 | 19.7 |
| 50 to 74 | 1,608 | 1,474 | 8.3 |
| 75 and over | 1,055 | 1,040 | 1.4 |
| 5 to 99 | 4,372 | 3,885 | 11.1 |
Annual rate of reduction, 0.87 per cent.
Corresponding Australian results obtained by operating on the Australian census of 1921 were:—
| Ages. | MALES. | FEMALES. | ||||
|---|---|---|---|---|---|---|
| Annual Deaths (1901–10 Mortality). | Annual Deaths (1920–22 Mortality). | Percentage Reduction. | Annual Deaths (1901–10 Mortality). | Annual Deaths (1920–22 Mortality). | Percentage Reduction. | |
| 5 to 14 | 1,185 | 1,024 | 13.6 | 1,050 | 857 | 18.4 |
| 15 to 29 | 2,670 | 2,044 | 23.4 | 2,572 | 1,917 | 25.5 |
| 30 to 49 | 5,939 | 4,565 | 23.1 | 4,854 | 3,614 | 25.5 |
| 50 to 74 | 12,420 | 10,958 | 11.8 | 8,223 | 6,893 | 16.2 |
| 75 and over | 5,160 | 4,919 | 4.7 | 4,601 | 4,520 | 1.8 |
| 5 to 99 | 27,374 | 23,510 | 141 | 21,300 | 17,801 | 16.4 |
Annual rate of reduction: Males, 0.98 per cent.; females, 1.15 per cent.
In connection with the Australian results, I should mention here that the values of m applicable to the 1901–10 table were not taken from the published volume. The values recorded therein are based upon the assumption that L is a third degree function of l instead of the more usual assumption of a linear function. The differences arising from this fact would be trifling, but in order to keep the calculations consistent I have used specially computed values of m from the usual approximation and applied them to obtain the expected deaths by the 1901–10 table.
The several results may be more intelligibly apprehended by saying that, if the annual rates of reduction as ascertained were to remain uniform, the male mortality would be reduced by one-half in New Zealand in 96 years, but in Australia in only 71 years; and that the female mortality would be similarly reduced in New Zealand in 79 years, but in Australia in only 60 years.
These figures, which are based upon the assumption that the age-distributions of the respective populations are not characteristically changing, give a fairly adequate idea of the relative improvements in mortality which are taking place in the two countries. The method of comparison is, in fact, an extension of the principle underlying the computation of the so-called “index of mortality,” or, as it is called by the Registrar-General of England and Wales, the “rate in standard population.” Thus, although, as far as these ages are concerned, New Zealand is at present the healthier country, her salubrity is not improving so rapidly as Australia's, according to the teachings of the past.
The results at the infantile ages 0–4 show wide and indeed remarkable differences; but before presenting them I would like to say that the populations at these ages were not taken from the census enumerations, but were estimated from the statistics of births and deaths. (This means that at the ages mentioned the population of New Zealand was taken as at the 31st December, 1921, and the population of Australia was taken as at the 30th June, 1921.) Consequently, throughout the following calculations the ungraduated central rates of mortality deduced from such populations have been employed so as to render the various results properly comparable. For the central rates belonging to the Australian experience of 1901–10 I obtained assistance from the volume. “Census of the Commonwealth of Australia, 1911,” but, for age 0, had to assume that the proportion of deaths under 1 year of age during the first six months of life was the same as that deduced from the 1920–22 experience, because the statistics of deaths were not immediately available in sufficient detail.
If, now, the New Zealand populations aged 0–4 had been subject during the years 1921 and 1922 to the Australian mortality-rates of 1920–22 there would have been 1,447 male deaths per annum instead of 972, and 1,107 female deaths per annum instead of 744, giving excess mortality percentages of 49.0 and 48.9 respectively. These results are almost exactly reproduced when the Australian populations are operated upon instead. The other figures are as follows:—
| AGES 0 TO 4. | ||||||
|---|---|---|---|---|---|---|
| — | NEW ZEALAND. | AUSTRALIA. | ||||
| Annual Deaths (1906–10 Mortality). | Annual Deaths (1921–22 Mortality). | Percentage Reduction. | Annual Deaths (1901–10 Mortality). | Annual Deaths (1920–22 Mortality). | Percentage Reduction. | |
| Males | 1,481 | 972 | 34.4 | 8,653 | 6,635 | 23.3 |
| Females | 1,163 | 744 | 361 | 7,059 | 5,058 | 28.3 |
Annual rate of reduction:— New Zealand—Males, 3.07 per cent.; females, 3.26 per cent.: Australia—Males, 1.70 per cent.; females, 2.13 per cent.
On the basis of such annual rates of reduction the mortality of New Zealand would be reduced at these ages by one-half in twenty-two and twenty-one years respectively; but forty-one and thirty-two years respectively would pass before a similar reduction was felt in Australia.
The superiority of New Zealand figures at these infantile ages is very striking. For what is reputed to be the lowest infantile-death rate in the world, the Royal New Zealand Society for the Health of Women and Children (Plunket Society) claims the right of achievement. This society, whoso activities are chiefly voluntary in character, supported by subsidy from the Dominion Government, was founded in the year 1907 (at the beginning of the intercensal period 1906–10, which has been chosen throughout the calculations), and, under the skilful guidance of Sir Truby King, has carried out most remarkable welfare work. It may be suggested that perhaps the salubrious climate, advances in public sanitation, and other factors have conduced to the production of these unique figures. It is significant, however, that since the year of the society's foundation there has been an unmistakable deflection of the previously existent infantile-mortality curve, and without doubt the society's claims are largely vindicable.
Looking at the results as a whole, it will be found that, for males as well as females, the percentage reductions in mortality throughout the various groups have been roughly following curves of the form of the letter S in the recumbent position, in both countries. Thus we see that the improvement in mortality as applied to age is subject to periodicities. New Zealand rates of mortality are throughout superior to those of Australia, and, although the rate of improvement is also superior at the infantile ages, the tendency is not maintained when we come to consider the older ages in general, and the male group 5–14 in particular. I hesitate to draw any conclusion from that deduction of the past, but it is sufficient to show that the future relative trends of mortality in the two countries should indeed provide an interesting study, and it will then be more legitimate to interpret whether any special influence is exerted on the mortality of the older ages by phenomenally large reductions in infantile mortality, such as has taken place in New Zealand during the last eighteen years or so.
23. In conclusion, I sincerely desire to acknowledge the kindness of Mr. Malcolm Fraser, O.B.E., the New Zealand Government Statistician, in affording me facilities for obtaining the various data. I also tender my warmest thanks to Mr. S. Beckingsale and Mr. A. W. Bowden, members of the Institute of Actuaries, for their very willing and capable assistance in the heavy work of calculation involved in the preparation of this paper.
JOHANNES C. ANDERSEN.
[The following paper, which represents the results of an investigation into the true history of the events in connection with the settlement of Akaroa, was read before the Historical Section of the Wellington Philosophical Society on the 20th May, 1919. The paper is here reprinted from volume 52 of the “Transactions of the New Zealand Institute.”]
THE British Government, though constantly urged by the New Zealand Company, bad persistently refused to recognize New Zealand as a British colony, or even as a possession of the Kingdom. The Company, therefore, in order to force the hand of the Government, despatched the “Tory” for Port Nicholson (afterwards named Wellington) on the 12th May, 1839, for the purpose of purchasing land from the Natives and forming a settlement, the first colonists to follow almost at once. This forced the Government into unwilling action, and an Imperial Proclamation was issued on the 15th June, 1839, extending the boundaries of New South Wales so as to include portions of New Zealand; and on the 13th July of the same year Captain Hobson was appointed Lieutenant-Governor “of any territory which is or may be acquired in sovereignty by Her Majesty in New Zealand.” Among other instructions issued to Captain Hobson by Lord Normanby was one to the effect that he should endeavour to persuade the chiefs of New Zealand to unite themselves to Great Britain; he was also to establish a settled form of civil government, with the free and intelligent consent of the Natives expressed according to their established usages; to treat for the recognition of the sovereignty of Her Majesty over the whole or any part of the Islands; to induce the chiefs to contract that no lands should in future be sold except to the Crown; to announce by Proclamation that no valid title to land acquired from the Natives would thereafter be recognized unless confirmed by a Crown grant; to arrange a Commission of inquiry as to what lands had been lawfully acquired by British subjects and others; to select and appoint a Protector of Aborigines.
Captain Hobson left in the “Druid” for Port Jackson, where he arrived on the 24th December, 1839. On the 14th January, 1840, Sir George Gipps, Governor of New South Wales, administered the oaths to Captain Hobson, making him Lieutenant Governor of New Zealand. He also, in accordance with the instructions of Lord Normanby, issued three Proclamations—the first extending the boundaries of New South Wales to include any territory which then was, or might thereafter be, acquired in sovereignty by Her Majesty in New Zealand; the second appointing Captain Hobson Lieutenant-Governor; the third declaring that all purchases of land from the Natives thereafter would be invalid unless supported by a Crown grant.
The new Lieutenant - Governor arrived in the Bay of Islands on the 29th January, 1840, where he next day read his commissions before the people assembled. As a first step towards establishing the sovereignty of Her Majesty he called together the Natives, and on the 5th February, 1840, were commenced the negotiations which, on the following day, resulted in the Treaty of Waitangi being signed by forty-six principal chiefs. Others signed it, or authorized copies of it, in various parts of the Islands at later dates, the aggregate number of signatures obtained being 512. Being attacked by paralysis, the Lieutenant - Governor was disabled from travelling to obtain the signatures personally, and he deputed Major Bunbury to visit parts of the North Island, and also the Middle and Stewart Islands, for that purpose. Major Bunbury sailed in H.M.S. “Herald,” with instructions, dated 25th April, 1840, to obtain signatures at all places possible, and to visit such places as he might deem most desirable for establishing Her Majesty's authority.
In reporting the results of his mission Major Bunbury stated that he had, on the 5th June, 1840, proclaimed the Queen's authority, by right of discovery—no Natives being there met with—at Southern Port (Stewart Island); and at Cloudy Bay (Middle Island) on the 17th June, the sovereignty at this place having been ceded by the principal chiefs signing the treaty.
Writing on the 25th May, 1840, to the Secretary of State for the Colonies, Lieutenant-Governor Hobson concluded his despatch by saying that without waiting for Major Bunbury's report he had, on the 21st May, 1840, proclaimed the sovereignty of Her Majesty, owing to affairs at Port Nicholson pressing him so to do, over the North Island in accordance with the consents given by the Natives in the treaty, and over the southern islands by right of discovery. This despatch was acknowledged and approved by Lord John Russell, and the Proclamations making the islands subject to Her Majesty were inserted in the London Gazette. New Zealand was at the time promised a charter of separate government, which charter was sent on the 9th December, 1840, Lest, however, the proclamation of sovereignty over the Middle Island “by virtue of discovery” should be considered either insufficient or illegal, the Queen's authority was again proclaimed over it by Major Bunbury on the 17th June, 1840, by virtue of the Treaty of Waitangi. This same proclamation was also made at Cloudy Bay, and Captain Nias, of H.M.S. “Herald,” landed with a party of marines to honour the occasion, twenty-one guns being fired from the ship.
Sir George Gipps, writing to Lord John Russell on the 24th July, 1840, reported that Major Bunbury appeared to have carried out his instructions very satisfactorily. He says, inter alia, “One of the places visited by the ‘Herald' was Banks Peninsula, the spot at which it has been said that a settlement is about to be made by a company formed in France. Of this company, however, and of its proceedings I know nothing, save what I have derived from English newspapers.” The French discovery-ships “Astrolabe” and “Zélée” were at Banks Peninsula in April, 1840; they knew of no project for forming a settlement there, and, indeed, thought the locality a disadvantageous and undesirable one for such a purpose.
Strong feeling had been excited in France by the publication in London of the instructions to Captain Hobson when he was sent out as Lieutenant-Governor to New Zealand. The French Press teemed with calls on their Government to take steps similar to those the British Government proposed to adopt, and to take a share in the colonizing of New Zealand, as a country open to all nations. Mr. E. Gibbon Wakefield, giving evidence on the 17th July, 1840, before the Select Committee on New Zealand affairs, stated that he had received as many as forty different French newspapers containing comments on Captain Hobson's instructions. The French Chamber of Commerce also petitioned the Government, and from all this excitement sprang a project for sending French colonists and establishing a French colony in New Zealand. Matters connected with this project were conducted by a company calling itself the Nanto-Bordelaise Company. A certain Captain Langlois had, on the 2nd August, 1838, made a provisional purchase from Tuaanau and other Natives of the greater part of Banks Peninsula, paying a deposit in commodities valued at £6, further commodities to the value of £234 to be paid at a later period. They were so paid, but not until the arrival of the French colonists in August, 1840. Consequently, owing to the Proclamation of Governor Gipps above referred to, the purchase was, strictly speaking, illegal, and need not have been recognized by the Crown at all. Captain Langlois sold part of his interest to the Nanto-Bordelaise Company, and on the 9th March, 1840, sixty-three emigrants left Rochefort in the “Comte de Paris,” an old man-of-war given by the French Government for the purpose.
Another man-of-war, the “Aube,” under Captain Lavaud, was sent as escort, and also to take possession for the French Government and protect the colonists on their arrival. The captain, in order to consult the Roman Catholic bishop resident there, sailed for the Bay of Islands, arriving on the 11th July, 1840. Certain proceedings took place subsequently to his arrival, which have given rise to the romantic account of the “taking possession” at Akaroa. It is said that the captain in an unguarded moment revealed the object of his presence in New Zealand waters, whereupon the “Britomart” was secretly despatched to forestall the French by taking possession of the South Island at Akaroa. Lavaud was obliged to make some mention of his mission in order to explain his presence in the bay, and was placed in an extremely awkward position when he was told that the whole of New Zealand, including the South Island, had been proclaimed a possession of the British Crown. At the time he left France New Zealand was still a No Man's Land; and he had had two separate instructions—one to protect the French whaling industry in the southern waters, the other to prepare Akaroa for the reception of the emigrants by the “Comte de Paris,” part of such preparation being the annexation of Banks Peninsula or further territories on behalf of France. He knew nothing even of the appointment of Hobson as Lieutenant-Governor, and he was at first disposed to refuse recognition of his authority.
Hobson appreciated his difficulty; and in order partly to safeguard such British interests in the peninsula as had been established, partly to convince the French that the territory was undoubtedly regarded as British, he despatched Captain Stanley with two Magistrates to hold Courts at Akaroa and other places on the peninsula. The following is a copy of the instructions to Stanley: they are printed in part in Rusden's “History of New Zealand,” though not in the printed collections of official documents:—
Government House, Russell,
SIR,—
Bay of Islands, 22nd July, 1840.
It being of the utmost importance that the authority of Her Majesty should be most unequivocally exercised throughout the remote parts of this colony, and more particularly in the Southern and Middle Islands, where, I understand, foreign influence and even interference is to be apprehended, I have the honour to request you to proceed immediately in H.M. sloop, under your command, to those islands.
On the subject of this commission I have to request the most inviolable secrecy from all except your immediate superior officers, to whom it may be your duty to report your proceedings.
The ostensible purpose of your cruise may appear to be the conveyance of two Magistrates to Port Nicholson, to whom I will elsewhere more particularly refer. The real object to which I wish particularly to call your attention is to defeat the movements of any foreign ship-of-war that may be engaged in establishing a settlement in any part of the coast of New Zealand.
There are various rumours current that Captain Lavaud, of the French corvette “L'Aube,” now at anchor in this port, is employed in the furtherance of designs such as I have before mentioned. From some observations that fell from him, I discovered that his intention was to proceed to the southern islands, being under the impression that the land about Akaroa and Banks Peninsula, in the Middle Island, is the property of a French subject. These circumstances, combined with the tone in which Captain Lavaud alluded to Akaroa and Banks Peninsula, excited in my mind a strong presumption that he is charged with some mission in that quarter incompatible with the sovereign rights of Her Britannic Majesty, and which, as I have before observed, it will be your study by every means to frustrate.
If my suspicions prove correct, “L'Aube” will no doubt proceed direct to Akaroa and Banks Peninsula, for which place I have earnestly to request that you will at once depart with the utmost expedition, as it would be a point of the utmost consideration that, on his arrival at that port, He may find you in occupation, so that it will be out of his power to dislodge you without committing some direct act of hostility.
Captain Lavaud may, however, anticipate you at Akaroa, or (should he be defeated in his movements) may endeavour to establish himself at some other point. In the event of either contingency occurring, I have to request you will remonstrate and protest in the most decided manner against such proceeding, and impress upon him that such interference must be considered as an act of decided hostile invasion.
You will perceive by the enclosed copy of Major Bunbury's declaration that, independent of the assumption of the sovereignty of the Middle and Southern Islands, as announced by my Proclamation of the 21st May last (a copy of which is also enclosed), the principal chiefs have ceded their rights to Her Majesty through that officer, who was fully authorized to treat with thorn for that purpose; it will not, therefore, be necessary for you to adopt any further proceedings. It will, however, be advisable that some act of civil authority should be exorcised on the islands, and for that purpose the Magistrates who accompany you will be instructed to hold a Court on their arrival at each port, and to have a record of their proceedings registered and transmitted to me.
You will by every opportunity which may offer forward intelligence of the French squadron's movements, and should you deem it necessary, to the Secretary of State for the Colonies through the Admiralty, and to His Excellency Sir George Gipps, Governor of New South Wales.
Mr. Murphy and Mr. Robinson, the Magistrates who accompany you. will receive a memorandum of instructions for their future guidance, which you will be pleased to hand to them when you arrive at your destination.
As your presence in these islands will be of the utmost importance to keep in check any aggression on the part of foreign Powers, I have earnestly to request that, should you require any further supply of provisions, the same may be procured, if possible, at Port Nicholson, or at any of the ports on the coast, without returning to Sydney.
I have the honour to be, Sir,
Your most obedient servant.
W. HOBSON.
The instructions to the Magistrates are not copied by Rusden; they and the above were, however, discovered in the Public Records Office in London by Mr. Guy H. Scholefield, London, correspondent of the Press. The instructions were addressed to Mr. Murphy, whose name appears first in Stanley's instructions, he, not Robinson, being apparently the senior officer. They were as follows:—
You will, at every port that H.M. sloop “Britomart” touches at, act. in your magisterial capacity, and, as it is requisite that the civil authority should be strictly exercised, should no case be brought under your notice, you will adjourn from day to day, and a careful record of your proceedings be registered, a copy of which you will transmit to me.
Under any circumstances that Captain Stanley may call upon you for assistance you will, of course, render it, and co-operate generally with him in the advancement of any measures he may think it expedient to adopt.
Dated at Russell, 21st July, 1840.
The following is a copy of Captain Stanley's report, dated 17th September, 1840:—
I have the honour to inform Your Excellency that I proceeded in Her Majesty's sloop under my command to the port of Akaroa, in Banks Peninsula, where I arrived on August 10th after a very stormy passage, during which the stern boat was washed away and one of the quarter-boats stove. The French frigate “L'Aube” had not arrived when I anchored, nor had any French emigrants been landed. August 11th I landed, accompanied by Messrs. Murphy and Robinson, Police Magistrates, and visited the only two parts of the bay where there were houses; at both places a flag was hoisted, and a Court, of which notice had been given the day before, held by the Magistrates. Having received information that there were three whaling-stations on the southern side of the peninsula, the exposed positions of which afforded no anchorage for the “Britomart,” I sent Messrs. Murphy and Robinson to visit them in a whale-boat. At each station the flag was hoisted and a Court held. On August 15th the French frigate “L'Aube” arrived, having been four days off the point. On August 16th the French whaler “Comte de Paris,” having on board fifty - seven French emigrants, arrived. With the exception of M. Belligni, from the Jardin des Plantes, who is sent to look after the emigrants, and who is a good botanist and mineralogist, the emigrants are all of the lower order, and include carpenters, gardeners, stonemasons, labourers, a baker, a miner—in all thirty men, eleven women, and the rest children. Captain Lavaud, on the arrival of the French emigrants, assured me on his word of honour that he would observe strict neutrality between the English residents and the emigrants, and should any difference arise he would settle matters impartially. Captain Lavaud also informed me that, as the “Comte de Paris” has to proceed to sea, whaling, he would cause the emigrants to be landed on some unoccupied part of the bay, where he pledged himself they would do nothing which would be considered hostile to the Government, and that until fresh instructions were received from our respective Governments the emigrants would merely build themselves houses for shelter and clear away what little land they might require for gardens. Upon visiting the “Comte de Paris” I found she had on board, besides agricultural tools for the settlers, six long 24-pounders, mounted on field carriages. I immediately called on Captain Lavaud to protest against the guns being landed. Captain Lavaud assured me that he had been much surprised at finding guns had been sent out in the “Comte de Paris,” but that he had already given the most positive orders that they should not be landed. On August 19th. the French emigrants having been landed in a sheltered well-chosen part of the bay, where they could not interfere With any one, I handed over to Messrs. Murphy and Robinson the instructions entrusted to me by Your Excellency to meet such a contingency. Mr. Robinson, finding that he could engage three or four Englishmen as constables, and having been enabled, through the kindness of Captain Lavaud, to purchase a boat from the French whaler, decided upon remaining. Captain Lavaud expressed much satisfaction when I informed him Mr. Robinson was to remain, and immediately offered him the use of his cabin and table so long as the “Aube” remained at Akaroa. Mr. Robinson accepted Captain Lavaud's offer until he could establish himself on shore. On August 27th I sailed from Akaroa to Pigeon Bay, where, finding no inhabitants, I merely remained long enough to survey the harbour, which, though narrow and exposed to the westward, is well sheltered from every other wind, and is much frequented by whalers, who procure a great number of pigeons. From Pigeon Bay I went to Port Cooper, where Mr. Murphy held a Court. Several chiefs were present, and seemed to understand and appreciate Mr. Murphy's proceedings in one or two cases that came before him. Between Port Cooper and Cloudy Bay I could hoar of no anchorage whatever from the whalers who frequented the coast. I arrived at Port Nicholson on September 2nd, embarked Messrs. Shortland and Smart, and sailed for the Bay of Islands on September 16th. I have the honour to enclose herewith such information as I was enabled to procure during my stay at Banks Peninsula, and also plans of the harbours.
One enclosure is an interesting table of ports and whaling-stations in the peninsula visited by Captain Stanley, but as it does not bear on the subject it is not copied; from it is gathered, however, that the European population at the time of I Captain Stanley's visit numbered over eighty.
It will be observed that no note whatever is made of “taking possession.” The log of the “Britomart” is equally reticent. A copy of the log was obtained by Mr. Guy H. Scholefield in London, and from it the following particulars are gathered. The sloop-of-war “Britomart,” Captain Stanley, left Sydney on the 17th June, 1840, and came to anchor at Kororareka, or Bay of Islands, on the afternoon of the 2nd July, H.M.S. “Herald” having worked into the bay just ahead of her. She lay in the bay for nine days, “cutting brooms,” watering, &c., until on Saturday, the 11th July, “arrived the French ship of war ‘L'Aube,’ and revenue cutter ‘Ranger,’ with the Governor. Saluted the French flag with twenty-one guns.” Routine work went on as before, but on the 22nd the company of the “Britomart” was employed making preparations for sea. The log of the following day, commencing at midnight on the 22nd, is interesting: “2 a.m. received on board per order of His Excellency Lieutenant-Governor Hobson, Mr. Murphy and Mr. Robinson, Magistrates; 8, loosed sail, short'd in cable; 11, weighed and made sail. Working out of Kororareka Harbour; tacked occasionally.” The vessel was busy all the afternoon working out of the Bay of Islands, and at daylight on the 24th Cape Brett lay on the lee bow distant ten or twelve miles. The passage to Akaroa was a thoroughly bad one, and the ship suffered considerably from the knocking-about she received. At midday on the 25th, the first day out, the vessel was off the Great Barrier. The following morning the fore topmast was found to be chafed through, and in the afternoon the fore topsail was split. On the 27th much time was occupied in bending new sails; in the afternoon two ports were stove in by the heavy sea. Cape Wareka [? Whare-kahika] was 218 miles distant at noon on the 28th. On the 29th and 30th there was a heavy head swell, which made the 120 miles to East Cape a good deal more. However, the wind veered round, and the “Britomart” rounded East Cape before midnight on the 31st. In the afternoon the hold had 14 in. of water, and thereafter the pumps were going almost continuously. On the 2nd August “Akoroa” was 306 miles distant, and there were 17 in. and 18 in. of water in the hold through the afternoon. At 2 o'clock on the morning of the 3rd a sea was shipped which stove in the lee quarter-beat and washed away a port. The ship was twelve miles farther from her destination at noon on the 4th than on the previous day. Again, in the early morning of the 5th, a sea stove in a weather port. Land was seen on the port bow at 10 a.m. on the 6th; it was somewhere near Flat Point, or Te Awaite, in the North Island. In the afternoon the sea split the fore topmast-staysail. Next day the weather moderated, and sea-water was pumped into the empty tanks. Land showed on the lee bow at 7 in the evening, and next morning, the 8th, Cape Palliser was four or five leagues distant. On the morning of the 9th, Sunday, the crew were mustered and the Articles of War were read. This was a proceeding of quite a routine nature. There was land on the beam, and a run of eighty-three miles to Akaroa. This is the narrative of the 10th: “4 a.m. bore up for the land; 12.30 calm, with a heavy swell; out sweeps and swept ship; 1.30 a breeze from the nor'ward; in sweeps trimmed and swept into the harbour; 4.30 shortened sail and came to with S.B. in 6 ¾ fathoms; furled sails, &c.” At daylight on the 11th the boats were out and the ship was made snug. There is no reference to any incident outside the ordinary routine of the ship. On the 12th the boats were sent out to survey and cut wood, and they were so employed for the next few days, completing on Friday, 14th. On the following day, 15th August: “5 p.m., sent boats to assist towing the French ship-of-war ‘L'Aube; 8, anchored do.” Sunday was marked with the usual Divine service. On Monday, 17th: “—p.m., arrived the French ship (merchant) ‘Count de Paris,’ with emigrants. Lent the cutter with a party to haul the seine.” There is nothing but routine entries until the 22nd, when the company was employed making preparations for sea. The “Britomart” ran down the harbour on the 26th and came near the entrance, when she spoke the British merchant ship “Speculator,” just arrived. Sails were loosed on the 27th, and further preparations made for sea. At 8 a.m. Captain Stanley “discharged Mr. C. B. Robinson, Police Magistrate,” and at 9 made sail down the harbour, coming to at the anchorage. Putting to sea the following day, the “Britomart” spoke the schooner “Success,” of Sydney, from Port Cooper, and another sail. On the 29th she shaped her course for Pigeon Bay. where she came to and sent a boat to survey and get water. On the 30th she sailed for Port Cooper (now Lyttelton Harbour) and anchored there. On the 1st September the “Britomart” was again under sail, and a cable was passed to the merchant ship “Africane,” but in getting under way in the squally wind the hawser parted, and the “Britomart” touched bottom. She made a good passage to Cape Palliser, which was in sight at daylight on the 2nd. and in the afternoon she was working up to Port Nicholson, where she anchored at 5 p.m.
Lieutenant-Governor Hobson sent a copy of Captain Stanley's report to Governor Sir George Gipps, saying, “I transmit a copy of Captain Stanley's report of his proceedings while at Akaroa. The measures he adopted with the French emigrants are, I think, extremely judicious, and the whole of his conduct evinces a degree of zeal and intelligence which, I trust, you will consider worthy of the notice of Her Majesty's Government.” There is no note of “forestalling” the French; and the first apparent note of anything that might be construed into pleasure at such forestalling is found in Governor Gipps's despatch to Lord John Russell: “I have already transmitted to your Lordship copies of the instructions which have been given to Captain Stanley, of H.M.S. ‘Britomart,” by the Lieutenant-Governor of New Zealand.. I have now the satisfaction to inform your Lordship that Captain Stanley preceded the French. . .”
Even in the French Chamber of Deputies the position seemed to have been clearly perceived; for later, on the 29th May, 1844, the following remarks were made in that chamber by M. Guizot, Minister of Foreign Affairs: “There are two Proclamations—one on the 21st May, the other on the 17th June. Both are anterior to the arrival of Captain Lavaud, of the ‘Aube.’ Of these I have carefully read only that of June 17th, relative to the taking possession of the southern Island. Here is the English text—I translate literally: ‘Taken possession, in the name of Her Most Gracious Majesty the Queen of the United Kingdoms of Great Britain and Ireland, of the southern Island of New Zealand. This island, situated in [here follows latitude and longitude], with all its woods, rivers, ports, and territory, having been ceded in sovereignty by different independent chiefs to Her Most Gracious Majesty, we have taken solemn possession of it, &c.”
There was a diary in existence, and may still be, though its whereabouts is not known — the diary of C. B. Robinson, one of the Magistrates sent with Stanley. Thanks to the foresight of the late Mr. S. C. Farr, of Christchurch, important extracts from it are printed in “Canterbury Old and New,” as follows:—
August 3rd, 1840. Appointed by Captain William Hobson, Lieutenant-Governor of New Zealand, with all necessary instructions and a Proclamation signed “William Hobson,” and dated August 3rd, 1840, at Government House, Russell, Bay of Islands. Also signed by Willoughby Shortland, Colonial Secretary. Instructions were: “To proceed with all despatch in H.M.S. (brig) ‘Britomart,’ Captain Owen Stanley, R.N.. Commander, to Akaroa, Banks Peninsula, and hoist the Union Jack, which will be given to you, on a spur jutting out a little more than half-way up the harbour, on the east side, and marked in red on the map you take with you.”
Here followed the Proclamation, which was not copied. The diary continued:—
“We sailed that evening with a fair, strong wind; a good passage was made, and we anchored in Akaroa Bay on the morning of August 11th. We at once proceeded to make preparations for the formal ceremony. A log of wood, old and dry, was procured from the bush by some of the crew, and was hewn by the carpenter eight inches square. A hole was dug in the ground at the spot selected, the post put in, and the earth well rammed down round it. A spar had been brought from the vessel, rigged with pulley and halyard for hoisting the flag; this was lashed to the post, and everything made ready by 5 p.m. on August 15th. The next morning, at 12 o'clock noon, I, Charles Barrington Robinson, deputed by the Acting-Governor, hoisted the Union Jack in the name of Her Majesty the Queen Victoria, and in the presence of Captain Stanley, his officers, some of the crew, about a dozen Natives (Maoris), and the only Englishman then in the Bay, Mr. Green, with his family. There was no demonstration other than my reading the Proclamation, three cheers for Her Majesty, and the National Anthem.”
The next note made was: “August 18th. The French man-of-war ‘Aube,’ Captain Lavaud, arrived in the bay.”
Now compare these statements with the log of the “Britomart.” The Proclamation signed “William Hobson” was, it is said, dated 3rd August. On that date the “Britomart” was actually being buffeted at sea, south of East Cape, and somewhat over three hundred miles from Akaroa! Mr. Robinson says, “We sailed that evening [August 3rd]. a good passage was made and we anchored on the morning of August 11th.’” The log shows they sailed on the morning of the 22nd July, and made anything but a good passage, anchoring in Akaroa at 4.30 p.m. on the 10th August. Mr. Robinson says he hoisted the flag at noon on the 16th, and the “Aube” appeared on the 18th August; the log shows that the “Aube” came to anchor on Saturday, 15th August. Again, the report of Captain Stanley shows that the flag was hoisted and a Court held at two places in the bay on the 11th August, and at three other bays where there were whaling-stations during the succeeding days, so that during the time Mr. Robinson says they were busy preparing the pole, &c., the report shows that he and Mr. Murphy were visiting the whaling-stations in a whaleboat.
These discrepancies are extraordinary, and cannot but give colour to a suggestion already made in the voluminous newspaper correspondence on the subject—that the diary was not begun until some time after the event, and then written up from memory, or from faulty notes.
On the late Dr. R. McNab visiting England towards the end of 1909 the writer of this paper wrote to him in December of that year, urging him to secure, if possible, logs of the “Aube”" and “Comte de Paris,” also the instructions to Captain Lavaud, and Lavaud's despatches to his Government. The writer had already sent him a précis of what had been gathered by him up till that date, and Dr. McNab was successful in obtaining copies of a great deal of matter—so much that he intended making it the subject of a book. This his lamented death unfortunately prevented.
The following are translated extracts from a letter written by Lavaud to the Minister of Marine, at the Bay of Islands, on the 19th June, 1840:—
On the 29th of June I sailed round Van Diemen's Land; at that time there was a S.E. wind shifting to the east—a fine breeze but contrary to the course to be travelled to get to the south of New Zealand: I decided to sail into the Bay of Islands, where I hoped to see the Bishop of Maronae Your Excellency was kind enough to allow me the latitude to change this part of my course, and I sailed to the north, directing the “Aube” to the Three Kings Islands, the first land I caught sight of since the 25th of March, and it was on the 8th of this month at 1 o'clock in the morning. On the 9th I recognized the Cape Maria van Diemen. I left the North Cape the same day at night, and on the 10th, in the morning, I was at the entrance of the Bay of Islands, which I could only reach in the night on account of the calm and the strong land breezes which did not permit me to go ahead. I met the vessel H.B.M. “Britomart.” The Captain came to see me as soon as I had cast anchor. We exchanged the usual salutes of politeness and remained very good friends. I immediately visited the Bishop. . . .
On my arrival I heard of the taking possession, in the name of the Queen of the United Kingdom of Great Britain and Ireland, of the three islands composing the group known under the name of New Zealand. The British flag flies two miles from the anchorage of Kororareka, on the River Karra-karra, on the site of Fort Russell-Town, the name of the town to be built there. A Lieutenant-Governor, Mr. Hobson, is established there with a large administrative staff and a garrison of 130 men, commanded by a field officer of the land forces, who has three other officers under his command. Three warships seem to be attached to the British colony. The corvette “Herald,” which belongs to them, recently made a voyage round all the islands where Englishmen are established, visiting the principal places. . . . Akaroa is at present also occupied by an Englishman, whose cattle graze there. The corvette “Herald” went there, and I heard that about two months ago, there, as well as everywhere where she found no Europeans, the declaration of British sovereignty had been written on a paper, enclosed in a bottle, and hidden in the earth. . . .
The property of Banks Peninsula has been constituted by a Mr. Clayton, who lives in the Bay of Islands, and who has heard from the whalers long ago that Mr. Langlois had acquired it; but as I thought, in such a state of affairs, I ought at present to conceal the mission I was charged with, this statement did not come to me in an official way.
The position has greatly changed since my departure from France; British jealousy has made great steps forward and is running fast. I shall avoid to compromise the Government of the King; I will act with great caution; but, on the other hand, so far away from Your Excellency, and ignoring what has happened between the two Governments, after France has been notified that the full sovereign power lies in the hands of “Her Majesty Queen Victoria, her heirs and successors,” as stated in the Proclamation dated the 21st of May—I repeat, so far away, I cannot deviate from the orders I carry, and, having above all to preserve the honour of my flag, I shall declare officially to the representative of Her Britannic Majesty on the island, Captain Hobson, that for the present I protest against any measure, coming from the British Government, which might result in infringing the French property duly acquired from the free and independent Natives, till the moment in which the Government of the King will be pleased to recognize. British sovereignty over these islands.
I fear that the “Comte de Paris,” which, according to what her captain wrote to me before I left France, has put into port at Senegal, at the Cape, at Hobart Town, and at the Bay of Islands, before returning to Akaroa, will keep us waiting for some time, which will be very regrettable. There ought to be more than one warship here, for I shall not be able to leave Akaroa when I get there, and yet I shall entirely ignore there what is happening around me. We must not conceal from ourselves that everybody here will try and hinder us, and I shall be all the more unprepared to avoid the pitfalls of our neighbours because I shall have no information from the outside. . . . I hope that the official news received in France the last few months will appear to Your Excellency to be of such a nature that fresh instructions will be sent me, and that perhaps also the sea fortes will be increased. . . .
I add my letter to Captain Hobson . . . who, as Your Excellency will see, refused to enter into explanations with me if I did not previously recognize his title as Governor of the Islands of New Zealand.. I tried to make him understand that I could not see why he should keep silent about the object of my letter [concerning properties acquired by the French in various parts of the Islands], having only as a reason that I did not recognize him as Governor of the Islands of New Zealand. I also pointed out to him that large French properties existed in the Islands, especially in the Middle Island, which we call in France the South Island, and that I could not admit the rights of sovereignty of a foreign Government over this property; but he very well explained to me that there was a distinction to be made here—that he did not contest the property of the French on the Islands; that the chiefs when selling had only sold the land, but not their authority, which they abdicated in favour of Britain; that only after this abdication the British sovereignty had been declared. Then I handed him a letter telling him that the contents would make him understand my last word. He read it with great attention, and told me that in my place he would have acted as I had done, and that he thought it was the surest way to avoid a conflict which might have had very unpleasant consequences for both Governments, in breaking out so far away. I insisted upon knowing if the contents of my letter had been well understood. He told me, Yes, that he understood the whole sense and the whole situation; that he would send a copy to the Governor-General at Sydney, who would take his orders from the Government of the Queen; and that in the meantime he would use his whole persuasive influence with this same Governor-General, so that the Committee should not be obliged to inquire about the validity of the French title-deeds until the two Governments had come to some arrangement. After that I added that I was going to the South; that several landowners and colonists were already established there, and others would go there to establish themselves; that the measures I claimed were to be extended to them also, and that there, too, they were to feel the protection of their Government, and consequently should be able to occupy the land, work on it, sow and reap without being worried. Mr. Langlois will take possession of Banks Peninsula and will give over to me the land which he is to transfer to the French Government, which will not appear in the matter, unless it were to judge that it ought not to give its adhesion to the sovereignty of Queen Victoria over the Islands of New Zealand, of which Banks Peninsula is a part; and in case that I were to receive orders to declare that this sovereignty was not recognized I should proclaim that of France over the peninsula. I say only Banks Peninsula because all the rest is invaded and occupied by the British. There is even a Magistrate at Cloudy Bay. Well, Minister, things are so advanced that it is too late to stop them, and being persuaded of this I wish to let the King's Government act freely without urging or compromising it in anything. The same motives have made me avoid placing myself in the position to be obliged to fire the first cannon-shot, the signal of war, knowing that if, on my departure from France, Your Excellency could have seen the position in which I find myself at present you would have sent me off with different instructions from those I have; you would not have let the “Comte de Paris” sail, and would not have loft me the choice of war or peace. . . .
Later, in July, Lavaud received information of other claims than that of Langlois to land on Banks Peninsula; and he writes to his Minister:—
. . . Your Excellency will sec that, as I had already heard, the ownership of Banks Peninsula has been partially or totally claimed by several people, who every one of them pretend to be the legitimate owners and to possess title-deeds. I have had the honour of mentioning to you, among others, Mr. Clayton, who lays claim only to a part. Further I may name to you the firm of Cooper and Levy, of Sydney, who, as well as Monsieur Langlois, claim the whole peninsula; they have already brought timber to close the isthmus of this peninsula, and the herd of oxen which is in the bay of Akaroa belongs to this firm. . . .
I shall concert with Monsieur Langlois to see what can be done; perhaps it would be suitable to come to some arrangement with the claimants, of whom at least two, Messrs. Clayton and Cooper, bought prior to him.
In any case we shall settle at Akaroa, awaiting your orders.
The Middle Island (Tawai-Ponamoo) is to-day, as I had the honour of telling you, nearly entirely in the possession of foreigners. We can no more think of acquiring from the Natives, who possess only the land reserved for their habitations and plantations; we could only buy from the British, but they are so numerous that I regard it as very difficult to proclaim the sovereignty of France there, as the company, according to all appearances, can actually only claim a part of this peninsula. Through negotiations, I believe it to be quite possible to make the. Britannic Cabinet disown Governor Hobson's first Proclamation, as he, in declaring the Queen's sovereignty, relies on a right of discovery which cannot be acknowledged by the nations.
It seems to me that it is impossible that this pretended right can be invoked to-day, so long after the discovery of these Islands by Captain Cook; besides, the right of discovery can only be exercised in uninhabited countries, but not in those where the land is trodden by those to whom it naturally belongs and ought to belong. The independence of the Middle Island, under the protectorate of France, would be, I believe, what would henceforth suit you the best. The freedom of the ports of this Island would lead to great commercial movement; which would strike a big blow at the colony of the North Island, soon to be subjected to Customs duties. Your Excellency will appreciate, from all that I have had the honour of communicating to you, the obstacles I have had to encounter and the delicate position in which I find myself. Nevertheless, in a conversation I had yesterday with Mr. Hobson, I thought fit to tell him that French colonists, landowners in the Middle Island, had just arrived, and that I was going there to protect them when they would take possession of their lands. His letter of the 23rd will perhaps lead me, if I find difficulties in Akaroa, to return to Sydney, when I have settled Monsieur Langlois, for I see that Mr. Hobson can or will not settle the question. In this state of affairs, if the Britannic Government has not got the signatures of the chiefs of Banks Peninsula—that is to say, their consent to recognize its sovereignty—I will make every possible effort to convince the chiefs that they must not abandon their land to any nation, but preserve it for themselves and their descendants by accepting the patronage of France and its Government. It is also in the direction of independence, I believe, that we ought to act with Britain.
But, sir, there is no time to be lost to enter into an explanation with the Britannic Cabinet: everything goes very quickly in this colony, and the powers given by Lord Normanby to the Government of Sydney give him all the more latitude, because what he will decide to do concerning these Islands has been applauded in advance. . . .
A later letter is dated Akaroa, 19th August, 1840. In it he informs his Minister what he found at Akaroa:—
I have the honour to announce to you the arrival of the “Aube” in the Bay of Akaroa on the 15th instant.
I found several British established there, and the Proclamation placarded by the corvette “Herald” last May posted on the house of an Englishman placed in charge of these Proclamations. . . .
The brig “Britomart” is sailing along the coast and visiting the different ports with two Magistrates, having to go everywhere where any offence has to be investigated and punished. I suppose that ray presence is somewhat the reason of these cruises. A boat from this brig, which was lying outside the bay on the 17th instant. came alongside the “‘Comte de Paris,” which, on entering, had fired guns; in this boat were officers and the two Magistrates I just mentioned. Believing that this gun-fire was to call their boat, these gentlemen came on board. They noticed carriages for coast-guns which were on deck; they seemed astonished, but, however, did not say anything about it. Various remarks thoughtlessly made by Captain Langlois also made them feel uneasy, and have been the subject of an explanation between the British captain and myself. I promised to follow the line of conduct that I had traced for myself in the Bay of Islands, and to maintain what I had written, until the British and French Cabinets had decided the question of occupancy in one way or another.
As I have had the honour of informing Your Excellency, I had officially announced to Captain Hobson that I was returning to Akaroa, where the surrounding land, as well as the whole of Banks Peninsula, belonged to French proprietors, who had sent out cultivators from France to clear the land and make it productive. . . . My surprise was great when, on the arrival of the “Comte de Paris,” I heard, in the most positive way, that Monsieur Langlois had never negotiated with the chiefs of this part, that he possessed nothing there, and that we had, in fact, no right of ownership we could put forward. The chiefs gathered around me declared to me, through the voice of M. Comte, a missionary priest of Monseignor Pompallier, who speaks the language of the Natives, that Monsieur Langlois had negotiated for a part of the land at Port Cooper, Tokolabo Bay, for which he had paid one part, but that there never had been any question of the port of Akaroa, in which they had sold to a Mr. Rhodes a certain part for grazing or cultivating, and that in the same way they had sold the, bay of Pyreka and other bays forming the southern part of the peninsula; and, finally, that they had never signed a contract of sale, drawn up between Monsieur Langlois and the tribes of the north-west and west of the peninsula.
In such a state of things, how am I to execute the orders of the King? How to take possession . . . even tacitly, in case of an arrangement between the Governments of France and of Britain, of a land that does not belong to the company? In one word, how to execute the treaty of the 11th October, 1839, made in Paris between the Government and the Nanto-Bordelaise Company? Really, sir, I am travelling on such a winding and dark road that I only walk by groping my way.. If Monsieur Langlois had not heard of my presence he would have treated the acts and the official doings of Britain as a joke; he would have hoisted the tricolour flag, would have saluted it with 101 guns, and he would have taken possession in the name of the King of the French; while I, for my part, have tried every day in my conduct to avoid binding my Government, and especially not to compromise the dignity of Royalty. Fortunately, the whaler “Pauline,” which I met at sea. by making my presence here known at Port Cooper, prevented a demonstration of this kind, for the ceremony of which several officers and masters of whalers had already been convoked.
From to-day [21st August] a British Magistrate has been appointed to reside at Akaroa and will establish himself there. I suppose it is the arrival and the landing of our colonists that has called forth this measure. I had a conference on this matter with him, and I could see a certain fear concerning my intentions; nevertheless, I am pleased at his presence, because, together with mine, it might avoid misunderstandings between the established British and our colonists. . . .
In ending this despatch I must repeat to Your Excellency my whole idea: No colonization possible in these seas if we do not obtain the withdrawal of these Proclamations and declarations as to the Island of Tawai Poenamou (Middle Island); and then, apart from the inconvenience of the neighbourhood, one would have to make a better choice of emigrants than those brought out by the “Comte de Paris.”
There is a voluminous essay written by Lavaud, entitled “Voyage and Attempted Colonization of the South Island of New Zealand, undertaken by the Corvette ‘Aube,’ commanded by Commander Lavaud,” which gives more detail than the official papers, but is hardly more to the point.
It will be admitted that Lavaud was placed in a very difficult position through the change of circumstances that had taken place since he left France; that he, as representative of that country, bore himself in a courteous if independent manner, and that both he and Hobson acted with admirable mutual forbearance; that there was no race, the French objects having been defeated whilst Lavaud was still at sea and in ignorance of events; and that Lavaud, whilst accepting the defeat with difficulty, did so with dignity; that his action was the best he could have taken, both for the continued amity of the two nations and for the comfort of the emigrants.
In conclusion, it is a pleasure to be able to express this respect for one who represented a nation with whom we have often been at variance, but between whom and ourselves a bitter war against a common foe has, we trust, consummated an enduring friendship. The French did not prosecute their claim; upon inquiry, the New Zealand Government, in view of the fact that a large number of emigrants had been sent out in good faith, at a cost of £15,125, made the company a grant of 30,000 acres, and the company finally ceded all its rights on the peninsula to the New Zealand Company for the sum of £4,500.
Many contemporary versions have appeared of what was supposed to have taken place at Akaroa in August, 1840; and it was the great discrepancies among these, and the reading of Stanley's report, that awoke in the writer a suspicion that the ceremony performed was not one of taking possession, but merely one of exercising civil authority in virtue of possession already taken; and that more facts were to be gleaned from the dark fields of the past.
It is to be hoped that the whole of the official correspondence, both. English and French, may be made generally available by publication.
[Since the foregoing was printed, an area of 12.8 perches on which the monument stands at Akaroa has been acquired by the Government as land of historic interest (see New Zealand Gazette No. 52, of 26th August, 1926). The inscription on the monument will be altered to accord with the true facts, so that there may be no grounds for misconception in the future.]
Table of Contents
| POPULATION:— | |||
|---|---|---|---|
| Males. | Females. | Total. | |
| Estimated (inclusive of Maoris but exclusive of residents of Cook and other Pacific islands) at 30th September, 1926 | 724,389 | 693,475 | 1,417,864 |
| MIGRATION:— | |||
|---|---|---|---|
| Males. | Females. | Total. | |
| Arrivals (excluding crews), ten months, 1926 | 20,539 | 15,835 | 36,374 |
| Departures (excluding crows), ten months, 1926 | 16,149 | 12,984 | 29,133 |
| VITAL STATISTICS:— | |||
| Males. | Females. | Total. | |
| Births, nine months, 1926 | 10,871 | 10,242 | 21,113 |
| Deaths, nine months, 1926 | 5,012 | 3,917 | 8,929 |
| Corresponding yearly rates per 1000 | Births, 20.90; deaths, 8.84 | ||
| Quantity. | Value. £ | ||
|---|---|---|---|
| EXPORTS:— | |||
| Total for ten months, 1926 | 39,020,207 | ||
| Total, New Zealand produce, ten months, 1926 | 38,263,857 | ||
| Principal items (New Zealand produce)— | |||
| Butter | cwt. | 860,265 | 6,533,871 |
| Cheese | cwt. | 1,141,977 | 4,807,173 |
| Beef, frozen | cwt. | 368,169 | 490,806 |
| Lamb, whole carcases, frozen | cwt. | 1,468,545 | 5,415,860 |
| Mutton, whole carcases, frozen | cwt. | 908,916 | 1,987,095 |
| Sausage-skins | lb. | 3,346,558 | 741,974 |
| Milk, dried | lb. | 6,671,650 | 211,927 |
| Hides | number | 832,842 | 602,277 |
| Rabbit-skins | number | 13,855,524 | 653,896 |
| Sheep-skins, without wool | number | 2,235,719 | 1,232,543 |
| Wool | bales | 571,216 | 10,732,761 |
| Phormium-fibre | tons | 15,497 | 473,934 |
| Tallow | tons | 19,581 | 686,657 |
| Kauri-gum | tons | 4,168 | 285,627 |
| Gold | oz. | 101,606 | 417,681 |
| Timber, sawn | sup. ft. | 32,934,861 | 385,642 |
| IMPORTS:— | |||
| Total for ten months, 1926 | 41,741,128 | ||
| Principal imports— | |||
| Wheat | 528,262 | ||
| Flour | 353,241 | ||
| Sugar | 846,134 | ||
| Tea | 827,477 | ||
| Whisky | 553,277 | ||
| Cigarettes | 630,667 | ||
| Tobacco | 760,002 | ||
| Apparel | 1,929,431 | ||
| Boots, shoes, and slippers | 831,370 | ||
| Hosiery | 425,756 | ||
| Carpeting, matting, and oilcloth | 560,257 | ||
| Drapery n.e.i. | 421,769 | ||
| Cotton piece-goods | 1,796,926 | ||
| Silk, satin, and velvet piece-goods | 614,144 | ||
| Woollen piece-goods | 733,446 | ||
| Benzine, benzoline, gasolene, kerosene, &c | 1,072,398 | ||
| Motor-spirit n.e.i. | 2,001,580 | ||
| Coal | 564,670 | ||
| Hardware and metal manufactures, n.e.i. | 948,628 | ||
| Iron and steel—Galvanized plate and sheet | 457,280 | ||
| Iron and steel—Tubes, pipes, and fittings | 479,995 | ||
| Electrical machinery and equipment | 1,700,945 | ||
| Timber | 696,794 | ||
| Paper, printing | 530,424 | ||
| Paper, other | 465,091 | ||
| Motor-vehicles | 3,041,809 | ||
| Rubber-tires, &c., for motor-vehicles | 825,014 | ||
| SHIPPING, OVERSEAS:— | Number. | Tonnage. |
|---|---|---|
| Inwards, ten months, 1926 | 567 | 1,868,844 |
| Outwards, ten months, 1926 | 553 | 1,871,103 |
| RAILWAYS:— | £ | |
| Receipts, 1st April to 16th October, 1926 | 4,065,907 | |
| Expenditure, 1st April to 16th October, 1926 | 3,489,194 | |
| AGRICULTURE:— | ||
| Area sown or intended to be sown, season 1926–27— | Acres. | |
| Wheat | 222,000 | |
| Oats | 405,000 | |
| Potatoes | 24,500 | |
| MORTGAGES:— | Number. | Amount. £ |
| Registered, seven months ended October, 1926 | 28,895 | 25,997,552 |
| Discharged, seven months ended October, 1926 | 21,172 | 19,517,856 |
| LAND TRANSFERS:— | Number. | Consideration. £ |
| Registrations, seven months ended October. 1926— | ||
| Town and suburban properties | 15,735 | 10,632,322 |
| Country properties | 5,453 | 10,142,197 |
| Total | 21,188 | 20,774,519 |
| BANKS OF ISSUE:— | £ | |
| Assets, September quarter, 1926 | 64,367,510 | |
| Liabilities, September quarter, 1926 | 57,219,995 | |
| Advances, September quarter, 1926 | 48,323,946 | |
| Deposits, September quarter, 1926 | 50,010,356 | |
| Bank rate of discount, October, 1926 | 6 ½ per cent. | |
| Overdraft interest rate, October, 1926 | 6 ½ per cent. | |
| POST OFFICE SAVINGS-BANK:— | £ | |
| Deposits during seven months ended October, 1926 | 17,854,159 | |
| Withdrawals during seven months ended October, 1926 | 17,975,548 | |
| TELEGRAPHIC BUSINESS:— | Number. | Revenue. £ |
| Ordinary telegrams, six months ended September, 1926 | 2,691,461 | 137,795 |
| Urgent ordinary telegrams, six months ended September, 1926 | 135,380 | 14,085 |
| Night letter - telegrams, six months ended September, 1926 | 198,619 | 9,019 |
| Press telegrams, six months ended September, 1926 | 263,879 | 36,542 |
| Toll communications, six months ended September, 1926 | 4,444,467 | 178,870 |
| Total | 7,733,806 | 376,311 |
| MONEY ORDER AND POSTAL-NOTE BUSINESS:— | Number. | Amount. £ |
| Money-orders issued, six months ended September, 1926 | 390,564 | 2,473,503 |
| Money-orders paid, six months ended September, 1926 | 333,382 | 2,299,259 |
| Postal notes issued, six months ended September, 1926 | 1,64£,762 | £484,446 |
| Postal notes paid, six months ended September, 1926 | 1,6£,407 | £479,641 |
| PENSIONS:— | Number, | Annual Value. £ |
| Old-age, October, 1926 | 23,308 | 998,748 |
| Widows', October, 1926 | 3,964 | 311,372 |
| Military, October, 1926 | 394 | 19,306 |
| War, October, 1926 | 20,643 | 1,114,722 |
| Miners', October, 1926 | 646 | 40,859 |
| Epidemic, October, 1926 | 293 | 11,134 |
| Blind, October, 1926 | 221 | 10,586 |
| BANKRUPTCY:— | Number. | |
| Auckland, January-October, 1926 | 249 | |
| Wellington, January-October, 1926 | 198 | |
| Christchurch, January-October, 1926 | 98 | |
| Dunedin, January-October, 1926 | 45 | |
| Total | 590 | |
| STATE ADVANCES (LOANS AUTHORIZED):— | Number | Amount. £ |
| To settlers, three months ended June, 1926 | 421 | 481,635 |
| To workers, three months ended June, 1926 | 316 | 251,905 |
| To local authorities, three months ended June, 1926 | 10 | 10,640 |
| ESTATES CERTIFIED FOR STAMP DUTY:— | Number. | Amount. £ |
| Ten months ended October, 1926 | 4,254 | 12,971,198 |
| CONSOLIDATED FUND:— | £ | |
| Receipts, six months ended September, 1926 | 9,801,548 | |
| Expenditure, six months ended September, 1926 | 11,284,001 | |
| LOANS OF LOCAL BODIES:— | £ | |
| Amount raised six months ended September, 1926:— | ||
| Counties | 314,910 | |
| Boroughs | 882,367 | |
| Electric-power Boards | 862,500 | |
| Harbour Boards | 237,300 | |
| Others | 438,360 | |
| Total | 2,735,437 | |
| RETAIL PRICES, ALL GROUPS:— | ||
| Dominion index number (base: July, 1914 = 1000), August, 1926 | 1633 | |
| WAGE RATES:— | ||
| Dominion index number (base: Year, 1914 = 1000), September quarter, 1926 | 1,584 | |
| INDUSTRIAL DISTURBANCES:— | ||
| Number reported during nine months ended September, 1926 | 43 | |
| Number of workers affected | 4,382 | |
| Approximate loss in wages | £21,576 | |
CHRONOLOGICAL LIST OF SOME OF THE PRINCIPAL EVENTS IN THE HISTORY OF NEW ZEALAND.
1642. Discovery of New Zealand by Tasman.
1769. Captain Cook's first visit to New Zealand.
1788. Discovery of Macaulay and Curtis Islands (Kermadec Group), and of Bounty Islands.
1791. Discovery of Snares and Chatham Islands.
1792. First sealing gang left on New Zealand coast.
1793. Discovery of Raoul or Sunday Island (Kermadec Group). Visit of Lieutenant-Governor King, of Norfolk Island, to Doubtless Bay.
1800. Discovery of Antipodes Islands.
1806. Discovery of Auckland Islands.
1807. Defeat of Hongi and the Ngapuhi Tribe. 1810. Discovery of Campbell Island.
1814. Arrival of Rev. Samuel Marsden, and introduction of Christianity. Horses, oxen, sheep, and poultry first brought to New Zealand.
1818. Hongi's and Te Morenga's great expedition to East Cape.
1819–20. Raid on Taranaki and Port Nicholson by Patuone, Nene, and Te Rauparaha.
1820. Hongi's visit to England. Rev. S. Marsden travelled from Waitemata, via Kaipara, to Bay of Islands—the first white man to do so. First vessel entered Auckland Harbour.
1821. Hongi's capture of Mauinaina and Te Totara Pas. Ngati-Toa migration from Kawhia to Otaki.
1822. Fall of Matakitaki Pa, Waikato, to Hongi.
1823. Fall of Mokoia Pa, Rotorua, to Hongi.
1823–28. Jurisdiction of Courts of Justice in New South Wales extended to British subjects in New Zealand
1824. Fall of Te Whetumatarau Pa to Pomare.
1825. First attempt at colonization by on expedition under Captain Herd. Great defeat of Ngati-Whatau by Hongi.
1827. Hongi's forces destroyed mission station at Whangaroa.
1828. Death of Hongi.
1829. Brig “Hawes” captured by Maoris.
1830. Battles of Taumata-wiwi and Kororareka. Fall of Kaiapohia Pa, Canterbury, to Te Rauparaha.
1831. Tory Channel whaling-station established. Application of thirteen chiefs for the protection of King William IV. Capture of Pukerangiora Pa, Waitara, by Waikato.
1832. Repulse of Waikato at Nga-motu Pa.
1833. Mr. Busby appointed British Resident at Bay of Islands.
1834. Bishop Williams's first visit to East Cape. Battle near Otaki. Waimate Pa shelled and captured by British—first occasion on which H.M. troops employed in New Zealand.
1835. Declaration of independence of the whole of New Zealand as one nation, with title of “United Tribes of New Zealand.” Ngati-Awa tribes migrated to and conquered Chatham Islands.
1836. Battles between Waikato and Te Arawa.
1838. Pelorus Sound discovered. Arrival of Roman Catholic mission under Bishop Pompallier.
1839. Governor of New South Wales authorized to include within the limits of that colony any territory that might be acquired in sovereignty by Her Majesty in New Zealand. Preliminary expedition of New Zealand Company under Colonel Wakefield arrived at Port Nicholson.
1840. Arrival of New Zealand Company's settlers at Port Nicholson. First steamer arrived. Treaty of Waitangi signed. British sovereignty proclaimed. Captain Hobson appointed Lieutenant-Governor, with residence at Auckland. Settlements formed at Petre (Wanganui) and Akaroa.
1841. Issue of charter of incorporation of New Zealand Company. New Zealand proclaimed independent of New South Wales. Arrival of New Plymouth settlers.
1842. Settlement founded at Nelson.
1843. Affray with Natives at the Wairau, and massacre of persons who had surrendered.
1844. Royal flagstaff at Kororareka cut down by Heke.
1845. Destruction of Kororareka by Heke.
1846. Capture of pa at Ruapekapeka and termination of Heke's war. Native hostilities near Wellington. Te Rauparaha captured and detained as a prisoner. New Zealand divided into two provinces, New Munster and New Ulster, and representative institutions conferred.
1847. Attack by Maoris on Wanganui.
1848. Suspension of that part of New Zealand Government Act which had conferred representative institutions. Severe earthquake at Wellington. Otago founded.
1850. Surrender of New Zealand Company's charter, all its interests reverting to the Imperial Government. Canterbury founded.
1852. Discovery of gold at Coromandel. Constitution Act passed, granting representative institutions to New Zealand, and dividing country into six provinces.
1854. Opening at Auckland of first session of the General Assembly.
1855. First members elected to the House of Representatives under system of responsible Government. Very severe earthquake on both sides of Cook Strait.
1856. Appointment of first Ministry under system of responsible Government.
1857. Goldfield opened at Collingwood.
1858. New Provinces Act passed. Hawke's Bay Province constituted.
1859. Establishment of Marlborough Province.
1860. Hostilities in Waitara district.
1861. Truce arranged with Waitara Maoris. Bank of New Zealand incorporated. Southland Province established. Gold discovered at Gabriel's Gully, Otago.
1862. Coromandel proclaimed a goldfield. Wreck of s.s. “White Swan,” with loss of many public records. First electric-telegraph line opened—Christchurch to Lyttelton.
1863. Wreck of H.M.S. “Orpheus” on Manukau bar, with loss of 181 lives. Control of Native affairs transferred to Colonial Government. Commencement of Waikato War. Defeat of Maoris at Rangiriri, and occupation of Ngarua-wahia. First railway in New Zealand opened.
1864. Severe fighting in Waikato and elsewhere, including Battles of Rangiaohia, Orakau, Gate Pa, and Te Ranga. Gold discovered on west coast of South Island.
1865. Seat of Government transferred to Wellington. Further fighting, followed by proclamation of peace. Activities of Hauhau fanatics, including murders of Europeans. Rebel Natives defeated at Wairoa.
1866. Further defeats of rebel Natives. Commencement of Panama steam mail-service. Cook Strait submarine telegraph-cable laid.
1867. Opening of Thames Goldfield. Admission of four Maori members to House of Representatives as direct representatives of Maori people.
1868. Westland Province established. Maori prisoners, under leadership of Te Kooti, seized schooner “Rifleman” and escaped from Chatham Islands to mainland, where they massacred Europeans and were engaged in a series of fights with European forces and friendly Natives. Considerable fighting also with other rebel Natives.
1869. Continuation of fighting with rebels and of pursuit after Te Kooti. Termination of Panama-mail-service. Visit of H.R.H. the Duke of Edinburgh. Government Life Insurance Office established.
1870. Further fighting with Te Kooti. Last of Imperial troops left New Zealand. Commencement of San Francisco mail-service. Bounty Island taken possession of. Inauguration of Vogel public-works policy. Act passed to establish the New Zealand University. Southland Province reunited with Otago.
1871. Commencement of railway-construction under public-works policy.
1872. Resumption of friendly relations with Waitara Maoris. Appointment of Maori chiefs (two) to Legislative Council. Public Trust Office created.
1873. Establishment of New Zealand Shipping Company.
1874. In pursuance of immigration and public-works policy, 31,774 assisted immigrants introduced.
1875. Resumption of amicable relations with Maori King. Establishment of Union Steam Ship Company. Abolition of Provinces Act passed.
1876. New Zealand connected by cable with Australia. Abolition of Provinces Act came into operation, provincial institutions being abolished and the country divided into counties and boroughs.
1877. Education Act passed, providing for free and compulsory education.
1879. Trouble with Parihaka Natives, under Te Whiti, and imprisonment of 180 of these. Triennial Parliaments Act passed. Adult male suffrage introduced.
1880. Release of Parihaka prisoners.
1881. Wreck of s.s. “Tararua,” with loss of 130 lives. Severe earthquakes in Wellington. Arrest of Te Whiti and Tohu.
1882. First shipment of frozen meat from New Zealand.
1883. Amnesty to Maori political offenders proclaimed. Te Whiti and Tohu released. Direct steam communication inaugurated between New Zealand and England.
1885. New Zealand Industrial Exhibition at Wellington.
1886. Tarawera eruption, involving loss of 101 lives and destruction of Pink and White Terraces.
1887. Annexation of Kermadec Islands. Members of House of Representatives reduced to seventy-four, including four Maoris. Australian Naval Defence Act passed, providing for additional naval force on the Australian Station.
1888. British protectorate over Cook Islands proclaimed.
1889. South Seas Exhibition at Dunedin.
1890. Great maritime strike. First election of House of Representatives under one-man-one-vote principle.
1891. Inauguration of Liberal regime under Hon. John Ballance, succeeded on his death in 1893 by Mr. Seddon. This and following years marked by passage of industrial and social legislation.
1892. Introduction of lease-in-perpetuity system of land-tenure.
1893. Franchise extended to women. Special licensing poll introduced.
1894. Industrial Conciliation and Arbitration Act passed. Government Advances to Settlers Act passed. Wreck of s.s. “Wairarapa,” with loss of 135 lives. First ascent of Mount Cook.
1895. Government assumed management of Midland Railway.
1896. Brunner Mine explosion, causing sixty-seven deaths. Abolition of non-residential or property qualification to vote. Government Valuation of Land Act passed.
1898. Old-age Pensions Act passed.
1899. Labour Day instituted. New Zealand Contingent (the first of ten) sent to South Africa.
1900. Number of European representatives in Lower House increased to seventy-six.
1901. Duke and Duchess of York visited New Zealand. Universal penny postage adopted by New Zealand. Cook and other Pacific islands annexed.
1902. Pacific cable opened. Wreck of s.s. “Elingamite.” Conference of colonial Premiers in London, at which New Zealand was represented by Right Hon. R. J. Seddon.
1903. Empire Day proclaimed. State Fire Insurance Act passed.
1904. New Zealand rifle team competed at Bisley, and won Kolapore Cup.
1905. Workers' Dwellings Act passed. Title of New Zealand's representative in London altered to “High Commissioner.” “All Black” Rugby football team visited United Kingdom, winning all matches but one.
1906. Death of Right Hon. R. J. Seddon, Premier since 1893. Government Advances to Workers Act passed. New Zealand International Exhibition at Christ-church.
1907. New Zealand constituted a Dominion. Lease-in-perpetuity system of land-tenure abolished. Parliament Buildings destroyed by fire.
1908. Through communication established between Wellington and Auckland. Wellington-Manawatu Railway purchased by Government. American Fleet visited Auckland. New Zealand's subsidy to British Navy increased to £100,000 per annum. Second Ballot Act passed.
1909. S.s. “Penguin” wrecked, with loss of seventy-five fives. Battle-cruiser presented by New Zealand to Imperial Government. System of compulsory military training introduced.
1910. Field-Marshal Lord Kitchener's visit to New Zealand to report and advise on defences. Public Debt Extinction Act, National Provident Fund Act, and Workers' Dwellings Act passed.
1911. Wireless telegraphy installed in New Zealand. Widows' Pensions Act passed. First poll on national prohibition taken.
1912. Foundation-stone of new Parliament Buildings laid. Public Service placed under Commissioner control.
1913. Visit of Dominions Royal Commission. Visit of gift ship H.M.S. “New Zealand” to Dominion. Aeroplane presented to New Zealand as nucleus of proposed air fleet. Extensive strikes. Second Ballot Act repealed.
1914. Western-Samoa occupied by New Zealand Advance Expeditionary Force. Main Expeditionary Force left for Egypt. Huntly coal-mine disaster, whereby forty-three lives lost.
1915. New Zealand Expeditionary Force engaged in operations on Gallipoli Peninsula. National Cabinet formed. National register of men compiled.
1916. New Zealand Division transferred to western front, where it took part in heavy fighting during this and two following years, Mounted Brigade being retained in Egypt, and being later engaged in successful advance into Palestine. Compulsory enrolment of men for war service introduced. Lake Coleridge electric-supply scheme opened.
1918. S.s. “Wimmera” sunk by enemy mine off New Zealand coast. Otira tunnel pierced. Great influenza epidemic, causing over five thousand deaths.
1919. Visit of French mission under General Pau. Second visit of H.M.S. “New Zealand,” bringing Admiral of the Fleet Viscount Jellicoe of Scapa. Women made eligible for seats in Parliament. Dissolution of National Ministry. New Zealand represented at Peace Conference by Right Hon. W. F. Massey, P.O., Prime Minister.
1920. Visit of H.R.H. the Prince of Wales. Railway strike. First aeroplane flight over Cook Strait. League of Nations gave New Zealand mandate to administer Western Samoa. Anzac Day constituted a national holiday.
1921. System of compulsory registration of firearms introduced. Samoa Act passed, making provision for “peace, order, and good government” of Western Samoa, in terms of mandate. New Zealand represented at Disarmament Conference, Washington, by Hon. Sir John Salmond.
1922. Earth tremors over period of several weeks in Taupo district. British Empire Exhibition Mission visited New Zealand. Anzac Day made observable in all respects as if it were a Sunday. Meat-export trade placed under control of a Board. Enrolment of volunteers in view of possible outbreak of war with Turkey.
1923. Seventeen lives lost in railway accident at Ongarue. Opening of Arthur's Pass tunnel. Ross Dependency proclaimed and placed under jurisdiction of Governor-General of New Zealand. Sockburn aerodrome purchased by Government. First winter ascent of Mount Cook. Highway districts created. Reintroduction of penny postage. Extension of scheme of advances to settlers and workers. Dairy - produce Export Control Act passed, and adopted by dairy producers.
1924. Visit of Special Service Squadron to New Zealand. “All Black” Rugby football team visited Great Britain and Ireland. New Zealand took part in British Empire Exhibition at Wembley. Railway strike. Direct two-way radio communication effected between New Zealand and England. Mangahao electric-supply scheme opened. S.s. “Ripple” lost with all hands off Cape Palliser. Motor-vehicles Act passed, providing for registration and annual licensing of motor-vehicles. Land Transfer (Compulsory Registration of Titles) Act passed, bringing under Land Transfer Act all land hitherto alienated in fee-simple and not already under Land Transfer Act. Visit of a party of Samoan faipules to New Zealand.
1925. Death of Right Hon. W. F. Massey. Prime Minister since 1912. Visit of American Fleet to New Zealand. Social Hygiene Regulations made, to provide means of coping with spread of venereal disease. Repayment of the Public Debt Act passed. Strike of seamen on British vessels trading to New Zealand. New Zealand and South Seas International Exhibition at Dunedin.
1926. Administration of Tokelau (Union) Islands transferred to New Zealand. Webster claims against New Zealand finally rejected. Visit of Indian Army hockey team to New Zealand. Absolute control adopted by Dairy-produce Export Control Board. Family Allowances Act passed. Explosion in Dobson coal-mine, whereby nine fives lost.
The following list contains the names of some of the principal works dealing with New Zealand, Samoa, the Cook Islands, and the Ross Dependency, but it does not purport to be a complete list. The year of publication is given in each case, and the list is arranged as far as possible in chronological order of issue.
1807. New Zealand. By Dr. Savage. London—J. Murray.
1817. Voyage to New Zealand. By John L. Nicholas. London—Black.
1823. Journal of Ten Months' Residence in New Zealand. By Captain Cruise. London—Longmans.
1830. The New-Zealanders (Library of Entertaining Knowledge). London—Chas. Knight.
1832. Nino Months' Residence in New Zealand. By Augustus Earle. London—Longmans.
1836. Two Visits to New Zealand. By Dr. Marshall. London—Nisbet and Co.
1840. Manners and Customs of the New-Zealanders. By J. S. Polack London—Madden and Co.
1843. Travels in New Zealand. By E. Dieffenbach. London—Murray.
1846. The New-Zealanders. (Five coloured illustrations.) By G. F. Angas. London—Thomas McLean.
1855. Te-Ika-a-Maui, or New Zealand and its Inhabitants. By Rev. Richard Taylor. London—Wertheim and Macintosh. (Second edition, enlarged, 1870.)
1856. Traditions and Superstitions of the New-Zealanders. By Edward Shortland. London—Longmans.
1859. New Zealand and its Colonization. By William Swainson, formerly Attorney-General for New Zealand. London—Smith, Elder, and Co.
1859. Story of New Zealand. By Dr. Thompson. London—John Murray.
1863. Old New Zealand. By Judge Maning. Auckland—Creighton and Scales.
1864. The Maori King, or the Story of our Quarrel with the Natives of New Zealand. By J. E. Gorst, M.A. London—Macmillan and Co. 1874. Life of Henry Williams. By Hugh Carleton. Auckland—Upton.
1878. Forty Years in New Zealand. By Rev. J. Buller. London—Hodder and Stoughton.
1879. Reminiscences of the War in New Zealand. By T. W. Gudgeon. London—Sampson Low.
1879. George Augustus Selwyn. By Rev. H. W. Tucker. London—W. W. Gardner.
1885. Polynesian Mythology and Maori Legends. By Sir G. Grey.
1887. Mission Commercials en Nouvelle-Zélande. Par Emile de Harven. Bruxelles—P. Weissenbruch.
1889. Ancient History of the Maori. By John White. London.
1890. Early History of New Zealand. By R. A. Sherrin and J. H. Wallace. Edited by Thomson W. Leys. (Brett's Historical Series.) Auckland—Brett.
1891. Storia della Nuova Zelanda (2 vols.). Per D. Felice Vaggioli. Parma—Vesc. Fiaccadori.
1893. Captain Cook's Journal during his First Voyage round the World. Edited by Captain W. J. L. Wharton, R.N. London—Elliot Stock.
1895. History of New Zealand. By G. W. Rusden. Melbourne—Melville, Mullen, and Slade.
1895. Les Nouvelles Sociétés Anglo-saxonnes. By P. Leroy-Beaulieu. Paris.
1896. The Art Workmanship of the Maori Race in New Zealand. By Augustus Hamilton. Dunedin—Fergusson and Mitchell.
1896. Journal of Sir Joseph Banks. Edited by Sir Joseph D. Hooker. London—Macmillan and Co.
1896. Moko, or Maori Tattooing. By Major-General Robley. London—Chapman and Hall.
1897. New Zealand Rulers and Statesmen (1844–97). By W. Gisborne. London.
1898. Abel Janszoon Tasman's Journal of his Discovery of Van Diemen's Land and New Zealand in 1642, &c. By J. E. Heeres. Amsterdam—F. Mueller and Co.
1898. Contributions to the Early History of New Zealand. By T. M. Hocken. London.
1898. New Zealand (Story of the Empire Series). By W. P. Reeves. London—Marshall and Sons.
1899. History of New Zealand. 2v. (1896–99). By Alfred Saunders. Christchurch—Whitcombe and Tombs; Smith, Anthony, Sellars, and Co.
1900. Old Marlborough. By T. L. Buick. Palmerston North—Hart and Keeling.
1900. A Country without Strikes. By H. D. Lloyd. New York—Doubleday Page.
1901. Newest England. By H. D. Lloyd. London. 1901. New Zealand. By R. A. Loughnan. Wellington.
1901. Le Socialisme sans Doctrines. By A. Metin. Paris. (Second edition in 1910.)
1902. The Progress of New Zealand in the Century. By R. F. Irvine and O. T. J. Alpers. London.
1902. State Experiments in Australia and New Zealand. By W. P. Reeves. London—Grant Richards.
1902. The Last Maori War in New Zealand. By Major-General Sir George S. Whitmore, K.C.M.G., M.L.C. London—Sampson, Low, Marston, and Co.
1902. L'Evolution Sociale en Australasie. By L. Vigoureux. Paris.
1903. Old Manawatu. By T. L. Buick. Palmerston North—Buick and Young.
1904. La Démocratie en Nouvelle Zélande. Paris, 1904. Translated by E. V. Burns, 1914. London.
1904. Wars of the Northern against the Southern Tribes of New Zealand in the Nineteenth Century. By S. Percy Smith, F.R.G.S. Wellington—Whitcombe and Tombs (Limited). (Second and enlarged edition in 1910.)
1904. La Nouvelle Zélande. Par Comte de Courte. Paris—Hachette et Cie.
1905. The Maori Race. By E. Tregear. Wanganui—A. D. Willis.
1905. The Animals of New Zealand. An Account of the Colony's Air-breathing Vertebrates. By Captain F. W. Hutton and James Drummond. (Third edition, 1907.) Christchurch—Whitcombe and Tombs (Limited).
1906. Adrift in New Zealand. By E. W. Elkington. London.
1907. The Plants of New Zealand. By R. M. Laing and E. W. Blackwell. Second and Revised Edition. Christchurch—Whitcombe and Tombs (Limited).
1907. Maori Life in Ao-tea. By Johannes C. Andersen. Christchurch—Whitcomb and Tombs (Limited). 1907. Maori and Polynesian. By J. M. Brown. London.
1907. Our Feathered Immigrants. Evidence for and against Introduced Birds in New Zealand, together with Notes on Native Avifauna. Illustrated. By J. Drum-mond. Wellington—Government Printer.
1908. State Regulation of Labour and Labour Disputes in New Zealand. By Henry Broadhead. Christchurch—Whitcombe and Tombs (Limited).
1908. New Zealand. By F. W. Wright and W. P. Reeves. London—Black.
1908. New Zealand. (Romance of Empire Series.) By Reginald Horsley. London—T. C. and E. C. Jack.
1908. Adventure in New Zealand. By E. J. Wakefield. New Edition. Wellington—Whitcombe and Tombs (Limited).
1908. Bibliography of the Literature relating to New Zealand. By T. M. Hocken, Wellington.
1908. Historical Records of New Zealand. By the Hon. Dr. Robert McNab, Litt.D. Wellington—Government Printer.
1908. New Zealand Revisited. By the Right Hon. Sir John Eldon Gorst. London—Sir Isaac Pitman and Sons (Limited).
1909. New Zealand in Evolution, Industrial, Economic, and Political. By G. H Schole-field, with an introduction by W. P. Reeves. London—T. F. Unwin.
1909. Murihiku. A History of the South Island of New Zealand and the Islands Adjacent and Lying to the South, from 1642 to 1835. By the Hon. Dr. Robert McNab, Litt.D. Wellington—Whitcombe and Tombs (Limited).
1909. The Dominion of New Zealand. By A. P. Douglas. London.
1909. Australien in Politik Wirtschaft. By R. Schachner. Jena—Fischer.
1910. The Maoris of New Zealand. By J. Cowan. Wellington—Whitcombe and Tombs (Limited).
1910. The Geology of New Zealand. By James Park. Christchurch—Whitcombe and Tombs (Limited). 1910. Maori Patterns, Painted and Carved. By J. H. Menzies. Christchurch—Smith and Anthony.
1910. New Zealand Plants and their Story. By L. Cockayne, Ph.D., F.L.S. (Second edition, 1919.) Wellington—Government Printer.
1910. History and Traditions of the Maoris of the West Coast, North Island of New Zealand. By S. Percy Smith, F.R.G.S. New Plymouth—Polynesian Society.
1910. Birds of the Water, Wood, and Waste. By H. Guthrie-Smith. Christchurch—Whitcombe and Tombs (Limited).
1911. Hawaiki: The Original Home of the Maori. By S. Percy Smith. Third Edition. Christchurch—Whitcombe and Tombs (Limited).
1911. The Course of Prices in New Zealand. By James W. McIlraith, LL.B., Litt.D. Wellington—Government Printer. 1911. State Socialism in New Zealand. By J. E. Le Rossignol and W. Downie Stewart. London—G. G. Harrop and Co.
1911. New Zealand. By the Right Hon. Sir Robert Stout, P.O., K.C.M.G., LL.D., and J. Logan Stout, LL.B. Cambridge University Press.
1911. With the Lost Legion in New Zealand. By Colonel G. Hamilton-Browne. London—T. Werner Laurie.
1911. Die Soziale Frage in Australien und Neusseland. By R. Schachner. Jena—Fischer.
1912. Stone Implements of the Maori. By Elsdon Best. (Dominion Museum Bulletin No. 4.) Wellington—Government Printer.
1913. La Nuova Zelanda. Giuseppe Capra. Scuola Tipografica D. Bosco—S. Benigno Canavese.
1913. New Zealand: its History, Commerce, and Industrial Resources. By S. Playne. London.
1913. Social Welfare in New Zealand. By H. H. Lusk. London.
1913. The Lore of the Whare Wananga. Third Volume of Memoirs of Polynesian Society On Maori Religion, Myths, Cosmogony, &c.
1914. The Constitutional History and Law of New Zealand. By J. Hight, Litt.D., and H. D. Bamford, LL.D. Christchurch—Whitcombe and Tombs (Limited).
1914. The Treaty of Waitangi. By T. Lindsay Buick. Wellington—S. and W. Mackay.
1914. The Wilds of Maoriland. By M. J. Bell. London.
1914. Oxford Survey of the British Empire. Vol. 5. Australasian Territories. London.
1914. Early Rangitikei. By Sir James G. Wilson, Kt. Christchurch—Whitcombe and Tombs (Limited).
1914. Mutton Birds and Other Birds. By H. Guthrie-Smith. Christchurch—Whitcombe and Tombs (Limited).
1916. Jubilee History of South Canterbury. By Johannes C. Andersen. Christchurch—Whitcombe and Tombs (Limited).
1916. Innere Kolonisation in Neuseeland. By W. Plugge. Jena—Fischer. 1916. The “Socialism” of New Zealand. By R. H. Hutchinson. New York—New Review Publishing Association.
1916. Arbitration and Conciliation in Australasia. By M. T. Rankin. London—Allen and Unwin.
1917. A Natural History of Australia, New Zealand, and the Adjacent Islands. By R. P. Thomson. London. 1917. A Dictionary of the Maori Language. By Herbert L. Williams. Wellington—Government Printer.
1919. Official History of New Zealand's Effort in the Great War. Vol. 1. The New-Zealanders at Gallipoli. By Major Fred Waite, D.S.O., N.Z.E. Wellington—Whitcombe and Tombs (Limited).
1919. New Zealand To-day. By Hon. G. W. Russell. Christchurch—G. W. Russell (Limited).
1920. Prices: An Inquiry into Prices in New Zealand. By the Census and Statistics Office, Wellington. Wellington—Government Printer.
1920. Mounted Riflemen in Sinai and Palestine. The Story of New Zealand's Crusaders. By A. Briscoe Moore (late Lieutenant, Auckland Mounted Rifles). Auckland—Whitcombe and Tombs (Limited).
1921. New Zealand One Hundred Years Ago. By Major Richard A. Cruise. Auckland—Brett Printing and Publishing Company. (A reprint of the book published in 1823.)
1921. Official History of New Zealand's Effort in the Great War. Vol. 2. The New Zealand Division, 1916–19. By Colonel H. Stewart, C.M.G., D.S.O., M.C. Wellington—Whitcombe and Tombs (Limited).
1921. Maori and Pakeha: a History of New Zealand. By A. W. Shrimpton, M.A., and A. E. Mulgan. Christchurch—Whitcombe and Tombs (Limited).
1921. The Vegetation of New Zealand. By L. Cockayne, Ph.D., F.R.S., F.L.S., F.N.Z.Inst. Leipzig—Wilhelm Engelmann. (Vol. 14 of a work Die Vegetation der Erde.)
1921. The Hot Springs of New Zealand. By Arthur Stanley Herbert, M.D. London—H. K. Lewis and Co. (Limited).
1921. Tutira: the Story of a New Zealand Sheep-station. By H. Guthrie-Smith. London—Blackwood and Sons.
1921. History of the Canterbury Regiment, N.Z.E.F., 1914–19. By Captain David Ferguson, M.C. (late of the 2nd Battalion, Canterbury Regiment). Auckland—Whitcombe and Tombs (Limited).
1921. Official History of the Otago Regiment, N.Z.E.F., in the Great War, 1914–18. By Lieutenant A. E. Byrne, M.C., Otago Regiment, N.Z.E.F. Dunedin—J. Wilkie and Co. (Limited).
1922. The Naturalization of Animals and Plants in New Zealand. By Hon. George M. Thomson, F.L.S., F.N.Z.Inst., M.L.C. Cambridge University Press.
1922. The Geomorphology of New Zealand. By C. A. Cotton, D.Sc., F.G.S., F.N.Z.Inst. Wellington—Government Printer.
1922. Maori Myth and Religion. Spiritual and Mental Concepts of the Maori. Astronomical Knowledge of the Maori. Maori Division of Time. By Elsdon Best, F.N.Z.Inst. Dominion Museum Monographs 1–4. Wellington—Government Printer.
1922. The New Zealand Wars: a History of the Maori Campaigns and the Pioneering Period: Vol. 1, 1845–64. By James Cowan. Wellington — Government Printer. Vol. 2, 1864–72, issued 1923.
1922. Medical Practice in Otago and Southland in the Early Days. By Robert Valpy Fulton, M.D. Edin. Dunedin—Otago Daily Times.
1922. Official History of New Zealand's Effort in the Great War. Vol. 3. The New Zealanders in Sinai and Palestine. By Lieut.-Colonel C. Guy Powles, C.M.G., D.S.O. Wellington—Whitcombe and Tombs (Limited).
1922. New Zealand Citizen: an Elementary Account of the Citizen's Rights and Duties and the Work of Government. By E. K. Mulgan, MA. (late Senior Inspector of Schools), and Alan E. Mulgan. Auckland—Whitcombe and Tombs (Limited).
1922. New Zealand Tunnelling Company, 1915–19. Edited by J. C. Neill, A.O.S.M. (late Lieutenant, N.Z. Tunnelling Company). Auckland—Whitcombe and Tombs (Limited).
1922. Regimental History of New Zealand Cyclist Corps in the Great War, 1914–18. By Officers. Auckland—Whitcombe and Tombs (Limited).
1922. Practice of the Supreme Court and Court of Appeal of New Zealand. By Right Hon. Sir R. Stout, P.O., K.C.M.G., and W. R. Sim. Auckland—Whitcombe and Tombs (Limited).
1923. With the Machine Gunners in France and Palestine. By J. H. Luxford, Major, N.Z.M.G.C. The Official History of the Machine Gun Corps in the Great World War, 1914–18. Auckland—Whitcombe and Tombs (Limited).
1923. The Waikato War, together with some Account of Te Kooti Rikirangi. By John Featon (new edition revised by Captain Mair). Auckland—Brett Printing and Publishing Co.
1923. Polynesian Voyagers. Maori Schools of Learning. (Dominion Museum Bulletins Nos. 5 and 6.) By Elsdon Best. Wellington—Government Printer.
1923. Human Australasia. By C. F. Thwing. New York—McMillan.
1923. Cultivation of New Zealand Plants. By L. Cockayne. Auckland—Whitcombe and Tombs (Limited).
1923. War Effort of New Zealand: a Popular History of (a) Minor Campaigns in which New-Zealanders took part; (b) Services not fully dealt with in the Campaign Volumes; (c) the War at the Bases. Edited by Lieut. H. T. B. Drew. Wellington—Whitcombe and Tombs (Limited).
1924. Dominion Civics. By Miss N. E. Coad. Wellington — Whitcombe and Tombs (Limited). 1924 Official History of the Wellington Mounted Rifles Regiment, 1914–19. By Major A. H. Wilkie. Auckland—Whitcombe and Tombs (Limited).
1924. The Maori. By Elsdon Best. Published by the Board of Maori Ethnological Research. Wellington—H. Tombs.
1924. Bibliography of Printed Maori to 1900. (New Zealand Dominion Museum.) By Herbert W. Williams. Wellington—Government Printer.
1924. Who's Who in New Zealand and the Western Pacific, 1925. Wellington—Gordon and Gotch.
1924. Maori Religion and Mythology. (Dominion Museum Bulletin No. 10). By Elsdon Best. Wellington—Government Printer.
1924. Game Animals of New Zealand. By T. E. Donne. London—Murray.
1924. Red Deer Stalking in New Zealand. By T. E. Donne. London—Constable.
1924. Sterbende Welt. By A. Reischek. Leipszig—Brockhaus.
1924. The Long White Cloud (Aotearoa). By W. P. Reeves. Third Edition (to which is added a sketch of recent events in New Zealand by C. J. Wray). London—Allen and Unwin.
1924. White Wings (on early shipping). By H. Brett. Auckland—Brett Co.
1925. The Maori as He Was. By Elsdon Best. Wellington—Government Printer. 1925. Bird Life on Island and Shore. By H. Guthrie-Smith. Edinburgh—Wm. Blackwood and Sons.
1925. Recollections of Early New Zealand. By H. B. Morton. Auckland—Whitcombe and Tombs (Limited).
1925. Bibliography of Australasian Poetry and Verse. By P. Serle. Melbourne University Press.
1925. Constance Grande. By Julian Grande. London—Chapman and Hall.
1925. Evolution considered in the Light of Hybridization. By J. P. Lotsy. Introduction and List of New Zealand Hybrids, by Dr. L. Cockayne. Christchurch—Canterbury College.
1925. Fungous Diseases of Fruit-trees in New Zealand. By G. H. Cunningham. Auckland—New Zealand Fruitgrowers' Federation.
1925. The Maori Canoe. (Dominion Museum Bulletin No. 7.) By Elsdon Best. Published under the direction of the Board of Maori Ethnological Research. Wellington—Government Printer.
1925. Games and Pastimes of the Maori. (Dominion Museum Bulletin No. 8.) By Elsdon Best. Published under the direction of the Board of Maori Ethnological Research. Wellington—Whitcombe and Tombs (Limited).
1925. Maori Agriculture. (Dominion Museum. Bulletin No. 9.) By Elsdon Best. Published under the direction of the Board of Maori Ethnological Research. Wellington— Whitcombe and Tombs (Limited).
1925. Land Legislation and Settlement in New Zealand. By W. R. Jourdain Wellington—Lands and Survey Department.
1925. Manual of New Zealand Flora. Edition 2: revised and enlarged. By T. F. Cheeseman, F.L.S., F.Z.S., F.N.Z.Inst., &c. Edited by W. R. B. Oliver. Wellington—Government Printer.
1925. New Zealand Birds and how to identify them. By P. Moncrieff. Auckland—Whitcombe and Tombs (Limited).
1925. Short History of New Zealand. By J. B. Condliffe. Christchurch—L. M. Isitt.
1925. Story of Old Wairoa. By T. Lambert. Dunedin—Coulls, Somerville, Wilkie (Limited).
1926. Geography of the Pacific. By Miss N. E. Coad. Wellington—New Zealand Book Depot.
1926. History of the Pacific. By Miss N. E. Coad. Wellington—New Zealand Book Depot.
1926. Memoirs of Sir J. E. Denniston. By J. G. Denniston and others. Christchurch—Gaskell and Co.
1926. New Zealand: its Political Connection with Great Britain. Vol. 1. By J. I. Hetherington. Dunedin—Coulls, Somerville, Wilkie (Limited).
1926. The Pa Maori. (Dominion Museum Bulletin No. 6.) By Elsdon Best. Published under the direction of the Board of Maori Ethnological Research. Wellington—Whitcombe and Tombs (Limited).
1926. Treasury of New Zealand Verse: New Edition of New Zealand Verse. By W. F. Alexander and A. E. Currie. Auckland—Whitcombe and Tombs (Limited).
1926. New Zealand's First War. By T. Lindsay Buick. Published under the direction of the Board of Maori Ethnological Research. Wellington—Government Printer.
1926. Bird-song and New Zealand Song-birds. By J. C. Andersen. Christchurch—Whitcombe and Tombs (Limited).
1845. Quelques Semaines dans l'Arohipel de Samoa. By G. F. de Lurcy. (Extrait du Bulletin de la Société de Geographie.) Paris.
1846. Missionary Life in Samoa. By G. A. Lundie. Glasgow—W. Collins.
1872. Report on the Islands of the Samoa Group. By E. Wakeman. New York—Slote and James.
1875. My Story of Samoan Methodism. By M. Dyson. Melbourne—Ferguson and Moore.
1878. Grammar and Dictionary of the Samoan Language. By G. Pratt. London—Trübner and Co.
1879. Freundschafts-Vertrag zwischen des Deutschen Reiche und der Regierung von Samoa. (Agreement between Germany and Samoa.)
1884. Samoa a Hundred Years Ago and Long Before. By George Turner. London—Macmillan.
1887. My Consulate in Samoa. By W. B. Churchward. London—Bentley and Son.
1889. Iles Samoa. By A. Marques. Lisbon.
1889. Les Iles des Samoa ou des Navigateurs. By A. de Ganniers. Paris.
1890. Le Missionaire des Samoa. By A. Monfat. Bellecour.
1893. Kurze Anleitung zum Verständnisz der Samoanischen Sprache. By B. Funk. Berlin—Mittler und Sohn.
1895. In Stevenson's Samoa. By Marie Fraser. London—Smith and Elder.
1896. Samoanische Texte. By O. Stuebel. Berlin—Mueller.
1897. Old Samoa. By Rev. John B. Stair. London—Religious Tract Society.
1899. The Imbroglio in Samoa. By H. C. Ide. (From North American Review, June, 1899.)
1899. Samoan Question. By W. Cooper. Auckland—Wilson and Horton.
1900. Samoa: Das Land, die Leute und die Mission. By G. Kurze. Berlin—M. Warneck.
1902. Samoa Uma. By L. P. Churchill. New York—Forest and Stream Publishing Company.
1902. Manuia Samoa. By Richard Dekken. Oldenburg—G. Stalling.
1902. Samoa. By Dr. F. Reinecke. Berlin—W. Süsserott.
1902–3. Die Samoa-Inseln. By A. Krämer. Stuttgart.
1904. Samoa: die Perle der Südsee. By Otto E. Ehlers. Berlin—H. Paetel.
1906. The Fishes of Samoa. By D. S. Jordan and A. Scale. Bulletin 25, United States Fisheries Bureau.
1910. Beiträge zur Geologie der Samoainseln. By I. Friedlander. München.
1910. Die deutschen Kolonien. By Major A. D. Kurd Schwabe. Berlin—Weller and Hüttich. (Samoa, in Vol. 2.)
1912. Island Reminiscences. By Thomas Trood, British Vice-Consul at Apia, Samoa. Sydney—McCarron, Stewart, and Co.
1918. History of Samoa. By R. M. Watson. Wellington—Whitcombe and Tombs (Limited).
1918. Grammar and Vocabulary of the Samoan Language. By H. Neffgen. London—Kegan, Paul, Trench, Trubner, and Co.
1924. Samoa Expeditionary Force, 1914–15. By S. J. Smith. Wellington—Ferguson and Osborn.
1925. Handbook of Western Samoa. New Zealand External Affairs Department. Wellington—Government Printer.
1892. The South Pacific . . . with Notes on the Hervey Group. By Rev. W. W. Gill. Sydney—Government Printer.
1893. Phrase Book of the Cook Islands. By F. Nicholas. Wellington.
1905. A Compilation of Acts . . . relating to the Government of the Cock Islands. N.Z. Crown Law Office.
1916. Rarotongan Records. By Rev. W. W. Gill. (From the Journal of the Polynesian Society.) New Plymouth.
1847. A Voyage of Discovery and Research in the Southern and Antarctic Regions . . . 1839–43. By Sir James Clark Ross, R.N. (2 vols.). London—John Murray. (This is the “Erebus” and “Terror” voyage, which resulted in the famous volumes by Sir Joseph Hooker on the Flora of New Zealand (2 vols.), Tasmania (3 vols.), and Antarctica (2 vols.), and on the Zoology (2 vols.), edited by John Richardson and John Edward Gray.)
1901. The Antarctic Manual, for the Use of the Expedition of 1901. Edited by George Murray, F.R.S. London—Royal Geographical Society.
1901. First on the Antarctic Continent. an Account of the British Antarctic Expedition, 1898–1900. By Carsten E. Borchgrevink, F.R.G.S. London-George Newnes (Limited).
1901. To the South Polar Regions: Expedition of 1898–1900. By Louis Bernacchi, F.R.G.S. London—Hurst and Blackett (Limited).
1902. Report on the Collections of Natural History made in the Antarctic Regions during the Voyage of the “Southern Cross.” London—British Museum.
1904. The Antarctic Regions. By Dr. Karl Fricker. London—Swan, Sonnenschein, and Co.
1905. Naermest Sydpolen Aaret, 1900. By Carsten E. Borchgrevink. Copenhagen—Gyldendalske Boghandel.
1905. The Siege of the South Pole: the Story of Antarctic Exploration. By Hugh Robert Mill, LL.D., D.Sc. London—Alston Rivers (Limited).
1905. The Voyage of the “Discovery.” By Captain Robert F. Scott, C.V.O., R.N. (2 vols.). London—Smith, Elder, and Co.
1905. Two Years in the Antarctic: being a Narrative of the British National Antarctic Expedition. By Albert B. Armitage, Lieutenant, R.N.R. London—Edward Arnold.
1906. The Voyage of the “Scotia”: being the Record of a Voyage of Exploration in Antarctic Seas. By Three of the Staff. London—William Blackwood and Sons.
1907. South Polar Times. Vol. 1, April to August, 1902, and Vol. 2, April to August, 1903. London—Smith, Elder, and Co. (Facsimile of the magazine produced on the “Discovery” month by month during the winters of 1902–3. Contains drawings, many coloured maps, &c., and whilst much of the matter is ephemeral, it contains information concerning the country, its flora and fauna, including Ross Island, &c. Vol. 3 was published in 1914.)
1907–12. National Antarctic Expedition, 1901–4. Natural History—Vol. 1, Geology, 1907; Vol. 2, Zoology, 1907; Vol. 3, Zoology and Botany, 1907; Vol. 4, Zoology, 1908; Vol. 5, Zoology and Botany, 1910; Vol. 6, Zoology and Botany, 1912: Physical Observations, 1908: Meteorology, Part I, 1908: Photographs and Sketches, 1908: Panoramas, n.d.: Charts, n.d. (11 vols.).. London—British Museum.
1908. Aurora Australia. Published at the winter quarters of the British Antarctic Expedition, 1907, during the winter months of April, May, June, and July, 1908. (Contains an account of the ascent of Mount Erebus.)
1909. The Heart of the Antarctic: being the Story of the British Antarctic Expedition, 1907–1909. By E. H. Shackleton, C.V.O. (2 vols.). London—William Heine Mann.
1910. The Heart of the Antarctic By Sir Ernest Shackleton, C.V.O. London-William Heinemann. (Popular edition in 1 vol. of the edition of 1909.)
1910. 21 Meilen vom Suedpol, die Geschichte der Britishen Suedpol Expedition, 1907–9. Von E. H. Shackleton . . . (2 B.). Berlin—Wilhelm Suesserott.
1910–11. British Antarctic Expedition, 1907–9, under command of Sir E. H. Shackleton, C.V.O. Reports of Scientific Investigations. Vol. I. Biology, Parts I to VII, and Vol. 2, Biology, Parts I to IV. London—British Museum.
1911. Shackleton in the Antarctic. By Sir Ernest Shackleton, C.V.O. London—William Heinemann. (Accepted from “The Heart of the Antarctic”)
1913. Scott's Last Expedition. Vol. 1, Journals of Captain R. F. Scott, C.V.O., R.N.; Vol. 2, Reports of the Journeyings and the Scientific Work undertaken by Dr. E. A. Wilson and the Surviving Members of the Expedition. Arranged by Leonard Huxley. London—Smith, Elder, and Co.
1914. Antarctic Adventure: Scott's Northern Party. By Raymond E. Priestly. London—T. Fisher Unwin.
1914. Antarctic Penguins: a Study of their Social Habits. By Dr. G. Murray Levich, R.N. London—William Heinemann.
1914. South Polar Times. Vol. 3, April to October, 1911. London—Smith, Elder, and Co. (Vols. 1 and 2 published in 1907.)
1914. The Voyages of Captain Scott. By Charles Turley. London—Smith, Elder, and Co.
1914–23. British Antarctic (“Terra Nova”) Expedition, 1910. Zoology, Vol. 1, Nos. 1–4; Vol. 2, Nos. 1–11; Vol. 3, Nos. 1–10; Vol. 4, Nos. 1–4; Vol. 5, Nos. 1 and 2; Vol. 6, Nos. 1 and 2; Botany, Part HI. Geology, Vol. 1, Nos. 1–5 (the work still being issued). London—British Museum.
1916. The Voyages of the “Morning.” By Captain Gerald S. Doorly, R.N.R. London—Smith, Elder, and Co.
1916. With Scott: the Silver Lining. By Griffith Taylor, D.Sc., &c. London- -Smith, Elder, and Co.
1919. South: the Story of Shackleton's Last Expedition, 1914–17. By Sir Ernest Shackleton, C.V.O. London—William Heinemann.
1921. The Great White South: being an Account of Experiences with Captain Scott's. South Pole Expedition, and of the Nature Life of the Antarctic. By Herbert G. Ponting, F.R.G.S. London—Duckworth and Co.
1921. South with Scott. By Edward R. G. Evans. London—Collins. (A popular edition issued in 1923.)
1922. The Worst Journey in the World: Antarctic, 1910–13. By Apsley Cherry-Garrard. (2 vols.) London—Constable and Co.
1923. South: the Story of Shackleton's 1914–17 Expedition. By Sir Ernest Shackleton, C.V.O. London—William Heinemann.
1923. Shackleton's Last Voyage. By F. Wild. London—Cassell.
1924. To the Frozen South. By A. J. Villiers. Hobart—Davies Bros.
The following geological papers, all by H. T. Ferrar, are not available in separate-book form:—
Notes on the Physical Geography of the Antarctic. In Geographical Journal, Vol. 25, 1905, pp. 373–82.
Cavities in Crystalline Rocks. In Geographical Magazine, Vol. 2, 1905, pp. 190–1.
The Antarctic Icecap. In Geographical Magazine, Vol. 3, 1906, pp. 529–34.
| Article on | Appeared for the Last or Only Time in the Year-book of | |
|---|---|---|
| Year. | Page. | |
| Acclimatization | 1894 | 430 |
| Agriculture in New Zealand (by M. Murphy, F.L.S.) | 1912 | 809 |
| Building-stones | 1892 | 194 |
| Cancer in New Zealand—a statistical study | 1926 | 889 |
| Chatham Islands, the | 1900 | 531 |
| Cheviot Estate, the | 1895 | 264 |
| Christchurch to West Coast journey from | 1899 | 548 |
| Coal-deposits of New Zealand, the | 1900 | 479 |
| Cook Islands, the laws of | 1902 | 573 |
| Co-operative system of constructing public works | 1894 | 234 |
| Education system of New Zealand, the | 1925 | 816 |
| Effect of nativity order on infantile mortality | 1925 | 835 |
| Exotic trees in Canterbury | 1904 | 569 |
| External trade of New Zealand, the | 1915 | 858 |
| Forest-trees and the timber industry | 1899 | 470 |
| Frozen-meat trade, the | 1894 | 311 |
| Gold-dredging industry, the | 1899 | 509 |
| Government training-ship “Amokura” | 1913 | 942 |
| Hanmer Thermal Springs | 1905 | 631 |
| Hemp industry, the | 1900 | 477 |
| H.M.S. “New Zealand” | 1913 | 932 |
| Kauri-gum | 1900 | 489 |
| Labour in New Zealand | 1894 | 362 |
| Land- and income-tax assessment | 1913 | 884 |
| Laws of England and New Zealand, difference between | 1896 | 281 |
| Local Government in New Zealand | 1925 | 845 |
| Maori, ancient, his amusements, games, &c. | 1907 | 707 |
| ,, ancient, his clothing | 1908 | 734 |
| ,, chant (tangi) | 1907 | 711 |
| ,, colour-sense of the | 1905 | 637 |
| ,, marriage customs | 1906 | 638 |
| mythology | 1900 | 536 |
| ,, neolithic, the | 1902 | 578 |
| ,, place-names | 1919 | 936 |
| ,, religion | 1901 | 530 |
| ,, sociology | 1903 | 641 |
| ,, songs | 1908 | 739 |
| Marlborough Sounds, the | 1901 | 517 |
| Midland Railway, the | 1894 | 386 |
| Mineral waters of New Zealand | 1913 | 896 |
| Moa, heir of the | 1899 | 517 |
| Mount Cook, a night on | 1900 | 525 |
| ,, district, the | 1899 | 554 |
| ,, its glaciers, and the Hermitage | 1898 | 552 |
| Mount Sefton, ascent of | 1900 | 519 |
| New Zealand Contingents for South Africa | 1900 | 449 |
| ,, International Exhibition | 1907 | 701 |
| Otago lakes, the | 1901 | 523 |
| Patents, designs, and trade-marks | 1893 | 350 |
| Pumice-stone deposits of New Zealand | 1900 | 486 |
| Railways in New Zealand, their history and progress | 1894 | 377 |
| Scenic wonderland, a | 1898 | 565 |
| Sheep, crossbreeding of | 1894 | 308 |
| Sheep-farming | 1894 | 302 |
| Shipping companies— | ||
| New Zealand Shipping Company | 1895 | 392 |
| Shaw, Savill, and Albion Company | 1895 | 393 |
| Union Company of New Zealand | 1895 | 389 |
| Southern Alps, the | 1894 | 474 |
| State farms | 1894 | 243 |
| Sydney Pageant, the | 1901 | 527 |
| Terman intelligence tests in New Zealand schools | 1925 | 823 |
| Thermal-springs district | 1905 | 614 |
| Timber-trees of the world | 1903 | 605 |
| Tokaanu to Raetihi | 1899 | 539 |
| Topographical nomenclature of the Maori | 1919 | 936 |
| Tree-planting | 1906 | 611 |
| Tuhoeland | 1899 | 546 |
| Varieties of soil | 1892 | 193 |
| Wages and working-hours in New Zealand | 1919 | 860 |
| Waihi Gold-mining Company | 1897 | 432 |
| Waikato district and through to Wanganui | 1899 | 520 |
| Waiouru to Mangaonoho | 1899 | 543 |
| Wanganui River, up the, to Tokaanu | 1900 | 509 |
| Wattle-growing in the Auckland Provincial District | 1897 | 430 |
| Wellington-Manawatu Railway, the | 1895 | 381 |
| West Coast Sounds, the | 1894 | 482 |
| White Island, a day on | 1906 | 637 |
A.
- Abattoirs, Animals slaughtered at, 478, 482.
- Absolute Decrees in Divorce, 259.
- Accident Insurance, 728.
- State, 731.
- Accidents, 169, 204, 262.
- Factory, 893–910.
- Mining, 520.
- Railway, 395, 894–910.
- Industrial, 893–910.
- Acclimatization of Fishes, 504.
- Accommodation in Mental Hospitals, 229.
- Accommodation Licenses, 933.
- Accrued Sinking Funds, 630.
- Acreage and Yield of Crops, 454–465.
- Acreage of Holdings, 418.
- Acts affecting Labour, 840–852.
- Acta passed 1925 and 1926, 936–957.
- Actuarial Investigation—
- National Provident Fund, 664.
- Public Service Superannuation Fund, 658.
- State Life Insurance, 726.
- Ad valorem Duties, 355.
- Added Value in Manufacturing, 540.
- Adenoids: Hospital Cases, 196.
- Adjacent Islands, Population of, 107.
- Administration, 53–58.
- Administrators, 59.
- Admissions to Hospitals, 180.
- Admissions to Mental Hospitals, 225.
- Adoptions, 128.
- Adult Suffrage, 56.
- Adulteration of Food, 211.
- Advances—
- Bank, 709.
- Cold Storage, 648.
- Discharged Soldiers, 435.
- Fishing Industry Promotion, 648.
- Fruit-preserving Industry, 647.
- Interest from, 604.
- Local Authorities, 645.
- Repatriation, 646.
- Revenue from, 604.
- Rural, 642, 953.
- Settlers, 635.
- Workers, 642.
- Aerated-water Factories, 553.
- Afforestation, 493.
- After-lifetime, Average, 147, 1006.
- Age, Mean—
- At Death, 147.
- At Marriage, 139.
- Ages—
- Of Brides and Bridegrooms, 138.
- Of Deceased Persons, 145.
- Of Hospital Patients, 183.
- Of Industries, 548.
- Of Inmates of Benevolent Institutions, 223.
- Of Inmates of Mental Hospitals, 226.
- Of Issue left, 153.
- Of Maoris convicted, 283.
- Of Maoris at Death, 173.
- Of Migrants, 88.
- Of Mothers of Illegitimate Children, 127.
- Of New-Zealand-born convicted, 282
- Of Parents, 123, 129.
- Of Persons arrested and convicted, 267.
- Of Persons dying, 145.
- Of Persons injured in Industrial Accidents, 910.
- Of Persons married, 138.
- Of Prisoners, 275.
- Of Public-school Pupils, 239.
- Aggregation of Land, 431.
- Agricultural and Pastoral Production, 447–485.
- Value of, 922.
- Agricultural Bursaries, 253.
- Agricultural College, Lincoln, 252.
- Agricultural Machinery Factories, 561.
- Agricultural Produce exported, 302.
- Agriculture, 447–465.
- Board of, 449.
- Department of, 449.
- Aid, State—
- To Cold Storage, 648.
- To Discharged Soldiers, 435, 599.
- To Fishing Industry, 648.
- To Fruit-preserving Industry, 647.
- To Housing, 646.
- To Immigrants, 92.
- To Kauri-gum Industry, 518.
- To Local Authorities, 645.
- To Mining, 521.
- To Settlers, 635.
- To Tree-planting, 498.
- To Water-power Development, 573–579.
- To Workers, 642.
- Aitutaki Island, 960.
- Akaroa, Settlement of, 1012–1022.
- Alcoholic Liquors—
- Consumption of, 286.
- Sale of, 933.
- Alien Immigrants, 90.
- Alienation of Land, 428.
- Alienation of Native Lands, 437.
- Aliens—
- Immigration of, 90.
- Naturalization of, 96.
- Race, 91.
- “All Groups” Index Numbers, 812.
- Allocation of Public Debt, 620.
- Allowances, Family, 656.
- Alluvial-gold Mining, 508.
- Alpine Meadow-land, 486.
- Vegetation of, 46.
- Altitude of Mountains, 3.
- Amortization of Debt, 628.
- Amusements-tax, 615.
- Angora Goats, 483.
- Animals, Domestic, 466–485.
- Annexation, 52.
- Annexed Islands, 1, 959–963.
- Population of, 111.
- Annual Value Rating-system, 676.
- Antecedent Liability, 676.
- Ante-Natal Clinics, 221.
- Ante-nuptial Conceptions, 126.
- Anti-dumping Legislation, 357.
- Antipodes Islands, 1, 958.
- Apia, 965.
- Radio-station, 412.
- Apiaries, Registration of, 484.
- Apiculture, 483.
- Appeal Court, 271.
- Appellate Court, Native, 437.
- Appendicitis Cases in Hospitals, 197.
- Apples, 463.
- Applicants for Crown Land, 427.
- Apprentices Act, 852.
- Arapuni Power Scheme, 577.
- Arbitration Act, 845.
- Unions Registered under, 853–862.
- Arbitration Court, 846.
- Area of Indigenous Forests, 486.
- Area of New Zealand, 2.
- Area under Cultivation, 421.
- Army, 287.
- Arrested Persons convicted, 267.
- Arrivals, 85–91.
- Arthur's Pass Tunnel, 387.
- Articles on Special Subjects in Previous
- Issues, 1036.
- Assembly, General, 54.
- Asses and Mules, 482.
- Assessable Income, 783.
- Assessment Court, 698.
- Assessment of Land and Income Tax, 608, 779, 793.
- Assets—
- Of Bankrupts, 761.
- Of Banks, 708.
- Of Building Societies, 750.
- Of Fire-insurance Companies, 734.
- Of Forestation Companies, 497.
- Of Friendly Societies, 744.
- Of Life-insurance Companies, 724.
- Of Local Bodies, 688, 765.
- Of Manufacturing Industries, 543.
- Of National Provident Fund, 664.
- State, 623, 764.
- Assisted Immigration, 92.
- Associated Diseases, 170.
- Asylums, 224–229.
- Benevolent and Orphan, 223.
- Athletic Sports, 924.
- Atiu Island, 959.
- Atlantic Salmon, 505.
- Auckland Islands, 1, 958.
- Audit of Expenditure, 589.
- Australia and New Zealand—
- Bank Deposits in, 711, 717.
- Birth-rates of, 117.
- Building Societies in, 750.
- Death-rates of, 148.
- Debt of, 633.
- Deposits in Banks in, 711, 717.
- Friendly Societies in, 746.
- Illegitimacy-rates of, 127.
- Live-stock in, 466.
- Marriage-rates of, 135.
- Oat Crop of, 459.
- Potato Crop of, 461.
- Public Debt of, 633.
- Railway Revenue of, 393.
- Reciprocity between, 369.
- Savings-banks Deposits in, 717.
- Sheep in, 470.
- Trade between, 316, 349.
- Wheat Crop of, 458.
- Australia, Reciprocity with, 369.
- Authorities, Loan, Unexercised, 695.
- Automatic Signalling, 387.
- Automatic Telephones, 410.
- Automobiles, Registration of, 401.
- Avifauna, 49.
- Award Rates of Wages, 828.
B.
- Bacon produced, 483, 550.
- Balance of Trade, 297.
- Balances of Accounts, 599.
- Banking, 705–717.
- Bank-notes, Issue of, 712.
- Tax on, 614.
- Bankruptcy, 760.
- Banks of Issue, 705.
- Banks, Savings—
- Post Office, 712.
- Private, 716.
- Barley, 454, 459.
- Barren Land, 417, 421.
- Baths, Medicinal, 5.
- Bats, 48.
- Beans and Peas, 454, 459.
- Export of, 320, 459.
- Beef consumed and exported, 479.
- Beer, Consumption of, 286.
- Beer Duty, 359, 607.
- Beer produced, 553.
- Bees, 483.
- Beeswax produced, 485.
- Benevolent Asylums, 223.
- Benign Tumours, Hospital Cases, 192.
- Bertillon Classification of Diseases, 159.
- Bibliography, 1029.
- Birds, 49.
- In Forests, 491.
- Birthplaces—
- Of Persons arrested and convicted, 268.
- Of Persons convicted of Drunkenness, 285.
- Of Persons naturalized, 97.
- Of Persons who died, 151.
- Of Prisoners, 275.
- Births, 113–132.
- Biscuit-factories, 552.
- Blind, Pensions for the, 655.
- Blind, Schools for the, 251.
- Boarding of School-children, 240.
- Boatbuilding-works, 563.
- Boats, Fishing, 502.
- Boer War, 288.
- Pensions, 654.
- Boilers, Inspection of, 915.
- Bones, Diseases of, treated in Hospital, 202.
- Boot and Shoe Factories, 555.
- Boroughs, 57, 666–695.
- Capital and Unimproved Values, 703.
- Extension of Main Highways through, 399.
- Population of, 105.
- Borrowers from Building Societies, 748.
- Borstal Institutions, 277.
- Boundaries of New Zealand, 1.
- Bounty Islands, 1, 958.
- Buys' Training-farms, 251.
- Brass-foundries, 560.
- Bread, Law re Sale of, 211.
- Breast-diseases treated in Hospital, 201.
- Breeding-ewes, 469.
- Breeds of Cattle, 475.
- Breeds of Sheep, 470.
- Breweries, 553.
- Brickworks, 559.
- Brides and Grooms—
- Ages of, 138.
- Condition of, 137.
- Bridges, 396.
- Briquetting of Coal, 516.
- British Postal Orders, 409.
- British Preference, 357, 366.
- British Seamen's Strike, 879.
- British Sovereignty, 52.
- British Trade Representatives, 70.
- Britomart's Mission at Akaroa, 1012–1022.
- Broadcasting, 414.
- Bronchitis Cases in Hospital, 195.
- Brother-in-law, Marriage with, 133.
- Building Permits, 110.
- Building Societies, 747–750.
- Buildings, 109.
- Building-stones, 519.
- Bullion held by Banks, 708.
- Bullion, Movement of, 298.
- Bulls, 474.
- Bursaries, 247, 253.
- Bush-beer Manufacture, 961.
- Bush, Virgin, Area of, 421, 486.
- Butter—
- Exported, 302–329, 477.
- Factories, 476, 551.
- Grading of, 449, 476.
- Production of, 476, 551.
- By-election, 933.
C.
- Cabinet, 53.
- Members of, 62.
- Cables, Ocean, 414.
- Cadets, Senior, 287.
- Calf-skins exported, 320.
- Campbell Island, 1, 958.
- Cancer, 164, 191.
- Candle-factories, 554.
- Capital—
- Invested in Factories, 545.
- Invested in Railways, 390.
- Of Banks of Issue, 705.
- Of Joint-stock Companies, 912.
- Capital Value of Land, 696–704.
- Rating on, 675–681.
- Cargo handled at Ports, 374.
- Carry-over of Wheat, 457.
- Cash Lands, 428, 433.
- Cassiterite, 513.
- Castaways, Depots of Provisions for, 958.
- Casualties in the War, 288.
- Casualties, Shipping, 386.
- Cattle, 474.
- Causes of Death, 159.
- Of Infants, 158.
- Of Macris, 174.
- Causes of Industrial Accidents, 898.
- Causes of Industrial Disputes, 887.
- Causes of Insanity, 225.
- Cement-works, 559.
- Census, 78.
- Census and Statistics Office, 73.
- Census Legislation, 72.
- Cereals, 454.
- Certificates, Marine Officers', 385.
- Certificates of Title, 425.
- Limited, 424.
- Chaff, 460.
- Chaffcutters, 452.
- Character of Organization of Industries, 547.
- Character of Stock, 624.
- Charges before Magistrates, 263.
- Charitable Aid, 217.
- Chatham Islands, 1.
- Flora, 47.
- Cheese—
- Exported, 302–329, 477.
- Factories, 476, 551.
- Grading of, 449, 476.
- Produced, 476, 551.
- Chemists, Registration of, 212.
- Child Welfare, 249, 939.
- Childbirth, Deaths in, 167.
- Childbirth: Hospital Cases, 201.
- Children born, Sexes of, 119.
- Children, Dependent, Care of, 249.
- Children under One Year, Deaths of, 155.
- Children's Courts, 249, 939.
- Children's Homes, 223, 250.
- Chinese, 91.
- Christchurch Magnetic Observatory, 445.
- Chronological List of Events, 1025.
- Cinnabar, 513.
- Circulatory System, Diseases of, 194.
- City and Suburban Drainage Districts, 669–695.
- Civil Law Cases, 257.
- Civil Marriages, 140.
- Employees, 917.
- Pensions, 655.
- Superannuation, 657.
- Claims, Insurance, 721–742.
- Class-books, School, 240.
- Climate, 27–45.
- Clothing-factories, 554.
- Clothing-prices, 811.
- Clover-seeds, 461.
- Exported, 320.
- Club Charters, 933.
- Coachbuilding-works, 561.
- Coaching train-mileage, 390.
- Coal exported, 302, 321.
- Coal used in Factories, 536.
- Coal-miners' Relief Fund, 524.
- Coal-mines Act, 851.
- Coal-mining, 514.
- Coastal Trade, 374.
- Coastwise Shipping, 382.
- Coates Ministry, 62.
- Cocksfoot, 462.
- Coin held by Banks, 708.
- Coin-in-slot Telephones, 411.
- Cold-storage Advances, 648.
- Coleridge, Lake, Water-power, 573.
- Colleges, University, 251.
- Collieries, 514.
- Colonization, 52.
- Commerce, 291–377.
- Commercial Failures, 760.
- Commercial Forestation, 496.
- Commercial Orchards, 463.
- Committals for Sentence, 264, 269.
- Communicable Diseases, 179, 190.
- Companies, Joint-stock, 912.
- In Manufacturing Industries, 545.
- Companies, Taxation of, 610, 773–795.
- Compensation to Workers, 843, 896.
- Compulsory Education, 235.
- Compulsory Registration—
- Of Electors, 56.
- Of Land Titles, 423.
- Compulsory Training, 288.
- Conciliation Councils, 846.
- Condensed-milk Factories, 551.
- Confectionery-factories, 552.
- Confinement—
- Deaths in, 167.
- Hospital Cases, 201.
- Maternity Hospital Cases, 220.
- Conjugal Condition of Persons marrying, 137.
- Conjugal Rights, Restitution of, 258.
- Consolidated Fund, 590.
- Constitution, 53.
- Of Cook Islands, 960.
- Of Local Bodies, 666.
- Construction of Railways, Cost of, 390.
- Construction of Roads, 396–406.
- Consuls, Foreign, 70.
- Consumption of Commodities, 924.
- Alcoholic Liquors, 286.
- Coal, 516, 536.
- Meat, 478, 482.
- Timber, 488.
- Wheat, 456.
- Contractors' Liens, 845.
- Contributory Causes of Death, 170.
- Conveyance Duty, 613.
- Conveyance of Children to School, 240.
- Conveyancing, 423.
- Convictions in Supreme Courts, 268.
- Convictions, Summary, 264.
- For Drunkenness, 284.
- Of Juveniles, 280.
- Of Maoris, 283.
- Of New-Zealand-born, 282.
- Of Persons arrested, 267.
- Of Women, 282.
- Cook and other Pacific Islands, 1, 959–963.
- Bibliography, 1035.
- Births, 131.
- Deaths, 175.
- Exports to, 329.
- Flora, 47.
- Imports from, 354.
- Marriages, 142.
- Population, 111, 961.
- Radio-stations, 413.
- Cook's Visits to New Zealand, 51.
- Co-operative Dairy Companies, 476.
- Co-operative Public Works, 917.
- Copper, 512.
- Cordial-factories, 553.
- Corn Crops, Acreage and Yield of, 454.
- Coroners' Inquests, 262.
- Correspondence Classes, 240.
- Cost of Railway-construction, 390.
- Council, Executive, 53.
- Members of, 62.
- Council, Legislative, 54.
- Members of, 66.
- Councils of Conciliation, 846.
- Counties, 58, 667–695.
- Capital and Unimproved Values, 702
- Population of, 104.
- Courts—
- Appeal, 271.
- Arbitration, 846.
- Assessment, 698.
- Bankruptcy, 760.
- Children's, 249, 939.
- Divorce, 258.
- Magistrates', 257, 263.
- Native Appellate, 437.
- Native Land, 436.
- Supreme, 257, 268.
- Cow-testing, 448, 474.
- Creameries, 477.
- Cream-separators on Farms, 450.
- Creditors' Petitions, 760.
- Credits-in-Aid, 590, 600.
- Crime, Law and, 257–286.
- Criminal Cases, 263–271.
- Criminals, Habitual, 277.
- Crops, 454–465.
- Crown Lands, 427–435.
- Crown Tenants, 430.
- Cuckoos, 49.
- Cultivation, Area in, 421.
- Curtis Islands, 959.
- Customary Land, 436.
- Customs Tariff and Revenue, 355–370.
- Customs Taxation, 360, 607.
- Cycle-works, 562.
D.
- Dairy Industry, 476.
- Dairying Machinery in Use, 450.
- Dairy-produce, 476.
- Export Control, 478, 946.
- Export of, 302–329, 477.
- Grading of, 449, 476.
- Retail Prices, 801.
- Danger Island, 1, 960.
- Dates of Maturity of Loans, 626.
- Dates of Principal Events, 1025.
- Dead-births, 129.
- Deaf, School for the, 251.
- Death Duties, 611.
- Deaths, 143–176.
- From Industrial Accidents, 903.
- In Hospitals, 180.
- In Mental Hospitals, 227.
- Debentures, 624, 689.
- Debenture-tax, 610.
- Debt of Local Bodies, 689.
- Debt, Public, 617–633.
- Debtors' Petitions, 760.
- Deceased Husband's Brother, Marriage with, 133.
- Deceased Wife's Sister, Marriage with, 133.
- Decrees in Divorce, 259.
- Deeds Registration, 424.
- Deer, 491.
- Defence, 287–290.
- Pensions, 654.
- Deferred-payment Lands, 428, 434.
- Degrees, University, 251.
- Demography, 78–112.
- Denominational Schools, 230, 243.
- Density of Population, 108.
- Dental Treatment of School-children, 213.
- Dentists, Registration of, 209.
- Departmental Reports, 76.
- Departments, Government, 68, 917.
- Departures, 85–91.
- Dependencies, 1, 958–972.
- Deposits, 707–717, 759.
- By Insurance Companies, 718, 733.
- With Building Societies, 749.
- Depots for Castaways, 958.
- Depreciated Rate of Exchange, Provisions re, 357.
- Designs, Registration of, 915.
- Destination—
- Of Emigrants, 89.
- Of Exports, 309–321.
- Of Shipping, 380.
- Detention, Reformative, 277.
- Deviations, Road, 406.
- Diamond Drills, 521.
- Diarrhœa Cases in Hospital, 197.
- Differential Tariff, 357, 366.
- Diphtheria Cases in Hospital, 186.
- Diplomas, 251.
- In Public Health, 208.
- Direction of Export Trade, 309–321.
- Direction of Import Trade, 335–354.
- Direction of Oversea Shipping, 380.
- Discharged Mortgages, 755.
- Discharged Soldiers—
- Financial Assistance for, 435, 646.
- Land for, 433.
- Pensions for, 652.
- Discharges from Hospitals, 180.
- Discharges from Mental Hospitals, 227.
- Discount Rates, 711.
- Discovery of New Zealand, 51.
- Diseases, Notification of, 177, 207.
- Diseases, Principal, Deaths from, 161.
- Diseases treated in Hospitals, 183–205.
- Dislocations treated in Hospitals, 204, Disputes, Industrial, 878–892.
- Dissolution of Marriages, 258.
- Dissolution of Parliament, Dates of, 64.
- Distribution of—
- Births over Year, 117.
- Deaths over Year, 144.
- Marriages over Year, 136.
- Population, 98.
- Wealth, 768.
- District Exports, 373.
- District High Schools, 245.
- Dividend Duty, 615.
- Dividends, Bank, 705.
- Divorce, 258.
- Domestics, Assisted Passages for, 93.
- Domestic-science Bursaries, 252.
- Domicile of Debt, 625, 691.
- Dominion of New Zealand, 1.
- Drainage Districts, 668–695.
- Dredging, Gold, 508.
- Drift, Urban, 100.
- Drills, Prospecting, 521.
- Drowning Accidents, 169, 262.
- Drugs, Sale of, 211.
- Drunkenness, 284.
- Ducks, 483.
- Dumping, 357.
- Dunedin Medical School, 220.
- Duration of Incapacity from Industrial Accidents, 902.
- Duration of Marriage and Number of Previous Issue, 124.
- Dutiable Imports, 364.
- Duties, Customs and Excise, 355–359.
- Duties, Death, 611.
- Dwellings, 109.
- Soldiers', 435.
- Workers', 646.
E.
- Early History, 51.
- Early Trade, 291.
- Earned Income, 787.
- Reduced Tax on, 610, 783.
- Earnings of Factory Employees, 530, 565.
- Ears, Diseases of, treated in Hospital, 194.
- Earthquakes, 22.
- Economic Pensions, 654.
- Eden By-election, 933.
- Education, 230–256.
- In Cook Islands, 962.
- In Western Samoa, 966.
- Education Gazette, 240.
- Educational Association, Workers', Educational Endowments, 429.
- Effect of Prices on Exports, 324.
- Effective Wages, 833.
- Eggs, 483.
- Election, General, 927–933.
- Electoral Qualifications, 56.
- Electric—
- Current, 558, 571–588.
- Power Boards, 579, 669–695.
- Power in Factories, 536.
- Railway, 387.
- Telegraph, 409.
- Emigration, 85–91.
- Employees—
- Factory, 529, 565, Farm, 451.
- Local Body, 920.
- Postal, 415.
- Public Works, 916.
- Railway, 394.
- State, 917.
- Unions of, 853–862.
- Employers' Liability, 843.
- Insurance, 728, 731.
- Employment and Unemployment, 863–877.
- Employment Bureaux, 865.
- Enactments affecting Labour, 840–852.
- Enactments of 1925 and 1926, 936-957.
- Endemic Diseases, 186.
- -Endowments, Educational, 429.
- Endowments, National, 428.
- Engine-drivers' Certificates, 916.
- Engineering-works, 560.
- Engine-mileage, 390.
- Engines—
- Employed in Factories, 534.
- Employed on Farms, 452.
- Railway, 388.
- Ensilage, 460.
- Enteritis Cases in Hospital, 197.
- Entertainments-tax, 615.
- Entrepôt Trade, 299, 323.
- Entry, Ports of, 371.
- Epidemic Diseases, 186.
- Epidemic Pensions, 655.
- Erection of Dwellings, 110, 435, 646.
- Estate Duty, 611.
- Estates—
- Acquired for Settlement, 431.
- Administered by Public Trust Office, 911.
- Passed for Probate, 770.
- Ewes, 469.
- Examinations, Annual, 255.
- Excavation, Scaffolding and, 851.
- Excess-profits Tax, 610.
- Exchanges, Telephone, 410.
- Excise Duties, 359.
- Taxation by means of, 360, 607.
- Executive Council, 53.
- Members of, 62.
- Exemptions from Taxation—
- Income-tax, 610, 789.
- Land-tax, 609, 777.
- Ex-nuptial Births, 126.
- Exotic Trees, Planting of, 493.
- Expectation of Life, 147, 1006.
- Expeditionary Forces, 288.
- Expenditure—
- Education, 256.
- Hospital, 215.
- Hydro-electric, 579.
- Local Body, 687.
- Mental Hospital, 229.
- Naval Defence, 290.
- Postal, 415.
- Public, 589–605.
- Railway, 393, 591.
- State Afforestation, 494.
- Experimental Farms, 449.
- Explorers, 51.
- Export Control—
- Dairy Produce, 478, 946.
- Fruit, 464.
- Honey, 485.
- Kauri-gum, 518.
- Meat, 479.
- Export Duties, 359.
- Export Prices, 324–329, 822.
- Exports, 301–330.
- Of Ports, 373.
- External Injuries treated in Hospital, 204.
- External Migration, 85–91.
- External Trade, 291–377.
- Extinction of Public Debt, 628.
- Extra-marital Conceptions, 126.
- Eyes, Diseases of, treated in Hospital, 194.
F.
- Factories, 525–570.
- Accidents in, 893–910.
- Act, 848.
- Dairy, 476, 551.
- Fallow Land, 421.
- Family Allowances, 656, 948.
- Farm Implements, 450.
- Advances on, 639.
- Farmers—
- Assisted Passages for, 93.
- Tree-planting by, 495.
- Farming, 447–485.
- Fauna, 47.
- Control of, in State Forests, 491.
- Feeble-minded, Schools for, 251.
- Fellmongering-works, 562.
- Female Suffrage, 56.
- Fern Lands, 421.
- Fibre, Phormium, 463.
- Exported, 302–329.
- Grading of, 449.
- Fidelity-guarantee Insurance, 728, 731.
- Finance, Public, 589–648.
- Finances of Local Bodies, 683–695.
- Financial Assistance to Soldiers, 435.
- Fire Brigades, 742.
- Fire Districts, 670, 675, 680.
- Fire Inquests, 262.
- Fire Insurance, 733–742.
- State, 741.
- Fire Losses, 739.
- Fire-protection in Forests, 492.
- First Births, 125.
- Sex-proportions, 119.
- First Offenders' Probation, 278.
- Fish Curing and Preserving, 550.
- Fish exported, 307, 502.
- Fisheries, 500–505.
- Fish-hatcheries, 504.
- Fishing Industry Promotion Advances, 648.
- Fishing-boats, 502.
- Fixed Assets of Industries,, 543.
- Fixed Deposits, 710.
- Flax (Phormium Tenax), 421, 463.
- Exports, 302–329.
- Mills, 463, 556.
- Fleeces, Average Weight of, 472.
- Flocks—
- Fowls, 483.
- Sheep, 469.
- Flora, 45.
- Flotation of Loans, 617.
- Flour-mills, 551.
- Fodder Grasses, 460.
- Food and Drugs, Sale of, 211.
- Food, Retail Prices of, 796–806.
- Foodstuffs, Consumption of, 924.
- Football, 926.
- Forces, Military, 287.
- Foreign Consuls, 70.
- Foreign Insurance Companies, 718, 733.
- Foreign Vessels entered and cleared, 379.
- Foreigners naturalized, 97.
- Forestation Companies, 496.
- Forest-produce exported, 304.
- Forestry, 486–499.
- Forwarding Trade, 299, 323.
- Foster-homes for Children, 250.
- Foundries, 560.
- Foveaux Strait Oysters, 503.
- Fowls, 483.
- Fowl-wheat, 457.
- Fractions, Totalizator, 615.
- Fractures: Hospital Cases, 204.
- Franchise, 56.
- Local, 667.
- Free and Dutiable Imports, 364.
- Free Secondary Education, 246.
- Free University Education, 252.
- Freehold, Crown Land made, 430.
- Freehold Tenure, 419, 430.
- Freezing-works, 549.
- Freight Train-mileage, 390.
- French Settlement of Akaroa, 1012–1022.
- Frequency Rates of Factory Accidents, 896.
- Friendly Societies, 743–746.
- Frozen Meat exported, 302–339, 478.
- Frozen-meat Works, 549.
- Fruit Export Control, 464.
- Fruit Industry, The, 463.
- Fruit-preserving, 465.
- Advances, 647.
- Factories, 552.
- Fuel and Light, Retail Prices of, 810.
- Funded Debt, 630.
- Funds—
- Of Banks, 705.
- Of Friendly Societies, 744.
- Of Public Trust Office, 312.
- Furniture-making Works, 564.
G.
- Games, 924.
- Gaols, Prisoners in, 273.
- Gardens, Acreage in, 463.
- Gas-lighting District, 671–695.
- Gasworks, 557.
- Gauge, Railway, 388.
- Geese, 483.
- General Assembly, 54.
- General Election, 926–933.
- Genital Organs, Diseases of, treated in Hospital, 200.
- Geodetic Survey, 442.
- Geographic Board, 444.
- Geographical, 1.
- Geological Survey, 22, 521.
- Geology, 17.
- German Samoa, 2, 964–968.
- Geysers, 5.
- Gift Duty, 613.
- Glaciers, 2.
- Glasshouses, 465.
- Goats, 4–83.
- Goitre, 192.
- Gold exported, 298, 302–329, 507.
- Duty on, 359.
- Goldfields, Subsidized Roads on, 523.
- Gold-mining, 507.
- Gonorrhea, 179, 190.
- Goods carried on Railways, 389.
- Government Departments, 68.
- Employees of, 917.
- Government Insurance—
- Accident, 731.
- Fire, 741.
- Life, 724.
- Government Railways, 387–395.
- Superannuation Fund, 661.
- Government Roads, 399.
- Government, System of, 53.
- Government Valuation of Land, &c., 696–704.
- Government Water-races, 523, 588.
- Governor-General, 60.
- Powers, Duties, &c., 54.
- Governors, Successive, 59.
- Grading—
- Of Dairy-produce, 449, 476.
- Of Fruit, 465.
- Of Honey, 484.
- Of Phormium-fibre, 449.
- Graduated Land-tax, 608.
- Grain Crops, 454.
- Grain-mills, 551.
- Grapes, 465.
- Grass Lands, Acreage of, 421, 465.
- Grass-seed, 461.
- Exported, 320.
- Greasy Wool exported, 473.
- Green Fodder, 460.
- Greenstone, 519.
- Groceries, Retail Prices of, 799.
- Gross Indebtedness, 618.
- Grounds for Divorce, 258.
- Growth of Population, 79.
- Growth of Trade, 291.
- Gum, Kauri, 518.
- Exported, 302–329.
H.
- Habitual Criminals, 277.
- Half-castes, 111.
- Ham and Bacon Curing, 550.
- Hands employed in Factories, 529, 565.
- Hanmer Springs, 5.
- Harbour Hoards, 670–695.
- Hardship Exemption, 609, 777.
- Harness-making, 562.
- Hawaiki, 51.
- Hay, 460.
- Heads of Government Departments, 68.
- Health Act, 206.
- Health, Public, 206–214.
- Heart Disease: Hospital Cases, 194.
- Herd-book Societies, 474.
- Hernia Cases treated in Hospital, 197.
- Hervey Islands, 960.
- Hides exported, 302–329.
- High Schools, 245.
- Technical, 248.
- Higher Education, 251.
- Highway Districts, 57, 397, 670, 674, 680.
- Highways, 396–406.
- Hindus, 91.
- His Majesty's Ships, 289.
- History, 51, 1025.
- Hives of Bees, 484.
- Hogs, 482.
- Holdings, Occupied, 417.
- Home Separators, 450.
- Homes, Benevolent, 223.
- Homes, Children's, 223, 250.
- Home-science Bursaries, 253.
- Homicide, 169, 262.
- Honey, 483.
- Export Control, 485.
- Hops, 462.
- Horahora Electric Supply, 575.
- Horse-racing, 615, 925.
- Horses, 481.
- Horticultural Stations, 449.
- Hosiery-factories, 555.
- Hospital Districts, 214, 670, 675, 680.
- Hospitals, 180–205, 214–229.
- Maternity, 219.
- Mental, 224.
- Private, 219.
- Private Mental, 228.
- Public, 180–205, 218.
- St. Helens, 219.
- Hot Springs, 5.
- Hour of Occurrence of Industrial Accidents, 909.
- Hours of Celebration of Marriage, 133.
- Hours of Labour, 836.
- House of Representatives, 55.
- Members of, 67, 928.
- House-rent, 806.
- Housing, 109, 646.
- Huia, The, 49.
- Hunt Clubs, 926.
- Husbands' Petitions in Divorce, 260.
- Hydatid Cases in Hospitals, 199.
- Hydraulic Sluicing, 508.
- Hydro-electric Power, 571–588.
- Hygiene, 206.
- Social, 179.
I.
- Igneous Rocks, 21.
- Illegitimacy, 126.
- Illegitimate Infants, Deaths of, 155.
- Immigration, 85–91.
- Assisted, 92.
- Restriction, 95.
- Implements, Farm, 450.
- Advances on, 639.
- Imported Items, Wholesale Prices Index of, 821.
- Imports, 331–354.
- Free and Dutiable, 364.
- Of Ports, 372.
- Improved-farm Settlements, 428.
- Improvements, Value of, 696–704.
- Incapacity from Industrial Accidents, 896–910.
- Incomes, 782–795.
- Income-tax, 610, 793.
- Increase in Food-prices during War, 804.
- Increase of Population, 79.
- Indebtedness of Local Bodies, 689.
- Indebtedness, Public, 617–633.
- Indentured Labourers in Samoa, 112, 965.
- Index Numbers, Price, 796–824.
- Index of Mortality, 148.
- Indians, 91.
- Indigenous Forest, 46, 488.
- Individualization of Native Land, 436.
- Industrial Accidents, 893–910.
- Industrial Conciliation and Arbitration, 845.
- Industrial Disputes, 878–892.
- Industrial Life Assurance, 721.
- Industrial Manufacture, 525–570.
- Industrial Schools, 250.
- Industrial Unions, 853–862.
- Industries, Manufacturing, 525–570.
- Infancy, Diseases of, 158, 204.
- Infantile Mortality, 155.
- Infantile Paralysis, 187.
- Infant-life Protection, 155, 251.
- Infectious Diseases—
- Hospital Cases, 186.
- Notification of, 177, 207.
- Prevention of, 207.
- Influenza, 161, 186.
- Injuries in Factories, 893–910.
- Injuries treated in Hospital, 204.
- Inland Fisheries, 504.
- Inmates—
- Of Benevolent and Orphan Asylums, 223.
- Of Gaols, 273.
- Of Hospitals, 180.
- Of Mental Hospitals, 224.
- Inquests, 262.
- Insanity, 224–229.
- Inscribed Stock, 624.
- Insolvency, 760.
- Inspection, Medical, of Schools, 213.
- Inspection of Machinery, 915.
- Instruction, Public, 230–249.
- Instruments, Registration of, 423.
- Insurance, 718–742.
- Intensity of Earthquakes, 26.
- Intercensal Estimates, 83.
- Interest—
- Credited by Post-Office Savings Bank, 713.
- On Local Bodies' Debt, 692.
- On Mortgages, 758.
- On Public Debt, 627.
- Paid by various Accounts, 602, 628.
- Intermediate Customs Tariff, 357.
- International Payments, 297.
- Inter-urban Telephones, 409.
- Intestinal Obstruction: Hospital Cases, 197.
- Intoxicating Liquor—
- Consumption of, 286.
- Sale of, 933.
- Investment Societies, 747.
- Investments, Revenue from, 604.
- Investments, Totalizator, 615.
- Invisible Imports and Exports, 297.
- Iron-foundries, 560.
- Iron-ores, 509.
- Ironsand, 511.
- Islands—
- Adjacent, Population of, 107.
- Administered on Mandate, 2, 964–970.
- Annexed, 1, 959–963.
- Outlying, 1, 958.
- Issue of Bank-notes, 712.
- issue of Deceased Males, 152.
- Issue, Previous, of Parents, 123.
J.
- Jam-factories, 552.
- Joint-stock Companies, 912.
- In Manufacturing Industries, 545.
- Journal of Agriculture, 449.
- Journal, School, 240.
- Judicial Separation, 259.
- June Year Exports, 322.
- Junior Scholarships—
- National, 246.
- University, 252.
- Justice, 257–286.
- Juvenile Offenders, 288.
- Juvenile Probation, 249.
K.
- Kaingaroa Plantation, 494.
- Kakapo, The, 49.
- Kauri-gum, 518.
- Exported, 302–329.
- Kawarau Falls Dam, 508.
- Kea, The, 49.
- Kermadec Islands, 1, 959.
- Flora, 47.
- Kidney-diseases in Hospitals, 200.
- Kiwi, The, 49.
- Kumara Water-races, 523, 588.
L.
- Labour Department Employment
- Bureaux, 865.
- Labour Disputes Investigation Act, 847.
- Labour, Hours of, 836.
- In factories, 567.
- Labour Laws, 840–852.
- Lake Coleridge Works, 573.
- Lakes, 13.
- Lamb consumed and exported, 479.
- Lambs, 469.
- Land and Income Tax, 608.
- Land Boards, 427.
- Maori, 437.
- Land Districts, 427.
- Land Drainage Districts, 668–695.
- Land for Discharged Soldiers, 433.
- Land for Settlements, 431.
- Land, Government Valuation of, 696–704.
- Land Holdings, 417.
- Value of, 771–781.
- Land, Occupation of, 417.
- Land Offices, 427.
- Land Purchase Board, 431.
- Land Tenure and Settlement, 417–446.
- Land Titles, Registration of, 423.
- Land Transfer and Deeds Registration, 423.
- Land, Valuation of, 696–704.
- Lands opened for Selection, 429.
- Land-settlement Finance Associations, 433.
- Land-tax, 608, 779.
- Latest Statistical Information, 1023.
- Law and Crime, 257–286.
- Laws affecting Labour, 840–852.
- Lease, Renewable, 428, 434.
- Leatherware-making, 562.
- Legislation of 1925 and 1926, 936–957.
- Legislative Council, 54.
- Members of, 66.
- Legitimacy of Infants dying, 155.
- Legitimate Births, 122.
- Legitimation Act, 128.
- Legumes, 454, 459.
- Letters of Naturalization, 96.
- Letters Patent, 914.
- Letters posted, 407.
- Letter-telegrams, 410.
- Liabilities—
- Of Bankrupts, 761.
- Of Banks, 707.
- Of Building Societies, 750.
- Of Fire-insurance Companies, 734.
- Of Forestation Companies, 497.
- Of Friendly Societies, 744.
- Of Life-insurance Companies, 723.
- Of Local Bodies, 688.
- Of National Provident Fund, 664.
- Libraries, School, 240.
- Licensed Houses, 934.
- Licenses by Local Bodies, 686, 933.
- Licenses, Publicans', 933.
- Licensing, 933.
- Poll, 935.
- Life, Expectation of, 147, 1006.
- Life Insurance, 718–727.
- State, 724.
- Life Tables, 995–1011.
- Light, Fuel and, Retail Prices of, 810.
- Lighthouses, 385.
- Lignite, 514.
- Lime and Cement Works, 559.
- Limited Certificates of Title, 424.
- Limonite, 509.
- Lincoln Agricultural College, 252.
- Linseed, 460.
- Liver-diseases treated in Hospital, 198.
- Live-stock, 466–485.
- Advances on, 639.
- Carried on Railways, 389.
- Loans—
- Allocation of, 620.
- By Building Societies, 748.
- Dates of Maturity of, 626.
- Domicile of, 625, 691.
- Of Local Bodies, 689.
- Receipts from, 601, 622.
- Redemption of, 601, 622.
- Unexercised Authorities for, 695.
- Local Bodies, 56, 666–695.
- Advances to, 645.
- Assets of, 688, 765.
- Duties under Health Act, 206.
- Employees, 920.
- Superannuation, 662, 672.
- Taxation by, 616, 685.
- Tree-planting by, 495.
- Local Government, 56, 666–695.
- Local Option, 936.
- Local Railway Districts, 669–695.
- Local Taxation, 616, 685.
- Location of Debt, 625, 691.
- Location of New Zealand, 1.
- Lockouts, 878–892.
- Locomotives, 388.
- Lodges, 743.
- London Missionary Society, 962, 966.
- London Prices—
- Of Food, 804.
- Of New Zealand Stock, 626.
- Loss of Wages, 883–890.
- Loss of Work through Factory Accidents, 902.
- Losses from Fires, 739.
- In Forests, 492.
- Lower Departments of Secondary Schools, 247.
- Lunacy, 224–229.
M.
- Macaulay Island, 959.
- Machinery—
- Accidents, 899.
- Factory, 543.
- Farm, 450.
- Inspection of, 915.
- Magistrates' Courts—
- Civil Cases, 257.
- Criminal Cases, 263.
- Magistrates, Superannuation of, 661.
- Magnetic Ironsand, 511.
- Magnetic Observatory, 445.
- Magnetic Survey, 444.
- Mails, 407.
- Main Highways, 396–406.
- Districts, 397, 670, 674, 680.
- Maize, 454, 459.
- Male and Female Death-rates, 144.
- Malformations: Hospital Cases, 203.
- Malthouses, 553.
- Mammalia, 48.
- Mandated Territories, 2, 964–970.
- Mangahao Hydro-electric Scheme, 576.
- Mangaia Island, 959.
- Manganese-ore, 512.
- Mangolds, 462.
- Mangrove Oysters, 503.
- Man-hours lost through Factory Accidents, 902.
- Manihiki Island, 1, 960.
- Manuae Island, 960.
- Manual Education, 239.
- Manual Telephones, 410.
- Manufacturing Production, 525–570.
- Maori Land Boards, 437.
- Maori War Pensions, 651.
- Maoris, 51.
- Births of, 113, 131.
- Children attending Schools, 244.
- Deaths of, 113, 173.
- Half-castes, 111.
- In Mental Hospitals, 228.
- Infantile Mortality of, 175.
- Marriages of, 141.
- Members of Parliament, 55, 68, 933.
- Offences by, 283.
- Population, 110.
- Schools for, 230, 244.
- Maps, Publication of, 445.
- Marine Fish-hatchery, 504.
- Marine Officers' Certificates, 385.
- Market Gardens, 463.
- Marriages, 133–142.
- Dissolution of, 258.
- Masculinity, 82.
- Of Children born, 119.
- Of Children dying, 156.
- Of First-born, 119.
- Of Hospital Patients, 183.
- Of Illegitimate Infants, 121.
- Of Persons dying, 144.
- Of Public-school Children, 239.
- Of Still-born Infants, 129.
- Masseurs, Registration of, 210.
- Mastoid Diseases treated in Hospitals, 194.
- Materials used in Manufacture, 538.
- Maternal Mortality, 167.
- Maternity Allowances, 662.
- Maternity Hospitals, 219.
- Maternity Nurses, Registration of, 209.
- Maturity of Loans, Dates of, 626.
- Mauke Island, 959.
- Measles, 186.
- Meat—
- Consumption of, 478.
- Export Control, 479.
- Export of, 302–329, 478.
- Freezing-works, 549.
- Retail Prices, 802.
- Medical Inspection of Schools, 213.
- Medical Practitioners, Registration of, 208.
- Medicine, School of, Dunedin, 220.
- Medicinal Waters, 5.
- Mental Defectives, 224.
- Mental Hospitals, 224–229.
- Mercury-mines, 513.
- Meridional Circuits, 441.
- Metal-mines, Accidents at, 520.
- Meteorology, 27–45.
- Midwives, Registration of, 209.
- Migration, External, 85–91.
- Mileage of—
- Railways, 388.
- Roads, 396.
- Telegraph lines and wire, 409.
- Telephone lines and wire, 412.
- Military Forces, 287.
- Military Pensions, 651.
- Milk exported, 306, 319.
- Milking-machines, 450.
- Milk-testing, 449, 474.
- Milling-timber Resources, 487.
- Milling-wheat, 456.
- Mills, Wool used at, 472.
- Mineral Waters, 5.
- Minerals, 506–524.
- Miners' Pensions, 651.
- Minimum Wage Rates, 829.
- Mining, 506–524.
- Accidents, 520.
- Act, 851.
- Examinations under, 524.
- Advances, 521.
- Produce exported, 304, 506.
- Water-power for, 523, 588.
- Ministers of each Denomination, 141.
- Marriages by, 140.
- Ministries, Successive, 60.
- Ministry, Coates, 62.
- Minors, Marriages of, 133, 140.
- Mission Schools, 230, 962, 966, 972.
- Missionaries, Arrival of, 52.
- Mitiaro Island, 960.
- Moa, The, 49.
- Money, Purchasing-power of, 809, 813.
- Money-orders issued and paid, 408.
- Moratorium, 759, Morbidity, 177–205.
- Mortality, Index of, 148.
- Mortality, Infantile, 155.
- Mortality Investigation, 147, 995–1011.
- Mortgage Duty, 613.
- Mortgage Exemption, 609, 777.
- Mortgages, 751–759.
- Mortgage-tax, 608.
- Mothers, Ages of, 122.
- In Illegitimate Cases, 127.
- In Still-born Cases, 129.
- Motive Power in Factories, 534.
- Motor-car Comprehensive Insurance, 728, 731.
- Motor-omnibus Traffic, 955.
- Motor-vehicles, Registration of, 401, Motor-vessels registered, 378.
- Motor-works, 562.
- Mountains, 2.
- Mouth, Diseases of the, 196.
- Movement of Specie and Bullion, 298.
- Mud Baths, 5.
- Mules, 482.
- Multiple Births, 121.
- Mutton consumed and exported, 478.
- Mutual Fire Insurance, 740.
N.
- Nassau Island, 960.
- National Endowments, 428.
- National Prohibition, 935.
- National Provident Fund, 662.
- National Scholarships, 246.
- National Wealth, 771.
- Nationality—
- Of Migrants, 90.
- Of Naturalized Persons, 97.
- Of Vessels, 379.
- Native Appellate Court, 437.
- Native Grasses, 421, 465.
- Native Land Court, 436.
- Native Lands, 436.
- Rates on, 677.
- Native Schools, 230, 244.
- Native Succession Duty, 612.
- Native Trust Office, 438.
- Native-land Purchase, 438.
- Nativity Order, 120, 123, 130.
- Natural Increase of Population, 81, 116.
- Naturalization, 96.
- Nauru Island, 2, 968.
- Naval Defence, 288.
- Navigable Rivers, 7.
- Navigators Islands, 2, 964–968.
- Navy, 288.
- Nephrite, 519.
- Nervous System, Diseases of, 193.
- Net Indebtedness, 632.
- New-Zealand-born, Offences by, 282.
- “New Zealand,” H.M.S., 288.
- New Zealand Produce exported, 302–329.
- New Zealand University, 251.
- Newspapers—
- Posted, 407.
- Registered, 408.
- Night Letter-telegrams, 410.
- Nisi Decrees in Divorce, 259.
- Niue Island, 1, 960.
- No-license Issue, 935.
- Nominal Wages, 826–835.
- Nomination of Assisted Immigrants, 92.
- Note-issue of Banks, 712.
- Tax on, 606.
- Notification of Births, 113.
- Notification of Diseases, 177, 207.
- Notornis, The, 49.
- Nullity of Marriage, 259.
- Nurseries and Plantations, 463.
- State, 495.
- Nurses, Registration of, 209.
- Nurses, Retiring-allowances to, 663.
O.
- Oats, 458.
- Exported, 302, 458.
- Occupation of Land, 417.
- Occupation with Right of Purchase, 428, 434.
- Occupations—
- Of Bankrupts, 762.
- Of Deceased Males, 151.
- Of Immigrants, 90.
- Of Taxpayers, 774, 785.
- Ocean Cables, 414.
- Ocean Island, 969.
- Offences, 263–270.
- Offenders Probation Act, 278.
- Officers, Military, 287.
- Official Assignees, 760.
- Official Representatives Abroad, 70.
- Officiating Ministers, 141.
- Oil, 518.
- Oilskin-factories, 563.
- Old Age, Deaths from, in Hospital, 204.
- Old-age Pensions, 649.
- Onakaka Iron-ore, 509.
- Operations in Hospitals, 205.
- Opossum Trapping, 492.
- Orchards, 463.
- Origin of Imports, 340–354.
- Origins of Earthquakes, 24.
- Ornamental Stones, 519.
- Orphan Asylums, 223.
- Orphanhood, 152.
- Osmiridium, 513.
- Otekaike Special School, 251.
- Otira Tunnel, 387.
- Outlying Islands, 1, 958.
- Overdraft Rates, 711.
- Oversea Companies registered, 912.
- Oversea Shipping, 378.
- Oversea Trade, 291–377.
- Overseas Representatives, 70.
- Overtime in Factories, 567.
- Oyster-beds, 503.
P.
- Pacific Cable, 414.
- Pacific Islands, Annexed, 1, 959–963.
- Packet Licenses, 933.
- Palmerston Island, 1, 960.
- Papatupu Land, 436.
- Parapara Iron-ore Deposit, 509.
- Parcel-post, 408.
- Parents, Ages of, 122, 129.
- Parliament, 54.
- Parliamentary Elections, 56, 927–933.
- Parliamentary Reports, 76.
- Parliaments, Successive, 64.
- Parry Island (Mauke), 959.
- Party-line Telephones, 411.
- Passages at Reduced Rates, 92.
- Passengers, Railway, 389.
- Passports, 95.
- Pastoral Produce exported, 302–329.
- Pastoral Production, 466–485.
- Pasture Grasses, 465.
- Patents, Designs, and Trade-marks, 914.
- Patients in Mental Hospitals, 224.
- Patients in Public Hospitals, 180, 218.
- Payers of Income-tax, 783–795.
- Payers of Land-tax, 772–781.
- Peas and Beans, 454, 459.
- Export of, 320, 459.
- “Pelorus Jack,” 48.
- Pelts, Export of, 302–329.
- Penguins, 49.
- Penrhyn Island, 1, 960.
- Pensions, 649–655.
- Peritonitis Cases in Hospital, 198.
- Permanent Building Societies, 747.
- Permanent Heads of Departments, 68.
- Permanent Military Forces, 287.
- Permission to enter New Zealand, 95.
- Permits and Passports, 95.
- Permits, Building, 110.
- Personal-accident Insurance, 728, 731.
- Petitions—
- Bankruptcy, 760.
- Divorce, 259.
- Petroleum, 518.
- Petrological Laboratory, 405.
- Pharmacy, 212.
- Pharynx, Diseases of, Hospital Cases, 196.
- Phormium Tenax, 421, 463.
- Fibre exported, 302–329.
- Grading of Fibre, 449.
- Mills, 483, 556.
- Phosphate Rock, 519.
- From Nauru Island, 969.
- Phthisis, 163, 189.
- Miner's, 651.
- Physical Education, 241.
- Physiography, 1–50.
- Pickle-factories, 554.
- Pig-iron Manufacture, 509.
- Pigs, 482.
- Wild, 492.
- Pisciculture, 504.
- Plantations, 463.
- State, 493.
- Planting of Oysters, 503.
- Plate-glass Insurance, 728, 731.
- Platinum, 513.
- Pleasant Island, 968.
- Plumbers Registration, 211.
- Plural Births, 121.
- Pneumonia Cases in Hospital, 195.
- Police, 262.
- Provident Fund, 657.
- Policies, Insurance, 718–742.
- Polling—
- At General Election, 927–933.
- At Licensing Polls, 935.
- At Rating Polls, 682.
- Poll-tax on Chinese, 92.
- Population, 78–112.
- Of Cook Islands, 111, 961.
- Of Western Samoa, 112, 965.
- Pork consumed, 483.
- Portfolios of Ministers, 62.
- Portobello Marine Fish Butchery, 504.
- Ports—
- Of Entry, 371.
- Shipping of, 382.
- Trade of, 371–377.
- Pest Office Employees, 416, 917.
- Accidents to, 894–910.
- Post Office Savings-bank, 712.
- Postal and Telegraphic, 407–416.
- Postal Notes, 409.
- Post-primary Education, 245.
- Potatoes, 461.
- Pottery-works, 5–59.
- Poultry, 483.
- Pounamu, 519.
- Power in Factories, 534.
- Power, Water, 571–588.
- Pratique, Granting of, 207.
- Preferential Tariff, 357, 366.
- Premature Birth, 158.
- Premiers, Successive, 60.
- Premium Income of Insurance Companies, 719–742.
- Pre-natal Influences, 157.
- Preserved Milk exported, 306, 319.
- Press Telegrams, 409.
- Prevention of Quackery, 212.
- Previous Convictions of Prisoners, 276.
- Previous Issue of Parents, 123.
- Prices, 796–824.
- Effect on Exports, 324.
- Of Stock, 626.
- Primage Duty, 356.
- Primary Schools, 230–245.
- Principal Events, 1025.
- Principal Exports, 302–329.
- Printing Establishments, 561.
- Prisoners, 273.
- New-Zealand-born, 283.
- Prisons, 273.
- Prisons Board, 277.
- Private Hospitals, 219.
- Private Mental Hospital, 228.
- Private Railways, 395.
- Private Savings-banks, 716.
- Private Schools, 243.
- Private Wealth, 767.
- Probate, Estates passed for, 770.
- Probation, 278.
- Juvenile, 249.
- Probationer Teachers, 241.
- Proclamation of British Sovereignty, 52.
- Production—
- Agricultural and Pastoral, 447–485.
- Factory, 525–570.
- Mineral, 506–524.
- Value of, 921.
- Production Districts, Exports of, 373.
- Productive Activity, 923.
- Profits-tax, 610.
- Prohibited Immigrants, 95.
- Prohibition Issue, 935.
- Prohibition Orders, 286.
- Prorogation of Parliament, Dates of, 64.
- Prospecting, State Aid to, 521.
- Prospecting-drills, Government, 521.
- Protection of Infant Life, 155, 251.
- Protection of Wages, 845.
- Provident Fund, National, 662.
- Provincial Districts, 57.
- Educational Systems, 231.
- Industries in, 526.
- Population of, 99.
- Provisional State Forests, 487.
- Public Debt, 617–633.
- Repayment of, 629, 937.
- Public Finance, 589–648.
- Public Health, 206–214.
- Public Hospitals—
- Admissions and Discharges, 180.
- Diseases treated in, 183–205.
- Finances, 214.
- Public Instruction, 230–249.
- Public Reserves, 417, 429.
- Public Schools, 237.
- Public Service, 69.
- Employees and Salaries, 917.
- Superannuation, 657.
- Public Trust Office, 911.
- Public Wealth, 764.
- Public Works—
- Accidents, 894–910.
- Co-operative System, 917.
- Employees, 916.
- Fund, 595.
- Publicans' Licenses, 933.
- Publications, 1029.
- Educational, 240.
- Statistical, 74.
- Puerperal Accidents and Diseases, 167, 201.
- Pukapuka Island, 1, 960.
- Pulmonary Tuberculosis, 163, 189.
- Pulse Crops, 454, 459.
- Punishments by Magistrates' Courts, 266.
- Punishments by Supreme Courts, 271.
- Pupils at Public Schools, 237.
- Pupil-teachers, 241.
- Purchase of Estates for Settlement, 431.
- Purchase of Native Lands, 438.
- Purchase of Dwellings, 435, 647.
- Purchasing-power of Money, 809, 813.
Q.
- Quackery-prevention, 212.
- Quadruplets, 121.
- Quarantine, 207.
- Quarries, 519.
- Accidents at, 520.
- Quarterly Statistics—
- Banking, 707–715.
- Births, 117.
- Deaths, 144.
- Marriages, 136.
- Prices, 798–813.
- Trade, 294.
- Quartz-mining, 507.
- Quicksilver-mining, 513.
- Quinnat Salmon, 505.
- Quinquennial Census, 78.
- Quorum—
- Executive Council, 54.
- House of Representatives, 56.
- Quotations, New Zealand Stock, 626.
R.
- Rabbit Districts, 671, 675, 681.
- Rabbit-skins, Exports of, 320.
- Race Aliens, 91.
- Racing, 925.
- Tax on, 615.
- Radio-telegraph, 412.
- Railway Accidents, 395, 894–910.
- Railway Crossings, 406.
- Railway Districts, 669–695.
- Railways, 387–395.
- Private, 395.
- Revenue and Expenditure, 591.
- Superannuation Fund, 661.
- Rain Forests, 488.
- Rainfall, 27–45.
- Rakaanga Island, 1, 960.
- Rams, 469.
- Rarotonga Island, 959.
- Rateable Value of Land, 700.
- Rates collected by Local Bodies, 616, 685.
- Rates of Interest-On Local Bodies' Debt, 691.
- On Mortgages, 758.
- On Public Debt, 627.
- Paid by Post Office Savings-bank, 712.
- Rating by Local Bodies, 675–681.
- On Unimproved Value, 681.
- Reapers-and-binders, 451.
- Rebate of Rent, 428.
- Receipts-tax, 606.
- Reception of Assisted Immigrants, 94.
- Reciprocity, 366.
- Redemption of Loans, 601, 622, 629.
- Reduced Passage-rates for Assisted Immigrants, 92.
- Re-exports, 299, 323.
- Reformative Detention, 277.
- Registered Companies, 912.
- Registered Mortgages, 752.
- Registered Vessels, 378.
- Registrars, Marriages before, 140.
- Registration—
- Of Adopted Children, 128.
- Of Apiaries, 484.
- Of Births, 113.
- Of Chemists, 212.
- Of Companies, 912.
- Of Dairies, 476.
- Of Dairy Companies, 476.
- Of Dead-births, 113, 129.
- Of Deaths, 143.
- Of Deeds, 424.
- Of Dentists, 209.
- Of Designs, 915.
- Of Electors, 56.
- Of Friendly Societies, 743.
- Of Industrial Unions, 853–862.
- Of Marriages, 133.
- Of Masseurs, 210.
- Of Medical Practitioners, 208.
- Of Mortgages, 752.
- Of Motor-vehicles, 401.
- Of Newspapers, 408.
- Of Nurses and Midwives, 209.
- Of Orchards, 465.
- Of Patents, 914.
- Of Pharmaceutical Chemists, 212.
- Of Plumbers, 211.
- Of Private Schools, 243.
- Of Still-births, 113, 129.
- Of Titles, 423.
- Of Trade-marks, 915.
- Of Trade Unions, 853–862.
- Of Vessels, 378.
- Relief Fund, Coal-miners', 524.
- Religious Denominations—
- Marriages by Ministers of, 140.
- Ministers on Marriage List, 141.
- Renewable Leases, 428, 434.
- Rent, Rebate of, 428.
- Rents, Government Revenue from, 604.
- Rents, House, 806.
- Repatriation Advances, 646.
- Repayment of Public Debt, 629, 937.
- Representatives abroad, 70.
- Representatives, Members of House of, 67, 928–933.
- Research Scholarships, 252.
- Reserve Funds of Banks, 705.
- Reserves, Public, 417, 429.
- Respiratory Diseases: Hospital cases, 195.
- Restitution of Conjugal Rights, 258.
- Restriction, Immigration, 95.
- Retail Prices, 796–815.
- Revaluation of Soldier Properties, 435.
- Revenue—Customs, 360.
- Hospital, 215.
- Local Body, 684.
- Postal, 415.
- Public, 589–605.
- Railway, 391, 591.
- Revocation of Naturalization, 97.
- Rhodes Scholarships, 252.
- Richmond Special School, 251.
- Rifle Clubs, 287.
- River Districts, 668–695.
- Rivers, 7.
- Road Districts, 57, 668–695.
- Roads, 396–406.
- On Goldfields, Subsidized, 523.
- Rock Oysters, 503.
- Rolling-stock, Railways, 388.
- Roman Catholic Schools, 243.
- Root Crops, 461.
- Ross Dependency, 2, 970.
- Bibliography of, 1035.
- Rossi-Forel Scale, 26.
- Rotorua Nursery, 495.
- Rotorua Thermal Springs, 5.
- Rugby Football, 926.
- Rural Advances, 642, 953.
- Rural Population, 99.
- Rural Security, Mortgages on, 754.
- Rural-mail Deliveries, 407.
- Rye, 462.
- Rye-grass, 462.
S.
- Saddlery-making, 562.
- Sailing-vessels registered, 378.
- Sailmaking-factories, 563.
- St. Helens Hospitals, 219.
- Sale of Food and Drugs, 211.
- Salmon, Acclimatization of, 504.
- Samoa, 2, 964–968.
- San Pablo Island, 960.
- Sanatoria, 5, 180, 189, 218.
- Sanitary Plumbing, 211.
- Sanitation, 206.
- In Western Samoa, 966.
- Sauce-factories, 554.
- Sausage-casings, Exports of, 320.
- Savage Island, 1, 960.
- Savai'i Island, 965.
- Savings-banks, 712–717.
- Sawmills, 488, 557.
- Scaffolding Accidents, 893.
- Scaffolding and Excavation Act, 851.
- Scarlet Fever, 186.
- Scheelite, 512.
- Scholars, 230–249.
- Scholarships, 246, 252.
- School Committees, 235.
- School Journal, 240.
- School Libraries and Class-books, 240.
- School-children, 230–249.
- Dental Treatment for, 213.
- Medical Inspection of, 213.
- Schools, 230–249.
- Medical Inspection of, 213.
- Of Mines, 522.
- Scoured Wool exported, 473.
- Scrub Lands, 421.
- Sea-fisheries, 500.
- Seals, 504.
- Seamen's Strike, 879.
- Season Tickets, Railway, 389.
- Secondary Education, 245.
- Second-growth Land, 421.
- Seed-gardens, 463.
- Seeds, Grass and Clover, 461.
- Exported, 320.
- Seismology, 22.
- Selections of Land, 429.
- Selwyn Plantations, 495.
- Senior Cadets, 287.
- Senior Scholarships—
- National, 246.
- University, 252.
- Sentences on Criminals, 266, 271.
- Separate Rates, 685.
- Separation, Judicial, 259.
- Separators, Cream, 450.
- Sessions, Parliamentary, Successive, 64.
- Settlement and Colonization, 52.
- Settlement Conditions, Selections under, 429.
- Settlement Surveys, 441.
- Settlements, Land for, 431.
- Settlers, Advances to, 634.
- Severities of Industrial Accidents, 903.
- Sex Proportions, 82.
- Of Children born, 119.
- Of Children dying, 156.
- Of First-born, 119.
- Of Hospital Patients, 183.
- Of illegitimate Infants, 121.
- Of Persons dying, 144.
- Of Public-school Children, 239.
- Of Still-born Infants, 129.
- Shearing-machines on Farms, 451.
- Sheep, 467.
- Sheep-skins and Pelts exported, 302–329.
- Sheet-metal Works, 560.
- Shipbuilding-works, 563.
- Shipping, 378–386.
- And Seamen Act, 849.
- Ships, Survey of, 385.
- Shipwrecked Mariners, Depots for, 958.
- Shops and Offices Act, 848.
- Short-time in Factories, 568.
- Sick and Accident Funds, 524.
- Sick and Funeral Funds, 744.
- Sickness, 177–205.
- Silver, 509.
- Exported, 321.
- Silviculture, 490.
- Singapore Naval Base, 290.
- Sinking Funds, 631.
- Sister-in-law, Marriage with, 133.
- Skin-diseases treated in Hospital, 203.
- Skins, Export of, 302–329.
- Slaughter of Animals for Food, 478, 482.
- Slaughterhouses, 449.
- Sliped Wool exported, 473.
- Slot Telephones, 411.
- Sluicing, 508.
- Snares Islands, 1, 958.
- Soap-factories, 554.
- Social Hygiene Regulations, 179.
- Soldiers, 287.
- Acquisition of Land by, 433.
- Dwellings, 435.
- Financial Assistance to, 435, 646.
- Pensions, 652.
- Settlement of, 433.
- War Bursaries for Dependants, 247.
- Source of Income, 785.
- South Africa, Reciprocity with, 368.
- South African War, 288.
- Pensions, 654.
- Southern Alps, 2.
- Sown Grasses, Extent of, 465.
- Spas, 5.
- Special Articles in previous Issues, 1036.
- Special Rates, 685.
- Special Schools, 250.
- Special Trade, 299.
- Specie, Movement of, 298.
- Spirits, Consumption of, 286.
- Sports, 924.
- Springs, Hot, 5.
- Stakes, Tax on, 615.
- Stamp Duties, 613.
- Standardized Birth-rates, 115.
- Standardized Death-rates, 148.
- Standardized Marriage-rates, 134.
- Stanley's Mission to Akaroa, 1012–1022.
- State Accident Insurance, 731.
- State Advances, 634–648.
- State Afforestation, 493.
- State Aid—
- To Cold Storage, 648.
- To Discharged Soldiers, 435, 646.
- To Fishing Industry, 648.
- To Fruit-preserving Industry, 647.
- To Housing, 647.
- To Immigrants, 92.
- To Kauri-gum Industry, 518.
- To Local Authorities, 645.
- To Mining, 521.
- To Settlers, 634.
- To Tree-planting, 498.
- To Water-power Development, 573–579.
- To Workers, 642.
- State Assets, 623, 764.
- State Coal-mines, 517.
- State Employees, 917.
- State Fire Insurance, 741.
- State Forests, 487.
- State Indebtedness, 617–633.
- State Instruction, 230–249.
- State Insurance—
- Accident, 731.
- Fire, 741.
- Life, 724.
- State Railways, 387–395.
- State Schools, 237.
- State Water-power Supply, 573–579.
- Statistical Information, Latest, 1023.
- Statistical Legislation, 72.
- Statistical Organization, 72–77.
- Statistical Publications, 74.
- Statistical Summary, 973–994.
- Steam-vessels Registered, 378.
- Stewart Island, 1.
- Oysters, 503.
- Still-births, 129.
- Stipendiary Magistrates' Courts-Civil Cases, 257.
- Criminal Cases, 263.
- Stock, Character of, 624.
- Stock, Live, 466–485.
- Advances on, 639.
- Stock, Quotations for, 626.
- Stomach-diseases treated in Hospital, 196.
- Stones, Building and Ornamental, 519.
- Stop-work Meetings, 878.
- Stratigraphy, 18.
- Streams, 7.
- Streets, Length of, 396.
- Strikes, 878–892.
- Stud Sheep, 469.
- Students, University, 252.
- Subdivision of Land, 431.
- Submarine Cable, 415.
- Subsidiary Accounts or Funds, 599.
- Subsidized Prospecting, 521.
- Subsidized Roads on Goldfields, 523.
- Succession Duty, 612.
- Suffrage, 56.
- Sugar, Duty on, 358.
- Sugar-prices, 799.
- Suicide, 169, 262.
- Sulphur, 514.
- Summary Convictions, 264.
- Summary of Legislation, 936–957.
- Summer Sports, 925.
- Summons Cases, 267.
- Sumner School for Deaf, 251.
- Sunday Island, 959.
- Sunshine, 28–34.
- Superannuation, 656–662.
- Super-tax, 609, 610.
- Supreme Court—
- Civil Cases, 257.
- Criminal Cases, 268.
- Surtax, Preferential, 357, 366.
- Surveys 440–446.
- Geological, 22, 521.
- Of Ships, 385.
- Suwarrow Island, 1, 960.
- Sympathetic Strikes, 878–892.
- Syphilis, 179, 190.
T.
- Takahe, The, 49.
- Takutea Island, 960.
- Tallow exported, 302–329.
- Tanning Establishments, 562.
- Taranaki Ironsand, 511.
- Taranaki Scholarships, 252.
- Tariff, Customs, 355–359.
- Tasman's Discovery of New Zealand, 51.
- Tax, Land and Income, 608.
- Tax on Totalizator Investments, 615.
- Taxation, 606–616.
- Local, 616, 684.
- Taxpayers, 772–795.
- Tea, Duty on, 358.
- Teachers, Public-school, 241.
- Superannuation Fund, 660.
- Training of, 242.
- Te Au-o-Tu Island, 960.
- Technical Education, 248.
- Telegraph, Electric, 409.
- Telephones, 410.
- Temperature, 27–45.
- Temporary Visitors, 87.
- Tenements, 109.
- Tent-factories, 563.
- Tenure of Occupied Lands, 419.
- Tenures under which Land selected, 428, 433.
- Terminating Building Societies, 747.
- Territorial Forces, 287.
- Thermal Regions, 5.
- Three Kings Islands, 1, 958.
- Threshing-machines, 452.
- Tidal Survey, 444.
- Tile-making, 559.
- Timber—
- Carried on Railways, 390.
- Export, 302–329, 489.
- Duty, 359.
- Output, 488, 557.
- Plantations, 493.
- Resources, 487.
- Trees, 488.
- Time lost through Industrial Accidents, 902.
- Time of Occurrence of Industrial Accidents, 909.
- Tin, 513.
- Tinware-works, 560.
- Tire-tax, 360, 607.
- Title, Certificates of, issued, 425.
- Titles, Compulsory Registration of, 423.
- Tobacco, Excise Duty on, 359.
- Tokelau Islands, 2, 972.
- Toll Communications, 409.
- Toll-gates, 403.
- Tolls, 686.
- Tomato-culture, 465.
- Tongareva Island, 1, 960.
- Ton-miles, Railway, 390.
- Tonnage of Shipping, 378–384.
- Tonnage of Trade, 374.
- Tonnage Statistics, Port, 374.
- Tonsils: Hospital Cases, 196.
- Topographical Survey, 443.
- Totalizator Taxation, 615.
- Tourists, 86.
- Town Districts, 57, 667–695.
- Capital and Unimproved Values, 704.
- Population, 106.
- Town-planning, 952.
- Tractors on Farms, 451.
- Trade, 291–377.
- Representatives, 70.
- Trade-marks, 915.
- Trade-unions, 853–862.
- Unemployment among Members, 875.
- Training-farm, 251.
- Training of Defence Forces, 288.
- Training of Teachers, 242.
- Train-miles run, 389.
- Tramway District, 669–695.
- Transfer, Land, 423.
- Transfers between Accounts, 603.
- Transhipments, 376.
- Transit Trade, 299, 323.
- Travelling Scholarships, 252.
- Trawlers, 502.
- Treasury Bills, 624.
- Treaty of Waitangi, 52.
- Tree-planting, 493.
- Trees, Indigenous, 46, 488.
- Triangulation, 441.
- Trigonometrical Stations, 442.
- Triplets, 121.
- Trotting Clubs, 925.
- Trout, Acclimatization of, 504.
- Truck Act, 845.
- Trust Funds, 750.
- Tuatara, The, 50.
- Tuberculosis, 163, 189.
- Tumour Cases in Hospitals, 192.
- Tungsten-ore, 512.
- Turkeys, 483.
- Turnips, 462.
- Tussock Land, 421, 465.
- Twins and Triplets born, 121.
U.
- Undesirable Immigrants Exclusion, 95.
- Undeveloped Water-power, 586.
- Unemployment, 863–877.
- Unexercised Loan Authorities, 695.
- Unimproved Occupied Land, 421.
- Unimproved Value of Land, 696–704.
- Holdings, 771–781.
- Land-tax assessed on, 608.
- Rating on, 681.
- Union Islands, 2, 972.
- Unions, Trade, 853–862.
- University Education, 251.
- Unpaid Totalizator Fractions, 615.
- Unproductive Land, 417, 421.
- Upolu Island, 965.
- Urban Areas—
- Births, 118.
- Deaths, 152.
- Population, 103.
- Urban Drift, 100.
- Urban Population, 99.
- Urban Security, Mortgages on, 754.
- Urgent Telegrams, 409.
- Urinary Diseases treated in Hospital, 200.
V.
- Valuation of Land, 696–704.
- Value of Exports affected by Prices, 324.
- Value of Land Holdings, 771–781.
- Value of Production, 921.
- Vegetation, 45.
- Vehicles—
- Motor, 401.
- Railway, 388.
- Venereal Diseases—
- Control of, 179.
- Hospital Cases, 190.
- Vessels—
- Employed in Fishing Industry, 502.
- Entered and cleared, 378.
- Nationality of, 379.
- Registered, 378.
- Survey of, 385.
- War, 289.
- Vice-regal Representatives, 59.
- Village Settlements, 428.
- Villages, Population of, 107.
- Vinegar-factories, 554.
- Vineyards, 465.
- Violent Deaths, 169, 262.
- Virgin Bush, Area of, 421, 486.
- Visitors, 87.
- Vital Statistics, 113–205.
- Viticulture, 465.
- Volcanoes, 2, 21.
- Voluntary Inmates of Mental Hospitals, 226.
- Voting—
- At General Election, 927–933.
- At Licensing Polls, 935.
- At Rating Polls, 682.
W.
- Wages, 825–835.
- Lost through Industrial Disputes, 883–890.
- Of Factory Employees, 530, 565.
- Of Employees of General and Local Governments, 917.
- Protection, 845.
- Waikare£moana Power-supply, 577.
- Waikato Power-supply, 575.
- Waiotapu Forest Plantation, 494.
- Waipori Power-supply, 577.
- Waitangi, Treaty of, 52.
- Wakari Private Mental Hospital, 228.
- War, 288.
- Bursaries, 247.
- Expenditure, 616.
- Increases in Food-prices, 804.
- Indebtedness, 616.
- Loans Sinking Fund, 629.
- Pensions, 652.
- Tax, 610.
- Warships, 289.
- Washed Wool exported, 473.
- Washington Conference, 288.
- Water-power, 571–588.
- Waterproof-material Factories, 554.
- Water-races, Government, 523, 588.
- Water-supply Districts, 669–695.
- Wealth, 764–781.
- Weather, 27–45.
- Weekly Wage-rates, 829.
- Weka, The, 49.
- Welfare of Children, 249.
- Weraroa Training-farm, 251.
- Western Samoa, 2, 964–988.
- Bibliography of, 1034.
- Births in, 132.
- Deaths in, 176.
- Marriages in, 142.
- Population of, 112.
- Wethers, 469.
- Whakarewarewa Forest Plantation, 493.
- Whales, 48.
- Whaling, 48,52, 503, 971.
- Wheat, 454.
- Export of, 302.
- White Island Sulphur, 514.
- Wholesale Licenses, 933.
- Wholesale Prices, 815–822.
- Widows left by Married Men, 154.
- Widows' Pensions, 650.
- Wills administered by Public Trust Office, 912.
- Wind, 27–45.
- Wine, Consumption of, 286.
- Wine Licenses, 933.
- Winter Sports, 926.
- Wire (Telegraph), Miles of, 409.
- Wireless Telegraphy, 412.
- Requirements on Vessels, 850.
- Withdrawals from Savings-banks, 713–716.
- Wives' Petitions in Divorce, 260.
- Women, Deaths of, in Childbirth, 167.
- Women, Offences by, 282.
- Women's Suffrage, 56.
- Wool, 471.
- Exported, 302–329, 472.
- Used at Local Mills, 472, 564.
- Woollen-mills, 564.
- Wool purchased by, 472.
- Wool-presses on Farms, 451.
- Wool-scouring Works, 562.
- Workers, Advances to, 642.
- Workers' Compensation, 843.
- Insurance, 728, 731.
- Workers' Dwellings, 646.
- Workers' Educational Association, 255.
- Workers' Unions, 853–862.
- Working Railways Account, 392, 591.
- Working-days lost through Industrial Disputes, 881–892.
- Working-hours, 836.
- World's Cattle, 476.
- World's Coal-production, 518.
- World's Gold-production, 509.
- World's Sheep Flocks, 471.
- Wrecks, 386.
Y.
- Year-book, The, 75.
- Yields of Crops, 454–465.
Z.
- Zoology, 47.