
Table of Contents
WITH this the twenty-ninth number of the Year-book it had been hoped to mark a return to the pre-war standard of early publication. That this hope was not realized was attributable firstly to the drastic reduction in size necessitated by the prevailing paper-shortage, and, secondly, to the late availability of much of the material included in the volume, this latter in itself being largely an indirect result of the paper-shortage also.
This number is the smallest ever issued under the title of “New Zealand Official Year-book,” and limitations of space have precluded the introduction of new features to any great extent. It was found a difficult task in the time available to retain with some degree of coherency all features of outstanding interest. In all cases the matter presented is of necessity treated with the utmost brevity, and other portions have had to be entirely omitted.
For more recent statistics than are contained herein the reader is referred to the “Monthly Abstract of Statistics” issued from this Office, while in many instances more detailed particulars can be obtained from the annual volumes of “Statistics of New Zealand.”
MALCOLM FRASER
Government Statistician.
Census and Statistics Office, Wellington, N.Z., 25th February, 1921.
Table of Contents
THE estimated population of the Dominion on 31st December, 1919, was 1,164,405 persons. This total does not include Maoris nor residents of the Cook and other Pacific islands annexed in 1901. The Maori population at the census of 1916 was 49,776, that of the annexed islands, 12,797.
| — | Males. | Females. | Total. |
|---|---|---|---|
* Excluding Maoris and residents of Cook and other Pacific Islands. † Including members of Expeditionary Forces. | |||
| Estimated population at end of 1918* | 542,046 | 566,327 | 1,108,373 |
| Increase during 1919— | |||
| By excess of births over deaths | 6,380 | 7,295 | 13,675 |
| By excess of immigration over emigration† | 40,462 | 1,895 | 42,357 |
| Estimated population at end of 1919* | 588,888 | 575,517 | 1,164,405 |
| Maori population, census 1916 | 25,933 | 23,843 | 49,776 |
| Population of Cook and other Pacific islands, census 1916 | 6,552 | 6,245 | 12,797 |
| Total estimated population of the Dominion on 31st December, 1919 | 621,373 | 605,605 | 1,226,978 |
The population, exclusive of Maoris and residents of the annexed islands, at each census since 1874 is given in the following statement, together with the numerical and centesimal increase between the successive enumerations:—
| Date of Enumeration. | Population. | Numerical Increase. | Centesimal Increase. | |
|---|---|---|---|---|
| March, | 1874 | 299,514 | 114,898 | 38.36 |
| March, | 1878 | 414,412 | 75,521 | 18.22 |
| April, | 1881 | 489,933 | 88,549 | 18.07 |
| March, | 1886 | 578,482 | 48,176 | 8.33 |
| April, | 1891 | 626,658 | 76,702 | 12.24 |
| 1896 | 703,360 | 69,359 | 9.86 | |
| March, | 1901 | 772,719 | 115,859 | 14.99 |
| April, | 1906 | 888,578 | 119,890 | 13.49 |
| April, | 1911 | 1,008,468 | 90,981 | 9.02 |
| October, | 1916 | 1,099,449 |
The Cook Islands are not included in any of the statistics of New Zealand quoted throughout this book. Figures re Maoris are included in the general details in a few cases only—i.e., imports and exports, savings-bank deposits, &. Where Maoris are included they swell totals to a much less extent per head than does the European population. The figures given below, therefore, do not include Maoris and residents of Cook Islands.
| Year. | Estimated Population at End of Year. | Increase during Year. | Mean Population for Year. | |||
|---|---|---|---|---|---|---|
| Males. | Females. | Totals. | Numerical. | Per Cent. | ||
* Decrease. † Census population. | ||||||
| 1910 | 529,998 | 474,388 | 1,004,386 | 21,460 | 2.18 | 992,802 |
| 1911 | 539,729 | 485,677 | 1,025,406 | 21,020 | 2.09 | 1,014,896 |
| 1912 | 553,212 | 499,415 | 1,052,627 | 27,221 | 2.65 | 1,039,016 |
| 1913 | 569,109 | 515,553 | 1,084,662 | 32,035 | 3.04 | 1,068,644 |
| 1914 | 568,161 | 527,833 | 1,095,994 | 11,332 | 1.04 | 1,090,328 |
| 1915 | 563,963 | 538,831 | 1,102,794 | 6,800 | 0.62 | 1,099,394 |
| 1916 | 549,895 | 550,668 | 1,100,563 | -2,231 | -0.20* | 1,099,449† |
| 1917 | 537,360 | 560,312 | 1,097,672 | -2,891* | -0.26* | 1,099,117 |
| 1918 | 542,046 | 566,327 | 1,108,373 | 10,701 | 0.97 | 1,103,022 |
| 1919 | 588,888 | 575,517 | 1,164,405 | 56,032 | 5.06 | 1,136,389 |
The departure of the Expeditionary Force and Reinforcements effected a heavy drain upon the small margin of numerical superiority of males. By the end of 1916 there were more females than males in New Zealand, and this position was maintained until July, 1919, when the male preponderance was again established.
At 30th June, 1914, there were 52,175 more males than females; at 30th June, 1920, only 15,404. (Maoris have not been included.)
Should the pre-war trend of events be continued, the male surplus would permanently disappear in a few years’ time.
The average rate of natural increase for the ten years preceding 1919 was 15.88 per 1,000. It may be remarked that the rates for 1918 and 1919 are much the lowest on record. Further discussion of natural increase will be found in the Vital Statistics section of this book.
| Year. | Excess of Births over Deaths. | Natural Increase per 1,000 of Mean Population. | ||
|---|---|---|---|---|
| Males. | Females. | Total. | ||
| 1910 | 7,838 | 8,507 | 16,345 | 16.46 |
| 1911 | 7,937 | 8,883 | 16,820 | 16.58 |
| 1912 | 8,622 | 9,672 | 18,294 | 17.61 |
| 1913 | 8,566 | 9,250 | 17,816 | 16.67 |
| 1914 | 8,549 | 9,641 | 18,190 | 16.68 |
| 1915 | 8,649 | 9,236 | 17,885 | 16.27 |
| 1916 | 8,523 | 9,390 | 17,913 | 16.29 |
| 1917 | 8,298 | 9,413 | 17,711 | 16.11 |
| 1918 | 3,391 | 6,105 | 9,496 | 8.61 |
| 1919 | 6,380 | 7,295 | 13,675 | 12.03 |
The total number of arrivals and departures during the past ten years, distinguishing the sexes and the number of those under and over twelve years of age, is given in the table following. The figures for the last five years do not include members of Expeditionary Forces.
| Arrivals and Departures, 1910–19. | |||||
|---|---|---|---|---|---|
| Year. | Over 12 Years of Age. | Under 12 Years of Age. | Total. | ||
| Males. | Females. | Males. | Females. | ||
| ARRIVALS. | |||||
| 1910 | 20,161 | 11,832 | 1,974 | 1,802 | 35,769 |
| 1911 | 22,881 | 13,953 | 2,452 | 2,103 | 41,389 |
| 1912 | 24,026 | 15,442 | 2,749 | 2,443 | 44,660 |
| 1913 | 22,872 | 15,801 | 3,019 | 2,896 | 44,588 |
| 1914 | 20,360 | 13,020 | 2,166 | 2,100 | 37,646 |
| 1915 | 12,993 | 9,589 | 1,494 | 1,475 | 25,551 |
| 1916 | 10,657 | 8,406 | 1,302 | 1,434 | 21,799 |
| 1917 | 8,334 | 5,583 | 825 | 907 | 15,649 |
| 1918 | 5,685 | 4,842 | 671 | 708 | 11,906 |
| 1919 | 9,341 | 8,822 | 1,431 | 1,337 | 20,931 |
| DEPARTURES. | |||||
| 1910 | 19,032 | 10,629 | 1,419 | 1,281 | 32,361 |
| 1911 | 21,730 | 12,190 | 1,809 | 1,460 | 37,189 |
| 1912 | 20,151 | 12,278 | 1,763 | 1,541 | 35,733 |
| 1913 | 17,188 | 10,518 | 1,372 | 1,291 | 30,369 |
| 1914 | 18,460 | 11,227 | 1,565 | 1,254 | 32,506 |
| 1915 | 12,228 | 8,251 | 1,090 | 907 | 22,476 |
| 1916 | 10,717 | 8,273 | 1,215 | 958 | 21,163 |
| 1917 | 6,896 | 5,672 | 701 | 600 | 13,869 |
| 1918 | 5,477 | 5,029 | 620 | 534 | 11,660 |
| 1919 | 10,086 | 7,440 | 1,291 | 1,060 | 19,877 |
The monthly figures for 1919 are as follows:—
| Month. | Arrivals. | Departures. | Excess of Arrivals. | Excess of Departures. |
|---|---|---|---|---|
| January | 1,139 | 706 | 433 | |
| February | 1,394 | 833 | 561 | |
| March | 1,545 | 1,761 | 216 | |
| April | 1,112 | 1,743 | 631 | |
| May | 1,514 | 2,018 | 504 | |
| June | 270 | 1,992 | 1,722 | |
| July | 1,765 | 995 | 770 | |
| August | 886 | 1,285 | 399 | |
| September | 2,444 | 1,845 | 599 | |
| October | 2,662 | 1,943 | 719 | |
| November | 2,735 | 2,314 | 421 | |
| December | 3,465 | 2,442 | 1,023 | |
| Totals | 20,931 | 19,877 | 1,054 |
Some two-thirds of the oversea arrivals come from Australia, while five-sixths of the departures are booked for the Commonwealth. The numbers of departures for Australian ports are, however, inflated by the inclusion of many persons who sail from New Zealand for Australia to make that country a starting-point for further travel, and who may or may not return by the same route. The real destination and original place of departure when returning are not ascertained in these cases.
| ARRIVALS FROM AND DEPARTURES TO VARIOUS COUNTRIES, 1910–19. | ||||||
|---|---|---|---|---|---|---|
| Year. | Arrivals. | |||||
| From | Total Arrivals. | |||||
| United Kingdom. | Australian Commonwealth. | Fiji. | Other British Possessions. | Foreign Countries. | ||
| 1910 | 9,367 | 24,502 | 581 | 351 | 968 | 35,769 |
| 1911 | 11,379 | 26,909 | 624 | 996 | 1,481 | 41,389 |
| 1912 | 12,912 | 28,522 | 767 | 1,305 | 1,154 | 44,660 |
| 1913 | 14,707 | 26,764 | 548 | 1,420 | 1,149 | 44,588 |
| 1914 | 8,579 | 25,967 | 648 | 1,267 | 1,185 | 37,646 |
| 1915 | 3,531 | 19,499 | 655 | 862 | 1,004 | 25,551 |
| 1916 | 3,394 | 15,321 | 697 | 626 | 1,761 | 21,799 |
| 1917 | 2,931 | 10,146 | 617 | 935 | 1,020 | 15,649 |
| 1918 | 1,176 | 8,282 | 574 | 1,130 | 744 | 11,906 |
| 1919 | 4,668 | 11,568 | 882 | 2,412 | 1,401 | 20,931 |
| Year. | Departures. | |||||
|---|---|---|---|---|---|---|
| To | Total Departures. | |||||
| United Kingdom. | Australian Commonwealth. | Fiji. | Other British Possessions. | Foreign Countries. | ||
| 1910 | 2,509 | 27,100 | 702 | 694 | 1,356 | 32,361 |
| 1911 | 2,755 | 30,918 | 696 | 844 | 1,976 | 37,189 |
| 1912 | 2,605 | 30,141 | 580 | 846 | 1,561 | 35,733 |
| 1913 | 2,649 | 24,961 | 479 | 1,017 | 1,263 | 30,369 |
| 1914 | 2,574 | 26,693 | 939 | 871 | 1,429 | 32,506 |
| 1915 | 2,063 | 17,793 | 658 | 821 | 1,140 | 22,476 |
| 1916 | 2,608 | 16,390 | 420 | 712 | 1,033 | 21,163 |
| 1917 | 1,501 | 10,499 | 503 | 588 | 778 | 13,869 |
| 1918 | 445 | 9,477 | 434 | 615 | 689 | 11,660 |
| 1919 | 3,559 | 12,722 | 675 | 1 546 | 1,375 | 19,877 |
The War Regulations of the 15th November, 1915, as amended from time to time, prescribe that no person over the age of fifteen years shall leave New Zealand for any place beyond the seas save in pursuance of a written permit issued to him by the Minister or Under-Secretary of Internal Affairs, or some other authorized person.
The only persons exempted from the necessity for obtaining permits are those who—
Leave New Zealand on the King's Service:
Leave New Zealand as bona fide members of the crew of any ship:
Arrive in and leave New Zealand in the course of the same voyage of any ship other than a ship arriving from a port in the Commonwealth of Australia.
The amendments made in November, 1915, to the Defence of the Realm Regulations of the Imperial Government, providing that no person shall enter or leave the United Kingdom without a passport, have led to a greatly increased number being issued in New Zealand.
A person leaving New Zealand for the United Kingdom or other country (with the exception of British possessions in the Pacific, for which permits suffice) must therefore have in his possession (1) a permit under the War Regulations to enable him to depart from the Dominion, (2) a passport to enable him to land at the end of his journey. If foreign countries are being visited the passport must be viséd by the Consular representative of such country in New Zealand.
Between the 1st November, 1915, and the 31st March, 1918, passports were issued to the number of 3,112, for the year ended 31st March, 1919, 1,346, and for the year ended 31st March, 1920, 4,620.
Under the War Regulations of the 21st August, 1916, no person over the age of fifteen years may land in New Zealand unless in possession of a passport or some other document satisfactorily establishing his or her nationality or identity.
In the case of a person coming from a foreign country the passport must have been issued or viséd by the British Ambassador or a British Consul in that country, and in the case of a person coming from any part of the British dominions the issue or visé must have been by some public official duly authorized in that behalf.
Certain exceptions are made with respect to persons coming to New Zealand from Australia, the Cook Islands, and Samoa. In their case the only requirement is the possession of a permit. The regulations further do not apply to a British subject arriving in New Zealand as the master or a member of the crew of the vessel in which he arrives.
The Minister of Internal Affairs or any person authorized by him is given power to grant exemptions from the requirements of the regulation.
Residents in the Dominion may, by application on the proper form, secure a passage at assisted rates for any person residing in the United Kingdom.
The payments required are—second class, £52; third class (two-berth cabin), £30; third class (four-berth cabin), £26. The passage-money, which must be paid in full before passages are booked, can be paid to the Immigration Department in Wellington or to the High Commissioner for New Zealand in London. The Department will cable any nomination, together with a remittance, if so desired, for the extra charge of £1.
Domestic servants and farm labourers granted assisted passages as such are required to follow in New Zealand their respective occupations of domestic and farm work for a period of one year after their arrival in the Dominion. If it is found that some occupation other than domestic or farm work is entered into by any such assisted immigrant before the expiration of one year after arrival in New Zealand, the immigrant will be called upon to pay the Government the difference between the assisted rate and the full fare.
Children between three and twelve years of age travelling with their parents are charged half rates. One child under three years of age in each family is taken free. A quarter-fare is charged for each additional child under three years of age.
Passages are granted on vessels belonging to the Shaw, Savill, and Albion Company, the New Zealand Shipping Company, and the Federal Steam Navigation Company.
Unhealthy persons should not be nominated, as passages at reduced rates will not be granted to them. When cases of lung, chest, or other like complaints are discovered in any member of a family by the Medical Officer at London or Liverpool, the whole family will be prevented from sailing.
The foregoing applies to persons of not more than fifty years of age in the case of nominated persons and farmers or farm labourers, and not more than forty years of age in the case of domestic servants.
In the case of immigrants under twenty-one years of age, special arrangements have to be entered into for their protection on the voyage where deemed necessary or advisable.
The High Commissioner is authorized to grant to suitable and healthy farmers, farm labourers, and domestic servants, who apply to him in London, a passage to New Zealand at the following rates:—
| Farmers. | Farm Labourers. | Domestic Servants. | |||||
|---|---|---|---|---|---|---|---|
| £ | s. | d. | £ | s. | d. | Free.Grant £2.— | |
| Third class: 6-berth cabin | 24 | 0 | 0 | 10 | 0 | 0 | |
| Third class: 4-berth cabin | 26 | 0 | 0 | 12 | 0 | 0 | |
| Third class: 2-berth cabin | 30 | 0 | 0 | 16 | 0 | 0 | |
The following table illustrates the progress of the last decade:—
| Year ended 31st March. | Immigrants assisted. | Capital possessed by Assisted Immigrants. | Net Government Expenditure on Immigration. |
|---|---|---|---|
| * Not available. | |||
| £ | £ | ||
| 1911 | 2,624 | 37,735 | 9,441 |
| 1912 | 3,300 | 24,088 | 11,681 |
| 1913 | 3,928 | 32,006 | 14,694 |
| 1914 | 5,064 | 39,701 | 33,914 |
| 1915 | 2,986 | 16,313 | 33,220 |
| 1916 | 1,103 | 2,564 | 10,010 |
| 1917 | 638 | 1,407 | 6,533 |
| 1918 | 171 | * | 3,877 |
| 1919 | 906 | * | 8,000 |
| 1920 | 3,811 | * | 40,516 |
On arrival in New Zealand the immigrants are met on board by officers of the Immigration Department who accompany the Port Health Officer to the ship. While the ship is in the stream it is the special duty of such officers to afford to the assisted immigrants all necessary information as regards transhipment, &. Arrangements are made for safety and transhipment of luggage.
Each immigrant is seen as he passes towards the doctor for examination, and is handed an official letter containing information as to where his ticket will be arranged for, and the place and time of departure of his connecting train or boat (if any). The immigrant is also requested to see the Immigration Officer on board, or to come to the office, which is near the wharf in Wellington (Union Steamship Company's building), if he requires information or advice beyond what is given in the letter. The addresses of the district agencies of the Labour Department in the larger centres of the Dominion are also supplied to male assisted immigrants. It is the practice of the Department to send out advices, by wire if necessary, to friends and relatives of immigrants about to arrive, and to get back information as to where the newcomers will be met. These messages, often together with private letters, &., are given out on board to those to whom they are addressed. Information of this nature is much appreciated, especially by wives joining their husbands.
Assisted immigrants requiring work are referred to the office of the Immigration Department, and their cases are there dealt with.
As regards the female assisted domestic workers, who are chosen after application at Home to the High Commissioner, and who are sent to New Zealand under the supervision of one or more responsible matrons, the following applies:—
The Government advertises the fact that the books of the Department are open to record the names of those people in the Dominion desirous of securing the services of an assisted girl. Such advertisements bring into the office many applications, especially pending the arrival of the ship.
Each matron in charge on board is instructed to classify the girls under two heads: (a) those with work already arranged or friends to go to; (b) those without either friends or work. On arrival they are met by the Girls’ Superintendent of the Immigration Department. Arrangements are made for sending to their destinations those girls who are going to friends or to definite positions. Those requiring accommodation are directed to homes or hostels approved by the Minister of Immigration for this purpose. The Superintendent then separately considers the case of each girl, and arranges to place her with an applicant for a Government assisted girl. In placing these girls at present, considerable reliance has necessarily to be placed on the statements made by them. The Department is, however, taking steps to get full and independent details of the work that the girl was actually engaged in before she left the Mother-country. After a girl has been placed, the Department endeavours to keep in touch with her by correspondence.
The legislation respecting the restriction of immigration into New Zealand is contained in the Immigration Restriction Act, 1908, and its amendments, and the Undesirable Immigrants Exclusion Act, 1919.
The following persons or classes of persons are prohibited from landing in New Zealand:—
Persons not of British birth and parentage who are unable to write out and sign in any European language a prescribed form of application;
Idiots or insane persons;
Persons suffering from contagious diseases which are loathsome or dangerous;
Persons arriving in New Zealand within two years after the termination of a period of imprisonment for a serious offence.
The above provisions do not apply to (a) His Majesty's land and sea forces, (b) the officers and crew of any ship of war of any Government, (c) persons duly accredited to the Government of New Zealand by the Imperial or any other Government, (d) shipwrecked persons, (e) the officers and crew of any mercantile vessel who leave New Zealand with that vessel, (f) persons exempted by the Governor-General in Council or by the Minister of Internal Affairs.
Chinese (not naturalized in New Zealand), unless they pay a poll-tax of £100 and are able to read a printed passage of not less than 100 words of the English language selected by the Collector of Customs.
The officers and crews of any ship of war of the Chinese Government, and members of the crew of any mercantile vessel who leave New Zealand by that vessel, are exempted from these provisions. There is power to exempt any other persons or classes of persons under such conditions as the Minister of Customs may prescribe.
Persons who have at any time been subjects of the State of Germany or of Austria-Hungary as those States existed on the 4th August, 1914, except under a license issued by the Attorney-General.
Persons not permanently resident in New Zealand who are disaffected or disloyal and of such a character that their presence in New Zealand would be injurious to the peace, order, and good government of the Dominion, and whom the Attorney-General on that account prohibits from landing.
When persons arrive in New Zealand who are lunatic, idiotic, deaf, dumb, blind, or infirm, and are likely to become a charge upon the public or upon any public or charitable institution, the master, owner, or charterer of the ship by which such persons come to New Zealand must enter into a bond for £100 for each such person, guaranteeing his support and maintenance for five years.
His Majesty's land and sea forces, persons brought to New Zealand either wholly or partly at the expense of the Government, shipwrecked mariners brought to New Zealand by another vessel without charge, and persons domiciled in New Zealand are exempted from these provisions. General power is given to exempt other persons in special cases and under such conditions as the Minister of Customs may prescribe.
Every person of and over the age of fifteen years who lands in New Zealand must, unless exempted by the Attorney-General, make and deliver to an officer of Customs a declaration giving his or her name, occupation, and residence, and also the following particulars if the immigrant is not a permanent resident in New Zealand returning thereto after not more than twelve months’ absence: Country of birth; age; names and places of birth of his parents; particulars as to his nationality, his intention as to permanent residence in or departure from New Zealand, and his purpose in coming thereto.
Persons of other than European descent are classified in the immigration returns as “race aliens.” Immigrants of this class have since 1908 been required to pass an education test before admission to the Dominion.
| Birthplace. | Year. | |||||||||
|---|---|---|---|---|---|---|---|---|---|---|
| 1910. | 1911. | 1912. | 1913. | 1914. | 1915. | 1916. | 1917. | 1918. | 1919. | |
| British Possessions— | ||||||||||
| India | 80 | 190 | 325 | 133 | 257 | 13 | 92 | 92 | 138 | 193 |
| Pacific islands | 9 | 24 | 51 | 48 | 8 | 10 | 28 | 44 | 278 | 25 |
| Other | 43 | 1 | 4 | 34 | 7 | 8 | 1 | 5 | ||
| Total, British possessions | 132 | 215 | 380 | 215 | 272 | 31 | 120 | 136 | 417 | 223 |
| Foreign Countries— | ||||||||||
| China | 209 | 546 | 348 | 325 | 511 | 265 | 327 | 272 | 256 | 418 |
| Syria | 12 | 9 | 20 | 19 | 9 | 3 | 1 | 2 | 1 | |
| Asia Minor | 4 | 4 | 8 | 2 | 2 | 2 | ||||
| Japan | 1 | 4 | 9 | 17 | 13 | 13 | 26 | 11 | 30 | 10 |
| Pacific islands | 7 | 25 | 24 | 4 | 6 | 6 | 537 | 295 | 211 | 57 |
| Other | 2 | 1 | 14 | 7 | 12 | 4 | 8 | |||
| Total, foreign countries | 235 | 589 | 423 | 374 | 551 | 291 | 893 | 588 | 500 | 485 |
| Total, “race aliens” | 367 | 804 | 803 | 589 | 823 | 322 | 1,013 | 724 | 917 | 708 |
Of the race aliens arriving in New Zealand a large proportion are Chinese, some of whom, however, have been formerly resident in the Dominion. Hindus and other natives of India are also of late years arriving in considerable numbers. A number of soldiers from the French Pacific islands are included in the figures for 1916, 1917, and 1918.
Since July, 1914, records of departures of race aliens have been kept, and these show that a total of 321 race aliens left the Dominion during 1919, including natives of the following countries: China, 237; India, 18; Japan, 4; British Pacific islands, 36; foreign Pacific islands, 22.
The census returns of 1916 showed that there were 3,204 race aliens resident in the Dominion, not including 3,221 Maori half-castes living as Europeans. Of these, 2,857 were described as being of full-blood and 347 as of half-blood.
More than 45 per cent, of the race aliens reside in Auckland Province. Wellington, however, claims the largest share (over one-third) of the Chinese.
At the census of 1881, the year in which taxation was first imposed on Chinese landing in New Zealand, the Chinese population numbered 5,004 persons. In 1896 an Act was passed raising the poll-tax on Chinese immigrants from £10 to £100 per head, and limiting the number of Chinese passengers that may be carried by vessels to New Zealand to one for every 200 tons burthen. According to the census of 1901, the Chinese population was 2,857, in 1906 it was 2,570, in 1911, 2,630, and in 1916 2,147, of whom 135 were half-castes. During recent years departures are about equal to arrivals. For the first nine months of 1920, however, arrivals exceeded departures by the large total of 905.
When any alien residing in New Zealand desires to be naturalized he may present to the Governor-General a memorial signed and verified by a statutory declaration setting forth—
His name, age, birthplace, residence, and occupation;
The length of his residence in New Zealand, and his desire to settle therein;
A request that letters of naturalization may be granted to him.
Every memorial must have written upon it or attached to it a certificate signed by some Magistrate or Justice to the effect that the applicant is known to the person certifying and is of good repute. On taking the oath of allegiance he shall enjoy within New Zealand all the rights and capacities that a natural-born subject of the United Kingdom can enjoy or transmit, excepting such rights (if any) as are specially excepted in the letters of naturalization granted to him.
Any person who has been previously naturalized in the United Kingdom or any British possession may obtain letters of naturalization in New Zealand upon presentation of his certificate or letters to the Governor-General, with satisfactory evidence of his bona fides.
An alien woman married to a natural-born or naturalized British subject shall be deemed to be herself naturalized. Where the father (or the mother, being a widow) has become naturalized in New Zealand, every child of such father or mother who during minority resides with such parent shall also be deemed to be naturalized.
No fee is payable for naturalization except in the case of Chinese, who are charged £1.
The issue of letters of naturalization, which was suspended during the war, was resumed during November, 1919, in regard to aliens from countries which, in the recent war, were either neutral or allied with Great Britain.
The Revocation of Naturalization Act of 1917 provided that the Governor-General may, by Order in Council, revoke the naturalization of any person when such revocation is considered desirable on grounds of public policy.
The number of natives of each country naturalized during the twenty years 1895–1914 is shown in the next table.
| Natives of— | Persons. |
|---|---|
| Austria-Hungary | 1,529 |
| Germany | 1,159 |
| Denmark | 676 |
| Sweden | 671 |
| Norway | 455 |
| Russia | 346 |
| Italy | 231 |
| Switzerland | 186 |
| France | 159 |
| Syria | 147 |
| China | 146 |
| United States of America | 144 |
| Netherlands | 61 |
| Greece | 61 |
| Portugal and possessions | 60 |
| Belgium | 40 |
| Spain | 16 |
| Japan | 11 |
| Turkey | 11 |
| Other countries | 52 |
| Total | 6,161 |
The Registration of Aliens Act passed in 1917 provided for the registration of all persons of the age of fifteen or over who are not British subjects either by birth or by naturalization in New Zealand. The Government Statistician is charged with the duty of compiling and keeping the register, but the actual registration is effected by Registration Officers (mostly police officers) throughout the Dominion. Every alien not less than fifteen years of age is required to make application for registration to a Registration Officer, and is required to supply the following particulars concerning himself or herself:—
Name in full:
Nationality (and if nationality is not the nationality of origin, nationality of origin):
Place of birth:
Age, and date of birth:
Whether married, single, widower, widow, or divorced:
If married, the name, age, nationality of origin, and place of abode of wife or husband:
If married, a widower, a widow, or divorced, number, names, and ages of children (if any):
Occupation:
Date of arrival in New Zealand:
Place of abode and postal address:
Whether permanently resident in New Zealand:
If not permanently resident in New Zealand, place of permanent residence, and date of projected departure from New Zealand:
Such other particulars as may from time to time be prescribed by regulations under the Act.
Upon receipt of an application for registration the Registration Officer issues a certificate of registration, and forwards the application in duplicate to the Superintendent of Police for the district, who files one copy and sends the other on to the Commissioner of Police for transmission to the Government Statistician. Registered aliens are required to notify change of address on pain of a penalty not exceeding £20. Failure to register involves a fine on conviction not exceeding £50.
The number of aliens on the Dominion register in April, 1920, was 8,581. The birthplaces of these are as follows:—
| Birthplace. | Males. | Females. | Total. |
|---|---|---|---|
| France | 89 | 46 | 135 |
| Spain | 17 | 4 | 21 |
| Portugal | 14 | 1 | 15 |
| Italy | 177 | 23 | 200 |
| Switzerland | 178 | 64 | 242 |
| Belgium | 48 | 19 | 67 |
| Netherlands | 66 | 2 | 68 |
| Germany | 587 | 167 | 754 |
| Schleswig-Holstein | 18 | 4 | 22 |
| Denmark | 452 | 92 | 544 |
| Norway | 359 | 26 | 385 |
| Sweden | 165 | 8 | 173 |
| Poland | 112 | 34 | 146 |
| Late Russian Empire | 227 | 57 | 284 |
| Austria-Hungary | 72 | 6 | 78 |
| Balkan States | 1,080 | 34 | 1,114 |
| Palestine and Syria | 85 | 39 | 124 |
| China | 2,349 | 27 | 2,376 |
| Japan | 9 | 9 | |
| U.S. America | 430 | 115 | 545 |
| South Sea islands | 69 | 28 | 97 |
| Other countries | 474 | 38 | 512 |
| At sea | 9 | 4 | 13 |
| British - born, but aliens by naturalization, marriage, &. | 50 | 607 | 657 |
| Totals | 7,136 | 1,445 | 8,581 |
A table published in Volume iv of “Statistics of New Zealand,” 1919, gives fairly detailed information as to birthplaces in conjunction with ages. A summary giving information as to ages follows:—
| Age-group. | Males. | Females. | Total. |
|---|---|---|---|
| 15 and under 20 | 158 | 21 | 179 |
| 20 and under 25 | 633 | 100 | 733 |
| 25 and under 30 | 994 | 174 | 1,168 |
| 30 and under 35 | 990 | 183 | 1,173 |
| 35 and under 40 | 867 | 168 | 1,035 |
| 40 and under 45 | 751 | 173 | 924 |
| 45 and under 50 | 615 | 160 | 775 |
| 50 and under 55 | 551 | 129 | 680 |
| 55 and under 60 | 468 | 118 | 586 |
| 60 and over | 1,109 | 219 | 1,328 |
| Totals | 7,136 | 1,445 | 8,581 |
The number of persons (excluding Maoris) to a square mile in each provincial district at the last eight censuses is as follows:—
| Provincial District. | Area in Square Miles. | Persons to a Square Mile. | |||||||
|---|---|---|---|---|---|---|---|---|---|
| 1881. | 1886. | 1891. | 1896. | 1901. | 1906. | 1911. | 1916. | ||
| Auckland | 25,364 | 3.92 | 5.14 | 5.25 | 6.05 | 6.94 | 8.33 | 10.43 | 12.17 |
| Taranaki | 3,732 | 3.98 | 4.82 | 5.91 | 8.35 | 10.14 | 11.63 | 13.82 | 14.99 |
| Hawke's Bay | 4,241 | 4.10 | 5.79 | 6.72 | 8.03 | 8.35 | 9.96 | 11.45 | 12.80 |
| Wellington | 10,807 | 5.68 | 7.17 | 9.04 | 11.28 | 13.08 | 16.64 | 18.42 | 21.48 |
| Marlborough | 4,225 | 2.20 | 2.63 | 3.02 | 2.95 | 3.15 | 3.40 | 3.78 | 3.93 |
| Nelson | 10,875 | 2.40 | 2.78 | 3.20 | 3.29 | 3.49 | 3.91 | 4.46 | 3.98 |
| Westland | 4,881 | 3.08 | 3.26 | 3.25 | 2.96 | 2.97 | 3.01 | 3.22 | 3.18 |
| Canterbury | 13,858 | 8.11 | 8.77 | 9.28 | 9.82 | 10.34 | 11.50 | 12.52 | 13.12 |
| Otago— | |||||||||
| Otago portion | 13,957 | 7.70 | 8.15 | 8.32 | 8.60 | 8.98 | 9.16 | 9.52 | 9.42 |
| Southland portion | 11,358 | 2.34 | 3.12 | 3.26 | 3.87 | 4.21 | 4.67 | 5.17 | 5.25 |
| Totals | 103,298 | 4.74 | 5.60 | 6.07 | 6.81 | 7.48 | 8.60 | 9.76 | 10.64 |
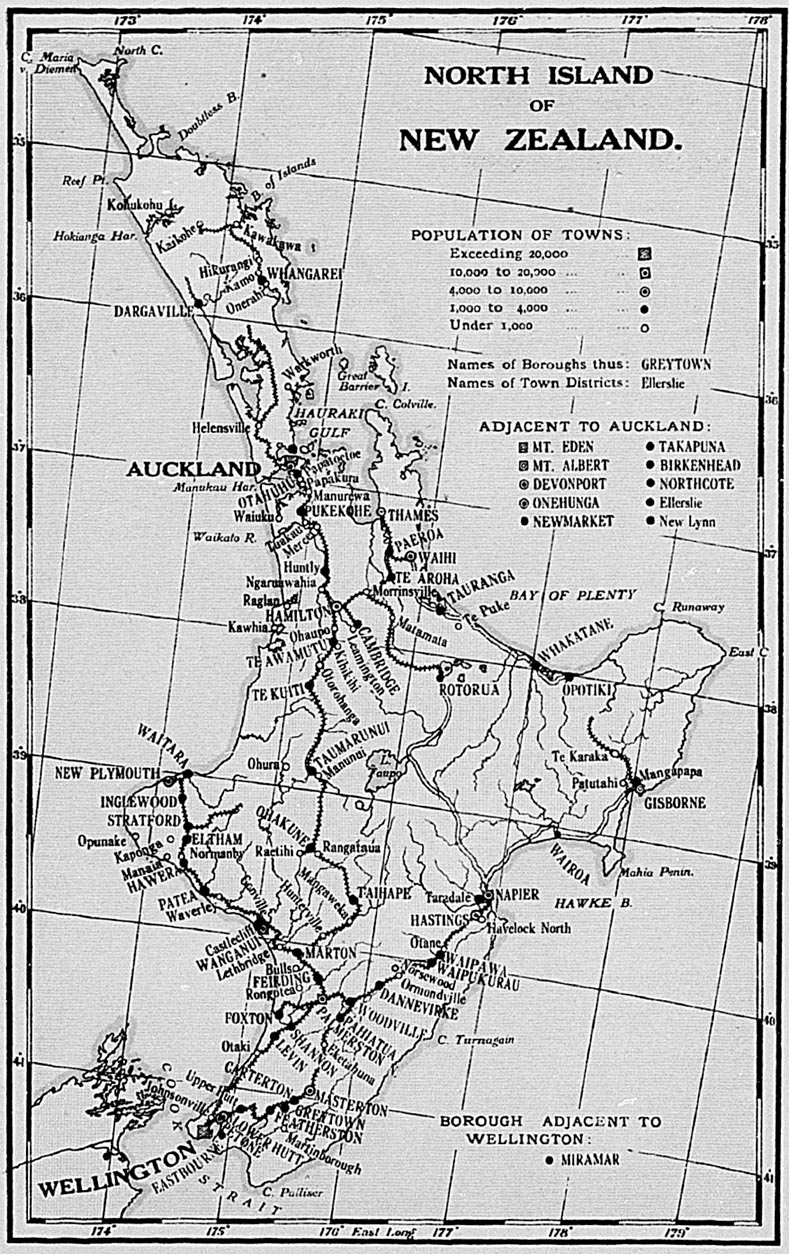
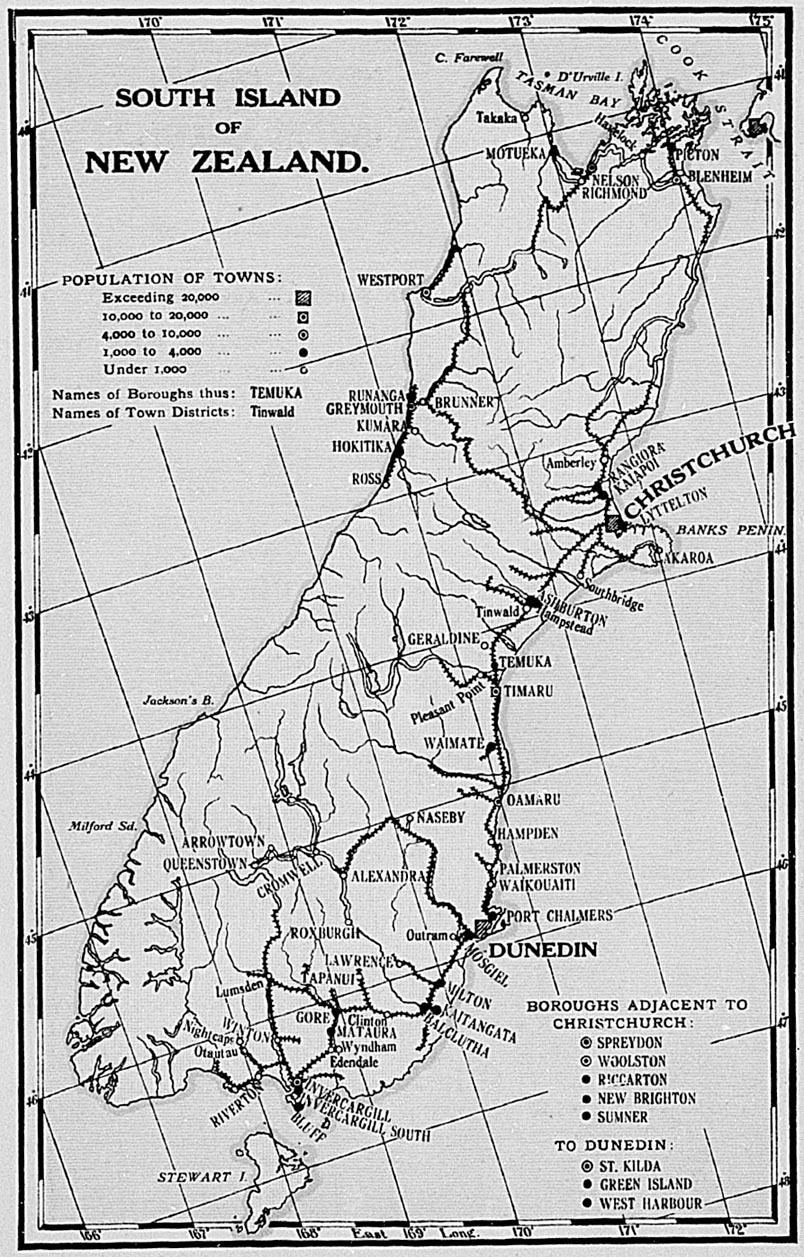
The principal natural divisions in New Zealand are the North, South, and Stewart Islands. These contain approximately the whole population of European descent, the Cook and other annexed islands being inhabited almost solely by coloured Natives.
The population of the two Islands at successive censuses is given in the table following, together with the percentage that each Island bears to the total:—
| Population of the North and South Islands, 1858–1916. | |||||
|---|---|---|---|---|---|
| Census Year. | Population (excluding Maoris). | Proportions per Cent. | |||
| North Island. | South Island.* | Total. | North Island. | South Island.* | |
| * Including Stewart Island and Chatham Islands. | |||||
| 1858 | 34,094 | 25,319 | 59,418 | 57.88 | 42.62 |
| 1861 | 41,641 | 57,380 | 99,021 | 42.05 | 57.95 |
| 1864 | 65,263 | 106,895 | 172,158 | 37.91 | 62.09 |
| 1867 | 79,913 | 138,755 | 218,668 | 36.55 | 63.45 |
| 1871 | 96,875 | 159,518 | 256,393 | 37.78 | 62.22 |
| 1874 | 111,934 | 187,580 | 299,514 | 37.37 | 62.63 |
| 1878 | 158,208 | 256,204 | 414,412 | 38.18 | 61.82 |
| 1881 | 193,047 | 296,886 | 489,933 | 39.40 | 60.60 |
| 1886 | 250,482 | 328,000 | 578,482 | 43.30 | 56.70 |
| 1891 | 281,474 | 345,184 | 626,658 | 44.92 | 55.08 |
| 1896 | 340,638 | 362,722 | 703,360 | 48.43 | 51.57 |
| 1901 | 390,579 | 382,140 | 772,719 | 50.54 | 49.45 |
| 1906 | 476,737 | 411,841 | 888,578 | 53.65 | 46.35 |
| 1911 | 563,733 | 444,735 | 1,008,468 | 55.90 | 44.10 |
| 1916 | 651,072 | 448,377 | 1,099,449 | 59.22 | 40.78 |
The figures for 1916 are not quite fair to the South Island. All the military and internment camps were in the North Island, and many of the soldiers, &., in these on census night belonged to the South Island. The presence of the camps in the North Island had the further effect of temporarily attracting people from the other Island for business purposes, or to be near soldier friends and relatives. The troops abroad on census night (42,666 in number) may be regarded as having come from the two Islands in proportions approximately relative to population.
The populations of the various provincial districts as estimated at the 31st December, 1919, are as follows:—
| Provincial District. | Totals. |
|---|---|
| Auckland | 333,424 |
| Taranaki | 58,301 |
| Hawke's Bay | 60,246 |
| Wellington | 239,962 |
| Marlborough | 16,970 |
| Nelson | 49,050 |
| Westland | 14,801 |
| Canterbury | 191,282 |
| Otago— | |
| Otago portion | 137,995 |
| Southland portion | 62,374 |
| Totals for the Dominion | 1,164,405 |
The counties contain what is understood to be the rural population, but this is not strictly correct, as some of the towns not municipalized and forming part of counties have considerable populations. On the other hand, the population of a few of the smaller boroughs might be classed as rural, as will be noticed further on.
The estimated distribution of population at 31st December, 1919 (exclusive of Maoris), was as follows:—
| Counties | 484,195 |
|---|---|
| Boroughs | 641,100 |
| Independent town districts | 35,328 |
| Adjacent islands | 697 |
| Persons on shipboard | 3,085 |
| Total population of Dominion | 1,164,405 |
A list is given below showing counties and their population (exclusive of interior boroughs and independent town districts) as estimated at the 31st December, 1919, with amendments where necessary on account of subsequent alterations of boundaries. Maoris are not, unless expressly stated to the contrary, included in any population figures quoted in this section.
| Population of Counties. | |
|---|---|
| County. | Population. |
| Akaroa | 2,062 |
| Akitio | 1,503 |
| Amuri | 1,895 |
| Ashburton | 11,216 |
| Ashley | 757 |
| Awakino | 801 |
| Awatere | 1,578 |
| Bay of Islands | 3,838 |
| Bruce | 4,924 |
| Buller | 5,809 |
| Castlepoint | 659 |
| Chatham Islands | 228 |
| Cheviot | 1,263 |
| Clifton | 2,150 |
| Clutha | 7,106 |
| Collingwood | 1,293 |
| Cook | 6,060 |
| Coromandel | 2,362 |
| Dannevirke | 4,831 |
| East Taupo | 551 |
| Eden | 14,196 |
| Egmont | 3,340 |
| Eketahuna | 2,454 |
| Ellesmere | 3,629 |
| Eltham | 3,711 |
| Eyre | 1,879 |
| Featherston | 3,434 |
| Fiord | 18 |
| Franklin | 8,795 |
| Geraldine | 5,403 |
| Great Barrier | 262 |
| Grey | 5,684 |
| Halswell | 1,693 |
| Hauraki Plains | 2,168 |
| Hawera | 5,080 |
| Hawke's Bay | 10,080 |
| Heathcote | 3,509 |
| Hobson | 5,055 |
| Hokianga | 2,915 |
| Horowhenua | 5,401 |
| Hutt | 5,405 |
| Inangahua | 4,263 |
| Inglewood | 3,234 |
| Kaikoura | 1,948 |
| Kairanga | 4,377 |
| Kaitieke | 2,955 |
| Kawhia | 1,185 |
| Kiwitea | 2,744 |
| Kowai | 1,991 |
| Lake | 1,784 |
| Levels | 4,808 |
| Mackenzie | 3,033 |
| Makara | 3,156 |
| Malvern | 2,818 |
| Manawatu | 4,798 |
| Maniototo | 2,585 |
| Manukau | 5,130 |
| Marlborough | 7,014 |
| Masterton | 3,976 |
| Matakaoa | 474 |
| Matamata | 3,633 |
| Mauriceville | 818 |
| Mongonui | 3,998 |
| Mount Herbert | 421 |
| Murchison | 1,343 |
| Ohinemuri | 3,523 |
| Ohura | 2,605 |
| Opotiki | 2,011 |
| Oroua | 3,507 |
| Otamatea | 3,924 |
| Oxford | 1,827 |
| Pahiatua | 3,290 |
| Paparua | 4,905 |
| Patangata | 2,192 |
| Patea | 3,396 |
| Peninsula | 1,880 |
| Piako | 4,264 |
| Pohangina | 1,678 |
| Raglan | 4,305 |
| Rangiora | 2,857 |
| Rangitikei | 9,204 |
| Rodney | 3,630 |
| Rotorua | 1,522 |
| Selwyn | 1,480 |
| Sounds | 1,227 |
| Southland | 25,754 |
| Springs | 1,857 |
| Stewart Island | 367 |
| Stratford | 5,562 |
| Taieri | 5,801 |
| Takaka | 1,938 |
| Taranaki | 4,912 |
| Tauranga | 3,616 |
| Tawera | 881 |
| Thames | 1,764 |
| Tuapeka | 5,301 |
| Uawa | 876 |
| Vincent | 3,945 |
| Waiapu | 1,723 |
| Waihemo | 1,506 |
| Waikato | 6,918 |
| Waikohu | 3,243 |
| Waikouaiti | 4,272 |
| Waimairi | 12,394 |
| Waimarino | 2,783 |
| Waimate | 7,164 |
| Waimate West | 2,499 |
| Waimea | 9,633 |
| Waipa | 6,452 |
| Waipara | 2,133 |
| Waipawa | 3,250 |
| Waipukurau | 708 |
| Wairarapa South | 2,912 |
| Wairewa | 1,078 |
| Wairoa | 2,469 |
| Waitaki | 10,077 |
| Waitemata | 7,943 |
| Waitomo | 5,539 |
| Waitotara | 2,636 |
| Wallace | 8,542 |
| Wanganui | 2,540 |
| Weber | 443 |
| Westland | 4,257 |
| West Taupo | 2,514 |
| Whakatane | 2,197 |
| Whangamomona | 1,519 |
| Whangarei | 8,808 |
| Whangaroa | 852 |
| Woodville | 1,917 |
The next table shows the distribution of the population in counties and boroughs at each quinquennial census since 1881:—
| Census Year. | Counties. | Boroughs. | Percentage. | ||
|---|---|---|---|---|---|
| Counties. | Boroughs. | Shipboard, &. | |||
| 1881 | 291,238 | 194,981 | 59.44 | 39.80 | 0.76 |
| 1886 | 327,328 | 245,612 | 56.58 | 42.46 | 0.96 |
| 1891 | 352,097 | 270,343 | 56.18 | 43.14 | 0.68 |
| 1896 | 391,735 | 307,294 | 55.69 | 43.69 | 0.62 |
| 1901 | 417,596 | 350,202 | 54.04 | 45.32 | 0.64 |
| 1906 | 458,797 | 424,614 | 51.63 | 47.79 | 0.58 |
| 1911 | 496,779 | 505,598 | 49.26 | 50.14 | 0.60 |
| 1916 | 501,259 | 585,306 | 45.59 | 53.24 | 1.17 |
Prior to the year 1900 there was no statutory limitation to the number of inhabitants necessary to constitute a borough, and consequently many small centres, the residents being mainly engaged in rural occupations, became municipalities. The Municipal Corporations Act now imposes a limit as to area, and provides that no new borough may be constituted unless the proposed area contains at least 1,000 inhabitants.
The following table shows the estimated population of boroughs (excluding Maoris) as at 31st December, 1919, with amendments where necessary on account of subsequent alteration of boundaries:—
| Population of Boroughs. | |
|---|---|
| Borough. | Population. |
| *Town constituted under special Act. | |
| Akaroa | 562 |
| Alexandra | 737 |
| Arrowtown | 322 |
| Ashburton | 3,334 |
| Auckland (City) | 73,852 |
| Balclutha | 1,671 |
| Birkenhead | 2,262 |
| Blenheim | 4,005 |
| Bluff | 1,926 |
| Brunner | 606 |
| Cambridge | 1,711 |
| Carterton | 1,713 |
| Christchurch (City) | 61,104 |
| Cromwell | 576 |
| Dannevirke | 3,515 |
| Dargaville | 1,899 |
| Devonport | 8,140 |
| Dunedin (City) | 57,935 |
| Eastbourne | 1,310 |
| Eketahuna | 850 |
| Eltham | 1,871 |
| Featherston | 1,230 |
| Feilding | 4,949 |
| Foxton | 1,831 |
| Geraldine | 929 |
| Gisborne | 11,022 |
| Gore | 3,735 |
| Green Island | 1,996 |
| Greymouth | 4,960 |
| Greytown | 1,259 |
| Hamilton | 8,059 |
| Hampden | 412 |
| Hastings | 8,543 |
| Hawera | 3,891 |
| Hokitika | 2,241 |
| Inglewood | 1,311 |
| Invercargill | 14,867 |
| Invercargill South | 1,766 |
| Kaiapoi | 1,627 |
| Kaitangata | 1,762 |
| Kumara | 553 |
| Lawrence | 878 |
| Levin | 1,730 |
| Lower Hutt | 5,093 |
| Lyttelton | 3,817 |
| Marton | 1,801 |
| Masterton | 6,256 |
| Mataura | 1,197 |
| Milton | 1,531 |
| Miramar | 2,390 |
| Mosgiel | 1,802 |
| Motueka | 1,513 |
| Mount Albert | 10,422 |
| Mount Eden | 13,023 |
| Napier | 13,785 |
| Naseby | 299 |
| Nelson (City) | 9,107 |
| New Brighton | 3,003 |
| Newmarket | 3,061 |
| New Plymouth | 9,820 |
| Northcote | 1,765 |
| Oamaru | 5,389 |
| Ohakune | 1,455 |
| Onehunga | 6,422 |
| Opotiki | 1,167 |
| Otahuhu | 2,539 |
| Paeroa | 1,471 |
| Pahiatua | 1,650 |
| Palmerston | 788 |
| Palmerston North | 13,617 |
| Patea | 1,155 |
| Petone | 7,652 |
| Picton | 1,195 |
| Port Chalmers | 2,742 |
| Pukekohe | 1,589 |
| Queenstown | 739 |
| Rangiora | 2,081 |
| Riccarton | 3,106 |
| Richmond | 942 |
| Riverton | 980 |
| Ross | 507 |
| Rotorua* | 3,042 |
| Roxburgh | 446 |
| Runanga | 1,406 |
| Shannon | 1,044 |
| Spreydon | 4,961 |
| St. Kilda | 5,788 |
| Stratford | 3,067 |
| Sumner | 2,579 |
| Taihape | 2,045 |
| Takapuna | 3,895 |
| Tapanui | 363 |
| Taumarunui | 1,955 |
| Tauranga | 2,302 |
| Te Aroha | 1,877 |
| Te Awamutu | 1,138 |
Population of Boroughs—continued.
| Borough. | Population. |
|---|---|
| Te Kuiti | 2,119 |
| Temuka | 1,724 |
| Thames | 5,714 |
| Timaru | 13,230 |
| Waihi | 4,804 |
| Waikouaiti | 741 |
| Waimate | 1,942 |
| Waipawa | 1,159 |
| Waipukurau | 1,230 |
| Wairoa | 1,612 |
| Waitara | 1,505 |
| Wanganui | 15,363 |
| Wellington (City) | 81,301 |
| West Harbour | 1,711 |
| Westport | 4,248 |
| Whakatane | 1,082 |
| Whangarei | 3,522 |
| Winton | 576 |
| Woodville | 1,136 |
| Woolston | 4,150 |
For various purposes (vital statistics, &.) metropolitan areas have been created at each of the four chief centres, and suburban areas at nine of the more important secondary centres. Each area includes, in addition to the central borough and suburban boroughs, a considerable non-municipalized area adjacent to and contingent on the centre.
The population figures as estimated at the 31st December, 1919, with necessary subsequent internal amendments due to alteration of boundaries, are as follows:—
| Metropolitan Areas. | |
|---|---|
| Auckland | 144,646 |
| Wellington | 100,898 |
| Christchurch | 101,747 |
| Dunedin | 72,048 |
| Suburban Areas. | |
| Gisborne | 14,366 |
| Napier | 16,383 |
| New Plymouth | 11,051 |
| Wanganui | 21,778 |
| Palmerston North | 14,866 |
| Nelson | 10,340 |
| Grey Valley Boroughs | 8,495 |
| Timaru | 15,028 |
| Invercargill | 18,726 |
The several stages in the growth of a New Zealand town may be marked thus: The village, taxed by the parent county, and dependent upon the latter for all public works; then the legally constituted town district, still subordinate to the county in some matters, its affairs administered by a Board presided over by a Chairman. When its population exceeds 500 the town district may become independent of the county and control the whole of its revenues. When the population reaches 1,000 full municipal powers may be obtained, with the dignity of a Council presided over by a Mayor; and finally, if the number of inhabitants should reach 20,000 or over, the title of “city” may be assumed, although the constitution remains unaltered. The name of each town district and its population as estimated on the 31st December, 1919, including alterations due to subsequent changes in boundaries, are as follows:—
| (a.) Town Districts not forming Parts of Counties. | |
|---|---|
| Town District. | Population. |
| Bull's | 513 |
| Castlecliff | 1,557 |
| Ellerslie | 1,457 |
| Gonville | 2,950 |
| Hampstead | 1,323 |
| Havelock North | 917 |
| Helensville | 895 |
| Hikurangi | 829 |
| Hunterville | 639 |
| Huntly | 1,541 |
| Johnsonville | 940 |
| Lumsden | 537 |
| Manaia | 663 |
| Mangapapa | 1,169 |
| Mangaweka | 413 |
| Manunui | 863 |
| Manurewa | 440 |
| Martinborough | 800 |
| Matamata | 610 |
| Morrinsville | 999 |
| New Lynn | 1,613 |
| Ngaruawahia | 807 |
| Nightcaps | 641 |
| Otaki | 855 |
| Otautau | 712 |
| Papakurạ̣ | 953 |
| Papatoetoe | 801 |
| Pleasant Point | 601 |
| Raetihi | 807 |
| Rangataua | 435 |
| Taradale | 1,066 |
| Te Puke | 664 |
| Tinwald | 818 |
| Tuakau | 417 |
| Upper Hutt | 1,485 |
| Waiuku | 610 |
| Warkworth | 667 |
| Waverley | 661 |
| Wyndham | 660 |
| (b.) Town Districts forming Parts of Counties. | |
|---|---|
| Town District. | Population. |
| Amberley | 338 |
| Clinton | 433 |
| Cobden | 1,080 |
| Edendale | 391 |
| Havelock | 296 |
| Kaikohe | 381 |
| Kamo | 428 |
| Kaponga | 434 |
| Kawakawa ̣̣ ̣̣ | 350 |
| Kawhia | 206 |
| Kihikihi | 296 |
| Kohukohu | 411 |
| Leamington | 469 |
| Lethbridge | 270 |
| Mercer | 352 |
| Normanby | 402 |
| Norsewood | 274 |
| Ohaupo | 277 |
| Ohura | 224 |
| Onerahi | 347 |
| Opunake | 552 |
| Ormondville | 334 |
| Otane | 351 |
| Otorohanga | 392 |
| Outram | 365 |
| Patutahi | 272 |
| Raglan | 282 |
| Rongotea | 283 |
| Southbridge | 434 |
| Takaka | 402 |
| Te Karaka | 356 |
No fewer than nine of the “independent” town districts have sufficient population to enable them to be constituted boroughs, while on the other hand four have fallen below the 500 mark.
At the present time there is being exhibited in many countries a tendency for an increasing proportion of their inhabitants to accumulate in towns. This gradual desertion of the rural life for that of the city is usually referred to as “urban drift.” That this movement is reflected in New Zealand life is certain, but to provide an exact measure of its growth would be an excessively laborious task. The following method, while imperfect, may be taken as indicating approximately the changing of the population: The total population of towns of over 1,000 inhabitants in 1878 is contrasted with the total population of that day. Similar calculations have been made for 1886, 1896, 1906, and 1916. To make allowance for normal expansion, the minimum size of towns dealt with has been raised from 1,000 in 1878 to 1,500 in 1886, 2,000 in 1896, 2,500 in 1906, and 3,000 in 1916, a rate roughly commensurate with the growth of the country. The result was:—
| Year. | Urban Population. | Total Population. | Urban Population expressed as a Percentage of Total Population. |
|---|---|---|---|
| 1878 | 130,407 | 414,412 | 31.47 |
| 1886 | 213,286 | 578,482 | 36.87 |
| 1896 | 250,498 | 703,360 | 35.61 |
| 1906 | 344,308 | 888,578 | 38.75 |
| 1916 | 464,835 | 1,099,449 | 42.28 |
According to this calculation, urban residents formed in 1916 over 42 per cent. of the people, whereas in 1878 they were only 31 1/2 per cent.
Adjacent to the main Islands are many smaller islands, some of which are of considerable area, and are under cultivation; others are but islets used as sites for lighthouses, while others again are barren and unfitted for human habitation. The Chatham Islands and Great Barrier Island have been constituted counties, and their populations are shown in the list of counties already given. The name and population of each of the other inhabited islands as at the census of 1916 are shown in the following table:—
| Islands. | Population. |
|---|---|
| * Excluding internment camp. | |
| Mokohinau | 8 |
| Kawau | 23 |
| Motuketekete | 2 |
| Moturekareka | 1 |
| Little Barrier | 3 |
| Motuhora | 5 |
| Waiheke | 193 |
| Pakihi | 2 |
| Ponui | 21 |
| Rakino | 6 |
| Motutapu | 20 |
| Motuihi* | 6 |
| Rangitoto | 6 |
| Brown's | 5 |
| Rotoroa | 125 |
| Pakatoa | 43 |
| Tiritiri | 13 |
| Slipper | 2 |
| Cuvier | 7 |
| Mercury | 4 |
| Matakana | 7 |
| Motiti | 6 |
| Somes * | 7 |
| Mana | 1 |
| Kapiti | 3 |
| The Brothers | 3 |
| D'Urville | 87 |
| Stephen | 11 |
| Quarantine | 56 |
| Dog | 12 |
| Centre | 9 |
| Total | 697 |
In 1901 the boundaries of New Zealand were extended to include the Cook and certain other Pacific islands, the population of which is given on the next page.
A census of the Maori population is taken every five years, the information being obtained by the collectors either directly or through the chief or head of the tribe or hapu. The name, sex, and age, so far as can be ascertained, of each Maori are entered; but, owing to the nomadic habits of the race and lack of definite knowledge in some particulars, it has been a difficult task in the past. The results of the past six enumerations are as follows:—
| Census Year. | Males. | Females. | Total. |
|---|---|---|---|
| 1891 | 22,861 | 19,132 | 41,993 |
| 1896 | 21,673 | 18,181 | 39,854 |
| 1901 | 23,112 | 20,031 | 43,143 |
| 1906 | 25,538 | 22,193 | 47,731 |
| 1911 | 26,475 | 23,369 | 49,844 |
| 1916 | 25,933 | 23,843 | 49,776 |
The slight decrease in 1916 as compared with 1911 is more than compensated for by the number of Maoris at the front.
The number of half-castes living as members of Maori tribes is given in the next table for six census periods. Those under the first heading are already included among Maoris in the preceding table, the others being classed among the European population.
During the year 1901 the boundaries of the Dominion were extended to include the Cook Group and certain other of the South Pacific islands. No record of the population of these islands was then obtainable, but at each subsequent census an account of the number and birthplaces was taken. The figures for the censuses of 1906, 1911, and 1916 are as follows:—
| Census Year. | Males. | Females. | Total. |
|---|---|---|---|
| 1906 | 6,224 | 6,116 | 12,340 |
| 1911 | 6,449 | 6,149 | 12,598 |
| 1916 | 6,553 | 6,244 | 12,797 |
The islands of Western Samoa are now within the governing authority of the Dominion. An account of the group will be found in the section dealing with Outlying Islands.
Table of Contents
THE number of births registered during 1919 was 24,483 or 21.54 per 1,000 of mean population. This birth-rate of only 21.54 per 1,000, the lowest point ever reached in New Zealand, is somewhat startling. A considerable improvement for 1920 is anticipated if the numbers already recorded in the first part of the year are maintained.
The number of male children born during 1919 was 12,587, and of female children 11,896.
| BIRTHS: NUMBERS AND RATES. | |||
|---|---|---|---|
| Year. | Total Number of Births registered. | Birth-rate. | |
| Per 1,000 of Population. | Compared with Rate in 1882-86, taken as 100. | ||
| * Average of five years. | |||
| 1882-86 | 19,410* | 35.40 | 100 |
| 1890 | 18,278 | 29.44 | 83 |
| 1895 | 18,546 | 26.78 | 76 |
| 1900 | 19,546 | 25.60 | 72 |
| 1905 | 23,682 | 27.22 | 77 |
| 1910 | 25,984 | 26.17 | 74 |
| 1915 | 27,850 | 25.33 | 72 |
| 1916 | 28,509 | 25.94 | 73 |
| 1917 | 28,239 | 25.69 | 73 |
| 1918 | 25.860 | 23.44 | 66 |
| 1919 | 24,483 | 21.54 | 61 |
The decline of the birth-rate in New Zealand has been partially compensated for by a decrease in the death-rate. Nevertheless, the rate of natural increase of population h & s fallen from 31.19 per 1,000 of mean population in 1870 to 12.03 in 1919.
| Period. | Annual Rates per 1,000 living. | ||
|---|---|---|---|
| Births. | Deaths. | Natural Increase. | |
| 1871–1875 | 39.88 | 12.67 | 27.21 |
| 1876–1880 | 41.21 | 11.80 | 29.41 |
| 1881–1885 | 36.36 | 10.95 | 25.41 |
| 1886–1890 | 31.15 | 9.85 | 21.30 |
| 1891–1895 | 27.68 | 10.15 | 17.53 |
| 1896–1900 | 25.75 | 9.55 | 16.20 |
| 1901–1905 | 26.60 | 9.91 | 16.69 |
| 1906–1910 | 27.06 | 9.75 | 17.31 |
| 1911–1915 | 25.98 | 9.22 | 16.76 |
| 1919 | 21.54 | 9.51 | 12.03 |
In spite of the fact that the birth-rate in New Zealand is low compared with other countries, yet so low is the Dominion's death-rate that New Zealand has one of the highest rates of natural increase among countries keeping records of births and deaths.
The diagram which follows shows the rates of births and deaths and of natural increase per 1,000 of mean population each year from 1855 to 1919. The marriage-rate is also shown.
GRAPHS SHOWING THE RATES OF BIRTHS, DEATHS, MARRIAGES, AND NATURAL INCREASE IN NEW ZEALAND, 1855–1919.
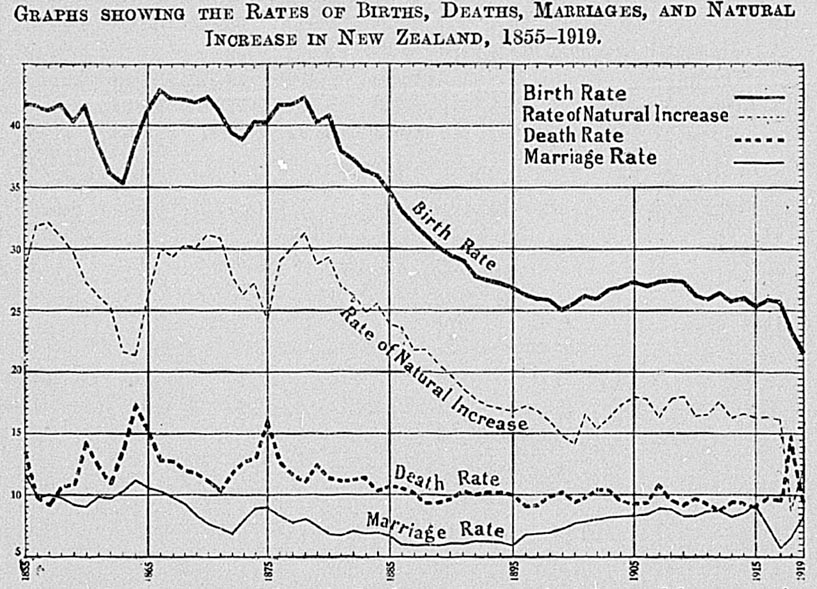
The well-known fact that the birth-rate is strongly influenced by economic factors finds illustration in the position revealed by this graph, falls in the curve occurring during periods of economic depression. Recent declines are, of course, largely, if not wholly, due to war influences. At the present time birth-rates show a world-wide tendency to decline.
BIRTH-RATES (LEGITIMATE) PER 1,000 MARRIED WOMEN AT CHILD-BEARING AGES FOR EACH CENSUS YEAR, 1878 TO 1916.
| Year (Census). | Number of Married Women between 15 and 45 Years of Age. | Proportion per Cent. of Married Women in the Female Population aged 15 to 45 Years. | Number of Legitimate Births (Confinements). | Birth-rate per 1,000 Married Women of from 15 to 45 Years of Age. |
|---|---|---|---|---|
| 1878 | 50,995 | 63.50 | 17,196 | 337.2 |
| 1881 | 57,458 | 59.76 | 18,003 | 313.3 |
| 1886 | 62,704 | 53.19 | 18,532 | 295.5 |
| 1891 | 63,165 | 48.12 | 17,455 | 276.3 |
| 1896 | 69,807 | 44.12 | 17,596 | 252.1 |
| 1901 | 79,406 | 43.30 | 19,355 | 243.8 |
| 1906 | 98,211 | 46.15 | 22,352 | 227.6 |
| 1911 | 119,355 | 49.59 | 24,972 | 209.2 |
| 1916 | 141,322 | 52.97 | 26,786 | 189.5 |
Taking the whole of the four metropolitan areas into consideration the birth-rate for 1919 was 19.67 per 1,000. Each individual metropolitan area has a lower rate than the Dominion as a whole (21.54 per 1,000), a position which always obtains. Tho rates for five years, 1915 to 1919, are given below:—
| Births per 1,000 of Population. | |||||
|---|---|---|---|---|---|
| 1915. | 1916. | 1917. | 1918. | 1919. | |
| * Metropolitan areas in 1917. | |||||
| Auckland (including suburbs)* | 23.13 | 23.35 | 22.33 | 21.77 | 19.47 |
| Wellington (including suburbs) | 24.19 | 24.30 | 25.25 | 23.15 | 21.13 |
| Christchurch (including suburbs) | 22.19 | 23.54 | 22.96 | 20.22 | 19.79 |
| Dunedin (including suburbs) | 20.73 | 23.32 | 22.47 | 18.69 | 17.94 |
The fact is well illustrated above that, of tho four centres, Wellington usually has the highest rate and Dunedin the lowest. Explanation of this lies in the difference in age-constitution between the cities. In any year the ages of tho parents of the great majority of children born in that year range from 25 to 50 years. Considering this group (i.e., married people of ages 25 to 49 inclusive) it is found that it forms to the total population a proportion of 41.48 per cent, in Auckland, in Wellington 46.19 per cent., in Christchurch 40.66 per cent., in Dunedin only 36.58 per cent. These proportions are clearly reflected in the birth-rates.
Of recent years the Australian birth-rate has been higher than that of New Zealand.
The movement over the last ten years is as follows:—
BIRTH-RATES PER 1,000 OF POPULATION.
| State. | 1910. | 1911. | 1912. | 1913. | 1914. | 1915. | 1916. | 1917. | 1918. | 1919. |
|---|---|---|---|---|---|---|---|---|---|---|
| Queensland | 27.33 | 27.65 | 29.67 | 30.24 | 29.46 | 29.35 | 27.91 | 29.09 | 28.37 | 26.23 |
| New South Wales | 27.83 | 28.75 | 29.86 | 28.86 | 28.96 | 28.33 | 27.89 | 28.06 | 26.53 | 24.68 |
| Victoria | 24.51 | 24.84 | 26.39 | 25.82 | 25.45 | 24.55 | 24.30 | 23.50 | 22.29 | 21.56 |
| South Australia | 26.50 | 26.89 | 28.65 | 29.08 | 29.33 | 26.81 | 27.37 | 26.21 | 25.80 | 24.27 |
| Western Australia | 27.99 | 28.21 | 28.83 | 29.36 | 28.45 | 27.97 | 27.21 | 25.54 | 22.84 | 21.44 |
| Tasmania | 29.25 | 28.57 | 30.53 | 30.03 | 30.33 | 29.32 | 28.47 | 27.03 | 25.91 | 25.12 |
| Aust. Commonwealth | 26.73 | 27.21 | 28.65 | 28.25 | 28.05 | 27.25 | 26.78 | 26.51 | 25.25 | 23.78 |
| New Zealand | 26.17 | 25.97 | 26.48 | 26.14 | 25.99 | 25.33 | 25.94 | 25.69 | 23.44 | 21.54 |
The birth-rates for ten years in Great Britain and Ireland and certain countries of tho European Continent are also given. The decline is steady and continuous, except in the cases of Roumania and Hungary, where the rates are very high.
| Number of Births per 1,000 of Mean Population. | ||||||||||
|---|---|---|---|---|---|---|---|---|---|---|
| Country. | 1905. | 1906. | 1907. | 1908. | 1909. | 1910. | 1911. | 1912. | 1913. | 1914. |
| Roumania | 38.3 | 39.9 | 41.1 | 40.3 | 41.1 | 39.2 | 42.3 | 43.4 | 42.1 | 42.5 |
| Hungary | 36.3 | 36.5 | 36.7 | 36.9 | 37.7 | 35.7 | 35.0 | 36.3 | ||
| Spain | 35.2 | 34.0 | 33.6 | 34.0 | 33.5 | 33.1 | 31.2 | 32.6 | 30.4 | 29.8 |
| Italy | 32.7 | 32.1 | 31.7 | 33.7 | 32.7 | 33.3 | 31.5 | 32.4 | 31.7 | 31.1 |
| Austria | 33.9 | 35.0 | 34.0 | 33.7 | 33.4 | 32.5 | 31.4 | 31.3 | ||
| German Empire | 32.9 | 33.1 | 32.3 | 32.1 | 31.0 | 29.8 | 28.6 | 28.3 | 27.5 | |
| Netherlands | 30.8 | 30.4 | 30.0 | 29.7 | 29.1 | 28.6 | 27.8 | 28.1 | 28.1 | 28.2 |
| Denmark | 28.4 | 28.5 | 28.2 | 28.5 | 28.2 | 27.5 | 26.7 | 26.7 | 25.6 | 25.6 |
| Scotland | 28.6 | 28.6 | 27.7 | 28.1 | 27.3 | 26.2 | 25.6 | 25.9 | 25.5 | 26.1 |
| Norway | 27.4 | 26.7 | 26.4 | 26.3 | 26.3 | 26.1 | 25.9 | 25.6 | 25.3 | 25.2 |
| Switzerland | 26.9 | 26.9 | 26.2 | 26.4 | 25.5 | 25.0 | 24.2 | 24.1 | 23.1 | |
| England and Wales | 27.3 | 27.2 | 26.5 | 26.7 | 25.8 | 25.1 | 24.3 | 23.9 | 24.1 | 23.8 |
| Sweden | 25.7 | 25.7 | 25.5 | 25.7 | 25.6 | 24.7 | 24.0 | 23.8 | 23.1 | 22.9 |
| Ireland | 23.4 | 23.5 | 23.2 | 23.3 | 23.4 | 23.3 | 23.2 | 23.0 | 22.8 | 22.6 |
| Belgium | 26.1 | 25.7 | 25.3 | 24.9 | 23.7 | 23.7 | 22.9 | 22.6 | ||
| France | 20.6 | 20.6 | 19.7 | 20.1 | 19.5 | 19.6 | 18.7 | 19.0 | 19.0 | 18.0 |
An examination of the figures shows that, with the exception of one year, there has always been a preponderance of males in the number of children born in New Zealand. The proportions are usually shown by stating the number of births of male children to every 1,000 female births. This number has been as high as 1,113 (in 1859), and as low as 991 (in 1860). Little significance can be attached to any figures prior to 1870, on account of the comparatively small number of births. The period preceding 1870 exhibits violent fluctuations in the proportion of males, which tend to disappear as the total of births grows larger. The extreme range since 1870 has been from 1,016 male to 1,000 female births in 1878, to 1,078 in 1875 and 1,073 in 1915.
| Year. | Number of Births of | Proportion of Births of Males to every 1,000 Females. | |
|---|---|---|---|
| Males. | Females. | ||
| 1910 | 13,442 | 12,542 | 1,072 |
| 1911 | 13,532 | 12,822 | 1,055 |
| 1912 | 13,996 | 13,512 | 1,036 |
| 1913 | 14,433 | 13,502 | 1,069 |
| 1914 | 14,535 | 13,803 | 1,053 |
| 1915 | 14,415 | 13,435 | 1,073 |
| 1916 | 14,669 | 13,840 | 1,060 |
| 1917 | 14,329 | 13,910 | 1,030 |
| 1918 | 13,124 | 12,736 | 1,030 |
| 1919 | 12,587 | 11,896 | 1,058 |
There were 270 eases of twin births (540 children), two cases of triplets and one of quadruplets registered in 1919. The number of children born was 24,483; the number of mothers was 24,206: thus, on an average, one mother in every 89 gave birth to twins or triplets.
The number of cases of plural births and the proportion per 1,000 of the total cases of births during the past five years was,—
| Year. | Total Births. | Total Cases. | Cases of Twins. | Cases of Triplets. | Plural Cases per 1,000 of Total Cases |
|---|---|---|---|---|---|
| * Including one case of quadruplets. | |||||
| 1915 | 27,850 | 27,546 | 302 | 1 | 11.00 |
| 1916 | 28,509 | 28,184 | 323 | 1 | 11.50 |
| 1917 | 28,239 | 27,927 | 312 | 11.17 | |
| 1918 | 25,860 | 25,560 | 294 | 3 | 11.62 |
| 1919 | 24,483 | 24,206 | 270 | 3* | 11.15 |
The following table shows the sexes in individual cases of twin births for the last eight years:—
| Year. | Total Cases. | Both Males. | Both Females. | Opposite Sexes. |
|---|---|---|---|---|
| 1912 | 329 | 114 | 106 | 109 |
| 1913 | 314 | 108 | 86 | 120 |
| 1914 | 350 | 105 | 116 | 129 |
| 1915 | 302 | 93 | 88 | 121 |
| 1916 | 323 | 99 | 98 | 126 |
| 1917 | 312 | 90 | 105 | 117 |
| 1918 | 294 | 87 | 95 | 112 |
| 1919 | 270 | 81 | 79 | 110 |
During the eight years 1912–19 there were seventeen cases of triplets. In three cases all the children were males, in four cases all were females, in three cases there were two males and one female, and in each of the remaining seven cases two of the three children were females.
There occurred in 1919 one case of quadruplets, all male children.
An examination of the total still-births recorded during 1915–19 shows that of 3,447 cases 188 (5.45 per cent.) were found in cases of plural births, either one or both of the children being still-born. Since, for living births in the same period, plural cases were only 1.13 per cent. of total cases, it appears that still-births occur proportionately almost five times as often in plural births as in cases of single births.
| Age of Mother, in Years. | Illegitimate Births. | Duration of Marriage, in Months. | Total Legitimate First Births within One Year after Marriage. | |||||||
|---|---|---|---|---|---|---|---|---|---|---|
| Under 3. | 3 and under 6. | 6 and under 7. | 7 and under 8. | 8 and under 9. | 9 and under 10. | 10 and 11. | 11 and under 12. | |||
| Under 21 | 348 | 82 | 159 | 71 | 55 | 35 | 47 | 35 | 27 | 511 |
| 21 and under 25 | 362 | 99 | 207 | 116 | 98 | 101 | 198 | 169 | 123 | 1,111 |
| 25 and under 30 | 197 | 48 | 82 | 56 | 41 | 70 | 143 | 124 | 92 | 656 |
| 30 and under 35 | 108 | 12 | 20 | 9 | 23 | 21 | 55 | 48 | 48 | 236 |
| 35 and under 40 | 79 | 6 | 16 | 5 | 5 | 8 | 24 | 17 | 23 | 104 |
| 40 and under 45 | 38 | 4 | 4 | 1 | 3 | 2 | 4 | 1 | 19 | |
| 45 and over | ||||||||||
| Totals | 1,132 | 251 | 488 | 258 | 222 | 238 | 469 | 397 | 314 | 2,637 |
A compilation of births registered in 1919 gives 5,485 children (23 per cent, of all legitimate births) as first issue of the existing marriage. Of these 2,851 were males and 2,634 females; the sex proportion being thus 1,082 males to 1,000 females—somewhat higher than for all births. Plural cases numbered 46, or 0.85 per cent, of the total, as compared with 1.12 per cent. for all births.
The birth statistics for 1918 contained one feature which was by way of a novelty in New Zealand statistics. This consisted of a series of tables showing the period that elapsed between successive births, in conjunction with the total number of children born. One table is repeated in this issue.
| Average Interval (In Years) between | Cases in which the Number of Children In the Family was | ||||||||||
|---|---|---|---|---|---|---|---|---|---|---|---|
| 2. | 3. | 4. | 5. | 6. | 7. | 8. | 9. | 10 | Over 10. | All Families. | |
| First and second child | 2.96 | 2.75 | 2.55 | 2.35 | 2.27 | 2.27 | 2.24 | 2.14 | 2.15 | 2.01 | 2.67 |
| Second and third child | 3.33 | 2.98 | 2.69 | 2.48 | 2.41 | 2.27 | 2.24 | 2.36 | 1.92 | 2.94 | |
| Third and fourth child | 3.33 | 2.96 | 2.72 | 2.63 | 2.39 | 2.42 | 2.25 | 2.21 | 2.98 | ||
| Fourth and fifth child | 3.30 | 2.92 | 2.65 | 2.61 | 2.50 | 2.49 | 2.27 | 2.97 | |||
| Fifth and sixth child | 3.20 | 2.80 | 2.65 | 2.54 | 2.43 | 2.19 | 2.88 | ||||
The births of 1,138 children (581 males, 557 females) were illegitimate: thus 46 in every 1,000 children registered were born out of wedlock.
| Age. | Single Cases. | Plural Cases. |
|---|---|---|
| Years. | ||
| 14 | 1 | |
| 15 | 10 | |
| 16 | 32 | |
| 17 | 41 | |
| 18 | 75 | 1 |
| 19 | 79 | |
| 20 | 109 | |
| 21 | 116 | 1 |
| 22 | 98 | |
| 23 | 87 | |
| 24 | 60 | |
| 25 | 59 | 1 |
| 26 | 44 | |
| 27 | 33 | |
| 28 | 28 | |
| 29 | 32 | |
| 30 | 33 | 1 |
| 31 | 17 | |
| 32 | 14 | 1 |
| 33 | 25 | |
| 34 | 17 | |
| 35 | 20 | |
| 36 | 17 | |
| 37 | 12 | |
| 38 | 16 | |
| 39 | 13 | 1 |
| 40 | 12 | |
| 41 | 6 | |
| 42 | 6 | |
| 43 | 5 | |
| 44 | 9 | |
| Total | 1,126 | 6 |
The proportion of illegitimate births per 1,000 unmarried women —i.e., spinsters and widows—at the reproductive ages, covering a period of twenty-five years, is shown in the following table.
| Year. | Unmarried Women aged 15-45 Years. | Illegitimate Births. | Illegitimate-birth Rate per 1,000 Unmarried Women. |
|---|---|---|---|
| 1891 | 68,990 | 638 | 9.25 |
| 1896 | 89,722 | 834 | 9.30 |
| 1901 | 105,420 | 937 | 8.89 |
| 1906 | 116,506 | 1,132 | 9.72 |
| 1911 | 116,726 | 1,078 | 9.24 |
| 1916 | 125,461 | 1,159 | 9.24 |
The rates of illegitimacy in Australasia are quoted. The average rate for New Zealand for the ten years (4.37 per 100 of all births) compares favourably with that of the Commonwealth (5.39 per 100).
| Year. | Queensland. | New South Wales. | Victoria. | South Australia. | Western Australia. | Tasmania. | Commonwealth. | New Zealand. |
|---|---|---|---|---|---|---|---|---|
| 1909 | 7.05 | 6.44 | 5.94 | 4.18 | 3.95 | 5.45 | 6.01 | 4.61 |
| 1910 | 6.39 | 6.28 | 5.60 | 4.32 | 4.13 | 5.33 | 5.75 | 4.47 |
| 1911 | 6.22 | 6.14 | 5.96 | 4.21 | 4.47 | 5.33 | 5.79 | 4.09 |
| 1912 | 6.14 | 5.64 | 5.72 | 4.71 | 4.39 | 4.78 | 5.53 | 4.28 |
| 1913 | 6.22 | 5.35 | 6.03 | 4.18 | 4.40 | 5.18 | 5.48 | 4.23 |
| 1914 | 5.77 | 5.29 | 5.56 | 3.87 | 4.22 | 5.90 | 5.26 | 4.59 |
| 1915 | 5.36 | 4.97 | 5.74 | 4.00 | 4.24 | 5.32 | 5.12 | 4.14 |
| 1916 | 5.11 | 4.73 | 5.15 | 3.80 | 3.75 | 5.05 | 4.77 | 4.10 |
| 1917 | 5.01 | 4.74 | 5.53 | 3.96 | 4.15 | 5.28 | 4.91 | 4.56 |
| 1918 | 5.46 | 5.18 | 5.85 | 4.02 | 4.02 | 5.28 | 5.23 | 4.65 |
The Legitimation Act makes provision for the legitimation of children born before marriage on the subsequent intermarriage of their parents. For legitimation purposes Registrars must register a birth when called upon to do so by any person claiming to be the father of an illegitimate child; but such person is required to make a solemn declaration that he is the father, and that at the time of the birth there existed no legal impediment to his marriage with the mother of the child. He has also to produce the evidence of his marriage. The following is the number of legitimations in the past ten years, and the total since the Act came into force:—
| Number of Children legitimized. | |||
|---|---|---|---|
| Year. | Previously registered. | Not Previously registered. | Total. |
| 1910 | 75 | 46 | 121 |
| 1911 | 76 | 46 | 122 |
| 1912 | 86 | 51 | 137 |
| 1913 | 89 | 72 | 161 |
| 1914 | 99 | 66 | 165 |
| 1915 | 100 | 67 | 167 |
| 1916 | 190 | 91 | 281 |
| 1917 | 213 | 96 | 309 |
| 1918 | 128 | 76 | 420 |
| 1919 | 100 | 66 | 166 |
| Totals. | 1,904 | 1,140 | 3,044 |
The registration of still-births has been made compulsory in New Zealand as from the 1st March, 1913. Still–births are not included either as births or as deaths in the various numbers and rates shown in this subsection and in that relating to deaths.
In the 680 still-births registered in 1919 are included eight cases of twins, and thirty-four cases where one child of twins was still-born.
The sexes recorded in cases of still-births during each of the last five years are as follows:—
| Year. | Male. | Female. | Not stated. | Total. |
|---|---|---|---|---|
| 1915 | 382 | 340 | 6 | 728 |
| 1916 | 383 | 295 | 4 | 682 |
| 1917 | 375 | 305 | 14 | 694 |
| 1918 | 396 | 300 | 5 | 701 |
| 1919 | 377 | 288 | 15 | 680 |
The number of births of Maoris registered during 1919 under the provisions of section 20 of the Births and Deaths Registration Amendment Act, 1912, was 995. Only 14 Maori births were registered under the main Act.
Regulations under the Cook Islands Act, 1915, providing for compulsory registration of births and deaths in the Cook Islands and Niue from the 1st July, 1916, were gazetted on the 29th June, 1916.
| Islands. | Number of Births. |
|---|---|
| Rarotonga | 160 |
| Aitutaki | 60 |
| Mangaia | 63 |
| Manihiki | |
| Rakahanga | 14 |
| Atiu | 46 |
| Mauke | 19 |
| Mitiaro | 5 |
| Penrhyn | 4 |
| Niue | 110 |
| Total | 481 |
NOTE.—In some cases the above figures are for the calendar year 1919, others for year ending March, 1920, others again for different periods.
IN the following table are shown the numbers and rates for a series of years. A column is added showing the index number for the year as compared with the average of the five years 1882-86, taken as 100.
The marriage-rate for the period under review—war years 1915–18 excepted — shows a general upward tendency, having been above 8 per 1,000 in each year since and including 1902. Reference to the diagram on page 22 will show that the marriage-rate was at its lowest in the period 1885 to 1895, and that the rate in the early years of registration was considerably in excess of that in even the best of recent years.
| Year | Total Number of Marriages registered. | Marriage-rate. | |
|---|---|---|---|
| Per 1,000 of Population. | Compared with Rate in 1882-86, taken as 100. | ||
| * Average for five years. | |||
| 1882-86 | 3,663* | 6.68 | 100 |
| 1890 | 3,797 | 6.12 | 92 |
| 1895 | 4,110 | 5.94 | 89 |
| 1900 | 5,860 | 7.67 | 115 |
| 1905 | 7,200 | 8.28 | 124 |
| 1910 | 8,236 | 8.30 | 124 |
| 1915 | 10,028 | 9.12 | 137 |
| 1916 | 8,213 | 7.47 | 112 |
| 1917 | 6,417 | 5.84 | 87 |
| 1918 | 6,227 | 5.65 | 85 |
| 1919 | 9,519 | 8.38 | 125 |
The cessation of hostilities at the end of 1918 and the repatriation during 1919 of the great bulk of the Expeditionary Force has led to a healthy increase in marriages. Though not quite reaching the normal level of pre-war years, the progress made is satisfactory in view of two rate-depressing influences: first, the loss to the Dominion of many thousands of lives; and, secondly, the marriage abroad of no inconsiderable body of soldiers, the majority of whom would otherwise have married in this country.
| Year. | March Quarter. | June Quarter. | September Quarter. | December Quarter. |
|---|---|---|---|---|
| 1915 | 1,984 | 2,728 | 2,247 | 3,069 |
| 1916 | 2,214 | 2,393 | 1,773 | 1,833 |
| 1917 | 1,511 | 1.805 | 1,505 | 1,596 |
| 1918 | 1,457 | 1,756 | 1,593 | 1,421 |
| 1919 | 1,631 | 2,432 | 2,450 | 3,006 |
| Quinquennial average | 1,759 | 2,223 | 1,914 | 2,185 |
It will be seen that the June quarter is apparently considered the most propitious for the solemnization of marriage. The two years exceptional in this respect are 1915 and 1919. In the first year the December quarter was swelled by the influence of the National Registration Act of October, 1915; and the second may be explained by the celebration of many marriages postponed until the return of soldiers abroad.
An additional investigation of marriages contracted in 1919 reveals the pre-eminence which December has attained as a suitable month for entering the matrimonial state. The marriages contracted in each month were as follows:—
| January | 558 |
| February | 501 |
| March | 572 |
| April | 932 |
| May | 590 |
| June | 910 |
| July | 833 |
| August | 798 |
| September | 819 |
| October | 923 |
| November | 801 |
| December | 1,282 |
| Total | 9,519 |
Wednesday claims almost half of the total marriages—
| Sunday | 54 |
| Monday | 1,109 |
| Tuesday | 1,645 |
| Wednesday | 4,109 |
| Thursday | 1,279 |
| Friday | 476 |
| Saturday | 847 |
| Total | 9,519 |
The days of the year on which an exceptionally large number of marriages were performed were,—
| 23rd April | 137 |
| 26th November | 120 |
| 25th June | 117 |
| 30th April | 110 |
| 15th October | 107 |
| 31st December | 106 |
All these days were, it may be remarked, Wednesdays. Easter Monday, usually considered a most suitable day, ranked only thirteenth in favour.
A comparison of the marriage-rate of each Australian State with New Zealand for ten years is given. The Commonwealth rate has for some years been higher than that of this country.
| Year. | Queensland. | New South Wales. | Victoria. | South Australia (Proper). | Western Australia. | Tasmania. | Commonwealth. | New Zealand. |
|---|---|---|---|---|---|---|---|---|
| 1910 | 8.06 | 8.76 | 7.98 | 9.17 | 7.77 | 7.82 | 8.37 | 8.30 |
| 1911 | 8.41 | 9.24 | 8.34 | 9.81 | 8.44 | 7.76 | 8.79 | 8.70 |
| 1912 | 8.91 | 9.60 | 8.65 | 9.62 | 8.37 | 7.86 | 9.07 | 8.81 |
| 1913 | 8.67 | 9.02 | 8.13 | 9.40 | 8.19 | 8.27 | 8.66 | 8.25 |
| 1914 | 8.73 | 9.37 | 8.31 | 9.11 | 8.22 | 7.78 | 8.80 | 8.51 |
| 1915 | 8.93 | 9.68 | 9.00 | 9.02 | 8.01 | 8.02 | 9.14 | 9.12 |
| 1916 | 7.69 | 8.74 | 8.05 | 8.31 | 7.51 | 7.23 | 8.21 | 7.47 |
| 1917 | 7.16 | 7.09 | 6.76 | 7.52 | 5.25 | 5.72 | 6.87 | 5.84 |
| 1918 | 6.99 | 6.90 | 6.46 | 7.25 | 5.18 | 5.55 | 6.65 | 5.65 |
| 1919 | 7.62 | 8.04 | 7.98 | 8.46 | 6.78 | 7.16 | 7.88 | 8.38 |
The average rate for New Zealand in normal years is higher than the rate for most of the European countries with the exception of the races of the east and south-east of Europe.
The table which follows gives information as to the conjugal condition of persons married in each of the past ten years, divorced men and women being classed as bachelors and spinsters.
| Year. | Marriages contracted between | Number of Divorced Persons married (included previously). | Total Marriages registered. | |||
|---|---|---|---|---|---|---|
| Bachelors and Spinsters. | Bachelors and Widows. | Widowers and Spinsters. | Widowers and Widows. | |||
| 1910 | 7,440 | 306 | 342 | 148 | 150 | 8,236 |
| 1911 | 8,036 | 258 | 365 | 166 | 165 | 8,825 |
| 1912 | 8,350 | 253 | 413 | 133 | 204 | 9,149 |
| 1913 | 8,034 | 274 | 370 | 135 | 218 | 8,813 |
| 1914 | 8,672 | 276 | 398 | 134 | 204 | 9,280 |
| 1915 | 9,124 | 337 | 394 | 173 | 227 | 10,028 |
| 1916 | 7,323 | 329 | 408 | 153 | 230 | 8,213 |
| 1917 | 5,613 | 284 | 369 | 151 | 218 | 6,417 |
| 1918 | 5,370 | 284 | 427 | 146 | 261 | 6,227 |
| 1919 | 8,337 | 403 | 572 | 207 | 345 | 9,519 |
The figures for 1919 are given herewith in more detail as to conjugal condition of bride and bridegroom immediately prior to the marriage.
| Condition of Bridegrooms. | Condition of Brides. | |||
|---|---|---|---|---|
| Spinsters. | Divorced Women. | Widows. | Total. | |
| Bachelors | 8,079 | 154 | 372 | 8,605 |
| Divorced men | 88 | 16 | 31 | 135 |
| Widowers | 532 | 40 | 207 | 779 |
| Total | 8,699 | 210 | 610 | 9,519 |
Included amongst widows in 1919 are eighteen married women, and amongst the widowers eleven men, who elected to go through the form of marriage with other persons under the protection of the provisions of section 224, subsection (5), of the Crimes Act, which reads, “No one commits bigamy by going through a form of marriage if he or she has been continually absent from his or her wife or husband for seven years then last past, and is not proved to have known that his wife or her husband was alive at any time during those seven years.”
Of the persons married in 1919, 344 bridegrooms and 1,272 brides were under twenty-one years of age. Of the bridegrooms, ten were between seventeen and eighteen, while thirty-seven were between eighteen and nineteen. Of the brides, four were between fifteen and sixteen, and twenty-eight between sixteen and seventeen years of age. A table is given showing relative ages of bridegrooms and brides in groups of years.
| Age of Bridegroom. in Years. | Age of Bride, in Years. | Total Bridegrooms. | ||||||
|---|---|---|---|---|---|---|---|---|
| Under 21. | 21 and under 25 | 25 and under 30 | 30 and under 35 | 35 and under 40 | 40 and under 45 | 45 and over. | ||
| Under 21 | 199 | 125 | 17 | 3 | 344 | |||
| 21 and under 25 | 501 | 1,041 | 269 | 39 | 4 | 1 | 1,855 | |
| 25 and under 30 | 387 | 1,263 | 1,083 | 207 | 49 | 4 | 1 | 2,994 |
| 30 and under 35 | 114 | 586 | 774 | 392 | 93 | 19 | 10 | 1,988 |
| 35 and under 40 | 48 | 210 | 338 | 302 | 166 | 61 | 21 | 1,146 |
| 40 and under 45 | 20 | 53 | 106 | 129 | 116 | 87 | 35 | 546 |
| 45 and over | 3 | 30 | 59 | 85 | 112 | 127 | 230 | 646 |
| Total brides | 1,272 | 3,308 | 2,646 | 1,157 | 540 | 299 | 297 | 9,519 |
The decrease in the proportion of men at the ages at which marriages are usually solemnized is exemplified in the following statement giving average age of bridegrooms and brides over a series of years:—
| Year. | Mean Age of Bridegrooms. | Mean Age of Brides |
|---|---|---|
| 1900 | 29.91 | 25.29 |
| 1903 | 29.89 | 25.84 |
| 1906 | 29.76 | 25.97 |
| 1909 | 30.11 | 26.40 |
| 1912 | 29.95 | 26.39 |
| 1915 | 3003 | 26.56 |
| 1918 | 31.57 | 27.16 |
| 1919 | 31.21 | 27.11 |
In England the mean age of those whose ages were stated was (average of the five years 1910–14) 29.02 years for men and 26.77 years for women. As in the case of New Zealand, ages of both bridegrooms and brides have risen swiftly during the war years, reaching in 1917, 30.04 years for bridegrooms and 27.27 for brides. Thus the average age at marriage in New Zealand would appear to be higher for men, but slightly lower for women, than in England. The average age of all spinsters married in New Zealand in 1919 was 26.03 years. Australian figures for 1918 give the mean ages of groom and bride as 29.55 and 26.11 respectively.
The foregoing figures give the average age at marriage, but these do not correspond with the popular age, if the age at which the most marriages are celebrated may be so termed.
In 1919 ages twenty-six and twenty-seven compete for pride of place for bridegrooms, and twenty-one holds good in the case of brides. If the marriages of spinsters only be considered, age twenty-one is still the most popular.
Of every 1,000 men married in 1919, 36 were under twenty-one years of age, while 134 in every 1,000 brides were under twenty-one. The proportion of bridegrooms under twenty-one is in normal years 2 per cent. of the total number. The proportions for 1917 (3.6 per cent.), 1918 (5.1 per cent.), and 1919 (3.6 per cent.) therefore represent high increases in marriages of male minors. No corresponding rise occurs in the proportion of marriages of female minors.
| Year. | Bridegrooms. | Brides. | Minors, per 100 Marriages. | |||
|---|---|---|---|---|---|---|
| Adults. | Minors. | Adults. | Minors. | Bridegrooms. | Brides. | |
| 1910 | 8,080 | 156 | 6,975 | 1,261 | 1.95 | 15.70 |
| 1911 | 8,653 | 172 | 7,499 | 1,326 | 1.95 | 15.02 |
| 1912 | 8,947 | 172 | 7,688 | 1,461 | 1.88 | 15.97 |
| 1913 | 8,654 | 159 | 7,419 | 1,394 | 1.80 | 15.82 |
| 1914 | 9,085 | 195 | 7,842 | 1,438 | 2.10 | 15.50 |
| 1915 | 9,819 | 209 | 8,516 | 1,512 | 2.08 | 15.07 |
| 1916 | 8,052 | 161 | 6,943 | 1,270 | 1.96 | 15.46 |
| 1917 | 6,187 | 230 | 5,343 | 1,074 | 3.58 | 16.74 |
| 1918 | 5,912 | 315 | 5,266 | 961 | 5.06 | 15.43 |
| 1919 | 9,175 | 344 | 8,247 | 1,272 | 3.61 | 13.36 |
The ages at which persons may contract binding marriages are the same as in England—twelve years for females and fourteen for males. Marriage may be contracted at earlier ages than those stated, but would be voidable at the discretion of either of the parties upon reaching the age of twelve or fourteen, as the case may be, and without the necessity of proceedings in Court.
In connection with the fertility of marriages the succeeding table is of interest. The number of children born to the marriages in existence at the census in 1916 was over three. It should be kept in mind that this number does not represent the average children of a parent, but only the average children of the existing marriage, which is necessarily somewhat less than in the former case.
| AVERAGE ISSUE PER MARRIAGE. | |||
|---|---|---|---|
| Duration of existing Marriage. | Average of Issue born. | ||
| New Zealand, Census, 1916. | New Zealand, Census, 1911. | Australia, Census, 1911. | |
| Under 5 years | 0.88 | 1.21 | 0.89 |
| 5 to 9 years | 2.18 | 2.51 | 2.29 |
| 10 to 14 years | 3.05 | 3.54 | 3.34 |
| 15 to 19 years | 3.77 | 4.39 | 4.24 |
| 20 to 24 years | 4.35 | 5.23 | 5.05 |
| 25 to 29 years | 4.99 | 5.92 | 5.87 |
| 30 to 34 years | 5.65 | 6.78 | 6.67 |
| 35 to 39 years | 6.46 | 7.38 | 7.25 |
| 40 to 45 years | 7.16 | 7.81 | 7.74 |
| 45 and over | 7.76 | 8.34 | 8.37 |
| Unspecified | 3.05 | 3.61 | 4.53 |
| All periods | 3.24 | 3.94 | 3.78 |
The heavy decline from 1911 to 1916 may perhaps be discounted to some extent by the fact that in the prior year the proportion of cases where the number of issue was not stated formed nearly 12 per cent. of the total.
These cases were not included in computing the averages, and may have belonged in any proportion to any group. In 1916 the percentage of unstated cases was reduced to less than 1 per cent.
The continuous rise during all periods of duration of marriage is at first glance rather curious, since additions to families after a marriage of thirty years’ standing would be infinitesimal, and would certainly not take place after forty years. It is, however, merely the effect of the steady decline in the once high birth-rate. Taking thirty years of marriage as the point marking the limit of fertility, then the average issue in respect of marriages of longer duration was 7.41 in 1911 and 6.52 in 1916.
Of the 9,519 marriages registered in 1919, Church of England clergymen officiated at 2,595, Presbyterians at 2,462, Methodists at 1,114, and Roman Catholics at 1,055, while 1,801 marriages were celebrated before Registrars.
| Denomination. | Percentage of Marriages. | ||||
|---|---|---|---|---|---|
| 1915. | 1916. | 1917. | 1918. | 1919. | |
| Church of England | 26.76 | 25.73 | 24.54 | 25.36 | 27.26 |
| Presbyterians | 25.84 | 25.36 | 22.92 | 24.09 | 25.87 |
| Methodists | 11.83 | 10.47 | 10.44 | 11.22 | 11.70 |
| Roman Catholics | 11.18 | 12.02 | 11.94 | 11.19 | 11.08 |
| Other denominations | 5.83 | 5.37 | 5.39 | 5.06 | 5.17 |
| Before Registrars | 18.56 | 21.05 | 24.77 | 23.08 | 18.92 |
| 100.00 | 100.00 | 100.00 | 100.00 | 100.00 | |
The number of names on the list of officiating ministers under the Marriage Act is (May, 1920) 1,638, and the denominations to which they belong are shown hereunder:—
| Denomination. | Number. |
|---|---|
| Specified in statute— | |
| Church of England | 440 |
| Presbyterian Church of New Zealand | 366 |
| Methodist Church of New Zealand | 234 |
| Roman Catholic Church | 269 |
| Congregational Independents | 28 |
| Baptists | 61 |
| Lutheran Church | 7 |
| Hebrew Congregations | 5 |
| Not specified in statute— | |
| Church of Christ | 34 |
| Salvation Army | 116 |
| Catholic Apostolic Church | 4 |
| Old Catholic Church | |
| Unitarians | 3 |
| Seventh-day Adventists | 18 |
| Latter-day Saints | 9 |
| Church of the Seven Rules of Jehovah | 15 |
| Ringatu Church | 11 |
| Others | 18 |
| Total | 1,638 |
The Ringatu Church and the Church of the Seven Rules of Jehovah are Maori denominations.
Of the men married in 1919, eight, and of the women fourteen, signed the register by mark.
Of twenty-two cases in 1919, eight (five males, three females) were those of New-Zealanders by birth, all being under the age of sixty. In three instances where both groom and bride were Chinese, the bride signed by mark. Birthplaces of the remainder were: England, 4; Ireland, 3; Scotland, 1; Denmark, 1; Tasmania, 1; South Africa, 1.
According to information received from the Cook Islands Department, the following are the figures of marriages solemnized in the Cook Islands during the year ended 31st March, 1920:—
| Island. | Number of Marriages. |
|---|---|
| NOTE.—In some cases the figures quoted are for the calendar year or for other periods. | |
| Rarotonga | 80 |
| Aitutaki | 43 |
| Mangaia | 14 |
| Manihiki (nine months) | 1 |
| Mitiaro | 5 |
| Mauke (nine months) | 8 |
| Rakahanga | 1 |
| Atiu | 9 |
| Niue | 71 |
| Total | 232 |
THE deaths registered in 1919 were 10,808, representing a rate of 9.51 per 1,000 of mean population. Although, with the exception of 1918, in which occurred the disastrous influenza epidemic, the number of deaths is a record, the rate is nevertheless quite normal.
The following table shows the number of deaths and the death-rate; also a comparison with the average rate for 1882–86:—
| Year. | Total Number of Deaths. | Death-rate. | |
|---|---|---|---|
| Per 1,000 of Population. | Compared with Rate in 1882–86, taken as 100. | ||
| * Average for five years. | |||
| 1882—86 | 5,944* | 10.84 | 100 |
| 1890 | 5,994 | 9.66 | 89 |
| 1895 | 6,863 | 9.91 | 91 |
| 1900 | 7,200 | 9.43 | 87 |
| 1905 | 8,061 | 9.27 | 86 |
| 1910 | 9,639 | 9.71 | 89 |
| 1915 | 9,965 | 9.06 | 84 |
| 1916 | 10,596 | 9.64 | 89 |
| 1917 | 10,528 | 9.58 | 88 |
| 1918 | 16,364 | 14.84 | 137 |
| 1919 | 10,808 | 9.51 | 88 |
The death-rates of males and females for the last ten years are shown separately in the next table, also the number of male deaths to every 100 female deaths, and the death-rate of males expressed as an index number of the female rate, taking the latter as equal to 100.
| Year. | Deaths per 1,000 of Population. | Male Deaths to every 100 Female Deaths. | Male Rate expressed as Index Number of Female Rate (= 100). | ||
|---|---|---|---|---|---|
| Males. | Females. | Total. | |||
| 1910 | 10.67 | 8.63 | 9.71 | 139 | 124 |
| 1911 | 10.46 | 8.21 | 9.39 | 142 | 127 |
| 1912 | 9.83 | 7.79 | 8.87 | 140 | 126 |
| 1913 | 10.46 | 8.38 | 9.47 | 138 | 125 |
| 1914 | 10.53 | 7.98 | 9.31 | 144 | 132 |
| 1915 | 10.19 | 7.87 | 9.06 | 137 | 129 |
| 1916 | 11.14 | 8.13 | 9.64 | 138 | 138 |
| 1917 | 11.09 | 8.09 | 9.58 | 134 | 137 |
| 1918 | 18.03 | 11.77 | 14.84 | 147 | 153 |
| 1919 | 10.98 | 7.36 | 9.51 | 148 | 149 |
Prior to the war period, the excess of male over female population had the effect of showing a smaller variation between death-rates for the two sexes than was indicated by a comparison of numbers of deaths.
The withdrawal of a large number of males between the ages of 20 and 45 for military service overseas, however, reduced the male population without proportionately reducing the total of male deaths. Consequently there has been a tendency towards an increase in the crude male death-rate.
For the purpose of considering the mortality in New Zealand more closely than can be done by means of crude death-rates, it is desirable to ascertain the rates at different age-periods of the population.
DEATH-RATES PER 1,000 LIVING AT VARIOUS AGE-PERIODS.
| Ages, in Years. | Averages, 1910–14. | 1915. | 1916. | 1917. | 1918. | 1919. | Increase, 1910–14 to 1919. |
|---|---|---|---|---|---|---|---|
| Per Cent. | |||||||
| Under 5 | 16.46 | 14.27 | 15.49 | 14.02 | 14.12 | 11.77 | - 28.49 |
| 5 and under 10 | 1.72 | 1.86 | 2.61 | 2.44 | 2.30 | 1.93 | + 12.21 |
| 10 and under 15 | 1.32 | 1.47 | 1.59 | 1.39 | 1.98 | 1.49 | + 12.88 |
| 15 and under 20 | 2.10 | 1.83 | 2.35 | 2.05 | 5.16 | 2.24 | + 6.67 |
| 20 and under 25 | 2.83 | 3.19 | 3.16 | 3.40 | 10.03 | 2.74 | - 3.18 |
| 25 and under 35 | 3.93 | 3.79 | 3.91 | 4.19 | 15.12 | 3.95 | + 0.51 |
| 35 and under 45 | 5.98 | 5.81 | 6.67 | 5.76 | 14.79 | 6.01 | + 0.50 |
| 45 and under 55 | 9.79 | 9.40 | 10.24 | 8.93 | 15.72 | 10.01 | + 2.25 |
| 55 and under 65 | 19.54 | 20.08 | 19.22 | 19.07 | 23.89 | 19.84ot: | + 1.54 |
| 65 75 | 46.31 | 41.85 | 40.22 | 44.78 | 50.42 | 45.56 | - 1.62 |
| 75 and over | 138.58 | 134.83 | 142.75 | 128.55 | 145.94 | 143.53 | + 3.57 |
| All ages | 9.35 | 9.06 | 9.64 | 9.58 | 14.84 | 9.51 | + 17.1 |
Besides advantages of climate, New Zealand possesses a population younger in age constitution than that of most other countries—conditions favourable to a low rate of mortality. Another table is given comparing death-rates at twelve age-periods for 1917 with those of England and Wales. In only one instance is the Dominion rate higher than the corresponding rate in England and Wales. This occurs in the female death-rate for the age-period 25–35 years.
| DEATH-RATE PER 1,000 PERSONS LIVING, ACCORDING TO SEX, FOR THE YEAR 1917, COMPARED WITH ENGLAND AND WALES. | ||||
|---|---|---|---|---|
| Ages, in Years. | New Zealand. | England and Wales. | ||
| Males. | Females. | Males. | Females. | |
| Under 5 | 15.32 | 12.66 | 31.7 | 26.2 |
| 5 and under 10 | 2.66 | 2.21 | 3.2 | 3.0 |
| 10 and under 15 | 1.63 | 1.17 | 2.1 | 2.2 |
| 15 and under 20 | 2.08 | 2.02 | 8.5 | 3.1 |
| 20 and under 25 | 4.16 | 2.95 | 3.3 | |
| 25 and under 35 | 4.53 | 3.91 | 3.7 | |
| 35 and under 45 | 6.61 | 4.93 | 6.0 | |
| 45 and under 55 | 9.73 | 7.99 | 14.4 | 10.6 |
| 55 and under 65 | 20.23 | 17.63 | 29.4 | 22.2 |
| 65 and under 75 | 48.76 | 40.06 | 67.1 | 50.2 |
| 75 and under 85 | 118.09 | 100.20 | 157.5 | 126.8 |
| 85 and over | 286.23 | 244.88 | 302.1 | 280.6 |
| All ages | 11.09 | 8.10 | 17.8 | 12.1 |
The deaths occurring during 1919 are tabulated below in single ages up to five years, and thereafter in groups, showing males and females separately:—
| Ages. | Males. | Females. | Total. |
|---|---|---|---|
| Months. | |||
| Under 1 | 417 | 278 | 695 |
| 1-3 | 87 | 71 | 158 |
| 3-6 | 55 | 54 | 109 |
| 6–12 | 77 | 69 | 146 |
| Years. | |||
| 1-2 | 87 | 82 | 169 |
| 2-3 | 67 | 54 | 121 |
| 3-4 | 51 | 43 | 94 |
| 4-5 | 45 | 36 | 81 |
| 5–10 | 130 | 114 | 244 |
| 10–15 | 80 | 86 | 166 |
| 15-20 | 119 | 99 | 218 |
| 20-25 | 136 | 111 | 247 |
| 25-30 | 165 | 182 | 347 |
| 30-35 | 212 | 199 | 411 |
| 35-40 | 259 | 229 | 488 |
| 40-45 | 275 | 188 | 463 |
| 45-50 | 315 | 202 | 517 |
| 50-55 | 307 | 243 | 550 |
| 55-60 | 322 | 229 | 551 |
| 60-65 | 437 | 291 | 728 |
| 65-70 | 526 | 324 | 850 |
| 70-75 | 531 | 377 | 908 |
| 75-80 | 643 | 448 | 1,091 |
| 80-85 | 523 | 334 | 857 |
| 85-90 | 270 | 185 | 455 |
| 90-95 | 54 | 58 | 112 |
| 95–100 | 16 | 13 | 29 |
| 101 | 1 | 1 | 2 |
| 103 | 1 | 1 | |
| Totals | 6,207 | 4,601 | 10,808 |
The average age at death of persons of either sex in each of the ten years 1910–19 was as follows:—
| Year. | Males. | Females. |
|---|---|---|
| 1910 | 44.47 years. | 42.25 years. |
| 1911 | 46.17 years. | 42.37 years. |
| 1912 | 47.19 years. | 44.91 years. |
| 1913 | 46.26 years. | 43.04 years. |
| 1914 | 46.97 years. | 44.27 years. |
| 1915 | 47.24 years. | 44.71 years. |
| 1916 | 46.06 years. | 44.01 years. |
| 1917 | 48.33 years. | 45.51 years. |
| 1918 | 44.56 years. | 44.29 years. |
| 1919 | 50.73 years. | 48.47 years. |
The average age at death, taking both sexes into account, was 49.77 years for 1919.
EXPECTATION OF LIFE.
The 1915 issue of the Year-book contained results of a mortality investigation undertaken from the results of the five censuses 1891 to 1911, inclusive, in conjunction with the records of deaths. Considerations of space allow only the following to be repeated in this issue:—
| Age. | Males. | Females. |
|---|---|---|
| Years. | Years. | Years. |
| 0 | 59.165 | 61.764 |
| 5 | 60.581 | 62.211. |
| 10 | 56.144 | 57.754 |
| 20 | 47.200 | 48.770 |
| 30 | 38.775 | 40.477 |
| 40 | 30.540 | 32.368 |
| 50 | 22.672 | 24.295 |
| 60 | 15.508 | 16.774 |
| 70 | 9.383 | 10.311 |
| 80 | 5.294 | 5.815 |
| 90 | 2.765 | 2.900 |
| 100 | 0.720 | 0.723 |
A table is given showing the death-rates of the Australian States and Commonwealth, and of New Zealand, in each of the ten years 1910–19.
| DEATH-RATES OF AUSTRALASIA PER 1,000 OF MEAN POPULATION, 1910–19. | ||||||||||
|---|---|---|---|---|---|---|---|---|---|---|
| Country. | 1910. | 1911. | 1912. | 1913. | 1914. | 1915. | 1916. | 1917. | 1918. | 1919. |
| Queensland | 9.71 | 10.65 | 10.96 | 10.39 | 9.97 | 11.00 | 11.09 | 9.64 | 10.39 | 12.42 |
| New South Wales | 9.89 | 10.37 | 10.86 | 10.89 | 10.11 | 10.48 | 10.63 | 9.60 | 9.84 | 13.40 |
| Victoria | 11.49 | 11.45 | 12.23 | 11.11 | 11.59 | 11.10 | 11.70 | 10.36 | 10.70 | 13.21 |
| South Australia (proper) | 10.09 | 9.82 | 10.28 | 10.82 | 10.71 | 10.67 | 11.72 | 10.10 | 9.97 | 12.01 |
| Western Australia | 10.11 | 10.19 | 11.06 | 9.34 | 9.41 | 9.28 | 9.80 | 8.97 | 9.11 | 11.10 |
| Tasmania | 11.10 | 10.13 | 10.73 | 10.87 | 9.67 | 10.11 | 10.38 | 8.89 | 8.84 | 10.37 |
| Commonwealth | 10.43 | 10.66 | 11.23 | 10.87 | 10.51 | 10.66 | 11.04 | 9.80 | 10.09 | 12.82 |
| New Zealand ̣̣ ̣̣ | 9.71 | 9.39 | 8.87 | 9.47 | 9.31 | 9.06 | 9.64 | 9.58 | 14.84 | 9.51 |
New Zealand has ordinarily a lower death-rate than any of the Australian States, which, again, have considerably lower rates than other countries. Abnormalities in 1918 and 1919 are due to the pandemic of influenza.
Perfect accuracy in comparing one country with another can be attained only by the use of what is termed an “index of mortality.” The proportions of the living vary in regard to the different age-groups, and the ordinary death-rate—which is calculated on the population as a whole—does not afford a true means of judging of the relative healthiness of the places compared. But by taking a population like that of Sweden, and applying the percentage at each age-group to the death-rates, a standard of health or index of mortality can be arrived at. This has been done for New Zealand in accordance with a resolution of the Statistical Conference held at Hobart in 1902, and the result is expressed in tabular form.
| INDEX OF MORTALITY IN NEW ZEALAND FOR 1919. | |||||
|---|---|---|---|---|---|
| Ages, in Years. | Estimated Mean Population. | Number of Deaths. | Death-rate per 1,000. | Percentage of Population of Sweden, 1890 (Standard). | Index of Mortality in New Zealand per 1,000. |
| Under 1 | 27,394 | 1,108 | 40.45 | 2.55 | 1.03 |
| 1 and under 20 | 441,428 | 1,093 | 2.48 | 39.80 | 0.98 |
| 20 ” 40 | 371,006 | 1,493 | 4.02 | 26.96 | 1.08 |
| 40 ” 60 | 211,380 | 2,081 | 9.84 | 19.23 | 1.89 |
| 60 and upwards | 85,181 | 5,033 | 59.09 | 11.46 | 6.77 |
| Totals | 1,136,389 | 10,808 | 9.51 | 100.00 | 11.75 |
The New Zealand rates may be compared with those of the Australian States and of the Commonwealth standardized by the same system.
STANDARDIZED DEATH-RATES, 1910–19.
| Country. | 1910. | 1911. | 1912. | 1913. | 1914. | 1915. | 1916. | 1917. | 1918. | 1919. |
|---|---|---|---|---|---|---|---|---|---|---|
| New Zealand | 12.04 | 11.83 | 11.27 | 11.92 | 11.85 | 11.38 | 11.88 | 11.66 | 16.80 | 11.75 |
| Queensland | 12.44 | 13.57 | 13.91 | 13.25 | 12.70 | 14.30 | 14.37 | 12.64 | 13.94 | 15.97 |
| New South Wales | 12.36 | 13.23 | 13.63 | 13.61 | 12.72 | 13.24 | 13.48 | 12.45 | 12.86 | 16.48 |
| Victoria | 14.11 | 14.23 | 14.94 | 13.50 | 14.11 | 13.54 | 14.28 | 12.81 | 13.23 | 15.51 |
| South Australia | 12.39 | 12.18 | 12.76 | 13.25 | 13.03 | 13.09 | 14.45 | 12.65 | 12.53 | 14.59 |
| Western Australia | 13.31 | 13.47 | 14.55 | 12.58 | 12.56 | 12.79 | 14.15 | 12.93 | 13.69 | 15.50 |
| Tasmania | 13.59 | 12.97 | 13.69 | 13.54 | 12.11 | 13.04 | 13.43 | 11.78 | 11.70 | 13.29 |
| Commonwealth | 13.17 | 13.55 | 14.08 | 13.47 | 13.18 | 13.44 | 13.99 | 12.63 | 13.07 | 15.75 |
Where comparisons are restricted to the figures for different years in a country such as New Zealand, where age and sex constitution are undergoing gradual change, it is preferable to use as a standard the constitution of the population of the same country at some fixed date.
In the following table the rates have been standardized on the population as disclosed at the census of 1911.
| DEATH-RATES, CRUDE AND STANDARDIZED. | ||
|---|---|---|
| Year. | Crude (Actual) Death-rate. | Standardized Rate. |
| 1872 | 11.39 | 12.36 |
| 1875 | 15.92 | 17.30 |
| 1885 | 10.76 | 12.36 |
| 1895 | 9.91 | 11.22 |
| 1905 | 9.27 | 9.60 |
| 1915 | 9.06 | 9.09 |
| 1916 | 9.64 | 9.22 |
| 1917 | 9.58 | 9.04 |
| 1918 | 14.84 | 14.66 |
| 1919 | 9.51 | 9.02 |
The death-rates for the cities, including suburbs, for five years are as below:—
| Deaths per 1,000 of Population. | |||||
|---|---|---|---|---|---|
| 1915. | 1916. | 1917. | 1918. | 1919. | |
| * Metropolitan areas in 1917. | |||||
| Auckland (including suburbs)* | 9.05 | 9.58 | 10.45 | 18.07 | 10.68 |
| Wellington years. (including suburbs) | 9.71 | 9.45 | 9.37 | 15.71 | 11.14 |
| Christchurch years. (including suburbs) | 9.01 | 10.84 | 10.04 | 15.47 | 10.77 |
| Dunedin years. (including suburbs) | 11.03 | 11.72 | 11.58 | 16.20 | 11.32 |
Wellington has proportionately fewer old people than the other three centres, and this explains largely its lower average death-rate. Dunedin, on the other hand, has a higher proportion of old people in its population than Auckland or Christchurch, and has consequently the highest death-rate of all four centres, notwithstanding its low rate of infantile mortality.
The table following shows the number of living issue left by married men whose deaths were registered during the ten years 1910–19, the information being given according to the age of father and of issue. It will be seen that during the period under review 26,967 fathers left issue to the number of 126,901 an average of 4.71. There were also 4,582 married men who died without leaving issue.
| NUMBER AND AGES OF ISSUE LEFT BY MARRIED MEN, 1910–19. | |||||||||
|---|---|---|---|---|---|---|---|---|---|
| Age of Issue, in Years. | Number of Issue left by Fathers dying within the Age-groups shown at Head of Column. | ||||||||
| 20 and under 30. | 30 and under 40. | 40 and under 50. | 50 and under 60. | 60 and under 65. | 65 and under 70. | 70 and under 80. | 80 and over. | Totals. | |
| 0 | 157 | 366 | 164 | 61 | 10 | 2 | 2 | 762 | |
| 1 | 188 | 512 | 257 | 76 | 15 | 7 | 4 | 1,059 | |
| 2 | 174 | 624 | 341 | 125 | 24 | 14 | 6 | 1,308 | |
| 3 | 138 | 638 | 406 | 140 | 27 | 8 | 6 | 3 | 1,366 |
| 4 | 93 | 628 | 423 | 160 | 21 | 17 | 12 | 1 | 1,355 |
| 5 | 69 | 600 | 505 | 166 | 27 | 24 | 21 | 2 | 1,414 |
| 6 | 45 | 596 | 498 | 230 | 40 | 30 | 22 | 7 | 1,468 |
| 7 | 16 | 559 | 537 | 273 | 45 | 47 | 25 | 2 | 1,504 |
| 8 | 9 | 418 | 564 | 333 | 63 | 34 | 33 | 5 | 1,459 |
| 9 | 8 | 393 | 627 | 327 | 78 | 54 | 37 | 4 | 1,528 |
| 10 | 3 | 363 | 610 | 405 | 91 | 59 | 58 | 8 | 1,597 |
| 11 | 1 | 267 | 628 | 422 | 105 | 72 | 67 | 3 | 1,565 |
| 12 | 217 | 621 | 486 | 142 | 97 | 62 | 8 | 1,633 | |
| 13. | 144 | 605 | 503 | 156 | 103 | 82 | 15 | 1,608 | |
| 14 | 100 | 576 | 602 | 177 | 138 | 108 | 11 | 1,712 | |
| 15 | 77 | 515 | 595 | 209 | 133 | 123 | 13 | 1,665 | |
| 10 | 48 | 536 | 675 | 233 | 180 | 158 | 271 | 1,857 | |
| 17. | . | 22 | 448 | 708 | 296 | 207 | 208 | 18 | 1,907 |
| 18 | 13 | 437 | 693 | 329 | 226 | 221 | 28 | 1,947 | |
| 19 | 4 | 355 | 803 | 380 | 280 | 283 | 57 | 2,162 | |
| 20 | 2 | 317 | 801 | 406 | 286 | 332 | 39 | 2,183 | |
| 21 and over | 7 | 853 | 8,056 | 9,303 | 13,343 | 38,038 | 22,779 | 92,379 | |
| Unspecified | 13 | 69 | 168 | 232 | 207 | 236 | 493 | 45 | 1,463 |
| Totals | 914 | 6,667 | 10,991 | 16,872 | 112,384 | 15,597 | 40,401 | 23,075 | 120,901 |
| Married men who died— | |||||||||
| (a) Without leaving issue | 270 | 638 | 610 | 645 | 347 | 433 | 998 | 641 | 4,582 |
| (b) Leaving issue. | 531 | 2,575 | 3,091 | 3,719 | 2,400 | 2,898 | 7,330 | 4,423 | 20,967 |
| Totals | 801 | 13,213 | 3,701 | 4,364 | 2,747 | 3,331 | 8,328 | 5,064 | 31,549 |
Several tables dealing with orphanhood are given in full in Volume I of “Statistics of the Dominion of New Zealand,” 1919. One of these, showing the number of issue under 16, left by married men whose deaths were registered during 1919, is summarized and given below:—
| Age at Death, in Years. | Married Men who died leaving Number of Issue under 16 Years of Age shown at Head of Column. | Total Number of Married Men who died leaving Issue under Age 16. | ||||||
|---|---|---|---|---|---|---|---|---|
| 1 | 2 | 3 | 4 | 5 | 6 | 7 and over. | ||
| 20 and under | 25 | 2 | 2 | |||||
| 25 ” 30 | 12 | 6 | 4 | 2 | 24 | |||
| 30 ” 35 | 22 | 27 | 9 | 5 | 2 | 3 | 1 | 69 |
| 35 ” 40 | 27 | 38 | 29 | 13 | 7 | 3 | 1 | 118 |
| 40 ” 45 | 38 | 23 | 27 | 22 | 16 | 2 | 5 | 133 |
| 45 ” 50 | 41 | 38 | 28 | 13 | 11 | 5 | 7 | 143 |
| 50 ” 55 | 49 | 33 | 17 | 9 | 7 | 6 | 3 | 124 |
| 55 ” 60 | 41 | 20 | 12 | 8 | 3 | 2 | 1 | 87 |
| 60 ” 65 | 49 | 17 | 3 | 4 | 1 | 1 | 1 | 76 |
| 65 ” 70 | 19 | 14 | 6 | 3 | 2 | 44 | ||
| 70 ” 75 | 17 | 7 | 2 | 1 | 27 | |||
| 75 ” 80 | 2 | 1 | 1 | 4 | ||||
| 80 and over | 2 | 1 | 3 | |||||
| Totals | 321 | 225 | 138 | 77 | 51 | 23 | 19 | 854 |
Subjoined is a classified statement of the deaths of infants under one year during 1919, with the ratio of the deaths in each class to the 1,000 births during the year:—
| Sex. | Under 1 Month. | 1 and under 3 Months. | 3 and under 6 Months. | 6 and under 12 Months. | Total under 12 Months. |
|---|---|---|---|---|---|
| NUMBER OF DEATHS. | |||||
| Male | 417 | 67 | 55 | 77 | 636 |
| Female | 278 | 71 | 54 | 69 | 472 |
| Deaths per 1,000 Births. | |||||
| Male | 33.13 | 6.91 | 4.37 | 6.12 | 50.53 |
| Female | 23.37 | 5.97 | 4.54 | 5.80 | 39.68 |
Fifty-one out of every thousand male children born and forty of every thousand females died before attaining the age of one year. The mortality was thus one in twenty of male children, and one in twenty-five of females.
It will be seen from the figures that the chances of living during the first year of age are greater for female than for male infants. Thus, in proportion to the number of children of each sex born in 1919, there were during the year—
| 100 deaths of males to 71 deaths of females under 1 month of age; |
| 100 deaths of males to 86 deaths of females from 1 to 3 months of age; |
| 100 deaths of males to 104 deaths of females from 3 to 6 months of age; |
| 100 deaths of males to 95 deaths of females from 6 to 12 months of age; |
| 100 deaths of males to 79 deaths of females under 12 months of age. |
Dealing with the results for ten years, the deaths of infants under one year are in the large proportion of 74 per cent. of the total deaths under five.
| Year. | Deaths of Children under 5 Years of Age. | Total Deaths at all Ages. | Deaths under 5 Years: Per Cent. of Mortality at all Ages. | |||||
|---|---|---|---|---|---|---|---|---|
| Under 1 Year. | 1 Year and under 2 Years. | 2 Years and under 3 Years. | 3 Years and under 4 Years. | 4 Years and under 5 Years. | Total under 5 Years. | |||
| 1910 | 1,760 | 253 | 95 | 76 | 54 | 2,238 | 9.639 | 23.22 |
| 1911 | 1,484 | 206 | 122 | 99 | 69 | 1,980 | 9,534 | 20.77 |
| 1912 | 1,409 | 157 | 93 | 45 | 46 | 1,750 | 9,214 | 18.99 |
| 1913 | 1,658 | 223 | 104 | 65 | 54 | 2,099 | 10,119 | 20.74 |
| 1914 | 1,456 | 199 | 118 | 80 | 63 | 1,916 | 10,148 | 18.88 |
| 1915 | 1,394 | 204 | 125 | 65 | 80 | 1,868 | 9,965 | 18.75 |
| 1916 | 1,446 | 261 | 139 | 132 | 84 | 2,062 | 10,596 | 19.46 |
| 1917 | 1,360 | 196 | 132 | 102 | 89 | 1,879 | 10,528 | 17.85 |
| 1918 | 1,252 | 275 | 155 | 129 | 107 | 1,918 | 16,364 | 11.72 |
| 1919 | 1,108 | 169 | 121 | 94 | 81 | 1,573 | 10,808 | 14.55 |
| Average of ten years | 1,432 | 214 | 120 | 89 | 73 | 1,928 | 10,691 | 18.03 |
DEATHS OF INFANTS UNDER ONE YEAR, AND PROPORTION TO BIRTHS.
| Year. | Deaths of Infants under 1 Year of Age. | Total Births registered. | Proportion of Deaths of Infants under 1 Year to every 1,000 Births. | ||||
|---|---|---|---|---|---|---|---|
| Under 1 Month | 1 Month and under 3 Months. | 3 Months and under 6 Months. | 6 Months and under 12 Months. | Total under 12 Months. | |||
| 1910 | 786 | 298 | 333 | 343 | 1,760 | 25,984 | 67.73 |
| 1911 | 751 | 217 | 234 | 282 | 1,484 | 26,354 | 56.31 |
| 1912 | 827 | 188 | 192 | 202 | 1,409 | 27,508 | 51.22 |
| 1913 | 830 | 283 | 238 | 302 | 1,653 | 27,935 | 59.17 |
| 1914 | 818 | 241 | 192 | 205 | 1,456 | 28,338 | 51.38 |
| 1915 | 815 | 195 | 175 | 209 | 1,394 | 27.S50 | 50.05 |
| 1916 | 770 | 212 | 228 | 236 | 1,446 | 28,509 | 50.70 |
| 1917 | 787 | 186 | 171 | 216 | 1,360 | 28,239 | 48.16 |
| 1918 | 691 | 226 | 119 | 216 | 1,252 | 25,860 | 48.41 |
| 1919 | 695 | 158 | 109 | 146 | 1,108 | 24,483 | 45.26 |
| Average of ten years | 777 | 220 | 199 | 236 | 1,432 | 27,106 | 52.83 |
The infantile-mortality rates during the last three years are the most satisfactory ever experienced in New Zealand.
The principal causes of mortality in children under one year of age, together with the numbers of deaths in New Zealand from such causes during the five years 1915–19, are given below.
| Causes | Number of Deaths from each Cause. | Percentage of Total. | ||||||||
|---|---|---|---|---|---|---|---|---|---|---|
| 1915. | 1916. | 1917. | 1918. | 1919. | 1915. | 1916. | 1917. | 1918. | 1919. | |
| Whooping-cough | 50 | 63 | 29 | 20 | 5 | 3.58 | 4.36 | 2.13 | 1.60 | 0.45 |
| Convulsions | 55 | 74 | 56 | 53 | 47 | 3.95 | 5.12 | 4.12 | 4.23 | 4.24 |
| Bronchitis and pneumonia | 127 | 123 | 96 | 102 | 94 | 9.11 | 8.50 | 7.06 | 8.15 | 8.48 |
| Diarrhœa and enteritis | 115 | 164 | 146 | 50 | 56 | 8.25 | 11.34 | 10.74 | 3.99 | 5.05 |
| Malformations | 132 | 108 | 120 | 82 | 112 | 9.47 | 7.47 | 8.82 | 6.55 | 10.11 |
| Premature birth | 397 | 381 | 330 | 373 | 317 | 28.48 | 26.35 | 27.94 | 29.79 | 28.62 |
| Congenital debility | 211 | 215 | 208 | 239 | 196 | 15.14 | 14.87 | 15.29 | 19.09 | 17.69 |
| Other causes | 307 | 318 | 325 | 333 | 281 | 22.02 | 21.99 | 23.90 | 26.60 | 25.36 |
| Totals | 1,394 | 1,446 | 1,360 | 1,252 | 1,108 | 100.00 | 100.00 | 100.00 | 100.00 | 100.00 |
The classification of causes of death was made in 1908 for the first time in New Zealand according to the Bertillon Index of Diseases. This system has been adopted by the Commonwealth of Australia and the principal European and American countries. It is highly desirable for comparative purposes that uniformity of statistical method should obtain when possible.
| Class. | Number of Deaths. | Proportion to Total Deaths. | Proportion per 10,000 living | ||||
|---|---|---|---|---|---|---|---|
| M. | F. | Total. | M. | F. | Total. | ||
| Per Cent. | Per Cent. | Per Cent | |||||
| I. General diseases | 1,505 | 1,353 | 2,858 | 24.25 | 29.41 | 26.44 | 25.15 |
| II. Diseases of the nervous system and of the organs of special sense | 658 | 507 | 1,165 | 10.60 | 11.02 | 10.78 | 10.25 |
| III. Diseases of the circulatory system | 1,097 | 753 | 1,850 | 17.67 | 16.37 | 17.12 | 16.28 |
| IV. Diseases of the respiratory system | 612 | 417 | 1,029 | 9.86 | 9.06 | 9.52 | 9.05 |
| V. Diseases of the digestive system | 308 | 304 | 612 | 4.90 | 6.61 | 5.66 | 5.39 |
| VI. Non-venereal diseases of the genito-urinary system and annexa | 301 | 161 | 462 | 4.85 | 3.50 | 4.27 | 4.07 |
| VII. Puerperal condition | 124 | 124 | 2.69 | 1.15 | 1.09 | ||
| VIII. Diseases of the skin and of the cellular tissue | 29 | 23 | 52 | 0.47 | 0.50 | 0.48 | 0.46 |
| IX. Diseases of the bones and of the organs of locomotion | 20 | 6 | 20 | 0.32 | 0.13 | 0.24 | 0.23 |
| X. Malformations | 80 | 52 | 138 | 1.39 | 1.13 | 1.28 | 1.21 |
| XI. Early infancy | 357 | 259 | 610 | 5.75 | 5.63 | 5.70 | 5.42 |
| XII. Old age | 593 | 463 | 1,056 | 9.55 | 10.06 | 9.77 | 9.29 |
| XIII. External violence | 574 | 146 | 720 | 9.25 | 3.17 | 6.66 | 6.34 |
| XIV. Ill-defined causes | 67 | 33 | 100 | 1.08 | 0.72 | 0.93 | 0.88 |
| Totals | 6,207 | 4,601 | 10,808 | 100.00 | l00.00 | 100.00 | 95.11 |
The next table shows the number of deaths from certain principal causes for the five years 1915–1919.
| Cause. | Number of Deaths. | Proportion per 10,000 of Mean Population. | ||||||||
|---|---|---|---|---|---|---|---|---|---|---|
| 1915. | 1016. | 1917. | 1918. | 1919. | 1915. | 1016. | 1917. | 1918. | 1919. | |
| Typhoid fever | 52 | 37 | 41 | 33 | 34 | 0.47 | 0.34 | 0.37 | 0.30 | 0.30 |
| Measles | 64 | 93 | 17 | 15 | 3 | 0.58 | 0.85 | 0.15 | 0.14 | 0.03 |
| Scarlet fever | 44 | 52 | 30 | 30 | 23 | 0.40 | 0.47 | 0.27 | 0.27 | 0.20 |
| Whooping-cough | 80 | 98 | 44 | 27 | 7 | 0.73 | 0.89 | 0.40 | 0.24 | 0.06 |
| Diphtheria | 99 | 163 | 237 | 189 | 149 | 0.90 | 1.48 | 2.16 | 1.71 | 1.31 |
| Influenza | 110 | 73 | 38 | 510 | 340 | 1.00 | 0.66 | 0.35 | 50.01 | 3.04 |
| Pulmonary tuberculosis | 562 | 591 | 597 | 664 | 602 | 5.11 | 5.3S. | 5.43 | 6.02 | 5.30 |
| Other forms of tuberculosis | 131 | 141 | 158 | 168 | 160 | 1.19 | 1.28 | 1.14 | 1.52 | 1.41 |
| Cancer | 900. | 909 | 957 | 936 | 1,031 | 8.19 | 8.271 | 8.71 | 8.49 | 9.07 |
| Diabetes | 148 | 154 | 144 | 195 | 108 | 1.35 | 1.401 | 1.31 | 1.77 | 1.48 |
| Exophthalmic goitre | 31 | 27 | 37 | 42 | 25 | 0.28 | 0.25 | 0.34 | 0.38 | 0.22 |
| Anaemia. chlorosis | 69 | 99 | 104 | 82 | 75 | 0.63 | 0.90 | 0.95 | 0.74 | 0.65 |
| Meningitis | 138 | 169, | 186 | 182 | 155 | 1.26 | 1.54 | 1.5 | 1.65 | 1.36 |
| infantile paralysis | 3 | 123 | 10 | 4 | 0.03 | 1.12 | 0.09 | 0.04 | ||
| Apoplexy, cerebral haemorrhage | 403 | 478 | 472 | 470 | 539 | 3.68 | 4.35 | 4.29 | 4.26 | 4.74 |
| Epilepsy | 49 | 51 | 56 | 61 | 49 | 0.45 | 0.40 | 0.51 | 0.55 | 0.13 |
| Convulsions of children under 5 years of age | 77 | 105 | 62 | 70 | 61 | 0.70 | 0.95 | 0.56 | 0.63 | 0.54 |
| Organic heart-disease | 1,144 | 1,269 | 1,390 | 1.469 | 1,538 | 10.41 | 11.54 | 13.32 | 13.32 | 13.53 |
| Arteriosclerosis | 79 | 87 | 71 | 83 | 0.72 | 0.79 | 0.65 | 0.75 | ||
| Embolism, thrombosis | 52 | 75 | 62 | 53 | 78 | 0.47 | 0.68 | 0.56 | 0.48 | 0.69 |
| Bronchitis | 283 | 240 | 225 | 304 | 290 | 2.57 | 2.18 | 2.05 | 2.70 | 2.55 |
| Broncho-pneumonia | 136 | 127 | 121 | 200 | 140 | 1.24 | 1.15 | 1.10 | 1.81 | 1.23 |
| Pneumonia | 300 | 320 | 262 | 449 | 401 | 2.73 | 2.91 | 2.38 | 4.07 | 3.53 |
| Gastritis | 37 | 37 | 51 | 38 | 0.34 | 0.34 | 0.46 | 0.34 | ||
| Diarrhoea and enteritis | 244 | 302 | 306 | 147 | 132 | 2.22 | 2.75 | 2.78 | 1.33 | 1.16 |
| Appendicitis and typhlitis | 94 | 90 | 101 | 92 | 88 | 0.86 | 0.82 | 0.92 | 0.83 | 0.77 |
| Hernia, intestinal obstruction | 86 | 110 | 46 | 96 | 79 | 0.73 | 1.05 | 0.42 | 0.87 | 0.70 |
| Cirrhosis of liver | 51 | 53 | 33 | 41 | 40 | 0.46 | 0.48 | 0.30 | 0.37 | 0.35 |
| Simple peritonitis | 42 | 37 | 46 | 45 | 57 | 0.38 | 0.34 | 0.42 | 0.41 | 0.50 |
| Cause. | Number of Deaths. | Proportion per 10,000 of Mean Population. | ||||||||
|---|---|---|---|---|---|---|---|---|---|---|
| 1915. | 1916. | 1917. | 1918. | 1919. | 1915. | 1916. | 1917. | 1918. | 1919. | |
| Nephritis, Bright's disease | 267 | 304 | 271 | 287 | 309 | 2.43 | 2.76 | 2.46 | 2.69 | 2.72 |
| Cystitis | 28 | 51 | 49 | 26 | 0.25 | 0.46 | 0.45 | 0.24 | ||
| Diseases and accidents of puerperal condition | 131 | 167 | 169 | 134 | 124 | 1.19 | 1.52 | 1.54 | 1.21 | 1.09 |
| Malformations | 153 | 127 | 133 | 112 | 138 | 1.39 | 1.15 | 1.21 | 1.02 | 1.21 |
| Congenital debility | 217 | 222 | 208 | 239 | 196 | 1.97 | 2.02 | 1.89 | 2.17 | 1.72 |
| Premature birth | 397 | 381 | 381 | 373 | 317 | 3.611 | 3.47 | 3.47 | 3.38 | 2.79 |
| Senility | 793 | 833 | 1,001 | 1,229 | 1.C56 | 7.21 | 8.03 | 9.11 | 11.14 | 9.29 |
| Violence (1) suicide | 113 | 147 | 124 | 113 | 139 | 1.03 | 1.34 | 1.13 | 1.02 | 1.22 |
| (2) accident &. | 623 | 595 | 561 | 548 | 581 | 5.67 | 5.41 | 5.10 | 4.97 | 5.11 |
| Other causes | 1,735 | 1.603 | 1,747 | 1,602 | 15.76 | 14.59 | 15.89 | 14.52 | ||
| Totals | 9,965 | 10,596 | 10,528 | l6,364 | 10,808 | 90.64 | 96.37 | 95.77 | 148.36 | 95.11 |
Pulmonary tuberculosis takes fourth place in point of the number of deaths resulting therefrom during 1919, ranking after heart-disease, senility, and cancer in that order. Acute miliary tuberculosis is included with pulmonary. The average for the past ten years was 598, or 5.58 per 10,000.
| Year. | Deaths from Pulmonary Tuberculosis. | Rate per 10,000. |
|---|---|---|
| 1910 | 582 | 5.86 |
| 1911 | 584 | 5.75 |
| 1912 | 567 | 5.46 |
| 1913 | 656 | 6.14 |
| 1914 | 576 | 5.28 |
| 1915 | 562 | 5.11 |
| 1916 | 591 | 5.38 |
| 1917 | 597 | 5.43 |
| 1918 | 664 | 6.02 |
| 1919 | 602 | 5.30 |
The mortality-rate from all forms of tuberculosis has also exhibited a very satisfactory decline for many years. Ten years’ figures are quoted.
DEATHS AND DEATH-RATES FROM TUBERCULOSIS, AND PERCENTAGE OF TOTAL DEATHS, 1910–19.
| Year. | Mean Population. | Number of Deaths from Tubercular Diseases. | Rate per 1,000. | Percentage of Total Deaths from all Causes. |
|---|---|---|---|---|
| 1910 | 992,802 | 731 | 7.36 | 7.58 |
| 1911 | 1,014,896 | 738 | 7.27 | 7.74 |
| 1912 | 1,039,016 | 716 | 6.89 | 7.77 |
| 1913 | 1,068,644 | 812 | 7.60 | 8.02 |
| 1914 | 1,090,328 | 728 | 6.67 | 7.17 |
| 1915 | 1,099,394 | 693 | 6.30 | 6.95 |
| 1916 | 1,099,449 | 742 | 6.74 | 7.00 |
| 1917 | 1,099,117 | 755 | 6.87 | 7.17 |
| 1918 | 1,103,022 | 832 | 7.54 | 5.08 |
| 1919 | 1,136,389 | 762 | 6.71 | 7.05 |
Tuberculosis claims its victims at comparatively early age. Of those dying from this cause in 1919, persons under the age of twenty years formed 20 per cent. and those under forty years 69 per cent.
The New Zealand rate of deaths from tubercular diseases, as well as those of the Australian States, compares very favourably with those of England, Scotland, and Ireland, which have, however, also decreased considerably of late years.
| Death-rates (per 1,000) from Tuberculosis. | Percentage of Total Deaths. | |
|---|---|---|
* Civilians only. † Year 1915. | ||
| England and Wales* | 1.62 | 11.21 |
| Scotland† | 1.63 | 9.58 |
| Ireland† | 2.20 | 12.50 |
| Queensland | 0.50 | 5.20 |
| New South Wales | 0.61 | 6.36 |
| Victoria | 0.79 | 7.63 |
| South Australia | 0.95 | 9.37 |
| Western Australia | 0.77 | 8.63 |
| Tasmania | 0.59 | 6.67 |
| Commonwealth | 0.69 | 7.00 |
| New Zealand | 0.69 | 7.17 |
This disease is annually responsible for more deaths in New Zealand than can be assigned to any cause other than organic disease of the heart.
In 1919 there were 1,031 deaths from cancer in the Dominion, a proportion of 9.07 per 10,000 persons. This number is the highest yet recorded, an unenviable distinction which almost every year in succession attains. Rates for war years are inflated to some extent by the absence of a large number of young men who are comparatively immune from cancer.
The average number of cancer deaths and the average cancer death-rate for the years 1914–18 were 947 and 8.55 respectively. Deaths of males during 1919 numbered 543, and of females 488.
| NUMBER OF PERSONS WHO DIED FROM CANCER, THE PROPORTION PER 10,000 PERSONS LIVING, AND THE PERCENTAGE OF ALL DEATHS, 1910–19. | ||||
|---|---|---|---|---|
| Years. | Deaths from Cancer. | Total Deaths, all Causes. | Deaths from Cancer per 10,000 of Living Persons. | Deaths from Cancer per 100 of all Deaths. |
| 1910 | 742 | 9,639 | 7.47 | 7.70 |
| 1911 | 809 | 9,534 | 7.97 | 8.49 |
| 1912 | 812 | 9,214 | 7.82 | 8.81 |
| 1913 | 856 | 10,119 | 8.01 | 8.46 |
| 1914 | 904 | 10,148 | 8.29 | 8.91 |
| 1915 | 900 | 9,965 | 8.19 | 9.03 |
| 1916 | 909 | 10,596 | 8.27 | 8.50 |
| 1917 | 957 | 10,528 | 8.71 | 9.09 |
| 1918 | 936 | 16,364 | 8.49 | 5.72 |
| 1919 | 1,031 | 10,808 | 9.07 | 9.54 |
The parts of the body most commonly affected are the stomach and liver. Among females the generative and mammary organs are frequently the seat of the disease. Full details of location are published in Volume I of the “Statistics of the Dominion of New Zealand,” 1919.
CANCER: SEAT OF DISEASE, 1919.
| Seat of Disease. | Males. | Females. | Total. |
|---|---|---|---|
| Buccal cavity | 43 | 10 | 53 |
| Stomach and liver | 227 | 130 | 357 |
| Peritoneum, intestines, rectum | 101 | 81 | 182 |
| Female genital organs | 84 | 84 | |
| Breast | 63 | 63 | |
| Skin | 19 | 6 | 25 |
| Other organs or organs not specified | 153 | 114 | 267 |
| Totals | 543 | 488 | 1,031 |
Eighty-nine per cent. of the deaths from cancer during 1919 were at the ages 45 years and upwards, and 61 per cent. at the ages 60 years and upwards.
Exhaustive statistical inquiry for the period 1872–1919 has shown that in New Zealand death from cancer is, on the average, now occurring later in life than formerly. It would seem that this is the case even if allowance be made for the fact that the age-constitution of the Dominion is increasing—i.e., that the average citizen of New Zealand is now older than the average citizen of ten, twenty, or fifty years ago.
The deaths certified to these causes in 1919 numbered 124, as against 134 in 1918. Included in the number in 1919 were: Accidents of pregnancy, 9; puerperal hæmorrhage, 10; other accidents of labour, 11; puerperal septicæmia, 52; puerperal albuminuria, 36. The number of deaths to every 1,000 confinements (where children were born alive) for each ten years is shown.
| Year. | Deaths of Mothers to every 1,000 Confinements. |
|---|---|
| 1910 | 4.55 |
| 1911 | 4.38 |
| 1912 | 3.73 |
| 1913 | 3.62 |
| 1914 | 4.22 |
| 1915 | 4.76 |
| 1916 | 5.93 |
| 1917 | 6.05 |
| 1918 | 5.24 |
| 1919 | 5.12 |
The higher rate of puerperal accidents and diseases shown since 1915 as compared with preceding years is largely, perhaps wholly, accounted for by the fact that during the past four years in all cases possible where a woman of child-bearing age was shown as having died of septicæmia, peritonitis, convulsions, &., steps were taken to ascertain whether the disease was puerperal.
The following table shows the numbers of Maoris registered under section 20 of the Births and Deaths Registration Amendment Act, 1912, since its coming into force. The numbers registered under the main Act are also given.
| Year. | Under Section 20 of Births and Deaths Registration Amendment Act, 1912. | Under Main Act. | ||
|---|---|---|---|---|
| Males. | Females. | Totals. | Totals. | |
* Not shown separately. | ||||
| 1913 | * | * | 412 | 61 |
| 1914 | 382 | 341 | 723 | 42 |
| 1915 | 424 | 362 | 786 | 31 |
| 1916 | 432 | 329 | 761 | 47 |
| 1917 | 382 | 347 | 729 | 44 |
| 1918 | 1,000 | 937 | 1,937 | 99 |
| 1919 | 631 | 563 | 1,194 | 69 |
Maoris suffered exceedingly severe losses during the influenza epidemic of 1918. As statistics of causes of deaths are not compiled in their case, the exact totals cannot be ascertained, but it is estimated that at least 1,500 perished. This represents a rate of 30 per 1,000 of the Maori population, or over five times the “European” death-rate in the epidemic.
These deaths are not included in the numbers quoted elsewhere in this subsection.
As explained in the Births subsection of this book, a system of compulsory registration of deaths is now ruling in the Cook Islands.
The following figures of deaths during the year ended 31st March, 1920, are supplied by the Cook Islands Department.
| Islands. | Number of Deaths. |
|---|---|
| NOTE.—In some cases the figures quoted above are for the calendar year 1919 or other periods. | |
| Rarotonga | 89 |
| Aitutaki | 43 |
| Mangaia | 40 |
| Manihiki | 10 |
| Mauke | 10 |
| Mitiaro | 2 |
| Rakahanga | 10 |
| Atiu | 29 |
| Penrhyn | 2 |
| Pukapuka (no returns) | |
| Niue | 126* |
| Total | 361 |
IN comparisons of healthiness based on death-rates, the effect of the advance of medical science in recent years is not taken into account. It is common knowledge that many diseases regarded a few decades ago as incurable now give a fair percentage of recoveries. Again, many diseases seldom or never result fatally.
In New Zealand the only records of this nature beyond that of fatality are the returns of infectious diseases notified and discharges from public hospitals.
| Month. | Scarlet Fever. | Diphtheria. | Enteric Fever. | Tuberculosis. | Cerebro-spinal Meningitis. | Poliomyelitis. | Puerperal Septicæmia. | Hydatids. | Ophthalmia Neonatorum. | Septicæmia (unclassified). | Erysipelas. | Measles. | Lethargic Encephalitis. | Influenza. | Pneumonia. | Trachoma. | Anthrax. | Totals. |
|---|---|---|---|---|---|---|---|---|---|---|---|---|---|---|---|---|---|---|
| Jan. | 79 | 159 | 20 | 74 | 16 | 1 | 3 | 3 | 2 | 4 | 21 | 366 | 1 | 749 | ||||
| Feb. | 69 | 166 | 26 | 84 | 2 | 2 | 8 | 2 | 3 | 4 | 6 | 76 | 448 | |||||
| March | 80 | 249 | 41 | 107 | 2 | 6 | 4 | 4 | 2 | 8 | 16 | 133 | 652 | |||||
| April | 145 | 333 | 47 | 70 | 7 | 1 | 5 | 3 | 2 | 3 | 5 | 5 | 395 | 1,021 | ||||
| May | 172 | 409 | 46 | 71 | 13 | 1 | 2 | 1 | 1 | 1 | 4 | 28 | 6 | 284 | 1,039 | |||
| June | 172 | 381 | 37 | 75 | 9 | 3 | 5 | 6 | 2 | 1 | 7 | 10 | 39 | 136 | 29 | 912 | ||
| July | 152 | 353 | 58 | 83 | 10 | 9 | 2 | 2 | 3 | 8 | 13 | 20 | 200 | 80 | 993 | |||
| Aug. | 148 | 330 | 43 | 95 | 12 | 9 | 4 | 1 | 1 | 11 | 18 | 7 | 316 | 113 | 1,105 | |||
| Sept. | 138 | 291 | 44 | 71 | 9 | 2 | 5 | 5 | 2 | 8 | 62 | 13 | 256 | 154 | 2 | 1,062 | ||
| Oct. | 126 | 305 | 60 | 88 | 9 | 4 | 6 | 2 | 2 | 76 | 3 | 197 | 118 | 996 | ||||
| Nov. | 153 | 265 | 30 | 95 | 4 | 11 | 4 | 1 | 1 | 6 | 113 | 2 | 528 | 199 | 4 | 1 | 1,417 | |
| Dec. | 87 | 258 | 25 | 71 | 8 | 1 | 12 | 5 | 4 | 6 | 109 | 813 | 186 | 1,580 | ||||
| Totals | 1,521 | 3,499 | 477 | 984 | 96 | 11 | 79 | 45 | 24 | 14 | 73 | 477 | 90 | 3,700 | 879 | 7 | 1 | 11,977 |
Nearly 60 per cent. of the notifications were for diphtheria and influenza. The great majority of influenza cases were of a very mild type. A quinquennial summary of the principal diseases only is as follows:—
PRINCIPAL INFECTIOUS DISEASES NOTIFIED DURING THE PAST FIVE YEARS.
| Disease. | 1915. | 1916. | 1917. | 1918. | 1919. |
|---|---|---|---|---|---|
| Scarlet fever | 2,312 | 4,278 | 2,755 | 1,654 | 1,521 |
| Diphtheria | 1,420 | 2,376 | 5,458 | 5,539 | 3,499 |
| Enteric fever | 825 | 806 | 653 | 423 | 477 |
| Tuberculosis | 1,019 | 950 | 1,521 | 1,072 | 984 |
| Cerebro-spinal meningitis | 85 | 135 | 42 | 159 | 96 |
| Poliomyelitis | 10 | 1,018 | 54 | 6 | 11 |
The total admissions to public hospitals (other than St. Helens’ Maternity Homes) in New Zealand during 1919 numbered 42,917. There were 2,895 patients in hospital at the beginning of the year, the total cases dealt with during the year being thus 45,812, equal to 386 per 10,000 of mean population, including Maoris. The total number of persons treated is somewhat less than the number of cases, each admission being counted a separate case.
Of the 45,812 cases, 26,321 were discharged as recovered, including a number of tuberculosis cases in which the patient was described as able to work or as having had the disease arrested. In 11,385 cases the patient was discharged relieved, and in 1,906 cases as unrelieved. Deaths in hospital numbered 2,864, or 6.25 per cent. of cases dealt with. end of the year. There are 65 public general hospitals, 4 fever or infectious-diseases hospitals, and 6 sanatoria for consumptives.
The ages of patients discharged from or dying in public hospitals during 1919 and 1918 are as shown in the following summary:—
| PUBLIC HOSPITALS.—AGES OF PATIENTS DISCHARGED OR DYING. | ||||||
|---|---|---|---|---|---|---|
| Ages of Patients, in Years. | 1919. | 1918. | ||||
| Males. | Females. | Total. | Males. | Females. | Total. | |
| Under 5 | 2,046 | 1,461 | 3,507 | 2,208 | 1,775 | 3,983 |
| 5 and under 10 | 2,288 | 1,890 | 4,178 | 2,571 | 2,199 | 4,770 |
| 10 and under 15 | 1,693 | 1,281 | 2,974 | 1,851 | 1,508 | 3,359 |
| 15 and under 25 | 4,659 | 3,174 | 7,833 | 4,793 | 4,125 | 8,918 |
| 25 and under 35 | 5,676 | 3,468 | 9,144 | 5,405 | 4,483 | 9,888 |
| 35 and under 45 | 3,664 | 2,517 | 6,181 | 3,992 | 2,657 | 6,649 |
| 45 and under 55 | 2,356 | 1,173 | 3,529 | 2,539 | 1,259 | 3,798 |
| 55 and under 65 | 1,520 | 671 | 2,191 | 1,513 | 648 | 2,161 |
| 65 and over | 2,262 | 677 | 2,939 | 2,166 | 648 | 2,814 |
| Unspecified | 81 | 75 | 156 | |||
| Totals | 26,164 | 16,312 | 42,476 | 27,119 | 19,377 | 46,496 |
The Bertillon system of classification of diseases and causes of death divides such into fourteen well-defined classes, which are further subdivided into 189 orders. The table following shows that Class I, “General diseases,” is first on the list as regards both discharges and deaths. Diseases of the digestive system come next in point of numbers, but the death-rate is low. External causes come third on the list, and here again the death-rate is low, owing to the preponderance of simple fractures, cuts, bruises. &.
| Class. | Discharges. | Deaths. | Total Discharges and Deaths. | ||||
|---|---|---|---|---|---|---|---|
| Recovered. | Relieved. | Unrelieved. | Males. | Females. | Males. | Females. | |
| I. General diseases | 5,847 | 2,235 | 603 | 600 | 377 | 5,685 | 3,977 |
| II. Diseases of the nervous system and of the organs of special sense | 923 | 1,153 | 327 | 220 | 114 | 1,700 | 1,037 |
| III. Diseases of the circulatory system | 819 | 786 | 77 | 232 | 90 | 1,427 | 577 |
| IV. Diseases of the respiratory system | 3,779 | 1,206 | 97 | 225 | 86 | 3,295 | 2,098 |
| V. Diseases of the digestive system | 5,289 | 1,311 | 122 | 154 | 112 | 3,908 | 3,020 |
| VI. Diseases of the genitourinary system and annexa | 2,016 | 834 | 119 | 130 | 45 | 1,045 | 2,099 |
| VII. Puerperal condition | 1,229 | 151 | 32 | 47 | 1,459 | ||
| VIII. Diseases of the skin and of the cellular tissue | 1,225 | 473 | 48 | 25 | 11 | 1,271 | 511 |
| IX. Diseases of the organs of locomotion | 797 | 612 | 59 | 16 | 3 | 1,096 | 391 |
| X. Malformations | 239 | 67 | 27 | 10 | 4 | 281 | 66 |
| XI. Diseases of early infancy | 26 | 14 | 1 | 22 | 15 | 48 | 30 |
| XII. Old age | 23 | 97 | 98 | 92 | 25 | 280 | 55 |
| XIII. External causes | 3,792 | 2,293 | 259 | 153 | 40 | 5,758 | 779 |
| XIV. Ill-defined causes | 317 | 153 | 37 | 5 | 11 | 310 | 213 |
| Totals | 26,321 | 11,385 | 1,906 | 1,884 | 980 | 26,164 | 16,312 |
More detailed information concerning certain of the principal diseases and groups of diseases is given in the following pages. The “Statistics of the Dominion of New Zealand” (Volume I) contain detailed information for each hospital.
A table of the epidemic general diseases dealt with in public hospitals during 1919 is given. The figures in this and following tables throughout this subsection deal with the discharges and deaths only, and not with patients remaining in hospital at the end of the year, who will be included in the figures for 1920 or such other year of discharge or death.
PRINCIPAL EPIDEMIC GENERAL DISEASES, 1919.
| Disease. | Discharges. | Deaths. | Total Discharges and Deaths. | ||||
|---|---|---|---|---|---|---|---|
| Recovered. | Relieved. | Unrelieved. | Males. | Females. | Males. | Females. | |
| Typhoid fever | 176 | 6 | 3 | 11 | 7 | 121 | 82 |
| Malaria | 77 | 127 | 1 | 204 | 1 | ||
| Measles | 70 | 1 | 1 | 1 | 42 | 31 | |
| Scarlet fever | 731 | 22 | 38 | 7 | 10 | 307 | 501 |
| Whooping-cough | 7 | 7 | 6 | 8 | |||
| Diphtheria | 2,028 | 76 | 8 | 54 | 55 | 1,003 | 1,218 |
| Croup | 10 | 1 | 8 | 3 | |||
| Influenza | 888 | 94 | 9 | 42 | 22 | 680 | 375 |
| Dysentery | 24 | 13 | 1 | 1 | 34 | 5 | |
| Erysipelas | 46 | 7 | 1 | 5 | 28 | 31 | |
| Chicken-pox | 81 | 3 | 1 | 1 | 20 | 15 | |
| Mumps | 11 | 5 | 1 | 82 | 5 | ||
| German measles | 1 | 5 | 7 | ||||
| Other diseases | 2 | 5 | 1 | 7 | 1 | ||
| Totals | 4,181 | 366 | 63 | 119 | 101 | 2,547 | 2,283 |
The rate of mortality of this group is normally very low, between 2 and 3 per cent. In 1919 the mortality rate was 4.55 per cent., due principally to the influenza cases, an aftermath of the epidemic.
Tuberculosis occupies eight orders in the classification of diseases, but is usually divided into two groups—viz., pulmonary tuberculosis and other forms of tuberculosis. Pulmonary tuberculosis, with which is included tuberculosis (undefined) and acute miliary tuberculosis, comprises 72 per cent. of the total of 1,511 cases of tubercular diseases, and the same percentage of the deaths.
| TUBERCULOSIS CASES IN HOSPITALS, 1919. | |||||||
|---|---|---|---|---|---|---|---|
| Form of Tuberculosis. | Discharges. | Deaths. | Total Discharges and Deaths. | ||||
| Recovered. | Relieved. | Unrelieved. | Males. | Females. | Males. | Females. | |
| Tuberculosis of lungs | 126 | 523 | 205 | 149 | 84 | 751 | 336 |
| Acute miliary tuberculosis | 4 | 3 | 4 | 3 | |||
| Tuberculous meningitis | 1 | 2 | 4 | 29 | 12 | 31 | 17 |
| Abdominal tuberculosis | 20 | 31 | 9 | 7 | 7 | 31 | 43 |
| Pott's disease | 18 | 50 | 13 | 5 | 5 | 64 | 27 |
| White swellings | 35 | 76 | 13 | 4 | 4 | 86 | 46 |
| Tuberculosis of other organs | 96 | 131 | 23 | 7 | 7 | 165 | 99 |
| Disseminated tuberculosis | 1 | 1 | 4 | 2 | 5 | 3 | |
| Totals | 297 | 813 | 268 | 209 | 124 | 1,137 | 574 |
Five sanatoria for the treatment of tuberculosis cases are situated in suitable districts throughout the Dominion.
In order to obtain some definite information regarding the so-called “social diseases,” a questionnaire was attached in 1919 to the hospital discharge cards used in the preparation of statistical tables, requiring completion in all cases where the disease treated was due to one form or other of venereal disease. Of 42,476 patients discharged from or dying in public hospitals in 1919, some 234 suffered from effects of syphilis and 339 from effects of gonococcal infection. Some of the results obtained are as tabulated below:—
| How infection contracted. | Recovered. | Relieved. | Unrelieved. | Died. | Total. | |||||
|---|---|---|---|---|---|---|---|---|---|---|
| Males. | Females. | Males. | Females. | Males. | Females. | Males. | Females. | Males. | Females. | |
| Origin Syphilitic. | ||||||||||
| Congenitally | 3 | 3 | 10 | 10 | 3 | 1 | 4 | 2 | 20 | 16 |
| Sexual intercourse | 12 | 4 | 44 | 19 | 14 | 2 | 6 | 76 | 25 | |
| Mouth infection | 2 | 2 | ||||||||
| Otherwise | 1 | 1 | 1 | 2 | 1 | |||||
| Not known or not stated | 11 | 8 | 44 | 11 | 13 | 1 | 4 | 72 | 20 | |
| Total | 26 | 16 | 101 | 40 | 31 | 4 | 14 | 2 | 172 | 62 |
| Origin Gonococcal. | ||||||||||
| At birth | 2 | 5 | 2 | 1 | 1 | 5 | 6 | |||
| Sexual intercourse | 62 | 54 | 81 | 18 | 10 | 3 | 2 | 1 | 155 | 76 |
| By contact | 1 | 1 | ||||||||
| Contact with infected clothes, towels, &. | 2 | 2 | 4 | |||||||
| Otherwise | 2 | 8 | 3 | 4 | 5 | 12 | ||||
| Not known or not stated | 16 | 19 | 20 | 14 | 1 | 4 | 1 | 37 | 38 | |
| Total | 82 | 89 | 106 | 39 | 11 | 7 | 3 | 2 | 202 | 137 |
| Grand total | 108 | 105 | 207 | 79 | 42 | 11 | 17 | 4 | 374 | 199 |
Another portion of the questionnaire concerned itself with the present communicability of the disease, and the opinions of the medical practitioners in charge of the cases were as follows:—
| Was Disease communicable at Date of Discharge? | Origin Syphilitic. | Origin Gonococcal. | ||
|---|---|---|---|---|
| No. | Per Cent. | No. | Per Cent. | |
| Yes | 47 | 20.09 | 105 | 30.97 |
| Probably | 4 | 1.71 | 16 | 4.72 |
| Possibly | 2 | 0.86 | 7 | 2.05 |
| Probably not | 2 | 0.86 | 1 | 0.30 |
| No | 89 | 38.03 | 163 | 48.08 |
| Patient dead | 16 | 6.84 | 5 | 1.50 |
| Not known or not stated | 74 | 31.61 | 42 | 12.38 |
| 234 | 100.00 | 339 | 100.00 | |
The total number of deaths in public hospitals in 1919 where cancer was assigned as the cause was 279 (males 186, females 93). In addition 160 patients treated for cancer were discharged as recovered, 216 as relieved, and 171 as unrelieved. Very few of the recoveries were in cases of internal cancer, and but a small proportion of the deaths in cases of surface cancer. It is noticeable that with but six exceptions cancer of the mouth and its annexa was confined to males. Cancer of the stomach, liver, &., and of the skin are also pre-eminently male diseases.
| Seat of Disease. | Discharges. | Deaths | ||||||
|---|---|---|---|---|---|---|---|---|
| Recovered. | Relieved. | Unrelieved. | Males. | Females | ||||
| Males. | Females | Males. | Females | Males. | Females | |||
| Buccal cavity | 38 | 1 | 20 | 2 | 20 | 1 | 21 | 2 |
| Stomach, liver, &. | 2 | 2 | 24 | 7 | 35 | 11 | 69 | 22 |
| Intestines, rectum, &. | 9 | 27 | 11 | 15 | 8 | 33 | 14 | |
| Female genital organs | 8 | 35 | 19 | 23 | ||||
| Breast | 52 | 31 | 11 | 10 | ||||
| Skin | 8 | 4 | 17 | 2 | 7 | 2 | 9 | 1 |
| Other organs (including unspecified) | 25 | 11 | 20 | 20 | 29 | 13 | 54 | 21 |
| Totals | 73 | 87 | 108 | 108 | 106 | 65 | 186 | 93 |
Of the 279 patients who died in hospitals from cancer during 1919, 142, or more than half, had been in hospital less than one month, and of these 53 died within one week of admission.
A total of 1,459 cases come under the heading of puerperal. This number includes 393 cases of normal childbirth dealt with at public general hospitals, but does not cover maternity cases in St. Helens Hospitals.
| PUERPERAL ACCIDENTS, ETC. | |||||
|---|---|---|---|---|---|
| Disease. | Discharges. | Deaths. | Total Discharges and Deaths. | ||
| Recovered. | Relieved. | Unrelieved. | |||
| Miscarriage | 207 | 37 | 1 | 2 | 247 |
| Abortion | 289 | 33 | 322 | ||
| Ectopic gestation | 66 | 8 | 1 | 2 | 77 |
| Persistent vomiting | 22 | 4 | 26 | ||
| Hyperemesis gravidarum | 13 | 3 | 1 | 17 | |
| Other accidents of pregnancy | 26 | 10 | 6 | 42 | |
| Normal labour | 377 | 9 | 7 | 393 | |
| Puerperal hæmorrhage | 34 | 9 | 2 | 45 | 45 |
| Ruptured perinæum | 27 | 2 | 1 | 30 | |
| Other accidents of labour | 36 | 10 | 6 | 3 | 55 |
| Puerperal septicæmia | 99 | 13 | 27 | 139 | |
| Puerperal eclampsia | 17 | 2 | 11 | 30 | |
| Other | 16 | 11 | 7 | 2 | 36 |
| Totals | 1,229 | 151 | 32 | 47 | 1,459 |
Of remaining diseases dealt with, a number of the more important or more frequently occurring are shown in tabulated form.
| Bertillon No. | Disease, &c. | Discharges. | Deaths. | Total Discharges and Deaths. | |||
|---|---|---|---|---|---|---|---|
| Recovered. | Relieved. | Unrelieved. | Males. | Females. | |||
| 47, 48 | Rheumatism | 307 | 233 | 23 | 12 | 363 | 212 |
| 50 | Diabetes | 21 | 58 | 14 | 42 | 67 | 68 |
| 51 | Exophthalmic goitre | 33 | 39 | 4 | 11 | 12 | 75 |
| 54 | Anæmia, chlorosis | 27 | 39 | 4 | 19 | 37 | 52 |
| 56 | Alcoholism | 194 | 81 | 6 | 12 | 267 | 26 |
| 61 | Meningitis | 54 | 13 | 6 | 96 | 107 | 62 |
| 64 | Apoplexy, cerebral hæmorrhage | 12 | 23 | 9 | 118 | 117 | 45 |
| Neurasthenia | 90 | 169 | 30 | 167 | 122 | ||
| 75 | Diseases of eyes | 266 | 334 | 50 | 1 | 404 | 247 |
| 76 | Diseases of ears | 117 | 81 | 10 | 123 | 85 | |
| 79 | Organic heart-disease | 93 | 485 | 37 | 257 | 658 | 214 |
| 81 | Diseases of arteries, &. | 3 | 24 | 8 | 18 | 44 | 9 |
| 83 | Diseases of veins, &. | 433 | 136 | 17 | 2 | 407 | 181 |
| 88 | Diseases of thyroid body | 117 | 54 | 10 | 2 | 29 | 154 |
| 89, 90 | Bronchitis | 393 | 201 | 10 | 52 | 475 | 181 |
| 91 | Broncho-pneumonia | 143 | 14 | 1 | 43 | 114 | 87 |
| 92 | Pneumonia | 656 | 72 | 4 | 151 | 589 | 294 |
| 93 | Pleurisy | 362 | 154 | 6 | 27 | 401 | 148 |
| 96 | Asthma | 75 | 104 | 6 | 11 | 131 | 65 |
| Tonsils | 801 | 149 | 6 | 2 | 516 | 442 | |
| Gastritis | 248 | 167 | 7 | 4 | 292 | 134 | |
| 104, 105 | Diarrhæa and enteritis | 354 | 101 | 5 | 28 | 313 | 175 |
| 108 | Appendicitis | 1,957 | 165 | 12 | 63 | 1,057 | 1,140 |
| 109 | Hernia, &. | 785 | 159 | 24 | 43 | 806 | 205 |
| 111–115 | Diseases of liver | 203 | 93 | 12 | 31 | 122 | 217 |
| 117 | Peritonitis | 52 | 34 | 6 | 27 | 52 | 67 |
| 119, 120 | Nephritis, Bright's disease | 76 | 101 | 9 | 82 | 178 | 90 |
| 124 | Diseases of bladder | 121 | 109 | 12 | 24 | 155 | 111 |
| 128–130 | Diseases of uterus | 940 | 215 | 46 | 14 | 1,215 | |
| 131 | Diseases of ovary | 98 | 17 | 3 | 2 | 120 | |
| 132 | Diseases of female genital organs | 128 | 37 | 4 | 169 | ||
| Osteomyelitis | 79 | 81 | 8 | 10 | 137 | 41 | |
| Synovitis | 104 | 42 | 5 | 117 | 34 | ||
| 160-3 | Violence (1) suicides | 10 | 7 | 1 | 2 | 16 | 4 |
| 164–186 | Violence (2) accident | 3,782 | 2,286 | 258 | 191 | 5,742 | 775 |
Table of Contents
LEGISLATION on the subject of public health is contained principally in the Public Health Act, 1908, and its amendments in 1910 and 1918.
The 1918 amendment was passed largely as the result of experience gained during the influenza epidemic which visited New Zealand in the last three months of the year 1918. Its principal object was the provision of necessary powers to enable the Public Health Department to take more vigorous action in combating an epidemic. It also provided for the creation of a Board of Public Health, consisting of ten members, whose duty it is to report to the Minister of Health on matters concerning developments in national health, medical service, instruction in health questions, and desirable legislative reforms. Further power is given to the Minister of Health to create District Advisory Committees in any health district when required. Provision is also made for any local authority to establish lodginghouses within the area of its jurisdiction, or contiguous thereto, the money for the purchase of the necessary land and buildings being obtainable by loan under the Local Bodies’ Loans Act. In regard to buildings in a condition unfit for occupation or dangerous to public health, the local authority may, upon the certificate of the District Health Officer, require the owner to have the premises pulled down, or, as an alternative, the District Health Officer may require structural alterations or additions made to the buildings or improvements to the sanitary conditions. In order to prevent overcrowding in lodginghouses and tenements, no person is allowed to accommodate more than five lodgers at any time, for either temporary or permanent board and residence, unless the premises have been licensed by the local governing authority; nor can the owner let any house or tenement in which more than one family is to reside, or any room for the occupation of more than two persons, without the previous approval of the local authority. To secure adequate medical services in the outlying districts power is given to the Minister, on receiving an application from a local authority, to provide a resident medical practitioner, whose salary and emoluments shall be fixed, and who will not be debarred from holding Government appointments connected with matters of public health in his district.
The law in this connection makes vaccination of children compulsory, but provides for exemption if the parent or custodian of a child has conscientious objections. Comparatively few children are now vaccinated.
Under the Medical Practitioners Act, 1914, is constituted the Medical Board of New Zealand, consisting of the Inspector-General of Hospitals and six other registered medical practitioners.
It is a serious offence for a person to carry on the practice of medicine unless he is registered under the Act. The register is kept by the Registrar-General. The Medical Board deals with all applications for registration, considering not only professional qualifications, but other attendant circumstances also. To be qualified for registration a person must be a graduate in medicine of the University of New Zealand, or eligible for registration in the United Kingdom, or hold the diploma of an approved foreign institution after a course of not less than five years’ study of medical or surgical subjects.
Applicants who are refused registration have the right of appeal to the Supreme Court. Application for registration should be made in the first place to the Registrar of Births and Deaths at Auckland, Wellington, Christchurch, or Dunedin. The fee for registration is £3 3s., payable on deposit of evidence of qualification. The number on the register at 31st December, 1919, was 1,015.
Application for registration as a dentist should be made to the Registrar-General, Wellington, accompanied by a fee of £1.
Every adult person is entitled to be registered as a dentist in New Zealand who is the holder of a degree in dental surgery of the University of New Zealand, or a certificate of proficiency in dentistry obtained from the Senate of the University, or is registered or entitled to be registered as a dentist in the United Kingdom, or is the holder of such degree in dentistry granted in a British possession or a foreign country as may be recognized by the Senate of the New Zealand University. Evidence of good character is required in every case. The number on the register at 31st December, 1919, was 751.
The Sale of Food and Drugs Act is administered by the officers of the Public Health Department, and provides for the analysis, by public analysts, of any article of food or drink, or of any drug, which may be sold, offered for sale, or exposed for sale, and for the inspection of any place where there is any food or drug intended for sale. If any such article be proved to be unfit for human consumption, or likely to cause injury to health if consumed, heavy penalties may be inflicted on the person or persons responsible.
During the year 1919, 144 charges under the Sale of Food and Drugs Act were dealt with in the Magistrates’ Courts, resulting in 108 convictions. Fines were imposed in 102 cases, and in six cases the defendant was convicted and discharged. One hundred of the convictions were in connection with the sale of adulterated milk, twenty-one for selling light-weight bread, and eight for selling light-weight or over-watered butter.
In 1919, 2,489 samples were taken by the Department, 2,135 being milk-samples. Samples of bread to the number of 3,197 were weighed, and 380 of these were found to be short-weighted. Of 1,579 butter-samples weighed, thirty-five were non-complying. The total fines and costs where legal proceedings resulted from sampling or weighing, &., amounted to £1,048 for the year.
The Plumbers Registration Act, passed during the session of 1912, provided for the setting-up of a Board, to be called the Plumbers’ Board of New Zealand. The functions of the Board are to decide what persons may be registered under the Act, in what districts sanitary plumbing shall be performed only by registered plumbers, and what shall be the scope of the examinations to be held in the future as a part of the process of securing registration.
The total number of plumbers entered on the register to date is 1,295.
The year 1918–19 is the third year for which official statistics of Hospital and Charitable Aid Boards have been prepared on the basis of an income and Expenditure Account and Balance-sheet. The results arrived at are the products of the application of the uniform system of accounts which has been adopted in several countries abroad, and these are thus comparable with those of many other countries.
On account of the fact that the figures furnished in the following tables for this Dominion prior to the year 1916–7 were compiled on a basis of receipts and payments and not of income and expenditure, the amounts in some points are not strictly comparable with those for the last three years.
The total gross income of Hospital Boards, separate institutions, and Government institutions for the year ended 31st March, 1919, was £1,213,815, and for Hospital Boards alone was £1,161,669.
The main sources of income for the year were as follow:—
| £ | |
|---|---|
| * Exclusive of fees paid by Hospital and Charitable Aid Boards or separate institutions. | |
| Contributable by Government | 302,666 |
| Levies on local authorities | 264,063 |
| Voluntary contributions | 17,620 |
| Fees payable by those assisted | 349,172* |
| Fees payable on account of patients by Hospital and Charitable Aid Boards, separate institutions, and Government (inter se) | 3,680 |
| Charitable-aid recoveries | |
| Rents, interests, and dividends | 19,255 |
| Miscellaneous income | 19,295 |
The total gross expenditure of Hospital Boards, separate institutions, and Government institutions amounted during the year to £1 213,815, the expenditure of Hospital Boards alone being £1,161,669. The net expenditure— i.e., the gross expenditure less the excess of income over expenditure—was £939,828. The following are the main items of expenditure by all authorities:—
| £ | |
|---|---|
| Hospital maintenance | 547,649 |
| Charitable aid | 136,177 |
| Public health | 33,700 |
| Administration | 14,330 |
| Reductions in patients’ fees and amounts written off | 151,716 |
The average annual cost of maintenance per occupied bed for the last five years is set out below:—
| Year. | Provisions. | Surgery and Dispensary. | Domestic and Establishment. | Salaries and Wages. | Total Maintenance. |
|---|---|---|---|---|---|
| £ | £ | £ | £ | £ | |
| 1914–15 | 25.0 | 10.7 | 27.0 | 43.5 | 106.2 |
| 1915–16 | 27.4 | 10.4 | 31.1 | 42.5 | 111.3 |
| 1916–17 | 28.7 | 10.3 | 27.1 | 43.7 | 109.6 |
| 1917–18 | 30.7 | 11.8 | 33.8 | 41.8 | 118.1 |
| 1918–19 | 35.9 | 12.8 | 39.0 | 48.0 | 135.7 |
The charitable-aid expenditure for the last five years has been as follows:—
| Year. | Indoor Relief. | Outdoor Relief. | Total. |
|---|---|---|---|
| £ | £ | £ | |
| 1914–15 | 74,081 | 37,413 | 111,494 |
| 1915–16 | 84,269 | 40,349 | 124,618 |
| 1916–17 | 72,524 | 41,119 | 113,643 |
| 1917–18 | 91,092 | 44,006 | 135,098 |
| 1918–19 | 82,713 | 53,464 | 136,177 |
| Year ended 31st March. | Mean Population. | Hospital and Charitable Aid and other Expenditure. | Expenditure per Head of Mean Population. | |
|---|---|---|---|---|
| £ | s. | d. | ||
| 1915 | 1,095,206 | 578,838 | 10 | 6 3/4 |
| 1916 | 1,100,496 | 631,504 | 11 | 5 3/4 |
| 1917 | 1,099,449 | 603,081 | 10 | 11 3/4 |
| 1918 | 1,114,706 | 716,059 | 12 | 10 1/4 |
| 1919 | 1,136,390 | 947,171 | 16 | 8 |
The above figures include infectious-diseases hospitals and consumptive sanatoria under Boards’ control, also public-health expenditure and subsidies to medical associations and district nurses. Since 1916–17 the figures are statements of expenditure incurred, not of actual payments made as in previous years. The number of persons availing themselves of treatment in the general hospitals for the last five years has been as follows:—
| Year. | Total Number of Persons under Treatment | Mean Population. | Proportion under Treatment per 1,000 of Population. | Average Number of Occupied Beds per Diem. | Proportion per 1,000 of Population. |
|---|---|---|---|---|---|
| 1914–15 | 31,366 | 1,095,206 | 28.6 | 2,364 | 2.16 |
| 1915–16 | 36,477 | 1,100,496 | 33.1 | 2,617 | 2.38 |
| 1916–17 | 39,029 | 1,099,449 | 35.5 | 2,972 | 2.73 |
| 1917–18 | 40,232 | 1,114,706 | 36.1 | 3,190 | 2.86 |
| 1918–19 | 50,112 | 1,136,390 | 44.1 | 3,653 | 3.21 |
The general hospitals, numbering sixty-five in 1918–19, covered by the above table include five hospitals which are also old people's homes, as well as two institutions—the Mercury Bay and Oamaru Hospitals—which are not under the control of Hospital Boards. The figures given do not cover maternity hospitals or special hospitals for infectious diseases or tuberculosis.
Information as to the number of public general hospitals and their staff and accommodation is given for each of the past five years.
| Number of | Year ended 31st March. | ||||
|---|---|---|---|---|---|
| 1915. | 1916. | 1917. | 1918. | 1919. | |
| Institutions | 65 | 65 | 65 | 64 | 65 |
| Medical staff (stipendiary) | 100 | 115 | 112 | 114 | 123 |
| Nursing staff— | |||||
| Trained nurses | 281 | 260 | 248 | 293 | 292 |
| Probationers | 647 | 764 | 833 | 864 | 900 |
| Domestic staff | 623 | 675 | 600 | 771 | |
| Beds | 3,531 | 3,832 | 4,075 | 4,191 | 4,616 |
Further particulars concerning the public general hospitals of the Dominion for the years ended the 31st March, 1918 and 1919, are given in the next table:—
| — | Year ended 31st March. | |
|---|---|---|
| 1918. | 1919. | |
| Average number of patients per diem | 3,190 | 3,653 |
| Number of patients under treatment | 40,232 | 50,112 |
| Deaths | 2,607 | 4,359 |
| Average annual cost of maintenance per occupied bed apart from administration, &., charged | £118.1 | £135.7 |
| Number of out-patients attended during year | 28,091 | 27,987 |
State charitable institutions are administered by combined Hospital and Charitable Aid Boards, who also distribute outdoor relief. In the case of recipients of old-age pensions, the pension is received by the officers of the Board as payment for the maintenance of the pensioner, but a proportion is handed over to the latter to be expended as he or she may choose.
The Hospitals and Charitable Institutions Act, 1909, provides for the licensing (annually), management, and inspection of private hospitals. At the end of 1919 some 240 licensed private hospitals were in existence.
| Town. | Confinements in Institution. | Confinements attended outside. | ||
|---|---|---|---|---|
| Births. | Deaths of Mothers. | Deaths of Infants. | ||
| Births. | ||||
| Auckland | 317 | 3 | 217 | |
| Gisborne | 90 | |||
| Wellington | 278 | 2 | 8 | 92 |
| Christchurch | 220 | 2 | 6 | 142 |
| Dunedin | 123 | 1 | 8 | 96 |
| Invercargill | 111 | 5 | ||
| Totals | 1,139 | 5 | 25 | 552 |
| Year ended 31st March. | Confinements in Institution. | Confinements attended outside. | ||
|---|---|---|---|---|
| Births. | Deaths of Mothers. | Deaths of Infants. | ||
| Births. | ||||
| 1916 | 798 | 2 | 6 | 563 |
| 1917 | 1,071 | 8 | 28 | 523 |
| 1918 | 1,248 | 7 | 27 | 530 |
| 1919 | 1,123 | 18 | 26 | 521 |
| 1920 | 1,139 | 5 | 25 | 552 |
There is a maternity hospital attached to the Medical School at Dunedin, which also serves as a training-school for medical students and midwives.
Charitable maternity homes are established at Auckland, Otahuhu, Napier, Wellington, Christchurch, and Invercargill for the reception of unmarried girls. The Salvation Army have similar institutions at Auckland, Wellington, Christchurch, and Dunedin.
The Nurses Registration Act provides that every person who has attained the age of twenty-three years and is certified as having had three years’ training as a nurse in a recognized general hospital, together with systematic instruction in theoretical and practical nursing from the medical officer and the matron of that hospital, and who passes the prescribed examination, is entitled to registration. There are now 2,728 nurses on the register.
The number of registered midwives on 31st March, 1920, was 2,638. Of these latter, 1,119 were trained and certificated, the remainder having satisfied the Registrar that at the date of the passing of the Act they had been for at least three years in bona fide practice as midwives, and that they bear a good character.
Exclusive of industrial schools, there are so far as is known some thirty-five institutions that may be described as orphanages or children's homes. The Education Act provides for the inspection of all orphanages and cognate institutions by Inspectors of the Education Department, with a view to securing that as regards education of the children and general management these organizations are acting consistently with the laws governing the education, care, and upbringing of children who are maintained in kindred institutions.
Under the control of the Education Department come also the various institutions for deaf and dumb, blind, or mentally defective children. These are dealt with in the section of this book dealing with Education.
There are seven public mental hospitals in the Dominion, maintained wholly or in part out of the public revenue. There is also one private hospital, licensed by the Governor-General for the reception of the mentally afflicted.
Information concerning the law dealing with the treatment of mental defectives is given in the 1914 issue of this book.
The number of patients at the end of the year 1919 was 4,647, including 60 Maoris.
| Mental Hospital. | Males. | Females. | Total. |
|---|---|---|---|
| Auckland | 596 | 401 | 997 |
| Tokanui | 151 | 49 | 200 |
| Porirua | 591 | 449 | 1,040 |
| Nelson | 99 | 103 | 202 |
| Hokitika | 193 | 72 | 265 |
| Christchurch | 356 | 388 | 744 |
| Dunedin (Seacliff and Waitati) | 623 | 432 | 1,055 |
| Ashburn Hall (private mental hospital) | 20 | 23 | 43 |
| Absent on probation | 38 | 63 | 101 |
| Totals | 2,667 | 1,980 | 4,647 |
The number of patients remaining at the close of each of the past five years, and the proportion per 10,000 of the population (excluding Maoris), are shown in the following table:—
| Year. | Number remaining at Close of Year. | Proportion per 10,000 of Population. | ||||
|---|---|---|---|---|---|---|
| Males. | Females. | Total. | Males. | Females. | Total. | |
| 1915 | 2,428 | 1,740 | 4,168 | 43.05 | 31.50 | 37.79 |
| 1916 | 2,533 | 1,804 | 4,337 | 46.06 | 32.76 | 39.41 |
| 1917 | 2,577 | 1,884 | 4,461 | 47.96 | 33.62 | 40.64 |
| 1918 | 2,564 | 1,921 | 4,485 | 47.30 | 33.92 | 40.46 |
| 1919 | 2,630 | 1,957 | 4,587 | 44.66 | 34.01 | 39.39 |
| Means of five years | 2,546 | 1,861 | 4,407 | 45.76 | 33.33 | 39.54 |
The total number of patients under oversight, care, or control during 1919 was 5,509 (males 3,178, females 2,331), as against 5,408 in 1918. The average number resident in mental hospitals was 4,501 in 1918 and 4,527 in 1919.
The total admissions to mental hospitals during the year 1919 were 883 (512 males and 371 females), this number not including 80 transfers from one institution to another. The principal causes of insanity as assigned on admission are given below, distinguishing each hospital:—
| Causes | Auckland. | Christchurch. | Dunedin. | Hokitika. | Nelson. | Porirua. | Tokanui. | Ashburn Hall. | Total. |
|---|---|---|---|---|---|---|---|---|---|
| Heredity | 21 | 7 | 24 | 5 | 3 | 8 | 2 | 70 | |
| Congenital | 49 | 13 | 26 | 4 | 8 | 28 | 128 | ||
| Previous attack | 16 | 21 | 18 | 1 | 4 | 23 | 83 | ||
| Puberty and adolescence | 16 | 4 | 1 | 8 | 29 | ||||
| Climacteric | 10 | 8 | 6 | 1 | 2 | 3 | 30 | ||
| Senility | 34 | 18 | 18 | 2 | 2 | 24 | 98 | ||
| Prolonged mental stress | 35 | 9 | 16 | 3 | 23 | 1 | 2 | 89 | |
| Alcohol | 20 | 19 | 6 | 4 | 2 | 16 | 67 | ||
| Syphilis | 12 | 9 | 4 | 1 | 17 | 4 | 47 | ||
| Epilepsy | 11 | 9 | 3 | 1 | 11 | 35 | |||
| Influenza | 16 | 1 | 5 | 1 | 23 | ||||
| Unknown | 16 | 11 | 2 | 4 | 53 | 86 | |||
| Other causes | 29 | 10 | 23 | 33 | 1 | 2 | 98 | ||
| Total | 269 | 151 | 150 | 21 | 25 | 251 | 2 | 14 | 883 |
Of the 883 persons admitted to mental hospitals during 1919, those admitted for the first time to any mental hospital in New Zealand numbered 744 (males 448, females 296), and those readmitted 139 (males 64, females 75).
Excluding the Native race, the number of first admissions and the rate per 10,000 of population for each of the past five years were as follows:—
| Year. | Number of First Admissions. | Proportion per 10,000 of Population. | ||||
|---|---|---|---|---|---|---|
| Males. | Females. | Total. | Males. | Females. | Total. | |
| 1915 | 376 | 269 | 645 | 6.87 | 5.10 | 6.01 |
| 1916 | 436 | 283 | 719 | 7.90 | 5.17 | 6.54 |
| 1917 | 406 | 294 | 700 | 7.47 | 5.29 | 6.37 |
| 1918 | 367 | 320 | 687 | 6.80 | 5.68 | 6.23 |
| 1919 | 444 | 291 | 735 | 7.85 | 5.10 | 6.47 |
| Means of five years | 406 | 291 | 697 | 7.33 | 5.26 | 6.30 |
The figures for 1919 represent one first admission for every 1,546 persons in the Dominion.
Persons labouring under mental defect, but capable of understanding the meaning of the procedure, may seek admission to a mental hospital as voluntary boarders. At the beginning of 1919 there were 51 boarders in residence (20 males, 31 females), and during the year 95 (36 males, 59 females) were admitted. If a voluntary boarder should after admission show mental defect sufficiently pronounced and sustained to render it improper to classify him any longer as such, application for a reception order is made to a Magistrate. During the year 1919, 6 (3 males, 3 females) were transferred from the voluntary to the ordinary register, and 5 died, while 66 (24 males, 42 females) were discharged, leaving 69 resident at the end of the year (26 males, 43 females).
A summary is attached showing the ages of patients in mental hospitals at the close of 1919:—
| Age, in Years. | Males. | Females. | Total. |
|---|---|---|---|
| 1 to 5 | 2 | 2 | 4 |
| 5 to 10 | 10 | 12 | 22 |
| 10 to 15 | 33 | 17 | 50 |
| 15 to 20 | 55 | 49 | 104 |
| 90 and over | 3 | 3 | 6 |
| 20 to 30 | 266 | 173 | 439 |
| 30 to 40 | 581 | 393 | 974 |
| 40 to 50 | 632 | 481 | 1,113 |
| 50 to 60 | 470 | 412 | 882 |
| 60 to 70 | 355 | 256 | 611 |
| 70 to 80 | 168 | 124 | 292 |
| 80 to 90 | 48 | 26 | 74 |
| Unknown | 44 | 32 | 76 |
| Totals | 2,667 | 1,980 | 4,647 |
The number of Maoris admitted as patients to the mental hospitals is small. Twelve (6 males, 6 females) were admitted during the year, and 60 (37 males, 23 females) remained at the end of the year.
Dealing with patients of all races, the next table gives the average number resident, those who were discharged as recovered, and those who died, during the period 1915–19:—
| Year. | Average Number Resident. | Discharged as recovered. | Died. | ||
|---|---|---|---|---|---|
| Number. | Per Cent. of Average Number Resident. | Number. | Per Cent. of Average Number Resident. | ||
| 1915 | 4,094 | 359 | 8.77 | 284 | 6.94 |
| 1916 | 4,251 | 331 | 7.79 | 289 | 6.80 |
| 1917 | 4,368 | 323 | 7.39 | 318 | 7.28 |
| 1918 | 4,501 | 283 | 6.29 | 448 | 9.95 |
| 1919 | 4,527 | 337 | 7.44 | 342 | 7.55 |
| Means of five years | 4,348 | 327 | 7.52 | 336 | 7.73 |
| Cause of Death. | Auckland. | Christchurch. | Dunedin. | Hokitika. | Nelson. | Porirua. | Tokanui. | Ashburn Hall. | Totals. |
|---|---|---|---|---|---|---|---|---|---|
| Tuberculosis | 8 | 4 | 4 | 1 | 6 | 23 | |||
| Cancer | 2 | 2 | 2 | 6 | |||||
| Other general diseases | 4 | 3 | 2 | 9 | |||||
| General paralysis of the insane | 17 | 3 | 6 | 1 | 1 | 14 | 1 | 43 | |
| Organic brain-disease | 29 | 5 | 1 | 1 | 36 | ||||
| Epilepsy | 9 | 1 | 5 | 1 | 2 | 18 | |||
| Other nervous diseases | 9 | 2 | 8 | 1 | 7 | 27 | |||
| Diseases of the respiratory system | 5 | 6 | 3 | 1 | 6 | 21 | |||
| Diseases of the circulatory system | 14 | 4 | 12 | 5 | 17 | 1 | 1 | 54 | |
| Diseases of the digestive system | 2 | 1 | 1 | 1 | 5 | ||||
| Diseases of the genito-urinary system | 3 | 1 | 1 | 5 | |||||
| Old age | 21 | 17 | 18 | 4 | 8 | 21 | 2 | 91 | |
| External causes | 1 | 1 | 2 | ||||||
| Ill-defined causes | 1 | 1 | 2 | ||||||
| Totals | 124 | 38 | 66 | 15 | 14 | 79 | 2 | 4 | 342 |
A table is added showing for all admissions since 1876 the percentages of patients discharged (as recovered, relieved, and not improved, separately), dying, and remaining.
| — | Males. | Females. | Both Sexes. |
|---|---|---|---|
| Discharged— | |||
| Recovered | 36.78 | 42.79 | 39.22 |
| Relieved | 7.25 | 9.18 | 8.04 |
| Not improved | 9.54 | 9.27 | 9.44 |
| Died | 32.41 | 22.61 | 28.42 |
| Remaining at end of 1919 | 14.02 | 16.15 | 14.88 |
| 100.00 | 100.00 | 100.00 | |
There is only one licensed private institution in the Dominion, that at Wakari, near Dunedin, established in 1882. Particulars of admissions, &., for the past five years are as follows:—
| Year. | Admissions. | Discharges. | Deaths. | Patients remaining at End of Year. |
|---|---|---|---|---|
| 1915 | 8 | 12 | 1 | 40 |
| 1916 | 15 | 5 | 4 | 46 |
| 1917 | 20 | 11 | 3 | 52 |
| 1918 | 11 | 11 | 7 | 45 |
| 1919 | 15 | 12 | 4 | 44 |
The total expenditure on maintenance of mental hospitals (not including the cost of new buildings and additions), and receipts from patients and for sale of produce, &., during the past five years were as follows:—
| Year. | Total Expenditure. | Receipts from Patients, Sale of Produce, &., | Net Expenditure. |
|---|---|---|---|
| £ | £ | £ | |
| 1915 | 178,373 | 51,786 | 126,587 |
| 1916 | 197,663 | 60,745 | 136,918 |
| 1917 | 220,777 | 68,446 | 152,331 |
| 1918 | 248,609 | 69,195 | 179,414 |
| 1919 | 286,847 | 94,130 | 192,717 |
The total net expenditure out of the Public Works Fund for buildings and equipment from 1st July, 1877, to 31st March, 1920, was £891,540.
Farms are conducted in connection with the various mental hospitals, the inmates themselves doing most of the labour. During 1919, sales of produce brought in £14,285, while the value of produce grown on the farms and consumed in the institutions was estimated at £22,953. Expenses in connection with the farms amounted to £24,171, so that the year's working shows a credit balance of £12,707.
The net cost per patient for the year 1919 was £42 8s. 5d. as against £39 18s. 5 1/2d. for the previous year.
Table of Contents
As a result of the census taken in October, 1916, it is found that 83.53 per cent. of the persons in New Zealand at that date were able to read and write, 0.68 per cent. could read only, while 15.79 per cent. could neither read nor write. Of the latter, children form a large proportion.
The proportion able to read and write has fallen slightly as compared with figures compiled from the 1911 census returns. This small decrease is probably due to the disturbance of the normal proportions of the population brought about by the absence with the Forces of a number of men between twenty and forty years of age.
In the following tables an attempt has been made to analyse the public expenditure on the various branches of education.
| (Figures given in every case to the nearest £1,000.) | |||||||||
|---|---|---|---|---|---|---|---|---|---|
| Branch of Education. | Amount. | Per Head of Population (including Maoris). | |||||||
| Out of Public Funds.* | Secondary and University Reserves Revenue. | Total from all Public Sources. | Out of Public Funds.* | Secondary and University Reserves Revenue. | Total from all Public Sources. | ||||
| * Including expenditure out of income from primary-education reserves. † Including technical high schools and secondary departments of district high schools. | |||||||||
| £ | £ | £ | s. | d. | s. | d. | s. | d. | |
| Primary. | 1,939,000 | 1,939,000 | 31 | 11 | 31 | 11 | |||
| Secondary† | 288,000 | 51,000 | 339,000 | 4 | 8 | 1 | 0 | 5 | 8 |
| Continuation and technical | 87,000 | 87,000 | 1 | 5 | 1 | 5 | |||
| Higher | 69,000 | 29,000 | 98,000 | 1 | 1 | 0 | 6 | 1 | 7 |
| 2,383,000 | 80,000 | 2,463,000 | 39 | 1 | 1 | 6 | 40 | 7 | |
| Industrial schools, &. | 87,000 | 87,000 | 1 | 5 | 1 | 5 | |||
| Special schools | 13,000 | 13,000 | 0 | 3 | 0 | 3 | |||
| Superannuation and miscellaneous | 61,000 | 61,000 | 1 | 1 | 1 | 1 | |||
| Totals | 2,544,000 | 80,000 | 2,624,000 | 41 | 10 | 1 | 6 | 43 | 4 |
The following table shows the total amount expended on education out of the public funds only, and the amount per head of population:—
| Year ended 31st March. | Amount expended out of Public Funds. | Expenditure per Head of Population out of Public Funds. | |
|---|---|---|---|
| * Income from primary-education reserves included. | |||
| £ | s. | d. | |
| 1899 | 519,000 | 13 | 4 |
| 1904 | 679,000 | 15 | 6 |
| 1914 | 1,301,000 | 23 | 0 |
| 1918 | 1,814,000* | 31 | 7* |
| 1919 | 1,986,000* | 34 | 4* |
| 1920 | 2,554,000* | 41 | 10* |
The central Department of Education, with a Cabinet Minister at its head, manages directly the Native schools and special schools, and also administers the Education Act. For the purposes of primary education the Dominion is divided into nine education districts, each of which is presided over by an Education Board, and these in turn are divided into smaller districts, in each of which a School Committee elected by the householders has authority. The School Committees of each education district elect the Education Board, and are subject to its general control. The Board receives from the Department and disburses money voted by the General Assembly for the purposes of instruction, and appoints the teachers, subject to the condition of consultation with the Committee of the school district.
A General Council of Education created by the Act reports to the Minister upon educational methods or developments deemed worthy of introduction into the Dominion and upon such matters as bear upon the provision of further facilities for education, whether local or general.
Education at the public schools is free and purely secular. Attendance at a registered school is obligatory upon all children between the ages of seven and fourteen, except when special exemptions are granted. The Inspectors who visit the schools are officers of the Education Department.
The programme of primary instruction provided by the Act includes English, arithmetic, geography, history and civics, drawing and handwork (including needlework), nature-study and elementary science, physical instruction, moral instruction and health, and singing.
The number of scholars and students as in 1919 is shown in the following summary. Pupils of private schools not inspected by the Education Department are excluded.
| Primary education— | |
| Public schools | 191,153 |
| Native village and Native mission schools | 5,358 |
| Registered private primary schools | 20,977 |
| Lower departments of secondary schools | 686 |
| 218,174 | |
| Secondary education— | |
| Secondary schools | 9,068 |
| Secondary departments of district high schools | 2,159 |
| Technical high schools | 2,926 |
| Maori secondary schools | 434 |
| Registered private secondary schools | 1,497 |
| 16,084 | |
| Technical and continuation (excluding technical high schools) | 17,950 |
| Higher education— | |
| University colleges (including training-college students) | 3,060 |
| Lincoln Agricultural College | 52 |
| 3,112 | |
| Total under instruction | 255,320 |
This is an increase of 5,731 on the number under instruction during the previous year.
The public primary schools numbered 2,400 in 1919, against 2,365 in 1918. The number of registered private primary schools was 212. The number of aided or endowed colleges, grammar and high schools in operation was 34, and the number of technical schools 9. The number of University colleges was 4. The number of private schools from which returns were received in 1918 by the Government Statistician was 320. The number of primary and secondary schools established for the education of the Native or Maori race was 134.
Compared with 1918, there was in 1919 an increase of 1,125 in the number of pupils belonging to the public schools at the end of the year, and the average attendance shows an increase of 5,049 for the whole year.
| Year. | Number of Schools. | Pupils at End of Year. | Mean of Average Weekly Roll. | Average Attendance, Whole Year. | Average Attendance as Percentage of Weekly Roll. |
|---|---|---|---|---|---|
| 1878 | 748 | 65,040 | 48,773 | ||
| 1888 | 1,158 | 112,685 | 113,636 | 90,108 | 79.3 |
| 1898 | 1,655 | 131,621 | 133,782 | 111,636 | 83.4 |
| 1908 | 1,998 | 147,428 | 145,974 | 127,160 | 87.1 |
| 1913 | 2,255 | 172,168 | 169,530 | 151,242 | 89.2 |
| 1915 | 2,338 | 183,214 | 181,229 | 163,092 | 90.0 |
| 1916 | 2,355 | 185,884 | 184,056 | 163,156 | 88.6 |
| 1917 | 2,368 | 190,354 | 187,954 | 168,711 | 89.8 |
| 1918 | 2,365 | 194,934 | 191,382 | 169,836 | 88.7 |
| 1919 | 2,400 | 196,059 | 193,655 | 174,885 | 90.3 |
The following table shows the age and sex of the pupils on the rolls of the public schools of the Dominion at the end of 1919, and the percentage of the roll for each age:—
| Age, in Years. | 1919. | Percentages for Five Years. | ||||||
|---|---|---|---|---|---|---|---|---|
| Boys. | Girls. | Total. | 1915. | 1916. | 1917. | 1918. | 1919. | |
| 5 and under 6 | 7,863 | 7,194 | 15,057 | 7.8 | 7.9 | 8.0 | 7.4 | 7.8 |
| 6 and under 7 | 10,721 | 9,907 | 20,628 | 10.8 | 10.6 | 10.6 | 10.7 | 10.6 |
| 7 and under 8 | 11,660 | 10,689 | 22,349 | 11.7 | 11.6 | 11.5 | 11.4 | 11.6 |
| 8 and under 9 | 11,533 | 10,635 | 22,168 | 11.4 | 11.7 | 11.7 | 11.3 | 11.4 |
| 9 and under 10 | 11,342 | 10,634 | 21,976 | 11.4 | 11.2 | 11.6 | 11.4 | 11.3 |
| 10 and under 11 | 11,241 | 10,628 | 21,869 | 11.2 | 11.1 | 11.1 | 11.5 | 11.3 |
| 11 and under 12 | 11,143 | 10,220 | 21,363 | 10.9 | 10.8 | 10.9 | 10.7 | 11.0 |
| 12 and under 13 | 10,526 | 9,660 | 20,186 | 10.0 | 10.5 | 10.4 | 10.5 | 10.4 |
| 13 and under 14 | 8,944 | 8,161 | 17,105 | 8.5 | 8.5 | 8.8 | 8.9 | 8.8 |
| 14 and under 15 | 4,579 | 3,963 | 8,542 | 4.5 | 4.3 | 4.2 | 4.7 | 4.4 |
| 15 and over | 1,441 | 1,216 | 2,657 | 1.8 | 1.8 | 1.2 | 1.5 | 1.4 |
| Totals | 100,993 | 92,907 | 193,900 | 100.0 | 100.0 | 100.0 | 100.0 | 100.0 |
Physical exercises based on the syllabus of the Board of Education, England, are practised in all public schools under the supervision of a staff of physical instructors. Corrective classes for children with physical deformities are also held with good results.
A staff of ten School Medical Officers and fifteen School Nurses medically examine public-school children, notifying parents when medical or dental treatment is required. The number of public schools visited in 1919 was 704, and the number of children completely examined was approximately 30,000.
The following shows expenditure for 1919 on the above-named services:—
| — | Railway Fares. | Boarding-allowance and Conveyance by Road or Water. | Total. |
|---|---|---|---|
| £ | £ | £ | |
| Primary | 11,459 | 17,757 | 29,216 |
| Secondary | 5,613 | 155 | 5,768 |
| Technical | 3,852 | 3,852 | |
| Totals | 20,924 | 17,912 | 38,836 |
Classes for elementary handwork exist in 2,166 primary schools, and in 1,562 schools other branches of manual instruction are taught. The capitation payments made by the Department on account of manual instruction for the year 1919–20 amounted to £57,560. Instruction is given in a wide variety of subjects, ranging from laundry-work to agriculture.
A capitation grant at the rate of 3d. per head on the average attendance is paid to Boards for the purpose of supplying schools with supplementary continuous readers for class-reading or free supply in certain cases.
Provision has been made for the payment of subsidies of £1 for £1 on moneys raised by voluntary contributions for school libraries. In addition, a subsidy is payable by the Education Board not exceeding £5 for any one school.
An illustrated paper, called the School Journal, is published monthly by the Education Department for free circulation among pupils attending public primary schools and for sale at moderate prices to private schools.
The number of teachers in the public schools, exclusive of those employed in the secondary departments of district high schools, is shown for a number of years. The figures are as in December of the years given.
| Year. | Adults. | Pupil-teachers. | ||||
|---|---|---|---|---|---|---|
| Males. | Females. | Total. | Males. | Females. | Total. | |
| * Excluding probationers. | ||||||
| 1878 | 707 | 454 | 1,161 | 181 | 332 | 450 |
| 1888 | 1,039 | 887 | 1,926 | 219 | 694 | 913 |
| 1898 | 1,234 | 1,370 | 2,604 | 229 | 831 | 1,060 |
| 1908 | 1,331 | 2,021 | 3,352 | 161 | 476 | 637 |
| 1913 | 1,603 | 2,659 | 4,262 | 142* | 474* | 616* |
| 1915 | 1,591 | 3,077 | 4,668 | 141* | 485* | 626* |
| 1916 | 1,501 | 3,209 | 4,710 | 137* | 519* | 656* |
| 1917 | 1,383 | 3,324 | 4,707 | 132* | 517* | 649* |
| 1918 | 1,366 | 3,452 | 4,818 | 123* | 523* | 646* |
| 1919 | 1,606 | 3,394 | 5,000 | 123* | 503* | 626* |
The total number of teachers employed in primary schools, excluding probationers and including pupil-teachers, in 1919 was 5,626 (1,729 males and 3,897 females). The number of probationers was 436 (62 males and 374 females). Taking all schools with two or more teachers, the average number of pupils per teacher was 38, and in schools with six or more teachers the average number was 45.
Omitting schools with less than 21 pupils the ratio of adult men teachers to adult women teachers in 1919 was 100 to 193. The proportion of men to women in charge of schools with 1 to 20 scholars was 100 to 362. If all public schools and all teachers are included, it is found that the ratio of men teachers to women teachers was 100 to 267 in 1918, and 100 to 225 in 1919. The ratio of male pupil-teachers to female pupil-teachers was 100 to 425 in 1918, and 100 to 409 in 1919.
The average salaries paid to teachers in 1919, including house allowance or value of residence were—Male head teachers, £380; female head teachers, £319; male assistants, £301; female assistants, £197; sole male teachers, £221; sole female teachers, £193.
Information as to the Teachers’ Superannuation Fund will be found in the section of this book dealing with Pensions, Superannuation, &.
Training colleges are situated in the four principal centres of the Dominion. The total provision is for 150 students at each centre. Towards this number, out of the total reported, Auckland contributed in the year 1919, 175; Wellington, 152; Christchurch, 129; and Dunedin, 126.
The management of the training colleges is entrusted to the local Education Boards, subject to general regulations.
The amount paid to Education Boards during 1919–20 for the training of teachers was £89,070.
The receipts and payments of the Education Boards (numbering nine altogether) in 1919 are tabulated below, with further particulars:—
| Receipts. | |
|---|---|
| From Government,— | £ |
| General Fund | 47,863 |
| Teachers’ salaries and allowances | 1,278,842 |
| School and class libraries | 3,633 |
| Conveyance and board of school-children | 11,972 |
| Incidental expenses of schools | 83,301 |
| Training of teachers | 79,801 |
| Manual instruction | 51,884 |
| Technical instruction | 97,427 |
| Public-school buildings, sites, furniture, &. | 91,054 |
| Rebuilding, rent, maintenance of buildings | 139,105 |
| Scholarships, subsidies, and miscellaneous | 17,386 |
| From local sources | 46,988 |
| Total | £1,949,256 |
| Payments. | £ |
|---|---|
| Staff salaries, office expenses, &. | 38,003 |
| Teachers’ salaries and allowances | 1,281,942 |
| School and class libraries | 1,494 |
| Conveyance and board of school-children | 16,715 |
| Incidental expenses of school | 83,360 |
| Training of teachers | 79,703 |
| Manual instruction | 63,095 |
| Technical instruction | 100,823 |
| Public-school buildings, sites, furniture, &. | 106,296 |
| Rebuilding, rent, maintenance of buildings | 124,448 |
| Subsidies, scholarships, workshop expenses, &. | 33,678 |
| Total | £1,929,557 |
There were 320 private schools at the end of 1918, 35 were for boys, 59 for girls, and 226 for children of both sexes. The number of pupils attending them was 26,237—namely, 11,083 boys and 15,154 girls, not counting 134 Maoris (62 boys and 72 girls). Of the private schools, 173 were Roman Catholic, with 18,734 pupils.
| Year. | Number of Private Schools. | Pupils. | Included in previous Numbers. | |||
|---|---|---|---|---|---|---|
| Boys. | Girls. | Totals. | Roman Catholic Schools. | Pupils at Roman Catholic Schools. | ||
| 1909 | 306 | 7,597 | 10,333 | 17,930 | 150 | 12,611 |
| 1910 | 318 | 8,036 | 10,945 | 18,981 | 156 | 13,161 |
| 1911 | 326 | 8,310 | 11,558 | 19,868 | 158 | 13,941 |
| 1912 | 310 | 8,801 | 11,437 | 20,238 | 156 | 14,476 |
| 1913 | 304 | 9,146 | 11,969 | 21,115 | 155 | 14,837 |
| 1914 | 321 | 9,641 | 12,439 | 22,080 | 180 | 16,471 |
| 1915 | 310 | 9,555 | 12,784 | 22,339 | 172 | 15,892 |
| 1916 | 305 | 9,791 | 13,621 | 23,412 | 170 | 17,266 |
| 1917 | 320 | 10,749 | 14,742 | 25,491 | 171 | 18,257 |
| 1918 | 320 | 11,083 | 15,154 | 26,237 | 173 | 18,734 |
The total number of teachers engaged in instruction in private schools was 1,146 (135 men and 1,011 women). Included in these figures are the teachers of Roman Catholic schools, 69 males and 550 females. A summary of the ages of the pupils in 1918 was,—
| Roman Catholic Schools. | All Private Schools. | ||||
|---|---|---|---|---|---|
| Age. | Boys. | Girls. | Boys. | Girls. | Total. |
| Under 5 years | 91 | 77 | 490 | 460 | 950 |
| 5 years and under 7 | 1,636 | 1,761 | 2,166 | 2,498 | 4,664 |
| 7 years and under 13 | 4,770 | 5,819 | 5,942 | 7,722 | 13,664 |
| 13 years and under 15 | 1,577 | 1,922 | 1,906 | 2,817 | 4,723 |
| 15 years and over | 367 | 714 | 579 | 1,657 | 2,236 |
| Total | 8,441 | 10,293 | 11,083 | 15,154 | 26,237 |
Any private school may apply to be registered under the Education Act, 1914. At the end of the year 1919 the number of registered private primary schools was 212. The total roll number was 20,977, and the average attendance 18,472.
The roll number of the eighteen registered private secondary schools in 1919 was 1,497.
The number of Native village schools in operation at the end of 1919 was 119. In addition, there were thirteen private schools at which education for Maori boys and girls is provided. Of these, ten are maintained from the incomes arising out of lands held in trust for educational purposes by various denominational bodies; the others are supported by private resources.
On the rolls of the 119 village schools at the 31st December, 1919, there were 5,198 children (including 648 Europeans). The average attendance for the year was 4,485, the percentage of regularity being 86.4, and the average weekly roll number 5,190. The total number of pupils on the rolls of the Native mission schools was 167, and on those of the secondary schools 434. At the end of the year, therefore, the total roll number of all the Native schools inspected by officers of the Education Department was 5,799, the average weekly roll being 5,803, and the total average attendance 5,036.
Besides the children of the Maori race who are receiving instruction in the Native schools there is a still larger number attending public schools, so that the total number of primary pupils of Maori race (including those in the mission schools) is 9,737, made up as follows:—
| Attending Government Native schools | 4,550 |
| Attending public schools | 5,020 |
| Attending mission schools | 167 |
| 9,737 |
Of the children on the rolls of the Native schools in December, 1919, 84.4 per cent. were Maoris speaking Maori in their homes, 3.1 per cent. were Maoris speaking English, and 12.5 per cent. were Europeans.
The total net expenditure on Native schools during the year ended the 31st March, 1920, was £59,166. Included in this is the sum of £46,032 expended on teachers’ salaries, £2,885 expended on new buildings and additions, £2,975 on maintenance of buildings, repairs, &., and £3,524 on secondary education.
The staffs of the village schools included seventy-three male and forty-four female head or sole teachers, and 122 assistants. The average salary of the head or sole teachers was £253 13s. 3d., of the 115 female assistants £115 15s. 8d., and of the seven male assistants £115.
Secondary education is carried on at thirty-four secondary schools, sixty district high schools, nine technical high schools, ten Maori secondary schools, and twenty-one private secondary schools (registered).
The total numbers of pupils attending the thirty-four secondary schools for the last terms of 1918 and 1919 respectively were as follows:—
| 1918 | 1919 | |||||
|---|---|---|---|---|---|---|
| Boys. | Girls. | Total. | Boys. | Girls. | Total. | |
| Roll (exclusive of lower departments) | 4,621 | 3,763 | 8,384 | 5,054 | 4,014 | 9,068 |
| Number in lower departments | 397 | 268 | 665 | 392 | 294 | 686 |
| Totals | 5,018 | 4,031 | 9,049 | 5,446 | 4,308 | 9,754 |
In the same years these schools were staffed as follows:—
| 1918 | 1919 | |||||
|---|---|---|---|---|---|---|
| M. | F. | Total. | M. | F. | Total. | |
| Regular staff | 175 | 195 | 370 | 186 | 195 | 381 |
| Part-time teachers | 42 | 43 | 85 | 74 | 74 | |
The average number of pupils per teacher (excluding part-time teachers) was thus 22.
The number on the roll of the secondary departments of district high schools at the end of the year 1919 was 2,159.
Besides the head teachers, who generally take some part in the secondary instruction, there were employed in 1919 in the secondary departments of district high schools 105 special assistants—34 men and 71 women. The average number of pupils per teacher was 21.
The total numbers on the roll of technical high schools at any time during the years 1918 and 1919 were as follows:—
| 1918 | 1919 | |
|---|---|---|
| Boys | 1,265 | 1,438 |
| Girls | 1,482 | 1,488 |
| Totals | 2,747 | 2,926 |
The number on the roll of secondary schools for Maoris (all of whom were boarders) at the end of 1919 was 434.
The number of children on the rolls of registered private secondary schools at the end of the year was 1,497, being 595 boys and 902 girls.
Summarizing all these figures, and excluding pupils in the lower departments of secondary schools, we obtain the following statement of the numbers receiving some form or other of secondary instruction during the years 1918 and 1919 (as nearly as can be ascertained):—
| 1918. | 1919. | |
|---|---|---|
| Secondary schools | 8,384 | 9,068 |
| District high schools | 2,283 | 2,502 |
| Technical high schools | 2,747 | 2,926 |
| Maori secondary schools | 471 | 434 |
| Private secondary schools | 1,366 | 1,497 |
| Totals | 15,251 | 16,427 |
The figure shows an increase of 8 per cent. over the corresponding figure for the previous year, and an increase of nearly 50 per cent. over the figure of five years ago.
The following are some of the figures for 1918 and 1919 in regard to free places in secondary schools:—
| 1918. | 1919. | |
|---|---|---|
| Number of secondary schools giving free tuition | 32 | 32 |
| Roll number of these schools | 7,871 | 8,536 |
| Number of free-place holders at end of year | 6,966 | 7,657 |
| Average number of free-place holders during year | 7,177 | 8,006 |
| Free-place holders as a percentage of roll number | 91 per cent. | 94 per cent. |
| Total annual payment by Government for free places | £85,422 | £111,062 |
In order to arrive at the total number of pupils in New Zealand receiving free secondary instruction it will be necessary, however, to include also 104 holders of scholarships or exhibitions carrying free instruction not otherwise enumerated, which are granted by the secondary schools included above or by endowed secondary schools not coming under the conditions for free places, 2,015 free-place holders at district high schools, ninety Maori pupils receiving free education in Maori secondary schools, and 2,754 holders of free places in technical high schools. Consequently, there were approximately 12,620 pupils receiving free secondary education in the Dominion, exclusive of those holders of free places in technical schools (mostly evening students), who, while not taking full-day courses, were nevertheless receiving free education of secondary grade.
The following table gives a summary of the various secondary free places at the end of the year for which payment was made by Government:—
| Free Places in December, 1918 and 1919. | ||||||
|---|---|---|---|---|---|---|
| 1918 | 1919 | |||||
| Boys. | Girls. | Total. | Boys. | Girls. | Total. | |
| (i.) Secondary schools— | ||||||
| (a.) Junior free pupils | 2,503 | 2,405 | 4,908 | 2,793 | 2,573 | 5,366 |
| (b.) Senior free pupils | 1,081 | 977 | 2,058 | 1,187 | 1,104 | 2,291 |
| Totals | 3,584 | 3,382 | 6,966 | 3,980 | 3,677 | 7,657 |
| (ii.) District high schools— | ||||||
| (a.) Junior free pupils | 876 | 977 | 1,853 | 849 | 859 | 1,708 |
| (b.) Senior free pupils | 103 | 167 | 270 | 116 | 191 | 307 |
| Totals | 979 | 1,144 | 2,123 | 965 | 1,050 | 2,015 |
| (iii.) Maori secondary schools | 45 | 58 | 103 | 42 | 48 | 90 |
| (iv.) Technical high schools— | ||||||
| (a.) Junior free pupils | 1,053 | 1,160 | 2,213 | |||
| (b.) Senior free pupils | 109 | 182 | 291 | |||
| Totals | 1,162 | 1,342 | 2,504 | 1,351 | 1,403 | 2,754 |
| Grand totals | 5,770 | 5,926 | 11,696 | 6,338 | 6,178 | 12,516 |
At the examinations held in 1,919,217 candidates qualified for Junior National Scholarships, of which number 6 were pupils of sole-teacher schools, and 67 were pupils of secondary schools. The number of candidates qualifying for Senior National Scholarships was 122, of which number 6 qualified on the alternative programme provided specially to suit the needs of those taking a rural or domestic course.
The following figures indicate the number and the value of scholarships current in 1918 and 1919, respectively:—
| Number of scholarship-holders— | 1918. | 1919. |
|---|---|---|
| Boys | 486 | 481 |
| Girls | 310 | 285 |
| Totals | 796 | 766 |
| Number receiving boarding-allowance (included in the above total) | 239 | 221 |
| Number receiving travelling-allowance (similarly included) | 47 | 42 |
| Number held at secondary schools | 687 | 661 |
| Number held at district high schools | 86 | 82 |
| Number held at other registered secondary schools | 23 | 23 |
| Total annual rate of payment | £13,130 | £12,913 |
The number of foundation and private scholarships in the last term of 1919 was 150, of a total annual value of £1,547. Of the holders, fifty-one were also Government free pupils under the regulations. In addition, free tuition was given by the schools to holders of foundation and private scholarships to the value of £470, not including Government free places.
Regulations which came into force in January, 1919, provided for the award of bursaries to dependants of killed or disabled members of the New Zealand Expeditionary Force. To qualify for a war bursary a child must be eligible for—
Free education at technical classes; or
A free place at a secondary school, district high school, or technical high school; or
A University or educational bursary at a University college.
A bursary entitles the holder to an allowance, in addition to free tuition, of £1 10s. or £3 per annum in the case of those qualified under (a), £5 for those under (b), or £10 for those under (c). Lodging-allowance is also payable to bursars who are obliged to live away from home to attend school, at the rate of £15 per annum under (a) and £30 under (b) and (c); travelling-allowances varying from £5 to £10 per annum are also made when travelling is necessary. During 1919 the number of bursaries held at secondary schools was twenty-seven, the expenditure thereon being £524.
The following is a summary of the receipts and payments of all secondary schools (excluding Wanganui Collegiate and Christ's College Grammar Schools) for the year 1919:—
| Receipts. | |
|---|---|
| £ | |
| Endowments— | |
| Sales and mortgage-money repaid | 7,945 |
| Lands vested in High School Boards… … … … | 44,261 |
| Secondary-education reserved … | 7,209 |
| Interest on moneys invested … | 1,043 |
| Government grants— | |
| Grants for buildings, sites, rent, apparatus, &., and subsidies … | 23,347 |
| Capitation for free places … | 114,858 |
| Capitation for manual instruction … … … … | 2,825 |
| School fees … … … | 11,696 |
| Lower Department Account … | 4,608 |
| Boarding-school Account … | 43,290 |
| Loans, transfers from Capital Account, interest, &. ̣̣ … | 579 |
| Technical Classes Account … | 2,842 |
| Voluntary contributions, income from property not reserves, refunds, and sundries … … | 8,755 |
| £273,258 | |
| Payments. | £ |
|---|---|
| Endowments (including proportion of office expenses) … … | 11,731 |
| Teachers’ salaries and allowances | 122,511 |
| Incidental expenses of secondary departments— | |
| Office expenses and salaries … | 3,565 |
| Printing, stationery, and advertising … … … | 2,473 |
| Cleaning, heating, lighting, and care of school-grounds … | 9,306 |
| Material, examinations, prizes, games, and other incidentals … | 3,296 |
| Manual instruction (excluding buildings, &.) … … … | 1,804 |
| Sites, buildings, furniture, apparatus, taxes, &c… … … | 53,990 |
| Lower Department Account … | 4,448 |
| Boarding-school Account … … | 41,985 |
| Investments, loans repaid, and interest … … … … | 6,917 |
| Technical Classes Account … | 2,856 |
| Scholarships, advances to pupils, and miscellaneous … … | 3,696 |
| £268,578 | |
The total debit balance at the end of 1919 was £58,544, for the most part due to loans required for the erection of necessary buildings. The following is a summary of the monetary assets and liabilities at the end of the year:—
| Monetary Assets. | £ | Liabilities. | £ |
|---|---|---|---|
| Bank balances | 32,975 | Overdrafts | 63,494 |
| Other assets | 26,947 | Other liabilities | 54,972 |
| Total | £59,922 | Total | £118,466 |
| Debit balance | £58,544 |
The Education Act provides for public instruction in such subjects of art, science, and technology as are set forth in regulations. Classes recognized under the Act are eligible for grants in aid of necessary buildings, equipment, and material, for capitation, and for subsidies of £1 for £1 on voluntary contributions. Free technical education is also provided for.
The total number of classes held in 1919 was 2,014, and the total number of students in attendance 17,950. The following figures show the number of classes at which the various subjects indicated were taken:—
| Mathematics and science | 120 |
| Engineering | 238 |
| Wood and lead working, and other trade subjects | 201 |
| Agriculture, dairy-work, &. | 95 |
| Art and art crafts | 232 |
| Domestic subjects | 371 |
| Commercial subjects | 380 |
| Subjects of general education | 377 |
| Total | 2,014 |
Regulations requiring the attendance of young persons between the ages of fourteen and seventeen who are not otherwise receiving a suitable education or who are not specially exempted from attendance were in operation in 1919 in certain school districts in the Auckland, Wanganui, Taranaki, Hawke's Bay, and Canterbury education districts. The classes established under these regulations were attended by 1,372 students.
The number of discharged soldiers who received free education at technical schools in 1919 was 1,021.
The number of pupils receiving free education under the regulations for free places at technical high schools and other technical schools and classes was 4,488–2,326 males and 2,162 females; the number for the previous year was 4,211.
These schools (nine in number) are of secondary grade, and provide industrial, domestic, agricultural, commercial, and art courses. The number of pupils in attendance was as follows: Auckland, 587; Wanganui, 300; Wellington, 405; Napier, 275; Westport, 28; Christchurch, 596; Dunedin, 435; and Invercargill, 300. The total roll number was 2,926, an increase of 179 over that of the preceding year. Figures for the newly established school at Hawera are not included. The schools appear to meet the needs of a number of young people who would not otherwise proceed to secondary schools. The courses of instruction taken up by pupils were as follows:—
| Males. | Females. | Total. | |
|---|---|---|---|
| Industrial | 786 | 786 | |
| Commercial and general | 448 | 1,187 | 1,635 |
| Domestic | 297 | 297 | |
| Agricultural | 203 | 203 | |
| Art | 1 | 4 | 5 |
| Totals | 1,438 | 1,488 | 2,926 |
Capitation earned on account of technical high schools during 1919 totalled £41,113.
The following table classifies the free pupils at technical high schools in 1918 and 1919:—
| 1918. | 1919. | |||||
|---|---|---|---|---|---|---|
| Boys. | Girls. | Total. | Boys. | Girls. | Total. | |
| Junior free pupils | 1,053 | 1,160 | 2,213 | 1,232 | 1,172 | 2,404 |
| Senior free pupils | 109 | 182 | 291 | 119 | 231 | 350 |
| Totals | 1,162 | 1,342 | 2,504 | 1,351 | 1,403 | 2,754 |
The following is a summary of the expenditure by the State on technical instruction during the year ended the 31st March, 1920:—
| £ | |
|---|---|
| Capitation | 95,201 |
| Subsidies on voluntary contributions | 6,934 |
| Scholarships and bursaries | 2,985 |
| Grants in aid of material for class use | 5,844 |
| Grants for buildings and equipment | 13,319 |
| Rents | 1,293 |
| Conveyance of instructors, students, and free pupils | 4,467 |
| Examinations (less recoveries) | 103 |
| Inspectors’ salaries and travelling-expenses | 1,976 |
| Sundries | 123 |
| £132,245 |
The functions of the Special Schools Branch of the Education Department include provision (1) For the maintenance, education, and training of destitute, dependent, or homeless children and epidemic orphans who have lost both parents; for the training of uncontrollable and delinquent children and juvenile offenders, and for the supervision of all young persons under the age of sixteen years who are placed on probation by the Courts: (2) for the supervision of all infants and young children under the age of six years maintained apart from their parents for payment either in foster-homes or private institutions, or adopted with premium: and (3) for the education and maintenance of all afflicted children–the deaf, blind, and the feeble-minded.
The number of new cases actually dealt with in 1919 was 864, as compared with 381 for 1918, and 358 for 1917.
This abnormal increase has necessitated the adoption of a system providing for children being dealt with in their own districts.
The juvenile probation system has also been extended to such districts as Whangarei, Hamilton, and Nelson. A boys’ probation home has been established in each of the four centres. The number of cases dealt with by the Probation Officers is as follows: Auckland, 401; Wellington, 127; Christchurch, 196; Dunedin, 94: total, 818.
The number of children boarded out in foster-homes at the end of the year was 1,696.
On account of the increased cost of living the boarding-out rate has been raised from 15s. to 17s. 6d. per week for infants under twelve months, and from 12s. 6d. to 15s. for children over that age and up to fifteen years, or longer if the child in question is still attending school. In addition, a very complete initial outfit of clothing is supplied with each child, and the Department provides free medical and dental treatment and medicines. School books and stationery are also provided for children attending school.
The boys’ Training-farm at Weraroa caters for boys of all ages who through the commission of offences against the law are not considered fit to associate with the children attending an ordinary public school, at least not until they have undergone a course of training and discipline at Weraroa. There is a special school for mentally backward boys at Nelson.
Institutions at Otekaike and Nelson are available for the reception of feeble-minded boys, who, under capable supervision, are employed in farmwork, garden and orchard work, and in the bootmaking, basketmaking, matmaking, and carpentering shops. Girls are provided for at the Special School at Richmond, and employed in housework and laundry-work, in the workroom sewing, knitting, &., and in outside occupations, such as gardening and flower-growing.
This work is now carried out under the supervision of trained nurses who are fully qualified in the care and feeding of infants and young children. The majority of infants dealt with under this system are illegitimate, and have been neglected to such an extent prior to placing them in foster-homes that the greatest care is necessary in catering for their welfare.
During 1919 special classes have been established in the various centres for the education of the hard-of-hearing children and for the correction of defective speech among children. A school at Sumner exists for the preliminary teaching of stone-deaf children and young children who, in addition to being deaf, have little or no speech, and incidentally for the training of teachers for the deaf.
Of sixty secondary departments of district high schools, the average attendance in 1919 was in 18 cases, 12 to 20; in 15 cases, 21 to 30; in 22 cases, 31 to 70; in 2 cases, 71 to 105; and in 3 cases over 105.
| Education Board. | Average Attendance, 1919. | Number of Assistant Teachers. | Average Number of Pupils per Assistant Teacher. | Statutory Annual Rate of Salary as in December, 1919. | ||||
|---|---|---|---|---|---|---|---|---|
| M. | F. | Total. | ||||||
| £ | s. | d. | ||||||
| Auckland | 396 | 8 | 11 | 19 | 21 | 5,740 | 0 | 0 |
| Taranaki | 186 | 1 | 5 | 6 | 30 | 1,595 | 0 | 0 |
| Wanganui | 143 | 4 | 4 | 8 | 24 | 2,305 | 0 | 0 |
| Hawke's Bay | 124 | 3 | 3 | 6 | 21 | 1,755 | 0 | 0 |
| Wellington | 316 | 3 | 12 | 15 | 22 | 4,455 | 0 | 0 |
| Nelson | 164 | 1 | 6 | 7 | 23 | 1,940 | 0 | 0 |
| Canterbury | 684 | 11 | 20 | 31 | 22 | 9,135 | 0 | 0 |
| Otago | 262 | 3 | 10 | 13 | 21 | 4,055 | 0 | 0 |
| Totals, 1919 | 2,275 | 34 | 71 | 105 | 22 | 30,980 | 0 | 0 |
Courses bearing more or less on rural pursuits are taken in many district high schools, 69 per cent. of the boys and 32 per cent. of the girls studying agricultural science, 24 per cent. of the pupils taking dairy-work, 55 per cent. of the boys learning woodwork, and 52 per cent. of the girls cookery or needlework. Latin is taken by only 31 per cent. of the pupils, and French by 51 per cent.
Rural courses were, in 1919, in operation at forty-seven district high schools, and were taken by 1,635 pupils.
The affairs of the University of New Zealand are controlled by three Courts—the Senate, the Board of Studies, and the General Court of Convocation.
The University of New Zealand has power to confer degrees, but is not itself a teaching body, undergraduates for the most part keeping their terms at one or other of the four affiliated institutions—Otago University, Canterbury College, Auckland University College, and Victoria University College.
The revenue of the University is derived mainly from a statutory Government grant of £4,000 per annum, authorized by the New Zealand University Amendment Act, 1919, from fees, and from interest on investments.
Auckland University College and Victoria University College each receive an annual statutory grant of £11,500, while Canterbury College receives £4,500 and Otago University £10,000. The two latter institutions are endowed with reserves of land. In addition a certain proportion of the income from the National Endowment Fund for the purposes of education is paid directly to the four affiliated institutions. In 1919 the sum paid to each out of the fund amounted to £1,881. There is also now provision for the payment under regulations of a Government subsidy on voluntary contributions to the funds of the institutions affiliated to the University of New Zealand.
The total amount paid by the Education Department on account of the University of New Zealand and the affiliated colleges for the year 1919–20 was £68,975.
There were in 1919 2,961 students actually in attendance at the four University colleges. Of these, 109 were graduates, 1,938 undergraduates, and 914 unmatriculated students. In addition to the students mentioned above, there were 99 students attached to the various University colleges, but exempt from lectures. There were also 52 students taking an agricultural course of University grade at the Lincoln Agricultural College.
The University Junior Scholarships (fourteen of which were gained in 1919) are of the value of £20 per annum plus tuition fees, and are tenable for three years. In the case of holders living away from home a further sum of £30 per annum is allowed. The University National Scholarships are of equal monetary value, the number gained in 1919 being twenty-three. Taranaki Scholarships are of the annual value of £60, and the Senate may at discretion extend the tenure from three to four years. There are also some thirty or forty local and privately endowed scholarships awarded on the results of the same entrance examination.
Scholarships awarded during the degree course are the Senior University and John Tinline Scholarships. The various colleges have also private scholarships for which their own students may compete.
The chief scholarships awarded at the end of the University course are the Rhodes Scholarship, the 1851 Exhibition Scholarship, the Medical Travelling Scholarship, the Post-graduate Travelling Scholarship, the French Travelling Scholarship, and the National Research Scholarships. All excepting the last-named are tenable abroad. The Research Scholarships are each of the value of £100 per annum, with laboratory fees and expenses.
So far nineteen Rhodes Scholarships have been granted, of which five have been gained by students of Auckland University College, four by students of Otago University, six by students of Victoria University College, and three by students of Canterbury College.
Of the eighteen Research Scholarships awarded up to the present one was in active operation in 1919.
University bursaries entitle the holders to the payment of tuition and examination fees (not exceeding £20 per annum) during a three (or possibly four) years’ course at a University college or school of agriculture recognized by the University. The number of University bursaries held in 1919 was 450.
The number of educational bursaries under the Education Act, 1914, held in 1919 was seventy-four, of which number seven completed the three-years tenure of their bursaries
Domestic-science bursaries tenable at the Otago University may be awarded under the regulations for technical instruction.
Bursaries of this kind were awarded to sixteen students in 1919, making forty-three bursars in attendance at classes.
In the distribution to University colleges of the moneys received by the University from the National Endowment Fund in 1919, £300 was allocated to three colleges and £350 to the fourth for the establishment and maintenance of the Workers’ Educational Association tutorial or University extension classes. Each college is now to receive an additional grant of £500 for the purpose. Branches of this association have been established in several of the larger towns, and tutorial classes in such subjects as economics, history, industrial law, English, electricity, debating, and chairmanship, conducted in some cases by University-college professors or lecturers, are in operation for the better education of working men and women.
Agricultural bursaries may be awarded to qualified candidates in order to enable them to obtain the necessary practical training for positions as teachers or agricultural instructors, or as farmers.
During 1919 nine bursars were in attendance at Lincoln Agricultural College, Canterbury.
The number of candidates for the various examinations in 1919–20 who actually presented themselves in the examination-room is given below:—
| Junior National and junior free places | 2,170 |
| Public Service Entrance, Senior National Scholarships, and Intermediate | 3,063 |
| Teachers'D and C | 2,234 |
| Public Service Senior | 50 |
| Kindergarten Certificate Examination | 9 |
| London University Examinations | 4 |
| Special Public Service Entrance Examination in June | 189 |
| Other examinations | 20 |
| Total | 7,739 |
The cost of conducting all examinations was as follows:—
| £ | |||
| Total expenses, including cost of additional temporary clerical services, but omitting other salaries | 7,020 | ||
| Less recoveries— | |||
| £ | |||
| Fees paid by candidates for teachers’ certificates and others | 2,564 | ||
| Contribution by Public Service Commissioner for expense of conducting Public Service examinations— | |||
| £ | |||
| Public Service Entrance (two examinations) | 1,312 | ||
| Public Service Senior and Typists’ Examinations | 69 | ||
| 1,381 | |||
| 3,945 | |||
| Net expenditure | £3,075 | ||
Table of Contents
THE remodelling of the New Zealand defence system, outlined in the 1915 and preceding issues of the Year-book, placed the Defence Forces of the Dominion in such a position that on the outbreak of war in August, 1914, it was possible to take immediate and decisive steps to assist the other Forces of the Empire.
The total number attested into the New Zealand Expeditionary Force who left for service overseas was 3,085 officers, 550 nurses, and 96,809 other ranks.
A total of 9,924 troops were in training at the date of the Armistice. The complete number of troops and nurses provided for foreign service up to the cessation of hostilities was therefore 110,368—more than 10 per cent. of the Dominion's total mean population in 1914. A further total of 3,370 are known to have left New Zealand to serve in British and Australian Forces.
The great majority of these troops were volunteers. Of 124,211 men provided from the commencement of the war to the 12th November, 1918, 91,941 were volunteers, and 32,270 were conscripted under the Military Service Act, 1916.
“Wastage” whilst undergoing training accounted for a loss to the Force of 11,333.
Casualties in the Expeditionary Force were, unfortunately, very high. The total number of deaths up to 1st June, 1920, was as follows:—
| Killed in action | 10,245 |
| Died of wounds | 3,958 |
| Died, other causes | 2,351 |
| Died in New Zealand before discharge | 227 |
| Total | 16,781 |
At 31st May, 1920, some 3,057 “service” patients were still under treatment in New Zealand.
Section 7 of the Expeditionary Forces Amendment Act, 1918, authorized payment of “a free gift by the State in recognition of the honourable service of soldiers of the Expeditionary Forces in the present war.” A scale of 1s. 6d. per diem (for period of active service) with certain limitations was prescribed by Order in Council on 19th September, 1919. Payments in New Zealand to 20th May, 1920, have been made of 88,932 gratuities aggregating £5,225,900. In addition, approximately 2,000 claims have been settled in London.
The total war expenditure to 31st March, 1920, may be summarized as follows:—
| £ | |
| General expenditure (including pay and allowances, £30,476,998) | 69,800,449 |
| Relief purposes | 268,439 |
| Repatriation | 801,725 |
| Charges and expenses of raising loans | 693,215 |
| Gratuities, New Zealand Expeditionary Force | 4,872,485 |
| Gratuities, Imperial and naval | 45,153 |
| Advances outstanding | 471,610 |
| Total | £76,953,076 |
Under the Defence Act, 1909, and its amendments, all male British subjects in New Zealand on attaining the age of fourteen years must register for military training. In the case of immigrants those who are within the ages of fourteen and twenty-five years must register within six months after their arrival in New Zealand. There are no exemptions from registration, and any person failing to comply with the law in this respect is liable to a fine of £5 and deprivation of civil rights for a period not exceeding ten years.
The posting of Cadets to Senior Cadet companies, and of individuals accepted for service (either direct or on completion of service in the Senior Cadets) to units of the Territorial Force, is carried out in June of each year.
Senior Cadets become liable for training in June of the year in which they attain the age of fourteen years, or any later date on which they cease to attend a primary school.
Persons liable for training are posted to the Territorial Force in June of the year in which they attain the age of eighteen years, or on ceasing to attend a secondary school (whichever is the later).
Members of the Territorial Force are posted to the Reserve in June of the year in which they attain the age of twenty-five years, and training in the Reserve continues until the 1st day of June in the year in which the Reservist attains the age of thirty.
The amount of obligatory training to be carried out annually is as follows:—
Territorial Force—
Thirty drills (including twenty out-of-door parades).
Twelve half-day or six whole-day parades.
Seven days in camp.
Prescribed course of musketry.
Reserve—
Two half-day parades, or their equivalent, with a Territorial unit or company.
Senior Cadets—
Fifty drills of one hour's duration, or thirty-four drills of one and a half hours’ duration.
Six half-day parades.
Prescribed course of musketry.
Absence from compulsory parades constitutes a civil offence, and offenders are liable to a fine not exceeding £5.
The strength of the Territorial Force is limited to 30,000 men, and these are organized into units. The New Zealand Forces generally are now in process of reorganization, consequent upon lessons learnt in the recent war.
| TERRITORIAL FORCE AND SENIOR CADETS. | ||||
|---|---|---|---|---|
| Year. | Territorial Force. | Senior Cadets. | General Training Section. | Rifle Clubs. |
| Note.—The total strength of the Volunteer Forces at the end of the year 1909–10 was 14,249. | ||||
| 1911–12 | 22,614 | |||
| 1912–13 | 23,919 | 24,770 | 1,370 | 4,003 |
| 1913–14 | 25,902 | 25,332 | 3,729 | 2,577 |
| 1914–15 | 29,447 | 26,446 | 2,075 | 8,770 |
| 1915–16 | 26,839 | 27,063 | 3,437 | 7,928 |
| 1916–17 | 22,174 | 29,832 | 7,975 | |
| 1917–18 | 22,933 | 30,668 | 7,252 | |
| 1918–19 | 25,626 | 31,109 | 6,354 | |
| 1919-20 | 30,000 | 31,929 | 328 | 5,523 |
Sufficient officers, warrant officers, non-commissioned officers, and men are permanently employed for the staffs of general headquarters and military districts, and to furnish cadres of regular troops as a nucleus of the Territorial personnel and fixed defences and field artillery. These comprise the New Zealand Staff Corps, the Royal New Zealand Artillery, the New Zealand Permanent Staff, the New Zealand Army Ordnance Corps, the New Zealand Army Pay Corps, and the New Zealand Army Medical Corps.
Under an arrangement with the Australian Government, New Zealand may send ten cadets every year to the Royal Military College of Australia at Duntroon.
The college has a staff of twenty-two, and contains barracks for 150 cadets. It is equipped with class-rooms, physical and chemical laboratories, library, riding-school, gymnasium, &. The number of New Zealand cadets at the college at present (August, 1920) is twenty-two.
The Dominion Rifle Association was formed to encourage the members of the New Zealand Defence Forces to become efficient in the use of the rifle, and to promote rifle shooting generally as a necessary element for the defence of the Empire. It was established in 1879, the annual rifle meetings prior to that date having been conducted and controlled by the military authorities. At Trentham, near Wellington, a range accommodation of seventy-five targets with all necessary equipment and suitable buildings has been made available for the rifle championship meetings.
No meetings were held during the war period, but no time was lost in renewing these valuable competitions after the Armistice was signed.
The first post-war meeting, held in March, 1919, was largely attended and a great success.
The association receives an annual grant from the State.
Railway passes are granted to Territorials and members of rifle clubs up to a distance of 100 miles to attend rifle-shooting competitions.
By the Australian Defence Act, 1887, provision was made for the payment by New Zealand of a proportional part of the cost of the establishment and maintenance of a British Naval Force to be employed for the protection of trade in Australasian waters. Under this Act a sum of approximately £20,000 per annum was paid by New Zealand to the Imperial Government.
In 1903, consequent on the passing of the Australian and New Zealand Naval Defence Act, the annual contribution payable by New Zealand was raised to “a sum not exceeding £40,000.”
By the Naval Subsidy Act, 1908, the contribution of the Dominion was again increased, this time to a sum of £100,000 payable annually for ten years from the 12th May, 1909.
The year 1909 was an important one in the history of the Dominion. At what was generally regarded as a critical period for the whole Empire New Zealand presented a battle-cruiser to the Home Government. Full information concerning this vessel and her visit to New Zealand in 1913 appears in the 1913 issue of this book (pages 932–941).
The Naval Defence Act, 1913, provides for the establishment of a New Zealand Naval Force, to be raised and maintained by voluntary enlistment only, enlistment being for a prescribed period of not less than two years. In time of war the Naval Force (including vessels acquired for defence purposes) is to be at the disposal of the British Government. The establishment of a New Zealand Royal Naval Reserve is also provided for under the Act. The third-class cruiser “Philomel” was lent by the English Admiralty to the New Zealand Government to serve as a training-ship for the forming of a nucleus of the Naval Force. The light cruiser “Chatham” has recently been presented to New Zealand by the Imperial Government.
A report on the naval defence of the Dominion was presented by Admiral of the Fleet Viscount Jellicoe of Scapa, G.C.B., O.M., G.C.V.O., on the occasion of his visit to New Zealand in August, 1919.
The “Amokura,” formerly H.M.S. “Sparrow,” is maintained by the New Zealand Marine Department as a training-ship for fitting boys for service in either the Navy or the mercantile marine. Boys who are taken on board must be between the ages of thirteen and a half and fifteen years. The period of training is two years.
The vessel has accommodation for sixty boys, and, since she started as a training-ship in 1907, 412 boys have been trained on her, exclusive of those now on board.
The “Amokura” has proved to be not particularly well adapted for the purposes of a training-ship, and is now laid up in harbour. Negotiations are in progress for the obtaining of a more suitable vessel.
Table of Contents
THE ordinary civil jurisdiction of Magistrates’ Courts is limited generally to claims not exceeding £200. Justices of the Peace may hear and decide certain civil cases when the sum in dispute does not exceed £20.
MAGISTRATES‘ COURTS.
| Year. | Cases entered. | Cases tried. | |||
|---|---|---|---|---|---|
| Number. | Total Amount claimed. | Number. | Total Amount sued for. | Total Amount for which Judgment entered. | |
| * Information not available. | |||||
| £ | £ | £ | |||
| 1910 | 55,225 | 562,115 | 29,698 | * | 293,326 |
| 1911 | 53,394 | 557,158 | 34,627 | * | 296,629 |
| 1912 | 57,079 | 592,943 | 36,815 | 420,073 | 331,020 |
| 1913 | 61,759 | 670,925 | 39,086 | 427,484 | 366,981 |
| 1914 | 62,471 | 706,953 | 39,233 | 455,197 | 398,760 |
| 1915 | 60,170 | 695,625 | 37,632 | 446,979 | 383,532 |
| 1916 | 49,806 | 639,922 | 31,064 | 395,779 | 339,847 |
| 1917 | 46,004 | 624,693 | 29,412 | 401,568 | 340,958 |
| 1918 | 39,176 | 563,358 | 25,594 | 378,025 | 308,429 |
| 1919 | 38,775 | 619,576 | 24,680 | 385,020 | 319,135 |
The number of actions commenced, cases tried, and judgments entered, together with the total amount for which judgments were recorded, in the Supreme Court of New Zealand during each of the ten years 1910–19 were as follows:—
| SUPREME COURT: CIVIL JURISDICTION. | |||||
|---|---|---|---|---|---|
| Year. | Number of Actions commenced. | Cases tried. | Judgments recorded. | ||
| With Jury. | Without Jury. | Number. | Amount. | ||
| £ | |||||
| 1910 | 569 | 52 | 211 | 193 | 83,427 |
| 1911 | 729 | 76 | 170 | 211 | 84,822 |
| 1912 | 755 | 64 | 233 | 235 | 102,657 |
| 1913 | 788 | 75 | 243 | 284 | 79,610 |
| 1914 | 792 | 95 | 251 | 281 | 91,286 |
| 1915 | 697 | 50 | 253 | 241 | 68,555 |
| 1916 | 673 | 48 | 193 | 254 | 78,877 |
| 1917 | 581 | 70 | 172 | 234 | 100,447 |
| 1918 | 611 | 47 | 188 | 226 | 104,927 |
| 1919 | 783 | 72 | 227 | 238 | 88,144 |
Under the provisions of the Judicature Amendment Act, 1913, the Court of Appeal consists of two divisions, each composed of five Judges of the Supreme Court, the Chief Justice and the two senior Judges being members of both divisions. The two divisions sit separately, but may sit together to save time to determine any appeal of special difficulty or importance.
The decision of the Court must be in accordance with the opinion of a majority of the Judges present. Certain proceedings may by order of the Supreme Court be removed to the Court of Appeal. The decision of the Court of Appeal is final as regards the tribunals of New Zealand, but the Court may, in civil proceedings, give leave to either party to appeal to the Privy Council. In criminal cases any party may appeal to the Court of Appeal.
| Year. | Crown Criminal Cases. | Civil. | |||||
|---|---|---|---|---|---|---|---|
| Number. | Convictions affirmed. | Appeals. | Cases removed. | ||||
| Number. | Allowed. | Number. | Judgments for Plaintiffs. | Judgments for Defendants. | |||
| 1915 | 4 | 3 | 14 | 7 | 14 | 11 | 3 |
| 1916 | 4 | 1 | 16 | 6 | 6 | 3 | 3 |
| 1917 | 4 | 4 | 11 | 4 | 12 | 8 | 4 |
| 1918 | 5 | 3 | 11 | 5 | 7 | 5 | 2 |
| 1919 | 6 | 2 | 13 | 9 | 6 | 2 | 4 |
Under the Bankruptcy Act, 1908—a consolidation of the then existing laws—a person may seek the protection of the Court by filing a petition with a declaration of insolvency, or one or more creditors may petition the Court to have a debtor declared insolvent.
| Year. | Petitions by Debtors. | Adjudications on Petitions by Creditors. | Cases in which Composition accepted. | Orders of Immediate Discharge granted. | Cases in which Order of Discharge were suspended. |
|---|---|---|---|---|---|
| 1915 | 250 | 44 | 55 | 18 | |
| 1916 | 267 | 37 | 63 | 21 | |
| 1917 | 221 | 44 | 1 | 60 | 10 |
| 1918 | 133 | 31 | 1 | 53 | 9 |
| 1919 | 109 | 32 | 1 | 128 | 13 |
Private assignments and compositions are not registered, and particulars respecting this class of insolvency are not procurable.
| Year. | Number of Bankruptcies. | Debtors’ Statements of Assets, excluding Amounts secured to Creditors. | Amounts realized by Official Assignees. | Amount of Debts proved. | Amounts paid in Dividends and Preferential Claims. |
|---|---|---|---|---|---|
| £ | £ | £ | £ | ||
| 1915 | 294 | 92,876 | 63,310 | 153,926 | 42,374 |
| 1916 | 304 | 123,441 | 56,416 | 172,774 | 29,223 |
| 1917 | 265 | 138,696 | 63,645 | 178,244 | 27,405 |
| 1918 | 164 | 50,356 | 67,729 | 88,607 | 33,176 |
| 1919 | 141 | 43,627 | 54,662 | 59,767 | 24,980 |
Of the 141 bankruptcies in 1919: in 5 cases the liabilities were under £50; in 16, from £50 to £100; in 46, from £100 to £250; in 33, from £250 to £500; in 24, from £500 to £1,000; in 13, from £1,000 to £2,000; and in 4, from £2,000 to £5,000.
As regards occupations, some 34 were described as employers, 51 were working on their own account, and 56 were employees.
During the year 1919 an abnormally large number—viz., 675—of petitions for dissolution of marriage were filed, this number including 8 petitions for nullity of marriage. In 395 of these cases a decree nisi was granted, 160 of these being made absolute during the year. In addition, decrees nisi were granted in respect of 84 petitions filed in previous years, 72 of these being made absolute before the end of the year, and 104 decrees nisi of previous years became absolute. The total number of decrees nisi for the year was thus 479, which includes 5 decrees for nullity of marriage.
In addition, 5 petitions for judicial separation were filed, and 1 decree granted, while 2 applications for restitution of conjugal rights were made, both of which are still pending.
The subject of the next table is the duration of the marriage for dissolution of which petitions were filed in the past four years.
| Duration of Marriage, in Years. | Husbands’ Petitions. | Wives’ Petitions. | ||||||
|---|---|---|---|---|---|---|---|---|
| 1919. | 1918. | 1917. | 1916. | 1919. | 1918. | 1917. | 1916. | |
| Under 1 | 3 | 1 | 1 | 2 | 2 | 1 | 2 | |
| 1 and under 2 | 4 | 3 | 6 | 2 | 1 | 3 | 3 | |
| 2 and under 3 | 20 | 7 | 3 | 3 | 3 | 2 | 2 | 3 |
| 3 and under 4 | 25 | 7 | 7 | 5 | 7 | 3 | 4 | 3 |
| 4 and under 5 | 14 | 10 | 5 | 7 | 20 | 5 | 5 | 1 |
| 5 and under 10 | 96 | 46 | 35 | 47 | 106 | 42 | 39 | 48 |
| 10 and under 15 | 70 | 61 | 25 | 27 | 101 | 56 | 36 | 34 |
| 15 and under 20 | 54 | 30 | 28 | 24 | 58 | 39 | 29 | 34 |
| 20 and under 30 | 27 | 14 | 11 | 13 | 48 | 35 | 30 | 22 |
| 30 and under 40 | 5 | 6 | 2 | 4 | 3 | 7 | 8 | 4 |
| 40 and over | 2 | 1 | 1 | 3 | ||||
| Not stated | 8 | 2 | ||||||
| Totals | 326 | 185 | 125 | 135 | 349 | 195 | 157 | 154 |
A table is given showing the chief grounds of petitions, in combination with particulars as to number of living issue. Columns are added showing for the various grounds the sex of the petitioner.
| Grounds. | Petitioner. | Number of Cases in which Number of Living Issue was | Total Number of cases. | |||||||
|---|---|---|---|---|---|---|---|---|---|---|
| Husband. | Wife. | 0 | 1 | 2 | 3 | 4 | 5 | 6 or over. | ||
*“ Nullity ” cases. † Including one “ nullity ” case. | ||||||||||
| Adultery | 237 | 151 | 130 | 97 | 80 | 44 | 19 | 9 | 9 | 388 |
| Bigamy* | 2 | 3 | 5 | 5 | ||||||
| Crueltỵ̣ | 7 | 2 | 1 | 1 | 2 | 1 | 7 | |||
| Desertion (alone) | 78 | 130 | 66 | 51 | 47 | 16 | 14 | 9 | 5 | 208 |
| Desertion and drunkenness | 5 | 2 | 1 | 1 | 1 | 5 | ||||
| Drunkenness (alone) | 3 | 29 | 7 | 6 | 9 | 5 | 3 | 1 | 1 | 32 |
| Drunkenness and cruelty | 9 | 1 | 2 | 1 | 3 | 1 | 1 | 9 | ||
| Other or not stated† | 6 | 15 | 6 | 7 | 1 | 2 | 1 | 2 | 2 | 21 |
| Totals | 326 | 349 | 219 | 165 | 140 | 72 | 38 | 22 | 19 | 675 |
On the 31st March, 1920, the number of permanent members of the Police Force in New Zealand was 844 of all ranks, being an increase of 53 during the year. The total is made up as follows: 4 superintendents, 11 inspectors, 6 sub-inspectors, 31 senior sergeants, 83 sergeants, 671 constables, 7 senior detectives, 16 detective-sergeants, and 15 detectives. There were also 4 police surgeons, 7 matrons, 7 district constables, and 5 Native constables.
In addition to the above, there were 72 temporary constables appointed under section 2 of the Police Force Amendment Act, 1919, 40 of whom were recruits undergoing a period of probationary service with a view to permanent appointment.
The following table shows the number of stations and of police in each police district:—
| Police District. | No. of Stations. | No. of Police. |
|---|---|---|
| Auckland | 52 | 187 |
| Hamilton | 36 | 68 |
| Napier | 28 | 64 |
| Wanganui | 28 | 55 |
| Palmerston North | 17 | 40 |
| Wellington | 35 | 168 |
| Greymouth | 22 | 39 |
| Christchurch | 37 | 116 |
| Timaru | 13 | 34 |
| Dunedin | 35 | 92 |
| Invercargill | 22 | 41 |
There were also 7 attached to headquarters, 1 has been lent to the Cook Islands Administration, 2 lent to Samoan Administration, and two were on leave prior to retirement.
The proportion of police to population is 1 to every 1,325 persons, and the expenditure (exclusive of the cost of buildings) on the whole Police Force for the year ended the 31st March, 1920, was 4s. 11¾d. per head of population.
The following table shows the growth of the Police Force since 1878, prior to which each province had its own Police Force, and reliable data are not available:—
| Year ended 31st March. | Officers. | Non-commissioned Officers. | Detectives. | Constables. | Total. | Police to Population (including Maoris). | Cost per In. habitant. | |
|---|---|---|---|---|---|---|---|---|
| s. | d. | |||||||
| 1878 | 25 | 90 | 14 | 329 | 458 | 1 to 944 | ||
| 1885 | 20 | 65 | 17 | 372 | 474 | 1 to 1,293 | 3 | 0¾ |
| 1890 | 12 | 66 | 13 | 403 | 494 | 1 to 1,346 | 2 | 10¾ |
| 1895 | 7 | 51 | 13 | 416 | 487 | 1 to 1,495 | 2 | 6¾ |
| 1900 | 11 | 56 | 20 | 499 | 586 | 1 to 1,359 | 2 | 10¾ |
| 1905 | 12 | 65 | 25 | 553 | 655 | 1 to 1,375 | 2 | 10¼ |
| 1910 | 16 | 86 | 34 | 639 | 775 | 1 to 1,330 | 3 | 3½ |
| 1916 | 19 | 104 | 36 | 757 | 916 | 1 to 1,258 | 4 | 2¾ |
| 1917 | 20 | 108 | 36 | 734 | 898 | 1 to 1,280 | 4 | 3 |
| 1918 | 20 | 111 | 38 | 732 | 901 | 1 to 1,274 | 4 | 6½ |
| 1919 | 20 | 112 | 41 | 705 | 878 | 1 to 1,319 | 5 | 2½ |
| 1920 | 21 | 114 | 38 | 743 | 916 | 1 to 1,325 | 4 | 11¾ |
The proportion of police to population is much lower in New Zealand than in any of the Australian States, and the cost of police per inhabitant is, as might be expected, also lower in New Zealand than in the Commonwealth. If, however, the proportion of police to population were the same in each of the Australian States as in New Zealand, the cost per inhabitant would be higher in the Dominion than in any of the States.
CHARGES.
The total number of charges brought before Magistrates in 1919, and number of convictions obtained, are shown in the following table :—
| How brought before Magistrate. | Arrested or summoned. | Convicted. | ||
|---|---|---|---|---|
| Total Offences, including Multiple Charges. | Distinct Arrests or Summonses, excluding Multiple Charges. | Total Summary Convictions, including Multiple Charges. | Distinct Summary Convictions, excluding Multiple Charges. | |
| By arrest | 15,909 | 11,408 | 13,106 | 10,424 |
| By summons | 25,438 | 21,783 | 19,586 | 17,164 |
| Totals | 40,447 | 33,191 | 32,692 | 27,588 |
If the Maoris be excluded the number of charges in 1919 is found to have been 38,221, an increase of 3,539 upon the number for 1918; and the proportion per 1,000 of population 33.63, as against 31.44.
Summary convictions in 1919 numbered 32,692, including 1,935 recorded against Maoris. In respect of 519 charges (34 of which were against Maoris) the accused were committed for sentence. Commitments for trial at the Supreme Courts numbered 564 (including 41 charges against Maoris).
Dealing with the summary convictions for all offences, the figures for 1910 and onward (excluding the Maoris) are,—
| Year. | Offences against the Person. | Offences against Property. | Other Offences. | Totals. | ||||
|---|---|---|---|---|---|---|---|---|
| Total Number. | Per 1,000 Mean Population. | Total Number. | Per 1,000 Mean Population. | Total Number. | Per 1,000 Mean Population. | Number. | Per 1,000 Mean Population. | |
| 1910 | 655 | 0.66 | 2,080 | 2.09 | 29,245 | 29.47 | 31,980 | 32.22 |
| 1911 | 654 | 0.64 | 2,146 | 2.11 | 29,239 | 28.81 | 32,039 | 31.56 |
| 1912 | 595 | 0.57 | 2,407 | 2.32 | 31,984 | 30.78 | 34,986 | 33.67 |
| 1913 | 646 | 0.60 | 2,852 | 2.67 | 35,250 | 32.99 | 38,748 | 36.26 |
| 1914 | 726 | 0.67 | 2,740 | 2.51 | 36,944 | 33.88 | 40,410 | 37.06 |
| 1915 | 628 | 0.57 | 2,579 | 2.35 | 35,012 | 31.85 | 38,219 | 34.76 |
| 1916 | 618 | 0.56 | 2,360 | 2.15 | 31,218 | 28.39 | 34,196 | 31.10 |
| 1917 | 588 | 0.54 | 2,315 | 2.11 | 29,868 | 27.17 | 32,771 | 29.82 |
| 1918 | 525 | 0.48 | 2,321 | 2.10 | 24,988 | 22.65 | 27,834 | 25.23 |
| 1919 | 671 | 0.59 | 2,978 | 2.62 | 27,108 | 23.85 | 30,757 | 27.06 |
In dealing with the summary convictions in the Magistrates’ Courts, in the above table each offence is reckoned as a distinct person. Of recent years there has been a tendency for the rates to decline, but this has been offset by the increase in prosecutions for offences not strictly criminal in character.
Of the 671 summary convictions for offences against the person in 1919 the greater number were on account of common (616) and aggravated (10) assaults. There were also 42 convictions for attempt to commit suicide.
Of offences against property, theft (not otherwise described) is the most common, showing 2,022 summary convictions during 1919. There were, besides, 125 for fraud and false pretences; 221 for housebreaking; and 550 for wilful damage to property. These are the principal items only.
Under the heading “Other Offences” (those relating to good order included) drunkenness comes first with 7,656 summary convictions, of which 475 were in respect of females. These figures cover, besides drunkenness only, drunkenness with disorderly conduct and habitual drunkenness. Prohibition orders numbered 1,781, including 140 made against women. The subject of drunkenness is specially dealt with under a separate heading.
Further offences against good order include 3,807 summary convictions simply defined as for “breach of by-laws”; 813 for obscene, threatening, or abusive language; 555 for indecent, riotous, or offensive conduct; and 253 for assaulting or resisting the police. Under “Vagrancy” there were 390 summary convictions, including 94 against women. The chief items only are referred to above.
Information in connection with charges brought before Magistrates is obtained on cards, and it is possible to give particulars in regard to the ages and birthplaces of persons arrested. Ages and birthplaces in summons cases are not obtainable.
From the following table it will be seen that of the total convictions in 1919 of persons arrested (12,430) the distinct arrests amounted to 9,941, the difference being accounted for by multiple charges against the same person. If distinct persons only are taken this total is further reduced to 7,760, representing 6.82 for every 1,000 of the mean population. Convictions of Maoris are not included.
| Convictions on Arrest, 1919. | ||||
|---|---|---|---|---|
| Offences against | Total Convictions, including Multiple Charges. | Distinct Convictions, excluding Multiple Charges. | Distinct Persons convicted, most Serious Offence recorded. | Proportion of Distinct Persons convicted per 1,000 of Mean Population. |
| The person | 322 | 284 | 254 | 0.22 |
| Property | 1,943 | 1,167 | 1,019 | 0.90 |
| Good order | 9,180 | 7,847 | 6,403 | 5.63 |
| Other offences | 985 | 643 | 84 | 0.07 |
| Total | 12,430 | 9,941 | 7,760 | 6.82 |
The offences and sentences for convictions in arrest and summons cases (including multiple charges) are shown below. Cases concerning Maoris are not included.
| Offences against | Convicted and discharged or ordered to come up for Sentence | Fined. | Imprisoned. | Other. | Total Convictions. |
|---|---|---|---|---|---|
| *Including 265 released under the First Offenders' Probation Act, 318 committed to industrial schools, 30 whipped, 50 bound over, and 3,254 against whom an order was made. | |||||
| The person | 161 | 384 | 97 | 29 | 671 |
| Property | 1,148 | 699 | 477 | 654 | 2,978 |
| Good order | 3,109 | 9,567 | 1,064 | 1,988 | 15,728 |
| Other offences | 1,248 | 8,067 | 696 | 1,369 | 11,380 |
| Totals | 5,666 | 18,717 | 2,334 | 4,040* | 30,757 |
Included in the figures of total charges and convictions for the year 1919 are a number dealing with offences committed by juvenile offenders— i.e., persons under or apparently under the age of sixteen.
| Class of Offence. | Charges. | Dismissed or discharged. | Committed for Sentence or Trial. | Summary Convictions. |
|---|---|---|---|---|
| Against the person | 14 | 9 | 1 | 4 |
| Against property | 1,536 | 719 | 19 | 798 |
| Against good order | 121 | 49 | 72 | |
| Other | 88 | 36 | 52 | |
| Totals | 1,759 | 813 | 20 | 926 |
Of the 926 convictions, in 152 cases the offender was discharged, in 250 ordered to come up for sentence, in 89 released on probation, and i 305 committed to an industrial school.
In 1919 the total number of cases coming before the Supreme Court was 1,112, and this included 437 cases sent from Magistrates’ Courts for sentence. Maoris are included in these numbers.
Of 646 indictments and informations (excluding Maoris), 347 resulted in convictions being obtained. For Maoris the total was 29, resulting in 24 convictions.
Dealing now with distinct persons, it is found that the total indicted during the year was 388, including 28 Maoris; of these, 236 were convicted, including 24 Maoris. The distinct persons sent up from Magistrates’ Courts for sentence numbered 225, inclusive of 18 Maoris.
The following summary shows the number of distinct persons (Maoris excluded) convicted in Supreme Courts during the last decade:—
SUPREME COURTS.—PERSONS CONVICTED, ETC., 1910–19.
| Year. | Offences against the Person. | Offences against Property. | Forgery and Offences against the Currency. | Other Offences. | Total Convictions. | Number committed for Sentence included in previous Columns. |
|---|---|---|---|---|---|---|
| 1910 | 89 | 301 | 54 | 34 | 478 | 243 |
| 1911 | 88 | 245 | 34 | 36 | 403 | 185 |
| 1912 | 105 | 225 | 44 | 21 | 395 | 185 |
| 1913 | 123 | 194 | 44 | 21 | 382 | 171 |
| 1914 | 90 | 258 | 57 | 47 | 452 | 192 |
| 1915 | 95 | 233 | 52 | 32 | 412 | 212 |
| 1916 | 101 | 204 | 47 | 21 | 373 | 190 |
| 1917 | 116 | 181 | 37 | 28 | 362 | 178 |
| 1918 | 74 | 175 | 40 | 21 | 310 | 183 |
| 1919 | 104 | 251 | 29 | 35 | 419 | 203 |
Particulars of sentences (distinct persons) are,—
| Sentence. | Excluding Maoris. | Including Maoris. |
|---|---|---|
| Imprisonment (only) with or without hard labour | 130 | 139 |
| Imprisonment and declared habitual criminal | 17 | 18 |
| Imprisonment and reformative detention | 8 | 9 |
| Reformative detention (only) | 118 | 133 |
| Fined | 27 | 29 |
| Released on probation | 67 | 75 |
| Ordered to come up for sentence | 50 | 56 |
| Held on bail | 2 | 2 |
| Totals | 419 | 461 |
The number of convictions for breaches of the licensing laws by publicans and for selling liquor without a license, during the past five years, was as shown in the following statement. Offences by Maoris are not included.
| Convictions for | ||
|---|---|---|
| Year. | Breaches of Licensing | Selling Liquor |
| Laws by Publicans. | without a License. | |
| 1915 | 171 | 142 |
| 1916 | 223 | 102 |
| 1917 | 452 | 132 |
| 1918 | 360 | 73 |
| 1919 | 486 | 38 |
The number of convictions for drunkenness and drunkenness with disorderly conduct during 1919 (exclusive of convictions against Maoris) totalled 7,181 against males and 475 against females. In addition there were 411 convictions against Maoris—398 against males and 110 against females.
CONVICTIONS for DRUNKENNESS (exclusive of MAORIS), 1910–19.
| Year. | Convictions recorded against. | Per 1,000 of Mean Population. | ||||
|---|---|---|---|---|---|---|
| Males. | Females. | Total. | Males. | Females. | Total. | |
| 1910 | 10,808 | 805 | 11,613 | 20.58 | 1.72 | 11.70 |
| 1911 | 10,559 | 841 | 11,400 | 19.74 | 1.75 | 11.23 |
| 1912 | 10,688 | 843 | 11,531 | 19.56 | 1.71 | 11.10 |
| 1913 | 10,815 | 783 | 11,598 | 19.27 | 1.54 | 10.85 |
| 1914 | 12,133 | 1,012 | 13,145 | 21.34 | 1.94 | 12.06 |
| 1915 | 12,010 | 952 | 12,962 | 21.22 | 1.78 | 11.79 |
| 1916 | 9,937 | 765 | 10,702 | 18.01 | 1.40 | 9.73 |
| 1917 | 7,971 | 606 | 8,577 | 14.66 | 1.09 | 7.83 |
| 1918 | 6,467 | 532 | 6,999 | 11.98 | 0.94 | 6.35 |
| 1919 | 7,181 | 475 | 7,656 | 12.69 | 0.83 | 6.74 |
Repeated charges against the same person are included in the totals shown in the previous table. Dealing with arrests only (males, 6,890; females, 462: total 7,352), but excluding Maoris, it is found that the number of distinct persons convicted of this offence was 4,879 (4,656 males and 223 females), or 66.36 per cent. of the total “arrest” convictions (excluding Maoris) for drunkenness.
Offences for which convictions were entered against persons arrested (and convicted) at the same time for drunkenness numbered 1,212. The principal were: Assault, 70; wilful damage, 103; indecent or offensive conduct, 104; obscene or abusive language, 268; assaulting or resisting police, 98.
A calculation of the amount of alcoholic liquor consumed per head of mean population during the past five years is given below:—
CONSUMPTION of BEER, WINE, and SPIRITS per HEAD of MEAN POPULATION.
| Including Maoris. | Excluding Maoris. | |||||
|---|---|---|---|---|---|---|
| Beer. | Wine. | Spirits. | Beer. | Wine. | Spirits. | |
| Gal. | Gal. | Gal. | Gal. | Gal. | Gal. | |
| 1915 | 9.455 | 0.142 | 0.818 | 9.883 | 0.148 | 0.856 |
| 1916 | 9.987 | 0.121 | 0.678 | 10.439 | 0.126 | 0.709 |
| 1917 | 9.937 | 0.124 | 0.661 | 10.387 | 0.130 | 0.691 |
| 1918 | 9.213 | 0.109 | 0.502 | 9.629 | 0.114 | 0.524 |
| 1919. | 11.704 | 0.147 | 0.581 | 12.216 | 0.153 | 0.606 |
The quantity of each kind of alcoholic liquor used in the Dominion during the same period was as follows:—
| Beer for Consumption. | Wine for Consumption. | Spirits for Consumption. | |
|---|---|---|---|
| Gal. | Gal. | Gal. | |
| 1915 | 10,865,764 | 163,244 | 940,611 |
| 1916 | 11,477,041 | 138,757 | 779,698 |
| 1917 | 11,416,475 | 142,859 | 759,118 |
| 1918 | 10,621,229 | 126,122 | 578,177 |
| 1919 | 13,882,286 | 174,333 | 688,632 |
The number of summary convictions of Maoris brought before Magistrates’ Courts for the past five years is shown in the following table:—
| Year. | Offences. | |||||
|---|---|---|---|---|---|---|
| Against the Person. | Against Property. | Against Good Order. | Other Offences. | Total. | ||
| Drunkenness.* | Other. | |||||
*Including drunkenness with disorderly conduct. | ||||||
| 1915 | 69 | 187 | 422 | 405 | 373 | 1,456 |
| 1916 | 44 | 152 | 296 | 393 | 378 | 1,263 |
| 1917 | 50 | 185 | 320 | 373 | 490 | 1,418 |
| 1918 | 66 | 190 | 297 | 407 | 458 | 1,418 |
| 1919 | 150 | 272 | 411 | 620 | 482 | 1,935 |
Distinct Maoris convicted after arrest in 1919 numbered 485. The ages of these are given in the following table in combination with information as to class of offence:—
| AGES and OFFENCES of DISTINCT MAORIS convicted (ARRESTS only), 1919. | |||||||
|---|---|---|---|---|---|---|---|
| Offences against | Under 20. | 20 and under 25. | 25 and under 30. | 30 and under 40. | 40 and over. | Unspecified. | Totals. |
| The person | 1 | 20 | 12 | 5 | 3 | 4 | 45 |
| Property | 46 | 34 | 13 | 8 | 5 | 5 | 111 |
| Good order | 27 | 69 | 57 | 50 | 101 | 14 | 318 |
| Other offences | 1 | 2 | 4 | 1 | 2 | 1 | 11 |
| Totals | 75 | 125 | 86 | 64 | 111 | 24 | 485 |
The number of Maoris convicted in the higher Courts in 1919 was 42, including 18 who had been committed for sentence by the lower Courts.
The following table gives for the year 1919 the prison accommodation, the number of prisoners received, the number in prison at end of year, and the daily average number in confinement:—
| Name of Prison. | Number for whom there is Accommodation. | Number received during Year. | Number in Confinement at End of Year. | Daily Average Number in Confinement. |
|---|---|---|---|---|
| Auckland | 311 | 959 | 209 | 222.46 |
| Kaingaroa | 62 | 36 | 35 | 44.94 |
| Waikeria | 133 | 92 | 86 | 110.30 |
| New Plymouth | 58 | 65 | 51 | 47.95 |
| Roto-aira | 53 | 59 | 47 | 42.62 |
| Napier | 74 | 171 | 11 | 17.43 |
| Wellington | 225 | 1,058 | 121 | 126.84 |
| Wi Tako | 27 | 28 | 23 | 19.68 |
| Addington | 35 | 50 | 36 | 38.95 |
| Lyttelton | 105 | 369 | 9 | 24.89 |
| Paparua | 181 | 149 | 98 | 117.02 |
| Invercargill | 167 | 145 | 165 | 160.79 |
| Minor prisons | 191 | 835 | 29 | 30.47 |
| Totals | 1,622 | 4,016 | 920 | 1004.34 |
The total number of prisoners received in the different gaols during the year 1919 was 4,016 (males 3,731, females 285), as compared with 3,807 (males 3,517, females 290) in 1917, counting each admission as a distinct person.
Omitting those received by transfer from another prison, 809 (males 784, females 25), the debtors and lunatics received, 68 (males 63, females 5), and duplicate receptions of the same prisoner on the same charge, 57 (males 55, females 2), it is found that the total receptions for criminal offences during 1919 were 3,122 (males 2,867, females 255). In this total are included 40 persons (males 38, females 2) on remand or awaiting sentence from the year 1918.
The number of prisoners in gaol (including Maoris) at the end of each of the past five years, and the proportion per 10,000 of population as at the 31st December, is given in the next table:—
| PRISONERS in GAOL (31st DECEMBER). | |||||
|---|---|---|---|---|---|
| Year. | Number of Prisoners. | Proportion per 10,000 of Population. | |||
| Undergoing Sentence. | On Remand and awaiting Trial, &. | Total. | Undergoing Sentence. | Total in Confinement | |
| 1915 | 941 | 57 | 998 | 8.53 | 9.05 |
| 1916 | 836 | 54 | 890 | 7.60 | 8.09 |
| 1917 | 954 | 53 | 1,007 | 8.32 | 8.78 |
| 1918 | 1,005 | 42 | 1,047 | 8.68 | 9.04 |
| 1919 | 852 | 68 | 920 | 7.02 | 7.58 |
The actual number of distinct convicted prisoners received in the various gaols during the year 1919 (excluding Maoris) was 1,725.
These figures do not include children committed to the industrial schools simply on the ground that they are neglected or destitute.
In classifying the offences a prisoner convicted of more than one offence during the year is reckoned once only, under the heading of the principal offence. Debtors and lunatics received into gaol are omitted.
| AGES and OFFENCES of DISTINCT CONVICTED PRISONERS (excluding MAORIS) received into PRISON during 1919. | ||||||||
|---|---|---|---|---|---|---|---|---|
| Age, in Years. | Offences against the Person. | Theft and other Offences against Property. | Offences not included previously. | Totals. | ||||
| Sexual Offences. | Assaults. | Other. | Vagrancy. | Drunkenness. | Other. | |||
| Under 21 | 7 | 8 | 91 | 8 | 31 | 145 | ||
| 21 and under 25 | 2 | 10 | 1 | 70 | 3 | 10 | 61 | 157 |
| 25 and under 30 | 5 | 19 | 3 | 68 | 4 | 8 | 89 | 196 |
| 30 and under 35 | 4 | 18 | 2 | 65 | 19 | 21 | 110 | 239 |
| 35 and under 40 | 9 | 15 | 3 | 77 | 23 | 46 | 105 | 278 |
| 40 and under 45 | 5 | 10 | 44 | 22 | 43 | 80 | 204 | |
| 45 and under 50 | 6 | 4 | 1 | 34 | 27 | 43 | 74 | 189 |
| 50 and under 55 | 4 | 2 | 21 | 20 | 37 | 40 | 124 | |
| 55 and under 60 | 4 | 2 | 1 | 8 | 10 | 24 | 26 | 75 |
| 60 and under 65 | 2 | 5 | 8 | 23 | 23 | 61 | ||
| 65 and over | 3 | 1 | 5 | 17 | 15 | 14 | 55 | |
| Not stated | 1 | 1 | 2 | |||||
| Totals | 51 | 89 | 11 | 489 | 162 | 270 | 653 | 1,725 |
Out of these 1,725 prisoners, 723 had not suffered any previous conviction. The remaining 1,002 were apportioned—one previous conviction, 231; two, 130; three, 99; four, 67; five and over, 475.
It must be understood that the actual number of imprisonments was much in excess of the figures given above, as many persons were several times imprisoned either for offences differing in kind or for repetitions of the same offence.
Two hundred and twenty-six persons were placed on probation in the year 1919, as against 192 in 1918 and 127 in 1917.
Afforestation by prison labour is now carried on at one camp only—viz., at Kaingaroa, which is situated about 33 miles from Rotorua, on the Kaingaroa Plains. During the past year the camp has been largely used as a place of detention for military court-martialled prisoners, the greater part of the tree-planting work for the year having been carried out by them.
The number of trees planted in the neighbourhood of Kaingaroa for the year ended 31st March, 1919, was 1,418,975, while the total number of trees planted throughout the Dominion by prison labour since the inception of the afforestation scheme in 1901 is 39,797,475.
The total labour value of the prisoners’ work during the period since 1901 to March, 1919, as estimated by the Forestry Department, is £63,753.
For the purposes of the Crimes Amendment Act of 1910 there is constituted a Prisons Board, at present consisting of the Chief Justice as President, and six other members.
In the ten years that the Board has been in existence no fewer than 1,288 persons have been sentenced to reformative detention. Seventy-one per cent. of these were released on the Board's recommendation, while of those released some 83 per cent. are not known to have again offended.
Much less favourable are the statistics of habitual criminals, of whom there were 261 declared in the period dealt with. Eighty-four per cent. were released, but more than half (56 per cent.) of these relapsed into criminal ways.
The number of bodies on which inquests were held in 1919 was 1,456. The verdicts given at the inquests may be classified as under:—
| Nature of Verdict. | Inquests on Persons. | ||
|---|---|---|---|
| Males. | Females. | Totals. | |
| Disease and natural causes | 528 | 260 | 788 |
| Accident | 430 | 91 | 521 |
| Homicide | 4 | 1 | 5 |
| Suicide | 112 | 30 | 142 |
| 1,074 | 382 | 1,456 | |
Of the accidental deaths drowning is one of the most common forms. The verdicts show that 130 deaths were due to this cause, giving a percentage of 24.95 of the accidental deaths from all causes.
The inquests on suicidal deaths in 1919 show an increase on the number for the previous year. The figures for each of the past ten years were,—
| Year. | Inquests on Suicides. | Year. | Inquests on Suicides. | ||||
|---|---|---|---|---|---|---|---|
| Males. | Females. | Totals. | Males. | Females. | Totals. | ||
| 1910 | 90 | 16 | 106 | 1915 | 112 | 12 | 124 |
| 1911 | 109 | 25 | 134 | 1916 | 122 | 28 | 150 |
| 1912 | 111 | 15 | 126 | 1917 | 104 | 30 | 134 |
| 1913 | 118 | 33 | 151 | 1918 | 99 | 22 | 121 |
| 1914 | 116 | 27 | 143 | 1919 | 112 | 30 | 142 |
In case of fire causing the destruction of any building, ship, or merchandise, or any stack of grain, pulse, or hay, or any growing crop, a Coroner may hold an inquiry into the cause of such fire, the procedure being similar to that of inquests into cause of death.
The inquests on fires held during 1919 numbered nine. In one case the verdict was arson, in a second accident, and in the remaining seven cases no evidence was forthcoming.
The number of charges laid in the Magistrates’ Courts for breaches of the gaming laws, and the manner in which such charges were disposed of, are shown for five years in the table following. Maoris are not included.
| Year. | Number of Charges. | Discharged or dismissed. | Convictions recorded. |
|---|---|---|---|
| 1915 | 217 | 54 | 163 |
| 1916 | 286 | 60 | 226 |
| 1917 | 336 | 117 | 219 |
| 1918 | 278 | 73 | 205 |
| 1919 | 313 | 101 | 212 |
Table of Contents
LEGISLATIVE authority in New Zealand is centred in a Parliament of two Houses, the House of Representatives and the Legislative Council. The latter body has at present some thirty-seven members, who are appointed, with the exception of one life member, for a period of seven years. Provision is made by the Legislative Council Act, 1914, for the ultimate creation of an elective Upper Chamber, but the date on which the Act is to commence has yet to be fixed.
The House of Representatives is composed of seventy-six members for “European” electorates and four for Maori constituencies. With certain minor exceptions, any registered elector, male or female, is eligible for election. The franchise is a broad one, covering all male or female adults of British nationality by birth or by naturalization in New Zealand who have resided in the Dominion for a minimum of twelve months.
The normal life of Parliament is three years, but owing to extraordinary circumstances the duration of the last Parliament was extended to five. A general election was held in December, 1919: for Maori representatives on the 16th, for European representatives on the 17th. Dealing with the latter election only, it is found that out of a total roll number of 683,420 some 550,327 (80.53 per cent.) persons exercised their vote. A summary for the last five general elections is as follows:—
| Year of General Election. | Estimated Total Adult Persons. | Number on Rolls. | Proportion per Cent. of Adult Persons registered as Electors. | Number of Persons who voted. | Proportion per Cent. of Persons on Rolls who voted. |
|---|---|---|---|---|---|
*This excess of roll number over total population may be explained thus: The population quoted is the de facto population actually in the country; the roll number includes many soldiers still abroad. Further, many thousands of deceased soldiers and others had not been removed from the rolls owing to lack of proof of death. | |||||
| 1905 | 500,108 | 476,473 | 95.28 | 396,657 | 83.25 |
| 1908 | 538,950 | 537,003 | 99.64 | 428,648 | 79.82 |
| 1911 | 594,532 | 590,042 | 99.24 | 486,100 | 83.67 |
| 1914 | 641,768 | 616,043 | 95.99 | 521,525 | 84.66 |
| 1919 | 675,415 | 683,420* | * | 550,327 | 80.53 |
The relative interest in the poll evinced by males and females may be measured by the percentage of votes recorded to the number on the roll—viz., males 81.45 per cent., females 79.52 per cent.
Informal votes cast numbered 7,587, or 1.38 per cent. of all votes recorded.
Valid votes for successful candidates totalled 279,373 (51.47 per cent.); for defeated candidates. 263,367, or 48.53 per cent. A statement of the voting in individual electorates follows.
RESULT of GENERAL ELECTION, 1919.
| Electoral Districts and Names of Candidates. | Number of Votes recorded | Number of Electors on Roll. | Population at Census, 1916. |
|---|---|---|---|
| Bay of Islands— | |||
| Reed, V. H. | 3,066 | ||
| Jounneaux, St. C. | 1,871 | ||
| Informal | 56 | ||
| .. | 4,993 | 6,344 | 13,455 |
| Marsden— | |||
| Mander, F. | 2,307 | ||
| Murdoch, A. J. | 2,118 | ||
| McLean, D. A. | 850 | ||
| Curtis, A. H. | 604 | ||
| Informal | 108 | ||
| 5,987 | 7,606 | 14,229 | |
| Kaipara— | |||
| Coates, J. G. | 4,214 | ||
| Gregory, A. | 923 | ||
| Informal | 198 | ||
| 5,335 | 6,871 | 13,624 | |
| Waitemata— | |||
| Harris, A. | 4,911 | ||
| Greenslade, A. E. | 3,492 | ||
| Informaḷ̣ 119 | |||
| 8,522 | 10,211 | 17,002 | |
| Eden— | |||
| Parr, C.J. | 3,431 | ||
| McBrine, O. | 1,577 | ||
| Hornblow, R. E. | 1,500 | ||
| Informal | 93 | ||
| 6,601 | 7,888 | 14,637 | |
| Auckland East— | |||
| Myers, A. M. | 3,718 | ||
| McKenzie, C. N… | 3,560 | ||
| Way, R. F. | 1,756 | ||
| Informal | 146 | ||
| 9,180 | 10,959 | 17,013 | |
| Auckland Central— | |||
| Parry, W. E. | 4,007 | ||
| Glover, A. E. | 3,221 | ||
| Thomas, J. J. | 1,023 | ||
| Informal | 106 | ||
| 8,357 | 9,777 | 16,888 | |
| Auckland West— | |||
| Savage, M. J. | 4,008 | ||
| Bennett, F. | 3,475 | ||
| Entrican, A. J. | 1,493 | ||
| Informal | 83 | ||
| 9,059 | 10,599 | 17,366 | |
| Grey Lynn— | |||
| Bartram, F. N. | 3,141 | ||
| Melville, Miss E… | 2,660 | ||
| Fowlds, G. | 2,405 | ||
| Garmston, L. J. F. | 214 | ||
| Richardson, P. | 180 | ||
| Informal | 118 | ||
| 8,718 | 10,130 | 17,203 | |
| Roskill— | |||
| Potter, V. H. | 4,200 | ||
| Gunson, J. H. | 2,346 | ||
| Davis, G. | 1,998 | ||
| Peddle, F. W | 728 | ||
| Informal | 95 | ||
| 9,367 | 10,996 | 17,217 | |
| Parnell— | |||
| Dickson. J. S. | 5,706 | ||
| Bloodworth, T. | 2,287 | ||
| Baume, Mrs. R. L. | 1,026 | ||
| Informal | 110 | ||
| 9,129 | 11,985 | 16,911 | |
| Manukau— | |||
| Lang, F. W. | 4,182 | ||
| Mason, H. G. R… | 2,304 | ||
| Major. E. E. | 1,173 | ||
| Informal | 87 | ||
| 7,746 | 9,422 | 15,751 | |
| Franklin— | |||
| Massey, W. F. | 4,195 | ||
| Rea, J. | 1,165 | ||
| Piggott, E. | 637 | ||
| Informal | 134 | ||
| 6,131 | 7,815 | 13,419 | |
| Raglan— | |||
| Bollard, R. F. | 2,888 | ||
| Jordan, W. J. | 1,900 | ||
| Johnstone, C. | 756 | ||
| Informal | 64 | ||
| 5,608 | 7,214 | 12,998 | |
| Thames— | |||
| Rhodes, T. W. | 3,078 | ||
| McCormick, W. J. | 1,488 | ||
| Purtell, J. | 965 | ||
| Cooke, Mrs. A. A. M. | 72 | ||
| Long, T. | 56 | ||
| Informal | 75 | ||
| 5,734 | 6,807 | 13,779 | |
| Ohinemuri— | |||
| Poland, H. | 3,173 | ||
| Clark, J. | 2,618 | ||
| Informal | 52 | ||
| 5,843 | 7,431 | 14,134 | |
| Tauranga— | |||
| Herries, W. H. | 3,946 | ||
| Bobbins, B. C. | 2,086 | ||
| Informal | 118 | ||
| 6,150 | 9,019 | 12,988 | |
| Waikato— | |||
| Young, J. A | 4,869 | ||
| Watts, P. H. | 1,976 | ||
| Lafferty, C. | 766 | ||
| Informal | 121 | ||
| 7,732 | 10,019 | 14,912 | |
| Rotorua— | |||
| Hockly, F. F. | 3,258 | ||
| Carney, M. | 1,525 | ||
| Jones, G. T. | 854 | ||
| Hewitt, W. C. | 497 | ||
| Keegan, P. | 324 | ||
| Informal | 86 | ||
| 6,544 | 8,007 | 13,115 | |
| Bay of Plenty— | |||
| MacDonald, W.D.S. | 3,546 | ||
| Williams, K. S. | 2,312 | ||
| Informal | 66 | ||
| 5,924 | 8,436 | 13,281 | |
| Waitomo— | |||
| Jennings, W. T. | 2,906 | ||
| Wilson, K. C. | 2,529 | ||
| Elliott, G. | 332 | ||
| Informal | 159 | ||
| 5,926 | 7,546 | 13,407 | |
| Gisborne— | |||
| Lysnar, W. D. | 3,041 | ||
| Carroll, J. | 2,668 | ||
| Brindle, T. | 2,312 | ||
| Informal | 114 | ||
| 8,135 | 11,678 | 15,881 | |
| Hawke's Bay— | |||
| Campbell, H. M… | 3,234 | ||
| McKay, G. | 2,292 | ||
| Chapman, C. H… | 2,176 | ||
| Informal | 86 | ||
| 7,788 | 10,675 | 15,480 | |
| Napier— | |||
| Brown, J. V. | 2,763 | ||
| Evans, F. C. | 2,709 | ||
| Hill, H. | 2,562 | ||
| Informal | 161 | ||
| 8,195 | 10,084 | 16,623 | |
| Waipawa— | |||
| Hunter, G. | 3,458 | ||
| Jull, A. E. | 3,184 | ||
| Informal | 72 | ||
| 6,714 | 7,884 | 13,721 | |
| Pahiatua— | |||
| McNicol, A. | 2,775 | ||
| Ross, R. B. | 2,603 | ||
| Rice, R. S. L. | 1,142 | ||
| Informal | 51 | ||
| 6,571 | 7,900 | 14,325 | |
| Masterton— | |||
| Sykes, G. R. | 2,444 | ||
| Holms, A. C. | 2,106 | ||
| McLeod, A. | 1,730 | ||
| Matheson, W. B. | 791 | ||
| Informal | 43 | ||
| 7,108 | 8,238 | 14,653 | |
| Wairarapa— | |||
| McLeod, A. D. | 3,266 | ||
| Hornsby, J. T. M. | 2,726 | ||
| Danahey, C. J. | 199 | ||
| Informal | 102 | ||
| 6,293 | 7,634 | 12,957 | |
| Stratford— | |||
| Masters, R. | 3,118 | ||
| Hine, J. B. | 3,057 | ||
| Informal | 50 | ||
| 6,225 | 7,302 | 13,663 | |
| Taranaki— | |||
| Smith, S. G. | 4,287 | ||
| Buckeridge, G. H. | 3,264 | ||
| Informal | 79 | ||
| 7,630 | 8,651 | 14,959 | |
| Egmont— | |||
| Hawken, O. J. | 3,123 | ||
| Astbury, D. L. A. | 2,932 | ||
| Informal | 49 | ||
| 6,104 | 7,478 | 13,043 | |
| Patea— | |||
| Powdrell, W.D. | 3,276 | ||
| Morrison, W. | 3,021 | ||
| Fitzherbert, P. B. | 458 | ||
| Pearce, G. V. | 144 | ||
| Informal | 154 | ||
| 7,053 | 8,892 | 13,738 | |
| Wanganui— | |||
| Veitch, W. A. | 4,340 | ||
| Cuttle, W. J. | 2,637 | ||
| McIlvride, L. | 1,266 | ||
| Informal | 77 | ||
| 8,320 | 10,503 | 15,712 | |
| Waimarino— | |||
| Smith, R. W. | 3,116 | ||
| Langstone, F. | 2,473 | ||
| Informal | 79 | ||
| 5,668 | 7,506 | 13,014 | |
| Oroua— | |||
| Guthrie, D. H. | 3,891 | ||
| Tunnicliffe, E. J. | 2,048 | ||
| Informal | 191 | ||
| 6,130 | 7,841 | 13,843 | |
| Manawatu— | |||
| Newman, E. | 3,025 | ||
| Hillier, A. C. | 2,159 | ||
| Informal | 68 | ||
| 5,52 | 6,622 | 12,973 | |
| Rangitikei— | |||
| Glenn, W. S. | 2,903 | ||
| Brady, F. P. | 2,268 | ||
| Meldrum, W. | 1,655 | ||
| Informal | 75 | ||
| 6,901 | 9,054 | 14,393 | |
| Palmerston— | |||
| Nash, J. A. | 4,617 | ||
| Ayrton, M. | 3,613 | ||
| Informal | 173 | ||
| 8,403 | 10,536 | 16,078 | |
| Otaki— | |||
| Field, W. H. | 2,820 | ||
| McKenzie, J. | 1,588 | ||
| MacDonald, E. | 407 | ||
| Isherwood, A. J. R. | 198 | ||
| Informal | 146 | ||
| 5,159 | 6,578 | 13,373 | |
| Hutt— | |||
| Wilford, T. M. | 3,422 | ||
| Pritchard, D. K. | 2,417 | ||
| Rishworth, E. P. | 2,319 | ||
| Informal | 68 | ||
| 8,226 | 9,983 | 16,247 | |
| Wellington North— | |||
| Luke, J. P. | 3,999 | ||
| Browne, H. O. | 2,934 | ||
| Read, J. | 2,345 | ||
| Informal | 86 | ||
| 9,364 | 11,954 | 17,159 | |
| Wellington Central— | |||
| Fraser, P. | 4,486 | ||
| Pirani, F. | 3,430 | ||
| Informal | 146 | ||
| 8,062 | 10,551 | 17,255 | |
| Wellington East— | |||
| Newman, A. K. | 4,375 | ||
| Monteith. A. L. | 3,317 | ||
| McKenzie, L. S. W. | 2,441 | ||
| Informal | 94 | ||
| 10,227 | 12,705 | 17,113 | |
| Wellington South— | |||
| Mitchell, G. | 4,801 | ||
| Semple, R. | 3,375 | ||
| Informal | 103 | ||
| 8,27 | 10,122 | 17,330 | |
| Wellington Suburbs— | |||
| Wright, R. A. | 4,091 | ||
| Croskery, A. W. | 2,964 | ||
| Sloane, A. D. | 2,073 | ||
| Informal | 105 | ||
| 9,233 | 11,595 | 17,239 | |
| Nelson— | |||
| Atmore, H. | 3,412 | ||
| Field, T. A. H. | 2,902 | ||
| Price, J. G. | 1,079 | ||
| Informal | 83 | ||
| 7,476 | 8,701 | 15,759 | |
| Motueka— | |||
| Hudson, R. P. | 2,456 | ||
| Power, W. P. | 1,795 | ||
| Lomax, P. B. | 1,255 | ||
| Informal | 46 | ||
| 5,552 | 7,350 | 13.630 | |
| Buller— | |||
| Holland, H. E. | 3,545 | ||
| O'Brien, D. Q. | 2,542 | ||
| Informal | 56 | ||
| 6,143 | 7,298 | 14,528 | |
| Westland— | |||
| Seddon, T. E. Y | 4,201 | ||
| O'Brien, J. | 2,704 | ||
| Informal | 85 | ||
| 6,990 | 8,311 | 15,321 | |
| Wairau— | |||
| McCallum, R. | 2,152 | ||
| Cooke, B. J. | 1,656 | ||
| Corry, J. J. | 1,430 | ||
| Penny, E. H. | 1,348 | ||
| Informal | 35 | ||
| 6,921 | 7,919 | 14,352 | |
| Hurunui— | |||
| Forbes, G. W. J | 3,008 | ||
| Armstrong, J. G. | 2,341 | ||
| Gardner, G. G. | 373 | ||
| Informal | 50 | ||
| 5,772 | 7,147 | 13,173 | |
| Kaiapoi— | |||
| Jones, D. | 2,580 | ||
| Buddo, D. | 2,530 | ||
| Williams, C. M. | 1,521 | ||
| Informal | 71 | ||
| 6,702 | 7,998 | 14,038 | |
| Christchurch North— | |||
| Isitt, L. M. | 6,033 | ||
| Armstrong, H. T. | 3,600 | ||
| Informal | 313 | ||
| 9,946 | 12,104 | 17,132 | |
| Christchurch East— | |||
| Thacker, H. T. J. | 5,572 | ||
| Hunter, H. | 3,632 | ||
| Informal | 216 | ||
| 9,420 | 11,666 | 17,122 | |
| Christchurch South— | |||
| Howard, E. J. | 5,088 | ||
| Holland, H. | 3,413 | ||
| Informal | 213 | ||
| 8,714 | 11,595 | 17,114 | |
| Riccarton— | |||
| Witty, G. | 2,948 | ||
| Devereaux, W. R. | 2,322 | ||
| Robertson, J. | 1,966 | ||
| Informal | 89 | ||
| 7,325 | 8,621 | 15,771 | |
| Avon— | |||
| Sullivan, D. G. | 5,168 | ||
| Russell, G. W. | 3,520 | ||
| Carl, J. L. | 218 | ||
| Informal | 205 | ||
| 9,111 | 11,137 | 17,176 | |
| Lyttelton— | |||
| McCombs, J. | 2,999 | ||
| MacCartney, R. | 2,422 | ||
| Lester, W. T. | 1,277 | ||
| Ell, H. G. | 585 | ||
| Informal | 147 | ||
| 7,430 | 8,908 | 15,957 | |
| Ellesmere— | |||
| Rhodes, R. H. | 3,582 | ||
| Barclay, G. | 2,833 | ||
| Informal | 74 | ||
| 6,489 | 8,577 | 13,913 | |
| Ashburton— | |||
| Nosworthy, W. | 4,056 | ||
| Dickie, W. J. | 2,563 | ||
| Jones, H. M. | 290 | ||
| Informal | 42 | ||
| 6,951 | 8,119 | 14,282 | |
| Timaru— | |||
| Craigie, J. | 4,717 | ||
| Vinnell, P. C. | 3,198 | ||
| Informal | 163 | ||
| 8,078 | 10,243 | 16,258 | |
| Temuka— | |||
| Burnett, T. G. | 3,294 | ||
| Talbot, C. J. | 3,263 | ||
| Informal | 53 | ||
| 6,610 | 8,142 | 13,638 | |
| Waitaki— | |||
| Pitchener, J. | 2,550 | ||
| Anstey, J. | 2,078 | ||
| Paul, W. G. | 1,665 | ||
| Informal | 55 | ||
| 6,348 | 7,595 | 13,770 | |
| Oamaru— | |||
| Lee, E. P. | 3,819 | ||
| MacPherson, J. A. | 3,543 | ||
| Informal | 53 | ||
| 7,415 | 8,553 | 14,967 | |
| Dunedin North— | |||
| Kellett, E. | 4,784 | ||
| Walker, A. | 3,978 | ||
| Informal | 119 | ||
| 8,881 | 11,199 | 17,252 | |
| Dunedin West— | |||
| Stewart, W. D. | 5,712 | ||
| Brown, J. A. | 3,291 | ||
| Informal | 122 | ||
| 9,125 | 12,233 | 17,035 | |
| Dunedin Central— | |||
| Statham, C. E. | 4,769 | ||
| Munro, J. W. | 4,272 | ||
| Informal | 90 | ||
| 9,131 | 11,736 | 17,136 | |
| Dunedin South— | |||
| Sidey, T. K. | 4,395 | ||
| Paul, T. | 4,311 | ||
| Informal | 123 | ||
| 8,829 | 10,333 | 16,944 | |
| Chalmers— | |||
| Dickson, J. Mc. | 2,693 | ||
| Gilchrist, J. | 1,810 | ||
| Colquhoun, D. | 1,382 | ||
| Informal | 70 | ||
| 5,955 | 7,248 | 14,400 | |
| Bruce— | |||
| Allen, J. | 2,993 | ||
| Edit. J. | 2,867 | ||
| Informal | 71 | ||
| 5,931 | 7,395 | 13,224 | |
| Clutha— | |||
| Malcolm, A. S. | 2,257 | ||
| Rodger, R. A. | 2,123 | ||
| Maslin, W. S. | 1,190 | ||
| Christie, J. | 143 | ||
| Informal | 49 | ||
| 5,762 | 6,869 | 12,949 | |
| Wakatipu— | |||
| Horn, J. | 3,062 | ||
| Scott, R. | 2,261 | ||
| Ashworth, A. | 879 | ||
| Informal | 47 | ||
| 6,249 | 8,010 | 13,563 | |
| Mataura— | |||
| Anderson, G. J. | 3,042 | ||
| McDougall, D. | 1,706 | ||
| McLachlan, A. | 848 | ||
| McIntyre, N. | 181 | ||
| Informal | 50 | ||
| 5,887 | 7,123 | 13,766 | |
| Wallace— | |||
| Hamilton, A. | 2,843 | ||
| Thomson, J. C. | 2,800 | ||
| Informal | 58 | ||
| 5,701 | 6,891 | 13,535 | |
| Invercargill— | |||
| Hanan, J. A. | 4,758 | ||
| Archer, J. K. | 3,355 | ||
| Informal | 93 | ||
| 8,206 | 10,414 | 16,995 | |
| Awarua— | |||
| Hamilton. J. R. | 3,164 | ||
| Ward, J. G. | 2,407 | ||
| Informal | 80 | ||
| 5,651 | 6,937 | 13,280 | |
The Maori population at the census of October, 1916, amounted to 49,776 persons. With four representatives in Parliament, their ratio of representation is one to every 12,444 persons, compared with one to every 14,466 persons for European electorates at the same date, excluding absent soldiers, &. Polling in each district was as under:—
| Electoral Districts and Names of Candidates. | Number of Votes recorded. |
|---|---|
| *Elected unopposed. | |
| Northern Maori— | |
| Tau Henarẹ̣̣̣ | 2,665 |
| Nau Paraone Kawitị̣ | 1,036 |
| Anaru Ngawakạ̣ | 135 |
| Aperahana Reupene Tuoro | 71 |
| Wiri Henarẹ̣̣̣ | 32 |
| Informaḷ̣̣̣ | 44 |
| Totaḷ̣̣̣ | 3,983 |
| Southern Maori— | |
| John Hopere Wharewiti | 376 |
| Uru | |
| Riki te Mairaki Taiaroa | 16 |
| Teone Matapura Erihana | 97 |
| Hoani Matiụ̣̣̣ | 46 |
| Informaḷ̣ ̣̣ ̣̣ | Informaḷ̣ ̣̣ |
| Total | 688 |
| Eastern Maori— | |
| Apirana Turupu Ngata | * |
| Western Maori— | |
| Maui Pomarẹ̣̣ | 2,669 |
| Ngarangi Katitiạ̣ | 1,245 |
| Tanea Kaawe Shorṭ̣ | 567 |
| Tuwhakaririka Patena. | 536 |
| Henare Kaihaụ̣ | 215 |
| Taiwiwi Tukimana te | 212 |
| Taniwha | |
| Tema Pouwharetapu | 45 |
| Keawene | 44 |
| Keritoke te Ahụ̣ | 35 |
| Otene Paorạ̣̣̣ | 24 |
| Eruera Pohipi Chasẹ̣ | 12 |
| Kipi te Whatanui ̣̣ | 72 |
| Total | 5,675 |
Since the general election, by-elections have been held in three electorates —viz., Bruce (14th April, 1920), Stratford (6th May, 1920), and Bay of Plenty (30th September, 1920). The first was necessitated by the resignation of Sir James Allen, K.C.B., the second by the invalidation of the previous election owing to irregularities, and the third by the death of the Hon. W. D. S. Macdonald. The results were—
| Bruce— | Stratford— | Bay of Plenty— | |||
|---|---|---|---|---|---|
| Edie, J. | 2,421 | Masters, R. | 3,394 | Williams, K. S. | 2,341 |
| Begg, J. C. | 2,297 | Hine, J. B. | 3,246 | Lysnar, F. | 1,735 |
| Informal | 16 | Informal | 24 | Informal | 5 |
| Total | 4,734 | Total | 6,664 | Total | 4,081 |
| (Number on roll, 7,406.) | (Number on roll, 7,640.) | (Number on roll, 5,765.) | |||
Table of Contents
DURING the year ended the 31st March, 1919, 1,667 licenses for the sale of intoxicating liquors were granted. Of these, 1,156 were publicans’ and accommodation licenses, 42 New Zealand wine, 52 packet, 136 wholesale, and 281 conditional licenses. The fees paid amounted to £39,817, and formed part of the revenue of the local governing bodies of the districts in which the licenses were issued. Particulars are given in the following table:—
| NUMBER of LICENSES granted during the YEAR 1918–19, and the AMOUNT of FEES paid to LOCAL BODIES therefor. | ||||
|---|---|---|---|---|
| Licenses. | In Counties. | In Boroughs. | In Town Districts. | Total. |
| Publicans’ licenses | 333 | 594 | 41 | 968 |
| Accommodation licenses | 174 | 12 | 2 | 188 |
| Total licensed houses | 507 | 606 | 43 | 1,156 |
| New Zealand wine licenses | 30 | 12 | 42 | |
| Packet licenses | 11 | 41 | 52 | |
| Wholesale licenses | 3 | 131 | 2 | 136 |
| Conditional licenses | 158 | 122 | 1 | 281 |
| Total licenses granted | 709 | 912 | 46 | 1,667 |
| Amount of license fees paid to local bodies | £10,665 | £27,452 | £1,700 | £39,817 |
The number of publicans’ and accommodation licenses granted in counties, boroughs, and independent town districts during each of the past ten years is here given, together with the total amount of fees paid for all licenses for the sale of intoxicating liquor:—
| Year ended 31st March. | Counties. | Boroughs. | Town Districts. | Total. | Total Fees, All Licenses. |
|---|---|---|---|---|---|
| £ | |||||
| 1910 | 643 | 580 | 34 | 1,257 | 44,900 |
| 1911 | 630 | 582 | 36 | 1,248 | 43,843 |
| 1912 | 617 | 590 | 28 | 1,235 | 42,572 |
| 1913 | 594 | 592 | 32 | 1,218 | 42,456 |
| 1914 | 578 | 598 | 42 | 1,218 | 42,283 |
| 1915 | 564 | 596 | 47 | 1,207 | 41,769 |
| 1916 | 557 | 598 | 44 | 1,199 | 42,978 |
| 1917 | 536 | 598 | 49 | 1,183 | 46,164 |
| 1918 | 540 | 598 | 46 | 1,184 | 41,208 |
| 1919 | 507 | 606 | 43 | 1,156 | 39,817 |
The average number of persons to each licensed house in counties, boroughs, and independent town districts respectively for 1918–19 is next shown:—
| Number of Licensed Houses.* | Mean Population, 1918–19, excluding Maoris. | Number of Persons to each Licensed House. | |
|---|---|---|---|
*I.e., houses holding publicans’ or accommodation licenses. | |||
| Counties | 507 | 494,304 | 975 |
| Boroughs | 606 | 591,478 | 976 |
| Town districts | 43 | 28,924 | 673 |
| Totals | 1,156 | 1,114,706 | 964 |
That the proportion of licensed houses to population has declined steadily in the last decade is evidenced by the following figures:—
| Year ended 31st March. | Average Persons to a Licensed House. |
|---|---|
| 1910 | 732 |
| 1911 | 803 |
| 1912 | 824 |
| 1913 | 852 |
| 1914 | 895 |
| 1915 | 911 |
| 1916 | 920 |
| 1917 | 918 |
| 1918 | 946 |
| 1919 | 964 |
The annual fees payable for licenses are,—
For a publican's license— £
Within the limits of a borough or town district 40
Outside the aforesaid limits 25
For a New Zealand wine license 1
For an accommodation license, a sum to be determined by the Licensing Committee, not exceeding 20
For a packet license—
For a vessel exceeding 50 tons register 10
For a vessel not exceeding 50 tons register 5
For a wholesale license 20
For a conditional license, according to duration of license, a sum not exceeding 30
The approximate capital value of the licensed houses in the counties for the year ended 31st March, 1919, was stated at £690,491, in certain of the boroughs at £1,687,443, and in the town districts at £127,721. There was, besides, an annual value of £122,210 for other licensed houses in the boroughs, which, capitalized at 6 per cent., would represent £2,036,833. The capital value of all licensed houses may therefore be put down at approximately £4,542,488. Caution should be exercised in this connection, as some of the valuation on which the above total is based are by no means recent, revaluations having been delayed by the war. It is probable that the capital value was at the 31st March, 1919, somewhat above the figure quoted.
The results of the special licensing poll of the 10th April, 1919, held under the authority of the Licensing Amendment Act, 1918, were as follows:—
| Votes. | |
|---|---|
| For national continuance | 264,189 |
| For national prohibition with compensation | 253,827 |
Under the provisions of the Licensing Amendment Act, 1918, three issues were submitted on the 17th December, 1919. The final figures are—
| Votes. | |
|---|---|
| For national continuance | 241,251 |
| For State purchase and control | 32,261 |
| For national prohibition | 270,250 |
None of the three issues secured the minimum of more than half of the total valid votes east. Voting in each licensing district was as under:—
| District. | For National Continuance. | For State Purchase and Control. | For National Prohibition. |
|---|---|---|---|
| Bay of Islandṣ̣ | 2,205 | 300 | 2,631 |
| Marsdeṇ̣̣̣ | 2,130 | 316 | 3,476 |
| Kaiparạ̣̣̣ | 2,262 | 332 | 2,708 |
| Waitematạ̣ | 3,224 | 426 | 4,720 |
| Edeṇ̣̣̣ | 2,465 | 306 | 3,720 |
| Aucklanḍ̣ | 13,410 | 1,161 | 11,629 |
| Grey Lynṇ̣ | 3,350 | 325 | 4,835 |
| Roskilḷ̣̣̣ | 2,633 | 379 | 6,214 |
| Parnelḷ̣̣̣ | 3,324 | 458 | 5,221 |
| Manukaụ̣̣ | 3,046 | 339 | 4,198 |
| Frankliṇ̣̣̣ | 2,296 | 326 | 3,395 |
| Raglaṇ̣̣̣ | 2,331 | 487 | 2,719 |
| Thameṣ̣̣̣ | 2,356 | 336 | 2,971 |
| Ohinemurị̣ | 2,263 | 757 | 2,651 |
| Taurangạ̣ | 2,619 | 483 | 3,120 |
| Waikatọ̣̣̣ | 2,886 | 362 | 4,375 |
| Rotoruạ̣̣̣ | 2,945 | 541 | 3,081 |
| Bay of Plentỵ̣ | 2,914 | 485 | 2,489 |
| Waitomọ̣ | 2,933 | 491 | 2,372 |
| Gisbornẹ̣ | 3,459 | 724 | 3,840 |
| Hawke's Baỵ̣ | 3,581 | 542 | 3,532 |
| Napieṛ̣̣̣ | 3,645 | 644 | 3,733 |
| Waipawạ̣̣ | 3,025 | 471 | 3,099 |
| Pahiatuạ̣ | 2,984 | 288 | 3,223 |
| Mastertoṇ̣ | 3,097 | 471 | 3,375 |
| Wairarapạ̣ | 3,035 | 341 | 2,842 |
| Stratforḍ̣ | 2,348 | 207 | 3,574 |
| Taranakị̣ | 2,780 | 320 | 4,407 |
| Egmonṭ̣̣̣ | 2,638 | 214 | 3,133 |
| Pateạ̣̣̣ | 2,967 | 234 | 3,776 |
| Wanganuị̣ | 3,739 | 325 | 4,167 |
| Waimarinọ̣ | 3,339 | 479 | 1,771 |
| Orouạ̣̣̣ | 2,577 | 248 | 3,229 |
| Rangitikeị̣ | 3,109 | 385 | 3,345 |
| Manawatụ̣ | 2,364 | 266 | 2,539 |
| Palmerstoṇ̣ | 3,584 | 352 | 4,376 |
| Otakị̣̣̣ | 2,360 | 418 | 2,300 |
| Hutṭ̣̣̣ | 3,842 | 574 | 3,717 |
| Wellingtoṇ̣ | 13,702 | 2,240 | 11,295 |
| Wellington Soutḥ̣ | 3,633 | 583 | 3,851 |
| Wellington Suburbs | 3,651 | 877 | 4,555 |
| Nelsoṇ̣̣̣ | 3,199 | 694 | 3,480 |
| Motuekạ̣̣̣ | 2,771 | 499 | 2,210 |
| Bulleṛ̣̣̣ | 2,815 | 393 | 2,812 |
| Westlanḍ̣ | 3,901 | 490 | 2,468 |
| Wairaụ̣̣̣ | 3,451 | 288 | 3,110 |
| Hurunuị̣̣̣ | 2,961 | 321 | 2,439 |
| Kaiapoị̣̣̣ | 3,060 | 269 | 3,275 |
| Christchurcḥ̣ | 12,152 | 1,747 | 13,752 |
| Riccartoṇ̣ | 3,121 | 411 | 3,704 |
| Avoṇ̣̣̣ | 3,676 | 555 | 4,790 |
| Lytteltoṇ̣ | 3,078 | 486 | 3,770 |
| Ellesmerẹ̣ | 3,258 | 302 | 2,818 |
| Ashburtoṇ̣ | 3,396 | 372 | 3,023 |
| Timarụ̣̣̣ | 3,343 | 355 | 4,241 |
| Temukạ̣̣̣ | 3,090 | 403 | 3,032 |
| Waitakị̣̣̣ | 2,881 | 250 | 3,123 |
| Oamarụ̣̣̣ | 3,036 | 354 | 3,806 |
| Dunediṇ̣̣̣ | 11,377 | 916 | 14,430 |
| Dunedin Soutḥ̣ | 3,646 | 293 | 4,759 |
| Chalmerṣ̣ | 2,399 | 146 | 3,294 |
| Brucẹ̣̣̣ | 2,619 | 291 | 2,894 |
| Cluthạ̣̣̣ | 2,367 | 222 | 3,073 |
| Wakatipụ̣ | 3,285 | 304 | 2,577 |
| Mataurạ̣̣̣ | 2,89 | 331 | 3,097 |
| Wallacẹ̣̣̣ | 2,740 | 248 | 2,596 |
| Invercargilḷ̣ | 2,986 | 674 | 4,319 |
| Awaruạ̣̣̣ | 2,416 | 255 | 2,876 |
| Totalṣ̣ | 240,364 | 31,682 | 269.972 |
| Number of Valid Votes recorded by Members of Expeditionary Force. | |||
| Englanḍ̣̣̣ | 148 | 230 | 35 |
| Samoa | 34 | 18 | 16 |
| On board troopships | 705 | 331 | 227 |
| Totals | 887 | 579 | 278 |
| Grand totalṣ̣ | 241,251 | 32,261 | 270,250 |
| Grand totalṣ̣ | 241,251 | 32,261 | 270,250 |
In the thirteen no-license districts an additional issue was submitted—viz., local restoration. Local prohibition was maintained in all districts.
| NO-LICENSE DISTRICTS. | |||||
|---|---|---|---|---|---|
| District. | Number of Electors on Effective Roll. | License to be restored. | License be not restored. | Number of Valid Votes recorded. | Result. |
| Eden | 7,888 | 2,440 | 3,864 | 6,304 | Restoration not carried. |
| Grey Lynn | 10,130 | 3,244 | 5,067 | 8,311 | Restoration not carried. |
| Roskill | 10,996 | 2,525 | 6,330 | 8,855 | Restoration not carried. |
| Ohinemuri | 7,431 | 3,058 | 2,559 | 5,617 | Restoration not carried. |
| Masterton | 8,238 | 3,261 | 3,610 | 6,871 | Restoration not carried. |
| Wellington South | 10,122 | 3,812 | 4,100 | 7,912 | Restoration not carried. |
| Wellington Suburbs | 11,595 | 3,747 | 5,062 | 8,809 | Restoration not carried. |
| Ashburton | 8,119 | 3,646 | 3,157 | 6,803 | Restoration not carried. |
| Oamaru | 8,553 | 3,181 | 3,989 | 7,170 | Restoration not carried. |
| Bruce | 7,395 | 2,576 | 3,170 | 5,746 | Restoration not carried. |
| Clutha | 6,869 | 2,387 | 3,191 | 5,578 | Restoration not carried. |
| Mataura | 7,123 | 2,456 | 3,149 | 5,605 | Restoration not carried. |
| Invercargill | 10,414 | 3,565 | 4,409 | 7,974 | Restoration not carried. |
| Totals | 114,873 | 39,898 | 51,657 | 91,555 | |
Table of Contents
ON the 31st March, 1919, the boroughs numbered 118 and the counties 126. There were, moreover, 94 road districts (including two without Boards) in existence at the close of March, 1919, and 36 independent and 31 non-independent town districts. Besides the above there were 42 river-protective districts, 3 city and suburban drainage districts (Christchurch, Dunedin, and Auckland), 7 water-supply districts, 55 land-drainage districts under the Land Drainage Act, 2 tramway districts, and 1 local railway district. The Harbour Boards numbered 36, excluding 10 cases where some other local authority acts as Harbour Board.
Local governing bodies levied rates in the financial year 1918–19 to the amount of £2,939,606, of which £2,028,151 consisted of general rates and £911,455 special and separate rates. The sum of £87,125 was raised by licenses, and £112,241 by other taxes, making £3,138,972 altogether, which sum is equivalent to £2 16s. 11d. per head of the mean European population. In the year 1917–18 the local taxation was £2 12s. per head, or 4s, 11d. less than in 1918–19.
The receipts of local governing bodies, divided into the various groups shown above, are given for each of the past ten years.
| Financial Year. | Revenue from | Receipts not Revenue. | Total Receipts. | |||
|---|---|---|---|---|---|---|
| Rates. | Licenses, Fees, Rents, and other Sources. | Government. | Total Revenue. | |||
| £ | £ | £ | £ | £ | £ | |
| 1914–15 | 2,140,086 | 2,622,221 | 239,076 | 5,001,383 | 2,595,706 | 7,597,089 |
| 1915–16 | 2,355,155 | 2,705,562 | 262,083 | 5,322,800 | 2,469,275 | 7,792,075 |
| 1916–17 | 2,534,539 | 3,001,324 | 242,618 | 5,778,481 | 1,411,422 | 7,189,903 |
| 1917–18 | 2,674,541 | 3,034,894 | 248,855 | 5,958,290 | 1,250,047 | 7,208,337 |
| 1918–19 | 2,939,606 | 3,184,741 | 267,330 | 6,391,677 | 942,780 | 7,334,457 |
The figures given in this and following tables are for the year ended 31st March, except in the case of certain Harbour Boards whose own financial year is taken in each case. A summary of receipts for the year 1918–19 is given below.
The total revenue of the local bodies for the financial year was £6,391,677, and they further received a sum of £942,780 which could not properly be termed “revenue,” making altogether a grand total of receipts amounting to £7,334,457. The rates formed 45.99 per cent. of the revenue proper; licenses, rents, and other sources yielded 49.83 per cent.; and 4.18 per cent. was granted by the General Government.
| LOCAL GOVERNING BODIES.—RECEIPTS, 1918–19. | ||||||
|---|---|---|---|---|---|---|
| Local Districts. | Revenue from | Receipts not Revenue. | Total Receipts | |||
| Rates. | Licenses, Rents, &. | Government. | County. | |||
| £ | £ | £ | £ | £ | £ | |
| Counties | 1,175,752 | 121,836 | 192,735 | 344,241 | 1,834,564 | |
| Boroughs | 1,346,634 | 1,979,880 | 44,529 | 401,178 | 3,772,221 | |
| Town districts | 55,056 | 32,780 | 4,075 | 178 | 17,195 | 109,284 |
| Road districts | 94,956 | 12,458 | 14,205 | 1,642 | 24,427 | 147,688 |
| River districts | 17,174 | 12,941 | 13 | 4,073 | 34,201 | |
| Land-drainage districts | 28,272 | 1,800 | 28,758 | 58,830 | ||
| Water-supply districts … | 726 | 2,655 | 1 | 288 | 3,670 | |
| Tramway districts | 3,023 | 173,210 | 176,233 | |||
| City and suburban drainage districts | 100,181 | 3,243 | 825 | 16,606 | 120,855 | |
| Railway district | 8,732 | 228 | 8,960 | |||
| Harbour districts | 117,832 | 833,386 | 10,947 | 105,786 | 1,067,951 | |
| Totals | 2,939,606 | 3,182,921 | 267,330 | 1,820 | 942,780 | 7,334,457 |
As stated above, rates contributed in 1918–19 the sum of £2,939,606 to the revenue of local governing bodies. General rates levied brought in £2,028,151, and special and separate rates £911,455. Of the latter, £709,166 was received by boroughs, and £150,655 by counties. The whole of the rates in harbour districts were general rates, while all those collected by Tramway Boards came under the heading of “special and separate.”
| RATES levied by LOCAL GOVERNING BODIES. | |||
|---|---|---|---|
| Financial Year. | General. | Special and Separate. | Total. |
| £ | £ | £ | |
| 1914–15 | 1,484,591 | 655,495 | 2,140,086 |
| 1915–16 | 1,607,764 | 747,391 | 2,355,155 |
| 1916–17 | 1,695,572 | 838,967 | 2,534,539 |
| 1917–18 | 1,791,028 | 883,513 | 2,674,541 |
| 1918–19 | 2,028,151 | 911,455 | 2,939,606 |
Separate rates are of two classes—“general” and “particular.” General separate rates are levied for the construction, maintenance, &., of any public work, for the acquisition of land or buildings, or for engaging in any undertaking for the benefit of whole or part of a local district. Particular separate rates are levied in respect of water-supply, lighting, sanitation, and of libraries. Special rates are those levied as security for the repayment of loans.
At the 31st March, 1919, the system of rating on the unimproved value was in force in 36 counties, 61 boroughs, 26 town districts, 14 road districts, 14 river-protective districts, 15 land-drainage districts, and 1 tramway district.
The following list shows the various items of revenue received from the Government together with the amount for the financial year 1918–19 in each case: Rates on Crown and Native lands, £1,914; timber and flax, royalties £5,100; goldfields revenue and gold duty, £25,822; subsidy on rates, £168,835; one-third of receipts from lands sold on deferred payment and from perpetual leases, £35,094; one-fourth of rents from small grazing-runs, £7,722; fees and fines, £4,564; other receipts (including amounts paid to Harbour Boards by the Admiralty), £18,279. In addition there are special grants from the General Government for various local works of a public or semi-public character, £156,354. These are not considered revenue, and are included with “Receipts not revenue.” A further class of receipts from the Government is provided by loans, £208,158.
Payments of local governing bodies for ten years are as follows:—
| Financial Year. | Payments. | Financial Year. | Payments. |
|---|---|---|---|
| £ | £ | ||
| 1909–10 | 4,898,482 | 1914–15 | 6,806,567 |
| 1910–11 | 5,360,261 | 1915–16 | 6,920,736 |
| 1911–12 | 6,074,372 | 1916–17 | 6,758,593 |
| 1912–13 | 6,537,769 | 1917–18 | 7,103,073 |
| 1913–14 | 6,796,314 | 1918–19 | 7,320,277 |
Payments during 1918–19 are shown below in more detail:—
| LOCAL GOVERNING BODIES.—PAYMENTS, 1918–19. | ||||||
|---|---|---|---|---|---|---|
| — | Public Works. | Hospitals and Charitable Aid. | Administration. | Interest on Loans and Overdraft. | Other. | Total Payments. |
* Including expenses of management †Included in public works. | ||||||
| £ | £ | £ | £ | £ | £ | |
| Counties | 1,217,405 | 178,583 | 158,135 | 140,538 | 68,074 | 1,762,735 |
| Boroughs | 2,648,344 | 117,871 | 175,095 | 697,484 | 176,041 | 3,814,835 |
| Town districts | 70,894 | 3,484 | 13,515 | 19,523 | 4,410 | 111,826 |
| Road districts | 98,981 | 8,484 | 15,023 | 12,139 | 9,435 | 144,062 |
| River districts | 13,986 | 6,074 | 5,608 | 5,995 | 31,663 | |
| Land-drainage districts | 42,680 | 4,746 | 9,928 | 3,419 | 60,773 | |
| Water-supply districts | 2,732 | 753 | 9 | 215 | 3,709 | |
| Tramway districts | 142,315* | † | 28,944 | 420 | 171,679 | |
| City and suburban drainage districts | 28,295 | 7,799 | 65,939 | 6,031 | 108,064 | |
| Railway district | 13,283 | 1,226 | 1,000 | 15,509 | ||
| Harbour districts | 578,393 | 125,977 | 323,921 | 67,131 | 1,095,422 | |
| Totals | 4,857,308 | 308,422 | 507,117 | 1,305,259 | 342,171 | 7,320,277 |
It is seen that during the year the total payments were £7,320,277, of which £4,857,308 was expended on public works and £1,305,259 on debt charges. The item “administration expenses” does not rank very high in the aggregate, though the table following shows that in some classes of local bodies the expenses of administration account for a fair percentage of the revenue:—
| Local Districts. | Administration Expenses as Percentage of | ||
|---|---|---|---|
| Revenue. | Total Receipts. | Payments. | |
| £ | £ | £ | |
| Counties | 10.61 | 8.62 | 8.97 |
| Boroughs | 5.19 | 4.64 | 4.59 |
| Town districts | 14.68 | 12.73 | 12.09 |
| Road districts | 12.19 | 10.17 | 10.43 |
| River districts | 20.16 | 17.76 | 19.18 |
| Land-drainage districts | 15.78 | 8.07 | 7.81 |
| Water-supply districts | 22.27 | 20.52 | 20.30 |
| City and suburban drainage districts | 7.48 | 6.45 | 7.22 |
| Harbour districts | 13.09 | 11.80 | 11.50 |
| All districts | 8.17 | 7.09 | 7.11 |
The table following gives, in respect of boroughs only, the payments out of loan-money during the past five years, classified under various heads:—
| EXPENDITURE out of LOANS.—BOROUGHS ONLY. | |||||||||
|---|---|---|---|---|---|---|---|---|---|
| Year ended 31st March. | Streets, Foot-ways, and Bridges. | Drainage and Sanitation. | Waterworks. | Tramways. | Abattoirs, Slaughterhouses and Pounds. | Lighting and Power Services. | Other Public Works. | Management, Interest, and Sundries. | Total. |
| £ | £ | £ | £ | £ | £ | £ | £ | £ | |
| 1915 | 153,209 | 68,061 | 70,306 | 28,889 | 5,463 | 201,651 | 58,982 | 25,098 | 611,659 |
| 1916 | 175,248 | 98,366 | 86,864 | 45,390 | 3,860 | 235,071 | 78,398 | 17,818 | 741,015 |
| 1917 | 98,595 | 92,677 | 84,012 | 21,497 | 14,970 | 130,489 | 60,902 | 16,794 | 519,936 |
| 1918 | 72,290 | 86,346 | 45,917 | 6,880 | 104,359 | 57,086 | 12,571 | 385,449 | |
| 1919 | 92,923 | 62,710 | 40,593 | 671 | 68,276 | 34,014 | 5,163 | 304,350 | |
The assets and liabilities of local governing bodies at the end of the financial year 1918–19 are as shown in the table following. The figures shown in the column “other assets” are taken from the respective balance-sheets, but are far from complete. In quite a number of cases no assets whatever are shown, while in the majority of the others nothing is included for the reserves held. These totals can be taken only as a very approximate indication of the property held in addition to the actual cash assets.
| — | Assets. | Liabilities. | ||||
|---|---|---|---|---|---|---|
| Cash Assets. | Other Assets (as estimated in Published Balance-sheets). | Net Indebtedness on Loans (excluding Government Loans and those from the State Advances Office). | Net Indebtedness on Loans from State Advances Office. (Net indebtedness on 31st March, 1919.) | Inscribed Debt, i.e., Loans from Treasury under Loans to Local Bodies Acts). Estimated Present Indebtedness. | Liabilities other than the Loans included in preceding Columns (Bank Overdrafts, Outstanding Accounts, &.). | |
| £ | £ | £ | £ | £ | £ | |
| Counties | 607,596 | 620,217 | 498,145 | 1,116,204 | 822,974 | 507,029 |
| Boroughs | 1,090,487 | 14,709,971 | 10,961,957 | 1,313,700 | 563,442 | 945,540 |
| Town districts | 32,768 | 228,130 | 251,599 | 83,407 | 10,118 | 50,035 |
| Road districts | 54,956 | 95,843 | 73,140 | 88,129 | 53,897 | 24,491 |
| River districts | 12,938 | 90,273 | 34,273 | 3,213 | 40,185 | 15,440 |
| Land-drainage districts | 26,813 | 21,231 | 25,457 | 125,665 | 61,170 | 6,835 |
| City and suburban drainage districts | 52,282 | 585,886 | 1,223,325 | 174 | 491,493 | |
| Tramway districts | 25,624 | 708,306 | 565,557 | 1,383 | ||
| Water-supply districts | 1,327 | 1,896 | 20,796 | 637 | 234 | |
| Railway districts | 341 | 29,278 | 29,619 | |||
| Harbour districts | 858,690 | 8,751,454 | 6,246,616 | 116,345 | 240,141 | |
| Totals | 2,763,822 | 25,842,485 | 19,900,865 | 2,846,837 | 1,552,423 | 2,472,240 |
The net indebtedness of local governing bodies on account of outstanding loans increased in the twenty years 1899–1900 to 1918–19 from £6,356,630 to £19,922,153, exclusive of moneys borrowed from the Government, which represented a further indebtedness of £4,399,260 at the end of March, 1919, made up as follows: Inscribed debt, i.e., debentures under the Roads and Bridges Construction Act, 1882, converted, and amounts borrowed from the Treasury under the Local Bodies’ Loans Acts, £1,552,423; loans from the New Zealand State Advances Office, £2,846,837.
The gross indebtedness of local bodies at 31st March, 1919, amounted to £28,323,853, made up as follows: Debentures and stock, &., £22,673,712; inscribed debt, £2,554,401; loans for State Advances Office, £3,095,740.
A table is given showing the gross amount of the debt raised in New Zealand and elsewhere, other than loans from the General Government. Columns are added showing the interest payable and the average rate of interest per cent. During the war period there have been decreases in the amounts raised abroad and increases in the amounts raised in New Zealand, making a difference between the two amounts of nearly £7,000,000 at the 31st March, 1919.
INDEBTEDNESS and INTEREST CHARGES.
| Financial Year. | Raised in New Zealand. | Raised Abroad. | Total Indebtedness. | Interest. | Average Rate per Cent. |
|---|---|---|---|---|---|
| £ | £ | £ | £ | £ | |
| 1914–15 | 10,998,775 | 8,455,700 | 19,454,475 | 870,992 | 4.48 |
| 1915–16 | 12,793,543 | 7,960,625 | 20,754,168 | 948,511 | 4.57 |
| 1916–17 | 13,218,617 | 8,214,150 | 21,432,767 | 983,408 | 4.59 |
| 1917–18 | 14,096,187 | 8,164,350 | 22,260,537 | 1,034,272 | 4.64 |
| 1918–19 | 14,749,763 | 7,923,949 | 22,673,712 | 1,048,999 | 4.63 |
The average rate of interest had shown a continuous fall for many years prior to the war. Since 1914–15, however, a tendency to an increasing rate of interest has developed. Of a gross indebtedness of £22,673,712, £5,445,923 was held at 4 per cent.; £2,015,913 at 4¼ per cent.; £6,310,500 at 4¼ per cent.; £5,377,150 at 5 per cent.; £1,359,278 at 5¼ per cent., and £1,082,190 at 6 per cent. Against this were sinking funds amounting to £2,751,559, leaving the net indebtedness, other than to the State, £19,922,153. The annual charge for interest was £1,048,999, and for sinking fund £182,465. The net indebtedness to the State Advances Office was £2,846,837, representing loans originally amounting to £3,095,740. The instalments of principal and interest on this amounted to an annual charge of £161,401. The estimated net indebtedness on account of Inscribed Debt was £1,552,423 at the 1st February, 1919. This debt is decreasing yearly, and will be extinguished in course of time. The amount outstanding is repayable by annual instalments of £97,025.
Detailed tables showing the statistics of individual local bodies will be found in Volume iv of “Statistics of New Zealand,” also as regards boroughs, town districts, and Harbour Boards in the “Municipal Handbook,” published biennially.
Table of Contents
GENERAL valuations of land for the whole of New Zealand were made periodically up to the year 1897–98. Since that year no general valuations for the whole Dominion have been made, but portions have been revalued from time to time.
No statement absolutely accurate at the present day can be given, as the totals for 1919 and preceding years are not ascertained by general revaluations in each year. Revaluations are made, district by district, as circumstances permit. The total capital value, £445,533,445 at 31st March, 1919, represents a figure treble that of twenty years previous.
A quinquennial summary of valuation in the North and South Islands follows:—
| Year. | North Island. | South Island.* | New Zealand. | |||
|---|---|---|---|---|---|---|
| Capital Value (Land and Improvements). | Unimproved Value of Land (included in previous Column). | Capital Value (Land and Improvements). | Unimproved Value of Land (included in previous Column). | Capital Value (Land and Improvements). | Unimproved Value of Land (included in previous Column). | |
*Including Stewart Island and Chatham Islands. | ||||||
| COUNTIES. | ||||||
| £ | £ | £ | £ | £ | £ | |
| 1915 | 137,669,168 | 91,079,543 | 94,296,275 | 69,841,015 | 231,965,443 | 160,920,558 |
| 1916 | 146,242,118 | 97,379,015 | 96,811,084 | 71,199,250 | 243,053,202 | 168,578,265 |
| 1917 | 154,477,641 | 102,981,689 | 100,636,688 | 74,108,106 | 255,114,329 | 177,089,795 |
| 1918 | 164,928,221 | 109,611,569 | 103,714,879 | 76,670,835 | 268,643,100 | 186,282,404 |
| 1919 | 182,705,967 | 120,687,776 | 108,086,615 | 80,086,519 | 290,792,582 | 200,774,295 |
| BOROUGHS. | ||||||
| 1915 | 87,671,609 | 48,150,309 | 46,638,663 | 19,396,948 | 134,310,272 | 67,547,257 |
| 1916 | 92,902,160 | 50,443,309 | 48,313,999 | 20,050,324 | 141,216,159 | 70,493,733 |
| 1917 | 96,207,345 | 51,510,819 | 48,770,852 | 20,018,500 | 144,978,197 | 71,529,319 |
| 1918 | 97,648,139 | 51,772,269 | 49,660,419 | 20,358,456 | 147,308,558 | 72,130,725 |
| 1919 | 98,520,644 | 51,910,886 | 50,615,526 | 20,737,636 | 149,136,170 | 72,64,522 |
| TOWN DISTRICTS. | ||||||
| 1915 | 3,916,101 | 1,854,576 | 884,867 | 382,756 | 4,800,968 | 2,237,332 |
| 1916 | 4,273,975 | 1,989,761 | 621,393 | 260,496 | 4,895,368 | 2,250,257 |
| 1917 | 4,732,948 | 2,207,633 | 640,597 | 260,961 | 5,373,545 | 2,468,594 |
| 1918 | 4,820,083 | 2,255,646 | 611,632 | 253,037 | 5,431,715 | 2,508,683 |
| 1919 | 4,941,519 | 2,301,302 | 663,174 | 264,290 | 5,604,693 | 2,565,592 |
| GRAND TOTALS. | ||||||
| 1915 | 229,256,878 | 141,084,428 | 141,819,805 | 89,620,719 | 371,076,683 | 230,705,147 |
| 1916 | 243,418,253 | 149,812,085 | 145,746,476 | 91,510,170 | 389,164,729 | 241,322,255 |
| 1917 | 255,417,934 | 156,700,141 | 150,048,137 | 94,387,567 | 405,466,071 | 251,087,708 |
| 1918 | 267,396,443 | 163,639,484 | 153,986,930 | 97,282,328 | 421,383,373 | 260,921,812 |
| 1919 | 286,168,130 | 174,899,964 | 159,365,315 | 101,088,445 | 445,533,445 | 275,988,409 |
The total valuations are also given for individual counties, boroughs, and independent town districts. In making comparisons it should be borne in mind, as previously remarked, that the valuations are not all for the same year.
TABLE showing CAPITAL and UNIMPROVED VALUE of each COUNTY in NEW ZEALAND.
| County. | Gross Values. | |
|---|---|---|
| Capital Value (Land and Improvements). | Unimproved Value of Land (included in previous Column). | |
| £ | £ | |
| Mongonui | 931,868 | 551,484 |
| Whangaroa | 294,696 | 188,519 |
| Bay of Islands | 1,601,130 | 1,020,544 |
| Hokianga | 1,269,515 | 772,222 |
| Whangarei | 2,500,883 | 1,413,326 |
| Hobson | 2,111,900 | 1,258,372 |
| Otamatea | 1,713,799 | 952,032 |
| Rodney | 1,024,641 | 615,121 |
| Waitemata | 2,641,388 | 1,819,282 |
| Eden | 4,245,928 | 2,640,715 |
| Manukau | 3,079,652 | 2,101,565 |
| Franklin | 3,891,084 | 2,561,224 |
| Great Barrier | 133,758 | 108,440 |
| Islands— | ||
| Little Barrier, Waiheke, &c. | 327,038 | 212,080 |
| Waikato | 4,664,736 | 3,323,252 |
| Raglan | 3,275,713 | 2,118,572 |
| Waipa | 4,982,742 | 3,441,515 |
| Kawhia | 575,503 | 369,734 |
| Awakino | 954,555 | 553,533 |
| Waitomo | 4,071,034 | 2,615,184 |
| Ohura | 1,029,903 | 657,823 |
| Coromandel | 432,953 | 281,627 |
| Thames | 1,806,296 | 1,287,286 |
| Ohinemuri | 1,868,027 | 1,363,882 |
| Tauranga | 1,764,584 | 1,046,348 |
| Piako | 3,316,433 | 2,256,843 |
| Matamata | 3,095,205 | 1,946,197 |
| Rotorua | 618,760 | 482,173 |
| Whakatane | 2,188,628 | 1,505,362 |
| Opotiki | 1,330,598 | 857,802 |
| East Taupo | 544,775 | 347,029 |
| West Taupo | 1,976,991 | 1,433,929 |
| Islands— | ||
| Mayor and Motiti | 19,415 | 12,141 |
| Waiapu | 4,766,053 | 2,622,928 |
| Uawa | 1,549,464 | 1,042,086 |
| Waikohu | 5,077,035 | 3,096,254 |
| Cook | 6,522,824 | 4,419,190 |
| Wairoa | 3,836,190 | 2,457,547 |
| Hawke's Bay | 10,947,629 | 8,234,152 |
| Waipukurau | 908,285 | 678,599 |
| Dannevirke | 3,315,936 | 2,179,650 |
| Woodville | 1,381,106 | 962,641 |
| Patangata | 4,600,982 | 3,581,022 |
| Weber | 719,621 | 475,510 |
| Clifton | 998,933 | 565,261 |
| Taranaki | 2,263,310 | 1,266,804 |
| Egmont | 1,933,925 | 1,038,292 |
| Stratford | 2,083,336 | 1,218,425 |
| Whangamomona | 564,030 | 325,790 |
| Waimate West | 1,413,041 | 1,117,710 |
| Hawera | 4,293,151 | 3,116,491 |
| Eltham | 1,998,741 | 1,356,856 |
| Patea | 3,612,307 | 2,394,618 |
| Waitotara | 2,677,626 | 1,824996 |
| Waimarino | 1,404,310 | 971,926 |
| Wanganui | 2,209,754 | 1,372,692 |
| Rangitikei | 7,122,856 | 4,677,926 |
| Kiwitea | 3,415,433 | 2,232,152 |
| Pohangina | 1,793,299 | 1,154,131 |
| Kaitieke | 1,478,081 | 969,492 |
| Manawatu | 3,644,282 | 2,598,633 |
| Oroua | 2,941,855 | 2,101,250 |
| Kairanga | 2,986,631 | 2,189,130 |
| Horowhenua | 3,484,090 | 2,512,475 |
| Islands— | £ | £ |
| Kapiti, Mana, and | 17,984 | 13,378 |
| Somes | ||
| Chatham Islands | 286,373 | 195,957 |
| Pahiatua | 1,737,710 | 1,042,597 |
| Akitio | 1,187,656 | 608,945 |
| Castlepoint | 831,608 | 536,660 |
| Eketahuna | 1,854,220 | 1,011,040 |
| Mauriceville | 541,815 | 303,988 |
| Masterton | 2,854,883 | 1,876,765 |
| Wairarapa South | 2,280,446 | 1,358,000 |
| Featherston | 4,674,260 | 2,987,593 |
| Hutt | 2,208,449 | 1,286,806 |
| Makara | 1,047,166 | 499,590 |
| Collingwood | 474,153 | 310,603 |
| Takaka | 697,979 | 391,875 |
| Waimea | 3,186,014 | 1,784,761 |
| Sounds | 793,741 | 478,729 |
| Marlborough | 3,160,853 | 2,391,442 |
| Awatere | 2,241,612 | 1,760,017 |
| Kaikoura | 1,228,734 | 903,231 |
| Buller | 1,413,917 | 731,070 |
| Murchison | 780,201 | 473,313 |
| Inangahua | 589,482 | 296,775 |
| Grey | 1,003,363 | 656,554 |
| Westland | 1,052,424 | 762,567 |
| Cheviot | 1,792,145 | 1,469,113 |
| Amuri | 2,611,891 | 2,125,925 |
| Waipara | 3,166,649 | 2,701,129 |
| Ashley | 850,497 | 700,790 |
| Kowai | 1,189,261 | 937,277 |
| Oxford | 1,149,665 | 952,064 |
| Rangiora | 1,383,154 | 1,065,278 |
| Eyre | 1,203,409 | 961,226 |
| Waimairi | 3,722,335 | 2,279,417 |
| Paparua | 2,114,827 | 1,567,503 |
| Malvern | 1,953,055 | 1,539,577 |
| Tawera | 580,009 | 483,579 |
| Heathcote | 959,585 | 551,690 |
| Halswell | 855,994 | 684,184 |
| Selwyn | 1,727,462 | 1,396,862 |
| Springs | 1,264,600 | 1,039,935 |
| Ellesmere | 2,230,884 | 1,818,306 |
| Mount Herbert | 572,004 | 470,054 |
| Akaroa | 2,286,366 | 1,916,312 |
| Ashburton | 9,857,939 | 8,181,911 |
| Geraldine | 3,524,300 | 2,871,199 |
| Levels | 3,061,792 | 2,435,063 |
| Mackenzie | 2,136,238 | 1,675,281 |
| Waimate | 5,398,886 | 4,396,194 |
| Waitaki | 5,362,790 | 4,116,986 |
| Maniototo | 927,718 | 640,772 |
| Waihemo | 799,805 | 598,881 |
| Waikouaiti | 894,506 | 511,166 |
| Peninsula | 521,579 | 291,500 |
| Taieri | 2,200,729 | 1,588,629 |
| Tuapeka | 2,439,816 | 1,661,127 |
| Bruce | 1,763,770 | 1,171,332 |
| Clutha | 2,765,446 | 1,745,430 |
| Islands— | ||
| Quarantine and Goat | 3,454 | 900 |
| Vincent | 977,040 | 645,674 |
| Lake | 551,693 | 405,151 |
| Fiord | 144,293 | 137,513 |
| Wallace | 3,703,517 | 2,559,351 |
| Southland | 11,352,356 | 7,649,179 |
| Stewart Island | 166,870 | 129,164 |
| Islands— | ||
| Antipodes, &c. | 13,880 | 13,880 |
| TABLE showing CAPITAL and UNIMPROVED VALUE of each BOROUGH in NEW ZEALAND. | ||
|---|---|---|
| Borough. | Gross Values. | |
| Capital Value (Land and Improvements). | Unimproved Value of Land (included in previous Column). Borough. | |
| £ | £ | |
| Whangarei | 659,444 | 348,226 |
| Dargaville | 426,065 | 231,435 |
| Birkenhead | 615,185 | 322,750 |
| Devonport | 1,562,147 | 656,205 |
| AUCKLAND CITY— | ||
| City Portion | 18,088,551 | 11,205,565 |
| Parnell, | 1,266,308 | 616,925 |
| Grey Lynn, | 1,321,521 | 516,066 |
| Arch Hill, | 223,425 | 104,880 |
| Eden Terrace, | 326,934 | 140,324 |
| Epsom, | 1,210,069 | 591,985 |
| Remuera, | 2,464,139 | 1,187,414 |
| Total of City | 24,900,947 | 14,363,159 |
| Newmarket | 688,789 | 367,504 |
| Onehunga | 1,073,480 | 510,875 |
| Takapuna | 1,178,121 | 768,099 |
| Northcote | 339,078 | 185,208 |
| Mount Albert | 1,686,788 | 807,170 |
| Mount Eden | 2,477,450 | 1,021,085 |
| Otahuhu | 506,525 | 272,540 |
| Pukekohe | 393,236 | 218,996 |
| Hamilton | 2,279,271 | 1,369,360 |
| Cambridge | 449,440 | 258,761 |
| Te Awamutu | 303,560 | 174,281 |
| Thames | 443,630 | 183,510 |
| Tauranga | 300,405 | 143,516 |
| Paeroa | 193,276 | 84,843 |
| Waihi | 419,582 | 147,407 |
| Te Aroha | 348,585 | 160,230 |
| Rotorua (Town) | 787,555 | 468,762 |
| Whakatane | 246,915 | 135,172 |
| Opotiki | 273,382 | 153,086 |
| Taumarunui | 386,500 | 196,977 |
| Te Kuiti | 560,357 | 332,180 |
| Gisborne | 2,978,745 | 1,490,480 |
| Wairoa | 431,393 | 238,803 |
| Napier | 3,462,860 | 1,671,501 |
| Hastings | 2,666,045 | 1,521,015 |
| Dannevirke | 839,595 | 381,470 |
| Woodville | 165,827 | 60,852 |
| Waipawa | 261,662 | 141,425 |
| Waipukurau | 247,133 | 133,198 |
| New Plymouth | 2,255,380 | 1,333,084 |
| Hawera | 880,682 | 421,003 |
| Patea | 149,197 | 57,406 |
| Waitara | 235,632 | 84,546 |
| Inglewood | 200,764 | 87,392 |
| Stratford | 578,268 | 241,718 |
| Eltham | 416,993 | 193,542 |
| Wanganui | 3,185,107 | 1,920,790 |
| Marton | 349,552 | 139,557 |
| Ohakune | 134,113 | 47,992 |
| Taihape | 349,943 | 173,742 |
| Feilding | 884,534 | 431,756 |
| Palmerston North | 3,216,938 | 1,661,856 |
| Foxton | 273,670 | 115,902 |
| Karori | 533,042 | 310,031 |
| £ | £ | |
| WELLINGTON CITY— | ||
| Onslow Portion | 959,654 | 473,242 |
| Karori Portion | 532,561 | 214,909 |
| City Portion | 18,121,654 | 9,714,359 |
| Kilbirnie Portion | 3,803,084 | 1,497,906 |
| Island Bay Portion | ||
| Ohiro Portion | ||
| Total of City | 23,416,953 | 11,900,416 |
| Shannon | 124,660 | 54,085 |
| Levin | 309,968 | 148,014 |
| Pahiatua | 242,242 | 101,454 |
| Masterton | 1,386,887 | 574,465 |
| Carterton | 298,251 | 118,650 |
| Greytown | 205,102 | 85,957 |
| Lower Hutt | 1,458,818 | 830,393 |
| Petone | 1,473,418 | 673,282 |
| Eketahuna | 154,611 | 66,624 |
| Featherston | 137,203 | 32,525 |
| Eastbourne | 237,087 | 102,282 |
| Miramar | 878,656 | 482,341 |
| Richmond | 221,538 | 117,475 |
| Nelson City | 1,827,171 | 850,023 |
| Picton | 295,873 | 154,235 |
| Blenheim | 991,215 | 477,183 |
| Motueka | 202,035 | 89,676 |
| Westport | 743,911 | 373,562 |
| Greymouth | 845,301 | 269,286 |
| Brunner | 71,330 | 12,249 |
| Kumara | 33,875 | 6,135 |
| Hokitika | 262,149 | 77,178 |
| Ross | 24,730 | 7,102 |
| Runanga | 58,483 | 18,859 |
| Rangiora | 330,387 | 130,327 |
| Kaiapoi | 190,743 | 58,753 |
| CHRISTCHURCH CITY— | ||
| St. Albans Portion | 2,665,325 | 925,855 |
| Richmond Portion | 214,200 | 72,025 |
| North-east Portion | 662,635 | 253,216 |
| North-west Portion | 1,843,996 | 869,861 |
| South-east Portion | 1,562,636 | 727,337 |
| South-west Portion | 3,657,987 | 2,113,981 |
| Sydenham Portion | 2,079,366 | 746,938 |
| Opawa Portion | 152,230 | 67,430 |
| St. Martin's, | 70,335 | 36,760 |
| Linwood Portion | 1,072,196 | 368,379 |
| Avonside Portion | 121,375 | 52,355 |
| Total of City | 14,102,281 | 6,234,137 |
| Woolston | 522,416 | 172,346 |
| New Brighton | 426,982 | 170,682 |
| Sumner | 598,902 | 272,465 |
| Lyttelton | 988,107 | 272,707 |
| Akaroa | 115,756 | 44,349 |
| Riccarton | 576,644 | 197,035 |
| Spreydon | 627,990 | 235,360 |
| Ashburton | 546,036 | 213,569 |
| Timaru | 3,255,225 | 1,562,170 |
| Geraldine | 136,863 | 43,660 |
| Temuka | 251,923 | 67,621 |
| Waimate | 394,075 | 129,510 |
| Oamaru | 880,933 | 290,416 |
| Hampden | 30,001 | 9,647 |
| Naseby | 20,863 | 2,583 |
| Palmerston | 91,519 | 24,376 |
| Waikouaiti | 77,457 | 28,112 |
| Port Chalmers | 369,746 | 120,952 |
| West Harbour | 214,002 | 73,812 |
| DUNEDIN CITY— | ||
| Valley Portion | 649,416 | 210,537 |
| Maori Hill Portion | 457,712 | 186,770 |
| Roslyn Portion | 1,050,062 | 346,496 |
| Mornington Portion | 554,061 | 191,056 |
| Leith Portion | 1,609,480 | 671,655 |
| Bell Portion | 1,818,035 | 801,415 |
| High Portion | 3,026,071 | 1,308,060 |
| South Portion | 1,088,105 | 458,135 |
| Caversham Portion | 960,187 | 287,350 |
| South Dunedin Portion | 662,437 | 167,203 |
| Anderson's Bay Portion | 398,831 | 161,858 |
| Total of City | 12,274,397 | 4,790,535 |
| £ | £ | |
| WELLINGTON CITY— | ||
| St. Kilda | 958,755 | 313,415 |
| Green Island | 285,256 | 65,775 |
| Mosgiel | 267,030 | 95,660 |
| Roxburgh . | 37,680 | 5,969 |
| Lawrence | 111,484 | 29,949 |
| Tapanui | 33,225 | 9,075 |
| Milton | 185,753 | 55,946 |
| Balclutha | 224,718 | 82,803 |
| Kaitangata | 110,801 | 31,538 |
| Cromwell | 46,487 | 10,060 |
| Alexandra | 57,454 | 11,763 |
| Arrowtown | 21,519 | 3,375 |
| Queenstown | 65,595 | 14,564 |
| Gore | 705,694 | 275,654 |
| Mataura | 206,702 | 74,828 |
| Winton | 114,537 | 38,765 |
| Invercargill | 3,861,203 | 1,738,124 |
| Invercargill South | 278,408 | 136,301 |
| Riverton | 139,197 | 44,885 |
| Bluff | 303,169 | 101,100 |
TABLE showing CAPITAL and UNIMPROVED VALUE of LAND in each TOWN DISTRICT (outside the JURISDICTION of any COUNTY) in NEW ZEALAND.
| Town District, independent of County (outside County Jurisdiction). | Gross Values. | |
|---|---|---|
| Capital Value (Land and Improvements). | Unimpr'v'd Value of Land (included in previous Column). | |
| £ | £ | |
| Hikurangị̣ | 66,180 | 30,415 |
| Warkwortḥ̣ | 82,262 | 26,695 |
| Helensvillẹ̣ | 111,740 | 36,430 |
| New Lynṇ̣ | 199,340 | 105,085 |
| Ellersliẹ̣̣̣ | 285,410 | 135,910 |
| Waiukụ̣̣̣ | 138,783 | 67,415 |
| Papakurạ̣̣ | 220,945 | 134,120 |
| Tuakaụ̣̣̣ | 194,422 | 59,107 |
| Huntlỵ̣̣̣ | 151,500 | 71,820 |
| Ngaruawahiạ̣ | 135,188 | 64,238 |
| Te Pukẹ̣̣̣ | 104,269 | 45,650 |
| Morrinsvillẹ̣ | 239,390 | 125,835 |
| Matamatạ̣ | 133,685 | 66,635 |
| Mangapapạ̣ | 274,987 | 122,846 |
| Taradalẹ̣̣̣ | 226,974 | 134,901 |
| Havelock Nortḥ̣ | 266,707 | 136,903 |
| Manaiạ̣̣̣ | 117,426 | 51,258 |
| Waverleỵ̣̣ | 100,717 | 42,341 |
| Gonvillẹ̣̣̣ | 581,092 | 222,427 |
| Castlecliff̣̣̣ | 186,386 | 65,532 |
| Raetihị̣̣̣ | 95,373 | 42,027 |
| Rangatauạ̣ | 34,840 | 10,696 |
| Mangawekạ̣ | 57,252 | 22,055 |
| Huntervillẹ̣ | 96,144 | 37,325 |
| Bull'ṣ̣̣̣ | 57,796 | 23,798 |
| Manunuị̣̣̣ | 72,149 | 25,894 |
| Otakị̣̣̣ | 200,370 | 111,034 |
| Martinborougḥ̣ | 161,155 | 53,549 |
| Johnsonvillẹ̣ | 191,373 | 100,461 |
| Upper Hutṭ̣ | 247,664 | 128,900 |
| Hampsteaḍ̣ | 145,176 | 58,165 |
| Tinwalḍ̣̣̣ | 89,316 | 45,405 |
| Pleasant Poinṭ̣ | 80,477 | 36,582 |
| Nightcapṣ̣ | 46,518 | 11,546 |
| Otautaụ̣̣̣ | 128,608 | 49,969 |
| Lumsdeṇ̣̣̣ | 49,715 | 12,043 |
| Wyndhaṃ̣ | 123,364 | 50,580 |
Table of Contents
THE following table shows the increase in the total trade since the year 1853:—
| TOTAL TRADE, IMPORTS, and EXPORTS of NEW ZEALAND, 1853–1919. | ||||||||||||
|---|---|---|---|---|---|---|---|---|---|---|---|---|
| Year. | Total Value. | Value per Head (excluding Maoris). | ||||||||||
| Total Trade. | Imports. | Exports. | Total Trade. | Imports. | Exports. | |||||||
| £ | £ | £ | £ | s. | d. | £ | s. | d. | £ | s. | d. | |
| 1853 | 901,110 | 597,828 | 303,282 | 30 | 0 | 9 | 19 | 18 | 7 | 10 | 2 | 2 |
| 1863 | 10,510,079 | 7,024,674 | 3,485,405 | 72 | 10 | 5 | 48 | 9 | 5 | 24 | 1 | 0 |
| 1873 | 12,075,058 | 6,464,687 | 5,610,371 | 41 | 19 | 3 | 22 | 9 | 4 | 19 | 9 | 11 |
| 1883 | 15,070,037 | 7,974,038 | 7,095,999 | 28 | 9 | 5 | 15 | 1 | 3 | 13 | 8 | 2 |
| 1893 | 15,896,879 | 6,911,515 | 8,985,364 | 24 | 0 | 9 | 10 | 9 | 0 | 13 | 11 | 9 |
| 1903 | 27,799,053 | 12,788,675 | 15,010,378 | 33 | 17 | 10 | 15 | 11 | 10 | 18 | 6 | 0 |
| 1910 | 39,231,792 | 17,051,583 | 22,180,209 | 39 | 10 | 4 | 17 | 3 | 6 | 22 | 6 | 10 |
| 1911 | 38,574,369 | 19,545,879 | 19,028,490 | 38 | 0 | 2 | 19 | 5 | 2 | 18 | 15 | 0 |
| 1912 | 42,747,155 | 20,976,574 | 21,770,581 | 41 | 2 | 10 | 20 | 3 | 9 | 20 | 19 | 1 |
| 1913 | 45,275,024 | 22,288,302 | 22,986,722 | 42 | 7 | 3 | 20 | 17 | 1 | 21 | 10 | 2 |
| 1914 | 48,117,543 | 21,856,096 | 26,261,447 | 44 | 2 | 8 | 20 | 0 | 11 | 24 | 1 | 9 |
| 1915 | 53,477,746 | 21,728,834 | 31,748,912 | 48 | 12 | 10 | 19 | 15 | 2 | 28 | 17 | 8 |
| 1916 | 59,626,220 | 26,339,283 | 33,286,937 | 54 | 4 | 8 | 23 | 19 | 2 | 30 | 5 | 6 |
| 1917 | 52,516,812 | 20,919,265 | 31,587,547 | 47 | 15 | 5 | 19 | 0 | 7 | 28 | 14 | 10 |
| 1918 | 52,750,195 | 24,234,007 | 28,516,188 | 47 | 16 | 6 | 21 | 19 | 5 | 25 | 17 | 1 |
| 1919 | 84,641,773 | 30,671,698 | 53,970,075 | 74 | 9 | 8 | 26 | 19 | 10 | 47 | 9 | 10 |
A low and fluctuating level of trade was turned in 1860–63 into a rapidly increasing volume by the effect of the gold-discoveries which occurred in the early “sixties.” Both imports and exports were stimulated, the former to feed and clothe an ever-increasing population, the latter by the export of gold.
After the gold rushes had subsided trade remained stationary till the expenditure of borrowed money brought the land-boom of the early “seventies.” A great temporary increase of trade was succeeded by violent fluctuations and but slowly increasing trade, as the effects of the bubble were slowly worked off. It is significant that from 1873 till 1895 the world level of prices was falling continuously, and this factor contributed not a little to the depression of New Zealand. Little headway could be made against a falling price of wool and a decreasing production of gold, which were the main features of those twenty years.
But in 1895 world prices began to rise, and the effect is seen immediately in the upward rush of the external trade. On only three occasions has this upward tendency been checked—in 1908, when the commercial crisis which was felt in the Old World a year previously affected New Zealand; in 1913, on the occasion of another depression of trade; and again since 1916, as a result of shortage of shipping.
For a long period the external trade, while increasing absolutely, was declining relatively to population. Since 1895, however, trade has increased much faster than has population—doubtless largely due to increasing prices. To some extent this is probably a result of greater productivity and consequent increased purchasing-power.
The trade per head was fairly great in the early years, after 1853; but the amount was swelled by the relatively large imports which were necessary for the development of the young colony. The gold-discoveries raised the level both of imports and exports, and after 1870 the borrowing policy which was inaugurated greatly inflated trade, and especially imports. The highest level, apart from the abnormal years of the early “sixties,” was reached in 1874, and the consequent reaction saw an almost continuous decrease in the per capita trade both in imports and exports till 1895.
It is significant that the turning-point should have come in 1895, the year in which prices turned to rise all over the world. From 1895 there has been an almost constant increase. Since the outbreak of war the total trade has increased enormously. This, of course, was largely if not entirely due to increased market values of both imports and exports.
The relation between imports and exports is of the greatest importance to a young country like New Zealand. In the very earliest years of occupation by Europeans the exports of phormium, timber, and skins were greatly in excess of the few imports, mainly muskets and gunpowder, a fact which is explained partly by the temporary residence of the traders and more by the weaker bargaining-power of the Maori. With the settlement of the regular colony in 1840 there was evident an inflation of imports occasioned by the amount of capital the new colonists brought in for the development of the country. From 1853 to 1870 there was an excess of imports, which, however, was tending to decrease.
A temporary excess of exports was changed in the early “seventies” by another great increase of imports, due to the borrowing policy inaugurated in that period. Except for a big decrease in 1880, imports continued to be greater than exports until 1886.
From that year onward there was a continued excess of exports, except for two bad years, 1908 and 1913. In the period from 1886 to 1895 it is most marked. Fluctuations in exports have usually preceded by a year similar fluctuations in imports.
The balance of trade is intimately bound up, in later years especially, with the large imports of capital which have been brought in to assist in the development of the country. This has already been made evident in discussing the balance of trade in early years. The excess of imports from 1853 to 1870, and again from 1872 to 1886, can definitely be traced to the importation of capital in those periods.
The excess of exports in later years consists mainly of profits, interest, and other charges on the debt of New Zealand, public, local, and private. Other items, such as remittances abroad and subsidies, also swell the balance of exports. The amount necessary in each year to pay the interest on the debt of New Zealand cannot be definitely stated, owing to the lack of data concerning the private investments in the Dominion.
The amount of interest payable on the debt of the General Government at the 31st March, 1919, was £7,299,006, but of this amount roughly forty-four per cent. must be deducted for stock held in the Dominion (see section on “Public Finance”). Added to this there is the interest on local bodies’ debts of approximately twenty-six millions (of which, however, only eight millions were raised abroad), and on the private debts of the Dominion, for which no statistics are available. It is evident that some five millions are needed each year to defray the charges on the various public debts owing abroad.
Against this outgoing must be set the amount of new importations of capital in the shape of loans. While the expenditure on interest is fairly constant from year to year, the amount raised by new loans varies, and these variations are a big factor in the fluctuations of the balance of trade.
There is no Mint in New Zealand, while there is a fairly considerable production of gold bullion. Gold, therefore, ranks as an ordinary export of the Dominion, along with wool, frozen meat, and dairy-produce. In earlier days this export of gold was much more important than now, amounting in 1863 to 70 per cent. of the total exports, from which figure it shrank steadily to 6 per cent. in 1913.
As all coin necessary for the commerce of the Dominion must be imported from abroad, the movement of specie has in normal times afforded a ready index of the state of trade. A bad year has been reflected in an export of specie, while prosperous years have shown a steady inflow. During the war the disappearance of gold currency from circulation has, of course, somewhat modified circumstances in this respect. It is, however, still of interest to append a table showing imports and exports of specie during the ten years 1910–19.
VALUE of SPECIE imported and exported, 1910–19.
| Year. | Total Specie. | Balance. | ||
|---|---|---|---|---|
| Imported. | Exported. | In. | Out. | |
| £ | £ | £ | ||
| 1910 | 303,360 | 27,736 | 275,624 | |
| 1911 | 763,271 | 48,305 | 714,966 | |
| 1912 | 399,995 | 258,955 | 141,040 | |
| 1913 | 634,670 | 176,359 | 458,311 | |
| 1914 | 711,869 | 7,522 | 704,347 | |
| 1915 | 1,070,114 | 318,090 | 752,024 | |
| 1916 | 1,293,880 | 5,880 | 1,288,000 | |
| 1917 | 177,135 | 70,475 | 106,660 | |
| 1918 | 102,215 | 35,610 | 66,605 | |
| 1919 | 362,531 | 62,150 | 300,381 | |
The amount of gold bullion exported is shown in the following table:—
| EXPORTS of GOLD from NEW ZEALAND, 1910–19. | |||||
|---|---|---|---|---|---|
| Year. | Exports. | Percentage of Total Exports. | |||
| To United Kingdom. | To Australia. | To other Countries. | Total. | ||
| £ | £ | £ | £ | ||
| 1910 | 996,081 | 900,237 | 1,896,318 | 8.55 | |
| 1911 | 379,596 | 1,435,655 | 1,815,251 | 9.54 | |
| 1912 | 394,425 | 950,706 | 1,345,131 | 6.18 | |
| 1913 | 353,763 | 1,105,720 | 16 | 1,459,499 | 6.35 |
| 1914 | 159,499 | 735,811 | 57 | 895,367 | 3.41 |
| 1915 | 5,060 | 507,659 | 1,181,834 | 1,694,553 | 5.34 |
| 1916 | 134,827 | 510,499 | 553,886 | 1,199,212 | 6.01 |
| 1917 | 690,025 | 213,863 | 903,888 | 2.86 | |
| 1918 | 275 | 42,116 | 42,391 | 0.15 | |
| 1919 | 339,533 | 558,656 | 436,216 | 1,334,405 | 2.47 |
It is customary to classify the trade of a country as “special” and “entrepôt,” according as it represents exchange of domestic productions for imports for home consumption, or a mere transit trade. In many countries, such as Belgium, France, and the United Kingdom, the transit trade attains considerable importance, but New Zealand, owing to its geographical position, is precluded from developing in that direction. Her imports, except for a small forwarding trade to the Pacific islands, are for her own consumption, and the great bulk of her exports are commodities of domestic production.
The following table gives the proportion of special trade for the last ten years:—
“SPECIAL” and “ENTREPôT” TRADE of NEW ZEALAND.
| Year. | Trade (excluding Specie). | Re-exports (included in two preceding columns). | Percentage Re-exports. | |||
|---|---|---|---|---|---|---|
| Imports. | Exports. | Total. | To Imports | To Exports | ||
| £ | £ | £ | £ | |||
| 1910 | 16,748,223 | 22,152,473 | 38,900,696 | 208,310 | 1.24 | 0.94 |
| 1911 | 18,782,608 | 18,980,185 | 37,762,793 | 198,287 | 1.06 | 1.04 |
| 1912 | 20,576,579 | 21,511,626 | 42,088,205 | 239,221 | 1.16 | 1.11 |
| 1913 | 21,653,632 | 22,810,363 | 44,463,995 | 232,473 | 1.07 | 1.02 |
| 1914 | 21,144,227 | 26,253,925 | 47,398,152 | 269,208 | 1.27 | 1.03 |
| 1915 | 20,658,720 | 31,430,822 | 52,089,542 | 392,690 | 1.90 | 1.25 |
| 1916 | 25,045,403 | 33,281,057 | 58,326,460 | 311,030 | 1.24 | 0.93 |
| 1917 | 20,742,130 | 31,517,072 | 52,259,202 | 499,590 | 2.41 | 1.59 |
| 1918 | 24,131,792 | 28,480,578 | 52,612,370 | 579,178 | 2.40 | 2.04 |
| 1919 | 30,309,167 | 53,907,925 | 84,217,092 | 665,691 | 2.20 | 1.23 |
Before comparisons may properly be made with the trade of other countries care must be taken to ensure that the statistics are comparable in their methods of compilation and definition.
The value of imports into New Zealand has, since 1916, been reckoned at the fair market value in the country of export at the time of exportation, plus 10 per cent. (see subsection C of this section); exports are valued f.o.b. In the United States and Canada, however, the value of imports also are calculated f.o.b., and the difference representing freight insurance, and charges amounts to about 10 per cent. of the total value. Again, in the United Kingdom the values both of imports and exports are obtained by assessment at current market prices in the United Kingdom.
A comparison of the “special” trade of various countries in the Australian Commonwealth Official Year-book, 1916, covering in most cases the latest available year before the outbreak of the war, necessarily ignores many of the elements considered above, but gives a sufficiently accurate idea of the relative trade of the various countries.
In this comparison New Zealand heads the list as regards exports of domestic produce, Belgium taking second place. For imports of articles entered for consumption in the country itself, which in the case of such countries as the United Kingdom, Belgium, &., includes raw material imported for manufacturing purposes, New Zealand yields place only to Belgium, Switzerland, and the United Kingdom.
By themselves statistics of foreign trade are not a sure test of a country's prosperity, and they must always be interpreted with a knowledge of local conditions. An increase of imports may not be the result of increased purchasing-power, but may merely represent loans from another country, or even a failure of the home supply of certain commodities. Similarly, increased exports may mean greater productivity and increased purchasing-power, but they may also denote the payments on greatly increased liabilities.
In all countries the home trade is greatly in excess of the external trade, and in larger countries which are more self-contained a decrease in foreign trade may be due to development within the country itself. But New Zealand is far from self-contained, and from her position must attach a great importance to external trade. Under present conditions, only by export can a sufficient market be obtained for her rich resources, and only from abroad can be obtained the manufactures which are needed for common use. The development of the external trade since 1895 has been accompanied by increasing prosperity, and every advance in exports, followed in the next year by larger imports, represents an increase in the wealth of the Dominion.
IN New Zealand the Department of H.M. Customs requires for every package exported a declared statement of the contents, value, and destination. In all cases exports are valued “free on board at the port of shipment.” In many cases, however, the goods are not sold till arrival at their destination, and therefore values must be assessed in New Zealand with reference to current prices. It is possible, therefore, that an interim change in the markets overseas may to some extent falsify the values given to exports.
No account is taken in the export values of “ships’ stores” except where they are shipped “ex warehouse”—that is, from a bonded store under Customs control. The exports of New Zealand produce are separated from re-exports of foreign goods.
The ultimate destination of the goods is distinguished as far as is practicable, but it is impossible to discover what proportion of the exports is intended for home consumption in the country of destination. Goods for transhipment on a through bill of lading are, however, credited to the ultimate destination shown.
The following table gives a summary of the main exports from New Zealand during the last ten years.
The main feature of the table is the prominence given to the primary products of the soil. The extractive industries of New Zealand have always supplied the overwhelming bulk of the exports, and, though the proportion of the different classes has varied from time to time, there has never been any considerable or even noticeable export of manufactured goods.
It will be observed that the value of exports during 1919 constituted a record.
| EXPORTS of NEW ZEALAND PRODUCE.—PASTORAL PRODUCE. | |||||||
|---|---|---|---|---|---|---|---|
| Year. | Wool. | Frozen Meat. | Butter. | Cheese. | Tallow. | Skins, Hides, and Pelts. | Other Pastoral Produce.* |
*The main items in this heading are bacon and hams, beef and pork (salted), live-stock, preserved meats, sausage-skins, and preserved milk. | |||||||
| £ | £ | £ | £ | £ | £ | £ | |
| 1910 | 8,308,410 | 3,850,777 | 1,811,975 | 1,195,373 | 756,841 | 1,129,041 | 468,298 |
| 1911 | 6,491,707 | 3,503,406 | 1,576,917 | 1,192,057 | 607,257 | 911,519 | 467,695 |
| 1912 | 7,105,483 | 3,909,569 | 2,088,809 | 1,680,393 | 684,739 | 1,091,871 | 370,616 |
| 1913 | 8,057,620 | 4,449,933 | 2,061,651 | 1,770,297 | 663,088 | 1,199,375 | 317,181 |
| 1914 | 9,318,114 | 5,863,062 | 2,338,576 | 2,564,125 | 694,348 | 1,317,593 | 433,331 |
| 1915 | 10,387,875 | 7,794,395 | 2,700,625 | 2,730,211 | 780,828 | 1,450,276 | 690,398 |
| 1916 | 12,386,074 | 7,271,318 | 2,632,293 | 3,514,310 | 785,339 | 1,667,679 | 637,409 |
| 1917 | 12,175,366 | 5,982,404 | 2,031,551 | 3,949,251 | 553,016 | 1,861,817 | 776,194 |
| 1918 | 7,527,266 | 4,957,576 | 3,402,223 | 4,087,278 | 847,618 | 2,645,864 | 1,170,011 |
| 1919 | 19,559,537 | 9,628,292 | 3,080,128 | 7,790,990 | 2,680,006 | 3,439,468 | 2,432,819 |
| EXPORTS of NEW ZEALAND PRODUCE.—MINING and AGRICULTURAL PRODUCE. | ||||||||
|---|---|---|---|---|---|---|---|---|
| Year. | Wheat. | Oats. | Other Agricultural Produce.* | Gold. | Coal. | Kauri gum. | Phormium Fibre and Tow. | Timber. |
*The main items in this heading are bran and sharps, chaff, flour, barley, beans and peas, maize, malt, hops, oatmeal, potatoes, and seeds. | ||||||||
| £ | £ | £ | £ | £ | £ | £ | £ | |
| 1910 | 216,657 | 44,299 | 220,566 | 1,896,318 | 259,562 | 465,044 | 480,519 | 407,658 |
| 1911 | 219,196 | 9,211 | 184,408 | 1,815,251 | 204,379 | 395,707 | 325,130 | 439,353 |
| 1912 | 95,702 | 483,756 | 481,147 | 1,345,131 | 216,170 | 401,305 | 407,903 | 490,508 |
| 1913 | 11,816 | 29,252 | 238,908 | 1,459,499 | 205,010 | 549,106 | 797,062 | 319,055 |
| 1914 | 3,580 | 165,930 | 278,894 | 895,367 | 282,163 | 497,444 | 492,230 | 422,864 |
| 1915 | 128 | 132,827 | 541,318 | 1,694,553 | 329,731 | 279,133 | 610,059 | 383,883 |
| 1916 | 17,835 | 30,200 | 135,680 | 1,199,212 | 326,553 | 339,882 | 1,078,632 | 381,488 |
| 1917 | 509 | 1,306 | 178,087 | 903,888 | 236,063 | 291,917 | 1,232,608 | 408,121 |
| 1918 | 460 | 872 | 194,422 | 42,391 | 227,228 | 157,313 | 1,408,147 | 556,309 |
| 1919 | 679 | 33,671 | 753,837 | 1,334,405 | 201,383 | 255,812 | 907,584 | 439,935 |
In recent years the proportions of the principal exports have changed a good deal. Wool, which reached its maximum percentage (47.9) in 1897, showed a tendency to decline till 1902, since when the tendency has been to regain its former pre-eminence. Frozen meat has throughout shown a steady tendency to increase.
The main feature of the period has been the great advance, relatively and absolutely, of dairy-produce, especially cheese. This advance has been shared by all classes of pastoral produce and, except for a set-back in 1919, by phormium. Agricultural produce shows a fluctuating export, reaching its highest percentage in 1899–1901, the period of the South African War.
In the following table the exports are classified under the main industries, according to a broad division, to illustrate the relative importance of the pastoral, agricultural, mining, forest, and other industries as far as the export trade is concerned. It must be remembered that in a particular industry the home trade may be relatively more important than the external trade.
The table indicates a tendency for the Dominion to rely more and more upon the pastoral industry for her main exports. The four main products of that industry—wool, frozen meat, butter, and cheese—provide an ever-increasing proportion of the total quantity of goods shipped overseas. On the other hand, the proportion of minerals has tended to fall, through decreasing exports of gold, and agricultural exports fluctuate with a downward tendency. It would seem that New Zealand is restricting her agriculture to a level barely sufficient to provide for her own needs in the matter of foodstuffs, and only in exceptionally good years is there a surplus available for export.
TABLE showing PROPORTIONS of EXPORTS supplied by the MAIN INDUSTRIES, 1910–1919.
| — | Exports. | Percentage of Total Exports. | ||||||||
|---|---|---|---|---|---|---|---|---|---|---|
| Pastoral. | Mining. | Agricultural. | Forest. | Other. | Pastoral. | Mining. | Agricultural. | Forest. | Other. | |
| £ | £ | £ | £ | £ | Per Cent. | Per Cent. | Per Cent. | Per Cent. | Per Cent. | |
| 1910 | 17,520,715 | 2,344,348 | 481,522 | 889,603 | 944,021 | 79.0 | 10.6 | 2.2 | 4.0 | 4.2 |
| 1911 | 14,750,558 | 2,165,137 | 412,815 | 843,310 | 856,670 | 77.5 | 11.4 | 2.2 | 4.4 | 4.5 |
| 1912 | 16,931,480 | 1,660,280 | 1,060,605 | 900,671 | 1,217,545 | 77.8 | 7.6 | 4.9 | 4.1 | 5.6 |
| 1913 | 18,519,145 | 1,791,777 | 279,976 | 874,110 | 1,521,714 | 80.6 | 7.8 | 1.2 | 3.8 | 6.6 |
| 1914 | 22,529,149 | 1,263,553 | 448,404 | 927,482 | 1,092,859 | 85.8 | 4.8 | 1.7 | 3.5 | 4.2 |
| 1915 | 26,534,608 | 2,149,217 | 674,273 | 674,533 | 1,716,281 | 83.6 | 6.8 | 2.1 | 2.1 | 5.4 |
| 1916 | 28,894,422 | 1,661,650 | 183,797 | 734,034 | 1,502,004 | 87.6 | 5.0 | 0.6 | 2.2 | 4.6 |
| 1917 | 27,329,599 | 1,274,222 | 179,902 | 711,188 | 1,593,046 | 86.5 | 4.0 | 0.6 | 2.3 | 5.0 |
| 1918 | 24,638,531 | 479,017 | 196,291 | 719,538 | 1,903,633 | 86.4 | 1.7 | 0.7 | 2.5 | 6.7 |
| 1919 | 48,611,240 | 1,668,314 | 788,187 | 698,849 | 1,537,794 | 90.7 | 3.1 | 1.5 | 1.3 | 2.8 |
The most noticeable feature of the above table is the extremely high proportion of the exports supplied by the pastoral industry. It is notable that the percentage supplied by this group was fairly high in the late “nineties,” but in the early years of the new century fell relatively, owing mainly to increased exports of agricultural and mining produce. Since 1901, however, the percentage has increased almost continuously, a record being established in 1919, when the exports of pastoral products amounted to over 91 per cent. of the total.
On the whole, mining products are growing less important to New Zealand, mainly because of the overwhelming increase of the pastoral products. In later years especially this tendency to diminish is noticeable.
Agricultural exports showed an abnormal increase from 1899 to 1903, the period which covers the South African War, but since then their importance has declined. Their lowest level (0.6 per cent. of total exports) was reached in 1916 and 1917. Forest products, too, though steady, showed a relative downward tendency.
Measured by their value in money the exports of 1919 constituted a record, the total being not far short of double the previous year's. Wool retained its leading position, and with £19,559,537 to its credit accounted for 36 per cent. of the Dominion's total sales abroad. Frozen meat stood at £9,628,292, an increase of one-third on the figure for the previous year.
It should be mentioned, however, that an increased value is not in all cases an indication of increased output, being in many cases accountable for (especially during the war period) solely by enhanced prices. Thus, while the actual amount of wool exported in 1916 was 6 per cent. less than the quantity shipped in 1915, the value of this commodity exported showed an increase of, roughly, £2,000,000. A fuller reference to the effect of price-changes upon most of the main items will be found further on in this subsection.
In 1914 a new method of classification was adopted, and both imports and exports were divided into classes, which will in the future be adhered to in all statistical comparisons. The total exports of each class in 1919 are shown in the following table:—
EXPORTS by CLASSES, 1919.
| No. | Class. | Domestic Produce. | Foreign Produce. |
|---|---|---|---|
| £ | £ | ||
| I | Foodstuffs of animal origin (excluding live animals) | 22,876,020 | 23,909 |
| II | Foodstuffs of vegetable origin and common salt | 590,778 | 46,869 |
| III | Beverages (non-alcoholic), and substances used in making up the same | 1,372 | 15,850 |
| IV | Spirits and alcoholic liquors | 2,575 | 35,334 |
| V | Tobacco and preparations thereof | 211 | 15,396 |
| VI | Live animals | 47,925 | 274 |
| VII | Animal substances (mainly unmanufactured), not being foodstuffs | 23,011,477 | 7 |
| VIII | Vegetable substances and non-manufactured fibres | 1,226,968 | 38,544 |
| IXA | Apparel | 187,024 | 22,651 |
| IXB | Textiles | 8,905 | 76,689 |
| IXC | Manufactured fibres | 12,411 | 7,377 |
| X | Oils, fats, and waxes | 2,721,169 | 7,312 |
| XI | Paints and varnishes | 275 | 7,214 |
| XII | Stones and minerals used industrially | 461,281 | 26,221 |
| XIII | Speciẹ̣̣̣̣̣ | 62,150 | |
| XIVA | Metal (unmanufactured and partly manufactured) and ores | 1,478,005 | 2,142 |
| XIVB | Metal manufactures, other than machinery and machines | 7,002 | 30,634 |
| XV | Machinery and machines | 22,703 | 46,782 |
| XVIA | Indiarubber and manufactures thereof (not including tires) | 2,081 | 703 |
| XVIB | Leather and manufactures thereof, including substitutes | 65,825 | 9,619 |
| XVIIA | Timber | 439,935 | 310 |
| XVIIB | Wood, cane, and wicker manufactures | 2,398 | 770 |
| XVIII | Earthenware, china, glass, stoneware, cement, and cement materials | 9,219 | 2,385 |
| XIXA | Paper | 877 | 1,352 |
| XIXB | Stationery | 6,398 | 8,637 |
| XX | Jewellery, timepieces, and fancy goods | 110 | 71,299 |
| XXI | Optical, surgical, and scientific instruments | 172 | 14,823 |
| XXIIA | Drugs, chemicals, and druggists’ wares | 24,789 | 14,674 |
| XXIIB | Manures | 243 | 18 |
| XXIII | Miscellaneous | 19,935 | 75,746 |
| Parcels-post | 76,301 | ||
| Total | 53,304,384 | 665,691 |
It will be seen that the great bulk of the exports fail into two classes—I, which includes butter and cheese, frozen meat, and fish; and VII, which includes wool, hides, skins, pelts, and hair. Mineral products fall under XII and XIVA, and timber under XVIIA; tallow is the main item in X, phormium, seeds, and fungus in VIII, while the main agricultural products are included in II.
The re-exports are clearly shown to be spread over various manufactured items, and, indeed, are mainly returned imports, since the genuine entrepôt trade is very small.
The principal items of export may conveniently be grouped under six definite heads, and for nearly fifty years a decennial table has been published in the “Statistics of the Dominion of New Zealand” using this method of summary. A comparative statement is given below for the past five years, following the classification therein adopted.
Practically all the main commodities are homogeneous articles, and it is therefore possible to give the quantities exported. For some purposes quantities are preferable to values, since the latter contain the variable element of price.
QUANTITIES of the PRINCIPAL ARTICLES of NEW ZEALAND PRODUCE exported, 1915–19.
| Articles. | 1915. | 1916. | 1917. | 1918. | 1919. |
|---|---|---|---|---|---|
| The mine— | |||||
| Coaḷ̣̣̣ (tons) | 323,992 | 328,183 | 221,125 | 182,603 | 138,174 |
| Golḍ̣̣̣ (oz.) | 422,825 | 292,620 | 218,624 | 11,987 | 320,210 |
| Silveṛ̣̣̣ (oz.) | 957,541 | 787,053 | 787,152 | 879,383 | 453,567 |
| Other mineralṣ̣ (tons) | 244 | 304 | 161 | 171 | 131 |
| The fisheries— | |||||
| Fisḥ̣̣̣ (cwt.) | 17,698 | 19,372 | 12,370 | 8,633 | 5,499 |
| Oysterṣ̣̣ (doz.) | 283,735 | 178,354 | 30,900 | 142,800 | 29,347 |
| Whalebonẹ̣ (lb.) | 896 | 896 | |||
| Whale-oiḷ̣ (gal.) | 40,397 | 22,740 | 46,151 | 64,940 | 114,732 |
| The forest— | |||||
| Funguṣ̣̣ (cwt.) | 2,881 | 3,829 | 3,610 | 2,054 | 989 |
| Kauri-guṃ̣ (tons) | 4,575 | 5,456 | 4,594 | 2,419 | 4,128 |
| Timber, sawn and hewṇ̣̣ (sup. ft.) | 76,797,161 | 71,503,154 | 71,838,174 | 74,932,815 | 49,726,670 |
| Pastoral products— | |||||
| Bacon and hamṣ̣ (cwt.) | 3,469 | 2,646 | 1,359 | 3,475 | 425 |
| Beef and pork, salted (cwt.) | 3,823 | 2,794 | 4,416 | 4,904 | 4,274 |
| Butteṛ̣̣̣ (cwt.) | 420,144 | 358,632 | 254,397 | 431,023 | 345,818 |
| Cheesẹ̣̣̣ (cwt.) | 817,258 | 949,416 | 885,743 | 883,430 | 1,572,311 |
| Hides and skinṣ̣(number) | 516,799 | 510,936 | 237,906 | 820,832 | 440,492 |
| Live-stock— | |||||
| Cattlẹ̣(number) | 386 | 297 | 357 | 402 | 309 |
| Horseṣ̣ (number) | 5,738 | 2,453 | 283 | 316 | 134 |
| Sheep̣̣ (number) | 8,396 | 7,241 | 5,158 | 3,251 | 1,355 |
| Pigṣ̣ (number) | 528 | 367 | 714 | 626 | 456 |
| Preserved meatṣ̣ (cwt.) | 61,851 | 65,582 | 55,008 | 74,903 | 218,802 |
| Frozen meatṣ̣ (cwt.) | 3,591,260 | 2,326,045 | 2,446,945 | 2,036,904 | 3,822,683 |
| Sausage-skinṣ̣ (cwt.) | 44,707 | 22,612 | 18,132 | 19,899 | 22,868 |
| Rabbit-skinṣ̣(number) | 6,090,872 | 5,896,410 | 4,944,607 | 7,854,152 | 14,340,007 |
| Sheep skins and pelts (number) | 9,093,850 | 8,335,570 | 6,528,053 | 8,741,538 | 8,501,756 |
| Talloẉ̣̣̣ (cwt.) | 535,260 | 449,440 | 251,980 | 328,420 | 937,480 |
| Wooḷ̣̣̣ (lb.) | 196,570,114 | 185,506,859 | 178,274,486 | 108,724,575 | 274,246,618 |
| Agricultural products— | |||||
| Bran and sharpṣ̣ (tons) | 6,629 | 619 | 340 | 275 | 543 |
| Chaff̣̣̣̣ (tons) | 27,032 | 386 | 354 | 249 | 575 |
| Flouṛ̣̣̣ (tons) | 173 | 131 | 744 | 1,541 | 2,876 |
| Grain— | |||||
| Barleỵ̣ (centals) | 11,153 | 429 | 911 | 412 | 705 |
| Beans and peas (centals) | 121,165 | 50,501 | 66,705 | 54,297 | 252,892 |
| Oatṣ̣̣̣ (centals) | 273,061 | 88,106 | 2,307 | 1,300 | 57,931 |
| Wheaṭ̣ (centals) | 216 | 41,287 | 902 | 674 | 974 |
| Hopṣ̣̣̣ (cwt.) | 4,336 | 4,358 | 2,805 | 2,010 | 2,214 |
| Oatmeaḷ̣ (tons) | 18 | 11 | 16 | 87 | 78 |
| Potatoeṣ̣ (tons) | 19,572 | 1,724 | 727 | 440 | 3,603 |
| Seeds (grass and (cwt) clover) | 13,980 | 9,841 | 16,484 | 15,99 | 49,906 |
| Miscellaneous— | |||||
| Ale and beeṛ̣ (gal.) | 23,025 | 11,948 | 11,989 | 12,782 | 16,303 |
| Cordagẹ̣ (cwt.) | 10,654 | 6,508 | 7,872 | 7,359 | 3,354 |
| Leatheṛ̣ (cwt.) | 6,678 | 3,499 | 845 | 2,228 | 4,433 |
| Phormium fibre and (tons) tow | 26,685 | 32,252 | 26,016 | 26,982 | 25,609 |
| Soap̣̣̣̣ (cwt.) | 6,973 | 9,748 | 9,287 | 7,361 | 6,588 |
The values of these principal commodities are tabulated in the following pages, and the statement of exports is rendered complete by the addition of miscellaneous groups and the provision of totals for each group and for all combined.
VALUE of PRINCIPAL ARTICLES exported, 1915–19.
| Articles. | 1915. | 1916. | 1917. | 1918. | 1919. |
|---|---|---|---|---|---|
| £ | £ | £ | £ | £ | |
| The mine— | |||||
| Coal | 329,731 | 326,553 | 236,063 | 227,228 | 201,383 |
| Gold | 1,694,553 | 1,199,212 | 903,888 | 42,391 | 1,334,405 |
| Silver | 93,583 | 85,111 | 105,299 | 171,456 | 103,037 |
| Other minerals | 29,350 | 50,774 | 28,972 | 37,942 | 29,489 |
| Totals | 2,149,217 | 1,661,650 | 1,274,222 | 479,017 | 1,668,314 |
| The fisheries— | |||||
| Fish | 37,166 | 37,475 | 23,818 | 19,202 | 17,425 |
| Oysters | 2,057 | 1,340 | 244 | 1,114 | 342 |
| Whalebone | 250 | 280 | |||
| Whale-oil | 3,011 | 1,647 | 5,511 | 12,618 | 22,908 |
| Other | 2,412 | 1,751 | 201 | 25 | 402 |
| Totals | 44,896 | 42,493 | 29,774 | 32,959 | 41,077 |
| The forest— | |||||
| Fungus | 9,709 | 12,227 | 10,688 | 5,784 | 2,523 |
| Kauri-gum | 279,133 | 339,882 | 291,917 | 157,313 | 255,812 |
| Timber | 383,883 | 381,488 | 408,121 | 556,309 | 439,935 |
| Other | 1,808 | 437 | 462 | 132 | 579 |
| Totals | 674,533 | 734,034 | 711,188 | 719,538 | 698,849 |
| Pastoral products— | |||||
| Bacon and hams | 15,717 | 13,329 | 7,974 | 21,901 | 2,993 |
| Beef and pork, salted | 7,227 | 5,647 | 11,310 | 13,862 | 11,787 |
| Butter | 2,700,625 | 2,632,293 | 2,031,551 | 3,402,223 | 3,080,128 |
| Cheese | 2,730,211 | 3,514,310 | 3,949,251 | 4,087,278 | 7,790,990 |
| Hides and skins | 573,765 | 673,641 | 456,308 | 532,510 | 969,483 |
| Live-stock— | |||||
| Cattle | 7,357 | 5,612 | 11,381 | 16,743 | 8,914 |
| Horses | 154,488 | 79,720 | 20,447 | 29,544 | 27,715 |
| Sheep | 26,594 | 23,089 | 19,096 | 16,933 | 7,311 |
| Pigs | 1,954 | 1,453 | 3,122 | 4,350 | 3,100 |
| Other | 2,160 | 453 | 485 | 1,033 | 885 |
| Preserved milk and cream | 20,388 | 23,780 | 153,538 | 341,797 | 579,266 |
| Preserved meats | 223,666 | 249,519 | 278,753 | 420,179 | 1,283,218 |
| Frozen meats | 7,794,395 | 7,271,318 | 5,982,404 | 4,957,576 | 9,628,292 |
| Sausage-skins | 192,028 | 196,785 | 227,431 | 257,871 | 324,001 |
| Rabbit-skins | 59,004 | 76,405 | 105,321 | 299,765 | 775,118 |
| Sheep skins and pelts | 826,507 | 917,633 | 1,300,188 | 1,813,589 | 1,694,867 |
| Tallow | 780,828 | 785,339 | 553,016 | 847,618 | 2,680,006 |
| Wool | 10,387,875 | 12,386,074 | 12,175,366 | 7,527,266 | 19,559,537 |
| Other | 38,819 | 38,022 | 42,657 | 46,493 | 183,629 |
| Totals | 26,534,608 | 28,894,422 | 27,329,599 | 24,638,531 | 48,611,240 |
| Agricultural products— | |||||
| Bran and sharps | 52,051 | 3,702 | 2,111 | 1,827 | 4,555 |
| Chaff | 154,552 | 2,727 | 2,917 | 3,155 | 5,875 |
| Flour | 2,678 | 2,154 | 13,595 | 29,341 | 53,188 |
| Fruits | 21,603 | 7,493 | 722 | 307 | 1,729 |
| Grain and pulse— | |||||
| Barley | 5,318 | 218 | 513 | 307 | 481 |
| Beans and peas | 77,022 | 38,545 | 72,077 | 71,282 | 319,516 |
| Oats | 132,827 | 30,200 | 1,306 | 872 | 33,671 |
| Wheat | 128 | 17,835 | 509 | 460 | 679 |
| Other | 168 | 723 | 880 | 1,240 | 3,973 |
| Hops | 18,536 | 17,632 | 1038 | 11,234 | 16,301 |
| Oatmeal | 336 | 271 | 340 | 2,083 | 3,267 |
| Onions | 7,475 | 3,778 | 9,814 | 2,099 | 6,018 |
| Potatoes | 135,552 | 14,941 | 5,816 | 4,279 | 38,718 |
| Seeds (grass and clover) | 42,314 | 34,266 | 48,635 | 42,215 | 249,886 |
| Seeds (various) | 7,459 | 7,622 | 6,937 | 24,372 | 49,127 |
| Other | 16,254 | 1,690 | 1,683 | 1,218 | 1,203 |
| Totals | 674,273 | 18,797 | 179,902 | 196,291 | 788,187 |
| Miscellaneous (including manufactures)— | |||||
| Ale and beer | 3,223 | 1,661 | 1,456 | 1,442 | 2,508 |
| Apparel | 37,606 | 36,589 | 55,808 | 92,814 | 136,045 |
| Cement | 28,503 | 18,711 | 5,506 | 7,651 | 6,976 |
| Cordage | 2,571 | 17,553 | 22,781 | 26,630 | 10,525 |
| Foods, infants’ and invalids’ | 45,297 | 37,890 | 31 | 6 | 12 |
| Leather | 61,795 | 35,143 | 10,458 | 28,095 | 64,645 |
| Phormium fibre and tow | 610,059 | 1,078,632 | 1,232,608 | 1,408,147 | 907,584 |
| Soap | 9,260 | 12,393 | 14,846 | 14,724 | 14,069 |
| Sugar | 24,663 | 48,183 | 62,102 | 19,238 | 26,699 |
| Woollen manufactures | 18,592 | 19,504 | 8,780 | 10,632 | 8,866 |
| Other | 115,515 | 153,252 | 148,896 | 261,295 | 318,788 |
| Totals | 965,335 | 1,459,511 | 1,563,272 | 1,870,674 | 1,496,717 |
| Total exports (domestic produce) | 31,042,862 | 32,75,907 | 31,087,957 | 27,937,010 | 53,304,384 |
| Specie | 318,090 | 5,880 | 70,475 | 35,610 | 62,150 |
| Re-exports | 387,960 | 305,150 | 429,115 | 543,568 | 603,541 |
| Total exports | 31,748,912 | 3,286,937 | 31,587,547 | 28,516,188 | 53,970,075 |
The first exports from New Zealand went naturally to the earlier-developed sister colony, and for a considerable time Australia had a monopoly of our trade. In 1865 70 per cent., and in 1871 44 per cent., of the total exports went to Australia. But since the establishment of direct shipping lines with the United Kingdom the Mother-land has absorbed the bulk of New Zealand exports, and four-fifths of the total exports normally go to the United Kingdom. This proportion has prevailed with but slight variations for forty years, the most notable variation being the marked fall in 1918 in the proportion of the total exports destined for that country. The total amount sent to Australia fluctuates considerably from year to year, usually rising if the products of the Commonwealth are reduced by drought.
During and since 1916 exports to the United States have exceeded those to Australia. This increase has been mainly confined to raw materials, the items concerned being fairly uniformly distributed throughout this group. Ceylon, the South African Union, and Hong Kong within the Empire, and France, Belgium, and Uruguay among foreign countries, were prior to the war probably the most reregular customers, though the abnormal conditions of the last six years have dislocated their trade and given to Egypt an importance hitherto unknown. An interesting recent feature is the fluctuation of exports (principally wool) to Japan, which rose from a modest £377 in 1911, to £137,464 in 1915, falling again to £8,178 in 1919.
| — | United Kingdom. | Australia. | Canada. | Pacific Islands.* | United States. | Germany. | Other Countries.† | Total. |
|---|---|---|---|---|---|---|---|---|
*Includes Cook Islands prior to 1902. †The principal other countries are Hong Kong, India, France, Egypt, and Japan. | ||||||||
| £ | £ | £ | £ | £ | £ | £ | £ | |
| 1910 | 18,633,118 | 2,010,751 | 160,842 | 296,244 | 553,603 | 205,931 | 319,720 | 22,180,209 |
| 1911 | 15,134,743 | 2,515,168 | 199,587 | 324,306 | 434,586 | 170,493 | 249,607 | 19,028,490 |
| 1912 | 16,861,256 | 2,848,664 | 542,271 | 338,621 | 620,988 | 254,703 | 304,078 | 21,770,581 |
| 1913 | 18,130,160 | 2,315,747 | 606,662 | 295,032 | 912,051 | 337,448 | 389,622 | 22,986,722 |
| 1914 | 21,383,891 | 1,928,410 | 595,611 | 326,025 | 1,028,054 | 456,163 | 543,293 | 26,261,447 |
| 1915 | 25,389,030 | 2,548,605 | 925,813 | 499,063 | 2,006,507 | 4 | 379,890 | 31,748,912 |
| 1916 | 26,869,988 | 2,191,545 | 691,986 | 368,069 | 2,493,987 | 5 | 671,357 | 33,286,937 |
| 1917 | 26,023,396 | 1,460,980 | 961,683 | 540,380 | 1,894,317 | 6 | 706,785 | 31,587,547 |
| 1918 | 18,244,250 | 1,803,739 | 1,793,576 | 511,842 | 4,045,648 | 2,117,133 | 28,516,188 | |
| 1919 | 44,312,048 | 2,249,827 | 980,190 | 548,112 | 4,200,861 | 1,679,037 | 53,970,075 | |
On the average only about four-fifths of the exports from New Zealand to the United Kingdom are normally retained in that country, and the remaining fifth is distributed to Europe and America. Even deducting this re-export trade, the Mother-country may be said to retain two-thirds of the total exports from the Dominion. The following table must be read in conjunction with the fact that in the case of a large proportion of the goods shipped to London that port is regarded merely as a convenient depot whence they may be retransferred to other countries:—
| DESTINATION of EXPORTS, 1910–1919. | ||||
|---|---|---|---|---|
| Year. | United Kingdom. | British Colonies and Possessions. | Foreign Countries. | Total. |
| £ | £ | £ | £ | |
| 1910 | 18,633,118 | 2,468,119 | 1,078,972 | 22,180,209 |
| 1911 | 15,134,743 | 2,966,952 | 926,795 | 19,028,490 |
| 1912 | 16,861,256 | 3,641,276 | 1,268,049 | 21,770,581 |
| 1913 | 18,130,160 | 3,135,957 | 1,720,605 | 22,986,722 |
| 1914 | 21,383,891 | 2,724,965 | 2,152,591 | 26,261,447 |
| 1915 | 25,389,030 | 3,694,453 | 2,665,429 | 31,748,912 |
| 1916 | 26,869,988 | 3,122,187 | 3,294,762 | 33,286,937 |
| 1917 | 26,023,396 | 2,635,002 | 2,929,149 | 31,587,547 |
| 1918 | 18,244,250 | 3,808,892 | 6,466,046 | 28,516,188 |
| 1919 | 44,312,048 | 3,750,655 | 5,907,372 | 53,970,075 |
In the following table exports have been grouped in accordance with the classification adopted by the British Board of Trade in many of its tables. As might be expected, the classification shows that raw material (other than foodstuffs) is the largest of the five divisions, food, drink, and tobacco coming next. Many of the most important items in this latter class are raw materials also, and the table is a further illustration of the fact that New Zealand is essentially a primary-producing country. Exports of manufactures in 1919 constituted only 6.47 per cent. of the total. A similar table given in the Imports subsection of this book shows that the reverse is the case in respect of imports—namely, a preponderance of manufactured goods received into the Dominion.
| Countries. | Food, Drink, and Tobacco. | Raw Materials and Articles mainly unmanufactured. | Articles wholly or mainly manufactured. | Miscellaneous and Unclassified (including Parcels-post). | Bullion and Specie. | Total. |
|---|---|---|---|---|---|---|
| £ | £ | £ | £ | £ | £ | |
| United Kingdom | 21,454,044 | 19,886,184 | 2,401,561 | 224,587 | 345,672 | 44,312,048 |
| British Possessions. | ||||||
| Europe— | ||||||
| Gibraltar | 2 | 2 | ||||
| Malta | 4 | 4 | ||||
| Asia— | ||||||
| Ceylon | 177 | 301 | 478 | |||
| Hong Kong | 334 | 2,518 | 709 | 72 | 8,630 | 12,263 |
| India | 78,315 | 70,160 | 370 | 775 | 179,254 | 328,874 |
| Straits Settlements | 2,136 | 3,135 | 165 | 22,771 | 28,207 | |
| Other British possessions in Asia | 19 | 8 | 27 | |||
| Africa— | ||||||
| South African Union | 1,263 | 585 | 393 | 2,241 | ||
| Other British possessions in Africa | 308 | 69 | 377 | |||
| America— | ||||||
| Canada | 176,585 | 673,219 | 120,913 | 9,473 | 980,190 | |
| Other British possessions in America | 16 | 16 | ||||
| Pacific Islands— | ||||||
| Australia | 242,272 | 953,945 | 284,371 | 160,376 | 608,803 | 2,249,827 |
| British Solomon Islands Protectorate | 1,632 | 34 | 820 | 24 | 2,510 | |
| Fanning Island | 303 | 82 | 1,000 | 1,385 | ||
| Fiji | 80,593 | 15,428 | 40,403 | 4,137 | 274 | 140,835 |
| Gilbert and Ellice Islands | 190 | 675 | 54 | 1 | 920 | |
| Norfolk Island | 528 | 268 | 26 | 822 | ||
| Papua | 1,598 | 48 | 23 | 1,669 | ||
| Other British possessions in Pacific islands | 5 | 3 | 8 | |||
| Foreign Countries and Possessions. | ||||||
| Europe— | ||||||
| France | 27 | 98,243 | 303 | 98,573 | ||
| Italy | 17,378 | 3,929 | 49,416 | 90 | 70,813 | |
| Norway | 963 | 33 | 996 | |||
| Switzerland | 580 | 1,533 | 2,113 | |||
| Other foreign possessions in Europe | 8 | 169 | 177 | |||
| Asia— | ||||||
| China | 349 | 418 | 32,012 | 32,779 | ||
| Japan | 123 | 1,592 | 6,192 | 271 | 8,178 | |
| Java | 817 | 12 | 829 | |||
| Malay States | 4,000 | 70 | 4,070 | |||
| Persia | 27,000 | 27,000 | ||||
| Other foreign possessions in Asia | 1 | 34 | 69 | 104 | ||
| Africa— | ||||||
| Egypt | 1,049,840 | 9,682 | 61 | 1,059,583 | ||
| Other foreign possessions in Africa | 7 | 7 | ||||
| America— | ||||||
| Argentina | 23 | 23 | ||||
| United States of America | 304,143 | 3,195,352 | 434,320 | 32,048 | 234,998 | 4,200,861 |
| Uruguay | 16 | 16 | ||||
| Other American possessions | 401 | 879 | 7 | 1,287 | ||
| Pacific Islands— | ||||||
| German Samoa | 54,324 | 2,198 | 36,142 | 398 | 93,062 | |
| Hawaii | 1,636 | 1 | 46 | 363 | 2,046 | |
| Society Islands | 78,530 | 13,493 | 23,475 | 7,671 | 123,169 | |
| Tonga | 56,183 | 3,772 | 44,175 | 1,935 | 61,150 | 167,215 |
| Tutuila | 1,487 | 37 | 408 | 11 | 1,943 | |
| Other foreign Pacific islands | 4,657 | 6,757 | 1,092 | 22 | 12,528 | |
| Totals | 23,608,312 | 24,928,901 | 3,492,234 | 445,996 | 1,494,632 | 53,970,075 |
In order to give further detail concerning the destination of the main exports a number of tables are appended showing the details for five years for each of the principal articles.
DESTINATION of MAIN EXPORTS, 1915–19.
| Country to which exported. | 1915. | 1916. | 1917. | 1918. | 1919. |
|---|---|---|---|---|---|
| WOOL. | |||||
| lb. | lb. | lb. | lb. | lb. | |
| United Kingdoṃ̣ | 183,011,230 | 162,452,392 | 168,062,049 | 80,502,867 | 258,388,501 |
| Indiạ̣ ̣̣ ̣̣ ̣̣ ̣̣ ̣̣ | 1,031,906 | ||||
| Canadạ̣̣̣ | 2,881,566 | 2,508,349 | 3,620,449 | 8,191,769 | 49,661 |
| Australiạ̣̣̣ | 1,579,063 | 555,881 ̣̣ | 523,057 ̣̣ | ||
| Belgiuṃ̣ ̣̣ ̣̣ ̣̣ ̣̣ ̣̣ ̣̣ | |||||
| Francẹ̣ ̣̣ ̣̣ | 4,369,748 | 6,591,988 | 11,328,194 | 1,482,037 | |
| Germanỵ̣ ̣̣ ̣̣ ̣̣ ̣̣ ̣̣ ̣̣ | |||||
| Japaṇ̣̣̣ | 2,998,791 | 2,182,035 | |||
| United States of America | 6,113,073 | 13,438,854 | 8,178,688 | 13,294,508 | |
| Other countries | |||||
| Totalṣ̣ | 196,583,723 | 185,507,259 | 178,274,486 | 108,724,575 | 274,246,613 |
| FROZEN MEAT. | |||||
| Cwt. | Cwt. | Cwt. | Cwt. | Cwt. | |
| United Kingdoṃ̣ | 3,582,602 | 3,319,911 | 2,438,456 | 1,537,671 | 3,469,842 |
| Canadạ̣̣̣ | 221 | 2,584 | 70,671 | 18,671 | |
| Pacific islandṣ̣ | 2,805 | 467 | 547 | 603 | 556 |
| Australiạ̣̣̣ | 4,603 | 5,667 | 11 | 275 | |
| Gibraltar | |||||
| United States of America | 1,025 | 638 | 1,888 | ||
| Egypt | 25,334 | 427,034 | 331,724 | ||
| Other countries | 4 ̣̣ | ||||
| Totals | 3,591,260 | 3,326,045 | 2,466,932 | 2,036,892 | 3,822,681 |
| BUTTER. | |||||
| United Kingdom | 371,959 | 336,412 | 250,721 | 415,250 | 336,606 |
| South African Union | 200 | ||||
| Canadạ̣ | 18,838 | 3,557 | 304 | 11,893 | 6,000 |
| Pacific islands | 3,791 | 3,094 | 1,872 | 1,495 | 2,126 |
| Australiạ̣ | 25,269 | 15,566 | 1,499 | 36 | 6 |
| United States of America | 87 | 3 | 1 | ||
| Other countries ̣̣ | 1,949 | 1,080 | |||
| Totals | 420,144 | 358,632 | 254,397 | 431,023 | 345,818 |
| CHEESE. | |||||
| United Kingdom | 803,917 | 942,773 | 865,152 | 844,198 | 1,517,102 |
| Indiạ̣ | 19 | 63 | 23 | 2 | 14,973 |
| South African Union | 1,971 | 1,574 | |||
| Pacific islands | 278 | 239 | 279 | 233 | 372 |
| Australiạ̣ | 10,729 | 4,682 | 314 | 256 | 105 |
| Egypt | 19,975 | 38,646 | 39,796 | ||
| Other countries | 344 | 85 | 110 | 5 | |
| Totals | 817,258 | 949,416 | 885,743 | 883,445 | 1,572,353 |
| TALLOW. | |||||
| Tons. | Tons. | Tons. | Tons. | Tons. | |
| United Kingdom | 26,599 | 22,333 | 9,672 | 3,529 | 36,170 |
| Pacific islands | 68 | 127 | 143 | 109 | 87 |
| Australiạ̣ | 92 | 12 | 464 | 96 | 240 |
| Canadạ̣ | 4 | 1,256 | 5,872 | 2,261 | |
| United States of America | 375 | 6,018 | 6,985 | ||
| Other countries | 689 | 797 | 1,131 | ||
| Totals | 26,763 | 22,472 | 12,599 | 16,421 | 46,874 |
| HIDES (HORSE and CATTLE). | |||||
| Number. | Number. | Number. | Number. | Number. | |
| United Kingdom | 69,013 | 32,084 | 98,142 | 53,848 | 9,996 |
| Canadạ̣ | 150,758 | 114,488 | 72,633 | 82,942 | 89,013 |
| Australiạ̣ | 49,703 | 151,624 | 7,551 | 65,736 | 118,506 |
| Fijị̣̣̣ ̣̣ | 3 | ||||
| United States of America | 889 | 6,434 | 103,936 | ||
| Other countries ̣̣ | 435 | ||||
| Totals | 270,363 | 298,196 | 178,326 | 208,960 | 321,88 |
| Number. | Number. | Number. | Number. | Number. | |
| United Kingdom | 5,323,176 | 4,819,597 | 879,483 | 254,868 | 3,032,188 |
| Canadạ̣ | 98,400 | 1,611,089 | 2,871,980 | 1,633,067 | |
| Australiạ̣ | 255,241 | 225,551 | 201,822 | 52,917 | 39,485 |
| United States of America | 412,555 | 851,132 | 2,252,213 | 4,674,387 | 9,635,267 |
| Other countries | 1,500 | 130 | |||
| Totals | 6,090,872 | 5,896,410 | 4,944,607 | 7,854,152 | 14,340,007 |
| SHEEP SKINS and PELTS. | |||||
| United Kingdom | 8,375,638 | 4,141,630 | 1,786,153 | 65,163 | 2,638,378 |
| Canadạ̣ | 301,075 | 440,138 | 49,327 | 340,620 | 530,492 |
| Australiạ̣ | 374,333 | 433,370 | 205,809 | 123,370 | 22,466 |
| United States of America | 42,804 | 3,320,394 | 4,486,764 | 8,212,385 | 5,310,420 |
| Other countries | 38 | ||||
| Totals | 9,093,850 | 8,335,570 | 6,528,053 | 8,741,538 | 8,501,756 |
| SAUSAGE-skins. | |||||
| Cwt. | Cwt. | Cwt. | Cwt. | Cwt. | |
| United Kingdom | 34,120 | 6,511 | 4 | 3,451 | |
| Canadạ̣ | 322 | 2,295 | 2,390 | 3,527 | 3,537 |
| Australiạ̣ | 1,662 | 1,635 | 650 | 1,767 | 2,182 |
| Germany | |||||
| Russia | |||||
| United States of America | 8,604 | 12,171 | 15,091 | 14,600 | 13,738 |
| Other countries | 1 | 1 | 1 | 2 | |
| Totals | 44,708 | 22,613 | 18,132 | 19,899 | 22,910 |
| WHEAT. | |||||
| Centals. | Centals. | Centals. | Centals. | Centals. | |
| United Kingdom | 40,570 | 3 | |||
| Pacific islands | 206 | 93 | 890 | 660 | 974 |
| Australiạ̣ | 10 | 624 | 12 | 14 | |
| Other countrieṣ̣ ̣̣ | |||||
| Totals | 216 | 41,287 | 902 | 674 | 977 |
| OATS. | |||||
| United Kingdom | 8,257 | 1,526 | |||
| Ceyloṇ̣ | 1,629 | 1,514 | |||
| Pacific islands (other than Fiji) | 2,844 | 1,371 | 1,555 | 1,009 | 996 |
| Australiạ̣ | 258,202 | 2,393 | 398 | 170 | 54,801 |
| Fijị̣̣̣ | 279 | 278 | 419 | 121 | 605 |
| Brazil | |||||
| Uruguaỵ̣ | 713 | ||||
| Other countries | 1,137 | 82,550 | 3 | ||
| Totals | 273,061 | 88,106 | 2,372 | 1,300 | 57,931 |
| BEANS and PEAS. | |||||
| United Kingdom | 79,912 | 23,454 | 56,070 | 43,517 | 230,492 |
| Canadạ̣ | 60 | 1,961 | 2,684 | 45 | |
| South African Union | 1 | ||||
| Australia | 34,888 | 24,042 | 7,258 | 10,251 | 15,987 |
| Fijị̣ | 2 | 2 | 16 | 10 | 9 |
| France | 498 | 176 | |||
| United States of America | 6,018 | 711 | 476 | 444 | 9,294 |
| Pacific islands | 49 | ||||
| Other countries | 285 | 202 | 25 | 30 | |
| Totals | 121,165 | 50,871 | 66,705 | 54,297 | 255,831 |
| POTATOES | |||||
| Tons. | Tons. | Tons. | Tons. | Tons. | |
| Pacific islands (other than Fiji) | 262 | 190 | 197 | 176 | 216 |
| Australia | 18,145 | 1,029 | 1 | 2,810 | |
| Fijị̣ | 418 | 517 | 532 | 26 | 577 |
| Argentine Republic | |||||
| Brazil | 95 | ||||
| Other countries | 655 | 2 | 10 | 1 | 20 |
| Totals | 19,575 | 1,738 | 739 | 440 | 3,623 |
| SEEDS (GRASS and CLOVER). | |||||
| Cwt. | Cwt. | Cwt. | Cwt. | Cwt. | |
| United Kingdom | 6,579 | 6,669 | 5,230 | 778 | 24,289 |
| Canada | 424 | 60 | 351 | 140 | 1,817 |
| Pacific islands (other than Fiji) | 26 | 5 | 1 | 8 | 19 |
| South African Union | |||||
| Australia | 7,809 | 2,212 | 8,398 | 10,659 | 18,153 |
| Fiji | 3 | 1 | 21 | ||
| Germany | |||||
| United States of America | 242 | 1,475 | 5,111 | 4,415 | 7,008 |
| Uruguay | 1 | ||||
| Other countries | 2 | ||||
| Totals | 15,081 | 10,426 | 19,092 | 15,995 | 51,307 |
| GOLD. | |||||
| Oz. | Oz. | Oz. | Oz. | Oz.. | |
| United Kingdom | 1,417 | 32,866 | 165,001 | 70 | 82,009 |
| Australia | 126,922 | 127,345 | 53,623 | 11,917 | 133,220 |
| Other countries | 294,498 | 132,409 | 104,981 | ||
| Totals | 422,837 | 292,620 | 218,624 | 11,987 | 320,210 |
| COAL. | |||||
| Tons. | Tons. | Tons. | Tons. | Tons. | |
| United Kingdom | 185,616 | 115,682 | 102,970 | 90,010 | 85,299 |
| Canada | 3,350 | 5,330 | 5,532 | 4,959 | 5,947 |
| Pacific islands (other than Fiji) | 12,900 | 5,724 | 9,186 | 6,085 | 10,530 |
| Australia | 36,444 | 51,972 | 32,073 | 26,773 | 26,496 |
| Fijị̣ | 12,915 | 17,391 | 12,672 | 4,871 | 6,109 |
| Egypt | 29,621 | 25,246 | 206 | 2,506 | |
| Argentine Republic | 1,400 | ||||
| Chile | 4,140 | 1,815 | 994 | 1,100 | 247 |
| United States of America | 5,072 | 17,999 | 15,643 | 16,527 | 12,486 |
| Guam | 32,817 | 40,705 | 46,087 | 29,372 | 3,125 |
| Other countries | 1,993 | 49,811 | 3,500 | 400 | 54 |
| Totals | 326,268 | 331,675 | 228,843 | 182,603 | 150,293 |
| KAURI-gum. | |||||
| United Kingdom | 1,172 | 1,516 | 620 | 69 | 1,771 |
| Canada | 56 | 237 | 1,229 | 1,167 | 703 |
| Australia | 9 | 31 | 11 | 56 | 19 |
| Belgium | |||||
| Austria-Hungary | |||||
| France | 5 | ||||
| Germany | |||||
| Italy | |||||
| Netherlands | |||||
| Russia | 21 | 15 | 35 | ||
| Sweden | |||||
| United States of America | 3,312 | 3,649 | 2,689 | 1,127 | 1,635 |
| Other countries | 8 | 10 | |||
| Totals | 4,575 | 5,456 | 4,594 | 2,419 | 4,128 |
| PHORMIUM FIBRE. | |||||
| Tons. | Tons. | Tons. | Tons. | Tons. | |
| United Kingdom | 15,369 | 15,288 | 7,669 | 3,286 | 10,911 |
| Canada | 237 | 1,444 | 3,538 | 1,572 | 1,489 |
| Australia | 5,538 | 4,722 | 3,249 | 4,556 | 3,764 |
| United States of America | 2,076 | 6,219 | 9,059 | 15,568 | 6,059 |
| Other countries | 1 | 1 | 185 | 124 | |
| Totals | 23,220 | 27,674 | 23,516 | 25,167 | 22,347 |
| TIMBER (SAWN and HEWN). | |||||
| Sup. ft. | Sup. ft. | Sup. ft. | Sup. ft. | Sup. ft. | |
| United Kingdom | 1,438,249 | 340,490 | 163,938 | 45,800 | 149,199 |
| Pacific islands (other than Fiji) | 408,451 | 309,054 | 665,975 | 619,708 | 290,532 |
| Australia | 73,811,328 | 69,168,629 | 68,725,732 | 72,965,071 | 48,900,372 |
| Fijị̣ | 1,173,899 | 1,692,821 | 1,801,860 | 1,301,936 | 394,891 |
| Other countries | 360 | 300 | 5,268 | ||
| Totals | 76,832,287 | 71,510,994 | 71,357,555 | 74,932,815 | 49,740,262 |
The forwarding trade of New Zealand has never at any time been of great significance, indeed, prior to 1914 on only one occasion, in 1907, did the amount exceed a quarter of a million sterling. Since 1913, however, the amount has rapidly increased. Items of re-exports consist partly of goods returned from New Zealand either as unsuitable or as finished with, though the bulk of the total amount is made up by various classes of machinery, hardware, metal manufactures, motor-cars, and also items such as apparel, books, tobacco, and spirits.
There is, however, a genuine entrepôt trade with the islands of the Pacific, the amount of which is still comparatively small. Exports to Cook Islands, which are treated as part of the Dominion, are not included in the figures of either exports or re-exports.
The amounts for the last twenty years of the re-exports of New Zealand are shown in the table below:—
| RE-exports of BRITISH, FOREIGN, and other COLONIAL PRODUCE (excluding SPECIE). | ||
|---|---|---|
| £ | £ | £ |
| 1899 123,682 | 1906 152,134 | 1913 232,473 |
| 1900 168,009 | 1907 278,503 | 1914 269,208 |
| 1901 179,350 | 1908 180,675 | 1915 387,960 |
| 1902 136,860 | 1909 173,215 | 1916 305,150 |
| 1903 133,734 | 1910 208,310 | 1917 429,115 |
| 1904 136,963 | 1911 198,287 | 1918 543,568 |
| 1905 138,539 | 1912 239,221 | 1919 603,541 |
The destination of this re-export trade is shown in the following table for 1915–19:—
| Country. | 1915. | 1916. | 1917. | 1918. | 1919. |
|---|---|---|---|---|---|
| £ | £ | £ | £ | £ | |
| United Kingdom | 122,379 | 40,577 | 50,245 | 103,580 | 113,267 |
| Australia | 144,104 | 144,406 | 217,168 | 261,814 | 263,689 |
| Fiji | 18,991 | 24,480 | 36,434 | 36,927 | 40,934 |
| Canada | 2,371 | 5,828 | 6,670 | 7,009 | 17,744 |
| Germany | |||||
| United States of America | 4,481 | 11,926 | 24,697 | 17,008 | 24,364 |
| Tonga or Friendly Islands | 18,242 | 10,364 | 23,881 | 33,051 | 42,257 |
| Samoa or Navigator Islands | 26,055 | 22,355 | 26,201 | 25,350 | 31,182 |
| Tahiti or Society Islands | 19,523 | 14,665 | 18,019 | 27,183 | 23,168 |
| Other countries | 31,814 | 30,549 | 25,800 | 31,646 | 46,936 |
| Totals | 387,960 | 305,150 | 429,115 | 543,568 | 603,541 |
The following table illustrates the effect of prices on the New Zealand exports. The gain to New Zealand on the ten principal items quoted amounts to over 25½ millions for the two years ended 31st March, 1919 and 1920, when assessed on the values for the same items in the calendar year 1914.
TEN PRINCIPAL EXPORTS of NEW ZEALAND for the CALENDAR YEARS 1918 and 1919, showing ACTUAL VALUES and VALUES when assessed at PRICES ruling in the CALENDAR YEAR 1914.
| Item. | 1914. | 1918. | 1919. | Difference for Two Years. | ||
|---|---|---|---|---|---|---|
| Actual Value. | Value of Quality exported assessed at 1914 Prices. | Actual Value. | Value of Quality exported assessed at 1914 Prices. | |||
| £ | £ | £ | £ | £ | £ | |
| Wool | 9,318,114 | 7,527,266 | 4,588,938 | 19,559,537 | 11,590,818 | 10,907,047 |
| Mutton (frozen) | 2,115,080 | 1,922,941 | 1,293,400 | 4,470,290 | 2,980,096 | 2,119,735 |
| Lamb (frozen) | 2,554,517 | 1,220,832 | 930,634 | 3,063,769 | 2,332,122 | 1,021,845 |
| Beef (frozen) | 1,029,529 | 1,661,187 | 1,221,980 | 1,770,766 | 1,304,429 | 905,544 |
| Butter | 2,338,576 | 3,402,223 | 2,322,175 | 3,080,128 | 1,863,126 | 2,297,050 |
| Cheese | 2,564,125 | 4,087,278 | 2,622,471 | 7,790,990 | 4,667,416 | 4,588,381 |
| Hides | 358,618 | 490,150 | 347,894 | 892,080 | 535,908 | 498,428 |
| Tallow | 694,348 | 847,618 | 465,100 | 2,680,006 | 1,327,631 | 1,734,893 |
| Phormium | 455,214 | 1,387,763 | 581,908 | 866,930 | 516,327 | 1,156,458 |
| Timber, sawn and hewn | 422,545 | 556,270 | 380,039 | 439,935 | 252,116 | 364,050 |
| 21,850,666 | 28,103,528 | 14,754,539 | 44,614,431 | 27,369,989 | 25,593,431 | |
The following table shows the total values of the exports from each port of New Zealand, arranged in order of magnitude, in 1919. In order to eliminate any temporary fluctuation an annual average has been taken over five-yearly periods since 1896 and contrasted with the figures for 1919.
| EXPORTS from VARIOUS PORTS. | |||||
|---|---|---|---|---|---|
| Port. | Yearly Average of Quinquennial Periods. | Year 1919. | |||
| 1896–1900. | 1901–5. | 1906–10. | 1911–15. | ||
*Included in New Plymouth. | |||||
| £ | £ | £ | £ | £ | |
| Auckland | 1,649,238 | 2,334,369 | 3,374,789 | 4,031,432 | 9,847,296 |
| Wellington | 1,825,895 | 2,612,896 | 3,692,669 | 5,684,827 | 9,506,957 |
| Lyttelton | 2,107,449 | 2,431,547 | 2,704,521 | 3,153,723 | 6,702,130 |
| Napier | 950,614 | 944,293 | 1,674,638 | 2,000,657 | 4,504,387 |
| Wanganui | 337,319 | 350,039 | 409,526 | 673,035 | 3,975,354 |
| Gisborne | 347,603 | 512,749 | 992,554 | 1,373,145 | 3,466,502 |
| Dunedin | 1,155,387 | 1,488,901 | 1,500,952 | 1,619,348 | 3,366,731 |
| Invercargill | 700,580 | 888,637 | 1,173,801 | 1,442,996 | 2,874,580 |
| Patea | 43,361 | 230,195 | 510,504 | 738,668 | 2,369,581 |
| Timaru | 645,843 | 876,514 | 1,142,524 | 1,273,164 | 2,214,237 |
| New Plymouth | 351,452 | 400,357 | 554,135 | 591,212 | 2,133,601 |
| Wairau (including Picton) | 133,786 | 186,196 | 285,991 | 311,187 | 836,317 |
| Waitara | * | 99,329 | 292,503 | 366,326 | 555,265 |
| Oamaru | 247,180 | 239,419 | 225,308 | 259,294 | 539,539 |
| Nelson | 60,168 | 88,601 | 94,608 | 173,964 | 482,660 |
| Greymouth | 239,553 | 419,547 | 376,185 | 403,297 | 330,820 |
| Kaipara | 112,311 | 150,817 | 138,023 | 124,830 | 54,507 |
| Hokitika | 52,147 | 39,113 | 32,133 | 28,277 | 47,885 |
| Tauranga | 137 | 5,648 | 43,326 | ||
| Westport | 38,501 | 75,769 | 58,533 | 59,070 | 42,099 |
It has been noticed repeatedly that the calendar year is a bad period for which to calculate exports of New Zealand produce. These exports consist almost wholly of seasonal products, and the calendar year often splits the seasons. The largest export, wool, is sheared from the sheep in the early summer, and the wool-sales are held in December and January. Exports of any season's wool-clip are therefore divided between one year and the next in varying proportion. A favourable season or, as in 1914, a sudden demand may cause a great increase of exports in the December quarter, with the result that the March quarter of the next year shows low figures. The wool trade invariably bases its calculations on each season's clip, not on calendar years.
The same argument holds good in the case of butter and cheese, which are almost wholly exported in December and March quarters. It is desirable, therefore, to tabulate New Zealand exports for years ending in June instead of December, since this division does not split the seasonal production of any main commodity, and more truly shows the results of each season as compared with previous seasons. The following table gives this information for the principal items of export during each of the last nine “June” years.
| PRINCIPAL EXPORTS of DOMESTIC PRODUCE from NEW ZEALAND for YEARS ending 30th JUNE, 1915 to 1920 (inclusive). | |||||
|---|---|---|---|---|---|
| Article. | 1915–16. | 1916–17. | 1917–18. | 1918–19. | 1919–20. |
| The mine— | £ | £ | £ | £ | £ |
| Coal | 292,447 | 249,106 | 270,028 | 195,573 | 147,547 |
| Gold | 2,134,256 | 529,878 | 927,943 | 635,717 | 1,085,483 |
| Silver | 107,851 | 89,651 | 139,214 | 128,464 | 123,475 |
| Fisheries— | |||||
| Fish | 41,914 | 30,785 | 24,057 | 17,374 | 33,009 |
| The forest— | |||||
| Kauri-gum | 332,308 | 30,433 | 220,085 | 193,902 | 556,744 |
| Timber (sawn and hewn) | 387,370 | 422,281 | 457,317 | 517,182 | 544,229 |
| Pastoral products— | |||||
| Beef, salted | 5,331 | 7,912 | 14,198 | 10,821 | 21,942 |
| Butter | 2,805,152 | 2,767,150 | 3,232,788 | 3,592,875 | 2,257,145 |
| Cheese | 3,345,314 | 3,982,089 | 4,010,842 | 5,501,452 | 6,930,178 |
| Hides | 626,834 | 343,858 | 558,560 | 707,057 | 1,071,639 |
| Live-stock | 119,245 | 54,265 | 66,239 | 40,920 | 54,838 |
| Meat, preserved | 231,113 | 268,323 | 534,256 | 924,934 | 134,186 |
| Meat, frozen | 7,523,788 | 6,953,944 | 6,414,471 | 4,911,582 | 5,636,560 |
| Sausage-skins | 217,709 | 212,110 | 243,745 | 262,288 | 518,033 |
| Skins, rabbit | 56,078 | 79,182 | 258,246 | 209,702 | 532,208 |
| Skins sheep | 887,014 | 1,136,923 | 1,002,476 | 1,937,242 | 2,754,076 |
| Tallow | 698,605 | 767,313 | 615,464 | 1,613,250 | 2,155,753 |
| Wool | 1,127,697 | 10,628,359 | 9,519,199 | 15,378,923 | 13,206,083 |
| Agricultural products— | |||||
| Beans and peas | 66,172 | 40,804 | 97,902 | 170,012 | 142,844 |
| Oats | 15,922 | 28,839 | 1,228 | 4,758 | 50,027 |
| Wheat | 211 | 17,940 | 491 | 401 | 1,075 |
| Hops | 18,474 | 18,792 | 6,129 | 18,409 | 12,677 |
| Potatoes | 130,399 | 6,199 | 5,036 | 7,722 | 41,280 |
| Seeds, grass and clover | 42,043 | 43,331 | 44,912 | 98,066 | 247,340 |
| Miscellaneous— | |||||
| Leather | 57,608 | 23,894 | 29,360 | 47,133 | 11,067 |
| Phormium | 778,966 | 1,221,184 | 1,553,791 | 1,059,316 | 656,553 |
| Other New Zealand | 712,192 | 646,821 | 794,428 | 1,523,115 | 6,927,499 |
| produce | |||||
| Totals | 33,762,013 | 30,901,366 | 31,042,315 | 39,708,190 | 45,853,490 |
In 1901 a group of Pacific islands was annexed to New Zealand, and has since been administered by the Dominion. The islands are fertile and rich in tropical products, so that there is a growing trade between them and the Dominion proper. This trade is not regarded as external to New Zealand, but merely as interchange between different parts of the Dominion, and it is therefore not included in the account of the external trade. Separate returns are made of the transactions between the Dominion and its dependent islands.
| TOTAL VALUE of EXPORTS from NEW ZEALAND to COOK and other annexed ISLANDS since 1901. | |||
|---|---|---|---|
| Year. | Exports. | Year. | Exports. |
| £ | £ | ||
| 1901 | 21,849 | 1911 | 56,131 |
| 1902 | 22,973 | 1912 | 75,774 |
| 1903 | 27,965 | 1913 | 72,046 |
| 1904 | 28,644 | 1914 | 59,056 |
| 1905 | 29,098 | 1915 | 55,459 |
| 1906 | 35,452 | 1916 | 52,831 |
| 1907 | 38,288 | 1917 | 53,449 |
| 1908 | 39,284 | 1918 | 79,309 |
| 1909 | 40,204 | 1919 | 88,902 |
| 1910 | 60,647 | ||
The occupation of German Samoa by New Zealand troops in August, 1914, has led to an expansion of the Dominion's trade with those islands. This development arose in the first place from the necessity for sending stores, &., from New Zealand for the troops, but there is evidence now of considerable interchange of commodities between New Zealand and the settlers in the Group. Exports from the Dominion to German Samoa during the last six years have been as follows:—
| £ | |
|---|---|
| 1914 | 59,938 |
| 1915 | 113,143 |
| 1916 | 71,781 |
| 1917 | 119,049 |
| 1918 | 84,241 |
| 1919 | 93,062 |
AN exact and detailed account is kept of all imports of merchandise into New Zealand from overseas, and the Customs Department insists on full and accurate descriptions of all goods passing under its control. Entries must be passed and invoices presented for every package imported, and the quantities and values stated on the entries must be supported by declaration. The detailed nature of the tariff makes it essential that all goods should be described minutely under the tariff headings, and care is also taken to furnish statistical information concerning quantities. In the case of goods chargeable with specific duties the quantities are ascertained by examination in support of the invoices.
Prior to 1916 the import value taken was the c.i.f. or landed value in New Zealand, thus including freight into the Dominion. For free goods and goods liable to specific duties this landed value in New Zealand was insisted upon. But the landed value for ad valorem goods was defined as the fair market value of the goods when sold for home consumption in the principal markets of the country whence imported, and at the time when imported, plus 10 per cent.—i.e., the f.o.b. invoice value, plus a uniform 10 per cent. to cover the cost of freight, &. From and including the year 1916, however, the value shown for all merchandise imported is the fair market value in the country of export at the time of exportation, plus 10 per cent. Fair market value is accepted as the wholesale value, less all the usual trade discounts, but including all special discounts. Since 1914 the ordinary cash discount has been allowed, and the value of casing or packing may also be deducted if shown separately.
Passengers’ baggage is omitted from the total of imports in each year, except where dutiable items are included. Personal luggage is exempt from duty upon declaration that the goods are personal property, not intended for sale, have been in use for twelve months, and do not exceed £100 in value.
The following table shows the total imports during the last decade:—
| Year. | Value. | Value per Head. | ||||||
|---|---|---|---|---|---|---|---|---|
| Including Specie. | Excluding Specie. | Including Specie. | Excluding Specie. | |||||
| £ | £ | £ | s. | d. | £ | s. | d. | |
| 1910 | 17,051,583 | 16,748,223 | 17 | 3 | 6 | 16 | 17 | 5 |
| 1911 | 19,545,879 | 18,782,608 | 19 | 5 | 2 | 18 | 10 | 2 |
| 1912 | 20,976,574 | 20,576,579 | 20 | 3 | 9 | 19 | 16 | 1 |
| 1913 | 22,288,302 | 21,653,632 | 20 | 17 | 1 | 20 | 5 | 3 |
| 1914 | 21,856,096 | 21,144,227 | 20 | 0 | 11 | 19 | 7 | 10 |
| 1915 | 21,728,834 | 20,658,720 | 19 | 15 | 2 | 18 | 15 | 10 |
| 1916 | 26,339,283 | 25,045,403 | 23 | 19 | 2 | 22 | 15 | 7 |
| 1917 | 20,919,265 | 20,742,130 | 19 | 0 | 8 | 18 | 17 | 7 |
| 1918 | 24,234,007 | 24,131,792 | 21 | 19 | 5 | 21 | 17 | 7 |
| 1919 | 30,671,698 | 30,309,167 | 26 | 19 | 10 | 26 | 13 | 5 |
The main groups of imports according to the classification followed in the “Statistics of the Dominion of New Zealand,” Volume ii, are given below for the five years 1915–19.
| MAIN GROUPS of IMPORTS, 1915–19. | |||||
|---|---|---|---|---|---|
| Group of Principal Articles imported. | 1915. | 1916. | 1917. | 1918. | 1919. |
*Includes methylated and perfumed spirits, and spirits of wine. *Excluding gold (specie and bullion) | |||||
| £ | £ | £ | £ | £ | |
| Apparel (including hats and caps) | 1,172,998 | 1,675,782 | 1,346,505 | 1,558,385 | 1,780,871 |
| Boots and shoes | 409,987 | 505,114 | 493,109 | 589,642 | 589,766 |
| Drapery, haberdashery, linens, woollens, and other textiles | 2,470,036 | 3,703,338 | 2,783,291 | 3,715,045 | 4,251,102 |
| Hosiery | 211,962 | 367,096 | 209,741 | 311,356 | 434,225 |
| Silks | 201,854 | 293,101 | 277,962 | 468,629 | 504,171 |
| Totals | 4,466,837 | 6,544,431 | 5,110,608 | 6,643,057 | 7,560,135 |
| Iron and steel (pig, wrought, wire, &., and galvanized) | 1,206,655 | 1,313,584 | 681,546 | 613,709 | 1,762,945 |
| Railway and tramway plant | 288,536 | 94,842 | 44,007 | 52,214 | 270,900 |
| Machinery | 893,383 | 948,858 | 777,353 | 702,044 | 1,208,739 |
| Sewing and knitting machines | 47,013 | 50,789 | 62,946 | 65,782 | 72,256 |
| Hardware and ironmongery | 309,754 | 390,840 | 294,951 | 208,158 | 417,743 |
| Tools and implements (including agricultural) | 256,098 | 318,355 | 274,654 | 219,074 | 519,241 |
| Nails | 61,829 | 101,740 | 66,092 | 58,130 | 224,175 |
| Other metals and metal manufactures | 734,769 | 947,421 | 708,078 | 754,029 | 1,174,474 |
| Totals | 3,798,037 | 4,166,429 | 2,909,627 | 2,673,140 | 5,650,473 |
| Sugar | 1,069,096 | 986,766 | 1,136,722 | 904,957 | 1,114,084 |
| Tea | 455,240 | 386,316 | 428,912 | 415,244 | 423,293 |
| Totals | 1,524,336 | 1,373,082 | 1,565,634 | 1,320,201 | 1,537,377 |
| Beer | 53,668 | 44,775 | 17,535 | 10,920 | 6,495 |
| Spirits* | 405,628 | 743,510 | 528,797 | 868,645 | 467,766 |
| Wine | 83,817 | 85,183 | 73,336 | 68,908 | 1,013,888 |
| Tobacco | 533,876 | 717,822 | 446,308 | 690,924 | 112,546 |
| Totals | 1,076,989 | 1,591,290 | 1,065,976 | 1,639,397 | 1,600,695 |
| Paper | 386,996 | 590,530 | 485,300 | 472,050 | 672,474 |
| Printed books | 233,058 | 258,125 | 236,267 | 288,070 | 324,170 |
| Stationery | 198,590 | 269,308 | 207,789 | 210,047 | 302,764 |
| Totals | 818,644 | 1,117,963 | 929,356 | 970,167 | 1,299,408 |
| Miscellaneous (specified articles)— | |||||
| Arms, ammunition, and explosives | 173,140 | 149,267 | 163,140 | 156,017 | 228,475 |
| Automobiles, motor-cars, and motor cycles, and materials for | 1,037,079 | 1,668,895 | 1,254,608 | 1,323,488 | 2,244,741 |
| Bags and sacks | 254,174 | 235,139 | 219,955 | 254,518 | 326,920 |
| Bicycles and tricycle | 11,900 | 21,895 | 11,755 | 14,695 | 14,255 |
| Bicycle and tricycle fittings | 96,369 | 105,431 | 80,204 | 90,192 | 104,658 |
| Candles | 37,440 | 36,009 | 9,064 | 26,237 | 20,288 |
| Canvas | 71,745 | 91,047 | 94,692 | 130,177 | 210,924 |
| Carpeting and drug-getting | 78,327 | 128,214 | 82,703 | 59,307 | 135,820 |
| Carts, carriages, and materials for | 68,525 | 47,273 | 41,573 | 40,214 | 67,318 |
| Cement | 5,667 | 1,374 | 788 | 527 | 2,219 |
| China, porcelain, earthenware, and Parian ware | 109,135 | 188,552 | 114,261 | 103,513 | 159,386 |
| Coal | 344,495 | 189,526 | 214,152 | 202,102 | 382,016 |
| Drugs, chemicals, and druggists’ wares | 680,122 | 890,980 | 741,776 | 994,173 | 1,099,454 |
| Fancy goods and toys | 212,840 | 320,996 | 284,781 | 292,539 | 382,356 |
| Fish, potted and preserved | 87,736 | 92,821 | 104,819 | 133,321 | 121,599 |
| Floorcloth and oil-cloth | 81,079 | 101,337 | 54,482 | 29,540 | 66,266 |
| Fruits (including fresh, preserved, bottled, and dried) | 410,842 | 458,417 | 493,733 | 519,166 | 367,719 |
| Furniture, cabinet-ware, and upholstery | 31,152 | 41,012 | 32,072 | 75,417 | 21,264 |
| Glass and glassware | 181,873 | 218,664 | 134,256 | 134,921 | 227,815 |
| Leather and leather manufactures | 218,464 | 295,697 | 372,051 | 344,454 | 405,019 |
| Manures | 476,584 | 342,580 | 328,762 | 267,323 | 319,620 |
| Musical instruments and materials for | 124,025 | 157,188 | 116,062 | 99,692 | 127,528 |
| Seeds | 327,290 | 219,502 | 294,520 | 262,973 | 151,065 |
| Oil | 793,663 | 1,001,924 | 943,460 | 1,448,318 | 1,305,043 |
| Timber | 305,685 | 166,817 | 160,914 | 152,525 | 174,666 |
| Woolpacks and wool-pockets | 82,798 | 101,909 | 113,926 | 119,955 | 198,909 |
| Total miscellaneous (specified articles) | 6,302,149 | 7,272,466 | 6,462,509 | 7,275,304 | 8,871,343 |
| Other imports (excluding specie) | 2,671,728 | 2,979,742 | 2,698,420 | 3,610,526 | 3,789,736 |
| Total imports (excluding specie) | 20,658,720 | 25,045,403 | 20,742,130 | 24,131,792 | 30,309,167 |
| Specie imported | 1,070,114 | 1,293,880 | 177,135 | 102,215 | 362,531 |
| Total imports | 21,728,834 | 26,339,283 | *20,919,265 | *24,234,007 | 30,671,698 |
Owing to the very varied nature of the import trade it is not possible to classify imports so completely as exports. There are two big groups of items, however, which are of dominating importance, and are, moreover, fairly homogeneous. The first, “Clothing and textiles,” comprises practically all woven articles; but the second, “Metals and machinery,” is not altogether complete, since there are many items in the “Miscellaneous” group which are metal manufactures. The other three groups are well defined, and the value imported in each is, on the whole, steady.
In the miscellaneous items the most noteworthy advance is that made by motor-cars and accessories; whereas prior to 1911 their value never exceeded £300,000 per annum, two years later it rose to over a million, and in 1919 amounted to £2,244,741.
The grand total of £30,671,698 shown for 1919 (over £6,400,000 more than in 1918) is very satisfactory, but it must be remembered that most if not all of this increase was attributable to higher prices ruling.
The subjoined table exhibits the value of the imports received at each port in New Zealand during 1919, together with average annual values for the four preceding quinquennial periods. The general increase in the value of imports in 1919 as compared with the previous year is very evenly distributed over the various parts of the Dominion.
It will be observed that the number of ports participating in the direct importing trade of the Dominion is large. The four chief ports are far in advance of the rest, and amongst them the North shows a more rapid progress, so that now Lyttelton and Dunedin combined do not receive so much as either Wellington or Auckland.
The imports credited to each port consist of the goods actually landed over the wharf at that port, not, as in the case of exports, of the goods credited to the district in which they are produced. The figures given in the following table therefore represent the actual shipping import trade of each port, though from the central ports the goods are afterwards distributed over the country either by rail or by coastal shipping:—
| IMPORTS by PORTS. | |||||
|---|---|---|---|---|---|
| Port. | Yearly Average of Quinquennial Periods. | 1918 | |||
| 1897–1901. | 1902–6. | 1907–11. | 1912–16. | ||
*Parcels-post now included under the headings of the various ports. | |||||
| £ | £ | £ | £ | £ | |
| Wellington | 2,353,678 | 3,897,314 | 4,979,747 | 6,881,216 | 10,626,873 |
| Auckland | 2,434,444 | 3,250,124 | 4,786,242 | 6,683,080 | 9,567,409 |
| Lyttelton | 1,600,056 | 2,154,373 | 2,670,757 | 3,418,749 | 4,584,822 |
| Dunedin | 1,914,319 | 2,112,128 | 2,467,786 | 2,783,086 | 3,331,655 |
| Napier | 201,157 | 261,940 | 417,597 | 570,557 | 575,493 |
| Invercargill | 251,633 | 349,532 | 501,344 | 577,029 | 527,475 |
| Timaru | 133,732 | 196,022 | 303,622 | 376,691 | 353,868 |
| Wanganui | 123,017 | 167,188 | 233,082 | 281,545 | 317,007 |
| New Plymouth | 60,939 | 89,975 | 132,056 | 192,901 | 230,089 |
| Gisborne | 40,054 | 70,519 | 143,521 | 201,660 | 165,390 |
| Nelson | 133,467 | 133,812 | 126,836 | 147,835 | 110,014 |
| Greymouth | 52,640 | 74,203 | 108,370 | 101,552 | 77,616 |
| Oamaru | 45,251 | 59,896 | 68,750 | 89,783 | 56,630 |
| Patea | 14,037 | 20,411 | 27,520 | 30,072 | 52,952 |
| Wairau (including Picton) | 14,016 | 25,028 | 38,297 | 54,825 | 43,763 |
| Westport | 28,815 | 34,562 | 53,801 | 43,718 | 35,867 |
| Kaipara | 5,419 | 6,002 | 10,188 | 5,509 | 5,955 |
| Hokitika | 14,696 | 13,989 | 17,126 | 10,768 | 5,846 |
| Tauranga | 3,146 | 2,704 | 3,628 | 5,494 | 2,974 |
| Parcels-post | 73,377 | 169,748 | 318,995 | * | * |
| Totals | 9,497,893 | 13,089,470 | 17,409,265 | 22,637,817 | 30,671,698 |
Information as to the amount of certain principal articles of food and drink entered for home consumption on importation and ex warehouse is given in the tables which follow. The figures shown for beer include also beer manufactured in the Dominion on which excise duty was paid. In all other cases the articles specified are not produced (in the raw) in the Dominion, or, if so, only in very small quantities, so that the figures shown in the second of the tables practically represent the per capita consumption of the various commodities. Coffee-essence, of which £4.305 worth was entered for home consumption in 1919, is not included in the figures given for coffee.
| TOTAL AMOUNTS entered for HOME CONSUMPTION. | ||||||
|---|---|---|---|---|---|---|
| Article. | Unit of Quantity. | 1915. | 1916. | 1917. | 1918. | 1919. |
| Tea | lb. | 9,148,578 | 7,977,963 | 8,793,057 | 9,403,207 | 8,648,653 |
| Coffee, raw and roasted | lb. | 343,501 | 375,408 | 365,351 | 539,591 | 237,348 |
| Cocoa and chocolate* | lb. | 774,880 | 685,639 | 235,213 | 554,585 | 978,961 |
| Cocoa-beans | lb. | 574,965 | 1,124,373 | 1,011,811 | 978,090 | 1,271,292 |
| Rice | lb. | 9,171,232 | 8,042,944 | 10,261,328 | 8,235,696 | 4,899,888 |
| Sago and tapioca | lb. | 2,715,104 | 2,928,800 | 3,558,016 | 3,065,888 | 731,362 |
| Currants, dried | lb. | 2,455,674 | 1,571,232 | 1,808,475 | 1,177,500 | 1,200,704 |
| Raisins | lb. | 6,535,863 | 6,253,293 | 5,479,282 | 6,361,968 | 3,161,926 |
| Figs, dates, and prunes | lb. | 3,851,558 | 2,758,546 | 2,415,312 | 1,610,799 | 277,943 |
| Sugar | Cwt. | 1,333,649 | 1,246,457 | 1,368,056 | 1,041,537 | 1,159,403 |
| Salt | Cwt. | 437,620 | 637,160 | 319,820 | 843,600 | 308,360 |
| Spices | lb. | 705,530 | 717,584 | 892,798 | 780,335 | 426,440 |
| Mustard | lb. | 236,618 | 332,365 | 154,640 | 177,007 | 153,413 |
| Tobacco | lb. | 3,173,152 | 3,075,756 | 3,104,810 | 3,111,037 | 3,765,672 |
| Beer | Gal. | 10,865,764 | 11,477,046 | 11,416,475 | 10,621,229 | 18,882,286 |
| Wine | Gal. | 163,248 | 138,806 | 142,893 | 126,138 | 174,424 |
| Spirits | Gal. | 932,547 | 769,964 | 750,729 | 568,868 | 708,991 |
| AMOUNTS per HEAD (including MAORIS) entered for HOME CONSUMPTION. | |||||||
|---|---|---|---|---|---|---|---|
| Article. | Unit of Quantity. | 1915. | 1916. | 1917. | 1918. | 1919. | Average of Five Years. |
* Not including chocolate confectionery. | |||||||
| Tea | lb. | 7.96 | 6.94 | 7.65 | 8.16 | 7.29 | 7.60 |
| Coffee, raw and roasted | lb. | 0.30 | 0.33 | 0.32 | 0.47 | 0.20 | 0.32 |
| Cocoa and chocolate* | lb. | 0.67 | 0.60 | 0.20 | 0.48 | 0.83 | 0.56 |
| Cocoa-beans | lb. | 0.50 | 0.98 | 0.88 | 0.85 | 1.07 | 0.86 |
| Rice | lb. | 6.98 | 7.00 | 8.93 | 7.14 | 4.13 | 7.02 |
| Sago and tapioca | lb. | 2.36 | 2.55 | 3.10 | 2.66 | 0.62 | 2.25 |
| Currants, dried | lb. | 2.14 | 1.37 | 1.57 | 1.02 | 1.01 | 1.42 |
| Raisins | lb. | 5.69 | 5.44 | 4.77 | 5.52 | 2.67 | 4.80 |
| Figs, dates, and prunes | lb. | 3.35 | 2.40 | 2.10 | 1.40 | 0.24 | 1.88 |
| Sugar | lb. | 129.92 | 120.96 | 133.48 | 101.19 | 109.47 | 119.02 |
| Salt | lb. | 42.56 | 61.60 | 31.36 | 81.96 | 29.12 | 49.29 |
| Spices | lb. | 0.61 | 0.62 | 0.78 | 0.68 | 0.36 | 0.61 |
| Mustard | lb. | 0.21 | 0.29 | 0.13 | 0.15 | 0.13 | 0.18 |
| Tobacco | lb. | 2.76 | 2.68 | 2.70 | 2.70 | 3.17 | 2.81 |
| Beer | Gal. | 9.46 | 9.99 | 9.94 | 9.21 | 15.92 | 10.09 |
| Wine | Gal. | 0.14 | 0.12 | 0.12 | 0.11 | 0.14 | 0.13 |
| Spirits | Gal. | 0.81 | 0.67 | 0.65 | 0.49 | 0.59 | 0.64 |
Whilst the average consumption of the main items of food and drink is naturally very steady from year to year, not a single item shows an uninterrupted increase.
In 1914 the statistics, both of imports and exports, were collected for the first time upon a new plan, a statistical classification being adopted which assembles the items in well-defined classes, based largely on the recommendations of the Dominions Royal Commission which toured New Zealand in 1913, and conforming closely to the scheme adopted in Australia.
The import trade of the Dominion, though spread over more countries than the export trade, is yet confined mainly to the United Kingdom, Australia, and the United States. In the days of the first settlement Australia was the source from which the young colony drew most of its supplies, and for a long period imports from Australia overshadowed imports from the United Kingdom. The proportion of imports from Australia, however, tended to decrease steadily till from 60 per cent. in 1862 it had fallen to about 15 per cent. In 1918, however, imports from Australia were nearly 22 per cent. of the total imports.
Most of the goods brought to New Zealand from overseas come from the United Kingdom, which in normal times supplies about 60 per cent. of the total imports. The proportion has fallen a good deal of recent years—in the “eighties” and “nineties” the figure was, on the average, nearer 70 per cent. than 60 per cent.
The cause of this decline is to be found in the development of trade with other countries in quite recent years, particularly with Germany, the United States, Japan, and in a less degree with France, Belgium, Holland, and other European countries. The United States was sending goods to New Zealand practically from the foundation of the colony, and the share of the imports received from that country steadily increased. till in the first decade of the present century it was 11 or 12 per cent. The adoption of Imperial preference seems to have caused a temporary drop in the figure to about 7 per cent., though the proportion has now for some years been steadily climbing again, and has indeed actually surpassed its old level. In 1918 more than 20 per cent. of the imports came from the United States. Trade with Germany developed steadily during the decade preceding the outbreak of war.
India captured the New Zealand jute-market in the early “eighties,” and since then there has been a regular import of corn-sacks, woolpacks, &. In former times the colony imported its sugar from Mauritius, but after 1890 Fiji supplanted Mauritius, so that the imports from the Pacific islands are swelled to 4 per cent., while Mauritius practically disappears from the list of countries. Similarly the import of tea from China gave way about the same time to imports from Ceylon.
The present position is illustrated by the tables which follow. It will be seen that, while imports of goods from Germany have practically ceased, and imports from the United Kingdom are less than in any year except 1917, since 1905 the remaining six countries, with the exception of Fiji, have maintained a high level. The figures for India, United States, and Canada are the highest ever recorded.
The figures relate to countries of shipment.
IMPORTS from PRINCIPAL COUNTRIES, 1910–1919.
| Year. | United Kingdom. | Australia. | Canada. | India. | Ceylon. | Fiji. | United States. | Germany |
|---|---|---|---|---|---|---|---|---|
| £ | £ | £ | £ | £ | £ | £ | £ | |
| 1910 | 10,498,771 | 2,359,393 | 261,402 | 399,991 | 248,476 | 580,084 | 1,399,737 | 391,795 |
| 1911 | 11,787,300 | 2,944,991 | 283,410 | 326,360 | 275,672 | 728,806 | 1,682,129 | 480,617 |
| 1912 | 12,499,787 | 2,583,887 | 394,249 | 395,298 | 289,008 | 764,790 | 2,049,618 | 653,230 |
| 1913 | 13,312,193 | 2,914,848 | 452,519 | 421,209 | 275,350 | 846,493 | 2,107,990 | 687,935 |
| 1914 | 11,985,946 | 3,376,371 | 479,140 | 486,978 | 394,444 | 738,751 | 2,282,966 | 620,400 |
| 1915 | 11,141,067 | 3,554,535 | 797,816 | 527,942 | 408,697 | 1,128,959 | 2,600,248 | 7,790 |
| 1916 | 13,869,455 | 4,002,171 | 757,286 | 572,257 | 366,753 | 1,053,754 | 3,969,925 | 4,287 |
| 1917 | 8,817,519 | 3,660,931 | 757,041 | 612,063 | 353,613 | 1,203,372 | 3,900,658 | 733 |
| 1918 | 8,977,725 | 5,133,412 | 930,964 | 712,633 | 319,498 | 939,341 | 4,980,748 | 393 |
| 1919 | 11,839,430 | 5,081,968 | 1,622,234 | 772,838 | 383,209 | 980,186 | 7,576,314 | 23 |
In the exports subsection of this book it has been shown that New Zealand is a primary-producing country—i.e., her exports consist principally of raw materials. It was also pointed out that the largest proportion of imports was of manufactures. The following table, grouped in the same manner as the export table referred to, illustrates this statement. This table differs from that which precedes it in that the figures given refer to countries of origin.
| Countries. | Food, Drink, and Tobacco. | Raw Materials and Articles mainly unmanufactured. | Articles wholly or mainly manufactured. | Miscellaneous and Unclassified. | Bullion and Specie.* | Total.* |
|---|---|---|---|---|---|---|
*Excluding gold. | ||||||
| £ | £ | £ | £ | £ | £ | |
| United Kingdom | 1,095,401 | 157,408 | 9,812,225 | 108,274 | 350,345 | 11,523,653 |
| British Possessions. | ||||||
| Europe— | ||||||
| Gibraltar | 24 | 24 | ||||
| Malta | 732 | 732 | ||||
| Asia— | ||||||
| Burma | 7,761 | 41,421 | 49,182 | |||
| Ceylon | 383,397 | 200 | 4,651 | 180 | 388,428 | |
| India | 43,870 | 12,016 | 730,298 | 1,485 | 787,669 | |
| Other Asiatic possessions | 23,488 | 3,427 | 1,997 | 28,912 | ||
| Africa— | ||||||
| South African Union | 42,779 | 27,868 | 98,441 | 134 | 169,222 | |
| Other African possessions | 2,098 | 49 | 2,147 | |||
| America— | ||||||
| Canada | 174,176 | 41,755 | 1,432,461 | 1,158 | 1,649,550 | |
| Other American possess'ns | 12,337 | 4 | 6,307 | 18,648 | ||
| Pacific Islands— | ||||||
| Australia | 1,234,246 | 559,379 | 2,075,308 | 33,708 | 13,467 | 3,916,108 |
| Fiji | 976,489 | 655 | 175 | 977,319 | ||
| Other Pacific islands | 1,382 | 961 | 1,258 | 4,424 | 8,025 | |
| Foreign Countries and Possessions. | ||||||
| Europe— | ||||||
| Denmark | 53,166 | 9,611 | 2,753 | 65,530 | ||
| France | 51,815 | 3,707 | 353,184 | 2,656 | 411,362 | |
| Italy | 12,641 | 409 | 123,917 | 620 | 137,587 | |
| Netherlands | 24,121 | 25,285 | 674 | 50,080 | ||
| Sweden | 26,189 | 3,306 | 83,266 | 911 | 113,672 | |
| Switzerland | 149 | 205,805 | 1,133 | 207,087 | ||
| Other European countries | 17,955 | 18,213 | 20,878 | 57,046 | ||
| Countries. | Food, Drink, and Tobacco. | Raw Materials and Articles mainly unmanufactured. | Articles wholly or mainly manufactured. | Miscellaneous and Unclassified. | Bullion and Specie.* | Total.* |
|---|---|---|---|---|---|---|
*Excluding specie. | ||||||
| Foreign Countries and Possessions—contd. | ||||||
| Asia– | £ | £ | £ | £ | £ | £ |
| China | 63,184 | 1,354 | 62,837 | 185 | 127,560 | |
| Japan | 17,676 | 32,138 | 1,262,335 | 1,056 | 1,313,205 | |
| Java | 227,231 | 15,879 | 5,055 | 248,165 | ||
| Philippine Islands | 6,283 | 27,639 | 796 | 34,718 | ||
| Sumatra | 98 | 97,112 | 97,210 | |||
| Other Asiatic countries | 10,540 | 117 | 14,355 | 25,012 | ||
| Africa— | ||||||
| Egypt | 1,117 | 54,127 | 55,244 | |||
| Other African countries | 3,857 | 81 | 1,291 | 12 | 5,241 | |
| America— | ||||||
| United States of America | 613,187 | 159,565 | 7,213,021 | 67,351 | 3 | 8,053,127 |
| Other American countries | 15,013 | 2,574 | 10,426 | 50 | 28,063 | |
| Pacific Islands— | ||||||
| German Samoa | 22,530 | 215 | 163 | 90 | 22,998 | |
| New Caledonia | 5 | 17,435 | 17,440 | |||
| Tuamotu Archipelago | 65,209 | 65,209 | ||||
| Other Pacific islands | 8,908 | 4,684 | 2,931 | 16,523 | ||
| Totals | 5,173,084 | 1,073,559 | 23,834,386 | 226,854 | 363,815 | 30,671,698 |
A small group of Pacific islands was annexed to the Dominion on the 11th June, 1901, and has since been administered as the “Cook and other annexed islands.” The following table shows the growth of the import trade from this group—previous figures are included with those for the other Pacific islands:—
| Year. | Imports. | Year. | Imports. |
|---|---|---|---|
| £ | £ | ||
| 1902 | 32,163 | 1911 | 92,382 |
| 1903 | 38,708 | 1912 | 105,943 |
| 1904 | 45,517 | 1913 | 109,095 |
| 1905 | 44,179 | 1914 | 94,620 |
| 1906 | 63,477 | 1915 | 87,890 |
| 1907 | 61,922 | 1916 | 63,702 |
| 1908 | 67,483 | 1917 | 72,470 |
| 1909 | 73,469 | 1918 | 70,374 |
| 1910 | 90,039 | 1919 | 88,820 |
IN the earlier years of New Zealand's history the amount derived from Customs and excise duties produced a greater proportion of the revenue than it does to-day. There has been a constant tendency for this proportion to decrease, and the table given below will show that, even in the last twenty years, this tendency has been very noticeable.
AMOUNT of CUSTOMS and EXCISE REVENUE, expressed as a PERCENTAGE of the TOTAL TAXATION and TOTAL REVENUE of NEW ZEALAND.
| Year ended 31st March. | Total Revenue. | Total Taxation. | Customs and Excise Duties. | ||
|---|---|---|---|---|---|
| Amount. | Percentage of Total Revenue. | Percentage of Total Taxation. | |||
| £ | £ | £ | Per Cent. | Per Cent. | |
| 1900 | 5,699,618 | 2,891,126 | 2,187,859 | 38.39 | 75.67 |
| 1901 | 5,906,916 | 3,042,890 | 2,266,032 | 38.36 | 74.47 |
| 1902 | 6,152,839 | 3,113,079 | 2,291,349 | 37.24 | 73.61 |
| 1903 | 6,447,435 | 3,277,964 | 2,426,043 | 37.63 | 74.01 |
| 1904 | 7,130,117 | 3,649,601 | 2,698,046 | 37.84 | 73.93 |
| 1905 | 7,347,197 | 3,754,379 | 2,728,193 | 37.13 | 72.67 |
| 1906 | 7,650,098 | 3,841,596 | 2,795,546 | 36.54 | 72.77 |
| 1907 | 8,478,957 | 4,264,555 | 3,048,622 | 35.96 | 71.49 |
| 1908 | 9,063,989 | 4,645,754 | 3,217,538 | 35.50 | 69.26 |
| 1909 | 9,001,185 | 4,377,761 | 2,917,462 | 32.41 | 66.64 |
| 1910 | 9,238,917 | 4,180,516 | 2,786,490 | 30.16 | 65.63 |
| 1911 | 10,297,273 | 4,837,322 | 3,145,929 | 30.55 | 65.03 |
| 1912 | 11,061,161 | 5,296,590 | 3,398,143 | 30.72 | 64.16 |
| 1913 | 11,734,276 | 5,606,829 | 3,531,761 | 30.10 | 62.99 |
| 1914 | 12,229,661 | 5,918,034 | 3,553,785 | 29.06 | 60.05 |
| 1915 | 12,451,945 | 5,880,811 | 3,294,943 | 26.46 | 56.03 |
| 1916 | 14,507,530 | 7,266,966 | 3,524,063 | 24.29 | 48.49 |
| 1917 | 18,355,194 | 10,549,654 | 4,037,628 | 22.00 | 38.27 |
| 1918 | 20,206,222 | 12,340,853 | 3,601,383 | 17.82 | 29.18 |
| 1919 | 22,352,372 | 13,801,643 | 4,104,749 | 18.37 | 29.74 |
| 1920 | 26,081,340 | 16,251,769 | 5,185,388 | 19.08 | 31.91 |
Though the Customs revenue has increased greatly, the table shows that other forms of taxation and other sources of revenue have increased still faster, so that the tendency is for the proportion of taxation and of revenue furnished by the Customs duties constantly to decrease. This relative decrease has been due in part to the extension of the governmental services in the Dominion increasing the revenue apart from taxation, to the greater use of direct taxation, and to the remissions and reductions of duty which have been made from time to time. These reductions have been mainly in foodstuffs, so that the tariff has tended towards the ideal of a free breakfast-table. War conditions necessitated in 1917 a partial reversal of this principle whereby non-alcoholic beverages again became the subject of taxation.
The tables hereunder show the amounts and percentages collected at intervals of five years, 1891–1911, and in each year since 1911, in respect of (1) foods and non-alcoholic drinks, (2) clothing and textiles, (3) alcoholic drinks and tobacco, and (4) all other articles. Excise duties on alcoholic liquors, tobacco, &., are not included.
PRINCIPAL CLASSES of IMPORTS from which CUSTOMS REVENUE derived.
| Year. | Amount of Duty derived from | Total. | |||
|---|---|---|---|---|---|
| Foods and Non-alcoholic Drinks. | Clothing and Textiles. | Alcoholic Drinks and Tobacco. | All other Articles. | ||
| £ | £ | £ | £ | £ | |
| 1891 | 312,809 | 276,072 | 651,680 | 320,141 | 1,560,702 |
| 1896 | 329,622 | 322,947 | 715,019 | 400,264 | 1,767,852 |
| 1901 | 321,625 | 434,112 | 928,176 | 512,853 | 2,196,766 |
| 1906 | 369,964 | 610,873 | 1,130,837 | 787,429 | 2,899,103 |
| 1911 | 147,456 | 682,710 | 1,286,601 | 1,048,890 | 3,165,657 |
| 1912 | 158,077 | 708,853 | 1,395,837 | 1,072,952 | 3,335,719 |
| 1913 | 146,938 | 790,862 | 1,408,977 | 1,078,649 | 3,425,426 |
| 1914 | 165,998 | 822,373 | 1,459,464 | 906,780 | 3,354,615 |
| 1915 | 155,292 | 727,869 | 1,515,903 | 745,264 | 3,144,328 |
| 1916 | 170,009 | 985,335 | 1,390,322 | 1,036,227 | 3,581,893 |
| 1917 | 174,430 | 794,443 | 1,397,267 | 805,400 | 3,171,540 |
| 1918 | 278,939 | 935,203 | 1,342,443 | 801,953 | 3,358,538 |
| 1919 | 248,762 | 1,097,463 | 1,629,680 | 1,245,157 | 4,221,062 |
| PERCENTAGE of each CLASS to the TOTAL DUTY collected. | ||||
|---|---|---|---|---|
| Year. | Percentage of Total Duty collected on | |||
| Foods and Non-alcoholic Drinks. | Clothing and Textiles. | Alcoholic Drinks and Tobacco. | All other Articles. | |
| Per Cent. | Per Cent. | Per Cent. | Per Cent. | |
| 1891 | 20.05 | 17.69 | 41.75 | 20.51 |
| 1896 | 18.64 | 18.27 | 40.45 | 22.64 |
| 1901 | 14.64 | 19.76 | 42.25 | 23.35 |
| 1906 | 12.76 | 21.07 | 39.01 | 27.16 |
| 1931 | 4.66 | 21.57 | 40.64 | 33.13 |
| 1912 | 4.74 | 21.25 | 41.84 | 32.17 |
| 1913 | 4.29 | 23.09 | 41.13 | 31.49 |
| 1914 | 4.95 | 24.51 | 43.51 | 27.03 |
| 1915 | 4.94 | 23.15 | 48.21 | 23.70 |
| 1916 | 4.75 | 27.51 | 38.81 | 28.93 |
| 1917 | 5.50 | 25.05 | 44.06 | 25.39 |
| 1918 | 8 31 | 27.84 | 39.97 | 23.88 |
| 1919 | 5.89 | 26.00 | 38.61 | 29.50 |
The Customs and excise duties received during the last five years are shown in detail in the table given below, which also shows the rate of revenue per head of mean population, inclusive and exclusive of Maoris, for each year considered.
CUSTOMS and EXCISE REVENUE, 1915–19.
| — | 1915. | 1916. | 1917. | 1918. | 1919. | ||||||||||
|---|---|---|---|---|---|---|---|---|---|---|---|---|---|---|---|
*Minus quantity. | |||||||||||||||
| Customs Duties. | |||||||||||||||
| £ | £ | £ | £ | £ | |||||||||||
| Spirits | 762,694 | 665,182 | 659,477 | 522,401 | 622,811 | ||||||||||
| Wine | 42,258 | 34,950 | 35,812 | 31,698 | 38,839 | ||||||||||
| Ale, beer, &. | 26,005 | 22,932 | 8,063 | 3,237 | 2,997 | ||||||||||
| Cigars, cigarettes, and snuff | 258,494 | 262,695 | 287,777 | 369,817 | 472,256 | ||||||||||
| Tobacco | 423,435 | 401,598 | 403,591 | 413,226 | 490,483 | ||||||||||
| Coffee, cocoa, &c | 10,214 | 9,062 | 3,261 | 8,012 | 12,930 | ||||||||||
| Tea | 574 | 623 | 36,651 | 129,145 | 116,432 | ||||||||||
| Opium | 22 | 17 | 21 | 29 | 19 | ||||||||||
| Other goods by weight | 190,121 | 195,351 | 141,089 | 144,356 | 149,412 | ||||||||||
| ” ad valorem | 1,315,611 | 1,854,262 | 1,498,805 | 1,613,908 | 2,215,101 | ||||||||||
| Other duties | 114,901 | 135,221 | 96,993 | 122,709 | 99,782 | ||||||||||
| Primage | 46,576 | 241,118 | 196,863 | 227,626 | 281,292 | ||||||||||
| Surtax | *22 | ||||||||||||||
| Totals, Customs duties | 3,190,883 | 3,823,011 | 3,368,403 | 3,586,164 | 4,502,354 | ||||||||||
| Excise Duties. | |||||||||||||||
| Tinctures—New Zealand | 7,815 | 8,557 | 9,892 | 12,078 | 11,495 | ||||||||||
| Cigars, cigarettes, and snuff | 331 | 399 | 543 | 866 | 14,667 | ||||||||||
| —New-Zealand-manufactured | |||||||||||||||
| Tobacco — New - Zealand - manufactured | 583 | 1,452 | 3,478 | 1,745 | 1,578 | ||||||||||
| Beer—New Zealand | 137,225 | 189,671 | 219,594 | 261,536 | 337,811 | ||||||||||
| Totals, excise duties | 145,954 | 200,079 | 233,507 | 276,225 | 365,551 | ||||||||||
| £ | s. | d. | £ | s. | d. | £ | s. | d. | £ | s. | d. | £ | s. | d. | |
| Revenue from Customs duties per head of mean population (excluding Maoris) | 2 | 18 | 1 | 3 | 9 | 6 | 3 | 1 | 4 | 3 | 5 | 0 | 3 | 19 | 3 |
| Ditto (including Maoris) | 2 | 15 | 6 | 3 | 6 | 6 | 2 | 18 | 8 | 3 | 2 | 3 | 3 | 15 | 11 |
| Revenue from excise duties per head of mean population (excluding Maoris) | 0 | 2 | 7.9 | 0 | 3 | 7.7 | 0 | 4 | 2.9 | 0 | 5 | 0.1 | 0 | 6 | 5.2 |
| Ditto (including Maoris) | 0 | 2 | 6.5 | 0 | 3 | 5.8 | 0 | 4 | 0.8 | 0 | 4 | 9.5 | 0 | 6 | 1.9 |
The increasing Customs revenue shown in the pre-war years suffered a check in 1914, followed by further diminution in 1915. Since then the tendency has been a fluctuating one, owing to the modifications in the tariff, but with a general tendency to rise.
It may here be remarked that a revision of the Customs tariff in 1921 is in contemplation. A departmental Commission has been constituted to make inquiries and receive suggestions, with a view to laying definite proposals before Parliament.
The following table furnishes a general view of the ratio of Customs revenue to imports since 1895, which is taken as the base year:—
CUSTOMS REVENUE compared with IMPORT VALUES from 1895.
| Year. | Imports. | Revenue. | Percentage of Revenue on Total Imports. | Index Numbers of Customs Revenue compared with Imports. | |||||||||
|---|---|---|---|---|---|---|---|---|---|---|---|---|---|
| Value. | Value per Head. | Amount. | Actual Value per Head. | Value per Head at 1895 Ratio. | |||||||||
| £ | £ | s. | d. | £ | £ | s. | d. | £ | s. | d. | Per Cent. | ||
| 1893 | 6,400,129 | 9 | 4 | 10 | 1,619,970 | 2 | 6 | 9 | 2 | 6 | 9 | 25.31 | 1000 |
| 1896 | 7,137,320 | 10 | 1 | 11 | 1,765,073 | 2 | 9 | 11 | 2 | 11 | 1 | 24.73 | 977 |
| 1897 | 8,055,223 | 11 | 3 | 3 | 1,912,161 | 2 | 13 | 0 | 2 | 16 | 6 | 23.74 | 938 |
| 1898 | 8,230,600 | 11 | 3 | 7 | 1,961,726 | 2 | 13 | 3 | 2 | 16 | 7 | 23.83 | 942 |
| 1899 | 8,739,633 | 11 | 13 | 1 | 2,042,002 | 2 | 14 | 5 | 2 | 19 | 0 | 23.36 | 923 |
| 1900 | 10,646,096 | 13 | 18 | 10 | 2,170,354 | 2 | 16 | 10 | 3 | 6 | 4 | 20.39 | 805 |
| 1901 | 11,817,915 | 15 | 3 | 10 | 2,191,798 | 2 | 16 | 4 | 3 | 16 | 11 | 18.55 | 733 |
| 1902 | 11,326,723 | 14 | 3 | 11 | 2,285,043 | 2 | 17 | 3 | 3 | 11 | 10 | 20.17 | 797 |
| 1903 | 12,788,675 | 15 | 11 | 10 | 2,501,896 | 3 | 1 | 0 | 3 | 18 | 11 | 19.56 | 773 |
| 1904 | 13,291,694 | 15 | 14 | 7 | 2,650,189 | 3 | 2 | 9 | 3 | 19 | 8 | 19.94 | 788 |
| 1905 | 12,828,857 | 14 | 14 | 11 | 2,62,666 | 3 | 1 | 0 | 3 | 14 | 8 | 20.68 | 817 |
| 1906 | 15,211,403 | 16 | 19 | 8 | 2,899,103 | 3 | 4 | 9 | 4 | 6 | 0 | 19.06 | 753 |
| 1907 | 17,302,861 | 18 | 16 | 6 | 3,079,422 | 3 | 7 | 0 | 4 | 15 | 4 | 17.80 | 703 |
| 1908 | 17,471,284 | 18 | 9 | 9 | 2,903,086 | 3 | 1 | 5 | 4 | 13 | 7 | 16.62 | 656 |
| 1909 | 15,674,719 | 16 | 2 | 7 | 2,653,617 | 2 | 14 | 7 | 4 | 1 | 8 | 16.93 | 669 |
| 1910 | 17,051,583 | 17 | 3 | 6 | 2,954,989 | 2 | 19 | 6 | 4 | 6 | 11 | 17.33 | 685 |
| 1911 | 19,545,879 | 19 | 5 | 2 | 3,165,657 | 3 | 2 | 5 | 4 | 9 | 2 | 16.20 | 640 |
| 1912 | 20,976,574 | 20 | 3 | 9 | 3,335,719 | 3 | 4 | 3 | 5 | 2 | 2 | 15.90 | 628 |
| 1913 | 22,288,302 | 20 | 17 | 1 | 3,425,426 | 3 | 4 | 1 | 5 | 5 | 7 | 15.37 | 607 |
| 1914 | 21,856,096 | 20 | 0 | 11 | 3,354,616 | 3 | 1 | 6 | 5 | 1 | 6 | 15.35 | 606 |
| 1915 | 21,728,834 | 19 | 15 | 2 | 3,190,883 | 2 | 18 | 1 | 5 | 0 | 1 | 14.68 | 580 |
| 1916 | 26,339,283 | 23 | 19 | 2 | 3,823,011 | 3 | 9 | 6 | 6 | 1 | 4 | 14.51 | 578 |
| 1917 | 20,919,265 | 19 | 0 | 8 | 3,368,403 | 3 | 1 | 3 | 4 | 16 | 4 | 16.10 | 636 |
| 1918 | 24,234,007 | 21 | 19 | 5 | 3,586,164 | 3 | 5 | 0 | 5 | 11 | 2 | 14.79 | 584 |
| 1919 | 30,071,698 | 26 | 18 | 11 | 4,502,354 | 3 | 19 | 3 | 6 | 14 | 8 | 14. 06 | 556 |
With regard to the above table, it may be explained that the figures given in the column “Value per head at 1895 ratio” indicate the amount of revenue per head of population which would have been obtained had the same high ratio of Customs taxation been levied as prevailed in 1895. The last two columns in the table show clearly the substantial decline in the proportion which the Customs revenue bears to the value of the imports.
With slight interruptions in 1902, 1905, 1909, 1910, 1914, 1915, and 1917 the imports increased annually in both total and per capita values, until in 1919 the total was not very far short of five times as much as that of 1895.
In the same period the Customs revenue has nearly trebled, whilst the advance in population was just over 62 per cent. It is plain, therefore, that the Customs taxation per head has been increasing steadily in sympathy with the greater imports, and in spite of a steady movement towards diminishing the relative duty payable.
In 1895 the proportion of revenue to the total imports was one-fourth; in 1919 it had fallen to less than one-seventh. The tariff of 1903 and the further changes made in 1907, together with the financial circumstances of 1908, may account for such interruptions as are noticeable in this generally steady diminution. As will be seen later in this subsection, duty-free goods are, in recent years, being imported more rapidly than those on which duty is levied.
CUSTOMS REVENUE by CLASSES of IMPORTS, 1919.
| Class. | Items. | Articles. | Revenue collected. | ||
|---|---|---|---|---|---|
| General. | Additional Preferential. | Total. | |||
| £ | £ | £ | |||
| I | 1–41 | Foodstuffs of animal origin (excluding live animals) | 41,033 | 2,419 | 43,452 |
| II | 42–137 | Foodstuffs of vegetable origin, and common salt | 70,095 | 4,343 | 74,438 |
| III | 138–150 | Beverages (non-alcoholic) and substances used in making up the same | 122,069 | 8,803 | 130,872 |
| IV | 151–167 | Spirits and alcoholic liquors | 666,867 | 74 | 666,941 |
| V | 168–173 | Tobacco and preparations thereof | 962,739 | 962,739 | |
| VI | 174–186 | Live animals | 38 | 38 | |
| VII | 187–207 | Animal substances (mainly unmanufactured), not being foodstuffs | 954 | 29 | 983 |
| VIII | 208–233 | Vegetable substances and non-manufactured fibres | 6,485 | 1,925 | 8,410 |
| IXA | 234–262 | Apparel | 633,932 | 91,482 | 725,414 |
| IXB | 263–291 | Textiles | 309,656 | 62,393 | 372,049 |
| IXC | 292–309 | Manufactured fibres | 27,356 | 7,149 | 34,505 |
| X | 310–344 | Oils, fats, and waxes | 52,284 | 7,849 | 60,133 |
| XI | 345–355 | Paints and varnishes | 13,426 | 1,642 | 15,068 |
| XII | 356–372 | Stones and minerals used industrially | 3,141 | 23 | 3,164 |
| XIII | 373–375 | Speciẹ̣̣̣ | |||
| XIVA | 376–405 | Metal, unmanufactured, partially manufactured, and ores | 861 | 861 | |
| XIVB | 406–495 | Metal manufactures, other than machines and machinery | 180,981 | 47,450 | 228,431 |
| XV | 496–572 | Machines and machinery | 85,102 | 43,195 | 128,297 |
| XVIA | 573–576 | Indiarubber and manufactures thereof (not including tires) | 53 | 1,101 | 1,154 |
| XVIB | 577–603 | Leather and manufactures thereof (including substitutes) | 15,001 | 4,200 | 19,201 |
| XVIIA | 604–641 | Timber | 6,243 | 6,243 | |
| XVIIB | 642–661 | Wood, cane, and wicker manufactures | 16,089 | 2,692 | 18,781 |
| XVIII | 662–683 | Earthenware, china, glass, stoneware, cements, and cement materials | 36,253 | 7,638 | 43,891 |
| XIXA | 684–696 | Paper | 10,103 | 12,623 | 22,726 |
| XIXB | 697–711 | Stationery | 48,338 | 8,019 | 56,357 |
| XX | 712–722 | Jewellery, timepieces, and fancy goods | 96,972 | 20,221 | 117,193 |
| XXI | 723–734 | Optical, surgical, and scientific instruments | 2,097 | 3,535 | 5,632 |
| XXIIA | 735–791 | Drugs, chemicals, and druggists’ wares | 94,989 | 15,970 | 110,959 |
| XXIIB | 792–810 | Manureṣ̣̣̣ | |||
| XXIII | 811–903 | Miscellaneous | 242,820 | 120,310 | 363,130 |
| Totals | 3,745,116 | 475,946 | 4,221,062 | ||
Rather less than one-sixth of the Customs revenue collected during 1919 was furnished by spirits and alcoholic liquors (£666,941). Although up to and including 1917 this class has furnished more of the Customs revenue than any other item, it has been surpassed in 1918 and 1919 by both tobacco and apparel.
Two classes (manures and specie) are entirely duty-free, and a good number contribute very little to the revenue. The additional surtax on foreign goods by which New Zealand extends preference to British imports produces most revenue from the items comprised in Classes IXA, IXB, XIVB, and XV, and the miscellaneous class. The total surtax, however, compared with the revenue derived from the general tariff, does not amount to a very large sum, and in 1919 was less than 13 per cent. of the total duties.
The main item from which excise revenue is derived is beer, which, however, pays only a few pence per gallon, as against the import duty of 2s. per gallon, so that the quantity of beer brewed in New Zealand is very much greater than the quantity imported. There are, besides, small but growing manufactures of tinctures and of tobacco which yield a certain amount of excise revenue. The following table shows the amounts of duty collected in respect of these manufactures during the past five years:—
| EXCISE DUTIES, 1915–19. | |||||
|---|---|---|---|---|---|
| Item. | 1915. | 1916. | 1917. | 1918. | 1919. |
| £ | £ | £ | £ | £ | |
| Beer | 137,225 | 189,671 | 219,594 | 261,536 | 337,811 |
| Culinary and flavouring essences, spirituous | 3,402 | 4,167 | 4,096 | 4,552 | 4,180 |
| Medicinal preparations over 50 per cent. proof spirit | 3,097 | 2,915 | 3,181 | 4,907 | 4,101 |
| Perfumed spirits | 1,117 | 1,439 | 2,430 | 2,331 | 2,489 |
| Toilet preparations | |||||
| Toilet preparations spirituous | 199 | 36 | 185 | 288 | 725 |
| Cigarettes made by hand | |||||
| Cigarettes manufactured by machinery | 13,519 | ||||
| Cigars and snuff | 331 | 399 | 543 | 866 | 1,148 |
| Tobacco, manufactured | 583 | 1,452 | 3,478 | 1,745 | 1,578 |
| Totals | 145,954 | 200,079 | 233,507 | 276,225 | 365,551 |
The next table gives the imports of free and dutiable goods arranged according to the statistical classification. Dutiable goods that are subject to preferential duty are also distinguished from those that are not so subject. The main features of the table are the overwhelming proportion of dutiable goods in the classes containing beverages (especially alcoholic) and tobacco, and the high proportion of free goods in stones and minerals (mainly coal), specie, and manures.
IMPORTS by CLASSES, and the NATURE of DUTY payable, 1919.
| Class. | Items. | Articles. | Value Imported. | ||||
|---|---|---|---|---|---|---|---|
| Free Goods. | Dutiable Goods. | Total Goods. | |||||
| Subject to Preferential Duty. | Not subject to Preferential Duty. | Total Dutiable. | |||||
| £ | £ | £ | £ | £ | |||
| I | 1–41 | Foodstuffs of animal origin (excluding live animals) | 93,580 | 30,790 | 230,562 | 261,352 | 354,932 |
| II | 42–137 | Foodstuffs of vegetable origin, and common salt. | 2,115,215 | 69,612 | 395,212 | 464,824 | 2,580,039 |
| III | 138–150 | Beverages (non-alcoholic) and substances used in making up the same | 80,493 | 72,209 | 484,716 | 556,925 | 637,418 |
| IV | 151–167 | Spirits and alcoholic liquors | 272 | 1,135 | 585,400 | 586,535 | 586,807 |
| V | 168–173 | Tobacco and preparations thereof̣̣ | 1,013,888 | 1,013,888 | 1,013,888 | ||
| VI | 174–186 | Live animals | 3,022 | 10,686 | 10,686 | 13,708 | |
| VII | 187–207 | Animal substances (mainly unmanufactured), not being foodstuffs | 29,964 | 1,563 | 6,447 | 8,010 | 37,974 |
| VIII | 208–233 | Vegetable substances and non-manufactured fibres | 342,092 | 19,759 | 28,502 | 48,261 | 390,953 |
| IXA | 234–262 | Apparel | 570,726 | 780,300 | 1,907,850 | 2,688,150 | 3,258,876 |
| IXB | 263–291 | Textiles | 3,136,100 | 586,675 | 1,003,818 | 1,590,493 | 4,726,593 |
| IXC | 292–309 | Manufactured fibres | 625,900 | 41,614 | 128,517 | 170,131 | 796,031 |
| X | 310–344 | Oils, fats, and waxes | 1,101,125 | 188,414 | 114,254 | 302,668 | 1,403,793 |
| XI | 345–355 | Paints and varnishes | 37,473 | 78,049 | 171,376 | 249,425 | 286,898 |
| XII | 356–372 | Stones and minerals used industrially | 397,581 | 158 | 12,413 | 12,571 | 410,152 |
| XIII | 373–375 | Specie | 362,531 | 362,531 | |||
| XIVA | 376–405 | Metal, unmanufactured, partially manufactured, and ores | 241,423 | 4,498 | 4,498 | 245,921 | |
| XIVB | 406–495 | Metal manufactures, other than machines and machinery | 2,284,879 | 597,018 | 872,315 | 1,469,333 | 3,754,212 |
| XV | 496–572 | Machines and machinery | 790,847 | 439,140 | 296,485 | 735,625 | 1,526,472 |
| XVIA | 573–576 | Indiarubber and manufactures thereof (not including tires) | 49,276 | 5,387 | 250 | 5,637 | 54,913 |
| XVIB | 577–603 | Leather and manufactures thereof (including substitutes) | 211,599 | 41,527 | 177,835 | 219,362 | 430,961 |
| XVIIA | 604–641 | Timber | 75,976 | 98,690 | 98,690 | 174,666 | |
| XVIIB | 642–661 | Wood, cane, and wicker manufactures | 54,560 | 26,756 | 50,899 | 77,655 | 132,215 |
| XVIII | 662–683 | Earthenware, china, glass, stoneware, cements, and cement materials | 207,256 | 75,617 | 106,547 | 182,164 | 389,420 |
| XIXA | 084–696 | Paper | 665,901 | 72,435 | 52,455 | 124,890 | 790,791 |
| XIXB | 697–711 | Stationery | 382,792 | 84,813 | 146,502 | 231,315 | 614,107 |
| XX | 712–722 | Jewellery, timepieces, and fancy goods | 200,904 | 201,254 | 284,297 | 485,551 | 686,455 |
| XXI | 723–734 | Optical, surgical, and scientific instruments | 290,101 | 36,833 | 3,883 | 40,716 | 330,817 |
| XXIIA | 735–791 | Drugs, chemicals, and druggists’ wares | 634,689 | 153,438 | 311,327 | 464,765 | 1,099,454 |
| XXIIB | 792–810 | Manures | 319,620 | 319,620 | |||
| XXII | 811–903 | Miscellaneous | 1,367,689 | 1,185,255 | 717,137 | 1,902,392 | 3,270,081 |
| Totals | 16,665,186 | 4,794,249 | 9,212,263 | 14,006,512 | 30,671,698 | ||
By classifying the different rates of duty as is done in the following table it will be found that, even if specie is excluded, on the average rather over half the imports into New Zealand are duty-free, while the value of goods which are liable to specific duties is about one-seventh. The 15-per-cent. figures are composed mainly of the imports of boots, while the 30 - per - cent. figures consist of the value of goods which are liable to 20 per cent. general duty plus an additional preferential duty of 10 per cent.
| Rate of Duty. | 1915. | 1916. | 1917. | 1918. | 1919. |
|---|---|---|---|---|---|
| £ | £ | £ | £ | £ | |
| Free (excluding specie) | 11,819,569 | 12,789,639 | 11,301,527 | 13,272,262 | 16,302,655 |
| Specific duties | 3,007,981 | 3,742,150 | 2,995,395 | 4,236,439 | 4,256,337 |
| Ad valorem duties— | |||||
| 5 per cent. | 58,321 | 57,683 | 28,524 | 29,255 | 81,422 |
| 10 per cent. | 321,028 | 583,390 | 387,617 | 353,161 | 751,249 |
| 14 11/20 per cent. | 4 | ||||
| 15 per cent. | 3,684 | 303,043 | 282,475 | 350,902 | 599,545 |
| 19⅖ per cent. | 81 | 173 | 271 | 516 | 919 |
| 20 per cent. | 3,035,260 | 4,713,363 | 3,042,690 | 2,672,950 | 4,167,888 |
| 22½ per cent. | 41,291 | 69,854 | 69,137 | 85,123 | 154,313 |
| 24 per cent. | 63,40 | 51,875 | 9,883 | 21,623 | 31,187 |
| 24¼ per cent. | 52 | 269 | 173 | 50 | 348 |
| 25 per cent. | 1,730,835 | 2,232,780 | 1,478,009 | 1,561,640 | 1,803,429 |
| 30 per cent. | 459,082 | 19,149 | 1,062,883 | 1,412,273 | 1,792,690 |
| 33¾ per cent. | 3,958 | 7,772 | 12,787 | 8,630 | 8,726 |
| 37½ per cent. | 93,102 | 135,303 | 380,824 | 515,354 | 703,783 |
| 40 per cent. | 4,119 | 3,862 | 2,788 | 2,292 | 3,404 |
| 60 per cent. | 62 | 104 | 428 | ||
| Totals ad valorem | 6,116,044 | 8,838,520 | 6,758,113 | 7,013,873 | 10,099,331 |
| Specie | 1,070,114 | 1,293,880 | 177,135 | 102,215 | 362,531 |
| Grand totals | 21,728,834 | 26,339,283 | 20,919,265 | 24,234,007 | 30,671,698 |
The value of boots imported is included under both specific and ad valorem duties: 1915, £295,883; 1916, £324,906; 1917, £312,905; 1918, £390,782; 1919, £349,156.
As already stated, general tariff revisions were made in 1895 and 1907. The table following shows for the years immediately preceding and following these changes, and for 1919, the value of free and dutiable imports, the percentage admitted free of duty, and the duty per cent. on dutiable imports and on all merchandise imported:—
| —– | 1894. | 1896. | 1906. | 1908. | 1919. |
|---|---|---|---|---|---|
*Including excise duties levied on certain imports manufactured in bond. | |||||
| Merchandise— | £ | £ | £ | £ | £ |
| Free | 1,871,772 | 2,263,091 | 5,476,949 | 8,658,111 | 16,302,655 |
| Dutiable | 4,118,405 | 4,772,288 | 8,826,221 | 8,589,051 | 14,006,512 |
| Imports (less specie) | 5,990,177 | 7,035,379 | 14,303,170 | 17,247,162 | 30,309,167 |
| Percentage of free merchandise | Per Cent. 31.25 | Per Cent. 32.17 | Per Cent. 38.29 | Per Cent. 50.20 | Per Cent. 53.79 |
| £ | £ | £ | £ | £ | |
| Total net duty received* | 1,572,467 | 1,767,852 | 2,903,131 | 2,907,151 | 4,867,905 |
| Duty, per cent. of imports— | Per Cent. | Per Cent. | Per Cent. | Per Cent. | Per Cent. |
| (a.) On dutiable imports | 38.18 | 37.04 | 32.89 | 33.85 | 34.75 |
| (b.) On all merchandise | 26.25 | 25.13 | 20.30 | 16.86 | 16.06 |
The average rate levied on dutiable goods in 1919 was thus very slightly higher than before the tariff revision of 1907, although the average on all merchandise shows a decrease of rather more than 20 per cent. The proportion of imported merchandise free of duty amounted to 53.79 per cent. in 1919, the corresponding figures for 1918 and 1917 being 54.97 and 54.49 per cent. respectively, and for 1906 38.29 per cent.
Though the preferential tariff of New Zealand covers a considerable number of items, the amount of revenue obtained from it has only recently attained any importance. The following table shows the extent of the imports which are affected by preference, by giving the percentage of the total imports and of foreign imports so affected. It will be seen that the proportions have increased after the tariff changes of 1903, 1907, and 1917.
Full details by classes of the imports during 1919 of goods subject to preferential duties have already been quoted on page 161.
| IMPORTS affected by PREFERENTIAL SURTAX. | ||||||
|---|---|---|---|---|---|---|
| Year. | Value of Imports. | Imports on which Surtax was paid. | Percentage of | |||
| Total. | British Empire. | Foreign Countries. | Total Imports. | Foreign Imports. | ||
| £ | £ | £ | £ | Per Cent. | Per Cent. | |
| 1903 | 12,788,675 | 10,648,142 | 2,140,533 | 1,752 | 0.01 | 00.08 |
| 1904 | 13,291,694 | 11,029,694 | 2,262,000 | 487,867 | 3.67 | 21.57 |
| 1905 | 12,828,857 | 10,709,642 | 2,119,215 | 599,764 | 4.68 | 28.30 |
| 1906 | 15,211,403 | 12,890,016 | 2,321,387 | 620,600 | 4.08 | 26.73 |
| 1907 | 17,302,861 | 14,942,183 | 2,360,678 | 658,027 | 3.98 | 27.87 |
| 1908 | 17,471,284 | 14,780,276 | 2,691,008 | 895,007 | 5.12 | 33.26 |
| 1909 | 15,674,719 | 13,554,962 | 2,119,757 | 842,407 | 5.37 | 39.74 |
| 1910 | 17,051,583 | 14,465,824 | 2,585,759 | 1,000,267 | 5.87 | 38.68 |
| 1911 | 19,545,879 | 16,497,340 | 3,048,539 | 1,159,342 | 5.93 | 38.03 |
| 1912 | 20,976,574 | 17,073,272 | 3,903,302 | 1,337,182 | 6.37 | 34.26 |
| 1913 | 22,288,302 | 18,348,249 | 3,940,053 | 1,325,057 | 5.95 | 33.63 |
| 1914 | 21,856,096 | 17,649,784 | 4,206,312 | 1,228,207 | 5.62 | 29.20 |
| 1915 | 21,728,834 | 17,727,137 | 4,001,697 | 1,321,853 | 6.08 | 33.03 |
| 1916 | 26,339,283 | 20,833,461 | 5,506,822 | 2,071,175 | 7.86 | 37.61 |
| 1917 | 20,919,265 | 15,591,308 | 5,327,957 | 2,251,428 | 10.77 | 42.26 |
| 1918 | 24,234,007 | 16,017,554 | 8,216,453 | 3,457,004 | 14.27 | 42.07 |
| 1919 | 30,671,698 | 19,519,619 | 11,152,079 | 4,794,249 | 15.63 | 42.99 |
The system of recording imports was changed in 1914, and for that and subsequent years statistics are given of the countries of origin as well as the countries of shipment, so that it is now possible to get better comparisons of the value of goods produced each year in the various countries with which New Zealand trades. Previously the imports credited to any country were those shipped to New Zealand from that country, and it is evident that more foreign goods come into New Zealand than are shipped direct.
There has been a reciprocal arrangement with British South Africa since 1907, by which New Zealand admits certain goods, mainly wine and tobacco, at reduced rates of duty, in return for similar concessions granted by the South African Union. The following table shows the growth of trade since 1907:—
| Year. | Imports. | Exports. | |
|---|---|---|---|
| According to Country of Shipment. | According to Country of Origin. | ||
* Not available | |||
| £ | £ | £ | |
| 1907 | 1,067 | * | 63,717 |
| 1908 | 5,494 | * | 86,465 |
| 1909 | 6,221 | * | 121,931 |
| 1910 | 7,443 | * | 45,555 |
| 1911 | 9,936 | * | 43,755 |
| 1912 | 13,733 | * | 83,229 |
| 1913 | 7,796 | * | 61,651 |
| 1914 | 33,229 | 98,437 | 60,826 |
| 1915 | 42,654 | 55,826 | 11,279 |
| 1916 | 71,300 | 105,000 | 6,681 |
| 1917 | 56,392 | 98,538 | 1,588 |
| 1918 | 43,856 | 110,645 | 718 |
| 1919 | 62,628 | 169,222 | 2,241 |
Prior to 1914 the figures for imports represent only the value of goods shipped from South Africa. As a rule, very little of this trade, however, comes within the scope of the reciprocal treaty; in 1919 imports amounting in value to £41,743 were subject to reduction of duty in connection with the South African reciprocal tariff.
THE purchase and control of produce requisitioned on behalf of the Imperial Government is in the hands of the Department of Imperial Government Supplies. This Department, which commenced its operations on the 3rd March, 1915, was primarily constituted for the purpose of controlling the purchase of frozen meat on behalf of the Imperial Government. Later its operations in this connection were extended to include many other items of New Zealand produce, notably wool, butter, cheese, and hides. In addition a considerable amount of business has been undertaken on behalf of the New Zealand Government, such as the purchase of butter and cheese for use in camps and on transports, the butter-fat levy, and the internal arrangements in connection with the sale and shipment of kauri-gum.
The requisition of frozen meat on behalf of the Imperial Government commenced on the 3rd March, 1915, and has since then comprised all beef, mutton, and lamb in store or produced at freezing-works available for shipment.
The preliminary arrangements in connection with this requisition were made at conferences convened by the Prime Minister and attended by representatives of the industry, and the schedule of prices and general arrangements necessary in connection with the requisition were agreed upon and subscribed to by all parties interested.
The rates for first quality meat are quoted hereunder:—
| Description | Prices operating from 3rd March, 1915, to 19th October, 1916. | Prices operating from 20th October, 1916. |
|---|---|---|
| d. | d. | |
| Wethers, first quality, 72 lb. and under | 4½ | 5⅜ |
| Ewes, first quality, 72 lb. and under | 4 | 4⅞ |
| Lamb, specially prime and Canterbury quality, 42 lb. and under | 5⅝ | 6½ |
| Beef, prime ox | 4¾ | 5 |
| Mutton, legs | 5½ | 6⅜ |
Advances of payment are made to the extent of 75 per cent. of the value after the meat has been in store six weeks.
Between the 3rd March, 1915, and the 31st March, 1920, 2,885,043 quarters of beef, 12,299,080 carcases of mutton, and 13,625,510 carcases of lamb had been shipped under the Government-purchase scheme, the quantities shipped from the various ports being as shown in the table following. Th total payments to the 31st March, 1920, in respect of meat-purchases amounted to £44,344,503.
| SHIPMENTS of MEAT under IMPERIAL-purchase SCHEME, 3rd MARCH, 1915, to 31st MARCH, 1920. | |||
|---|---|---|---|
| Port of Shipment. | Quarters Beef. | Carcases Mutton. | Carcases Lamb. |
| Whangarei | 149,580 | 61,514 | 9,818 |
| Auckland | 565,150 | 379,752 | 348,605 |
| Whakatane | 36,299 | 56,311 | 6,666 |
| Tokomaru Bay | 41,435 | 385,198 | 162,138 |
| Gisborne | 245,453 | 1,363,419 | 548,634 |
| Napier | 215,535 | 1,885,288 | 1,080,929 |
| Waitara | 248,556 | 249,989 | 150,892 |
| New Plymouth | 54,818 | 108,028 | 36,946 |
| Wanganui | 219,493 | 683,462 | 456,491 |
| Wellington | 578,311 | 3,490,327 | 2,773,406 |
| Totals, North Island | 2,354,630 | 8,663,288 | 5,574,525 |
| Nelson | 17,200 | 52,894 | 63,253 |
| Picton | 2,047 | 131,886 | 190,744 |
| Lyttelton | 162,580 | 1,427,026 | 3,804,467 |
| Timaru | 44,618 | 770,750 | 2,255,495 |
| Oamaru | 111,143 | 208,835 | |
| Dunedin | 87,598 | 479,796 | 694,744 |
| Bluff | 216,370 | 662,297 | 833,447 |
| Totals, South Island | 530,413 | 3,635,792 | 8,050,985 |
| Grand totals | 2,885,043 | 12,299,080 | 13,625,510 |
The quantity of meat in store on the 31st March, 1920, was 6,628,789 freight carcases.
The requisition of cheese commenced operation on the 4th November, 1915. One-third of the 1915–16 output (first grade) was purchased at 7¼d. per lb. f.o.b; all 1916–17 output (first and second grade) at 9½d. and 9¼d.; and the 1918–19 and 1919–20 outputs at 103/4d., 10½d., and 10d., according to quality.
Dairy cheese also has been purchased at 8½d. and 8d. respectively for first- and second-grade quality in 1917–18, and 9¼d. and 8 3/4 d. in the next two seasons.
The following table shows the number of crates and the value of all cheese purchased to the 31st March, 1920:—
| Season. | Number of Crates. | Amount. £ |
|---|---|---|
| 1915–16 | 189,502 | 918,104 |
| 1916–17 | 518,327 | 3,271,982 |
| 1917–18 | 756,142 | 5,013,295 |
| 1918–19 | 789,550 | 5,634,389 |
| 1919–20 | 644,773 | 4,269,096 |
| 2,898,294 | £19,106,866 |
The figures for the 1919–20 season include 274,411 crates awaiting shipment on the 31st March. The conditions of purchase provide for the payment on delivery of the cheese f.o.b. ocean steamer, subject, however, to an advance of 90 per cent. in the event of the cheese remaining in store for a period of fourteen days prior to shipment.
The Dominion's output of butter was requisitioned by the Imperial Government as from the 20th November, 1917. The prices paid for the 1919–20 output were as follows: Creamery butter, first grade, 181s. per hundredweight; second grade, 6d. per hundredweight less for each half grade-point by which the butter falls below first grade. Whey butter and dairy butter, 162s. 4d. per hundredweight; second grade, ½d. per pound less. Milled butter, 148s. 4d. per hundredweight; second grade, ½d. per pound less.
The total quantity of butter purchased during each season to the 31st March, 1920, was as follows:—
| Season | Number of Boxes. | Value. £ |
|---|---|---|
| 1917–18 | 724,699 | 2,829,032 |
| 1918–19 | 667,114 | 2,926,139 |
| 1919–20 | 483,099 | 2,387,929 |
| 1,874,912 | £8,143,100 |
The value shown against the 1919–20 season includes the amount advanced against 77,482 boxes awaiting shipment on the 31st March.
During 1917–18 many of the factories which had been supplying butter for local requirements were attracted by the higher prices prevailing in the United Kingdom, and, withdrawing from the local markets, exported their produce.
An attempt was made to overcome this difficulty by forming into an Equalization Fund the 50 per cent. of the profits arising out of the sale of requisitioned butter in the United Kingdom, which had been returned by the Imperial Government. The amount of this fund was £307,919, and distribution approximately equalized the returns to factories for export or local sales to 1s. 5 3/4 d. per lb. at factory door.
Section 16 of the Appropriation Act, 1919, authorized the Dominion Government to assume the liability of equalizing the profits on local butter-sales, and appropriated £340,000 for this purpose for the 1918–19 and 1919–20 seasons.
For the 1918–19 season payments totalling £211,815 were made to manufacturers selling butter for local consumption, the rate amounting to 1.955d. per lb. An interim payment of 1 3/4 d. per lb. is being made for the 1919–20 season.
At the request of the Imperial Government, the Dominion Government made arrangements for the purchase of the 1916–17 wool-clip for war purposes.
The prices paid for the wool-clip were fixed at a 55-per-cent. advance on those ruling in 1913–14. The scale of qualities and values (to which 55 per cent. must be added) is as follows:—
| Description of Wool. | Ranges of Values per Pound according to Quality. | |
|---|---|---|
| Superior merino combings | From 12d. to 14½d. | + 55 per cent. |
| Medium to good merino | From 9¾d. ” 11½d. | |
| Inferior merino | From 8½d. ” 9½d. | |
| Superior half-bred | From 12d. ” 14d. | |
| Medium to good half-bred | From 9¾d. ” 12d. | |
| Inferior half-bred | From 9d. ” 10d. | |
| Superior crossbred | From 10½d. ” 12d. | |
| Medium to good crossbred | From 9d. ” 11d. | |
| Inferior crossbred | From 7¾d. ” 9d. | |
| Lincoln and Leicester | From 8¾d. ” 10½d. | |
| Lambs, good | From 11d. ” 13d. | |
| Lambs, medium | From 9d. ” 10¾d. |
The 1917–18, 1918–19, and 1919–20 wool-clips have also been accepted on the same terms. In addition the Imperial Government undertook to return to New Zealand wool-growers half the profits on wool sold for other than military purposes.
Since the commencement of the requisition the following quantities of wool have been disposed of as under:—
| Bales. | |
|---|---|
| Total number of bales valued (as per valuation certificates received) | 2,039,157 |
| Total number of bales paid for | 2,031,092 |
| Number of bales shipped | 1,251,578 |
| Number of bales awaiting shipment | 787,579 |
In addition 282,185 bales of scoured and slipe wool had been shipped to 31st March, 1920, at which date 56,142 bales were available for shipment.
For the 2,031,092 bales of wool paid for as mentioned above, the sum of £49,600,913 has been disbursed.
Wool required for local mills is supplied at Imperial Government schedule rates, plus the cost of valuation.
To the 31st March, 1920, 68,880 bales had been purchased subject to valuation in the United Kingdom, and of this quantity 67,085 bales had been shipped to the United Kingdom and 1,795 bales to other Governments; 138,406 bales have been valued and purchased in New Zealand, and of this number 80,789 bales have been shipped to the United Kingdom and 7,604 bales to other Governments. The total payments for freezing companies’ slipe wool were £5,880,344.
The purchase of sheep-skins by the New Zealand Government on behalf of the Imperial Government commenced on the 5th February, 1917. The scale of prices on which purchases are made is as follows:—
| Skins. | Merino. | Half-bred. | Fine Crossbred. | Coarse Crossbred. |
|---|---|---|---|---|
| d. | d. | d. | d. | |
| Three-quarter to full-woolled, sound | 10½–11½ | 13 –14 | 12 –13 | 11½–12½ |
| Half-woolled, sound | 8¾– 9¾ | 11 –12 | 10½–11½ | 10 –11½ |
| Short to quarter-woolled, sound | 7½- 8½ | 9¼–10¾ | 9¼–10¾ | 8½–10¾ |
| Shorn, sound | 5¾- 6 3/1; | 8 - 9 | 8½- 9½ | 8 –10 |
| Lamb-skins, sound | 11–12½ | |||
All skins with damaged or faulty pelts are valued at prices proportionate to those shown above. After purchase, the skins are allocated to fellmongers for treatment, the resultant slipe wool and pelts being shipped to the United Kingdom.
The payment to fellmongers for their services was increased as from the 1st January 1920, to the following rates:—
| Fellmongering | 2½d. per pound on the weight of wool. |
| Curing pelts | 4s. 6d. per dozen pelts (casks extra). |
At the 31st March, 1920, the number of skins purchased and distributed to fellmongers was 6,380,501, value £2,573,155. Payments to fellmongers amounted to £116,204.
Other commodities which have been purchased from time to time through the agency of the Imperial Supplies Department include Glaxo (dried milk), condensed milk, scheelite, rabbits, hides and calf-skins.
From the 3rd March, 1915, to the 30th June, 1920, total payments amounting to £141,680,297 were made by the Imperial Supplies Department. The chief items were—Frozen meat, £48,719,056; wool, £57,305,577; cheese, £20,782,214; butter, £9,402,445; sheep-skins, £2,820,347; hides, £735,663; scheelite, £178,479.
Table of Contents
| THE number and tonnage of the registered vessels belonging to the several ports of registry in the Dominion on the 31st December, 1919 (distinguishing sailing-vessels and steamers), were as under:— | ||||||
|---|---|---|---|---|---|---|
| Ports. | Sailing-vessels. | Steam-vessels. | ||||
| Vessels. | Gross Tonnage. | Net Tonnage. | Vessels. | Gross Tonnage. | Net Tonnage. | |
| Auckland | 114 | 8,294 | 6,935 | 207 | 23,402 | 12,064 |
| Napier | 4 | 266 | 253 | 29 | 3,842 | 2,240 |
| Wellington | 14 | 3,179 | 2,892 | 37 | 11,704 | 5,828 |
| Nelson | 7 | 189 | 152 | 15 | 2,813 | 1,307 |
| Lyttelton | 12 | 3,713 | 3,615 | 18 | 6,188 | 3,000 |
| Timaru | 1 | 733 | 690 | 1 | 942 | 488 |
| Dunedin | 20 | 7,608 | 7,335 | 64 | 66,176 | 39,462 |
| Invercargill | 2 | 372 | 344 | 11 | 1,194 | 554 |
| Totals | 174 | 24,354 | 22,216 | 382 | 116,261 | 64,943 |
Auckland is the port of registry of the majority of the vessels forming New Zealand's “mosquito” fleet, the average net tonnage of the 321 vessels on the Auckland register being under 60 tons. At Dunedin many of the vessels of the Union Steamship Company of New Zealand are registered. Shortly after the outbreak of war, however, many of the principal vessels of this company were transferred to the London register, the large decrease in 1914 as compared with 1913, shown in the next table, being due to this cause.
| At End of Year. | Sailing-vessels on New Zealand Register. | Steam-vessels on New Zealand Register. | ||||
|---|---|---|---|---|---|---|
| Vessels. | Gross Tonnage. | Net Tonnage. | Vessels. | Gross Tonnage. | Net Tonnage. | |
| 1910 | 254 | 40,894 | 38,631 | 352 | 192,637 | 112,475 |
| 1911 | 244 | 37,710 | 35,651 | 361 | 196,374 | 114,973 |
| 1912 | 242 | 36,558 | 34,308 | 374 | 208,887 | 121,772 |
| 1913 | 225 | 33,931 | 31,619 | 391 | 220,186 | 127,691 |
| 1914 | 197 | 22,714 | 20,984 | 384 | 135,838 | 77,901 |
| 1915 | 196 | 23,546 | 21,762 | 385 | 126,549 | 71,695 |
| 1916 | 190 | 23,664 | 21,853 | 390 | 124,833 | 70,442 |
| 1917 | 184 | 24,356 | 22,404 | 376 | 115,683 | 65,092 |
| 1918 | 178 | 25,200 | 23,158 | 379 | 116,551 | 65,388 |
| 1919 | 174 | 24,354 | 22,216 | 382 | 116,261 | 64,943 |
The tonnage of sailing-vessels on the register has decreased rapidly during recent years, though a slight improvement has been effected since 1914, due to the demand for vessels to replace those used for war purposes.
The number and tonnage of vessels entered and cleared during each of the last ten years are as shown in the following table:—
| Year. | Entered. | Cleared. | ||||||
|---|---|---|---|---|---|---|---|---|
| Vessels. | Tonnage. | Vessels. | Tonnage. | |||||
| Steam. | Sailing. | Steam. | Sailing. | Steam. | Sailing. | Steam. | Sailing. | |
| 1910 | 475 | 134 | 1,317,284 | 71,747 | 464 | 124 | 1,299,082 | 68,125 |
| 1911 | 499 | 122 | 1,417,943 | 64,435 | 498 | 126 | 1,402,103 | 65,299 |
| 1912 | 582 | 95 | 1,619,411 | 52,681 | 572 | 94 | 1,620,057 | 48,573 |
| 1913 | 563 | 82 | 1,692,929 | 46,056 | 559 | 76 | 1,658,457 | 41,350 |
| 1914 | 567 | 79 | 1,676,840 | 48,009 | 582 | 75 | 1,735,601 | 46,380 |
| 1915 | 581 | 57 | 1,613,679 | 27,746 | 585 | 64 | 1,604,050 | 31,883 |
| 1916 | 520 | 54 | 1,418,991 | 29,526 | 534 | 56 | 1,461,597 | 29,996 |
| 1917 | 485 | 58 | 1,378,676 | 27,100 | 486 | 61 | 1,353,975 | 27,907 |
| 1918 | 458 | 85 | 1,225,481 | 54,067 | 464 | 80 | 1,264,105 | 46,522 |
| 1919 | 472 | 92 | 1,427,759 | 53,124 | 475 | 99 | 1,444,206 | 61,050 |
Tables are given showing the number and tonnage of British, colonial, and foreign vessels entered and cleared since 1909.
| Year. | British. | Colonial. | Foreign. | Total. | ||||
|---|---|---|---|---|---|---|---|---|
| Vessels. | Tons. | Vessels. | Tons. | Vessels. | Tons. | Vessels. | Tons. | |
| Entered. | ||||||||
| 1909 | 155 | 587,235 | 407 | 633,813 | 43 | 42,887 | 605 | 1,263,935 |
| 1914 | 191 | 791,529 | 398 | 847,910 | 57 | 85,410 | 646 | 1,724,849 |
| 1917 | 249 | 1,008,759 | 262 | 336,027 | 32 | 60,990 | 543 | 1,405,776 |
| 1918 | 193 | 838,198 | 289 | 374,130 | 61 | 67,220 | 543 | 1,279,548 |
| 1919 | 266 | 1,114,479 | 239 | 285,383 | 59 | 81,021 | 564 | 1,480,883 |
| Cleared. | ||||||||
| 1909 | 152 | 572,384 | 406 | 641,055 | 38 | 40,439 | 596 | 1,253,878 |
| 1914 | 194 | 826,358 | 407 | 867,184 | 56 | 88,439 | 657 | 1,781,981 |
| 1917 | 253 | 995,346 | 261 | 327,822 | 33 | 58,714 | 547 | 1,381,882 |
| 1918 | 203 | 872,204 | 289 | 377,383 | 52 | 61,040 | 544 | 1,310,627 |
| 1919 | 273 | 1,139,812 | 239 | 286,062 | 62 | 79,382 | 574 | 1,505,256 |
A more detailed account of the nationality of registry of the shipping of 1919 reveals the following: Of tonnage entered in that year 1,114,479 tons belonged to vessels on the United Kingdom registry; 164,429 tons on the New Zealand registry; 120,954 on other colonial registries; 54,528, United States; 11,827, Dutch; 7,394, Japanese; 4,604, Norwegian; 2,391, French; and 277, Belgian. Tonnage of vessels cleared was approximately the same.
The net tonnage of oversea shipping entered and cleared at the various ports during the years 1909 and 1919 is given in the next table. Vessels arriving from abroad are recorded at the first port of call, and those departing oversea are cleared at the port from which they finally sail.
| Port. | 1909. | 1919. | ||
|---|---|---|---|---|
| Entered. | Cleared. | Entered. | Cleared. | |
| Tons. | Tons. | Tons. | Tons. | |
| Auckland | 554,811 | 330,870 | 684,705 | 418,741 |
| Kaipara | 5,311 | 33,101 | 1,360 | 9,607 |
| Gisborne | 3,761 | 5,739 | 10,125 | 8,002 |
| New Plymouth | 3,619 | 2,528 | 3,987 | |
| Waitara | 5,164 | |||
| Wanganui | 2,749. | 6,452 | 19,209 | 14,850 |
| Wellington | 399,028 | 478,093 | 518,995 | 847,883 |
| Napier | 3,577 | 8,769 | 10,946 | 16,674 |
| Wairau (including Picton) | 2,151 | 5,361 | 5,412 | |
| Nelson | 1,574 | 2,185 | 467 | |
| Westport | 15,797 | 34,388 | 7,010 | |
| Greymouth | 3,258 | 15,155 | 324 | 26,973 |
| Lyttelton | 36,035 | 88,499 | 138,332 | 40,883 |
| Timaru | 8,635 | 4,947 | 4,303 | 7,406 |
| Oamaru | 650 | 1,219 | ||
| Dunedin | 58,572 | 68,866 | 51,530 | 62,526 |
| Bluff | 164,407 | 171,453 | 36,840 | 30,138 |
| Totals | 1,263,935 | 1,253,878 | 1,480,883 | 1,505,256 |
The extensive coast-line and numerous harbours of New Zealand facilitate travelling and the distribution of goods by sea. The total tonnage of coastwise shipping, as shown below, includes that of oversea vessels which, after entry at the first port of arrival, proceed to other ports within the Dominion for the purpose of delivering and loading cargo, each movement, until the final sailing, being recorded as coastwise shipping.
| Year. | Entered. | Cleared. | ||||||
|---|---|---|---|---|---|---|---|---|
| Vessels. | Tonnage. | Vessels. | Tonnage. | |||||
| Steam. | Sailing. | Steam. | Sailing. | Steam. | Sailing. | Steam. | Sailing. | |
| 1910 | 22,272 | 4,500 | 11,839,244 | 242,652 | 22,217 | 4.478 | 11,848,680 | 241,302 |
| 1911 | 23,092 | 4,024 | 12,060,227 | 206,427 | 23,064 | 4,033 | 12,026,951 | 208,820 |
| 1912 | 23,654 | 3,843 | 12,451,499 | 180,698 | 23,622 | 3,870 | 12,457,316 | 181,718 |
| 1913 | 21,937 | 3,764 | 11,332,143 | 173,494 | 21,922 | 3,733 | 11,330,078 | 172,715 |
| 1914 | 23,019 | 3,880 | 12,217,206 | 175,757 | 23,026 | 3,846 | 12,154,108 | 179,761 |
| 1915 | 21,890 | 3,204 | 10,918,580 | 133,102 | 21,927 | 3,202 | 10,899,058 | 133,519 |
| 1916 | 21,228 | 3,092 | 9,919,576 | 129,253 | 21,156 | 3,131 | 9,713,698 | 127,182 |
| 1917 | 18,503 | 2,283 | 8,172,124 | 93,845 | 18,403 | 2,295 | 8,164,407 | 95,808 |
| 1918 | 17,492 | 1,967 | 6,942,341 | 113,124 | 17,493 | 1,923 | 7,041,489 | 103,059 |
| 1919 | 17,631 | 1,976 | 7,274,635 | 91,494 | 17,633 | 1,974 | 7,277,281 | 90,593 |
In the next table is given the total tonnage of coastwise shipping in the chief ports, 1919. The figures are correct to the nearest 1,000 tons, the last three figures being omitted.
| Port. | Tonnage entered.* | Tonnage cleared.* |
|---|---|---|
* Shown in thousands of tons. | ||
| Auckland | 805 | 1,083 |
| Onehunga | 95 | 95 |
| Thames | 82 | 82 |
| Whangarei | 197 | 204 |
| Gisborne | 307 | 301 |
| New Plymouth | 140 | 140 |
| Wanganui | 125 | 129 |
| Wellington | 2,018 | 1,692 |
| Napier | 359 | 359 |
| Picton | 264 | 258 |
| Nelson | 219 | 219 |
| Westport | 254 | 247 |
| Greymouth | 195 | 170 |
| Lyttelton | 1,159 | 1,260 |
| Timaru | 228 | 220 |
| Oamaru | 92 | 93 |
| Dunedin | 389 | 393 |
| Bluff | 94 | 100 |
A large part of the shipping shown as entered and cleared in the case of Wellington and Lyttelton is due to the fact that these ports are the termini of the daily inter-Island ferry service.
The number of seamen and waterside workers belonging to the registered local unions respectively at each of the four centres was—
| Seamen's Union. | Waterside Workers’ Union. | |
|---|---|---|
| Auckland | 1,145 | 1,380 |
| Wellington | 1,710 | 2,270 |
| Lyttelton | 535 | |
| Dunedin | 649 | 482 |
The Shipping and Seamen Act of 1908, and its amendment of 1909, provide for an annual survey by Government surveyors of all vessels, with a view to ensuring their seaworthiness. Certificates of survey were issued in 1919-20 to 314 steamers, 464 oil-engine vessels, and 59 sailing-vessels.
The long coast-line of the Dominion is marred in many places by hidden rocks or reefs and other perils to navigation. This has compelled the erection of some sixty-five lighthouses of various types. No fewer than fifteen of these are situated in the stormy area of Cook Strait and the bays opening therefrom, reaching from where the red and white rays of Cape Farewell light give warning of the seven-mile-long sandspit at the northern extremity of the South Island to the bluff shore marked by the Cape Palliser light at the southern point of the North Island.
The average cost of erection and equipment of the coastal lighthouses was about £6,000 per light. The two most costly were Cape Brett Lighthouse (£11,237) on the Auckland Peninsula, and Dog Island Lighthouse (£10,481) in Foveaux Strait. The average cost of maintenance for 1919-20 was: Salaries, £373; oil and stores, &c, £301: total, £674. Light dues collected at the various ports in 1919-20 were as follows: Auckland, £12,153; Wellington, £11,230; Lyttelton, £3,095; Dunedin, £1,218; other ports, £4,468: making a total of £32,164.
During the year 1919-20 sixty-five inquiries into shipping casualties were held, eleven of which were Magisterial. Lives lost during the year numbered nineteen, including eight in the burning of the s.s. “Tainui,” and ten in the loss of the cutter “Janet.”
A summary of shipping casualties in or near New Zealand coasts in the past year is as follows:—
| No. | Tonnage. | |
|---|---|---|
| Strandings— | ||
| Total wrecks | 3 | 175 |
| Partial loss | 7 | 8,210 |
| Slight damage | 6 | 762 |
| No damage | 11 | 11,955 |
| Collisions— | ||
| Partial loss | 3 | 43 |
| Slight damage | 3 | 37 |
| No damage | 6 | 574 |
| Fires— | ||
| Total loss | 1 | 59 |
| Slight damage | 4 | 6,258 |
| No damage | 4 | 18,729 |
| Miscellaneous | 15 | 7,976 |
| Totals | 63 | 54,778 |
Table of Contents
AT the present time there are over 3,000 miles of railway open for traffic of which 2,996 are State-owned. State railways are divided into nine distinct sections, as follows:—
| Section. | Length. Miles. |
|---|---|
| North Island main lines and branches | 1,126 |
| Whangarei | 74 |
| Kaihu | 20 |
| Gisborne | 49 |
| Total, North Island | 1,269 |
| South Island main lines and branches | 1,417 |
| Westland | 157 |
| Westport | 36 |
| Nelson | 61 |
| Picton | 56 |
| Total, South Island | 1,727 |
The gauge is 3 ft. 6 in., and a steel rail of 70 lb. weight per lineal yard is the standard for the permanent-way, and is in use on some 1,304 miles of line. Some 1,527 miles are still in 53 lb., 55 lb., and 56 lb. steel rails, and most of the remainder is in lighter material. Sleepers, which are laid down to the number of 2,100 to the mile, are principally Australian hardwoods or New Zealand silver-pine or totara.
Since 1901 all carriages and wagons required for use on the State railways have been manufactured in the railway workshops of the Dominion. The locomotives also are now all built in the Dominion, mostly in the railway workshops. A new passenger locomotive, Class AB, was brought into operation during 1915, and has been adopted as a standard type. This is a simple superheated tender-engine of the “Pacific” type — weight in working trim, 79 tons; tractive power, 20,000 lb. The standard goods-locomotive used is of the four-cylinder balanced compound type, weighs 94 tons, and has a tractive power of 29,840 lb. Standard carriages are 50 ft. in length, fitted with chair seats to accommodate forty-four passengers, and lighted by the Pintsch-gas system. All rolling-stock is fitted with the Westinghouse brake.
| State. | Miles open for Traffic. | Locomotives. | Passenger Vehicles. | Wagons and Brake-vans. |
|---|---|---|---|---|
| NOTE.—The Australian figures are for the year ended 30th June, 1919; the New Zealand figures for the year ended 31st March, 1920. | ||||
| Number. | Number. | Number. | ||
| Victoria | 4,190 | 798 | 1,663 | 20,392 |
| New South Wales | 4,737 | 1,279 | 1,659 | 23,076 |
| Queensland | 5,469 | 658 | 829 | 14,471 |
| South Australia | 2,285 | 489 | 649 | 9,496 |
| Western Australia | 3,507 | 424 | 423 | 10,078 |
| Tasmania | 599 | 80 | 175 | 1,834 |
| New Zealand | 2,996 | 616 | 1492 | 22,937 |
The following statement shows the number of miles of Government railways open in the Dominion, the number of train-miles travelled and of passengers carried, and the tonnage of goods traffic in the past decade.
| Year ended 31st March. | Length open (Miles). | Train-mileage. | Passengers. | Season Tickets issued. | Goods and Live-stock.* |
|---|---|---|---|---|---|
* The equivalent tonnage for live-stock has been given. | |||||
| Tons. | |||||
| 1911 | 2,753 | 8,141,075 | 11,200,613 | 222,104 | 5,863,674 |
| 1912 | 2,798 | 8,371,687 | 11,891,134 | 236,957 | 5,887,908 |
| 1913 | 2,851 | 9,016,224 | 13,123,879 | 265,259 | 6,246,128 |
| 1914 | 2,854 | 9,319,268 | 13,355,893 | 287,037 | 6,019,633 |
| 1915 | 2,945 | 9,383,420 | 13,565,772 | 302,912 | 6,453,472 |
| 1916 | 2,960 | 9,356,522 | 14,201,506 | 330,622 | 6,370,945 |
| 1917 | 2,960 | 9,146,331 | 14,173,115 | 355,832 | 6,239,172 |
| 1918 | 2,983 | 7,468,646 | 11,408,156 | 322,487 | 5,742,968 |
| 1919 | 2,983 | 7,477,583 | 11,374,521 | 351,124 | 5,611,738 |
| 1920 | 2,996 | 7,408,608 | 12,760,814 | 400,621 | 6,000,279 |
The principal commodities carried on the State railways during each of the past ten years were,—
| Year ended 31st March. | Wool. | Timber. | Grain. | Minerals. | Cattle. | Sheep and Pigs. |
|---|---|---|---|---|---|---|
* Information not available. | ||||||
| Tons. | Tons. | Tons. | Tons. | Number. | Number. | |
| 1911 | 143,247 | 627,107 | 1,013,298 | 2,655,250 | 210,848 | 6,071,670 |
| 1912 | 141,607 | 718,414 | 949,556 | 2,676,783 | 207,546 | 5,601,711 |
| 1913 | 147,735 | 695,060 | 1,181,899 | 2,760,983 | 221,595 | 5,524,935 |
| 1914 | 155,709 | 676,858 | 1,050,395 | 2,551,614 | 254,291 | 7,006,268 |
| 1915 | 162,002 | 621,963 | 1,103,352 | 2,988,028 | 314,219 | 7,086,461 |
| 1916 | 154,633 | 625,866 | 1,061,987 | 2,831,959 | 371,529 | 7,387,269 |
| 1917 | * | 579,428 | * | 2,787,523 | 402,769 | 7,269,544 |
| 1918 | * | 523,784 | * | 2,572,576 | 362,134 | 6,502,090 |
| 1919 | * | 487,729 | * | 2,444,007 | 346,544 | 6,691,760 |
| 1920 | * | 611,171 | * | 2,300,760 | 357,976 | 7,316,556 |
The total cost of construction of open lines up to the 31st March, 1920, was £36,390,115. The amount spent on lines in course of construction and not handed over to the Working Railways Department for traffic purposes was £3,607,225, making the total capital invested in State railways £39,997,340.
| — | 1915–16. | 1916–17. | 1917–18. | 1918–19. | 1919-20. |
|---|---|---|---|---|---|
| £ | £ | £ | £ | £ | |
| Lines open for traffic | 35,857,882 | 35,378,664 | 36,001,432 | 36,167,681 | 36,390,115 |
| Lines under construction | 2,477,198 | 2,808,509 | 2,796,731 | 3,093,201 | 3,607,225 |
| Totals | 37,335,080 | 38,187,173 | 38,798,163 | 39,260,882 | 39,997,340 |
So varied are the geographical features of the Dominion that a great disparity exists in the cost of constructing the individual sections of lines. The numerous mountain-chains and rivers make railway-construction in general both difficult and expensive.
| Section. | Capital Cost of Open Lines, 31st March, 1920. | Capital Cost per Mile (Open Lines). | Net Revenue per Mile of Open Line, 1919-20. |
|---|---|---|---|
* Loss. | |||
| £ | £ | £ | |
| North Island— | |||
| Whangarei | 775,556 | 10,480 | 114.65 |
| Kaihu | 99,962 | 4,998 | –173.50* |
| Gisborne | 682,922 | 13,927 | 151.51 |
| Main line and branches | 16,163,269 | 14,355 | 963.95 |
| Total | 17,721,709 | 13,965 | 865.13 |
| South Island— | |||
| Westland | 2,122,303 | 13,518 | 126.53 |
| Westport | 606,236 | 16,840 | 734.69 |
| Nelson | 444,963 | 7,294 | -27.05* |
| Picton | 680,466 | 12,151 | 48.61 |
| Main line and branches | 14,710,176 | 10,381 | 354.47 |
| Total | 18,564,144 | 10,749 | 318.28 |
| Lake Wakatipu steamer service | 43,708 | ||
| W.R.D. stock, &. | 60,554 | ||
| Grand total | 36,390,115 | 12,132 | 549.87 |
The railways of New Zealand have been looked upon more as adjuncts to the settlement of the country and the development of its natural resources than as an investment from which large profits should directly accrue.
| Year ended 31st March. | Gross Revenue from | Total Gross Revenue. | Net Revenue. | Percentages of Net Revenue to Capital Cost. | |||||
|---|---|---|---|---|---|---|---|---|---|
| Passenger-fares. | Parcels, Luggage, and Mails. | Goods and Livestock. | Rents and Miscellaneous. | ||||||
| £ | £ | £ | £ | £ | £ | £ | s. | d. | |
| 1911 | 1,223,412 | 193,789 | 1,961,078 | 115,903 | 3,494,182 | 1,190,910 | 4 | 1 | 3 |
| 1912 | 1,319,114 | 203,334 | 2,032,785 | 121,276 | 3,676,509 | 1,210,613 | 3 | 19 | 7 |
| 1913 | 1,461,873 | 215,209 | 2,157,686 | 136,234 | 3,971,002 | 1,265,393 | 4 | 0 | 9 |
| 1914 | 1,450,480 | 236,761 | 2,209,398 | 146,689 | 4,043,328 | 1,163,005 | 3 | 12 | 3 |
| 1915 | 1,482,382 | 227,521 | 2,249,399 | 146,155 | 4,105,457 | 1,185,002 | 3 | 10 | 7 |
| 1916 | 1,722,702 | 236,705 | 2,423,493 | 165,456 | 4,548,356 | 1,637,473 | 4 | 14 | 4 |
| 1917 | 1,873,048 | 243,832 | 2,498,862 | 185,068 | 4,800,810 | 1,873,946 | 5 | 5 | 11 |
| 1918 | 1,802,597 | 254,110 | 2,465,241 | 165,752 | 4,687,700 | 1,644,793 | 4 | 11 | 11 |
| 1919 | 1,950,281 | 258,525 | 2,608,336 | 171,490 | 4,988,632 | 1,680,057 | 4 | 12 | 11 |
| 1920 | 2,303,987 | 290,453 | 2,956,237 | 201,810 | 5,752,487 | 1,647,420 | 4 | 10 | 8 |
The revenue from passenger-fares during the year 1919–20 represented an expenditure on railway travel of £1 18s. 6d. per head of mean population, including Maoris.
| State.* | Average Miles of Line worked. | Train-miles run (,000 omitted). | Gross Revenue (,000 omitted). | Net Revenue. | |||
|---|---|---|---|---|---|---|---|
| Amount (,000 omitted). | Per Train-mile. | Per Cent. of Capital. | |||||
* Australian year ends June, 1919; New Zealand, March, 1920. | |||||||
| £ | £ | s. | d. | ||||
| Queensland | 5,469 | 9,943 | 3,985 | 294 | 0 | 8 | 0.73 |
| New South Wales | 4,737 | 19,935 | 9,958 | 3,054 | 3 | 1 | 4.03 |
| Victoria | 4,190 | 13,032 | 6,432 | 2,421 | 3 | 9 | 4.21 |
| South Australia | 2,285 | 5,413 | 2,391 | 562 | 2 | 1 | 2.96 |
| Western Australia | 3,507 | 4,259 | 1,873 | 305 | 1 | 5 | 1.70 |
| Tasmania | 599 | 1,108 | 401 | 77 | 1 | 5 | 1.51 |
| New Zealand ̣̣ | 2,996 | 7,409 | 5,752 | 1,647 | 4 | 5 | 4.53 |
The expenditure under various heads for each of the past ten years has been as follows:—
| Year ended 31st March. | Maintenance of Way. | Locomotive Power. | Carriages and Wagons. | Traffic. | Lake Wakatipu Steamers | Head and Departmental Offices. | Total. |
|---|---|---|---|---|---|---|---|
| £ | £ | £ | £ | £ | £ | £ | |
| 1911 | 693,445 | 695,062 | 180, | 631,380 | 5,029 | 98,135 | 2,303,272 |
| 1912 | 735,546 | 743,443 | 209, | 670,631 | 5,997 | 101,240 | 2,465,896 |
| 1913 | 765,860 | 833,146 | 226,146 | 768,936 | 6,619 | 104,902 | 2,705,609 |
| 1914 | 763,207 | 921,564 | 232,745 | 838,222 | 7,046 | 117,539 | 2,880,323 |
| 1915 | 738,550 | 954,868 | 228,145 | 870,392 | 6,085 | 122,415 | 2,920,455 |
| 1916 | 740,349 | 934,737 | 225,968 | 889,991 | 6,377 | 113,461 | 2,910,883 |
| 1917 | 720,840 | 937,780 | 238,868 | 904,318 | 6,602 | 118,456 | 2,926,864 |
| 1918 | 710,655 | 962,222 | 283,248 | 954,142 | 7,664 | 124,976 | 3,042,907 |
| 1919 | 752,558 | 1,075,489 | 306,308 | 1,032,609 | 6,985 | 134,626 | 3,308,575 |
| 1920 | 837,910 | 1,397,993 | 387,498 | 1,301,935 | 7,964 | 171,767 | 4,105,067 |
The number of men employed in operating the State railways at the 31st March, 1920, was 13,385. The staff is divided into two divisions— namely, the first or clerical division and the second or out-of-door division.
| As at 31st March. | General. | Traffic. | Maintenance. | Locomotive. | Totals. |
|---|---|---|---|---|---|
| 1916 | 693 | 5,041 | 3,931 | 5,303 | 14,968 |
| 1917 | 675 | 4,798 | 3,586 | 4,649 | 13,708 |
| 1918 | 660 | 4,612 | 3,410 | 4,320 | 13,002 |
| 1919 | 661 | 4,505 | 3,347 | 3,878 | 12,391 |
| 1920 | 876 | 4,740 | 3,364 | 4,405 | 13,385 |
Railway employees are under a system of classification, first introduced in 1896, and revised at various times since then.
Appeal Boards (one in each Island) have been constituted to hear and redress grievances of men dissatisfied with decisions respecting the withholding of annual increments, promotion, loss of status, or breaches of discipline involving fines in excess of £2. Each Board consists of a Magistrate and two members of the Railway service elected by the members thereof. The Minister of Railways has the power of veto in respect of any decision of the Board.
A superannuation fund in connection with the Railway service was established in 1903. Full information concerning this is given in the section dealing with Pensions and Superannuation Funds.
Private railways have a total mileage of 138 miles. A complete list is as follows:—
| Railway. | Location. | Length of Railway. | |||
|---|---|---|---|---|---|
* Not available. | |||||
| M. | C. | L. | |||
| Waipa Railway and Collieries (Limited) | Ngaruawahia | 5 | 50 | 0 | |
| Taupo Totara Timber Company (Limited) | Putaruru | 50 | 40 | 0 | |
| Waihi Gold-mining Company (Limited) | Waikino | 5 | 72 | 0 | |
| Sanson Tramway | Sanson-Himatangi | 17 | 0 | 0 | |
| Castlecliff Railway | Wanganui-Castlecliff | 3 | 40 | 0 | |
| Napier Harbour Board's line | Port Ahuriri | 1 | 24 | 50 | |
| Homebush Coal Company | Coalgate | 3 | 37 | 0 | |
| Waronui Coal Company | Milton | 5 | 33 | 0 | |
| Taratu Coal Company | Lovell's Flat | 7 | 47 | 0 | |
| Kaitangata Coal Company | Stirling | 5 | 45 | 0 | |
| Dunedin City Corporation Ocean Beach Railway | Dunedin (about) | 3 | 14 | 0 | |
| Nightcaps Coal Company | Wairio-Nightcaps | 2 | 33 | 63 | |
| Ohai Railway | From Wairio | 5 | 60 | 0 | |
| Westport Harbour Board | Westport-Cape Foulwind and Quarries | 16 | 14 | 0 | |
| Denniston Incline (Westport Coal Company's line) | Waimangaroa - Conn's Creek | 1 | 2 | 0 | |
| Paparoa Company's Railway | (Worked by N.Z.R.) | 1 | 68 | 21 | |
| Reefton Coal Company | Reefton | 2 | 20 | 0 | |
| Tongariro Timber Company | Kakahi | * | |||
| Total mileage | 138 | 40 | 0 | ||
The history of railways in New Zealand has been one of comparative freedom from accidents of a serious nature. A quinquennial summary is quoted.
| Year ended 31st March. | To Passengers. | To Employees. | To Others. | Fatal. | Serious. | Minor. | Totals. |
|---|---|---|---|---|---|---|---|
| 1916 | 28 | 919 | 27 | 33 | 6 | 935 | 974 |
| 1917 | 25 | 852 | 22 | 24 | 8 | 867 | 899 |
| 1918 | 11 | 765 | 29 | 22 | 13 | 770 | 805 |
| 1919 | 33 | 715 | 29 | 23 | 22 | 732 | 777 |
| 1920 | 22 | 827 | 39 | 42 | 34 | 812 | 888 |
Of the persons meeting with fatal accidents in 1919–20, 6 were passengers, 18 employees, and 18 neither passengers nor employees.
Table of Contents
THERE were 2,315 post-offices in New Zealand at the end of 1919, a decrease of twenty-nine during the year.
The table following gives information covering the past five years as to number of post-offices and numbers of articles posted and delivered:—
| POSTAL BUSINESS, 1915–19. | ||||||
|---|---|---|---|---|---|---|
| Year. | Post-offices open at End of Year. | Articles posted and delivered. | ||||
| Letters and Letter-cards. | Post-cards. | Books and Pattern-packets. | Parcels. | Newspapers. | ||
| 1915 | 2,402 | 242,547,859 | 9,242,792 | 57,693,130 | 5,724,576 | 41,311,535 |
| 1916 | 2,379 | 242,121,361 | 8,133,697 | 48,868,537 | 6,085,103 | 41,807,999 |
| 1917 | 2,346 | 245,796,945 | 7,549,867 | 44,934,218 | 6,314,875 | 40,366,792 |
| 1918 | 2,344 | 242,527,369 | 7,145,606 | 42,301,230 | 6,376,469 | 35,476,212 |
| 1919 | 2,315 | 247,143,183 | 7,292,922 | 44,320,385 | 6,193,475 | 35,498,263 |
The average number of letters, &., posted in the Dominion per head of the mean population in the past ten years is as shown in the next table:—
| ARTICLES POSTED PER HEAD OF MEAN POPULATION. 1910–19. | |||||
|---|---|---|---|---|---|
| Year. | Letters and Letter-cards. | Post-cards. | Books and Parcels. | Newspapers. | Totals. |
| 1910 | 97.14 | 5.83 | 30.04 | 18.51 | 151.52 |
| 1911 | 97.85 | 5.35 | 31.28 | 18.66 | 153.14 |
| 1912 | 102.06 | 5.00 | 31.52 | 18.89 | 157.47 |
| 1913 | 101.91 | 4.36 | 28.14 | 17.81 | 152.22 |
| 1914 | 105.01 | 4.51 | 33.37 | 18.15 | 161.04 |
| 1915 | 111.53 | 3.77 | 31.40 | 16.94 | 163.64 |
| 1916 | 109.54 | 3.20 | 25.80 | 17.20 | 155.74 |
| 1917 | 110.27 | 3.00 | 24.47 | 16.60 | 154.34 |
| 1918 | 112.57 | 2.94 | 23.57 | 15.14 | 154.22 |
| 1919 | 111.33 | 2.99 | 24.27 | 14.64 | 153.23 |
During recent years the Post Office has made very substantial extensions in the establishment of rural-mail deliveries. Many of these are performed by officers mounted on motor-cycles. By means of such deliveries it has been possible to give settlers living in the back country an efficient service.
The facilities afforded for the transmission of parcels through the Post Office to places within and without the Dominion have proved of much convenience to the public. The regulations admit of parcels up to 11 lb. in weight being sent to almost all the important countries of the world, and up to 28 lb. in weight for inland parcels for or from places served the whole way by railway or steamer.
The following table shows the number of parcels exchanged with the United Kingdom, the Australian States, &., in 1919:—
| Country. | Number of Parcels. | |||
|---|---|---|---|---|
| Received. | Despatched. | |||
| Number. | Weight. | Number. | Weight. | |
| United Kingdom and foreign countries, via London | 114,256 | 637,400 | 33,025 | 164,031 |
| United States of America | 61,472 | 427,632 | 2,823 | 12,891 |
| N.Z. Expeditionary Force | 384 | 1,423 | 9,851 | 33,593 |
| Canada | 3,348 | 19,414 | 742 | 2,401 |
| Victoria | 15,889 | 83,397 | 3,262 | 9,728 |
| New South Wales | 27,462 | 138,939 | 6,033 | 19,233 |
| South Australia | 493 | 1,799 | 456 | 1,322 |
| Queensland | 873 | 3,089 | 729 | 2,331 |
| Tasmania | 215 | 573 | 487 | 1,197 |
| Western Australia | 330 | 696 | 378 | 1,083 |
| Fiji | 329 | 747 | 1,265 | 4,255 |
| Ceylon | 282 | 1,342 | 79 | 326 |
| Cape of Good Hope | 1,067 | 3,860 | 60 | 204 |
| Natal | 261 | 834 | ||
| India | 1,544 | 7,383 | 592 | 3,061 |
| Tonga | 45 | 138 | 617 | 2,515 |
| Tahiti | 23 | 90 | 566 | 2,895 |
| Hong Kong | 1,273 | 10,826 | 259 | 1,247 |
| Straits Settlements | 142 | 431 | 175 | 881 |
| Totals | 229,427 | 1,339,179 | 61,660 | 265,028 |
The declared value of the parcels received from places outside the Dominion during 1919 was £1,450,476, on which the Customs duty amounted to £254,776.
The number of offices open for the transaction of money-order business at the end of 1919 was 807.
During 1919, 690,291 money-orders, for a total sum of £4,604,059, were issued at the various post-offices. The money-orders from places beyond New Zealand and payable in the Dominion numbered 36,605 for the amount of £181,972.
The number of offices open for the sale of postal notes at the end of 1919 was 1,036: 2,197,520 postal notes were sold, value £655,910. The notes paid numbered 2,172,727.
British postal orders issued in the Dominion during the year numbered 67,882 of a value amounting to £40,747. Those paid numbered 32,672, and represented £19,174.
There were 13,722 miles of telegraph and interurban telephone line open at the end of March, 1920, carrying 50,751 miles of wire. There were 15,074,067 telegrams transmitted during the year: of these, the private and Press messages numbered 14,957,615, which, together with telephone-exchange and other telegraph receipts, yielded a revenue of £1,038,506.
There were 62 central telephone exchanges and 229 sub-exchanges on the 31st March, 1920. The number of telephone connections (including 12,520 extensions), was 80,723, and the total telephone-exchange revenue £419,318.
Working-expenses in 1919–20 exceeded revenue by £19,027.
The capital expended on the equipment, &., of the several telephone exchanges up to the 31st March, 1920, was £2,401,671, the average cost of each connection being thus £39 3s. 7d.
The telephone-exchange system included on the 31st March, 1920, 5,111 miles of pole line and 177,509 miles of wire.
Originally the system was worked by single aerial wires, but these were replaced some years ago at the more important exchanges by aerial and subterranean lead-covered cables. The system of subterranean cables and metallic telephone circuits is being largely extended.
The telephone-exchange system in use is generally of the magneto type, branching multiple switchboards being installed in the principal exchanges. In three installations the common battery system is in operation. The installation of automatic telephones, Western electric type, in the larger towns is well under way.
By the “party” line system of telephone-exchange service several persons may share a common line. This has, on account of the considerable reduction in rental charges, been largely availed of, particularly by those whose premises are situated at a distance from the exchange. In March, 1920, the number of party-line connections was 4,947, with a total of 16,846 subscribers.
The first coin-in-slot telephones erected in the Dominion were installed at Wellington on the 17th August, 1910. There are now 295 such instruments in use in the Dominion.
The distribution of telephones to the population of the Dominion and of the four principal centres on the 31st March, 1920, was as follows:—
| Inhabitants per Telephone. | |
|---|---|
| Dominion | 15 |
| Auckland | 16 |
| Wellington | 11 |
| Christchurch | 13 |
| Dunedin | 13 |
The first wireless-telegraph station opened for commercial use was that of Wellington on 26th July, 1911. Details of the seven stations now under the control of the Post and Telegraph Department are:—
| Station and Call-sign. | Hours of Service. | Wave-length, in Metres (Normal in Black Type). | Daylight Range (in Knots) on Normal Wave-length. |
|---|---|---|---|
| Awanui (V.L.A.). 173° 18’ E., 34° 54’ S. | 6.30 p.m. to midnight. Continuous listening service | 300, 600, 1,000, 2,000, 2,500, 3,500 | S.W. 500; L.W. 1,200. |
| Awarua (V.L.B.). 168° 23’ E., 46° 30’ S. | 6.30 p.m. to midnight. Continuous listening service | 300, 600, 1,000, 2,000, 2,500, 3,500 | S.W. 500; L.W. 1,200. |
| Apia, Samoa (V.M.G.). 171° 49’ W., 13° 51’ S. | Continuous | 300, 600, 1,000, 2,000, 2,400, 2,800, 3,300, 4,000 | S.W. 500. L.W. 1,500. |
| Wellington (V.L.W.). 174° 46’ 39” E., 41° 17’ 5” S. | Continuous | 300, 600, 1,000 | 300. |
| Chatham Islands (V.L.C.). 176° 31’ W., 47° 57’ S. | 6 p.m. to 6 a.m. | 300, 600 | 300. |
| Auckland (V.L.D.). 174° 46’ 8” E., 36° 50’ S. | 7 p.m. to 6 a.m. | 300, 600, 1,000 | 300. |
| Rarotonga, Cook Islands (V.M.R.). 159° 48’ 30” W., 21° 12’ S. | 7 p.m. to midnight | 300, 600, 1,000, 1,700 | 300, 450 on 1,700 metres. |
The Rarotonga station is of the Marconi synchronous gap type; the remainder use the Telefunken quenched gap (500 cycles) system. The aerial system in most cases comprises an umbrella aerial with earthed counterpoise for long waves and a T aerial for short waves.
The radio business transacted by the New Zealand coast stations during the past five years was as follows:—
| Year ended 31st March. | Forwarded. | Received. | ||||
|---|---|---|---|---|---|---|
| Messages. | Words. | Value. | Messages. | Words. | Value. | |
| £ | £ | |||||
| 1916 | 3,076 | 61,759 | 2,296 | 4,666 | 71,291 | 2,763 |
| 1917 | 3,018 | 63,872 | 3,023 | 4,651 | 73,149 | 3,032 |
| 1918 | 2,851 | 60,393 | 3,082 | 4,338 | 73,050 | 3,330 |
| 1919 | 4,482 | 93,507 | 5,245 | 6,570 | 235,889 | 6,227 |
| 1920 | 11,589 | 192,822 | 9,114 | 19,109 | 248,063 | 5,272 |
The above table does not include free (service) messages.
The general rate for transmission of radio-telegrams has been fixed at 5d. a word for all vessels on the Australian or New Zealand register.
The New Zealand coast stations are all reliably connected with the land-line systems. Complete arrangements exist for the prompt transmission of wireless telegrams over them, and for ensuring that distress-signals shall be immediately communicated to the proper authorities.
The cable opened for traffic between New Zealand and Australia and Fiji on the 9th April, 1902, was completed to Bamfield, Vancouver Island, on the 31st October following, and opened for international business on the 8th December, 1902.
The route is from Auckland to Vancouver, via Norfolk Island, Fiji, and Fanning Island. The Australian connection is at Norfolk Island. The deep-sea portion of the Vancouver - Fanning Island cable is stated to be the longest in the world. Following the opening of the cable a much faster service with America and Europe has resulted.
Direct communication between Auckland and Sydney was established on the 31st December, 1912, thus giving the Pacific Cable Board an alternative route to Australia.
During the year 1919–20 the Pacific route took 67 per cent. of the outward business, and the Eastern route 33 per cent.
The length of submarine cable in use in the Dominion, apart from ocean-cable services, is 416 knots.
Aerial transport of mails in New Zealand is as yet in the experimental stages only. Trial mail-carrying flights were successfully carried out from Auckland to Dargaville, Whangarei, Thames, and Whakatane.
The huge volume and multifarious business of the Post and Telegraph Department entails the employment of a numerous staff. The Secretary and the Chief Telegraph Engineer, under the Ministerial control of the Postmaster-General, are the administrative heads.
A return of the staff as at 31st March, 1920, is as follows:—
| 31st March, 1920. | |
|---|---|
| Classified staff,— | |
| Permanent | 7,662 |
| Temporary | 742 |
| Total | 8,404 |
| Employees not on classified staff | 2,393 |
| Grand total | 10,797 |
The receipts and payments of the Post and Telegraph Department for the financial year 1919–20 are shown in the following table:—
| RECEIPTS. | |||
|---|---|---|---|
| Item. | Postal. | Telegraph. | Total. |
| £ | £ | £ | |
| Postages | 1,013,026 | 1,013,026 | |
| Money-order and postal-note commission | 32,361 | 32,361 | |
| Money-order commission received from foreign offices | 854 | 854 | |
| Private box and bag rents | 20,347 | 20,347 | |
| Miscellaneous receipts | 1,901 | 14,967 | 16,869 |
| Paid telegrams | 604,221 | 604,221 | |
| Telephone exchanges | 419,318 | 419,317 | |
| Totals | 1,068,489 | 1,038,506 | 2,106,995 |
| PAYMENTS. | |||
|---|---|---|---|
| Item. | Postal. | Telegraph. | Total. |
* Balance of payments over receipts. | |||
| £ | £ | £ | |
| Salaries (classified officers) | 391,964 | 659,361 | 1,051,325 |
| Salaries (country Postmasters and telephonists, and contributions to Railway Department) | 24,647 | 38,174 | 62,821 |
| Conveyance of mails by sea | 53,812 | 53,812 | |
| Conveyance of inland mails | 144,131 | 144,131 | |
| Conveyance of mails by railway | 79,017 | 79,017 | |
| Money-order commission credited to foreign offices | 2,667 | 2,667 | |
| Maintenance of telegraph and telephone lines | 162,069 | 162,069 | |
| Miscellaneous | 168,962 | 219,35 | 388,319 |
| Totals | 865,200 | 1,078,961 | 1,944,161 |
| Balance of receipts over payments | 203,289 | 40,455* | 162,834 |
In addition to its ordinary business, the Post and Telegraph Department performs an enormous amount of work for almost every other Department of State. The monetary value of this business reaches many millions of pounds annually, and the operations range from the receipt of land- and income-tax payments (£4,506,748) to the sale of fishing licenses (£1,580), and from the payment of pensions (£2,580,469) to the performance of marriage ceremonies.
Table of Contents
THE Crown lands are administered under the authority of the Land Act, 1908, by the Minister of Lands at Wellington, his executive officer being the Under-Secretary of Lands, who is the permanent head of the Department of Lands and Survey. New Zealand is divided into eleven land districts, each being under the local direction of a Commissioner of Crown Lands and a Land Board. The Commissioner's office is known as the principal land office, and in some of the larger districts there are one or more local land offices. It is with these land offices the selector has to transact all business, from the first consultation of the maps to the final receipt of the Crown title.
The names of the land districts and of the towns where the principal office of each is situated are as under:—
| Land District. | Principal Land Office situated at |
|---|---|
| North Auckland | Auckland. |
| Auckland | Auckland. |
| Taranaki | New Plymouth. |
| Hawke's Bay | Napier. |
| Wellington | Wellington. |
| Nelson | Nelson. |
| Marlborough | Blenheim. |
| Westland | Hokitika. |
| Canterbury | Christchurch. |
| Otago | Dunedin. |
| Southland | Invercargill. |
Commissioners of Crown Lands are executive officers of the land districts, having large discretionary powers under the Act. Each is the Chairman of the Land Board of his district, and transacts all its routine business in the sale, letting, and occupation of Crown lands. The Commissioners deal with trespassers and intruders (persons and cattle), removing the former and prosecuting the owners of the latter; they recover all penalties, ascertain the boundaries of Crown lands, enforce all contracts for the disposition of Crown lands, recover rents and other moneys, deal with determinable contracts, prosecute and defend suits, and do whatever is necessary in the course of their duties. They are also Conservators of State Forests for their respective land districts.
A Land Board consists of five members—viz., the Commissioner of Crown Lands for the district (who is ex officio Chairman), three members nominated by the Governor-General, and one member elected by the Crown tenants of the district.
The Boards transact all business connected with the sale, letting, disposal, and occupation of Crown lands, and all matters connected with the management and control of the public lands in their hands. They are the sole judges of the fulfilment of conditions in leases and licenses, and they can declare them forfeit. All meetings are open to the Press and public, with certain limitations.
A selector may purchase for cash, or may select for occupation with right of purchase or for renewable lease. Every applicant must be of the age of seventeen years or upwards, and must apply for Crown land solely for his own use and benefit, and not directly or indirectly for the use or benefit of any other person, whilst, including the land he applies for, he is not to be the owner, holder, or occupier under any tenure of more than one year's duration, either severally or jointly or in common with any other person or persons, of any land anywhere in New Zealand exceeding in the whole 5,000 acres of land, computed as follows:—
Every acre of first-class land is reckoned as 7 1/2 acres;
Every acre of second-class land is reckoned as 2 1/2 acres;
Every acre of third-class land is reckoned as 1 acre.
The annual rental payable for occupation-with-right-of-purchase selections is 5 per cent. on the cash price of the land, and for lands selected for renewable lease the annual rental is 4 per cent on the cash price of the land.
Crown land may be selected and occupied under the following tenures and systems:—
Town, suburban, and village lands—
For cash, by public auction;
By lease for terms up to ten years;
By renewable lease for thirty-three years.
Rural land (unimproved), (under optional system)—
For cash, by application;
Occupation with right of purchase for twenty-five years;
Renewable lease for sixty-six years.
Village settlements—
Under the three foregoing tenures of optional system.
Improved-farm settlements (rural land)—
Under special conditions, and either (a) on occupation-with-right-of-purchase license or (b) on renewable lease.
Special settlements (rural land)—
On renewable lease for sixty-six years and under special regulations.
Land-for-settlement estates (improved rural and pastoral land)—
Under renewable lease for thirty-three years, with limited right to acquire freehold.
Pastoral land—
By small-grazing-run lease for twenty-one years, with right of renewal (maximum area, 20,000 acres);
By pastoral license on terms up to twenty-one years, as follows:
(a) Pastoral lands suitable exclusively for pasturage, and not capable of being used with profit in areas of a carrying-capacity of less than 5,000 sheep; and (b) pastoral agricultural lands, with areas not exceeding 5,000 acres.
Land within mining districts—
On pastoral licenses under special regulations, with right to acquire the freehold or exchange to a renewable lease;
On occupation leases under special regulations, with similar rights as to purchase of freehold and exchange.
(9.) Miscellaneous—
Temporary occupation on terms up to five years;
Sale, or occupation, for special purposes;
Outlying land.
Full particulars are given in the Crown Lands Guide, issued periodically and obtainable at any Land Office, as to the conditions of lease and occupation. A certain amount of improvements is required to be effected on rural land purchased for cash, or held under occupation-with-right-of-purchase or renewable-lease tenures, and residence is compulsory for certain periods on many Crown leaseholds. Rebate of rent is given in many cases when the half-yearly instalment of rent is paid within thirty days of its becoming due. Applications for mortgage, transfer, and sublease of a Crown leasehold have to be approved by the Land Board of the district in most cases.
National Endowments may be disposed of under renewable lease, small-grazing-run lease, or pastoral license. These lands are occupied on the same conditions as ordinary Crown lands, with the exception that the freehold cannot be acquired while such lands continue to be included in the endowment under section 11 of the Land Laws Amendment Act, 1920. The Governor-General is authorized to remove from the endowment certain lands comprised therein, including lands occupied by discharged soldiers under any tenure, and small grazing-runs held under leases issued under the Land Act, 1892, or the Land Act, 1908, up till 10th December, 1918. Upon the removal of such lands from the endowment the occupiers thereof can acquire the freehold in manner prescribed by section 11 of the Land Laws Amendment Act, 1920.
Education Endowments are available for leasing under the Education Reserves Amendment Act, 1910, modifying the Education Reserves Act, 1908, which permits of a lease being granted under the Public Bodies’ Leases Act, 1908, as well as under the Land Act, 1908. The freehold of the land cannot be acquired.
Public Reserves not vested in trustees or a local authority may be leased under the Public Reserves and Domains Amendment Act, 1911, for any term not exceeding twenty-one years, with right of renewal for a further term. The freehold of the land cannot be acquired.
During the year ended 31st March, 1920, an area of 133,287 acres of land was offered for selection under the various tenures provided by the Land Act, Land for Settlements Act, and Education Reserves Acts.
Under the optional system an area of 8,195 acres was advertised.
Under renewable lease an area of 5,648 acres was offered, 5,031 acres being settlement land of which the lessees have the right to acquire the freehold, and 617 acres national endowment. The pastoral-run area comprised 90,000 acres.
In addition to the above a total area of 883,301 acres of Crown, settlement, and national-endowment lands was set apart for selection by discharged soldiers under the ordinary tenures of the Land Act and the Land for Settlements Act, and the special tenures of the Discharged Soldiers Settlement Act. Fuller particulars regarding these lands will be found at the end of this subsection.
The total selections during the year covered an area of 801,877 acres, by 1,825 selectors. These figures include, however, 253 purchases of small town, suburban, and rural lands, aggregating 3,957 acres, offered for sale at auction. The ordinary Crown lands holdings represented 368,452 acres; land for settlements and Cheviot Estate, 91,395 acres; national endowment, 324,717 acres; and educational, 13,356 acres. Selections by discharged soldiers are included in the foregoing totals.
Areas under this heading include all lands sold for cash or selected on the deferred-payment system, small grazing-runs, and leases under the following tenures: Renewable lease, occupation with right of purchase, mining districts land occupation leases, education - endowment leases, and pastoral licenses in mining districts under special regulations.
A five years’ summary is as follows:—
| Year ended 31st March. | Sold for Cash. | Deferred-payment Licenses. | Leases and Licenses (Ordinary Settlement). | Small Grazing-runs. | Totals. |
|---|---|---|---|---|---|
| 1916 | 319 | 11 | 884 | 12 | 1,226 |
| 1917 | 313 | 37 | 868 | 16 | 1,234 |
| 1918 | 180 | 14 | 708 | 5 | 907 |
| 1919 | 27 | 44 | 573 | 1 | 745 |
| 1920 | 253 | 94 | 1,007 | 11 | 1,365 |
The acreage represented by the selections included in the foregoing table is as follows:—
| Year ended 31st March. | Sold for Cash. | Deferred-payment Licenses. | Leases and Licenses (Ordinary Settlement). | Small Grazing-runs. | Totals. |
|---|---|---|---|---|---|
| Acres. | Acres. | Acres. | Acres. | Acres. | |
| 1916 | 7,097 | 486 | 251,822 | 150,514 | 409,919 |
| 1917 | 5,414 | 680 | 231,477 | 135,691 | 373,262 |
| 1918 | 4,696 | 992 | 151,854 | 31,093 | 188,635 |
| 1919 | 2,225 | 632 | 136,754 | 2,532 | 142,143 |
| 1920 | 3,957 | 2,110 | 247,925 | 128,437 | 382,429 |
The following table shows in a condensed form the area of Crown land held at 31st March, 1920, the yearly rental payable, and the area made freehold:—
| Tenure. | Total Number of Selectors. | Total Area held. | Total Yearly Rental or Instalment Payable. | Total Area made Freehold. | |
|---|---|---|---|---|---|
| Number of Purchasers. | Area. | ||||
| Acres. | £ | Acres. | |||
| Cash lands | 13,196,536 | ||||
| Deferred payment | 1,157 | 247,242 | 47,034 | 9,981 | 1,179,497 |
| Perpetual lease | 290 | 24,688 | 1,410 | 2,988 | 843,674 |
| Occupation with right of purchase | 4,947 | 1,507,814 | 115,527 | 3,488 | 949,234 |
| Lease in perpetuity | 8,167 | 1,752,876 | 202,960 | 2,403 | 456,438 |
| Renewable lease | 5,875 | 11,744,903 | 420,231 | 249 | 31,175 |
| Agricultural lease | 12 | 319 | 14 | 1,358 | 134,326 |
| Mining districts land occupation leases | 700 | 21,830 | 1,528 | 55 | 2,091 |
| Pastoral licenses in mining districts under special regulations | 921 | 224,596 | 5,318 | 7 | 829 |
| Small grazing-runs | 860 | 2,740,032 | 97,324 | 33 | 40.763 |
| Pastoral runs | 667 | 10,174,236 | 157,431 | ||
| Miscellaneous leases and licenses | 6,475 | 1,348,030 | 37,641 | ||
| Totals | 30,071 | 19,786,566 | 1,086.418 | 20,622 | 16,834,563 |
| Thermal - spring leases (Rotorua) | 325 | 3,362 | 2,061 | ||
| Education endowments— | |||||
| Primary | 3,191 | 764,751 | 94,339 | 3 | 86 |
| Secondary | 407 | 38,777 | 6,833 | ||
| Totals | 3,598 | 803,528 | 101,172 | 3 | 86 |
| Grand totals | 33,994 | 20,593,456 | 1,189,651 | 20,625 | 16,834,649 |
| Other endowment lands | 749 | 353,148 | 16,325 | 4 | 5,019 |
Much of the land legislation of recent years has been in the direction of preventing large areas of good land from being acquired or retained by a single individual. The Land Laws Amendment Acts of 1912 and 1913 went further in the direction of encouraging or compelling subdivision of land held in large areas. Part III of the Land Laws Amendment Act, 1912, makes provision for agreements between the Minister of Lands and the owner in fee-simple of any land for the subdivision of that land, and for the disposal by public tender of the allotments by way of sale or by way of lease with right of purchase.
Section 49 provides for similar agreements between the Minister and the owners of Native freehold land in respect of the disposition by sale or lease of that land.
In Part VI of the Land Laws Amendment Act, 1913, provision is made whereby the Minister of Lands may at any time in writing notify an owner of land that such land or a portion thereof is required for purposes of settlement. The owner of land is required, within six months after such notice has been gazetted, to notify the Minister whether he elects (a) to himself subdivide and offer the land for sale in subdivisions, or (b) to enter into an agreement with the Minister as above, or (c) that the land shall be taken compulsorily under the Land for Settlements Act.
In Part VII of the Land Laws Amendment Act, 1913, provision is made for compulsorily taking private land (not within a borough or town district) in cases where in the opinion of the Board of Land Purchase Commissioners such land has been acquired by way of aggregation, and where such aggregation is contrary to the public interest. Compensation is payable for all land so taken.
The number of estates offered during the year was less than that for the previous one, being 461, of an acreage of 619,680 acres. The whole was considered for soldier settlements. The area purchased and completed is 176,836 acres, of a value of £1,929,435. Besides there was purchased for individual soldiers 25,061 acres, of a value of £423,017. Further areas were purchased but not yet taken over—viz., 47,235 acres, valued at £583,281, for ballot, and 16,814 acres, valued at £403,466, for individual soldiers. The areas dealt with show a large increase on previous years.
Amongst the areas secured is part of the Hill Springs Estate, adjoining Teviot—9,820 acres, with 28,600 of Crown leasehold given in.
The general demand for land, especially for dairying and grazing, is extremely keen, and prices are being paid for properties far beyond what the members of the Boards feel they can safely recommend. A large number of the places offered present insuperable difficulties in the way of roading and subdividing into reasonable areas, and the want of suitable homestead-sites.
A table is given showing for each land district the number and area of estates purchased to the 31st March, 1920, together with information as to purchase-money and incidental expenses.
| Land District. | Number. | Area. | Purchase-money. | Incidental Expenses, Improvements, Roads, &. |
|---|---|---|---|---|
| Acres. | £ | £ | ||
| Auckland | 84 | 375,203 | 1,303,919 | 122,191 |
| Hawke's Bay | 53 | 289,339 | 2.047,328 | 115,571 |
| Taranaki | 18 | 18,214 | 264,545 | 12,953 |
| Wellington | 115 | 135,455 | 1,689,331 | 98,201 |
| Marlborough | 17 | 217.709 | 687,838 | 62,071 |
| Nelson | 10 | 35,834 | 86,275 | 5,458 |
| Westland | 2 | 5,125 | 8,343 | 2,981 |
| Canterbury | 158 | 441,277 | 3,287,602 | 147.880 |
| Otago | 66 | 285,207 | 1,635,561 | 131,055 |
| Southland | 23 | 87,648 | 423,313 | 29,928 |
| Totals | 546 | 1,891,011 | 11,434,055 | 728,289 |
The transfer of certain areas from Crown to settlement lands, and the adjustment of areas to account for ascertained surpluses or deficiencies, brings the total area to 1,899,346 acres at the 31st March, 1920. Of this, 160,325 acres have been sold for cash or made freehold, the total purchase-money being £597,169; and 22,786 acres are occupied by roads or by reserves unlet. At the 31st March, 1920, 6,167 selectors were holding a total of 631,163 acres, the annual rental for which amounts to £62,941; and the remaining 84,869 acres were unlet. The figures for each land district are as follows:—
| POSITION OF LAND FOR SETTLEMENTS AT THE 31ST MARCH, 1920. | ||||||
|---|---|---|---|---|---|---|
| District. | Net Area acquired, including ascertained Surplus. | Area occupied by Roads and Reserves unlet. | Area of Land unlet, including Land forfeited, surrendered, or resumed and not relet, and also Land not yet offered for Selection. | Total Area purchased for Cash or made Freehold to Date. | ||
| Number of Purchasers. | Area. | Price realized. | ||||
| Acres. | Acres. | Acres. | Acres. | £ | ||
| North Auckland | 31,828 | 636 | 2,506 | 143 | 1,349 | 17,564 |
| Auckland | 310,371 | 6,715 | 74,772 | 502 | 100,629 | 206,240 |
| Hawke's Bay | 249,304 | 2,623 | 100 | 18,852 | 114,522 | |
| Taranaki | 9.532 | 90 | 155 | 20 | 1,052 | 24,240 |
| Wellington | 102,501 | 910 | 399 | 97 | 6,792 | 71,161 |
| Nelson | 39,388 | 855 | 1,469 | 5 | 966 | 2,153 |
| Marlborough | 228,358 | 2,683 | 740 | 28 | 4,557 | 15,650 |
| Westland | 3,230 | 66 | 2 | 192 | 116 | |
| Canterbury | 582,935 | 4,427 | 931 | 174 | 12,833 | 96,069 |
| Otago | 247,732 | 2,811 | 3,265 | 36 | 4,976 | 22,599 |
| Southland | 94,167 | 970 | 632 | 58 | 8,127 | 26,855 |
| Totals | 1,899.346 | 22,786 | 84,869 | l,165 | 160,325 | 597,169 |
| District. | Total Lands leased to Date. | Rent and other Payments received during the Years. | Total Receipts from Inception to 31st March, 1920. | ||
|---|---|---|---|---|---|
| Number of Selectors. | Area. | Annual Rental. | |||
| Acres. | £ | £ | £ | ||
| North Auckland | 215 | 27,337 | 10,262 | 7,785 | 77,051 |
| Auckland | 807 | 128,255 | 32,905 | 66,526 | 544,405 |
| Hawke's Bay | 713 | 227,828 | 81,141 | 109,646 | 1,178,347 |
| Taranaki | 93 | 8,235 | 6,683 | 7,739 | 72,427 |
| Wellington | 673 | 94,400 | 56,330 | 62,617 | 300,046 |
| Nelson | 47 | 36,097 | 3,679 | 3,392 | 28,652 |
| Marlborough | 470 | 220,187 | 33,147 | 33,306 | 438,422 |
| Westland | 22 | 2,972 | 268 | 540 | 10,362 |
| Canterbury | 1,800 | 564,744 | 153,771 | 162,512 | 1,909,320 |
| Otago | 1,006 | 236,670 | 65,424 | 67,508 | 873,151 |
| Southland | 321 | 84,438 | 19,331 | 22,916 | 253,300 |
| Totals | 6,167 | 1,631,163 | 462,941 | 544,487 | 4,685,483 |
The Land for Settlements Account at the 31st March, 1920, stands as under:—
| Receipts. | £ | s. | d. |
|---|---|---|---|
| Loans current | 8,966,487 | 0 | 0 |
| Rents, &., received | 5,232,378 | 17 | 5 |
| Sales of settlement lands | 786,763 | 9 | 9 |
| Sales of workers’ dwellings | 43,180 | 12 | 8 |
| Receipts under Land Act, section 191 | 8,782 | 7 | 10 |
| Receipts under Land Act, section 177 | 59,700 | 17 | 1 |
| Sale of Crown lands | 1,085,898 | 17 | 7 |
| Interest on investments | 26,341 | 15 | 10 |
| Recoveries | 1,303 | 18 | 10 |
| Premium on loan | 117 | 0 | 0 |
| Four-per-cent. stock created to cover expenses of raising loan | 349 | 0 | 0 |
| Receipts on account of Teviot for year | 10,977 | 3 | 11 |
| £16,222,2811 | 0 | 11 |
| Payments. | £ | s. | d. |
|---|---|---|---|
| Purchase-money | 9,981,738 | 5 | 5 |
| Incidental expenses | 821,278 | 19 | 3 |
| Interest | 4,318,928 | 6 | 11 |
| Sinking fund | 663,496 | 8 | 0 |
| Land Laws Amendment Act, section 63 | 280,171 | 0 | 0 |
| Balance | 156,668 | 1 | 4 |
| £16,222,281 | 0 | 11 |
On the 1st January, 1910, the Land Settlement Finance Act, which is described fully in the 1915 issue of this book, came into force. The associations incorporated now number forty-six.
Under the provisions of the Discharged Soldiers Settlement Act, 1915 and amendments, any person is entitled to the benefits of the Act who has been a member of a New Zealand Naval or Expeditionary Force, has served beyond New Zealand in connection with the present war, has returned to New Zealand, and has received an honourable discharge, together with any person who immediately prior to the commencement of the present war was a bona fide resident of New Zealand, and has also served during the present war with some portion of His Majesty's Naval or Military Forces (not being Forces raised in New Zealand), and has received an honourable discharge therefrom. In addition, all discharged members of an Expeditionary Force who, having been classed as medically fit for service beyond the seas, have served as members of that Force in a camp of military training and remained attached to that camp on the 12th November, 1918 (being the date of the cessation of hostilities with Germany), are entitled to apply for advances or private land under sections 2 or 3 of the Discharged Soldiers Settlement Amendment Act, 1917. (See paragraphs headed “Private Land” and “Financial Assistance.”)
Any discharged soldier wishing to take up land should obtain a provisional application form, answer the questions thereon, and forward it to the Commissioner of Crown Lands for the land district in which he desires to settle. Provisional application forms may be obtained at any land office or from the Discharged Soldiers’ Information Department, Wellington. On receipt of a provisional application the Commissioner will supply the applicant with information regarding all available Crown lands in his land district, and the Land Board will endeavour to place the applicant on a suitable holding.
There is power to dispose of land under the ordinary tenures of the Land Act, 1908, and the Land for Settlements Act, 1908—i.e., for cash, or occupation with right of purchase, or on renewable lease under the former Act, and renewable lease under the latter Act, also under the “special tenures” of the Discharged Soldiers Settlement Act, 1915, which are cash, deferred payment, or a renewable lease with a purchasing clause. The various tenures mentioned may be explained as under, and are given under two heading–viz., “Ordinary Tenures” and “Special Tenures.”
Cash.—In all cases of purchase of land for cash the applicant is required to pay one-fifth of the purchase-money at the date of the sale, and the balance, with the Crown-grant fee, within thirty days from the date of the approval of the application.
Occupation with Right of Purchase.–Term, twenty-five years; rental, 5 per cent. on the capital value of the land; right of purchase after the license has been held six years, provided the residence and improvement conditions have been complied with. If the licensee does not acquire the freehold prior to the expiration of the term of twenty-five years he has a prior right to a renewable lease.
Renewable Lease under the Land Act.—Term, sixty-six years, with a perpetual right of renewal; rental, 4 per cent. on the capital value of the land. Land selected under this tenure immediately becomes national endowment, and there is no right to the freehold.
Renewable Lease under the Land for Settlements Act.—Term, thirty-three years, with perpetual right of renewal; rental, 4 1/2 per cent. on the capital value of the land. Right of purchase at any time during the currency of the lease. Purchase of the freehold may be made on the deferred-payment system if desired.
Cash.—The remarks already made under “Cash” heading apply to cash selections under “Special Tenures.”
Deferred Payment under Special Tenures.—Term, twenty years; licensee to deposit 5 per cent. of the purchase-money, and thereafter pay the balance of 95 per cent. by equal annual payments, together with interest at 5 per cent., payable half-yearly, on all outstanding balances. The licensee has the right to pay off the whole or any part of the outstanding money at any time during the currency of the license.
Renewable Lease with Purchasing Clause under Special Tenures.—Term may be for any period not exceeding thirty-three years in the case of settlement land, and sixty-six years in the case of Crown land, with perpetual rights of renewal for thirty-three years or sixty-six years as the case may be. Freehold may be acquired any time during the currency of the lease. Purchase of the freehold may be made on the deferred-payment system if desired.
Under section 3 of the Discharged Soldiers Settlement Amendment Act, 1917, one or more discharged soldiers may apply to the Land Board with a view to the acquisition by the Crown on their behalf of any private land. The Land Board, however, cannot deal with such application until an offer in writing to sell the land to the Crown has been submitted to the Board by the owner of the land. It can then consider the application and offer, and forward them to the Minister of Lands with such recommendations as it thinks proper. The Minister may thereupon refer the offer to the Land Purchase Board for consideration, and if the land or any part thereof is acquired by the Crown, it may then be disposed of under the Discharged Soldiers Settlement Act to the applicant. (See also under heading of “Financial Assistance.”)
The Minister may set land apart for the purpose of soldiers’ dwellings, and may erect suitable buildings thereon. The land and dwellings may then be disposed of to discharged soldiers in the same manner generally as in the case of workers by the Workers’ Dwellings Act, 1910.
No transfer of land selected under the Discharged Soldiers Settlement Act will be permitted for a period of ten years, except with the approval of the Land Board and the Minister of Lands.
Section 2 of the Discharged Soldiers Settlement Amendment Act, 1917, provides that financial assistance may be given to discharged soldiers for the following purposes: (a) The purchase of private or Native land; (b) the acquisition by assignment or transfer of the lease of any land; and (c) the discharge of any mortgage affecting any land owned by a discharged soldier or held by him under license or lease from a Land Board. The maximum amount for any of these purposes that may be advanced to any one person is £2,500, with a further advance of £750 for improvements, stock, &., where necessary. Repayment of advances may be secured by flat mortgage for ten years, with interest at 5 per cent., or by instalment mortgage extending over a period of thirty-six years and a half, with an annual charge of 6 per cent., which includes interest and sinking fund.
If assistance is required for the purchase of a residential site with dwelling thereon, an advance not exceeding £1,000 may be made, or, in the event of the site being owned by the applicant, an advance not exceeding £900 may be made towards the erection of a dwelling thereon. Repayment of advances may be secured by flat mortgage for ten years, with interest at 5 per cent., or by instalment mortgage extending over a period of twenty-five years and a half, with an annual charge of 7 per cent., which includes interest and sinking fund.
Valuation fees are payable with applications.
In addition, financial assistance may be given to discharged soldiers who own freehold land or are the lessees or licensees of any land administered by a Land Board, for any of the following purposes: The clearing, fencing, draining, and general improvement (including erection of buildings) of the land, and the purchase of plant, stock, implements, seeds, trees, &. Except in the case of a house to be built on other than rural land, the maximum total amount that may be advanced for all the foregoing purposes is £500 (not more than £250 of this being for a dwelling and other buildings) unless there be special circumstances in which the amount would be inadequate, when the Minister may authorize an additional advance not exceeding £250.
Advances are secured by a first mortgage over the land, with the addition, at the option of the Minister, of a bill of sale over the stock implements, &. The rate of interest is 5 per cent.
Advances for improvements or buildings may be made by progress-payments up to 75 per cent. of the value of any work done.
Applications for assistance, giving full particulars, must be made to the Land Board for the district in which the land affected is situated. Before making its recommendation the Board will require the applicant to appear personally before it, or before such person as it may appoint. No application for an advance to assist in the purchase of land can be considered unless accompanied by an option to purchase the fee-simple, or lease, or license, as the case may be.
At the 31st March, 1920, advances amounting to £12,610,254, to 12,415 settlers, had been authorized. Advances actually made to the same date reached a total of £8,859,173, of which £178,398 has already been repaid.
The following table shows the total area proclaimed under the Discharged Soldiers Settlement Act, 1915. Of the total area proclaimed, ordinary Crown lands amounted to 365,092 acres, Cheviot Estate to 3,356 acres, land for settlements to 198,815 acres, and national-endowment land to 316,038 acres.
| District. | Under Section 3 of the Act. (Ordinary Tenures.) | Under Section 4 of the Act. (Special Tenures.) | Total Area proclaimed. | |||
|---|---|---|---|---|---|---|
| For the Year ended 31st March, 1920. | Total to 31st March, 1920. | For the Year ended 31st March, 1920. | Total to 31st March, 1920. | For the Year ended 31st March, 1920. | Total to 31st March, 1920. | |
| Acres. | Acres. | Acres. | Acres. | Acres. | Acres. | |
| North Auckland | 13,709 | 13,709 | 13,520 | 13,520 | 27,229 | 27,229 |
| Auckland | 6,638 | 40,611 | 23,317 | 85,291 | 29,955 | 125,902 |
| Hawke's Bay | 2,846 | 16,658 | 30,434 | 101,369 | 33,280 | 118,027 |
| Taranaki | 597 | 11,562 | 9,272 | 16,968 | 9,869 | 28,530 |
| Wellington | 1,591 | 11,440 | 86,459 | 11,440 | 88,050 | |
| Nelson | 2,856 | 26,086 | 4,351 | 8,137 | 7,207 | 34,223 |
| Marlborough | 1,910 | 12,930 | 1,910 | 12,930 | ||
| Westland | 11,186 | 480 | 11,666 | |||
| Canterbury | 154,727 | 233,028 | 19,092 | 27,124 | 173,819 | 260,152 |
| Otago | 65,893 | 118,377 | 9,212 | 36,450 | 75,105 | 154,827 |
| Southland | 2,836 | 10,140 | 4,028 | 11,625 | 6,864 | 21,765 |
| Totals | 250,102 | 482,948 | 126,576 | 400,353 | 376,678 | 883,301 |
During the year ended 31st March, 1920, 5,041 applications were made under the provisions of the Discharged Soldiers Settlement Act, and allotments were made in the case of 932 applicants. The following table shows the number of applications for land in each of the several land districts of the Dominion, and also the number of applications granted, together with the areas so allotted:—
| District. | Applications. | Allotments | |
|---|---|---|---|
| Number. | Area. | ||
| Acres. | |||
| North Auckland | 200 | 113 | 27,082 |
| Auckland | 440 | 226 | 41,439 |
| Hawke's Bay | 740 | 80 | 31,730 |
| Taranaki | 132 | 33 | 11,053 |
| Wellington | 575 | 227 | 39,574 |
| Nelson | 17 | 11 | 11,136 |
| Marlborough | 43 | 10 | 2,879 |
| Westland | 16 | 10 | 3,611 |
| Canterbury | 1,998 | 119 | 187,947 |
| Otago | 796 | 58 | 33,413 |
| Southland | 84 | 45 | 14,027 |
| Totals | 5,041 | 932 | 403,891 |
NATIVE lands and Native affairs generally are administered by the Native Department as indicated below.
The Native Land Court is the Court of Record of Titles, and deals, inter alia, with the partition and exchange of Native lands, succession, probate and letters of administration, consolidation of interests, incorporation of owners, and alienation.
Maori Land Boards, of which there are seven, all located in the North Island, are concerned with the confirmation and approval of alienations, the administration of Native lands by way of sale or lease, and the administration of estates as farms.
The Registrars of the Native Land Courts are also the administrative officers of the Maori Land Boards of the various districts.
The purchase of lands on behalf of the Crown is conducted by a Native Land Purchase Board.
Maori Councils elected for defined districts, and composed of Natives, supervise matters generally affecting the Maori settlements and kaingas, more particularly as regards sanitary arrangements.
The terms “partition” and “individualization” as applied to Native Land Court dealings are often confused. To individualize is to partition in severalty, and not merely to define relative interests, which may be done without further partition. To partition is to cut out certain interests in a block of land, and may not necessarily be for an individual. The term “customary land,” which is also sometimes misunderstood, is applied to land not yet clothed with a Native Land Court title. Customary land was formerly known as papatupu land.
Particulars of the business dealt with by the Native Land Court during the twelve months ended 31st March, 1920, are as follows:—
| Number of sittings | 169 |
| Number of cases notified | 28,954 |
| Number of cases for which orders were made | 10,399 |
| Number of cases dismissed | 3,000 |
| Number of cases adjourned sine die | 15,834 |
| Number of partitions made | 904 |
| Area affected (acres) | 358,791 |
| Number of investigations of title | 11 |
| Area affected (acres) | 557 |
| Number of succession orders made | 8,511 |
| Number of other orders made | 2,386 |
| Prom the Native Land Court an appeal lies to the Native Appellate Court. | |
The total area vested in and administered by the various Maori Land Boards at 31st March, 1920, was 942,632 acres.
During the year 1,021 acres of vested land were disposed of by lease, as against 1,024 acres by lease and 4,733 acres by sale in the previous year.
With regard to Native freehold land, the Boards during the year approved of 405 leases, comprising 39,246 acres, and confirmed 1,248 transfers (apart from sales to the Crown) affecting 103,306 acres of freehold land.
During the year some 107 blocks, comprising 75,119 acres, were proclaimed Crown land. The actual purchases made during the year totalled an area of 121,176 acres. In the Urewera Reserve an area of 29,996 acres was secured, making the Crown purchases in the Urewera total 320,578 acres as at the 31st March last.
During the ten years which have elapsed since the coming into operation of the Native Land Act, 1909, the total area of Native land alienated by way of sale has been approximately 2,380,000 acres. Of this total an area of some 1,076,570 acres has been acquired on behalf of the Crown for settlement purposes, at a purchase-price of £2,505,473.
The total area of lands held by Maori owners at 31st March, 1920, was 5,066,197 acres, of which 4,787,686 acres were situated in the North Island. Dealing with the North Island only, the position was:—
| Acres. | |
|---|---|
| Leased through Maori Land Boards | 2,810,637 |
| Leased and farmed by East Coast Trust Commissioner | 158,432 |
| Leased by Public Trustee | 151,801 |
| Leased under special enactments | 9,538 |
| Occupied by Maori owners (estimated) | 380,000 |
| Unoccupied | 1,277,278 |
| Total | 4,787,686 |
A high proportion of the unoccupied land consists of pumice land, mountain-tops, sand-dunes, &. The position is briefly that there is barely sufficient Native land for the requirements of the Natives themselves.
PRIOR to 1870 conveyancing in New Zealand was based upon the English laws of real property as existing at the date of the constitution of the colony, varied in some important particulars by the Conveyancing Ordinance of 1842 and other colonial legislation, now embodied in the Property Law Act, 1908. Considerable areas of land in all parts of the Dominion are still held and dealt with under this system. Although provision is made for the registration of deeds affecting such land, registration is no guarantee of their validity, and a purchaser has to rely for the security of his title upon the skill and care of his legal adviser.
By the Land Transfer Act, 1870, the system of title by registration was introduced. The title to land under this system is not affected by the execution of documents. Registration is the fundamental principle, and it is only on registration that any interest passes. The Land Transfer Department assumes all responsibility for the registration, and any person named in the register as taking an interest under a registered instrument acquires a practically indefeasible title.
Provision has existed since 1841 and is now contained in the Deeds Registration Act, 1908, for the registration of deeds and instruments affecting land which is not subject to the provisions of the Land Transfer Act. Registration is not essential to the validity of the instrument, but it is highly important as a record and to secure priority. The Act provides that every deed shall be void as against any person claiming for valuable consideration under any subsequent deed duly registered unless the earlier deed was registered before the subsequent one. The Department is not responsible for the form or matter of the instruments registered beyond seeing that they are duly stamped and contain a sufficient description of the land to identify it.
Provision is made for the deposit of instruments in the Deeds Registry Office for safe custody and reference, and such deposit operates as a release from any covenant for production.
The Deeds Index and all recorded and deposited instruments are open to public inspection, and certified copies may be obtained on payment of the prescribed fees.
| Year ended 31st March. | Deeds recorded. | Fees. £ |
|---|---|---|
| 1915 | 15,716 | 15,133 |
| 1916 | 15,348 | 15,429 |
| 1917 | 15.664 | 14,371 |
| 1918 | 13,673 | 13,226 |
| 1919 | 12,798 | 13,148 |
| 1920 | 24,650 | 25,157 |
The land-transfer system in New Zealand originated, as stated above, with the Land Transfer Act, 1870. This re-enacted with amendments is now the Land Transfer Act, 1915.
The land subject to the Land Transfer Act comprises all land alienated from the Crown since 1870, all land included in any order under the Native Land Acts vesting such land in any person in freehold tenure, and all land vested in any person in fee-simple by virtue of any Act of the General Assembly, besides land which has been brought under the Act on the application of the proprietors after investigation and acceptance of the title by the Department.
Full information concerning the land-transfer system is given in the 1914 and preceding issues of this book.
Information as to applications to bring land under the Land Transfer Act during each of the past five years is given in the next table.
| Year ended 31st March. | Applications. | |||
|---|---|---|---|---|
| Number. | Area. | Value. | ||
| Town and Suburban. | Country. | |||
| Acres. | Acres. | £ | ||
| 1916 | 428 | 185 | 64,914 | 1,215,552 |
| 1917 | 409 | 133 | 37,447 | 1,029,143 |
| 1918 | 316 | 99 | 89,388 | 965,089 |
| 1919 | 291 | 133 | 76,441 | 776,403 |
| 1920 | 497 | 175 | 85,237 | 1,343,243 |
The following table shows the number of certificates issued for the past ten years. Included in the totals are those certificates issued in lieu of Crown grants, 1,206 being the number for 1919–20.
| CERTIFICATES OF TITLE ISSUED. | |
|---|---|
| Year ended 31st March. | Number. |
| 1911 | 11,645 |
| 1912 | 12,907 |
| 1913 | 13,075 |
| 1914 | 12,867 |
| 1915 | 11,074 |
| 1916 | 10,525 |
| 1917 | 10,350 |
| 1918 | 10,230 |
| 1919 | 7,988 |
| 1920 | 11,637 |
The table next following shows transfers registered under the Land Transfer Act during each of the past five years:—
| TRANSFERS REGISTERED. | ||||
|---|---|---|---|---|
| Year ended 31st March. | Number. | Area. | Consideration-money. | |
| Town and Suburban. | Country. | |||
| Acres. | Acres. | £ | ||
| 1915 | 21,381 | 6,206 | 2,129,973 | 17,206,248 |
| 1916 | 22,394 | 7,073 | 2,414,007 | 22,264,623 |
| 1917 | 22,187 | 79,316 | 2,676,691 | 34,288,831 |
| 1918 | 19,949 | 6,156 | 2,008,370 | 18,083,634 |
| 1919 | 22,496 | 21,156 | 1,992,312 | 25,197,384 |
One of the most notable differences between the present system of land-transfer and the former is in respect of the form of a mortgage. Under the old system the mortgagor conveyed the land to the mortgagee subject to a right to a reconveyance or “equity of redemption” on repayment of the money. Under the Act no transfer of the property takes place, but a charge only is created, the mortgagee being specially empowered to sell the land in the event of default being made in payment. A simple receipt by the mortgagee for the amount secured releases the land from the encumbrance. Provision is made, similar to that contained in the Property Law Act, for sale through the Registrar of the Supreme Court in the event of the mortgagee desiring to buy in the mortgaged land.
| Year ended 31st March. | Number. | Area. | Amount secured. | |
|---|---|---|---|---|
| Town and Suburban. | Country. | |||
| Acres. | Acres. | £ | ||
| 1916 | 20,545 | 4,872 | 4,608,014 | 18,428,772 |
| 1917 | 18,803 | 4,342 | 3,714,395 | 17,604,524 |
| 1918 | 15,899 | 4,118 | 3,559,517 | 14,879,640 |
| 1919 | 16,069 | 18,742 | 2,830,260 | 15,891,277 |
| 1920 | 35,632 | 43,398 | 6,050,551 | 40,670,049 |
In regard to mortgages under the Land Transfer Act, a table is added showing the total amount remaining secured by such mortgages on the 31st March, 1920.
| District. | Amount. |
|---|---|
| £ | |
| Auckland | 33,069,405 |
| Taranaki | 13,897,481 |
| Wellington | 39,445,373 |
| Hawke's Bay | 15,616,311 |
| Poverty Bay | 6,493,976 |
| Nelson | 2,909,701 |
| Marlborough | 2,664,143 |
| Canterbury | 28,186,325 |
| Otago | 8,629,073 |
| Southland | 9,668,655 |
| Westland | 571,297 |
| Total | 161,151,740 |
The total, £161,151,740, represents a net increase of £21,404,574 during the year, the amount of mortgages paid off since 1st April, 1919, being £19,265,475, as against mortgages registered amounting to £40,670,049, shown above.
In addition to the mortgages under the Land Transfer Act, a considerable number are registered under the Deeds Registration Act. During the year ended the 31st March, 1920, the total mortgages registered were 42,664, representing £48,442,900, so that the registrations of mortgages under the Deeds Registration Act numbered 7,032, for an amount of £7,772,851.
The total amount represented by the mortgages on the register under the Land Transfer and Deeds Registration Acts on the 1st April, 1920, was £172,106,789, as compared with £146,750,636 a year previous.
It should be explained that the amounts quoted in respect of mortgages do not represent the true amounts of advances secured by deed. In cases where the property mortgaged is situated in more than one registration district the deed is registered for the full amount in each district, and thus there is some degree of duplication. On the other hand, mortgages are not all registered, those given in security for temporary loans, stock and crop liens, bills of sale, and chattels—transfers not being included in the figures.
Classified according to the various rates of interest, the amounts in the mortgage-deeds registered during 1919–20 are compared with the last pre war year, 1913–14:—
| Rate per Cent. | 1913–14. | 1919–20. |
|---|---|---|
| £ | £ | |
| 4 | 78,053 | 54,937 |
| 4 1/2 | 325,487 | 84,826 |
| 5 | 4,792,360 | 10,124,172 |
| 5 1/2 | 349,805 | 61,317 |
| 5 1/2 | 3,968,897 | 13,409,139 |
| 5 1/2 | 176,044 | 713,436 |
| 6 | 6,317,723 | 16,164,802 |
| 6 1/2 | 801.919 | 1,882,491 |
| 7 | 1,128,676 | 1,432,412 |
| 7 1/2 | 199,653 | 201,078 |
| 8 | 814,164 | 1,199,160 |
| 9 | 64,279 | 139,696 |
| 10 | 181,868 | 148,901 |
| Other and unspecified | 2,153,767 | 2,826,533 |
| Totals | 21,352,695 | 48,442,900 |
THE total area of the Dominion, excluding Cook and other Pacific islands annexed in 1901, is 66,292,232 acres. Of this total, 43,473,079 acres were returned in 1920 as being in occupation, including reserves and Native lands leased, but excluding areas within borough boundaries and holdings of less than 1 acre in extent. Of the balance, it is estimated that 3,307,515 acres are barren and 2,244,564 occupied by lakes, rivers, and roads.
The numbers of holdings and percentages of total holdings in occupation in groups of sizes, as returned at the past five collections, are given below:—
| Area, in Acres. | Number of Holdings. | Percentages of Total. | ||||||||
|---|---|---|---|---|---|---|---|---|---|---|
| 1916. | 1917. | 1918. | 1919. | 1920. | 1916. | 1917. | 1918. | 1919. | 1920. | |
| (Inclusive) | ||||||||||
| 1 to 10 | 15,454 | 15,832 | 15,735 | 15,674 | 15,554 | 20.01 | 19.91 | 19.63 | 19.48 | 19.06 |
| 11 to 50 | 12,748 | 13,097 | 13,232 | 13,291 | 13,367 | 16.51 | 16.45 | 16.51 | 16.52 | 16.38 |
| 51 to 100 | 9,122 | 9,399 | 9,479 | 9,524 | 10,039 | 11.81 | 11.82 | 11.83 | 11.84 | 12.31 |
| 101 to 200 | 12,159 | 12,609 | 12,698 | 12,745 | 13,079 | 15.75 | 15.85 | 15.84 | 15.84 | 16.03 |
| 201 to 320 | 7,972 | 8,157 | 8,217 | 8,277 | 8,500 | 10.32 | 10.26 | 10.25 | 10.28 | 10.42 |
| 321 to 640 | 9,572 | 9,800 | 9,940 | 10,031 | 10,166 | 12.39 | 12.32 | 12.40 | 12.46 | 12.46 |
| 641 to 1,000 | 3,895 | 4,022 | 4,120 | 4,133 | 4,080 | 5.04 | 5.06 | 5.14 | 5.13 | 5.00 |
| 1,001 to 5,000 | 5,284 | 5,540 | 5,623 | 5,699 | 5,722 | 6.84 | 6.97 | 7.02 | 7.08 | 7.01 |
| 5,001 to 10,000 | 517 | 562 | 565 | 562 | 550 | 0.67 | 0.71 | 0.71 | 0.70 | 0.67 |
| 10,001 to 20,000 | 277 | 281 | 291 | 287 | 299 | 0.36 | 0.35 | 0.36 | 0.36 | 0.37 |
| 20,001 to 50,000 | 165 | 173 | 185 | 183 | 174 | 0.21 | 0.22 | 0.23 | 0.23 | 0.21 |
| Over 50,000 acres | 64 | 64 | 61 | 62 | 62 | 0.09 | 0.08 | 0.08 | 0.08 | 0.08 |
| Totals | 77,229 | 79,536 | 80,146 | 80,468 | 81,592 | 100.00 | 100.00 | 100.00 | 100.00 | 100.00 |
The areas of holdings in occupation by size-groups, and the percentage each group represents of the total area in occupation, are now given.
| Sizes of Holdings, in Acres. | Aggregate Area of Group (Acres). | ||||
|---|---|---|---|---|---|
| 1916. | 1917. | 1918. | 1919. | 1920. | |
| (Inclusive) | |||||
| 1 to 10 | 69,390 | 72,071 | 72,413 | 72,524 | 72,191 |
| 11 to 50 | 358,726 | 368,068 | 372,509 | 373,737 | 376,722 |
| 51 to 100 | 708,228 | 730,703 | 737,054 | 741,469 | 780,437 |
| 101 to 200 | 1,812,196 | 1,873.968 | 1,890,152 | 1,895,119 | 1,942,252 |
| 201 to 320 | 2,054,917 | 2,096,827 | 2,114,802 | 2,129,449 | 2,186,233 |
| 321 to 640 | 4,355,985 | 4,465,009 | 4,525,386 | 4,576,782 | 4,641,779 |
| 641 to 1,000 | 3,149,598 | 3,242,427 | 3,330,364 | 3,365,145 | 3,301,292 |
| 1,001 to 5,000 | 10,366,504 | 10,911,716 | 11,015,761 | 11,199,385 | 11,305,733 |
| 5,001 to 10,000 | 3,593,266 | 3,929,618 | 3,949,500 | 3,905,073 | 3,824,623 |
| 10,001 ”20,000 | 3,880,927 | 3,975,105 | 4,091,022 | 4,033,038 | 4,235,689 |
| 20,001 to 50,000 | 5,126,470 | 5,442,567 | 5,727,399 | 5,654,073 | 5,371,215 |
| Over 50,000 acres | 5,785,986 | 5,636,640 | 5,385,717 | 5,396,912 | 5,434,913 |
| Totals | 41,262,193 | 42,744,719 | 43,212,079 | 43,342,706 | 43,473,079 |
| Sizes of Holdings, in Acres. | Percentage of Total Area occupied. | ||||
|---|---|---|---|---|---|
| 1916. | 1917. | 1918. | 1919. | 1920. | |
| (Inclusive) | |||||
| 1 to 10 | 0.17 | 0.16 | 0.17 | 0.17 | 0.17 |
| 11 to 50 | 0.87 | 0.86 | 0.86 | 0.86 | 0.87 |
| 51 to 100 | 1.72 | 1.71 | 1.71 | 1.71 | 1.80 |
| 101 to 200 | 4.39 | 4.38 | 4.37 | 4.37 | 4.47 |
| 201 to 320 | 4.98 | 4.91 | 4.89 | 4.91 | 5.03 |
| 321 to 640 | 10.56 | 10.45 | 10.47 | 10.56 | 10.68 |
| 641 to 1,000 | 7.63 | 7.59 | 7.71 | 7.76 | 7.59 |
| 1,001 to 5,000 | 25.12 | 25.53 | 25.49 | 25.84 | 26.00 |
| 5,001 to 10,000 | 8.71 | 9.19 | 9.14 | 9.01 | 8.80 |
| 10,001 to 20,000 | 9.41 | 9.30 | 9.47 | 9.31 | 9.74 |
| 20,001 to 50,000 | 12.42 | 12.73 | 13.26 | 13.05 | 12.35 |
| Over 50,000 acres | 14.02 | 13.19 | 12.46 | 12.45 | 12.50 |
| Totals | 100.00 | 100.00 | 100.00 | 100.00 | 100.00 |
Taking the years 1916 and 1920 it is now possible to show the increase or decrease per cent. of numbers and areas of holdings according to size-groups.
| Sizes of Holdings, in Acres. | 1916. | 1920. | ||
|---|---|---|---|---|
| Per Cent. of Total. | Per Cent. Increase or Decrease compared with 1916. | |||
| Number. | Area. | Number. | Area. | |
| (Inclusive) | ||||
| 1 to 10 | 20.01 | 0.17 | -0.95 | |
| 11 to 50 | 16.51 | 0.87 | -0.13 | |
| 51 to 100 | 11.81 | 1.72 | +0.50 | +0.08 |
| 101 to 200 | 15.75 | 4.39 | +0.28 | +0.08 |
| 201 to 320 | 10.32 | 4.98 | +0.10 | +0.05 |
| 321 to 640 | 12.39 | 10.56 | +0.07 | +0.12 |
| 641 to 1,000 | 5.04 | 7.63 | -0.04 | -0.04 |
| 1,001 to 5,000 | 6.84 | 25.12 | +0.17 | +0.88 |
| 5,001 to 10,000 | 0.67 | 8.71 | +0.09 | |
| 10,001 to 20,000 | 0.36 | 9.41 | +0.01 | +0.33 |
| 20,001 to 50,000 | 0.21 | 12.42 | -0.07 | |
| Over 50,000 acres | 0.09 | 14.02 | -0.01 | –1.52 |
The following table gives the numbers and average areas of holdings for each land district in the Dominion as ascertained at the 1920 collection of agricultural and pastoral statistics.
As regards counties, Eden County is the most closely settled, the average area of holdings being 15.39 acres, while Fiord County shows the largest average—viz., 9,009 acres. There are no counties in the North Island having an average in excess of 2,500 acres, but in the South Island there are no fewer than seven—viz., Awatere, Amuri, Tawera, Mackenzie, Vincent, Lake, and Fiord.
The average area for the Dominion is 532.81 acres, and twenty-two counties out of seventy-seven in the North Island exceed this, and twenty-seven out of fifty-two in the South Island. The average area for the North Island is 386.83 acres, and for the South 739.63 acres.
| Land District. | Number of Holdings. | Total Area occupied. | Average Area of Holdings. |
|---|---|---|---|
| Acres. | Acres. | ||
| North Auckland | 13,009 | 2,998,755 | 230.51 |
| Auckland | 11,261 | 4,308,673 | 382.62 |
| Hawke's Bay | 6,345 | 4,666,294 | 735.43 |
| Taranaki | 6,288 | 1,705,180 | 271.18 |
| Wellington | 10,928 | 4,823,492 | 441.39 |
| Nelson | 3,914 | 1,329,369 | 339.64 |
| Marlborough | 1,970 | 2,532,798 | 1,285.68 |
| Westland | 1,471 | 1,732,949 | l,178.08 |
| Canterbury | 12,887 | 8,276,908 | 642.27 |
| Otago | 7,786 | 7,918,028 | 1,016.96 |
| Southland | 5,733 | 3,180,633 | 554.79 |
| Totals, Dominion | 81,592 | 43,473,079 | 532.81 |
Land in occupation in each land district tabulated according to tenure is given below. The acreage in the fifth column does not agree exactly with the figures published in the report of the Lands and Survey Department, for the reason that, although these figures include Crown reserves leased, they do not include Crown lands alienated but not in occupation at the time of collecting the agricultural and pastoral statistics; also, the figures given in the fifth column are as at the 31st January, whilst the figures published by the Lands and Survey Department are as at the 31st March.
| Land District. | Total of Holdings. | Freehold (occupied by Owner). | Leased from Private Individuals or Public Bodies. | Leased from Natives. | Held from Crown under Different Tenures. | Tenure not specified. |
|---|---|---|---|---|---|---|
| Acres. | Acres. | Acres. | Acres. | Acres. | Acres. | |
| North Auckland | 2,998,755 | 2,303,504 | 166,782 | 82,674 | 445,795 | |
| Auckland | 4,308,673 | 2,525,969 | 201,754 | 455,865 | 1,125,085 | |
| Hawke's Bay | 4,666,294 | 2,760,223 | 346,279 | 706,376 | 853,416 | |
| Taranaki | 1,705,180 | 862,125 | 220,917 | 119,318 | 502,820 | |
| Wellington | 4,823,492 | 3,175,471 | 473,102 | 409,632 | 765,287 | |
| Nelson | 1,329,369 | 626,017 | 65,596 | 14,978 | 622,774 | 4 |
| Marlborough | 2,532,798 | 835,441 | 53,284 | 27,287 | 1,616,786 | |
| Westland | 1,732,949 | 150,990 | 23,935 | 5,129 | 1,552,895 | |
| Canterbury | 8,276,908 | 3,152,933 | 673,658 | 11,555 | 4,438,762 | |
| Otago | 7,918,028 | 1,601,085 | 281,543 | 7,258 | 6,028,142 | |
| Southland | 3,180,633 | 1,489,340 | 280,178 | 6,116 | 1,404,999 | |
| Totals | 43,473,079 | 19,483,098 | 2,787,028 | 1,846,188 | 19,356,761 | 4 |
In point of area the most important Crown-lands tenure is “pastoral run,” the area for 1920 being 10,174,236 acres. Considerable areas are also held under the following tenures: Small grazing-runs, 2,740,032 acres; lease in perpetuity, 1,752,876 acres; occupation with right of purchase, 1,507,814 acres; renewable lease, 1,744,903 acres.
Further details of tenure, &., of Crown lands will be found in Subsection A of this section.
Lands in occupation are, however, not strictly comparable with Crown lands alienated or in process of alienation, for certain lands have passed into the hands of Europeans which were never made waste lands of the Crown. It must also be remembered that of the freehold land in the Dominion a considerable area is unoccupied and unused.
Table of Contents
DURING the past five years complete collections of agricultural and pastoral statistics have been made annually by the Census and Statistics Office through the agency of officers of the Police Department. Practically every holding of 1 acre or over (with the exception of those within borough boundaries) is canvassed personally. Interim returns of principal crops and live-stock are published in the New Zealand Gazette, and when the collection is completed the full statistics are gazetted, and are also included in Volume iii of “Statistics of the Dominion of New Zealand.”
In the years previous to and inclusive of 1908–9 complete statistics were collected annually by sub-enumerators appointed by the Department of Agriculture; in 1909–10 full statistics were not collected, but the areas under the principal grain and root crops were ascertained and an estimate made of the yields; for 1910–11 complete information was obtained in connection with the 1911 census. In the four succeeding years returns were collected by post regarding the acreage and yield of the principal crops; but this method of collection was found to be less satisfactory than the personal visit, and the figures for these years are probably not quite accurate.
In addition to the main collection of agricultural and pastoral statistics the following supplementary inquiries are undertaken: Areas sown or intended to be sown in wheat and oats (taken at the end of September); stocks of flour, wheat, and oats in the hands of millers, merchants, storekeepers, and farmers (at the end of November); estimated yields of wheat and oats (early in February); and returns of wheat and oats threshed (throughout the threshing season). The results of these first three inquiries are gazetted, and they are also, together with the threshing, published from time to time in the Monthly Abstract of Statistics.
Of the total area in occupation in 1919–20 (43,473,079 acres) 18,004,776 acres were in cultivation. Land in cultivation expressed as a percentage of land in occupation for the past five years, together with the area in cultivation per inhabitant (inclusive of Maoris) is given below:—
| Year. | Total Area in Occupation. | Total Area in Cultivation. | Cultivated Land per Cent. of Occupied Land. | Cultivated Land per Inhabitant. |
|---|---|---|---|---|
| Acres. | Acres. | Acres. | ||
| 1915–16 | 41,262,193 | 16,895,590 | 40.95 | 14.69 |
| 1916–17 | 42,744,719 | 17,061,675 | 39.92 | 14.85 |
| 1917–18 | 43,212,079 | 17,386,160 | 40.23 | 15.15 |
| 1918–19 | 43,342,706 | 17,613,337 | 40.64 | 15.21 |
| 1919-20 | 43,473,079 | 18,004,776 | 41.42 | 14.83 |
The following table gives details of cultivation and total area occupied for each land district in the Dominion for the season, 1919–20.
| Land District. | In Grain and Pulse Crops. | In Grasses and Clovers (for Hay or Seed), and Green and Root Crops. | In Fallow. | In Grasses and Clovers not cut for Hay or Seed. | In Vineyards and Orchards. | In Market Gardens, Nurseries, and Seed-gardens. | In Private Gardens and Pleasure-grounds. | In Plantations (not Native Bush). | Total Area in Cultivation. | Unimproved Land. | Total Area in Occupation. |
|---|---|---|---|---|---|---|---|---|---|---|---|
| Acres. | Acres. | Acres. | Acres. | Acres. | Acres. | Acres. | Acres. | Acres. | Acres. | Acres. | |
| North Auckland | 9,572 | 30,994 | 8,549 | 1,440,076 | 7,083 | 1,105 | 5,504 | 3,331 | 1,506,214 | 1,492,541 | 2,998,755 |
| Auckland | 20,874 | 106,020 | 17,851 | 2,023,057 | 2,048 | 207 | 5,116 | 7,534 | 2,182,707 | 2,125,966 | 4,308,673 |
| Hawke's Bay | 21,630 | 45,505 | 960 | 3,077,783 | 2,790 | 280 | 4,988 | 5,865 | 3,159,801 | 1,506,493 | 4,666,294 |
| Taranaki | 8,892 | 66,552 | 319 | 1,241,167 | 242 | 55 | 2,606 | 619 | 1,320,452 | 384,728 | 1,705,180 |
| Wellington | 29,043 | 83,817 | 447 | 3,359,233 | 1,129 | 862 | 7,982 | 5,515 | 3,488,028 | 1,335,464 | 4,823,492 |
| Nelson | 13.812 | 11,016 | 585 | 320,952 | 10,914 | 289 | 1,280 | 1,349 | 360,197 | 969,172 | 1,329,369 |
| Marlborough | 30,923 | 14,300 | 859 | 360,935 | 1,041 | 36 | 1,787 | 1,782 | 411,663 | 2,121,135 | 2,532.798 |
| Westland | 899 | 2,303 | 16 | 133,928 | 67 | 12 | 451 | 787 | 138,463 | 1,594,486 | 1,732,949 |
| Canterbury | 369,088 | 290,666 | 31,096 | 2,034,391 | 2,892 | 901 | 14,809 | 21,021 | 2,764,864 | 5,512,044 | 8,276,908 |
| Otago | 125,265 | 136,252 | 18,813 | 1,074,964 | 4,908 | 186 | 6,996 | 5,494 | 1,372,878 | 6,545,150 | 7,918,028 |
| Southland | 83,448 | 148,120 | 2,265 | 1,058,779 | 250 | 63 | 5,318 | 1,266 | 1,299,509 | 1,881,124 | 3,180,633 |
| Totals | 713,446 | 935,545 | 81,760 | 16,125,265 | 33,364 | 3,996 | 56,837 | 54,563 | 18,004,776 | 25,468,303 | 43,473,079 |
Further details of the various crops are given under their respective headings on the following pages, but as unimproved lands are not again referred to, a table is appended showing condition by land districts:—
| Land District. | Phormium Tenax. | Tussock and other Native Grasses. | Fern, Scrub, and Second Growth. | Standing Virgin Bush. | Barren and Unproductive Land. | Total Unimproved Occupied Land. |
|---|---|---|---|---|---|---|
| Acres. | Acres. | Acres. | Acres. | Acres. | Acres. | |
| North Auckland | 4,796 | 218,098 | 778,577 | 384,795 | 106,275 | 1,492,541 |
| Auckland | 8,417 | 284,054 | 1,009,790 | 755,880 | 67,825 | 2,125,966 |
| Hawke's Bay | 433 | 657,503 | 450,807 | 323,155 | 74,595 | 1,506,493 |
| Taranaki | 54 | 7,020 | 63,804 | 306,679 | 7,171 | 384,728 |
| Wellington | 19,357 | 496,141 | 292,392 | 435,780 | 91,794 | 1,335,464 |
| Nelson | 1,785 | 299,933 | 152,980 | 468,857 | 45,617 | 969,172 |
| Marlborough | 913 | 1,284,457 | 248,191 | 198,702 | 388,872 | 2,121,135 |
| Westland | 6,478 | 198,018 | 75,977 | 952,301 | 361,712 | 1,594,486 |
| Canterbury | 1,468 | 4,466,004 | 114,722 | 230,187 | 699,663 | 5,512,044 |
| Otago | 1,582 | 5,628,060 | 370,119 | 267,061 | 278,328 | 6,545,150 |
| Southland | 4,584 | 1,352,825 | 165,008 | 235,546 | 123,161 | 1,881,124 |
| Totals | 49,867 | 14,892,113 | 3,722,367 | 4,558,943 | 2,245,013 | 25,468,303 |
The areas, yields, and average yields per acre of the principal crops during the past ten seasons are shown in the following tables:—
| Season. | Wheat. | Oats. | Barley. | Maize. | Peas and Beans. |
|---|---|---|---|---|---|
| Acres. | Acres. | Acres. | Acres. | Acres. | |
| 1910–11 | 322,167 | 302,827 | 33,491 | 13,057 | 16,627 |
| 1911–12 | 215,528 | 403,668 | 31,644 | 6,094 | |
| 1912–13 | 189,869 | 386,786 | 37,486 | 4,683 | |
| 1913–14 | 166,774 | 361,741 | 32,022 | 5,942 | |
| 1914–15 | 229,600 | 287,561 | 18,347 | 5,477 | |
| 1915–16 | 329,207 | 212,688 | 30,204 | 8,086 | 9,209 |
| 1916–17 | 218,942 | 177,332 | 29,648 | 6,359 | 11,905 |
| 1917–18 | 280,978 | 156,202 | 18,860 | 8,151 | 11,685 |
| 1918–19 | 208,030 | 172,686 | 18,753 | 9,792 | 17,929 |
| 1919–20 | 139,611 | 179,800 | 22,907 | 9,064 | 14,416 |
| Yields. | ||||||||||
|---|---|---|---|---|---|---|---|---|---|---|
| Season. | Wheat. | Oats. | Barley. | Maize. | Peas and Beans. | |||||
| Total. | Average per Acre. | Total. | Average per Acre. | Total. | Average per Acre. | Total. | Average per Acre. | Total. | Average per Acre. | |
*The figures for 1911–12 to 1914–15 (inclusive) do not represent actual results, but were obtained by applying to ascertained average yields per acre the areas stated by growers to be intended for threshing. It would appear, however, that in many cases farmers included under the heading “Oats for Threshing” areas which were intended or used for chaffing or other purposes. The yields given are therefore probably overstated. | ||||||||||
| Bushels. | Bushels. | Bushels. | Bushels. | Bushels. | Bushels. | Bushels. | Bushels. | Bushels. | Bushels. | |
| 1910–11 | 8,290,221 | 25.73 | 10,118,917 | 33.41 | 927,112 | 27.68 | 569,807 | 43.64 | 583,750 | 35.11 |
| 1911–12 | 7,261,138 | 33.69 | 19,662,668* | 48.71 | 1,254,648 | 39.65 | 278,252 | 45.66 | ||
| 1912–13 | 5,179,626 | 27.28 | 13,583,924* | 35.12 | 1,377,610 | 36.75 | 222,115 | 47.43 | ||
| 1913–14 | 5,231,700 | 31.37 | 14,740,946* | 40.75 | 1,205,628 | 37.65 | 307,736 | 51.79 | ||
| 1914–15 | 6,644,336 | 28.94 | 11,436,301* | 39.77 | 596,828 | 32.53 | 275,274 | 50.26 | ||
| 1915–16 | 7,108,360 | 21.59 | 7,653,208 | 35.98 | 820,174 | 27.15 | 340,372 | 42.09 | 163,273 | 17.73 |
| 1916–17 | 5,083,277 | 23.22 | 5,371,249 | 30.29 | 758,935 | 25.60 | 274,332 | 43.14 | 243,297 | 20.43 |
| 1917–18 | 6,807,536 | 24.23 | 4,942,759 | 31.64 | 568,702 | 30.15 | 367,761 | 45.09 | 312,582 | 26.73 |
| 1918–19 | 6,567,629 | 31.57 | 6,884,609 | 39.88 | 710,932 | 37.91 | 413,595 | 42.17 | 505,950 | 28.16 |
| 1919–20 | 4,559,934 | 32.66 | 6,967,862 | 38.75 | 815,807 | 35.61 | 405,775 | 44.76 | 369,306 | 25.62 |
Areas.
| — | Wheat for Chaff, &. | Oats for Chaff, &. | Barley for Chaff, &. | Maize for Ensilage, &. | Grasses and Clovers for Hay. | Green Fodder. |
|---|---|---|---|---|---|---|
* Including green fodder. | ||||||
| Acres. | Acres. | Acres. | Acres. | Acres. | Acres. | |
| 1910–11 | 14,222* | 290,569* | 4,640* | 5,800* | 62,600 | |
| 1911–12 | ||||||
| 1912–13 | ||||||
| 1913–14 | ||||||
| 1914–15 | ||||||
| 1915–16 | 6,215 | 429,437 | 2,040 | 624 | 94,330 | 229,496 |
| 1916–17 | 3,738 | 354,550 | 1,240 | 711 | 106,723 | 218,452 |
| 1917–18 | 2,258 | 311,316 | 634 | 613 | 111,181 | 180,867 |
| 1918–19 | 1,646 | 301,724 | 530 | 272 | 131,557 | 149,622 |
| 1919–20 | 2,125 | 322,174 | 711 | 589 | 117,110 | 166,758 |
| Yields. | |||||
|---|---|---|---|---|---|
| — | Wheat. | Oats. | Barley. | Maize. | Hay. |
| Tons. | Tons. | Tons. | Tons. | Tons. | |
| 1910–11 | |||||
| 1911–12 | |||||
| 1912–13 | |||||
| 1913–14 | |||||
| 1914–15 | |||||
| 1915–16 | 7,440 | 572,435 | 3,387 | 3,493 | 177,165 |
| 1916–17 | 5,186 | 432,878 | 2,151 | 5,107 | 179,505 |
| 1917–18 | 3,549 | 419,434 | 1,240 | 3,335 | 180,436 |
| 1918–19 | 2,554 | 461,739 | 938 | 1,378 | 225,549 |
| 1919–20 | 3,172 | 467,640 | 1,182 | 2,909 | 184,115 |
| Areas. | ||||||||
|---|---|---|---|---|---|---|---|---|
| — | Rye-grass. | Cocksfoot. | Chewings Fescue. | Red Clover and Cow-grass. | White Clover. | Potatoes. | Turnips. | Mangolds. |
| Acres. | Acres. | Acres. | Acres. | Acres. | Acres. | Acres. | Acres. | |
| 1910–11 | 46,706 | 41,918 | 29,023 | 450,959 | 14,082 | |||
| 1911–12 | 77,535 | 38,297 | 28,248 | |||||
| 1912–13 | 63,031 | 34,007 | 23,480 | |||||
| 1913–14 | 55,936 | 25,935 | 29,164 | |||||
| 1914–15 | ||||||||
| 1915–16 | 43,095 | 13,293 | 5,787 | 1,643 | 888 | 29,809 | 572,137 | 13,046 |
| 1916–17 | 79,135 | 16,134 | 5,514 | 2,978 | 1,330 | 26,156 | 526,283 | 9,073 |
| 1917–18 | 70,220 | 16,595 | 4,372 | 6,907 | 3,722 | 22,854 | 450,819 | 8,712 |
| 1918–19 | 31,250 | 19,318 | 2,329 | 6,682 | 6,798 | 19,169 | 438,045 | 8,233 |
| 1919–20 | 39,580 | 16,789 | 3,425 | 6,181 | 2,284 | 24,933 | 542,310 | 9,546 |
| Yields. | ||||||
|---|---|---|---|---|---|---|
| — | Rye-grass. | Cocksfoot. | Chewings Fescue. | Red Clover and Cow-grass. | White Clover. | Potatoes. |
* Of 20 lb. | ||||||
| Bushels.* | lb. | lb. | lb. | lb. | Tons. | |
| 1910–11 | 1,167,650 | 5,868,520 | 141,510 | |||
| 1911–12 | 2,198,893 | 6,974,650 | 144,912 | |||
| 1912–13 | 1,458,947 | 5,285,708 | 147,689 | |||
| 1913–14 | 1,098,835 | 4,956,438 | 157,194 | |||
| 1914–15 | ||||||
| 1915–16 | 795,416 | 1,577,285 | 1,230,219 | 385,638 | 141,469 | 128,807 |
| 1916–17 | 1,152,487 | 1,907,043 | 1,247,545 | 443,861 | 143,465 | 133,642 |
| 1917–18 | 1,355,612 | 2,410,557 | 1,013,042 | 1,076,360 | 461,853 | 100,596 |
| 1918–19 | 646,194 | 3,761,814 | 551,588 | 1,255,478 | 958,360 | 105,483 |
| 1919–20 | 652,672 | 2,201,729 | 827,769 | 1,146,882 | 335,203 | 144,705 |
Wheat is principally grown in the central and southern portions of the South Island. Eighty-two per cent. of the grain produced now comes from Canterbury; Otago and Southland together produce 15 per cent., while the remainder of the South Island and the whole of the North Island contribute the remaining 3 per cent. The area under wheat for threshing in each season since 1874–75 is given below:—
| Year. | Area. | Year. | Area. | Year. | Area. | Year. | Area. |
|---|---|---|---|---|---|---|---|
| Acres. | Acres. | Acres. | Acres. | ||||
| 1874–75 | 105,673 | 1886–87 | 253,025 | 1898–99 | 399,034 | 1909–10 | 311,000 |
| 1875–76 | 90,804 | 1887–88 | 357,359 | 1899–1900 | 269,749 | 1910–11 | 322,167 |
| 1876–77 | 141,614 | 1888–89 | 362,153 | 1900–1 | 208,084 | 1911–12 | 215,528 |
| 1877–78 | 243,406 | 1889–90 | 335,861 | 1901–2 | 167,474 | 1912–13 | 189,869 |
| 1878–79 | 264,861 | 1890–91 | 301,460 | 1902–3 | 195,255 | 1913–14 | 166,774 |
| 1879–80 | 270,198 | 1891–92 | 402,273 | 1903–4 | 230,959 | 1914–15 | 229,600 |
| 1880–81 | 324,949 | 1892–93 | 381,245 | 1904–5 | 258,896 | 1915–16 | 329,207 |
| 1881–82 | 365,715 | 1893–94 | 242,737 | 1905–6 | 222,183 | 1916–17 | 218,942 |
| 1882–83 | 390,818 | 1894–95 | 148,575 | 1906–7 | 206,185 | 1917–18 | 280,978 |
| 1883–84 | 377,706 | 1895–96 | 245,441 | 1907–8 | 193,031 | 1918–19 | 208,030 |
| 1884–85 | 270,043 | 1896–97 | 258,608 | 1908-9 | 252,391 | 1919–20 | 142,473 |
| 1885–86 | 173,891 | 1897–98 | 315,801 |
The area (for threshing) and the production of wheat par head of population for the last ten years are now given:—
| Year. | Per Head of Population. | |
|---|---|---|
| Area. | Production. | |
| Acres. | Bushels. | |
| 1910–11 | 0.32 | 8.35 |
| 1911–12 | 0.21 | 7.15 |
| 1912–13 | 0.18 | 4.98 |
| 1913–14 | 0.16 | 4.90 |
| 1914–15 | 0.21 | 6.09 |
| 1915–16 | 0.30 | 6.47 |
| 1916–17 | 0.19 | 4.62 |
| 1917–18 | 0.26 | 6.19 |
| 1918–19 | 0.18 | 5.67 |
| 1919–20 | 0.12 | 3.76 |
Unless there is a considerable carry-over from the previous season, importation of wheat requires to be made when the production nears or falls below 6 bushels per head of population. The carry-over from 1911–12 made up the deficiency of the 1913 harvest; but in 1914, 121,737 bushels were imported; in 1915, 522,617 bushels; in 1916, 51,512 bushels; in 1917, 719,977 bushels; in 1918, 1,370,542 bushels; and in 1919, 1,336,222 bushels.
Wheat grown for purposes other than threshing is insignificant.
The area and yield of wheat in 1918–19 for each State in the Common wealth of Australia and in New Zealand were as follows:—
| State. | Wheat Crop. | ||
|---|---|---|---|
| Area. | Total Yield. | Average Yield per Acre. | |
| Acres. | Bushels. | Bushels. | |
| Queensland | 21,637 | 104,509 | 4.83 |
| New South Wales (including Federal Territory) | 2,409,669 | 18,325,000 | 7.60 |
| Victoria | 2,214,490 | 25,239,871 | 11.40 |
| South Australia | 2,186,349 | 22,936,925 | 10.49 |
| Western Australia | 1,146,103 | 8,845,387 | 7.72 |
| Tasmania | 11,917 | 186,570 | 15.66 |
| Totals for Commonwealth | 7,990,165 | 75,638,262 | 9.47 |
| New Zealand | 208,030 | 6,567,629 | 31.57 |
| Grand totals | 8,198,195 | 82,205,891 | 10.03 |
The average production per acre for the last ten seasons is—for New Zealand, 28.02 bushels per acre; and for Australia, 10.47 bushels per acre.
It may be said that although from twenty to thirty countries in the world generally produce more wheat than does New Zealand, only three or four European countries have a better record of production per acre. This says much for the fertility of the soil of the Dominion, for cultivation here is naturally less intensive than it is in the closely settled continental countries.
In point of area oats is the most important grain crop of the Dominion. Canterbury, Otago, and Southland produce about 80 per cent. of the total, the remainder of the South Island 5 per cent., and the North Island 15 per cent. The greater portion of the oat crop is usually converted into chaff without threshing, but the proportion so dealt with depends on market conditions. In 1915–16, 33.12 per cent. of the crop harvested was threshed; in 1916–17, 33.36 per cent.; in 1917–18, 33.41 per cent.; in 1918–19, 36.40 per cent.; and in 1919–20, 35.82 per cent.
The total and average yields per acre of grain and of chaff, hay, or ensilage for the past five seasons were as follows:—
| Season. | Grain. | Chaff, Hay, or Ensilage. | ||
|---|---|---|---|---|
| Total Yield. | Average per Acre. | Total Yield. | Average per Acre. | |
| Bushels. | Bushels. | Tons. | Tons. | |
| 1915–16 | 7,653,208 | 35.98 | 572,435 | 1.33 |
| 1916–17 | 5,371,436 | 30.26 | 432,878 | 1.22 |
| 1917–18 | 4,942,759 | 31.64 | 419,434 | 1.35 |
| 1918–19 | 6,884,609 | 39.87 | 461,739 | 1.53 |
| 1919–20 | 6,967,862 | 38.75 | 467,640 | 1.45 |
New Zealand has no regular export of oats, and in some years has practically no surplus available for export. The quantity exported in 1891 and succeeding years was as follows:—
| Year. | Export of Oats. Bushels. |
|---|---|
| 1891 | 4,052,414 |
| 1892 | 3,830,444 |
| 1894 | 1,963,288 |
| 1896 | 2,247,053 |
| 1898 | 816,210 |
| 1900 | 5,818,648 |
| 1901 | 10,514,924 |
| 1903 | 4,956,330 |
| 1904 | 2,693,417 |
| 1905 | 1,076,916 |
| 1906 | 734,997 |
| 1907 | 36,693 |
| 1908 | 972,896 |
| 1909 | 5,133,473 |
| 1910 | 444,586 |
| 1911 | 72,826 |
| 1912 | 4,123,920 |
| 1913 | 239,268 |
| 1914 | 1,323,362 |
| 1915 | 682,652 |
| 1916 | 220,265 |
| 1917 | 5,767 |
| 1918 | 3,250 |
| 1919 | 144,827 |
The oat crop for 1917–18 in the States of the Commonwealth of Australia was as follows:—
| Acres. | Bushels. | Average per Acre. | |
|---|---|---|---|
| Bushels. | |||
| Queensland | 3,002 | 44,688 | 14.89 |
| New South Wales | 82,512 | 1,452,144 | 17.60 |
| Federal Capital Territory | 79 | 2,967 | 37.56 |
| Victoria | 293,214 | 6,141,287 | 20.94 |
| South Australia | 106,556 | 1,248,529 | 11.72 |
| Western Australia | 95,666 | 908,592 | 9.50 |
| Tasmania | 34,771 | 589,224 | 16.95 |
| Totals for Commonwealth | 615,800 | 10,387,431 | 16.87 |
The area under barley for threshing for the season 1919–20 was 22,907 acres, the crop amounting to 815,807 bushels, an average of 35.61 bushels per acre. In 1918–19 the area under barley was 18,753 acres, and the yield 710,932 bushels, or 37.91 bushels per acre.
The returns for 1919–20 show that there were 9,064 acres sown for grain, being a decrease of 728 acres from the area for the previous season (9,792 acres). The yield in 1920 was 405,775 bushels of corn, an average of 44.76 bushels per acre, and in 1919 413,595 bushels, an average of 42.17 bushels per acre. With the exception of a few acres in the South, maize is grown only in the North Island. In 1919–20 the Land District of North Auckland had 342 acres; Auckland, 5,632 acres; Hawke's Bay, 3,060 acres; Taranaki, 5 acres; Wellington, 22 acres; and Nelson, Canterbury and Otago, 1 acre each.
The area under peas and beans for threshing in the season 1919–20 was 14,416 acres, yielding 369,306 bushels. The area under these crops in 1918–19 was 17,969 acres.
New Zealand has a considerable export of peas and beans, the figures for the past ten years being,—
| Year. | Bushels. |
|---|---|
| 1910 | 198,527 |
| 1911 | 332,227 |
| 1912 | 464,609 |
| 1913 | 339,998 |
| 1914 | 305,053 |
| 1915 | 201,942 |
| 1916 | 84,168 |
| 1917 | 111,175 |
| 1918 | 90,495 |
| 1919 | 451,595 |
The area under potatoes in 1919–20 was 24,933 acres, yielding a return of 144,705 tons, or at a rate of 5.79 tons per acre, against 19,116 acres in 1918–19 and 105,483 tons (or 5.50 tons per acre).
These figures do not include areas of less than a quarter of an acre, so that a considerable quantity of potatoes grown for private use has not been taken into account.
The following table shows the average yield per acre of potatoes in each of the Australian States and in New Zealand from 1913–14 to 1917–18. Later figures for Australia are not available.
| AVERAGE YIELD PER ACRE OF POTATOES, 1913–14 TO 1917–18. | |||||
|---|---|---|---|---|---|
| State. | 1913–14. | 1914–15. | 1915–16. | 1916–17. | 1917–18. |
| Tons. | Tons. | Tons. | Tons. | Tons. | |
| Queensland | 1.64 | 1.91 | 1.28 | 2.1 | 2.06 |
| New South Wales | 2.76 | 1.34 | 2.27 | 2.02 | 2.21 |
| Victoria | 2.37 | 2.89 | 3.05 | 2.55 | 2.72 |
| South Australia | 3.05 | 2.36 | 2.99 | 4.29 | 2.72 |
| Western Australia | 3.40 | 3.08 | 2.90 | 2.88 | 2.52 |
| Tasmania | 2.61 | 2.50 | 2.71 | 1.95 | 2.58 |
| Federal Territory | 1.47 | 1.88 | 3.57 | 2.92 | 2.27 |
| Commonwealth | 2.53 | 2.41 | 2.75 | 2.38 | 2.55 |
| New Zealand | 5.39 | 6.06 | 4.33 | 5.11 | 4.38 |
Turnips form a most important crop in a sheep-breeding country such as New Zealand, and in 1919–20 the area under this crop was 542,310 acres, while there were 9,546 acres of mangolds.
The figures for these crops for 1918–19 were 438,045 acres and 8,233 acres respectively.
There were 440 acres under hops in 1919–20, 435 acres of this area being in the Nelson Land District. The total produce amounted to 700,876 lb.
Previous to 1916 official statistics of the growing of tobacco were not collected since 1895. In 1889, 34 acres were being cultivated; in 1890, 25 acres; in 1891, 16 acres; in 1892, 6 acres; in 1893, 4 acres; in 1894, 4 acres; in 1895, 5 acres. In 1916, and again in 1917, the New Zealand Tobacco Company (Limited), Napier, returned 100 acres as under this crop. No tobacco was grown by this company in 1918, as the abundant crops obtained during the previous seasons were sufficient to fill manufacturing requirements up to 1919; again in 1919 no area was returned.
Certain localities which are free from frosts are eminently suited for this crop, which can be grown to advantage in young orchards, between the rows of fruit-trees.
Large areas (49,867 acres in 1919–20) in various parts of New Zealand are covered with Phormium tenax, the fibre of which is largely used for rope-making, &. At the census of 1919 there were seventy-six mills in operation, employing 1,430 hands, the total value of output being £681,369. The export of fibre and tow during each of the past ten years was as follows:—
| Year. | Fibre. | Tow. |
|---|---|---|
| Tons. | Tons. | |
| 1910 | 20,645 | 4,501 |
| 1911 | 17,366 | 3,283 |
| 1912 | 18,641 | 3,388 |
| 1913 | 28,092 | 6,299 |
| 1914 | 19,702 | 4,226 |
| 1915 | 23,220 | 3,465 |
| 1916 | 27,674 | 4,578 |
| 1917 | 23,516 | 2,500 |
| 1918 | 25,167 | 1,815 |
| 1919 | 22,347 | 3,262 |
In 1919–20 there were 3,540 acres in market gardens, 456 acres in nurseries and seed-gardens, and 56,837 acres in private gardens and pleasure-grounds. The area in plantations (not virgin bush) was 54,563 acres.
The area in orchard in 1919–20 (exclusive of that within borough boundaries) was 33,179 acres; in 1918–19 there were 34,722 acres exclusive of boroughs. Orchards within boroughs aggregated 2,443 acres in 1916, these being the latest figures available at present, but the information will again be obtained in connection with the 1921 census.
The following table gives particulars, by land districts, of areas for private use and for commercial purposes:—
| Land District. | For Private Use only. | For Commercial Purposes. | Total Area in Orchard. | |
|---|---|---|---|---|
| Not bearing. | Bearing. | |||
| Acres. | Acres. | Acres. | Acres. | |
| North Auckland | 1,774 | 2,434 | 2,802 | 7,010 |
| Auckland | 1,044 | 291 | 666 | 2,001 |
| Hawke's Bay | 526 | 725 | 1,493 | 2,744 |
| Taranaki | 190 | 9 | 43 | 242 |
| Wellington | 590 | 75 | 462 | 1,127 |
| Nelson | 374 | 4,903 | 5,624 | 10,901 |
| Marlborough | 301 | 234 | 506 | 1,041 |
| Westland | 44 | 2 | 21 | 67 |
| Canterbury | 992 | 782 | 1,116 | 2,890 |
| Otago | 606 | 1,500 | 2,800 | 4,906 |
| Southland | 234 | 4 | 12 | 250 |
| Dominion | 6,675 | 10,959 | 15,545 | 33,179 |
Commercial orchards are defined as “those producing fruit for sale to the value of £50 and upwards annually, or, if not yet in full bearing, that are calculated to produce fruit for sale to that value when in full bearing.” Private orchards consist chiefly of small areas the produce of which is consumed principally on the holding, or, if sold, does not aggregate an annual value of £50. Larger areas which, through age, disease, or other cause, are incapable of producing a yearly revenue of the stipulated amount are also included in private orchards.
Large areas are continually being planted in fruit-trees, especially in the Nelson Land District, where tracts of land which until recently bore nothing but stunted manuka, and were looked upon as practically useless, have now been proved to be eminently suitable for growing fruit, particularly apples. A good market exists locally for choice clean fruit, but as the large areas recently planted come into bearing, growers will have to look to outside markets to take the surplus, and it is hoped that the export of fruit will become in time one of the largest in the Dominion.
The Department of Agriculture assists orchardists by supplying information on fruitgrowing generally, and as to the most up-to-date methods to adopt for the control of diseases and insect pests, pruning, &. Practical demonstrations of pruning, spraying, and the grading and packing of fruit are given regularly by the Orchard Instructors attached to the Department.
Co-operative fruit-testing plots are established in various parts of the Dominion. These plots are for the purpose of—
Ascertaining which varieties of fruit are best adapted to particular districts:
Demonstrating various methods of pruning:
Conducting modified manurial experiments.
Extensive experiments have been carried out in the growing of tomatoes and the control of diseases affecting them, many thousands of pounds having been lost through failure of the tomato crops grown under glass during the last few years. The results of these experiments have proved of great value, and have enabled growers to adopt successful methods for the production of large and profitable crops.
The total acreage in vineyards outside of borough boundaries is 253 acres. The growing of outdoor grapes is chiefly confined to the districts situated between the North Cape and Hawke's Bay. The greater portion of the crop is used for wine-making, but a considerable quantity of outdoor-grown grapes is sold for table use.
Copies of full plans and specifications of a cool store capable of holding 4,000 cases of fruit have been prepared by the Department of Agriculture, and are supplied free on application.
The canning of fruit is also another important feature of the fruit industry. Plans and specifications for the building and equipment of a factory capable of turning out 4,000 cans per day are also available, free of charge, for those contemplating the erection of a factory.
State aid to the fruit-preserving industry is provided for by the Fruit-preserving Industry Act, 1913, whereby not more than £25,000 may be raised in any year for the purpose of making advances for the establishment of cold stores for fruit and of fruit-canning works, and otherwise for the assistance of the fruitgrowing industry. The advances during the financial year 1914–15 totalled £10,000.
The Orchard-tax Act, 1916, provides for the levying of a tax of 1s. per acre on commercial orchards (with a minimum of 2s. 6d.), the proceeds to be paid over to the New Zealand Fruitgrowers’ Federation (Limited), and to be expended in aid of the fruitgrowing industry. This Act is to remain in force until 1921.
The area under rye-grass for seed in the season 1919–20 was 39,580 acres, yielding 652,672 bushels of 20 lb., or a rate of 16.42 bushels per acre.
In cocksfoot there were 16,789 acres, which yielded 2,201,729 lb., or an average of 131.14 lb. per acre. The area in the previous season was 19,318 acres, and the total yield 3,761,814 lb., the average yield per acre being 194.70 lb. The area returned by farmers as being under cocksfoot is decreasing steadily, having been 41,918 acres in 1910–11. Much of the waste land of the Dominion is laid down in cocksfoot, including a large proportion of the land enclosed with the State railway-lines. Much of this is harvested, but no record of the amount obtained from this source is kept.
New Zealand is essentially suited for grazing purposes. Wherever there is light and moisture English grasses thrive when the natural bush and fern are cleared off—in fact, the white clover gradually overcomes the fern; and, from the mildness of the winter season, there are few places where there is not some growth even in the coldest months of the year. In all parts of the Dominion stock live, although in varying condition, without other food than such as they can pick up. Sown-grass land, as might be expected, heads the list of cultivations.
At the beginning of the year 1920 there were 16,125,265 acres under artificial (pasture) grasses, an increase of 293,661 acres over the area in 1919.
Seeds for sowing pasture lands are used much as in Great Britain, the following being a common mixture: Perennial rye - grass, 25 lb. to 30 lb. per acre; cocksfoot, 2 lb.; alsike, 2 lb.; timothy, 3 lb.; cow-grass, 2 lb.; red clover, 2 lb.; white clover, 2 lb.; rape, 1 lb.: total, 39 lb. to 44 lb. per acre. Pastures are renewed at intervals of from four to eight years, according to the nature of the land.
The following shows the acreage in sown grasses in each State of Australia and in New Zealand for the 1917–18 season:—
| Acres. | |
|---|---|
| Queensland | 406,094 |
| New South Wales | 1,389,640 |
| Victoria | 1,268,310 |
| South Australia | 20,155 |
| Western Australia | 11,769 |
| Tasmania | 679,512 |
| Federal Territory | 83 |
| New Zealand | 15,448,134 |
It will be observed that the acreage of land under sown grasses is far greater in New Zealand than in the whole of Australia and Tasmania. When compared in size with the States of Australia, New Zealand is not large—about one-thirtieth of their total area—but in respect of grazing capabilities the relative importance of this country is much greater. Australia is generally unsuitable, owing to conditions of climate, for the growth of English grasses, and the amount of feed produced by the natural grasses throughout the year is very much less per acre than is obtained from the sown-grass lands in New Zealand; indeed, it may be said that the average productiveness of grass land is about nine times as great here as in Australia, or, in other words, that land in New Zealand covered with English grasses may be considered equal for grazing purposes to an area of Australian land about nine times as great.
In addition to the artificially sown pastures, the returns for 1919–20 show that 14,892,113 acres in tussock or native grass belonged to the occupied holdings, and were available for stock-feeding by the sheep and cattle farmers.
A COMPARATIVE table is presented showing the increase in live-stock since the year 1858. The figures are taken from the census as far as 1891 and for 1911, but for 1895-96 and following years up to 1910 the results of the enumeration made annually by the Department of Agriculture have been made use of. No enumeration was taken from 1911 to 1915, except as regards sheep.
| Year. | Horses. | Asses and Mules. | Cattle. | Sheep. | Goats. | Pigs. | Poultry. |
|---|---|---|---|---|---|---|---|
* Not enumerated. | |||||||
| 1858 | 14,912 | 122 | 137,204 | 1,523,324 | 11,797 | 40,734 | * |
| 1861 | 28,275 | 153 | 193,285 | 2,761,383 | 12,191 | 43,270 | 236,098 |
| 1864 | 49,409 | 339 | 249,760 | 4,937,273 | 12,005 | 61,276 | 378,414 |
| 1867 | 65,715 | 323 | 312,835 | 8,418,579 | 11,964 | 115,104 | 676,065 |
| 1871 | 81,028 | 397 | 436,592 | 9,700,629 | 12,434 | 151,460 | 872,174 |
| 1874 | 99,859 | 267 | 494,917 | 11,704,853 | 14,276 | 123,921 | 1,058,198 |
| 1878 | 137,768 | 241 | 578,430 | 13,069,338 | 14,243 | 207,337 | 1,323,542 |
| 1881 | 161,736 | 362 | 698,637 | 12,190,215 | 11,223 | 200,083 | 1,566,114 |
| 1886 | 187,382 | 297 | 853,358 | 15,174,263 | 10,220 | 277,901 | 1,679,021 |
| 1891 | 211,040 | 348 | 831,831 | 16,753,752 | 9,055 | 308,812 | 1,790,070 |
| 1895-96 | 237,418 | 426 | 1,047,901 | 19,826,604 | * | 239,778 | * |
| 1896-97 | 249,813 | 434 | 1,138,067 | 19,138,493 | * | 209,834 | * |
| 1897-98 | 252,834 | 393 | 1,209,165 | 19,687,954 | * | 186,027 | * |
| 1898-99 | 258,115 | 534 | 1,203,024 | 19,673,725 | * | 193,512 | * |
| 1899-00* | 261,931 | 459 | 1,222,139 | 19,348,506 | * | 249,751* | |
| 1900–1 | 266,245 | 480 | 1,256,680 | 19,355,195 | * | 250,975 | * |
| 1901-2 | 279,672 | 406 | 1,361,784 | 20,233,099 | * | 224,024 | * |
| 1902-3 | 286,955 | 464 | 1,460,663 | 20,342,727 | * | 193,740 | * |
| 1903-4 | 298,714 | 468 | 1,593,547 | 18,954,553 | * | 226,591 | * |
| 1904-5 | 314,322 | 448 | 1,736,850 | 18,280,806 | * | 255,320 | * |
| 1905-6 | 326,537 | 429 | 1,810,936 | 19,130,875 | * | 249,727 | * |
| 1906-7 | 342,608 | 451 | 1,851,750 | 20,108,471 | * | 242,273 | 3,191,604 |
| 1907-8 | 352,832 | 425 | 1,816,299 | 20,983,772 | * | 241,128 | * |
| 1908-9 | 363,259 | 519 | 1,773,326 | 22,449,053 | * | 245,092 | * |
| 1909 | * | * | * | 23,480,707 | * | * | * |
| 1910 | * | * | * | 24,269,620 | * | * | * |
| 1911 | 404,284 | 404 | 2,020,171 | 23,996,126 | * | 348,754 | 3,693,137 |
| 1912 | * | * | * | 23,750,153 | * | * | * |
| 1913 | * | * | * | 24,191,810 | * | * | * |
| 1914 | * | * | * | 24,798,763 | * | * | * |
| 1915 | * | * | * | 24,901,421 | * | * | * |
| 1916 | 371,331 | 246 | 2,417,491 | 24,788,150 | 17,601 | 297,501 | 3,465,638 |
| 1917 | 373,600 | 320 | 2,575,230 | 25,270,386 | 18,235 | 283,770 | * |
| 1918 | 378,050 | 253 | 2,869,465 | 26,538,302 | 17,730 | 258,694 | * |
| 1919 | 363,188 | 296 | 3,035,478 | 25,828,554 | 16,924 | 235,347 | * |
| 1920 | 346,407 | 262 | 3,101,945 | 23,914,506 | 14,564 | 266,829 | * |
The following diagram will give an idea of the large increase in the number of horses, cattle, sheep, and pigs since 1858:—
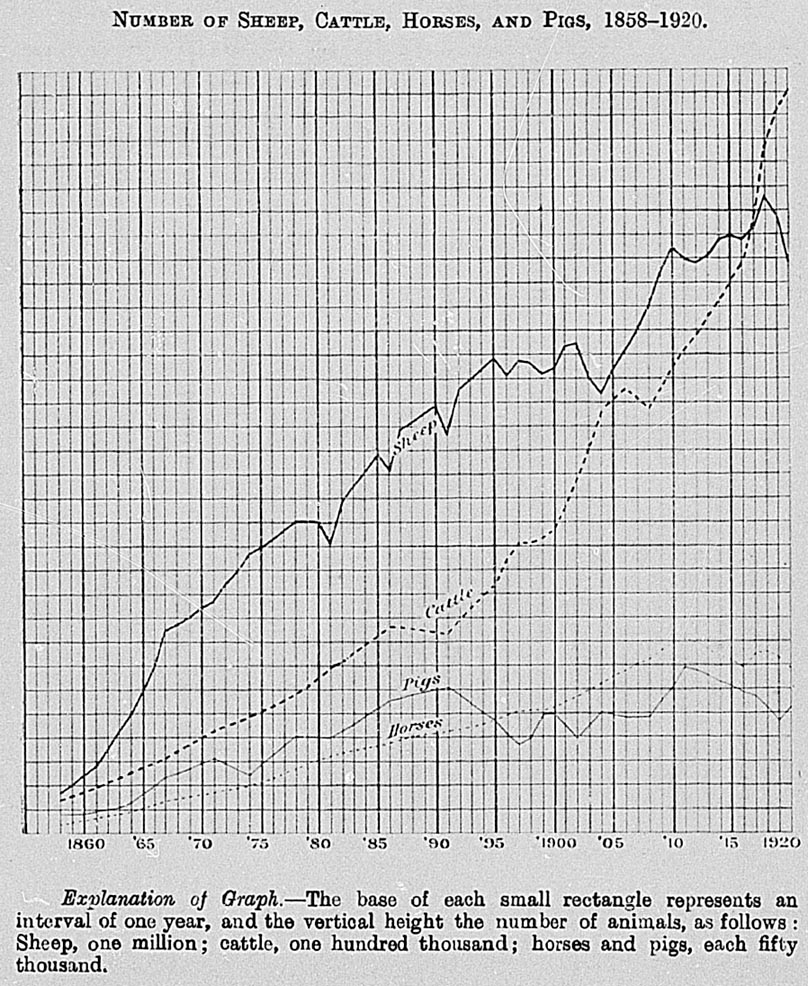
The table on the following pages gives for each county and land district in the Dominion the totals of the principal varieties of live-stock. Further details as to sex, age, breed, &., will be found under the respective headings later in this volume.
| TABLE SHOWING FOB EACH LAND DISTRICT IN THE DOMINION THE NUMBER OF LIVE-STOCK AS AT 31ST JANUARY, 1920. | ||||||||||
|---|---|---|---|---|---|---|---|---|---|---|
| Land District (including Interior Boroughs). | Horses. | Asses and Mules. | Dairy Cows. | Cattle (including Dairy Cows) | Number of Sheep shorn, 1919-20. | Number of Lambs tailed, 1919-20. | Sheep (including Lambs) as at 30th April, 1920. | Pigs. | Goats | |
| Angora. | Other. | |||||||||
| North Auckland | 39,456 | 58 | 126,724 | 412,248 | 693,265 | 246,708 | 664,455 | 35,905 | 1,198 | 1,741 |
| Auckland | 49,702 | 15 | 206,650 | 617,261 | 982,252 | 391,598 | 911,135 | 52,423 | 570 | 1,249 |
| Hawke's Bay | 36,534 | 83 | 47,321 | 465,514 | 5,531,706 | 2,050,604 | 5,454,427 | 16,058 | 616 | 646 |
| Taranaki | 23,498 | 3 | 157,376 | 357,906 | 957,090 | 336,425 | 860,365 | 42,043 | 204 | 2,469 |
| Wellington | 47,687 | 30 | 141,760 | 615,633 | 5,132,461 | 2,096,032 | 5,358,289 | 39,751 | 924 | 642 |
| Nelson | 8,348 | 20,964 | 59,903 | 421,623 | 136,903 | 451,374 | 9,205 | 1,128 | 1,064 | |
| Marlborough | 7,111 | 11,656 | 39,967 | 965,247 | 307,480 | 1,011,741 | 5,816 | 548 | 951 | |
| Westland | 2,777 | 2 | 10,072 | 40,561 | 55,897 | 29,005 | 66,100 | 3,273 | 14 | 94 |
| Canterbury | 63,686 | 42 | 68,985 | 193,248 | 4,262,804 | 2,160,035 | 4,727,882 | 41,037 | 255 | 168 |
| Otago | 38,500 | 21 | 47,189 | 134,324 | 2,638,757 | 1,051,316 | 2,807,098 | 14,128 | 20 | 16 |
| Southland | 29,108 | 8 | 54,757 | 165,380 | 1,434,148 | 641,646 | 1,601,640 | 7,190 | 47 | |
| Totals for Dominion | 346,407 | 262 | 893,454 | 3,101,945 | 23,075,250 | 9,447,752 | 23,914,506 | 266,829 | 5,447 | 9,087 |
The following table gives the number of the principal kinds of livestock in Australasia for the year 1918:—
| State. | Sheep. | Cattle. | Horses. | Pigs. |
|---|---|---|---|---|
| New South Wales | 37,243,770 | 3,271,782 | 721,302 | 294,338 |
| Victoria | 15,773,902 | 1,596,544 | 523,788 | 267,819 |
| Queensland | 18,220,985 | 5,786,744 | 759,726 | 140,966 |
| South Australia | 6,625,184 | 342,768 | 269,255 | 79,078 |
| Western Australia | 7,183,747 | 943,847 | 180,094 | 85,863 |
| Tasmania | 1,841,924 | 218,234 | 41,221 | 44,328 |
| Northern Territory | 58,620 | 570,039 | 31,436 | 1,200 |
| Federal Territory | 138,104 | 8,894 | 1,421 | 310 |
| Totals for Commonwealth | 87,036,236 | 12,738,852 | 2,528,243 | 913,902 |
| New Zealand | 25,828,554 | 3,035,478 | 363,188 | 235,347 |
The Dominion is eminently suited for sheep-breeding, practically every description of sheep finding a favourable local habitat. In the hilly and down country of the South Island the merino has been bred for very many years, and was the original sheep depastured. In fact, the merino ewe furnished the foundation of the crossbred stock which has made Canterbury mutton famous on British meat-markets. In the early days of the Canterbury meat trade the English Leicester of the original type was the favourite ram for putting to the merino ewe. Of later years the Lincoln has been largely employed to cross with the merino, and black-faced rams have been further employed to put to the crossbred ewes. In the North Island the Romney sheep, which suits the rather moist climate of this portion of the Dominion, has become the most popular sheep; it is also increasing in numbers in the South Island. The Lincoln and Border Leicester are also favoured in both Islands, while the Southdown is displacing other breeds for fat-lamb production throughout the Dominion.
A table appears on p. 230 giving the predominating breed of sheep in each Land District in the Dominion, together with the average weight of fleece obtained in the past five years.
From the table following it will be seen that the flocks of the North Island increased from 5,285,907 sheep in the year 1886 to 10,009,731 in 1906 and 13,880,799 in 1916. or at the rate of 89.37 per cent. in the first twenty years of the period, and of 38.67 per cent, between 1906 and 1916; 1920 shows a decrease of 7.41 per cent, from the previous year.
The number of sheep in the South Island has fluctuated considerably, decreases from previous years having occurred in 1911, 1912, 1913, 1915, 1916, 1917, 1919, and 1920.
| Year. | North Island. | South Island. | Total. |
|---|---|---|---|
| 1886 | 5,285,907 | 9,888,356 | 15,174,263 |
| 1910 | 12,917,662 | 11,351,958 | 24,269,620 |
| 1911 | 12,814,353 | 11,181,773 | 23,996,126 |
| 1912 | 12,618,089 | 11,132,064 | 23,750,153 |
| 1913 | 13,145,445 | 11,046,365 | 24,191,810 |
| 1914 | 13,155,958 | 11,642,805 | 24,798,763 |
| 1915 | 13,315,916 | 11,585,505 | 24,901,421 |
| 1916 | 13,880,799 | 10,907,351 | 24,788,150 |
| 1917 | 14,567,128 | 10,703,258 | 25,270,386 |
| 1918 | 14,758,278 | 11,780,024 | 26,538,302 |
| 1919 | 14,211,944 | 11,616,610 | 25,828,554 |
| 1920 | 13,166,750 | 10,747,756 | 23,914,506 |
There were fewer sheep in the Dominion in 1920 than in any year since 1912.
In the table given above the Chatham Islands are included in the South Island, as they form portion of the Canterbury-Kaikoura Sheep District. In dealing with land districts, however, they are included with Wellington.
Of the land districts, Hawke's Bay had most sheep in 1920, Wellington came next, and Canterbury occupied the third place.
| Land District. | No. of Sheep in 1919. | No. of Sheep in 1920. | Increase. | Decrease. |
|---|---|---|---|---|
| North Auckland | 728,915 | 664,455 | 64,460 | |
| Auckland | 966,377 | 911,135 | 55,242 | |
| Hawke's Bay | 5,977,805 | 5,454,427 | 523,378 | |
| Taranaki | 937,227 | 860,365 | 76,862 | |
| Wellington | 5,683,541 | 5,358,289 | 325,252 | |
| Nelson | 478,279 | 451,374 | 26,905 | |
| Marlborough | 1,044,307 | 1,011,741 | 32,566 | |
| Westland | 71,647 | 66,100 | 5,547 | |
| Canterbury | 5,147,677 | 4,727,882 | 419,795 | |
| Otago | 3,044,503 | 2,807,098 | 237,405 | |
| Southland | 1,748,276 | 1,601,640 | 146,636 | |
| Total | 25,828,554 | 23,914,506 | 1,914,048 |
The number of breeding-ewes and the total number of sheep in each county on the 30th April, 1920, are detailed in the next table.
| TABLE SHOWING FOR EACH COUNTY THE NUMBER OF BREEDING-EWES AND THE TOTAL NUMBER OF SHEEP ON THE 30TH APRIL, 1920. | ||
|---|---|---|
| County. | Total (including Lambs). | Breeding ewes (included in previous Column). |
* 1919 figures. | ||
| Mongonui | 47,644 | 22,120 |
| Whangaroa | 16,715 | 8,381 |
| Bay of Islands | 80,731 | 39,623 |
| Hokianga | 41,700 | 17,890 |
| Whangarei | 101,223 | 46,709 |
| Hobson | 99,086 | 44,016 |
| Otamatea | 57,445 | 27,043 |
| Rodney | 62,387 | 27,542 |
| Waitemata | 54,236 | 24,571 |
| Eden | 2,631 | 292 |
| Great Barrier | 12,217 | 7,492 |
| Manukau | 50,243 | 22,321 |
| Franklin | 38,147 | 17,639 |
| Totals, North Auckland L.D. | 664,455 | 305,639 |
| Waikato | 46,120 | 22,060 |
| Raglan | 178,252 | 82,296 |
| Waipa | 24,723 | 13,851 |
| Kawhia | 47,766 | 25,205 |
| Awakino | 103,200 | 37,521 |
| Waitomo | 141,084 | 61,448 |
| Coromandel | 42,044 | 19,413 |
| Thames | 5,477 | 3,194 |
| Ohinemuri | 3,994 | 1,237 |
| Tauranga | 10,478 | 3,663 |
| Piako | 26,042 | 12,380 |
| Matamata | 16,441 | 7,908 |
| Rotorua | 13,556 | 3,790 |
| Whakatane | 53,760 | 21,592 |
| Opotiki | 161,543 | 57,957 |
| East Taupo | 9,301 | 4,242 |
| West Taupo | 27,354 | 9,079 |
| Totals, Auckland L.D. | 911,135 | 386,836 |
| Waiapu | 664,777 | 317,790 |
| Waikohu | 650,311 | 316,169 |
| Uawa | 931,344 | 435,001 |
| Cook | ||
| Wairoa | 639,096 | 245,199 |
| Hawke's Bay | 1,059,555 | 436,630 |
| Waipukurau | 115,124 | 52,524 |
| Waipawa | 346,643 | 152,127 |
| Woodville | 82,791 | 38,712 |
| Dannevirke | 260,141 | 130,845 |
| Patangata | 591,626 | 288,477 |
| Weber | 113,019 | 43,401 |
| Totals, Hawke's Bay L.D. | 5,454,427 | 2,456,875 |
| Ohura | 153,894 | 61,222 |
| Clifton | 86,771 | 35,157 |
| Taranaki | 28,219 | 13,456 |
| Egmont | 13,654 | 5,119 |
| Stratford | 73,817 | 33,353 |
| Whangamomona | 83,412 | 35,270 |
| Waimate West | 3,025 | 1,635 |
| Hawera | 81,908 | 28,687 |
| Eltham | 64,270 | 25,468 |
| Patea | 273,395 | 90,701 |
| Totals, Taranaki L.D. | 860,365 | 330,068 |
| Waitotara | 238,913 | 89,407 |
| Wanganui | 465,850 | 175,037 |
| Waimarino | 320,003 | 119,760 |
| Kaitieke | 140,694 | 52,913 |
| Rangitikei | 1,019,137 | 414,348 |
| Kiwitea | 286,712 | 143,447 |
| Pohangina | 150,212 | 82,062 |
| Kairanga | 120,108 | 52,414 |
| Oroua | 165,694 | 90,650 |
| Manawatu | 138,437 | 51,848 |
| Horowhenua | 112,284 | 51,294 |
| Pahiatua | 197,719 | 99,254 |
| Akitio | 262,534 | 118,769 |
| Castlepoint | 160,759 | 79,017 |
| Eketahuna | 102,003 | 55,376 |
| Mauriceville | 62,092 | 38,094 |
| Masterton | 475,538 | 235,633 |
| Wairarapa South | 178,640 | 95,866 |
| Featherston | 465,889 | 203,928 |
| Hutt | 135,642 | 68,034 |
| Makara | 77,508 | 42,135 |
| Chatham Islands | 81,921* | 33,394* |
| Totals, Wellington L.D. | 5,358,289 | 2,392,680 |
| Collingwood | 20,442 | 9,455 |
| Takaka | 55,576 | 33,552 |
| Waimea | 310,849 | 179,286 |
| Buller | 5,137 | 2,769 |
| Murchison | 48,231 | 24,227 |
| Inangahua | 11,139 | 5,828 |
| Totals, Nelson L.D. | 451,374 | 255,117 |
| Sounds | 168,030 | 97,528 |
| Marlborough | 355,222 | 175,532 |
| Awatere | 290,098 | 152,227 |
| Kaikoura | 198,391 | 115,772 |
| Totals, Marlborough L.D. | 1,011,741 | 541,059 |
| Grey | 27,370 | 14,719 |
| Westland | 38,730 | 19,432 |
| Totals, Westland L.D. | 66,100 | 34,151 |
| Cheviot | 186,298 | 121,198 |
| Amuri | 399,675 | 210,413 |
| Waipara | 367,840 | 234,469 |
| Ashley | 100,868 | 63,581 |
| Oxford | 105,250 | 61,428 |
| Kowai | 84,855 | 50,031 |
| Rangiora | 44,580 | 25,419 |
| Eyre | 59,902 | 35,575 |
| Waimairi | 8,714 | 6,198 |
| Paparua | 41,167 | 16,918 |
| Malvern | 150,323 | 73,528 |
| Tawera | 89,773 | 43,501 |
| Heathcote | 13,139 | 5,215 |
| Halswell | 14,496 | 8,347 |
| Selwyn | 224,409 | 113,599 |
| Springs | 31,036 | 16,848 |
| Ellesmere | 86,167 | 52,099 |
| Mount Herbert | 50,632 | 35,640 |
| Wairewa | 79,760 | 59,428 |
| Akaroa | 88,299 | 52,566 |
| Ashburton | 934,245 | 549,530 |
| Geraldine | 302,293 | 174,841 |
| Levels | 186,371 | 99,483 |
| Mackenzie | 473,871 | 271,732 |
| Waimate | 594,919 | 327,719 |
| Totals, Canterbury L.D. | 4,727,882 | 2,709,306 |
| Waitaki | 610,110 | 320,638 |
| Maniototo | 291,967 | 142,824 |
| Waihemo | 137,650 | 74,017 |
| Waikouaiti | 85,528 | 51,696 |
| Peninsula | 5,846 | 3,698 |
| Taieri | 203,520 | 98,573 |
| Tuapeka | 410,894 | 177,157 |
| Bruce | 215,489 | 105,391 |
| Clutha | 326,401 | 161,742 |
| Vincent | 297,136 | 146,295 |
| Lake | 222,557 | 94,782 |
| Totals, Otago L.D. | 2,807,098 | 1,376,813 |
| Fiord | ||
| Wallace | 480,545 | 235,809 |
| Southland | 1,116,922 | 542,436 |
| Stewart Island | 4,173 | 1,760 |
| Totals, Southland L.D. | 1,601,640 | 780,005 |
| Totals for Dominion | 23,914,506 | 11,568,549 |
| Size of Flocks. | 1916. | 1917. | 1918. | 1919. | 1920. |
|---|---|---|---|---|---|
| Under 500 | 11,818 | 11,812 | 11,562 | 11,719 | 12,286 |
| 500 and under 1,000 | 4,911 | 5,071 | 5,603 | 5,466 | 5,249 |
| 1,000 and under 2,500 | 4,344 | 4,279 | 4,747 | 4,637 | 4,411 |
| 2,500 and under 5,000 | 1,299 | 1,375 | 1,407 | 1,440 | 1,314 |
| 5,000 and under 10,000 | 566 | 629 | 622 | 611 | 536 |
| 10,000 and under 20,000 | 202 | 176 | 187 | 162 | 139 |
| 20,000 and upwards | 41 | 38 | 40 | 30 | 25 |
| Totals | 23,181 | 23,380 | 24,168 | 24,065 | 23,960 |
The average size of the flocks is found to have been 1,069 sheep in 1916, 1,081 in 1917, 1,098 in 1918, 1,073 in 1919, and 998 in 1920.
The number of the different classes composing the flocks in April, 1920, was as follows:—
| — | North Island. | South Island. | Total in Dominion. |
|---|---|---|---|
| Stud sheep (entered in Flock-book)— | |||
| Merino | 16,041 | 16,041 | |
| Lincoln | 30,745 | 4,210 | 34,964 |
| Romney | 88,967 | 50,503 | 139,470 |
| Border Leicester | 728 | 20,985 | 21,713 |
| English Leicester | 1,223 | 26,254 | 27,477 |
| Shropshire | 595 | 2,134 | 2,729 |
| Southdown | 10,625 | 5,663 | 16,288 |
| Corriedale | 555 | 26,644 | 27,199 |
| Other breeds | 399 | 721 | 1,120 |
| Totals | 133,846 | 153,155 | 287,001 |
| Sheep of a distinctive breed, but not entered in Flock-book— | |||
| Merino | 39,004 | 764,585 | 803,589 |
| Lincoln | 253,579 | 20,453 | 274,032 |
| Romney | 2,375,657 | 657,182 | 3,032,839 |
| Border Leicester | 10,176 | 131,984 | 142,160 |
| English Leicester | 4,161 | 146,276 | 150,437 |
| Shropshire | 2,769 | 6,343 | 9,112 |
| Southdown | 26,530 | 5,885 | 32,415 |
| Corriedale | 7,940 | 433,096 | 441,036 |
| Half-bred | 1,142,459 | 1,142,459 | |
| Other breeds | 1,880 | 12,513 | 14,393 |
| Totals | 2,721,696 | 3,320,776 | 6,042,472 |
| Flock sheep— | |||
| Crossbreds and others not otherwise enumerated | 10,311,208 | 7,273,825 | 17,585,033 |
| Grand totals | 13,166,750 | 10,747.756 | 23,914,506 |
The following table gives the predominating breed of sheep and the average weight of fleece for each land district in the Dominion in 1916, 1917, 1918, 1919, and 1920.
| TABLE SHOWING THE PREDOMINATING BREED OF SHEEP AND THE AVERAGE WEIGHT OF FLEECE FOR EACH LAND DISTRICT IN THE DOMINION FOR THE YEARS 1916, 1917, 1918, 1919, AND 1920. | ||||||||||
|---|---|---|---|---|---|---|---|---|---|---|
| Reference.—M., Merino. L., Lincoln. R., Romney. B.L., Border Leicester. E.L., English Leicester. Shp., Shropshire. Sd., Southdown. C., Corriedale. Hb., Half-bred. O., Other breeds. | ||||||||||
| Land District | 1916–18.* | 1916–17.* | 1917–18. | 1918–19. | 1919–20. | |||||
| Predominating Breed of Sheep. | Average Weight of Fleece. | Predominating Breed of Sheep. | Average Weight of Fleece. | Predominating Breed of Sheep. | Average Weight of Fleece. | Predominating Breed of Sheep. | Average Weight of Fleece. | Predominating Breed of Sheep. | Average Weight of Fleece. | |
* In 1915–16 flock sheep were classified as “Merino” and “Others” only. In 1916–1917 flock sheep were classified according to predominating strain, but no provision was made for “Half-breds.” | ||||||||||
| lb. | lb. | lb. | lb. | lb. | ||||||
| North Auckland | R. | 7.04 | R. | 6.92 | R. | 6.61 | R. | 6.60 | R. | 6.48 |
| Auckland | R. | 6.74 | R. | 6.62 | R. | 6.72 | R. | 6.99 | R. | 6.93 |
| Hawke's Bay | R. | 7.73 | R. | 8.39 | R. | 7.63 | R. | 7.89 | R. | 7.58 |
| Taranaki | L. | 6.83 | R. | 6.88 | R. | 6.72 | R. | 7.20 | R. | 7.45 |
| Wellington | R. | 7.98 | R. | 8.14 | R. | 7.85 | R. | 8.12 | R. | 7.88 |
| Nelson | R. | 5.77 | R. | 5.61 | R. | 5.69 | R. | 5.89 | R. | 5.59 |
| Marlborough | M. | 6.60 | M. | 7.21 | Hb. | 7.12 | Hb. | 7.29 | Hb. | 6.86 |
| Westland | R. | 5.46 | R. | 5.75 | R. | 5.94 | R. | 5.92 | R. | 5.93 |
| Canterbury | M. | 6.99 | O. | 7.28 | Hb. | 7.31 | Hb. | 7.29 | Hb. | 7.08 |
| Otago | M. | 6.90 | M. | 6.98 | M. | 6.87 | M. | 6.71 | R. | 6.71 |
| Southland | R. | 7.27 | R. | 6.79 | R. | 6.90 | R. | 6.65 | R. | 6.53 |
| Dominion | R. | 7.31 | R. | 7.58 | R. | 7.32 | R. | 7.45 | R. | 7.25 |
Figures showing sheep and lambs slaughtered for food purposes during each of the last ten years, together with the exports of frozen mutton and lamb, are given in the tables following:—
| SHEEP. | ||||
|---|---|---|---|---|
| Year ended 31st March. | Sheep slaughtered for Food Purposes. | Frozen Mutton exported. | ||
| Number. | Approximate Weight. | Number of Carcases, including Pieces at 60 lb. to a Sheep. | Weight. | |
| Cwt. | Cwt. | |||
| 1911 | 3,372,150 | 1,806,509 | 2,193,665 | 1,068,881 |
| 1912 | 3,189,527 | 1,708,675 | 1,867,828 | 912,926 |
| 1913 | 3,306,588 | 1,771,386 | 2,208,330 | 1,092,692 |
| 1914 | 4,019,831 | 2,153,570 | 2,557,639 | 1,271,935 |
| 1915 | 3,999,460 | 2,139,889 | 2,522,448 | 1,244,399 |
| 1916 | 4,018,578 | 2,152,809 | 2,939,611 | 1,498,843 |
| 1917 | 3,601,284 | 1,929,259 | 2,409,899 | 1,228,696 |
| 1918 | 3,631,344 | 1,945,363 | 2,150,505 | 1,118,014 |
| 1919 | 4,381,005 | 2,346,967 | 1,300,047 | 680,732 |
| 1920 | 5,512,482 | 2,953,116 | 4,127,853 | 2,097,678 |
| Total for 10 years | 39,032,249 | 20,907,543 | 24,277,825 | 12,214,796 |
| LAMBS. | ||||
|---|---|---|---|---|
| Year ended 31st March. | Lambs slaughtered for Food Purposes. | Frozen Lamb exported. | ||
| Number. | Approximate Weight. | Number of Careases. | Weight. | |
| Cwt. | Cwt. | |||
| 1911 | 4,044,953 | 1,301,056 | 3,839,922 | 1,167,980 |
| 1912 | 3,192,108 | 1,026,034 | 3,093,091 | 932,835 |
| 1913 | 3,505,986 | 1,126,924 | 2,956,249 | 901,146 |
| 1914 | 4,338,180 | 1,394,415 | 3,854,348 | 1,186,638 |
| 1915 | 4,471,861 | 1,597,093 | 3,692,003 | 1,120,682 |
| 1916 | 4,091,085 | 1,314,991 | 3,750,590 | 1,152,736 |
| 1917 | 3,431,943 | 1,103,125 | 2,797,290 | 838,569 |
| 1918 | 2,695,443 | 866,392 | 2,048,612 | 623,022 |
| 1919 | 2,950,316 | 948,315 | 916,914 | 277,822 |
| 1920 | 3,280,601 | 1,054,478 | 3,420,220 | 1,070,340 |
| Totals for 10 years | 36,002,476 | 11,732,823 | 30,369,239 | 9,271,770 |
In addition to the figures of slaughterings given above there are the killings by farmers for their own use. During the 1919–20 season farmers killed 671,136 sheep and 57,529 lambs for food, and on the basis of these figures it is estimated that about 5,500,000 sheep, representing a weight of 330,000,000 lb., and 500,000 lambs, of a weight of 18,000,000 lb., were killed by farmers for local consumption during the ten years shown. This gives a total of approximately 1,350,000,000 lb., equal to an average annual consumption per head of population, including Maoris, of over 120 lb.
The number of sheep in the Australian States and in New Zealand for the years 1900, 1905, 1910, 1915, and 1918 was as follows:—
| 1900. | 1905. | 1910. | 1915. | 1918. | |
|---|---|---|---|---|---|
* Including Northern Territory. † Figures for April following. | |||||
| Queensland | 10,339,185 | 12,535,231 | 20,331,838 | 15,950,154 | 18,220,985 |
| New South Wales | 40,020,506 | 39,506,764 | 45,560,969 | 32,874,359 | 37,243,770 |
| Viotoria | 10,841,790 | 11,455,115 | 12,882,665 | 10,545,632 | 15,773,902 |
| South Australia* | 5,283,247 | 6,339,542 | 6,324,717 | 3,744,747 | 6,683,804 |
| Western Australia | 2,434,311 | 3,120,703 | 5,158,516 | 4,831,727 | 7,183,747 |
| Tasmania | 1,683,956 | 1,583,561 | 1,788,310 | 1,624,450 | 1,841,924 |
| Federal Territory | 134,679 | 138,104 | |||
| New Zealand† | 19,355,195 | 19,130,875 | 23,996,126 | 24,788,150 | 25,828,554 |
| Total, Australasia | 89,958,190 | 93,671,791 | 116,043,141 | 94,493,898 | 112,914,790 |
According to the Year-book of the International Institute of Agriculture at Rome, the following figures represented the latest information (1916) available as to the number of sheep in the various countries concerned at the time of the publication of the volume. The figure shown for France does not include the number of sheep in territory occupied by the enemy at the time of the enumeration, while that for Turkey covers both Turkey in Europe and Turkey in Asia.
| Country. | Number of Sheep. |
|---|---|
| Argentina | 81,485,149 |
| Russia | 76,404,792 |
| Australia | 69,244,603 |
| United States of America | 48,483,000 |
| South African Union | 35,710,843 |
| British India | 31,443,727 |
| United Kingdom | 28,770,692 |
| Turkey | 27,094,678 |
| New Zealand | 24,788,150 |
| Spain | 16,012,277 |
| Italy | 13,824,000 |
| Uruguay | 11,482,251 |
| France | 10.845,280 |
| Austria-Hungary | 8,987,959 |
| Algeria | 8,810,739 |
| Bulgaria | 8,632,388 |
| Brazil | 7,204,920 |
| British East Africa Protectorate | 6,555,000 |
| Roumania | 5,269,493 |
| Germany | 5,073,478 |
| French Morocco | 4,715,371 |
| Chile | 4,557,800 |
| Serbia | 3,818,997 |
| Portugal | 3,072,988 |
| Canada | 1,965,101 |
Wool is the most important product of New Zealand. In normal years the value of the export is over a third of the value of the total exports of the Dominion, the figures for 1918 and 1919 being,—
| 1918. | 1919. | |
|---|---|---|
* Exclusive of gold (specie and bullion). | ||
| £ | £ | |
| Wool (New Zealand produce) | 7,527,266 | 19,559,537 |
| Total exports of New Zealand produce | 27,894,619* | 53,304,384 |
The quantity of wool exported in 1919 was 274,246,613 lb., an increase of 165,522,038 lb. as compared with the quantity exported in the previous year. The annual production of wool for the past twenty years, taking the exports for the twelve months immediately preceding the commencement of shearing, and adding thereto the quantity used in the Dominion for manufacturing purposes, is shown in the next table, but no addition has been made for wool on sheep-skins exported, nor for loss in scouring and washing.
| Year ended 30th September. | Quantity exported. | Quantity purchased by Local Mills. | Total. |
|---|---|---|---|
| lb. | lb. | lb. | |
| 1900 | 144,829,515 | 3,223,392 | 148,052,907 |
| 1901 | 143,064,789 | 4,629,924 | 147,694,713 |
| 1902 | 155,652,563 | 4,203,312 | 159,855,875 |
| 1903 | 160,919,693 | 5,294,652 | 166,214,345 |
| 1904 | 141,031,699 | 5,191,451 | 146,223,150 |
| 1905 | 146,889,767 | 3,651,343 | 150,541,110 |
| 1906 | 152,765,232 | 4,372,472 | 157,137,704 |
| 1907 | 164,006,579 | 4,116,722 | 168,123,301 |
| 1908 | 163,930,722 | 4,779,198 | 168,709,920 |
| 1909 | 187,619,181 | 5,202,821 | 192,822,002 |
| 1910 | 194,472,934 | 5,642,113 | 200,115,047 |
| 1911 | 184,854,149 | 6,048,164 | 190,902,313 |
| 1912 | 189,553,723 | 6,284,114 | 195,837,837 |
| 1913 | 195,353,533 | 6,823,545 | 202,177,078 |
| 1914 | 196,499,896 | 6,846,960 | 203,346,856 |
| 1915 | 208,908,118 | 6,628,019 | 215,536,137 |
| 1916 | 200,119,016 | 8,772,467 | 208,891,483 |
| 1917 | 162,043,634 | 7,590,445 | 169,634,079 |
| 1918 | 110,054,315 | 7,488,932 | 117,543,247 |
| 1919 | 258,363,524 | 6,720,400 | 265,083,924 |
The following summary is interesting as showing the various classes of wool purchased by the New Zealand mills. For 1918–19 greasy wool represents over 98 per cent. of the total. More than half of the wool used at mills is shown to be half-bred, less than one-third crossbred, and slightly less than one-fifth merino.
| CLASS OF WOOL PURCHASED BY WOOLLEN-MILLS, 1918–19. | ||||
|---|---|---|---|---|
| —– | Merino. | Half-bred. | Crossbred. | Totals. |
| lb. | lb. | lb. | lb. | |
| Greasy | 1,207,655 | 3,526,471 | 1,870,171 | 6,604,297 |
| Washed | 687 | 3,826 | 4,513 | |
| Scoured | 9,520 | 4,245 | 17,078 | 30,843 |
| Sliped | 6,622 | 74,125 | 80,747 | |
| Totals, 1918–19 | 1,217,175 | 3,538,025 | 1,965,200 | 6,720,400 |
| Totals, 1917–18 | 1,623,417 | 3,653,914 | 2,211,601 | 7,488,932 |
The percentages of greasy, scoured, and washed wool to the total quantities exported during the last ten years are,–
| Year. | Greasy Per Cent. | Scoured and sliped. Per Cent. | Washed. Per Cent. |
|---|---|---|---|
| 1910 | 83.48 | 16.27 | 0.25 |
| 1911 | 80.63 | 19.16 | 0.21 |
| 1912 | 80.96 | 18.77 | 0.27 |
| 1913 | 83.28 | 16.43 | 0.29 |
| 1914 | 83.45 | 16.28 | 0.27 |
| 1915 | 78.62 | 21.09 | 0.29 |
| 1916 | 79.27 | 20.24 | 0.49 |
| 1917 | 81.77 | 18.07 | 0.16 |
| 1918 | 77.92 | 21.21 | 0.87 |
| 1919 | 71.78 | 28.07 | 0.15 |
The following diagram shows the increase in the weight of wool exported since 1882, also the great expansion of the frozen-meat trade in the same period. The decrease during the war period is attributable to lack of shipping facilities.
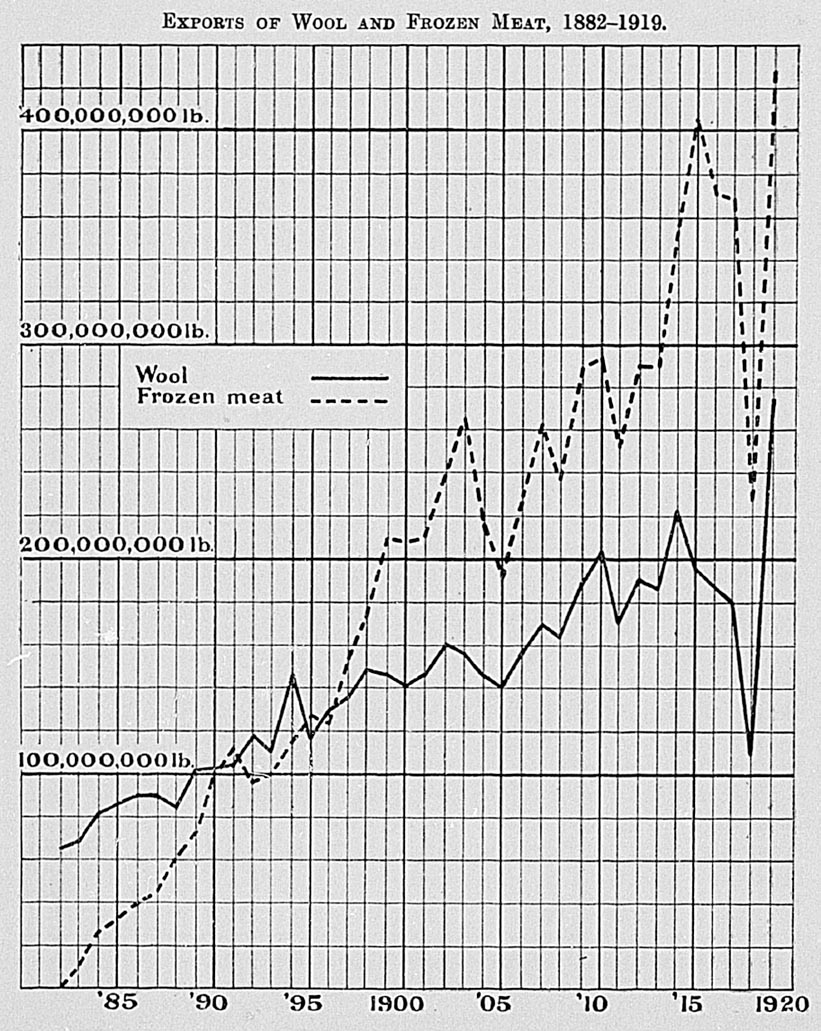
Most of the leading breeds of the cattle of Great Britain are represented in the Dominion by herds bred on sound lines, though the beef-breeds of later years are not making much headway owing to the advance taking place in dairying operations. There are still very many fine Short horn herds of the beef type, while Aberdeen-Angus and Hereford cattle are also bred. There are herd-books for each of these breeds.
The breeding of dairy cattle has made considerable progress in recent years. A special Jersey herd-book has been in existence for some time, and herd-book societies are now well established for the Friesian, Ayrshire, and Milking Shorthorn breeds as well. The various societies have heartily co-operated in a scheme for establishing registers of merit in connection with purebred dairy cattle, giving a great fillip to the breeding of purebred dairy stock. The ordinary dairy-farmer is encouraged to use purebred bulls and thereby to assist materially in raising the standard of the dairy stock of the country. He is now coming to appreciate the value of herd-testing work, and thus, knowing the really profitable cows in his herd, will be anxious to secure a bull which will enable them to perpetuate their good qualities.
An important factor responsible for the improved position of dairy cattle in New Zealand is the milking-machine, which is making the farmer more independent of hired labour. The farms generally are on a fairly large scale, but with the increasing price of land there is a gradual tendency towards smaller farms and the keeping of fewer but better cows. Also, there is a growing realization of the necessity of a more liberal system of feeding, particularly in the direction of growing special fodder crops to maintain the milk-flow at all seasons of the year. Generally, dairy-farming in New Zealand is being conducted on a sound and profitable basis, and the outlook for the industry is most encouraging.
A policy which has been partly responsible for placing the breeding of dairy cattle on up-to-date principles has been the establishment of purebred herds at three of the State experimental farms, and there breeding them according to an exact record of performance. High-priced stock have been imported in order that the foundation herds at the farms may be of the best quality. The milk of all the cattle is daily weighed and periodically tested, official check tests being conducted by experts of the Dairy Division of the Agriculture Department. The yearling bulls from these State milk-record herds command high values. The appreciation of the farming community for this officially tested stock has been chiefly responsible for the gratifying manner in which private breeders of pedigree stock have participated in the official register - of - merit scheme of the Department and the herd-book societies. In the season of 1910–11 the Department established a model herd-testing association in the Wairarapa district, carrying out the work of testing and of recording results free of all charge to the farmers taking part. This had the effect of creating at once wide interest in the important herd-testing movement, and the following season model associations were established in several leading dairying districts. This was intended not only to demonstrate the value of herd-testing when properly conducted and with full comparative records published at the end of the season, but also to encourage farmers to establish co-operative testing associations on their own account. The object was achieved, and many associations are now in operation.
Details for 1920 for each land district are given in the next table.
| TABLE SHOWING DETAILS OF CATTLE FOR EACH LAND DISTRICT IN THE DOMINION AS AT 31ST JANUARY, 1920. | |||||||||||
|---|---|---|---|---|---|---|---|---|---|---|---|
| Land District (including Interior Boroughs). | Dairy Cattle. | Other Cattle. | Total Cattle. | ||||||||
| Bulls of all Ages. | Cows and Heifers over Two Years Old. | Total Dairy Cattle. | Bulls of all Ages. | Cows and Heifers over Two Years Old. | Heifers under Two Years Old. | Steers over Two Years Old. | Steers under Two Years Old. | Total other Cattle. | |||
| In Milk. | Dry. | ||||||||||
| North Auckland | 6,105 | 109,165 | 17,559 | 132,829 | 1,557 | 55,306 | 90,414 | 63,438 | 68,704 | 279,419 | 412,248 |
| Auckland | 8,839 | 178,661 | 27,989 | 215,489 | 1,766 | 68,961 | 129,369 | 102,554 | 99,122 | 401,772 | 617,261 |
| Hawke's Bay | 1,728 | 40,307 | 7,014 | 49,049 | 5,690 | 150,382 | 94,056 | 87,593 | 78,744 | 416,465 | 405,514 |
| Taranaki | 7,044 | 148,186 | 9,190 | 164,420 | 1,096 | 30,868 | 80,065 | 40,001 | 41,456 | 193,486 | 357,900 |
| Wellington | 6,063 | 124,230 | 17,530 | 147,823 | 5,032 | 127,512 | 117,394 | 126,674 | 91,198 | 467,810 | 615,633 |
| Totals, North Island | 29,779 | 600,549 | 79,282 | 709,610 | 15,141 | 433,029 | 511,298 | 420,260 | 379,224 | 1,758,952 | 2,468,562 |
| Nelson | 971 | 17,381 | 3,583 | 21,935 | 205 | 7,462 | 12,458 | 8,652 | 9,191 | 37,968 | 59,903 |
| Marlborough | 626 | 10,113 | 1,543 | 12,282 | 218 | 5,733 | 8,812 | 5,907 | 7,015 | 27,685 | 39,967 |
| Westland | 426 | 8,132 | 1,940 | 10,498 | 203 | 7,350 | 8,065 | 7,518 | 6,927 | 30,063 | 40,561 |
| Canterbury | 3,305 | 60,009 | 8,976 | 72,290 | 492 | 19,854 | 40,389 | 27,920 | 32,303 | 120,958 | 193,248 |
| Otago | 2,356 | 40,007 | 7,182 | 49,545 | 551 | 15,539 | 28,969 | 17,499 | 22,221 | 84,779 | 134,324 |
| Southland | 2,682 | 46,566 | 8,191 | 57,439 | 1,044 | 22,535 | 34,708 | 22,176 | 27,478 | 107,941 | 165,380 |
| Totals, South Island | 10,366 | 182,208 | 31,415 | 223,989 | 2,713 | 78,473 | 133,401 | 89,672 | 105,135 | 409,394 | 633,383 |
| Totals, Dominion | 40,145 | 82,757 | 110,697 | 933,599 | 17,854 | 511,502 | 644,699 | 509,932 | 484,359 | 2,168,346 | 3,101,945 |
The total number of cattle in the Dominion at the enumeration of 1920 was 3,101,945, as against 3,035,478 in 1919. The comparative figures for the two years, according to the classification in use, are as follows:—
| 1919. | 1920. | |
|---|---|---|
| Dairy cattle— | ||
| Bulls of all ages | 37,453 | 40,145 |
| Cows and heifers two years old and over | 826,135 | 893,454 |
| Other cattle— | ||
| Bulls of all ages | 19,253 | 17,854 |
| Cows and heifers two years old and over | 520,361 | 511,502 |
| Heifers under two years old | 634,550 | 644,699 |
| Steers two years old and over | 459,186 | 509,932 |
| Steers under two years old | 538,540 | 484,359 |
| Totals | 3,035,478 | 3,101,945 |
The greater proportion of the increase in cattle appears in the Auckland (including North Auckland), and Wellington Land Districts. Hawke's Bay and Westland are the only land districts showing a decrease on the previous year's figures. The figures for each district are as follows:—
| Land District. | Increase. | Decrease. |
|---|---|---|
| Auckland (incl. Nth. Auckland) | 26,045 | |
| Hawke's Bay | 13,498 | |
| Taranaki | 8,082 | |
| Wellington | 38,719 | |
| Nelson | 1,115 | |
| Marlborough | 1,668 | |
| Westland | 1,481 | |
| Canterbury | 4,031 | |
| Otago | 1,705 | |
| Southland | 81 | |
| Total increase | 66,467 |
Out of a total of 3,101,945 cattle, the North Island is shown to have had 2,468,562 or 79.58 per cent., while the South Island had 633,283, or 20.42 per cent. The dairy cows and heifers intended for dairying in the North Island numbered 679,831, or 76.09 per cent., and in the South Island 213,623, or 23.91 per cent.
The following table shows the number and weight of cattle slaughtered for food purposes in each of the past ten years, together with the weight of beef exported:—
| Year ended 31st March. | Cattle slaughtered for Food Purposes. | Weight of Frozen Beef exported. | |
|---|---|---|---|
| Number. | Approximate Weight. | ||
| Cwt. | Cwt. | ||
| 1911 | 286,256 | 2,044,686 | 500,022 |
| 1912 | 237,696 | 1,697,829 | 210,629 |
| 1913 | 259,935 | 1,856,679 | 260,880 |
| 1914 | 299,409 | 2,139,529 | 325,593 |
| 1915 | 347,353 | 2,481,093 | 716,289 |
| 1916 | 369,647 | 2,640,336 | 750,938 |
| 1917 | 385,129 | 2,750,921 | 1,008,689 |
| 1918 | 341,300 | 2,437,857 | 882,982 |
| 1919 | 355,357 | 2,538,264 | 804.512 |
| 1920 | 413,206 | 2,951,471 | 576,054 |
| Totals for 10 years | 3,295,288 | 23,538,665 | 6,036,588 |
In addition to these figures there were 3,810 bullocks and cows and 2,780 calves slaughtered by farmers for local consumption during the year ended the 31st January, 1920.
In connection with the enumeration of live - stock in 1918 information was collected as to breeds of cattle, horses, and pigs in addition to the usual details of age, sex, &. A summary of the results of this enumeration as regards cattle is given below. More detailed information giving particulars according to land districts will be found in the 1918 issue of this book.
A similar detailed collection will be made in connection with the 1921 population census.
| TABLE SHOWING DETAILS OF CATTLE IN THE DOMINION ON 31ST JANUARY, 1918, CLASSIFIED ACCORDING TO BREED, SEX, AND AGE. | ||||||
|---|---|---|---|---|---|---|
| Breed. | Bulls of All Ages for Stud. | Cows and Heifers over Two Years Old. | Heifers under Two Years Old. | Steers over Two Years Old. | Steers under Two Years Old. | Total Cattle. |
| Purebred— | ||||||
| Jersey | 2,048 | 2,774 | 1,337 | 14 | 55 | 6,228 |
| Alderney | 2 | 3 | 5 | |||
| Friesian (Holstein) | 1,082 | 1,939 | 920 | 16 | 76 | 4,033 |
| Ayrshire | 318 | 659 | 339 | 3 | 1,319 | |
| Shorthorn | 1,550 | 2,624 | 903 | 63 | 100 | 5,240 |
| Hereford | 1,455 | 2,575 | 913 | 47 | 3 | 4,993 |
| Polled Angus | 538 | 846 | 304 | 325 | 92 | 2,105 |
| Devon | 22 | 10 | 32 | |||
| Other breeds | 21 | 41 | 25 | 87 | ||
| Crossbred with predominating strain of— | ||||||
| Jersey and other Channel Island breeds | 5,823 | 214,144 | 98,146 | 6,629 | 30,505 | 355,247 |
| Friesian (Holstein) | 5,542 | 90,168 | 54,470 | 10,752 | 37,110 | 198,042 |
| Ayrshire | 1,053 | 29,677 | 12,201 | 1,349 | 5,536 | 49,816 |
| Shorthorn | 23,068 | 675,057 | 335,131 | 296,282 | 330,736 | 1,660,274 |
| Hereford | 5,188 | 109,139 | 55,244 | 64,191 | 55,700 | 289,462 |
| Polled Angus | 2,669 | 58,817 | 26,757 | 30,062 | 26,873 | 145,178 |
| Other (dairy cattle) | 315 | 39,238 | 14,826 | 3,084 | 9,314 | 66,777 |
| Other (beef cattle) | 193 | 14,809 | 8,277 | 15,448 | 11,062 | 49,789 |
| Totals | 50,887 | 1,242,520 | 609,793 | 428,262 | 507,165 | 2,838,627 |
| Boroughs | 1,048 | 20,199 | 6,671 | 1,069 | 1,851 | 30,838 |
| Grand totals | 51,935 | 1,262,719 | 616,464 | 429,331 | 509,016 | 2,869,465 |
The Dairy Industry Act, 1908, a consolidation of previous legislation, provides for the appointment of inspectors of dairy stock and factories or other places used for the manufacture of dairy-produce, and power is given to condemn or forbid their use, if necessary. The sale of unwholesome milk or other dairy-produce is prohibited, and provision is made for the inspection, grading, and shipping of all such produce exported. Provision is made for the framing of regulations for the registration of dairies, licensing of persons carrying on the manufacture or sale of the produce, registration of trade-marks or brands, and for inspection and grading. A fine not exceeding £50 may be inflicted for any offence under this part of the Act.
Authority is given for State advances to dairy companies, on the security of their assets, for the purposes of acquiring land or of erecting buildings and machinery for carrying on the manufacture of dairy-produce. Loans are repayable by equal half-yearly instalments within fifteen years, and bear interest at the rate of 5 per cent. per annum.
The Act also provides for the registration of co-operative dairy companies, and shareholders are protected in the event of certain contingencies.
A short amending Act was passed in 1915, but does not affect the main points of the measure as summarized.
The census of industrial manufacture showed that during the year ended 31st March, 1919, 509,093 cwt. of butter was produced by butter-factories in the Dominion. The quantity exported during this period amounted to 429,627 cwt.
Returns from cheese-factories give the quantity manufactured during the twelve months ended 31st March, 1919, as 1,054,090 cwt.
The number of butter and cheese factories in each district as in April, 1920, with the previous season's output for export, is next given. The districts shown do not in all cases correspond exactly with the land districts of the same name.
| District. | Number of Factories. | Forwarded for Export, 1919-20. | Number of Suppliers. | |||
|---|---|---|---|---|---|---|
| Butter. | Cheese. | Butter. | Cheese. | Butter. | Cheese. | |
| Tons. | Tons. | |||||
| Auckland | 53 | 51 | 10,424 | 10,553 | 10,609 | 1,153 |
| Hawke's Bay | 10 | 23 | 472 | 2,390 | 1,694 | 655 |
| Taranaki | 26 | 116 | 2,699 1/2 | 26,048 | 1,776 | 3,028 |
| Wellington | 20 | 70 | 1,368 | 10,557 | 2,442 | 1,846 |
| Nelson | 7 | 5 | 357 | 347 | 579 | 130 |
| Marlborough | 4 | 7 | 121 | 806 | 362 | 238 |
| Westland | 8 | 4 | 259 | 189 | 499 | 74 |
| Canterbury | 12 | 16 | 887 1/2 | 1,557 | 3,986 | 524 |
| Otago and Southland | 14 | 92 | 448 1/4 | 8,288 | 3,207 | 2,841 |
| Totals, 1920 | 154 | 384 | 17,036 1/4 | 60,735 | 25,154 | 10,489 |
| Totals, 1919 | 214 | 384 | ||||
| Totals, 1918 | 162 | 402 | ||||
| Totals, 1917 | 164 | 392 | ||||
| Totals, 1916 | 173 | 381 | ||||
| Totals, 1915 | 167 | 330 | ||||
| Totals, 1914 | 181 | 293 | ||||
| Totals, 1913 | 174 | 276 | ||||
| Totals, 1912 | 172 | 224 | ||||
| Totals, 1911 | 185 | 218 | ||||
| Totals, 1910 | 189 | 194 | ||||
In addition to the above, in April, 1920, there were 7 private dairies for butter and 28 packing-houses.
The total export of butter and cheese in the past twenty years, and the total quantity of each commodity sent to the United Kingdom, are tabulated below:—
| Year. | Total Export of Butter. | Butter exported to the United Kingdom. | Total Export of Cheese. | Cheese exported to the United Kingdom. |
|---|---|---|---|---|
| Cwt. | Cwt. | Cwt. | Cwt. | |
| 1900 | 172,583 | 165,871 | 102,849 | 81,908 |
| 1901 | 201,591 | 170,903 | 104,294 | 74,510 |
| 1902 | 253,998 | 170,207 | 74,746 | 50,325 |
| 1903 | 285,106 | 249,016 | 74,780 | 64,661 |
| 1904 | 314,360 | 299,171 | 84,526 | 82,046 |
| 1905 | 305,722 | 282,275 | 88,562 | 85,653 |
| 1906 | 320,225 | 306,739 | 131,206 | 129,321 |
| 1907 | 328,441 | 314,081 | 236,833 | 234,517 |
| 1908 | 229,971 | 211,242 | 280,798 | 276,212 |
| 1909 | 321,108 | 301,693 | 400,607 | 398,619 |
| 1910 | 356,535 | 345,400 | 451,915 | 449,167 |
| 1911 | 302,387 | 283,505 | 439,174 | 435,616 |
| 1912 | 378,117 | 316,857 | 577,070 | 572,562 |
| 1913 | 372,258 | 288,224 | 611,663 | 608,933 |
| 1914 | 434,067 | 361,381 | 863,776 | 859,986 |
| 1915 | 420,144 | 371,959 | 817,258 | 803,917 |
| 1916 | 358,632 | 336,412 | 949,416 | 942,773 |
| 1917 | 254,397 | 250,721 | 885,751 | 865,152 |
| 1918 | 431,023 | 415,250 | 883,445 | 844,198 |
| 1919 | 345,818 | 336,606 | 1,572,355 | 1,517,102 |
Exports of butter to countries other than the United Kingdom in 1919 include 6,000 cwt. to Canada, and 39,796 and 14,973 cwt. to Egypt and India respectively.
The quantities of butter and cheese exported continued about equal till the close of the year 1895. During the period 1896–1907 butter assumed the lead, reaching its maximum of comparative importance in 1903, in which year the export was nearly four times that of cheese. A remarkable rise then took place in the cheese - exports, and the increase in the exports continued so rapidly that 1917 saw the quantity of cheese more than treble that of butter.
The number of horses is shown for seven census years,—
| Census Years. | Number of Horses. | Numerical Increase. | Increase per Cent. |
|---|---|---|---|
* Decrease. | |||
| 1886 | 187,382 | ||
| 1891 | 211,040 | 23,658 | 12.63 |
| 1896 | 237,418 | 26,378 | 12.50 |
| 1901 | 266,245 | 28,827 | 12.14 |
| 1906 | 326,537 | 60,292 | 22.65 |
| 1911 | 404,284 | 77,747 | 23.81 |
| 1916 | 371,331 | -32,953* | -8.15* |
As previously stated, particulars as to breeds of horses were obtained at the enumeration of 1918, and detailed tables giving particulars by land districts were published in that year's issue of this volume. A summarized table is subjoined.
TABLE SHOWING DETAILS OF HORSES IN THE DOMINION ON 31ST JANUARY, 1918, CLASSIFIED ACCORDING TO BREED, SEX, AND AGE.
| Breed. | Stallions for Stud. | Geldings Two Years Old and Over. | Dry Mares Two Years Old and Over. | Mares with Foal at Foot or to foal this Season. | Fillies under Two Years Old. | Colts or Geldings under Two Years Old. | Other Horses, and Horses unspecified. | Total Horses. |
|---|---|---|---|---|---|---|---|---|
| Thoroughbred | 407 | 1,772 | 1,895 | 928 | 637 | 511 | 177 | 6,327 |
| Draught | 922 | 72,299 | 64,116 | 6,905 | 7,971 | 6,452 | 1,022 | 159,687 |
| Other (harness and saddle) | 408 | 76,707 | 71,144 | 8,281 | 8,701 | 7,083 | 5,897 | 178,221 |
| Ponies under 14 hands | 123 | 3,753 | 4,083 | 505 | 459 | 413 | 568 | 9,904 |
| Totals | 1,860 | 154,531 | 141,238 | 16,619 | 17,768 | 14,459 | 7,664 | 354,139 |
| Boroughs | 158 | 11,080 | 6,875 | 622 | 406 | 3,022 | 1,748 | 23,911 |
| Grand totals | 2,018 | 165,611 | 148,113 | 17,241 | 18,174 | 17,481 | 9,412 | 378,050 |
In addition there were 253 asses and mules in the Dominion, classified as follows:—
| Stallions for stud | 17 |
| Geldings over two years old | 124 |
| Dry mares over two years old | 63 |
| Mares with foal at foot or to foal this season | 7 |
| Fillies under two years old | 5 |
| Colts or geldings under two years old | 8 |
| Other asses and mules, and asses and mules unspecified | 13 |
| Total | 237 |
| Boroughs | 16 |
| Grand total | 253 |
There were 346,407 horses in the Dominion on 31st January, 1920, being a decrease of 16,781 on the total for the previous year. The following table gives details by land districts:—
| Land District (including Interior Boroughs). | Stallions for Stud. | Geldings Two Years Old and Over. | Dry Mares Two Years Old and Over. | Mares with Foal at Foot or to foal this Season. | Fillies under Two Years Old. | Colts or Geldings under Two Years Old. | Other Horses, and Horses unspecified. | Total Horses. |
|---|---|---|---|---|---|---|---|---|
| North Auckland | 183 | 19,294 | 16,055 | 939 | 847 | 1,096 | 1,042 | 39,456 |
| Auckland | 278 | 22,787 | 19,865 | 1,821 | 1,695 | 1,835 | 1,421 | 49,702 |
| Hawke's Bay | 303 | 16,186 | 13,940 | 1,685 | 1,459 | 1,489 | 1,472 | 36,534 |
| Taranaki | 99 | 11,124 | 10,469 | 486 | 513 | 534 | 273 | 23,498 |
| Wellington | 248 | 21,179 | 19,543 | 1,696 | 1,529 | 1,760 | 1,732 | 47,687 |
| Nelson | 27 | 3,713 | 3,773 | 268 | 207 | 254 | 106 | 8,348 |
| Marlborough | 37 | 3,118 | 3,097 | 248 | 273 | 260 | 78 | 7,111 |
| Westland | 15 | 1,263 | 1,169 | 84 | 86 | 101 | 59 | 2,777 |
| Canterbury | 244 | 28,827 | 26,035 | 2,130 | 1,846 | 1,858 | 2,746 | 63,686 |
| Otago | 150 | 16,738 | 15,695 | 1,202 | 1,148 | 1,355 | 2,212 | 38,500 |
| Southland | 90 | 12,968 | 12,780 | 921 | 904 | 898 | 547 | 29,108 |
| Totals | 1,674 | 157,197 | 142,421 | 11,480 | 10,507 | 11,440 | 11,688 | 346,407 |
Additional information in regard to horses over two years old was also collected for the first time in 1919. Horses over two years old were classified in three classes—(1) Draught; (2) spring-cart or light artillery; and (3) light (including thoroughbred and trotting). This information is available only in respect of holdings that are over one acre in extent and that are not situated within borough boundaries. The number of horses included in this classification at the 31st January, 1920, was 300,258, of which 126,554 were draught and 95,100 light, whilst spring-cart or light artillery horses numbered 78,604.
The following table gives details by land districts:—
| HORSES OVER TWO YEARS OLD, 31ST JANUARY, 1920. | ||||
|---|---|---|---|---|
| Land District (excluding Interior Boroughs). | Draught. | Spring-cart or Light Artillery. | Light (including Thoroughbred and Trotting). | Total Horses over Two Years Old. |
| North Auckland | 7,398 | 11,520 | 14,232 | 33,150 |
| Auckland | 14,427 | 14,386 | 14,795 | 43,608 |
| Hawke's Bay | 8,731 | 6,749 | 15,973 | 31,453 |
| Taranaki | 5,175 | 8,864 | 6,960 | 20,999 |
| Wellington | 11,491 | 13,957 | 14,609 | 40,057 |
| Nelson | 2,522 | 2,395 | 1,955 | 6,872 |
| Marlborough | 3,089 | 1,662 | 1,493 | 6,244 |
| Westland | 555 | 949 | 626 | 2,130 |
| Canterbury | 35,446 | 9,178 | 12,125 | 56,749 |
| Otago | 19,977 | 5,645 | 6,865 | 32,487 |
| Southland | 17,743 | 3,299 | 5,467 | 26,509 |
| Totals | 126,554 | 78,604 | 95,100 | 300,258 |
Asses and mules numbered 262 as at the 31st January, 1920, being an decrease of 34 on the figures for 1919.
There were 258,694 pigs in the Dominion on the 31st January, 1918. The following table shows the classification by breeds:—
| Breed. | Boars of All Ages for Stud. | Sows of All Ages used or intended for Breeding. | Other Pigs. | Total Pigs. |
|---|---|---|---|---|
| Pure Berkshire | 3,990 | 13,137 | 49,483 | 66,610 |
| Pure Yorkshire | 552 | 2,064 | 4,600 | 7,216 |
| Other purebred pigs | 219 | 1,115 | 3,066 | 4,400 |
| Crossbred pigs | 1,838 | 16,692 | 156,508 | 175,038 |
| Totals | 6,599 | 33,008 | 213,657 | 253,264 |
| Boroughs | 116 | 632 | 4,682 | 5,430 |
| Grand totals | 6,715 | 33,640 | 218,339 | 258,694 |
As regards the numbers of pigs in recent years, a decrease of 23,347 was recorded between 1918 and 1919, but a recovery of 31,482 was shown between 1919 and 1920. Details by land districts for 1920 are as follow:—
| Land District (including Interior Boroughs). | Boars of All Ages for Stud. | Sows of All Ages used or intended for Breeding. | Other Pigs. | Total Pigs. |
|---|---|---|---|---|
| North Auckland | 1,094 | 5,242 | 29,569 | 35,905 |
| Auckland | 1,538 | 8,206 | 42,679 | 52,423 |
| Hawke's Bay | 423 | 2,386 | 13,249 | 16,058 |
| Taranaki | 1,337 | 6,180 | 34,526 | 42,043 |
| Wellington | 1,184 | 6,929 | 31,638 | 39,751 |
| Nelson | 252 | 1,238 | 7,715 | 9,205 |
| Marlborough | 146 | 770 | 4,900 | 5,816 |
| Westland | 97 | 487 | 2,689 | 3,273 |
| Canterbury | 814 | 4,992 | 35,231 | 41,037 |
| Otago | 335 | 1,670 | 12,123 | 14,128 |
| Southland | 160 | 864 | 6,166 | 7,190 |
| Totals | 7,380 | 38,964 | 220,485 | 266,829 |
During the ten years ended the 31st March, 1920, 1,979,612 pigs were slaughtered in New Zealand for food purposes, the weight of pork, bacons, and hams being 2,296,350 cwt. During this period, roughly, 20,000 cwt. of hams and bacons were exported leaving over 99 per cent. for home consumption.
Figures showing the slaughter for each of the ten years are given below:—
| Year ended 31st March. | Number of Pigs. | Weight of Pork, Bacon, and Hams. |
|---|---|---|
| Cwt. | ||
| 1911 | 163,307 | 189,553 |
| 1912 | 232,091 | 269,391 |
| 1913 | 192,407 | 223,330 |
| 1914 | 191,797 | 222,622 |
| 1915 | 241,683 | 280,525 |
| 1916 | 219,041 | 254,244 |
| 1917 | 202,834 | 235,432 |
| 1918 | 179,540 | 208,395 |
| 1919 | 155,960 | 181,024 |
| 1920 | 200,952 | 233,104 |
The number of Angora goats in the Dominion on the 31st January, 1920, was 5,477, a decrease of 969 since 1919. Other goats decreased by 1,391 during the period, the number in 1920 being 9,087.
The number of poultry in New Zealand at the taking of the 1916 census was ascertained to be 3,468,000, a decrease of 225,137 from the number for the year 1911 (3,693,137).
Details as to kind, age, and sex, and a comparison with previous years, are given below:—
| —– | 1916. | Total, 1916. | Total, 1911. | Total. 1906. | ||
|---|---|---|---|---|---|---|
| Reared in a Previous Season. | Reared in Current Season. | |||||
| Male Birds. | Female Birds. | |||||
| Fowls | 198,056 | 2,308,928 | 634,370 | 3,141,354 | 3,215,031 | 2,784,269 |
| Ducks | 32,907 | 145,399 | 42,502 | 220,808 | 329,230 | 281,999 |
| Turkeys | 13,268 | 37,315 | 5,938 | 56,521 | 97,933 | 77,101 |
| Geese | 9,231 | 20,791 | 16,933 | 46,955 | 45,389 | 44,300 |
| Other poultry | 2,362 | 5,554 | 3,935 | |||
In the North Island 74,848 householders owned 1,866,608 poultry, in the South Island (including Stewart Island and Chatham Islands) the numbers were 59,313 and 1,596,024 respectively, and in other adjacent islands 73 and 3,006. These figures are exclusive of poultry other than fowls, ducks, turkeys, and geese.
Bees were first introduced into New Zealand in 1839, and after early vicissitudes bee-farming has steadily increased. The census returns of 1916 show that there were 8,244 households keeping bees in the Dominion, the number of colonies being 57,540. During 1919 the amount of honey exported was 1,701,801 lb., valued at £59,846.
The Department of Agriculture maintains four apiary instructors and inspectors who give practical instruction in management, preparation of products for market, &. The grading of honey r export is now compulsory.
Regulations have been gazetted under the Apiaries Amendment Act, 1913, requiring all beekeepers to make application to the Director of the Horticulture Division, Department of Agriculture, for registration of their apiaries. Re-registration was to be effected in 1920, and every third year thereafter. In the case of apiaries being established or transferred from one beekeeper to another, application for registration of such establishment or transfer must be made within twenty-one days of such establishment or transfer.
Table of Contents
NEW ZEALAND possesses a large variety of trees in its native forests, there being no fewer than eighty-six different species known to botanists. The majority of these are, unfortunately, through various causes, of little use for commercial purposes to any great extent, and, as a matter of fact, the following trees are practically the staple supply of the timber trade: Kauri, totara, rimu (red-pine), kahikatea (white-pine), matai (black-pine). The puriri, miro, silver-pine, and the various birches (or beeches, as they should be properly designated) are the only other trees which are used to any extent for general purposes.
Most of the indigenous trees suitable for conversion into marketable timber are slow of growth, and the steps that have been taken in regard to New Zealand forests have been in the direction of conserving the existing supply as far as practicable, while allowing sawmilling to proceed under conditions that ensure the greatest possible use being made of the timber.
One of the earlier methods of inducing the planting of suitable trees was by means of “land grants”—a settler being given a free grant of Crown land if he planted a certain portion of his freehold land in suitable trees. Several large plantations may be seen in North Canterbury that were established by means of this method.
In 1896 a Forestry Branch of the Department of Lands was started, and three nurseries were established—two at Tapanui and Ranfurly, in the Otago District of the South Island, and the other at Whakarewarewa, near Rotorua, in the North Island. Later on another nursery was formed at Hanmer, in the Canterbury District (South Island). The establishment of nurseries in certain other localities was also undertaken, but from various causes these other nurseries have been discontinued.
In 1919, however, the urgent needs of the rapidly dwindling forest resources impelled the inauguration of a progressive forest policy. A Department of Forestry was created, and the services of a trained and experienced Director were secured. The establishment will also include qualified research officers, forest inspectors, rangers, &. It is proposed to establish a School of Forestry, which, with the provision of a professorial chair in Forestry at one of the University Colleges, will supply means for the training of students in scientific forestry.
Section 34 of the War Legislation and Statute Law Amendment Act, 1918, confers power upon the Commissioner of State Forests to purchase and hire sawmills and machinery, to cut and sell timber in State forests, and to purchase private lands for addition to or production of State forests. The Governor-General in Council is empowered to set aside by Proclamation any Crown lands as and for “provisional forests.” Up to 31st March, 1920, some 3,311,000 acres of Crown lands and 56,066 acres of national-endowment lands were proclaimed provisional State forests.
During the year ended 31st March, 1920, some 11,724,000 trees were raised in the State nurseries at Rotorua, Tapanui, Ranfurly, and Hanmer Springs.
From the inauguration in 1896 up to March, 1920, State nurseries have raised 116,695,000 trees, of which 95,164,000 were sent to State plantations and 5,642,000 to other places. The total expenditure on nurseries in the same period was £181,239.
In the year 1919-20, 1,952 acres were planted with 2,625,000 trees in State plantations. Some 1,085,500 trees were in addition used to replace losses in areas previously planted.
In March, 1920, the eighteen State plantations had 77,458,500 trees in their 37,110 acres. The largest plantations are situated at Waiotapu, Whakarewarewa, Kaingaroa Plains, Conical Hills, Hanmer Springs, Naseby, and Puhi-puhi. Total expenditure on plantations, 1896–1920, amounted to £333,397. The average cost per acre planted was, in the case of the six largest plantations, approximately £4 7s.
The Commissioner of State Forests, who is the Ministerial head of the Forestry Department, has control over State forests proclaimed under the State Forests Acts, and certain forest reserves made under the Land Act prior to 1885. The total area is approximately 1,660,000 acres, of which about 1,450,000 acres are under forest, but only 365,000 carry kauri, rimu, white-pine, matai, totara, or miro in sufficient quantity to be of any commercial value at the present time.
In addition to this total is the 3,367,000 acres of proclaimed “provisional” State forest lands mentioned previously.
National-endowment lands are forest-clad to the extent of 2,200,000 acres, about 400,000 acres of this area being milling forest. Reserves under the Land Act, Public Works and other Acts carry 370,000 acres of forest. Only 37,000 acres of this is classed as milling forest. Scenic reserves carry much valuable timber, but, of course, it is highly desirable to preserve this in its natural state. National parks contain a large area under forest, mostly of poor milling quality.
The total area of forest now owned by the State is about 10,500,000 acres, but of this area the total area of forest at present of milling value is approximately only 1,370,000 acres, and a portion of this is already subject to milling licenses. As the area of the whole Dominion is sixty-six million acres, it will be seen that the total area of forest still owned by the State is less than 16 per cent. of the total, whilst the area of milling forest owned by the State is only 2.08 per cent. It may be concluded that most of the forest on private and Native lands (of which there is no information as regards the forest area) will be cut down in a few years’ time.
The Government's proposal to assist farmers in tree-planting was authorized by section 69 of the Reserves and other Lands Disposal and Public Bodies Empowering Act, 1915, and the sum of £1,000 was voted by Parliament to cover expenses in connection with raising and supplying the trees.
The total number of trees disposed of to farmers and local bodies during the year was 256,714.
Returns collected in 1919 show that the total area of plantations belonging to farmers was 48,981 acres.
Information supplied by the Board of Trade shows that the total output of all timbers during the year 1919-20 was, in superficial feet, as follows: Rimu; 145,584,203; white-pine, 82,419,821; kauri, 22,598,391; totara, 14,414,298; matai, 17,820,597; beech, 9,650,344; taraire, 174,650; pukatea, 200,000; tanekaha, 54,238; silver-pine, 50,000; blue-gum, 80,000; kahikawaka, 50,000; Pinus insignis, 3,064,201: or a total of all kinds of 296,165,080 superficial feet.
The Dominion's timber-production is at present more than sufficient for home requirements. A considerable quantity of Oregon pine and Australian hardwoods is imported, but is more than balanced by a much larger export, principally of white-pine, rimu, and kauri. During the year ended 31st March, 1920, some 16,867,642 superficial feet of timber, valued at £278,273, was imported. The chief varieties were: Oregon pine (sawn, rough), 2,889,801 superficial feet, value £26,982; ironbark (logs and sawn timber), 3,101,575 superficial feet, value £58,398; and jarrah (logs and sawn timber), 4,199,964 superficial feet, value £49,610. Exports amounted to 53,725,002 superficial feet, of a value of £484,945, including white-pine, 34,827,162 superficial feet (£317,150); rimu, 12,125,889 superficial feet (£96,135): and kauri, 3,719,610 superficial feet (£45,763).
Table of Contents
UP to the present time New Zealand's fisheries can scarcely be said to have attained to national importance. With a few exceptions, the fishing-grounds so far worked have been those within easy reach of the principal centres. Beyond them is an immense extent of grounds, a few sections of which have been partly prospected, but of the greater part practically nothing is known regarding the value and extent of its fish-supply.
A site for a marine fish-hatchery was selected at Purakanui, Otago, in 1900, but this being found unsuitable for its intended purpose, another site was chosen at Portobello, in Otago Harbour. The erection of the hatchery was carried out by a Board set up to superintend the work of the hatchery, funds being provided by the State, and grants being made by a number of societies. The State makes an annual grant towards the maintenance of the hatchery.
Prior to the war experiments were carried out with a view to introducing English food-fishes to New Zealand waters, and these are believed to have been fairly successful as regards the three species dealt with so far—viz., lobsters, edible crabs, and turbot. Much valuable work has also been done in the direction of hatching the spawn of various indigenous fishes and in making a study of their life habits.
The principal oyster-beds round the coast of New Zealand are those situated in Foveaux Strait, between South and Stewart Islands, and the rock-oyster beds on the east and west coasts of the Auckland peninsula. The Foveaux Strait beds are very extensive. During the 1919 season 21,394 sacks of oysters, valued at £13,371, were picked from these beds.
A step towards conserving the rock-oyster beds of Auckland was taken in 1908, when the picking of rock-oysters from the North Island beds was undertaken by the State, private picking being prohibited. A table is given showing the quantity and value of oysters picked and sold by the State during each of the last five years.
| Season. | Oysters sold. | Prices realized. | Cost of Picking and Selling. |
|---|---|---|---|
| Sacks. | £ | £ | |
| 1915 | 9,396 | 6,715 | 5,475 |
| 1916 | 8,172 | 5,693 | 4,282 |
| 1917 | 10,357 | 6,890 | 5,819 |
| 1918 | 10,422 | 7,517 | 6,822 |
| 1919 | 7,256 | 5,331 |
Most of the rock-oysters are marketed in Auckland, the price per sack charged there last season being 13s. 6d. Parcels of four and one-half dozen are sold at 1s., and parcels of sixteen dozen at 3s. 6d.
Various attempts were made about fifteen years ago to form artificial oyster-beds, but none of these met with success. A further attempt to plant rock-oysters in the Marlborough Sounds has been made, and, so far as can be seen, this has resulted successfully.
In the earlier part of the nineteenth century New Zealand was the centre of an important whale-fishery, many whaling-stations being established in the North of Auckland and in Cook and Foveaux Straits. The industry gradually declined in importance until at present only two or three stations remain. The whales caught are almost all of the hump-back variety. At Whangamumu, North Auckland, a whaling-steamer, fitted with the most modern appliances for killing and handling whales, has been placed in commission, and a very serviceable whaling plant has been established. Sixty-one were taken last season in this locality, yielding 300 tons of oil and 56 tons of bonedust, of a total value of £10,300. Whaling operations are also carried on from Kaikoura and Tory Channel, in Marlborough. The value of the product of the Marlborough whale-fisheries in 1919 (275 tons of oil) was £9,345, the number of whales caught being fifty-eight.
A close season for seals existed in New Zealand from the end of August, 1894, until 1913, but owing to poaching, which it was found impossible to stop, the seals did not increase to any great extent. It was proposed a few years ago to grant licenses for the right to take seals, one of the conditions of which was that a royalty should be paid on each skin. Tenders were invited for the licenses, but none were received. At present the taking of seals is prohibited.
As early as 1867 attempts were made to introduce English brown trout into New Zealand. The first attempt was not successful, but from ova imported in the two following years and hatched at Opoho the bulk of the trout now inhabiting the streams and lakes of the Dominion have descended. In later years Loch Leven and Scottish brown trout were introduced, as also rainbow trout, perch, carp, and tench.
Various attempts were made to introduce Atlantic salmon, sockeye salmon, quinnat salmon, and whitefish into New Zealand. Quinnat salmon proved the most successful, and they are now firmly established as an adjunct to the Dominion's fresh-water fisheries. The fish have now extended along the east coast as far as the Waiau-ua River in the north and the Taieri in the south.
Very fine trout-fishing is obtained in New Zealand, especially in the lakes of the North Island. Under the direction of the Conservator of Fish and Game, operations are carried out in the Taupo and Rotorua districts with a view to the improvement of fishing generally. Special attention is given to the destruction of ill-conditioned fish, the destruction of shags, the study of the habits of the fish, procuring of fresh food-supplies, &.
Trout from Lakes Taupo, Rotorua, and Roto-iti are now marketed by the Government. In the 1919-20 season, which was from varying causes a particularly bad one, some 16 1/2 tons of fresh and 3 1/4 tons of smoked trout were disposed of.
A fish-hatchery is also maintained in this district, and in the last year 1,475,000 rainbow-trout ova and 578,000 fry were liberated in the rivers and lakes of the North.
Municipal fish-markets have been established at Wellington and Auckland with a view to bringing the fisherman and the public into closer contact, and enabling the former to dispose of his catch at a figure which ensures a good return to himself and is reasonable from the point of view of the public.
The market is under the management of a Markets Committee appointed by the City Council. The office and premises are situate at Hobson Street Wharf, where the two Municipal trawlers discharge their loads of fish. Two motor-lorries are engaged delivering the fish to the various hotels and fish-shops in Auckland City and suburbs, while an increasing trade is also being done with country districts. At the market facilities are provided for handling and treating fish, and for the performance of necessary work in connection with the industry.
The market is open from 6 a.m. to 5 p.m. daily, and a night staff is provided for receiving, cleaning, and smoking fish for the next day's business. The sales at the wholesale market for the year ended 31st March, 1920, totalled £21,763. In addition, at the retail premises in Queen Street, conducted by a manager, four salesmen, cashier, and oyster-opener, the turnover was £14,390.
The quantity of fish brought in by the Municipal trawlers (including one under contract) was 23,727 baskets (100 lb. each) of mixed fish, largely snapper.
The registration and licensing of fishing-boats and of boats engaged in taking oysters was made compulsory in July, 1904. A table is appended showing the number licensed, and the number of fishermen employed, at the various ports of the Dominion.
| Name of Port. | Number of Fishing-vessels. | Number of Fishermen employed. |
|---|---|---|
* One hundred of these employed whitebaiting without boats. | ||
| Hokianga | 9 | 15 |
| Russell | 42 | 90 |
| Whangarei | 10 | 15 |
| Kaipara | 27 | 45 |
| Auckland | 26 | 84 |
| Thames | 60 | 50 |
| Tauranga | 29 | 20 |
| Gisborne | 26 | 51 |
| Napier | 73 | 140 |
| New Plymouth | 34 | 58 |
| Wanganui | 17 | 18 |
| Foxton | 13 | 13 |
| Wellington | 86 | 208 |
| Picton | 18 | 25 |
| Blenheim | 10 | 16 |
| Nelson | 62 | 20 |
| Westport | 14 | 10 |
| Greymouth | 14 | 22 |
| Hokitika | 3 | 104* |
| Kaikoura | 23 | 48 |
| Rangiora | 18 | 22 |
| Lyttelton and Sumner | 17 | 25 |
| Akaroa | 13 | 26 |
| Southbridge | 24 | 30 |
| Kaiapoi and Styx | 24 | 24 |
| Timaru | 20 | 32 |
| Oamaru | 9 | 13 |
| Moeraki | 25 | 34 |
| Dunedin and Port Chalmers | 83 | 149 |
| Invercargill | 4 | 6 |
| Bluff | 57 | 100 |
| Stewart Island | 25 | 51 |
| Chatham Islands | 13 | 14 |
| Totals | 928 | 1,588 |
Provision exists in the Fisheries Act, 1908, whereby owners of boats and fish-curers may be required to make returns to the Marine Department in such form and in such manner as may be prescribed by the Governor-General in Council, but advantage of this provision has not yet been taken to enable information to be collected as to quantity of fish caught.
A table has been compiled by the Chief Inspector of Fisheries showing the various kinds of fish caught and the approximate quantity and value of fish landed at the different fishing-ports for the year ended 31st March, 1920. The figures are as follows:—
| Port. | Kinds of Fish caught. | Quantity. | Total Value. |
|---|---|---|---|
* Sacks. † Dozen. | |||
| Cwt. | £ | ||
| Hokianga | Mullet, snapper, flounder, and kahawai | Not supplied. | |
| Russell | Mullet, snapper, flounder, hapuku, kingfish, tarakihi, and kahawai | 3,450 | 3,100 |
| Whangarei | Snapper, mullet, flounder, hapuku, and red cod | 800 | 1,500 |
| Kaipara | Mullet, flounder, snapper, trevally, and gurnard | 8,220 | 9,736 |
| Auckland | Snapper, flounder, mullet, trevally, kahawai, john-dory, gurnard, kingfish, and hapuku | 63,400 | 80,413 |
| Thames | Snapper, flounder, sole, kahawai, garfish, and crayfish | 17,136 | 20,392 |
| Tauranga | Snapper, hapuku, trevally, kahawai, rock cod, garfish, herring, kingfish, flounder, and crayfish | 120 | 250 |
| Gisborne | Tarakihi, snapper, sole, and flounder | 2,169 | 5,160 |
| Napier | Sole, flounder, brill, snapper, gurnard, butterfish, hapuku, moki, trumpeter, ling, barracouta, kingfish, trevally, warehou, and crayfish | 17.479 | 30,036 |
| Crayfish, cockle, and pipi | 750* | 900 | |
| New Plymouth | Snapper, hapuku, blue cod, flounder, ling, gurnard, kahawai, herring, and crayfish | 200 | 175 |
| Wanganui | Blue cod, hapuku, snapper, flounder, kahawai, mullet, barracouta, and gurnard | 375 | 850 |
| Foxton | Flounder, snapper, and whitebait | 200 | 560 |
| Wellington | Snapper, hapuku, hake, kingfish, warehou, moki, tarakihi, gurnard, butterfish, blue cod, kahawai, flounder, sole, and crayfish | 17,100 | 23,940 |
| Picton | Groper, moki, barracouta, flounder, sole, brill, herring, trevally, kingfish, blue cod, red cod, snapper, butterfish, ling, tarakihi, warehou, gurnard, kahawai, and crayfish | 2,100 | 2,600 |
| Blenheim | Blue cod, rock-cod, red cod, snapper, garfish, moki, ling, flounder, sole, tarakihi, butterfish, kahawai, groper, whitebait, and crayfish | 530 | 800 |
| Nelson | Snapper, flounder, sole, moki, butterfish, blue cod, gurnard, and kahawai | 820 | 935 |
| Crayfish | 300† | ||
| Westport | Snapper, blue cod, kahawai, herring, flounder, sole, hapuku, crayfish, and whitebait | 1,456 | 3,636 |
| Greymouth | Sole, hapuku, red cod, snapper, flounder, and whitebait | 124 | 241 |
| Hokitika | Whitebait, herring, kahawai, flounder, mackerel, and snapper | 895 1/2 | 4,185 |
| Kaikoura | Groper, trumpeter, kingfish, ling, butterfish, and blue cod | 7,232 | 14,000 |
| Rangiora | Whitebait, flounder, herring, and red cod | 95 1/2 | 1,093 |
| Lyttelton and Sumner | Groper, ling, red cod, conger-eel, flounder, sole, trevally, herring, garfish, butterfish, moki, and barracouta | 9,500 | 13,300 |
| Akaroa | Groper, blue cod, red cod, trevally, moki, butterfish, flounder, sole, ling, tarakihi, and barracouta | 3,900 | 5,380 |
| Crayfish | 400* | ||
| Southbridge | Flounder, herring, and red cod | 4,159 | 5,823 |
| Kaiapoi and Styx | Whitebait and flounder | 340 | 2,000 |
| Timaru | Groper, sole, flounder, brill, ling, red cod, barracouta, and gurnard | 3,000 | 6,100 |
| Oamaru | Groper, red cod, blue cod, moki, warehou, barracouta, ling, flounder, and gurnard | 3,274 | 2,882 |
| Moeraki | Groper, red cod, blue cod, moki, warehou, barracouta, and ling | 3,095 | 3,592 |
| Crayfish | 248* | ||
| Dunedin and Port Chalmers | Groper, kingfish, ling, barracouta, blue cod, red cod, moki, trumpeter, bream, tarakihi, trevally, mullet, garfish, kahawai, gurnard, sole, flounder, brill, and skate | 40,980 | 49,176 |
| Invercargill | Flounder, mullet, red cod, trout, and whitebait | 1,033 | 1,434 |
| Bluff | Blue cod, red cod, groper, flounder, trevally, and moki | 6,587 | 12,997 |
| Stewart Island | Blue cod, trevally, trumpeter, groper, and moki | 3,891 1/2 | 5,155 |
| Chatham Islands | Blue cod, and hapuku | 3,148 1/2 | 2,863 |
| Totals | 219,392 | 315,205 | |
In addition, the produce of the oyster-fisheries was valued at £18,702, and of the whale-fisheries at £19,645.
Included in New Zealand produce exported during the past five years were,—
| Item. | 1915. | 1916. | 1917. | 1918. | 1919. |
|---|---|---|---|---|---|
| £ | £ | £ | £ | £ | |
| Fish | 37,166 | 37,475 | 23,818 | 19,202 | 17,377 |
| Oysters | 2,057 | 1.340 | 244 | 1,114 | 342 |
| Whalebone | 250 | 280 | |||
| Whale-oil | 3.011 | 1 647 | 5,511 | 12,618 | 22,908 |
| Other products of fisheries | 2,412 | 1,751 | 201 | 25 | |
| Totals | 44.896 | 42,493 | 29,774 | 32,959 | 40,627 |
The value of fish imported in 1919 was £121,599.
Table of Contents
NEW ZEALAND has been described by an eminent geologist as a mineralized rather than a mineral country, for although in no other country of equal size are indications of a greater number of economic minerals to be found, yet, with the exception perhaps of iron-ore, the known mineral reserves are not great in comparison with those in many other countries, and the value of our mineral production is incomparable with that of our pastoral products. The life of our coalfields has been estimated by the Director of Geological Survey at under one hundred years. However, in the almost unrivalled resources of water-power from our mountain rivers and streams suitable for the production of hydro-electric power New Zealand possesses an inexhaustible resource of continuously increasing value, which will be still available when the coalfields of the world are exhausted.
The gold-mining industry, which in its early stages contributed greatly to the progress and settlement of New Zealand, has for a number of years continued to decline in importance, in common with most other gold-producing countries. The causes of such decline are found in the approaching exhaustion of the most accessible known alluvial-gold deposits, the exhaustion of ore from the zones of secondary enrichment, and the increased cost of material and labour.
The quantities and values of metals and minerals entered for exportation, also the coal-output during the years 1918 and 1919, and the total value since 1853, are,—
| 1919. | 1918. | Total Value since 1853. | |||
|---|---|---|---|---|---|
| Oz. | £ | Oz. | £ | £ | |
| Gold | 320,210 | 1,334,405 | 11,987 | 42,391 | 88,128,359 |
| Silver | 453,567 | 103,037 | 879,383 | 171,456 | 2,561,285 |
| Tons. | Tons. | ||||
| Quicksilver | 8 3/5 | 4,619 | 4 1/2 | 2,122 | 6,741 |
| Copper-ore | 12 | 6 | 19,390 | ||
| Chrome-ore | 38,002 | ||||
| Antimony-ore | 13 | 104 | 55,045 | ||
| Manganese-ore | 61,905 | ||||
| Hæmatite ore | 469 | ||||
| Tungsten-ore | 131 | 29,489 | 169 13/20 | 37,922 | 297,933 |
| Sulphur (crude) | 13,241 | ||||
| Mixed minerals | 1,090 | 4,039 | 2,286 3/4 | 5,772 | 241,367 |
| Coal | 1,847,848 | 2,693,163 | 2,034,250 | 2,530,677 | 30,284,646 |
| Kauri-gum | 4,128 | 255,812 | 2,419 | 157,313 | 18,581,064 |
| Shale | 7,236 | ||||
| Coke | 45 | 113 | 70 | 146 | 25,625 |
From 1st January, 1853, to 31st December, 1919, the value of the mineral production of the Dominion is estimated by the Mines Department at £140,322,308, of which the precious metals, gold and silver, claim £90,689,644.
Gold-mining operations in New Zealand are divided into three branches, viz.: (1) Quartz-mining, (2) alluvial mining, and (3) dredging.
| — | Production of Bullion (all Mines). | Dividends paid (by Registered Companies only). | Number of Persons ordinarily employed. | Number of productive Mines and Dredges. | ||
|---|---|---|---|---|---|---|
| 1919. | 1918. | 1919. | 1918. | 1919. | 1919. | |
| £ | £ | £ | £ | |||
| Quartz-mining | 574,021 | 743,731 | 118,831 | 193,519 | 1,423 | 37 |
| Dredges | 47,838 | 63,691 | 2,845 | 4,925 | 138 | 19 |
| Alluvial mining | 80,273 | 78,895 | 2,068 | 4,953 | 432 | 131 |
| Totals | 702,132 | 880,317 | 123,744 | 203,397 | 1,993 | 187 |
As regards dredges and alluvial mining, the bullion-production is from all dredges and claims, whereas the dividends paid are only obtainable from those few which are owned by registered companies.
The most important gold-mining operations in New Zealand consist in the working of quartz lodes and the extraction of the precious metals therefrom. Quartz-mining is conducted in the North Island in the Ohinemuri County, and to a less extent in the Thames and Coromandel Counties. The mountain ranges and hills of andesite and other volcanic rocks which form the Hauraki Goldfields are intersected by lodes containing gold and silver. In the South Island quartz-mining operations are carried on in the Reefton and Blackwater districts, also to a small extent in the Wakamarina Valley (Marlborough). In Otago the only quartz-mining operations of importance are in connection with the working of quartz-mines in which scheelite is associated with gold.
Alluvial gold is found chiefly on the west coast of the South Island and in Otago, where mining operations have been conducted over an area of 17,000 square miles.
This system of gold - mining, which originated in New Zealand, is rapidly declining in importance, the number of productive dredges having decreased from 167 during 1906 to nineteen during 1919. Gold-dredging is at present confined to Otago, Southland, and Westland.
The value of the gold-yield of Australia and New Zealand is quoted in the next table:—
| 1900. | 1905. | 1910. | 1915. | 1917. | Total to End of 1917. | |
|---|---|---|---|---|---|---|
* Thousands omitted; figures are given to nearest £1,000. | ||||||
| £* | £* | £* | £* | £* | £* | |
| New South Wales | 1,071 | 1,165 | 802 | 563 | 349 | 61,999 |
| Victoria | 3,230 | 3,174 | 2,423 | 1,398 | 857 | 298,652 |
| Queensland | 2,871 | 2,517 | 1,875 | 1,060 | 761 | 82,112 |
| South Australia | 82 | 97 | 54 | 30 | 34 | 3,799 |
| West Australia | 6,008 | 8,306 | 6,247 | 5,140 | 4,122 | 133,888 |
| Tasmania | 316 | 312 | 157 | 79 | 62 | 8,674 |
| New Zealand | 1,440 | 2,094 | 1,896 | 1,695 | 904 | 86,752 |
| Totals | 15,018 | 17,665 | 13,454 | 9,965 | 7,089 | 675,876 |
The following figures showing the world's gold-production are taken from the Statistical Abstract of the United States:—
| Year. | Fine Ounces. |
|---|---|
| 1899 | 14,837,775 |
| 1900 | 12,315,135 |
| 1901 | 12,625,527 |
| 1902 | 14,354,680 |
| 1903 | 15,852,620 |
| 1904 | 16,804,372 |
| 1905 | 18,396,451 |
| 1906 | 19,471,080 |
| 1907 | 19,977,260 |
| 1908 | 21,422,244 |
| 1909 | 21,965,111 |
| 1910 | 22,022,180 |
| 1911 | 22,348,313 |
| 1912 | 22,549,335 |
| 1913 | 22,249,596 |
| 1914 | 21,240,416 |
| 1915 | 22,674,568 |
| 1916 | 21,970,788 |
| 1917 | 20,289,456 |
| 1918 | 18,427,232 |
Nearly the whole of the silver-production of New Zealand, amounting in value at the end of 1919 to £2,561,285, was obtained from the refinement of bullion from the quartz-mines, principally from those of the Hauraki Goldfield, where the two precious metals are found alloyed as an electrum, the ratio of the two metals in the alloy varying greatly. No other silver-mining operations have been carried out profitably in this country.
Iron-ore occurs in New Zealand at Parapara, Golden Bay; on the seashore in Taranaki; at Kerr Point and Waitangi River, North Auckland; in the Raglan Kawhia district; on Mount Peel, Nelson; on Mount Royal, near Palmerston North; on Table Hill, near Milton; in the Lake Wakatipu district; and in the Mount Cook district, Westland.
The most extensive iron-ore deposits occur at Parapara, Golden Bay, in the Nelson Province, where it is estimated that the amount of limonite-ore on the surface exceeds 63,000,000 tons; but in the absence of any thorough system of prospecting this estimate must be regarded as inconclusive.
Samples of outcrop ore taken from the Parapara deposit some years ago were found to contain 51.38 per cent. of metallic iron. By means of prospecting-drives during 1913 more definite information concerning the ore was obtained, and the samples analysed showed the percentage of metallic iron to be 45.02.
Along the seashore from Patea to New Plymouth occur large quantities of magnetic ironsand more or less titaniferous. This has originated through the disintegration of hornblende-andesites and their tufas, which occur very extensively near New Plymouth around the volcanic cone of Mount Egmont. It is quite impossible to give any definite idea of the quantity of this ironsand; undoubtedly, however, it exists in immense quantities, and is measurable in millions of tons.
The most extensive deposit of ironsand occurs near Patea, the quantity of which has been estimated to be at least 5,374,000 tons of high-grade ore in addition to a great quantity of low-grade ironsand.
At Kerr Point the deposit of iron-ore consists of limonite, but does not probably exceed 100,000 tons. The iron-ore near the head of the Waitangi River is also limonite of excellent quality, but does not exceed 100,000 tons. The limonite deposits in the Kawhia-Raglan district and on Table Hill, so far as known, are not large. Little authentic information exists concerning the iron-ore deposits at Mount Peel or at Mount Royal. In the Lake Wakatipu district from Moke Creek, through Benmore in the direction of Mount Gilbert, a band of hæmatite has been reported to occur, also at Maori Point, Shotover River. On the Westland side of Mount Cook large quantities of magnetite are disseminated through chlorite schist.
Scheelite, one of the principal ores of tungsten, is mined at the goldscheelite-quartz mines near Glenorchy, Paradise, Macrae's, Stoneburn, Hyde, and Barewood, Otago; also at Wakamarina Valley, Marlborough; at which places milling and concentrating plants have been installed.
The quantity of tungsten-ore exported during 1919 amounted to 131 tons, valued at £29,489, as compared with 169 tons, valued at £37,922, in 1918.
Ores of copper are found in New Zealand in no fewer than thirty-two localities, but during the past fifty years attempts at their successful exploitation have been unprofitable, the total recorded copper-production at the end of 1919 amounting in value to only £19,390. Prior to the inauguration of systematic records there was a considerable production from mines on Great Barrier and Kawau Islands.
Copper-mines have also been worked on the Dun Mountain, near Nelson. Underground prospecting has been carried on near Kaeo, Whangaroa; at Maharahara, near Woodville; and at Mount Radiant, near Karamea; but no conclusive results have been obtained.
Manganese-ore has been found at Otau, Wairoa, Bay of Islands, Purua Bay, Mangapai, Otonga, Waiheke Island, and Taieri Mouth. The total quantity of manganese-ore exported to the end of 1919 amounted to 19,364 tons, value £61,905.
After several unsuccessful attempts, extending over a number of years, to work our cinnabar-deposits in the Auckland Province, satisfactory and profitable results have been obtained by the New Zealand Quicksilver-mines (Limited), whose mine and furnace are situated at Puhipuhi, about twenty-eight miles by road from Whangarei. This company produced in 1919 11,175 lb. of quicksilver, valued at £2,794. It is hoped that this branch of mining will show considerable expansion.
For the purpose of encouraging the cinnabar-mining industry the Government on the 1st August, 1917, published in the New Zealand Gazette a notice that, subject to certain conditions, a bonus of 4d. per pound would be paid on the first 100,000 lb. of marketable quicksilver produced in New Zealand.
Cassiterite in the form of “stream-tin” occurs near Port Pegasus. Stewart Island, where it has been worked to some extent. “Lode-tin” has been found in the same locality, and is now being prospected. Small quantities of cassiterite have also been detected in the stream-gravels of the Reefton, Greymouth, and Westport districts. Among other localities in which traces of tin occur are Wet Jacket Arm (Otago) and Campbell Island.
In the published lists of minerals of New Zealand platinum is stated to occur in several places associated generally with gold in gravel. It is only from Southland, however, that platinum has been mined and exported. No record is available of the amount produced to date.
Native sulphur in sufficient quantity to be profitably worked is known to occur only in the thermal districts of the North Island, near Rotorua and Lake Taupo, and at White Island. With the exception of the small lake deposit on White Island, all the known native sulphur in payable quantity occurs in the form of pockets in pumice, or sinter around fumaroles or thermal springs (from which it has been sublimed in crystalline form), and as black sulphur. The small quantity of sulphur now extracted is used in the chemical works of the Dominion.
Coal, varying in grade from anthracite to lignite, occurs in many parts of New Zealand. In proportion to the present yearly consumption of somewhat under 2,500,000 tons (10 to 15 per cent. of which is in normal times imported), the supply may be considered relatively large, but in comparison with probable future needs it is decidedly small. It is likely, indeed, that the proved coal resources of the Dominion will be practically exhausted within a hundred years.
The following is an estimate of the proved and probable coal in New Zealand by the Director of the Geological Survey of New Zealand:—
| Class of Coal. | Proved. | Probable. | Possible. |
|---|---|---|---|
| Imperial Tons. | Imperial Tons. | ||
| Anthracite | Very little | Very little | Small. |
| Bituminous | 187,000,000 | 477,000,000 | Moderate. |
| Semi-bituminous | 68,000,000 | 196,000,000 | Moderate. |
| Brown | 194,000,000 | 728,000,000 | Large. |
| Lignite | 161,000,000 | 420,000,000 | Large. |
| Totals | 610,000,000 | 1,821,000,000 | Large. |
The output of coal in each inspection district may be summarized as follows:—
| Class of Coal. | Output of Coal during 1919. | Total Output to End of 1919. | |||
|---|---|---|---|---|---|
| Northern District. | West Coast District. | Southern District. | Total. | ||
| Tons. | Tons. | Tons. | Tons. | Tons. | |
| Bituminous and semi-bituminous | 115,390 | 845,717 | 961,107 | 32,132,112 | |
| Brown | 393,841 | 109 | 290,381 | 684,331 | 15,164,488 |
| Lignite | 2,220 | 200,190 | 202,410 | 2,744,088 | |
| Totals for 1919 | 511,451 | 845,826 | 490,571 | 1,847,848 | 50,040,688 |
| Totals for 1918 | 549,778 | 997,089 | 487,383 | 2,034,250 | 48,192,840 |
The following statement shows the tons of coal and shale raised persons employed, lives lost by accidents in or about coal-mines, &.:—
| Year. | Output. | Persons employed above and below Ground. | Tons raised per each Person employed Underground. | Lives lost. | ||
|---|---|---|---|---|---|---|
| Per Million Tons raised. | Per Thousand Persons employed. | Number by Accident. | ||||
* All the principal collieries were rendered idle by the strike during November and December. † Year of Ralph's (Huntly) explosion. | ||||||
| 1910 | 2,197,362 | 4,599 | 634 | 7.28 | 3.55 | 16 |
| 1911 | 2,066,073 | 4,290 | 706 | 6.77 | 3.26 | 14 |
| 1912 | 2,177,615 | 4,328 | 681 | 4.13 | 2.08 | 9 |
| 1913* | 1,888,005 | 4,250 | 590 | 3.18 | 1.38 | 6 |
| 1914 | 2,275,614 | 4,734 | 639 | 21.53 | 10.35 | 49† |
| 1915 | 2,208,624 | 4,156 | 711 | 4.07 | 2.16 | 9 |
| 1916 | 2,257,135 | 3,988 | 750 | 2.65 | 1.50 | 6 |
| 1917 | 2,068,419 | 3,983 | 715 | 1.93 | 1.00 | 4 |
| 1918 | 2,034,250 | 3,994 | 703 | 2.95 | 1.50 | 6 |
| 1919 | 1,847,848 | 3,944 | 648 | 5.41 | 2.53 | 10 |
The decline in the annual output for 1919 amounts to over 9 per cent. from even the low output of 1918.
The annual report for the year 1919 of the Inspecting Engineer of Mines states:—
“The decline in the annual output was chiefly due to restriction of work by miners at the principal collieries. The output per person employed below ground has declined from 750 tons during 1916 to 648 tons during 1919.
“The number of operative collieries was 138, of which the 16 most productive won 1,375,789 tons, being an average of 641 tons per person employed below ground; the 122 smaller collieries, where little or no restriction occurred, produced 472,059 tons, being an average of 671 tons per person employed below ground. As the principal collieries are better developed and equipped for a larger production per miner than are the smaller collieries, the fact that the latter have produced more coal per miner during 1919 appears to be conclusive evidence as to the chief cause of the decline of coal-output for the Dominion.”
The gross capital expenditure on the State coal-mines up to the 31st March, 1920, amounted to £446,700, and no less than £231,340 of this amount has now been written off out of profits for depreciation, &. The present net book value of permanent or fixed assets is £209,106.
Owing to the approaching exhaustion of the present Point Elizabeth State Mine it has become necessary to secure another suitable colliery to take its place.
An area of coal-bearing land at Waikokowai, in the Waikato district, has recently been purchased by the Government for the establishment of a State colliery, which it is proposed to develop forthwith.
A valuable extension of the Point Elizabeth coal-measure has recently been proved in the low coastal hills to the north of the Point Elizabeth Colliery towards Nine-mile Creek. This area also is now being developed for a State colliery. The coal-seam has been proved by boring to cover an area of at least 250 acres, and averages 8ft. in thickness, and is probably identical with that mined at Point Elizabeth.
The output from the Point Elizabeth and Liverpool State collieries during 1919 was 45,885 tons and 121,710 tons respectively. The Point Elizabeth Colliery was finally closed in March, 1920, having yielded since its inception a gross total of 2,453,884 tons. The State coal business during the financial year 1919–20 resulted in a profit of £21 as compared with £30,607 in the previous year.
Drilling for petroleum has been carried on in Taranaki, Hawke's Bay, Canterbury, and Westland. Petroleum of good quality but in limited quantity has been proved at Moturoa, but up to the present time boring for petroleum in the Dominion has only attained a small and intermittent flow.
Oil-prospecting operations throughout the Dominion have received very liberal financial assistance from the Government in the forms of bonus, subsidies, and loans.
During 1919 4,128 tons of kauri-gum, valued at £255,812, were exported, the total quantity and value of gum exported to the end of 1919 being respectively 360,420 tons, and £18,581,064.
Since 1917 progress has been made in the development of the kauri-peat oil-extraction. Plants are being installed by two companies—viz., the New Zealand Peat-oils Company (Limited), who propose to operate on 3,000 acres at Kaimaumau, north of Mangonui, and by the Parenga Gumfields (Limited), who will shortly commence operations at Redhill, Northern Wairoa, upon 6,000 acres. It is proposed to refine from the crude oil motor-spirit (benzine), paint-oil, and varnish-oils, with the residuum pitch.
Two new processes—viz., the “salt vacuum” and “sand-blast”—for treating small and large pieces of gum respectively will also, it is hoped, tend to the recrudescence of the kauri-gum industry.
The European market for this fossil resin—used in the manufacture of varnish and linoleum—being greatly restricted by the present war, new but smaller markets have been obtained. The Kauri-gum Industry Act, 1914, providing for State purchase of gum from diggers and the disposal of the gum, has served a useful purpose in enabling the industry to keep going in spite of the disorganization occasioned by the war.
Deposits of phosphate rock occur in many parts of the Dominion. From a commercial standpoint the only good area known is that at Clarendon, Otago, where 116,522 tons were produced to the end of 1919, the output for the last year being 4,000 tons.
The mineral nephrite, the “pounamu” of the Maori, more popularly known as one of the varieties of “greenstone,” whenever observed in situ, occurs as rounded segregations in tale or tale-serpentine rocks. So far as known, the mineral has only been found in its original locus in the Griffin Range, Turiwhate Survey District, North Westland.
New Zealand possesses a great variety of handsome and durable building-stones scattered throughout both Islands. In Auckland there is basalt, andesite, porphyrite, and quartz biotite-diorite, known in the building trade as Coromandel “granite,” a hard, coarsely crystalline rock capable of taking a fine polish. Besides these rocks are the Whangarei limestone and Raglan stone, the former an excellent building-stone, the latter a good freestone. Taranaki has the hornblende andesites of New Plymouth and Mount Egmont, and Wellington the andesites of Ruapehu.
In Nelson there is the granite of Tata Island and Tonga Bay and the marble and crystalline limestones of the Pikikiruna (Riwaka) Range. Marble of fine quality from a quarry on the last-named range is now being used for the new Parliamentary Buildings at Wellington. West Nelson and Westland are well provided with granites and limestones of good quality, well adapted for building purposes; and in the Griffin Range, North Westland, there is found an abundance of finely coloured serpentine, unsurpassed as a decorative stone. Building-stone is scarce in Marlborough, but Canterbury is well supplied, having an abundance of Lyttelton bluestone (andesite) and Mount Somers stone, a limestone of exceptional quality. In Otago there is an abundance of excellent building-stone, ranging from the well-known Oamaru stone to the granite, gneiss, and limestones of Fiordland, all close to deep water. In Southland there is the so-called Ruapuke “granite,” the norite of the Bluff, and the granites of Stewart Island.
In 1919 219 quarries were working under the Stone-quarries Act. Some 1,409 persons were ordinarily employed in these quarries, and the output was 1,056,239 tons, of which building-stone amounted to 27,051 tons.
The number of fatal accidents in or about the mines and quarries of the Dominion is low, and compares favourably with other countries.
| Year. | Coal-mines. | Metal Mines. | Stone-quarries (under Act). | |||
|---|---|---|---|---|---|---|
| Number of Deaths. | Proportion per 1,000 Persons employed. | Number of Deaths. | Proportion per 1,000 Persons employed. | Number of Deaths. | Proportion per 1,000 Persons employed. | |
| 1915 | 9 | 2.16 | 10 | 2.38 | 2 | 1.27 |
| 1916 | 6 | 1.50 | 9 | 2.42 | 2 | 1.23 |
| 1917 | 4 | 1.00 | 7 | 2.03 | 2 | 2.00 |
| 1918 | 6 | 1.50 | 2 | 0.77 | 2 | 1.40 |
| 1919 | 10 | 2.53 | 4 | 1.82 | 1 | 0.71 |
The total number of persons employed in mining in 1919 was 7,554; 3,944 being in coal-mines, 2,201 in metal mines, and 1,409 in quarries under the Stone-quarries Act. The corresponding total for 1918 was 8,029, and for 1917, 7,995.
During the year ended 31st March, 1920, thirty-eight approved prospecting parties were granted subsidies amounting to £3,554, of which £1,520 was expended during the year.
As an aid towards the development of the mining industry the Government offers varied and liberal assistance to prospectors in the form of subsidies, loans, expert and technical advice, use of plant, &. Subject to the provisions of the Mining Act, the holder of a valid miner's right is entitled to prospect for gold and any other metal or mineral (except coal) on any Crown land. He may also obtain authority from the Governor-General to prospect on Native land, and he may also prospect on private land with the consent of the owner. Details of assistance offered to prospectors will be found in the 1919 issue of the Year-book.
Advances by way of loan of a sum not exceeding £20,000 may be made by Government to any company or person for carrying on mining operations.
The expenditure on roads and tracks by subsidies and direct grants during the financial year ended the 31st March, 1920, amounted to £13,096.
The Waimea-Kumara and Mount Ida water-races, which render possible hydraulic mining in the Kumara district, Westland, and the Naseby district, Central Otago, supplied thirty-seven miners with water for sluicing during 1919, by which gold to the value of about £8,180 was obtained.
For the year ended 31st March, 1920, the sum received for water sold amounted to £1,398, and the expenditure on the upkeep of the races amounted to £4,056.
The capital expenditure upon these races exceeds £250,000, and, as the expenditure in maintenance has for some years exceeded the cash received for water sold, no interest on capital or depreciation has been provided.
Prospecting-drills of various types suitable for the conditions existing in the Dominion are lent to bona fide prospectors free of all charge except that of maintenance in good order and condition; as security for which a deposit of £50 is required. The Government will pay the salary of the expert drill superintendent who has charge of the drill, and when diamond drills are used will bear half the cost of diamonds (carbons) used. The hirer is required to furnish to the Mines Department weekly journals of boring-results.
After many years’ experience of Government drills as an aid to the mining industry it may be positively stated that no other class of State aid to mining has been so satisfactory. During 1919 an aggregate of 71 holes were drilled and a total depth amounting to 9,534 ft. attained by Government drills, with varying results.
Further information regarding these drills may be obtained upon application to the Under-Secretary, Mines Department, Wellington.
There are Government subsidized schools of mines at Coromandel, Thames, Waihi, Karangahake, Huntly, Westport, and Reefton.
For the year ended 31st March, 1920, the expenditure by the Mines Department on schools of mines amounted to £4,505.
Examinations are held by the Board of Examiners annually of candidates for certificates as first-class and second-class mine-managers, battery-superintendents, and dredgemasters under the Mining Act, 1908, and for certificates as first-class and second-class mine-managers, underviewers, and firemen and deputies under the Coal-mines Act, 1908.
As required by the Coal-mines Act, 1908, the owner of every coal-mine contributes 1/2d. per ton on all coal sold, for the relief of coal-miners who may be injured whilst working, and for the relief of families of coal-miners who may be killed or injured. The proceeds of this levy are administered partly by the Public Trustee, under the above title, and partly by miners’ medical associations, under the title of “Sick and Accident F.”
Table of Contents
ALTHOUGH abundant water-power is available throughout New Zealand, comparatively little use had been made of it before 1900, but since then the development has been extensive, and promises to be still more extensive in the early future. In 1903 water-power to the extent of 9,911 horse-power was actually in use. By 1913 this amount had risen to 34,956 horse-power, and in 1920 to 47,983. Recently interest in hydro-electric power has been accentuated by the partial failure, from various causes, of the coal-supply and the high cost of imported coal.
The Public Works Act of 1908 vests the sole right to use the water-power of the Dominion in His Majesty, subject to any existing rights, and gives the Government the right to develop such power, or to delegate such power to any local authority, or, outside a mining district, to any person or company, subject to conditions. Advantage has been taken of this in several cases, the right in the case of local authorities being issued subject to a royalty of ls. per year per kilowatt of maximum output, and in the case of private concerns developing water-power for electrical distribution, subject to a royalty of 4s. per year per kilowatt of maximum output.
The following table shows the actual horse-power in use in the various districts at the 31st March, in the year indicated:—
| 1915. | 1916. | 1917. | 1918. | 1919. | 1920. | |
|---|---|---|---|---|---|---|
* Including Nelson North. † Excluding Nelson North, now included in Marlborough. | ||||||
| Auckland | 12,933 | 12,153 | 15,206 | 15,113 | 15,473 | 15,423 |
| Hawke's Bay | 9 | 35 | 55 1/2 | 90 | 94 | 109 |
| Taranaki | 2,853 | 2,968 | 3,122 | 3,255 | 3,374 | 3,120 |
| Wellington | 663 | 711 | 713 | 749 | 844 | 859 |
| Marlborough | 174 | 291* | 127 ¼* | 88* | 120* | 153 |
| Nelson | 640 | 583† | 554 1/2† | 548† | 546† | |
| Westland | 3,595 | 3,579 | 3,609 | 3,611 | 3,611 | 4,141 |
| Canterbury | 9,682 | 9,642 | 9,040 1/2 | 12,468 | 12,455 | 11,491 |
| Otago | 10,555 | 10,735 | 10,789 | 10,625 | 10,504 | 10,715 |
| Southland | 1,912 | 1,921 | 1,925 | 1,939 | 1,949 | 1,972 |
| Totals | 43,016 | 42,618 | 45,141 3/4 | 48,487 | 48,970 | 47,983 |
It will be observed from these figures that progress in the last two or three years has been exceedingly slow, in fact the amount quoted for 1920 is somewhat less than that of the two years immediately preceding. In large part this has been due to the difficulty of obtaining the necessary machinery, but, as reference to the latter portion of this section will show, the schemes under way or to be commenced in the near future will have the effect of creating a considerable improvement in this respect. The following table gives the analysis of the purposes for which water-power was employed as on the 31st March, 1920:—
| WATER-POWER IN USE ON THE 31ST MARCH, 1920. | |||||||||||
|---|---|---|---|---|---|---|---|---|---|---|---|
| District. | Electric Supply. | Mining. | Flax-mills. | Sawmills. | Flour-mills. | Dairying. | Construction-works. | Freezing-works. | Paper-mills. | Miscellaneous. | Totals. |
| Auckland North | 2,680 | 20 | 5 | 2,705 | |||||||
| Auckland | 695 | 2,111 | 21 | 4 | 16 | 298 | 10 | 70 | 3,225 | ||
| Auckland South | 9,420 | 60 | 3 | 10 | 9,493 | ||||||
| Hawke's Bay | 46 | 15 | 29 | 19 | 109 | ||||||
| Taranaki North | 1,531 | 30 | 30 | 24 | 460 | 65 | 2,140 | ||||
| Taranaki | 557 | 10 | 265 | 148 | 980 | ||||||
| Wellington Nth. | 552 | 50 | 3 | 605 | |||||||
| Wellington | 50 | 45 | 73 | 86 | 254 | ||||||
| Nelson and Marlborough | 26 | 12 | 46 | 30 | 8 | 31 | 153 | ||||
| Westland | 1,903 | 1,440 | 33 | 65 | 12 | 600 | 88 | 4,141 | |||
| Canterbury | 11,028 | 82 | 127 | 15 | 90 | 11,342 | |||||
| Canterbury Sth. | 58 | 30 | 54 | 7 | 149 | ||||||
| Otago | 10,257 | 65 | 30 | 68 | 20 | 275 | 10,715 | ||||
| Southland | 51 | 115 | 46 | 29 | 45 | 2 | 1,200 | 450 | 34 | 1,972 | |
| Totals | 38,854 | 3,743 | 438 | 218 | 326 | 918 | 898 | 1,210 | 450 | 928 | 47,983 |
The following table gives details of the chief hydro-electric installations from which power is distributed for public supply. Of the twenty-four stations mentioned, seventeen are operated by local authorities, three by the State, and four by private companies.
| Locality. | Supply Authority. | Power installed. | Max. Load, Kw., Year ending 31st March, 1920. | Distance transmitted: Miles. | Voltage of Transmission. | |
|---|---|---|---|---|---|---|
| H.P. | Kw. | |||||
* Lake Coleridge plant. † Overload. ‡ Waipori plant. § Diesel auxiliary. | ||||||
| Canterbury* | P.W. Department | 8,000 | 6,000 | 7,066† | 65 | 66,000 |
| Horahora | ” | 8,400 | 6,300 | 2,700 | 55 | 50,000 |
| Dunedin‡ | City Council | 8,000 | 6,000 | 5,420 | 32 | 35,000 |
| Rotorua | Tourist Department | 380 | 200 | 184 | 13 | 6,600 |
| Hawera§ | Electric Light Co. | 600 | 445 | 362 | 12 | 5,500 |
| Wairua Falls | Wilsons (N.Z.) Cement Co. | 3,300 | 2,000 | 1,460 | 22 | 22,000 |
| Stratford§ | Borough Council | 150 | 90 | 187 | 2 | 2,200 |
| New Plymouth | Borough Council | 1,150 | 785 | 750 | 5 | 6,600 |
| Inglewood | Borough Council | 200 | 120 | 60 | 3 | 3,200 |
| Waverley | Town Board | 60 | 40 | 30 | 2 | 2,300 |
| Patea | Borough Council | 70 | 50 | 50 | 4 | 3,000 |
| Thames | Borough Council | 150 | 105 | 105 | 1 | 460 |
| Te Aroha§ | Borough Council | 255 | 150 | 100 | 3 | 3,300 |
| Ohakune | Borough Council | 160 | 120 | 45 | 1 | 2,400 |
| Locality. | Supply Authority. | Power installed. | Max. Load, Kw., Year ending 31st March, 1920. | Distance transmitted: Miles. | Voltage of Transmission. | |
|---|---|---|---|---|---|---|
| H.P. | Kw. | |||||
* Gas Auxiliary. † Steam auxiliary. | ||||||
| Raetihi | Town Board | 80 | 60 | 45 | 4 | 3,300 |
| Tauranga | Borough Council | 213 | 160 | 150 | 18 | 11,000 |
| Akaroa | ” | 50 | 30 | 30 | 1 | 220 |
| Taihape | ” | 133 | 100 | 128 | 2 | 460 |
| Mangaweka | Town Board | 47 | 35 | 23 | 3 | 2,400 |
| Brightwater* | Waimea Electric Co. | 53 | 40 | 42 | 4 | 2,300 |
| Reefton† | Electric Supply Co. | 80 | 60 | 80 | 1 | 230 |
| Oamaru | Borough Council | 150 | 112 | 75 | 3,300 | |
| Kaponga | Town Board | 60 | 45 | 42 | 230 | |
| Gore | Borough Council | 200 | 150 | 100 | 6 | 11,000 |
LAKE COLERIDGE WORKS.
The Aid to Water-power Works Act of 1910 empowered the State to establish hydro-electric-supply installations, and the first is now in operation at Lake Coleridge, in the Southern Alps, sixty-five miles west of Christchurch. This plant has been designed for a total capacity of 12,000 kilowatts (16,000 h.p.), but natural features of the lake and adjacent rivers allow of a very large extension of the supply up to 58,000 h.p. The transmission-line is constructed in duplicate by separate routes to Christchurch, thus ensuring continuity of supply, each line having a capacity of 5,000 kw. The installed plant capacity is 12,000 h.p., and further plant of 4,000 h.p. capacity is now on order for extensions. The population being served is over 110,000, and a large demand for power is being made. Contracts have already been made for the bulk supply to the Christchurch City Council and some fifteen other local bodies for retail distribution, the Christchurch Tramway Board, and the power-supply to the large meat-freezing works and dairy factories, tanneries, flour-mills, woollen-mills, and other factories and industries of Canterbury. The contract entered into with the Christchurch City Council provides for a charge for the first 300 kilowatts (400 h.p.) of £8 13s. 4d. per annum per kilowatt of maximum load (equivalent to £6 10s. per horse-power), and all over 300 kilowatts at £5 per annum per kilowatt of maximum load (equivalent to £3 15s. per horse-power). This enables the Council to retail it to the public for lighting at 5d. per unit, flat rate, or 6d. per unit for forty hours of maximum demand and 1d. per unit thereafter, and at 1 1/2d. per unit for power in small units, and special rates ranging from 1/2d. to 1/3d. per unit for special contracts. The standard rate of sale by the Public Works Department is based on £16 per kilowatt year (£12 per horse-power year).
The growth of the supply and the general financial results are as follows:—
| Results of Operation for | First Year ending March, 1916. | Second Year ending March, 1917. | Third Year ending March, 1918. | Fourth Year ending March, 1919. | Fifth Year ending March, 1920. |
|---|---|---|---|---|---|
| Capital outlay | £320,330 | £366,984 | £389,754 | £403,157 | £422,076 |
| Working costs | £9,383 | £12,889 | £14,449 | £17,138 | £17,760 |
| Interest, 4 per cent. | £11,398 | £13,743 | £14,871 | £15,692 | £16,863 |
| Depreciation, 2 per cent. | £5,386 | £6,078 | £7,013 | £7,329 | £7,623 |
| Total costs | £26.167 | £32,710 | £36,333 | £40,159 | £42,246 |
| Total revenue | £8,518 | £20,754 | £32,092 | £37,324 | £45,831 |
| Maximum load, kw.— | |||||
| Power-house | 1,372 | 4,366 | 5,438 | 5,900 | 7,066 |
| Substation | 1,220 | 3,900 | 4,800 | 5,340 | 6,260 |
| Units output— | |||||
| Power-house | 4,860,260 | 14,774,960 | 22,403,660 | 27,495,720 | 33,010,130 |
| Substation | 4,128,232 | 12,934,230 | 20,539,430 | 24,548,554 | 29,572,160 |
| Total units sold | 3,991,767 | 11,664,961 | 19,844,676 | 23,387,546 | 28,017,976 |
| Average weekly load factor, per cent.— | |||||
| Power-house | 44.3 | 52.9 | 58.0 | 59.1 | 59.9 |
| Substation | 43.3 | 53.1 | 58.4 | 58.4 | 58.6 |
| Working cost per unit sold | 0.56d. | 0.265d. | 0.175d. | 0.176d. | 0.15d. |
| Capital charge per unit sold | 1.01d. | 0.41d. | 0.265d. | 0.236d. | 0.21d. |
| Total cost per unit sold | 1.57d. | 0.675d. | 0.44d. | 0.412d. | 0.36d. |
| Revenue per unit sold | 0.51d. | 0.45d. | 0.388d. | 0.383d. | 0.39d. |
| Total cost per kw. substation maximum | £21.4 | £8.4 | £7.57 | £7.52 | £6.75 |
To the above costs must be added the cost of retailing by the various local authorities, and the gross results of distribution in the district for the year ending 31st March, 1920, are given in the following table.
| Gross Financial Results of the Distribution of Lake Coleridge Power in Canterbury, 31st March, 1920. | |||||||||
|---|---|---|---|---|---|---|---|---|---|
| Distributing Authority. | Number of Consumers. | Capital Outlay. | Revenue from Consumers. | Paid for Electricity. | Maintenance and Working Expenses. | Interest. | Sinking Fund. | Depreciation. | Net Profit. |
*After deducting amount of sales to other distributing bodies. † Paid to Public Works Department. ‡ Paid to Christchurch City Council. § Net loss. | |||||||||
| £ | £ | £ | £ | £ | £ | £ | £ | ||
| Public Works Department | 359 | 422,076 | 24,780* | 17,759 | 16,863 | 7,624 | 3,585 | ||
| Christchurch City Council | 6,632 | 302,185 | 66,662* | 16,029† | 19,342 | 11,610 | 15,628 | 5,933 | |
| Halswell County Council | 78 | 5,000 | 264 | 105† | 50 | 120 | 50 | 61§ | |
| Heathcote County Council | 432 | 9,700 | 2,310 | 1,029† | 671 | 401 | 77 | 131 | |
| Kaiapoi Borough Council | 326 | 4,320 | 1,792 | 722† | 445 | 161 | 464 | ||
| Lyttelton Borough Council | 108 | 5,000 | 1,560 | 677† | 390 | 214 | 100 | 179 | |
| Riccarton Borough Council | 325 | 4,998 | 1,521 | 217† | 354 | 237 | 240 | 164 | |
| 309‡ | |||||||||
| Rangiora Borough Council | 171 | 5,500 | 708 | 279† | 174 | 289 | 55 | 89§ | |
| Rangiora County Council | 121 | 6,659 | 639 | 189† | 54 | 151 | 50 | 195 | |
| Spreydon Borough Council | 303 | 6,162 | 1,230 | 370† | 277 | 300 | 60 | 125 | 98 |
| Sumner Borough Council | 292 | 6,465 | 1,565 | 495† | 435 | 315 | 60 | 129 | 131 |
| Tai Tapu Dairy Company | 109 | 5,344 | 1,606 | 720† | 423 | 318 | 194 | 49§ | |
| Waimairi County Council | 1,289 | 37,650 | 5,659 | 83† | 1,785 | 1,938 | 651 | ||
| 1,201‡ | |||||||||
| Woolston Borough Council | 286 | 7,515 | 1,319 | 506† | 395 | 343 | 70 | 5 | |
| Totals | 10,831 | 828,574 | 111,615 | 22,931 | 42,554 | 33,260 | 716 | 23,746 | 11,337 |
The column “Revenue from Consumers” omits, in the cases of the Public Works Department and Christchurch City Council, the revenue from the sale of energy to other local authorities for distribution, as this is resold and the actual revenue from the consumers is included in the revenue of the distributing local authority. The amounts thus paid for power in bulk for resale are shown in the column “Paid for Electricity.”
Practically all the local authorities were carrying out construction during the year. As interest during construction is paid in all cases out of capital, the period on which the amount of interest included in the columns “Interest” and “Sinking Fund” is based does not in many cases cover the whole year.
In November, 1920, the Waihi Gold-mining Company's electric-power plant at Horahora was acquired by the State for £212,500.
The main features of the plant acquired are the headworks and generating-station on the Waikato River at Horahora, seventeen miles from Cambridge, with a plant capacity of six generators each capable of generating 1,050 kw. or a total of 6,300 kw.; the transmission-line of three No. O.S.W.G. copper conductors on steel towers from Horahora to Waikino (fifty-five miles); and the transformer-station at Waikino, for transforming the energy supplied to the Waihi Company's mine.
As shown in the accounts, the operations for the five months ending 31st March, 1920, resulted in a gross revenue of £5,803, or £3,933 in excess of working-expenses. Interest on the purchase-money amounted to £4,427, and depreciation at 2 per cent. per annum as required by law to £1,628, leaving a deficiency after paying working and capital charges of £2,122.
The total number of units generated over the five months was 6,415,150, and the number delivered to consumers was 5,630,200, so that 784,950 units, or 12.3 per cent. of the amount generated, were lost in transmission. The maximum demand on the power-house was 2,700 kilowatts.
The following shows the average cost of production:—
| — | Costs. | Per Unit generated. | Per Unit sold. | Per Kilowatt of Power-house. Max. per Year. |
|---|---|---|---|---|
| £ | d. | d. | £ | |
| Generating | 1,024 | 0.040 | 0.043 | 0.91 |
| Transmission | 278 | 0.010 | 0.012 | 0.23 |
| Distribution | 225 | 0.008 | 0.010 | 0.20 |
| Management | 343 | 0.013 | 0.015 | 0.30 |
| Total working costs | 1,870 | 0.071 | 0.080 | 1.64 |
| Interest | 4,427 | 0.165 | 0.189 | 3.93 |
| Depreciation | 1,628 | 0.061 | 0.069 | 1.45 |
| Total costs | 7,925 | 0.297 | 0.338 | 7.02 |
The revenue represented a return of 0.217d. per unit generated, 0.247d. per unit sold, and £5 16s. per annum per kilowatt of power-house maximum.
The total power installed at Horahora (6,300 kw., or 8,400 h.p.) will be dealt with as follows:—
| Horse-power. | |
|---|---|
| Spare standby unit | 1,400 |
| For Waihi Gold-mining Company | 3,300 |
| For Arapuni construction-works | 200 |
| For special industries | 500 |
| For losses in transmission | 600 |
| Available for local authorities | 2,400 |
| 8,400 |
In allocating the power, the population and other considerations, such as existing installations, have been taken into account, and the following allocation is the result of a careful investigation into the whole of the factors:—
| Horse-power. | |
|---|---|
| Thames Valley Power Board | 900 |
| Te Awamutu Power Board | 600 |
| Cambridge Power Board | 200 |
| Central Power Board | 350 |
| Hamilton Borough Council | 300 |
| Waihi Borough Council | 50 |
| 2,400 |
The only other hydro-electric development of any size is the powerstation of the Dunedin City Council on the Waipori River, thirty-two miles from the city. This plant was started in 1907 with two units of 1,000 kilowatts (1,340 h.p.) each. Two more similar units were added in 1910, and two more were installed in 1913, which brings the total capacity up to 6,000 kilowatts (8,000 h.p.). The retail rates charged range from 5d. to 1d. per unit for lighting, and from 2d. to 1/2d. per unit for power purposes.
The output for the year 1919–20 was as follows:—
| Units sold. Number. | Average Price per Unit. | |
|---|---|---|
| Private lighting | 2,651,628 | 3.49 |
| Public lighting | 398,028 | 2.88 |
| Power and heating | 8,375,387 | 0.83 |
| Tramways | 2,777,744 | 0.70 |
| Total supply | 14,202,787 | 1.43 |
The total outlay to the 31st March, 1920, was £526,181, including distribution, standby plant, and public lighting; the total revenue for the year ended the 31st March, 1920, £84,720; and the total expenditure, including interest, sinking fund, depreciation, and renewal funds, £74,892, leaving a net profit of £9,828. The number of consumers supplied was 8,313, and the total capacity of all connections to the mains at the 31st March, 1920, was 17,770 kilowatts.
A large and comprehensive scheme is now under construction for the supply of electrical energy in the North Island, with the object of making it generally available, as far as possible, to all the towns and districts throughout the Island. It is anticipated that the productiveness of the country will be greatly increased, the dairying industry in particular being capable of expansion with the provision of cheap electric power.
A complete scheme was outlined in a report dated October, 1918, by Mr. Evan Parry, B.Sc. M.I.C.E., recently Chief Electrical Engineer of the Public Works Department. He estimates the demand at 0.2 h.p. per head of population, exclusive of large blocks of power required for electro-chemical and metallurgical industries, and allowing for losses in transmission and distribution the power required on this basis for the North Island is 160,000 h.p. This it is proposed to obtain from three sources—the Mangahao River, near Shannon (24,000 h.p.), Lake Waikaremoana (40,000 h.p.), and the Arapuni Rapids, on the Waikato, near Putaruru (96,000 h.p.). Of these the Waikaremoana scheme is capable of further development up to a total of 130,000 h.p., and Arapuni to a total of 160,000 h.p.
The complete estimate to provide for the general scheme of electricity-supply, based on 12 per cent. in excess of pre-war costs, is as follows:—
| — | Amount. | Per Horse-power. | |||
|---|---|---|---|---|---|
| Generating-stations (total plant capacity 160,000 h.p.)— | £ | £ | |||
| H.P. | Cost. | Per H.P. | |||
| Mangahao | 24,000 | £438,654 | 18.30 | ||
| Waikaremoana | 40,000 | 544,369 | 13.16 | ||
| Arapuni | 96,000 | 1,078,700 | 10.80 | ||
| 160,000 | 2,061,723 | 12.88 | |||
| Main transmission-lines | 1,553,880. | 11.22 | |||
| Extra branch transmission-lines at lower voltage to main substations not on main lines | 241,360. | ||||
| Main substations | 838,808 | 5.24 | |||
| Distribution-lines and secondary substations | 2,086,000 | 13.04 | |||
| 6,781,771 | 42.38 | ||||
| Interest during construction | 271,271 | 1.69 | |||
| Assistance to local authorities and power-users | 100,000 | 0.62 | |||
| Working capital | 150,000 | 0.94 | |||
| Total | 7,303,042 | 45.63 | |||
The capital charges for interest, depreciation, and sinking fund at 7 1/2 per cent. will amount to £547,728 per annum. The working-expenses should not exceed £220,000 per annum, making a total annual expenditure of £767,728, requiring an average return of £5.9 per horse-power per annum of maximum load—i.e., about £8 per kilowatt.
The policy of the Government generally is to supply power in bulk, leaving the reticulation and retail supply in the hands of the local authorities. In the past the only local authorities available have been the cities, boroughs, counties, and Town Boards, but with the extension of electric supply into the country areas a stronger organization became necessary, and this has been provided under the Electric Power Boards Act of 1918. This Act provides for several local districts to combine for the purpose of electric-power distribution, and to set up a special Electric-power Board to carry out the work, with rating-powers over the district concerned.
Amendments to the original Act, based on the results of experience, have been passed in 1919 and 1920 respectively.
The provisions of this Act have now been taken advantage of by ten districts details of which are set out in the table herewith. The total area covered by these ten districts is 17,179 square miles, being 16.6 per cent. of the total area of the Dominion, and the total population included is 137,960, being 12.5 per cent. of the population of the Dominion. Five of the Boards have laid out their reticulation systems and submitted the necessary loans to the ratepayers for approval. Of these one (Southland) includes a generating-station at Lake Monowai, and the other four provide for taking power in bulk from the Public Works Department.
The total amount of the loans authorized by the ratepayers of these five districts amounts to £1,980,000. This is £20.6 per head of population concerned, and 7.25 per cent. of the unimproved rateable value.
| Name of Electric-power District. | Proclamation constituting District Gazetted. | Number of Members on Board. | Approximate Area of District. | Population. | Value of Rateable Property (unimproved). | Amount of Loan. | Voting for Loan Poll. | |
|---|---|---|---|---|---|---|---|---|
| For. | Ag'nt. | |||||||
| Square Miles. | £ | £ | ||||||
| Southland | 19/11/19 | 12 | 9,986 | 65,450 | 13,600,471 | 1,500,000 | 6,516 | 415 |
| Thames Valley | 8/1/20 | 12 | 2,304 | 16,000 | 6,814,993 | 200,000 | 1,503 | 28 |
| Te Awamutu | 8/1/20 | 10 | 309 | 6,000 | 1,759,558 | 120,000 | 359 | |
| Cambridge | 8/1/20 | 8 | 104 | 5,000 | 1,683,632 | 60,000 | 198 | 3 |
| Banks Peninsula | 8/1/20 | 7 | 372 | 3,500 | 3,430,817 | 100,000 | 331 | 23 |
| Wairarapa | 25/3/20 | 9 | 2,073 | 21,800 | 3,114,718 | Poll not yet taken. | ||
| Cantral | 8/7/20 | 7 | 300 | 9,110 | 3,667,904 | Poll not yet taken. | ||
| Teviot | 22/7/20 | 7 | 120 | 1,800 | 169,137 | Poll not yet taken. | ||
| Wairoa | 29/7/20 | 10 | 1,369 | 3,900 | 2,417,251 | Poll not yet taken. | ||
| Springs-Ellesmere | 8/7/20 | 7 | 242 | 5,400 | 2,627,468 | Poll not yet taken. | ||
| Totals | 17,179 | 137,980 | 39,285,949 | 1,980,000 | 8,907 | 469 | ||
In addition to the developed power in New Zealand there is a practically unlimited amount of undeveloped power. The following table gives the particulars of the more important available water-powers, showing also the nearest market consisting of a city or an actual or potential port. A considerable number of these are suitable for general industrial development, but the largest ones, as a rule being in the unsettled portions of the South Island and near the deep-water sounds, are particularly suitable for utilization in connection with electro-chemical or electro-metallurgical industries.
| Source of Power. | Position of Powerhouse. | Available Flow: Cubic Feet per Second. | Available Head: Feet. | Average Power on 50 per cent Load Factor. | Nearest City, Port, or Deep Water. | Distance: Miles. | |
|---|---|---|---|---|---|---|---|
| H.P. | K.W. | ||||||
* Signifies seasonal storage made available. † Signifies storage available to utilize 50 per cent. daily load factor. | |||||||
| North Auckland District. | |||||||
| Wairua Falls | Wairua Falls | 300 | 130 | 3,200 | 2,400 | Whangarei | 16 |
| South Auckland District. | |||||||
| Kaituna | Okere Falls | 500* | 784 | 60,000† | 45,000 | Tauranga | 25 |
| Auckland | 125 | ||||||
| Waikato River | Huka Falls | 4,400* | 50 | 20,000 | 15,000 | Auckland | 158 |
| Waikato River | Aratiatia Rapids | 4,400* | 170 | 136,000† | 100,000 | Auckland | 154 |
| Waikato River | Orakeikorako Rapids | 4,400* | 35 | 14,000 | 10,000 | Auckland | 148 |
| Waikato River | Aniwhaniwha Falls | 4,400* | 80 | 32,000 | 24,000 | Auckland | 142 |
| Waikato River | Atiamuri Rapids | 4,400* | 25 | 10,000† | 7,500 | Auckland | 139 |
| Waikato River | Arapuni Gorge | 5,300 | 165 | 163,000† | 120,000 | Auckland | 105 |
| Waikato River | Horahora Rapids | 5,300 | 27 | 13,000 | 10,000 | Auckland | 97 |
| Pokaiwhenua River | Horahora Rapids | 165 | 170 | 4,600† | 3,400 | Auckland | 97 |
| Omanawa | Omanawa | 160 | 108 | 1,500 | 1,100 | Tauranga | 16 |
| Wairere Falls | Wairere Falls | 160 | 60 | 860 | 600 | Te Kuiti | 18 |
| Hawke's Bay District. | |||||||
| Waikaremoana | Upper Waikaretaheki | 530* | 1,100 | 97,000† | 75,000 | Gisborne | 50 |
| Waikaremoana | Lower Waikaretaheki | 530* | 360 | 32,000† | 24,000 | Napier | 60 |
| Te Reinga Falls | To Reinga Falls | 124 | 125 | 1,300 | 1,000 | Gisborne | 35 |
| Waikohu River | Waikohu | 45* | 847 | 6,000† | 4,500 | Gisborne | 26 |
| Wanganui District. | |||||||
| Lake Rotoaira | Patu River | 260 | 520 | 11,000 | Wanganui | 105 | |
| Mangawhero River | Raukawa Falls | 125 | 90 | 940 | Wanganui | 45 | |
| Mangawhero River | Wanganui River | 125 | 680 | 7,100 | Wanganui | 24 | |
| Rangitikei River | Makohine | 1,500 | 300 | 75,000† | Wanganui | 48 | |
| Wangaehu River | Wangaehu River | 260 | 70 | 1,500 | Wanganui | 25 | |
| Taranaki District. | |||||||
| Waitara River | Waitara River | 400 | 140 | 4,600 | New Plymouth | 12 | |
| Waiwakaiho | Waiwakaiho | 120 | 250 | 5,000† | New Plymouth | 4 | |
| Wellington District. | |||||||
| Mangahao River | Shannon | 144* | 895 | 24,000† | Wellington | 65 | |
| Makuri River | Makuri Gorge | 100 | 384 | 3,200 | Pahiatua | 20 | |
| Waiohine | Woodside | 120 | 120 | 2,400† | Masterton | 15 | |
| Hutt River | Mungaroa | 200* | 330 | 11,000† | Wellington | 24 | |
| Source of Power. | Position of Powerhouse. | Available Flow: Cubic Feet per Second. | Available Head: Feet. | Average Power on 50 per cent. Load Factor | Nearest City, Port, or Deep Water. | Distance: Miles. | |
|---|---|---|---|---|---|---|---|
| H.P. | K.W. | ||||||
* Signifies seasonal storage made available. † Signifies storage available to utilize 50 per cent. daily load factor. | |||||||
| Nelson District. | |||||||
| Boulder Lake | Aorere River | 50 | 2,600 | 11,000 | 8,000 | Golden Bay | 10 |
| Rotoiti Lake | Gowan River | 200 | 1,200 | 20,000 | 15,000 | Westport | 48 |
| Nelson | 48 | ||||||
| Rotoroa Lake | Buller River | 900 | 400 | 30,000 | 22,000 | Westport | 48 |
| Nelson | 48 | ||||||
| Buller River | Lyell | 25,000 | 18,000 | Westport | 24 | ||
| Inangahua River | Blackwater River | 780 | 125 | 8,000 | 6,000 | Westport | 18 |
| Westland District. | |||||||
| Lake Brunner | Stillwater | 1,750 | 200 | 29,000 | 22,000 | Greymouth | 10 |
| Kumara Water-race | Kumara | 87 | 330 | 2,400 | 1,800 | Greymouth | 12 |
| Otira River | Otira | 40 | 700 | 2,300 | 1,700 | Greymouth | 52 |
| Rolleston River | Otira | 36 | 700 | 2,000 | 1,500 | Greymouth | 52 |
| Kanieri Lake | Kanieri River | 100 | 330 | 2,800 | 2,100 | Hokitika | 20 |
| Toaroha River | Toaroha River | 150 | 760 | 9,500 | 7,100 | Hokitika | 17 |
| Whitcombe River | Hokitika River | 250 | 800 | 16,000 | 12,000 | Hokitika | 20 |
| Kakapotahi River | Kakapotahi River | 100 | 580 | 4,800 | 3,600 | Hokitika | 26 |
| Wanganui River | Hende's Ferry | 830 | 580 | 40,000 | 30,000 | Hokitika | 36 |
| Wataroa River | Wataroa | 1,360 | 700 | 80,000 | 60,000 | Hokitika | 48 |
| Canterbury District. | |||||||
| Clarence River | Jollies Pass | 200 | 1,160 | 20,000 | 15,000 | Christchurch | 82 |
| Clarence River | Conway River | 1,150 | 1,050 | 100,000 | 75,000 | Christchurch | 88 |
| Kaikoura | 25 | ||||||
| Waiau-ua River | Culverden | 1,600 | 200 | 27,000 | 20,000 | Christchurch | 75 |
| Waimakariri River | Gorge Bridge | 2,000 | 90 | 15,000 | 11,000 | Christchurch | 30 |
| Lake Coleridge | Rakaia River | 100* | 480 | 8,000† | 6,000 | Christchurch | 65 |
| Acheron River | Rakaia River | 50* | 480 | 4,000† | 3,000 | Christchurch | 70 |
| Harper River | Rakaia River | 420* | 480 | 32,000† | 24,000 | Christchurch | 70 |
| Wilberforce River | Rakaia River | 1,100 | 480 | 44,000 | 33,000 | Christchurch | 70 |
| Rakaia River | Gorge Bridge | 2,600 | 30 | 6,500 | 4,800 | Christchurch | 25 |
| Lake Heron | Rakaia River | 300 | 200 | 4,000 | 3,000 | Christchurch | 88 |
| Rangitata River | Arundel | 1,100 | 250 | 23,000 | 17,000 | Timaru | 35 |
| Opihi River | Opihi Gorge | 200 | 400 | 6,700 | 5,000 | Timaru | 30 |
| Opuha River | Opihi Gorge | 200 | 400 | 6,700 | 5,000 | Christchurch | 100 |
| Tekapo Lake | Fairlie | 5,100 | 900 | 400,000 | 300,000 | Timaru | 40 |
| Ohau Lake | Waitaki River | 5,000 | 600 | 250,000 | 180,000 | Timaru | 52 |
| Otago and Southland Districts. | |||||||
| Ahuriri River | Waitaki River | 600 | 200 | 10,000 | 7,500 | Oamaru | 62 |
| Timaru | 100 | ||||||
| Waipori Falls | Waipori River | 135 | 650 | 7,300 | 5,500 | Dunedin | 29 |
| Lee Stream | Outram | 15 | 750 | 1,280 | 970 | Dunedin | 18 |
| Deep Stream | Taieri River | 110 | 900 | 8,400 | 6,300 | Dunedin | 20 |
| Taieri River | Deep Stream | 700 | 220 | 12,000 | 9,000 | Dunedin | 44 |
| Talla Burn | Clutha River | 30 | 890 | 2,200 | 1,600 | Dunedin | 60 |
| Teviot River | Roxburgh | 100* | 1,900 | 30,000† | 21,000 | Dunedin | 90 |
| Mauwherika River | Chatto Creek | 200 | 350 | 5,800 | 4,400 | Dunedin | 127 |
| Hawea Lake | Wanaka Lake | 2,500* | 205 | 80,000† | 60,000 | Dunedin | 170 |
| Wakatipu Lake | Kawarau River | 11,000 | 544 | 500,000 | 375,000 | Dunedin | 140 |
| Shotover | Wakatipu Lake | 500 | 250 | 14,500 | 11,000 | Invercargill | 112 |
| Lake Hall | Doubtful Sound | 220 | 2,625 | 48,000 | 36,000 | On seaboard | |
| Lake Cecil | Lake Te Anau | 200 | 900 | 15,000 | 11,200 | On seaboard | |
| Lake Hilda | Lake Te Anau | 1,550 | 1,190 | 55,000 | 41,080 | On seaboard | |
| Lake Te Anau | George Sound | 12,630 | 694 | 750,000 | 560,000 | On seaboard | |
| Lake Manapouri | Smith Sound | 8,400 | 600 | 420,000 | 315,000 | On seaboard | |
| Lake Monowai | Waiau River | 700* | 180 | 20,000† | 15,000 | Invercargill | 60 |
| Lake Hauroto | Tewaewae Bay | 2,300 | 514 | 100,000 | 75,000 | Invercargill | 51 |
Table of Contents
STATISTICS of industrial manufacture in the Dominion have been collected quinquennially (in conjunction with the population census) since 1867. For some years past the desirability of an annual collection has been recognized, but various circumstances have prevented its inception until 1918–19. On the 19th June, 1919, regulations under the Census and Statistics Act were gazetted prescribing the establishments in respect of which returns are required to be furnished annually, and also the form in which the information is to be supplied.
Under these regulations a “factory” is defined as an establishment engaged in manufacture, repair, or preparation of articles for wholesale or retail trade or for export which employs at least two hands or uses motive power, with the exception of the following, which are expressly excluded: Bakeries, butcheries, laundries, smithies, waterworks, shops engaged in retail trade only, and farmers or others using motive power for their own individual and private use. The following are, however, required to furnish returns even although employing less than two hands and not using motive power: Tanneries, bacon, butter, cheese, soap or candle factories, brickyards, and limeworks.
This definition is practically, in concrete form, the procedure formerly adopted in deciding whether an establishment is required to furnish a return or not, but in some respects a less rigid interpretation is made.
The definition is fairly comprehensive, and clearly includes such industries as, for instance, jewellery and watch repairing, boot, shoe, and saddlery repairing, and similar trades. In former years a number of small establishments thus engaged were included in the statistics, but it has now been decided to exclude such unless also engaged in actual manufacture employing at least two hands. This has had the effect of showing an apparent decrease in the number of establishments in some industries and also in the total of all industries; but in other respects the effect on the statistics is negligible, the number of employees, materials used, products, &., thus excluded in the trades concerned being comparatively small.
It should be noted that these statistics do not cover and do not purport to cover all establishments registered as factories in the Dominion, for the following reasons: “One-man” businesses are excluded; some small repair shops (as explained previously) are excluded, even although they may employ two or more hands; and in some cases where a factory has two or more branches it has been found impracticable to obtain separate returns, and all the branches have been treated as one establishment.
In comparing previous years with the 1918–19 collection the foregoing remarks should be borne in mind, and also the fact that in some of the earlier years, owing to the longer intervals between collections, lax methods of book-keeping more widely prevailing, less understanding of the requirements of the Statistical Office, and less appreciation of the necessity for and value of the statistics compiled, no doubt to a certain extent impaired the accuracy of the published results.
As previously stated, the omission of small repair-shops from the 1918–19 collection has resulted in an apparent decrease in the number of establishments as compared with 1916, the numbers being 4,245 and 4,670 respectively. The industries principally affected by the omissions referred to are—boot and shoe making, saddlery and harness making, coachbuilding, and tinned-plate and sheet-metal working.
The numbers and per - cent. increases or decreases in the principal industries since 1901 are as follows:—
| Industry. | 1900–1 Number. | 1905–6 | 1910–11. | 1915–16. | 1918–19. | ||||
|---|---|---|---|---|---|---|---|---|---|
| Number. | Increase or Decrease per Cent. | Number. | Increase or Decrease per Cent. | Number. | Increase or Decrease per Cent. | Number. | Increase or Decrease per Cent. | ||
* Comparison invalidated owing to inclusion in some years of small repair-shops | |||||||||
| Meat freezing and preserving | 34 | 37 | +8.8 | 41 | +10.8 | 45 | +9.8 | 48 | +6.7 |
| Butter, cheese, and condensed-milk manufacturing | 248 | 266 | +7.3 | 340 | +27.8 | 352 | +3.5 | 405 | +15.1 |
| Sawmilling and sash and door making | 334 | 444 | +32.9 | 534 | +20.3 | 292 | -45.3 | 301 | +3.1 |
| Engineering | 37 | 61 | +64.9 | 120 | +96.7 | 142 | +18.3 | 132 | -7.0 |
| Printing, publishing, and bookbinding | 188 | 239 | +27.1 | 241 | +0.8 | 266 | +10.4 | 259 | -2.6 |
| Coachbuilding | 160 | 183 | +14.4 | 180 | –1.6 | 313 | +73.9 | 129 | * |
| Tanning, fellmongering, and wool-scouring | 119 | 99 | –16.8 | 79 | -20.2 | 59 | -25.3 | 65 | +10.2 |
| Furniture and cabinet making | 144 | 172 | +19.4 | 207 | +20.3 | 257 | +24.2 | 219 | –14.8 |
| Woollen-milling | 10 | 10 | +0.0 | 10 | +0.0 | 10 | +0.0 | 10 | 0.0 |
| Tailoring | 175 | 308 | +76.0 | 448 | +45.5 | 496 | +10.7 | 335 | -32.5 |
| Dress and millinery making | 290 | 338 | +16.6 | 382 | +13.0 | 339 | –11.3 | 341 | +0.6 |
| Boot and shoe making | 126 | 72 | * | 74 | * | 166 | * | 75 | * |
| Clothing-manufacture | 21 | 23 | +9.5 | 69 | +200.0 | 83 | +20.3 | 156 | +88.0 |
| Flax-milling | 101 | 240 | +137.6 | 81 | -70.4 | 76 | -6.2 | 77 | +1.3 |
Previous to 1918–19 productive employees only were asked for; employees are now, however, required under three heads—viz., administrative, productive, and distributive. In the light of information now available it is obvious that on previous occasions employers other than those directly productive were often included, so that no strictly comparable figures are available.
Employees returned in 1915–16 numbered 57,823, while productive employees were returned in 1918–19 as 58,788, an increase of 965, or 1.5 per cent. The increase is in reality greater, for the reason stated.
Total employees, 1918–19, were classified as follows (all and principal industries):—
| EMPLOYEES IN MANUFACTORIES, 1918–19. | |||||||||||||||
|---|---|---|---|---|---|---|---|---|---|---|---|---|---|---|---|
| Industry. | Administrative. | Productive. | Distributive. | Total. | |||||||||||
| Male. | Female. | Male and Female. | Per Cent. of Total. | Male. | Female. | Male and Female. | Per Cent. of Total. | Male. | Female. | Male and Female. | Per Cent. of Total. | Male. | Female. | Male and Female. | |
| All industries | 1,761 | 329 | 2,090 | 3.1 | 44,128 | 14,660 | 58,788 | 87.9 | 5,351 | 681 | 6,032 | 9.0 | 51,240 | 15,670 | 66,910 |
| Principal Industries. | |||||||||||||||
| Meat freezing and preserving | 165 | 32 | 197 | 2.4 | 7,782 | 78 | 7,860 | 96.7 | 50 | 23 | 73 | 0.9 | 7,997 | 133 | 8,130 |
| Butter, cheese, and condensed-milk manufacture | 239 | 10 | 249 | 8.7 | 2,346 | 89 | 2,435 | 85.2 | 139 | 36 | 175 | 6.1 | 2,724 | 135 | 2,859 |
| Sawmilling, sash and door making | 101 | 10 | 111 | 1.9 | 5,153 | 29 | 5,182 | 89.0 | 506 | 22 | 528 | 9.1 | 5,760 | 61 | 5,821 |
| Engineering | 91 | 20 | 111 | 4.1 | 2,449 | 40 | 2,489 | 91.1 | 101 | 30 | 131 | 4.8 | 2,641 | 90 | 2,731 |
| Printing, publishing, and bookbinding | 170 | 50 | 220 | 4.9 | 2,619 | 862 | 3,481 | 78.3 | 659 | 87 | 746 | 16.8 | 3,448 | 999 | 4,447 |
| Coachbuilding | 11 | 5 | 16 | 1.9 | 789 | 21 | 810 | 97.2 | 4 | 3 | 7 | 0.9 | 804 | 29 | 833 |
| Tanning, fellmongering, and woolscouring | 25 | 3 | 28 | 2.0 | 1,313 | 15 | 1,328 | 94.7 | 39 | 8 | 47 | 3.3 | 1,377 | 26 | 1,403 |
| Furniture and cabinet making | 32 | 9 | 41 | 2.6 | 1,394 | 91 | 1,485 | 93.7 | 37 | 22 | 59 | 3.7 | 1,463 | 122 | 1,585 |
| Woollen-milling | 8 | 2 | 10 | 0.5 | 779 | 1,083 | 1,862 | 98.7 | 11 | 4 | 15 | 0.8 | 798 | 1,089 | 1,887 |
| Tailoring | 14 | 1 | 15 | 0.6 | 819 | 1,760 | 2,579 | 96.3 | 67 | 16 | 83 | 3.1 | 900 | 1,777 | 2,677 |
| Dress and millinery making | 2 | 2 | 4 | 0.1 | 44 | 3,157 | 3,201 | 99.3 | 4 | 15 | 19 | 0.6 | 50 | 3,174 | 3,224 |
| Boot and shoe making | 24 | 4 | 28 | 1.2 | 1,474 | 830 | 2,304 | 94.9 | 64 | 31 | 95 | 3.9 | 1,562 | 865 | 2,427 |
| Clothing-manufacture | 13 | 16 | 29 | 0.6 | 597 | 3,906 | 4,503 | 96.6 | 48 | 82 | 130 | 2.8 | 658 | 4,004 | 4,662 |
| Flax-milling | 24 | 24 | 1.7 | 1,397 | 2 | 1,399 | 97.8 | 7 | 7 | 0.5 | 1,428 | 2 | 1,430 | ||
The most nearly comparable figures of employees (those returned as productive) are given for the last five censuses, together with the increase or decrease per cent. for all and for the principal industries.
| Industry | 1900–1. | 1905–6. | 1910–11. | 1915–16. | 1918–19. | ||||
|---|---|---|---|---|---|---|---|---|---|
| Number. | Number. | Increase or Decrease per Cent. | Number. | Increase or Decrease per Cent. | Number. | Increase or Decrease per Cent. | Number. | Increase or Decrease per Cent. | |
| All industries | 46,847 | 56,359 | 56,234 | 57,823 | 58,788 | ||||
| Deduct figures for industries included in some years and not in others | 1,858 | 2,381 | 3,037 | ||||||
| Comparative figures for industries common to all years | 46,847 | 56,359 | +20.3 | 54,376 | -3.5 | 55,442 | +2.0 | 55,751 | +0.6 |
| Principal Industries. | |||||||||
| Meat freezing and preserving | 2,282 | 3,260 | +42.9 | 4,095 | +25.6 | 5,982 | +46.1 | 7,860 | +31.4 |
| Butter, cheese, and condensed-milk manufacture | 1,188 | 1,484 | +24.9 | 1,504 | +1.3 | 1,814 | +20.6 | 2,435 | +34.2 |
| Sawmilling, sash and door making | 6,812 | 9,111 | +33.7 | 6,877 | -24.5 | 5,870 | –14.6 | 5,182 | –11.7 |
| Engineering | 1,442 | 3,706 | 3,747 | +1.1 | 2,783 | -25.7 | 2,489 | –10.6 | |
| Printing, publishing, and bookbinding | 3,134 | 3,898 | +24.3 | 4,222 | +8.4 | 4,202 | -0.5 | 3,481 | –17.2 |
| Coachbuilding | 1,185 | 1,465 | +23.6 | 1,439 | –1.8 | 1,393 | -3.2 | 810 | -41.9 |
| Tanning, fellmongering, and wool-scouring | 1,963 | 1,336 | -31.9 | 1,372 | +2.7 | 1,187 | –13.5 | 1,328 | +11.9 |
| Furniture and cabinet making | 1,310 | 1,528 | +16.6 | 1,689 | +10.5 | 1,821 | +7.8 | 1,485 | –18.4 |
| Woollen-milling | 1,693 | 1,549 | -8.6 | 1,410 | -9.0 | 1,897 | +34.5 | 1,862 | –1.8 |
| Tailoring | 1,621 | 2,997 | +84.9 | 4,225 | +40.9 | 3,132 | -25.9 | 2,579 | –17.7 |
| Dress and millinery making | 2,888 | 3,039 | +5.2 | 4,128 | +35.8 | 3,645 | –11.7 | 3,201 | –12.2 |
| Boot and shoe making | 2,696 | 2,206 | –18.2 | 2,072 | -6.1 | 2,257 | +8.9 | 2,304 | +2.1 |
| Clothing-manufacture | 2,512 | 1,914 | -23.9 | 2,947 | +53.9 | 3,574 | +21.3 | 4,503 | +26.0 |
| Flax-milling | 1,698 | 4,076 | +140.0 | 1,244 | -09.5 | 1,257 | +1.0 | 1,399 | +11.3 |
The average number of employees per establishment during the same period is shown below. It should be borne in mind that the rejection of schedules from small establishments engaged in retail repairs only has decreased the number of establishments in 1918–19, and consequently is responsible for a portion of the considerable increase in the number of employees per establishment. All administrative and distributive employees are also included in 1918–19.
| Industry. | 1900–1. | 1905-6. | 1910–11. | 1915–16. | 1918–19. |
|---|---|---|---|---|---|
| All industries | 12.7 | 13.5 | 12.8 | 12.4 | 15.7 |
| Principal Industries. | |||||
| Meat freezing and preserving | 67.1 | 88.1 | 99.9 | 132.9 | 168.8 |
| Butter, cheese, and condensed-milk manufacture | 4.9 | 5.8 | 4.6 | 5.4 | 7.1 |
| Sawmilling and sash and door making | 20.4 | 20.5 | 12.9 | 20.1 | 19.3 |
| Engineering | 38.5 | 30.3 | 20.4 | 16.9 | 20.7 |
| Printing, publishing, and bookbinding | 16.6 | 16.3 | 17.5 | 15.8 | 17.2 |
| Coach building | 7.4 | 8.0 | 7.9 | 4.4 | 6.5 |
| Tanning, fellmongering, and wool-scouring | 16.5 | 13.5 | 17.3 | 20.1 | 21.6 |
| Furniture and cabinet making | 9.1 | 8.9 | 8.1 | 7.1 | 7.2 |
| Woollen-milling | 169.3 | 154.9 | 141.0 | 189.7 | 188.7 |
| Tailoring | 9.3 | 9.7 | 9.4 | 6.3 | 8.0 |
| Dress and millinery making | 9.9 | 9.0 | 10.8 | 10.8 | 9.5 |
| Clothing-manufacture | 119.6 | 83.2 | 42.7 | 43.1 | 29.9 |
| Flax-milling | 16.8 | 16.9 | 15.4 | 16.5 | 18.6 |
Both the total amount paid in wages (nominal) to productive workers and also the average wage per worker show large increases from one census to another, particularly since 1905–6. No distinction is made as regards ages of workers, so that the subjoined figures include adults and young persons of each sex.
| — | Males. | Females. | Males and Females. | |||
|---|---|---|---|---|---|---|
| Total. | Average. | Total. | Average. | Total. | Average. | |
| £ | £ | £ | £ | £ | £ | |
| All industries, 1900–1 | 2,972,193 | 81.9 | 330,454 | 31.3 | 3,302,647 | 70.5 |
| All industries, 1905-6 | 3,979,593 | 88.5 | 478,026 | 41.9 | 4,457,619 | 79.1 |
| All industries, 1910–11 | 4,865,426 | 115.1 | 706,844 | 50.6 | 5,591,270 | 99.4 |
| All industries, 1915–16 | 5,868,788 | 133.5 | 785,716 | 56.7 | 6,654,504 | 117.1 |
| All industries, 1918–19 | 7,033,491 | 159.4 | 1,009,216 | 68.8 | 8,042,707 | 136.8 |
| Principal Industries, 1918–19. | ||||||
| Meat freezing and preserving | 1,271,241 | 159.0 | 13,102 | 98.5 | 1,284,343 | 158.0 |
| Butter, cheese, and condensed-milk manufacture | 422,564 | 155.1 | 9,864 | 73.1 | 432,428 | 151.3 |
| Sawmilling and sash and door making | 1,057,404 | 183.6 | 5,581 | 91.5 | 1,062,985 | 182.6 |
| Engineering | 369,734 | 151.0 | 2,698 | 67.5 | 372,432 | 149.6 |
| — | Males. | Females. | Males and Females. | |||
|---|---|---|---|---|---|---|
| Total. | Average. | Total | Average. | Total. | Average. | |
| £ | £ | £ | £ | £ | £ | |
| Printing, publishing, and bookbinding | 480,144 | 183.3 | 66,344 | 76.9 | 546,488 | 157.0 |
| Coachbuilding | 114,833 | 145.5 | 1,402 | 66.8 | 116,235 | 143.5 |
| Tanning, fellmongering, and wool-scouring | 211,856 | 161.3 | 1,726 | 115.0 | 213,582 | 160.8 |
| Furniture and cabinet making | 205,522 | 147.4 | 6,957 | 76.5 | 212,479 | 143.1 |
| Woollen-milling | 131,572 | 168.9 | 93,416 | 86.3 | 224,988 | 120.8 |
| Tailoring | 138,538 | 169.2 | 133,108 | 75.7 | 271,646 | 105.3 |
| Dress and millinery making | 7,867 | 178.8 | 187,099 | 59.3 | 194,966 | 60.9 |
| Boot and shoe making | 233,699 | 158.5 | 63,285 | 76.2 | 296,984 | 128.9 |
| Clothing-manufacture | 89,989 | 150.7 | 260,437 | 66.7 | 350,426 | 77.8 |
| Flax-milling | 226,331 | 161.9 | 256 | 128.0 | 226,587 | 160.7 |
In 1918–19 total salaries and wages paid on account of administration, production, and distribution were returned as shown in the next table. Percentages of total salaries and wages are given in each case for purposes of comparison (all and principal industries).
| — | Administrative. | Productive. | Distributive. | |||
|---|---|---|---|---|---|---|
| Amount. | Per Cent. of Total. | Amount. | Per Cent. of Total. | Amount. | Per Cent. of Total. | |
| £ | £ | £ | ||||
| All industries | 483,074 | 5.1 | 8,042,707 | 84.9 | 950,162 | 10.0 |
| Principal Industries. | ||||||
| Meat freezing and preserving | 52,354 | 4.1 | 1,218,548 | 94.9 | 13,441 | 1.0 |
| Butter, cheese, and condensed-milk manufacture | 34,168 | 7.9 | 374,671 | 86.7 | 23,589 | 5.4 |
| Sawmilling, sash and door making | 29,018 | 2.7 | 944,683 | 88.9 | 89,284 | 8.4 |
| Engineering | 27,366 | 6.5 | 372,432 | 88.1 | 22,939 | 5.4 |
| Printing, publishing, and bookbinding | 58,316 | 8.5 | 546,488 | 79.6 | 81,969 | 11.9 |
| Coachbuilding | 2,389 | 2.0 | 116,235 | 97.1 | 1,088 | 0.9 |
| Tanning, fellmongering, and woolscouring | 6,914 | 3.0 | 213,582 | 93.2 | 8,798 | 3.8 |
| Furniture and cabinetmaking | 10,107 | 4.3 | 212,479 | 91.8 | 8,979 | 3.9 |
| Woollen-milling | 4,393 | 1.9 | 224,988 | 96.5 | 3,789 | 1.6 |
| Tailoring | 4,302 | 1.5 | 271,646 | 95.0 | 9,919 | 3.5 |
| Dress and millinery making | 1,111 | 0.6 | 194,966 | 98.5 | 1,911 | 0.9 |
| Boot and shoe making | 5,763 | 1.8 | 296,984 | 92.3 | 19,091 | 5.9 |
| Clothing-manufacture | 3,622 | 0.9 | 350,426 | 95.6 | 12,934 | 3.5 |
| Flax-milling | 6,492 | 2.8 | 226,587 | 96.8 | 995 | 0.4 |
The total horse-power in use in 1918–19 was 158,996, an increase of 12,955 since 1915–16. The average horse-power per establishment was 37.38, and per employee 2.70—increases of 6.11 and 0.17 respectively. Comparative figures for the last five collections are given in the following table.
| — | 1900–1. | 1905-06. | 1910–11. | 1915–16. | 1918–19. |
|---|---|---|---|---|---|
| All Industries. | |||||
| Total horse-power | 39,113 | 60,335 | 100,587 | 146,041 | 158,996 |
| Deduct figures for industries included in some years and not in others | 127 | 403 | 477 | ||
| Comparative figures for industries common to all years | 39,113 | 60,335 | 100,460 | 145,638 | 158,519 |
| Average per establishment | 10.7 | 14.4 | 22.9 | 31.27 | 37.38 |
| Average per productive employee | 0.8 | 1.7 | 1.8 | 2.53 | 2.70 |
| Principal Industries (Total Horsepower). | |||||
| Meat freezing and preserving | 7,057 | 9,498 | 16,531 | 28,767 | 36,555 |
| Butter, cheese, and condensed - milk manufacture | 2,399 | 3,759 | 5,995 | 12,890 | 13,762 |
| Sawmilling, sash and door making | 8,744 | 13,278 | 19,484 | 16,816 | 18,608 |
| Engineering | 541 | 1,109 | 3,333 | 3,322 | 4,408 |
| Printing, publishing, and bookbinding | 956 | 1,520 | 3,370 | 4,240 | 4,475 |
| Coachbuilding | 128 | 395 | 657 | 1,018 | 648 |
| Tanning, fellmongering, and woolscouring | 1,108 | 980 | 1,927 | 1,890 | 2,963 |
| Furniture and cabinetmaking | 369 | 706 | 1,339 | 1,853 | 2,010 |
| Woollen-milling | 1,554 | 1,945 | 2,641 | 3,080 | 3,452 |
| Boot and shoe making | 184 | 328 | 680 | 831 | 1,197 |
| Clothing-manufacture | 67 | 135 | 576 | 488 | 613 |
| Flax-milling | 1,190 | 3,087 | 2,516 | 3,316 | 3,827 |
As regards kind of power used, the most remarkable development is the large increase in electric motors. Where electric current is available new installations of power are almost invariably of this type, and with increasing facilities no doubt will become correspondingly preponderant. The subjoined table shows the number of engines or motors of each kind in use at the last five censuses, together with the percentage each represents of the total number of engines or motors in the respective years.
| Kind of Power. | 1900–1. | 1905–6. | 1910–11. | 1915–16. | 1918–19. | |||||
|---|---|---|---|---|---|---|---|---|---|---|
| No. of Engines or Motors. | Per Cent. of Total. | No. of Engines or Motors. | Per Cent. Of Total. | No. of Engines or Motors. | Per Cent. of Total. | No. of Engines or Motors. | Per Cent. of Total. | No. of Engines or Motors. | Per Cent. of Total. | |
| Steam | 1,359 | 64.7 | 1,372 | 59.9 | 2,218 | 47.4 | 2,231 | 36.9 | 1,940 | 27.8 |
| Coal-gas | 407 | 19.4 | 452 | 19.7 | 853 | 18.2 | 809 | 13.4 | 539 | 7.7 |
| Suction-gas | 193 | 2.8 | ||||||||
| Oil | 31 | 1.5 | 97 | 4.2 | 231 | 4.9 | 239 | 4.0 | 215 | 3.2 |
| Electric | 15 | 0.7 | 55 | 2.4 | 1,084 | 23.2 | 2,516 | 41.6 | 5,855 | 55.4 |
| Water | 216 | 10.3 | 197 | 8.6 | 229 | 4.9 | 236 | 3.9 | 217 | 3.1 |
| Others and unspecified | 73 | 3.4 | 120 | 5.2 | 65 | 1.4 | 10 | 0.2 | ||
| Totals | 2,101 | 100.0 | 2,293 | 100.0 | 4,680 | 100.0 | 6,041 | 100.0 | 6,959 | 100.0 |
A comparison is now given between 1915–16 and 1918–19, showing the numbers of engines and motors of each kind in use in each provincial district and in the principal industries:—
| — | Steam. | Gas. | Oil. | Electric. | Water. | Other and Unspecified. | Total. | |||||||
|---|---|---|---|---|---|---|---|---|---|---|---|---|---|---|
| 1915–16. | 1918–19. | 1915–16. | 1918–19. | 1915–16. | 1918–19. | 1915–16. | 1918–19. | 1915–16. | 1918–19. | 1915–16. | 1918–19. | 1915–16. | 1918–19. | |
| Provincial districts— | ||||||||||||||
| Auckland | 553 | 496 | 243 | 223 | 80 | 55 | 712 | 1,051 | 37 | 37 | 2 | 1,627 | 1,862 | |
| Taranaki | 339 | 181 | 17 | 20 | 18 | 13 | 99 | 144 | 86 | 61 | 559 | 419 | ||
| Hawke's Bay | 126 | 95 | 54 | 59 | 16 | 25 | 76 | 125 | 3 | 3 | 4 | 279 | 307 | |
| Wellington | 355 | 411 | 222 | 213 | 41 | 47 | 589 | 806 | 11 | 16 | 1 | 1,219 | 1,493 | |
| Marlborough | 31 | 26 | 8 | 9 | 3 | 2 | 14 | 2 | 1 | 1 | 57 | 40 | ||
| Nelson | 93 | 76 | 31 | 36 | 12 | 7 | 35 | 48 | 9 | 12 | 180 | 179 | ||
| Westland | 112 | 124 | 18 | 22 | 1 | 1 | 3 | 1 | 8 | 6 | 142 | 154 | ||
| Canterbury | 229 | 178 | 123 | 70 | 27 | 25 | 471 | 946 | 22 | 23 | 872 | 1,242 | ||
| Otago | 206 | 168 | 59 | 50 | 21 | 25 | 444 | 651 | 52 | 40 | 3 | 785 | 934 | |
| Southland | 187 | 185 | 34 | 30 | 20 | 15 | 73 | 81 | 7 | 18 | 321 | 329 | ||
| Dominion (all industries) | 2,231 | 1,940 | 809 | 732 | 239 | 215 | 2,516 | 3,855 | 236 | 217 | 10 | 6,041 | 6,959 | |
| Principal Industries. | ||||||||||||||
| Meat freezing and preserving | 348 | 249 | 46 | 68 | 10 | 6 | 525 | 868 | 34 | 13 | 963 | 1,204 | ||
| Butter, cheese, and condensed-milk manufacture | 583 | 581 | 26 | 17 | 13 | 6 | 33 | 75 | 34 | 40 | 3 | 692 | 719 | |
| Sawmilling, sash and door making | 502 | 521 | 3 | 17 | 7 | 4 | 13 | 68 | 5 | 525 | 615 | |||
| Engineering | 43 | 40 | 71 | 44 | 13 | 7 | 125 | 202 | 12 | 14 | 264 | 307 | ||
| Printing, publishing, and bookbinding | 7 | 8 | 153 | 125 | 27 | 31 | 428 | 470 | 24 | 22 | 1 | 640 | 656 | |
| Coachbuilding | 10 | 2 | 40 | 29 | 40 | 23 | 63 | 59 | 5 | 1 | 158 | 114 | ||
| Tanning, fellmongering, and wool-scouring | 53 | 50 | 8 | 11 | 6 | 6 | 49 | 151 | 2 | 118 | 218 | |||
| Furniture and cabinet making | 28 | 12 | 87 | 64 | 9 | 88 | 132 | 4 | 7 | 207 | 224 | |||
| Woollen-milling | 16 | 16 | 5 | 5 | 14 | 15 | 1 | 1 | 36 | 37 | ||||
| Boot and shoe making | 5 | 25 | 18 | 1 | 70 | 102 | 1 | 101 | 121 | |||||
| Clothing-manufacture | 3 | 14 | 4 | 91 | 185 | 1 | 1 | 109 | 192 | |||||
| Flax-milling | 72 | 42 | 24 | 3 | 5 | 2 | 126 | 11 | 3 | 114 | 174 | |||
The following table gives values of products of all and principal industries at each enumeration since 1900–1. together with the percentage increase during each period:—
| Industry. | 1900–1. | 1905-6. | 1910–11. | 1915–16. | 1918–19. | ||||
|---|---|---|---|---|---|---|---|---|---|
| Value of Products. | Value of Products. | Increase per Cent. | Value of Products. | Increase per Cent. | Value of Products. | Increase per Cent. | Value of Products. | Increase per Cent. | |
*Decrease. | |||||||||
| £ | £ | £ | £ | £ | |||||
| All industries | 12,863,969 | 23,371,177 | 31,729,002 | 45,454,184 | 58,374,507 | ||||
| Deduct figures for industries included in some years and not in others | 667,337 | 908,236 | 1,695,799 | ||||||
| Comparative figures for industries common to all years | 12,863,969 | 23,371,177 | 81.7 | 31,061,665 | 32.9 | 44,545,948 | 43.4 | 56,678,708 | 27.2 |
| Principal Industries. | |||||||||
| Meat freezing and preserving | 3,834,891 | 4,928,545 | 28.5 | 7,422,187 | 50.6 | 12,613,571 | 69.4 | 14,852,732 | 17.8 |
| Butter, cheese, and condensed-milk manufacture | 1,535,150 | 2,581,639 | 68.5 | 3,919,184 | 51.8 | 7,670,752 | 95.7 | 10,056,782 | 31.1 |
| Sawmilling and sash and door making | 1,268,689 | 2,128,766 | 67.9 | 2,699,888 | 26.8 | 1,898,526 | -29.0* | 2,329,535 | 22.7 |
| Engineering | 361,958 | 437,036 | 20.7 | 751,485 | 76.5 | 883,496 | 17.6 | 1,123,300 | 27.1 |
| Printing, publishing, and bookbinding | 704,285 | 1,067,827 | 51.6 | 1,377,926 | 29.0 | 1,697,381 | 23.2 | 2,159,217 | 27.2 |
| Coachbuilding | 216,077 | 294,818 | 36.4 | 396,012 | 34.3 | 487,824 | 23.2 | 308,121 | -36.7* |
| Tanning, fellmongering, and wool-scouring | 1,888,107 | 1,836,310 | –1.7* | 2,036,770 | 10.9 | 2,755,283 | 35.3 | 3,662,659 | 32.9 |
| Furniture and cabinet making | 241,024 | 328,185 | 36.2 | 497,681 | 51.6 | 578,560 | 16.3 | 692,993 | 19.8 |
| Woollen-milling | 359,382 | 397,348 | 10.2 | 377,713 | -4.9* | 717,638 | 89.9 | 956,434 | 33.3 |
| Tailoring | 301,356 | 578,416 | 91.9 | 936,237 | 61.9 | 828,840 | –11.4* | 914,170 | 10.3 |
| Dress and millinery making | 312,436 | 331,268 | 6.0 | 575,059 | 73.6 | 568,472 | –1.1* | 652,170 | 14.7 |
| Boot and shoe making | 529,254 | 501,065 | -5.3* | 619,873 | 23.7 | 801,572 | 29.3 | 1,199,897 | 49.7 |
| Clothing-manufacture | 446,173 | 423,144 | -5.2* | 507,125 | 19.8 | 908,117 | 79.7 | 1,498,132 | 65.0 |
| Flax-milling | 203,492 | 557,808 | 174.1 | 284,399 | -49.0* | 470,774 | 65.5 | 681,369 | 44.7 |
For comparative purposes value of output per productive employee is frequently calculated and given over a period of years, but owing to increased prices of commodities it would appear that such a procedure would show to a considerable extent a fictitious increase in the productivity of labour. It has been thought advisable, therefore, to substitute for the unit “productive employee” an arbitrary unit “£100 expended in productive wages.” The results of this are now given from 1900–1 to 1918–19.
| — | 1900–1. | 1905-6. | 1910–11. | 1915–16. | 1918–19. |
|---|---|---|---|---|---|
| £ | £ | £ | £ | £ | |
| All industries | 541 | 526 | 569 | 683 | 726 |
| Principal Industries. | |||||
| Meat freezing and preserving | 1,813 | 1,128 | 1,280 | 1,637 | 1,219 |
| Butter, cheese, and condensed-milk manufacture | 1,592 | 1,969 | 2,305 | 2,939 | 2,684 |
| Sawmilling and sash and door making | 247 | 255 | 349 | 204 | 247 |
| Engineering | 283 | 260 | 289 | 281 | 302 |
| Printing, publishing, and bookbinding | 247 | 266 | 281 | 287 | 395 |
| Coachbuilding | 259 | 254 | 264 | 297 | 265 |
| Tanning, fellmongering, and wool-scouring | 1,185 | 1,791 | 1,481 | 1,880 | 1,715 |
| Furniture and cabinet making | 264 | 246 | 279 | 212 | 326 |
| Woollen-milling | 321 | 378 | 275 | 382 | 425 |
| Tailoring | 293 | 269 | 273 | 282 | 337 |
| Dress and millinery making | 398 | 292 | 308 | 277 | 335 |
| Boot and shoe making | 275 | 292 | 313 | 336 | 404 |
| Clothing-manufacture | 326 | 293 | 299 | 384 | 428 |
| Flax-milling | 201 | 722 | 512 | 608 | 301 |
The most satisfactory basis for comparison between one industry and another is the surplus of value of the finished product over the cost of materials used or treated. This surplus or added value represents the fund from which are derived wages, cost of power, overhead and other expenses, and profits.
These figures are, however, subject to the same disability as regards historical comparisons as are any other monetary expressions—viz., they are subject to distortion owing to fluctuations in price.
| — | 1900–1. | 1905–6. | 1910–11. | 1915–16. | 1918–19. | ||||
|---|---|---|---|---|---|---|---|---|---|
| Added Value. | Added Value | Increase per Cent. | Added Value. | Increase per Cent. | Added Value. | Increase per Cent. | Added Value. | Increase per Cent. | |
* Not available. † Decrease. | |||||||||
| £ | £ | £ | £ | £ | |||||
| All industries | 8,834,674 | 10,207,485 | 10,918,791 | 14,136,215 | 17,944,723 | ||||
| Deduct figures for industries included in some years and not in others | 497,067 | 472,905 | 670,919 | ||||||
| Comparative figures for industries common to all years | 8,834,674 | 10,207,485 | 15.50 | 10,421,724 | 2.10 | 13,663,310 | 31.10 | 17,273,804 | 26.40 |
| Principal Industries. | |||||||||
| Meat freezing and preserving | * | 1,219,320 | 771,313 | -36.70† | 2,058,666 | 166.90 | 2,306,284 | 12.00 | |
| Butter, cheese, and condensed-milk manufacture | 339,550 | 519,424 | 52.90 | 614,191 | 18.20 | 1,406,781 | 129.00 | 1,949,089 | 38.50 |
| Sawmilling and sash and door making | * | 1,922,122 | 1,446,735 | -24.74† | 902,042 | -37.65† | 1,275,355 | 41.32 | |
| Engineering | 175,750 | 213,671 | 21.58 | 436,114 | 104.11 | 522,016 | 19.70 | 715,448 | 37.05 |
| Printing, publishing, and bookbinding | 504,042 | 794,970 | 57.72 | 1,063,163 | 33.74 | 1,265,119 | 10.00 | 1,374,046 | 8.60 |
| Coachbuilding | 127,848 | 172,434 | 34.87 | 239,183 | 38.71 | 301,575 | 26.09 | 179,526 | -40.47† |
| Tanning, fellmongering, and wool-scouring | 496,784 | 634,992 | 27.82 | 247,998 | -60.94† | 539,866 | 117.69 | 542,994 | 0.58 |
| Furniture and cabinet making | 139,429 | 170,701 | 22.43 | 282,650 | 65.58 | 325,506 | 15.16 | 370,514 | 13.83 |
| Woollen-milling | 163,301 | 190,501 | 16.66 | 129,526 | -32.01† | 306,006 | 136.25 | 392,359 | 28.22 |
| Tailoring | 178,503 | 334,225 | 87.24 | 571,848 | 71.09 | 495,394 | 13.37 | 488,127 | 1.47 |
| Dress and millinery making | 139,225 | 150,067 | 7.79 | 289,486 | 92.90 | 300,617 | 3.85 | 321,787 | 7.04 |
| Boot and shoe making | 255,929 | 231,401 | -9.58† | 284,993 | 23.16 | 360,280 | 26.42 | 481,581 | 33.67 |
| Clothing-manufacture | 204,319 | 207,310 | 1.46 | 209,212 | 0.92 | 347,737 | 66.21 | 530,036 | 52.42 |
| Flax-milling | 168,644 | 189,356 | 12.28 | 156,237 | –17.49† | 185,120 | 18.49 | 474,164 | 156.14 |
Appended is a table showing the number of all and principal industries in each provincial district in 1918–19:—
| — | Auckland. | Taranaki. | Hawke's Bay. | Wellington | Marlborough | Nelson. | Westland. | Canterbury. | Otago. | Southland. | Dominion. |
|---|---|---|---|---|---|---|---|---|---|---|---|
| All industries | 1,100 | 224 | 216 | 917 | 38 | 126 | 91 | 673 | 592 | 277 | 4,254 |
| Principal Industries. | |||||||||||
| Meat freezing and preserving | 8 | 3 | 6 | 10 | 1 | 1 | 7 | 7 | 5 | 48 | |
| Butter, cheese, and condensed-milk manufacture | 65 | 83 | 25 | 83 | 7 | 14 | 9 | 30 | 37 | 52 | 405 |
| Sawmilling and sash and door making | 92 | 9 | 15 | 67 | 4 | 23 | 28 | 21 | 14 | 28 | 301 |
| Engineering | 34 | 5 | 7 | 33 | 1 | 4 | 4 | 17 | 21 | 6 | 132 |
| Printing, publishing, and bookbinding | 75 | 13 | 12 | 57 | 2 | 6 | 4 | 37 | 36 | 17 | 259 |
| Coachbuilding | 42 | 8 | 8 | 27 | 7 | 1 | 19 | 9 | 8 | 129 | |
| Tanning, fellmongering, and wool-scouring | 11 | 1 | 10 | 12 | 1 | 1 | 15 | 9 | 5 | 65 | |
| Furniture and cabinet making | 71 | 11 | 10 | 58 | 1 | 6 | 6 | 29 | 19 | 8 | 219 |
| Woollen-milling | 1 | 1 | 1 | 3 | 4 | 10 | |||||
| Tailoring | 96 | 19 | 17 | 55 | 4 | 8 | 6 | 55 | 52 | 23 | 335 |
| Dress and millinery making | 72 | 9 | 10 | 66 | 1 | 8 | 5 | 72 | 73 | 25 | 341 |
| Boot and shoe making | 35 | 1 | 15 | 1 | 13 | 8 | 2 | 75 | |||
| Clothing-manufacture | 45 | 2 | 1 | 45 | 33 | 26 | 4 | 156 | |||
| Flax-milling | 17 | 1 | 1 | 20 | 3 | 4 | 2 | 3 | 8 | 18 | 77 |
A table is now given showing for all industries, and individually for the principal industries, the number established during the periods indicated:—
| — | Prior to 1860. | 1860-69. | 1870-79. | 1880-89. | 1890-99. | 1900-4. | 1905-9. | 1910. | 1911. | 1912. | 1913. | 1914. | 1915. | 1916. | 1917. | 1918. | Not stated. | Total. |
|---|---|---|---|---|---|---|---|---|---|---|---|---|---|---|---|---|---|---|
| All industries | 59 | 186 | 277 | 436 | 536 | 438 | 586 | 172 | 146 | 177 | 184 | 188 | 137 | 155 | 169 | 184 | 224 | 4254 |
| Principal Industries. | ||||||||||||||||||
| Meat freezing and preserving | 1 | 2 | 1 | 15 | 4 | 4 | 2 | 4 | 1 | 2 | 5 | 4 | 1 | 1 | 1 | 48 | ||
| Butter, cheese, and condensed-milk manufacture | 3 | 18 | 72 | 51 | 46 | 20 | 24 | 23 | 21 | 15 | 23 | 16 | 13 | 6 | 54 | 405 | ||
| Sawmilling and sash and door making | 1 | 6 | 19 | 24 | 30 | 35 | 45 | 9 | 9 | 18 | 16 | 13 | 10 | 13 | 19 | 30 | 4 | 301 |
| Engineering | 2 | 11 | 13 | 8 | 9 | 13 | 17 | 7 | 9 | 12 | 8 | 6 | 4 | 2 | 4 | 7 | 132 | |
| Printing, publishing, and bookbinding | 7 | 28 | 42 | 37 | 40 | 21 | 30 | 5 | 6 | 9 | 11 | 10 | 2 | 4 | 5 | 1 | 1 | 259 |
| Coachbuilding | 4 | 7 | 12 | 20 | 19 | 10 | 19 | 8 | 7 | 4 | 4 | 1 | 3 | 2 | 1 | 3 | 5 | 129 |
| Tanning, fellmongering, and wool-scouring | 4 | 7 | 14 | 10 | 6 | 5 | 4 | 1 | 4 | 5 | 1 | 4 | 65 | |||||
| Furniture and cabinet making | 2 | 8 | 10 | 20 | 29 | 18 | 33 | 10 | 10 | 7 | 10 | 14 | 6 | 12 | 12 | 13 | 5 | 219 |
| Woollen-milling | 3 | 4 | 1 | 1 | 1 | 10 | ||||||||||||
| Tailoring | 4 | 12 | 12 | 28 | 47 | 54 | 49 | 14 | 18 | 16 | 11 | 24 | 8 | 13 | 9 | 9 | 7 | 335 |
| Dress and millinery making | 3 | 9 | 12 | 32 | 28 | 19 | 47 | 17 | 15 | 14 | 23 | 20 | 12 | 19 | 24 | 28 | 19 | 341 |
| Boot and shoe making | 2 | 7 | 14 | 7 | 11 | 11 | 1 | 2 | 3 | 3 | 3 | 3 | 7 | 1 | 75 | |||
| Clothing-manufacture | 6 | 3 | 7 | 11 | 13 | 16 | 24 | 2 | 5 | 2 | 4 | 8 | 14 | 10 | 7 | 14 | 10 | 156 |
| Flax-milling | 1 | 5 | 15 | 14 | 3 | 1 | 5 | 4 | 4 | 5 | 13 | 1 | 6 | 77 | ||||
The following table gives a general summary of various particulars as at the 31st March, 1919:—
| — | Number of Establishments. | Average Number of Employees for Year ended 31st March, 1919. | Total Amount paid in Salaries and Wages during Year ended 31st March. 1919. | Total Horsepower available. | Cost of Materials used or operated upon. | Value of Products. | Approximate Value of Land, Buildings, Machinery, and Plant. |
|---|---|---|---|---|---|---|---|
* Information not shown where the number of establishments is so small that individual particulars might be identified. † Total expenditure, less wages. | |||||||
| Animal food— | £ | £ | £ | £ | |||
| Meat, freezing and preserving | 48 | 8,130 | 1,284,343 | 36,555 | 12,546,448 | 14,852,732 | 4,615,191 |
| Ham and bacon curing | 27 | 273 | 45,235 | 502 | 469,162 | 514,507 | 136,401 |
| Fish curing and preserving | 13 | 83 | 14,450 | 125 | 30,536 | 50,569 | 29,507 |
| Butter, cheese, and condensed-milk manufacture | 405 | 2,859 | 432,428 | 13,762 | 8,107,693 | 10,056,782 | 1,597,615 |
| Vegetable food— | |||||||
| Grain-milling | 51 | 647 | 109,743 | 4,255 | 2,061,762 | 2,467,261 | 542,688 |
| Biscuit and confectionery manufacture | 49 | 1,640 | 165,041 | 1,385 | 537,297 | 838,226 | 310,813 |
| Fruit-preserving and jam-making | 12 | 572 | 35,154 | 170 | 170,783 | 218,019 | 76,810 |
| Sugar-refining | 1 | * | * | * | * | * | * |
| Baking-powder manufacture | 4 | 68 | 8,791 | 40 | 96,858 | 131,989 | 12,660 |
| Drinks, narcotics, and stimulants— | |||||||
| Brewing and malting | 56 | 1,024 | 205,089 | 1,931 | 393,735 | 739,412 | 654,215 |
| Colonial-wine making | 4 | 20 | 2,342 | 10 | 1,821 | 5,416 | 8,593 |
| Aerated-water and cordial manufacture | 112 | 500 | 73,447 | 470 | 86,273 | 268,315 | 208,258 |
| Coffee and spice grinding and preparing | 9 | 65 | 8,213 | 183 | 40,597 | 63,554 | 25,517 |
| Tobacco-preparing and cigarette-making | 4 | 32 | 3,119 | 12 | 5,735 | 16,647 | 8,353 |
| Sauce, pickle, and vinegar making | 15 | 259 | 30,463 | 341 | 88,146 | 140,267 | 61,812 |
| Tea blending and packing | 22 | 210 | 24,095 | 41 | 376,950 | 427,505 | 63,422 |
| Animal matters (not otherwise classed)— | |||||||
| Soap and candle making | 18 | 270 | 41,384 | 380 | 310,962 | 438,290 | 84,796 |
| Glue-manufacture | 2 | * | * | * | * | * | * |
| Sausage-casing manufacture | 21 | 283 | 51,250 | 43 | 104,441 | 164,421 | 31,033 |
| Boiling-down and manure-making | 45 | 473 | 76,169 | 1,609 | 472,168 | 700,688 | 294,822 |
| Working in wood— | |||||||
| Coopering and casemaking | 25 | 370 | 65,593 | 868 | 197,178 | 331,322 | 83,299 |
| Sawmilling, sash and door making | 301 | 5,821 | 1,062,985 | 18,608 | 1,054,180 | 2,329,535 | 1,954,681 |
| Woodware and turnery manufacture | 66 | 336 | 54,830 | 875 | 91,721 | 184,885 | 130,293 |
| Vegetable produce for fodder— | |||||||
| Grain-crushing | 5 | 40 | 7,589 | 217 | 35,164 | 49,609 | 18,532 |
| Paper-manufactures— | |||||||
| Paper-milling | 3 | * | * | * | * | * | * |
| Paper-bag and box making | 9 | 172 | 18,394 | 74 | 38,169 | 71,487 | 30,760 |
| Heat, light, and power— | |||||||
| Gas making and supply | 48 | 1,885 | 259,925 | 384,807 | 1,041,345 | 3,242,467 | |
| Electricity generation and supply | 45 | 536 | 94,913 | 28,770 | 297,796 | 463,560 | 2,253,260 |
| Electric tramways | 10 | 2,153 | 384,969 | 441,257† | 876,093 | 2,389,095 | |
| Processes relating to stone, clay, glass, &.— | |||||||
| Stone-crushing | 37 | 311 | 49,690 | 1,284 | 5,961 | 81,072 | 124,780 |
| Lime crushing or burning and cement-making | 18 | 602 | 111,929 | 9,232 | 74,723 | 329,610 | 753,543 |
| Brick, tile, and pottery making | 68 | 851 | 125,634 | 3,133 | 17,860 | 239,881 | 413,488 |
| Asphalt-making | 7 | 29 | 5,055 | 44 | 18,272 | 29,304 | 18,118 |
| Monumental masonry | 22 | 172 | 26,969 | 182 | 27,727 | 83,329 | 33,420 |
| Leadlight-making and glass-bevelling | 15 | 89 | 12,862 | 111 | 21,937 | 50,193 | 33,516 |
| Electroplating | 8 | 30 | 3,102 | 47 | 2,874 | 11,018 | 12,876 |
| Pumice-insulation making | 1 | * | * | * | * | * | * |
| Concrete block or pipe and fibrous-plaster making | 15 | 88 | 13,307 | 20 | 12,253 | 34,392 | 26,704 |
| Metals other than gold or silver— | |||||||
| Tinned-plate and sheet-metal working | 77 | 815 | 117,765 | 382 | 277,700 | 482,442 | 212,054 |
| Iron and brass founding, boilermaking | 36 | 503 | 83,216 | 904 | 100,173 | 263,104 | 179,524 |
| Engineering | 132 | 2,731 | 422,737 | 4,408 | 407,852 | 1,123,300 | 786,966 |
| Electrical engineering | 13 | 166 | 21,472 | 62 | 31,606 | 64,643 | 24,796 |
| Rangemaking | 8 | 212 | 32,369 | 329 | 36,082 | 86,694 | 84,487 |
| Wireworking | 15 | 59 | 8,401 | 106 | 31,153 | 53,694 | 33,911 |
| Fencing-standard making | 2 | * | * | * | * | * | * |
| Precious metals— | |||||||
| Jewellery and watch making | 53 | 251 | 34,353 | 71 | 51,585 | 117,612 | 112,773 |
| Books and publications— | |||||||
| Printing, publishing, and bookbinding | 259 | 4,447 | 686,773 | 4,475 | 785,171 | 2,159,217 | 1,627,849 |
| — | Number of Establishments. | Average Number of Employees for Year ended 31st March, 1919. | Total Amount paid in Salaries and Wages during Year ended 31st March, 1919. | Total Horsepower available. | Cost of Materials used or operated upon. | Value of Products. | Approximate Value of Land, Buildings, Machinery, and Plant. |
|---|---|---|---|---|---|---|---|
* Information not shown where the number of establishments is so small that individual particulars might be identified. | |||||||
| £ | £ | £ | £ | ||||
| Musical instruments— | |||||||
| Piano, &., making and repairing | 9 | 61 | 7,466 | 24 | 5,770 | 18,005 | 21,350 |
| Ornaments and minor art products— | |||||||
| Picture-frame making | 31 | 83 | 12,712 | 16 | 18,225 | 42,652 | 46,107 |
| Basket, perambulator, &., making | 18 | 116 | 12,622 | 14 | 15,536 | 43,770 | 27,275 |
| Equipment for sports and games— | |||||||
| Billiard-table making | 3 | * | * | * | * | * | * |
| Designs, medals, type, and dies— | |||||||
| Engraving and stamp-making | 14 | 56 | 7,758 | 23 | 5,551 | 22,016 | 26,406 |
| Ammunition and explosives— | |||||||
| Ammunition, explosives, and fireworks making | 1 | * | * | * | * | * | * |
| Machines, tools, and implements— | |||||||
| Agricultural-machinery making | 22 | 830 | 128,185 | 546 | 163,331 | 380,044 | 192,587 |
| Brush and broom making | 10 | 188 | 22,776 | 180 | 45,297 | 82,835 | 30,428 |
| Carriages and vehicles— | |||||||
| Coachbuilding | 129 | 833 | 119,712 | 648 | 128,595 | 308,121 | 268,610 |
| Motor and cycle engineering | 255 | 1,366 | 193,149 | 952 | 220,606 | 571,074 | 714,271 |
| Harness, saddlery, and leatherware— | |||||||
| Saddlery and harness making | 67 | 453 | 63,809 | 55 | 137,907 | 237,134 | 112.703 |
| Leather-goods manufacture | 10 | 103 | 11,097 | 4 | 35,706 | 59,258 | 18,716 |
| Tanning, fellmongering, and wool-scouring | 65 | 1,403 | 229,294 | 2,963 | 3,119,665 | 3,662,659 | 379,198 |
| Ships, boats, and their equipment— | |||||||
| Ship and boat building | 22 | 1,217 | 156,985 | 607 | 123,918 | 305,622 | 78,397 |
| Sail, tent, and oilskin making | 34 | 235 | 26,199 | 93 | 129,366 | 174,670 | 102,065 |
| House-furnishings— | |||||||
| Furniture and cabinet making | 219 | 1,585 | 231,565 | 2,010 | 322,479 | 692,993 | 405,899 |
| Blindmaking | 4 | 13 | 1,576 | 6 | 5,314 | 9,383 | 4,951 |
| Mattress-making | 11 | 213 | 24,890 | 198 | 78,742 | 104,525 | 33,444 |
| Rug and mat making | 2 | * | * | * | * | * | * |
| Chemicals and by-products— | |||||||
| Ink-manufacture | 2 | * | * | * | * | * | * |
| Starch-manufacture | 2 | * | * | * | * | * | * |
| Chemicals-manufacture | 13 | 139 | 16,998 | 172 | 60,329 | 95,594 | 47,805 |
| Paint and varnish manufacture | 6 | 24 | 3,723 | 95 | 14,339 | 27,320 | 18,275 |
| Sheep-dip manufacture | 1 | * | * | * | * | * | * |
| Match-manufacture | 2 | * | * | * | * | * | * |
| Boot-polish manufacture | 5 | 44 | 4,765 | 11 | 24,330 | 66,305 | 8,167 |
| Patent medicines and preparations manufacture | 16 | 169 | 20,540 | 153 | 74,057 | 126,948 | 37,593 |
| Textile fabrics— | |||||||
| Woollen-milling | 10 | 1,887 | 233,170 | 3,452 | 564,075 | 956,434 | 456,551 |
| Flock-milling | 7 | 28 | 3,438 | 198 | 11,018 | 18,521 | 9,526 |
| Apparel— | |||||||
| Tailoring | 335 | 2,677 | 285,867 | 35 | 426,043 | 914,170 | 679,901 |
| Dress and millinery making | 341 | 3,224 | 197,988 | 84 | 330,383 | 652,170 | 421,151 |
| Boot and shoe making | 75 | 2,427 | 321,838 | 1,197 | 718,316 | 1,199,897 | 313,350 |
| Hosiery-making | 10 | 177 | 17,529 | 87 | 61,158 | 103,401 | 30,108 |
| Umbrella-making | 10 | 57 | 5,328 | 4 | 17,428 | 32,842 | 24,953 |
| Clothing and waterproof making | 156 | 4,662 | 366,982 | 613 | 968,096 | 1,498,132 | 441,987 |
| Fibrous materials— | |||||||
| Rope and twine making | 7 | 197 | 27,410 | 511 | 131,883 | 172,070 | 61,997 |
| Bag and sack making | 2 | * | * | * | * | * | * |
| Flax-milling | 77 | 1,430 | 234,074 | 3,827 | 217,281 | 681,369 | 814,305 |
| Industries (included above) for which the number of schedules received was so small that operations of individual establishments might be identified | 1,081 | 149,819 | 4,044 | 1,565,917 | 2,040,081 | 311,069 | |
| Miscellaneous (not included above) | 35 | 158 | 21,082 | 149 | 344,555 | 422,551 | 76,984 |
| Totals | 4,254 | 66,910 | 9,475,943 | 158,996 | 40,429,784 | 58,374,507 | 29,559,817 |
As previously mentioned, a number of small repair-shops in some industries have this year been omitted from the statistics, and as these were practically all either under individual ownership or carried on as partnerships, this will account for a considerable portion of the apparently large decrease in the number of establishments thus organized. Details for the last three collections are as follows:—
| Character of Organization. | 1910–11. | 1915–16. | 1918–19. | |||
|---|---|---|---|---|---|---|
| No. | Output. | No. | Output. | No. | Output. | |
| £ | £ | £ | ||||
| Individual | 2,076 | 4,498,825 | 2,222 | 5,371,479 | 1,661 | 5,706,054 |
| Private firm or partnership | 1,126 | 4,706,066 | 1,042 | 3,881,718 | 921 | 4,693,331 |
| Public registered company | 566 | 15,635,535 | 445 | 21,623,870 | 447 | 23,179,563 |
| Private registered company | 433 | 4,062,757 | 595 | 6,833,220 | 761 | 13,744,611 |
| Municipal | 201 | 2,825,819 | 366 | 7,743,897 | 70 | 13,334,586 |
| Co-operative and miscellaneous | 394 | 9,716,362 | ||||
| Totals | 4,402 | 31,729,002 | 4,670 | 45,454,184 | 4,254 | 58,374,507 |
Table of Contents
ISSUES of this book for some few years prior to 1915 contained a schedule of the Acts in force coming within the definition of “labour laws,” together with those statutes now repealed and incorporated in existing laws. Detailed references to the principal labour laws were also given. Reference to wages will be found in the section on “Wages” in this issue.
The business dealt with by the Arbitration Court and Conciliation Councils during the year ended the 31st March, 1920, may be summarized as follows:—
| Number of Cases. | |
|---|---|
| Industrial agreements | 51 |
| Recommendations of Conciliation Councils | 168 |
| Awards of Arbitration Court | 131 |
The number of cases brought before Magistrates during the year ended the 31st March, 1920, in regard to enforcement of awards or breaches of the Industrial Conciliation and Arbitration Act was 121. The awards and agreements in force as at the 31st March, 1920, totalled 530.
The table following shows the work performed by Commissioners and Councils of Conciliation during the year ended the 31st March, 1920:—
| — | Industrial District. | Total. | ||
|---|---|---|---|---|
| Northern and Taranaki. | Wellington, Marlborough, Nelson, and Westland. | Canterbury, and Otago and Southland. | ||
| Industrial agreements arrived at and filed under section 26 by parties through the Commissioner alone | 4 | 5 | 9 | |
| Disputes dealt with by Conciliation Councils:— | ||||
| Industrial agreements filed under section 26 | 4 | 3 | 7 | |
| Recommendations fully accepted and forwarded to the Court to be made into awards | 27 | 21 | 61 | 109 |
| Recommendations substantially accepted and referred to Court to make awards | 19 | 17 | 10 | 46 |
| Only minor recommendation or no recommendation made | 2 | 4 | 7 | 13 |
| Totals | 56 | 50 | 78 | 184 |
The above table shows that out of 184 disputes dealt with by them 171 (or 93 per cent.) were settled or substantially settled by the Commissioners and Councils of Conciliation.
In a case arising out of the influenza epidemic it was decided that, providing the engagement had not been terminated by the requisite notice, an employer is obliged to pay wages to an employee during his temporary absence through sickness, or for the period when places of business were closed by order of the District Health Officer during the influenza epidemic. This ruling, if applied to other cases, is of course subject to the terms of the engagement and to the provisions of any award or industrial agreement affecting it.
War Legislation and Statute Law Amendment Act, 1918, Section 18.—This section provides that the Court of Arbitration may, if it thinks fit, on the application of any industrial union, amend the provisions of an award or industrial agreement with respect to the rates of wages on account of the increase in the cost of living. In a memorandum dated 19th April, 1919, the Court gave an indication of the general principles upon which it is proposed to deal with applications under this section. For the purposes of uniformity it was proposed to fix the basic wages for skilled, semi-skilled, and unskilled workers at 1s. 7 1/2d., 1s. 4 1/2d. to 1s. 6d., and 1s. 3 1/2d. per hour respectively (raised since 31st March, 1920, to 2s., 1s. 8d. to 1s. 10d., and 1s. 7d.), which wages should not be subject to variation during the currency of the award except that in addition a bonus would be given from time to time to compensate for the increase in the cost of living. The Court decided to adjust these bonuses half-yearly as at March and September in each year, taking into accordance the rise or fall in the cost of living as ascertained for the Dominion by the Government Statistician.
Returns of the number and membership of registered industrial unions of employers and workers are compiled annually. A quinquennial statement is given.
| NUMBER AND MEMBERSHIP OF UNIONS. | ||||
|---|---|---|---|---|
| At 31st December. | Employers. | Workers. | ||
| Unions. | Membership. | Unions. | Membership. | |
| 1915 | 141 | 5,718 | 389 | 67,661 |
| 1916 | 141 | 5,554 | 378 | 71,388 |
| 1917 | 145 | 5,390 | 382 | 72,873 |
| 1918 | 147 | 5,346 | 370 | 71,447 |
| 1919 | 139 | 5,146 | 380 | 82,553 |
The number of registered factories in the Dominion on the 31st March, 1920, was 13,490, employees thereat numbering 85,591.
| Year. | Number of Factories. | Number of Workers. |
|---|---|---|
| 1915–16 | 13,214 | 83,011 |
| 1916–17 | 12,455 | 78,188 |
| 1917–18 | 12,485 | 79,653 |
| 1918–19 | 12,444 | 82,783 |
| 1919-20 | 13,490 | 85,591 |
A table is given showing the number of accidents in factories during the past five years.
| Year. | Slight. | Moderate. | Serious. | Fatal. | Total. |
|---|---|---|---|---|---|
| 1915–16 | 837 | 160 | 65 | 3 | 1,065 |
| 1916–17 | 938 | 144 | 84 | 5 | 1,171 |
| 1917–18 | 509 | 317 | 65 | 10 | 901 |
| 1918–19 | 795 | 192 | 58 | 8 | 1,053 |
| 1919-20 | 652 | 454 | 105 | 7 | 1,218 |
There were sixty-five industrial disturbances during the year, including thirty-nine which involved the cessation of work for one day or less.
In addition, considerable unrest prevailed in the principal coal-mines from September, 1919, to February, 1920.
The following remarks are quoted verbatim from the annual report of the Labour Department:—
“A good deal of criticism has, of late years, been made respecting the work of the Arbitration Court and also regarding the constitution of that Court. In this connection it may be interesting to point out that the intention of the original Act was primarily to abolish “sweating” by fixing minimum wages for any workers that chose to register thereunder, leaving the ordinary law of supply and demand to determine the actual wages to be paid, and in this the Court has fulfilled its purpose; but the minimum wages have been in many cases forced into what has become a standard wage, with a tendency to levelling the workers’ wages up and down towards that amount. The fixing of a standard wage is no doubt practicable enough in unskilled or semi-skilled employments like those of waterside workers and coal-miners, but in skilled occupations some supplementary machinery (such as the setting-up of a shop committee for each establishment) seems to be required to fix the actual conditions, over and above the minimum, for the particular workers concerned, according to their skill.”
The majority of unions still preserve their registration under the Industrial Conciliation and Arbitration Act, which makes strikes unlawful. Very few have elected to come under the Labour Disputes Investigation Act which allows a strike after a reasonable time has elapsed. Only four disputes were heard during the year, three being successfully settled.
Factories Act.—There were in 1919-20 thirty-one prosecutions, resulting in thirty convictions.
Shops and Offices Act.—During the year 1919-20 there were 100 prosecutions under the Act. Convictions were obtained in ninety-three of these.
Scaffolding Inspection Act.—Eight hundred and ninety-seven notices of intention to erect scaffolding were received by the Department of Labour during the year ended the 31st March, 1920. Fifty-six accidents were reported under the Act. Of this number one was fatal; and five were of serious
character. Five prosecutions were made under the provisions of the Act, resulting in convictions in each case.
Workers’ Compensation Act.—Twenty-six cases were dealt with under this Act, as compared with twenty-nine during the previous year.
Footwear Regulation Act.—This Act makes illegal the sale of leather or apparently leather footwear unless the sole is of leather, or if not branded legibly with a statement of the materials used. Few complaints were received under this heading.
Rent-restriction.—The War Legislation Amendment Acts of 1916, 1917, and 1918 contain provisions calculated to prevent undue increases of rent and other hardships in connection with housing. Under these Acts 320 applications were received in the year 1919–20 for reduction of rents charged for dwellinghouses. No fewer than 174 of these were from Wellington. Action was taken in 242 cases, and in some 157 instances the increase was decided to be unjustified and rents reduced accordingly. The Act has proved of considerable benefit to tenants and returned soldiers. It has, however, undoubtedly had the effect of discouraging the building of houses for letting-purposes, and thus to a considerable extent defeated the very purpose of the Act. Further, in many cases tenants protected by rent-restriction have made considerable profits by subletting portions of their houses.
Shearers’ and Agricultural Labourers’ Accommodation Acts.—This amending Act came into force on the 1st July, 1920. Inspections made and notices to improve accommodation (under the previous Act) were: Shearers, 716 and 380; sawmill employees, 169 and 31; threshing-mill employees, 39 and 4; flax-mill employees, 77 and 2; agricultural labourers, 219 and 18.
The co-operative contract system is somewhat as follows: When a length of railway or road is to be constructed on the co-operative principle the formation-work is divided into sections the size of which depends upon the difficulty of the work. Plans and a simple specification of the work are prepared, also an estimate of the cost based on the rate of wages ruling in the district for similar work. The work, at a price reckoned at so-much per unit of quantity or measurement, is offered to a party of men, who, if they accept, become the contractors. The work done by the men is measured periodically, and full payment made to the party, who divide the money amongst themselves according to the time worked by each workman. The engineer in charge of the work has a certain amount of discretion and control in respect of the character of the men employed, the progress of the work, hours of labour, &.
The constitution of the party is left very much to the men themselves, and they have power, subject to approval of the engineer, to ballot out any member who proves himself undesirable or inefficient. The Department supplies the men with materials, explosives, &c, at cost price.
When the work is let by direct contract, tenders are publicly invited, but the sections of work included in each contract are more extensive than under the co-operative system, yet not too large to enable parties of working contractors to tender.
The number of labourers and artisans employed under the co-operative system during each month of the year ended the 31st March, 1920, was as follows:—
| Month. | Roads. | Railways. | Other Works. | Total. | |
|---|---|---|---|---|---|
| April, | 1919 | 1,197 | 1,538 | 606 | 3,341 |
| May, | 1919 | 1,371 | 1,625 | 664 | 3,660 |
| June, | 1919 | 1,463 | 1,749 | 780 | 3,992 |
| July, | 1919 | 1,417 | 1,798 | 760 | 3,975 |
| August, | 1919 | 1,498 | 1,953 | 715 | 4,166 |
| September, | 1919 | 1,390 | 1,886 | 741 | 4,017 |
| October, | 1919 | 1,406 | 1,907 | 760 | 4,073 |
| November, | 1919 | 1,483 | 1,820 | 754 | 4,057 |
| December, | 1919 | 1,477 | 1,632 | 759 | 3,868 |
| January, | 1920 | 1,614 | 1,612 | 826 | 4,052 |
| February, | 1920 | 1,781 | 1,708 | 838 | 4,327 |
| March, | 1920 | 1,839 | 1,759 | 784 | 4,382 |
The (monthly) average number of men employed since 1892 was as follows:—
| Year ended 31st March. | Roads. | Railways. Buildings, &. | Total. |
|---|---|---|---|
| 1892 | 261 | 527 | 788 |
| 1895 | 1,103 | 962 | 2,065 |
| 1900 | 1,825 | 1,243 | 3,068 |
| 1905 | 1,407 | 2,119 | 3,526 |
| 1910 | 1,762 | 3,929 | 5,691 |
| 1915 | 2,494 | 2,234 | 4,728 |
| 1917 | 965 | 1,875 | 2,840 |
| 1918 | 788 | 1,444 | 2,232 |
| 1919 | 1,042 | 1,841 | 2,883 |
| 1920 | 1,495 | 2,498 | 3,993 |
MEN'S BRANCHES.
The total number of men for whom employment has been found by the Department of Labour up to the end of March, 1920, is as given in the following statement, which also shows the number of persons dependent upon the men assisted:—
| Year ended 31st March. | Men. | Dependants. |
|---|---|---|
* Ten months only. | ||
| 1892* | 2,593 | 4,729 |
| 1895 | 3,030 | 8,883 |
| 1900 | 2,147 | 4,471 |
| 1905 | 3,130 | 3,425 |
| 1910 | 8,506 | 10,164 |
| 1915 | 7,515 | 8,342 |
| 1917 | 2,966 | 3,518 |
| 1918 | 2,952 | 3,675 |
| 1919 | 3,199 | 3,005 |
| 1920 | 4,205 | 2,709 |
| 128,824 | 162,350 | |
Of the 128,824 men assisted to 31st March, 1920, private employment was found for 59,710, while the remaining 69,114 went to works of various kinds for the General Government.
WOMEN'S BRANCHES.
In each of the four chief centres of population—Auckland, Wellington, Christchurch, and Dunedin—women's employment branches of the Labour Department were established in June, 1908. In January, 1909, a branch was opened at Nelson. Each branch is in charge of an experienced female officer, and every assistance is given, free of charge, to women seeking employment. During the year ended the 31st March, 1920, work was found for 1,406 women, making a total of 24,855 women assisted since the initiation of the system. In most cases the employment is domestic service.
Table of Contents
THE Advances to Settlers Office was established by an Act passed in 1894. An administrative officer called the Superintendent was appointed early in the following year, and a Board set up to advise and co-operate with the Superintendent. Advances can be granted only with the consent of the Board.
The legislation has been amended at different times, and is now embodied in the State Advances Act, 1913. It authorizes the borrowing of moneys for the purpose of lending to settlers, workers, and local authorities. Each year there may be borrowed for advances to settlers £1,500,000, to workers £750,000, and to local authorities £1,000,000.
From the inception of the scheme of advances to settlers in 1894, applications have been received to the number of 63,651 for loans totalling £26,004,047. The Advances Board authorized loans of £18,076,170 to 48,924 applicants, the total actual payments to 31st March, 1919, being £17,957,600, of which £9,972,323 has been repaid in respect of principal. A table is given showing the business to date and for each of the past ten years.
| Year ended 31st March. | Applications received. | Loans authorized. | Amount advanced. | Amount repaid. | ||
|---|---|---|---|---|---|---|
| Number. | Amount. | Number. | Amount. | |||
| £ | £ | £ | £ | |||
| 1911 | 4,957 | 2,122,749 | 3,571 | 1,282,880 | 1,204,310 | 726,714 |
| 1912 | 5,355 | 2,593,084 | 4,610 | 2,191,300 | 2,235,495 | 1,018,286 |
| 1913 | 3,187 | 1,164,225 | 2,114 | 749,590 | 937,435 | 698,938 |
| 1914 | 3,604 | 1,400,248 | 2,390 | 878,855 | 978,395 | 710,590 |
| 1915 | 3,870 | 1,826,265 | 2,100 | 749,040 | 1,136,475 | 754,810 |
| 1916 | 2,507 | 982,800 | 2,022 | 746,630 | 814,555 | 713,177 |
| 1917 | 1,619 | 660,975 | 1,412 | 515,270 | 589,975 | 643,751 |
| 1918 | 1,228 | 511,532 | 984 | 353,465 | 367,160 | 501,009 |
| 1919 | 1,326 | 579,022 | 986 | 363,875 | 350,140 | 529,023 |
| 1920 | 2,841 | 1,520,128 | 2,219 | 1,031,855 | 808,180 | 1,118,486 |
| Totals to 31/3/20 | 66,492 | 27,524,175 | 51,143 | 19,108,025 | 18,765,780 | 11,090,809 |
Not all the advances to settlers are made by the Advances to Settlers Branch of the State Advances Office. Part of the business shown in the above table relates to the Public Debt Sinking Funds Branch and the Advances Office Sinking Fund Branch. The advances to settlers authorized by these three branches during 1919–20 are as follows:—
| Advances authorized. | ||
|---|---|---|
| Branch. | Number. | Amount. |
| £ | ||
| Advances to Settlers | 1,949 | 862,990 |
| Public Debt Sinking Funds | 9 | 3,840 |
| Advances Office Sinking Fund | 261 | 165,025 |
| Totals | 2,219 | 1,031,855 |
The advances authorized in each provincial district during the year, and the total to 31st March, 1920, are next shown.
| Provincial District. | Advances authorized, 1919-20. | Total Advances authorized to 31st March, 1920. | ||
|---|---|---|---|---|
| Number. | Amount. | Number. | Amount. | |
| £ | £ | |||
| Auckland | 810 | 372,165 | 17,275 | 6,004,373 |
| Taranaki | 88 | 41,825 | 5,364 | 2,488,864 |
| Hawke's Bay | 195 | 99,520 | 2,541 | 872,365 |
| Wellington | 604 | 305,525 | 12,103 | 4,816,648 |
| Marlborough | 44 | 19,940 | 1,296 | 543,205 |
| Nelson | 31 | 12,315 | 922 | 288,635 |
| Westland | 29 | 10,900 | 940 | 250,165 |
| Canterbury | 284 | 114,810 | 4,923 | 1,675,615 |
| Otago— | ||||
| Otago portion | 68 | 29,740 | 2,573 | 992,400 |
| Southland portion | 66 | 25,115 | 3,206 | 1,175,755 |
| Totals | 2,219 | 1,031,855 | 51,143 | 19,108,025 |
Dealing now only with the operations of the Advances to Settlers Branch, it is seen that during the year 1919–20 the advances authorized numbered 1,949, representing a total amount of £862,990. The number of borrowers and the sums actually advanced during the year, classified according to amount, were,—
| Category. | Number of Advances. | Amount advanced. |
|---|---|---|
| £ | ||
| Not exceeding £500 | 1,016 | 362,725 |
| Exceeding £500, but not exceeding £1,000 | 373 | 257,520 |
| Exceeding £1,000, but not exceeding £2,000 | 28 | 39,900 |
| Totals | 1,417 | £660,145 |
The nature of the security upon which these advances were made was as follows:—
| Security. | Number of Advances. | Amount advanced. |
|---|---|---|
| £ | ||
| Freehold | 1,154 | 530,310 |
| Leasehold | 259 | 127,345 |
| Freehold and leasehold combined | 4 | 2,490 |
| Totals | 1,417 | £660,145 |
The advances outstanding, classified according to amount, are as follows:—
| Category. | Number of Advances. | Amount outstanding. |
|---|---|---|
| £ | ||
| Not exceeding £500 | 14,698 | 3,171,191 |
| Exceeding £500, but not exceeding £1,000 | 2,645 | 2,086,871 |
| Exceeding £1,000, but not exceeding £2,000 | 1,066 | 1,498,145 |
| Exceeding £2,000, but not exceeding £3,000 | 102 | 256,172 |
| Totals | 18,511 | £7,012,379 |
The nature of the security for the total amount of advances outstanding on the 31st March, 1920, was,—
| Security. | Number of Advances. | Amount outstanding. |
|---|---|---|
| £ | ||
| Freehold | 11,313 | 5,108,763 |
| Leasehold | 6,992 | 1,784,198 |
| Freehold and leasehold combined | 206 | 119,418 |
| Totals | 18,511 | £7,012,379 |
The average freehold advance is £452, the average leasehold advance £257, and the average of advances secured on both freehold and leasehold combined £580.
The number and amounts of current advances on rural and urban and suburban land are,—
| Number. | Amount. | |
|---|---|---|
| £ | ||
| On rural land | 11,531 | 4,541,052 |
| On urban and suburban land | 6,980 | 2,471,327 |
| Totals | 18,511 | £7,012,379 |
The average rural advance is £394, and the average urban and suburban advance is £354.
The gross profits for the year ended the 31st March, 1920, were £64,270, and the cost of management £12,403, being 0.133 per cent., or 2s. 8d. per £100 on the capital employed. The net profits amounted to £50,895.
The total of the advances to workers up to the 31st March, 1920 (including moneys repaid and again advanced), was £3,785,895.
The applications received for loans during the year ended the 31st March, 1920, numbered 1,660, the aggregate amount required being £746,586. Advances authorized during 1919–20 numbered 1,083, representing a total amount of £420,465. The advances actually paid during the year numbered 604, for an aggregate of £225,055. The tenures upon which these loans were made were,—
| Tenure. | Number of Loans. | Aggregate Amount. |
|---|---|---|
| £ | ||
| Freehold | 588 | 220,980 |
| Leasehold | 16 | 4,075 |
| Totals | 604 | £225,055 |
The total number of loans and the aggregate amount authorized in each provincial district are as follows:—
| Provincial District. | Advances authorized 1919-20. | Total Advances to 31st March, 1920. | ||
|---|---|---|---|---|
| No. | Amount. | No. | Amount. | |
| £ | £ | |||
| Auckland | 256 | 98,905 | 4,143 | 1,233,465 |
| Taranaki | 38 | 13,420 | 443 | 124,505 |
| Hawke's Bay | 133 | 54,005 | 956 | 290,355 |
| Wellington | 308 | 125,490 | 3,624 | 1,125,080 |
| Marlborough | 21 | 7,885 | 424 | 124,015 |
| Nelson | 11 | 3,125 | 238 | 59,485 |
| Westland | 194 | 42,030 | ||
| Canterbury | 236 | 92,605 | 3,264 | 1,013,435 |
| Otago— | ||||
| Otago portion | 60 | 19,010 | 998 | 282,060 |
| Southland portion | 20 | 6,020 | 450 | 118,655 |
| Totals | 1,083 | 420,465 | 14,734 | 4,413,085 |
The net amount outstanding at the end of the financial year was £2,433,036, secured upon the following tenures:—
| Tenure. | Number of Loans outstanding. | Aggregate Amount outstanding. |
|---|---|---|
| £ | ||
| Freehold | 8,718 | 2,343,971 |
| Leasehold | 514 | 89,065 |
| Totals | 9,232 | £2,433,036 |
The following table gives particulars of the transactions for each of the past ten years, and the total transactions since the passing of the Government Advances to Workers Act on the 29th October, 1906.
| Year ended 31st March. | Applications received. | Loans authorized. | Amount advanced. | Amount repaid. | ||
|---|---|---|---|---|---|---|
| Number. | Amount. | Number. | Amount. | |||
| £ | £ | £ | £ | |||
| 1911 | 2,125 | 660,892 | 1,521 | 473,530 | 407,760 | 47,925 |
| 1912 | 2,223 | 750,772 | 1,900 | 612,910 | 543,840 | 78,853 |
| 1913 | 1,805 | 574,493 | 1,254 | 397,175 | 449,260 | 84,771 |
| 1914 | 1,599 | 528,240 | 1,200 | 339,200 | 272,860 | 80,933 |
| 1915 | 1,492 | 462,065 | 1,129 | 337,690 | 313,025 | 110,110 |
| 1916 | 1,079 | 383,365 | 953 | 297,630 | 275,680 | 115,535 |
| 1917 | 734 | 266,740 | 658 | 210,995 | 214,965 | 127,450 |
| 1918 | 555 | 197,738 | 411 | 129,710 | 125,855 | 139,485 |
| 1919 | 562 | 214,415 | 372 | 119,555 | 87,590 | 147,791 |
| 1920 | 1,660 | 746,586 | 1,083 | 420,465 | 225,055 | 368,597 |
| Totals from inception to 31/3/1920 | 18,956 | 6,160,556 | 14,734 | 4,413,085 | 3,785,895 | 1,352,848 |
During the ten years which have elapsed since the system of State advances to local authorities was initiated, 1,830 applications under this head have been received for loans totalling £7,137,827. Loans authorized, 1,351 in number, have aggregated £3,972,069, of which £3,411,745 has been actually advanced. Repayments to 31st March, 1920, have totalled £302,063, leaving an indebtedness of £3,109,682 in respect of principal moneys.
ADVANCES TO LOCAL AUTHORITIES.
| Year ended 31st March. | Applications received. | Loans authorized. | Amount advanced. | Amount repaid. | ||
|---|---|---|---|---|---|---|
| Number. | Amount. | Number. | Amount. | |||
| £ | £ | £ | £ | |||
| 1911 | 429 | 3,572,585 | 193 | 947,770 | 405,195 | 1,172 |
| 1912 | 257 | 1,184,133 | 227 | 1,047,484 | 790,485 | 8,010 |
| 1913 | 93 | 136,513 | 87 | 181,795 | 494,135 | 20,781 |
| 1914 | 167 | 166,165 | 72 | 84,970 | 259,430 | 29,600 |
| 1915 | 77 | 222,070 | 48 | 254,430 | 237,285 | 29,800 |
| 1916 | 170 | 263,858 | 164 | 238,970 | 285,410 | 35,192 |
| 1917 | 118 | 154,025 | 103 | 127,135 | 152,310 | 38,874 |
| 1918 | 110 | 171,110 | 109 | 158,055 | 128,150 | 41,681 |
| 1919 | 125 | 225,988 | 119 | 214,300 | 130,575 | 46,615 |
| 1920 | 284 | 1,041,380 | 229 | 717,160 | 311,880 | 49,034 |
| Totals to 31/3/20 | 1,830 | 7,137,827 | 1,351 | 3,972,069 | 3,411,745 | 302,063 |
As in the case of advances to settlers, advances to local authorities are made from three distinct sources—viz., the funds of the Advances to Local Authorities Branch of the State Advances Office, the Public Debt Sinking Funds, and the Advances Office Sinking Fund. Of the £130,575 advanced in 1919–20 as shown above, £88,935 came from the Local Authorities Branch, the Advances Office Sinking Fund contributing £52,345, and the Public Debt Sinking Funds £170,600. Of the amount outstanding at 31st March, the Public Debt Sinking Funds claimed £812,617, and the Advances Office Sinking Fund £136,642.
The Workers’ Dwellings Acts of 1905 and 1910 made provision for the erection by the State of workers’ dwellings on Crown lands purchased for that purpose. Purchase of houses already erected was also provided for. The total number of houses erected and purchased from the inception of the scheme to the 31st March, 1920, was 688, while at that date 127 others were in course of erection. Legislation on the subject of workers’ dwellings is now merged in the Housing Act, 1919.
Of recent years the Dominion has experienced a serious shortage of housing-accommodation. This position, while alleviated somewhat during war years, was felt all the more acutely when the members of the Expeditionary Forces were repatriated. By the end of 1919 there was a deficit over normal requirements of several thousands of houses. In an effort to overcome this difficulty the Housing Act was passed in November, 1919. A summary of its provisions will be found on pp. 28–29 of this volume. The administration of the Act is in the hands of the Housing Branch of the Labour Department. Owing to the high cost of material, it has been difficult in the extreme to build houses of a good standard, yet within the statutory maximum cost of £775 for a wooden house
and £850 for a brick or concrete one. The difficulty is greatly accentuated by the actual scarcity of both men and material. Regulations have been made by the Board of Trade with a view to preventing non-essential building and allowing concentration of effort on dwellinghouses. A summary of progress to 30th June, 1920, is:—
| Town. | Under Construction or Completed. | Negotiations in Progress for. |
|---|---|---|
| Auckland | 15 | 100 |
| Carterton | 2 | |
| Christchurch | 63 | 37 |
| Dunedin | 25 | |
| Feilding | 2 | 6 |
| Hamilton | 25 | |
| Hastings | 6 | |
| Hawera | 10 | 25 |
| Invercargill | 11 | |
| Levin | 1 | 2 |
| Marton | 4 | |
| Masterton | 8 | 40 |
| Morrinsville | 5 | |
| Napier | 1 | 10 |
| Nelson | 8 | 11 |
| New Plymouth | 10 | 43 |
| Oamaru | 8 | 5 |
| Otorohanga | 3 | |
| Paeroa | 2 | |
| Palmerston North | 10 | 15 |
| Stratford | 6 | |
| Taihape | 9 | |
| Te Aroha | 6 | |
| Te Awamutu | 6 | |
| Te Kuiti | 3 | |
| Timaru | 11 | |
| Wanganui | 35 | 10 |
| Winton | 4 | |
| Wellington | 145 | 350 |
| Total | 318 | 780 |
Table of Contents
THE law relating to old-age, military, and widows’ pensions is contained in the Pensions Act, 1913, a consolidation of previous enactments, in the Pensions Amendment Act, 1914, and in the Finance Acts of 1917, 1919, and 1920. The history of legislation dealing with old-age pensions is given in previous issues of this book. The first payments were made in the year 1898.
The minimum age for an applicant is sixty-five for men and sixty for women. In certain cases where young children are dependent upon the applicant a reduction of the age to sixty and fifty-five respectively may be made.
An applicant must also have resided continuously in New Zealand for twenty-five years, must be of good character, and must not be possessed of property of a value of £390 or over.
The old - age pension amounts now in general to a sum of £39 per annum. This sum under certain conditions may be augmented or reduced.
The number of old-age pensions in force on the 31st March, 1920, was 19,993, an increase of 121 on the figures for the previous year. The annual liability was £731,735, being an average of £36 12s. per pension. The total payment in respect of old-age pensions during the year was £732,968. A quinquennial summary is—
| At 31st March, | Pensioners. | Amount paid during Year. | Cost per Head of Popul'n. | |
|---|---|---|---|---|
* Including allowance under Finance Act, 1917. | ||||
| £ | s. | d. | ||
| 1911 | 16,020 | 383,393 | 7 | 7 |
| 1912 | 16,649 | 406,256 | 7 | 10 |
| 1913 | 16,509 | 415,761 | 7 | 10 |
| 1914 | 18,050 | 416,776 | 7 | 7 |
| 1915 | 19,352 | 460,814 | 8 | 5 |
| 1916 | 19,804 | 479,339 | 8 | 9 |
| 1917 | 19,697 | 480,230 | 8 | 9 |
| 1918 | 19,960 | 643,177 | 11 | 8* |
| 1919 | 19,872 | 743,063 | 13 | 4* |
| 1920 | 19,993 | 732,968 | 12 | 6* |
The total payments to the 31st March, 1920, aggregated £7,928,788.
The Widows’ Pensions Act, 1911, came into operation on the 1st January, 1912. The scope of this Act has been widened by various further amendments.
Applicants for widows’ pensions must be British subjects of good character, and applications require to be lodged with the local Registrar of Pensions, and to be investigated by a Magistrate, who alone has power to grant pensions. The term “widow” includes a woman whose husband is detained in a mental hospital.
The maximum pension payable is 7s. 6d. weekly to a widow with one child under fourteen years of age, with 7s. 6d. weekly added for each additional child under fourteen. The term “child” includes a stepchild or a child legally adopted during the lifetime of the husband of the applicant.
The number of widows’ pensions in force on the 31st March, 1920, was 3,444, the annual value of these being £185,968. The gross payments during the year were £136,815.
The figures for the last five years are as follows:—
| Year ended 31st March. | Number at End of Year. | Annual Value. | Annual Payments. |
|---|---|---|---|
| £ | £ | ||
* Including allowance under Finance Act, 1917. | |||
| 1916 | 1,890 | 37,042 | 36,357 |
| 1917 | 2,024 | 39,386 | 38,016 |
| 1918 | 2,192 | 73,872* | 57,952* |
| 1919 | 3,211 | 112,618* | 80,773* |
| 1920 | 3,444 | 185,968 | 136,815 |
The average pension was £54.
The Military Pensions Act, 1912, was enacted to provide for payment of an annual pension of £36 (now £49) to veterans of the Maori War who have been awarded the New Zealand War Medal for active service in such war. This Act is now embodied in the Pensions Act of 1913 above referred to, which consolidates the law relating to old-age, widows’, and military pensions.
The number of pensions in force on the 31st March, 1920, was 939, representing an annual value of £43,294. The payments on account of military pensions during the year aggregated £45,085. The figures for five years are,—
| Year ended 31st March. | Number at End of Year. | Annual Value. | Annual Payments. |
|---|---|---|---|
| £ | £ | ||
* Including allowance under Finance Act. | |||
| 1916 | 1,323 | 47,623 | 48,273 |
| 1917 | 1,232 | 44,352 | 45,674 |
| 1918 | 1,153 | 53,208* | 50,734* |
| 1919 | 1,040 | 47,814* | 50,488* |
| 1920 | 939 | 43,294* | 45,085* |
The Miner's Phthisis Act, 1915, as amended by the Finance Acts, 1919 and 1920, provides for a pension to any miner who is totally incapacitated for work owing to miner's phthisis (pneumoconiosis) contracted while working as a miner in New Zealand.
The rates of pension payable are—
To a single man or widower without children under 14, £1 5s. a week.
To a married man or widower with children under 14, £1 15s. a week.
The War Pensions Act, 1925, as amended, provides for the payment of pensions on the conditions hereinafter set out:—
To disabled members of the New Zealand Forces.
To dependants of disabled, deceased, or missing members of the New Zealand Forces.
“Member of the Forces” may include—
A member of any New Zealand Expeditionary Force raised for service beyond New Zealand in the late war.
A member of any New Zealand Naval Force raised for service beyond New Zealand in the late war.
A member of the New Zealand Army Nursing Service who, while domiciled in New Zealand, has served beyond New Zealand in the late war and was in the pay of the New Zealand Government.
(d.) A member of the New Zealand Defence or Naval Forces temporarily attached to any other portion of His Majesty's Forces who has served beyond New Zealand in the late war and was in receipt of pay from the Imperial Government.
Any person, not being a member of any New Zealand Expeditionary or Naval Force, who, while domiciled in New Zealand, has served beyond New Zealand in the late war and was in receipt of pay from the New Zealand Government.
Any person, not being a member of any New Zealand Expeditionary Force, who has been engaged on active military service in any capacity in New Zealand in connection with the late war.
The pensions payable are set out in detail in the following schedules:—
RATES OF PENSION IN CASE OF DEATH.
| Rank or Rating. | Weekly Pension. | ||||||
|---|---|---|---|---|---|---|---|
| To the Wife without a Child. | To Wife with a Child or Children. | To each Child. | |||||
| £ | s. | d. | £ | s. | d. | s. | |
| Private, bombardier, lance-corporal, trooper, gunner, driver, sapper, trumpeter, bugler | 11 | 0 | 0 | 2 | 0 | 0 | 10 |
| Able seaman and equivalent ratings | |||||||
| Corporal | 1 | 11 | 0 | 2 | 1 | 0 | 10 |
| Farrier, shoeing-smith, saddler, or fitter | |||||||
| (If bombardier, lance-corporal, gunner, or private) | |||||||
| Lance-sergeant (not paid as such) | |||||||
| Leading seaman and equivalent ratings | |||||||
| Sergeant, farrier-corporal, shoeing-smith corporal, saddler-corporal, corporal-fitter, farrier-sergeant, saddler-sergeant, armourer-sergeant, sergeant-fitter | 1 | 12 | 0 | 2 | 2 | 0 | 10 |
| Lance-sergeant (paid as such) | |||||||
| Petty officer and equivalent ratings | |||||||
| Squadron, battery, or company sergeant-major, quartermaster-sergeant, colour-sergeant, staff sergeant, pay-clerk | 1 | 14 | 0 | 2 | 4 | 0 | 10 |
| Chief petty officer and equivalent ratings | |||||||
| Regimental sergeant-major, regimental quartermaster-sergeant | 1 | 15 | 0 | 2 | 5 | 0 | 10 |
| Warrant officer and equivalent ranks (Navy) | |||||||
| 2nd lieutenant, lieutenant (Army) | 2 | 5 | 0 | 2 | 15 | 0 | 10 |
| Commissioned warrant officer and equivalent ranks; sub-lieutenant and equivalent ranks (Navy) | |||||||
| Captain (Army) | 2 | 10 | 0 | 3 | 0 | 0 | 10 |
| Lieutenant under eight years’ seniority and equivalent ranks (Navy) | |||||||
| Major | 2 | 17 | 0 | 3 | 7 | 0 | 10 |
| Lieutenant of eight years’ seniority and equivalent ranks (Navy) | |||||||
| Lieutenant-colonel | 3 | 6 | 0 | 3 | 16 | 0 | 10 |
| Captain under three years’ seniority and equivalent ranks; commanders and equivalent ranks (Navy) | |||||||
| Colonel | 3 | 8 | 0 | 3 | 18 | 0 | 10 |
| Captain of three years’ seniority and equivalent ranks (Navy) | |||||||
| Brigadier-general, major-general | 3 | 10 | 0 | 4 | 0 | 0 | 10 |
| Commodores, first and second class; rear-admiral and other equivalent ranks) | |||||||
| Rank or Rating. | Maximum Weekly Pension. | ||||||
|---|---|---|---|---|---|---|---|
| To the Member. | To the Wife. | To each Child. | |||||
| £ | s. | d. | £ | s. | d. | s. | |
| Private, bombardier, lance - corporal, trooper, gunner, driver, sapper, trumpeter, bugler | 2 | 0 | 0 | 1 | 0 | 0 | 10 |
| Able seaman and equivalent ratings | |||||||
| Corporal | 2 | 0 | 0 | 1 | 0 | 0 | 10 |
| Farrier, shoeing-smith, saddler, or fitter (If bombardier, lance-corporal, gunner, or private) | |||||||
| Lance-sergeant (not paid as such) | |||||||
| Leading seaman and equivalent ratings | |||||||
| Sergeant, farrier-corporal, shoeing-smith corporal, saddler-corporal, corporal-fitter, farrier-sergeant, saddler-sergeant, armourer-sergeant, sergeant-fitter | 2 | 0 | 0 | 1 | 0 | 0 | 10 |
| Lance-sergeant (paid as such) | |||||||
| Petty officer and equivalent ratings | |||||||
| Squadron, battery, or company sergeant-major, quartermaster-sergeant, colour-sergeant, staff sergeant, pay-clerk | 2 | 0 | 0 | 1 | 0 | 0 | 10 |
| Chief petty officer and equivalent ratings | |||||||
| Regimental sergeant-major, regimental quartermaster-sergeant | 2 | 0 | 0 | 1 | 0 | 0 | 10 |
| Warrant officer and equivalent ranks (Navy) | |||||||
| 2nd lieutenant, lieutenant (Army) | 2 | 2 | 6 | 1 | 1 | 3 | 10 |
| Commissioned warrant officer and equivalent ranks; sub-lieutenant and equivalent ranks (Navy) | |||||||
| Captain (Army) | 2 | 5 | 0 | 1 | 2 | 6 | 10 |
| Lieutenant under eight years’ seniority and equivalent ranks (Navy) | |||||||
| Major | |||||||
| Lieutenant of eight years’ seniority and equivalent ranks (Navy) | 2 | 12 | 0 | 1 | 6 | 0 | 10 |
| Lieutenant-colonel | 3 | 1 | 0 | 1 | 10 | 6 | 10 |
| Captain under three years’ seniority and equivalent ranks; superiors (Navy) | |||||||
| Colonel | 3 | 3 | 0 | 1 | 11 | 6 | 10 |
| Captain of three years’ seniority and equivalent ranks (Navy) | |||||||
| Brigadier-general, major-general | 3 | 5 | 0 | 1 | 12 | 6 | 10 |
| Commodores, first and second class rear-admiral and other equivalent ranks | |||||||
The gross annual value of the pensions in force at the 31st March, 1920, was £1,869,365. A summary follows:—
| SUMMARY OF ANNUAL LIABILITY AT 31ST MARCH, 1920. | |||
|---|---|---|---|
| Class of Pension. | Number. | Annual Value. | Average Pension. |
* Including the pensions of 1,452 children. † Including the pensions of 2,313 children. | |||
| £ | £ | ||
| Soldiers (permanent) | 2,130 | 126,510 | 59 |
| Soldiers (temporary) | 23,144 | 1,223,342 | 53 |
| Dependants (temporary) | 1,517 | 88,473* | 58 |
| Widows of soldiers | 2,075 | 238,693† | 115 |
| Other dependants of deceased soldiers | 5,705 | 192,347 | 34 |
| Totals | 34,571 | 1,869,365 | 54 |
Including the 3,765 children, the average of the grand total 38,336 pensions in force on the 31st March, 1920, is £49 per annum.
Information as to number and rate of war pensions in force at 31st March, 1920, is given in the following table. The rates including the bulk of the pensions only are quoted.
| TABLE SHOWING THE NUMBER OF WAR PENSIONS IN FORCE AT EACH RATE ON 31st MARCH, 1920. | |||||
|---|---|---|---|---|---|
| Rate (nearest £1). | Soldiers (Permanent and upwards of Twelve Months). | Soldiers (Temporary). | Wives and Parents on Account of Disablement. | On Account of Death. | |
| Widows (including Children's Pensions). | Parents and other Dependants. | ||||
| £ £ | |||||
| 151–160 | 33 | 198 | 29 | 203 | |
| 101–110 | 70 | 2,290 | 88 | 17 | 9 |
| 90-95 | 52 | 217 | 6 | 9 | 3 |
| 83 | 334 | 37 | 4 | ||
| 78 | 233 | 3,012 | 267 | 523 | 152 |
| 65 | 98 | 506 | 24 | 7 | 62 |
| 52 | 455 | 5,745 | 274 | 42 | 400 |
| 39 | 226 | 5,424 | 239 | 41 | 1,520 |
| 26 | 353 | 5,646 | 222 | 194 | 3,283 |
| Total, including others at rates not quoted above | 2,130 | 23,144 | 1,517 | 2,075 | 5,705 |
Section 13 of the Finance Act, 1919, provides that every person permanently resident in New Zealand who on the passing of this Act was in receipt of a pension or allowance under Part IX of the Defence Act, 1909, in respect of military service in South Africa, shall be entitled to a pension under the War Pensions Act, 1915, in the same manner as if he had been a member of the Forces within the meaning of that Act. Any pension under this section shall not be of such amount that the total amount receivable (including any Imperial pension) would be more than the pension payable if he had been a member of the Forces within the War Pensions Act, 1915.
Section 14 of the Finance Act, 1919, makes provision that, in the event of the death of any Police officer by misadventure suffered in the exercise of his duties, an allowance is payable to or on behalf of his widow and children at rates not exceeding those payable if he were a member of an Expeditionary Force under the Expeditionary Force Act, 1915. This Act is retrospective, but in this case any compensation already paid is taken into account. The scale for disablement is also similar to the war-pensions scale.
Applications are made to the same authorities, and the procedure is the same as in the case of war pensions.
The question of providing pensions for the public and semi-public servants of the Dominion on their retirement has received a good deal of attention in recent years. The schemes now in force embrace the State Railways (1903), Public Service (1908) including Police (1899), and Teachers (1906), while the various local bodies are empowered to establish schemes under the Local Authorities Superannuation Act, 1908.
The Public Service Superannuation Act, 1907, now embodied in the Public Service Classification and Superannuation Act, 1908, which with its amendments includes all branches of the Public Service except the Railway Department and so much of the Education Department as is included in Part IX of the Education Act, 1908 (mainly Inspectors and teachers of public schools), came into force on the 1st January, 1908. The scheme, although optional on the part of public servants permanently employed at that date, is compulsory on all persons appointed thereafter.
The principal benefits are—
A pension for every year of service equal to one-sixtieth of the average annual salary for the last three years, payable (a) after forty years’ service, or (b) at age sixty-five, or (c) on retirement owing to ill health. The maximum pension is not to exceed two-thirds of the salary, or, in the case of entrants after the 24th December, 1909, £300 per annum.
A pension of £18 per annum to the widow of a contributor or pensioner during widowhood, and £13 per annum for each child under the age of fourteen.
Females may retire after thirty years’ service or at the age of fifty-five, while the retiring-age may be reduced in certain cases for both males and females. Special pensions may be given in the case of a member of the Police Force for injuries received on duty.
The contributions vary with the age on joining the fund: For ages under thirty they are 5 per cent. of the salary; ages thirty and under thirty-five 6 per cent.; thirty-five and under forty, 7 per cent.; forty and under forty-five, 8 per cent.; forty-five and under fifty, 9 per cent.; fifty and over, 10 per cent.
On the 31st December, 1919, there were 14,216 contributors paying £184,928 per annum into the fund. The pensioners at the same date numbered 1,685, and were entitled to £120,459 per annum, made up as follows:—
| Number. | Pension. | |
|---|---|---|
| £ | ||
| Retired for age or length of service | 707 | 97,398 |
| Retired for ill health | 128 | 9,585 |
| Police injured on duty | 5 | 521 |
| Widows | 394 | 7,092 |
| Children | 451 | 5,863 |
| 1,685 | £120,459 |
The following table contains particulars of the public servants who were contributing to the fund at the end of the year 1919, grouped according to their respective rates of contribution:—
| Rate per Cent. Of Contribution as provided by the Act. | Number. | Annual Salary. | Annual Contributions. | ||
|---|---|---|---|---|---|
| Male. | Female. | Total. | |||
| £ | £ | ||||
| 5 | 7,992 | 1,870 | 9,862 | 1,801,664 | 90,083 |
| 6 | 1,351 | 167 | 1,518 | 417,540 | 25,053 |
| 7 | 1,017 | 111 | 1,128 | 329,971 | 23,098 |
| 8 | 740 | 95 | 835 | 252,887 | 20,231 |
| 9 | 507 | 40 | 547 | 174,969 | 15,747 |
| 10 | 310 | 16 | 326 | 107,164 | 10,716 |
| Totals | 11,917 | 2,299 | 14,216 | 3,084,195 | 184,928 |
Accumulated funds at the end of 1919 amounted to £1,288,198. Interest was earned on the mean funds at a rate of £5 5s. 10d. per cent.
The report of the Superannuation Board for the year 1919 shows that up to the end of that year the total amount saved to the Consolidated Fund since the initiation of the superannuation scheme has been £364,532, the State subsidies to the fund aggregating £482,500, or £117,968 in excess of the actual saving referred to, which is reckoned only to the date the contributors joined the fund.
The Police Provident Fund, which was established on the 1st December, 1899, under the Police Provident Act, 1899, was merged in the Public Service Superannuation Fund on the 1st April, 1910, and members of the Police Force contributing at that date now pay the same contributions and receive the same benefits (plus the special allowance if injured on duty) as other members of the Public Service.
Since the passing of the Public Service Classification and Superannuation Amendment Act, 1908, the benefits from the Teachers’ Superannuation Fund have been brought into line with those of the Public Service Superannuation Fund. Existing contributors had, however, the right of electing to remain subject to the provisions formerly in force.
There are a few slight differences between the Public Service and the Teachers’ Funds, the chief being that (1) the service of the teachers need not be continuous; (2) no pensions are payable on retirement for ill health unless the service exceeds fifteen years; and (3) in the case of reduction of status owing to age or infirmity, there is no provision that the pension must be computed on the higher salary as in the Public Service Fund.
The total subsidies paid to the fund by the Government amounted on 31st December, 1919, to £178,000. On the 31st December, 1919, there were 5,019 contributors, the annual contributions amounting to £72,172.
The retiring and other allowances were 698, representing a charge of £51,033 per annum, made up of—
| Number. | Amount of Pension. | |
|---|---|---|
| £ | ||
| Retired for age or length of service | 475 | 51,026 |
| Retired for ill health | 94 | 9,029 |
| Widows | 117 | 2,119 |
| Children | 100 | 1,300 |
| 786 | £63,474 |
The Government Railways Superannuation Fund was established on the 1st January, 1903, by the Government Railways Superannuation Fund Act, 1902, now embodied in the Government Railways Act, 1908.
The pension is here also one-sixtieth of the annual rate of pay for every year of service, but the retiring age is sixty for both males and females, instead of ages sixty-five and fifty-five respectively as in the Public Service. The only other differences of importance are that the annual allowances to widows and children are paid only on the death of contributors before retiring on a pension, and that the pension is computed on the last salary except where the contributor has served in a lower grade within the previous five years, in which case the average for seven years is taken.
The number of contributors on the 31st March, 1919, was 10,655, and at that date there were 1,892 persons on the fund, drawing annual allowances amounting to £102,783.
The Local Authorities Superannuation Act, 1908, which came into force on the 10th October, 1908, applies to Borough Councils, County Councils, Town Boards, Road Boards, Harbour Boards, Charitable Aid Boards, tramway companies, or any body possessing rating powers over any district.
So far as can be ascertained, only three local authorities have so far initiated superannuation schemes under the authority of the statute—namely, Wellington Harbour Board, Auckland Harbour Board, and Buller County Council. The subsidies payable by the respective local authorities are as follows:—
Wellington Harbour Board: 65 per cent. of the members’ contributions, equivalent to 5 per cent. of the salaries.
Auckland Harbour Board: 60 per cent. of the members’ contributions, equivalent to 4 per cent. of the salaries.
Buller County Council: 80 per cent. of the members’ contributions, equivalent to 7 per cent. of the salaries.
The National Provident Fund was established by Act in 1910, and came into operation on the 1st March, 1911. The fund is administered by a Board composed of the Hon. the Minister of Finance as Chairman and four
members appointed by the Governor-General, one of whom is the Superintendent of the fund. The main object of the scheme is to provide for annuities in old age. This is supplemented by benefits for the protection of the family from birth to old age.
The system is open to any person between the ages of sixteen and forty-five years residing in New Zealand, and whose average income during the three years prior to joining has not exceeded £250 per annum. There is no medical examination on entry, and the method of joining is extremely simple, the applicant having merely to fill in a form at a postal money-order office or local office of the Fund, and pay a first weekly contribution.
The following benefits are payable:—
After contributing for twelve months, a payment not exceeding £6 for medical attendance and nursing on the birth of a contributor's child or children.
After contributing for five years, an allowance, after three months’ incapacity to work, of 7s. 6d. per week for each child of a contributor under fourteen years of age. Payable independent of any allowances due from friendly societies. No contributions payable while in receipt of incapacity allowance.
After contributing for five years, an allowance, on the death of a contributor, of 7s. 6d. per week for each child until fourteen years of age, and 7s. 6d. for the widow so long as any child is under fourteen years of age.
On reaching age sixty, a pension of 10s., 20s., 30s., or 40s. per week, according to the scale of contributions. The payment of this pension will not affect any rights under the Old-age Pensions Act.
The contributions range from 9d. per week at age sixteen last birthday, ls. 1d. at age twenty-two, ls. 4d. at twenty-five. and so on to age forty-five, for the 10s. pension, the rate being two, three, or four times as much if a higher pension is applied for. A contributor may decrease his pension after entry, or he may increase it at any time whilst he is under the age of forty-five years.
The result of the fund's operations up to the end of the ninth year is indicated in the following table:—
| At End of— | Number of Contributors. | Annual Rate of Contribution payable. | Amount of Fund. |
|---|---|---|---|
| £ | £ | ||
| 1911 | 550 | 3,172 | 1,826 |
| 1912 | 2,660 | 11,727 | 10,038 |
| 1913 | 5,791 | 22,719 | 20,327 |
| 1914 | 6,858 | 26,520 | 53,718 |
| 1915 | 8,101 | 31,875 | 83,000 |
| 1916 | 9,847 | 38,664 | 122,361 |
| 1917 | 12,124 | 56,707 | 176,210 |
| 1918 | 13,410 | 69,486 | 246,901 |
| 1919 | 16,154 | 91,450 | 338,729 |
A total amount of £16,167 was paid out through the fund for the year ended the 31st December, 1919, in respect of maternity grants, the amount to contributors being £3,959, and to the members of approved friendly societies, £12,208.
Table of Contents
THERE are six banks of issue trading in New Zealand, two of these institutions, the Bank of New Zealand and the National Bank of New Zealand, being incorporated by special Acts of the General Assembly of the Dominion. The Bank of New Zealand has branches in London, Australia, Fiji, and Samoa, while its branches and agencies within the Dominion number 216. The other five banks have between them 206 establishments within the Dominion, making a total of 422, or an average of one bank to every 2,693 inhabitants, excluding Maoris.
The paid-up capital of the above banks, their reserve funds, and the rate and amount of their last dividend as on the 31st December, 1919, were as follows:—
| Bank. | Paid-up Capital. | Rate per Cent. per Annum of Last Dividend and Bonus. | Amount of Last Half-yearly Dividend and Bonus. | Reserve Fund. |
|---|---|---|---|---|
* Dividend for full year. | ||||
| Bank of New Zealand— | £ | Per Cent. | £ | £ |
| 4-per-cent. stock guaranteed by New Zealand Government | 529,988 | |||
| “A” preference shares issued to the Crown (Act of 1903) | 500,000 | 10 | 237,500* | 2,345,702 |
| “B” preference shares issued to the Crown (Act of 1913) | 250,000 | 12 and bonus of 3 per cent. | ||
| Ordinary shares | 1,000,000 | 12 and bonus of 3 per cent. | ||
| Union Bank of Australia (Limited) | 2,500,000 | 14 | 140,000 | 2,288,614 |
| Bank of New South Wales | 4,000,000 | 10 | 200,000 | 3,200,000 |
| Bank of Australasia | 2,000,000 | 14 and bonus of 12s. per share | 170,000 | 3,071,100 |
| National Bank of New Zealand (Limited) | 1,000,000 | 12 per cent. per annum for half-year, and bonus of 1 per cent. | 52,500 | 874,932 |
| Commercial Bank of Australia (Limited)— | ||||
| Ordinary | 95,659 | |||
| Preference | 2,117,350 | 4(preference only) | 42,347 | 13,060 |
The development of banking in New Zealand since the year 1857 has been very great. A summary for the years 1857–1919 is as follows:—
| Year. | Deposits. | Advances. | Assets. | Liabilities. |
|---|---|---|---|---|
| £ | £ | £ | £ | |
| 1857 | 343,316 | 419,860 | 432,494 | |
| 1870 | 3,127,769 | 4,547,217 | 6,315,354 | 3,819,670 |
| 1880 | 8,538,935 | 11,300,404 | 14,220,275 | 9,550,177 |
| 1890 | 12,368,610 | 14,096,446 | 17,735,259 | 13,356,598 |
| 1900 | 15,570,610 | 12,084,744 | 17,314,535 | 16,964,582 |
| 1910 | 24,968,761 | 19,772,656 | 26,398,927 | 26,742,081 |
| 1914 | 27,640,507 | 25,222,127 | 32,502,312 | 29,808,349 |
| 1915 | 31,433,653 | 24,590,171 | 33,209,484 | 34,448,272 |
| 1916 | 37,757,917 | 26,989,644 | 37,015,486 | 41,977,619 |
| 1917 | 42,930,713 | 33,808,309 | 44,979,615 | 48,541,961 |
| 1918 | 45,562,939 | 37,396,623 | 48,570,126 | 52,048,732 |
| 1919 | 50,489,444 | 37,410,156 | 48,615,209 | 57,861,393 |
In 1880 the deposits of these banks were £18 per head of the mean population; in 1914, £25.35; and in 1919, £44.42. The ratio of advances to deposits, which was 132.34 per cent. in 1880, in 1919 was 74.09.
In 1886 the average amount of advances made by the banks was £15,853,420, equal to £27.23 per head of the mean population. The amount for 1919 (£37,410,156) represented £32.81 per head. The largest amount of discounts in any year was £6,061,959 in 1879, a rate of £13.53 per head. In the previous year had occurred the highest rate—£14.22 per head. Both amount and rate for 1919 were the lowest on record. Inflation of deposits and advances during recent years is, of course, a direct result of war conditions.
The liabilities of the banks of issue for the last ten years are shown in the table following, the figures given referring to New Zealand business only. The liabilities shown represent the average of the four quarters of the year, with the exception that in the figures for 1912 only the last quarter is taken in respect of the Commercial Bank of Australia, as this institution did not commence operations in the Dominion until fairly late in that year
| Year. | Notes in Circulation. | Bills in Circulation. | Balances due to other Banks. | Deposits. | Total Liabilities. |
|---|---|---|---|---|---|
| £ | £ | £ | £ | £ | |
| 1910 | 1,626,094 | 93,603 | 53,622 | 24,968,761 | 26,742,080 |
| 1911 | 1,677,842 | 113,582 | 69,257 | 26,765,122 | 28,625,803 |
| 1912 | 1,714,667 | 111,877 | 59,721 | 25,622,083 | 27,508,348 |
| 1913 | 1,674,333 | 108,518 | 75,061 | 25,733,187 | 27,591,099 |
| 1914 | 1,998,386 | 96,012 | 73,444 | 27,640,507 | 29,808,349 |
| 1915 | 2,846,277 | 105,759 | 62,580 | 31,433,653 | 34,448,272 |
| 1916 | 4,049,527 | 96,468 | 73,707 | 37,757,917 | 41,977,619 |
| 1917 | 5,410,957 | 105,895 | 94,396 | 42,930,713 | 48,541,961 |
| 1918 | 6,266,768 | 123,344 | 95,681 | 45,562,939 | 52,048,732 |
| 1919 | 7,087,545 | 173,722 | 110,682 | 50,489,444 | 57,861,393 |
The average assets, as shown below, include Colonial Government securities, which in 1919 amounted to £5,692,436.
| Year. | Coin and Bullion. | Notes and Hills discounted. | Debts due, exclusive of Bad Debts. | All other Assets. | Total Assets |
|---|---|---|---|---|---|
| £ | £ | £ | £ | £ | |
| 1910 | 5,035,764 | 1,741,984 | 16,698,015 | 2,923,164 | 26,398,927 |
| 1911 | 5,195,333 | 1,792,261 | 19,467,467 | 2,978,553 | 29,433,614 |
| 1912 | 5,338,295 | 1,847,016 | 21,062,101 | 2,948,988 | 31,196,400 |
| 1913 | 5,204,266 | 1,951,665 | 20,950,633 | 2,602,368 | 30,708,932 |
| 1914 | 5,712,751 | 1,843,217 | 22,407,029 | 2,539,315 | 32,502,312 |
| 1915 | 6,781,006 | 1,471,808 | 22,167,162 | 2,789,506 | 33,209,483 |
| 1916 | 7,393,917 | 1,484,356 | 23,427,562 | 4,709,651 | 37,015,486 |
| 1917 | 8,072,279 | 1,414,585 | 27,433,164 | 8,059,587 | 44,979,615 |
| 1918 | 8,085,961 | 1,261,203 | 30,450,147 | 8,772,815 | 48,570,126 |
| 1919 | 8,017,159 | 1,446,299 | 30,271,421 | 8,880,330 | 48,615,209 |
The total amount of deposits, &., taking the average of the four quarters for each of the past ten years, are as follows:—
| Year. | Deposits. | Advances. | ||||
|---|---|---|---|---|---|---|
| Total Amount. | Per Head of Population. | Total Amount. | Ratio to Deposits. | |||
| £ | £ | s. | d. | £ | Per Cent. | |
| 1910 | 24,968,761 | 25 | 3 | 0 | 19,772,656 | 79.19 |
| 1911 | 26,765,122 | 26 | 7 | 5 | 22,601,863 | 84.45 |
| 1912 | 25,622,083 | 24 | 13 | 2 | 24,268,634 | 94.72 |
| 1913 | 25,733,187 | 24 | 1 | 7 | 24,005,038 | 93.28 |
| 1914 | 27,640,507 | 25 | 7 | 0 | 25,222,127 | 91.25 |
| 1915 | 31,433,653 | 25 | 11 | 10 | 24,590,171 | 78.23 |
| 1916 | 37,757,917 | 34 | 6 | 10 | 26,989,644 | 71.48 |
| 1917 | 42,930,713 | 39 | 1 | 2 | 33,808,309 | 78.75 |
| 1918 | 45,562,939 | 41 | 6 | 2 | 37,396,623 | 82.08 |
| 1919 | 50,489,444 | 44 | 8 | 7 | 37,410,156 | 74.09 |
Deposits per head of population in cheque-paying banks in each of the Australian States during 1918 and the three preceding years are shown. Figures for New Zealand are also given by way of comparison.
| DEPOSITS PER HEAD IN CHEQUE-PAYING BANKS IN AUSTRALASIA, 1915–18. | ||||||||||||
|---|---|---|---|---|---|---|---|---|---|---|---|---|
| State. | 1915. | 1916. | 1917. | 1918. | ||||||||
| £ | s. | d. | £ | s. | d. | £ | s. | d. | £ | s. | d. | |
| Queensland | 39 | 16 | 2 | 37 | 9 | 1 | 43 | 2 | 2 | 49 | 13 | 3 |
| New South Wales | 36 | 8 | 10 | 42 | 19 | 0 | 44 | 19 | 9 | 45 | 7 | 2 |
| Victoria | 37 | 18 | 6 | 42 | 0 | 6 | 46 | 9 | 9 | 48 | 10 | 5 |
| South Australia | 26 | 19 | 0 | 31 | 6 | 3 | 36 | 14 | 7 | 42 | 6 | 11 |
| Western Australia | 23 | 7 | 2 | 25 | 11 | 8 | 27 | 12 | 9 | 31 | 9 | 8 |
| Tasmania | 28 | 12 | 5 | 30 | 9 | 7 | 30 | 2 | 5 | 33 | 4 | 0 |
| Northern Territory | 41 | 9 | 1 | 45 | 10 | 9 | 64 | 12 | 10 | 71 | 4 | 6 |
| Total Commonwealth | 35 | 6 | 8 | 39 | 5 | 5 | 42 | 15 | 1 | 45 | 5 | 1 |
| New Zealand | 25 | 11 | 10 | 34 | 6 | 10 | 39 | 1 | 2 | 41 | 6 | 2 |
On the 5th August, 1914, an amendment to the Banking Act was passed empowering the Governor-General in Council, from time to time, to make a Proclamation declaring bank-notes to be legal tender within New Zealand.
Immediately on the passing of the amendment referred to, a Proclamation was gazetted declaring notes of all six banks of issue doing business in New Zealand to be legal tender from the 6th August to the 6th September, 1914. Further extensions for short periods were made from time to time until the end of 1917, when the notes of the six banks were declared legal tender until the 31st December, 1922.
In connection with the Post Office in New Zealand a savings-bank has been conducted since the 1st February, 1867. The minimum deposit receivable, except in certain specified cases, is ls., and no interest is given on any sum less than £1 or in excess of £5,000. Interest on sums up to £500 is paid at the rate of 4 per cent. per annum, and on sums between £500 and £5,000 at the rate of 3 1/4 per cent., for the amount over £500.
The number of post-offices open for the transaction of savings-bank business at the end of 1919 was 794.
There were 118,109 new accounts opened in 1919, and 77,531 accounts were closed during the year. The total number of open accounts at the end of 1919 was 630,783, or one in every 1.95 of the population, excluding Maoris.
The deposits received during the year amounted to £29,758,447, and the withdrawals to £25,962,377. The total sum standing at credit of all accounts on the 31st December, 1919, was £38,393,130, which gave an average of £60 17s. 4d. to the credit of each open account. Information for each of the past ten years is given below.
| Year. | Number of Depositors at End of Year. | Total Amount of Deposits during Year. | Total Amount of Withdrawals during Year. | Excess of Deposits over Withdrawals. | Total Amount to Credit of Depositors at End of Year. |
|---|---|---|---|---|---|
| £ | £ | £ | £ | ||
| 1910 | 380,585 | 10,708,939 | 9,695,515 | 1,013,424 | 14,104,990 |
| 1911 | 405,566 | 11,627,368 | 10,662,046 | 965,322 | 15,543,187 |
| 1912 | 432,199 | 11,725,183 | 11,449,711 | 275,472 | 16,330,257 |
| 1913 | 458,594 | 11,286,702 | 11,041,454 | 245,248 | 17,131,414 |
| 1914 | 483,262 | 11,904,323 | 10,603,018 | 1,301,305 | 19,048,029 |
| 1915 | 509,085 | 13,706,057 | 11,294,974 | 2,411,083 | 22,166,338 |
| 1916 | 538,072 | 15,576,408 | 12,957,420 | 2,618,988 | 25,603,209 |
| 1917 | 566,351 | 17,106,529 | 14,461,169 | 2,645,360 | 29,196,390 |
| 1918 | 590,205 | 18,101,105 | 14,938,842 | 3,162,263 | 33,418,125 |
| 1919 | 630,783 | 29,758,447 | 25,962,377 | 3,796,070 | 38,393,130 |
During the past 30-odd years (since 1887) the total amount standing to the credit of depositors at the end of each year has in no case shown a decrease, while the amount standing to credit of depositors has increased from £1,813,085 in 1887 to £38,393,130 in 1919. There has been a corresponding steady increase in the average amount standing to the credit of each depositor.
The number of open accounts (as on the 31st December) for five years, classified according to amounts at credit, is as follows:—
| Amount. | 1915. | 1916. | 1917. | 1918. | 1919. |
|---|---|---|---|---|---|
| Not exceeding £20 | 356,968 | 369,769 | 382,689 | 385,812 | 394,280 |
| Exceeding £20 and up to £50 | 55,186 | 57,216 | 59,680 | 61,466 | 68,331 |
| Exceeding £50 “ £100 | 36,047 | 39,715 | 43,392 | 48,178 | 56,828 |
| Exceeding £100 “ £200 | 29,759 | 34,498 | 39,813 | 45,258 | 50,111 |
| Exceeding £200 “ £300 | 13,555 | 15,443 | 17,243 | 20,985 | 25,340 |
| Exceeding £300 “ £400 | 7,346 | 8,690 | 9,330 | 11,518 | 13,796 |
| Exceeding £400 “ £500 | 3,891 | 4,775 | 5,152 | 6,255 | 7,994 |
| Exceeding £500 “ £600 | 2,638 | 3,149 | 3,628 | 4,180 | 5,331 |
| Exceeding £600 | 3,695 | 4,817 | 5,424 | 6,553 | 8,772 |
| Totals | 509,085 | 538,072 | 566,351 | 590,205 | 630,783 |
Accounts above the £600 mark in 1919 included 3,071 between £600 and £700, 1,819 between £700 and £800, 1,186 between £800 and £900, 1,033 between £900 and £1,000, and 1,663 over £1,000.
The securities standing in the name of the Postmaster-General on account of the Post Office Savings-bank Fund on the 31st December, 1919, represented a nominal value of £36,392,202. Most of this fund is invested in Government securities. A summary of the investments is as follows:—
| £ | s. | d. | |
|---|---|---|---|
| In New Zealand Government securities | 35,327,253 | 11 | 1 |
| In local bodies’ securities | 1,020,550 | 0 | 0 |
| In other securities | 44,398 | 4 | 9 |
| Total | £36,392,201 | 15 | 10 |
There are five savings-banks not connected with the Post Office. The total amount deposited in them during the year ended the 31st March, 1920, was £3,308,628, of which the deposits by Maoris comprised £837. The withdrawals reached the sum of £2,981,887. The total amount to the credit of the depositors at the 31st March, 1920, was £3,557,895, of which sum £484 belonged to Maoris. Figures for ten years are as follows:—
| Year ended 31st March. | Number of Depositors at End of Year. | Total Amount of Deposits during Year. | Total Amount of Withdrawals during Year. | Excess of Deposits over Withdrawals. | Total Amount to Credit of Depositors at End of Year. |
|---|---|---|---|---|---|
The minus sign (—) represents excess of withdrawals over deposits. * Year ended 31st December. † Fifteen months ended 31st March. | |||||
| £ | £ | £ | £ | ||
| 1910* | 51,534 | 1,338,336 | 1,269,973 | 68,363 | 1,515,525 |
| 1911* | 54,036 | 1,420,321 | 1,337,586 | 82,735 | 1,651,275 |
| 1913† | 71,728 | 1,824,606 | 1,833,390 | - 8,784 | 1,713,283 |
| 1914 | 74,120 | 1,478,309 | 1,461,510 | 16,799 | 1,792,108 |
| 1915 | 75,941 | 1,358,876 | 1,340,760 | 18,116 | 1,876,725 |
| 1916 | 78,024 | 1,449,938 | 1,327,364 | 122,574 | 2,072,602 |
| 1917 | 81,900 | 1,631,065 | 1,374,114 | 256,951 | 2,412,465 |
| 1918 | 85,191 | 1,764,723 | 1,551,836 | 212,887 | 2,720,709 |
| 1919 | 89,203 | 2,058,360 | 1,775,531 | 282,829 | 3,111,529 |
| 1920 | 95,472 | 3,308,628 | 2,981,887 | 326,741 | 3,557,895 |
The deposits in the savings-banks of the Commonwealth on the 31st March, 1920, and of New Zealand on the 31st December, 1919 (Post Office), and on the 31st March, 1920 (private), are shown in the table following. The Australian figures are taken from the Quarterly Summary of Australian Statistics issued by the Commonwealth Statistician. In calculating the deposits per head of population in New Zealand Maoris were omitted from the population, although the total amount on deposit includes deposits by them. The amount deposited by Maoris is very small in proportion to the number of Maoris in the Dominion.
| State. | Number of Depositors. | Amount on Deposit at End of Year. | Average Amount per Depositor at End of Year. | Deposits to Credit per Head of Population. | ||||
|---|---|---|---|---|---|---|---|---|
| £ | £ | s. | d. | £ | s. | d. | ||
| New South Wales | 1,036,112 | 47,736,585 | 46 | 1 | 5 | 23 | 12 | 8 |
| Victoria | 1,002,186 | 39,926,184 | 39 | 16 | 9 | 26 | 12 | 9 |
| Queensland | 359,549 | 17,337,297 | 48 | 4 | 5 | 23 | 17 | 9 |
| South Australia | 373,742 | 14,818,826 | 39 | 13 | 0 | 31 | 9 | 6 |
| Western Australia | 200,935 | 6,818,727 | 33 | 18 | 8 | 20 | 10 | 1 |
| Tasmania | 103,123 | 3,439,444 | 33 | 7 | 1 | 15 | 15 | 4 |
| Northern Territory | 1,100 | 81,988 | 74 | 10 | 8 | 17 | 18 | 11 |
| Total, Commonwealth | 3,076,747 | 130,159,051 | 42 | 6 | 1 | 24 | 13 | 7 |
| New Zealand | 726,260 | 41,951,025 | 57 | 15 | 3 | 36 | 18 | 2 |
If the total deposits in the banks of issue at the end of the year be assumed to be equal to the average deposits for the four quarters of the year, then it may be affirmed that, exclusive of Government moneys, the deposits in the said banks of issue and in the two classes of savings-banks amounted at the end of 1919 to £83,556,519, representing an average of £73 10s. 7d. per head of population, or, including Maoris, £70 8s. 10d. per head. In addition there are the deposits with the building societies, referred to further on in this book, and it is known that there were also deposits with financial companies of which no particulars have been collected.
Table of Contents
AT the close of the year 1919 twelve life-assurance offices were represented in New Zealand.
The New Zealand Government and the Provident Life Assurance Company are the only purely New Zealand institutions, six of the societies having their head offices in Australia, two in England, and two in the United States of America. The Provident Life Assurance Company and four of the Australian offices transact both ordinary life and industrial business. Several of the companies, including the New Zealand Government Office, have branches for assurance against accident.
The following table shows the total ordinary life-assurance business in force in the Dominion at the end of each year 1914–18.
| Year. | Number of Policies in Force, including Annuities. | Amount insured. | Annuities per Annum. | Annual Premium Income, including Annuities. |
|---|---|---|---|---|
| £ | £ | £ | ||
| 1914 | 156,218 | 39,654,784 | 46,939 | 1,229,398 |
| 1915 | 160,568 | 40,967,147 | 39,112 | 1,274,667 |
| 1916 | 164,245 | 42,153,414 | 38,279 | 1,330,855 |
| 1917 | 164,145 | 42,885,433 | 37,856 | 1,372,278 |
| 1918 | 169,091 | 45,343,020 | 37,763 | 1,447,284 |
Similar information to the above is given respecting the industrial business of the companies operating in New Zealand.
| INDUSTRIAL ASSURANCE.—NEW ZEALAND BUSINESS. 1914–18. | |||
|---|---|---|---|
| Year. | Number of Policies in Force, including Annuities. | Amount insured. | Annual Premium Income, including Annuities. |
| £ | £ | ||
| 1914 | 93,488 | 2,598,905 | 163,164 |
| 1915 | 99,740 | 2,811,255 | 181,533 |
| 1916 | 109,667 | 3,180,011 | 206,495 |
| 1917 | 118,823 | 3,532,075 | 233,620 |
| 1918 | 129,691 | 3,998,256 | 266,568 |
The number of ordinary life policies in force in 1908 was 127,721, so that the increase in number during the last ten years has been over 32 per cent., while in the industrial business the number of policies increased by over 160 per cent. in the period, the number in force in 1908 having been 49,435. Taking both classes of life assurance together, the policies increased in number by 69 per cent. in the decennium, as compared with an increase in the total population of 15 per cent. during the same period. A statement of the income and outgo of all the companies operating in the Dominion, so far as ordinary business only is concerned, is also given.
| ORDINARY LIFE ASSURANCE.—NEW ZEALAND BUSINESS.—INCOME AND OUTGO. | ||||||
|---|---|---|---|---|---|---|
| Year. | Receipts and Expenditure. | Expenses of Management. | ||||
| Total Receipts, excluding Transfers. | Total Expenditure, excluding Transfers. | Excess of Receipts. | Total. | Proportion to Premium Receipts. | Proportion to Total Receipts. | |
| £ | £ | £ | £ | Per. Cent. | Per. Cent. | |
| 1914 | 1,911,446 | 1,311,661 | 599,785 | 179,261 | 14.80 | 9.38 |
| 1915 | 1,922,485 | 1,397,434 | 525,051 | 176,715 | 14.05 | 9.19 |
| 1916 | 2,016,607 | 1,558,320 | 458,287 | 174,683 | 13.20 | 8.66 |
| 1917 | 2,091,512 | 1,804,647 | 286,865 | 173,407 | 12.63 | 8.29 |
| 1918 | 2,225,897 | 2,054,409 | 171,488 | 215,351 | 14.55 | 9.67 |
Results under similar headings are given in the next table for industrial assurance:—
| INDUSTRIAL ASSURANCE.—NEW ZEALAND BUSINESS.—INCOME AND OUTGO. | ||||||
|---|---|---|---|---|---|---|
| Year. | Receipts and Expenditure. | Expenses of Management. | ||||
| Total Receipts, excluding Transfers. | Total Expenditure, excluding Transfers. | Excess of Receipts. | Total. | Proportion to Premium Receipts. | Proportion to Total Receipts. | |
| £ | £ | £ | £ | Per Cent. | Per Cent. | |
| 1914 | 158,974 | 94,553 | 64,421 | 65,513 | 43.05 | 41.21 |
| 1915 | 177,319 | 93,973 | 83,346 | 66,041 | 39.22 | 37.24 |
| 1916 | 200,903 | 109,452 | 91,451 | 71,778 | 37.79 | 35.72 |
| 1917 | 232,895 | 128,468 | 104,427 | 77,921 | 35.49 | 33.46 |
| 1918 | 264,000 | 156,618 | 107,382 | 88,071 | 35.51 | 33.36 |
This class of business has only recently attained any magnitude in the Dominion. The expense rate is exceedingly high, as is common with industrial assurance.
The New Zealand liabilities of all the institutions in respect of their ordinary life business at the end of 1918 amounted to £15,910,853, including life assurance and annuity funds, £14,767,274, and depreciation, reserve, and other special funds, £317,442.
At the same date the liabilities of the industrial branch of the Provident Life Assurance Company and the Colonial Mutual Life Assurance Society amounted in all to £184,874, of which funds amounted to £161,924.
The three other companies transacting both ordinary life and industrial assurance business did not show separate returns for their industrial branches.
The assets balance the liabilities in every case, and are stated as follows:—
| Ordinary Assurance. | Industrial Assurance.* | |
|---|---|---|
* Two companies only; figures for other companies included under “ordinary assurance.” | ||
| £ | £ | |
| Mortgages on property | 6,880,512 | 22,726 |
| Loans on policies | 2,095,746 | 2,194 |
| Government securities | 3,864,750 | 15,517 |
| Other investments | 1,124,928 | 75,794 |
| Cash | 275,658 | 2,234 |
| Other assets | 1,669,259 | 66,409 |
| Totals | £15,910,853 | £184,874 |
The Life Insurance Department of the New Zealand Government had at the end of 1919 policies in force to the number of 55,770, including 438 annuities. The total sum assured is £14,123,728, to which are attached reversionary bonuses amounting to £1,423,016, making the total business £15,546,744. The policies in force represent an annual premium income of £423,065.
The total income for 1919 was £701,423, of which £411,306 was premium income, £20,265 annuity purchase-money, and £269,852 interest (less land and income tax).
During the year 648 policies became claims by the deaths of policyholders, the amounts payable totalling £195,341; and 758 policies matured for £180,102, The total sum which has been paid in respect of claims by death and survival since the foundation of the Department fifty years ago has amounted to £7,430,175.
The total assurance, annuity, and endowment funds, apart from a special investment reserve of £288,825, now stand at £5,354,904.
On the 31st December, 1919, the total assets amounted to £5,728,681, and were invested as shown in the following statement, which also gives the distribution of the assets at the end of the previous year for purposes of comparison:—
| Class of Investment. | At 31st December, 1918. | At 31st December, 1919. | ||
|---|---|---|---|---|
| Amount. | Percentage of Total Assets. | Amount. | Percentage of Total Assets. | |
| £ | £ | |||
| Mortgages on freehold property | 3,038,552 | 53.6 | 2,784,532 | 48.6 |
| Loans on policies | 738,018 | 13.0 | 733,943 | 12.8 |
| Government securities | 1,250,900 | 22.0 | 1,635,800 | 28.6 |
| Local bodies’ debentures | 211,711 | 3.7 | 210,597 | 3.7 |
| Landed and house property | 134,864 | 2.4 | 134,831 | 2.3 |
| Miscellaneous assets | 128,593 | 2.3 | 130,179 | 2.3 |
| Cash in hand and on current account | 170,343 | 3.0 | 98,799 | 1.7 |
| Totals | 5,672,981 | 100.0 | 5,728,681 | 100.0 |
The progress of the Department during the last triennium, when compared with the four previous trienniums in respect of total business in force, is as follows:—
| Triennium. | Number of Policies. | Sums assured. | Reversionary Bonuses. | Annual Premiums. |
|---|---|---|---|---|
| £ | £ | £ | ||
| 1903–05 | ,137 | 10,468,316 | 954,751 | 319,221 |
| 1906–08 | 47,033 | 10,955,749 | 1,068,950 | 331,830 |
| 1909–11 | 49,376 | 11,514,657 | 1,168,620 | 348,285 |
| 1912–14 | 52,273 | 12,550,465 | 1,246,610 | 370,882 |
| 1915–17 | 53,058 | 12,884,531 | 1,304,243 | 387,377 |
The new business undertaken during the same periods also shows an increase in each succeeding triennium.
| NEW BUSINESS OF TRIENNIUM. | |||
|---|---|---|---|
| Triennium. | Number of Policies. | Sums assured. | Annual Premiums. |
| £ | £ | ||
| 1903–05 | 9,526 | 2,112,927 | 70,428 |
| 1906–08 | 9,739 | 2,261,767 | 72,803 |
| 1909–11 | 10,476 | 2,487,472 | 77,477 |
| 1912–14 | 11,721 | 3,197,694 | 89,715 |
| 1915–17 | 10,129 | 2,709,163 | 90,017 |
At the close of the year 1918 there were thirty-four insurance offices doing accident business in the Dominion. The following table relates only to the accident business transacted within the Dominion:—
| Year. | Premium Receipts. | Total Receipts. | Claims paid. | Total Expenditure. |
|---|---|---|---|---|
| £ | £ | £ | £ | |
| 1914 | 337,190 | 343,453 | 162,708 | 279,771 |
| 1915 | 337,733 | 344,640 | 172,049 | 291,634 |
| 1916 | 349,230 | 355,289 | 168,321 | 302,205 |
| 1917 | 351,103 | 356,480 | 179,514 | 231,027 |
| 1918 | 359,962 | 363,673 | 183,291 | 326,724 |
The Accident Branch of the Government Insurance Department was opened in 1901. General accident business is undertaken, but the branch was opened more especially with a view to relieve employers of labour of the liability imposed upon them by the Workers’ Compensation for Accidents Act, 1900, particulars of which are given in the 1915 issue of this book.
The premium income and claims of the Accident Branch in the last ten years have been as follows:—
| Year. | Gross Premium Income. | Claims. |
|---|---|---|
| £ | £ | |
| 1910 | 21,364 | 12,522 |
| 1911 | 20,756 | 10,497 |
| 1912 | 23,513 | 12,016 |
| 1913 | 23,677 | 11,492 |
| 1914 | 22,284 | 9,633 |
| 1915 | 23,466 | 9,092 |
| 1916 | 22,378 | 10,698 |
| 1917 | 22,115 | 9,270 |
| 1918 | 21,823 | 10,830 |
| 1919 | 25,414 | 13,150 |
The funds, assets, and liabilities of the Government Insurance Department belonging to its Accident Insurance Branch are kept separate and distinct from the main life-insurance business, and powers are vested in the Governor-General to make regulations in regard to tables fixing rates of premium and other details for the conduct of the Accident Insurance Branch.
The funds at the end of 1918 amounted to £6,329. The funds at the end of 1919 stood at £13,887, representing an excess of income over outgo for the year amounting to £7,558. The Reserve Fund, which was constituted under section 20 of the Government Accident Insurance Act, 1908, now stands at £91,808. The total assets at the end of the year amounted to £128,940.
By an Order in Council gazetted 31st July, 1919, the Government Statistician was authorized to collect statistics relating to offices doing fire business in the Dominion, the principal heads of inquiry being as to the stability of companies, revenue account, and fire losses. Information was collected for the year 1918.
It should be remembered that a single year's statistics are of little value in themselves. This is especially true of the year 1918, the figures for which show an exceptionally heavy outgo on account of the Waimarino bush fires, which partially wiped out the Town of Raetihi, together with miles of surrounding country. Statistics were collected in connection with the thirty-four offices carrying on business in the Dominion, five of which were mutual associations.
The total revenue of all offices carrying on fire business in the Dominion during 1918 was £959,410 net and £1,405,134 gross, including premiums £902,008 net and £1,347,772 gross. The last figure represents 0.61 per cent. of the total business underwritten. The total expenditure amounted to £733,176 net and £942,318 gross, including losses £332,394 net and £472,247 gross. The last figure represents 35.04 per cent. of the total premiums charged and 0.22 per cent. of the total risks covered. Net working-expenses amounted to 35.59 per cent. of net premium income and 24.49 per cent. of total net income. Gross working-expenses amounted to 28.90 per cent. of total gross premium income.
There were 2,273 fires and 76 conflagrations (cases where three or more buildings were affected) in connection with which policies of fire insurance were issued. In all 2,964 buildings were affected.
The full detailed tables relating to fire insurance will be found in Volume IV of the Statistics of New Zealand.
In the year 1903 an Act was passed “to establish a State Fire Insurance Office and to make other provisions for the insurance and protection of insurable property in New Zealand against loss or damage by fire.” This Act came into operation on the 4th January, 1905, when the State Fire Insurance Office opened for public business.
As a consequence of the operations of the State Fire Office, the rates on trade risks and the like have been reduced by 10 per cent., and those on dwellings, offices, and similar risks by 33 1/3 per cent.
The premium income, after deducting premiums on reinsurances during the ten years 1910–19, has been as follows:—
| Year. | Amount of Net Premium Income. |
|---|---|
| £ | |
| 1910 | 40,552 |
| 1911 | 47,745 |
| 1912 | 54,380 |
| 1913 | 59,418 |
| 1914 | 64,646 |
| 1915 | 71,166 |
| 1916 | 77,609 |
| 1917 | 85,321 |
| 1918 | 90,077 |
| 1919 | 100,764 |
The premium rates have remained unaltered during the above years. Debentures to the amount of £2,000 were raised under the authority of the Act governing the Office, but have now been redeemed. The Office has the sum of £68,196 invested in Government debentures and Consols, exclusive of war bonds mentioned below. The accumulated funds amount to £256,338, an increase of £47,318 over the figures for 1918.
The net surplus for the year 1919 (inclusive of income-tax charges), after appropriating a sum of £4,275 to reserve for unearned premiums and £1,000 to a special Investments Fluctuation Reserve, were £51,910 as against £42,265 for 1918. From this sum of £51,910 income-tax amounting to £14,867 is deductible. The total accumulated profit at the 31st December, 1919, amounted to £210,032, as compared with £172,989 on 31st December, 1918.
The loss-ratio of 23.0 per cent. for the year, as compared with 33.2 per cent. for 1918, is still remarkably low, and is considerably less than the average loss-ratio for the whole fire-insurance business of the Dominion.
The total cover (new and renewals) issued during the year amounted to the large sum of over £26,000,000.
The total assets of the Office at the close of 1919 amounted to £288,349, the increase for the year being £43,422. Investments at the 31st December, 1919, amounted to £232,371.
Every foreign company—i.e., a company registered or established out of New Zealand, and including a local company whose chief office is situated out of the Dominion—which proposes to commence in New Zealand the business of life insurance, whether conjointly or not with any other class of business, must deposit with the Public Trustee a sum of not less than £5,000 nor more than £50,000 in cash or approved securities. The amount of deposit is calculated on the total amount assured by current policies at the rate of £5,000 deposit for every £100,000 assured until the maximum deposit is reached.
A foreign company proposing to carry on fire- and marine-insurance business in the Dominion must first obtain from the Public Trustee a certificate in the form prescribed authorizing the company to transact its business for a period of twelve months from the date of the certificate. The certificate is renewable annually, provided the Public Trustee is satisfied that the company is financially sound.
Accident insurance or insurance business of any class not previously mentioned may be transacted in New Zealand by a foreign company, provided the company deposit with the Public Trustee the sum of £10,000 in cash or approved securities. If the company carries on a life-assurance business as well as accident insurance the last-mentioned deposit must be made in addition to that described in the first paragraph.
All cash deposited with the Public Trustee as deposit shall bear interest, which is payable to the company making the deposit.
Table of Contents
THE total revenue and expenditure of the Consolidated Fund Account for the financial years ended the 31st March, 1911 to 1920, is shown in the following table, together with the excess of revenue for each year and the amount of such excess transferred to the Public Works Fund in the succeeding year:—
| Year ended 31st March. | Revenue. | Expenditure. | Excess of Revenue over Expenditure. | Amount of Excess transferred to the Public Works Fund. |
|---|---|---|---|---|
| £ | £ | £ | £ | |
| 1911 | 10,297,273 | 9,343,106 | 954,167 | 800,000 |
| 1912 | 11,061,161 | 10,340,368 | 720,793 | 500,000 |
| 1913 | 11,734,271 | 11,082,038 | 652,233 | 750,000 |
| 1914 | 12,229,661 | 11,825,864 | 403,797 | 675,000 |
| 1915 | 12,451,945 | 12,379,803 | 72,142 | 350,000 |
| 1916 | 14,507,530 | 12,493,107 | 2,014,423 | |
| 1917 | 18,355,194 | 14,058,770 | 4,296,424 | |
| 1918 | 20,206,222 | 15,120,288 | 5,085,934 | |
| 1919 | 22,352,372 | 18,673,599 | 3,678,773 | |
| 1920 | 26,081,340 | 23,781,524 | 2,299,816 | |
| Totals, 10 years | 159,276,969 | 139,098,467 | 20,178,502 | 3,075,000 |
To the amount of excess revenue for the ten years must be added the sum of £432,315 brought forward from the financial year ended the 31st March, 1910, and an amount of £14,960, representing sinking funds set free (£2,607 in 1915–16 and £12,353 in 1916–17), and making a total of £20,625,777. Deducting the total amount transferred to the Public Works Fund, and a sum of £11,800 for redemption of debentures (£11,400 in 1913–14 and £400 in 1919–20), there remains a balance of £17,538,977 which has been carried forward to the current year's account.
The total amount of excess revenue transferred to the Public Works Fund during the twenty-nine financial years ended the 31st March, 1920, was £10,305,000.
An analysis of the revenue received during each of the past ten financial years is made in the next table.
Revenue under the head of “Taxation” includes Customs and excise duties, land-tax, income-tax, death duties, a tax on bank-note issue, and totalizator-taxes. Revenue from “Services” consists of Railway, Post, Telegraph, and Telephone receipts, and certain fees paid in return for special services. Revenue from “Crown Lands” includes proceeds of sales up to and including 1912–13, but not for subsequent years. The other items in Crown-lands revenue are rents and national-endowment net revenue. The amounts shown under “Other Sources” include miscellaneous revenue and sundry amounts recovered in respect of expenditure of previous years.
| Year ended 31st March. | Revenue derived from | Total Revenue. | |||
|---|---|---|---|---|---|
| Taxation. | Services. | Crown Lands. | Other Sources. | ||
| £ | £ | £ | £ | £ | |
| 1911 | 4,837,322 | 4,743,056 | 310,894 | 406,001 | 10,297,273 |
| 1912 | 5,296,590 | 4,987,088 | 311,156 | 466,327 | 11,061,161 |
| 1913 | 5,606,829 | 5,379,966 | 313,923 | 433,553 | 11,734,271 |
| 1914 | 5,918,034 | 5,551,913 | 262,846 | 496,868 | 12,229,661 |
| 1915 | 5,880,811 | 5,706,929 | 318,393 | 545,812 | 12,451,945 |
| 1916 | 7,266,966 | 6,423,452 | 311,969 | 505,143 | 14,507,530 |
| 1917 | 10,549,654 | 6,885,422 | 301,758 | 618,360 | 18,355,194 |
| 1918 | 12,340,853 | 6,729,524 | 306,136 | 829,709 | 20,206,222 |
| 1919 | 13,801,643 | 7,180,258 | 311,558 | 1,058,913 | 22,352,372 |
| 1920 | 16,251,769 | 8,034,644 | 331,597 | 1,463,330 | 26,081,340 |
| Totals, 10 years | 87,750,471 | 61,622,252 | 3,080,230 | 6,824,016 | 159,276,969 |
During and since the war period the total revenue shows in each year very large increases. These increases are due in great part to increased taxation, but partly also to increased charges for certain public services, notably railway fares and postal and telegraphic charges.
The total revenue per head of population, and the amounts per head derived from taxation and from other sources, during the past ten years are shown in the following table:—
| Year ended 31st March. | Revenue per Head derived from | Total Revenue per Head. | |||||||
|---|---|---|---|---|---|---|---|---|---|
| Taxation. | Other Sources. | ||||||||
| £ | s. | d. | £ | s. | d. | £ | s. | d. | |
| 1911 | 4 | 16 | 11 | 5 | 9 | 5 | 10 | 6 | 4 |
| 1912 | 5 | 3 | 10 | 5 | 13 | 1 | 10 | 16 | 11 |
| 1913 | 5 | 7 | 2 | 5 | 17 | 1 | 11 | 4 | 3 |
| 1914 | 5 | 10 | 0 | 5 | 17 | 4 | 11 | 7 | 4 |
| 1915 | 5 | 7 | 5 | 6 | 0 | 0 | 11 | 7 | 5 |
| 1916 | 6 | 12 | 1 | 6 | 11 | 7 | 13 | 3 | 8 |
| 1917 | 9 | 11 | 11 | 7 | 2 | 0 | 16 | 13 | 11 |
| 1918 | 11 | 3 | 9 | 7 | 2 | 7 | 18 | 6 | 4 |
| 1919 | 12 | 7 | 8 | 7 | 13 | 5 | 20 | 1 | 1 |
| 1920 | 14 | 2 | 9 | 8 | 10 | 4 | 22 | 13 | 1 |
Expenditure out of the Consolidated Fund is grouped under two main headings by the Treasury, “Permanent” and “Annual.” Permanent appropriations, as the name implies, are those fixed by special Acts of the Legislature. Annual appropriations are voted each year by resolution of Parliament, and include the cost of the business undertakings of the State. In the following table this grouping has not been adopted, as it is considered more desirable to show the growth of the main items of expenditure during the last ten financial years:—
| Year ended 31st March. | Amount expended on | Total Expenditure. | ||||
|---|---|---|---|---|---|---|
| Working Railways. | Post and Telegraph. | Education. | Interest, &c., on Public Debt. | Other Expenses. | ||
| £ | £ | £ | £ | £ | £ | |
| 1911 | 2,270,851 | 911,529 | 984,854 | 2,458,452 | 2,717,420 | 9,343,106 |
| 1912 | 2,467,718 | 986,527 | 1,072,992 | 2,656,344 | 3,156,787 | 10,340,368 |
| 1913 | 2,817,141 | 1,066,922 | 1,148,897 | 2,717,013 | 3,332,065 | 11,082,038 |
| 1914 | 3,004,181 | 1,170,883 | 1,206,678 | 2,887,981 | 3,556,141 | 11,825,864 |
| 1915 | 2,881,087 | 1,245,224 | 1,288,795 | 3,071,448 | 3,893,249 | 12,379,803 |
| 1916 | 2,964,006 | 1,294,712 | 1,441,398 | 3,190,798 | 3,602,193 | 12,493,107 |
| 1917 | 2,871,977 | 1,368,490 | 1,525,106 | 4,032,885 | 4,260,312 | 14,058,770 |
| 1918 | 3,067,658 | 1,487,145 | 1,640,988 | 4,430,779 | 4,493,718 | 15,120,288 |
| 1919 | 3,415,595 | 1,699,701 | 1,737,036 | 6,086,769 | 5,734,498 | 18,673,599 |
| 1920 | 4,305,965 | 1,941,494 | 2,190,587 | 7,249,426 | 8,094,052 | 23,781,524 |
The “Other Expenses” group includes old-age pensions, which amounted to £382,792 in 1910–11 and to £732,422 in 1919–20. The charges of the public debt are found to have absorbed 23.87 per cent. of the revenue in 1910–11 and 27.79 per cent. in 1919–20.
The total receipts of the Consolidated Fund for the financial year 1919–20, including a balance of £15,239,561 brought forward from the previous year, were £41,320,901, and the total expenditure for the same period was £23,781,524, exclusive of £400 set free for redemption of debentures, leaving the large balance of £17,538,976 to carry forward.
| CONSOLIDATED FUND.—RECEIPTS, 1919–20. | ||
|---|---|---|
| £ | £ | |
| From taxation— | ||
| Customs | 4,830,325 | |
| Excise | 355,403 | |
| Land-tax | 1,557,903 | |
| Income-tax | 6,369,765 | |
| Death duties | 978,095 | |
| Bank-note-issue tax | 212,626 | |
| Totalizator-tax | 413,654 | |
| Amusements-tax | 68,065 | |
| Other taxes | 1,465,933 | |
| 16,251,769 | ||
| From services— | ||
| Railways | 5,766,015 | |
| Postal | 1,013,026 | |
| Telegraph | 604,221 | |
| Telephone | 419,318 | |
| Other services | 232,064 | |
| 8,034,644 | ||
| Land revenue— | ||
| Rents, Crown lands | 218,757 | |
| Net revenue from national-endowment lands | 112,840 | |
| 331,597 | ||
| Miscellaneous | 1,463,330 | |
| Total | £26,081,340 | |
Taxation represented 62.31 per cent. of the total revenue for the year 1919–20, and services contributed 30.81 per cent. For the last financial year preceding the war (1913–14) the proportions were 48.39 per cent. and 45.40 per cent. respectively.
The amount shown as net revenue from national-endowment lands represents the money received from that source during the previous financial year. The method adopted is to place the amount received under this head each year to a separate account, and, after deducting necessary expenses, to transfer the balance to the Consolidated Fund Account. Of this balance 70 per cent. is expended on education and 30 per cent. on old-age pensions.
| CONSOLIDATED FUND.—EXPENDITURE, 1919–20. | ||
|---|---|---|
| £ | £ | |
| Charges of the public debt (excluding interest and sinking fund charges paid out of separate accounts) | 7,249,426 | |
| Pensions and allowances— | ||
| Old-age pensions | 732,422 | |
| Widows’ pensions | 136,730 | |
| Military pensions | 1,859,179 | |
| Miners’ pensions | 12,687 | |
| Civil pensions and allowances | 35,269 | |
| Civil Service, Railway, and Teachers’ Superannuation Funds | 154,000 | |
| 2,930,287 | ||
| Payment to local bodies— | ||
| Subsidies | 185,302 | |
| Endowments revenue | 37,152 | |
| Under the Land Act | 24,275 | |
| Other payments | 316 | |
| 247,045 | ||
| Public instruction— | ||
| Elementary | 1,348,999 | |
| Secondary and higher | 220,525 | |
| Manual and technical | 113,766 | |
| Training of teachers | 83,026 | |
| Native schools | 51,307 | |
| School buildings | 148,975 | |
| Departmental and miscellaneous | 145,001 | |
| National-endowment revenue not included above | 78,988 | |
| 2,190,587 | ||
| Judicial and legal— | ||
| Administration of justice | 151,880 | |
| Police | 307,045 | |
| Prisons | 78,844 | |
| 537,760 | ||
| Railways working-expenses | 4,305,965 | |
| Postal and Telegraph services | 1,941,494 | |
| Defence (including naval defence) | 528,569 | |
| Other expenditure— | ||
| Departmental | 3,835,905 | |
| Miscellaneous | 14,477 | |
| 3,850,382 | ||
| Total | £23,781,524 | |
A comparison of the revenue of the Consolidated Fund for the year 1919–20 with that of the previous year, together with the percentage which each item bears to the totals, and the increase or decrease, as the case may be, is given in the table following:—
| CONSOLIDATED FUND.—REVENUE FOR 1919–20 COMPARED WITH 1918–19. | ||||||
|---|---|---|---|---|---|---|
| Head of Revenue. | Revenue of Consolidated Fund. | Increase for 1919–20. | ||||
| 1918–19. | Per Cent. of Total. | 1919–20. | Per Cent. of Total. | Numerical. | Per Cent. | |
* Decrease. | ||||||
| £ | £ | £ | ||||
| Taxation— | ||||||
| Customs and excise | 4,104,016 | 18.36 | 5,185,728 | 19.88 | 1,081,712 | 26.35 |
| Land | 1,512,693 | 6.77 | 1,557,903 | 5.98 | 45,210 | 2.99 |
| Income | 6,219,336 | 27.82 | 6,369,765 | 24.42 | 150,429 | 2.42 |
| Death duties | 869,371 | 3.89 | 978,095 | 3.75 | 108,724 | 12.51 |
| Other taxes | 1,096,227 | 4.90 | 2,160,278 | 8.28 | 1,064,051 | 97.06 |
| Services— | ||||||
| Railways | 4,975,445 | 22.26 | 5,766,015 | 22.11 | 790,570 | 15.89 |
| Postal | 993,584 | 4.45 | 1,013,026 | 3.89 | 19,442 | 1.96 |
| Telegraph | 615,786 | 2.75 | 604,221 | 2.32 | –11,565 | 1.88* |
| Telephone | 373,169 | 1.67 | 419,318 | 1.61 | 46,149 | 12.37 |
| Other services | 222,274 | 1.00 | 232,064 | 0.89 | 9,790 | 4.40 |
| Land revenue | 311,558 | 1.39 | 331,597 | 1.26 | 20,039 | 6.43 |
| Miscellaneous | 1,058,913 | 4.74 | 1,463,330 | 5.61 | 404,417 | 38.19 |
| Totals | 22,352,372 | 100.00 | 26,081,340 | 100.00 | 3,728,968 | 16.68 |
The expenditure of the Consolidated Fund Account for the last two financial years is presented in the next table in similar form to the above.
| Head of Expenditure. | Expenditure of Consolidated Fund. | Increase for 1919–20. | ||||
|---|---|---|---|---|---|---|
| 1918–19. | Per Cent. of Total. | 1919–20. | Per Cent. of Total. | Numerical. | Per Cent. | |
* Decrease. | ||||||
| £ | £ | £ | ||||
| Charges of the public debt | 6,086,769 | 32.60 | 7,249,426 | 30.48 | ,162,657 | 19.10 |
| Pensions and allowances | 2,275,841 | 12.19 | 2,930,287 | 12.32 | 654,446 | 28.76 |
| Payment to local bodies | 252,254 | 1.35 | 247,045 | 1.04 | -5,209* | 2.06 |
| Public instruction | 1,737,036 | 9.30 | 2,190,587 | 9.21 | 453,551 | 26.11 |
| Judicial and legal | 516,069 | 2.76 | 537,769 | 2.27 | 21,700 | 4.21 |
| Railways working-expenses | 3,415,595 | 18.29 | 4,305,965 | 18.11 | 890,370 | 26.07 |
| Postal and Telegraph services | 1,699,701 | 9.10 | 1,941,494 | 8.16 | 241,793 | 14.23. |
| Defence (including naval) | 448,553 | 2.40 | 528,569 | 2.22 | 80,016 | 7.84 |
| Other expenditure | 2,241,781 | 12.01 | 3,850,382 | 16.19 | 1,608,601 | 71.76 |
| Totals | 18,673,599 | 100.00 | 23,781,524 | 100.00 | 5,107,925 | 27.35 |
The receipts of this account consist mainly of the proceeds of loans raised for the construction of public works. From time to time the fund has been aided by substantial transfers of surplus revenue from the Consolidated Fund Account. The receipts for the last ten years are shown in the next table.
| PUBLIC WORKS FUND.—RECEIPTS, TEN YEARS. | ||||
|---|---|---|---|---|
| Year ended 31st March. | Amounts received. | Total Receipts. | ||
| From Loans. | Transfers from Consolidated Fund. | Other Sources. | ||
| £ | £ | £ | £ | |
| 1911 | 2,590,140 | 800,000 | 6,508 | 3,396,648 |
| 1912 | 744,307 | 500,000 | 12,149 | 1,256,456 |
| 1913 | 2,420,685 | 750,000 | 130,044 | 3,300,729 |
| 1914 | 2,763,884 | 675,000 | 39,867 | 3,478,751 |
| 1915 | 1,857,742 | 350,000 | 16,749 | 2,224,491 |
| 1916 | 3,166,830 | 20,324 | 3,187,154 | |
| 1917 | 1,095,000 | 10,837 | 1,105,837 | |
| 1918 | 1,025,100 | 66,095 | 1,091,195 | |
| 1919 | 1,180,000 | 60,680 | 1,240,680 | |
| 1920 | 2,082,000 | 161,389 | 2,243,389 | |
In addition to the amounts shown above, the sum of £6,430,000 was transferred during the years 1891–92 to 1907–8 from the Consolidated Fund Account to the Public Works Fund. The next table shows the expenditure at intervals of five years from 1884–85 to 1904–5 and for each of the last eleven financial years upon services which are charged to the fund. As will be seen further on, the whole of what may be termed public works are not included in this account.
| Year ended 31st March. | Immigration. | Railways. | Roads. | Development of Mining. | Telegraph Ex tension. | Public Buildings. | Lighthouses, &c. | Other services. | Totals. |
|---|---|---|---|---|---|---|---|---|---|
| £ | £ | £ | £ | £ | £ | £ | £ | £ | |
| 1885 | 57,148 | 663,063 | 317,043 | 8,029 | 25,799 | 117,361 | 34,033 | 114,251 | 1,336,727 |
| 1890 | 867 | 289,572 | 84,126 | 284 | 16,346 | 35,473 | 9,434 | 46,362 | 482,464 |
| 1895 | 101 | 247,545 | 164,833 | 5,865 | 19,229 | 54,190 | 3,145 | 9,578 | 504,486 |
| 1900 | 385 | 417,937 | 285,532 | 21,815 | 26,771 | 115,427 | 9,026 | 116,330 | 993,223 |
| 1905 | 6,482 | 811,994 | 230,012 | 6,258 | 79,298 | 116,678 | 5,990 | 97,446 | 1,354,158 |
| 1910 | 17,002 | 1,279,807 | 367,230 | 18,598 | 123,422 | 276,949 | 16,683 | 116,706 | 2,216,397 |
| 1911 | 9,441 | 1,184,083 | 270,648 | 10,845 | 111,868 | 325,613 | 8,427 | 137,766 | 2,058,691 |
| 1912 | 11,681 | 1,178,969 | 430,647 | 21,245 | 147,692 | 349,655 | 12,576 | 187,915 | 2,340,380 |
| 1913 | 14,694 | 1,179,554 | 376,078 | 10,644 | 251,375 | 445,142 | 16,785 | 254,646 | 2,548,918 |
| 1914 | 33,914 | 1,144,756 | 382,097 | 4,889 | 392,648 | 369,600 | 9,059 | 423,835 | 2,760798 |
| 1915 | 33,219 | 1,156,073 | 514,798 | 2,384 | 288,395 | 417,000 | 17,131 | 308,364 | 2,737,364 |
| 1916 | 10,010 | 1,205,287 | 424,637 | 6,602 | 249,554 | 335,774 | 13,673 | 387,675 | 2,583,212 |
| 1917 | 6,533 | 846,983 | 219,794 | 4,592 | 203,311 | 251,431 | 3,768 | 239,101 | 1,775,513 |
| 1918 | 3,856 | 607,931 | 135,642 | 27 | 213,955 | 229,288 | 2,976 | 208,162 | 1,401,837 |
| 1919 | Cr. 12,018 | 467,737 | 226,073 | 518 | 198,611 | 235,846 | 5,392 | 265,502 | 1,387,661 |
| 1920 | Cr. 62,561 | 842,082 | 388,562 | 1,173 | 749,379 | 469,195 | 3,498 | 341,486 | 2,232,815 |
The receipts and expenditure of the fund during the financial year ended 31st March, 1920, were as under:—
| £ | £ | |
| Receipts— | ||
| Balance, 31st March, 1919 | 239,489 | |
| Debentures issued under the Finance Act, 1918 (No. 2) | 1,940,000 | |
| Debentures issued under the Railways Improvement Authorization Act, 1914 | 112,000 | |
| Debentures issued under the Waihou and Ohinemuri Rivers Improvement Act, 1910 | 30,000 | |
| 2,082,000 | ||
| Recoveries on account of expenditure of previous years | 112,864 | |
| Receipts under the Waihou and Ohinemuri Rivers Improvement Act, 1910 | 2,716 | |
| Receipts in connection with the Ellesmere and Forsyth Reclamation and Akaroa Railway Trust Account | 1,592 | |
| Receipts under State Supply of Electrical Energy Act, 1917 | 44,217 | |
| 161,389 | ||
| Total | £2,482,878 | |
| Expenditure— | ||
| Railways | 842,082 | |
| Roads | 388,562 | |
| Public buildings | 469,195 | |
| Telegraph extension | 249,379 | |
| Contingent defence | 10,187 | |
| Immigration | Cr. 62,561 | |
| Development of mining | 1,173 | |
| Lighthouses, harbour-works, and harbour-defences | 3,498 | |
| Tourist and health resorts | 6,194 | |
| Lands improvement | 2,964 | |
| Development of water-power | 79,401 | |
| Irrigation and water-supply | 34,115 | |
| Waihou and Ohinemuri Rivers improvement | 39,266 | |
| Plant, material, and stores | 47,682 | |
| Departmental | 121,435 | |
| Services not provided for | 243 | |
| 2,232,815 | ||
| Balance, 31st March, 1920 | 250,063 | |
| Total | £2,482,878 | |
The expenditure on roads out of the Public Works Fund does not comprise all of the moneys spent under that head by the General Government. Between 1896–97 and 1910–11 the sum of £469,236 was expended on construction of roads to open up Crown lands out of the moneys raised for loans to local bodies, and further sums have been spent from time to time for this purpose and for the opening-up of national-endowment lands out of the Land for Settlements and National Endowment Accounts respectively.
The roading of lands purchased for closer settlement is made a charge upon the Land for Settlements Account, and is included in the value upon which the rentals of those lands are based. The reclamation by drainage and opening up by means of roads of an area of the Hauraki Plains is provided for out of moneys borrowed for that purpose and shown in a separate account.
The accounts included under this heading in some cases comprise revenue of different kinds mixed up with loan-money, while others are merely records of transactions which of their nature cannot be considered as properly belonging to the Public Account. Among the former may be counted the State Forests and State Coal-mines Accounts, and among the latter the accounts of local bodies, which consist of revenue collected on behalf of and paid over to local authorities, and the Deposit Accounts, consisting partly of moneys held in trust and partly of moneys held in suspense for various reasons.
| Account. | Receipts | Expenditure. | |
|---|---|---|---|
| From Loan. | From other Sources. | ||
| £ | £ | £ | |
| Land for Settlements (opening up Crown lands for settlement) | 81,203 | 69,673 | |
| Waimarino Bush-fire Relief | 21,634 | 21,092 | |
| State Forests | 65,00 | 8,514 | 70,396 |
| State Coal-mines | 236,176 | 293,442 | |
| Scenery Preservation | 5,000 | 264 | 753 |
| Local Bodies | 51,442 | 53,559 | |
| Deposit | 38,283,770 | 38,141,263 | |
| Cheviot Estate | 23,335 | 8,866 | |
| Native Land Settlements | 325,000 | 79,521 | 470,230 |
| Conversion | 330 | ||
| War Expenses | 11,632,735 | 832,345 | 15,911,177 |
| Land for Settlements | 560,000 | 779,128 | 1,383,834 |
| Hauraki Plains | 40,000 | 26,589 | 74,806 |
| National Endowment | 109,378 | 121,770 | |
| Workers’ Dwellings | 14,649 | 22,467 | |
| Mining Advances | 1,098 | ||
| Rangitaiki Land Drainage | 105,000 | 6,340 | 64,965 |
| Bank of New Zealand Acts 1903 and 1913 | 875,000 | 875,000 | |
| Reserve Fund | 800,000 | 800,000 | |
| New Zealand Consols | 475,992 | 475,992 | |
| Kauri-gum Industry | 6,000 | 44,503 | 37,569 |
| Swamp Land Drainage | 27,000 | 31,541 | |
| Fruit-preserving Industry Advances | 13,410 | 4,641 | 21,750 |
| Discharged Soldiers Settlement | 8,445,000 | 1,011,067 | 8,700,580 |
| Cold-storage Advances | 17,500 | 21,692 | 28,642 |
| Land for Settlements (Discharged Soldiers Settlement) | 1,775,000 | 1,456,404 | |
The cash balances and investments of the foregoing accounts as on 31st March, 1920, are shown in the following table:—
| Account. | Cash. | Investments. | Total. |
|---|---|---|---|
| Cr. | £ | £ | £ |
| Consolidated Fund (ordinary revenue) | 2,358,726 | 15,180,250 | 17,538,976 |
| State Forests | 5,517 | 5,517 | |
| State Coal-mines | 18,090 | 45,000 | 63,090 |
| Scenery Preservation | 4,944 | 4,944 | |
| Local Bodies | 8,741 | 8,741 | |
| Deposit Accounts | 1,688,422 | 1,521,195 | 3,209,617 |
| Public Works Fund (proper) | 219,502 | 219,502 | |
| Railways Improvement Authorization Act, 1914 | 22,794 | 22,794 | |
| Waihou and Ohinemuri Rivers Improvement | 6,263 | 6,263 | |
| Electric Supply | 1,504 | 1,504 | |
| Cheviot Estate | 6,552 | 140,260 | 146,812 |
| Land for Settlements | 156,668 | 156,668 | |
| Land for Settlements (opening up Crown lands for settlement) | 22,377 | 22,377 | |
| Native Land Settlement | 22,869 | 22,869 | |
| Conversion Account | 6,905 | 6,905 | |
| War Expenses | 1,308,510 | 3,225,218 | 4,533,728 |
| Hauraki Plains Settlement | 2,333 | 2,333 | |
| National Endowment | 100,448 | 100,448 | |
| Workers’ Dwellings | 77,100 | 77,100 | |
| Mining Advances | 4,178 | 4,178 | |
| Rangitaiki Land Drainage | 50,754 | 50,754 | |
| Bank of New Zealand (preference shares) | 875,000 | 875,000 | |
| Reserve Fund | 800,000 | 800,000 | |
| New Zealand Consols | 7 | 475,985 | 475,992 |
| Kauri-gum Industry | 16,322 | 16,322 | |
| Swamp Drainage | 1,723 | 1,723 | |
| Fruit-preserving Industry Advances | 384 | 384 | |
| Cold-storage Advances | 10,550 | 10,550 | |
| Discharged Soldiers Settlement | 975,254 | 975,254 | |
| Waimarino Bush-fire Relief | 5,892 | 17,700 | 23,592 |
| Land for Settlements (Discharged Soldiers Settlement) | 318,596 | 318,596 | |
| Totals | 7,344,825 | 22,357,708 | 29,702,533 |
The State Advances Account, which is administered directly by the Advances Board, is not included in the above statement, nor is the Loans Redemption Account. In addition there are the funds of the Government Life. Insurance Department, the State Fire Insurance Department, and the Public Trust Office, which are administered by the Departments concerned. Reference to the working of these Departments will be found elsewhere in this book.
ALL revenue collected by means of taxation is applied to general purposes. Customs duties on imported goods, excise duties on beer and also on a few minor items, constitute the indirect taxation, land and income taxes, death duties, a tax on bank-note issues, duty on cheques and receipts for payments being the main source of revenue by direct taxation. Particulars of the collections during the past ten years, under the main headings, are shown in the following table:—
| Year ended 31st March. | Amount of Taxation derived from | Total. | ||||
|---|---|---|---|---|---|---|
| Customs and Excise Duties. | Land-tax. | Income-tax. | Death Duties. | Other Taxes. | ||
| £ | £ | £ | £ | £ | £ | |
| 1911 | 3,145,929 | 628,723 | 407,235 | 323,783 | 331,652 | 4,837,322 |
| 1912 | 3,398,143 | 647,015 | 448,935 | 361,186 | 441,311 | 5,296,590 |
| 1913 | 3,531,761 | 728,636 | 462,994 | 458,265 | 425,173 | 5,606,829 |
| 1914 | 3,553,785 | 767,451 | 554,271 | 613,751 | 428,776 | 5,918,034 |
| 1915 | 3,294,943 | 799,641 | 540,318 | 796,232 | 449,677 | 5,880,811 |
| 1916 | 3,524,063 | 1,048,356 | 1,392,119 | 610,350 | 692,078 | 7,266,966 |
| 1917 | 4,037,628 | 713,118 | 4,262,126 | 570,040 | 966,742 | 10,549,654 |
| 1918 | 3,601,383 | 1,385,708 | 5,619,561 | 805,511 | 928,690 | 12,340,853 |
| 1919 | 4,104,016 | 1,512,693 | 6,219,336 | 869,371 | 1,096,227 | 13,801,643 |
| 1920 | 5,185,728 | 1,557,903 | 6,369,765 | 978,095 | 2,160,278 | 16,251,769 |
The percentage under each heading to the total amount collected for each year is as under:—
| Year ended 31st March. | Proportion per Cent. derived from | ||||
|---|---|---|---|---|---|
| Customs and Excise Duties. | Land-tax. | Income-tax. | Death Duties. | Other Direct Taxes. | |
| Per Cent. | Per Cent. | Per Cent. | Per Cent. | Per Cent. | |
| 1911 | 65.03 | 13.00 | 8.42 | 6.69 | 6.86 |
| 1912 | 64.16 | 12.21 | 8.48 | 6.82 | 8.33 |
| 1913 | 62.99 | 13.00 | 8.26 | 8.17 | 7.58 |
| 1914 | 60.05 | 12.97 | 9.37 | 10.37 | 7.24 |
| 1915 | 56.03 | 13.60 | 9.19 | 13.54 | 7.64 |
| 1916 | 48.49 | 14.43 | 19.16 | 8.40 | 9.52 |
| 1917 | 38.27 | 6.76 | 40.40 | 5.40 | 9.17 |
| 1918 | 29.18 | 11.23 | 45.54 | 6.53 | 7.52 |
| 1919 | 29.74 | 10.96 | 45.06 | 6.30 | 7.94 |
| 1920 | 31.91 | 9.59 | 39.19 | 6.02 | 13.29 |
Some remarkable alterations in percentages are noticed during the last few years, due to war taxation.
The revenue from taxation per head of mean population during the past ten years is shown in the next table:—
| Year ended 31st March. | Including Maoris. | Excluding Maoris. | ||||
|---|---|---|---|---|---|---|
| £ | s. | d. | £ | s. | d. | |
| 1911 | 4 | 12 | 4 | 4 | 16 | 11 |
| 1912 | 4 | 19 | 0 | 5 | 3 | 10 |
| 1913 | 5 | 2 | 3 | 5 | 7 | 2 |
| 1914 | 5 | 5 | 2 | 5 | 10 | 0 |
| 1915 | 5 | 2 | 9 | 5 | 7 | 5 |
| 1916 | 6 | 6 | 4 | 6 | 12 | 1 |
| 1917 | 9 | 3 | 7 | 9 | 11 | 11 |
| 1918 | 10 | 14 | 1 | 11 | 3 | 9 |
| 1919 | 11 | 17 | 1 | 12 | 7 | 8 |
| 1920 | 13 | 11 | 1 | 14 | 2 | 9 |
During the year ended 31st March, 1920, the sum of £4,787,483 was collected, after deduction of drawbacks, for duty on imported goods, and £397,905 for excise duties, a total of £5,185,388. The amount of revenue derived from these sources for each of the past ten years is shown below.
| Year ended 31st March. | Customs Duties. | Excise Duties. | Total. |
|---|---|---|---|
| £ | £ | £ | |
| 1911 | 3,027,829 | 118,100 | 3,145,929 |
| 1912 | 3,279,012 | 119,131 | 3,398,143 |
| 1913 | 3,407,538 | 124,223 | 3,531,761 |
| 1914 | 3,426,744 | 127,041 | 3,553,785 |
| 1915 | 3,167,283 | 127,660 | 3,294,943 |
| 1916 | 3,366,171 | 157,892 | 3,524,063 |
| 1917 | 3,849,675 | 187,953 | 4,037,628 |
| 1918 | 3,364,308 | 237,075 | 3,601,383 |
| 1919 | 3,830,682 | 273,334 | 4,104,016 |
| 1920 | 4,787,483 | 397,905 | 5,185,388 |
The revenue from Customs and excise duties in 1909–10 was £2,786,490, and the increase for the ten years is therefore close on 90 per cent. In the ten calendar years corresponding to the same period the value of imports (excluding specie) increased from £14,817,462 to £30,308,908, or well over 100 per cent. Generally speaking, in spite of slight increases in Customs and excise duties referred to above as part of the war taxation, the average rate of duty has not increased greatly during the ten years. The increase in the total duties collected is thus almost entirely due to the increased prosperity of the country as reflected by its trade.
For a fuller discussion of Customs taxation than can be given here the reader is referred to the section of this book dealing with Commerce.
Except in regard to minor details, the system of land and income taxation in force in 1915 had remained unaltered for many years. Probably the only noteworthy point was the gradual hardening-up of the graduated land-tax, designed to prevent aggregation of land and to compel the cutting-up of large estates rather than to secure additional revenue.
The war taxation of 1915, however, not only included increased rates of 33 1/3 per cent. in the case of income-tax, 1/4 d. in the pound in the case of land-tax payable on mortgages, and 50 per cent. in the case of graduated land-tax, but also involved an important change of principle. Among the incomes formerly exempt from income-tax are those derived directly from land, but income-tax is now payable on such incomes, including those derived from mortgages of land. In the case of mortgages, however, the income-tax is reduced by such amount as has been paid for land-tax, provided such amount does not exceed the total amount of income-tax.
With the exception of the abolition of the land-tax on mortgages and the substitution of an income-tax in its place, the principles of land-tax assessment were not altered in 1916, nor were the rates increased, but an entirely new scheme, the excess-profits tax, was brought into operation in respect of income-tax, the 1915 system remaining also, with increased rates, for ordinary income-tax.
The excess-profits tax being found inequitable and otherwise unsatisfactory, a system of progressive land and income tax, with a special war tax on incomes, was adopted in 1917, and has been continued since.
Land-tax is assessed on the unimproved value of the land after allowing certain exemptions as set out below. As the law now stands an owner of land the unimproved value of which does not exceed £1,500 is allowed an exemption of £500, and where the unimproved value lies between £1,500 and £2,500 there is a similar exemption, diminished, however, by £1 for every £2 over the £1,500 mark, so that no exemption is allowable when the £2,500 is reached. Where the land is subject to a registered mortgage an alternate scale of deductions is provided—viz., £1,500 in cases where the unimproved value does not exceed £3,000, and the same amount diminished by £1 for every £2 above £3,000 when the unimproved value lies between £3,000 and £6,000. Where the capital value of the mortgage is less than the amount of deduction provided, such capital value is to be deducted instead. In lieu of the exemptions mentioned, the Commissioner of Taxes has discretionary powers to grant relief in certain specified cases of hardship. Subject to deductions provided, lessees and life tenants are liable to tax, and joint owners are to be assessed jointly as regards the land held in conjunction, and also severally in respect of each owner's interest in such land and any other land. This also applies to the shareholders in a company owning land.
The progressive land-tax, now substituted for the former double system of ordinary and graduated tax, ranges from 1d. to 7d. in the pound. The 1d. rate applies in cases where the unimproved value on which tax is payable does not exceed £1,000, and the rate is increased by 1/32,000 of a penny for every pound in excess of £1,000, up to the maximum of 7d. These rates were virtually increased for the year 1917–18 and later years by the imposition of a super-tax of 50 per cent., the minimum rate for the year being thus 1 1/2 d. and the maximum 10 1/2 d. A further 50-per-cent. increase on the total rates is imposed in the case of absentees, including shareholders in companies, but not in the case of the companies themselves.
Income-tax is payable on the full incomes of registered companies and of absentees, and in other cases on incomes in excess of £300 per annum. Formerly a deduction of £300 was made from the income in all cases (except for companies and absentees) when computing the amount of tax payable, but the full deduction is now made only when the income does not exceed £600. Between £600 and £900 the exemption is reduced by £1 for every £1 above £600, and no exemption at all is allowed for incomes above £900. Certain specified incomes are wholly exempt from taxation, and a further £25 is deductible from assessable income for each child under sixteen years of age. Sundry other deductions are also provided.
The rates of progressive income-tax since 1917–18 have ranged from 6d. to 3s. in the case of persons and firms, and from 1s. to 3s. for companies. The 6d. rate for persons and firms applies where the taxable income is not more than £400, and the 1s. rate for companies where the taxable income does not exceed £1,600, the rates being increased by 1/200 part of a penny for every additional pound until the maximum tax of 3s. in the pound is reached. Income derived by holders of company debentures from such debentures bears a uniform tax of 1s., plus a special war tax of 1s. 6d.
The special war tax also applies to assessable income in excess of £300 of all other income-tax payers. For incomes up to £400 the rate of special war tax is 9d. in the pound, and this is increased by 3/400 of a penny for every additional pound of income, but so as not to exceed 4s. 6d. in the pound. The maximum total rate of income-tax is thus 7s. 6d. in the pound.
A new feature of the land- and income-taxation laws of the Dominion was the provision in the Finance Act, 1917, for an additional penal tax in cases where the taxpayer had not contributed to the war loan in proportion to his income. The Act made it the duty of every taxpayer whose taxable income for the year ended 31st March, 1916, exceeded £700 to subscribe to the war loan of 1917–18, on notice being served by the Commissioner of Taxes, an amount equal to three times the amount of land and income tax payable for the year 1916–17. This provision was renewed for the following year by the Finance Act (No. 2) of 1918.
The income-tax for the year ended the 31st March, 1920, amounted to £6,369,765 and the land-tax to £1,557,903. The number of income-tax payers was 44,084, as against 30,230 just three years before. Land-tax payers numbered 53,807, as against 35,859 in 1917.
The total number of land- and income-tax payers for each of the past ten years was,—
| Year ended 31st March. | Land-tax. | Income-tax. |
|---|---|---|
| 1911 | 33,516 | 11,303 |
| 1912 | 35,273 | 12,207 |
| 1913 | 38,232 | 13,167 |
| 1914 | 40,889 | 14,277 |
| 1915 | 44,270 | 13,967 |
| 1916 | 45,409 | 20,072 |
| 1917 | 35,859 | 30,230 |
| 1918 | 51,275 | 37,949 |
| 1919 | 53,484 | 43,280 |
| 1920 | 53,807 | 44,084 |
The revenue derived from land-tax and income-tax during each of the past ten years is as shown below.
| Year ended 31st March. | Land-tax. | Income-tax. |
|---|---|---|
| £ | £ | |
| 1911 | 628,723 | 407,235 |
| 1912 | 647,015 | 448,935 |
| 1913 | 728,636 | 462,994 |
| 1914 | 767,451 | 554,271 |
| 1915 | 799,641 | 540,318 |
| 1916 | 1,048,356 | 1,392,119 |
| 1917 | 713,118 | 4,262,125 |
| 1918 | 1,385,708 | 5,619,561 |
| 1919 | 1,512,693 | 6,219,336 |
| 1920 | 1,557,903 | 6,369,765 |
In 1917 the dual system of land - taxation (ordinary and graduated) was superseded by a single graduated tax, which in 1919–20 yielded the sum of £1,557,903.
The fall in the amount of land-tax in 1916–17 was due to the alteration in system referred to above, whereby income derived from mortgages of land now bears income-tax instead of land-tax as formerly.
Under the Death Duties Act, 1909, an estate duty is levied upon the final balance of all property of a deceased person which is situated in New Zealand at his death in excess of the value of £500. In the case of any estate the final balance of which does not exceed £10,000, any interest acquired by the wife of the deceased up to the value of £5,000 is exempt from estate duty, but the rate of duty on the whole estate must be determined before the deduction is made.
The scale of duties ranges from 1 per cent. in cases where the net estate is between £500 and £1,000 to a maximum of 15 per cent. for large estates.
Succession duty is payable by any person who acquires a beneficial interest in the estate of a deceased person either by will or by intestacy, according to the following scale: Wife, husband, child, or other descendant of deceased, 2 per cent.: relatives up to fourth degree, 5 per cent.: all others, 10 per cent. Exemptions are allowed to a maximum of £20,000 for a wife of deceased, £5,000 for a child or grandchild of deceased, and £200 in other cases. The wife, lineal descendant, or lineal ancestor of a soldier who has met his death on account of the war is allowed an additional £5,000 exemption.
A gift means any disposition of property which is made otherwise than by will, whether with or without an instrument in writing, without fully adequate consideration in money or its equivalent. The duty payable is as follows:—
On a gift which together with the value of all other gifts made at the same time, or within twelve months previously or subsequently by the same donor to the same or any other beneficiary, otherwise than by way of a charitable trust, does not exceed the value of £1,000, no duty shall be charged.
On gifts exceeding the value of £1,000, 5 per cent. Antenuptial marriage settlements and charitable gifts are exempt from duty.
Death duties are due and payable to the Commissioner of Stamps within six months from the death of the deceased, and gift duties at the time the gift is made.
The revenue received from death duties during each of the past ten years was.—
| Year ended 31st March. | Amount.£ |
|---|---|
| 1911 | 323,783 |
| 1912 | 361,186 |
| 1913 | 458,265 |
| 1914 | 613,751 |
| 1915 | 796,232 |
| 1916 | 610,350 |
| 1917 | 570,040 |
| 1918 | 805,511 |
| 1919 | 869,371 |
| 1920 | 978,095 |
The Government tax on totalizator investments is 2 1/2 per cent. of the gross amount passed through the machines.
A tax of 1 per cent. has from the 1st November, 1915, been imposed on the total value of all stakes, and 6d. in the pound or part of a pound on totalizator dividends, in addition to the tax on totalizator investments.
| Financial Year. | Number of Totalizator Licenses issued for Meetings held during Financial Year. | Days. | Percentage paid to Treasury. | Total Amount invested by the Public. |
|---|---|---|---|---|
| £ | £ | |||
| 1910–11 | 144 | 287 | 48,338 | 1,933,534 |
| 1911–12 | 142 | 264 | 72,184 | 2,887,371 |
| 1912–13 | 148 | 265 | 86,095 | 3,600,465 |
| 1913–14 | 126 | 231 | 92,260 | 3,690,390 |
| 1914–15 | 141 | 255 | 110,733 | 4,429,320 |
| 1915–16 | 180 | 285 | 119,379 | 4,775,120 |
| 1916–17 | 171 | 279 | 127,387 | 5,095,480 |
| 1917–18 | 135 | 205 | 110,845 | 4,433,816 |
| 1918–19 | 134 | 201 | 122,154 | 4,886,156 |
| 1919–20 | 183 | 302 | 209,345 | 8,373,787 |
In addition to the amount shown above as percentage paid to the Treasury in 1919–20, the sum of £197,730 was received as dividend duty and £5,060 as tax on stakes.
The racing year ends on the 31st July, and the position as regards the last five years is perhaps better shown in the next table, which gives figures for July years.
| Racing Year. | Number of Totalizator Licenses issued. | Days. | Amount invested on Totalizator by the Public. | Amount of Gate-money, Licenses, &c. | Amounts paid to Treasury.* | |
|---|---|---|---|---|---|---|
| As Tax on Investments. | From Gate-money, Licenses, &c. | |||||
* Not including dividend duty or tax on stakes. | ||||||
| £ | £ | £ | £ | |||
| 1915–16 | 175 | 281 | 4,796,515 | 133,700 | 119,913 | 3,343 |
| 1916–17 | 163 | 280 | 5,040,594 | 128,868 | 126,015 | 3,222 |
| 1917–18 | 131 | 189 | 4,421,175 | 108,444 | 110,529 | 2,711 |
| 1918–19 | 152 | 239 | 5,721,649 | 137,572 | 143,041 | 3,439 |
| 1919–20 | 175 | 291 | 8,788,788 | 220,894 | 219,720 | 5,522 |
Local governing authorities have power under various Acts of the Legislature to impose taxes for general or special purposes as set out in another section of this book. The amount of revenue collected for local purposes during the last ten years is shown in the section dealing with local authorities.
THE gross and net indebtedness of the General Government, the amount of sinking fund accrued, and the rate of indebtedness per head of population, for each of the past ten years, is given in the following table:—
| As at 31st March. | Estimated or Census Population. | Amount of Debentures and Stock in Circulation. | Gross Indebtedness per Head of European Population. | Amount of Sinking Fund accrued. | Net Indebtedness. | Net Indebtedness per Head of European Population. | ||||
|---|---|---|---|---|---|---|---|---|---|---|
| £ | £ | s. | d. | £ | £ | £ | s. | d. | ||
| 1911 | 1,008,468 | 81,078,122 | 80 | 7 | 11 | 1,754,486 | 79,323,636 | 78 | 13 | 2 |
| 1912 | 1,031,500 | 84,353,913 | 81 | 15 | 7 | 2,160,603 | 82,193,310 | 79 | 13 | 8 |
| 1913 | 1,061,748 | 90,060,763 | 84 | 16 | 5 | 2,603,642 | 87,457,121 | 82 | 7 | 5 |
| 1914 | 1,089,827 | 99,730,427 | 91 | 10 | 2 | 3,063,992 | 91,689,835 | 84 | 2 | 8 |
| 1915 | 1,100,586 | 100,059,910 | 90 | 18 | 4 | 3,178,055 | 96,644,455 | 87 | 16 | 3 |
| 1916 | 1,100,406 | 109,637,397 | 99 | 12 | 8 | 3,679,964 | 105,957,433 | 96 | 5 | 9 |
| 1917 | 1,101,166 | 129,836,105 | 117 | 18 | 2 | 4,263,590 | 125,572,515 | 114 | 0 | 9 |
| 1918 | 1,104,783 | 150,840,055 | 136 | 30 | 8 | 4,971,605 | 145,868,450 | 132 | 0 | 8 |
| 1919 | 1,124,630 | 176,076,260 | 156 | 11 | 4 | 5,951,056 | 170,125,204 | 151 | 5 | 6 |
| 1920 | 1,174,139 | 201,170,755 | 171 | 6 | 8 | 7,257,564 | 193,913,191 | 165 | 3 | 1 |
The indebtedness as at 31st March, 1920, allocated to its various items in the four classes referred to, is shown in the following statement. In addition figures of the increase for the last financial year are given, as are also figures showing the increase since the 31st March, 1914.
| Increase since 31st March, 1914. | Increase during 1919-20. | Total Indebtedness at 31st March, 1920. | |
|---|---|---|---|
* Decrease. | |||
| (a.) Directly reproductive undertakings,— | £ | £ | £ |
| Railways | 4,579,215 | 784,495 | 33,000,519 |
| Railways improvement | 112,000 | ||
| Telegraphs and telephones | 1,352,411 | 261,319 | 3,561,295 |
| Lighthouses and harbours | 40,913 | 3,665 | 653,884 |
| Tourist and health resorts | 20,909 | 6,491 | 189,904 |
| State coal-mines | 2,601 | 227,601 | |
| Water-power development and electric supply | 243,371 | 462,291 | |
| Swamp drainage | 73,000 | 27,000 | 73,000 |
| Waihou and Ohinemuri Rivers improvement | 30,000 | 30,000 | 130,000 |
| Totals (class a) | 6,342,420 | 1,224,970 | 38,298,494 |
| (b.) Investments,— | |||
| Advances to settlers | 605,871 | 9,283,196 | |
| Advances to workers | 117,580* | 2,419,347 | |
| Advances to local authorities | 207,461 | 2,775,528 | |
| Mining advances | 11,500 | 26,500 | |
| Kauri-gum industry advances | 53,000 | 6,000 | 53,000 |
| Fruit-preserving industry advances | 69,610 | 13,410 | 69,610 |
| Cold-storage advances | 120,750 | 17,500 | 120,750 |
| Land for settlements | 3,520,430 | 2,335,000 | 10,654,523 |
| Discharged soldiers settlement | 9,345,000 | 8,445,000 | 9,345,000 |
| Native-land settlement | 1,525,431 | 325,000 | 2,455,031 |
| Opening up Crown lands | 347,911 | ||
| Hauraki Plains settlement | 85,000 | 40,000 | 185,000 |
| Rangitaiki drainage | 205,000 | 105,000 | 250,000 |
| Waimarino bush-fire relief | 75,000 | 75,000 | |
| Purchase of Native lands | 2,715,217 | ||
| Loans to local bodies | 3,507,000 | ||
| Investment of New Zealand Consols | 475,992 | ||
| Bank of New Zealand shares | 375,000 | 875,000 | |
| Reserve Fund securities | 800.000 | ||
| Totals (class b) | 16,081,473 | 11,286,910 | 46,433,605 |
| (c.) Indirectly productive,— | |||
| Roads and bridges | 1,783,192 | 407,167 | 9,818,198 |
| Lands improvement | 3,106 | ||
| Irrigation and water-supply | 59,672 | 35,748 | |
| State forests | 130,000 | 65,000 | 130,000 |
| Development of mining | 13,479 | 1,229 | 910,471 |
| Immigration | 38,709* | 65,557* | 2,483,169 |
| Totals (class c) | 1,947,634 | 446,693 | 13,341,838 |
| (d.) Unproductive,— | |||
| Public buildings | 1,721,334 | 491,661 | 8,164,890 |
| Scenery-preservation | 20,000 | 5,000 | 94,000 |
| Maori War | 4.00* | 400* | 2,356,600 |
| Contingent defence | 47,516 | 10,676 | 3,767,527 |
| Naval defence | |||
| Great European War | 80,089,025 | 11,628,985 | 80,089,025 |
| Deficiencies in revenue, charges and expenses of raising loans, provincial liabilities, &c. | 167,926 | 8,624,776 | |
| Totals (class d) | 82,045,401 | 12,135,921 | 103,096,818 |
| Grand totals | £106,416,928 | £25,094,494 | £201,170,755 |
In a consideration of the increase of public debt the end of the financial year 1890–91 is often regarded as a turning-point, since that date marks the beginning of the extension of State activities. The advent of the war created a second point of demarcation in the history of the loan expenditure of the General Government, necessitating as it did a postponement of all public works, &c., save works of pressing necessity.
The directly interest-earning portion of the debt amounts to 42 per cent. of the total debt, and is represented by assets which are of much greater value than the amount of borrowed money spent upon them, a considerable amount of surplus ordinary revenue having been expended from time to time on railways and other public services, as well as other moneys of the nature of special receipts. The small proportion represented by unproductive loan-money raised during the period prior to 1914 is in strong contrast to the similar proportion for the period 1914 to 1920.
The whole of the public debt as stated in the foregoing tables comprises inscribed stocks and debentures with varying periods of currency. The following table shows the relative increase of the different classes of securities during the past ten financial years:—
| Year ended 31st March. | Inscribed Stock. | Debentures. | Total. |
|---|---|---|---|
| £ | £ | £ | |
| 1911 | 54,832,570 | 26,245,552 | 81,078,122 |
| 1912 | 55,626,235 | 28,727,678 | 84,353,913 |
| 1913 | 59,960,105 | 30,100,658 | 90,060,763 |
| 1914 | 66,076,250 | 33,654,177 | 99,730,427 |
| 1915 | 68,008,389 | 32,051,521 | 100,059,910 |
| 1916 | 68,689,630 | 40,947,767 | 109,637,397 |
| 1917 | 68,689,935 | 61,146,170 | 129,836,105 |
| 1918 | 77,760,485 | 73,079,570 | 150,840,055 |
| 1919 | 87,373,480 | 88,702,780 | 176,076,260 |
| 1920 | 95,095,914 | 106,074,841 | 201,170,755 |
Until comparatively recent years the large proportion of the productive power of the Dominion diverted to the construction of railways, roads, &c., and engaged in the preparation of land for farming, necessitated the borrowing of capital from abroad; but of late the accumulation of savings, chiefly of small sums deposited in the savings-banks, has enabled the Government to raise considerable amounts from time to time locally. This has been especially the case in connection with the war loans.
Between the 31st March, 1910, and the corresponding date in 1920 the amount raised (and remaining outstanding) in London increased from 57 3/4 to 95 3/4 millions, while that raised in New Zealand increased from 13 to 102 millions. The amount raised in Australia is negligible. The following table shows, of the total amount outstanding in each of the past ten years, the amount raised in London, Australia, and New Zealand:—
| PUBLIC DEBT, WHERE RAISED. | ||||||
|---|---|---|---|---|---|---|
| Year ended 31st March. | Inscribed Stock. | Debentures. | Total | |||
| London. | New Zealand. | London. | Australia. | New Zealand. | ||
| £ | £ | £ | £ | £ | £ | |
| 1911 | 54,370,404 | 462,166 | 7,851,414 | 4,213,985 | 14,180,153 | 81,078,122 |
| 1912 | 55,152,124 | 474,111 | 8,852,750 | 4,213,985 | 15,660,943 | 84,353,913 |
| 1913 | 59,484,214 | 475,891 | 9,445,250 | 4,213,985 | 16,441,423 | 90,060,763 |
| 1914 | 65,600,259 | 475,991 | 13,024,050 | 4,286,800 | 16,343,327 | 99,730,427 |
| 1915 | 67,532,398 | 475,991 | 8,877,603 | 3,979,000 | 19,194,918 | 100,059,910 |
| 1916 | 68,213,639 | 475,991 | 13,251,109 | 3,520,650 | 24,176,008 | 109,637,397 |
| 1917 | 68,213,943 | 475,992 | 15,663,875 | 3,385,650 | 42.096,645 | 129,836,105 |
| 1918 | 68,213,943 | 9,546,542 | 20,493,875 | 3,385,650 | 49,200,045 | 150,840,055 |
| 1919 | 68,213,943 | 19,159,537 | 27,494,385 | 3,385,650 | 57,822,745 | 176,076,260 |
| 1920 | 68,213,943 | 26,881,971 | 27,494,385 | 3,385,650 | 75,194,806 | 201,170,755 |
The percentage of the total debt raised in each of the markets and outstanding in 1909–10 and 1919–20 was,—
| Market. | 1909–10. Per Cent. | 1919–20. Per Cent. |
|---|---|---|
| London | 77.09 | 47.58 |
| New Zealand | 17.42 | 50.74 |
| Australia | 5.49 | 1.68 |
| 100-00 | 100-00 |
A summary of the loans outstanding on the 31st March, 1920, showing the amounts falling due in each financial year is given.
| Due Date: Year ending 31st March. | Amount. |
|---|---|
* Overdue. | |
| £ | |
| 1915 | 2,100* |
| 1918 | 1,000* |
| 1920 | 6,200* |
| 1921 | 10,130,457 |
| 1922 | 6,361,890 |
| 1923 | 8,862,156 |
| 1924 | 9,546,365 |
| 1925 | 17,841,497 |
| 1926 | 618,810 |
| 1927 | 56,400 |
| 1928 | 2,573,560 |
| 1930 | 30,550,992 |
| 1931 | 5,528,990 |
| 1936 | 17,730 |
| 1937 | 1,000 |
| 1938 | 3,000 |
| 1939 | 26,429,975 |
| 1940 | 25,515,687 |
| 1941 | 781,815 |
| 1942 | 2,748,350 |
| 1946 | 17,074,121 |
| 1948 | 895,000 |
| 1949 | 1,423,600 |
| 1950 | 1,106,500 |
| 1963 | 10,884,628 |
| Unspecified | 22,208,932 |
| Total | £201,170,755 |
The amounts that have matured or will mature during the current financial year, with their due dates, are as follows:—
| Due Date. | £ |
|---|---|
* Overdue. | |
| 1914, July 15 | 2,100* |
| 1918, January 1 | 1,000* |
| 1920, January 1 | 1,000* |
| 1920, February | 5,200* |
| 1920, April 1 | 283,400 |
| 1920, April 15 | 302,400 |
| 1920, May 1 | 1,303,976 |
| 1920, June 1 | 130,000 |
| 1920, June 5 | 80,000 |
| 1920, June 30 | 190,000 |
| 1920, July 1 | 200,000 |
| 1920, July 31 | 15,000 |
| 1920, August 1 | 274,401 |
| 1920, September 1 | 19,000 |
| 1920, September 30 | 400,000 |
| 1920, October 1 | 229,900 |
| 1920, October 15 | 800 |
| 1920, November 1 | 268,000 |
| 1920, December 15 | 1,095,360 |
| 1920, December 31 | 159,900 |
| 1921, January 1 | 2,047,600 |
| 1921, February 1 | 2,028,620 |
| 1921, March 1 | 1,048,000 |
| 1921, March 3 | 25,000 |
| 1921, March 30 | 19,100 |
| 1921, March 31 | 10,000 |
| Total | £10,139,751 |
Of the total amount of public debt outstanding at the end of March, 1920, over twenty-four millions bore interest at the rate of 5 per cent., over sixty millions at 4 1/2 per cent., and nearly eighty-four millions at 4 per cent. Only £33,175,988, or 16.49 per cent, of the total, bore interest at a lower rate than 4 per cent., as against 48.39 per cent. of the total at 31st March, 1914. The following are the rates of interest payable on the whole public debt:—
| Rates of Interest. | Amount at each Rate. |
|---|---|
| £ | |
| 5 per cent. | 24,084,661 |
| 4 1/2 per cent. | 60,219,516 |
| 4 1/4 per cent. | 55,100 |
| per cent. | 83,626,190 |
| 3 3/4 per cent. | 1,076,700 |
| 3 1/2 per cent. | 22,436,498 |
| 3 per cent. | 9,662,790 |
| Overdue | 9,300 |
| Total | £201,170,755 |
The total amount of interest payable to bondholders on the full amount of the public debt (excluding interest on £9,300 shown as overdue) is £8,377,037, which gives an average rate of £4 3s. 3d. per £100. On the total public debt outstanding on the 31st March, 1891, the average interest charge was £4 10s. 3d. per £100. During the period 1890–91 to 1919–20, therefore, the average rate is found to have declined by 7s. per £100. There was, however, an increase of 6s. 10d. per £100 in 1919–20 as compared with 1913–14.
The foregoing refers to interest payable to bondholders only, and has nothing to do with sinking-fund requirements, which are included in the whole annual charge of the public debt.
The actual payments during the past ten years for interest and sinking fund out of the Consolidated Fund are shown in the following table, together with the rate per head of population and the percentage of ordinary and territorial revenue absorbed by the public-debt charges:—
| Year ended 31st March. | Amounts actually paid for Interest and Sinking Fund out of the Consolidated Fund. | Rate per Head of Mean Population. | Percentage of Revenue absorbed by Public-debt Charges. | ||||||
|---|---|---|---|---|---|---|---|---|---|
| Public Debt. | Treasury Bills. | Total. | |||||||
| Interest. | Sinking Fund. | Total. | Interest. | ||||||
| £ | £ | £ | £ | £ | £ | s. | d. | ||
| 1911 | 2,381,000 | 54,104 | 2,435,104 | 23,348 | 2,458,452 | 2 | 9 | 3 | 23.87 |
| 1912 | 2,446,493 | 198,388 | 2,644,881 | 11,459 | 2,656,340 | 2 | 12 | 1 | 24.02 |
| 1913 | 2,506,025 | 202,757 | 2,708,782 | 8,231 | 2,717,013 | 2 | 11 | 11 | 23.15 |
| 1914 | 2,649,796 | 221,726 | 2,871,512 | 16,468 | 2,887,980 | 2 | 13 | 8 | 23.61 |
| 1915 | 2,788,513 | 247,570 | 3,036,083 | 35,365 | 3,071,448 | 2 | 16 | 1 | 24.67 |
| 1916 | 2,888,533 | 257,036 | 3,145,569 | 45,229 | 3,190,798 | 2 | 18 | 0 | 21.99 |
| 1917 | 3,701,040 | 326,924 | 4,027,964 | 4,921 | 4,032,885 | 3 | 13 | 4 | 21.97 |
| 1918 | 3,935,118 | 494,699 | 4,429,817 | 962 | 4,430,779 | 4 | 0 | 4 | 21.93 |
| 1919 | 5,409,210 | 677,559 | 6,086,769 | 6,086,769 | 5 | 9 | 2 | 27.23 | |
| 1920 | 6,352,943 | 896,483 | 7,249,426 | 7,249,426 | 6 | 3 | 6 | 27.80 | |
The above amounts shown as interest and sinking fund do not comprise the whole of the interest and sinking fund paid in respect of moneys raised by way of loans. For loans raised for the purposes of State advances to settlers, workers, local authorities, &c., and under the Land for Settlements Acts, the interest, although made a charge upon the Consolidated Fund, is recovered from the receipts derived from the leasing of the lands or from instalments paid by borrowers. Other loan-money coming within the same category is that raised for State coal-mines, Native-land settlement, the purchase of the Cheviot Estate, the Rangitaiki land drainage, the Hauraki Plains settlement, the Waihou and Ohinemuri Rivers improvement, and a number of other purposes.
The amount of interest charged and recovered during last year in respect of the loan-money raised for such purposes was £1,068,759. The details are as follow:—
| £ | |
| Land for settlements (including opening up Crown lands for settlement) | 341,210 |
| Discharged soldiers settlement | 30,000 |
| Cold-storage Advances Act | 4,942 |
| Advances to settlers | 345,239 |
| Advances to workers | 95,854 |
| Advances to local authorities | 103,196 |
| Mining advances | 1,097 |
| State coal-mines | 8,933 |
| Kauri-gum industry | 1,987 |
| Native-land settlement | 82,164 |
| Cheviot Estate | 8,866 |
| Waihou and Ohinemuri Rivers improvement | 4,460 |
| Hauraki Plains settlement | 5,946 |
| State forests | 3,577 |
| Electric supply | 20,431 |
| Fruit-preserving Industry Advances Account | 1,500 |
| Waimarino Bush-fire Relief Account | 3,008 |
| Rangitaiki Land Drainage Account | 6,349 |
| Total | £1,068,759 |
Such interest does not become a burden upon the taxpayer, and consequently is not included in the figures upon which the rate per head of mean population is calculated.
The amount actually paid for interest and sinking fund out of the Consolidated Fund during 1919–20 was £1,162,657 more than that for the previous year, and the rate of charge per head of population shows an increase of 14s. 4d.
The whole of the public debt for which no special sinking fund exists has now been provided for by the Public Debt Extinction Act, 1910, referred to in detail below.
On the 31st March, 1920, the accrued sinking funds amounted to £7,257,564, made up as follows:—
| £ | |
| New Zealand Loan Act, 1863 | 2,207 |
| Government loans to local bodies | 799,601 |
| War and defence loans | 192,691 |
| War loans (1914–18) | 1,603,880 |
| Naval Defence Act, 1909 | 715,221 |
| State-advances loans | 1,410,261 |
| Land for settlements | 873,257 |
| Native-land settlement | 11,977 |
| Guaranteed mining advances | 722 |
| Hauraki Plains settlement | |
| Opening up Crown lands for settlement | |
| Rangitaiki land drainage | |
| Public Debt Extinction Act, 1910 | 1,647,747 |
| £7,257,564 |
The contributions to the fund to the 31st March, 1920, amounted to £1,386,790, interest, &c., bringing the amount to the credit of the fund to £1,647,747. The payments to the fund in each of the nine years which have elapsed since the coming into operation of the Act have been,—
| Year ended 31st March. | £ |
|---|---|
| 1912 | 144,885 |
| 1913 | 149,343 |
| 1914 | 151,572 |
| 1915 | 169,404 |
| 1916 | 161,870 |
| 1917 | 171,301 |
| 1918 | 155,038 |
| 1919 | 143,301 |
| 1920 | 140,076 |
The amount required to be set aside during the financial year 1920–21 is £152,295.
The decrease in the amount set aside in 1915–16, as compared with 1914–15, is due to the fact that in terms of section 10 of the Act the interest used in the calculation for 1915–16 was taken as the actual average net rate of interest earned during the preceding three years (£4 4s. 3d. per cent.), as against 4 per cent. in previous years. The decreases in the amount set aside since 1916–17, as compared with the amount set aside during that financial year, have resulted from the increasing rates of interest ruling. The average net rate for the three years ended the 31st March, 1920, has been ascertained to be £4 16s. 6d., as against £4 14s. 3d. per cent. for the triennium ending with the preceding year. The former rate was used in the computation of the amount due to be set aside in 1920–21.
The sum of £138,287 was at the 31st March, 1920, invested in mortgages to settlers, and £812,617 to local authorities. The former amount bears interest at 5 per cent., reducible to 4 1/2 per cent. if instalments are paid within fourteen days of due date. Of the amount advanced to local authorities, part bears interest at 4 1/8 per cent., and the balance at 4 1/2 per cent.
The highest and lowest London prices for the New Zealand 4., 3 1/2., and 3-per-cent. stock, taken over a range of twenty years, are quoted.
| QUOTATIONS, NEW ZEALAND STOCK. | ||||||||
|---|---|---|---|---|---|---|---|---|
| Year. | 4-per-cents. (1943-63.) | 4-per-cents. (1929.) | 3 1/2-per-cents. (1940.) | 3-per-cents. (1945.) | ||||
| Highest. | Lowest. | Highest. | Lowest. | Highest. | Lowest. | Highest. | Lowest. | |
| 1900 | 113 1/4 | 109 | 106 3/4 | 103 3/8 | 98 1/2 | 95 1/4 | ||
| 1901 | 115 3/8 | 110 3/4 | 109 3/4 | 104 1/8 | 99 1/2 | 93 1/8 | ||
| 1902 | 113 1/4 | 109 | 109 1/2 | 102 1/8 | 97 | 93 5/8 | ||
| 1903 | 110 1/8 | 105 | 104 3/4 | 99 1/2 | 96 | 88 | ||
| 1904 | 107 1/2 | 104 1/2 | 101 1/2 | 96 3/4 | 90 | 86 1/4 | ||
| 1905 | 110 1/4 | 105 1/4 | 100 1/8 | 97 5/8 | 89 7/8 | 89 1/2 | ||
| 1906 | 110 3/4 | 104 5/8 | 102 1/2 | 98 3/8 | 91 1/4 | 87 1/4 | ||
| 1907 | 108 3/4 | 103 1/4 | 101 | 98 | 89 3/4 | 84 | ||
| 1908 | 109 5/8 | 105 1/8 | 101 | 98 1/4 | 90 1/2 | 85 3/4 | ||
| 1909 | 108 3/8 | 104 3/4 | 99 3/4 | 97 3/8 | 88 3/8 | 85 5/8 | ||
| 1910 | 106 3/4 | 103 | 99 | 94 1/4 | 88 3/8 | 84 3/4 | ||
| 1911 | 106 3/4 | 102 1/8 | 98 1/2 | 95 1/4 | 87 3/8 | 85 | ||
| 1912 | 105 | 100 | 97 3/4 | 90 3/8 | 87 3/4 | 79 1/2 | ||
| 1913 | 101 | 96 3/8 | 102 1/2 | 95 1/2 | 91 7/8 | 87 3/4 | 80 3/4 | 76 1/4 |
| 1914 | 100 3/8 | 96 1/4 | 103 1/8 | 98 | 92 3/4 | 87 | 83 1/2 | 77 |
| 1915 | 97 1/2 | 95 | 99 1/8 | 95 | 87 1/2 | 83 1/4 | 77 3/4 | 76 |
| 1916 | 95 1/8 | 77 | 95 | 83 3/4 | 83 3/8 | 69 | 76 | 62 |
| 1917 | 82 5/8 | 76 | 86 1/2 | 81 1/4 | 74 1/2 | 69 | 64 3/8 | 60 |
| 1918 | 85 1/2 | 78 1/4 | 90 7/8 | 84 | 79 | 71 3/4 | 68 3/4 | 61 3/4 |
| 1919 | 86 | 77 1/8 | 90 | 83 | 79 | 68 1/8 | 69 1/8 | 60 |
The following figures show the gross and net public debt of each State of the Australian Commonwealth, and of the Commonwealth itself, on the 30th June, 1919, and of New Zealand on the 31st March, 1919:—
| State. | Gross Indebtedness. | Accrued Sinking Funds. | Net Indebtedness. | Indebtedness per Head. | |||||
|---|---|---|---|---|---|---|---|---|---|
| Gross. | Net. | ||||||||
* Information not available. † Excluding £16,750,000 borrowed by the Commonwealth on behalf of the States. | |||||||||
| £ | £ | £ | £ | s. | d. | £ | s. | d. | |
| New South Wales | 147,174,536 | 388,259 | 146,786,277 | 74 | 19 | 6 | 74 | 15 | 3 |
| Victoria | 82,031,929 | 2,600,778 | 79,431,151 | 55 | 18 | 3 | 54 | 2 | 9 |
| Queensland | 65,581,121 | 385,540 | 65,195,581 | 92 | 0 | 3 | 91 | 9 | 2 |
| South Australia | 42,650,206 | 1,509,930 | 41,140,276 | 93 | 10 | 10 | 90 | 4 | 7 |
| Western Australia | 43,637,076 | 6,139,008 | 37,498,068 | 135 | 0 | 0 | 116 | 0 | 10 |
| Tasmania | 15,281,281 | 646,197 | 14,635,084 | 72 | 9 | 3 | 69 | 8 | 0 |
| Total, Australian | 396,356,149 | 11,669,712 | 384,686,437 | 77 | 2 | 1 | 74 | 16 | 8 |
| States Commonwealth | †309,033,566 | * | * | 60 | 2 | 4 | * | ||
| Total Commonwealth and States | 705,389,715 | * | * | 137 | 4 | 5 | * | ||
| New Zealand | 176,076,260 | 5,951,054 | 170,125,206 | 158 | 11 | 4 | 151 | 5 | 6 |
New Zealand has now a greater per capita debt than any of the Australian States, although, if the Commonwealth debt be added to that for each State, an exception to this statement will be found in the case of Western Australia. The gross indebtedness of the Dominion is rather more than £5 per head greater than that of Australia, but if full information as to the net indebtedness of the Commonwealth were available it would probably be found that the net debt per head in New Zealand approximates a little more closely to that of Australia than is indicated by the figures of gross indebtedness.
Table of Contents
THE investigation of price-changes was undertaken by the Statistical Office of New Zealand early in 1914. Retail prices were collected and tabulated for each year since 1891, and the results of the inquiry, together with a full discussion of the method adopted, were published in the “Report on the Cost of Living in New Zealand, 1891–1914.” Since that date price quotations and index numbers have been continued—first in the Journal of the Department of Labour, and latterly in the Monthly Abstract of Statistics.
In 1920 the Census and Statistics Office issued its second report, “Prices.—An Inquiry into Prices in New Zealand, 1891–1919.” The scope of this inquiry was wider than that of the previous one and covered retail, wholesale, producers’, and export prices. Retail prices especially are given prominence in this volume, and by means of graphs and extensive tables of index numbers as well as actual prices price-movements during the period under review can easily be followed.
Retail price quotations, upon which index numbers are regularly calculated are collected each month in twenty-five towns of the Dominion, which were selected as being representative of New Zealand as a whole. These twenty-five towns are distributed over both Islands, from Whangarei in the North to Invercargill in the South, and represent coastal and inland districts and large and small centres. Returns of prices are collected by the local Inspector of Factories from representative retailers, and index numbers are computed in the Census and Statistics Office, Wellington. The average prices for each town are published in the Monthly Abstract of Statistics at the end of each quarter, while index-numbers appear in each month's issue.
The commodities considered are almost exclusively articles of food, divided into three groups—groceries, dairy-produce, and meat. Figures regarding house-rents and fuel and lighting are also given.
So far as the following tables are concerned, it is necessary to explain that in order that the index numbers for the smaller centres may be comparable with the index numbers given for the four chief centres for past years the same “base” has been retained throughout—viz., the “annual aggregate expenditure” in the four chief centres for the five years 1909–13.
The quarterly index numbers given below are based on the average prices of the three months in the quarter, so that they differ materially from the prices current at the end of the quarters. In comparing different quarters consideration must be given to the influence of seasonal fluctuations in price and consumption of some commodities, including such important articles as milk, butter, potatoes, eggs.
The tables are comparable both horizontally and vertically, since each column has the same base. Horizontally they show variations in time, vertically variations according to locality.
Index Numbers for each Quarter of 1919, and for the Average of the Four Quarters of 1919 and of 1918, for Twenty-five Representative Towns in New Zealand.
| (Base: Average aggregate annual expenditure, four chief centres, 1909–13 = 1000.) | ||||||
|---|---|---|---|---|---|---|
| Town. | First Quarter, 1919. | Second Quarter, 1919. | Third Quarter, 1919. | Fourth Quarter, 1919. | Average of Four Quarters, 1919. | Average of Four Quarters, 1918. |
| Auckland | 1486 | 1470 | 1554 | 1631 | 1535 | 1461 |
| Wellington | 1618 | 1564 | 1649 | 1745 | 1644 | 1579 |
| Christchurch | 1530 | 1426 | 1525 | 1640 | 1530 | 1417 |
| Dunedin | 1584 | 1478 | 1535 | 1644 | 1560 | 1503 |
| Whangarei | 1613 | 1634 | 1690 | 1726 | 1666 | 1552 |
| Hamilton | 1514 | 1514 | 1620 | 1722 | 1593 | 1496 |
| Rotorua | 1639 | 1607 | 1720 | 1804 | 1693 | 1574 |
| Waihi | 1492 | 1447 | 1566 | 1673 | 1545 | 1456 |
| Gisborne | 1641 | 1601 | 1720 | 1811 | 1693 | 1585 |
| Napier | 1584 | 1495 | 1565 | 1711 | 1589 | 1552 |
| Dannevirke | 1597 | 1562 | 1600 | 1687 | 1612 | 1475 |
| New Plymouth | 1516 | 1443 | 1513 | 1608 | 1520 | 1414 |
| Wanganui | 1462 | 1413 | 1528 | 1621 | 1506 | 1412 |
| Taihape | 1636 | 1634 | 1655 | 1793 | 1680 | 1577 |
| Palmerston North | 1506 | 1464 | 1529 | 1631 | 1533 | 1441 |
| Masterton | 1622 | 1584 | 1636 | 1750 | 1648 | 1548 |
| Blenheim | 1687 | 1654 | 1689 | 1808 | 1710 | 1530 |
| Nelson | 1566 | 1525 | 1557 | 1657 | 1576 | 1491 |
| Greymouth | 1584 | 1487 | 1523 | 1607 | 1550 | 1456 |
| Ashburton | 1638 | 1445 | 1497 | 1607 | 1547 | 1402 |
| Timaru | 1550 | 1434 | 1503 | 1562 | 1512 | 1457 |
| Oamaru | 1610 | 1475 | 1542 | 1640 | 1567 | 1491 |
| Alexandra | 1711 | 1614 | 1653 | 1716 | 1674 | 1617 |
| Gore | 1717 | 1551 | 1628 | 1722 | 1655 | 1503 |
| Invercargill | 1655 | 1521 | 1593 | 1663 | 1608 | 1529 |
| Dominion weighted average | 1554 | 1489 | 1570 | 1666 | 1570 | 1488 |
The weighted average index number for the Dominion shows an increase of 82 points in 1919 over the average for the previous year. The increase, to a varying extent, has been common to each of the twenty-five towns covered by the inquiry. Wellington maintains its position with considerably higher grocery-prices than prevail in the other three chief centres. It should be pointed out that movements as between succeeding quarters are by no means uniform. The effect of seasonal fluctuations in prices of such commodities as potatoes and onions renders it necessary that comparisons should be made either between corresponding quarters of the two years or between the average of the four quarters as given in the above table.
Index Numbers for each Quarter of 1919, and for the Average of the Four Quarters of 1919 and of 1918, for Twenty-five Representative Towns in New Zealand.
| (Base: Average aggregate annual expenditure, four chief centres, 1909–13 = 1000.) | ||||||
|---|---|---|---|---|---|---|
| Town. | First Quarter, 1919. | Second Quarter, 1919. | Third Quarter, 1919. | Fourth Quarter, 1919. | Average of Four Quarters, 1919. | Average of Four Quarters, 1918. |
| Auckland | 1447 | 1572 | 1520 | 1533 | 1518 | 1443 |
| Wellington | 1488 | 1630 | 1536 | 1556 | 1553 | 1476 |
| Christchurch | 1362 | 1474 | 1462 | 1438 | 1434 | 1328 |
| Dunedin | 1434 | 1595 | 1535 | 1553 | 1529 | 1432 |
| Whangarei | 1361 | 1566 | 1514 | 1527 | 1492 | 1354 |
| Hamilton | 1440 | 1550 | 1555 | 1580 | 1531 | 1420 |
| Rotorua | 1445 | 1555 | 1504 | 1526 | 1508 | 1419 |
| Waihi | 1417 | 1551 | 1527 | 1542 | 1509 | 1401 |
| Gisborne | 1457 | 1610 | 1566 | 1567 | 1550 | 1410 |
| Napier | 1474 | 1601 | 1542 | 1558 | 1544 | 1462 |
| Dannevirke | 1391 | 1537 | 1516 | 1447 | 1473 | 1391 |
| New Plymouth | 1443 | 1516 | 1466 | 1447 | 1468 | 1394 |
| Wanganui | 1391 | 1520 | 1500 | 1519 | 1483 | 1374 |
| Taihape | 1522 | 1606 | 1558 | 1571 | 1564 | 1506 |
| Palmerston North | 1287 | 1427 | 1411 | 1421 | 1387 | 1378 |
| Masterton | 1427 | 1529 | 1528 | 1472 | 1489 | 1426 |
| Blenheim | 1410 | 1530 | 1523 | 1528 | 1498 | 1382 |
| Nelson | 1434 | 1569 | 1542 | 1539 | 1521 | 1412 |
| Greymouth | 1467 | 1521 | 1457 | 1505 | 1488 | 1452 |
| Ashburton | 1433 | 1495 | 1440 | 1427 | 1449 | 1426 |
| Timaru | 1387 | 1473 | 1485 | 1491 | 1459 | 1321 |
| Oamaru | 1416 | 1531 | 1515 | 1470 | 1483 | 1413 |
| Alexandra | 1425 | 1499 | 1484 | 1463 | 1468 | 1442 |
| Gore | 1471 | 1553 | 1537 | 1538 | 1525 | 1434 |
| Invercargill | 1494 | 1571 | 1526 | 1503 | 1524 | 1378 |
| Dominion weighted average | 1431 | 1558 | 1512 | 1516 | 1504 | 1415 |
The index numbers for the dairy-produce group again show substantial increases over the previous year. The Dominion weighted index number advanced during 1919 by 89 points, the increase being shared by all centres.
This group is subject to much greater seasonal influences than are the groceries or meat groups. The fluctuation in prices of milk and butter, in accordance with the supply at different periods of the year, invariably brings about a high index number in the June quarter, to be followed, in most cases, by a fall in the September quarter's figures.
Taihape and Wellington show the highest prices of dairy-produce, while the least expensive are Palmerston North and Christchurch.
Index Numbers for each Quarter of 1919, and for the Average of the Four Quarters of 1919 and of 1918, for Twenty-five Representative Towns in New Zealand.
| (Base: Average aggregate annual expenditure, four chief centres, 1909–13 = 1000.) | ||||||
|---|---|---|---|---|---|---|
| Town. | First Quarter, 1919. | Second Quarter, 1919. | Third Quarter, 1919. | Fourth Quarter, 1919. | Average of Four Quarters, 1919. | Average of Four Quarters, 1918. |
| Auckland | 1573 | 1573 | 1611 | 1625 | 1596 | 1575 |
| Wellington | 1500 | 1492 | 1500 | 1522 | 1504 | 1476 |
| Christchurch | 1551 | 1483 | 1610 | 1784 | 1607 | 1540 |
| Dunedin | 1527 | 1507 | 1553 | 1766 | 1588 | 1507 |
| Whangarei | 1651 | 1651 | 1668 | 1679 | 1662 | 1681 |
| Hamilton | 1611 | 1628 | 1694 | 1791 | 1681 | 1476 |
| Rotorua | 1681 | 1738 | 1745 | 1779 | 1736 | 1696 |
| Waihi | 1718 | 1595 | 1577 | 1704 | 1649 | 1659 |
| Gisborne | 1544 | 1544 | 1555 | 1559 | 1551 | 1552 |
| Napier | 1502 | 1500 | 1507 | 1588 | 1524 | 1505 |
| Dannevirke | 1491 | 1440 | 1468 | 1471 | 1468 | 1515 |
| New Plymouth | 1607 | 1607 | 1615 | 1775 | 1651 | 1597 |
| Wanganui | 1600 | 1603 | 1608 | 1725 | 1634 | 1593 |
| Taihape | 1464 | 1452 | 1520 | 1620 | 1514 | 1521 |
| Palmerston North | 1585 | 1587 | 1587 | 1603 | 1591 | 1559 |
| Masterton | 1524 | 1516 | 1536 | 1551 | 1532 | 1518 |
| Blenheim | 1521 | 1531 | 1611 | 1720 | 1596 | 1505 |
| Nelson | 1568 | 1584 | 1768 | 1768 | 1672 | 1538 |
| Greymouth | 1775 | 1639 | 1727 | 1774 | 1729 | 1673 |
| Ashburton | 1647 | 1598 | 1609 | 1815 | 1667 | 1638 |
| Timaru | 1602 | 1592 | 1604 | 1653 | 1613 | 1587 |
| Oamaru | 1626 | 1618 | 1601 | 1773 | 1655 | 1611 |
| Alexandra | 1583 | 1583 | 1583 | 1598 | 1587 | 1537 |
| Gore | 1686 | 1678 | 1721 | 1836 | 1730 | 1669 |
| Invercargill | 1660 | 1661 | 1774 | 1876 | 1743 | 1657 |
| Dominion weighted average | 1558 | 1541 | 1589 | 1674 | 1591 | 1545 |
The increase in the index number for 1919 over that for 1918 is shown to be 46 points.
Of the four chief centres Christchurch has the highest number, being closely followed by Auckland and Dunedin.
The highest prices are shown by Invercargill and Rotorua, while Dannevirke and Wellington show the lowest.
Index Numbers for each Quarter of 1919, and for the Average of the Four Quarters of 1919 and of 1918, for Twenty-five Representative Towns in New Zealand.
| (Base: Average aggregate annual expenditure, four chief centres, 1909–13 = 1000.) | ||||||
|---|---|---|---|---|---|---|
| Town. | First Quarter, 1919. | Second Quarter, 1919. | Third Quarter, 1919. | Fourth Quarter, 1919. | Average of Four Quarters, 1919. | Average of Four Quarters, 1918. |
| Auckland | 1507 | 1529 | 1565 | 1606 | 1552 | 1496 |
| Wellington | 1548 | 1555 | 1572 | 1626 | 1575 | 1521 |
| Christchurch | 1498 | 1443 | 1540 | 1642 | 1531 | 1438 |
| Dunedin | 1530 | 1515 | 1541 | 1664 | 1563 | 1488 |
| Whangarei | 1567 | 1624 | 1642 | 1664 | 1624 | 1550 |
| Hamilton | 1530 | 1561 | 1630 | 1713 | 1609 | 1472 |
| Rotorua | 1608 | 1640 | 1678 | 1731 | 1664 | 1579 |
| Waihi | 1551 | 1522 | 1561 | 1653 | 1572 | 1512 |
| Gisborne | 1565 | 1584 | 1628 | 1668 | 1611 | 1533 |
| Napier | 1531 | 1522 | 1540 | 1634 | 1557 | 1515 |
| Dannevirke | 1513 | 1515 | 1536 | 1558 | 1531 | 1469 |
| New Plymouth | 1530 | 1516 | 1537 | 1627 | 1553 | 1472 |
| Wanganui | 1493 | 1502 | 1549 | 1633 | 1544 | 1465 |
| Taihape | 1551 | 1565 | 1586 | 1682 | 1596 | 1541 |
| Palmerston North | 1482 | 1497 | 1521 | 1573 | 1518 | 1466 |
| Masterton | 1544 | 1548 | 1577 | 1618 | 1572 | 1510 |
| Blenheim | 1566 | 1583 | 1624 | 1713 | 1622 | 1487 |
| Nelson | 1536 | 1556 | 1625 | 1667 | 1596 | 1489 |
| Greymouth | 1622 | 1547 | 1577 | 1640 | 1597 | 1529 |
| Ashburton | 1594 | 1509 | 1522 | 1636 | 1565 | 1488 |
| Timaru | 1530 | 1497 | 1533 | 1576 | 1534 | 1470 |
| Oamaru | 1570 | 1537 | 1556 | 1646 | 1577 | 1514 |
| Alexandra | 1601 | 1577 | 1590 | 1617 | 1596 | 1549 |
| Gore | 1649 | 1595 | 1638 | 1718 | 1650 | 1544 |
| Invercargill | 1619 | 1580 | 1639 | 1699 | 1634 | 1537 |
| Dominion weighted average | 1527 | 1520 | 1563 | 1634 | 1561 | 1491 |
It will be remembered that the Dominion weighted average for Group I shows an increase of 82 points over 1918, while Groups II and III have increased 89 points and 46 points respectively. The three groups in combination show an increase in the Dominion weighted average of 70 points. Over the year 1919 Palmerston North was the cheapest town for foodstuffs, while Rotorua was the dearest.
The cost of housing is an important item in the expenditure of the majority of families, and to obtain a record of fluctuations in this cost may be regarded as essential to a reasonably complete treatment of the subject of “cost of living.” An attempt has accordingly been made to trace the movement of house-rents over a period of years, on the grounds that house-rentals provide a reasonably accurate indication of housing-costs in general, not only for those classes of persons who may be paying rent, but also for those who own or partially own the dwellings they occupy.
By reason of the fact that leases, infrequent changes of residence, and the difficulty of departing from customary rents all tend to make the movement of the general level of rents comparatively slow, it is not necessary to attempt to measure the changes over short periods. The data upon which the rent figures given hereafter have been compiled are collected each half-year in the months of February and August. Figures quoted in reference to rent for the first two quarters of the year are therefore based upon the data obtained in February, and those for the last two quarters on the data obtained in August.
It is advisable to specially mention that the index numbers in respect of rent indicate the movement in the average rentals of a large number of houses, and that they do not purport to convey any statement as to the price at which housing-accommodation may be obtained from time to time. At the present time the exceptional demand for housing-accommodation accompanied by restrictive legislation against advancement of house-rents has caused a wide disparity between the rentals of houses which have been let for some time and the rents charged to the new occupants of houses being relet at the present time. In so far as the number of “relettings” is relatively small, there has not been the substantial advance in house-rents during the past few years which might be gathered from an inspection of the price charged for the occupancy of houses now falling vacant.
Latterly an insecurity of tenancy, which is due largely to a severe housing shortage and the statutory rent restriction, has led to the purchase of an abnormal number of houses by persons formerly content to remain tenants. In the normal course of events it is the newer and better-class dwelling that is purchased, thus leaving an unduly large proportion of older and lower-rented dwellings. The effect of this is to artificially reduce the level or retard the rise of the house rent index.
| House of | Auckland. | Wellington. | Christchurch. | Dunedin. | ||||||||||||
|---|---|---|---|---|---|---|---|---|---|---|---|---|---|---|---|---|
| Feb. | Aug. | Feb. | Aug. | Feb. | Aug. | Feb. | Aug. | |||||||||
| s. | d. | s. | d. | s. | d. | s. | d. | s. | d. | s. | d. | s. | d. | s. | d. | |
| 4 rooms | 11 | 4 | 11 | 9 | 14 | 8 | 14 | 3 | 11 | 6 | 11 | 7 | 11 | 2 | 11 | 4 |
| 5 rooms | 15 | 11 | 16 | 6 | 18 | 10 | 19 | 3 | 15 | 5 | 15 | 3 | 14 | 1 | 14 | 10 |
| 6 rooms | 18 | 5 | 18 | 7 | 23 | 9 | 24 | 2 | 19 | 0 | 19 | 3 | 17 | 11 | 18 | 5 |
| 7 rooms | 22 | 0 | 22 | 1 | 30 | 4 | 30 | 4 | 24 | 1 | 24 | 10 | 21 | 4 | 21 | 6 |
The index numbers for each of the twenty-five towns, according to returns collected in February and August, 1919, are given below, together with similar information for the previous year:—
Index Numbers for 1918 and 1919 for House-rent in Twenty-five Towns of New Zealand.
| (Base: Average aggregate annual expenditure, four chief centres, 1909–13 = 1000.) | ||||||
|---|---|---|---|---|---|---|
| Town. | February, 1918. | August, 1918. | 1918. | February, 1919. | August, 1919. | 1919. |
| Auckland | 994 | 1016 | 1005 | 1033 | 1055 | 1044 |
| Wellington | 1294 | 1295 | 1295 | 1309 | 1321 | 1315 |
| Christchurch | 973 | 1040 | 1007 | 1051 | 1057 | 1054 |
| Dunedin | 974 | 994 | 984 | 977 | 1006 | 992 |
| Whangarei | 917 | 887 | 902 | 900 | 979 | 940 |
| Hamilton | 1116 | 1147 | 1132 | 1127 | 1255 | 1191 |
| Rotorua | 997 | 975 | 986 | 992 | 962 | 977 |
| Waihi | 578 | 572 | 575 | 571 | 629 | 600 |
| Gisborne | 1063 | 1104 | 1084 | 1103 | 1102 | 1103 |
| Napier | 1049 | 1066 | 1058 | 1075 | 1072 | 1074 |
| Dannevirke | 685 | 771 | 728 | 764 | 781 | 773 |
| New Plymouth | 1015 | 1032 | 1024 | 998 | 1024 | 1011 |
| Wanganui | 1019 | 1030 | 1025 | 1053 | 1062 | 1058 |
| Taihape | 1229 | 1132 | 1181 | 1247 | 1151 | 1199 |
| Palmerston North | 978 | 998 | 988 | 991 | 1012 | 1002 |
| Masterton | 851 | 858 | 855 | 925 | 991 | 958 |
| Blenheim | 776 | 803 | 790 | 795 | 855 | 825 |
| Nelson | 916 | 925 | 921 | 945 | 937 | 941 |
| Greymouth | 700 | 713 | 707 | 748 | 675 | 712 |
| Ashburton | 862 | 878 | 870 | 864 | 870 | 867 |
| Timaru | 896 | 893 | 895 | 912 | 916 | 914 |
| Oamaru | 860 | 777 | 819 | 825 | 847 | 836 |
| Alexandra | 679 | 681 | 680 | 681 | 681 | 681 |
| Gore | 810 | 808 | 809 | 809 | 839 | 824 |
| Invercargill | 820 | 827 | 824 | 852 | 858 | 855 |
| Dominion weighted average | 1022 | 1044 | 1033 | 1053 | 1070 | 1062 |
An alternative statement of the difference in price-levels as between each of the twenty-five towns considered is given in the following table. Similar figures may easily be compiled for the various quarters by working from the index numbers and equating 1000 to 20s. The purchasing-power of money in the average of the five years 1909–13 in the four centres is taken as the base and equated to 20s., the indices being worked out proportionately. The amounts displayed in the table may be compared vertically but not horizontally, since the various groups have different bases.
AMOUNT REQUIRED TO PURCHASE IN TWENTY-FIVE REPRESENTATIVE TOWNS IN 1919 WHAT WOULD HAVE COST 20s. IN THE AVERAGE OF THE FOUR CHIEF CENTRES, 1909–13.
| Town. | Group I. Groceries. | Group II. Dairy-produce. | Group III. Meat. | Groups I-III. Food Groups. | Group IV. House-rent.* | |||||
|---|---|---|---|---|---|---|---|---|---|---|
* Based on average of figures for February and August, 1919. | ||||||||||
| s. | d. | s. | d. | s. | d. | s. | d. | s. | d. | |
| Auckland | 30 | 8 1/2 | 30 | 4 1/4 | 31 | 11 | 31 | 0 1/2 | 20 | 10 1/2 |
| Wellington. | 32 | 10 1/2 | 31 | 0 3/4 | 30 | 1 | 31 | 6 | 26 | 3 1/2 |
| Christchurch | 30 | 7 1/4 | 28 | 8 1/4 | 32 | 1 3/4 | 30 | 7 1/2 | 21 | 1 |
| Dunedin | 31 | 2 1/2 | 30 | 7 | 31 | 9 | 31 | 3 | 19 | 10 |
| Whangarei | 33 | 3 3 3/4 | 29 | 10 | 33 | 3 | 32 | 5 3/4 | 18 | 9 1/2 |
| Hamilton | 31 | 10 1/4 | 30 | 7 1/2 | 33 | 7 1/2 | 32 | 2 1/4 | 23 | 9 3/4 |
| Rotorua | 33 | 10 1/4 | 30 | 2 | 34 | 8 3/4 | 33 | 3 1/4 | 19 | 6 1/2 |
| Waihi | 30 | 10 3/4 | 30 | 2 1/4 | 32 | 11 3/4 | 31 | 5 1/4 | 12 | 0 |
| Gisborne | 33 | 10 1/4 | 31 | 0 | 31 | 0 1/4 | 32 | 2 3/4 | 22 | 0 3/4 |
| Napier | 31 | 9 1/4 | 30 | 10 1/2 | 30 5 3/4 | 31 1 3/4 | 21 5 3/4 | |||
| Dannevirke | 32 | 3 | 29 | 5 1/2 | 29 | 4 1/4 | 30 | 7 1/2 | 15 | 5 1/2 |
| New Plymouth | 30 | 4 3/4 | 29 | 4 1/4 | 33 | 0 1/4 | 31 | 0 3/4 | 20 | 2 3/4 |
| Wanganui | 30 | 1 1/2 | 29 | 8 | 32 | 8 1/4 | 30 | 10 1/2 | 21 | 2 |
| Taihape | 33 | 7 1/4 | 31 | 3 1/4 | 30 | 3 1/4 | 31 | 11 | 23 | 11 3/4 |
| Palmerston North | 30 | 8 | 27 | 9 | 31 | 9 3/4 | 30 | 4 1/4 | 20 | 0 1/2 |
| Masterton | 32 | 11 1/2 | 29 | 9 1/4 | 30 | 7 3/4 | 31 | 5 1/4 | 19 | 2 |
| Blenheim | 34 | 2 1/2 | 29 | 11 1/2 | 31 | 11 | 32 | 5 1/4 | 16 | 6 |
| Nelson | 31 | 6 1/4 | 30 | 5 | 33 | 5 1/4 | 31 | 11 | 18 | 9 3/7 |
| Greymouth | 31 | 0 | 29 | 9 | 34 | 7 | 31 | 11 1/4 | 14 | 3 |
| Ashburton | 30 | 11 1/4 | 28 | 11 3/4 | 33 | 4 | 31 | 3 1/2 | 17 | 4 |
| Timaru | 30 | 3 | 29 | 2 1/4 | 32 | 3 | 30 | 8 1/4 | 18 | 3 1/4 |
| Oamaru | 31 | 4 | 29 | 8 | 33 | 1 1/4 | 31 | 6 1/2 | 16 | 8 3/4 |
| Alexandra | 33 | 5 3/4 | 29 | 4 1/4 | 31 | 9 | 31 | 11 | 12 | 7 1/2 |
| Gore | 33 | 1 1/4 | 30 | 6 | 34 | 7 1/4 | 33 | 0 | 16 | 5 3/4 |
| Invercargill | 32 | 2 | 30 | 5 3/4 | 34 | 10 1/4 | 32 | 8 1/4 | 17 | 0 3/4 |
| Dominion weighted average | 31 | 4 3/4 | 30 | 1 | 31 | 9 3/4 | 31 | 2 3/4 | 21 | 3 |
To obtain a general estimate of the course of prices for the whole Dominion it has been necessary to obtain a weighted average of the index numbers for each town. It is obvious that it would not be strictly correct to obtain a simple average of the prices in Alexandra, with a population of 700, and in Auckland, with a population of over 140,000. Prices in each town have therefore been weighted in accordance with the number of people concerned, and a composite index number has been obtained, which, though artificial, represents the average level of retail prices in the Dominion.
The twenty-five towns considered have a total population of approximately half that of New Zealand, and they are therefore fully representative of the Dominion. The four chief centres, which include a third of the Dominion's population, account for about 70 per cent. of the population of the twenty-five towns, so that their influence in the Dominion index number is naturally predominating. This, however, is justifiable, since the chief centres. not only comprise a great part of the people of the Dominion, but also set the standard which is generally followed throughout the country. The Dominion weighted index number obtained is shown in the table below:—
| Group. | First Quarter, 1919. | Second Quarter, 1919. | Third Quarter, 1919. | Fourth Quarter, 1919. | Average of Four Quarters, 1919. | Average of Four Quarters, 1918. |
|---|---|---|---|---|---|---|
| Groceries | 1554 | 1489 | 1570 | 1666 | 1570 | 1488 |
| Dairy-produce | 1431 | 1558 | 1512 | 1516 | 1504 | 1415 |
| Meat | 1558 | 1541 | 1589 | 1674 | 1591 | 1545 |
| Three food groups | 1527 | 1520 | 1563 | 1634 | 1561 | 1491 |
| House-rent | 1053 | 1053 | 1070 | 1070 | 1062 | 1033 |
| Food and rent | 1359 | 1356 | 1388 | 1434 | 1384 | 1326 |
A comparison between the yearly figures for 1919 and 1918, as shown in the last two columns, affords a clear indication of the extent to which prices have moved. As previously mentioned, the greatest advance during 1919 is shown by the dairy-produce group, while both groceries and meat prices have also risen considerably.
The following table gives a comparison between price-levels during 1919 in the four chief centres and in the twenty-one smaller towns from which information is collected.
| Group. | Weighted Average of Four Chief Centres. (a.) | Weighted Average of Twenty-one Smaller Centres. (b.) | Excess of (a) over (b). |
|---|---|---|---|
* Excess of (b) over (a). | |||
| Groceries | 1565 | 1581 | –16* |
| Dairy-produce | 1509 | 1494 | +15 |
| Meat | 1575 | 1629 | -54* |
| Three food groups | 1554 | 1577 | -23* |
| House-rent | 1103 | 962 | +141 |
| Food and rent | 1394 | 1357 | +37 |
These figures indicate that there is no very considerable difference between the general level of food-prices in the four chief towns and in the average of the twenty-one smaller centres, higher grocery and meat prices in the small towns being to some extent offset by lower prices for dairy-produce. House accommodation, however, as may be expected, is considerably cheaper in the country towns than in the more closely populated cities.
The Monthly Abstract of Statistics published by the Census and Statistics Office gives each month the latest available information on this subject. It is advisable to shortly indicate here the advance in prices in 1919 over those ruling at the outbreak of war.
| TABLE SHOWING THE PERCENTAGE OF INCREASE IN FOOD-PRICES RULING DURING 1919 OVER PRICES RULING ON 31ST JULY, 1914. | ||||||||||
|---|---|---|---|---|---|---|---|---|---|---|
| Group. | First Quarter, 1919. | Second Quarter, 1919. | Third Quarter. 1919. | Fourth Quarter, 1919. | Average of Year 1919. | |||||
| Index Number. | Percentage Increase.* | Index Number. | Percentage Increase.* | Index Number. | Percentage Increase.* | Index Number. | Percentage Increase.* | Index Number. | Percentage Increase.* | |
* Over July, 1914. | ||||||||||
| Groceries (index number, July, 1914: 1033) | 1554 | 50.44 | 1489 | 44.14 | 1570 | 51.98 | 1666 | 61.28 | 1570 | 51.98 |
| Dairy-produce (index number, July, 1914: 1057) | 1431 | 35.38 | 1558 | 47.40 | 1512 | 43.05 | 1516 | 43.42 | 1504 | 42.29 |
| Meat (index number, July, 1914: 1127) | 1558 | 38.24 | 1541 | 36.73 | 1589 | 40.99 | 1674 | 48.54 | 1591 | 41.17 |
| Three food groups (index number, July, 1914: 1070) | 1527 | 42.71 | 1520 | 42.06 | 1563 | 46.07 | 1634 | 52.71 | 1561 | 45.89 |
It will be seen that, over the average for the year, food-prices show an increase since the outbreak of war of 45.89 per cent.
The following general survey of the course of retail prices over a number of years has been brought up to date by the inclusion of the figures for 1919:—
INDEX NUMBERS FOR FOUR CHIEF CENTRES, 1910–19.
(Base: Average aggregate annual expenditure, four chief centres, 1909–13 = 1000.)
| Year. | Auckland. | Wellington. | Christchurch. | Dunedin. | Average of Four Centres. |
|---|---|---|---|---|---|
| 1910 | 1036 | 1017 | 964 | 1039 | 1014 |
| 1911 | 981 | 989 | 934 | 968 | 968 |
| 1912 | 1050 | 1013 | 986 | 1039 | 1022 |
| 1913 | 1064 | 1029 | 964 | 1036 | 1023 |
| 1914 | 1035 | 1082 | 1046 | 1056 | 1055 |
| 1915 | 1172 | 1227 | 1210 | 1219 | 1207 |
| 1916 | 1196 | 1269 | 1197 | 1192 | 1214 |
| 1917 | 1268 | 1395 | 1279 | 1248 | 1298 |
| 1918 | 1461 | 1579 | 1417 | 1503 | 1490 |
| 1919 | 1535 | 1644 | 1530 | 1560 | 1567 |
The outstanding feature illustrated by this table is, of course, the substantial advance in prices since the outbreak of war. The year 1916, however, saw a slight decline in prices in Christchurch and Dunedin as compared with the previous year. Wellington still remains considerably in advance of the other centres.
The prices of commodities included in the dairy-produce group have shown an almost continuous increase since 1891—an increase which during the war period has been considerably accelerated. The year 1916 disclosed a greater and more rapid movement than took place in any previous year for which prices are recorded. The increase in 1919 has also been substantial.
(Base: Average aggregate annual expenditure, four chief centres, 1909–13 = 1000.)
| Year. | Auckland. | Wellington. | Christchurch. | Dunedin. | Average of Four Centres. |
|---|---|---|---|---|---|
| 1910 | 965 | 996 | 920 | 997 | 970 |
| 1911 | 986 | 1018 | 948 | 1021 | 993 |
| 1912 | 998 | 1076 | 992 | 1052 | 1029 |
| 1913 | 1028 | 1124 | 1003 | 1044 | 1050 |
| 1914 | 1019 | 1114 | 1016 | 1065 | 1054 |
| 1915 | 1140 | 1196 | 1133 | 1146 | 1154 |
| 1916 | 1288 | 1350 | 1251 | 1263 | 1288 |
| 1917 | 1362 | 1425 | 1318 | 1351 | 1364 |
| 1918 | 1443 | 1476 | 1328 | 1432 | 1420 |
| 1919 | 1518 | 1553 | 1434 | 1529 | 1508 |
The index numbers for the meat group disclose no exceptional movement beyond the increase brought about by war conditions. For the last four years Wellington index numbers have been considerably below those of the other three centres, while Christchurch during 1919 displaced Auckland from its leading position, and is now by a small margin the most expensive of the four centres for this group.
(Base: Average aggregate annual expenditure, four chief centres, 1909–13 = 1000.)
| Year. | Auckland. | Wellington. | Christchurch. | Dunedin. | Average of Four Centres. |
|---|---|---|---|---|---|
| 1910 | 1047 | 1029 | 980 | 851 | 977 |
| 1911 | 1052 | 1034 | 995 | 900 | 995 |
| 1912 | 1033 | 1024 | 1034 | 915 | 1001 |
| 1913 | 1104 | 1139 | 1027 | 917 | 1047 |
| 1914 | 1266 | 1112 | 1061 | 1103 | 1136 |
| 1915 | 1293 | 1205 | 1191 | 1190 | 1220 |
| 1916 | 1413 | 1274 | 1313 | 1283 | 1321 |
| 1917 | 1500 | 1380 | 1449 | 1417 | 1437 |
| 1918 | 1575 | 1476 | 1540 | 1507 | 1525 |
| 1919 | 1596 | 1504 | 1607 | 1588 | 1574 |
The index numbers given in the following table have been compiled from records of prices of the three separate food groups in such manner as to show the movement of the general level of food-prices, care being taken to give each group its due importance:—
(Base: Average aggregate annual expenditure, four chief centres, 1909–13 = 1000.)
| Year. | Auckland. | Wellington. | Christchurch. | Dunedin. | Average of Four Centres. |
|---|---|---|---|---|---|
| 1910 | 1023 | 1016 | 960 | 965 | 991 |
| 1911 | 1006 | 1011 | 958 | 957 | 983 |
| 1912 | 1032 | 1031 | 1004 | 1000 | 1017 |
| 1913 | 1069 | 1089 | 995 | 997 | 1037 |
| 1914 | 1110 | 1100 | 1044 | 1074 | 1082 |
| 1915 | 1206 | 1216 | 1176 | 1191 | 1197 |
| 1916 | 1291 | 1290 | 1249 | 1244 | 1268 |
| 1917 | 1369 | 1397 | 1346 | 1328 | 1360 |
| 1918 | 1496 | 1521 | 1438 | 1488 | 1486 |
| 1919 | 1552 | 1575 | 1531 | 1563 | 1555 |
It will be noted that food-prices in the four centres, as recorded by the above index numbers, move with considerable uniformity, although the extent of the movement varies as between the different cities.
In pre-war years food-prices were slightly higher in Auckland and Wellington than in the two southern centres, this being mainly due to the difference in prices of agricultural products (flour, oatmeal, &.), and meat. The position has now changed to a considerable extent, and Dunedin is now dearer than Auckland, although still cheaper than Wellington.
The following table brings into prominence the high level of weekly rentals in Wellington as compared with the other three centres. During the war period and for some years prior to 1914 the increase in house-rents in Wellington has been such as to increase the disparity between the level of rents in that city and in the other three chief centres of the Dominion.
In 1919, however, Auckland and Christchurch showed far greater increases than did Wellington, but in spite of this the latter city still maintains its position—considerably above the other centres.
(Base: Average aggregate annual expenditure, four chief centres, 1909–13 = 1000.)
| Year. | Auckland. | Wellington. | Christchurch. | Dunedin. | Average of Four Centres. |
|---|---|---|---|---|---|
| 1910 | 991 | 1100 | 933 | 936 | 990 |
| 1911 | 998 | 1088 | 923 | 938 | 987 |
| 1912 | 1065 | 1093 | 920 | 950 | 1007 |
| 1913 | 1044 | 1164 | 937 | 958 | 1026 |
| 1914 | 1044 | 1173 | 961 | 965 | 1036 |
| 1915 | 1005 | 1186 | 967 | 970 | 1032 |
| 1916 | 987 | 1216 | 949 | 965 | 1029 |
| 1917 | 977 | 1240 | 967 | 945 | 1032 |
| 1918 | 1005 | 1295 | 1007 | 984 | 1073 |
| 1919 | 1044 | 1315 | 1054 | 992 | 1101 |
Considerable difficulties are met with in any attempt to follow accurately the course of prices in this group. It has, in fact, been impossible to settle on any list of commodities which were used during the period under review in anything approaching comparable proportions in the four chief centres. The comparative usages of electric light, gas, kerosene, and candles vary greatly even between the four centres. Coal, too, presents a difficulty for comparative purposes in the several different classes of coal commonly used in the different towns.
However, a small group of seven items—coal, coke, firewood, kerosene, gas for lighting, electricity for lighting, and candles—has been considered, and prices in the four chief centres have been collected for as many past years as possible. Complete index numbers for this group have been compiled for 1007 and subsequent years. Figures for the past ten years are given in the table below.
(Base: Average aggregate annual expenditure, four chief centres, 1909–13 = 1000.)
| Year. | Auckland. | Wellington. | Christchurch. | Dunedin. | Average of Four Centres. |
|---|---|---|---|---|---|
| 1910 | 898 | 1054 | 1075 | 896 | 981 |
| 1911 | 899 | 1053 | 1074 | 893 | 980 |
| 1912 | 919 | 1091 | 1117 | 920 | 1012 |
| 1913 | 928 | 1101 | 1150 | 960 | 1035 |
| 1914 | 991 | 1151 | 1162 | 925 | 1057 |
| 1915 | 991 | 1146 | 1145 | 965 | 1062 |
| 1916 | 1103 | 1203 | 1230 | 1073 | 1152 |
| 1917 | 1286 | 1306 | 1468 | 1214 | 1319 |
| 1918 | 1378 | 1408 | 1569 | 1333 | 1422 |
| 1919 | 1497 | 1514 | 1705 | 1504 | 1555 |
Over the average of the four centres a considerable advance in the index numbers of this group has been noticeable since 1911. This movement is common to all four cities, and was particularly rapid as between 1916 and 1917, when the general index number increased by 173 points. There were further considerable increases during 1918 and 1919.
(Base: Average aggregate annual expenditure, four chief centres, 1909–13 = 1000.)
| Year. | Auckland. | Wellington. | Christchurch. | Dunedin. | Average of Four Centres. |
|---|---|---|---|---|---|
| 1910 | 1012 | 1046 | 950 | 955 | 991 |
| 1911 | 1004 | 1038 | 946 | 950 | 985 |
| 1912 | 1044 | 1053 | 974 | 982 | 1013 |
| 1913 | 1061 | 1115 | 974 | 983 | 1033 |
| 1914 | 1087 | 1125 | 1015 | 1035 | 1066 |
| 1915 | 1135 | 1201 | 1101 | 1114 | 1138 |
| 1916 | 1186 | 1262 | 1144 | 1140 | 1183 |
| 1917 | 1231 | 1339 | 1210 | 1194 | 1244 |
| 1918 | 1320 | 1439 | 1281 | 1306 | 1337 |
| 1919 | 1372 | 1483 | 1364 | 1360 | 1395 |
The index numbers given above show the movement of prices of food and of house-rents combined. These figures accordingly present concise information as to the movement in the cost of a substantial proportion of the ordinary domestic necessities—food and housing.
(Base: Average aggregate annual expenditure, four chief centres, 1909–13 = 1000.)
| Year. | Group I: Groceries. | Group II: Dairy-products. | Group III: Meat. | Groups I-III: Food Groups. | Group IV: House-rent. | Groups I-IV. Food and Rent. | Group V: Fuel and Light. | Groups I-V. Food, Rent, Fuel, and Light. |
|---|---|---|---|---|---|---|---|---|
| 1910 | 1014 | 970 | 977 | 991 | 990 | 991 | 981 | 990 |
| 1911 | 968 | 993 | 995 | 983 | 987 | 985 | 980 | 984 |
| 1912 | 1022 | 1029 | 1001 | 1017 | 1007 | 1013 | 1012 | 1013 |
| 1913 | 1023 | 1050 | 1047 | 1037 | 1026 | 1033 | 1035 | 1034 |
| 1914 | 1055 | 1054 | 1136 | 1082 | 1036 | 1066 | 1057 | 1065 |
| 1915 | 1201 | 1154 | 1222 | 1197 | 1032 | 1138 | 1062 | 1130 |
| 1916 | 1214 | 1288 | 1321 | 1268 | 1029 | 1183 | 1152 | 1180 |
| 1917 | 1298 | 1364 | 1437 | 1360 | 1032 | 1244 | 1319 | 1251 |
| 1918 | 1490 | 1420 | 1525 | 1486 | 1073 | 1337 | 1422 | 1346 |
| 1919 | 1567 | 1508 | 1574 | 1555 | 1101 | 1395 | 1555 | 1411 |
The following table, which is based on the average of the index numbers of the four chief centres as set out in the preceding table, gives an indication (in money figures) of the extent to which prices have risen during the period 1910–19. The table shows the amount necessary, on the average, to purchase the same quantity of foodstuffs, house accommodation, and fuel and light as would have cost 20s. on the average in the four chief centres during the base period 1909–13.
| Year. | Group I: Groceries. | Group II: Dairy-products. | Group III: Meat. | Groups I-III: Food Groups. | Group IV: House-rent. | Groups I-IV. Food and Rent. | Group V: Fuel and Light. | Groups I-V. Food, Rent, Fuel, and Light. | ||||||||
|---|---|---|---|---|---|---|---|---|---|---|---|---|---|---|---|---|
Note.—These figures are comparable vertically but not horizontally. See above re figures for rent. | ||||||||||||||||
| s. | d. | s. | d. | s. | d. | s. | d. | s. | d. | s. | d. | s. | d. | s. | d. | |
| 1910 | 20 | 3 1/4 | 19 | 4 3/4 | 19 | 6 1/2 | 19 | 9 3/4 | 19 | 9 1/2 | 19 | 9 3/4 | 19 | 7 1/2 | 19 | 9 1/2 |
| 1911 | 19 | 4 1/4 | 19 | 10 1/4 | 19 | 10 3/4 | 19 | 8 | 19 | 9 | 19 | 8 1/2 | 19 | 7 1/4 | 19 | 8 1/4 |
| 1912 | 20 | 5 1/4 | 20 | 7 | 20 | 0 1/4 | 20 | 4 | 20 | 1 3/4 | 20 | 3 | 20 | 3 | 20 | 3 |
| 1913 | 20 | 5 1/2 | 21 | 0 | 20 | 11 1/4 | 20 | 9 | 20 | 6 1/4 | 20 | 8 | 20 | 8 1/2 | 20 | 8 1/4 |
| 1914 | 21 | 1 1/4 | 21 | 1 | 22 | 8 3/4 | 21 | 7 3/4 | 20 | 8 3/4 | 21 | 3 3/4 | 21 | 1 3/4 | 21 | 3 1/2 |
| 1915 | 24 | 0 1/4 | 23 | 1 | 24 | 5 1/4 | 23 | 11 1/4 | 20 | 7 3/4 | 22 | 9 | 21 | 3 | 22 | 7 1/4 |
| 1916 | 24 | 3 1/4 | 25 | 9 | 26 | 5 | 25 | 4 1/4 | 20 | 7 | 23 | 8 | 23 | 0 1/2 | 23 | 7 1/4 |
| 1917 | 25 | 11 1/2 | 27 | 3 1/4 | 28 | 9 | 27 | 2 1/2 | 20 | 7 3/4 | 24 | 10 1/2 | 26 | 4 1/2 | 25 | 0 1/4 |
| 1918 | 29 | 9 1/2 | 28 | 4 3/4 | 30 | 6 | 29 | 8 3/4 | 21 | 5 1/2 | 26 | 9 | 28 | 5 1/4 | 26 | 11 |
| 1919 | 31 | 4 | 30 | 2 | 31 | 5 3/4 | 31 | 1 1/4 | 22 | 0 1/4 | 27 | 10 3/4 | 31 | 1 1/4 | 28 | 2 3/4 |
The general increase in prices has materially reduced the purchasing-power of the sovereign, as is shown by the following table, which sets out the relative “worth” in terms of commodities (but stated for convenience in terms of money) represented by a sovereign during the years 1910–19. The average “worth” in the years 1909–13 has been taken as a base and equated to 20s. The figures throughout are based on the average prices of the four chief centres.
| Year. | Group I: Groceries. | Group II: Dairy-products. | Group III: Meat. | Groups I-III: Food Groups. | Group IV: House-rent. | Groups I-IV. Food and Rent. | Group V: Fuel and Light. | Groups I-V. Food, Rent, Fuel, and Light. | ||||||||
|---|---|---|---|---|---|---|---|---|---|---|---|---|---|---|---|---|
Note.—These figures are comparable vertically but not horizontally. | ||||||||||||||||
| s. | d. | s. | d. | s. | d. | s. | d. | s. | d. | s. | d. | s. | d. | s. | d. | |
| 1910 | 19 | 8 3/4 | 20 | 7 1/2 | 20 | 5 3/4 | 20 | 2 1/4 | 20 | 2 1/2 | 20 | 2 1/4 | 20 | 4 3/4 | 20 | 2 1/2 |
| 1911 | 20 | 8 | 20 | 1 3/4 | 20 | 1 1/4 | 20 | 4 1/4 | 20 | 3 1/4 | 20 | 3 3/4 | 20 | 5 | 20 | 4 |
| 1912 | 19 | 6 3/4 | 19 | 5 1/4 | 19 | 11 3/4 | 19 | 8 | 19 | 10 1/4 | 19 | 9 | 19 | 9 1/4 | 19 | 9 |
| 1913 | 19 | 6 1/2 | 19 | 0 1/2 | 19 | 1 1/4 | 19 | 3 1/2 | 19 | 6 | 19 | 4 1/4 | 19 | 4 | 19 | 4 |
| 1914 | 18 | 11 1/2 | 18 | 11 3/4 | 17 | 7 1/4 | 18 | 5 3/4 | 19 | 3 3/4 | 18 | 9 1/4 | 18 | 11 | 18 | 9 1/4 |
| 1915 | 16 | 7 3/4 | 17 | 4 | 16 | 4 1/2 | 16 | 8 1/2 | 19 | 4 1/2 | 17 | 7 | 18 | 10 | 17 | 8 1/2 |
| 1916 | 16 | 5 3/4 | 15 | 6 1/2 | 15 | 1 1/2 | 15 | 9 1/4 | 19 | 5 1/4 | 16 | 10 3/4 | 17 | 4 1/2 | 16 | 11 1/2 |
| 1917 | 15 | 5 | 14 | 8 | 13 | 11 | 14 | 8 1/2 | 19 | 4 1/2 | 16 | 1 | 15 | 2 | 15 | 11 3/4 |
| 1918 | 13 | 5 | 14 | 1 | 13 | 1 1/2 | 13 | 5 1/2 | 18 | 7 3/4 | 14 | 11 1/2 | 14 | 0 3/4 | 14 | 10 1/4 |
| 1919 | 12 | 9 1/4 | 13 | 3 1/4 | 12 | 8 1/2 | 12 | 10 1/4 | 18 | 2 | 14 | 4 | 12 | 10 1/4 | 14 | 2 |
In the consideration of this table care must be taken that the figures are given their correct significance. In short, they represent—in money figures—the worth (or purchasing-power) of a sovereign expended in purchasing the commodities shown at the heads of the columns, as compared with a sovereign of full purchasing-power in the average of the years 1909–13.
Another fact which must be noted is that the figures shown in this table will not rise or fall to equal extent with any movements shown in the index number, and the percentage rise or fall will not be the same both in this table and in the table of index numbers.
This may be explained by pointing out that an index number of 1333 would represent in the above table approximately 15s., 1000 being equal to 20s. In that case prices are 33 1/3 per cent. higher than previously; or, in other words, the sovereign will purchase only 75 per cent. of the amount of goods for which it could have been exchanged in the “base” period. It will accordingly be seen that the index number will reach 2000 before the purchasing-power of money has fallen another 5s.—i.e., from 15s. to 10s.—and would move as high as 4000 before the purchasing-power of the sovereign fell to 5s. On the other hand, a falling index number will move relatively less rapidly than would the corresponding figure indicating the increasing purchasing-power of the sovereign.
During the year 1917 a system for the regular collection of information regarding wholesale prices was put into operation, and this system will be continued in future.
A considerable volume of data has been obtained from merchants and traders by means of retrospective investigations covering the years 1891 to 1917, and the Census and Statistics Office has now been able to obtain sufficient information upon which to calculate index numbers to record the movement of wholesale prices over the period from 1891 to date.
The general index number is based upon the prices of 106 commodities or grades of commodities. From 1909 more detailed information is available, and index numbers for eight groups of commodities can be given. These groups cover the following numbers of articles: Group I, agricultural produce, 15; Group II, flour, bran, pollard, and oatmeal, 4; Group III, wool, hides, tallow, butter, and cheese, 14; Group IV, general merchandise and crockery, 44; Group V, building-materials (ironmongery and timber), 31; Group VI, leather. 7; Group VII, chemicals and manures, 21; Group VIII, coal, 4. The group index numbers accordingly represent, in toto, the price fluctuations of 140 articles or grades of commodities. Each article has been given a weight relative to its average annual pre-war consumption in the Dominion and, further, relative to its price. This system of weighting, known as the “aggregate-expenditure method,” is the one adopted in the retail-prices inquiry.
A full report of the inquiry into the movement of wholesale prices will be published as early as circumstances permit. In the meantime index numbers for the years 1891 to 1919 are published in this section of the Year-book. Index numbers of current wholesale prices will be found in each issue of the Monthly Abstract of Statistics.
The following tables of index numbers have been compiled as indicated on page 802:—
(Base: Average aggregate annual expenditure, four chief centres, 1909–13 = 1000.)
| Quarter ended | Group I: Agricultural Produce. | Group II: Flour, Bran, Pollard, and Oatmeal. | Group III: Wool, Hides, Tallow, Butter, and Cheese. | Group IV: General Merchandise and Crockery. | Group V: Building-material. | Group VI: Leather. | Group VII: Chemicals and Manures. | Group VIII: Coal. |
|---|---|---|---|---|---|---|---|---|
| 1914. | ||||||||
| March | 907 | 990 | 1123 | 1078 | 1103 | 1172 | 1064 | 1003 |
| June | 969 | 1031 | 1159 | 1077 | 1109 | 1180 | 1077 | 1003 |
| September | 1033 | 1131 | 1115 | 1077 | 1123 | 1187 | 1080 | 1003 |
| December | 1176 | 1326 | 1067 | 1125 | 1144 | 1198 | 1082 | 1008 |
| 1915. | ||||||||
| March | 1542 | 1589 | 1196 | 1175 | 1148 | 1286 | 1160 | 1016 |
| June | 1621 | 1727 | 1305 | 1186 | 1192 | 1349 | 1195 | 1014 |
| September | 1641 | 1605 | 1371 | 1216 | 1256 | 1368 | 1244 | 1014 |
| December | 1517 | 1298 | 1315 | 1229 | 1273 | 1388 | 1272 | 1031 |
| 1916. | ||||||||
| March | 1480 | 1361 | 1337 | 1271 | 1334 | 1440 | 1375 | 1082 |
| June | 1305 | 1273 | 1402 | 1312 | 1448 | 1458 | 1417 | 1118 |
| September | 1461 | 1306 | 1436 | 1340 | 1485 | 1472 | 1494 | 1175 |
| December | 1702 | 1300 | 1430 | 1345 | 1508 | 1510 | 1495 | 1204 |
| 1917. | ||||||||
| March | 1499 | 1419 | 1431 | 1367 | 1564 | 1676 | 1574 | 1267 |
| June | 1503 | 1447 | 1452 | 1407 | 1676 | 1795 | 1650 | 1330 |
| September | 1535 | 1459 | 1468 | 1463 | 1838 | 1853 | 1719 | 1432 |
| December | 1529 | 1436 | 1512 | 1551 | 2009 | 1901 | 1753 | 1445 |
| 1918. | ||||||||
| March | 1582 | 1475 | 1470 | 1592 | 2007 | 1899 | 1817 | 1461 |
| June | 1716 | 1557 | 1462 | 1665 | 2077 | 1907 | 1965 | 1462 |
| September | 1902 | 1573 | 1463 | 1727 | 2209 | 1891 | 2070 | 1463 |
| December | 2181 | 1587 | 1467 | 1756 | 2300 | 1903 | 2071 | 1525 |
| 1919. | ||||||||
| March | 1873 | 1573 | 1466 | 1735 | 2181 | 1887 | 1977 | 1535 |
| June | 1727 | 1525 | 1480 | 1709 | 2050 | 1915 | 1919 | 1557 |
| September | 1898 | 1516 | 1544 | 1808 | 2000 | 2117 | 1916 | 1688 |
| December | 1974 | 1521 | 1571 | 1933 | 2035 | 2344 | 2021 | 1809 |
(Base: Average aggregate annual expenditure, four chief centres, 1909–13 = 1000.)
| Year. | Index Number. |
|---|---|
| 1891 | 994 |
| 1892 | 972 |
| 1893 | 973 |
| 1894 | 927 |
| 1895 | 920 |
| 1896 | 943 |
| 1897 | 942 |
| 1898 | 972 |
| 1899 | 893 |
| 1900 | 917 |
| 1901 | 931 |
| 1902 | 975 |
| 1903 | 954 |
| 1904 | 922 |
| 1905 | 994 |
| 1906 | 1016 |
| 1907 | 1016 |
| 1908 | 1006 |
| 1909 | 949 |
| 1910 | 983 |
| 1911 | 994 |
| 1912 | 1041 |
| 1913 | 1032 |
| 1914 | 1077 |
| 1915 | 1269 |
| 1916 | 1380 |
| 1917 | 1555 |
| 1918 | 1809 |
| 1919 | 1834 |
(Base: Average aggregate annual expenditure, four chief centres, 1909–13 = 1000.)
| Year. | Group I: Agricultural Produce. | Group II: Flour, Bran, Pollard, and Oatmeal. | Group III: Wool, Hides, Tallow, Butter, and Cheese. | Group IV: General Merchandise and Crockery. | Group V: Building-material. | Group VI: Leather. | Group VII: Chemicals and Manures. | Group VIII: Coal. |
|---|---|---|---|---|---|---|---|---|
| 1910 | 1021 | 989 | 981 | 969 | 957 | 986 | 994 | 985 |
| 1911 | 991 | 972 | 1008 | 993 | 995 | 982 | 986 | 985 |
| 1912 | 1089 | 970 | 1029 | 1053 | 1037 | 993 | 1024 | 1011 |
| 1913 | 967 | 981 | 1047 | 1055 | 1063 | 1126 | 1035 | 1038 |
| 1914 | 1021 | 1120 | 1116 | 1089 | 1120 | 1184 | 1076 | 1004 |
| 1915 | 1580 | 1555 | 1297 | 1202 | 1217 | 1348 | 1218 | 1019 |
| 1916 | 1487 | 1310 | 1401 | 1317 | 1444 | 1470 | 1445 | 1145 |
| 1917 | 1517 | 1440 | 1466 | 1447 | 1772 | 1806 | 1674 | 1369 |
| 1918 | 1845 | 1548 | 1466 | 1685 | 2148 | 1900 | 1981 | 1478 |
| 1919 | 1868 | 1534 | 1515 | 1796 | 2067 | 2066 | 1958 | 1647 |
The following table shows the average export prices of mutton (per pound) in the Canterbury District during three quarters of 1919, and also the average for 1918:—
| Item. | Average of Three Quarters, 1918 | First Quarter, 1919. | Second Quarter, 1919. | Third Quarter, 1919. | Average of Three Quarters, 1919. |
|---|---|---|---|---|---|
NOTE.—Figures for the fourth quarter of each year are not available. | |||||
| d. | d. | d. | d. | d. | |
| Prime lambs up to 42 lb. | 8 3/4 | 8 1/4 | 8 1/2 | 9 | 8 1/2 |
| Prime wethers up to 72 lb. | 6 3/4 | 6 | 6 1/2 | 7 | 6 1/2 |
| Prime ewes up to 72 lb. | 6 1/4 | 5 1/2 | 6 | 6 1/2 | 6 |
IN connection with the collection of manufactory statistics, which is now made annually, certain particulars are obtained with regard to the wage-rates of the employees in the various factories.
The summary which appears below covers the year 1918–19, and deals with some 58,909 employees, male and female. No claim is made for these figures that they cover all industries, or that they include all factories in any one industry. Information as to short time or overtime worked was also collected and compiled, but publication or discussion must await more space than is available within the reduced compass of this issue.
| WAGE-RATES OF EMPLOYEES IN VARIOUS MANUFACTORIES, 1918–19. | ||||||||||
|---|---|---|---|---|---|---|---|---|---|---|
| Industry. | Number of Firms. | Weekly Wage-rate. | Total Employees. | |||||||
| Under 20s. | 20s. and under 30s. | 30s. and under 45s. | 45s. and under 60s. | 60s. and under 80s. | 80s. and under 100s. | 100s. and under 120s. | 120s. and over. | |||
| Males. | ||||||||||
| Aerated waters and cordials | 101 | 7 | 29 | 46 | 82 | 219 | 28 | 7 | 2 | 420 |
| Agricultural machinery | 25 | 52 | 30 | 30 | 28 | 354 | 108 | 23 | 1 | 626 |
| Asphalt | 5 | 1 | 15 | 4 | 20 | |||||
| Baking-powder | 4 | 26 | 10 | 5 | 4 | 9 | 1 | 55 | ||
| Baskets and perambulators | 15 | 5 | 7 | 13 | 8 | 43 | 6 | 82 | ||
| Biscuits and confectionery | 48 | 88 | 119 | 167 | 125 | 165 | 59 | 20 | 6 | 749 |
| Boiling-down and manure | 55 | 3 | 13 | 8 | 413 | 140 | 6 | 2 | 585 | |
| Boots and shoes | 77 | 80 | 89 | 90 | 45 | 727 | 294 | 26 | 4 | 1,355 |
| Brewing and malting | 55 | 8 | 19 | 53 | 662 | 55 | 10 | 10 | 817 | |
| Brick, tile, and pottery | 70 | 3 | 12 | 43 | 71 | 582 | 90 | 11 | 13 | 825 |
| Brushes and brooms | 9 | 10 | 6 | 18 | 21 | 31 | 10 | 2 | 1 | 99 |
| Butter and cheese | 321 | 10 | 24 | 71 | 167 | 1,119 | 307 | 40 | 6 | 1,744 |
| Chemicals | 11 | 2 | 5 | 2 | 5 | 22 | 4 | 3 | 43 | |
| Clothing and dressmaking | 473 | 24 | 40 | 53 | 30 | 256 | 103 | 23 | 9 | 538 |
| Coachbuilding | 123 | 58 | 52 | 68 | 38 | 239 | 241 | 13 | 709 | |
| Coopering | 24 | 5 | 11 | 15 | 9 | 193 | 24 | 2 | 1 | 260 |
| Electrical engineering | 13 | 45 | 25 | 10 | 17 | 45 | 18 | 3 | 1 | 164 |
| Electroplating | 8 | 6 | 4 | 6 | 1 | 5 | 3 | 1 | 26 | |
| Electric supply | 42 | 17 | 22 | 18 | 38 | 200 | 116 | 26 | 3 | 440 |
| Electric tramways | 10 | 5 | 6 | 10 | 55 | 1,317 | 480 | 4 | 1,882 | |
| Engineering | 128 | 314 | 283 | 115 | 38 | 711 | 723 | 76 | 5 | 2,265 |
| Engraving | 13 | 6 | 6 | 3 | 9 | 8 | 1 | 1 | 34 | |
| Fibrous plaster | 13 | 3 | 6 | 1 | 5 | 67 | 9 | 3 | 94 | |
| Fish-curing | 11 | 1 | 2 | 8 | 43 | 28 | 1 | 4 | 87 | |
| Flax-milling | 79 | 4 | 3 | 21 | 31 | 401 | 457 | 116 | 184 | 1,217 |
| Furniture and cabinetmaking | 208 | 233 | 72 | 85 | 44 | 541 | 402 | 21 | 1 | 1,399 |
| Gas | 51 | 12 | 15 | 16 | 122 | 670 | 293 | 14 | 2 | 1,144 |
| Grain-milling | 44 | 5 | 14 | 17 | 13 | 329 | 68 | 7 | 2 | 455 |
| Ham and bacon | 24 | 4 | 8 | 5 | 116 | 37 | 3 | 4 | 177 | |
| Hats and caps | 17 | 5 | 11 | 2 | 4 | 33 | 9 | 4 | 0 | 68 |
| Iron and brass | 32 | 27 | 27 | 14 | 30 | 217 | 102 | 16 | 6 | 439 |
| Jam and fruit | 11 | 14 | 14 | 21 | 30 | 71 | 15 | 2 | 1 | 168 |
| Jewellery and watches | 54 | 35 | 18 | 19 | 8 | 64 | 62 | 11 | 3 | 220 |
| Leadlight and bevelled glass | 14 | 2 | 7 | 7 | 17 | 49 | 5 | 2 | 89 | |
| Leather goods | 16 | 14 | 9 | 11 | 5 | 43 | 21 | 4 | 1 | 108 |
| Lime and cement | 17 | 4 | 9 | 13 | 439 | 46 | 6 | 517 | ||
| Mattresses and bedding | 12 | 8 | 5 | 11 | 8 | 32 | 17 | 2 | 83 | |
| Meat freezing and preserving | 53 | 10 | 55 | 153 | 114 | 3,100 | 2,017 | 534 | 967 | 6,950 |
| Monumental masonry | 21 | 7 | 5 | 8 | 4 | 73 | 35 | 4 | 1 | 137 |
| Motor and cycle engineering | 329 | 252 | 210 | 226 | 120 | 345 | 327 | 12 | 45 | 1,637 |
| Musical instruments | 10 | 10 | 8 | 5 | 36 | 7 | 4 | 2 | 72 | |
| Printing and bookbinding | 252 | 343 | 233 | 236 | 90 | 643 | 986 | 177 | 73 | 2,781 |
| Proprietary medicines | 16 | 4 | 4 | 5 | 16 | 30 | 6 | 1 | 66 | |
| Ranges | 8 | 8 | 7 | 5 | 2 | 125 | 20 | 3 | 1 | 171 |
| Rope and twine | 7 | 3 | 14 | 34 | 43 | 68 | 16 | 2 | 180 | |
| Saddlery and harness | 62 | 30 | 21 | 16 | 5 | 145 | 85 | 5 | 1 | 308 |
| Sail, tent, and oilskin | 33 | 4 | 7 | 10 | 9 | 43 | 19 | 92 | ||
| Sauce, pickle, and vinegar | 16 | 8 | 5 | 20 | 41 | 50 | 5 | 1 | 1 | 131 |
| Sausage-casings | 14 | 1 | 1 | 7 | 7 | 80 | 89 | 79 | 32 | 296 |
| Sawmills, sash and door | 334 | 42 | 68 | 120 | 118 | 2,260 | 2,081 | 428 | 113 | 5,230 |
| Ship and boat building | 22 | 40 | 30 | 18 | 19 | 329 | 193 | 3 | 1 | 633 |
| Soap and candles | 18 | 10 | 12 | 12 | 11 | 128 | 18 | 7 | 1 | 199 |
| Stone-crushing | 32 | 1 | 1 | 7 | 291 | 82 | 1 | 383 | ||
| Tailoring | 326 | 27 | 20 | 27 | 39 | 379 | 191 | 48 | 18 | 749 |
| Tanning, fellmongering, and wool-scouring | 73 | 6 | 19 | 38 | 39 | 954 | 352 | 122 | 79 | 1,609 |
| Tea-packing | 22 | 14 | 29 | 17 | 6 | 34 | 6 | 2 | 108 | |
| Tinsmithing | 76 | 51 | 58 | 65 | 53 | 180 | 225 | 7 | 7 | 646 |
| Wireworking | 14 | 5 | 5 | 6 | 7 | 22 | 6 | 51 | ||
| Woodware and turnery | 62 | 27 | 19 | 22 | 14 | 173 | 117 | 10 | 1 | 382 |
| Woollen goods | 11 | 27 | 40 | 33 | 130 | 381 | 81 | 6 | 6 | 704 |
| Industries employing under fifty people | 149 | 38 | 66 | 77 | 89 | 598 | 96 | 17 | 4 | 985 |
| Totals | 4,193 | 2,096 | 1,934 | 2,215 | 2,184 | 20,909 | 11,457 | 2,083 | 1,626 | 44,504 |
| Females. | ||||||||||
| Biscuits and confectionery | 48 | 194 | 378 | 185 | 16 | 1 | 777 | |||
| Boots and shoes | 77 | 169 | 185 | 383 | 64 | 11 | 812 | |||
| Brushes and brooms | 9 | 5 | 18 | 29 | 1 | 53 | ||||
| Butter and cheese | 321 | 20 | 18 | 2 | 3 | 43 | ||||
| Chemicals | 11 | 12 | 30 | 7 | 1 | 50 | ||||
| Clothing and dressmaking | 473 | 2,044 | 1,677 | 2,706 | 279 | 109 | 40 | 22 | 15 | 6,892 |
| Furniture and cabinetmaking | 208 | 15 | 20 | 60 | 9 | 4 | 1 | 109 | ||
| Hats and caps | 17 | 62 | 79 | 84 | 9 | 6 | 2 | 242 | ||
| Hosiery | 8 | 35 | 49 | 42 | 1 | 2 | 129 | |||
| Jam and fruit | 11 | 16 | 62 | 23 | 1 | 102 | ||||
| Leather goods | 16 | 13 | 21 | 15 | 1 | 50 | ||||
| Mattresses and bedding | 12 | 17 | 25 | 46 | 2 | 2 | 92 | |||
| Meat freezing and preserving | 53 | 11 | 19 | 15 | 1 | 46 | ||||
| Paper bags and boxes | 8 | 16 | 41 | 31 | 3 | 91 | ||||
| Printing and bookbinding | 252 | 284 | 264 | 348 | 58 | 11 | 2 | 967 | ||
| Proprietary medicines | 16 | 26 | 23 | 15 | 2 | 66 | ||||
| Sail, tent, and oilskin | 33 | 19 | 52 | 51 | 5 | 1 | 128 | |||
| Sauce, pickle, and vinegar | 16 | 31 | 62 | 9 | 1 | 1 | 104 | |||
| Soap and candles | 18 | 3 | 24 | 4 | 31 | |||||
| Tailoring | 326 | 264 | 176 | 1,124 | 193 | 21 | 2 | 3 | 1,783 | |
| Tea-packing | 22 | 31 | 28 | 15 | 2 | 76 | ||||
| Tinsmithing | 76 | 10 | 28 | 9 | 47 | |||||
| Woollen goods | 11 | 132 | 160 | 661 | 97 | 37 | 1,087 | |||
| Umbrellas | 10 | 8 | 18 | 12 | 1 | 39 | ||||
| Industries employing under thirty people | 2,141 | 78 | 272 | 199 | 35 | 4 | 1 | 589 | ||
| Totals | 4,193 | 3,484 | 3,723 | 6,095 | 796 | 219 | 48 | 22 | 18 | 14,405 |
Table of Contents
UNDER the provisions of the Repatriation Act, 1918, a Department was created bearing the name of the “Repatriation Department,” whose aim it was “to help every discharged soldier requiring assistance to secure for himself a position in the community at least as good as that relinquished by him when he joined the colours.” The controlling authority is the Repatriation Board consisting of four Ministers of the Crown, with a Director of Repatriation as chief executive officer.
In each of the four centres District Repatriation Boards, composed of prominent citizens nominated by such bodies as the Returned Soldiers’ Association, the National Efficiency Board, the labour organizations, and the industrial, commercial, and patriotic interests of the community have been established, and departmental offices have been opened and staffed with discharged soldiers under the control of District Repatriation Officers at Auckland, Wellington, Christchurch, and Dunedin.
Repatiation Committees on a similar basis have been formed in the chief provincial towns, and offices with paid staffs are established in the following centres:—
| Hamilton | Napier | Wanganui | Nelson | Timaru |
| Rotorua | Hastings | Palmerston North | Blenheim | Oamaru |
| Gisborne | New Plymouth | Masterton | Greymouth | Invercargill. |
In addition to this some sixty-four honorary committees have been established throughout the country.
Under the Repatriation Act and the instructions issued in connection therewith a wide range of assistance is available to discharged soldiers. This assistance may be summarized under three main headings, viz.:— Employment; Training; and Financial Assistance.
It is found from experience that only some 25 per cent. of the discharged soldiers desire the assistance of the Government. The remaining 75 per cent. apparently either resume their pre-war billets or find no difficulty in obtaining the work they desire.
The following table shows the number of men placed in the various groups of industry in each of the four districts:—
| Group. | Auckland. | Wellington. | Canterbury. | Otago. | Total. |
|---|---|---|---|---|---|
| 1. Wood, furniture, timber, &. | 312 | 391 | 236 | 200 | 1,139 |
| 2. Engineers, metal-workers | 373 | 568 | 231 | 274 | 1,446 |
| 3. Food, tobacco, &. | 145 | 204 | 194 | 90 | 633 |
| 4. Clothing, boots, &. | 105 | 205 | 142 | 113 | 565 |
| 5. Books, printing, &. | 94 | 92 | 96 | 44 | 326 |
| 6. Other manufacturing | 202 | 136 | 210 | 96 | 644 |
| 7. Building | 228 | 262 | 200 | 74 | 764 |
| 8. Mining, quarrying, &. | 69 | 106 | 187 | 68 | 430 |
| 9. Rail and tram services | 79 | 217 | 174 | 107 | 577 |
| 10. Other land transport | 196 | 224 | 221 | 92 | 733 |
| 11. Shipping, wharf labour, &. | 65 | 105 | 122 | 58 | 350 |
| 12. Pastoral, agriculture, &. | 521 | 1,176 | 475 | 395 | 2,567 |
| 13. Domestic, hotels, &. | 169 | 321 | 163 | 79 | 732 |
| 14. General labour, and miscellaneous | 932 | 1,488 | 996 | 676 | 4,092 |
| 15. Clerical | 294 | 509 | 299 | 205 | 1,307 |
| 16. Government | 347 | 747 | 268 | 384 | 1,746 |
| Totals | 4,131 | 6,751 | 4,214 | 2,955 | 18,051 |
In June, 1920, the number of men on the unemployment sustenance list for the whole of the Dominion was only five out of a total of 79,604 returned to date.
Unemployment sustenance (inclusive of pension) is paid on the following basis: Soldier, £2 2s. per week; wife, 10s. per week; children (not exceeding four), 3s. 6d. per week each. In addition, an allowance of 5s. per week is payable if warranted by circumstances. A widower with children is entitled to sustenance allowance as though his wife were living.
Transportation and Medical Fees.—The Department pays transportation of soldiers proceeding to employment, &., and medical fees of those examined for appointment to the Public Service.
It is necessary to provide training for—
Partially disabled soldiers who owing to war service are unable to resume their pre-war occupations:
Those who enlisted at a comparatively early age and who had not yet acquired a trade or calling:
Apprentices whose indentures had been interrupted by war service:
Soldiers’ widows.
The arrangements made and the financial assistance provided during tuition are set out hereunder.
Subsidized Workers.—Discharged soldiers desirous of learning new trades or occupations, and who can be best trained within the environment of the trade itself, are placed in the workshops or factories of private employers under the subsidized-wages scheme.
The employer undertakes to train the applicant in the particular trade or calling, and pays the trainee a wage as fixed by a wages committee consisting of a representative of the trade-union concerned, the employer, and a representative of the Repatriation Department. The difference between the employer's wage and £3 per week is made up by the Department, such subsidy being quite irrespective of any pension allowance which the trainee is receiving. The wage paid by the employer is reviewed quarterly by the wages committee, and any increase granted during the currency of the permit is paid to the trainee and does not affect the Government subsidy. A proportion of the subsidy payable (amounting to 5s. per week) is retained by the Department, and is paid to the trainee on the satisfactory completion of the training.
Under this scheme, which is greatly assisted by the co-operation of the various trade-unions, training and employment has been arranged for a total of 3,211 men, and at the present time 2,249 are actually being trainee in workshops and factories throughout the Dominion.
Special Soldier Classes and Technical Schools.—Vocational training in new trades is also arranged in the various technical schools, and special soldier classes have been formed in the main centres.
Sustenance to trainees: Sustenance is paid to technical trainees as follows:—
Attending special soldier classes thirty hours or more per week: Soldier £2 10s. per week; wife, 10s. per week; children (not exceeding four) 3s. 6d. per week each, plus pension.
Attending ordinary technical-school classes: As above, but inclusive of pension.
Training under this particular scheme has been arranged for 1,461 men to date, and there are 978 attending the classes at the present time.
University training: Fees, also grants for necessary text-books up to £5 5s., are paid by the Department in approved cases, and sustenance is paid on the same basis as that laid down for technical trainees.
Facilities have been arranged to offer encouragement to discharged soldiers to take up farming pursuits. The Ruakura Government Experimental Farm, near Hamilton, affords instruction in beekeeping, fruitgrowing, and poultry-raising. Fit men requiring training in specialized subjects are also accommodated at the Weraroa Training-farm at Levin.
Other institutions are the Moa Seed-farm (Otago), and the Avonhead (Auckland), Motuihi (Auckland), Wairarapa, and Tauherenikau (for tubercular men) Farms.
The sustenance allowance payable to trainees at the State Farms: Soldier, £2 10s. per week; wife, 10s. per week; children (not exceeding four), 3s. 6d. per week each, plus pension. £1 per week is deducted for the soldier's board and lodging.
The subsidized-wages scheme is also available.
At the present time seventy-two men are being trained under this scheme, and indications go to show that as the fit men are discharged larger numbers are likely to seek assistance in this direction in the future.
Accommodation is provided for discharged soldiers at the State forest plantations at Waireka (Rotorua), and Tapanui (Central Otago). Fifty-three are at present thus employed
Discharged soldiers whose apprenticeship has been broken by war service and who are compelled to resume work at a small wage are financially assisted in order that their income may be not less than £3 per week (plus 5s. if married), irrespective of pension if any.
Training facilities in useful occupations for soldiers’ widows without children, and sustenance whilst undergoing training at such rate as will bring their income, inclusive of pension, up to £1 15s. per week, may also be afforded.
The total number of men for whom training has been arranged to date under the various schemes is 5,661, and of this number 3,227 are still in training.
District Boards or Local Committees are empowered to grant financial assistance to discharged soldiers or soldiers’ widows on the following terms:—
Business Loans.—Loans not exceeding £300 to establish or purchase businesses may be made for a term of years with or without security; £50 is loaned free of interest, the remainder bearing interest at 5 per cent. per annum.
All loans exceeding £50 must be approved by the Ministerial Board, and up to the 20th June, 1920, a total of 3,864 loans have been ratified, entailing an expenditure of £878,927.
Furniture, Tools of Trade, Equipment, &c.—Loans not exceeding £50 (£75 in case of furniture, free of interest) may be made for the purchase of these items.
The number of applications approved under this heading to June, 1920, over 7,854, and of this number 7,005 are for the purchase of household furniture.
Assisted Passages.—Grants not exceeding £50 may be made to an incapacitated soldier or the widow of a deceased soldier in respect of passage-money beyond New Zealand. Only ninety-three have been approved to date.
The total amount advanced to or expended on behalf of soldiers from the inception of the Department to the 20th June, 1920, was £1,222,854.
| Loans. | £ |
|---|---|
| Business | 773,149 |
| Furniture | 270,237 |
| Tools, &c. | 15,861 |
| Grants. | £ |
| Training fees, sustenance, &c. | 155,023 |
| Unemployment sustenance | 4,918 |
| Transportation | 3,666 |
Of this total it will be noted that the bulk (86 per cent.) is by way of loan and is repayable by the soldier. Some £206,585 has already been repaid.
Administration expenses to the same date were £64,522.
Table of Contents
This Office is designed mainly to afford, at low rates of commission, a secure and convenient recourse in every case where a person residing either in New Zealand or abroad, and desiring to form a trust or appoint an agent or attorney in the Dominion, may be in doubt or difficulty as to the choice of a trustee, executor, agent, or attorney. The Office is also-designed to relieve those who may be appointed trustees of property in the Dominion, or who, after having accepted the trusts of such property, may, for various reasons, be unwilling or unable to undertake or continue the administration.
The Public Trust Office has been in operation since 1873. At the end of that year the number of estates administered by the Office was 257, of a total value of £17,500; by the 31st December, 1890, the number had risen to 1,678, of a value of £1,240,097; and at the 31st March, 1920, was 14,679, of a value of £14,330,980.
| Financial Year ended 31st March. | Number. | Value. |
|---|---|---|
* Not available. | ||
| £ | ||
| 1911 | 5,966 | 5,477,675 |
| 1912 | 6,456 | 5,951,231 |
| 1913 | 7,225 | 6,782,532 |
| 1914 | 7,538 | 7,288,447 |
| 1915 | 8,026 | 7,942,158 |
| 1916 | 8,734 | 8,217,500 |
| 1917 | * | * |
| 1918 | 14,187 | 10,835,085 |
| 1919 | 15,223 | 12,807,214 |
| 1920 | 14,679 | 14,330,980 |
The above table does not include the following classes of accounts and funds: Investment agencies; sinking funds; pension funds; Maori Land Board funds; funds under the Land Settlement Finance Act, 1909; Office funds; miscellaneous funds; miscellaneous Native accounts; Office premises, furniture, &c.
There were 109 registered building societies in operation during the financial year 1919-20. Of these, 73 were terminable societies and 36 were permanent.
The dates upon which these societies close their accounts vary considerably within the year, but the figures given below may be taken as approximately corresponding to the periods stated.
| Year. | To Shareholders (including Reserve Funds and Undivided Profits). | Deposits. | To Bankers and other Creditors. | Total Liabilities. |
|---|---|---|---|---|
| £ | £ | £ | £ | |
| 1915–16 | 2,290,473 | 674,512 | 126,160 | 3,091,145 |
| 1916–17 | 2,277,072 | 725,469 | 138,399 | 3,140,940 |
| 1917–18 | 2,290,924 | 717,188 | 181,092 | 3,189,204 |
| 1918–19 | 2,315,378 | 693,890 | 244,485 | 3,253,753 |
| 1919–20 | 2,441,510 | 803,683 | 309,435 | 3,554,628 |
| Year. | Advances on Mortgage. | Other Investments. | Cash in Hand and on Deposit. | Total Assets. |
|---|---|---|---|---|
| £ | £ | £ | £ | |
| 1915–16 | 2,893,956 | 87,577 | 109,612 | 3,091,145 |
| 1916–17 | 2,927,859 | 89,904 | 123,177 | 3,140,940 |
| 1917–18 | 2,971,119 | 100,103 | 117,982 | 3,189,204 |
| 1918–19 | 3,008,289 | 84,732 | 160,732 | 3,253,753 |
| 1919–20 | 3,286,393 | 113,058 | 155,177 | 3,554,628 |
During the year ended 31st December, 1919, 328 joint-stock companies were registered, with a total nominal capital of £5,942,605, including 248 private companies, with a nominal capital of £2,025,755.
The following table gives the total number of companies and the aggregate nominal capital registered during each of the five years 1915–19:—
| Year. | Number of Companies registered. | Aggregate Nominal Capital. |
|---|---|---|
| £ | ||
| 1915 | 304 | 4,431,830 |
| 1916 | 258 | 4,072,803 |
| 1917 | 261 | 3,367,201 |
| 1918 | 200 | 3,055,351 |
| 1919 | 328 | 5,942,605 |
The Registrar of Friendly Societies received returns for the year 1919 from 735 lodges, courts, tents, &c., having a membership at the end of the year of 70,598.
The total value of the assets of these societies was £2,184,653, of which the value of the sick and funeral benefit funds (including surplus) was £1,923,347.
The total membership and funds of the 735 lodges, courts, &c., and of the various orders at 31st December, 1919, were,—
| Name of Order. | Number of Members. | Total Worth of Funds. |
|---|---|---|
| £ | ||
| Independent Order of Odd Fellows, M.U. | 21,611 | 921,051 |
| Independent Order of Odd Fellows of New Zealand | 7,314 | 157,857 |
| National Independent Order of Odd Fellows | 377 | 5,273 |
| British United Order of Odd Fellows | 122 | 4,075 |
| Ancient Order of Foresters | 15,963 | 501,565 |
| Ancient Order of Shepherds | 48 | 1,316 |
| United Ancient Order of Druids | 16,226 | 344,350 |
| Independent Order of Rechabites | 3,788 | 109,862 |
| Sons and Daughters of Temperance | 595 | 26,070 |
| Hibernian Australasian Catholic Benefit Society | 3,197 | 49,239 |
| Protestant Alliance Friendly Society of Australasia | 830 | 28,098 |
| Eden Temperance Benefit Friendly Society | 30 | 2,957 |
| Fountain of Friendship Lodge, Auckland | 497 | 32,940 |
| Totals | 70,598 | 2,184,653 |
The next table shows the progress of the friendly societies of New Zealand during five years:—
| Year. | Number of Lodges tabulated. | Number of Members. | Total Funds. | Average Capital. | ||
|---|---|---|---|---|---|---|
| £ | £ | s. | d. | |||
| 1915 | 728 | 73,027 | 1,852,355 | 25 | 7 | 4 |
| 1916 | 727 | 70,360 | 1,954,940 | 27 | 15 | 8 |
| 1917 | 730 | 68,771 | 2,052,753 | 29 | 17 | 0 |
| 1918 | 731 | 67,527 | 2,100,443 | 31 | 2 | 1 |
| 1919 | 735 | 70,598 | 2,184,653 | 30 | 18 | 11 |
The value of the various funds and the way in which they are invested will be seen by reference to the following table. The funds include those of the central bodies.
| Funds. | Assets. | ||
|---|---|---|---|
| £ | £ | ||
| Sick and Funeral Funds | 1,923,347 | Investments at interest | 1,845,352 |
| Surplus Appropriation Funds, &c. | 95,468 | Value of land and buildings | 196,557 |
| Management Funds, goods, &c. | 107,999 | Cash not bearing interest | 94,844 |
| Value of goods | 12,989 | ||
| Widows’ and Orphans’ Funds | 17,775 | Other assets | 31,581 |
| Distress, Benevolent Funds, &c. | 40,064 | Owing by Management Fund | 3,330 |
| Total | 2,184,653 | Total | 2,184,653 |
The net income from investments credited to the Sick and Funeral Funds during the year 1919 was £95,027, the average rate of interest earned being £5 2s. 8d. per cent.
Particulars are given of the number of members, the amount of accumulated capital, and the average capital per member of the friendly societies in the States of Australasia arranged in order of membership. Figures are based on returns to the 31st December, 1918, except for New South Wales.
| State or Dominion. | Number of Lodges. | Number of Members. | Amount of Funds. | Capital per Member. | ||
|---|---|---|---|---|---|---|
| £ | £ | s. | d. | |||
| New South Wales | 1,884 | 178,857 | 2,113,754 | 11 | 16 | 4 |
| Victoria | 1,496 | 149,558 | 3,073,083 | 20 | 10 | 11 |
| New Zealand | 731 | 67,527 | 2,100,443 | 31 | 2 | 1 |
| South Australia | 509 | 67,047 | 1,377,149 | 20 | 10 | 10 |
| Queensland | 478 | 53,194 | 946,531 | 17 | 15 | 11 |
| Tasmania | 189 | 21,996 | 262,039 | 11 | 18 | 3 |
| Western Australia | 257 | 17,786 | 279,025 | 15 | 13 | 9 |
The outbreak of hostilities in August, 1914, caused considerable financial anxiety among the various friendly societies. In November, 1914, the Government undertook to subsidize the reinsurance of death benefits of soldier members on active service to the extent of paying one-half of the premiums. The sum of £11,867 was paid by the State under this system up to the 30th September, 1916.
From the 1st October, 1916, a Reinsurance Fund was established. The premium rate was ultimately 3 1/2 per cent., and the surplus profits were to be divided pro rata. A summary of operations to the 31st March, 1920, is—
| £ | £ | ||
|---|---|---|---|
| Premiums from societies | 31,497 | Death claims | 55,950 |
| Penalties, &c. | 368 | Expenses | 1,330 |
| State subsidy | 31,497 | Surplus | 6,082 |
| £63,362 | £63,362 |
For the purpose of dealing with the problem of after-discharge sickness of soldier members each society was required to establish a special “After-discharge Sickness Fund.” On the ascertainment of excess sickness in this way the Government provides half the amount of such excess.
A scheme for the extension of State benefits to members of friendly societies, on special terms, was embodied in the Finance Act, 1916 (Part IX).
Estimates of the private wealth of the Dominion are arrived at on the assumption that the wealth per head of the living is approximately equal to that left by the average person dying. The fact that the younger and more numerous members of the population do not possess as much accumulated wealth as the older members, taken in conjunction with the fact that the death-rate varies with age, renders it necessary for this purpose to divide the population into quinquennial age-groups. The average wealth of persons dying within any one age-group being known, the average wealth of living persons belonging to that age-group is assumed to be identical, and an estimate of the total private wealth of the Dominion is arrived at by weighting the average wealth of persons in each age-group by the number of persons in that group.
The actual average wealth of deceased persons is obtained by a consideration of the estates certified for stamp duty. For each person whose estate is dealt with by the Stamp Duties Department a return is forwarded to the Census and Statistics Office showing name, date of death, amount of estate certified, and age. The few instances where the ages of deceased persons are not ascertainable are allocated to each age-group in proportion to its contribution to the total.
If the period under review be short, the infrequency of the appearance of large estates may occasion from time to time large discrepancies in the results according as many or few large estates appear in the returns. Matters are further complicated by the fact that from six to twelve months usually elapse from the date of death before the estate is finally certified, with the result that an abnormal number of deaths towards the end of any one year may swell the number of deaths for the year without affecting the number of estates certified, thus bringing about a fictitiously low average wealth of deceased persons for that year and a fictitiously high average wealth for the following year. The epidemic of influenza in the last quarter of 1918 produced just this effect. For these reasons it is desirable to extend the estimate over a series of years and strike an average. In former issues of the Year-book an average extending over ten years was taken, but with the rapid increase of values during the past five years so long a period yields an artificial estimate, and in this issue an average is taken over the years 1917–19. It should be noted that the estimate of private wealth therefrom relates to a period of time lying about the middle of 1918.
It has been found that the number of estates dealt with in any period is usually equal to about one-third only of the total deaths registered during that period; and as most persons leave some estate, however small, it is necessary to make some allowance for estimates which have not passed through the Stamp Duties Office. It should be noted in this connection that. estates below £200 in value are exempt from stamp and succession duty, though in many cases estates of a lower value than £200 are passed for probate or letters of administration. The method formerly adopted of making a proportionate allowance of 10 per cent. for all unrecorded estates involved a slight weakness, in that it gave too low an amount for persons dying at early ages and too high an amount for persons dying at advanced ages, so that while these factors balanced each other and did not affect very appreciably the total result it has been deemed better, in order to ensure closer accuracy, to make a fixed allowance increasing from £20 for the age-group 15 to 20 years to £100 at ages 35 to 40 and over. No allowance at all is made for estates of persons under 15.
From the following table it will be seen that the estimated private wealth of the Dominion in 1918 was £527.464.015.
| Age, in Years. | Number of Estates certified (1917–19). | Total Amount. including Allowance for Unrecorded Estates. | Number of Deaths registered (1917–19). | Average Wealth per Person dying. | Mean Population 1918. | Estimated Private Wealth, 1918. |
|---|---|---|---|---|---|---|
| £ | £ | £ | ||||
| Under 5 | 5,370 | 135,812 | ||||
| 5 and under 10 | 3 | 1,564 | 838 | 1.8663 | 126,302 | 235,717 |
| 10 and under 15 | 1 | 140 | 544 | 0.2574 | 112,324 | 28,912 |
| 15 and under 20 | 24 | 33,273 | 891 | 37.3434 | 93,588 | 3,494,894 |
| 20 and under 25 | 767 | 489,075 | 1,254 | 390.0120 | 74,889 | 29,207,609 |
| 25 and under 30 | 1,160 | 970,451 | 1,936 | 501.2660 | 85,849 | 43,033,185 |
| 30 and under 35 | 1,175 | 1,536,677 | 2,231 | 688.7839 | 90,239 | 62,155,170 |
| 35 and under 40 | 1,019 | 1,595,813 | 2,279 | 700.2251 | 87,265 | 61,105,143 |
| 40 and under 45 | 746 | 1,476,901 | 1,879 | 786.0037 | 68,195 | 53,601,522 |
| 45 and under 50 | 665 | 1,499,524 | 1,871 | 801.4559 | 62,457 | 50,056,531 |
| 50 and under 55 | 753 | 1,845,665 | 1,866 | 989.1024 | 46,386 | 45,880,504 |
| 55 and under 60 | 789 | 2,456,682 | 1,822 | 1,348.3436 | 35,310 | 47,610,013 |
| 60 and under 65 | 918 | 3,131,168 | 2,225 | 1,407.2665 | 29,501 | 41,515,769 |
| 65 and under 70 | 1,074 | 3,792,229 | 2,503 | 1,515.0735 | 21,385 | 32,399,847 |
| 70 and under 75 | 1,194 | 4,696,473 | 2,755 | 1,704.7089 | 15,602 | 26,596,868 |
| 75 and under 80 | 1,320 | 6,133,398 | 3,189 | 1.923.2982 | 10,845 | 20,858,169 |
| 80 and under 85 | 918 | 3,605,840 | 2,484 | 1,451.6264 | 5,015 | 7,279,906 |
| 85 and under 90 | 403 | 1,587,162 | 1,328 | 1,199.6689 | 1,677 | 2,011,845 |
| 90 and under 95 | 102 | 382,839 | 348 | 1,100.1121 | 309 | 339,935 |
| 95 and over | 31 | 67,053 | 92 | 728.8369 | 72 | 52,476 |
| Totals | 13,062 | 35,301,927 | 37,700 | 936.3906 | 1,103,022 | 527,464,015 |
A point that should be borne in mind in regard to the figures given above is that no distinction is made between the wealth of males and that of females. As it is generally understood that the average for males is higher than that for females, and as of the estates passed for probate in 1919 those of males represented nearly three-fourths of the number and more than four-fifths of the total value, it would appear that greater accuracy would be obtained by treating the estates of the two sexes separately, making a fixed allowance for unrecorded estates ranging from £30 for males and £10 for females for the age-group 15 to 20 years to £150 for males and £50 for females at ages 35 to 40 and over. This has been done, and a discrepancy emerges as follows:—
| £ | |
|---|---|
| (1) Sexes taken separately:— | |
| Male | 384,533,161 |
| Females | 83,155,657 |
| Total | 467,688,818 |
| (2.) Sexes taken together | 527,464,015 |
| Difference | £59,775,197 |
Estates of Maoris are excluded from the above calculation.
A table is now given showing the number of estates generally passed during 1918 and 1919, classified according to amount. In this table estates of Maoris are included.
| Amount. | Number of Estates. | Aggregate Net Value of Estates. | ||
|---|---|---|---|---|
| 1918. | 1919. | 1918. | 1919 | |
| £ | £ | £ | £ | |
| Under 500 | 1,732 | 2,202 | 438,785 | 531,089 |
| 500 and under 1,000 | 1,001 | 1,176 | 671,878 | 828,180 |
| 1,000 and under 2,000 | 624 | 783 | 883,385 | 1,100,224 |
| 2,000 and under 3,000 | 314 | 340 | 716,774 | 836,591 |
| 3,000 and under 4,000 | 139 | 183 | 496,787 | 629,900 |
| 4,000 and under 5,000 | 105 | 118 | 500,438 | 529,884 |
| 5,000 and under 7,500 | 138 | 159 | 914,875 | 966,801 |
| 7,500 and under 10,000 | 93 | 69 | 769,074 | 584,697 |
| 10,000 and under 15,000 | 78 | 88 | 953,845 | 1,057,209 |
| 15,000 and under 20,000 | 34 | 41 | 599,193 | 908,838 |
| 20,000 and over | 89 | 88 | 4,327,341 | 5,115,361 |
| Totals | 4,347 | 5,247 | 11,272,375 | 12,888,774 |
The present Act dealing with these subjects was passed in 1911 and came into force on the 1st July, 1912. An amending Act passed in 1914 enables the Governor-General in Council to order the avoidance or suspension of patents or trade-marks of subjects of a State at war with His Majesty.
There were 1,880 applications for letters patent during 1919; 995 were left with provisional specifications, and 885 with complete specifications; while 277 complete specifications were lodged in respect of applications with which provisional specifications had been previously filed.
The total number of applications received up to the 31st December, 1919, was 42,917, and the patents in force in New Zealand at that date numbered 4,623. The number of patent agents on the register was 22.
In the next table are shown the principal countries, residents of which applied for patents in New Zealand during the year 1919. Owing to applications being received from joint applicants resident in different countries, also from applicants giving two addresses, the figures total more than the actual number of applications received.
| Applications for Patents in New Zealand, 1919. | |
|---|---|
| Country. | Number. |
| New Zealand | 1,104 |
| Australia | 243 |
| Great Britain | 276 |
| United States of America | 200 |
| Canada | 11 |
| Sweden | 19 |
| Holland | 10 |
| Denmark | 9 |
The total number of applications during 1919 in respect of trade-marks was 1,272, and the fees received totalled £1,926. The number of trade-marks on the register at the end of the year was 10,903.
Of the 1,272 applications, 286 were made by residents of New Zealand, 445 came from Great Britain, 344 from the United States, and 136 from New South Wales and Victoria.
Seventy-three applications for registration of designs were received, and registration effected in 64 cases.
For this issue of the Official Year-Book a special article on the Climate-and Meteorology of New Zealand was prepared by Lieut. Colonel D. C. Bates, Dominion Meteorologist. The reduction in size of the 1920 Year-Book has, however, necessitated its being held over. A limited number of copies have been issued in pamphlet form.
A comparative table of meteorology for 1919 follows:—
| Stations. | Temperature in Shade. | Rainfall. | Mean Height of Barometer. | Prevailing Winds. | |||||
|---|---|---|---|---|---|---|---|---|---|
| Highest, and Date. | Lowest, and Date. | Mean Max. Temp. for Year. | Mean Min. Temp. for Year. | Mean Temp. for Year. | Days on which Rain fell. | Total Fall. | |||
*Incomplete. | |||||||||
| °F. | °F. | °F. | °F. | °F. | No. | Inches. | Inches. | ||
| Auckland | 81.0 Feb. 11 & 12 | 38.5 Sept. 8 | 63.8 | 50.8 | 57.3 | 174 | 33.55 | 30.001 | SW, W. |
| Greenmeadows (Napier) | 88.0 Jan. 22 | 29.5 July 17 | 65.6 | 47.2 | 56.4 | 58 | 22.60 | 29.973 | NW, W. |
| Palmerston N. | 80.0 Dec. 30 | 24.0 June 3 | 61.7 | 44.6 | 53.1 | 116 | 22.32 | W, E. | |
| New Plymouth | 80.0 Feb. 23 | 31.0 May 26 & 27 | 64.1 | 49.4 | 56.7 | 178 | 47.03 | SW, S. | |
| Wellington | 81.1 Feb. 24 | 29.9 June 1 | 60.5 | 48.7 | 54.6 | 136 | 28.51 | 29.967 | NW, NS. |
| Nelson | 83.5 Feb. 18 | 22.0 July 17 | 63.6 | * | * | 96 | 20.58 | SW, NE SE. | |
| Hokitika | 73.0 Dec. 31 | 26.5 June 27 | 57.5 | 44.0 | 50.7 | 205 | 99.53 | 29.984 | SW, E. |
| Christchurch | 82.7 Jan. 23 | 23.3 Sept. 2 | 60.9 | 43.4 | 52.1 | 110 | 21.70 | 29.902 | NE, SW. |
| Lincoln | 88.8 Feb. 18 | 21.8 Sept. 2 | 63.2 | 41.6 | 52.4 | 110 | 23.54 | 29.912 | NE, SW |
| Waimate | 89.0 Feb. 18 | 24.0 June 28 | 59.7 | 41.2 | 50.4 | 115 | 30.12 | NE, SW. | |
| Dunedin | 84.0 Feb. 17 & 20 | 29.0 Sept. 1 | 58.3 | 43.0 | 50.6 | 175 | 42.90 | 29.890 | SW, NE |
| Invercargill | 82.0 Feb. 21 | 19.0 July 31 | 57.6 | 40.6 | 49.1 | 230 | 53.73 | SW, E. | |
Table of Contents
MOST of the statistical information given elsewhere in this book relates only to the three principal islands of the Dominion, with their adjacent islands and islets. There are, however, a number of outlying islands included within the boundaries of the Dominion, and brief descriptions of these are now given.
The outlying group of the CHATHAM ISLANDS, lying between the parallels of 43° 30’ and 44° 30’ south latitude, and the meridians of 175° 40’ and 177° 15’ west longitude, 480 statute miles east-south-east from Wellington and 536 miles eastward of Lyttelton, consists of two principal islands and several unimportant islets. They were discovered by Lieutenant Broughton and named by him in honour of the Earl of Chatham. The largest island (Chatham Island) contains about 222,490 acres, of which an irregularly shaped lake or lagoon absorbs 45,960 acres. About one-quarter of the surface of the land is covered with forest, the rest with fern or grass. The hills nowhere rise to a great height. Pitt Island is the next in size; the area is 15,330 acres. The greater portion of both islands is used for grazing sheep, the only other industry carried on to any extent being fishing. The islands are connected with the mainland by wireless telegraph, and there is also steamship communication at fairly regular intervals. The population at the census of 1916 consisted of 219 Europeans and 258 Maoris.
The KERMADEC GROUP of islands is situated between 29° 10’ and 31° 30’ south latitude, and between 177° 45’ and 179° west longitude. They are named the Raoul or Sunday Island, Macaulay Island, Curtis Islands, and L'Espérance or French Rock. The principal island, Sunday, is 600 miles distant from Auckland, and lies a little more than half-way to Tonga, but 100 miles to the eastward of the direct steam route to that place. It is 300 miles eastward of the steam route to Fiji, and 150 miles westward of the steam route from Auckland to Rarotonga. Macaulay Island (named after the father of Lord Macaulay) and Curtis Islands were discovered in May, 1788, by Lieutenant Watts, in the “Penrhyn,” a transport ship. The remainder of the group was discovered in 1793 by Admiral Bruni d'Entrecasteaux. The Admiral gave the name of “Kermadec” to the whole group of islands, after the captain of his consort ship “L'Espérance,” and the name of the Admiral's ship, “La Recherché,” was given to the largest island. The name so given was not continued, but that of “Raoul” has taken its place, which would appear to have been given after the sailing-master of the “La Recherché,” whose name was Joseph Raoul. The name of “Sunday ” may have become attached to the island from the fact that it was discovered on a Sunday. The islands are volcanic, and in two of them signs of activity are still to be seen. The rainfall is plentiful, but not excessive. The climate is mild and equable, and slightly warmer than the north of New Zealand. The following are the areas of the islands and islets of the group: Sunday Island, 7,200 acres; Herald group of islets, 85 acres; Macaulay Island, 764 acres; Curtis Islands, 128 acres and 19 acres; L'Espérance, 12 acres: total, 8,208 acres. Sunday Island is twenty miles in circumference, roughly triangular in shape, and at the highest point 1,723 ft. above the sea-level. It is rugged and broken over a very large extent of its surface, and, except in a few places, covered with forest. The soil everywhere on the island is very rich, being formed by the decomposition of a dark-coloured pumiceous tuff and a black ande-sitic lava, with which is closely mixed a fine vegetable mould. The great luxuriance and richness of the vegetation bear witness to the excellence of the soil, which is everywhere—except where destroyed by eruptions, and on the steep cliffs—the same rich loam. Want of water is one of the drawbacks. Three of the four lakes on the island are fresh, but so difficult of approach as to be practically useless. Various attempts at settlement have been made from time to time, but the islands are now uninhabited.
The AUCKLAND ISLANDS were discovered on 18th August, 1806, by Captain Abraham Bristow, in the ship “Ocean.” The discoverer named the group after Lord Auckland, again visited the islands in 1807, and then took formal possession of them. They lie about 290 miles south of Bluff Harbour, their accepted position being given as latitude 50° 32’ south, and longitude 166° 13’ east. They have several good harbours. Port Ross, at the northern end of the principal island, was described by the eminent French commander D'Urville as one of the best harbours of refuge in the known world. At the southern end of the island there is a through passage extending from the east to the west coast. It has been variously named Adams Strait and Carnley Harbour, and forms a splendid sheet of water. The largest of the islands is about 27 miles long by about 15 miles broad, and is very mountainous, the highest part being about 2,000 ft. above the sea. The New Zealand Government maintains at this island a depot of provisions and clothing for the use of shipwrecked mariners.
The ANTIPODES, an isolated group, consisting of several detached rocky islands lying nearly north and south over a space of four to five miles; accepted position, 49° 41’ 15’ south, and longitude 178° 43’ east.
The BOUNTY ISLANDS, a little cluster of islets, thirteen in number and without verdure, discovered in 1788 by Captain Bligh, R.N., of H.M.S. “BOUNTY.” Position verified by observation, 47° 43’ south, longitude 179° 0 1/2’ east.
CAMPBELL ISLAND was discovered in 1810 by Frederick Hazelburgh, master of the brig “Perseverance,” owned by Mr. Robert Campbell, of Sydney. It is mountainous, and of a circumference of about thirty miles. There are several good harbours. The island maintains two or three inhabitants.
The COOK ISLANDS, with others now included within the extended boundaries of the Dominion, are as under:—
RAROTONGA : A magnificent island, rising to a height of 3,000 ft., clothed to the tops of the mountains with splendid vegetation. It has abundant streams, considerable tracts of sloping land, and rich alluvial valleys. The two harbours are poor.
MANGAIA, the south-easternmost of the Cook Group, is of volcanic origin and about thirty miles in circumference. The productions, which are numerous and cheap, are obtained by assiduous labour.
ATIU resembles Mangaia in appearance and extent. It is a mere bank of coral 10 ft. or 12 ft. high, steep and rugged, except where there are small sandy beaches and some clefts, where the ascent is gradual.
AITUTAKI presents a most fruitful appearance, its shores being bordered by flat land on which are innumerable coconut and other trees, the higher ground being beautifully interspersed with lawns. It is eighteen miles in circuit.
MAUKE or Parry Island is a low-lying island; it is about two miles in diameter, well wooded, and inhabited.
MITIARO is a low-lying island, from three to four miles long and one mile wide.
HERVEY ISLANDS : This group consists of two islands surrounded by a reef which is about 10 1/2 miles in circumference.
NIUE, or Savage Island, lying east of the Friendly Islands, is a coral island, thirty-six miles in circumference, rising to a height of 200 ft. It has the usual tropical productions.
PALMERSTON ISLAND, lying about 500 miles east of Niue and about 220 from the nearest island of the Cook Group (Aitutaki), is remarkable as the “San Pablo” of Magellan, the first island discovered in the South Sea. It has no harbour. The soil is fairly fertile, and there is some good hardwood timber.
MANAHIKI, lying about 400 miles eastward of Danger Island, is an atoll, about thirty miles in circumference, valuable from the extent of the coconut groves. The interior lagoon contains a vast deposit of pearl-shell.
PENRHYN ISLAND (Tongareva) lies about 300 miles north-east of Manahiki. It is one of the most famous pearl-islands in the Pacific, and there is a splendid harbour, a lagoon with two entrances, fit for ships of any size.
RAKAANGA is an atoll, three miles in length and of equal breadth.
DANGER ISLAND (Pukapuka): Next to the 10th parallel, but rather north of the latitude of the Navigators, and east of them are a number of small atolls. Of these, the nearest to the Samoan Group—about 500 miles—is Danger Island, bearing north-west of SUWARROW about 250 miles.
SUWARROW ISLAND has one of the best harbours in the Pacific. It lies about 500 miles east of Apia, the capital of German Samoa (now in British possession). It is a coral atoll, of a triangular form, fifty miles in circumference, the reef having an average width of half a mile across, enclosing a land-locked lagoon twelve miles by eight, which forms an excellent harbour. The entrance is half a mile wide, and the accommodation permits of ships riding in safety in all weathers, with depths of from three to thirty fathoms. It is out of the track of hurricanes, and supports a scant half-dozen inhabitants, but is capable by its fertility of supporting a larger population. As a depot for the collection of trade from the various islands it should in time be very valuable.
The Pacific islands annexed to New Zealand in pursuance of resolutions passed by the House of Representatives in September and October, 1900, were Rarotonga, Mangaia, Mauke, Atiu, Aitutaki, Mitiaro, Hervey Islands, Palmerston, Niue, Danger, Rakaanga, Manahiki, Penrhyn, and Suwarrow (see above); Takutea and Nassau, not mentioned in the resolutions, also lie within the boundary-lines prescribed by the Imperial Order in Council and the New Zealand Proclamation dealing with the annexation.
The Constitution and laws of the Cook Islands and Niue have been remodelled by the Cook Islands Act of 1915.
Island Councils were continued or established consisting either wholly or partly of ex officio, elected, or nominated members. Generally, European officials and Arikis or Native chiefs are Councillors ex officio, and nominated members hold office during the pleasure of the Governor-General or for a fixed period not exceeding five years. Women are eligible both as members and as electors of Island Councils.
Each Council is empowered to make laws for the good government of the island, with the proviso that such laws must not be repugnant to Acts of the New Zealand Parliament or regulations made thereunder. The maximum penalties imposed by the Ordinance of an Island Council must not exceed three months’ imprisonment or a fine of £50. The Council has no power to deal with Customs duties, to borrow money, to establish Courts of justice, or to appropriate expenditure of revenue other than that raised under authority of their Ordinance. No Ordinance has effect until it has received the assent of the Resident Commissioner or the Governor-General. The Governor-General may, by notice in the Gazette, disallow any Ordinance within one year after the Commissioner has given his assent.
Laws are enforced through the High Court, which has all jurisdiction, civil or criminal, necessary for the administration of justice. Judges and Commissioners of the High Court are appointed by the Governor-General; the Chief Judge to reside at Rarotonga, a second at Niue. A Commissioner may, with some exceptions, exercise the full powers and functions of a Judge, but rules of Court may allow appeal from his decision to that of a Judge.
A judgment obtained in a civil proceeding in the High Court may be enforced in the Supreme Court of New Zealand. From any decision in the former Court an appeal lies to the Supreme Court in the Dominion.
The manufacture or importation of intoxicating liquor is prohibited absolutely, except that the Resident Commissioner may import liquor for sale or for public purposes. Liquor imported through the Commissioner must not find its way into the hands of a Native. Attempts are made by the Natives to evade the law by illicitly manufacturing “bush-beer,” an offence which the Administration is endeavouring to check.
At the census of 1916 the population of the Cook and other islands annexed in 1901 was found to be 12,797. Fuller information is given in the portion of this book dealing with “Population.” A system of compulsory registration of births, deaths, and marriages is now in force in the islands (see “Vital Statistics” section), and records of arrivals and departures are kept.
The educational requirements of the islands up to recent years have been largely met by missionary effort. The London Missionary Society has a number of village schools in the various islands, while the Roman Catholic Mission and the Seventh-day Adventists also maintain schools, though to a less extent.
The education provided in this manner is necessarily inadequate, and a system has been inaugurated by which schools have been established on the lines of the Native schools in New Zealand.
In Niue the Tufukia School has been established for some time, and a new school at Hakupu has just been built. At this institution the New Zealand syllabus has been adopted with gratifying results. Special interest is shown in the technical branch, and additional technical classes are given after school hours. The leading pupils are being trained with a view to taking charge of village schools which it is hoped may soon be established in other districts of Niue.
Regulations which came into force on the 1st January, 1917, make it compulsory for all children between seven and fourteen years of age to attend school if living within three miles of a public school.
In 1916, when education in the Cook Islands was placed under the control of the Minister, there were three schools in the Group, two being in Rarotonga and one at Aitutaki. These had an attendance of 450 pupils, under nine teachers. Since 1916 two new primary schools have been opened in Rarotonga—viz., Avarua and Titikaveka—one at Palmerston Island, one at Mauke, one at Mangaia, and one at Aitutaki. New schools at Atiu and Ngatangiia are in course of erection. These primary schools have more than a thousand scholars being taught by twenty-six teachers.
A technical school, also created since 1916, has been established at Avarua, with classes in agriculture, drawing, and woodwork, and an advanced class in carpentry. In most of the schools classes for simple cookery and for mat and basket weaving are held.
Three scholarships for annual competition, tenable for two years at St. Stephen's College, Auckland, and created by the Administration, were allotted this year.
Four advanced pupils are chosen each year from the Technical School and sent to Wellington to be apprenticed to trades. They are under a bond to return to Rarotonga on the completion of their apprenticeship. By this method the Administration intends to secure the necessary supply of skilled Native artisans required for the Group.
Cook and Northern Islands.—For the financial year ended the 31st March, 1920, the revenue of the Cook Islands, not including the balance from the previous year, was £22,880, and the expenditure £17,060. There is now a credit balance of £5,200. The following is a comparative statement of revenue and expenditure for the past ten years:—
| Year. | Revenue. | Expenditure. |
|---|---|---|
| £ | £ | |
| 1910–11 | 8,267 | 8,047 |
| 1911–12 | 8,924 | 9,430 |
| 1912–13 | 9,420 | 11,508 |
| 1913–14 | 11,723 | 10,194 |
| 1914–15 | 10,118 | 10,617 |
| 1915–16 | 7,673 | 9,081 |
| 1916–17 | 9,710 | 8,586 |
| 1917–18 | 11,068 | 12,615 |
| 1918–19 | 13,846 | 12,343 |
| 1919-20 | 22,881 | 17,061 |
The principal items in the revenue for 1919-20 were: Customs duties (Rarotonga and New Zealand), £11,290; export duties, £2,492; postage-stamps, £4,672; and fees and fines, High Court, £755.
Niue.—The revenue of Niue for the year ended the 31st March, 1920 (excluding balance from previous year), was £6,563. The expenditure amounted to £3,662. The total funds to the credit of the Niue Government on the 31st March amounted to £4,241.
Cook and Northern Islands.—The value of exports for the year 1919 was £127,729, while the imports amounted to £142,925. The principal items exported were as follows:—
| £ | |
|---|---|
| Bananas, 31,494 cases | 18,300 |
| Coconuts, 2,780 sacks | 1,490 |
| Coffee, 20 tons | 1,400 |
| Copra, 2,145 tons | 45,235 |
| Oranges, 70,087 cases | 36,030 |
| Pearl-shell, 162 tons | 14,480 |
| Pineapples, 1,057 cases | 580 |
The fruit trade is greatly retarded by lack of a good steamer service to New Zealand.
Trade with the United States is gaining rapidly in importance. The following shows the countries to which the exports were sent:—
| 1916. | 1917. | 1918. | 1019. | |
|---|---|---|---|---|
| £ | £ | £ | £ | |
| New Zealand | 38,647 | 40,401 | 42,919 | 68,014 |
| United States | 17,621 | 17,146 | 34,344 | 50,665 |
| Tahiti | 1,920 | 2,643 | 5,445 | |
| United Kingdom | 9,958 | 9,050 | ||
| £68,146 | £60,190 | £82,708 | £127,729 |
The principal importing countries are as follows:—
| 1016. | 1917. | 1918. | 1919. | |
|---|---|---|---|---|
| Imports from | £ | £ | £ | £ |
| New Zealand | 43,557 | 61,931 | 70,773 | 91,973 |
| Australia | 914 | 1,714 | 1,682 | 3,005 |
| United Kingdom | 3,787 | 3,748 | 8,474 | 15,500 |
| United States | 8,241 | 11,092 | 15,324 | 27,605 |
| Tahiti | 1,569 | 1,110 | 2,504 | 3,808 |
| Other countries | 410 | 466 | 875 | 1,034 |
| Totals | £58,478 | £80,061 | £99,632 | £142,925 |
Niue.—The exports for 1919 amounted to £35,977, and the imports to £21,783. The principal items of export were,—
| £ | |
|---|---|
| Copra, 1,110 tons | 31,029 |
| Hats, 4,269 dozen | 3,367 |
Of the total imports, New Zealand contributed goods to the value of £20,268. Two-thirds of the exports went to New Zealand, and the bulk of the remainder to the United States of America.
By virtue of the acceptance of the mandate from the League of Nations to administer the government of Western Samoa, these islands have now become for many purposes part of the territories of the Dominion of New Zealand.
The Chief Executive Officer is an Administrator, who is stationed at Apia.
Colonel R. W. Tate, C.B.E., has been appointed to this position. Ministerial responsibility for the government is centred in the Minister of External Affairs. Laws are based on those of New Zealand, with the necessary modifications.
Western Samoa includes all islands lying between the 13th and 15th degrees of south latitude and the 171st and 173rd degrees of longitude west of Greenwich.
The principal islands are Savaii and Upolu. Savaii is the largest of the two, with a length of 48 miles, a breadth of 25 miles, and a total area of 660 square miles. The island is mountainous, rising to a height of over 4,000 ft. Upolu, which extends some 45 miles in length and 13 in breadth, measures nearly 600 square miles in area. Of the two, Upolu is the more fertile and populous, and contains the port and capital of Apia. Rainfall is plentiful throughout the Group.
The following particulars have been extracted from the Statesman's Yearbook, 1920: At the census of 1917 the population (excluding the Force in occupation) numbered 41,128, some 1,668 of which were of European descent. Of the Europeans 660 were described as British, 530 as Germans, 236 as Americans, and 42 as Swedes. The influenza epidemic which swept Samoa in common with other countries during 1918–19 caused the loss of over 8,000 lives.
Most of the Natives profess the Christian religion, Protestant, Catholic, or Mormon. Education is chiefly in the hands of the mission schools, which have over 8,000 pupils. The two Government schools accommodate about 800 pupils.
Roads, which are fairly good, extend over sixty miles.
For the financial year ended the 31st March, 1917, the revenue of Western Samoa was £98,937, and the expenditure £89,801.
Imports (exclusive of supplies for troops) were £319,521 in 1918, and exports £306,640.
Communication with the outer world is available through the high-powered wireless station at Apia. Apia is connected with New Zealand by a regular steam service.
Barely one-third of a degree south of the Equator, and lying some 166-55 degrees east of Greenwich, is the little phosphate island known as Nauru, or Pleasant Island. Prior to the world-wide conflagration of 1914–19 this rich though little-known island was a German possession. A mandate for the administration of the island was conferred by the Allied and Associated Powers upon the British Empire, to come into operation at the same date as the Treaty of Peace with Germany. The mandate is held jointly by the Imperial Government, the Government of Australia, and the New Zealand Government.
An agreement between the three parties to the mandate was drawn up and completed on the 2nd July, 1919. The administrative control of the island is vested in an Administrator, whose term of appointment is five years. The first Administrator is to be appointed by Australia. A Board of Commissioners comprising three members, one appointed by each Government, is established, and will have full control of the working and sale of the deposits and their products.
The yearly production of phosphates is to be allocated between the three Governments in the following proportions: United Kingdom, 42 per cent.; Australia, 42 per cent.; New Zealand, 16 per cent. This scale is subject to revision every five years. Any portion of its share not required by any Government may be disposed of either to the other Governments pro rata, or, if they do not require it, to others.
The value of Nauru lies almost wholly in the enormous quantity of phosphate it contains. Possession of from 80,000,000 tons to 100,000,000 tons of highest-grade (85 to 86 per cent.) phosphate makes Nauru the richest and best of the known phosphate islands of the world. The yearly output is approximately 150,000 tons.
Nauru, which is encircled by a road 10 miles long, has an area of only 5,000 to 6,000 acres. The island is surrounded by a wide reef. Near the coast is a belt of flat land covered with coconut-trees, of an area of about 1,400 acres. Behind this rises higher land covering some 4,250 acres, and enclosing a lagoon of almost fresh water. This higher country consists of a mass of phosphate of great richness.
There are some 1,200 Native inhabitants, who speak a language akin to that of the Gilbert-Islanders. Most of the workmen employed are Caroline-Islanders and Chinese. Nauru possesses a wireless station.
Table of Contents
| Year. | Population (exclusive of Maoris and for Annexed Pacific Islands) on 31st December. | Births. | Deaths. | Marriages. | ||
|---|---|---|---|---|---|---|
| Males. | Females. | Totals. | ||||
| 1855 | 20,781 | 16,411 | 37,192 | 1,460 | 470 | 406 |
| 1860 | 45,394 | 34,317 | 79,711 | 3,146 | 1,092 | 690 |
| 1865 | 117,376 | 73,231 | 190,607 | 7,490 | 2,757 | 1,908 |
| 1870 | 145,732 | 102,668 | 248,400 | 10,277 | 2,703 | 1,851 |
| 1875 | 213,294 | 162,562 | 375,856 | 14,438 | 5,712 | 3,209 |
| 1880 | 268,364 | 216,500 | 484,864 | 19,341 | 5,437 | 3,181 |
| 1885 | 312,125 | 263,101 | 575,226 | 19,693 | 6,081 | 3,813 |
| 1890 | 332,557 | 292,951 | 625,508 | 18,278 | 5,994 | 3,797 |
| 1895 | 369,725 | 328,981 | 698,706 | 18,546 | 6,863 | 4,110 |
| 1900 | 403,628 | 364,650 | 768,278 | 19,546 | 7,200 | 5,860 |
| 1905 | 467,366 | 415,096 | 882,462 | 23,682 | 8,061 | 7,200 |
| 1910 | 529,928 | 472,751 | 1,002,679 | 25,984 | 9,639 | 8,236 |
| 1911 | 539,729 | 485,677 | 1,025,406 | 26,354 | 9,534 | 8,825 |
| 1912 | 553,212 | 499,415 | 1,052,627 | 27,508 | 9,214 | 9,149 |
| 1913 | 569,109 | 515,553 | 1,084,662 | 27,935 | 10,119 | 8,813 |
| 1914 | 568,161 | 527,833 | 1,095,994 | 28,338 | 10,148 | 9,280 |
| 1915 | 563,963 | 538,831 | 1,102,794 | 27,850 | 9,965 | 10,028 |
| 1916 | 549,895 | 550,668 | 1,100,563 | 28,509 | 10,596 | 8,213 |
| 1917 | 537,360 | 560,312 | 1,097,672 | 28,239 | 10,528 | 6,417 |
| 1918 | 542,046 | 566,327 | 1,108,373 | 25,860 | 16,364 | 6,227 |
| 1919 | 588,888 | 575,517 | 1,164,405 | 24,483 | 10,808 | 9,519 |
| Year. | Occupied and Cultivated Holdings over One Acre in Extent. | Land (including Sown Grasses) under Cultivation. | Live-stock. | Coal-mines, Output from. | |||
|---|---|---|---|---|---|---|---|
| Horses. | Horned Cattle. | Sheep. | Pigs. | ||||
* Prior to 1878, 709,031. | |||||||
| Number. | Acres. | Tons. | |||||
| 1871 | 10,211 | 1,140,279 | 81,028 | 436,592 | 9,700,629 | 151,460 | * |
| 1874 | 15,883 | 1,651,712 | 99,859 | 494,917 | 11,704,853 | 123,921 | * |
| 1878 | 20,519 | 3,523,277 | 137,768 | 578,430 | 13,069,338 | 207,337 | 162,218 |
| 1881 | 24,147 | 4,768,192 | 161,736 | 698,637 | 12,190,215 | 200,083 | 337,262 |
| 1886 | 31,763 | 6,668,920 | 187,382 | 853,358 | 15,174,263 | 277,901 | 534,353 |
| 1891 | 38,083 | 8,462,495 | 211,040 | 788,919 | 16,753,752 | 222,553 | 668,794 |
| 1896 | 10,698,869 | 237,418 | 1,047,901 | 19,138,493 | 239,778 | 792,851 | |
| 1901 | 62,786 | 12,636,035 | 266,245 | 1,256,680 | 20,233,099 | 250,975 | 1,227,638 |
| 1906 | 69,942 | 14,114,925 | 326,537 | 1,810,936 | 20,108,471 | 249,727 | 1,729,536 |
| 1911 | 73,876 | 16,154,218 | 404,284 | 2,020,171 | 23,996,126 | 348,754 | 2,066,073 |
| 1912 | 23,750,153 | 2,177,615 | |||||
| 1913 | 24,191,810 | 1,888,005 | |||||
| 1914 | 24,798,763 | 2,275,593 | |||||
| 1915 | 24,901,421 | 2,208,624 | |||||
| 1916 | 77,229 | 16,984,174 | 371,331 | 2,417,491 | 24,788,150 | 297,501 | 2,257,135 |
| 1917 | 79,536 | 17,064,797 | 373,600 | 2,575,230 | 25,270,386 | 283,770 | 2,068,419 |
| 1918 | 80,146 | 17,386,160 | 378,050 | 2,869,465 | 26,538,302 | 258,694 | 2,034,250 |
| 1919 | 80,468 | 17,613,337 | 363,188 | 3,035,478 | 25,828,554 | 235,347 | 1,847,848 |
| Year. | Exports (the Produce of New Zealand). | |||||
|---|---|---|---|---|---|---|
| Wool. | Grain. | Frozen Meat. | ||||
| Quantity. | Value. | Quantity. | Value. | Quantity. | Value. | |
| lb. | £ | Centals. | £ | Cwt. | £ | |
| 1855 | 1,772,344 | 93,104 | 79,206 | 82,302 | ||
| 1860 | 6,665,880 | 444,392 | 25,285 | 13,112 | ||
| 1865 | 19,180,500 | 1,141,761 | 11,112 | 6,076 | ||
| 1870 | 37,039,763 | 1,703,944 | 431,050 | 141,135 | ||
| 1875 | 54,401,540 | 3,398,155 | 629,634 | 231,458 | ||
| 1880 | 66,860,150 | 3,169,300 | 2,907,934 | 906,228 | ||
| 1885 | 86,507,431 | 3,205,275 | 2,158,604 | 513,937 | 296,473 | 373,857 |
| 1890 | 102,817,077 | 4,150,599 | 4,327,753 | 1,030,415 | 898,894 | 1,087,617 |
| 1895 | 116,015,170 | 3,662,131 | 1,011,052 | 215,971 | 1,134,097 | 1,262,711 |
| 1900 | 140,706,486 | 4,749,196 | 4,485,155 | 1,034,014 | 1,844,831 | 2,123,881 |
| 1905 | 139,912,737 | 5,381,333 | 1,149,368 | 294,574 | 1,690,684 | 2,694,432 |
| 1910 | 204,368,957 | 8,308,410 | 1,097,952 | 319,073 | 2,654,196 | 3,850,777 |
| 1911 | 169,424,811 | 6,491,707 | 1,033,170 | 330,186 | 2,250,565 | 3,503,406 |
| 1912 | 188,361,790 | 7,105,483 | 2,348,678 | 741,600 | 2,573,238 | 3,909,569 |
| 1913 | 186,533,036 | 8,057,620 | 341,981 | 131,938 | 2,578,693 | 4,449,933 |
| 1914 | 220,472,898 | 9,318,114 | 750,904 | 270,011 | 3,229,969 | 5,863,062 |
| 1915 | 196,570,114 | 10,387,875 | 405,865 | 215,463 | 3,591,260 | 7,794,395 |
| 1916 | 185,506,859 | 12,386,074 | 180,586 | 86,985 | 3,326,045 | 7,271,318 |
| 1917 | 178,274,486 | 12,175,366 | 71,048 | 74,606 | 2,446,945 | 5,982,404 |
| 1918 | 108,724,575 | 7,527,266 | 56,819 | 73,088 | 2,036,904 | 4,957,576 |
| 1919 | 274,246,613 | 19,559,537 | 313,823 | 355,007 | 3,822,683 | 9,628,292 |
| Year. | Exports (the Produce of New Zealand)—continued. | |||||
|---|---|---|---|---|---|---|
| Butter. | Cheese. | Phormium Fibre. | ||||
| Quantity. | Value. | Quantity. | Value. | Quantity. | Value. | |
* Not available. | ||||||
| Cwt. | £ | Cwt. | £ | .Tons. | £ | |
| 1855 | 785 | 5,786 | 406 | 2,163 | 150 | 4,674 |
| 1860 | 1,026 | 6,623 | 810 | 3,535 | 61 | 1,240 |
| 1865 | * | * | * | * | 3 | 75 |
| 1870 | 3,435 | 12,995 | 2,735 | 9,327 | 5,471 | 132,578 |
| 1875 | 104 | 660 | 442 | 1,862 | 639 | 11,742 |
| 1880 | 2,717 | 8,350 | 717 | 1,983 | 894 | 15,617 |
| 1885 | 24,923 | 102,387 | 15,245 | 35,742 | 1,063 | 16,316 |
| 1890 | 34,816 | 122,701 | 40,451 | 84,986 | 21,158 | 381,789 |
| 1895 | 57,964 | 227,601 | 76,743 | 150,909 | 1,806 | 21,040 |
| 1900 | 172,583 | 740,620 | 102,849 | 229,111 | 15,906 | 332,182 |
| 1905 | 305,722 | 1,408,557 | 88,562 | 205,171 | 27,877 | 696,467 |
| 1910 | 356,535 | 1,811,975 | 451,915 | 1,195,373 | 20,645 | 448,414 |
| 1911 | 302,387 | 1,576,917 | 439,174 | 1,192,057 | 17,366 | 300,209 |
| 1912 | 378,117 | 2,088,809 | 577,070 | 1,680,393 | 18,641 | 376,264 |
| 1913 | 372,258 | 2,061,651 | 611,663 | 1,770,297 | 28,092 | 721,924 |
| 1914 | 434,067 | 2,338,576 | 863,776 | 2,564,125 | 19,702 | 455,214 |
| 1915 | 420,144 | 2,700,625 | 817,258 | 2,730,211 | 23,220 | 571,621 |
| 1916 | 358,632 | 2,632,293 | 949,416 | 3,514,310 | 27,674 | 1,001,725 |
| 1917 | 254,397 | 2,031,551 | 885,743 | 3,949,251 | 23,516 | 1,197,396 |
| 1918 | 431,023 | 3,402,223 | 883,430 | 4,087,278 | 25,167 | 1,387,763 |
| 1919 | 345,818 | 3,080,128 | 1,572,311 | 7,790,990 | 22,347 | 866,930 |
| Year. | Exports (the Produce of New Zealand—continued. | |||||
|---|---|---|---|---|---|---|
| Gold. | Gum (Kauri). | Provisions, Tallow, Timber, &c. | Total New Zealand Produce exported. | |||
| Quantity. | Value. | Quantity. | Value. | Value. | ||
| Oz. | £ | Tons. | £ | £ | £ | |
| 1855 | 355 | 4,514 | 173,324 | 365,867 | ||
| 1860 | 4,538 | 17,585 | 1,046 | 9,851 | 52,795 | 549,133 |
| 1865 | 574,574 | 2,226,474 | 1,867 | 46,060 | 82,729 | 3,503,421 |
| 1870 | 544,880 | 2,157,585 | 4,391 | 175,074 | 212,044 | 4,544,682 |
| 1875 | 355,322 | 1,407,770 | 3,230 | 138,523 | 285,674 | 5,475,844 |
| 1880 | 303,215 | 1,220,263 | 4,725 | 242,817 | 537,742 | 6,102,300 |
| 1885 | 222,732 | 890,056 | 5,876 | 299,762 | 1,154,579 | 6,591,911 |
| 1890 | 187,641 | 751,360 | 7,438 | 378,563 | 1,440,731 | 9,428,761 |
| 1895 | 293,493 | 1,162,181 | 7,425 | 418,766 | 1,268,843 | 8,390,153 |
| 1900 | 373,614 | 1,439,602 | 10,159 | 622,293 | 1,784,350 | 13,055,249 |
| 1905 | 520,485 | 2,093,936 | 10,883 | 561,444 | 2,167,616 | 15,503,530 |
| 1910 | 478,286 | 1,896,318 | 8,693 | 465,044 | 3,648,779 | 21,944,163 |
| 1911 | 454,837 | 1,815,251 | 7,587 | 395,707 | 3,176,458 | 18,781,898 |
| 1912 | 343,163 | 1,345,131 | 7,908 | 401,305 | 3,623,851 | 21,272,405 |
| 1913 | 376,161 | 1,459,499 | 8,780 | 549,106 | 3,375,922 | 22,577,890 |
| 1914 | 227,954 | 895,367 | 8,473 | 497,444 | 3,782,804 | 25,984,717 |
| 1915 | 422,825 | 1,694,553 | 4,575 | 279,133 | 4,668,986 | 31,042,862 |
| 1916 | 292,620 | 1,199,212 | 5,456 | 339,882 | 4,544,108 | 32,975,907 |
| 1917 | 218,624 | 903,888 | 4,594 | 291,917 | 4,481,578 | 31,087,957 |
| 1918 | 11,987 | 42,391 | 2,419 | 157,313 | 6,302,112 | 27,937,010 |
| 1919 | 320,210 | 1,334,405 | 4,128 | 255,812 | 10,433,283 | 53,304,384 |
| Year. | Total Exports. | Imports. | Total Trade. | |||
|---|---|---|---|---|---|---|
| Total. | From United Kingdom. | From Australia. | From United States. | |||
| £ | £ | £ | £ | £ | £ | |
| 1855 | 365,868 | 813,460 | 328,909 | 1,179,328 | ||
| 1860 | 588,953 | 1,548,333 | 870,569 | 649,473 | 18,474 | 2,137,286 |
| 1865 | 3,401,667 | 5,594,977 | 2,606,994 | 2,565,285 | 45,084 | 8,996,644 |
| 1870 | 4,822,756 | 4,639,015 | 2,685,736 | 1,655,086 | 60,497 | 9,461,771 |
| 1875 | 5,828,627 | 8,029,172 | 5,103,610 | 2,355,988 | 213,492 | 13,857,799 |
| 1880 | 6,352,692 | 6,162,011 | 3,479,217 | 1,930,408 | 238,011 | 12,514,703 |
| 1885 | 6,819,939 | 7,479,921 | 5,227,551 | 1,254,908 | 401,532 | 14,299,860 |
| 1890 | 9,811,720 | 6,260,525 | 4,221,270 | 1,087,593 | 355,395 | 16,072,245 |
| 1895 | 8,550,224 | 6,400,129 | 3,992,359 | 1,261,125 | 394,233 | 14,950,353 |
| 1900 | 13,246,161 | 10,646,096 | 6,504,484 | 1,776,978 | 1,061,873 | 23,802,257 |
| 1905 | 15,655,947 | 12,828,857 | 7,795,284 | 1,815,717 | 1,438,501 | 28,484,804 |
| 1910 | 22,180,209 | 17,051,583 | 10,498,771 | 2,359,393 | 1,399,737 | 39,231,792 |
| 1911 | 19,028,490 | 19,545,879 | 11,787,300 | 2,944,991 | 1,682,129 | 38,574,369 |
| 1912 | 21,770,581 | 20,976,574 | 12,499,787 | 2,583,887 | 2,049,618 | 42,747,155 |
| 1913 | 22,986,722 | 22,288,302 | 13,312,193 | 2,914,848 | 2,107,990 | 45,275,024 |
| 1914 | 26,261,447 | 21,856,095 | 11,985,946 | 3,376,371 | 2,282,966 | 48,117,542 |
| 1915 | 31,748,912 | 21,728,834 | 11,141,067 | 3,554,535 | 2,600,248 | 53,477,746 |
| 1916 | 33,286,937 | 26,339,283 | 13,869,455 | 4,002,171 | 3,969,925 | 59,626,220 |
| 1917 | 31,587,547 | 20,919,265 | 8,817,519 | 3,660,931 | 3,900,658 | 51,602,418 |
| 1918 | 28,516,188 | 24,234,007 | 8,977,725 | 5,133,349 | 4,980,748 | 52,707,441 |
| 1919 | 53,970,075 | 30,671,698 | 11,839,430 | 5,081,968 | 7,576,314 | 84,641,773 |
| Year. | Oversea Shipping. | ||||
|---|---|---|---|---|---|
| Inwards. | Outwards. | Registered Vessels belonging to New Zealand. | |||
| Vessels. | Tonnage. | Vessels. | Tonnage. | Gross Tonnage. | |
| 1855 | 378 | 88,614 | 341 | 79,825 | |
| 1860 | 398 | 140,276 | 398 | 140,293 | 8,527 |
| 1865 | 862 | 295,625 | 783 | 283,020 | 24,484 |
| 1870 | 756 | 273,151 | 766 | 265,407 | 26,743 |
| 1875 | 926 | 416,727 | 940 | 417,820 | 42,025 |
| 1880 | 730 | 395,675 | 786 | 424,041 | 66,316 |
| 1885 | 786 | 519,700 | 780 | 513,000 | 95,887 |
| 1890 | 744 | 662,769 | 745 | 649,705 | 98,907 |
| 1895 | 611 | 672,951 | 597 | 648,946 | 100,988 |
| 1900 | 616 | 854,632 | 613 | 825,275 | 137,767 |
| 1905 | 627 | 1,139,410 | 627 | 1,141,552 | 170,957 |
| 1910 | 609 | 1,389,031 | 588 | 1,367,207 | 233,531 |
| 1911 | 621 | 1,482,378 | 624 | 1,467,402 | 234,084 |
| 1912 | 677 | 1,672,092 | 666 | 1,668,630 | 245,445 |
| 1913 | 645 | 1,738,985 | 635 | 1,699,807 | 254,117 |
| 1914 | 646 | 1,724,849 | 657 | 1,781,981 | 168,552 |
| 1915 | 638 | 1,641,425 | 649 | 1,635,933 | 150,095 |
| 1916 | 574 | 1,448,517 | 590 | 1,491,593 | 148,497 |
| 1917 | 543 | 1,405,776 | 547 | 1,381,882 | 140,039 |
| 1918 | 543 | 1,279,548 | 544 | 1,310,627 | 141,751 |
| 1919 | 564 | 1,480,883 | 574 | 1,505,256 | 140,615 |
| Year. | Government Railways. (Figures to 31st March following.) | Electric Telegraph. (From 1895, figures for 31st March following.) | ||||
|---|---|---|---|---|---|---|
| Miles open for Traffic. | Miles under Construction. | Railway Receipts. | Miles of Line. | Number of Messages. | Cash and Cash Values, including Telephones. | |
| £ | £ | |||||
| 1870 | 1,887 | 238,195 | 27,422 | |||
| 1875 | 542 | 464 | 72,073 | 3,156 | 993,323 | 74,420 |
| 1880 | 1,288 | 192 | 836,077 | 3,758 | 1,304,712 | 100,023 |
| 1885 | 1,613 | 179 | 1,047,418 | 4,463 | 1,774,273 | 112,778 |
| 1890 | 1,842 | 132 | 1,121,701 | 5,060 | 1,961,161 | 110,697 |
| 1895 | 2,014 | 114 | 1,183,041 | 6,245 | 2,124,211 | 148,955 |
| 1900 | 2,212 | 208 | 1,727,236 | 7,249 | 3,898,128 | 222,305 |
| 1905 | 2,407 | 222 | 2,349,704 | 8,355 | 5,640,219 | 298,079 |
| 1910 | 2,753 | 192 | 3,494,182 | 11,316 | 8,360,647 | 438,989 |
| 1911 | 2,798 | 205 | 3,676,509 | 11,805 | 9,063,133 | 479,289 |
| 1912 | 2,851 | 192 | 3,971,002 | 12,508 | 9,944,272 | 528,119 |
| 1913 | 2,854 | 223 | 4,043,328 | 13,044 | 10,694,032 | 579,816 |
| 1914 | 2,945 | 211 | 4,105,457 | 13,434 | 10,827,968 | 665,938 |
| 1915 | 2,970 | 243 | 4,548,356 | 13,684 | 10,836,751 | 846,259 |
| 1916 | 2,970 | 243 | 4,800,810 | 13,896 | 10,875,120 | 855,298 |
| 1917 | 2,983 | 231 | 4,687,700 | 13,687 | 11,624,720 | 868,182 |
| 1918 | 2,983 | 250 | 4,988,632 | 13,813 | 12,091,017 | 993,991 |
| 1919 | 2,996 | 261 | 5,752,487 | 13,722 | 15,074,067 | 1,C44,336. |
| Year. | Revenue of General Government.* | Expenditure of General Government.* | Public Debt: Debentures and Stock in Circulation. | Debt of Local Bodies, Year ended 31st March following. | |
|---|---|---|---|---|---|
| Out of Revenue Account. | Out of Loan Accounts.† | ||||
| £ | £ | £ | £ | £ | |
| 1870 | 7,841,891 | ||||
| 1875 | 17,400,031 | ||||
| 1880 | 28,185,711 | 3,039,807 | |||
| 1885 | 33,880,722 | 4,943,270 | |||
| 1890 | 38,830,350 | 6,042,693 | |||
| 1895 | 4,556,015 | 4,370,481 | 43,050,780 | 6,737,578 | |
| 1900 | 5,854,116 | 5,479,704 | 1,746,141 | 49,591,245 | 7,563,069 |
| 1905 | 7,585,098 | 7,122,340 | 2,972,589 | 62,191,040 | 10,718,051 |
| 1910 | 10,297,273 | 9,343,106 | 3,359,311 | 81,078,122 | 15,727,613 |
| 1911 | 11,061,161 | 10,340,368 | 4,114,539 | 84,353,913 | 16,590,877 |
| 1912 | 11,734,271 | 11,082,038 | 4,097,160 | 90,060,763 | 17,483,332 |
| 1913 | 12,229,661 | 11,825,864 | 4,240,896 | 99,730,427 | 18,923,482 |
| 1914 | 12,451,945 | 12,379,803 | 6,059,983 | 100,059,910 | 19,454,475 |
| 1915 | 14,507,530 | 12,493,107 | 9,459,071 | 109,637,397 | 20,754,168 |
| 1916 | 18,355,194 | 14,658,770 | 17,509,017 | 129,836,105 | 21,432,767 |
| 1917 | 20,206,222 | 15,120,288 | 19,726,163 | 150,840,055 | 22,260,537 |
| 1918 | 22,352,372 | 18,673,599 | 25,075,656 | 176,076,260 | 22,673,712 |
| 1919 | 26,081,340 | 23,781,924 | 30,332,224 | 201,170,755 | |
| Year. | Banks of Issue. (Average of Four Quarters.) | Savings-banks (Post Office and Private). | Post Office Money-orders issued. | ||||
|---|---|---|---|---|---|---|---|
| Deposits. | Assets. | Liabilities. | Number of Depositors. | Balance to Credit at End of Year. | Number. | Amount. | |
* Financial year ended 31st March of year following. † Calendar years prior to 1880; after 1880, for year ended 31st March of year following. | |||||||
| £ | £ | £ | £ | £ | |||
| 1860 | 644,521 | 992,082 | 801,588 | 1,104 | 12,450 | ||
| 1865 | 2,638,414 | 5,455,289 | 3,522,146 | 4,304 | 87,400 | 17,236 | 78,576 |
| 1870 | 3,127,769 | 6,315,354 | 3,819,670 | 12,137 | 388,804 | 31,864 | 140,454 |
| 1875 | 5,967,205 | 10,987,178 | 6,987,318 | 30,310 | 897,326 | 73,027 | 293,481 |
| 1880 | 8,538,935 | 14,220,275 | 9,550,177 | 47,462 | 1,148,992 | 135,648 | 465,405 |
| 1885 | 10,083,296 | 18,811,567 | 11,130,244 | 85,769 | 2,142,560 | 188,622 | 581,395 |
| 1890 | 12,368,610 | 17,735,259 | 13,356,598 | 118,344 | 3,137,023 | 176,427 | 602,077 |
| 1895 | 13,544,415 | 18,159,781 | 14,491,627 | 163,513 | 4,620,696 | 243,497 | 812,604 |
| 1900 | 15,570,610 | 17,314,535 | 16,964,582 | 228,883 | 6,665,344 | 369,834 | 1,214,853 |
| 1905 | 20,545,601 | 21,770,525 | 22,144,166 | 316,376 | 9,773,954 | 417,441 | 1,541,712 |
| 1910 | 24,968,761 | 26,398,927 | 26,742,081 | 422,119 | 15,620,515 | 569,657 | 2,457,523 |
| 1911 | 26,765,122 | 29,433,614 | 28,625,803 | 459,602 | 17,194,461 | 607,764 | 2,759,393 |
| 1912 | 25,622,083 | 31,196,400 | 27,508,348 | 503,927 | 18,043,540 | 666,425 | 3,231,350 |
| 1913 | 25,733,187 | 30,708,932 | 27,591,099 | 532,682 | 18,923,522 | 690,745 | 3,357,774 |
| 1914 | 27,640,507 | 32,502,312 | 29,808,349 | 559,203 | 20,924,754 | 691,518 | 3,427,505 |
| 1915 | 31,433,653 | 33,209,483 | 34,448,270 | 587,109 | 24,238,966 | 664,860 | 3,471,818 |
| 1916 | 37,757,917 | 37,015,486 | 41,977,619 | 619,972 | 28,015,674 | 669,355 | 3,607,087 |
| 1917 | 42,930,713 | 44,979,616 | 48,541,961 | 651,532 | 31,917,099 | 642,683 | 3,476,646 |
| 1918 | 45,562,939 | 48,570,126 | 52,048,732 | 679,398 | 36,529,654 | 638,500 | 3,649,371 |
| 1919 | 50,489,444 | 48,615,209 | 57,861,393 | 726,255 | 41,951,026 | 690,291 | 4,604,059 |
| Year. | Insurances in Force in the Government Life Insurance Department at End of Year. | Old-age Pensions, 31st March of following Year. | Friendly Societies from which Returns received. | Public Trust Office. | ||||
|---|---|---|---|---|---|---|---|---|
| Number of Policies. | Sums Assured and Bonuses. | Number of Pensions in Force. | Amount represented. | Number of Lodges, &c. | Number of Members. | Number of Estates.* | Value of Estates.* | |
* From 1895 on the figures are for year ended 31st March following. † Information not available. | ||||||||
| £ | £ | £ | ||||||
| 1870 | 59 | 30,250 | ||||||
| 1875 | 4,989 | 1,836,859 | 347 | 42,163 | ||||
| 1880 | 11,656 | 4,171,504 | 179 | 14,484 | 770 | 117,980 | ||
| 1885 | 23,218 | 6,552,242 | 302 | 22,794 | 1,190 | 457,620 | ||
| 1890 | 28,102 | 7,807,792 | 357 | 26,379 | 1,678 | 1,240,097 | ||
| 1895 | 33,968 | 9,345,229 | 376 | 30,905 | 2,236 | 1,806,953 | ||
| 1900 | 40,368 | 10,639,978 | 12,405 | 211,965 | 443 | 40,257 | 2,898 | 2,326,954 |
| 1905 | 45,137 | 11,725,977 | 12,582 | 313,018 | 501 | 51,103 | 3,977 | 4,009,992 |
| 1910 | 48,932 | 12,586,798 | 16,020 | 403,020 | 609 | 68,006 | 5,966 | 5,477,675 |
| 1911 | 49,376 | 12,683,277 | 16,649 | 416,530 | 658 | 71,771 | 6,456 | 5,951,233 |
| 1912 | 50,458 | 13,271,699 | 16,509 | 412,408 | 664 | 73,243 | 7,225 | 6,782,532 |
| 1913 | 51,343 | 13,539,467 | 18,050 | 447,765 | 681 | 73,691 | 7,538 | 7,288,447 |
| 1914 | 52,273 | 13,797,075 | 19,352 | 475,970 | 717 | 74,074 | 8,026 | 7,942,158 |
| 1915 | 52,950 | 14,220,945 | 19,804 | 484,232 | 728 | 73,027 | 8,734 | 8,217,500 |
| 1916 | 53,208 | 14,259,372 | 19,697 | 480,559 | 727 | 70,360 | † | † |
| 1917 | 53,058 | 14,188,774 | 19,960 | 740,849 | 730 | 68,771 | 13,746 | 10,358,685 |
| 1918 | 53,803 | 14,770,543 | 19,872 | 731,910 | 731 | 67,527 | 15,223 | 12,807,214 |
| 1919 | 55,770 | 15,546,744 | 19,993 | 731,735 | 735 | 70,598 | 14,679 | 14,330,980 |
| Year. | Scholars at Primary Schools.* | Scholars at Secondary or High Schools.† | Scholars at Private Schools. | New Zealand University Graduates (Direct Degrees). |
|---|---|---|---|---|
* Excluding children attending Native schools and industrial schools. † Including in later years secondary pupils attending technical high schools (2,926 in 1919), but excluding secondary departments of district high schools. ‡ Registered schools only. | ||||
| 1875 | 45,562 | 7,316 | ||
| 1880 | 82,401 | 1,631 | 11,238 | |
| 1885 | 102,407 | 2,659 | 11,989 | 103 |
| 1890 | 117,912 | 2,117 | 13,626 | 230 |
| 1895 | 129,856 | 2,525 | 14,659 | 464 |
| 1900 | 130,724 | 2,792 | 15,555 | 699 |
| 1905 | 137,623 | 4,060 | 16,639 | 992 |
| 1910 | 156,324 | 7,970 | 18,981 | 1,424 |
| 1911 | 161,648 | 6,806 | 19,868 | 1,515 |
| 1912 | 166,264 | 7,357 | 20,238 | 1,631 |
| 1913 | 172,168 | 7,815 | 21,115 | 1,758 |
| 1914 | 178,509 | 8,257 | 22,080 | 1,880 |
| 1915 | 183,214 | 8,860 | 22,339 | 2,002 |
| 1916 | 185,884 | 9,623 | 23,412 | 2,108 |
| 1917 | 190,354 | 10,517 | 25,491 | 2,226 |
| 1918 | 194,934 | 11,796 | 26,237 | 2,317 |
| 1919 | 196,059 | 12,680 | 20,977‡ | 2,473 |
Table of Contents
[NOTE.—Dates of principal events prior to August, 1914, are given in issues of the Year-book for 1915 and previous years.]
| 1914. | Aug.5. | His Excellency the Governor publicly notified that war had been declared between Great Britain and Germany. |
| Aug. 15. | New Zealand Advance Expeditionary Force left Wellington. | |
| Aug. 29. | New Zealand Advance Expeditionary Force landed at Apia, Samoa, unopposed. | |
| Sept. 12. | Huntly coal-mine explosion whereby 43 lives were lost. | |
| Oct. 16. | New Zealand Main Expeditionary Force left Wellington. | |
| 1915. | April 25. | Australian and New Zealand Infantry effected a landing on Gallipoli. |
| Aug. 12. | National Cabinet formed. | |
| Dec. 19. | Australian and New Zealand troops evacuated Gallipoli. | |
| 1916. | April —. | New Zealand Division transferred to Western front. |
| Aug. 1. | Military Service Act passed providing for compulsory enrolment of men for war service. | |
| Sept. 15. | New Zealand Division distinguished itself at Flers. | |
| Oct. 15. | Census of New Zealand taken. | |
| Nov. 16. | First ballot under Military Service Act. | |
| 1917. | June 7. | Messines Village captured by New Zealand troops. |
| June 28. | Earl of Liverpool sworn in as first Governor-General of New Zealand. | |
| Oct. 4–12. | New Zealand Division took prominent part in operations north-east of Ypres. | |
| 1918. | June 26. | Huddart-Parker's s.s. “Wimmera” sunk off North Cape by hostile mine. |
| July 20. | Otira Tunnel pierced. | |
| Aug. 21.-Nov 11. | New Zealand Division took a meritorious part in the final British offensive. | |
| Sept. 19. | Turks heavily defeated in Palestine. | |
| Sept. 29. | Bulgarian surrender signed. | |
| Oct. 30. | Turkish armistice signed. | |
| Nov. 2. | Austrian armistice signed. | |
| Nov. 11. | Armistice signed by German High Command. | |
| Nov. 21. | German Fleet surrendered. | |
| Nov.-Dec. | Influenza epidemic prevalent throughout the Dominion. | |
| 1919. | Jan. —. | Visit of French Mission under General Pau. |
| April 10. | Special licensing poll taken. | |
| Aug. 20. | H.M.S. “New Zealand” arrived at Wellington on her second visit to the Dominion, bringing Admiral of the Fleet Viscount Jellicoe of Soapa, G.C.B., O.M., G.C.V.O. | |
| Aug. 21. | Dissolution of National Ministry. | |
| Oct. 2. | Women's Parliamentary Rights Bill passed its second reading in the Legislative Council. | |
| Dec. 17. | General elections. | |
| 1920. | Jan. 10. | Official date of termination of war with Germany. |
| April 24-May 22. | Visit to New Zealand of His Royal Highness the Prince of Wales. | |
| April 28. | Commencement of railway strike. | |
| Aug. 25. | First aeroplane flight across Cook Strait. | |
| Sept. 27. | Admiral of the Fleet Viscount Jeilicoe of Scapa, G.C.B., O.M., G.C.V.O., sworn in as Governor-General. | |
| 1921. | April 17. | Census of New Zealand. |
The following list contains the names of some of the principal works dealing with New Zealand, but it does not purport to be a complete list of all the important works on the Dominion. The year of publication is given in each case, and the list is arranged as far as possible in chronological order of issue.
1807. New Zealand. By Dr. Savage. London—J. Murray.
1817. Voyage to New Zealand. By John L. Nicholas. London—Black.
1823. Journal of Ten Months’ Residence in New Zealand. By Captain Cruise. London—Longmans.
1830. The New-Zealanders (Library of Entertaining Knowledge). London—Chas. Knight.
1832. Nine Months’ Residence in New Zealand. By Augustus Earle. London—Longmans.
1836. Two Visits to New Zealand. By Dr. Marshall. London—Nisbet and Co.
1840. Manners and Customs of the New-Zealanders. By J. S. Polack. London—Madden and Co.
1843. Travels in New Zealand. By E. Dieffenbach. London—Murray.
1855. Te-Ika-a-Maui, or New Zealand and its Inhabitants. By Rev. Richard Taylor. London—Wertheim and Macintosh.
1856. Traditions and Superstitions of the New-Zealanders. By Edward Short-land. London—Longmans.
1859. Story of New Zealand. By Dr. Thompson. London—John Murray.
1863. Old New Zealand. By Judge Maning. Auckland—Creighton and Scales.
1874. Life of Henry Williams. By Hugh Carleton. Auckland—Upton.
1879. Reminiscences of the War in New Zealand. By T. W. Gudgeon. London—Sampson Low.
1879. George Augustus Selwyn. By Rev. H. W. Tucker. London—W. W. Gardner.
1885. Polynesian Mythology and Maori Legends. By Sir G. Grey.
1889. Ancient History of the Maori. By John White. London.
1890. Early History of New Zealand. By R. A. Sherrin and J. H. Wallace. Edited by Thomas W. Leys. (Brett's Historical Series.) Auckland—Brett.
1893. Captain Cook's Journal during his First Voyage round the World. Edited by Captain W. J. L. Wharton. R.N. London—Elliot Stock.
1895. History of New Zealand. By G. W. Rusden. Melbourne—Melville, Mullen, and Slade.
1896. The Art Workmanship of the Maori Race in New Zealand. By Augustus Hamilton. Dunedin—Fergusson and Mitchell.
1896. Journal of Sir Joseph Banks. Edited by Sir Joseph D. Hooker. London—Macmillan and Co.
1897. New Zealand Rulers and Statesmen (1844–97). By W. Gisborne. London.
1898. Abel Janszoon Tasman's Journal of His Discovery of Van Diemen's Land and New Zealand in 1642, &c. By J. E. Heeres. Amsterdam—F. Mueller and Co.
1898. Contributions to the Early History of New Zealand. By T. M. Hocken. London.
1898. New Zealand (Story of the Empire Series). By W. P. Reeves. London—Marshall and Sons.
1900. Old Marlborough. By T. L. Buick. Palmerston North—Hart and Keeling.
1901. Newest England. By H. D. Lloyd. London.
1901. New Zealand. By R. A. Loughnan. Wellington.
1902. The Progress of New Zealand in the Century. By R. F. Irvine and O. T. J. Alpers. London.
1902. State Experiments in Australia and New Zealand. By W. P. Reeves. London—Grant Richards.
1903. Old Manawatu. By T. L. Buick. Palmerston North—Buick and Young.
1904. La Démocratie en Nouvelle Zélande. Paris, 1904. Translated by E. V. Burns, 1914. London.
1905. The Maori Race. By E. Tregear. Wanganui—A. D. Willis.
1905. The Animals of New Zealand. An Account of the Colony's Air-breathing Vertebrates. By Captain F. W. Hutton and James Drummond. Third Edition, 1907. Christchurch—Whitcombe and Tombs (Limited).
1906. Adrift in New Zealand. By E. W. Elkington. London.
1907. The Plants of New Zealand. By R. M. Laing and E. W. Blackwell. Second and Revised Edition. Christchurch—Whitcombe and Tombs (Limited).
1907. Maori and Polynesian. By J. M. Brown. London.
1907. Our Feathered Immigrants. Evidence for and against Introduced Birds in New Zealand, together with Notes on Native Avifauna. Illustrated. By J. Drummond. Wellington—Government Printer.
1908. State Regulation of Labour and Labour Disputes in New Zealand. By Henry Broadhead. Christchurch—Whitcombe and Tombs (Limited).
1908. New Zealand. By F. W. Wright and W. P. Reeves. London—Black.
1908. New Zealand. (Romance of Empire Series.) By Reginald Horsley. London—T. C. and E. C. Jack.
1908. Adventures in New Zealand. By E. J. Wakefield. New Edition. Wellington—Whitcombe and Tombs (Limited).
1908. Bibliography of the Literature relating to New Zealand By T. M. Hocken. Wellington.
1908. Historical Records of New Zealand. By Robert McNab. Wellington—Government Printer.
1909. New Zealand in Evolution, Industrial, Economic, and Political. By G. H. Scholefield, with an introduction by W. P. Reeves. London—T. F. Unwin.
1909. Murihiku. A History of the South Island of New Zealand and the Islands Adjacent and Lying to the South, from 1642 to 1835. By Robert McNab. Wellington—Whitcombe and Tombs (limited).
1909. The Dominion of New Zealand. By A. P. Douglas. London.
1910. The Maoris of New Zealand. By J. Cowan. Wellington—Whitcombe and Tombs (Limited).
1910. The Geology of New Zealand. By James Park. Christchurch—Whitcombe and Tombs (Limited).
1910. New Zealand Plants and their Story. By L. Cockayne, Ph.D., F.L.S. Second Edition, 1919. Wellington—Government Printer.
1911. Hawaiki: The Original Home of the Maori. By S. Percy Smith. Third Edition. Christchurch—Whitcombe and Tombs (Limited).
1911. The Course of Prices in New Zealand. By James W. Mcllwraith, LL.B., Litt.D. Wellington—Government Printer.
1911. State Socialism in New Zealand. By J. E. Le Rossignol and W. Downie Stewart. London—G. G. Harrop and Co.
1911. New Zealand. By the Hon. Sir Robert Stout, K.C.M.G., LL.D., and J. Logan Stout, LL.B. Cambridge—University Press.
1913. New Zealand, its History, Commerce, and Industrial Resources. By S. Playne. London.
1913. Social Welfare in New Zealand. By H. H. Lusk. London.
1913. The Lore of the Whare Wananga. Third Volume of Memoirs of Polynesian Society. On Maori Religion, Myths, Cosmogony, &c.
1914. The Constitutional History and Law of New Zealand. By J. Hight, Litt.D., and H. D. Bamford, LL.D. Christchurch—Whitcombe and Tombs (Limited).
1914. The Wilds of Maoriland. By M. J. Bell. London.
1914. Oxford Survey of the British Empire. Vol. v. Australasian Territories. London.
1915. The Long White Cloud, Aotearoa. By W. P. Reeves. London—Horace Marshall and Sons. Revised Edition.
1915. Report on the Cost of Living in New Zealand, 1891–1914. By Malcolm Fraser, Government Statistician. Wellington—Government Printer.
1917. A Natural History of Australia, New Zealand, and the Adjacent Islands. By R. P. Thomson. London.
| Article on | Appeared for the Last or Only Time in Year-book of | |
|---|---|---|
| Year | Page | |
| Acclimatization | 1894 | 430 |
| Agriculture in New Zealand (by M. Murphy, F.L.S.) | 1912 | 809 |
| Building-stones | 1892 | 194 |
| Cancer mortality in New Zealand | 1917 | 776 |
| Chatham Islands, the | 1900 | 531 |
| Cheviot Estate, the | 1895 | 264 |
| Christchurch to West Coast, journey from | 1899 | 548 |
| Coal-deposits of New Zealand, the | 1900 | 479 |
| Cook Islands, the laws of | 1902 | 573 |
| Co-operative system of constructing public works | 1894 | 234 |
| Exotic trees in Canterbury | 1904 | 569 |
| External trade of New Zealand, the | 1915 | 858 |
| Fauna of New Zealand | 1914 | 957 |
| Forest trees and the timber industry | 1899 | 470 |
| Frozen-meat trade, the | 1894 | 311 |
| Geology of New Zealand | 1914 | 943 |
| Gold-dredging industry, the | 1899 | 509 |
| Government training-ship “Amokura” | 1913 | 942 |
| Hanmer Thermal Springs | 1905 | 631 |
| Hemp industry, the | 1900 | 477 |
| H.M.S. “New Zealand” | 1913 | 932 |
| Kauri-gum | 1900 | 489 |
| Labour in New Zealand | 1894 | 362 |
| Lakes of New Zealand, the | 1915 | 963 |
| Land- and income-tax assessment | 1913 | 884 |
| Laws of England and New Zealand, difference between | 1896 | 281 |
| Maori, ancient, his amusements, games, &c. | 1907 | 707 |
| Maori, ancient, his clothing | 1908 | 734 |
| Maori, chant (tangi) | 1907 | 711 |
| Maori, colour-sense of the | 1905 | 637 |
| Maori, marriage customs | 1906 | 688 |
| Maori, mythology | 1900 | 536 |
| Maori, neolithic, the | 1902 | 578 |
| Maori, place-names | 1919 | 936 |
| Maori, religion | 1901 | 530 |
| Maori, sociology | 1903 | 641 |
| Maori, songs | 1908 | 739 |
| Marlborough Sounds, the | 1901 | 517 |
| Midland Railway, the | 1894 | 386 |
| Mineral waters of New Zealand | 1913 | 896 |
| Moa, heir of the | 1899 | 517 |
| Mount Cook, a night on | 1900 | 525 |
| Mount Cook, district, the | 1899 | 554 |
| Mount Cook, its glaciers, and the Hermitage | 1898 | 552 |
| Mount Sefton, ascent of | 1900 | 519 |
| New Zealand Contingents for South Africa | 1900 | 449 |
| New Zealand International Exhibition | 1907 | 701 |
| Otago lakes, the | 1901 | 523 |
| Patents, designs, and trade-marks | 1893 | 350 |
| Pumice-stone deposits of New Zealand | 1900 | 486 |
| Railways in New Zealand, their history and progress | 1894 | 377 |
| Rivers of New Zealand | 1914 | 948 |
| Scenic wonderland, a | 1898 | 565 |
| Sheep, crossbreeding of | 1894 | 308 |
| Sheep-farming | 1894 | 302 |
| Shipping companies— | ||
| New Zealand Shipping Company | 1895 | 392 |
| Shaw, Savill, and Albion Company | 1895 | 393 |
| Union Company of New Zealand | 1895 | 389 |
| Southern Alps, the | 1894 | 474 |
| State farms | 1894 | 243 |
| Sydney Pageant, the | 1901 | 527 |
| Thermal-springs district | 1905 | 614 |
| Timber-trees of the world | 1903 | 605 |
| Tokaanu to Raetihi | 1899 | 539 |
| Topographical nomenclature of the Maori | 1919 | 936 |
| Tree-planting | 1906 | 611 |
| Tuhoeland | 1899 | 546 |
| Varieties of soil | 1892 | 193 |
| Wages and working-hours in New Zealand | 1919 | 860 |
| Waihi Gold-mining Company | 1897 | 432 |
| Waikato district and through to Wanganui | 1899 | 520 |
| Waiouru to Mangaonoho | 1899 | 543 |
| Wanganui River, up the, to Tokaanu | 1900 | 509 |
| Wattle-growing in the Auckland Provincial District | 1897 | 430 |
| Wellington-Manawatu Railway, the | 1895 | 381 |
| West Coast Sounds, the | 1894 | 472 |
| White Island, a day on | 1906 | 637 |
A.
- Absolute Decrees in Divorce, 90.
- Accident Insurance, 324.
- Government Office, 324.
- Accidents, 44, 55, 100.
- In Factories, 297.
- Mining, 262.
- Railway, 179.
- Acclimatization of Fishes, 249.
- Accommodation Licenses, 109.
- Acreage and Yield of Crops, 211.
- Adjacent Islands, Population of, 19.
- Advances by Banks, 317.
- Advances, Kauri-gum Industry, 261.
- Advances to Local Authorities, 303.
- Advances to Settlers, 300.
- Advances to Workers, 302.
- Aerial Mail-services, 185.
- Afforestation, 245–247.
- After-lifetime, Average, 38.
- Age, Mean, at Death, 38.
- Age, Mean, at Marriage, 32.
- Ages, 90.
- At Death, 38.
- Of Industries, 289.
- Of Inmates of Hospitals, 50.
- Of Inmates of Mental Hospitals, 64.
- Of Issue left, 40.
- Of Maoris convicted, 98.
- Of Persons married, 31.
- Of Prisoners, 99.
- Of Public-school Pupils, 70.
- Aggregation of Land, 191.
- Agricultural Bursaries, 83.
- Agricultural College, Lincoln, 82.
- Agricultural Labourers’ Accommodation Act, 298.
- Agricultural Produce exported, 129.
- Agriculture, 209–221.
- Aid, State—
- To Dairy Industry, 238.
- To Friendly Societies, 380.
- To Kauri-gum Industry, 261.
- To Local Authorities, 303.
- To Mining, 262.
- To Settlers, 300.
- To Tree-planting, 245.
- To Water-power, 267.
- To Workers, 302.
- Aitutaki, Island of, 387.
- Alcoholic Liquors, Consumption of, 97, 151.
- Alien Immigrants, 9.
- Alienation of Land, 191.
- Alienation of Native Lands, 169.
- Aliens, Naturalized, 10.
- Aliens, Registration of, 11.
- Allocation of Public Debt and of Increase, 344.
- Alluvial-gold Mining, 255.
- “Amokura” Training-ship, 86.
- Angora Goats, 224, 242.
- Animals, Domestic, 222–244.
- Antipodes Islands, 386.
- Apia, 391.
- Apiculture, 244.
- Appeal Court, 88.
- Applicants for Crown Land, 188.
- Arbitration Court, 295.
- Area under Cultivation, 210.
- Arrested Persons convicted, 94.
- Arrivals, 3.
- Race Aliens, 9.
- Articles on Special Subjects in Previous Issues, 402.
- Asses and Mules, 222, 224, 242.
- Assessment of Land- and Income-tax, 338.
- Assets of Banks, 317.
- Assisted Immigrants, 5.
- Assurance, Life, 321.
- Asylums, 62–66.
- Atiu, Island of, 387.
- Auckland Fish-market, 250.
- Auckland Islands, 386.
- Australasia—
- Birth-rates of, 23.
- Death-rates of, 39. Standardized, 40.
- Debt of, 352.
- Deposits in Banks of Issue in, 317.
- Friendly Societies in, 380.
- Gold-production of, 256.
- Illegitimacy Rates of, 27.
- Index of Mortality of, 40.
- Live-stock in, 225.
- Marriage-rates of, 30.
- Oat Crop of, 216.
- Potato Crop of, 217.
- Railway Revenue of, 178.
- Railway Rolling-stock in, 175.
- Savings-banks Deposits in, 320.
- Sheep in, 232.
- Sown Grasses in, 221.
- Wheat Crop of, 215.
- Automatic Telephones, 183.
B.
- Balance of Trade, 124.
- Balances of Accounts, 336
- Banking, 315–320.
- Bank-notes, Issue of, 318
- Bankruptcy, 89.
- Banks of Issue, 315.
- Banks, Savings–
- Post Office, 318.
- Private, 319.
- Barley, 216.
- Beans and Peas, 217.
- Export of, 139, 217.
- Bee-farming, 244.
- Beef consumed and exported, 237.
- Beer, Consumption of, 97, 151.
- Beer Duty, 155, 160.
- Bertillon Classification of Causes of Death, 43.
- Bibliography, 400.
- Births, 21–28.
- Illegitimate, 25–27.
- Maori, 28.
- Plural, 24.
- Sexes of, 24.
- Still, 28.
- Board of Trade, 370.
- Boarding of School-children, 70.
- Boats, Fishing, licensed, 250.
- Boroughs—
- Finances of, 114.
- Population of, 15
- Value of Land and Improvements, 121.
- Bounty Islands, 386.
- Boys’ Training-schools, 80.
- Bread, Regulations re Sale of, 57.
- Breeding-ewes, 227.
- Brides and Grooms—
- Ages of, 31.
- Condition of, 31.
- Mark Signatures of, 35.
- Building Societies, 377.
- Building-stones, 261.
- Bullion, Movement of, 125.
- Bursaries, 77, 82.
- Butter—
- Export of, 239.
- Factories, 239.
- Production and Consumption of, 240.
- Requisition of, 167.
- By-elections, 108.
C.
- Cables, Pacific, 185.
- Cadets, Senior, 85.
- Campbell Island, 386.
- Cancer, 46, 53.
- Canterbury Agricultural College, 82.
- Capital of Banks of Issue, 315.
- Capital Value of Land, 119.
- Cassiterite, 258.
- Casualties in the War, 84.
- Cattle, 222–225, 234–238.
- Slaughtered for Food, 237.
- Causes of Death, 43–47.
- Causes of Insanity, 63.
- Census (see Population section).
- Cereals, 211.
- Certificates of Title issued, 202.
- Charges before Magistrates, 92.
- Charitable Aid, 59.
- Charitable Institutions, 61.
- Chatham Islands, 385.
- Cheese—
- Exported, 128–145, 239.
- Factories, 239.
- Produced and consumed, 240.
- Requisitioned, 163.
- Chief Centres (see under Cities).
- Childbirth, Deaths in, 47.
- Childbirth: Hospital Cases, 54.
- Children born, Sexes of, 24.
- Children, Dependent, Care of, 79.
- Children, Deaths of, 42.
- Children to a Marriage, 33.
- Children's Homes, 62, 79.
- Children's Welfare, 79.
- Chinese in New Zealand, 10.
- Cinnabar, 258.
- Cities—
- Births and Birth-rates, 23.
- Deaths and Death-rates, 40.
- Population, 17.
- Civil Law Cases, 88.
- Civil Marriages, 34.
- Class-books, School, 71.
- Classification of Lands, 188.
- Climate and Meteorology, 384.
- Clover-seeds, 220.
- Coal exported, 140.
- Coal-miners’ Relief Fund, 264.
- Coal-mining, 258.
- Coastwise Shipping, 172.
- Cocksfoot, 220.
- Coin-in-slot Telephones, 183.
- Coleridge, Lake, Water-power, 267.
- Colleges, University, 81.
- Commerce, 123–169.
- Companies, Joint-stock, 378.
- Compulsory Training, 85.
- Conciliation Councils, 295.
- Confinement, Deaths in, 47, 54, 61.
- Conjugal Condition of Parties marrying, 31.
- Consolidated Fund, 328.
- Constitution and Laws of Islands annexed in 1901, 388.
- Construction of Railways, Cost of, 176.
- Consumption—
- Of Alcoholic Liquors, 97, 151.
- Of Beef, 237.
- Of Butter and Cheese, 240.
- Of Food and Drink, 151.
- Of Mutton and Lamb, 231.
- Of Pork, &c., 243.
- Of Timber, 247.
- Phthisis, 45.
- Conveyance of Children to School, 70.
- Convictions—
- For Drunkenness, 96.
- In Superior Courts, 95.
- Of Juveniles, 94.
- Of Maoris, 97.
- Of Persons arrested, 94.
- Summary, 93.
- Cook and other Pacific Islands, 386–391.
- Births, 28.
- Deaths, 48.
- Exports to, 144.
- Imports from, 154.
- Marriages, 35.
- Population, 20.
- Co-operative Public Works, 298.
- Copper, 257.
- Corn Crops, Acreage and Yield of, 211.
- Cost of Living, 353.
- Cost of Railway-construction, 176.
- Councils of Conciliation, 295.
- Counties—
- Finances of, 114.
- Population of, 14.
- Sheep in, 227.
- Value of Land and Improvements in, 120.
- Courts—
- Appeal, 88.
- Arbitration, 295.
- Bankruptcy, 89.
- Divorce, 90.
- Magistrates’, 88, 92.
- Native Land, 199.
- Supreme, 88, 95.
- Cow-testing, 235.
- Creameries, 238.
- Crime, Law and, 88–101.
- Criminal Cases, 92.
- Criminals, Habitual, 100.
- Crops, Principal, 211.
- Crown Lands, 187–198.
- Cultivation, Area in, 210.
- Customs Revenue and Tariff, 155.
- Customs Taxation, 155, 338.
D.
- Dairy Industry, 238.
- Dairy-produce, 238.
- Export of, 128, 239.
- Grading of, 238.
- Retail Prices, 355, 363.
- Danger Island, 387.
- Dates of Principal Events, 399.
- Deaf, School for the, 80.
- Death Duties, 341.
- Deaths, 36–48.
- In Expeditionary Force, 84.
- In Hospitals, 51.
- In Mental Hospitals, 65.
- Debentures, Public, 346.
- Debt of Local Bodies, 117.
- Debt, Public, 344–352.
- Decisions of Arbitration Court, 296.
- Decrees in Divorce, 90.
- Deeds Registration, 201.
- Defence, 84–87.
- War Expenditure, 85, 345.
- Deferred-payment Lands, 191, 195.
- Denominational Schools, 72.
- Density of Population, 12.
- Dentists, Registration of, 57.
- Departures, 3.
- Deposits in Banks, 317.
- Designs, 383.
- Destination of Exports, 135.
- Detention, Reformative, 100.
- Development of Banking, 316.
- Development of Mining, 262.
- Diamond Drills, 263.
- Differential Tariff, 163.
- Direction of Import Trade, 152.
- Discharged Soldiers Repatriation, 372.
- Discharged Soldiers Settlement, 194.
- Discharges from Hospitals, 50, 65.
- Discharges from Mental Hospitals, 65.
- Diseases, Notification of Infectious, 49.
- Diseases, Principal, Deaths from, 43.
- Dissolution of Marriages, 90.
- Distribution of—
- Population, 13.
- Wealth, 381.
- District High Schools, 81.
- Dividend Duty, 342.
- Divorce, 90.
- Dominion Rifle Association, 86.
- Drainage Boards, Finances of, 114.
- Dredging, Gold, 255.
- Drills, Prospecting, 263.
- Drugs, Sale of, 57.
- Drunkenness, 96.
- Ducks, 244.
- Dunedin Medical School, 61.
- Duntroon Military College, 86.
- Dutiable Imports, 160.
- Duties, Customs and Excise, 155–164.
- Duties, Death, 341.
- Dwellings—
- Soldiers’ 196.
- Workers’ 304
E.
- Education, 67–83.
- Education Boards, Receipts and Expenditure of, 72.
- Educational Association, Workers’, 83.
- Educational Endowments, 189.
- Electoral, 102–108.
- Electric—
- Current, 265.
- Power Boards, 272.
- Telegraph, 183.
- Emigration, 3.
- Employees in Factories, 276.
- Employees, Postal, 185.
- Employees, Railway, 178.
- Employment Branches of Labour Department, 299.
- Employment of Discharged Soldiers, 372.
- Endowments, Educational, 189.
- Endowments, National, 189.
- Entrepôt Trade, 126, 141.
- Equalization (Butter) Funds, 167
- Estate Duty, 341.
- Estates acquired for Settlement, 191.
- Estates passed for Probate, 381.
- Estimated Population, 1.
- Events, Dates of, 399.
- Ewes, Breeding, 227.
- Examinations, Annual Education, 83.
- Examiners under Coal - mines and Mining Acts, Boards of, 264.
- Excise Duties, 155–160.
- Taxation by means of, 338.
- Ex-nuptial Births, 25, 26.
- Expectation of Life, 38.
- Expeditionary Forces, 84.
- Acquisition of Land by Members, 194.
- Expenditure, Revenue and, 328–336.
- Exports, 128–145.
- External Migration, 3.
- Extinction of Public Debt, 350.
F.
- Factories, 275–294, 296.
- Accidents in, 297.
- Employees in, 276.
- Farmers, Tree-planting by, 247.
- Farming, 209–244.
- Feeble-minded, School for, 80.
- Fertility of Marriages, 33.
- Fibre, Phormium, 128–145, 218.
- Finance, Public, 328–352.
- Financial Assistance to Soldiers, 196, 376.
- Fire Inquests, 101.
- Fire Insurance, 325.
- State, 326.
- First Offenders’ Probation, 100.
- Fish exported, 253.
- Fisheries, 248–253.
- Fish-hatcheries, 248–250.
- Fishing-boats licensed, 250.
- Fish-markets, Municipal, 250.
- Flax (Phormium Tenax), 218
- Exports, 128–145.
- Fleeces, Average Weight of, 230.
- Floating Debt, 346.
- Flotation of Loans, 346.
- Food and Drink: Import and Consumption, 151.
- Food and Drugs, Sale of, 57.
- Food Groups: Index Numbers, 357, 363, 366.
- Footwear Regulation Act, 298.
- Foreign Insurance Companies, 327.
- Foreigners naturalized, 10.
- Forestry, 245–247.
- Foster-homes for Children, 80.
- Foundation Scholarships, 76.
- Foveaux Strait Oysters, 248.
- Fowls, 243.
- Free and Dutiable Imports, 160.
- Freehold, Crown Land made, 191.
- Freehold Tenure, 191, 207.
- Friendly Societies, 378.
- Frozen Meat exported, 165, 166.
- Frozen Meat requisitioned, 165.
- Fruit Industry, The, 218.
- Fuel and Light: Index Numbers, 365.
- Future Settlement, Land for, 191.
G.
- Gaming and Lotteries, 101.
- Gaols, Prisoners in, 98–100.
- Gardens, Market, Acreage in, 218.
- Geese, 243.
- General Election, 102.
- Geographical Distribution of Industries, 288.
- German Samoa, Exports to, 145.
- Imports from, 154.
- Gift Duty, 341.
- Glaxo, Requisition of, 169.
- Goats, 222–224, 242.
- Gold exported, 128–145, 254.
- Goldfields, Subsidized Roads on, 263.
- Gold-mining, 255.
- Gonorrhœa: Hospital Cases, 53.
- Goods carried on Railways, 176.
- Government Insurance Offices, 323.
- Government Schools, Attendance at, 69.
- Government Valuation of Land, &c., 119–122.
- Grading of Dairy-produce, 238.
- Graduated Land-tax, 338.
- Grain Crops, 211.
- Grapes, 210, 220.
- Grass Lands, Acreage of, 220.
- Grass-seed, 140, 220.
- Gratuity, War-service, 84.
- Greenstone, 261.
- Groceries: Index Numbers, 354, 362.
- Gross Indebtedness, 344–352.
- Grounds for Divorce, 90.
- Growth of Population, 1.
- Growth of Trade, 123.
H.
- Half-castes, 19.
- Hands employed in Factories, 276.
- Harbour Boards, Finances of, 114.
- Health, Public, 56–58.
- Hervey Islands, 387.
- Hides exported, 128–145.
- Requisition of, 169.
- High Schools, 74.
- District, 81.
- Technical, 78.
- Hindu Immigrants, 9.
- H.M.S. “New Zealand,” 87.
- H.M.S. “Philomel,” 87.
- Holdings, Occupied, 207.
- Home-science Bursaries, 82.
- Homes, Children's, 62, 79.
- Honey, 244.
- Hops, 218.
- Horahora Electric Power, 269.
- Horses, 223–225, 240–242.
- Hospitals, 50–55, 56–66.
- Expenditure on, 58.
- Maternity, 61.
- Mental, 62–66.
- Private, 61.
- Private Mental, 66.
- Public, 50–55, 56–60.
- St. Helens, 61.
- House-rent, 358, 364.
- Housing Act (1919), 304.
- Hydro-electric Power, 265–274.
I.
- Illegitimate Births, 25, 26.
- Immigration, 3.
- Assisted, 5.
- Restriction, 8.
- Imperial Government Supplies, 165–169.
- Imports, 123, 146–154.
- Free and Dutiable, 160.
- Income-tax, 338.
- Increase in Food-prices during War, 361.
- Increase in Public Debt, 344.
- Increase of Population, 2, 21.
- Indebtedness of Local Bodies, 117.
- Indebtedness, Public, 344–352.
- Index Numbers, Cost of Living, 353.
- Index of Mortality, 39.
- Industrial, 295–299.
- Industrial Conciliation and Arbitration, 295.
- Industrial Disputes dealt with, 295.
- Industrial Life Assurance, 321.
- Industrial Manufacture, 275–294.
- Industrial Schools, 79.
- Industrial Unions registered, 296.
- Industries, 275–294.
- Wages in, 279, 371.
- Infantile Mortality, 42.
- Infant-life Protection, 80.
- Infections Diseases, Notification of, 49.
- Infectious Diseases, Prevention of, 56.
- Inland Fisheries, 249.
- Inmates of Gaols, 98–100.
- Inmates of Hospitals, 50.
- Inmates of Mental Hospitals, 62.
- Inquests, 100.
- Insanity, 62–66.
- Inscribed Stock, 346.
- Insolvency, 89.
- Inspection, Medical, of School-children, 70.
- Instruction, Public, 67–83.
- Insurance, 321–327.
- Interest on Public Debt, 348.
- Inter-urban Telephones, 183.
- Intervals between Births, 26.
- Investment Societies, 378.
- Ironsands and Ores, 256.
- Islands, Adjacent, Population of, 19.
- Islands, Outlying, 385–392.
- Issue born to Marriage, 33.
- Issue of Bank-notes, 318.
- Issue of Deceased Males, 41.
- Under 16 Years of Age, 41.
J.
- Joint-stock Companies, 378.
- Journal, School, 71.
- Judicial Separation, 90.
- Juvenile Offenders, 94.
K.
- Kauri-gum, 261.
- Exported, 128–145.
- Kermadec Islands, 385.
L.
- Labour Department: Employment.
- Branches, 299.
- Lake Coleridge Works, 267.
- Lamb, consumed and exported, 231.
- Land- and Income-tax, 338.
- Land Boards, 187.
- Maori, 200.
- Land Districts, 187.
- Land Drainage Boards, Finances of, 114.
- Land for Discharged Soldiers, 194.
- Land for Settlements, 192.
- Land, Government Valuation of, 119–122.
- Land, Occupation and Ownership of, 205–208.
- Land Offices, 187.
- Land Purchase Commissioners, 192.
- Land-settlement Finance Associations, 194.
- Lands opened for Selection, 189.
- Land-tax, 338.
- Land Tenure and Settlement, 187–208.
- Land Transfer and Deeds Registration, 201–204.
- Land, Valuation of, 119–122.
- Law and Crime, 88–101.
- Lease, Renewable, 191–195.
- Legitimation Act, 27.
- Letters posted, 181.
- Liabilities of Banks, 316.
- Libraries, School, 71.
- Licensed Houses, 109.
- Licenses and Local Option, 109–112.
- Licenses, Fishing-boat, 250.
- Licenses, Publicans’, 109.
- Licensing Polls, Results of, 111.
- Life Assurance, 321.
- State, 323.
- Life, Expectation of, 38.
- Light, Fuel and: Index Numbers, 365.
- Lighthouses, 173.
- Lincoln Agricultural College, 82.
- Live-stock and Agriculture, 209–221.
- Living, Cost of, 353.
- Loans, Dates of Maturity of, 347.
- Loans, Flotation of, 346.
- Loans of Local Bodies, 117.
- Local Bodies, 113–118.
- Advances to, 303.
- Superannuation, 313.
- Taxation by, 113, 343.
- Local Option, 112.
- Local Taxation, 343.
- Location of Industries, 288.
- Lodges, 378.
- Lotteries, Gaming and, 101.
- Lower Departments of Secondary
- Schools, 78.
- Lunacy, 62–66.
M.
- Magistrates’ Courts—
- Civil Cases, 88.
- Criminal Cases, 92.
- Mail-services, 181.
- Maize, 216.
- Male and Female Death-rates, 37
- Manahiki Island, 387.
- Mangaia Island, 387.
- Manganese-ore, 258.
- Mangolds, 218.
- Manual Education, 71.
- Manufactories and Works, 275–294.
- Maori Land Boards, 200.
- Maori Lands, 199.
- Maoris, 19.
- Births of, 28.
- Children attending Schools, 73.
- Crime amongst, 97.
- Deaths of, 48.
- Half-castes, 19.
- In Mental Hospitals, 65.
- Members of Parliament, 107.
- Population, 19.
- Schools for, 73.
- Maori-war Pensions, 307.
- Marine Fish-hatchery, 248.
- Mark Signatures of Persons married, 35.
- Market-gardens, 218.
- Marriages, 29–35.
- Dissolution of. 90.
- Maternity Allowances, 313.
- Maternity Hospitals, 61.
- Maturity of Loans, Dates of, 347.
- Mauke Island, 387.
- Meat—
- Export of, 128–145.
- Requisition of, 165.
- Retail Prices, 356–363.
- Medical Inspection of School-children, 70.
- Medical Practitioners, Registration of, 56.
- Medicine, School of, Dunedin, 61.
- Memorabilia, 399.
- Mental Defectives, 62.
- Mental Hospitals, 62–66.
- Mercantile Marine, Training of Boys for, 87.
- Mercury-mines, 258.
- Metal Mines, Accidents at, 262.
- Meteorology, 384.
- Metropolitan and Suburban Areas—
- Population, 17.
- Midwives, Registration of, 61.
- Migration, External, 3.
- Military Forces, 84–87.
- Military Pensions, 307.
- Milking-machines, 233.
- Milk-testing, 233.
- Mills, Wool used at, 233.
- Minerals, 254.
- Miners’ Pensions, 264, 307.
- Mining, 254–264.
- Produce exported, 129–145.
- Mining Act, Board of Examiners under, 264.
- Mining Advances, 262.
- Ministers of each Denomination, 34.
- Marriages by, 34.
- Minors, Marriages of, 32.
- Mitiaro Island, 387.
- Money-orders issued and paid, 182.
- Money, Purchasing-power of, 359.
- Morbidity, 49–55.
- Mortality, Index of, 39.
- Mortality, Infantile, 42.
- Mortality Investigation, 38.
- Mortgages, 203.
- Mothers, Ages of, 25.
- In Illegitimate Cases, 25.
- Motive-power in Factories, 280.
- Movement in Retail Prices, 362.
- Movement of Specie and Bullion, 125.
- Mules, 222, 224, 242.
- Municipal Fish-markets, 250.
- Mutton consumed and exported, 231.
- Mutton, Export Prices of. 370.
N.
- Nassau Island, 388.
- National Endowments, 189.
- National Provident Fund, 313.
- National Scholarships, 76.
- Nationality of Vessels, 171.
- Native Grasses, 221.
- Native Land Act (1909), 199.
- Native Land Court, 199.
- Native Land Purchase Board, 200.
- Native Lands, 199, 200.
- Native Schools, 73.
- Natural Increase of Population, 2, 21.
- Naturalization, 10.
- Nauru Island, 392.
- Naval Defence, 86.
- Navigator Islands, 391.
- Nephrite, 261.
- Net Indebtedness, 344.
- Newspapers—
- Posted, 181.
- Registered, 182.
- “New Zealand,” H.M.S., 87.
- New Zealand Produce exported, 128–145.
- New Zealand University, 81.
- Nisi Decrees in Divorce, 90.
- Niue, Island of (vide Cook Islands).
- No-license Districts, 112.
- Note-issue of Banks, 318.
- Notification of Infectious Diseases, 49.
- Nullity of Marriage, 90.
- Nurseries and Plantations, 246.
- Nurses, Registration of, 61.
O.
- Oats, 215.
- Exported, 216.
- Occupation, Area of Land in, 205, 210.
- Occupation of Land, 205–208, 210.
- Occupation with Right of Purchase, 188, 195.
- Ocean Cables, 185.
- Offences by Juveniles, 94.
- Offences of Convicted Persons, 93.
- Offences of Prisoners, 99.
- Officers, Training of, 86.
- Officiating Ministers, 34.
- Oil, 260.
- Old-age Pensions, 306.
- Orchards, 218.
- Ornamental Stones, 261.
- Orphanages, 62, 79.
- Orphanhood, 40.
- Otekaike Special School, 80.
- Outlying Islands, 385–392.
- Oversea Shipping, 170.
- Overseas Forces, 84.
- Ownership of Land, 191, 205–208.
- Oyster-picking, 248.
P.
- Pacific Cable, 185.
- Pacific Islands annexed in 1901, 386.
- Packet Licences, 109.
- Palmerston Island, 387.
- Parapara Iron-ore Deposit, 256.
- Parcel-post, 181.
- Parliamentary Elections, 102–108.
- Parry Island (Mauke), 387.
- Passengers, Railway, 176.
- Passports, 4.
- Pastoral Produce exported, 128–145.
- Pasture Grasses, 220.
- Patents, Designs, and Trade-marks, 383.
- Patients in Mental Hospitals, 62.
- Patients in Public Hospitals, 50.
- Peas and Beans, 217.
- Export of, 217.
- Pelts, Export of, 128–145.
- Penrhyn Island, 387.
- Pensions, 306–311.
- Military (Maori War), 307.
- Miners’, 307.
- Old-age, 306.
- Police, 311.
- South African War, 310.
- War, 307.
- Widows’, 306.
- Permanent Military Forces, 86.
- Permission to enter New Zealand, 5.
- Permits and Passports, 4.
- Petroleum, 260.
- “Philomel,” H.M.S., 87.
- Phormium Tenax, 218.
- Fibre exported, 128–145, 218.
- Phosphate Rock, 261.
- Phthisis, 44, 45, 52.
- Miner's, 307.
- Physical Instruction of School-children, 70.
- Pig-iron Manufacture, 257.
- Pigs, 222–225, 243.
- Plantations, 218.
- State, 246.
- Platinum, 258.
- Pleasant Island, 392.
- Plumbers Registration Act, 58.
- Plural Births, 24.
- Police, 88, 91.
- Pensions, 311.
- Policies, Life-assurance, 321.
- Poll, Licensing, Results of, 111.
- Population, 1–20.
- Pork consumed, 243.
- Portobello Marine Fish-hatchery, 248.
- Ports—
- Exports, 143.
- Imports, 149.
- Shipping, 171, 172.
- Postal and Telegraphic, 181–186.
- Postal Notes, 182.
- Post Office Savings-bank, 318.
- Potatoes, 217.
- Poultry-farming, 243.
- Pounamu, 261.
- Power in Factories, 280.
- Power, Water, 265–274.
- Preferential Tariff. 163.
- Prices, 353.
- Effect on Exports, 142.
- (Export) of Mutton, 370.
- Of Stock, 351.
- Retail: Index Numbers, 354.
- Wholesale, 368.
- Primary Schools, 69.
- Principal Events, Dates of, 399.
- Prisoners, 98–100.
- New-Zealand-born, 100.
- Tree-planting by, 100.
- Prisons, 98–100.
- Prisons Board, 100.
- Private Hospitals, 61, 66.
- Private Railways, 179.
- Private Savings-banks, 319.
- Private Scholarships, 76.
- Private Schools, 72.
- Private Wealth, 381.
- Probate, Estates passed for, 381.
- Probation Act, First Offenders’, 100.
- Products of Manufactories, 284.
- Prospecting-drills, Government, 263.
- Protection of Infant Life, 80.
- Provident Fund, National, 313.
- Provincial Districts—
- Industries in, 288.
- Population, 13.
- Public Debt, 344–352.
- Extinction Fund, 350.
- Public Finance, 328–352.
- Public Health, 56–58.
- Public Hospitals—
- Admissions and Discharges, 50.
- Ages of Patients, 50.
- Diseases treated in, 50.
- Finances, 58.
- Public Instruction, 68.
- Public Reserves, 189.
- Public Service Superannuation, 311.
- Public Schools, 69.
- Public Trust Office, 377.
- Public Works Co-operative System, 298.
- Public Works Fund, 333.
- Publicans’ Licenses, 109.
- Puerperal Accidents and Diseases, 47, 54.
- Pukapuka Island, 387.
- Pulmonary Tuberculosis, 44, 45, 52.
- Pulse Crops, 211.
- Punishments by Courts, 92.
- Pupils at Public Schools, 70.
- Purchase of Estates by Government, 191.
- Purchase of Native Lands, 200.
- Purchase of Products by Imperial Government, 165–169.
- Purchasing-power of Money, 359.
Q.
- Quarries (Stone), 262.
- Quartz-mining, 255.
- Quicksilver-mining, 258.
- Quinnat Salmon, 249.
- Quotations, New Zealand Stock, 351.
R.
- Rabbits, Requisition of, 169.
- Race Aliens, 9.
- Racing, Tax on, 342.
- Radio-telegraph, 184.
- Railway Districts, Finances of, 114.
- Railways, 175–180
- Private, 179.
- Superannuation Fund, 313.
- Rainfall, 384.
- Rakaanga Island, 387.
- Rarotonga Island, 386.
- Rateable Value of Land, 119–122.
- Rates collected by Local Bodies, 114.
- Reciprocity with South Africa, 164.
- Re-exports, 126, 141.
- Reformative Detention, 100.
- Registered Factories, 296.
- Registered Vessels, 170.
- Registrars, Marriages before, 34.
- Registration—
- Of Aliens, 11.
- Of Births, 21.
- Of Dairy Companies, 238.
- Of Deaths, 36.
- Of Deeds. 201.
- Of Dentists, 57.
- Of Factories, 296.
- Of Industrial Unions, 296.
- Of Marriages, 29.
- Of Medical Practitioners, 56.
- Of Newspapers, 182.
- Of Nurses and Midwives, 61.
- Of Plumbers, 58.
- Of Vessels, 170.
- Under Defence Act, 85.
- Relief Fund, Coal-miners’, 264.
- Religious Denominations—
- Marriages by Ministers of, 34.
- Ministers on Marriage List, 34.
- Renewable Leases, 191, 195.
- Rent, Restrictions on, 298.
- Rents, House, 358, 364.
- Repatriation of Soldiers, 372–376.
- Representation, 102–108.
- Requisitions for War Purposes, 165–169.
- Reserve Funds of Banks, 315.
- Reserves administered by Land 189.
- Reserves, Public, 189.
- Restriction, Immigration, 8.
- Retail-price Movements, 362.
- Retail Prices: Index Numbers, 354.
- Revenue and Expenditure, 328–336.
- Revenue, Customs, 155.
- Revenue, Public, 328–336.
- Revenue, Railway, 175.
- Rifle Association, 86.
- Rifle Clubs, 86.
- River Boards, Finances of, 114.
- Road Boards, Finances of, 114.
- Roads, Expenditure on, 334.
- Roads on Goldfields, Subsidized, 263.
- Rock Oysters, 248.
- Rolling-stock, Railways, 175.
- Roman Catholic Schools, 72
- Root Crops, 213.
- Rural Population, 14.
- Rye-grass, 213.
S.
- St. Helens Hospitals, 61.
- Salaries paid to Factory Employees, 279.
- Sale of Food and Drugs, 57.
- Salmon, Acclimatization of, 249.
- Samoa, 391.
- Exports to, 145.
- Imports from, 154.
- Sanitation, 56.
- San Pablo Island, 387.
- Savage or Niue Island (vide Cook Islands).
- Savaii, Island of, 391.
- Savings-banks, 318–320.
- Scaffolding Inspection Act, 297.
- Scheelite, 257.
- Requisition for War Purposes, 169.
- Scholars, 70.
- Scholarships, 76.
- School Journal, 71.
- School Libraries and Class-books, 71.
- Schools, 67–83.
- Of Mines, 263.
- Seals, 249.
- Seamen, 173.
- Secondary Education, 74.
- Seeds, Grass and Clover, 220.
- Exported, 140.
- Selections of Land, 189, 190.
- Senior Cadets, 85.
- Sentences of Criminals, 96.
- Settlement Conditions, Selections under, 190.
- Settlements, Land for, 192.
- Settlers, Advances to, 300.
- Sexes—
- Of Children born, 24.
- Of Persons dying, 36.
- Of Public-school Children, 70.
- Shearers’ Accommodation Act, 298.
- Sheep, 222–232.
- Sheep-skins and Pelts exported, 128–145.
- Requisition of, 169.
- Shipping, 170–174.
- Shops and Offices Act, 297.
- Signatures, Mark, of Persons married, 35.
- Silver, Production of, 256.
- Sinking Funds, 350.
- Skins and Hides, Requisition of, 169.
- Slaughter of Animals for Food—
- Cattle, 237.
- Pigs, 243.
- Sheep and Lambs, 231.
- Soldiers, 84.
- Acquisition of Land by, 194.
- Dwellings, 196.
- Financial Assistance to, 196, 376.
- Pensions, 307.
- Repatriation of, 372–376.
- War Bursaries for Dependants, 77.
- Soldiers (Discharged) Settlement, 194.
- South Africa, Reciprocity with, 164.
- South African War Pensions, 310.
- Sown Grasses, Extent of, 220.
- Special Schools, 79.
- Specie, Movement of, 125.
- Spirits, Consumption of, 97.
- Stakes, Tax on, 342.
- Standardized Death-rates, 39.
- State Advances, 300–305.
- State Afforestation, 245.
- State Aid—
- To Dairy Industry, 238.
- To Friendly Societies, 380.
- To Kauri-gum Industry, 261.
- To Local Authorities, 303.
- To Mining, 262.
- To Settlers, 300.
- To Tree-planting, 245.
- To Water-power, 267.
- To Workers, 302.
- State Coal-mines, 260.
- State Forests, 246
- State Instruction, 68.
- State Insurance—
- Accident, 324.
- Fire, 326.
- Life, 323.
- State Railways, 175.
- State Schools, 69.
- Statistical Summary, 393–398.
- Still-births, 28.
- Stipendiary Magistrates’ Courts—
- Civil Cases, 88.
- Criminal Cases, 92.
- Stock, Character of, 346.
- Stock, Live, 222.
- Stock, Quotations for, 351.
- Stones, Building and Ornamental, 261.
- Strikes, 297.
- Subdivision of Land, 191.
- Subsidized Prospecting, 263.
- Subsidized Roads on Goldfields, 263.
- Suburban Areas, Population of, 17.
- Succession Duty, 341.
- Sugar imported and consumed, 151.
- Suicide, 100.
- Sulphur, 258.
- Summary Convictions, 93.
- Sumner School for Deaf, 80.
- Superannuation, 31–314.
- Supplies for Imperial Government, 165–169.
- Supreme Court—
- Civil Cases, 88.
- Criminal Cases, 95.
- Surtax, Preferential, 163.
- Survey of Ships, 173.
- Suwarrow Island, 387.
- Syphilis Cases in Hospitals, 53.
T.
- Takutea Island, 388.
- Tallow exported, 128–145.
- Taranaki Ironsand. 256.
- Tariff, Customs, 155–164.
- Tax, Land and Income, 338.
- Tax on Totalizator Investments, 342.
- Taxation, 337–343.
- Taxpayers, Number of, 340.
- Teachers, Public-school, 71.
- Superannuation Fund, 312.
- Training of, 72.
- Tea imported and consumed, 151.
- Technical Education, 78.
- Telegraphic and Postal, 181–186.
- Telephones, 183.
- Temperature, 384.
- Tenure of Occupied Lands, 207.
- Territorial Forces, 85.
- Timber—
- Consumption of, 247.
- Export of, 128–145.
- Plantations, 246, 247.
- Supplies of, 246.
- Tin, 258.
- Title, Certificates of, issued, 202.
- Tobacco-culture, 218.
- Tobacco imported and consumed, 151.
- Customs and Excise Revenue from, 156.
- Tomato-culture, 220.
- Tongareva Island, 387.
- Tonnage of Vessels entered and cleared, 170–172.
- Totalizator Taxation, 342.
- Total Trade, 123–127.
- Town Districts—
- Finances of, 114.
- Population of, 17.
- Value of Land and Improvements, 122.
- Trade, 123–169.
- Board of, 370.
- Trade-marks, 383.
- Training of Defence Forces, 85.
- Training of Discharged Soldiers, 374.
- Training of Officers, 86.
- Training of Teachers, 72.
- Training-ship “Amokura,” 87.
- Train-miles run, 176.
- Tramway Boards, Finances of, 114.
- Transfer, Land, 201–204.
- Tree-planting, 245.
- By Farmers, 247.
- By Prisoners, 100.
- Trout, Acclimatization of, 249.
- Tuberculosis, 44, 45, 52.
- Tungsten, 257.
- Turkeys, 243.
- Turnips, 218.
- Twins and Triplets born, 24.
U.
- Undeveloped Water-power, 273.
- Unimproved Value of Land, 119.
- Rating on, 114.
- Unions registered, 296.
- University of New Zealand, 81.
- Scholarships and Bursaries, 82.
- Upolu, Island of, 391.
- Urban Population, 15.
- Urban Drift of Population, 18.
V.
- Vaccination, 56.
- Valuation of Land, 119–122.
- Value of Exports affected by Prices, 142.
- Value of Factory Property, 287.
- Value of Output of Factories, 284.
- Venereal Diseases: Hospital Cases, 53.
- Vessels entered and cleared, 171.
- Nationality of, 171.
- Vessels registered, 170.
- Vineyards, 210, 220.
- Vital Statistics, 21–55.
- Voluntary Inmates of Mental Hospitals, 64.
W.
- Wages, 371.
- Wages paid to Factory Employees, 279.
- Waikato Electric-power, 269.
- Waipori Power-supply, 270.
- Wakari Private Mental Hospital, 66.
- War, 85.
- Bursaries, 77.
- Expenditure, 85, 345.
- Increases in Food-prices, 361.
- Pensions, 307.
- War-service Gratuity, 84.
- Water-power, 265–274.
- Water-races, Government, 263.
- Waterside Workers, 173.
- Water-supply Boards, Finances of, 114.
- Wealth, Private, 381.
- Weather, 384.
- Welfare of Children, 79.
- Wellington Fish-market, 250.
- Western Samoa, 391.
- Whaling, 249.
- Wheat, 214.
- Export of, 128–145.
- White Island Sulphur, 258
- Wholesale Prices, 368.
- Widows’ Pensions, 306.
- Wine, Consumption of, 97, 151.
- Wine Licenses, 109.
- Wireless Telegraphy, 184.
- Women, Deaths of, in Childbirth, 47.
- Women's Branch, Labour Department, 299.
- Wool, 232.
- Exported, 128–145.
- Requisition of, 168.
- Used at Local Mills, 168, 233.
- Wool used at Local Mills, 168, 233.
- Workers, Advances to, 302.
- Workers’ Compensation Act, 298.
- Workers’ Dwellings, 304.
- Workers’ Educational Association, 83.
- World's Gold-production, 256.
- World's Sheep Flocks, 232.
- Wrecks, 174.
Y.
- Yields of Crops, 212.