
Table of Contents
THE “New Zealand Official Year-book,” now in its twenty-fourth year of publication, presents, in summary form, the latest information concerning the Dominion and its resources. Statistics are given of the various aspects of New Zealand life, and these figures are supported and illustrated by letterpress and by a considerable number of diagrams, so that, it is hoped, the information given is rendered more attractive and accessible. In the present issue, the statistics given are for the calendar year 1914, or the financial year 1914-15, with the exception of a few tables dealing with local governing bodies, valuation of land, life insurance, and those matters for which statistics cannot be obtained annually.
In the main this volume follows the same lines as in previous years; but the whole book has been revised, and in some places rearranged. A considerable quantity of new matter has been added, including a section on prices and a subsection on morbidity. The sections dealing with commerce and shipping have been entirely rewritten, and the results of the recent mortality investigation are shown in a subsection of the vital statistics.
The principal item in the supplementary portion of the book is a special article “The External Trade of New Zealand,” by Mr. J. B. Condliffe, M.A., F.R.E.S., Compiler for trade statistics in this office. The series of special articles on geographical features of the Dominion is continued by a discussion of “The Lakes of New Zealand” by Mr. R. Speight, M.Sc., F.G.S.
My thanks are due to those responsible Government officers who have supplied information, and also to the staff of the Statistical Office for their valuable and willing assistance.
Every care has been taken to provide for the accuracy of the statistics given; but where the mass of figures used is so great it would be idle to hope that all errors have been eliminated. I should be grateful if readers would supply information concerning any errors which they may detect.
This issue of the Year-book has been unavoidably delayed mainly by the abnormal demands made upon the Statistical Office by the circumstances arising out of the war. The reorganization of the trade statistics has also contributed to the delay.
Principally with the view of expediting the binding processes, the cover of the Year-book has been altered, and it has been decided that for the future all copies of the Year-book will be issued for sale at a uniform price of 2s. 6d.
In addition to the Year-book, there is published from this office a “Monthly Abstract of Statistics” giving the latest available information in connection with the more important aspects of New Zealand's activities. Full and complete details are published annually in the “Statistics of New Zealand” (four volumes). During 1915 also a “Report on the Cost of Living” was published, covering the period 1891-1914, and containing a special chapter dealing with the “War Increases.”
MALCOLM FRASER,
Government Statistician.
Census and Statistics Office,
Wellington, 13th January, 1916.
Table of Contents
THE Dominion of New Zealand consists of three main islands, with several groups of smaller islands lying at some distance from the principal group. The main islands, known as the North, the South, and Stewart Islands, have a coast-line 4,330 miles in length: North Island, 2,200 miles; South Island, 2,000 miles; and Stewart Island, 130 miles. Other islands included within the Dominion are the Chatham, Auckland, Campbell, Snares, Antipodes, Bounty, and Kermadec Islands. The Cook Group of islands and certain neighbouring islands were included in the Dominion by proclamation of the 10th June, 1901.
The total area of the Dominion proper (i.e., excluding the islands annexed in 1901) is 66,292,232 acres or 103,581 square miles. The land area of the Cook Group is about 150 square miles, and of the other islands annexed in 1901 about 130 square miles. Full information as to boundaries and area, together with descriptive matter relating to the physical features of the various portions of the Dominion, will be found in the 1913 issue of this book.
The geologic structure of New Zealand, so far as it has yet been determined is, owing to its complexity, difficult to summarize. For a fuller account than can be given here the reader is referred to the article in the 1914 Year-book, pages 943–47, and to the various works on geology mentioned therein.
The oldest fossiliferous rocks are the Ordovician argillites (“slates”) of North-west Nelson and Preservation Inlet. At Baton River Silurian fossils, at Reefton Devonian fossils, and in the limestone near Nelson Carboniferous or Permo-Carboniferous fossils, show that these systems are all represented in the Palæozoic sequence. Included in it are marble, sandstone, shale, greywacke, quartzite, schist, and gneiss. The auriferous lodes of the South Island are almost always found cutting through rocks of Palæozoic age.
Rocks belonging to the Mesozoic periods occur over a large area in both Islands. The Trias-Jura system of greywacke and argillite forms the main mountain-ranges, but contains few workable mineral deposits. It is fossiliferous in only a few localities, and cannot be easily subdivided.
While all these foregoing rocks were being deposited the New Zealand area was probably the foreshore of a great continent, but after the Trias-Jura sediments were deposited far-reaching changes, involving the breaking-up and disappearance of the continental land, took place. The New Zealand area was necessarily involved in these earth-movements, and as the result the existing strata were folded, broken, and raised above sea-level. After extensive denudation of its surface had taken place New Zealand was again, probably several times, depressed and elevated either in whole or in part. During the periods of subsidence Cretaceous and Tertiary strata were laid down. These contain all the workable coal-seams of the Dominion.
Pleistocene and Recent deposits are well represented by fluviatile, glacial, marine, and wind-blown material.
Plutonic rocks of various types, but mainly granitic, occupy a large area in the western parts of the South Island and occur also in North Auckland. Volcanic rocks, chiefly of Tertiary age, are found in scattered areas throughout the eastern part of the South Island and occur extensively in the North Island, where volcanic activity still continues on a small scale.
The maps illustrating the article on the geology of New Zealand in the 1914 Year-book are reproduced in this volume, and will serve as a supplement to these brief notes.
The rivers of New Zealand were fully discussed in the 1914 issue of this book in an article (pages 948–56), supplied by R. Speight, Esq., M.Sc., F.G.S., Curator of the Canterbury Museum. Considerations of space in the present book prevent more than a list of the more important rivers being given. These are as follows, the lengths shown being in most cases only approximate. Very few of these rivers are navigable by vessels of any size.
| North Island. | |
|---|---|
| Miles. | |
| Flowing into the Pacific Ocean— | |
| Piako | 60 |
| Waihou or Thames | 90 |
| Rangitaiki | 95 |
| Whakatane | 60 |
| Waiapu | 55 |
| Waipaoa | 50 |
| Wairoa | 50 |
| Mohaka | 80 |
| Ngaururoro | 85 |
| Tukituki | 65 |
| Flowing into Cook Strait— | |
| Ruamahanga | 70 |
| Hutt | 35 |
| Otaki | 30 |
| Manawatu (tributaries: Pohangina and Tiraumea) | 100 |
| Rangitikei | 115 |
| Turakina | 65 |
| Wangaehu | 85 |
| Wanganui (tributaries: Ohura, Tangarakau, and Maunganui-te-ao) | 140 |
| Waitotara | 50 |
| Patea | 65 |
| Flowing into Tasman Sea— | |
| Waitara (tributary: Maunganui) | 65 |
| Mokau | 75 |
| Waikato (tributary: Waipa) | 220 |
| Wairoa | 95 |
| Hokianga | 40 |
| South Island. | |
| Flowing into Cook Strait— | |
| Aorere | 45 |
| Takaka | 45 |
| Motueka | 75 |
| Wai-iti | 30 |
| Pelorus | 40 |
| Wairau (tributary: (Waihopai) | 105 |
| Awatere | 70 |
| Flowing into the Pacific Ocean— | |
| Clarence (tributary: Acheron) | 125 |
| Conway | 30 |
| Waiau (tributary: Hope) | 110 |
| Hurunui | 90 |
| Waipara | 40 |
| Ashley | 55 |
| Waimakariri (tributaries: Bealey, Poulter, Esk, and Broken River) | 93 |
| Selwyn | 55 |
| Rakaia (tributaries: Mathias, Wilberforce, Acheron, and Cameron) | 95 |
| Ashburton | 67 |
| Rangitata | 75 |
| Opihi | 50 |
| Pareora | 35 |
| Waihao | 45 |
| Waitaki (tributaries: Tasman, Tekapo, Ohau, Ahuriri, and Hakataramea | 135 |
| Kakanui | 40 |
| Shag | 45 |
| Taieri | 125 |
| Clutha (tributaries: Kawarau, Makarora, Hunter, Manuherikia, and Pomahaka) | 210 |
| Flowing South into Foveaux Strait— | |
| Mataura | 120 |
| Oreti | 105 |
| Aparima | 65 |
| Waiau (tributaries: Mararoa, Clinton, and Monowai) | 115 |
| Flowing into the Tasman Sea— | |
| Cleddau and Arthur | 20 |
| Hollyford | 50 |
| Cascade | 40 |
| Arawata | 45 |
| Haast (tributary: Landsborough) | 60 |
| Karangarua | 30 |
| Fox | 25 |
| Waiho | 20 |
| Wataroa | 35 |
| Wanganui | 35 |
| Waitaha | 25 |
| Hokitika (tributary: Kokatabi) | 40 |
| Arahura | 35 |
| Teramakau (tributaries: Otira and Taipo) | 45 |
| Grey (tributaries: Ahaura, Arnold, and Mawhera-iti) | 75 |
| Buller (tributaries: Matakitaki, Maruia, and Inangahua) | 105 |
| Mokihinui | 30 |
| Karamea | 45 |
| Heaphy | 25 |
In the 1913 issue of the Year-book (pages 32 to 34) appears a short account of the Flora of New Zealand, supplied by Dr. L. Cockayne, F.R.S. The article covers briefly the various points of interest in connection with the flora of the main Islands, and deals also with that of the outlying islands.
For information re the fauna of New Zealand the reader is referred to the article by James Drummond, Esq., F.L.S., F.Z.S., appearing on pages 957 to 961 of the Year-book for 1914. The article, though brief, contains a fairly comprehensive account of the Dominion's fauna.
The first authentic account of the discovery of New Zealand is that given by Abel Jansen Tasman, the Dutch navigator. He left Batavia on the 14th August, 1642, in the yacht “Heemskercq,” accompanied by the “Zeehaen” (or “Sea-hen”) fly-boat. After having visited Mauritius, and discovered Tasmania, named by him “Van Diemen's Land,” in honour of Anthony van Diemen, Governor of the Dutch possessions in the East Indies, he steered eastward, and on the 13th December of the same year sighted the west coast of the South Island of New Zealand, described by him as “a high mountainous country.”
Tasman, under the belief that the land he saw belonged to a great polar continent, and was part of the country discovered some years before by Schouten and Le Maire, to which the name of Staten Land had been given, gave the same name of Staten Land to New Zealand; but within about three months afterwards Schouten's “Staten Land” was found to be merely an inconsiderable island. Upon this discovery being announced, the country that Tasman had called Staten Land received the name of “New Zealand,” by which it has ever since been known. Tasman sailed along the coast to a bay, where he anchored. To this he gave the name of Murderers (since termed Massacre or Golden) Bay, on account of an unprovoked attack on a boat's crew by the Natives, and the massacre of four white men. Thence he steered along the west coast of the North Island, and gave the name of Cape Maria van Diemen to the north-western extremity thereof. After sighting the islands of the Three Kings he finally departed, not having set foot in the country.
There is no record of any visit to New Zealand after Tasman's departure until the time of Captain Cook, who, after leaving the Society Islands, sailed in search of a southern continent then believed to exist. He sighted land on the 6th October, 1769, at Young Nick's Head, and on the 8th of that month cast anchor in Poverty Bay. After having coasted round the North Island and the South and Stewart Islands—which last he mistook for part of the South Island—he took his departure from Cape Farewell on the 31st March, 1770, for Australia. He visited New Zealand again in 1773, in 1774, and in 1777.
M. de Surville, a French officer in command of the vessel “Saint Jean Baptiste,” while on a voyage of discovery, sighted the north-east coast of New Zealand on the 12th December, 1769, and remained for a short time. A visit was soon after paid by another French officer, M. Marion du Fresne, who arrived on the west coast of the North Island of New Zealand on the 24th March, 1772, but was, on the 12th June following, murdered at the Bay of Islands by the Natives.
Captain George Vancouver in the “Discovery,” accompanied by Captain Broughton in the “Chatham,” anchored in Dusky Bay, on the west coast of the South Island, on the 2nd November, 1791, and remained there until the 21st. After leaving Dusky Bay the two vessels parted company during a gale, not meeting again until their arrival at Otaheite. During the passage of the “Chatham” to this place, Captain Broughton discovered and named the Chatham Islands (on the 29th November, 1791).
On the 5th November, 1792, the “Britannia” (Captain Raven) anchored in Facile Harbour, on the west coast of the South Island. She had come from Sydney for the purpose of procuring seal-skins. A party of men was landed and accommodation for them built, and, on the 1st December the “Britannia” sailed for the Cape of Good Hope. On her return on the 27th December, 1793, the men were found to be in good health. So far as is known, this was the first instance of Europeans being left in New Zealand to their own resources.
The Spanish expedition in the vessels “Descubrierta” and “Atrevida,” the former commanded by Alejandro Malaspina and the latter by José de Bustamente y Guerra, sighted the west coast of the South Island on the 25th February, 1793. A boat's crew went into Doubtful Bay, whilst the vessels remained off the entrance. Next morning they unsuccessfully attempted to enter Dusky Bay, but the weather becoming stormy they left for Sydney, after giving Spanish names to several places in and around Dusky and Doubtful Bays.
In 1793 also the “Dædalus,” under the command of Lieutenant Hanson, was sent by the Government of New South Wales to New Zealand, and two chiefs were taken thence to Norfolk Island. There was after this an occasional intercourse between the islands of New Zealand and the English settlements in New South Wales.
On the 23rd May, 1820, Thaddeus Bellingshausen, in command of the two Russian ships “Wostok” and “Mirny,” sailed into Cook Strait, in the course of his voyage round the world. The vessels anchored in Queen Charlotte Sound on the 28th May, and remained there till the 3rd June.
In 1814 the first missionaries arrived in New Zealand—Messrs. Hall and Kendall—who had been sent as forerunners by Mr. Marsden, chaplain to the New South Wales Government. After a short stay they returned to New South Wales, and on the 19th November of that year again embarked in company with Mr. Marsden, who preached his first sermon in New Zealand on Christmas Day, 1814. He returned to Sydney on the 23rd March, 1815, leaving Messrs. Hall, Kendall, and King, who formed the first mission station at Rangihoua, Bay of Islands, under the auspices of the Church Missionary Society. Six years later, in 1821, the work of evangelization was put on a more durable basis; but the first station of the Wesleyan mission, established by Mr. Leigh and his wife, at the valley of the Kaeo, Whangaroa, was not taken possession of until the 10th June, 1823.
Almost immediately after Cook returned to England on the completion of his first voyage round the world there was published in London, on the 29th August, 1771, a pamphlet by Alexander Dalrymple, entitled “Scheme of a Voyage to convey the Conveniences of Life, Domestic Animals, Corn, Iron, &c., to New Zealand [sic], with Dr. Benjamin Franklin's Sentiments upon the Subject.” The idea Dalrymple had in mind was to civilize the Maoris by furnishing them with useful commodities, taking in exchange whatever goods the Natives could supply by way of trade. Dalrymple being unsuccessful in raising money to carry out his plan the matter dropped, but he was the first to suggest the idea of opening up commerce with New Zealand, thus paving the way for its colonization.
The first attempt at colonization was made in 1825 by a company formed in London, and called the New Zealand Company. An expedition was sent out under the command of Captain Herd, who acquired tracts of land at Hokianga, at Manakau, and on the borders of the Thames. The company was prevented by adverse circumstances from forming a settlement. In the same year two other persons—namely, Baron Charles de Thierry and Mr. William Stewart—were trying to form colonization companies in London. The former chose for his sphere the North Island and the latter Stewart Island, but neither scheme was successful.
In consequence of frequent visits of whaling-vessels to the Bay of Islands, a settlement grew up at Kororareka—now called Russell—and in 1833 Mr. Busby was appointed British Resident there. A number of Europeans gradually settled in different parts of the country, and married Native women.
In 1837 the New Zealand Association was formed, to apply to New Zealand the Wakefield system of colonization. A Royal Charter was applied for, but the terms offered by the British Government not being acceptable, the association dissolved. Some of the members of this association formed a plan for the prosecution of its leading objects by means of a joint-stock company. On the 29th August, 1838, a private copartnership was established under the name of “The New Zealand Colonization Company.” By the spring of 1839 it had raised sufficient funds to purchase an extensive territory (principally surrounding Hokianga and Kaipara Harbours), and to fit out a preliminary expedition for surveying the coasts, making further purchases, and preparing for the early arrival of settlers. On the 2nd May, 1839, the New Zealand Colonization Company ceased to exist, and the New Zealand Company (the second of that name) was formed with a capital of £100,000 in 4,000 shares of £25 each, to establish settlement in New Zealand on systematic principles.
On the 22nd January, 1840, the first body of immigrants arrived in Port Nicholson, and founded the town of Wellington. About the same time—namely, on the 29th January, 1840—Captain Hobson, R.N., arrived at the Bay of Islands, empowered, with the consent of the Natives, to proclaim the sovereignty of Queen Victoria over the Islands of New Zealand, and to assume the government thereof. A compact called the Treaty of Waitangi, to which in less than six months five hundred and twelve names were affixed, was entered into, whereby all rights and powers of sovereignty were ceded to the Queen, all territorial rights being secured to the chiefs and their tribes. The seat of Government was established at Waitemata (Auckland), and a settlement formed there.
The New Zealand Company having decided to form another settlement, to which the name of “Nelson” was to be given, despatched a preliminary expedition from England in April, 1841, for the purpose of selecting a site. The spot chosen was the head of Blind Bay, where a settlement was established. About the same time a number of pioneers arrived in Taranaki despatched thither by the New Plymouth Company, a colonizing society which had been formed in England, and had bought 50,000 acres of land from the New Zealand Company.
The next important event in the progress of colonization was the arrival at Port Chalmers, on the 23rd March, 1848, of the first of two emigrant ships sent out by the Otago Association for the foundation of a settlement by persons belonging to or in sympathy with the Free Church of Scotland.
In 1849 the “Canterbury Association for founding a Settlement in New Zealand” was incorporated. On the 16th December, 1850, the first emigrant ship despatched by the association arrived at Port Cooper, and the work of opening up the adjoining country was set about in a systematic fashion, the intention of the promoters being to establish a settlement complete in itself, and composed entirely of members of the then United Church of England and Ireland.
The rich tussock plains of Canterbury yielded at once to the efforts of the settlers, and the province soon became the great pastoral and agricultural centre of the colony. Grain and wool were exported, and the volume of trade increased rapidly. The district grew prosperous, and many of the settlers became wealthy men. The foresight of the founders of the settlement provided for endowments for schools and churches, and for the construction of roads and bridges, and when the provinces were abolished in 1875 Canterbury handed over not only a well-equipped district but a large credit balance at its bankers.
Up to the early sixties Otago had made a slow but steady advance, much of the province being adapted to agriculture, to which the energies of the majority of the early settlers were devoted. In 1861, however, gold was discovered in the Lindis Valley, and this, together with further rich finds in Gabriel's Gully and various other parts of Otago, attracted people from all parts of Australasia. The province rapidly increased in wealth and prosperity, and Dunedin soon became a thriving and populous commercial centre.
Southland advanced steadily, mainly on account of its rich agricultural and pastoral lands; and in the northern and western parts of the South Island good progress was also made. Marlborough and the eastern portion of Nelson, with their good soil and attractive climate, became the homes of farming communities, while West-land and the west coast of Nelson owed their progress to rich finds of gold and coal.
For many years the North Island lagged behind the South Island. Its progress was retarded by troubles with the Maoris, and in the early days many settlers, terrified by the warlike attitude of the aboriginals, abandoned their farms and left New Zealand. The unrest caused by the wars put a stop to settlement, and for years left the interior of the Island a terra incognita. After the initial conflicts with the Natives when the British flag was hoisted at the Bay of Islands, colonization proceeded quietly at Auckland, New Plymouth, Wanganui, Wellington, and Hawke's Bay.
In 1861, however, a serious misunderstanding arose at Waitara over the question of land, and almost without warning active hostilities were commenced by the Natives. The Taranaki settlers were driven from their homes, and the labour of years was destroyed in a few weeks. Blood was shed, and many men were killed on both sides. Soon the whole country from Auckland to Wellington was in arms. The settlers around Wanganui, Napier, and Wellington were forced to leave their farms and take refuge in the towns, and for a time all progress was stayed. Over ten thousand troops were brought from England to quell the disturbance, and after several years of fighting the Maoris at last sued for peace. The Waikato Natives lost their land, which was confiscated and handed over to military settlers, who soon converted the district into a thriving farming centre. Slowly the settlers restored their homes and farms, and gradually the North Island became settled by an ever-growing industrious community.
The discovery of rich gold at the Thames in 1367 attracted a large number of people from Australia and from other parts of New Zealand, and since the termination of the Maori wars the North Island has made immense progress, overtaking and, in later years, rapidly outstripping the South Island.
The record of formal Government of New Zealand under the British Crown begins with the following Proclamation issued by Captain William Hobson, R.N., on the 21st May. 1840:—
In the name of Her Majesty VICTORIA, Queen of the United Kingdom of Great Britain and Ireland. By WILLIAM HOBSON, Esquire, a Captain in the Royal Navy, Lieutenant-Governor of New Zealand.
WHEREAS by a treaty bearing date the sixth day of February, in the year of our Lord one thousand eight hundred and forty, made and executed by me, William Hobson, a Captain in the Royal Navy, Consul and Lieutenant-Governor in New Zealand, vested for this purpose with full powers by Her Britannic Majesty of the one part, and the Chiefs of the Confederation of the United Tribes of New Zealand, and the separate and independent Chiefs of New Zealand not members of the Confederation, of the other, and further ratified and confirmed by the adherence of the principal Chiefs of this Island of New Zealand (commonly called the “Northern Island”), all rights and powers of sovereignty over the said Northern Island Were ceded to Her Majesty the Queen of Great Britain and Ireland absolutely and without reservation:
Now, therefore, I, William Hobson, Lieutenant-Governor of New Zealand, in the name and on behalf of Her Majesty do hereby proclaim and declare to all men that from and after the date of the above-mentioned treaty the full sovereignty of the Northern Island of New Zealand vests in Her Majesty Queen Victoria, her heirs and successors for ever.
Given under my hand, at Government House, Russell, Bay of Islands, this twenty-first day of May, in the year of our Lord one thousand eight hundred and forty.
WILLIAM HOBSON,
Lieutenant-Governor.
By his Excellency's command.
WILLOUGHBY SHORTLAND, Colonial Secretary.
From the date of the Proclamation until the 3rd May, 1841, New Zealand remained a dependency of New South Wales, and on the latter date it was created a separate colony by Royal Charter, dated the 16th November, 1840.
The Government of the colony was first vested in a Governor, who was responsible only to the Crown; there was an Executive Council and a Legislative Council with advisory powers only. On the 23rd December, 1847, a Charter was signed dividing the colony into two provinces—New Ulster and New Minister—and this was proclaimed in New Zealand on the 10th March, 1848. The Province of New Ulster consisted of the whole of the North Island with the exception of that portion adjacent to Cook Strait and lying to the south of a line commencing at the centre of the mouth of the Patea River and running thence due east until it reaches the sea on the east coast. The Province of New Munster consisted of the portion of the North Island excluded from New Ulster and the whole of the South and Stewart Islands. Each province had a Lieutenant-Governor, an Executive Council, and a Legislative Council, while the Governor-in-Chief for the whole colony was also Governor of each province. Provision had also been made for a House of Representatives in each province, but this portion of the Charter was suspended for five years, and before it came into operation a new Constitution was obtained.
On the 30th June, 1852, the Act granting representative institutions was passed by the Imperial Parliament, and published in New Zealand by Proclamation on the 17th January, 1853. Under it the constitution of a General Assembly for the whole colony was provided for, to consist of a Legislative Council and a House of Representatives.
By the same Act the Provinces of New Ulster and New Munster were abolished and the colony was divided into six new provinces—Auckland, New Plymouth, Wellington, Nelson, Canterbury, and Otago. Each province was to be presided over by an elective Superintendent, and to have an elective Provincial Council empowered to legislate, except on certain specified subjects. The franchise amounted practically to household suffrage. In each case the election was for four years, but a dissolution of the Provincial Council by the Governor could take place at any time, necessitating a fresh election both of the Council and of the Superintendent. The Superintendent was chosen by the whole body of the electors of the province, and each member of the Provincial Council by the electors of a district. The boundaries of the new provinces were gazetted on the 2nd April, 1853, and the boundaries of the electoral districts on the 14th May following, the first general elections for the House of Representatives and the Provincial Councils being held during 1853 and the beginning of 1854. The Provincial Governments, afterwards increased to ten, but subsequently reduced to nine, remained as integral parts of the Constitution of the colony until the 1st November, 1876, when they were abolished by an Act of the General Assembly, that body having been vested with the power of altering the Constitution Act. On the same day an Act of the General Assembly subdivided the colony (exclusive of the areas included within municipalities) into counties and established a system of local government.
The first Executive for the colony included the Governor and three gentlemen holding office as Colonial Secretary, Attorney-General, and Colonial Treasurer—namely, Messrs. Willoughby Shortland, Francis Fisher, and George Cooper—all appointed on the 3rd May, 1841. The successors of those gentlemen (Andrew Sinclair, appointed 6th January, 1844; William Swainson, appointed 10th August, 1841; and Alexander Shepherd, appointed 9th May, 1842) continued in office until the establishment of Responsible Government on the 7th May, 1856. Only one of them, the Hon. Mr. Swainson, without ceasing to be Attorney-General, sat as a member of the first General Assembly, being Speaker of the Legislative Council. The first session of the General Assembly was opened on the 27th May, 1854, but the members of the Executive were not responsible to Parliament. During the session of that year there were associated with the permanent members of the Executive Council certain members of the House of Representatives. These latter held no portfolios. The first Ministers under a system of responsible government were appointed in the year 1856.
On addresses from both Houses of the General Assembly. His Majesty the King, by Order in Council dated 9th September, 1907, and by Proclamation issued 10th September, 1907, was graciously pleased to change the style and designation of the Colony of New Zealand to “The Dominion of New Zealand”; the change taking effect from Thursday, the 26th September, 1907.
Until the year 1865 the seat of Government of New Zealand was at Auckland, which was proclaimed the capital of the colony in 1842, but for at least two years during that time (1851 and 1852) the General Legislative Council for New Zealand sat in Wellington with the Legislative Council of New Munster. Several attempts were made by members of Parliament, by motions in the Legislative Council and House of Representatives, to have the seat of Government removed to some more central place; but it was not until November, 1863, that Mr. Domett (an ex-Premier) was successful in carrying resolutions in the House of Representatives that steps should be taken for appointing some place in Cook Strait as the permanent seat of Government. The resolutions adopted were: “(1.) That it has become necessary that the seat of Government in the colony should be transferred to some suitable locality in Cook Strait. (2.) That, in order to promote the accomplishment of this object, it is desirable that the selection of the particular site in Cook Strait should be left to the arbitrament of an impartial tribunal. (3.) That, with this view, a Bill should be introduced to give effect to the above resolutions.” On the 25th November an address was presented to the Governor, Sir George Grey, K.C.B., by the Commons of New Zealand, requesting that the Governors of the Colonies of New South Wales, Victoria, and Tasmania might each be asked to appoint one Commissioner for the purpose of determining the best site in Cook Strait. Accordingly, the Hon. Joseph Docker, M.L.C., New South Wales: the Hon. Sir Francis Murphy, Speaker of the Legislative Council, Victoria; and R. C. Gunn, Esq., Tasmania, were appointed Commissioners.
These gentlemen having made a personal inspection, of all suitable places, arrived at the unanimous decision “that Wellington, in Port Nicholson, was the site upon the shores of Cook Strait which presented the greatest advantages for the administration of the government of the colony.”
The seat of Government was, therefore, in accordance with the recommendation of the Commissioners, removed to Wellington in February, 1865.
Prior to the granting of Representative Institutions in 1853 there was no Parliament Building used exclusively for the meetings of the early Legislative Councils. In Auckland the later meetings of the Legislative Councils of New Zealand and New Ulster were held in the Courthouse, Official Bay, while in Wellington the Legislative Council of New Munster and also of New Zealand in 1851 and 1852, met in Barrett's Hotel (which then stood on a site in Lambton Quay, opposite the present Government Printing Office) in a room formerly used as a ball-room.
The first Parliament Building was erected in Auckland and completed in time for the meeting of the first General Assembly in May, 1854. On the transfer of the seat of Government to Wellington, the General Government purchased from the Wellington Provincial Council in January, 1865, the Provincial Council Buildings in Molesworth Street. This building was erected for the Provincial Council some six or seven years previously on a more comprehensive plan than the actual requirements of the province demanded, with a view to affording the requisite accommodation for the General Assembly on the anticipated transfer of the seat of Government to Wellington. The price paid for the building was £8,200, being one-third less than the original cost. These buildings, to which considerable additions and alterations were made later, were used for meetings of the General Assembly until the 11th December, 1907, on which date they were, with the exception of the library wing, destroyed by fire. Since then old Government House, occupying an adjoining site, has been utilized as temporary quarters for Parliament, a new residence for the Governor being erected at the southern end of the city.
The foundation-stone of new Parliament Buildings to replace those destroyed by fire was laid on the 23rd March, 1912. The foundations were prepared by the Public Works Department, and the contractors are now proceeding with the construction of the first portion of the buildings. A sketch of these, as they will appear when completed, was published as a frontispiece to the 1913 issue of this book, a description of the buildings being also given.
The following are the names of successive Governors of New Zealand, with dates on which they assumed and retired from office:—
Captain William Hobson, R.N. (January, 1840, to 10th September, 1842) Lieutenant-Governor of New Zealand under Sir George Gipps, Governor of New South Wales, from January, 1840, to 3rd May, 1841, and Governor of New Zealand from 3rd May, 1841, until date of death, 10th September, 1842.
Lieutenant Willoughby Shortland, Administrator from 10th September, 1842, to 26th December, 1843.
Captain Robert Fitzroy, R.N., Governor from 26th December, 1843, to 17th November, 1845.
Captain George Grey who became Sir George Grey, K.C.B., in 1848 (18th November, 1845, to 31st December, 1853), Governor from 18th November, 1845, to 1st January, 1848; Governor-in-Chief over the Islands of New Zealand, Governor of the Province of New Ulster and Governor of the Province of New Monster, from 1st January, 1848, to 7th March, 1853; Governor of New Zealand from 7th March, 1853, to 31st December, 1853.
Edward John Eyre, Esquire, Lieutenant-Governor of New Minister, appointed August, 1847, and sworn in on 28th January, 1848, until duties of Lieutenant-Governor ceased on 7th March, 1853.
Major-General George Dean Pitt, Lieutenant-Governor of New Ulster, appointed 3rd January, 1848, sworn in on 14th February, 1848, died 8th January, 1851.
Lieutenant-Colonel Robert Henry Wynyard, C.B., Lieutenant-Governor of New Ulster, appointed 14th April. 1851, sworn in 26th April, 1851, until duties of Lieutenant-Governor ceased on 7th March, 1853.
Lieutenant-Colonel Robert Henry Wynyard, C.B., Administrator from 3rd January, 1854, to 6th September, 1855.
Colonel Thomas Gore Browne, C.B., from 6th September, 1855, to 2nd October, 1861.
Sir George Grey, K.C.B., Administrator from 3rd October, 1861; Governor from 4th December, 1861, to 5th February. 1868.
Sir George Ferguson Bowen, G.C.M.G., from 5th February, 1868, to 19th March, 1873.
Sir George Alfred Arney, Chief Justice, Administrator from 21st March to 14th June, 1873.
Sir James Fergusson, Baronet. P.C., from 14th June, 1873, to 3rd December, 1874.
The Marquis of Normanby, P.C., G.C.M.G., Administrator from 3rd December, 1874; Governor from 9th January, 1875, to 21st February, 1870.
James Prendergast, Esquire, Chief Justice. Administrator from 21st February to 27th March, 1870.
Sir Hercules George Robert Robinson, G.C.M.G., Administrator from 27th March, 1879; Governor from 17th April, 1870, to 8th September, 1880.
James Prendergast, Esquire, Chief Justice, Administrator from 9th September to 20th November, 1880.
The Honourable Sir Arthur Hamilton Gordon, G.C.M.G., from 29th November, 1880, to 23rd June, 1882.
Sir James Prendergast, Chief Justice, Administrator from 24th June, 1882, to 20th January, 1883.
Lieutenant-General Sir William Francis Drummond Jervois, G.C.M.G., C.B., from 20th January, 1883, to 22nd March, 1880.
Sir James Prendergast, Chief Justice, Administrator from 23rd March to 2nd May, 1889.
The Earl of Onslow, G.C.M.G., from 2nd May, 1889, to 24th February, 1892.
Sir James Prendergast, Chief Justice, Administrator from 25th February to 6th June, 1892.
The Earl of Glasgow, G.C.M.G., from 7th June. 1892, to 6th February, 1897.
Sir James Prendergast, Chief Justice, Administrator from 8th February to 9th August, 1897.
The Earl of Ranfurly, G.C.M.G., from 10th August, 1897, to 19th June, 1904.
The Right Honourable William Lee, Baron Plunket, K.C.M.G., K.C.V.O., from 20th June, 1904, to 8th June, 1910.
Hon. Sir Robert Stout, K.C.M.G., Chief Justice, Administrator from 8th June to 22nd June, 1910.
The Right Honourable John Poynder Dickson-Poynder, K.C.M.G., Baron Islington, D.S.O., from 22nd June, 1910, to 2nd December, 1912.
Hon. Sir Robert Stout, K.C.M.G., Chief Justice, Administrator from 3rd December, to 19th December, 1912.
The Earl of Liverpool, G.C.M.G., M.V.O., from 19th December, 1912.
Prior to the establishment of responsible Government there was an Executive Council for New Zealand consisting, in addition to the Governor, of the Colonial Secretary, the Attorney-General, and the Colonial Treasurer, or the persons acting in that capacity, seniority being in the order named. The Governor, or in his absence the senior member present, was to preside, and two members exclusive of the Governor or member presiding were to form a quorum. The Governor was commanded to in all things consult and advise with the Executive Council, and not to exercise the powers and authorities vested in him except by and with the concurrence and advice of the Executive Council, except in cases of an urgent and pressing nature which would not admit of the delay incident to the deliberation of the Council. In such cases he was, with all convenient speed, to bring the measures so adopted by him before the Executive Council for their revision and sanction. Nothing in these instructions, however, was to prevent the Governor exercising any or all of the powers and authorities vested in him, without the advice and concurrence of the Executive Council in cases not considered of sufficient importance to require their assistance or advice, or in cases which were of such a nature that in his judgment material prejudice might be sustained by consulting the Executive Council thereupon. No questions were to be brought before the Council except those proposed by the Governor, who in any case in which he saw sufficient cause to dissent from the opinion of the major part or the whole of the Council was further empowered to exercise the powers vested in him in opposition to such opinion.
During the year 1854 there were associated with the permanent official members of the Executive Council above referred to certain members of the House of Representatives, but without portfolios. The following are the names of the various gentlemen who were members of the Executive Council of New Zealand prior to the establishment of responsible government on the 7th May, 1856:—
Willoughby Shortland, Colonial Secretary, from 3rd May, 1841, to 31st December, 1843; succeeded by Mr. Sinclair.
Francis Fisher, Attorney-General, from 3rd May to 10th August, 1814; succeeded by Mr. Swainson.
George Cooper, Colonial Treasurer, from 3rd May, 1841, to 9th May, 1842; succeeded by Mr. Shepherd.
William Swainson, Attorney-General, from 10th August, 1841, to 7th May, 1856.
Alexander Shepherd, Colonial Treasurer, from 9th May, 1842, to 7th May, 1856.
Andrew Sinclair, Colonial Secretary, from 6th January, 1844, to 7th May, 1856.
James Edward FitzGerald, M.H.R., without portfolio, from 14th June to 2nd August, 1854.
Henry Sewell, M.H.R., without portfolio, from 14th June to 2nd August, 1854.
Frederick Aloysius Weld, M.H.R., without portfolio, from 14th June to 2nd August, 1854.
Francis Dillon Bell, M.L.C., Without portfolio, from 30th June to 11th July, 1854.
Thomas Houghton Bartley, M.L.C., without portfolio, from 14th July to 2nd August, 1854.
Thomas Spencer Forsaith, M.H.R., without portfolio, from 31st August to 2nd September, 1854.
Edward Jerningham Wakefield, M.H.R., without portfolio, from 31st August to 2nd September, 1854.
William Thomas Locke Travers, M.H.R., without portfolio, from 31st August to 2nd September, 1854.
James Macandrew, M.H.R., without portfolio, from 31st August to 2nd September, 1854.
An Executive Council was established in each of the provinces of New Ulster and New Munster, for aiding with their advice the Officer Administering the Government thereof. The Executive Council consisted in each province of the Colonial Secretary, the Attorney-General, the Colonial Treasurer, and the principal officer in command of the military forces within the province, being a field officer, and of such other persons not holding any public office therein as the Governor-in-Chief might see fit to summon, the number of such unofficial members, however, not to exceed the number of official members. In the execution of the powers vested in the Governors or Lieutenant-Governors of the respective provinces it was not obligatory on them to consult with or to adopt the advice of the Executive Council in any case in which they should deem it inexpedient so to do. The names of those gentlemen who were members of the Executive Councils of New Ulster and New Munster are given below:—
Major-General George Dean Pitt, All appointed 1st January, 1848.
Andrew Sinclair, Colonial Secretary, All appointed 1st January, 1848.
William Swainson, Attorney-General, All appointed 1st January, 1848.
Alexander Shepherd, Colonial Treasurer, All appointed 1st January, 1848.
Lieutenant-Colonel R. D. Bolton, appointed 21st June, 1851.
Alfred Domett, Colonial Secretary, appointed 2nd February, 1848.
Daniel Wakefield, Attorney-General, appointed 21st December, 1848.
Henry William Petre, Colonial Treasurer, appointed 28th January, 1848.
Lieutenant-Colonel William Anson McCleverty, appointed 28th January, 1848.
Prior to the establishment of responsible government the Legislative Council of New Zealand consisted of the Colonial Secretary, the Attorney-General, the Colonial Treasurer, and the three senior Justices of the Peace. The Governor was to preside at all meetings of the Council, and, in his absence, the senior member present; four members in addition to the Governor or the member presiding to form a quorum. No law or ordinance was to be enacted by the Legislative Council which was not first proposed by the Governor, and no question was to be debated unless submitted by him for that purpose. The laws and Ordinances of the Council were to be designated “Ordinances enacted by the Governor of New Zealand with the advice and consent of the Legislative Council thereof.” No laws whatsoever were to be made to continue for less than two years except only in cases of unforeseen emergency requiring provision for temporary service, and the Governor was specially enjoined not to propose or assent to Ordinances or laws dealing with certain matters, some of which were:—
Restricting public worship, although not conducted according to the Church of England.
Reducing revenue or infringing prerogative or affecting the salaries or allowances of public officers without special leave.
Issuing bills of credit, or other negotiable securities in lieu of money on the credit of the colony, or paper currency, or any coin save the legal coin of the realm.
By which persons not of European birth or descent might be subjected or liable to disabilities or restrictions to which persons of European birth or descent would not also be subjected.
Raising money for public or private lotteries.
Naturalizing aliens without leave.
Divorcing persons joined together in holy matrimony.
Granting money, land, or other donation or gratuity to the Governor.
The following is a list of gentlemen who were members of the Legislative Council, with dates of their appointment and the office (if any) held. The dates on which they ceased to be members are known only in the cases shown—the others probably continued until the introduction of the new Constitution:—
| Name. | Office held. | Date of Appointment. | Date when ceased to be a Member. |
|---|---|---|---|
| Captain William Hobson, R.N. | Governor | 3 May, 1841 | 10 Sept., 1842. |
| Lieutenant Willoughby Shortland | Colonial Secretary and Administrator from 10 Sep., 1842, to 26 Dec., 1843 | 3 May, 1841 | 8 Jan., 1844. |
| Francis Fisher | Attorney-General | 3 May, 1841 | 28 Sept., 1841. |
| George Cooper | Colonial Treasurer | 3 May, 1841 | 9 May, 1842. |
| William Wakefield | .. | 3 May, 1841 | Sept., 1841. |
| William Cornwallis Symonds | .. | 3 May, 1841 | Oct., 1841. |
| James Reddie Clendon | .. | 3 May, 1841 | 6 June, 1844. |
| George Butler Earp | .. | 9 Sept., 1841 | 6 June, 1844. |
| William Swainson | Attorney-General | 28 Sept., 1841 | .. |
| William Field Porter | .. | 27 Oct., 1841 | 6 June, 1844. |
| Alexander Shepherd | Colonial Treasurer | 9 May, 1842 | .. |
| Captain Robert Fitzroy, R.N. | Governor | 26 Dec., 1843 | 17 Nov., 1845. |
| Andrew Sinclair, M.D., R.N. | Colonial Secretary | 8 Jan., 1844 | .. |
| Charles Clifford | .. | 6 June, 1844 | 3 Mar., 1845. |
| William Brown | .. | 6 June, 1844 | 3 Mar., 1845. |
| ″ | .. | 16 July, 1847 | 16 Nov., 1848. |
| Samuel M. D. Martin, M.D. | .. | 6 June, 1844 | 3 Mar., 1845. |
| Frederick Whitaker | .. | 3 Mar., 1845 | 1 Feb., 1846. |
| William Donnelly | .. | 3 Mar., 1845 | 1 Feb., 1846. |
| ″ | .. | 30 Sept., 1846 | 9 Aug., 1847. |
| Theophilus Heale | .. | 3 Mar., 1845 | 1 Feb., 1846. |
| Sir George Grey, K.C.B. | Govern or, Governor-in-Chief, Governor of New Ulster and Governor of New Munster | 18 Nov., 1845 | 31 Dec., 1853. |
| Alfred Domett | Colonial Secretary of New Munster | 30 Sept., 1846 | .. |
| Alexander Kennedy | .. | 30 Sept., 1846 | 16 July, 1847. |
| Alexander Kennedy | .. | 16 Nov., 1848 | .. |
| Frederick Ward Merriman | .. | 9 Aug., 1847 | .. |
| Edward John Eyre | Lieut.-Governor of New Munster | 28 Jan., 1848 | 7 Mar., 1853. |
| Lieut. - Colonel William Anson McCleverty | Commander of the Forces | 28 Jan., 1848 | .. |
| Hon. Henry William Petre | Colonial Treasurer of New Munster | 28 Jan., 1848 | .. |
| Charles Waybrow Ligar | Surveyor - General | 16 Nov., 1848 | .. |
| Robert Clapham Barstow | .. | 16 Nov., 1848 | .. |
| Hon. Francis Dillon Bell | .. | 20 Dec., 1848 | .. |
| Hon. William Hickson | .. | 20 Dec., 1848 | .. |
| Hon. Daniel Wakefield | Attorney - General of New Munster | 21 Dec., 1848 | .. |
| Lieut. - Colonel William Hulme | .. | 24 July, 1849 | .. |
| Major Henry Matson | .. | 24 July, 1849 | .. |
| Sampson Kempthorne | .. | 24 July, 1849 | .. |
| Major - General George Dean Pitt | Lieut.-Governor of New Ulster | 1 Aug., 1849 | 8 Jan., 1851. |
| Hon. Stephen Carkeek | Collector of Customs | 19 May, 1851 | .. |
| Hon. William Mein Smith | .. | 19 May, 1851 | .. |
| Hon. Constantine Augustus Dillon | .. | 3 June, 1851 | .. |
| Hon. William Oldfield Cautley | .. | 3 June, 1851 | .. |
| Hon. George Cutfield | .. | 3 June, 1851 | .. |
Under the Charter constituting the Provinces of New Ulster and New Munster, a Legislative Council was also established in each province, consisting of such persons as were for that purpose appointed. The following are the names, offices held, and dates of appointment of the members of the Provincial Legislative Councils:—
| Name. | Office held. | Date of Appointment. |
|---|---|---|
| (a.) NEW ULSTER. | ||
| Sir George Grey, K.C.B. | Governor | 1 Jan., 1848. |
| Andrew Sinclair | Colonial Secretary | 1 Jan., 1848. |
| William Swainson | Attorney-General | 1 Jan., 1848. |
| Alexander Shepherd | Colonial Treasurer | 1 Jan., 1848. |
| Major-General George Dean Pitt | Lieutenant-Governor | 3 Jan., 1848. |
| Charles Waybrow Ligar | Surveyor-General | 16 Nov., 1848. |
| Alexander Kennedy | .. | 16 Nov., 1848. |
| Frederick Ward Merriman | .. | 16 Nov., 1848. |
| Robert Clapham Barstow | .. | 16 Nov., 1848. |
| Lieut.-Colonel William Hulme | .. | 24 July, 1849. |
| Major Henry Matson | .. | 24 July, 1849. |
| Sampson Kempthorne | .. | 24 July, 1849. |
| (b.) NEW MUNSTER | ||
| Sir George Grey, K.C.B. | Governor | 1 Jan., 1848. |
| Edward John Eyre | Lieutenant-Governor | 28 Jan., 1848. |
| Henry William Petre | Colonial Treasurer | 28 Jan., 1848. |
| Lieut.-Colonel William Anson McCleverty | Commander of the Forces | 28 Jan., 1848. |
| Alfred Domett | Colonial Secretary | 2 Feb., 1848. |
| William McLeod Bannatyne | .. | 20 Dec., 1848. |
| Francis Dillon Bell | .. | 20 Dec., 1848. |
| William Hickson | .. | 20 Dec., 1848. |
| George Hunter | .. | 20 Dec., 1848. |
| Alfred Ludlam | .. | 20 Dec., 1848. |
| George Moore | .. | 20 Dec., 1848. |
| Daniel Wakefield | Attorney-General | 21 Dec., 1848. |
| David Monro | .. | 18 Jan., 1849. |
| John Damforth Greenwood | .. | 18 Jan., 1849. |
| Henry Seymour | .. | 18 Jan., 1849. |
| William Oldfield Cautley | .. | 5 May, 1849. |
In 1852 Proclamations were made altering the constitution of the Legislative Councils so as to include a certain number of elected members. New Ulster was to have eighteen members, of whom six were to be appointed and twelve elected, while New Munster was to have thirty-three members, of whom eleven were to be appointed and twenty-two elected. The elections for the Province of New Ulster were actually held, and the members, whose names are given below, were declared elected. The preliminary Proclamations were made for New Munster, but before the elections were held tidings of a new constitution were received, and the proceedings stayed.
| Name. | Date gazetted. | District. |
|---|---|---|
| William Brown | 21 September, 1852 | City of Auckland. |
| John Salmon | 21 September, 1852 | ″ |
| Frederick Whitaker | 21 September, 1852 | ″ |
| John Logan Campbell | 21 September, 1852 | Suburbs of Auckland. |
| Patrick Dignan | 21 September, 1852 | Pensioner Settlements. |
| Thomas Spencer Forsaith | 21 September, 1852 | Northern Division. |
| Allan O'Neill | 21 September, 1852 | ″ |
| James Macky | 21 September, 1852 | Southern Division. |
| William Field Porter | 21 September, 1852 | ″ |
| George Clarke | 21 September, 1852 | Bay of Islands. |
| Charles Brown | 2 October, 1852 | New Plymouth. |
| John Tylson Wicksteed | 2 October, 1852 | Taranaki. |
SUCCESSIVE PARLIAMENTS SINCETHE PASSING OFTHE CONSTITUTION ACT CONFERRING REPRESENTATIVE INSTITUTIONS UPON NEW ZEALAND, WITH THE DATES OF OPENING AND CLOSING OF SESSIONS AND DATES OF DISSOLUTION.
| Parliament. | Dates of Opening of Sessions. | Dates of Prorogation. |
|---|---|---|
| First (dissolved 15th September, 1855) | 27 May, 1854 | 9 August, 1854. |
| 31 August, 1854 | 16 September, 1854. | |
| 8 August, 1855 | 15 September, 1855. | |
| Second (dissolved 5th November, 1860) | 15 April, 1856 | 16 August, 1856. |
| (No session in 1857) | ||
| 10 April, 1858 | 21 August, 1858. | |
| (No session in 1859) | ||
| 30 July, 1860 | 5 November, 1860. | |
| Third (dissolved 27th January, 1866) | 3 June, 1861 | 7 September, 1861. |
| 7 July, 1862 | 15 September, 1862. | |
| 19 October, 1863 | 14 December, 1863. | |
| 24 November, 1864 | 13 December, 1864. | |
| 26 July, 1865 | 30 October, 1865. | |
| Fourth (dissolved 30th December, 1870) | 30 June, 1866 | 8 October, 1866. |
| 9 July, 1867 | 10 October, 1867. | |
| 9 July, 1868 | 20 October, 1868. | |
| 1 June, 1869 | 3 September, 1869. | |
| 14 June, 1870 | 13 September, 1870. | |
| Fifth (dissolved 6th December, 1875) | 14 August, 1871 | 16 November, 1871. |
| 16 July, 1872 | 25 October, 1872. | |
| 15 July, 1873 | 3 October, 1873. | |
| 3 July, 1874 | 31 August, 1874. | |
| 20 July, 1875 | 21 October, 1875. | |
| Sixth (dissolved 15th August, 1879) | 15 June, 1876 | 31 October, 1876. |
| 19 July, 1877 | 10 December, 1877. | |
| 26 July, 1878 | 2 November, 1878 | |
| 11 July, 1879 | 11 August, 1879. | |
| Seventh (dissolved 8th November, 1881) | 24 September, 1879 | 19 December, 1879. |
| 28 May, 1880 | 1 September, 1880. | |
| 9 June, 1881 | 24 September, 1881. | |
| Eighth (dissolved 27th June, 1884) | 18 May, 1882 | 15 September, 1882. |
| 14 June, 1883 | 8 September, 1883. | |
| 5 June, 1884 | 24 June, 1884. | |
| Ninth (dissolved 15th July, 1887) | 7 August, 1884 | 10 November, 1884. |
| 11 June, 1885 | 22 September, 1885. | |
| 13 May, 1886 | 18 August, 1886. | |
| 526 April, 1887 | 10 July, 1887. | |
| Tenth (dissolved 3rd October, 1890) | 6 October, 1887 | 23 December, 1887. |
| 10 May, 1888 | 31 August, 1888. | |
| 20 June, 1889 | 19 September, 1889. | |
| 19 June, 1890 | 18 September, 1890. | |
| Eleventh (dissolved 8th November, 1893) | 23 January, 1891 | 31 January, 1891. |
| 11 June, 1891 | 25 September, 1891. | |
| 23 June, 1892 | 12 October, 1892. | |
| 22 June, 1893 | 7 October, 1893. | |
| Twelfth (dissolved 14th November, 1896) | 21 June, 1894 | 24 October, 1894. |
| 20 June, 1895 | 2 November, 1895. | |
| 11 June, 1896 | 19 October. 1896. | |
| Thirteenth (dissolved 15th November, 1899) | 7 April, 1897 | 12 April, 1897. |
| 23 September, 1897 | 22 December, 1897. | |
| 24 June, 1898 | 5 November, 1898. | |
| 23 June, 1899 | 24 October, 1899. | |
| Fourteenth (dissolved 5th November, 1902) | 22 June, 1900 | 22 October, 1900. |
| 1 July, 1901 | 8 November, 1901. | |
| 1 July, 1902 | 4 October, 1902. | |
| Fifteenth (dissolved 15th November, 1905) | 29 June, 1903 | 25 November, 1903. |
| 28 June, 1904 | 8 November, 1904. | |
| 27 June, 1905 | 31 October, 1905. | |
| Sixteenth (dissolved 29th October, 1908) | 27 June, 1906 | 3 July, 1906. |
| 21 August, 1906 | 29 October, 1906. | |
| 27 June, 1907 | 25 November, 1907. | |
| 29 June, 1908 | 12 October, 1908. | |
| Seventeenth (dissolved 20th November, 1911) | 10 June, 1909 | 17 June, 1909. |
| 7 October, 1909 | 29 December, 1909. | |
| 28 June, 1910 | 5 December, 1910. | |
| 27 July, 1911 | 30 October, 1911. | |
| Eighteenth (dissolved 20th November, 1914) | 15 February, 1912 | 1 March, 1912. |
| 27 June, 1912 | 8 November, 1912. | |
| 26 June, 1913 | 15 December, 1913. | |
| 25 June, 1914 | 6 November, 1914. | |
| Nineteenth | 24 June, 1915. | .. |
| SUCCESSIVE MINISTRIES SINCETHE ESTABLISHMENT OF RESPONSIBLE GOVERNMENT IN NEW ZEALAND IN 1856. | ||
|---|---|---|
* Owing to the death of the Premier, the Hon. J. Ballance, on 27th April, 1893. † Owing to the death of the Premier, Bight Hon. R. J. Seddon, P.C., on 10th June, 1906. | ||
| Name of Ministry. | Assumed Office. | Retired. |
| 1. Bell-Sewell | 7 May, 1856 | 20 May, 1856. |
| 2. Fox | 20 May, 1856 | 2 June, 1856. |
| 3. Stafford | 2 June, 1856 | 12 July, 1861. |
| 4. Fox | 12 July, 1861 | 6 August, 1862. |
| 5. Domett | 6 August, 1862 | 30 October, 1863. |
| 6. Whitaker-Fox | 30 October, 1863 | 24 November, 1864. |
| 7. Weld | 24 November, 1864 | 16 October, 1865. |
| 8. Stafford | 16 October, 1865 | 28 June, 1869. |
| 9. Fox | 28 June, 1869 | 10 September, 1872. |
| 10. Stafford | 10 September, 1872 | 11 October, 1872. |
| 11. Waterhouse | 11 October, 1872 | 3 March, 1873. |
| 12. Fox | 3 March, 1873 | 8 April, 1873. |
| 13. Vogel | 8 April, 1873 | 6 July, 1875. |
| 14. Pollen | 6 July, 1875 | 15 February, 1876. |
| 15. Vogel | 15 February, 1876 | 1 September, 1876. |
| 16. Atkinson | 1 September, 1876 | 13 September, 1876. |
| 17. Atkinson (reconstituted) | 13 September, 1876 | 13 October, 1877. |
| 18. Grey | 15 October, 1877 | 8 October, 1879. |
| 19. Hall | 8 October, 1879 | 21 April, 1882. |
| 20. Whitaker | 21 April, 1882 | 25 September, 1883. |
| 21. Atkinson | 25 September, 1883 | 16 August, 1884. |
| 22. Stout-Vogel | 16 August, 1884 | 28 August, 1884. |
| 23. Atkinson | 28 August, 1884 | 3 September, 1884. |
| 24. Stout-Vogel | 3 September, 1884 | 8 October, 1887. |
| 25. Atkinson | 8 October, 1887 | 24 January, 1891. |
| 26. Ballance | 24 January, 1891 | 1 May, 1893.* |
| 27. Seddon | 1 May, 1893 | 21 June, 1906.† |
| 28. Hall-Jones | 21 June, 1906 | 6 August, 1906. |
| 29. Ward | 6 August, 1906 | 28 March, 1912. |
| 30. Mackenzie | 28 March, 1912 | 10 July, 1912. |
| 31. Massey | 10 July, 1912 | 12 August, 1915. |
| 32. National | 12 August, 1915 | |
| PREMIERS OF SUCCESSIVE MINISTRIES. | |
|---|---|
| Name of Premier. | Sir George Grey, K.C.B. |
| Henry Sewell. | Hon. John Hall. |
| William Fox. | Frederick Whitaker, M.L.C. |
| Edward William Stafford. | Harry Albert Atkinson. |
| William Fox. | Robert Stout. |
| Alfred Domett. | Harry Albert Atkinson. |
| Frederick Whitaker. | Sir Robert Stout, K.C.M.G. |
| Frederick Aloysius Weld. | Sir Harry Albert Atkinson, K.C.M.G |
| Edward William Stafford. | John Ballance. |
| William Fox. | Rt. Hon. Richard John Seddon, P.C. |
| Hon. Edward William Stafford. | William Hall-Jones. |
| George Marsden Waterhouse. | Right Hon. Sir Joseph George Ward, Bart., P.C., K.C.M.G. |
| Hon. William Fox. | Thomas Mackenzie. |
| Hon. Julius Vogel, C.M.G. | Right Hon. William Ferguson Massey, P.C. |
| Hon. Daniel Pollen, M.L.C. | Right Hon. William Ferguson Massey, P.C. (National Ministry). |
| Sir Julius Vogel, K.C.M.G. | |
| Harry Albert Atkinson. | |
| Harry Albert Atkinson (Ministry reconstituted). | |
| SPEAKERS OFTHE LEGISLATIVE COUNCIL, WITH DATES OF APPOINTMENT AND DATES OF RETIREMENT OR DEATH. | ||
|---|---|---|
| Name of Speaker. | Date of Appointment. | Date of Retirement or Death. |
| Hon. William Swainson | 16 May, 1854 | 8 August, 1855. |
| Hon. Frederick Whitaker | 8 August, 1855 | 12 May, 1856. |
| Hon. Thomas Houghton Bartley | 12 May, 1856 | 1 July, 1868. |
| Hon. Sir John Larkins Cheese Richardson, Kt. | 1 July, 1868 | 14 June, 1879. |
| Hon. Sir William Fitzherbert, K.C.M.G. | 14 June, 1879 | 22 April, 1887. |
| Hon. George Marsden Waterhouse | 22 April, 1887 | 21 September, 1887. |
| Hon. Sir William Fitzherbert, K.C.M.G. | 21 September, 1887 | 23 January, 1891. |
| Hon. Sir Harry Albert Atkinson, K.C.M.G. | 23 January, 1891 | 28 June, 1892. |
| Hon. Sir Henry John Miller | 8 July, 1892 | 9 July, 1903. |
| Hon. W. C. Walker, C.M.G. | 9 July, 1903 | 5 January, 1904. |
| Hon. John Rigg (Acting) | 5 January, 1904 | 7 July, 1904. |
| Hon. Sir A. J. Cadman, K.C.M.G. | 7 July, 1904 | 23 March, 1905 |
| Hon. R. H. J. Reeves (Acting) | 23 March, 1905 | 4 July, 1905. |
| Hon. Sir C. C. Bowen, K.C.M.G. | 4 July, 1905 | 7 July, 1915. |
| Hon. C. J. Johnston | 7 July 1915 | |
| SPEAKERS OFTHE HOUSE OF REPRESENTATIVES, WITH DATES OF ELECTION AND DATES OF RETIREMENT OR DEATH. | ||
|---|---|---|
| Name of Speaker. | Date of Election. | Date of Retirement or Death. |
| Sir Charles Clifford, Bart. | 26 May, 1854 | .. |
| 15 April, 1856 | 3 June, 1861. | .. |
| Sir David Monro, Kt. Bach. | 3 June, 1861 | .. |
| 30 June, 1866 | 13 Sept., 1870. | .. |
| Sir Francis Dillon Bell, K.C.M.G., C.B. | 14 August, 1871 | 21 October, 1875. |
| Sir William Fitzherbert, K.C.M.G. | 15 June, 1876 | 13 June, 1879. |
| Sir George Maurice O'Rorke, Kt. Bach. | 11 July, 1879 | .. |
| 24 September, 1879 | .. | |
| 18 May, 1882 | .. | |
| 7 August, 1884 | .. | |
| 6 October, 1887 | 3 October, 1890. | |
| Hon. Major Sir William Jukes Steward, Kt. Bach. | 23 January, 1891 | 8 November, 1893. |
| Hon. Sir George Maurice O'Rorke, Kt. Bach. | 21 June, 1894 | .. |
| 6 April, 1897 | .. | |
| 22 June, 1900 | 5 November, 1902. | |
| Hon. Sir Arthur Robert Guinness, Kt. Bach. | 29 June, 1903 | .. |
| 27 June, 1906 | .. | |
| 10 June, 1909 | .. | |
| 15 February, 1912 | 10 June, 1913. | |
| Hon Frederic William Lang | 26 June, 1913 | .. |
| 24 June, 1915 | .. | .. |
Sir W. Martin, appointed Chief Justice, 10th January, 1842. Resigned, 12th June, 1857.
H. S. Chapman, appointed, 26th December, 1843. Held office until March, 1852. Reappointed, 23rd March, 1864, Resigned, 31st March, 1875.
S. Stephen, appointed, 30th July, 1850. Appointed Acting Chief Justice, 20th October, 1855. Died, 13th January, 1858.
Daniel Wakefield, appointed, October, 1855. Died, October, 1857.
Hon. H. B. Gresson, appointed temporarily, 8th December, 1857. Permanently, 1st July, 1862. Resigned, 31st March, 1875.
Sir George A. Arney, appointed Chief Justice, 1st March, 1858. Resigned, 31st March, 1875.
A. J. Johnston, appointed, 2nd November, 1858. Died. 1st June, 1888.
C. W. Richmond, appointed, 20th October, 1862. Died, 3rd August, 1895.
J. S. Moore, appointed temporarily, 15th May, 1866. Relieved, 30th June, 1868.
C. D. R. Ward, appointed temporarily, 1st October. 1868. Relieved, May, 1870. Appointed temporarily, 21st September, 1880. Relieved, 12th February, 1889.
Hon. Sir James Prendergast, appointed Chief Justice, 1st April, 1875. Resigned, 25th May, 1899.
T. B. Gillies, appointed, 3rd March, 1875. Died, 26th July, 1889.
Hon. Sir Joshua S. Williams, P.C., Kt., appointed, 3rd March, 1875. Resigned, 31st January, 1914, on being called to the Privy Council.
Hon. J. E. Denniston, appointed, 11th February, 1889.
E. T. Conolly, appointed, 19th August, 1889. Resigned, 9th September, 1903.
Hon. Sir Patrick A. Buckley, K.C.M.G., appointed, 20th December, 1895. Died, 18th May, 1896.
Hon. W. B. Edwards, appointed, 11th July, 1896.
F. W. Pennefather, appointed temporarily. 25th April, 1898. Resigned, 24th April, 1899.
Hon. Sir Robert Stout, K.C.M.G., appointed Chief Justice, 22nd June, 1899.
J. C. Martin, Acting Judge, appointed, 12th April, 1900. Resigned, 4th December, 1900.
Hon. Theophilus Cooper, appointed, 21st February, 1901.
Hon. F. R. Chapman, appointed, 11th September, 1903.
C. E. Button, appointed temporarily, 12th March, 1907. Resigned, 29th February, 1908.
Hon. William Alexander Sim, appointed, 16th January, 1911.
Hon. John Henry Hosking, K.C., appointed, 11th February, 1914.
Hon. Thomas Walter Stringer, K.C., appointed, 19th February, 1914.
LIVERPOOL, His Excellency the Right Honourable Arthur William de Brito Savile, Fifth Earl of Liverpool. Born 27th May, 1870, succeeded 1907. Educated at Eton and the Royal Military College, Sandhurst. Formerly Major in the Rifle Brigade (the Prince Consort's Own) and subsequently Major of its 6th Battalion. Sometime an A.D.C. to the Lord-Lieutenant of Ireland (Earl Cadogan, K.G.), and Staff Captain, Dublin District. Is a J.P. for Kesteven and Lindsey Divisions of Lincolnshire, and Lieut.-Colonel 8th Battalion London Regiment (the Post Office Rifles). Served in South Africa 1901–2 (Queen's Medal with three clasps). Was State Steward and Chamberlain to the Lord-Lieutenant of Ireland (the Earl of
Aberdeen, K.T., G.C.M.G.), 1906–8. Comptroller of His Majesty's Household, 1909–12. Appointed Governor and Commander-in-Chief of the Dominion of New Zealand, 1912. M.V.O., 4th Class, 1900; K.C.M.G., 1912; G.C.M.G., 1914.
Seat: Hartsholme Hall, Lincoln.
London residence: 44 Grosvenor Gardens, S.W.
Residences: Government House. Wellington; Government House, Auckland.
Private Secretary: Gavin M. Hamilton, Esq.
Assistant Private Secretary: A. Cecil Day, Esq.
Military Secretary:
Aides-de-Camp:
Acting Aides-de-Camp: Honorary Lieutenant H. G. Helmore; Honorary
Lieutenant G. J. H. Reid.
Extra Aide-de-Camp: Lieut.-Colonel J. H. Boscawen.
Honorary Aides-de-Camp: Colonel R. J. Collins, C.M.G., I.S.O., V.D.; Colonel A. H. Russell; Lieut.-Colonel R. Logan; Lieut.-Colonel V. S. Smyth; Colonel J. C. Nichols, V.D.; Colonel G. P. C. Campbell, V.D.
The Executive Council now consists of:—
Right Hon. W. F. Massey, P.C., Prime Minister, Minister of Lands, Minister of Labour, Minister of industries and Commerce, Commissioner of State Forests, and Minister in Charge of Lands for Settlements, Valuation, and Scenery Preservation Departments.
Right Hon. Sir J. G. Ward, Bart., P.C., K.C.M.G., Minister of Finance, Postmaster-General and Minister of Telegraphs, Minister in Charge of Land and Income Tax, State Advances, Public Trust, and Government Life Insurance Departments.
Hon. J. Allen, Minister of Defence.
Hon. W. H. Herries, Minister of Railways and Native Minister.
Hon. A. L. Herdman, Attorney-General, Minister in Charge of Police and Crown Law Departments, and the new Department to be created dealing with the welfare of returned soldiers.
Hon. Dr. R. McNab, Minister of Justice, Minister of Marine, Minister of Stamps, and Minister in Charge of Tourist and Health Resorts Departments.
Hon. W. Fraser, Minister of Public Works and Minister in Charge of Roads Department.
Hon. G. W. Russell, Minister of Internal Affairs, Minister of Public Health, Minister in Charge of Printing and Stationery, High Commissioner's, Audit, Museum, Registrar-General's, and Laboratory Departments.
Hon. Sir F. H. D. Bell, K.C.M.G., K.C., Minister of Immigration and Leader of the Legislative Council.
Hon. A. M. Myers, Minister of Customs, Minister in Charge of Munitions and Supplies, Pensions, Advertising, and National Provident Fund Departments.
Hon. W. D. S. MacDonald, Minister of Agriculture, Minister of Mines, Minister in Charge of Legislative, Public Buildings, Inspection of Machinery, State Fire and Accident Insurance Departments.
Hon. J. A. Hanan, Minister of Education and Minister in Charge of Friendly Societies.
Hon. Dr. M. Pomare, Member of the Executive Council representing the Native Race, and in Charge of Maori Councils, Cook and other Islands Administration.
Clerk of the Executive Council—James Frank Andrews, I.S.O.
The Legislative Council assembled for its first session at Auckland on the 24th May, 1854, and comprised fourteen members.
The Councillors had been designated a year earlier by the Governor, and their names submitted to Her late Majesty Queen Victoria for the Royal approval; and they were gazetted in New Zealand in December, 1853. Until 1868 the rule was that the appointment of members should be made by an instrument under the Royal sign manual, but the rule was not strictly observed after 1861. An Act of the Imperial Parliament in 1868 validated any appointments of Councillors that might have been made irregularly in the past, and provided that future appointments should be made by the Governor (not by the Sovereign).
Until 1891 members were appointed for life, and the Speaker was appointed by the Governor; but since that year appointments have been for seven years only, members, however, being eligible for reappointment. The Council elects its own Speaker, who holds office for five years. A Chairman of Committees is elected every session, and holds office till the election of his successor. Speaker and Chairman are both eligible for re-election. The Imperial Act under which the earliest appointments were made did not fix a minimum number of members, though it provided that the first batch to be appointed should be not less than ten in number. The number actually summoned was sixteen, of whom only fourteen attended and were enrolled. The number increased irregularly for thirty years. In 1885 and 1886 it stood at fifty-three, but has not since reached that limit. The number on the roll at present (12th August, 1915) is thirty-seven.
An Act passed in the session of 1914 provides for an elective Legislative Council. For the purposes of the election of Legislative Councillors the Dominion is divided into four electoral divisions, two in each of the main Islands. At the first election, to be held simultaneously with the first general election after the end of the year 1915, twenty-four members are to be returned, seven in each of the North Island divisions and five in each South Island division. At subsequent elections forty members are to be elected, divided between the two Islands on a population basis. The term of office of Legislative Councillors under the new system will be from the date of election until the dissolution or expiry of Parliament next after the expiration of five years, except that in case of a dissolution of both Houses of Parliament (provided for under certain circumstances) a new election becomes necessary.
Life members and other appointed members of the Legislative Council who held their seats at the 5th November, 1914, will continue to do so until the end of the term of their appointment. Members appointed after the 5th November, 1914, and before the 1st January, 1916 (after which date no European members are to be appointed), will hold their seats only until the 1st July, 1921. The new Act empowers the Governor to appoint not more than three Maori members to the Council, the maximum strength of which will eventually be forty-three.
A Councillor must be a male person, of the full age of twenty-one years, and a British subject, either natural-born or naturalized; and he must not be in the receipt of pay out of the public purse, whether as a public servant or under a Government contract.* The seat of a member is voided if he enters the service or places himself under the protection of any foreign Power; or if he becomes bankrupt or compounds with his creditors; or if he is a public defaulter; or if he is convicted of any crime punishable by death or by imprisonment with hard labour for three years or more; or if he resigns his seat; or if he absents himself without the leave of the Governor for more than one whole session.
Before the year 1892 the honorarium of Councillors was understood to be for the session, not for the year, and formed the subject of a special vote every session, the amount varying in different sessions. By the Payment of Members Act, 1892, the honorarium was made annual, not sessional, and was fixed at £150 a year. The amount was raised in 1904 to £200 a year. Besides the honorarium, members are allowed travelling-expenses actually incurred in going to and from Parliament.
Subject to certain exemptions, members not attending the Council are liable to be fined.
* The Suspension of Disqualifications during War Act, 1915, however, permits of members of either branch of the Legislature drawing pay as members of His Majesty's Military or Naval Forces raised for service beyond New Zealand.
| ROLL OF MEMBERS OFTHE HONOURABLE LEGISLATIVE COUNCIL OF NEW ZEALAND (12TH AUGUST, 1915). | ||
|---|---|---|
| Speaker—Hon. C. J. Johnston. | ||
† Life members. * Life members. | ||
| Chairman of Committees—Hon. W. C. F. CARNCROSS. | ||
| Name. | Provincial District. | Date of Appointment. |
| Aitken, Hon. John Guthrie Wood | Wellington | 14 July, 1914. |
| Baillie, Hon. William Douglas Hall | Marlborough | 8 March, 1861.† |
| Baldey, Hon. Alfred | Otago | 18 March, 1910. |
| Barr, Hon. John | Canterbury | 22 January, 1914. |
| Beehan, Hon. William | Auckland | 22 June, 1910. |
| Bell, Hon. Sir Francis Henry Dillon, K.C.M.G. | Wellington | 10 July, 1912. |
| Bowen, Hon. Sir Charles Christopher, K.C.M.G. | Canterbury | 20 January, 1891.† |
| Buchanan, Hon. Sir Walter, Kt. Bach. | Wellington | 23 June, 1915. |
| Carncross, Hon. Walter Charles Frederick | Taranaki | 18 March. 1910. |
| Carson, Hon. Gilbert | Wellington | 14 July, 1914. |
| Collins, Hon. William Edward | Wellington | 14 July, 1914. |
| Duthie, Hon. John | Wellington | 26 June, 1913. |
| Earnshaw, Hon. William | Wellington | 26 June, 1913. |
| Fisher, Hon. John | Auckland | 14 July, 1914. |
| George, Hon. Seymour Thorne | Auckland | 22 June, 1910. |
| Hall-Jones, Hon. Sir William, K.C.M.G. | Wellington | 7 October, 1913. |
| Hardy, Hon. Charles Albert Creery | Canterbury | 20 June, 1913. |
| Harris, Hon. Benjamin | Auckland | 3 February, 1911. |
| Johnston, Hon. diaries John | Wellington | 23 January, 1891.* |
| Jones, Hon. George | Otago | 13 December, 1909. |
| MacGibbon, Hon. Thomas | Otago | 14 July, 1914. |
| MacGregor, Hon. John | Otago | 14 July, 1914. |
| McLean, Hon. Sir George, Kt. Bach. | Otago | 19 December, 1881.* |
| Maginnity, Hon. Andrew Thomas | Nelson | 14 July, 1914. |
| Millar, Hon. John Andrew | Auckland | 23 June, 1915. |
| Miller, Hon. Sir Henry John, Kt. Bach. | Otago | 8 July, 1865.* |
| Mills, Hon. Charles Houghton | Wellington | 2 March, 1909. |
| Moore, Hon. Richard | Canterbury | 14 July, 1914. |
| Morgan, Hon. William | Hawke's Bay | 14 July, 1914. |
| Ormond, Hon. John Davies | Hawke's Bay | 20 January, 1891.* |
| O'Rorke, Hon. Sir George Maurice, Kt. Bach. | Auckland | 25 June, 1911. |
| Parata, Hon. Thomas | Otago | 13 June, 1912. |
| Paul, Hon. John Thomas | Otago | 22 January, 1914. |
| Samuel, Hon. Oliver | Taranaki | 14 July, 1914. |
| Simpson, Hon. Robert Kirkpatrick | Wellington | 14 July, 1914. |
| Thompson, Hon. Thomas | Auckland | 18 March; 1910. |
| Wigram, Hon. Henry Francis | Canterbury | 22 June, 1910. |
The number of members constituting the House of Representatives is eighty—seventy-six Europeans and four Maoris. They are now designated Members of Parliament. The number was originally fixed by the Constitution Act as not more than forty-two and not less than twenty-four, and the first Parliament called together in 1854 consisted of forty members. Legislation passed in 1858 fixed the number of European members at forty-one; in 1860, at fifty-three; in 1862, at fifty-seven; in 1865, at seventy; in 1867, at seventy-two; in 1870, at seventy-four; in 1875, at eighty-four; in 1881, at ninety-one; in 1887, at seventy; and in 1900, at seventy-six. By the Maori Representation Act, 1867, which is still in force, as embodied in the Legislature Act, 1908, four Maori members were added, three for the North Island and one for the South.
The North Island at present returns forty-two European members, and the South Island thirty-four. The elections are triennial, except in the case of a dissolution by the Governor. Quinquennial Parliaments, instituted under the Constitution Act, were abolished by the Triennial Parliaments Act, 1879.
Every registered elector, being of the male sex and free from any of the disqualifications mentioned in the Legislature Act, 1908, is eligible for membership. All contractors to the public service of New Zealand to whom any public money above the sum of £50 is payable, directly or indirectly, in any one financial year, as well as the public servants of the Dominion, are incapable of being elected as, or of sitting or voting as, members. An exception is made by the Suspension of Disqualifications during War Act, 1915, whereby it is laid down that the receipt of pay as a member of any of His Majesty's military or naval forces raised for service beyond New Zealand shall not cause a member of either branch of the Legislature to be deemed a Civil servant or contractor for purposes of the Legislature Act.
The payment made to members of the House of Representatives is £25 per month, amounting to £300 per annum, subject to certain deductions for absence during session not due to sickness or other unavoidable cause. Travelling-expenses to and from Wellington are also allowed. This scale of payment came into force on the 7th November, 1901, under the provisions of an Act passed in that year.
The election of a Speaker is the first business of a new House after the members have been sworn. A Chairman of Committees is elected as soon after as is convenient. Both Speaker and Chairman of Committees hold office until a dissolution, but receive payment until the first meeting of a new Parliament.
Twenty members, inclusive of the Speaker, constitute a quorum.
ROLL OF MEMBERS OF PARLIAMENT (12TH AUGUST, 1915) IN THE HOUSE OF REPRESENTATIVES.
| Speaker—Hon. FREDERIC WILLIAM LANG. | Chairman of Committees—ALEXANDER SCOTT MALCOLM. | |
|---|---|---|
| Name. | Electoral District. | Date of Election. |
| For European Electorates. | ||
| Allen, Hon. James | Bruce | 10 December, 1914. |
| Anderson, George James | Mataura | ″ |
| Anstey, John | Waitaki | ″ |
| Bollard, Richard Francis | Raglan | ″ |
| Brown, John Vigor | Napier | ″ |
| Buddo, Hon. David | Kaiapoi | ″ |
| Buick, David | Palmerston | ″ |
| Carroll, Hon. Sir James, K.C.M.G. | Gisborne | ″ |
| Coates, Joseph Gordon | Kaipara | ″ |
| Colvin, James | Buller | ″ |
| Craigie, James | Timaru | ″ |
| Dickie, William James | Selwyn | ″ |
| Dickson, James McColl | Chalmers | ″ |
| Dickson, James Samuel | Parnell | ″ |
| Ell, Henry George | Christchurch South | ″ |
| Escott, James Henry | Pahiatua | ″ |
| Field, Thomas Andrew Hemming | Nelson | ″ |
| Field, William Hughes | Otaki | ″ |
| Fletcher, Robert | Wellington Central | ″ |
| Forbes, George William | Hurunui | ″ |
| Fraser, Hon. William | Wakatipu | ″ |
| Glover, Albert Edward | Auckland Central | ″ |
| Guthrie, David Henry | Oroua | ″ |
| Hanan, Hon. Josiah Alfred | Invercargill | 10 December, 1914. |
| Harris, Alexander | Waitemata | ″ |
| Human, Hon. Alexander Lawrence | Wellington North | ″ |
| Harries, Hon. William Herbert | Tauranga | ″ |
| Hindmarsh, Alfred Humphrey | Wellington South | ″ |
| Hine, John Bird | Stratford | ″ |
| Hornsby, John Thomas Marryat | Wairarapa | ″ |
| Hudson, Richard Phineas | Motueka | ″ |
| Hunter, George | Waipawa | ″ |
| Isitt, Leonard Monk | Christchurch North | ″ |
| Jennings, William Thomas | Taumarunui | 15 June, 1915. |
| Lang, Hon. Frederic William | Manukau | 10 December, 1914. |
| Lee, Ernest Page | Oamaru | ″ |
| McCallum, Richard | Wairau | ″ |
| McCombs, James | Lyttelten | ″ |
| MacDonald, Hon. William Donald Stuart | Bay of Plenty | ″ |
| McNab, Hon. Robert | Hawke's Bay | ″ |
| Malcolm, Alexander Scott | Clutha | ″ |
| Mander, Francis | Marsden | ″ |
| Massey, Right Hon. William Ferguson, P.O. | Franklin | ″ |
| Myers, Hon. Arthur Mielziner | Auckland East | ″ |
| Newman, Alfred Kingcome | Wellington East | ″ |
| Newman, Edward | Rangitikei | ″ |
| Nosworthy, William | Ashburton | ″ |
| Okey, Henry James Hobbs | Taranaki | ″ |
| Parr, Christopher James, C.M.G. | Eden | ″ |
| Payne, John | Grey Lynn | ″ |
| Pearce, George Vater | Patea | ″ |
| Poland, Hugh | Ohinemuri | ″ |
| Poole, Charles Henry | Auckland West | ″ |
| Rhodes, Hon. Robert Heaton | Ellesmere | ″ |
| Rhodes, Thomas William | Thames | ″ |
| Russell, Hon. George Warren | Avon | ″ |
| Scott, Robert | Otago Central | ″ |
| Seddon, Thomas Edward Youd | Westland | ″ |
| Sidey, Thomas Kay | Dunedin South | ″ |
| Smith, Robert William | Waimarino | ″ |
| Statham, Charles Ernest | Dunedin Central | 3 February, 1915. |
| Stewart, William | Bay of Islands | 8 June, 1915. |
| Stewart, William Downie | Dunedin West | 10 December, 1914. |
| Sykea, George Robert | Masterton | ″ |
| Talbot, Charles John | Temuka | ″ |
| Thacker, Henry Thomas Joynt | Christchurch East | ″ |
| Thomson, John Charles | Wallace | ″ |
| Veitch, William Andrew | Wanganui | ″ |
| Walker, Andrew | Dunedin North | ″ |
| Ward, Right Hon. Sir Joseph George, Bart., P.C., K.C.M.G. | Awarua | ″ |
| Webb, Patrick Charles | Grey | ″ |
| Wilford, Thomas Mason | Hutt | ″ |
| Wilkinson, Charles Anderson | Egmont | ″ |
| Witty, George | Riccarton | ″ |
| Wright, Robert Alexander | Wellington Suburbs and Country Districts | 10 December, 1914. |
| Young, James Alexander | Waikato | ″ |
| For Maori Electorates. | ||
| Tau Henare | Northern Maori | 11 December, 1914. |
| Ngata, Hon. Apirana Turupa | Eastern Maori | ″ |
| Pomare, Hon. Maui | Western Maori | ″ |
| Parata, Taare | Southern Maori | ″ |
Isaac Earl Featherston, Esq., appointed Agent-General under the Immigration and Public Works Act, 1870, by Warrant dated 5th April, 1871. Appointment to date from 25th March, 1871. (Gazette, 1871, page 155.)
(Note.—Sir W. Tyrone Power was appointed on 20th June, 1870, by the Crown Agents as temporary Agent-General on the death of Dr. Featherston.)
Sir Julius Vogel, K.C.M.G., appointed Agent-General under the Immigration and Public Works Act, 1870, by Warrant dated 19th September, 1876. Appointment to date from 9th September, 1876, vice I. E. Featherston, deceased. (Gazette 1876, page 721.)
Sir Francis Dillon Bell, appointed Agent-General under the Public Revenues Act, 1878, by Warrant dated 7th December, 1880, vice Sir Julius Vogel, resigned. (Gazette, 1881, page 311.)
Westby Brook Perceval, Esq., appointed Agent-General under the Public Revenues Act, 1891, by Warrant dated 25th September, 1891, vice Sir F. D. Bell. (Gazette, 1891, page 1071.)
The Hon. William Pember Reeves, appointed Agent-General under the Public Revenues Act, 1891, by Warrant dated 23rd December, 1895, vice Sir W. B. Perceval. (Gazette, 1896, page 50.) Appointed High Commissioner under the High Commissioner Act, 1904, by Warrant dated 14th June, 1905. (Gazette, 1905, page 1509.) Reappointed High Commissioner as from 14th June, 1908. (Gazette, 1908, page 1921.)
The Hon. Sir William Hall-Jones, K.C.M.G., appointed High Commissioner from 1st December, 1908, vice Hon. W. P. Reeves. Assumed office 18th January, 1909. (Gazette, 1909, page 27.) Appointment extended to 31st December, 1911. (Gazette, 1911, page 2720.) Appointment further extended to 31st March, 1912. (Gazette, 1912, page 45.) Appointment further extended to 31st May, 1912. (Gazette, 1912, page 1227.)
Charles Frederick Wray Palliser, appointed High Commissioner from 1st June, 1912, for one month. Reappointed from 1st July, 1912, and again reappointed from 1st August, 1912.
The Hon. Thomas Mackenzie, appointed High Commissioner from 23rd August, 1912, for a term of three years. (Gazette, 1912, page 2612.) Assumed office 9th October, 1912. Reappointed from 22nd August, 1915. (Gazette, 1915, page 2283.)
Principal Secretary of State for the Colonies—Right Hon. A. Bonar Law, P.C., M.P.
Parliamentary Under-Secretary—Right Hon. Lord Emmott, P.C., G.C.M.G.
Permanent Under-Secretary—Sir John Anderson, G.C.M.G., K.C.B.
Assistant Under-Secretaries—Sir H. W. Just, K.C.M.G., C.B.; and Sir G. V. Fiddes, K.C.M.G., C.B.
(City Office, Whitehall Gardens, S.W.; Stock Transfer Office, 1 Tokenhouse Buildings, E.C.; Shipping Office, 13 Great St. Helens, E.C.; Packing Store, Cole Abbey Chambers, Lambeth Hill, E.C.)
Crown Agents—Sir Reginald L. Antrobus, K.C.M.G., C.B.; Major Sir Maurice Alexander Cameron, K.C.M.G., late R.E.; and William Hepworth Mercer, C.M.G.
New Zealand—W. G. Wickham, 11 Grey Street, Wellington. Australia—G. T. Milne, Equitable Buildings, Melbourne. (Telegraphic Address: “Combrit.”) Canada—C. Hamilton Wickes, 3 Beaver Hall Square, Montreal. (Telegraphic address: “Britcom.”) South Africa—Sir R. Sothern Holland, Cape Town. (Telegraphic address: “Austere.”)
Argentine Republic.—Vice-Consul: Henry Hampton Rayward, Wellington.
Belgium.—Consul-General for Australasia and Fiji: F. Huylebroeck, Melbourne. Consul (with jurisdiction over New Zealand): M. Matteeuw, Sydney. Consul-General (with jurisdiction over the Provincial Districts of Hawke's Bay, Taranaki, and Wellington): Hon. Charles John Johnston, Wellington. Vice-Consul: G. F. Johnston, Wellington. Consul (with jurisdiction over the Districts of Canterbury, Marlborough, Nelson, and Westland): Joseph James Kinsey, Christchurch. Consuls: Alexander Manual Ferguson, Auckland; George Lyon Denniston, Dunedin.
Brazil.—Vice-Consul: A. H. Miles, Wellington.
Chile.—Consul-General for Commonwealth of Australia, and New Zealand: William Brown, Sydney. Consuls: Joseph James Craig, Auckland; J. Montgomery, Christchurch. Honorary Consuls: Albert Martin, M.D., Wellington; J. A. Roberts, Dunedin.
China.—Consul: Kwei Chih, Wellington.
Denmark.—Consul (for North island): Hon. Sir Francis Henry Dillon Bell, K.C.M.G., Wellington (Principal Consulate). Consul (for South Island): Henry Bylove Sorensen, Christchurch. Vice-Consuls: Paul Maximilian Hansen, Auckland: William Edward Perry, Hokitika; Odin Henry Möller, Dunedin; Michael Myers, Wellington.
France.—Consul (for New Zealand): J. Rigoreau, Auckland. Vice-Consul: Percival Clay Neill, Dunedin. Consular Agents: George Humphreys, Christchurch; James Macintosh, Wellington.
Greece.—Vice-Consul (for New Zealand); Joseph Frank Dyer, Wellington.
Honduras.—Consul-General for Commonwealth of Australia, and New Zealand; Frederic Walsh, Sydney.
Italy.—Consul-General for Commonwealth of Australia, New Zealand, and Fiji: Cavaliere Emilio Eles, Melbourne. Vice-Consul: Cavaliere G. Ferrando, Melbourne. Consular Agents: Thomas Wallace, Christchurch; Leonard Owen Howard Tripp, Wellington; John Roberts, C.M.G., Dunedin; Geraldo Perotti, Greymouth; Charles Rhodes, Auckland.
Japan.—Consul-General: S. Shimizu, Sydney. Consul: Thomas Young, Wellington.
Liberia.—Consul: Charles Louisson, Christchurch. Acting-Consul: Trevor Noel Holmden, Wellington.
Mexico.—Consul: John William Hall, Auckland.
Netherlands.—Consul-General for Commonwealth of Australia, New Zealand, and Fiji: W. L. Bosschart, Melbourne. Vice-Consul de Carriere, attached to Consulate-General, P. E. Teppema, Melbourne. Consul (with jurisdiction over New Zealand and the Islands belonging thereto): Hon. Charles John Johnston, Wellington. Vice-Consuls: George Ritchie, Dunedin; Ambrose Millar, Auckland; Walter Goring Johnston, Wellington; G. Van der Velden, Christchurch.
Norway.—Consul-General for Commonwealth of Australia, New Zealand, and the adjacent islands: O. Römcke, Melbourne. Consul: Alex. W. Newton, Wellington. Vice-Consuls: Sigurd Bentzon, Melbourne; Leslie Robert Wilson, Dunedin; Robert Millar, Auckland; Albert Peter Gundersen, Christchurch; Mathias Ericksen Wiig, Invercargill; John Hayes Enright, Westport.
Paraguay.—Consul: A. E. Kernot, Wellington.
Peru.—Consul-General (with jurisdiction over the Commonwealth of Australia, and New Zealand): J. Maitland Paxton, Sydney. Consul: Ambrose Millar, Auckland.
Portugal.—Consul: John Duncan, Wellington. Vice-Consuls: David L. Nathan, Auckland; Arthur Donald Stuart Duncan, Wellington; Charles William Rattray, Dunedin.
Russia.—Consul-General for the Commonwealth of Australia, and the Dominion of New Zealand: A. N. d'Abaza, Melbourne. Vice-Consuls: Ultan Francis McCabe, Wellington; James Paterson, Auckland.
Spain.—Consul-in-Chief (with jurisdiction over Australia and New Zealand): Senor Don Mario Pinies y Bayona, Melbourne. Vice-Consul (with jurisdiction throughout New Zealand): William Henry Dillon Bell, Wellington.
Sweden.—Consul: Arthur Edward Pearce, Wellington. Vice-Consuls: Sidney Jacob Nathan, Auckland; Albert Kaye, Christchurch.
Switzerland.—Consul: Georges A. Strieff, Auckland.
United. States of America.—Consul-General (for New Zealand and its dependencies): Alfred A. Winslow, Auckland. Vice-Consul-General: Leonard A. Bachelder, Auckland. Consular Agents: Frank Graham, Christchurch; Arthur Edward Whyte, Wellington; Frederick Orlando Bridgeman, Dunedin.
Uruguay.—Consul: Don Cesar Montero Bustamente, Wellington. Vice-Consul: William John Prouse, Wellington.
There is no State Church in the Dominion, nor is State aid given to any form of religion. Government in the early days set aside certain lands as endowments for various religious bodies, but nothing of the kind has been done for many years past.
The principal churches, with the names, &c., of the present heads or officers, and the places and times of holding the annual or periodical assemblies or meetings, are as follows:—
For church purposes, the Dominion is divided into six dioceses—viz., Auckland, Waiapu, Wellington, Nelson, Christchurch, and Dunedin. The General Synod meets every third year in each diocese in rotation. Representatives attend from each diocese, and also from the diocese of Melanesia. President, the Primate (Bishop of Dunedin). The Diocesan Synods meet once a year, under the presidency of the Bishop of the diocese.
The names, &c., of the Bishops of the Church of England are as follows:—
The Most Rev. Samuel Tarratt Nevill, D.D., Dunedin; consecrated 1871 (Primate).
The Right Rev. Alfred Walter Averill, D.D., Auckland; consecrated 1910; translated 1914.
The Right Rev. William Walmsley Sedgwick, B.A., Waiapu; consecrated 1914.
The Right Rev. Thomas Henry Sprott, D.D., Wellington; consecrated 1911.
The Right Rev. William Charles Sadlier, B.D., Nelson; consecrated 1912.
The Right Rev. Churchill Julius, D.D., Christchurch; consecrated 1890.
The Right Rev. Cecil John Wood, D.D., Melanesia; consecrated 1912.
The General Assembly will meet on the third Tuesday of November' 1915, in St Andrew's Church, Auckland. Moderator, the Rev. A. Grant' Dannevirke. Moderator-elect, Rev. William Scorgie, Mornington, Dunedin; Clerk, Rev. J. H. Mackenzie, Nelson; Treasurer, Rev. W. J. Comrie, Presbyterian Church Offices, Wellington; Theological Professors, Rev. Michael Watt, M.A., D.D., Dunedin, Rev. W. Hewitson, B.A., Dunedin, and Rev. John Dickie, M.A., Dunedin; Secretary for Foreign Missions, Rev. A. Don, Dunedin.
The Diocese of Wellington, established in 1848, was in 1887 created an archdiocese and the metropolitan see. There are three suffragan dioceses—Auckland, Christchurch, and Dunedin. A retreat is held annually in each of the four dioceses, at the end of which a synod is held, presided over by the bishop or archbishop, and at which all his clergy attend.
In January, 1899, the first Provincial Council of New Zealand was held in Wellington, under the presidency of the metropolitan, and attended by all the suffragan bishops, and a number of priests elected specially in each diocese as representatives of the whole Catholic clergy in the Dominion. The decrees of this Council were approved by Rome in April, 1900, were published on 1st January, 1901, and are now binding in every diocese in the Dominion.
The Most Rev. Francis Redwood, S.M., D.D., consecrated in 1874, is Archbishop and Metropolitan of the Roman Catholic Church in New Zealand, and the most Rev. Thomas O'Shea has been appointed Coadjutor Archbishop. The following are the bishops:—
Auckland: The Right Rev. Henry W. Cleary, D.D.; consecrated 1910.
Christchurch: Vacant. (The Right Rev. John Joseph Grimes died on the 15th March, 1915.)
Dunedin: The Right Rev. Michael Verdon, D.D.; consecrated 1896.
The New Zealand branches of the Methodist Church of Australasia and the Primitive Methodist Connexion are now united under the designation of the Methodist Church of New Zealand.
The Officers of the Church for 1915 are as follows: President of the Conference, Rev. J. Dawson, Wellington; Vice-President, Mr. H. Holland, Christchurch; Secretary, Rev. W. A. Sinclair, Christchurch; Connexional Secretary, Rev. Samuel Lawry, Christchurch; Secretary for Foreign Missions, Rev. W. Slade, Wellington; Secretary for Home Missions, Rev. T. G. Brooke, Mount Eden.
The affairs of the Church are administered by ten District Synods, which meet annually. The Chairmen are appointed by the Conference.
The next Conference will be held in Auckland, opening during the last week in February, 1916.
President, Rev. E. A. Kirwood, Grange Road, Mount Eden; Vice-President, Mr. C. Cathie, Wellington; Secretary, Rev. R. S. Gray, Dunedin; Treasurer, Mr. W. Lambourne, Ponsonby; Missionary Secretary, Rev. J. K. Archer, Invercargill; Missionary Treasurer, Mr. A. Hoby, Wellington. The Union comprises fifty-three churches, forty-six preaching-stations, 5,763 members, and a constituency of 25,000. The denominational organ is the New Zealand Baptist; Editor, Mr. H. H. Driver, Dunedin. The Foreign Missionary Society, with an income last year of £2,800, has a thoroughly equipped hospital and dispensaries, employs a doctor, two missionaries, five zenana ladies, and forty-six Native helpers. The sphere of operations is in North Tipperah, East Bengal, with a population of 1,200,000.
The annual meetings are held during the month of March, at such place as may be decided on by vote of the Council. Chairman for the current year, Rev. William Saunders, Dunedin; Secretary, Rev. E. A. Bridger, Green Lane; Treasurer, Mr. T. W. White, Auckland; Registrar, Mr. C. B. Gregory, Marton; Head Office, Auckland. In 1916 the meeting of the Council will be held at Dunedin. The Committee of the Union meets in Auckland on the second Tuesday of each month.
Ministers: Rev. S. A. Goldstein and Rev. S. Katz, Auckland; Rev. H. van Staveren and Rev. C. Pitkowski, Wellington; Rev. A. Diamond, Dunedin. Annual meetings of the general congregations are usually held at these places during the month of Elul (about the end of August).
The next Triennial Session of the Associated Churches of Christ will be held at Dunedin at New Year, 1915. President, Mr. C. Fleming McDonald, Dunedin; Vice-president, Mr. Ralfe Gebbie, Christchurch; Secretary, Mr. J. L. Stewart Wright, Dunedin. District conferences are held annually in each of the three districts—Auckland, Middle, and Southern.
The Annual Congress of the Salvation Army is held in the month of April each year.
The principal officers of the Salvation Army in New Zealand are: Territorial Commander, Commissioner H. C. Hodder; Chief Secretary, Lieut.-Col. A. E. Powley,; Secretary for Field Affairs, Major H. B. Colledge; Property Secretary, Brigadier J. H. Bray; National Young People's Secretary, Brigadier W. J. Hoare; Divisional Commanders, Brigadier A. B. Carmichael, Auckland, Major J. Toomer, Wellington, Major E. Newby, Christchurch, Major A. E. Colvin, Dunedin; Principal of Training College, Wellington, Brigadier W. Gist. Among the social institutions maintained by the Salvation Army are: Rescue Homes at St. Albans, Caver sham, Parnell, and South Wellington; Maternity Homes at each of the four chief centres, Samaritan Homes at Gisborne and Napier, Boys' Homes at Island Bay and Eltham; Girls' Homes at Middlemarch and South Wellington; Prison Gate Brigade Homes at Epsom and Addington; and Inebriates' Homes at Pakatoa and Rotoroa.
Baronet.
Ward, Right Hon. Sir Joseph George, 1911.
Privy Councillors (P.C.).
Massey, Right Hon. William Ferguson, 1913.
Ward, Right Hon. Sir Joseph George, 1907.
Williams, Right Hon. Sir Joshua Strange, 1913.
Bell, Hon. Sir Francis Henry Dillon, 1915.
Bowen, Hon. Sir Charles Christopher, 1913.
Carroll, Hon. Sir James, 1911.
Findlay, Hon. Sir John George, K.C., LL.D., 1911.
Hall-Jones, Hon. Sir William, 1910.
Mills, Sir James, 1909.
Perceval, Sir West by Brook, 1894.
Stout, Hon. Sir Robert, 1886.
Ward, Right Hon. Sir Joseph George, 1901.
Bowen, Hon. Sir Charles Christopher, 1910.
Buchanan, Hon. Sir Walter, 1912.
Kennaway, Sir Walter, 1909.
Miller, Hon. Sir Henry John, 1901
McLean, Hon. Sir George. 1909.
O'Rorke, Hon. Sir George Maurice, 1880.
Prendergast, Hon. Sir James, 1881.
Williams, Right Hon. Sir Joshua Strange, 1911.
Wilson, Sir James G., 1915.
Chaytor, Colonel E. W. C., 1915.
Cradock, Major Montagu, 1900.
Davies, Major-General R. H., 1900.
Newall, Colonel Stuart, 1900.
Porter, Colonel T. W., 1902.
Robin, Brigadier-General Alfred William, 1900.
Collins, Colonel Robert Joseph, V.D., I.S.O., 1911.
Fitchett, Frederick, M.A., LL.D., 1911.
Gudgeon, Lieut.-Colonel Walter Edward, 1890.
Hogben, George, M.A., F.G.S., 1915
Jowsey, Lieut.-Colonel Thomas, 1900.
Otterson, Henry, 1913.
Parr, C. J., 1914.
Roberts, John, 1891.
Robin, Brigadier-General Alfred William, 1912.
Stowe, Leonard, 1912.
Andrews, James Frank, 1913.
Blow, Horatio John Hooper, 1911.
Collins, Colonel R. J., V.D., 1909.
Heywood, James B., 1905.
Kensington, W. C., 1909.
Mackenzie, James, 1915.
Robertson, Donald, 1912.
Ronayne, Thomas, 1914.
Strauchon, John, 1912.
Tregear, Edward, 1911.
Biddle, Benjamin, 1869.
Hill, George, 1869.
Lingard, William, 1869.
Mace, Francis Joseph, 1869.
Mair, Gilbert, 1870.
Maling, Christopher, 1869.
Northcroft, Henry William, 1910.*
Preece, George Augustus, 1869.
Roberts, John Mackintosh, 1869.
Wrigg, Harry Charles William, 1898.†
Bartlett, Major E., 1902
Critchley-Salmonson, Captain A. C. B., 1915.
Hart, Major H. E., 1915.
Hickey, Major D. A., 1902.
Hughes, Lieut.-Colonel J. G., 1900.
Major, Colonel C. T., 1900.
O'Neill, Major E., 1915.
Poison, Major D., 1900.
Stevenson, Captain R., 1902.
Todd, Captain T. J. M., 1900.
Waite, Major F., 1915.
Walker, Captain G. H., 1901.
* For service rendered in 1866.
† For service rendered in 1867.
Members of New Zealand Contingents in South Africa, 1899–1902.
Baigent, Private Ivanhoe.
Black, Sergeant-major G. C.
Burr, Sergeant-major W. T.
Cassidy, Sergeant W.
Fletcher, Sergeant-major W. H.
Free, Private A.
Kent, Sergeant W.
Langham, Sergeant-major J.
Lockett, Sergeant-major E. B.
Pickett, Sergeant-major M.
Rouse, Farrier-Sergeant G.
Wade, Private H. B.
White, Sergeant-major H.
Members of New Zealand Expeditionary Force in Dardanelles Operations, 1915.
Abbey, Sergeant A. W.
Barlow, Private H.
Bennett, Corporal P. H. G.
Comrie, Private James.
Crawford-Watson, Private L.
Fear, Lance-Corpl. F. J. H.
Findlay, Private A. J.
Henry, Private W. J.
Hodges, Sapper E. A.
McLeod, Private R. C.
O'Connor, Private F.
Reid, Corporal W. J.
Rodger, Sergeant W. J.
Salmon, Corporal C. W.
Saunders, Corporal C. W.
Scrimshaw, Sapper E. G.
Steedman, Lance-Corpl. A. B.
Stockdill, Private T.
Swan, Private J. W.
Tempany, Private G. A.
Tilsley, Sergeant R.
Wilson, Private C. M.
Wimos, Corporal J.
(One of four knitted by Her late Majesty Queen Victoria for presentation to selected members of Colonial Contingents in South Africa.)
Coutts, Captain Henry Donald, 1900.
By despatch from the Secretary of State for the Colonies, dated 30th October, 1856, the Governor was apprised that the title of “Honourable” was conferred on members of the Legislative Council and on the Speaker of the House of Representatives of New Zealand.
By despatch from the Secretary of State for the Colonies, dated 15th June, 1893, it was announced that the title of “Honourable,” appertaining to Members of the Executive and Legislative Councils in colonies possessing Responsible Government, whether confined to duration of office or continued for life, was approved by Her late Majesty Queen Victoria, for use and recognition throughout her dominions, either during office or for life, as the case might be.
By further despatch of 10th March, 1894, the Secretary of State announced that he was prepared in future to submit for the approval of the Sovereign the recommendation of the Governor of any colony having Responsible Government that the President of the Legislative Council or the Speaker of the Legislative Assembly may, on quitting office after three years' service in their respective offices, be permitted to retain the title of “Honourable.” This title is now held by Sir G. M. O'Rorke.
Besides the members of the Executive and Legislative Councils, the following ex-Ministers are allowed, as such, to retain the title of “Honourable” Buddo, David. 1912; Carroll, Sir James, K.C.M.G., 1912; Findlay, Sir John George, K.C., LL.D., K.C.M.G., 1911; Fowlds, G., 1911; Hall-Jones, Sir William, K.C.M.G., 1908; Hislop, Thomas W., 1891; McKenzie, Roderick, 1912; Mackenzie, Thomas, 1912; Millar, John Andrew, 1912; Mills, Charles H., 1900; Mitchelsen, Edwin, 1891; Ngata, Apirana Turupa, 1912; Oliver, Richard, 1884; Reeves, William P., 1890; Stout, Hon. Sir Robert, K.C.M.G., 1887; Thompson, Thomas, 1900; Tole, Joseph A., 1888.
By another despatch of 14th November, 1896, the Secretary of State requested to be informed if the Government of New Zealand desired that members of the Legislative Council in this Dominion should on retirement or resignation, after a continuous service in such Council of not less than ten years, be eligible for recommendation by the Governor for Royal permission to retain the title of “Honourable.”
By despatch of 29th August, 1877, it was announced that retired Judges of the Supreme Court may be allowed the privilege of bearing the title of “Honourable” for life, within the Dominion. This title is now held by Sir James Prendergast.
By despatch of 22nd December, 1911, it was announced that the title of “Honourable” was conferred on Chief Justice and Judges of the Supreme Court of New Zealand.
By an Act passed during the year 1912 and intituled the Public Service Act, 1912, the Public Service of New Zealand was placed under the direct and sole control of a Commissioner and two Assistant Commissioners, who were appointed in the first place for a term of seven years, are responsible only to Parliament, and can be dismissed from office only for misbehaviour or incompetence.
The Act became operative on the 1st April, 1913, and applies to all members of the Public Service with the exception of the Controller and Auditor-General, officers of the Railway Department, members of the Police and Defence Forces, Judges and Magistrates, officers of the House, certain officers of the Legislative Departments, and persons paid only by fees or commission, as well as any officer to whom the Governor in Council declares the Act shall not apply.
The powers vested in the Commissioner are very wide. They include the inspection of offices, the appointment, promotion, transfer, and dismissal of officers, and the framing of regulations.
An entrance examination is provided for youths desirous of entering the service, and efficiency and educational tests for promotion have been established.
In accordance with the provisions of the Education Act, 1914, Inspectors appointed by Education Boards, and in office on the 1st January, 1915, are deemed to be Inspectors of the Education Department as if they had been appointed under the Public Service Act, and will in future come under the jurisdiction of the Commissioner. Under the same Act the Commissioner is empowered to appoint to the Clerical Division of the Public Service any person who on the 1st January. 1915, was permanently employed by any Education Board for more than twenty hours a week in clerical work.
In accordance with the provisions of Section 17 of the Act, a classification of all officers to whom the Act applied was immediately proceeded with by the Commissioner on his assuming control. The provisional list for Departments other than the Post and Telegraph Department was gazetted on the 20th August, 1913.
The Post and Telegraph Department had been working under a classification system for some years, and the list for this Department for 1913–14 was published separately on the 14th October, 1913.
The classified staff on the following dates was,—
| Departments other than Post and Telegraph. | ||
|---|---|---|
| As at 1st April, | Number. | Salaries. |
| £ | ||
| 1913 | 4,641 | 874,437 |
| 1914 | 5,095 | 953,343 |
| 1915 | 5,613 | 1,098,960 |
The large increase as at 1st April, 1915, is accounted for by the fact that 253 temporary employees were made permanent, and 40 Inspectors brought under the operation of the Public Service Act.
| Post and Telegraph Department. | ||
|---|---|---|
| As at 1st April, | Number. | Salaries. |
| £ | ||
| 1913 | 5,372 | 708,165 |
| 1914 | 5,033 | 761,365 |
| 1915 | 5,958 | 824,242 |
An officer dissatisfied with any decision of the Commissioner with regard to (1) grade, (2) classification of the work performed by or assigned to him, or (3) salary or promotion, has the right of appeal, notice of which must be lodged with the Commissioner within thirty days. All appeals are dealt with by a Board consisting of three members, two of these appointed by the Governor, and the third elected by the officers of that branch of the service to which the appellant belongs. The decision of the Appeal Board on all matters brought before it is final.
Public Service Commissioner—D. Robertson, I.S.O.
Assistant Commissioners — R. Triggs, A. D. Thomson.
Secretary—P. Verschaffelt.
Speaker —Hon. Sir C. C. Bowen, K.C.M.G.
Chairman of Committees — Hon. W. C. F. Carncross.
Clerk of Parliaments, Clerk of the Legislative Council, and examiner of Standing Orders upon Private Bills—L. Stowe, C.M.G.
Clerk-Assistant and Acting Gentleman Usher of the Black Rod—A. T. Bothamley.
Second Clerk - Assistant — B. E. S. Stocker, M.A.
Interpreter—F. H. Phillips.
Speaker—Hon. F. W. Lang, M.P.
Chairman of Committees—A. S. Malcolm, M.P.
Clerk of the House—(Vacant).
Clerk-Assistant—A. F. Lowe.
Second Clerk-Assistant—E. W. Kane.
Sergeant-at-Arms—Major T. V. Shepherd.
Reader and Clerk of Bills and Papers—W. E. Dasent.
Record Clerk—W. Collings.
Chief Hansard Reporter—S. Spragg.
Hansard Supervisor—M. F. Marks.
Clerk of Writs—J. Hislop.
Deputy Clerk of Writs—G. P. Newton.
Interpreter—D. F. G. Barclay.
Prime Minister —Rt. Hon. W. F. Massey, P.C.
Secretary to Cabinet and Clerk of the Executive Council—J. F. Andrews, I.S.O.
Private Secretary — F. D. Thomson, B.A.
Assistant Private Secretary — F. W. Furby.
Minister of Finance—Hon. J. Allen.
Private Secretary—F. G. Matthews.
Secretary, Receiver - General, Paymaster-General, and Registrar New Zealand Consols—G. F. C. Campbell.
Accountant, and Deputy Registrar New Zealand Consols—A. O. Gibbes.
Assistant Accountant and Inspector of Departmental Accounts — J. J. Esson.
Cashier—C. E. Chittey.
Head Ledger-keeper—A. J. Morgan.
Clerk in Charge Pay and Revenue Branches—H. J. Hawthorn.
Sectional Clerk—W. Wilson.
Correspondence and Record Clerk—M. S. Seddon.
Sectional Clerk—G. C. Rodda.
Ledger-keeper—R. Witheford.
Assistant Inspector Departmental Accounts—T. H. Jones.
Registrar—R. E. Hayes.
Revising Barrister—E. Y. Redward.
Actuary and Deputy Registrar—A. T. Traversi.
Members—Hon. the Minister of Finance (Chairman, ex officio), Dr. Hay, Messrs. W. R. Morris, G. F. C. Campbell, and R. E. Hayes.
Superintendent of Fund—R. E. Hayes.
Secretary to Board—A. T. Traversi.
Board meets third Thursday in February, May, August, and November, or as business requires.
Minister—Rt. Hon. W. F. Massey, P.C.
Private Secretary — F. D. Thomson, B.A.
Minister of Stamp Duties—Hon. A. L. Herdman.
Private Secretary—E. N. G. Poulton.
Auckland—W. G. Fletcher.*
Gisborne—R. S. Florance.*
Taranaki—A. V. Sturtevant.*
Hawke's Bay—F. Aspinall.*
Wanganui—G. Sampson.
Wellington—(Vacant).
Marlborough—F. Broughton.*
Nelson—W. Johnston.*
Westland—W. P. Morgan.*
Canterbury—P. G. Withers.*
Timaru—H. Kissel.
Otago—J. Murphy.*
Southland—W. W. de Castro.*
Postmaster - General and Minister of Telegraphs—Hon. R. H. Rhodes.
Private Secretary—W. Crow.
Secretary—W. R. Morris.
Assistant Secretaries — F. V. Waters and G. B. Dall.
Chief Clerk—J. C. Williamson.
Chief Telegraph Engineer—J. Orchiston, M.I.E.E.
Chief Electrician—T. Buckley.
Chief Inspector—R. B. Morris.
Controller of Money-orders and Savings-banks—J. L. H. Ledger.
Chief Accountant—H. A. R. Huggins.
Inspector of Telegraph Offices—H. W. Harrington.
Controller of Stores—C. B. Mann.
Inspector of Savings-banks—W. Gee.
Auckland—F. D. Holdsworth.†
Thames—P. P. White.†
Gisborne—J. J. Pickett.†
Napier—E. Northcroft.†
New Plymouth—C. H. Burton.†
Wanganui—G. W. Sampson†
Wellington—A. P. Dryden.
Blenheim—C. Whelan.†
Nelson—W. T. Ward.†
* Also Registrars of Building Societies, Industrial and Provident Societies, and Assistant Registrars of Companies.
† Combined post and telegraph offices.
Westport—A. W. Mann.*
Greymouth—D. St. George.*
Hokitika—G. A. Empson.*
Christchurch—(Vacant).
Timaru—H. Kissel.*
Oamaru—C. Hill.*
Dunedin—W. McHutcheson.
Invercargill—T. T. King.*
Auckland—R. M. Baird.
Wellington—E. A. Shrimpton, M.I.E.E.
Nelson—G. T. Kemp.
Christchurch and Dunedin—W. E. Chisholm.
P. Curtis (Northern District), A. T. Cavell (Central District), S. Inder (Wellington District), C. M. Price (West Coast District), G. F. Furby (Midland) District), S. F. Haszard (Southern District).
Minister—Hon. R. H. Rhodes.
Private Secretary—W. Crow.
Minister of Railways—Hon. W. H. Herries.
Private Secretary—L. E. Johnson.
Chief Traffic Manager—H. Buxton.
Traffic Superintendents—North Island—C. A. Piper; South Island—S. F. Whitcombe.
District Managers — Whangarei, W. Sword: Auckland. A. Duncan; Ohakune, G. Brownlee; Wanganui, J. E. Armstrong; Wellington, J. Bevin; Westport, P. L. Payne; Westland, A. H. Mellor; Christchurch, W. J. Stringleman: Dunedin, W. Bowles; Invercargill, T. W. Brebner.
Stationmasters in Charge — Kaihu, R. H. Nicolson; Gisborne, J. R. Boswell; Nelson, J. Young; Picton, A. M. Arthur.
Chief Engineer for Working Railways—J. Burnett, M.Inst.C.E.
Inspecting Engineer—F. W. MacLean.
Signal Engineer—H. J. Wynne, A.M.Inst.C.E.
Office Engineer—G. A. Troup.
Railway Land Officer—J. Young.
District Engineers—Auckland, D. T. McIntosh; Ohakune, C. T. Jeffreys; Wanganui, A. C. Koch; Wellington, F. C. Widdop; Westport and Westland, J. K. Lowe; Christchurch, A. J. McCredie; Dunedin, H. Macandrew; Invercargill, C. M. Benzoni.
Chief Mechanical Engineer—H. H. Jackson.
Locomotive Engineers—Auckland, F. T. Murison; Wellington – Napier–New Plymouth, G. E. Richardson; Hurunui – Bluff, G. A. Pearson; Westport and Westland, E. L. W. Haskins; Relieving, S. P. Evans and E. E. Gillon.
* Combined post and telegraph offices.
Members—Chairman, W. R. Haselden, S.M., appointed by the Governor: A. W. Hutchings, Assistant Stationmaster, Wellington, elected; D. Dwyer, Guard, Wanganui, elected; J. L. Churchouse, Ganger, Cross Creek, elected; D. McKenzie, Machinist, Petone, elected; A. Whisker, Engine-driver, Taumarunui, elected.
Meets irregularly when required and where most convenient.
Members—Chairman, W. R. Haselden, S.M., appointed by the Governor; J. P. Matheson, Goods Agent, Christchurch, elected; P. Gaines, Guard, Christchurch, elected; G. P. Martin, Engine-driver, Invercargill, elected; J. H. Jones, Turner, Addington, elected; E. J. Dash, Ganger, Waikari, elected.
Meets irregularly when required and where most convenient.
Members—Chairman, Hon. the Minister of Railways; J. L. Salmond, LL.B., Solicitor-General; F. Fitchett, M.A., LL.D., Public Trustee; E. H. Hiley, General Manager, Railways; elected—E. P. Moir, M. Lee, W. T. Wilson, and P. Gaines.
Board meets quarterly at Wellington.
Chief Judge—Jackson Palmer.
Judges—R. N. Jones, W. E. Rawson, C. E. MacCormick, M. Gilfedder, T. W. Fisher. J. W. Browne, A. G. Holland, T. H. Wilson, J. B. Jack.
Commissioners—H. W. Bishop, W. H. Bowler, H. Carr, C. T. H. Brown.
For places and dates of meetings of Boards see New Zealand Gazette of 30th April, 1914.
Minister of Justice and Attorney-General—Hon. A. L. Herdman.
Private Secretary—E. N. G. Poulton.
Auckland—R. E. G. Thomas.
Hamilton—E. Rawson.
Gisborne—W. A. Barton.
New Plymouth—A. Crooke.
Napier—S. E. McCarthy.
Wanganui—W. Kerr.
Palmerston North—J. W. Poynton.
Masterton—L. G. Reid.
Wellington—W. A. Hawkins.
Nelson—J. S. Evans.
Blenheim—F. O'B. Loughnan.
Westport—W. Wilson.
Greymouth and Hokitika—J. G. L. Hewitt.
Christchurch—A. H. Holmes.
Timaru—V. G. Day.
Dunedin—A. Stubbs.
Invercargill—J. R. Colyer.
Auckland—R. E. G. Thomas.
Poverty Bay—W. A. Barton.
Taranaki—J. Terry.
Hawke's Bay—S. E. McCarthy.
Wanganui and Rangitikei—F. W. Hart.
Manawatu—C. J. Hewlett.
Wairarapa—M. Foley.
Wellington—W. A. Hawkins.
Marlborough—A. F. Bent.
Nelson—W. Heaps.
Westland—J. G. L. Hewitt.
Westland North—J. McIndoe.
Westland Central—G. N. Morris.
Canterbury—A. H. Holmes.
Timaru—V. G. Day.
Otago—A. Stubbbs.
Southland—J. R. Colyer.
Auckland—Hon. J. A. Tole.
Hamilton—H. T. Gillies.
Gisborne—F. W. Nolan.
Napier—H. A. Cornford.
New Plymouth—H. R. Billing.
Wanganui—G. Marshall.
Palmerston North—C. A. Loughnan.
Masterton—A. R. Bunny.
Wellington—H. H. Ostler.
Blenheim—C. H. Mills.
Nelson—C. Y. Fell.
Westport—A. A. Wilson.
Greymouth—M. Hannan.
Hokitika—J. Park.
Christchurch—S. G. Raymond.
Timaru—J. W. White.
Oamaru—A. G. Creagh.
Dunedin—W. C. MacGregor.
Invercargill—W. Macalister.
Auckland—C. C. Kettle, E. C. Cutten, and F. V. Fraser.
Whangarei, &c.—E. Page.*
Hamilton. &c.—E. Rawson.
Russell, &c.—E. W. Burton.
Rotorua, &c.—R. W. Dyer.
Thames, &c.—F. J. Burgess.*
Gisborne, &c.—W. A. Barton and R. S. Florance.
New Plymouth, &c.—A. Crooke.
Hawera, &c.—W. G. K. Kenrick.
Napier, &c.—S. E. McCarthy.
Wanganui, &c.—W. Kerr.
Palmerston North, &c.—J. W. Poynton.
Wairarapa, &c.—L. G. Reid.
Wellington, &c.—W. G. Riddell and D. G. A. Cooper.
Blenheim, etc.—F. O'B. Loughnan.
Nelson. &c.—J. S. Evans.
Westport, &c.—W. Wilson.*
Greymouth and Hokitika, &c.—J. G. L. Hewitt.*
Christchurch, &c.—H. W. Bishop.
Kaiapoi, &c.—T. A. B. Bailey.
Timaru, &c.—V. G. Day.
Oamaru, &c.—J. B. Bartholomew.*
Dunedin, &c.—H. Y. Widdowson
Gore, &c.—H. A. Young.*
Naseby, &c.—R. J. Acheson.
Invercargill, &c.—G. Cruickshank (T. Hutchison, relieving).
Chatham Islands—Dr. G. H. Gibson.
* Also are Wardens of Goldfields.
Auckland—W. S. Fisher.
Wellington—(Vacant).
Christchurch—T. D. Kendall.
Dunedin—C. Zachariah.
Auckland—C. A. Barton.
Hamilton—H. J. Dixon.
Te Kuiti—F. W. Schramm.
Rotorua—C. V. Roberts.
Taumarunui—A. H. Cutler.
Gisborne—G. J. A. Johnstone.
Wairoa—J. L. Crowther.
Napier—J. Jordan.
Hastings—T. M. Lawlor.
Waipukurau, &c.—W. Baker.
Dannevirke—H. Smith.
New Plymouth—J. Terry.
Hawera—D. W. Mason.
Stratford—W. J. Reeve.
Wanganui—F. W. Hart.
Taihape—F. Mitchell.
Marton, &c.—H. Morgan.
Feilding—C. E. Taylor.
Palmerston North—C. J. Hewlett.
Otaki—T. O'Rourke.
Wellington—R. P. Ward.
Masterton—M. Foley.
Pahiatua—D. O'Rourke.
Christchurch—W. A. D. Banks.
Lyttelton—A. E. Reynolds.
Kaiapoi and Rangiora—A. G. Ashby.
Timaru—T. W. Tayler.
Temuka—W. S. Jones.
Waimate—W. Y. Purchase.
Oamaru—A. A. Mair.
Port Chalmers—S. R. McDonald.
Balclutha—W. Harte.
Invercargill—J. R. Colyer.
Whangarei—F. Bird, jun.
Thames—J. C. Malfroy.
Coromandel—G. H. Sherwood.
Paeroa and Te Aroha—H. R. Bush.
Waihi—D. P. Phillips.
Tauranga—T. R. W. Philpotts.
Nelson—J. Fitzgerald.
Blenheim—A. F. Bent.
Westport—J. McIndoe.
Reefton—G. N. Morris.
Greymouth—E. W. Cave.
Kumara—G. H. Harris.
Hokitika—J. N. Nalder.
Ashburton—G. G. Chisholm.
Dunedin—B. Harper.
Naseby, &c.—J. A. Norrie.
Cromwell, &c.—J. Reid.
Queenstown and Arrowtown — A. J. Thompson.
Lawrence—J. M. Adam.
Gore—G. H. Lang.
Riverton and Orepuki—A. E. Dobbie.
Arrowtown, H. Graham; Carterton, (vacant); Dannevirke, J. Drummond; Dunedin, C. C. Graham; Feilding, J. J. Bagnall, E. Goodbehere; Foxton, A. Fraser; Kawhia, T. D. Hamilton, Kinohaku, W. J. Shaw; Levin, W. C. Nation; Marton, J. J. McDonald; New Plymouth, J. Mackay; Ohakune, E. G. Allsworth; Onehunga, D. A. Sutherland; Opotiki, P. A. Crawford; Otahuhu, A. R. Harris; Paeroa, J. Nathan; Pahi, J. B. Ariell; Port Albert, L. P. Becroft; Queenstown, L. Hotop; Raglan, W. H. Wallis; Taihape, J. P. Aldridge; Takaka, A. Sinclair; Tapanui, W. Quin; Taumarunui, A. S. Laird; Te Awamutu, J. B. Teasdale; Te Kopuru, T. Webb; Te Kuiti, J. Boddie; Te Puke, C. Lally; Thames, W. H. Lucas; Waihi, W. M. Wallnutt; Waipawa, J. C. Taylor; Waiuku, W. J. King; Westport, G. B. Sinclair: Whangarei, J M. Killen; Woodville, E. J. Gothard. All Stipendiary Magistrates are ex officio Coroners.
Solicitor - General — J. W. Salmond, K.C., LL.B.
Assistant Law Officers—H. H. Ostler, LL.B., E. Y. Redward, P. S. K. Macassey.
Law Draftsman—W. Jolliffe.
Assistant Law Draftsman—J. Christie, LL.M.
Inspector—C. E. Matthews.
Gaolers—Auckland, A. W. Ironside; Invercargill, (vacant); Lyttelton, J. C. Scanlon; Napier, A. Gideon; New Plymouth, H. McMurray; Wellington, M. Hawkins; Kairtgaroa; W. Ayling; Waipa Valley, G. Anderson; Waikeria (vacant).
Members—Hon. Sir R. Stout, K.C.M.G., Dr. Hay, F. Waldegrave, G. Fenwick, W. Recce, and G. C. B. Jordan.
Board meets once a quarter at different gaols.
Commissioner of Police—J. Cullen.
Superintendents—J. W. Ellison, Wellington; N. Kiely, Auckland; J. Dwyer, Christchurch; J. O'Donovan, Dunedin.
Inspectors—E. Wilson, Wanganui; A. H. Wright, Hamilton; S. P. Norwood, Invercargill; W. J. Phair, Greymouth; J. A. McGrath, Napier; C. W. Hendry, Wellington; A. Cruickshank, Auckland.
Sub-Inspectors—B. Sheehan, Timaru; R. Marsack, Palmerston North; W. Fouhy, New Plymouth; J. Johnston, Gisborne; W. H. Mackinnon, Wellington; W. B. McIlveney, Auckland; C. R. Broberg, Dunedin; G. Hastie, Christchurch.
Clerk in Charge—F. G. Twiss.
Resident Commissioner, Rarotonga—H. W. Northcroft, N.Z.C.
Resident Commissioner, Niue—H. G. Cornwall.
Resident Agents—Mangaia, J. C. Cameron; Aitutaki, T. Duncan; Atiu, D. B. Russell; Mauke, H. J. B. Morris; Penrhyn, W. Wilson; Manihiki and Rakahanga, H. Williams; Pukapuka, Johnstone Dyer.
Chief Medical and Health Officer—Dr. G. P. Baldwin.
Medical Officer, Niue—Dr. J. Pirie Cameron.
Registrar of Courts—H. H. G. Ralfe.
Collector of Customs—W. J. Stevenson.
Engineer—H. M. Connal.
Clerk to Federal Council and Government Printer—S. Savage.
Fruit Inspector—E. A. Reid.
European Police Officer—J. Nash.
Inspecting Engineer and Inspector of Mines—F. Reed, M.I.M.E.
District Inspectors: — Thames and Auckland Districts—B. Bonnie and M. Paul: Canterbury, Otago, and Southland Districts—E. R. Green and A. Whitley: West Coast Districts—J. Newton (Westport), T. O. Bishop (Reefton).
Lecturers and Instructors:—Thames—W. H. Baker, B.Sc.: Coromandel—W. B. Inglis: Waihi—A. H. V. Morgan, M.A.: Karangahake—R. B. MacDuff: Reefton—J. McPadden: Wcstport—H. Lovell.
Members — The Director, Geological Survey; the Surveyor-General; the Inspecting Engineer of Mines; the Chief Inspector of Machinery; J. Bishop; J. C. Brown; and H. A. Gordon, F.G.S.
Same official members as preceding Board, excepting the Chief Inspector
of Machinery, with the following private members: H. A. Gordon, F.G.S., Auckland; T. Gilmour, Waihi; H. S. Molineaux, Barewood; and H. P. Hornibrooke, Coromandel.
The Director of Geological Survey is Chairman of both Boards, and H. E. Radcliffe is the Secretary.
Board meets once a year in Wellington.
Wellington—F. J. Gunn.
Christchurch—J. O. Butler.
Wanganui—F. A. Nalder.
Dunedin—T. Quinlivan.
Minister of Internal Affairs — Hon. Sir F. H. D. Bell, K.C.
Private Secretary—J. W. Black.
Chief Electoral Officer—J. Hislop.
Clerk in Charge and Deputy Electoral Officer—G. G. Hodgkins.
Members—The Minister of Internal Affairs (Chairman), the Director of the Dominion Museum, the President of the New Zealand Institute, Professor A. P. W. Thomas, and Messrs. H. F. Von Haast, G. M. Thomson, C. A. Even, and P. G. Morgan.
President—D. Petrie, M.A., Ph.D.
Hon. Treasurer—C. A. Ewen.
Secretary—B. C. Aston, F.I.C.
Dominion Analyst and Chief Inspector of Explosives—J. S. Maclaurin, D.Sc., F.C.S.
Mining Chemist—W. Donovan, M.Sc.
Explosives Chemist and Inspector of Explosives—R. Girling-Butcher.
High Commissioner — Hon. T. Mackenzie.
Secretary—C. F. W. Palliser.
Trade and Immigration Representative—T. E. Donne.
Accountant—G. F. Copus.
Produce Commissioner—H. C. Cameron.
Veterinarian—A. Crabb, M.R.C.V.S.
Chief Clerk—A. S. Row.
Nominated by the Government—H. J. H. Blow, I.S.O., G. F. C. Campbell, F. W. Flanagan, J. H. Richardson.
Elected by Contributors in the Post and Telegraph Department—H. E. Combs, H. A. R. Huggins.
Elected by contributors in the Police Department—Superintendent J. W. Ellison.
Elected by Contributors in other Departments—G. Allport, H. W. Bishop, J. W. Macdonald.
The Board holds its meetings in the Public Trust Building, Wellington, on the second Thursday in February, May, August, and November.
Controller and Auditor - General — Colonel R. J. Collins, C.M.G., I.S.O.
Deputy Controller and Auditor and Chief Clerk—P. Purvis Webb.
Audit Officer, London—T. H. Hamer.
Audit Inspectors—
Auckland—B. A. Meek, H. Wylie, C. G. Collins.
Napier—O. R. Younghusband.
New Plymouth—J. H. Fowler.
Wanganui—J. P. Rutherford.
Wellington—H. A. Lamb, J. Ward.
Nelson—J. C. A. Dudley.
Christchurch—A. W. Eames, A. L. B. Jordan.
Dunedin—C. P. Johnson, C. A. Ralston.
Invercargill—H. T. Thompson.
(Under New Zealand Loans Act, 1908.)
Minister of Finance—Hon. J. Allen.
Controller and Auditor - General —Colonel R. J. Collins, C.M.G., I.S.O.
Public Trustee—Dr. Fitchett, LL.D., C.M.G.
Speaker, House of Representatives—Hon. F. W. Lang.
Secretary to Commissioners—P. Purvis Webb.
Registrar-General—F. W. Mansfield.
Government Statistician—M. Fraser.
Deputy Registrar-General and Chief Clerk—W. W. Cook.
Chief Compiler, Statistical Branch—F. H. Machattie.
Year-book Clerk—J. W. Butcher.
Registrars of Birth, Deaths, and Marriages—Auckland, T. Culpan; Wellington, W. W. Cook; Christchurch, F. Evans; Dunedin, H. Maxwell.
Government Printer, Stationery Office Manager, and Controller of Stamp Printing—J. Mackay.
Chief Clerk and Accountant—B. B. Allen.
Superintendent—W. A. G. Skinner.
Inspector-General—F. Hay, M.B., C.M.
Deputy Inspector-General—St. L. H. Gribben, M.D.
Assistant Inspector—Miss H. Maclean.
Chief Clerk—D. Souter.
Medical Superintendent, Auckland Mental Hospital—R. M. Beattie, M.B.
Medical Superintendent, Christchurch Mental Hospital—W. B. Gow, M.D.
Medical Superintendent, Porirua Mental Hospital—G. Hassell, M.D.
Medical Superintendent, Seacliff Mental Hospital—F. T. King, M.B.
Medical Superintendent, Tokanui Mental Hospital, Kihikihi—A. Crosby, M.R.C.S.
Medical Superintendent. Nelson Mental Hospital—H. E. Jeffreys, M.R.C.S.
Superintendent, Hokitika Mental Hospital—J. Downey; Medical Officer H. Macandrew, M.B.
Minister—Hon. R. H. Rhodes.
Private Secretary—W. Crow.
Inspector-General of Hospitals, Chief Health Officer, and Registrar of Nurses and Midwives — T. H. A. Valintine, M.R.C.S., L.R.C.P., D.P.H.
Deputy Chief Health Officer—J. P. Frengley, M.D., F.R.C.S., D.P.H.
Assistant Inspector of Hospitals and Deputy Registrar of Nurses and Midwives—Miss H. Maclean.
Chief Clerk—E. A. S. Killick.
District Health Officers—Auckland. Dr. R. H. Makgill; Napier, Dr. F. I. De Lisle; Wellington, Dr. H. E. Finch; Christchurch. Dr. H. Chesson; Dunedin, Dr. S. Smith.
Chairman—Dr. J. P. Frengley.
Members—G. Hogben, C.M.G., M.A.; W. H. Morton, M.Inst.C.E., M.R.San. Inst.; A. Burt, jun.; and J. Clark.
Secretary—(vacant).
Board meets at irregular intervals, usually at Wellington.
Government Pathologist—R. H. Makgill, M.D., Edin., D.P.H., Camb.
Bacteriologist—J. A. Hurley.
Commandant N.Z. Defence Forces—Colonel A. W. Robin, C.B., C.M.G., T.D., N.Z. Staff Corps.
Assistant Military Secretary—Captain F. Hudson, N.Z. Staff Corps.
Chief Clerk—W. E. Butler.
Inspector of Rifle Clubs, Rifle Ranges, and Drill Halls—Colonel G. C. B. Wolfe, Reserve of Officers.
Judge Advocate-General—Colonel J. R. Reed, K.C., Reserve of Officers.
Chief of General Staff—Lieut.-Colonel C. M. Gibbon, Imperial General Staff.
Attached to General Staff—Captain W. B. D. Thring, R.N.Z.A.; Lieut, E. Purdon, N.Z. Staff Corps; Honorary Captain J. F. Rockstrow, temporarily attached to N.Z. Staff Corps.
Adjutant-General — Lieut.-Colonel H. E. Pilkington, R.N.Z.A.
Assistant Adjutant-General — Captain P. W. Skelley, N.Z. Staff Corps.
Quartermaster-General—Colonel A. W. Robin, C.B., C.M.G., T.D., N.Z. Staff Corps.
Assistant Quartermaster - General — (Q.M.G. (1)), H. M. Griffen.
Assistant Quartermaster - General — (Q.M.G. (2)), Major W. L. Robinson, N.Z. Staff Corps.
Assistant Quartermaster - General — (Q.M.G. (3)), Honorary Major J. O'Sullivan.
Assistant Quartermaster - General — (Q.M.G. (4)), G. Rodda.
Artillery Store Accountant—Honorary Lieut. R. G. V. Parker, R.N.Z.A.
Engineer Store Accountant—Honorary Lieut. R. G. V. Parker, R.N.Z.A.
Inspector Army Service Corps—Captain H. H. Wright, A.S.C.
Director of Veterinary Services and Remounts—Colonel C. J. Reakes, N.Z. Veterinary Corps.
Officer Commanding District—Colonel R. W. Tate.
Attached to General Staff—Major W. C Morrison, N.Z. Staff Corps.
Assistant Adjutant and Quartermaster-General—Major J. T. Bosworth, N.Z. Staff Corps.
Officer Commanding District—Colonel R. A. Chaffey, V.D., attached to N.Z. Staff Corps.
Attached to General Staff — Major W. C. Finnis, N.Z. Staff Corps.
Assistant Adjutant and Quartermaster-General—Major W. H. Meddings, N.Z. Staff Corps.
Officer Commanding District—Colonel J. C. Nicols, V.D., A.D.C.
General Staff Officer—Major D. A. Hickey, D.S.O., N.Z. Staff Corps.
Assistant Adjutant and Quartermaster-General—Captain C. L. Hawkins, N.Z: Staff Corps.
Officer Commanding—Lieut.-Colonel J. E. Hume, R.N.Z.A.
Commanding Detachment R.N.Z.A.—Auckland (vacant).
Commanding Detachment R.N.Z.A.—Wellington, Captain W. B. P. Thring, R.N.Z.A.
Commanding Detachment R.N.Z.A.—Lyttelton, Captain D. MacDonald, R.N.Z.A.
Commanding Detachment R.N.Z.A.—Dunedin, Captain S. G. Sandle, R.N.Z.A.
NOTE.—For full particulars of rank and names of Officers of Permanent Staff and Territorial Force vide Army List of the New Zealand Forces, published quarterly.
Positions held by Officers of the New Zealand Staff Corps and Royal N.Z. Artillery at Headquarters and at District Headquarters shown opposite their names are in almost every case held temporarily during the absence on service with the New Zealand Expeditionary Force of the Officers permanently appointed to such positions.
Mangonui — Officer in Charge, J. T. Williams.
Russell—Coastwaiter, H. Stephenson.
Whangaroa—Coastwaiter, A. G. Ratcliffe.
Whangarei—Coastwaiter, J. Munro.
Hokianga—Coastwaiter, F. A. Hardy.
Kaipara—Collector, D. Savident.
Auckland—Collector, J. P. Ridings; Sub-Collector. A. V. Penn; First Clerk, B. Anderson.
Thames—Coastwaiter, T. C. Bayldon.
Tauranga—Collector, F. J. Robertshaw.
Poverty Bay—Collector, J. Howie.
New Plymouth—Collector, R. B. D. Eyre.
Waitara—Coastwaiter, L. H. Sampson.
Patea—Collector, H. W. Williams.
Napier—Collector, W. F. Dickey.
Wanganui—Collector, F. J. Walker.
Wellington—Collector, E. R. Brabazon; Sub-Collector, E. T. W. Maclaurin; First Clerk, H. A. Jackman.
Wairau—Collector, C. O. Trownson.
Picton—Officer in Charge, J. W. Burgess.
Nelson—Collector, W. Devenish.
Westport—Collector, T. C. Rowe.
Greymouth—Collector, F. Davies.
Hokitika—Collector, G. A. Empson.
Christchurch and Lyttelton—Collector, W. J. Wratt; Sub-Collector, W. Howarth; First Clerk, S. E. Haop.
Timaru—Collector, W. Rose.
Oamaru—Collector, C. Hill.
Dunedin and Port Chalmers—Collector, T. M. Cullen; Sub-Collector, P. Doull; First Clerk, H. W. S. Ruffell.
Invercargill and Bluff—Collector, W. J. Hawley.
Chatham Islands—Officer in Charge, G. H. Fry.
Minister of Marine — Hon. W. H. Herries.
Private Secretary—L. E. Johnson.
Secretary—G. Allport.
Chief Clerk—A. R. Stone.
Marine Engineer for the Dominion—R. W. Holmes.
Nautical Adviser and Chief Examiner of Masters and Mates—H. S. Blackburne.
Director, Meteorological Branch—D. C. Bates.
Chief Inspector of Sea Fisheries—L. F. Ayson.
Superintendents of Mercantile Marine and Examiners of Masters and Mates—
Auckland—C. E. W. Fleming.
Wellington—G. G. Smith.
Lyttelton—J. A. H. Marciel.
Dunedin—N. Beaumont.
Master of s.s. “Hinemoa”—J. Bollons.
Commander Training-ship “Amokura”—G. S. Hooper (R.N.R.).
Chief Inspector of Machinery, Chief Surveyor of Ships, and Chief Examiner of Marine Engineers and Stationery-engine Drivers—R. Duncan.
Inspectors of Machinery, Surveyors of Ships, and Examiners of Marine and Land Engineers and Stationary-engine Drivers,—
Auckland—S. Dalrymple, W. G. Bell, H. G. L. Noy, A. C. Reid, W. J. White.
Hamilton—J. Kydd.
Napier—W. R. Douglas. D. Rankin.
Wanganui—C. W. R. Suisted, S. N. Johnston.
Palmerston North—W. Cullen.
Wellington—A. Calvert. A. E. Macindoe, J. W. Townsend, P. J. Healy.
Nelson—N. D. Hood.
Greymouth—P. Mackenzie.
Christchurch —A. W. Bethne, J. H. Knowles.
Timaru—A. McKenzie.
Dunedin—J. Williamson, W. J. Crawford, T. A. Cooper.
Invercargill—P. Grant.
Members — R. Duncan, Chief Inspector of Machinery, M. Inst., Nav. A., Chairman; F. Reed, M.I.M.E., Inspecting Engineer of Mines; R. W. Holmes, M.Inst.C.E., Engineer-in-Chief, P.W.D.; E. Parry, B.Sc., A.M.I.C.E., M.I.E.E., Electrical Engineer, P.W.D.; J. G. Macpherson, Secretary.
Board meets once a quarter, or when required, at Wellington.
Minister of Labour—Rt. Hon. W. F. Massey, P.C.
Private Secretary—F. D. Thomson, B.A.
Secretary for Labour, Registrar of Industrial Unions, Chief Inspector of Factories, and Superintendent of Workers' Dwellings—F. W. Rowley.
Chief Clerk, and Deputy Registrar of Industrial Unions—J. W. Collins.
Deputy Chief Inspector of Factories and Deputy Superintendent of Workers' Dwellings—W. H. Hagger.
Auckland—W. Newton (in charge). J. Hollows, T. G. Fielder.
Wellington—H. E. Moston, W. Slaughter, and W. Rapley.
Christchurch—H. B. Bower (in charge), R. T. Bailey. W. Wakelin.
Dunedin—L. D. Browett (in charge), J. Georgeson, A. Burgess.
Whangarei—P. J. Norwood.
Hamilton—M. McCormack.
Rotorua—S. H. Sargeant.
Thames—R. Lloyd.
Waihi—T. H. Erwin.
Gisborne—W. H. Westbrooke.
Napier—A. Donald.
Hastings—R. Walters.
Dannevirke—F. R. Pearson.
New Plymouth—J. F. Arnold.
Hawera—F. W. Pettett.
Wanganui—E. W. F. Göhns.
Feilding—T. Watson.
Palmerston North—W. J. Culver.
Masterton—J. C. Yorke.
Blenheim—J. H. Morrison.
Nelson—S. Tyson.
Westport—T. Fairhall.
Greymouth—H. J. Torbit.
Ashburton—R. Frizzelle.
Timaru—J. Jackson.
Oamaru—A. E. Waite.
Gore—R. Ross.
Invercargill—G. H. Light foot.
And 151 Inspectors and Agents (police officers) in small towns.
Auckland—H. Gresham.
Hawke's Bay—A. Donald.
Wellington—R. A. Bolland.
Nelson and Marlborough—S. Tyson.
Westland—H. J. Torbit.
North Canterbury—E. J. G. Stringer.
South Canterbury—J. Jackson.
Otago—F. Barton.
Southland—J. Brown.
Auckland—Miss H. R. Morrison.
Wellington—Miss E. R. Bremner.
Christchurch—Mrs. A. Way.
Dunedin—Miss M. S. Hale.
Judge — His Honour Mr. Justice Stringer.
Employers' Member—E. F. Duthie.
Workers' Member—J. A. McCullough.
Auckland and Taranaki Industrial Districts—T. H. Giles (Auckland).
Wellington, Marlborough, Nelson, and Westland Industrial Districts — P. Hally (Wellington).
Canterbury and Otago and Southland Industrial Districts — J. R. Triggs (Christchurch).
Members—F. W. Rowley (Chairman), J. W. Collins, and W. H. Hagger. There are also District Boards for the Auckland, Gisborne, Napier, New Plymouth, Wanganui, Palmerston North, Masterton, Wellington, Nelson, Greymouth, Christchurch, Timaru, Oamaru, Dunedin, and Invercargill Districts.
Meetings irregular; sits when business is required to be transacted.
Minister of Lands—Rt. Hon. W. F. Massey, P.C.
Private Secretary — F. D. Thomson, B.A.
Under-Secretary for Crown Lands—J. Mackenzie.
Assistant Under - Secretary — F. T. O'Neill.
Surveyor-General—E. H. Wilmot.
Inspectors of Surveys—J. Langmuir, J. D. Climie.
Chief Drainage; Engineer — J. B. Thompson.
Chief Clerk—W. R. Jourdain.
Chief Accountant—J. H. O'Donnell.
Inspector of Offices—A. C. Turnbull.
Chief Draughtsman—M. C. Smith.
Director of Magnetic Observatory (Christchurch)—H. F. Skey, B.Sc.
Commissioner of Crown Lands and Chief Surveyor—H. M. Skeet.
Inspecting Surveyor—W. J. Wheeler.
Kauri-gum Superintendent and Inspector of Surveys—R. P. Greville, F.R.G.S.
Chief Draughtsman—H. D. McKellar.
Chief Clerk—J. G. Bendely.
Receiver of Land Revenue—F. A. Cullen.
Commissioner of Crown Lands and Chief Surveyor—W. H. Skinner.
Inspecting Surveyor and Local Land Officer, Gisborne—T. Brook.
Chief Draughtsman—H. Mackay.
Chief Clerk—J. Thomson.
Receivers of Land Revenue—Napier, H. R. Robinson; Gisborne, F. T. Venning.
Commissioner of Crown Lands and Chief Surveyor—G. H. Bullard.
Chief Draughtsman—H. J. Lowe.
Chief Clerk—W. J. Munro.
Receiver of Land Revenue—A. J. Rossiter.
Commissioner of Crown Lands and Chief Surveyor—T. N. Brodrick.
Chief Draughtsman—W. F. Marsh.
Chief Clerk—H. M. Bannister.
Receiver of Land Revenue—T. G. Waitt.
Commissioner of Crown Lands and Chief Surveyor—H. G. Price.
Chief Draughtsman—J. D. Thomson.
Receiver of Land Revenue—H. L. Welch.
Commissioner of Crown Lands and Chief Surveyor—F. A. Thompson.
Chief Draughtsman—A. D. Burns.
Chief Clerk and Receiver of Land Revenue—A. D. A. Macfarlane.
Commissioner of Crown Lands and Chief Surveyor—H. D. M. Haszard, F.R.G.S.
Chief Draughtsman—A. N. Harrop.
Chief Clerk and Receiver of Land Revenue—F. T. Sandford.
Commissioner of Crown Lands—C. R. Pollen.
Chief Draughtsman—F. E. Greenfield.
Chief Clerk—R. Leckie.
Receiver of Land Revenue—G. W. Palmer.
Commissioner of Crown Lands and Chief Surveyor—R. T. Sadd.
Chief Draughtsman—D. M. Calder.
Chief Clerk and Receiver of Land Revenue—C. E. Archibald.
Commissioner of Crown Lands and Chief Surveyor—G. H. M. McClure.
Chief Draughtsman—R. S. Galbraith.
Chief Clerk and Receiver of Land Revenue—A. D. McGavock.
The respective Commissioners of Crown Lands and—
Auckland—A. R. Harris, W. Johns, J. Trounson, J. G. Rutherford.
Hawke's Bay — R. B. Ross, A. J. Cameron, L. McKay.
Taranaki—A. Coxhead, W. W. Jones, C. J. Ryan.
Wellington—J. Dawson, H. T. Ellingham, J. Georgetti, Charles McIntyre.
Marlborough—J. S. Storey, A. Mackay, E. A. Weld, J. Fulton.
Nelson—James Bell, G. Walker, W. C. Baigent, R. Patterson.
Westland—R. Houliston, A. Cumming, B. Ward, G. Mallinson.
Canterbury—J. Sealy, J. Stevenson, R. Macaulay, T. G. Gee.
Otago—G. Livingstone, James Smith, P. Kinney, T. A. Munro.
Southland—C. Robertson, H. J. Middleton, J. Fleming, J. King.
Members — The Surveyor - General (Chairman), the General Manager of Tourist and Health Resorts, the Under-Secretary Native Department, the Commissioner of Crown Lands for each Land District in which are lands dealt with under the Act.
Secretary—W. R. Jourdain.
Meets when directed by Minister, at Wellington or elsewhere.
Superintending Nurseryman, North Island (Rotorua)—H. A. Goudie.
Superintending Nurseryman, South Island (Tapanui)—R. G. Robinson.
Member.—E. H. Wilmot. Surveyor-General, Chairman; T. N. Brodrick, Chief Surveyor at Wellington; Thomas Humphries, Wellington; H. Sladden, Hutt; and H. M. Wilson, Auckland.
Secretary—M. C. Smith.
Board meets March and September for examinations, and at other times as business requires, at Wellington.
J. D. Ritchie, Chairman and Land Purchase Inspector.
J. Mackenzie, Under - Secretary for Lands.
E. H. Wilmot, Surveyor-General.
Chief Clerk—O. Mewhinney.
The respective Commissioners of Crown Lands and one other member.
Auckland—District Land Registrar, Examiner of Titles, and Registrar of Deeds—T. Hall.
Assistant Land Registrars—R. H. Bourke and A. H. Fletcher.
Deputy Registrar of Deeds—C. R. Keeble.
Draughtsman—T. K. Thompson.
Poverty Bay—District Land Registrar, Examiner of Titles, and Registrar of Deeds—R. S. Florance.
Assistant Land Registrar and Deputy Registrar of Deeds—J. A. Eraser.
Hawke's Bay—District Land Registrar, Examiner of Titles, and Registrar of Deeds—F. Aspinall.
Assistant Land Registrar and Deputy Registrar of Deeds—W. Hislop.
Draughtsman—E. H. Cane.
Taranaki—District Land Registrar, Examiner of Titles, and Registrar of Deeds—A. V. Sturtevant.
Draughtsman—J. R. Vaile.
Wellington—District Land Registrar and Registrar of Deeds—G. G. Bridges.
Examiner of Titles and Deputy Registrar of Deeds—J. J. L. Burke.
Assistant Land Registrars—J. J. L. Burke and A. P. Gorman.
Draughtsman—J. Cook.
Marlborough—District Land Registrar, Examiner of Titles, and Registrar of Deeds—F. W. Broughton.
Nelson—District Land Registrar, Examiner of Titles, and Registrar of Deeds—W. Johnston.
Draughtsman—J. R. Strachan.
Westland—District Land Registrar, Examiner of Titles, and Registrar of Deeds—W. P. Morgan.
Canterbury—District Land Registrar, Examiner of Titles, and Registrar of Deeds—W. Wyinks.
Assistant Land Registrar and Deputy Registrar of Deeds—J. A. Ambrose.
Draughtsman—W. C. Leversedge.
Otago—District Land Registrar, Examiner of Titles, and Registrar of Deeds—C. E. Nalder.
Assistant Land Registrar and Deputy Registrar of Deeds—P. Dalrymple.
Draughtsman—W. T. Morpeth.
Southland — District Land Registrar, Examiner of Titles, and Registrar of Deeds—W. W. de Castro.
Assistant Land Registrar and Deputy Registrar of Deeds—R. Sinclair.
Draughtsman—O. G. Goldsmith.
Minister in Charge—Rt. Hon. W. F. Massey, P.C.
Private Secretaries—F. D. Thomson, B.A., F. W. Furby.
Auckland—J. E. D. Spicer.
Napier—H. G. Absolum (Acting).
Wanganui—A. C. Philpott.
Wellington—W. T. Wynyard.
Christchurch—J. Andrews.
Dunedin—A. E. Rowden.
Invercargill—W. McN. Miller.
Director—C. J. Reakes, D.V. Sc., M.R.C.V.S.
Assistant Director—J. L. Bruce.
Senior Veterinarian—J. G. Clayton, M.R.C.V.S.
Veterinary Officer in Charge of Laboratory, Wallaceville—H. A. Reid, F.R.C.V.S., D.V.S., F.R.S.E.
President—Sir J. G. Wilson, Kt. Bach.
Vice-President—J. C. N. Grigg.
Members—A. P. Allport, E. Averill, W. F. M. Buckley, R. Dingle, E. Hall. W. D. Hunt, A. S. Orbell, W. Perry, and R. Reynolds.
General Manager—B. M. Wilson.
Chief Clerk—W. H. Frethey.
Accountant—J. H. Barr.
Tourist Agents—Auckland, C. Wallnutt; Te Aroha, G. F. McGirr; Rotorua, Wm. Hill; Wellington, J. W. Hill; Christchurch, G. W. C. Moon: Dunedin, S. J. Collett; Invercargill, T. F. McLaughlin.
New Zealand Trade Commissioner for Australia, and New Zealand Government Agent, Melbourne—H. J. Manson.
New Zealand Government Agent, Sydney, N.S.W.—W. R. Blow.
Rotorua Sanatorium and Bath—Balneologist, A. S. Wohlmann, M.D., M.R.C.S.,: House Surgeon. W. F. Findlay, M.B., Ch.B.
Hanmer Springs—Resident Medical Officer, J. D. C. Duncan. M.B., Ch.B.
Inspector—W. W. Bird, M.A.
Assistant Inspector—J. Porteous, M.A.
Clerk in Charge—F. L. Severne.
Inspectors — Elizabeth Gunn, M.B., Ch.B., L.M.; Ada G. Paterson, M.B., Ch.B.: Elizabeth S. Baker, M.B., Ch.B.; Elizabeth H. B. Macdonald, M.D.
Inspectors and Instructors — F. R. Just, S. Moore, W. A. Johnson, A. P. Roydhouse, H. E. Longworth, and Misses D. K. Heritage, K. I. Larsen, E. M. Blackburne, B. Greenwood, E. Threadgill.
Auckland—R. Crowe.
Taranaki—P. S. Whitcombe.
Wanganui—W. H. Swanger.
Wellington—G. L. Stewart.
Hawke's Bay—G. Crawshaw.
Marlborough—E. S. Hylton.
Nelson—N. R. Williams.
Grey—P. F. Daniels.
Westland—C. R. Kirk.
Canterbury North—H. C. Lane.
Canterbury South—J. McP Miller.
Otago—S. M. Park.
Southland—F. G. Stevenson.
Auckland—E. K. Mulgan, M.A.; C. W. Garrard, B.A.; W. A. Burnside, M.A.; J. T. G. Cox; G. H. Plummer, LL.B.; M. Priestley; N. T. Lambourne, MA.; J. W. McIlraith, M.A., LL.B., Litt. D.; Norman R. McKenzie.
Taranaki—W. A. Ballantyne, B.A.; R. G. Whetter, MA.
Wanganui—J. Milne, M.A.; T. B. Strong, M.A., B.Sc.; D. Stewart.
Wellington — T. R. Fleming, M.A., LL.B.; F. H. Bakewell, M.A.; F. G. A. Stuckey, M.A.; A. B. Charters, M.A.
Hawke's Bay — A. Strachan, M.A.; H. T. Hill, B.A.
Marlborough—D. A. Sturrock.
Nelson—G. A. Harkness, M.A.; A. Crawford, B.A.
Grey—W. S. Austin.
Westland—A. J. Morton, B.A.
North Canterbury—W. Brock. M.A.; C. D. Hardie, B.A.; S. C. Owen, M.A.; J. B. Mayne, B.A.
South Canterbury—J. G. Gow, M.A., J. A. Valentine, B.A.
Otago—C. R. D. Richardson, B.A.; C. R. Bossence; J. R. Don. M.A., D.Sc.; J. Robertson, B.A., B.Sc.
Southland—A. L. Wyllie, M.A.; A. Ingles, M.A.
Auckland—E. F. Warren.
Napier—E. B. Burdekin.
Hawera—E. Barns. (Also West Coast Settlement Reserves Agent.)
Wanganui—T. R. Saywell.
Masterton—T. R. Allen.
Wellington—K. N. H. Browne.
Nelson—J. E. Allen.
Greymouth—C. W. Cooke.
Christchurch—T. D. Kendall.
Dunedin—C. Zachariah.
Invercargill—S. W. Smith.
Members — The Minister of Finance, the Public Trustee, the Government Insurance Commissioner, the Valuer-General, the Superintendent of the State Advances Office, W. G. Foster, Esq., J. Macintosh, Esq.
Meets every Thursday at Wellington.
Members—The members of the Board constituted under the Public Trust Office Act, together with Mr. Hoani Tainui and Mr. Teo Tipene.
Meets irregularly at the Public Trust Office, Wellington.
Minister—Hon. Sir F. H. D. Bell, K.C. Private Secretary—J. W. Black.
Auckland—J. Findlay.
Wellington—G. E. Robertson.
Christchurch—J. C. Prudhoe.
Dunedin—F. B. Bolt.
Invercargill—H. S. Manning.
Napier—G. A. Noble-Campbell.
Wanganui—A. E. Allison.
Nelson—G. J. Robertson.
Greymouth—R. S. Latta.
Timaru—T. P. Laurenson.
Members—The Minister of Finance, the Solicitor-General, the Surveyor-General, the Public Trustee, the New Zealand State Advances Office Superintendent, and the Government Insurance Commissioner.
Meets weekly on Wednesdays, at the Government Insurance Buildings, Wellington.
Auckland—F. H. Pope.
New Plymouth—K. B. Bain.
Palmerston North—R. H. Pavitt.
Christchurch—H. C. Rogers.
Dunedin—L. H. Osborn.
Members — The Minister in Charge, the General Manager, the Government Insurance Commissioner, and Messrs. J. W. A. Marchant, and G. R. N. Wright.
Meets on third Monday of each month, at the State Fire Office, Wellington.
Superintendent—G. F. C. Campbell.
Deputy-Superintendent—W. Waddel.
Solicitor—J. B. Christie.
Accountant—W. N. Hinchliffe.
Inspecting Valuer—A. C. Mason.
Members — The Superintendent, the Under-Secretary of Crown Lands, the Government Insurance Commissioner, the Valuer-General, and the Public Trustee.
Board meets at the State Advances Office, Government Buildings, each Monday.
Under-Secretary—H. J. H. Blow, I.S.O.
Assistant Under - Secretary — W. S. Short (solicitor).
Engineer - in - Chief — R. W. Holmes, M.I.C.E.
Chief Electrical Engineer—E. Parry, B.Sc., A.M.I.C.E., M.I.E.E.
Inspecting Engineers — F. W. Furkert, A.M.I.C.E., A.M.I.M.E. (South Island). W. H. Gavin (North Island).
Staff Engineer — H. Vickerman, A.M.I.C.E., M.Sc., Auth. Sur.
Architect—J. Campbell, F.R.I.B.A.
Resident Engineer—C. J. McKenzie.
Designing Engineer—J. E. L. Cull.
Chief Clerk—G. C. Schmidt.
Accountant—C. E. Bennett.
Land-purchase Officers—E. Bold and A. H. Kimbell.
Inspecting Officer—P. S. Waldie.
Stores Manager—R. E. Herron.
Inspector of Stores—J. C. Fulton.
Fire Inspector—W. H. Hennah.
District Engineers—Auckland, F. Bigg-Wither; Gisborne, C. E. Armstrong; Wellington, J. D. Louch, A.M.I.C.E.; Dunedin, J. E. W. McEnnis.
Electrical Engineer—Christchurch, L. Birks, B.Sc., A.M.I.C.E., M.I.E.E., M.I.M.E.
Resident Engineers — Whangarei, J. Wood, A.M.I.C.E.; Tauranga, J. Hannah; Napier, L. B. Campbell; Taumarunui, A. J. Baker; Stratford, G. T. Murray; Wanganui, R. H. Reaney; Nelson, W. Widdowson; Blenheim, A. B. Wright; Greymouth H. H. Sharp, A.M.I.C.E.; Otira, A. Dinnie; Christchurch, H. Dickson; Invercargill, J. H. Treseder; Winton, J. H. Lewis.
Resident Road Engineer — T. Burd, Tauranga.
Section 2 empowers the Governor, subject to certain conditions therein expressed, by Proclamation to declare “that the notes payable on demand by any bank therein named, and then issued or thereafter to be issued or reissued within New Zealand under any lawful authority in that behalf, shall during the period limited by the Proclamation be everywhere within New Zealand a good and legal tender of money to the amount therein expressed to be payable.”
Section 4 provides a State guarantee of such notes for a period of six months after the expiration of the period fixed by the Proclamation (or successive Proclamations, if more than one).
Section 6 prohibits the export of gold from New Zealand, during the period limited by any Proclamation as aforesaid, except with the consent of the Minister of Finance.
This Act applies the provisions of the Customs Act (relating to the forfeiture of goods to the Crown) to gold exported or attempted to be exported in breach of the provisions of the Banking Amendment Act (No. 1).
The purpose of this Act is “to make provision for the regulation of trade and commerce in time of war.”*
Sections 2 to 23 enable the Governor, by Order in Council, to fix and determine the maximum price in New Zealand of any class of goods, and from time to time in like manner to revoke any Order in Council or vary any maximum, price so fixed and determined. In exercise of this power the Governor may determine different maximum prices for the same classes of goods in respect of different forms, modes, conditions, or localities of trade, commerce, sale, or supply. The maximum price may be fixed either (a) as a specified sum, or (b) by reference to the “standard” price—that is to say, the current price at which goods of the same nature and quality were saleable in the same locality on the 1st August, 1914, if sold in the same quantity and on the same terms as to payment, delivery, and otherwise. Every person commits an offence under the Act, and is liable to a fine of £500, who sells, or agrees or offers to sell, any goods for a price in excess of the maximum price determined as aforesaid, except in the case of goods intended for export and not for consumption within New Zealand.
In addition to the pecuniary penalty above referred to, section 21 renders wholly void as against the buyer every contract 'of sale made by a seller or his agent in wilful breach of the foregoing provisions, while, on the other hand, the property in the goods is declared to pass to the buyer at the same time and in the same manner as if the contract had been of full force and effect.
* For other special legislation occasioned by the war see Acts, 1914, Nos. 7, 12, 13, 17, 20, 35, 38, 40, 47, 48, 60, 71.
Section 24 empowers the Governor in Council to prohibit the exportation during the war of any goods if such prohibition is deemed necessary in the public interest.
Section 25 provides for the suspension or modification during the war of any of the provisions of the labour laws (e.g., Industrial Conciliation and Arbitration Act, Factories Act, and Shops and Offices Act).
Sections 26 to 33 enable the Governor, on payment of adequate compensation, to take possession of any goods required for the use of His Majesty during the war.
Section 34 authorizes the setting-up of a Commission to advise the Government as to the exercise of the foregoing powers.
Section 35 (giving effect in New Zealand to an Imperial Order in Council relating to trading with the enemy) has been repealed by the Trading with the Enemy Act, 1914 (No. 40).
This Act is intended for the relief of mortgagors during the present war, and declares it unlawful for a mortgagee, except with the leave of the Supreme Court, to do any of the following thin viz.,—
To call up the principal or any part thereof;
To exercise any power of sale or of entry into possession;
To commence an action for the breach of any covenant or condition expressed or implied in a mortgage (other than an action for breach of the provisions as to payment of interest); or
To commence an action for the recovery of a penal rate of interest.
Where leave of the Court is sought on the ground of the failure of the mortgagor to repay the principal or any part thereof, such leave shall not be granted so long as interest, at the ordinary rate fixed by the mortgage, is paid in accordance with the direction of the Court. Where such leave is sought on any other ground than the above or the non-payment of interest, the Court cannot give leave unless in its opinion the failure of the mortgagor to comply with the covenants and conditions of the mortgage is of such a nature as to seriously endanger the security.*
The Act relates to mortgages both of real and of personal estate, and is extended to apply, with the necessary modifications, to agreements for the sale and purchase of land and to leases containing purchasing clauses.
The Act was found to operate in a somewhat unexpected manner, the tendency being for investors not to lend money on mortgage at all. An amending Act (1914, No. 17) was accordingly passed enabling the parties
* The amending Bill now before the House (August, 1915) very considerably modifies these provisions. In particular, it proposes to repeal certain provisions that now restrict the exercise of the discretion of the Court. to a mortgage to contract themselves out of the provisions of the original Act. By a further amendment (No. 60) the Governor is empowered by Order in Council to suspend the principal Act or to modify any of its provisions in such manner as he thinks fit.
This Act amends the Fruit-preserving Industry Act, 1913. By that Act the Minister of Agriculture was empowered to arrange for advances not exceeding £3,000 in any one case, to be made by the State for the purpose of assisting in the establishment of fruit-preserving works. The present amendment increases the amount that may be advanced to any one person from £3,000 to £9,000.
This Act makes several technical amendments of the Public Revenues Act, 1910. In addition, section 8 empowers the Minister of Finance to raise, by way of Treasury bills, a loan of £2,000,000 towards the expenses incurred in New Zealand for the purposes of the present war.
This Act repeals certain provisions of the Civil Service Act, 1908, that required officers of the Public Service to make good, by way of proportionate contributions from their salaries, the amount of any misappropriation of public moneys by fellow-servants.
This Act authorizes local authorities and other bodies or persons having restricted powers to contribute out of their funds or in kind towards the expenses of the present war.
1914, No. 71, supplements the provisions of the earlier Act (No. 12), and validates contributions made,—
For the relief of distress occasioned by the war either within the British Empire or within the territory of any of the allied nations; or
For any patriotic purpose approved by His Excellency the Governor.
The later Act also enables local authorities to contribute towards the maintenance of the dependants of former employees who join any Expeditionary Force for military service beyond New Zealand, or who are called out for active service in New Zealand.
This Act is of temporary duration (expiring on the 31st December, 1915),* and empowers trustees, during the continuance of the war, to deposit trust-moneys at interest with approved savings-banks, building societies, investment companies, public companies, or municipal corporations.
* By the Expiring Laws Continuance Act, 1915 (No. 14) the duration of this Act is extended to the 31st August, 1916.
This Act allows Borough Councils to adopt the system of election by proportional representation at general elections of Councillors. The system adopted is that in force in Tasmania.
This Act empowers the Government to grant cover, at rates to be approved by the Governor in Council, against war risk on policies of marine insurance of gold bullion exported from New Zealand to Australia, not exceeding £10,000 in any one vessel. Authority is also given for the Government to insure cargo exported from New Zealand in cases where the value of cargo exported by any one person is so small that the employment of London agents to effect insurance would, in the opinion of the Minister of Internal Affairs, constitute an excessive addition to the cost of insurance. The amount so covered for all insurers in any one vessel is not to exceed £10,000.
Section 2 of this Act empowers a Fire Board and a local authority whose district is outside the boundaries of the fire district to enter into an agreement for the protection from fire of property within the district of the local authority. In such a case, the Superintendent and other officers and members of the fire brigade have, within the district of the local authority, the same rights, powers, privileges, and immunities that they have within the fire district.
Section 3 exempts a Fire Board and the officers and members of a fire brigade from liability for damage done to property in the exercise of their duty. All such damage is declared to be damage by fire within the meaning of any policy of fire insurance covering the damaged property.
Section 6 imposes on the owner of premises where a fire occurs and on the owner of any personal property in such premises an obligation, on request by any officer or member of the Fire Board, to supply particulars as to all policies of insurance (if any) over such premises or property.
The remaining sections of the Act (sections 7 to 11) relate to the constitution of united fire districts, by agreement between the local authorities of two or more contiguous districts. Under the principal Act every fire district is required to be coterminous with the district of some Borough Council, County Council, Road Board, or Town Board. The amendment permits of any continuous area being constituted a fire district notwithstanding the fact that such district is not coterminous with the district of any one local authority.
Section 2 is designed to prevent, as far as practicable, the inclusion by the Representation Commissioners (when determining the boundaries of the several electoral districts) of any licensed premises in a no-license district.
Section 6 prohibits the sale of intoxicating liquor to any person under the age of twenty-one years, except to a person resident on the premises where the liquor is sold, or to a bona fide guest or lodger on such premises.
Section 7 provides an altered form of ballot-paper for the national prohibition poll. Under the old form a voter was required to vote either (1) against national prohibition, or (2) for national prohibition. Under the amended form votes are recorded either (1) for national continuance, or (2) for national prohibition.
Section 10 prohibits (after the 1st April, 1915) the employment in any bar of a person under twenty-one years of age.
Section 11 provides for the issue of licenses for the manufacture of wine in New Zealand, and regulates the sale of such wine. A licensee under this section is prohibited from selling wine in quantities less than 2 gallons, and also from permitting the consumption of wine on his premises. For the purposes of these provisions “wine” includes any liquor being the produce of fruit grown in New Zealand and of a strength not exceeding 40 per cent. of proof spirit.
This Act is intended to encourage the breeding of horses suitable for military purposes by giving to the owners of selected stallions a subsidy not exceeding £150 in any one case.
The purpose of this Act is to permit of the construction of railways by Local Railway Boards in districts where the Government is not prepared to undertake the work.
Section 3 provides for the constitution of railway districts by the Governor, on the petition of not less than one-fourth of the ratepayers therein. For each district there is to be a Railway Board of not less than five nor more than nine members to be elected by the ratepayers.
For the purpose of providing funds the Board of a district is empowered to raise moneys under the Local Bodies' Loans Act, and is also empowered to levy rates for the purpose of providing for the excess of the estimated expenditure over the estimated revenue in any year.
Every railway to be constructed under the Act has to be specially authorized by the Governor, by Order in Council; and, on the issue of an Order, the Board may enter into the necessary contracts for the construction of the works. The necessary powers for the efficient conduct of the business of the railway, when completed, are conferred upon the Board.
Sections 78 to 86 enable the Governor, on giving twelve months' notice in writing of his intention, to purchase any railway undertaking constructed pursuant to the Act, the price to be determined by arbitration.
The provisions of Part VIII of the Public Works Act (relating to the regulation and inspection of railways) are applied to railways constructed under this Act, and certain rights of the Crown — e.g., free carriage of mails, use of railway and rolling-stock in time of war or civil commotion—are protected.
In addition to various technical amendments of minor importance, this Act provides for the following matters:—
Section 2 reduces from three months to one month the necessary period of residence in an electoral district before a person who is otherwise qualified becomes entitled to enrolment as an elector for that district.
Section 4 provides for the enrolment as electors of commercial travellers and members of the theatrical profession who have resided in New Zealand for not less than one year but may not have resided for one month in any electoral district.
Important amendments are made with respect to the right to vote of seamen who have not a settled residence (as defined) in any electoral district. Seamen who have such a residence vote as electors of the district in which their home is situated, but other seamen vote as follows:—
If they are engaged under articles, for the district comprising the port where they signed those articles.
If they are not engaged at the time of the election, then for the district comprising the port of discharge.
In certain cases, where any port referred to above is comprised in more electoral districts than one, the seaman may choose to vote for any one of those districts.
Section 18 allows a person whose name has been struck off the electoral roll in error to vote on making the prescribed declaration before the Deputy Returning Officer.
Section 25 applies the provisions relating to the enrolment of European electors to the enrolment of Maoris under Part IV of the principal Act.
The main object of this Act is to provide a workable scheme for the superannuation of the employees of local authorities, as an alternative to the scheme provided under the Local Authorities Superannuation Act, 1908. It empowers a local authority to become a contributor to the National Provident Fund on behalf of any or all of its employees, and either with or without their consent. In any such case the National Provident Fund Board may waive certain conditions and restrictions applicable in the case of ordinary contributors—for example, provisions as to ages of contributors, rates of contributions, maximum rate of allowances payable, &c. In fact, the Board is authorized to consider on its merits any scheme submitted by an applicant local authority, and to make such terms as it thinks fit as to rates of contribution and as to allowances and other benefits. It is bound, however, so far as practicable, to preserve the same proportion between rates of contribution and value of benefits as exists between the several rates of contribution and the benefits receivable under the principal Act. The Board is obliged before committing itself to any proposed scheme to obtain and have regard to actuarial computations as to the sufficiency of the proposed contributions (in conjunction with the State subsidy) to provide the benefits proposed to be conferred.
As between the local authority and its employees the position is briefly as follows:—
The local authority may agree with the Board to contribute to the fund, either with or without the consent of its employees.
Having become a contributor, it may deduct from the wages or salary of even employee for whom it contributes a proportion of the contribution due to the fund on behalf of that employee. This proportion may vary in different cases, but must not exceed two-thirds of the total contribution.
The balance of the contribution is payable out of the fluids of the local authority.
If the employee retires from the service of the local authority before becoming entitled to a retiring-allowance—(i) he may withdraw from the fund his proportion of contributions, less benefits actually received by him; or (ii) he may elect to continue as a personal contributor to the fund. If he withdraws his contribution from the fund, the local authority may also withdraw its share of contribution; if not, the local authority must leave its contribution with the fund for at least eighteen months. If within that time the employee has not entered the service of the same or another contributing local authority, the moneys may be withdrawn, but if he has entered such service the moneys remain in the fund. In lieu of exercising its right to withdraw moneys from the fund, the local authority may elect to have them applied on behalf of any other employee or employees.
Corresponding provisions are made enabling private employers, friendly societies, and others to contribute in respect of their employees or members, and enabling industrial unions and trade-unions to require their members to become contributors.
This Act makes special provisions with respect to those contributors to the National Provident Fund who are members of the military Expeditionary Forces from New Zealand during the present war. It provides—
That absence from New Zealand shall not disqualify such a member from receiving benefits from the fund:
That during absence as a member of an Expeditionary Force the rate of contributions payable by him shall be reduced by one-half.
The Act also authorizes the reduction of contributions by contributors who are engaged during the continuance of the war on military duty in New Zealand.
The Workers' Dwellings Act of 1910 made provision for the erection by the State of dwellings to be sold or rented to persons whose annual income was not in excess of £175. The present Act makes certain amendments of the original scheme, the most important of which are the following:—
Under the principal Act the maximum area of the allotment attached to a workers' dwelling was fixed at half an acre in the case of an urban allotment, an acre in the case of a suburban allotment, and five acres in the case of a rural allotment. Under the amending Act the maximum area in all cases is determined by reference to the unimproved value, which is not to exceed £250.
The possible capital value of a worker's dwelling is increased from £600 to £750.
In the case of concrete and brick buildings, the period that may be allowed for the payment of purchase-money is increased from 25½ years to 36½ years.
Section 14 permits of an arrangement being entered into between the Workers' Dwellings Board, the State Advances Office, and a worker for the purpose of enabling the worker to build a house on a section provided by the Workers' Dwellings Board, part of the cost of the building being provided by the State Advances Office.
This Act authorizes the raising of a loan of £3,200,000 for railway-improvement purposes, to be raised by instalments not exceeding £750,000 a year.
The object of this Act is to better secure the public safety, the defence of New Zealand, and the effective conduct of military or naval operations during the continuance of the present war. For these purposes the Governor in Council is empowered to make regulations prohibiting acts deemed to be dangerous. A penalty of twelve months' imprisonment (in the case of an alien), three months' imprisonment in any other case, and a fine not exceeding £100, may be imposed for the breach of any such regulation. Prosecutions under the Act are to be by way of summary proceedings and not on indictment.
Trading with the enemy during the continuance of the present war is declared by this Act to be an indictable offence, punishable by—
Imprisonment with or without hard labour for a term not exceeding five years; or
The payment of a fine not exceeding £1,000; or
Both such imprisonment and payment of fine.
In the case of a corporation the maximum fine is fixed at £5,000.
Authority is given to a Magistrate, on information laid on behalf of the Attorney-General, to issue a warrant authorizing the entry into and search of premises, the inspection and seizure of books and documents, and the production of information as to business, in any case where any person is suspected of carrying on business contrary to the provisions of the Act.
The expression “trading with the enemy” is declared to mean any act for the time being prohibited by or in pursuance of a certain Proclamation issued by His Majesty on the 9th September, 1914, and called the Trading with the Enemy Proclamation (No. 2) (as the same is or may hereafter be amended or extended by any subsequent Proclamation).
The main purpose of this Act is to enable the Minister of Lands to act as agent for the disposal of kauri-gum on behalf of the gum-diggers during the crisis occasioned by the present war. The Act also provides for the Crown undertaking gum-digging operations in a systematic manner, with a view to the thorough working of the land, and the making of it suitable (after the extraction of the gum) for agricultural and other industries.
In providing for the purchase of gum by the Crown the Minister is authorized to advance up to one-half of the estimated value, and for that purpose to take as the basis of computation the values current before the commencement of the war.
This Act authorizes the raising of a loan of £3,000,000 for the following purposes:—
Construction of railways, £600,000:
Additional rolling-stock, £500,000:
For land-settlement and goldfields-development (the construction of roads and bridges), £1,500,000:
Other public works, £400,000.
Section 3 authorizes the sale of upwards of five acres of any education reserve for certain educational, religious, charitable, or public purposes; and, further, authorizes the sale of any part of an education endowment (without any restriction as to area) if the Land Board and the Minister are both of opinion that the sale is in the best interests of the endowment. The proceeds of every such sale are to be expended in the purchase of other land to be held for the same educational purpose as the land sold.
Under the Education Reserves Amendment Act, 1913, the Governor was empowered to determine certain education leases in the event of the land being required for the purposes of closer settlement. Section 4 of the present amendment confers on the lessee whose lease is so determined the right without competition to acquire one of the subdivisions when the land is being again disposed of.
This Act enables friendly societies to make certain concessions (as to payment of dues, &c.) to members of societies joining any Expeditionary Force, and to other members deprived of employment by reason of the war.
This Act corresponds with a recent enactment of the Imperial Parliament, and authorizes the Governor, by regulations, to avoid or suspend patents or licenses where the persons entitled to the benefits therefrom are subjects of a State at war with His Majesty.
The Governor is also authorized to grant to persons other than enemy subjects the right to make, use, exercise, and sell any patented invention or design liable to avoidance or suspension as aforesaid.
This Act amends in various particulars the provisions of the law relating to the disposition and tenure of Crown Lands in New Zealand. Its most important provisions are the following:—
Section 5 relates to the classification of lands for the purposes of the various existing provisions relating to the limitation of area. It relates only to lands that have not been classified by the Land Board under the Land Act, 1908—that is to say, it relates principally to settlement land, Native land, and private European land. Where any such land is required to be classified as first, second, or third class (for example, for the purpose of determining the area that may be acquired in freehold under the provisions of earlier Acts relating to the purchase by tenants of the fee-simple), such land is to be classified as follows:—
First class, of an unimproved value of £8 per acre or upwards (in lieu of £4 and upwards):
Second class, of an unimproved value of between £4 and £8 (in lieu of between £2 and £4):
Third class, of an unimproved value of less than £4 (in lieu of £2).
The effect of the alteration will be to reduce land valued at between £4 and £8 an acre from first class to second class, and to reduce land valued at from £2 to £4 from second class to third class. The reduction in classification will result in an increase in the area that may be held.
Sections 17 and 18 relate to the right to acquire the fee-simple conferred by earlier legislation on lessees in perpetuity of ordinary Crown land and of settlement land. The usual provisions as to the restriction of the area that could be acquired in fee-simple are not appropriately applied in these cases, and lead only to needless complexity of the law. Sections 17 and 18 give to such lessees the right to acquire the “whole area comprised in their leases notwithstanding that such area may exceed the usual limit.
Section 22 authorizes the Land Board on the expiry of any lease of a small grazing-run of settlement land, and notwithstanding any provisions as to renewal, to subdivide the land and dispose of it in allotments, the outgoing lessee to have the right to one allotment, and preference in the disposal of the other allotments to be given to his sons over twenty-one years of age who have resided on the run for seven out of the ten years preceding the expiry of the original lease. Similar provisions with reference to the subdivision of small grazing-runs of ordinary Crown land were made in 1913.
Section 36 enables the Land Board to dispose of sand-dunes and other comparatively worthless Crown lands to the occupiers of other lands in the vicinity. The purchaser is required to effect certain improvements before the issue of a title, including the planting of grass, lupin, or trees.
Section 37 authorizes the exchange of any areas of an education reserve for areas of equal value of ordinary Crown land or national endowment land.
Sections 42, 43, and 44 make temporary provisions (during the continuance of the war) for—
Waiving restrictions as to cropping:
Postponement of payment of rent on pastoral runs, and on certain small grazing-runs.
This amendment is designed to relieve contractors from the onerous conditions to which they have for some time been subject by reason of judicial interpretations of the principal Act (1908, No. 204). Under section 59 of that Act an employer or contractor is obliged to retain in his hands one-fourth part of the money payable under the contract to the contractor or subcontractor, until the expiration of thirty-one days after the completion of the work. It has been held that the work was not completed until the expiration of the period of maintenance, usually a period of three months after the completion of the main work. The amendment provides that the retention of the one-fourth as before mentioned shall be for thirty-one days after the completion of the work in the ordinary sense.
This Act recasts the whole of the law relating to public schools, secondary schools, technical schools, and special schools. The principal changes introduced are as follows:—
Reorganization, of the Department of Education.—The Inspector-General of Schools becomes Director of Education, and the Assistant Inspector-General of Schools becomes Assistant Director. The position of Secretary for Education is abolished. Inspectors of Schools who have hitherto been officers of the several Education Boards become officers of the central department.
Education Districts.—Provision is made for the constitution of not fewer than seven and not more than nine education districts, to be determined on the report of a special Commission to be set up for the purpose. At present there are thirteen education districts, each under the jurisdiction of an Education Board. Every education district is divided into urban areas and a rural area. An urban area consists of a borough or a group of boroughs having more than 8,000 inhabitants. Where a majority of the School Committees in an urban area make application to the Education Board of the district to be constituted an urban school district, the members of the Board for that urban area are to be elected on the municipal franchise on the same day as the election of Borough Councillors—that is, the last Wednesday in April in every second year. The rural area of an education district is divided into three wards. The members for each ward of the rural area and for all urban areas other than urban-school districts are, as now, to be elected by the members of the several School Committees. The number of members of an Education Board for the rural area is six—two for each ward. The number of members for each urban area is two for each 60,000, or part of 60,000, inhabitants.
Council of Education.—A Council of Education is established whose duty it is to report to the Minister,—
Upon educational methods or developments in national education which in its opinion it is desirable to introduce into New Zealand.
Upon any matters concerning the provision of facilities for education in the Dominion or in any district thereof, and upon the co-ordination of the work carried on by the various bodies controlling education:
Upon any other matters in connection with education referred to it by the Minister.
To obviate the necessity for frequent meetings of the Council the Minister is given power to constitute from time to time District Advisory Committees to afford assistance and advice with regard to matters concerning one district only.
Election of School Committees.—Members of School Committees formerly held office for one year, and were elected at meetings of householders held in April. Under the Act the members of the Committee for each urban school district are to be elected on the municipal franchise and are to hold office for two years. In all other cases School Committees continue to be elected by the householders, and are to hold office for one year.
Staffs and Salaries in Public Schools.—The Act provides for a liberal increase of salaries, and also for the increase of the teaching staff.
Scholarships.—There are two systems of school scholarships now in existence—namely, the Junior National Scholarships and the Education Board Scholarships. The Junior National Scholarships are tenable for three years and may be extended to a fourth year, and are fixed in value. The Education Board Scholarships are divided into Junior and Senior, each series being generally for two years; they vary considerably in value in the different education districts. The Act provides for one system of scholarships, to be called Junior and Senior National Scholarships, each tenable for not more than three years, but where the holder of a Junior Scholarship afterwards becomes a Senior Scholarship holder the joint term cannot exceed five years. The scholarship entitles the holder to free tuition at a secondary school and also to a monetary payment sufficient to cover ordinary living-expenses.
This Act authorizes the payment out of the Consolidated Fund of bounties in respect of the manufacture in New Zealand during the next ten years of iron and steel from iron-ore or ironsand produced in New Zealand. The rate of bounty is fixed at 12s. a ton in respect of pig iron, puddled bar iron, and steel produced from puddled bar iron; and £1 4s. a ton in respect of steel produced from molten metal direct from the furnace. The total amount authorized to be paid is £150,000.
This Act provides for an elective instead of an appointed Legislative Council. For the purposes of the Act New Zealand is divided into four electoral divisions—two in the North and two in the South Island. At the first election (to be held simultaneously with the first general election of members of the House of Representatives held after the 1st January, 1916), seven members of the Council are to be elected for each of the North Island electoral divisions and five for each of the South Island divisions. At subsequent elections forty members in all are to be elected, and (unless the alterations in boundaries made by the Representation Commissioners necessitate an alteration) twenty-two members are to be elected for the North Island and eighteen for the South Island.
Members of the Legislative Council now in office remain in office until the expiry of the term for which they were appointed. In the future only Maori members may be appointed. Councillors elected under this Act will continue to hold office until the dissolution of Parliament which takes place after the expiration of five years from the date of their election.
Elections are to be conducted on the proportional representation system. The system adopted is that which has been in force for some time in Tasmania.
Sections 5 to 9 define the powers of the Legislative Council and the House of Representatives respectively with respect to the initiation of legislation and other matters.
This Act makes important amendments for the purpose of ensuring the safety and well-being of miners. In particular provision is made with respect to—
Official inquiries in case of accident.
Ventilation in mines.
Prohibiting use of electricity in certain cases.
Withdrawal of men from dangerous localities.
Prescribing the use of safety-lamps where deemed necessary.
Examinations of mines by persons appointed for the purpose by the workmen.
Provision for bathhouses, with hot- and cold-water supply, for use of workmen.
Constitution of committees (known as Additional Rules Committees) consisting of a Warden or Magistrate, with representatives of the mine-manager and men respectively, to frame additional rules for the regulation of particular mines.
Power to Inspector of Mines to order cessation of work where, in his opinion, there is any immediate danger to life.
This Act makes various rules for the better and safer working of goldmines.
Section 14 empowers the workmen in any mine to appoint two persons with authority to make an inspection of every part of the mine and of its machinery and working once in every month, and with further authority to make such an inspection at any reasonable time on receipt of a notice in the prescribed form that, in the opinion of two or more of the workmen, the mine is dangerous to life.
Section 15 enables an Inspector of Mines summarily to stop the work in any mine in case of danger to life.
Section 17 makes provision for the holding of official inquiries as to accidents before a Warden and two assessors to be appointed by him; one assessor is to be the holder of a first-class mine-manager's certificate and the other is to be a workman selected by a society of the workers employed in the mining industry.
This Act provides for the disqualification of members of either House of Parliament who are proved to the satisfaction of a parliamentary Committee to have acted as agents for commission or other reward on the sale to or acquisition by the Crown of any private land.
The principal amendment of the law effected by this Act is the constitution, in connection with the New Zealand University, of a Board of Studies, with power (1) to make recommendations to the Senate as to the appointment of examiners, and as to degrees, diplomas, scholarships, prizes, courses of study, and examinations, and (2) to receive recommendations as to any of those matters from the Professorial Boards of the several University colleges. The Senate is also empowered to delegate to the Board of Studies certain of its powers as to drawing up courses of study, conducting examinations, appointing examiners, &c.
Provision is also made for the establishment of University National Scholarships, University bursaries, National Research Scholarships, and other scholarships.
Section 31 provides for annual grants to the several University colleges as follows:—
Auckland University College, £9,000.
Victoria University College, £9,000.
Canterbury University College, £2,000.
Dunedin University College, £5,000.
This Act enables the Governor by regulation to provide for the cooling or other treatment of fruit prior to export, and also for the inspection, grading, packing, and stamping of fruit intended for export.
This Act provides much more effective machinery than has formerly been available with respect to the registration and control of medical practitioners. It provides for the setting-up of a Board of seven members, one of whom is the Inspector-General of Hospitals for the time being, and the others medical practitioners, appointed by the Governor. The Board considers all applications for enrolment, and has power to direct the removal from the register of the names of practitioners who have left the country without any intention of returning and the names of persons who cannot be found on due inquiry being made. It may also take proceedings for the removal by order of the Supreme. Court of the names of practitioners who are guilty of gross misconduct in their professional capacity.
Table of Contents
D. C. B ates
Dominion Meteorologist.
The climate of New Zealand is to be considered in relation to four main features—(1) Its position, stretching for nearly a thousand miles southward of latitude 34° S.; (2) its insular condition, situated as it is in the widest ocean of the world, from which no part of the country is distant more than seventy-five miles; (3) its physical features, mountain-chains running mostly north and south and affording different aspects: and (4) the weather-changes to which these parts of the earth are subject.
The latitudes in which the chief cities of New Zealand lie in the Southern Hemisphere correspond with the cities in the North from which the possible amount of sunshine may be gauged. Auckland's latitude corresponds to that of Cape Passaro in the south of Sicily; Wellington to Naples; and Dunedin to Venice. The following table gives the period during which the sun is above the true horizon on the days of midsummer and midwinter:—
| Possible Sunshine on the | At Auckland. Hr. min. | At Wellington. Hr. min. | At Dunedin. Hr. min. | |||
|---|---|---|---|---|---|---|
| Longest day | 14 | 40 | 15 | 10 | 15 | 46 |
| Shortest day | 9 | 38 | 9 | 13 | 8 | 39 |
The actual hours of bright sunshine recorded in Wellington average nearly six hours per day throughout the year, and few indeed are the days when a brilliant sun does not at some time or other score a definite trace upon the recording-chart. Other districts much more protected from cloud-formation, as Nelson, in Tasman Bay; Napier on the east coast of the North Island; and Lincoln, near Christchurch, on the east coast of the South Island, have higher records. Some of the west coast districts, on the other hand, record less bright sunshine; but Wellington, the capital city, is in the middle position, and affords a good mean for both the sunshine and the rainfall of the whole Dominion. Wellington is also in a critical position with regard to atmospheric disturbances, Cook Strait being usually the dividing-line between the cyclonic storms and westerly lows, generally partaking of the changes due to both. The actual results are as follows:—
| Hours of Sunshine. | ||||||||||||||||
|---|---|---|---|---|---|---|---|---|---|---|---|---|---|---|---|---|
| Year. | Auckland. | Gisborne. | Napier. | Moumahaki. | Wellington. | Lincoln. | Nelson. | Hokitika. | ||||||||
* Incomplete, 13 days no record kept. † Incomplete, 15 days no record kept. ‡ For five years. § For eight years. || For seven years. ¶ For six years. | ||||||||||||||||
| Hr. | min. | Hr. | min. | Hr. | min. | Hr. | min. | Hr. | min. | Hr. | min. | Hr. | min. | Hr. | min. | |
| 1907 | .. | .. | 1939 | 20 | 2,610 | 35 | 1897 | 34 | 1853 | 53 | 2,133 | 53 | .. | .. | .. | .. |
| 1908 | .. | .. | 2,259 | 20 | 2,806 | 42 | 2,001 | 40 | 2,009 | 3 | 2,185 | 11 | .. | .. | .. | .. |
| 1909 | .. | .. | 1965 | 40 | 2,203 | 20 | 1856 | 17 | 2,223 | 31 | 2,112 | 9 | 2,562 | 58 | .. | .. |
| 1910 | 1775 | 45 | 2,293 | 4 | 2,530 | 47 | 1869 | 15 | 2,157 | 3 | 2,083 | 42 | 2,571 | 34 | .. | .. |
| 1911 | 1975 | 30 | 2,147 | 20 | 2,406 | 56 | 1692 | 25 | 2,276 | 37 | 2,326 | 0 | 2,506 | 56 | .. | .. |
| 1912 | 1834 | 21 | 1750 | 9 | 2,451 | 25 | 1906 | 55 | 1953 | 17 | 1782 | 7 | *2227 | 15 | .. | .. |
| 1913 | 1945 | 20 | 2,091 | 35 | 2,626 | 5 | 2,214 | 20 | 1973 | 39 | 1950 | 25 | †2107 | 10 | .. | .. |
| 1914 | 1914 | 45 | 2,209 | 40 | 2,788 | 55 | .. | .. | 2,172 | 10 | 2,280 | 37 | 2,578 | 30 | 1836 | 22 |
| Average | ‡1889 | 8 | §2082 | 1 | §2553 | 6 | ||1919 | 46 | §2077 | 24 | §2106 | 45 | ¶2425 | 44 | … | .. |
These results bear comparison with some of the most favoured regions of the world, where, in order to produce the best results, sunshine and shower hold sway in turn. For instance, over the northern parts of the British Isles the annual average of bright sunshine is 1,200 hours, or 27 per cent. of the possible; and in the south it is 1,600 hours, or 36 per cent.; while Italy has averages from 2,000 to 2,400 hours, or from 45 to 54 per cent. of the possible.
Latitude, insolation, proximity of the ocean, and the height of a locality are the determining factors with regard to temperature. The oceanic influences are recognized as the dominant feature with regard to both summer heat and winter cold, upon both of which they exercise a moderating effect. The west coast of the South Island especially is open to the prevailing westerly winds, and is more humid and equable than the eastern coastal districts, which at times present an almost continental type with considerable range of temperature. In the cities of Auckland and Wellington frosts on the grass are of rare occurrence, though further south and inland they are often experienced. As showing the influence of the ocean in moderating temperature, we may contrast the records of a continental city with the capital city of Wellington.
| Temperatures (Degrees Fahrenheit). | |
|---|---|
| Mean. | Wellington. Lat. 41° 16′ S. |
| January, maximum | 69.4 |
| July, minimum | 42.1 |
| Mean annual range | 27.3 |
| August, maximum | 91.2 |
| January, minimum | 10.2 |
| Mean annual range | 81.0 |
The meteorological seasons are regarded as later than the solar or astronomical seasons. Thus, in the Southern Hemisphere July is usually the coldest and wettest month of the year, while January is the driest and warmest. The seasons are thus roughly divided:—
Winter—June, July, August.
Spring—September, October, November.
Summer—December, January, February.
Autumn—March, April, May.
The following table gives seasonal and annual means computed from several stations in the various provinces into which the Dominion was once politically as well as naturally divided:—
| — | Spring. | Summer. | Autumn. | Winter. | Annual. |
|---|---|---|---|---|---|
| Auckland— | |||||
| Mean | 56.9 | 65.7 | 59.8 | 51.0 | 58.4 |
| Maximum | 65.2 | 75.2 | 68.3 | 58.5 | 66.8 |
| Minimum | 48.6 | 56.3 | 51.3 | 43.6 | 49.9 |
| Hawke's Bay— | |||||
| Mean | 57.3 | 65.6 | 59.0 | 50.0 | 58.0 |
| Maximum | 66.5 | 74.8 | 67.3 | 58.1 | 66.7 |
| Minimum | 48.3 | 56.5 | 50.7 | 42.0 | 49.4 |
| Taranaki— | |||||
| Mean | 55.0 | 62.4 | 58.0 | 49.9 | 56.3 |
| Maximum | 63.0 | 71.0 | 66.0 | 57.3 | 64.3 |
| Minimum | 47.1 | 53.7 | 50.0 | 42.4 | 48.3 |
| Wellington— | |||||
| Mean | 54.1 | 62.1 | 56.4 | 47.9 | 55.1 |
| Maximum | 61.7 | 71.0 | 64.8 | 55.4 | 63.3 |
| Minimum | 46.2 | 53.3 | 48.2 | 40.5 | 47.0 |
| Nelson and Marlborough— | |||||
| Mean | 55.6 | 63.5 | 57.6 | 48.7 | 58.3 |
| Maximum | 63.7 | 72.2 | 65.6 | 55.9 | 64.3 |
| Minimum | 47.5 | 55.0 | 49.8 | 41.5 | 48.4 |
| Westland— | |||||
| Mean | 49.7 | 58.1 | 51.4 | 41.2 | 50.1 |
| Maximum | 57.5 | 66.2 | 59.1 | 48.6 | 57.8 |
| Minimum | 42.0 | 49.9 | 43.7 | 33.7 | 42.3 |
| Canterbury— | |||||
| Mean | 52.5 | 60.8 | 53.2 | 43.1 | 52.4 |
| Maximum | 61.9 | 70.9 | 62.3 | 51.2 | 61.6 |
| Minimum | 43.1 | 50.9 | 44.3 | 35.1 | 43.3 |
| Otago— | |||||
| Mean | 50.4 | 57.9 | 51.0 | 41.5 | 50.2 |
| Maximum | 59.5 | 67.5 | 59.1 | 48.1 | 58.5 |
| Minimum | 41.5 | 48.2 | 43.0 | 35.0 | 41.9 |
Mean temperatures of definite places are usually employed in climatic comparisons, and the following annual means, as well as the means of the extreme months of the summer and winter, afford the reader useful data. The Australian temperatures are from the Official Year-book of the Commonwealth of Australia, and the others are chiefly from Dr. J. von Hann's great work upon the climatology of the world.
| Mean Temperatures in Shade (Degrees Fahrenheit). | |||||
|---|---|---|---|---|---|
| Mean Temperatures. | |||||
| NEW ZEALAND. | |||||
| Auckland. | Gisborne. | Wellington. | Christchurch. | Hokitika. | |
| January | 66.7 | 67.1 | 62.4 | 61.7 | 60.9 |
| July | 51.8 | 49.5 | 47.5 | 42.4 | 44.8 |
| Annual | 59.3 | 58.3 | 55.2 | 52.6 | 53.4 |
| AUSTRALIA. | |||||
| Sydney. | Melbourne. | Brisbane. | Perth. | Adelaide. | Hobart. |
| January 71.6 | 67.4 | 77.2 | 73.6 | 74.1 | 62.4 |
| July 52.3 | 48.5 | 58.1 | 55.0 | 51.5 | 45.3 |
| Annual 63.0 | 58.3 | 68.9 | 64.0 | 62.9 | 54.3 |
| BRITISH ISLES. | |||||
| Greenwich. | Liverpool. | York. | Dublin. | Edinburgh. | |
| January | 38.5 | 39.4 | 37.8 | 41.7 | 39.0 |
| July | 62.6 | 59.7 | 56.7 | 59.7 | 58.5 |
| Annual | 49.6 | 48.7 | 47.7 | 49.6 | 47.7 |
| EUROPE. | |||||
| Vienna. | Berlin. | Paris. | Rome. | Naples. | |
| January | 28.9 | 32.7 | 36.5 | 44.1 | 46.8 |
| July | 67.3 | 64.6 | 65.5 | 76.5 | 75.6 |
| Annual | 48.6 | 47.3 | 50.5 | 59.7 | 60.4 |
| CANADA. | |||||
| Halifax. | Montreal. | Toronto. | Vancouver. | ||
| January | 42.0 | 12.3 | 22.4 | 37.9 | |
| July | 64.2 | 68.9 | 67.6 | 59.9 | |
| Annual | 43.2 | 42.0 | 44.2 | 48.7 | |
| UNITED STATES. | |||||
| New York City. | Washington, D.C. | St. Louis. | Los Angelos | ||
| January | 30.2 | 31.1 | 30.9 | 53.0 | |
| July | 73.5 | 76.8 | 79.1 | 67.4 | |
| Annual | 51.6 | 54.6 | 55.7 | 60.2 | |
| SOUTH AMERICA. | |||||
| Santiago. | Buenos Ayres. | Monte Video. | |||
| January | 67.4 | 73.5 | 71.7 | ||
| July | 45.8 | 50.1 | 50.7 | ||
| Annual | 56.3 | 61.8 | 61.3 | ||
| INDIA. | |||||
| Calcutta. | Bombay. | Madras. | Colombo. | ||
| January | 65.1 | 74.5 | 75.4 | 79.0 | |
| May | 85.6 | 84.4 | 88.7 | 82.0 | |
| Annual | 77.9 | 79.3 | 81.9 | 80.2 | |
| SOUTH AFRICA. | |||||
| Simonstown. | Grahamstown. | Kimberley. | Durban. | ||
| January | 70.7 | 68.0 | 75.0 | 75.7 | |
| July | 56.8 | 53.2 | 48.7 | 64.0 | |
| Annual | 63.6 | 61.3 | 63.3 | 70.3 | |
The rainfall map of New Zealand presents striking conformation to its physical configuration, and records gathered throughout the country during a period of more than sixty years present a certain regularity which brings out the dominating influence of the mountain ranges over the rainfall. The lofty Southern Alps, rising to heights of from ten to twelve thousand feet on the western side of the South Island, lie broadside to the prevailing westerly winds, and on their windward slopes are condensed the vapours which have been swept by the breezes over vast stretches of ocean-wave. On the plains at the margin near the foot of the ranges and on their rugged and precipitous slopes the rainfall averages from one to two hundred inches per annum, while on the lee side of this formidable chain the climate is comparatively very dry, and in parts the rainfall is only about one-tenth of what is recorded on the other side. The manner in which the sea-breezes are robbed of their moisture is occasionally manifested when a strong and steady westerly wind blows along parallel with the southern latitudes. Heavy and continuous then is the rain on the west coast, and the clouds and mist may rise to the summit, but no further. There the winds are forced onwards and rush downwards to the greatest plains in New Zealand which have been built up of the detritus of the mountains. Here, however, the characteristics of this westerly wind have been entirely changed, for it is now hot by compression, and dry because it gave off its moisture when it rose above sea-level away back among the hills. Instead of parting with superfluous humidity, it is now capable of sustaining the vapour of water, and nature seeks to restore the balance of its relative humidity by evaporating what moisture it can from stream and lake, vegetation or animal life in its path. These hot and dry “nor'-westers” of the Canterbury Plains are similar in character to the well-known Foehn winds such as are experienced in Austria, Switzerland, and Italy, but they illustrate and account for much of the comparative shortage of rainfall on the eastern side of the South Island which is manifest from a glance at the map.
While the South Island isohyets or rain-bands of equal rainfall stretch north and south, the North Island tracings are more irregular in form, but show that the rainfall itself is more regular over the country and less extreme in comparison between different districts. Here, again, however, the control of the mountains and plains over precipitation is apparent. The contours of the rainfall areas are found to coincide more or less with the configuration of the country—dark-tinted spots showing heavier rainfalls are found in proximity to Mount Egmont, the Tongariro, Tararua, Raukumara, and other ranges.
The mean annual rainfall of New Zealand, derived from means of representative stations in various parts of the whole country, is about 50 in., but the seasonal falls are different in various districts. The season of greatest fall in the North Island, which is mostly under the influence of subtropical conditions, is winter, and the month of July shows not only the lowest mean temperature but the mean maximum rainfall, and is regarded as the midwinter month in the Southern Hemisphere. In the
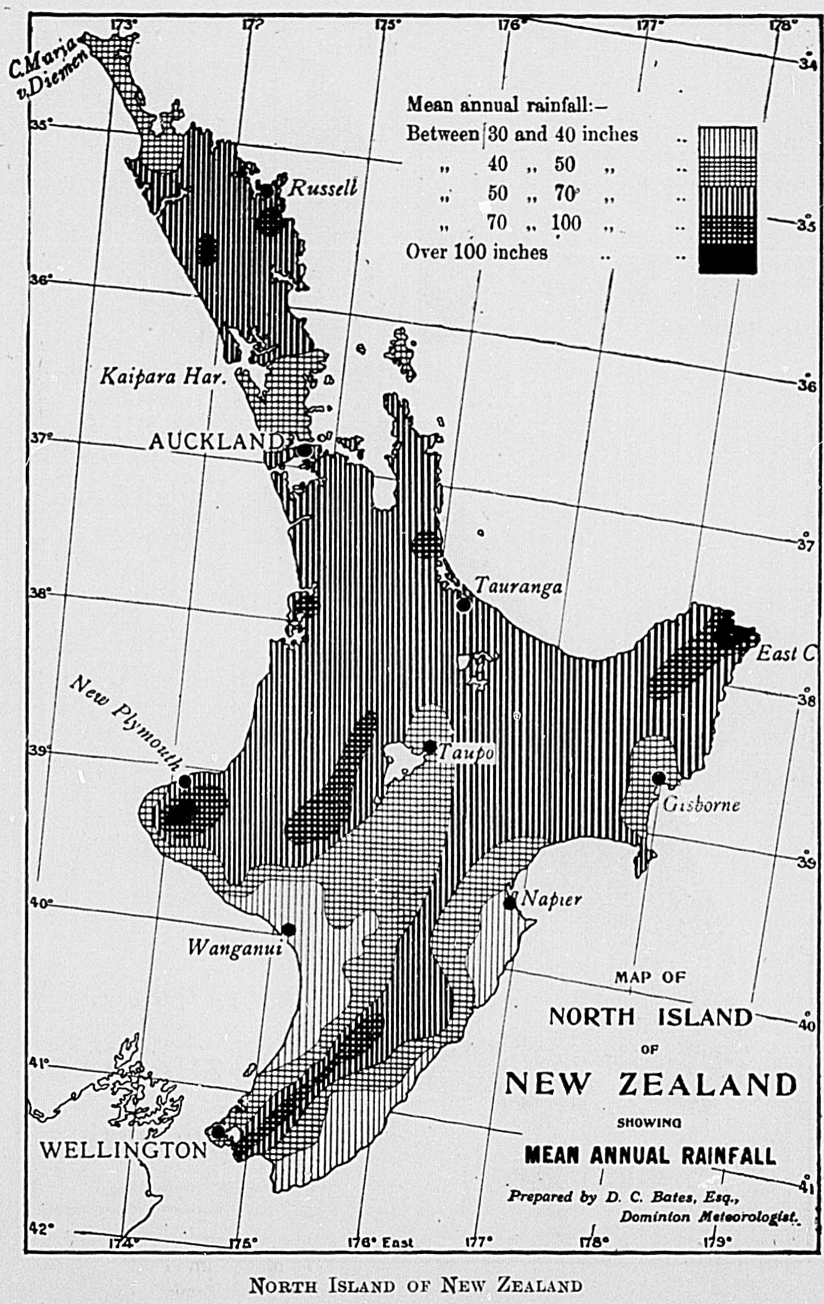
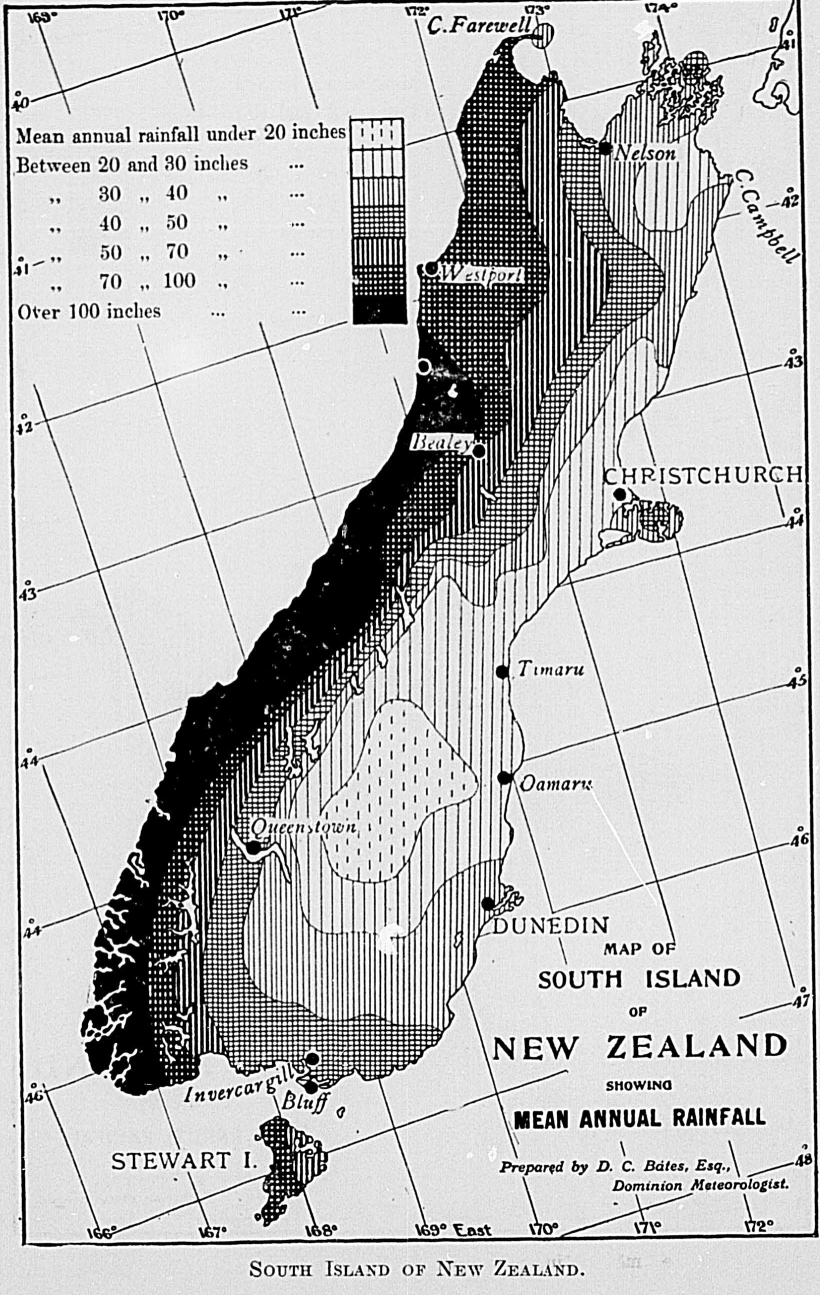
South Island late autumn, winter, and early spring are frequently dry, while the summer sometimes suffers from too frequent showers. This is the case on the east coast and southernmost portions of the South Island, but at this time the west coast occasionally is even in want of rain; in fact, the west and east coasts of the South Island are so different that if the east coast has more than the average rainfall the west coast has less, and vice versa. The average monthly rainfall of the year is remarkably even in the South Island, but the midwinter month's mean in the North Island is nearly double the mean of the midsummer month.
The averages from the climatological tables are—
| Rainfall (in Inches). | |||||
| Winter. | Spring. | Summer. | Autumn. | Annual. | |
| North Island | 14.73 | 12.17 | 9.93 | 13.71 | 50.54 |
| South Island | 12.28 | 11.94 | 10.27 | 10.79 | 45.28 |
| Rainy Days (0.005 in. or more). | |||||
| Winter. | Spring. | Summer. | Autumn. | Annual. | |
| North Island | 47 | 46 | 30 | 40 | 163 |
| South Island | 41 | 44 | 34 | 36 | 155 |
| Annual Rainfall (in Inches). | |||||
| Auckland (60 Years). | New Plymouth (36 Years). | Wellington (55 Years). | Gisborne (35 Years). | ||
| Average | 43.31 | 59.60 | 49.73 | 47.43 | |
| Maximum | 63.72 | 82.93 | 67.68 | 64.33 | |
| Minimum | 26.32 | 43.83 | 30.02 | 26.09 | |
| Christchurch (36 Years). | Hokitika (34 Years). | Dunedin (54 Years). | Invercargill (18 Years). | ||
| Average | 25.50 | 116.23 | 37.58 | 45.98 | |
| Maximum | 35.30 | 154.44 | 54.51 | 69.00 | |
| Minimum | 13.54 | 88.21 | 22.15 | 33.24 | |
| Mean Number of Days with Rain (0.01 in. or more). | ||||||||||||
|---|---|---|---|---|---|---|---|---|---|---|---|---|
| — | Jan. | Feb. | Mar. | April. | May. | June. | July. | Aug. | Sept. | Oct. | Nov. | Dec. |
| Auckland | 10.3 | 9.4 | 11.0 | 13.2 | 18.1 | 19.1 | 20.7 | 19.3 | 17.6 | 16.2 | 11.4 | 11.4 |
| New Plymouth | 12.5 | 10.5 | 12.2 | 14.0 | 18.0 | 17.2 | 19.5 | 19.2 | 17.5 | 18.5 | 15.7 | 14.2 |
| Gisborne | 9.0 | 9.7 | 12.3 | 12.4 | 15.6 | 16.4 | 16.8 | 15.7 | 13.4 | 11.6 | 11.6 | 9.3 |
| Wellington | 10.5 | 9.2 | 11.7 | 12.8 | 16.4 | 17.3 | 18.3 | 17.3 | 15.5 | 13.9 | 12.7 | 12.0 |
| Christchurch | 9.0 | 7.4 | 9.3 | 9.1 | 10.8 | 12.1 | 13.0 | 11.0 | 9.9 | 8.9 | 9.8 | 9.1 |
| Hokitika | 14.8 | 10.3 | 13.5 | 14.1 | 15.5 | 15.0 | 16.4 | 16.0 | 15.3 | 19.0 | 13.0 | 16.3 |
| Dunedin | 14.7 | 11.5 | 13.2 | 13.2 | 14.1 | 13.0 | 13.6 | 13.0 | 13.0 | 14.5 | 14.1 | 14.8 |
| Invercargill | 15.0 | 10.0 | 14.0 | 16.0 | 17.0 | 15.0 | 15.0 | 14.0 | 14.0 | 17.0 | 18.0 | 15.0 |
| Annual mean totals.—Auckland, 180.4; New Plymouth, 1897; Gisborne, 153.8; Wellington, 167.7; Christchurch, 119.4; Hokitika, 1792; Dunedin, 163.3; Invercargill, 180. | ||||||||||||
The seasons usually differ considerably in several characteristics from year to year, and the annual rainfalls are found to range considerably above and below the means in all parts of the Dominion. From month to month also, and by comparing the records of months of the same name in different years are seen surprising contrasts and periodic changes which evade general laws, and the approximately true mean rainfalls are only ascertained through averages derived from returns extending over many years
The abundance and frequency of the rainfall are, however, the leading features in the climate of New Zealand as a whole. The positions of the Islands, with vast oceans on every side, and the proximity of every part of the country to the sea, combined with frequent atmospheric changes usually cause all parts of the Dominion to be favoured with beneficent rains, and very rarely indeed does the rainfall report from any station in the Dominion make the return of “nil.” Nine out of ten of the stations throughout the country have never recorded months of such absolute drought, and on the other hand very few are the records showing rainfall every day during any month of their registrations. Sunshine and rain alternate fairly well throughout the year, with much greater predominance of the former. The rainfall is usually more intense and frequent at night than in the hours when the sun exercises its influence over air and earth and sea, for then “Maui is drawing water.”
Averages derived from the Monthly Climatological Tables from August, 1904, to December, 1914 (inclusive). Temperature in degrees Fahrenheit. Rainfall in points: 100 = 1 in.
| — | Jan. | Feb. | Mar. | April. | May. | June. | July. | Aug. | Sept. | Oct. | Nov. | Dec. |
|---|---|---|---|---|---|---|---|---|---|---|---|---|
| North Island— | ||||||||||||
| Mean temp. | 63.8 | 63.4 | 62.2 | 57.5 | 52.4 | 49.2 | 43.0 | 49.7 | 52.0 | 54.8 | 57.9 | 60.9 |
| Rainfall | 322 | 288 | 461 | 404 | 484 | 415 | 535 | 399 | 388 | 406 | 351 | 350 |
| Days with rain | 9.6 | 8.4 | 11.5 | 13.4 | 14.6 | 15.4 | 16.9 | 14.1 | 15.2 | 14.8 | 13.7 | 11.8 |
| South Island— | ||||||||||||
| Mean temp. | 60.0 | 60.0 | 58.2 | 52.8 | 47.6 | 44.0 | 42.5 | 44.6 | 48.9 | 52.2 | 55.1 | 58.0 |
| Rainfall | 385 | 257 | 379 | 348 | 343 | 424 | 403 | 331 | 405 | 403 | 349 | 408 |
| Days with rain | 12.6 | 8.2 | 12.2 | 12.5 | 12.0 | 14.0 | 13.6 | 12.9 | 14.8 | 14.6 | 14.2 | 13.8 |
Annual averages.—North Island—Mean temp., 56.0° F.; rainfall, 48.03 in.; days with rain, 159. South Island—Mean temp., 52.0° F.; rainfall, 44.35 in.; days with rain, 155.
Snow falls in the winter-time on the higher levels in the South Island and occasionally on the central plateau of the North Island, but, except on the mountain-tops, usually does not lie for long. Snow is seldom seen on the lowlands even in the southernmost districts of the South Island, and in many parts of New Zealand snow has never been known to fall; but, on the other hand, cyclonic areas in summer will bring some snow on the higher levels of the South Island.
Thunderstorms are also comparatively rare in the coastal districts, but are more frequent and prolonged in the mountainous parts. In summer the thunderstorms usually occur in the afternoon, and in the winter, with low pressure systems, at night.
Hail occasionally accompanies coastal thunderstorms, but rarely causes much damage to property, fruit, or crops in New Zealand, and is more frequently experienced in winter.
The winds of the temperate zone are usually fairly constant and fresh, and the Dominion of New Zealand—set as it is in the widest ocean in the world—is open to all its influence. The sea-breezes sweep uninterruptedly over thousands of miles of ocean-wave, not only bringing freshness, ozone, and moisture, but at times, it must be confessed, causing annoyance on account of their force and persistency. This may be regarded as a defect of their qualities, for in those parts of the earth that experience little wind the people usually lack energy, and the same regions are mostly subject to occasional storms that are terribly destructive to life and property. No country in the world, however, presents greater diversity in respect to wind than New Zealand, chiefly on account of its length and mountain-chains. The uneven surface of the land, the proximity of the straits, &c., are seen to exercise the most marked influence not only upon the force, but also upon the direction of the winds—reducing or increasing their velocity, diverting, and even entirely changing their course. For example, westerly winds blowing across the ocean towards the west coast are partially inverted—while the upper part will cross the mountains to become occasionally a hot, dry westerly wind on the Canterbury Plains, the lower part curls round and is actually experienced as an easterly wind in the towns on the coast at the foot of the mountains.
The average velocity as given herewith is from records of the Robinson anemometer, in miles per day:—
| Place. | Jan. | Feb. | Mar. | Apr. | May. | June. | July. | Aug. | Sept. | Oct. | Nov. | Dec. |
|---|---|---|---|---|---|---|---|---|---|---|---|---|
| Auckland | 213 | 181 | 178 | 145 | 162 | 159 | 173 | 174 | 181 | 197 | 209 | 188 |
| Wellington | 306 | 273 | 285 | 281 | 259 | 242 | 232 | 242 | 283 | 337 | 331 | 322 |
| Hokitika | 144 | 135 | 132 | 134 | 124 | 116 | 109 | 120 | 143 | 170 | 152 | 143 |
| Lincoln | 197 | 183 | 175 | 160 | 133 | 120 | 116 | 134 | 168 | 193 | 197 | 188 |
| — | Auckland (11 Years). | Wellington (16 Years). | Hokitika (16 Years). | Lincoln) (13 Years). |
|---|---|---|---|---|
| Average per day | 180 | 282 | 135 | 164 |
| Max. velocity in one day | 974 | 1,200 | 693 | 967 |
| (15/10/1897) | (5/6/1911) | (6/12/1911) | (4/11/1904) |
The velocity of the winds, it may be noted, is higher on the average in summer than in winter, and the winds are usually also stronger by day than by night.
The following “wind-roses” show the percentage of wind-directions from annual means for forty-eight years' unbroken records for each place.
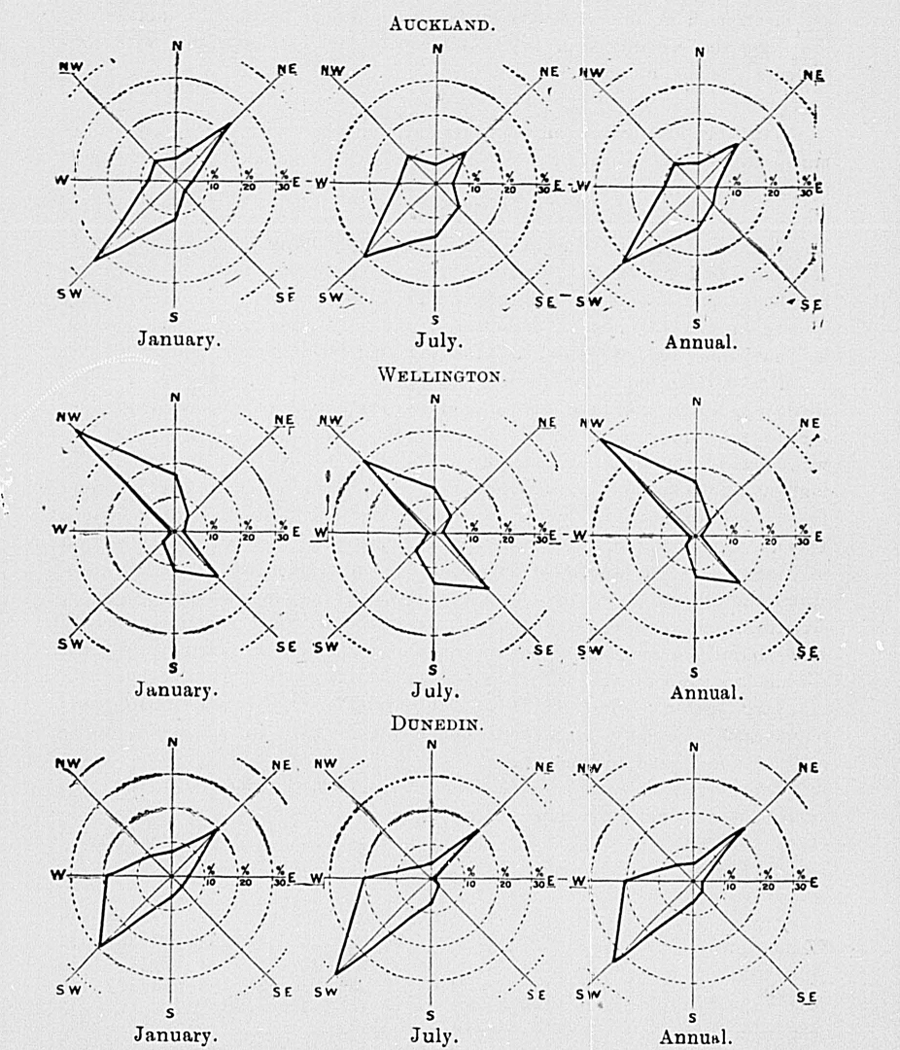
The prevailing winds are thus seen to be planetary anti-trade winds—westerlies which go round the world and are used by mariners to take them eastward towards England as far as Cape Horn, and on their return they pick them up again off the Cape of Good Hope. In summer, however, to the North of Auckland the easterly trade winds often blow with much regularity for weeks together.
The weather is full of vagaries in the temperate zones of both hemispheres, and New Zealand is not the only country which occasionally experiences a touch of winter in summer, but there is also very much summer-like weather in the winter-time. Occasionally winter storms account for temporary high winds and heavy rainfalls, but the monthly averages show that less wind is experienced in the season of winter, particularly in the south.
The chief atmospheric changes are associated with barometric pressures, above the normal being known as “high” pressure, and below it as “low.” For weather charts and forecast purposes the isobar, or line of equal pressure of 30 in., is regarded as normal in New Zealand, though the true normal lies between 29.90 in. and 30.00 in. The winds flow nearly parallel to the isobars in both high and low pressure systems, and all atmospheric systems in New Zealand move from west to east.
High-pressure systems or anti-cyclones are usually associated with fair weather by day and cold nights, when the earth radiates the heat of its surface into space. The central isobar will occasionally enclose an area in which all the barometers reduced to sea-level and to 32° Fahr. will read as high as 30.60. Around this centre the winds revolve or back contrary to the direction of the hands of a watch in the Southern Hemisphere; thus, if the barometer is 30.40 in. at Wellington, and the readings are 30.00 in. or thereabouts at both Russell and the Bluff, the winds will be easterly over the North Island and westerly over the South, southerly off the east coast and northerly off the west coast. The winds thus form vast circles hundreds of miles in diameter. These anticyclones often last for eight or nine days.
Low-pressure systems are mostly of two kinds, and around their centres of lowest pressure the winds are seen to revolve clockwise on the weather-chart; thus, if the centre of a cyclone should be in Cook Strait the winds will be westerly at Auckland, easterly at Christchurch, northerly off the east coast, and southerly off the west coast. If the lowest pressure on the chart were in Foveaux Strait the prevailing winds northward would be generally westerly, at least as far north as New Plymouth and Napier, and sometimes extend even to the North Cape, changing from north by the west to south-west.
Cyclones are circular or oval-shaped disturbances with closed isobars; they come from the tropics, and chiefly affect the North Island, bringing first warmth and humidity, then high winds and heavy rain. They usually last from two to five days, and are more frequent in winter than in summer, though they are often intense at the latter period.
The term “cyclone” does not always mean a storm of great intensity such as is experienced in tropical regions, for when the disturbance leaves the tropics it usually expands and covers a wider area, over which its forces are distributed. The frequency of cyclones during the past nine years shows the following average: Spring, 2; summer, 1.8; autumn, 3.3; winter, 5.3. These figures will be surprising to some who believe that ex-tropical cyclones are found only in spring or early in summer, while others assert that they come only in midwinter.
Westerly or antarctic lows of λ-shaped isobars, with lowest pressure southward of New Zealand, chiefly affect the South Island, but, like the cyclones, frequently extend their influences over the whole Dominion. These lows usually move along the parallels of latitude known to sailors as the “roaring forties.” Their duration is from twelve hours to as many days, and in some seasons they are much more frequent and persistent than in others. They come at all times of the year, but with greater frequency in spring-time: Spring, 6.3; summer, 4.3; autumn, 5.2; winter, 4.7.
The development of the Maori race is a striking testimony to the suitability of the climate to humanity, and European families under New Zealand skies have generally developed in physique. Imported stock has in most cases thriven marvellously in the fields, where throughout summer and winter they usually find all the nourishment needed, and hardly ever require more than natural protection.
The fertility of the soil gives remarkable testimony to the genial climate of New Zealand, for, though labour is not nearly plentiful enough to obtain the best results from agriculture, yet, as shown in the returns published annually, the actual average yields in bushels per acre for the Dominion compare more than favourably with the yields for other countries.
Lastly, the vital statistics show that for a long period New Zealand has had the lowest death-rate in the world, and this is undoubtedly owing very much to the salubrity of its climate. The vital statistics show to advantage not only in the earlier years of life, but it is after the age of thirty-two that the extraordinary longevity of New Zealand is apparent. The judgment of travellers and those best qualified to give an opinion is that the country is one of the healthiest in the world. The abundant vitality of the people is apparent not only in the homes and throughfares throughout the Dominion, but is manifested in thriving industries and the high place attained by New-Zealanders in the world of sport. New Zealand, in a word, is a country where from youth to old age man can keep in vigorous health and enjoy life to its fullest extent.
With the exception of the southernmost portion of the South Island, the total rainfall for 1914 was everywhere considerably below the average of previous years, many parts experiencing one of the driest years since observations have been taken. Following is a short summary for each month of the weather and the chief atmospheric systems which were in evidence:—
January.—Anticyclonic pressure was continuous in the northern districts from the beginning until the 27th of the month, although during this period several depressions of but slight intensity passed in the South—viz., on the 3rd, 9th, 11th, 13th, 16th, and 22nd. On the latter date some heavy downpours occurred, especially in the western districts. From the 27th to the close of the month an intense and extensive depression of a cyclonic type enveloped the Dominion, and general rains were experienced, which were extremely beneficial to portions of the North Island, where dry conditions had ruled for some time. As a whole the month was one of fine and warm weather. Nearly the whole of the North Island and the northeastern districts of the South recorded considerably less than the normal rainfall, but the remaining portion of the South Island had an excess.
February.—Between the 1st and 5th of the month a westerly low-pressure area, of a cyclonic type, in its passage over the Dominion caused very unsettled conditions. Heavy rain fell at this time in many parts, particularly in South Canterbury and North Otago. On this account these two districts had an aggregate rainfall much above the average. Several depressions, but of minor intensity, had a disturbing influence on weather-conditions about the 11th, 24th, and 26th, but on the whole the month was one of fine and warm weather. With the exception of the two above-named districts, precipitation was everywhere below normal.
March.—Westerly areas of low pressure passed in the south in the opening and closing days of the month, and subtropical “lows” in the north in the middle of the month, and from the 24th to the 27th, but barometric pressure was usually above the average. The weather was generally mild and seasonable. Rainfall was below the normal, especially on the west coast, but some useful rains fell on the east coast of both islands.
April.—Disturbances prevailing during April were more remarkable for their frequency than for their intensity. On the 8th a cyclone passed in the south, and from then until the 16th a low barometer ruled in the southern districts, culminating in boisterous weather on the 16th and 17th. On the 21st, and again between the 27th and 29th, a depression passed in the northern districts, causing dull and wet conditions, especially along the eastern coast. Heavy rain fell at isolated places in conjunction with electrical disturbances between the 24th and 27th, and also in the mountainous country between Canterbury and Westland during the first half of the month. Usually, however, frequent showers formed the striking feature of the month, but fair and mild weather was also prevalent. With the exception of the extreme north and south of the North Island, nearly the whole of New Zealand had more than the mean rainfall.
May.—Anticyclones were in existence over the Dominion between the 4th and 7th, and the 23rd and 28th, and during these two periods fair weather was experienced in most parts of the country, with clear frosty nights in the South and in inland districts of the North Island. The weather for the rest of the month was unsettled, owing to various disturbances which passed over or in close proximity to the Dominion. On the 1st a rapidly moving depression passed in the south, and the wind changed to southerly, increasing to gale force at widely separated places. Ngaruawahia, in the Waikato, reported an exceptionally severe south-west gale, which caused considerable damage to property. On the 8th the centre of a small disturbance passed in the vicinity of Cook Strait, and this was followed by a depression which prevailed in the North Island between the
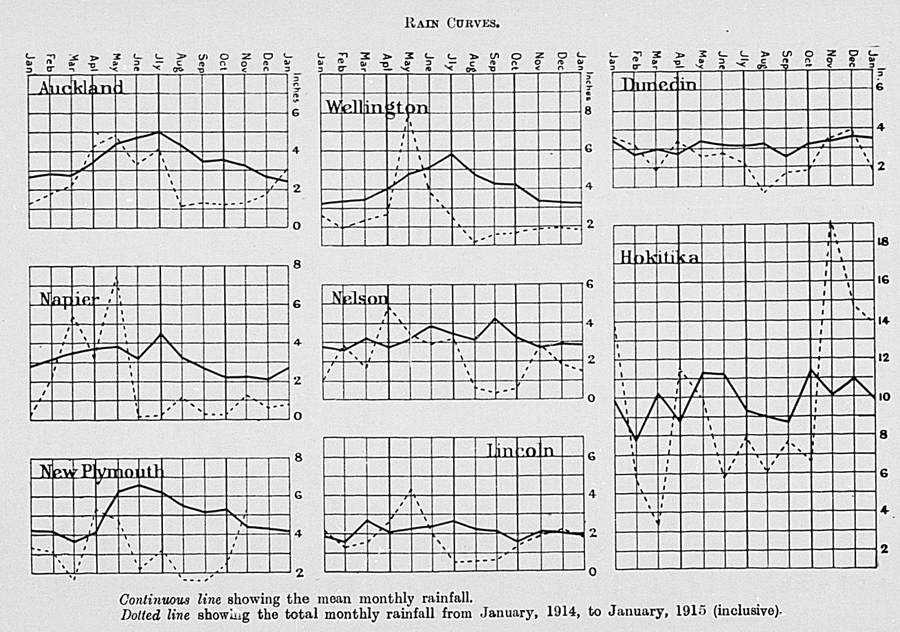
8th and 13th. This latter disturbance, and also an extensive cyclone which was centred off East Cape between the 16th and 22nd, accounted for heavy rains in the east coast districts of the North Island, and cold south-easterly weather generally. On the 17th, 18th, and 19th, owing to continuous heavy rains, floods occurred in many of the rivers in the Gisborne and Hawke's Bay districts. At Patunamu, Wairoa, the extraordinary fall of 13.05 in. fell on the 17th, and for the four days, 16th to the 19th, 29.63 in. were measured, while the total for the month was 38.31 in. Although this disturbance had not decreased in intensity on the 20th, the presence of another low-pressure area to the southward of New Zealand had a neutralizing effect, and a brief improvement in conditions was experienced, but this was followed by boisterous unsettled weather again on the night of the 20th. From the 29th to the close of the month squally weather ruled, with the development of an extensive westerly low-pressure area. About this date some heavy rains occurred in the northern districts. On the 29th Kaitaia reported 5.30 in., Wekaweka 4.88 in., and at Ruatoki 2 in. fell in one hour on the 30th. The aggregate total rainfall for the month was below the average on the west coast and in the extreme south of the South Island, and also in the central portion of the North Island; but elsewhere was in excess of the average.
June.—Although showery conditions were frequent, on the whole, the weather was propitious for the season of the year. In both the east coast districts especially, with the exception of a few short unsettled and squally periods, fair weather was the predominating feature. In consequence, in those parts vegetation was plentiful and everything was favourable to agricultural and pastoral pursuits. No severe storms were experienced, but numerous depressions of varying intensity passed over or in the neighbourhood of the Dominion. These were mostly of the westerly low-pressure type, bringing westerly winds with their approach, and southerlies with the passing of the trough to the eastward. A lagging of the barometric minimum about East Cape after the passage of these depressions was also a factor in causing a prevalence of strong and cold southerly winds during the month. The total rainfall was below normal in nearly all parts of the Dominion; in the North Island this deficiency averaged about 40 per cent., and in the South Island 26 per cent.
July.—In the northernmost districts and on the western coast of both Islands dull and showery conditions prevailed, but as a whole the weather was extremely mild for July, and the total rainfall was everywhere below the average, the deficiency being most remarkable in the east coast districts. Two persistent westerly low-pressure systems were in evidence during the month, but no storms of a severe character were experienced.
August.—The east coast provinces experienced almost continuous fair and dry weather, and some places reported the driest August for many years. Three westerly disturbances of moderate intensity passed in the south on the 7th, 12th, and 30th respectively; but the month was entirely free from severe storms. Between the 18th and 28th an anticyclone accounted for fair weather, and some sharp frosts occurred at inland stations. In the western districts and also in the southernmost portion of the South Island the weather was changeable and showery during the first half of the month, but improved thereafter. All parts of the country recorded a total rainfall below the average, the deficiency being strikingly low over the North Island and in the east coast and northern districts of the South Island.
September.—With the exception of the southernmost districts of the South Island, where the aggregate rainfall was above normal, warm and dry conditions were generally experienced, and a considerable deficiency resulted. At many stations in the east coast districts the total fall was less than 10 per cent. of the average. Between the 5th and 22nd an extensive anticyclone held sway, and fair weather was the predominating feature, with frosts often occurring at inland stations. On the 18th the barometer was as high as 30.65 in. at Wellington, but after this date high pressure gradually gave way, and was succeeded by an intense westerly area of low-pressure which brought unsettled and, in parts, stormy weather between the 23rd and 27th. At 7 p.m. on the 25th the barometer fell to 28.65 in. at the Bluff. It afterwards rose rapidly, and on the two closing days of the month fair weather again prevailed.
October.—During the month disturbances passed frequently in the south, but the centres on most occasions were located too far south of the Dominion, and except in Otago they were not responsible for much rainfall. Consequently the latter district was the only one having a total fall above the average. Over the remainder of the South Island the mean deficiency in rainfall averaged about 42 per cent., while in the North Island it was 67 per cent. below, ranging from 15 to as much as 91 per cent. In the southern districts of the South Island strong westerly winds and showery conditions prevailed, but elsewhere, except for a few brief periods, the weather was generally fair, although often cloudy. The stormiest days were the 10th, 18th, and 28th. On the 10th a heavy westerly gale was experienced, especially in and southward of Cook Strait. In Canterbury this was preceded by some hot weather, the high temperature of 90° F. being reported at Waimate, 87.8° at Christchurch, 87.2° at Lincoln, and 87° at Hanmer. On the 28th a cold southerly prevailed, accompanied by snow on the higher levels, and hail and sleet in many parts. A frosty night followed, and a general improvement took place on the 29th.
November.—Atmospheric depressions in southern latitudes were persistent during the month, and accounted for a prevalence of strong westerly winds, particularly in and southward of Cook Strait. The weather was very changeable generally. In the west coast and southern districts of the South Island the total rainfall was above the average; but elsewhere most parts reported a deficiency, although cloudiness was much in evidence.
December.—From the beginning until about the 25th strong northwesterly to south-westerly winds prevailed, and the weather was very changeable. During this period the winds occasionally attained gale-force, particularly between the 7th and 21st, when westerly low-pressure areas passed frequently in the south. From the 26th until the close of the month anticyclonic conditions, with fair and warm weather, were experienced. With the exception of the Taranaki District, and also the west coast and southernmost portions of the South Island, the rainfall was again generally much below normal.
The following table shows the difference, above or below the mean, for each month in the year:—
North Island Rainfall, 1914.
| Monthly Means compared with the Averages for Nine Previous Years. | ||||||||||||
|---|---|---|---|---|---|---|---|---|---|---|---|---|
| Jan. | Feb. | Mar. | April. | May. | June. | July. | Aug. | Sept. | Oct. | Nov. | Dec. | |
| + | .. | .. | .. | 5.04 | 5.90 | .. | .. | .. | .. | .. | .. | .. |
| Av. | 3.38 | 2.94 | 4.72 | 3.93 | 4.72 | 4.33 | 5.67 | 4.23 | 4.14 | 4.34 | 3.67 | 3.62 |
| – | 1.81 | 2.35 | 3.62 | .. | .. | 2.55 | 2.43 | 1.62 | 1.37 | 1.30 | 1.96 | 2.29 |
| Mean Number of Days with Rain, compared with the Averages for Nine Years. | ||||||||||||
|---|---|---|---|---|---|---|---|---|---|---|---|---|
| Jan. | Feb. | Mar. | April | May. | June. | July. | Aug. | Sept. | Oct. | Nov. | Dec. | |
| + | .. | 9.0 | .. | 16.8 | 16.9 | .. | .. | .. | .. | .. | .. | .. |
| Av. | 10.0 | 8.3 | 11.7 | 13.0 | 14.4 | 15.5 | 17.2 | 14.4 | 16.0 | 15.6 | 13.9 | 12.0 |
| – | 6.6 | .. | 10.5 | .. | .. | 14.2 | 13.9 | 10.7 | 7.6 | 6.9 | 10.7 | 9.8 |
| + Above the average. | ||||||||||||
| – Below the average. | ||||||||||||
South Island Rainfall, 1914.
| Monthly Means compared with the Averages for Nine Previous Years. | ||||||||||||
|---|---|---|---|---|---|---|---|---|---|---|---|---|
| Jan. | Feb. | Mar. | April. | May. | June. | July. | Aug. | Sept. | Oct. | Nov. | Dec. | |
| + | 3.95 | 2.89 | .. | 4.12 | 3.89 | .. | .. | .. | .. | .. | 4.61 | .. |
| Av. | 3.84 | 2.53 | 4.00 | 3.41 | 3.38 | 4.39 | 4.24 | 3.45 | 4.24 | 4.21 | 3.38 | 4.08 |
| – | .. | .. | 2.01 | .. | .. | 2.91 | 2.11 | 1.90 | 2.06 | 2.20 | .. | 4.06 |
| Mean Number of Days with Rain, compared with the Averages for Nine Years. | ||||||||||||
|---|---|---|---|---|---|---|---|---|---|---|---|---|
| Jan. | Feb. | Mar. | April. | May. | June. | July. | Aug. | Sept. | Oct. | Nov. | Dec. | |
| + | .. | 8.8 | .. | 15.8 | 13.1 | 14.7 | .. | .. | .. | .. | 14.9 | .. |
| Av. | 12.7 | 8.1 | 12.5 | 12.2 | 11.9 | 13.9 | 13.9 | 13.1 | 15.2 | 15.1 | 14.1 | 13.9 |
| – | 12.0 | .. | 9.9 | .. | .. | .. | 11.4 | 11.0 | 10.6 | 9.5 | .. | 12.7 |
| + Above the average. | ||||||||||||
| – Below the average. | ||||||||||||
Temperature, Rainfall, Atmospheric Pressure, and Wind throughout New Zealand, as observed at Ten Stations, for the Year 1914.
The Observations were taken at 9 a.m.
| METEOROLOGY. Temperature, Rainfall, Atmospheric Pressure, and Wind throughout New Zealand, as observed at Ten Stations, for the Year 1914. The Observations were taken at 9.am. | ||||||||||
|---|---|---|---|---|---|---|---|---|---|---|
| Stations. | Temperature in Shade. | Rainfall. | Mean Height of Barometer. | Prevailing Winds. | ||||||
| Months. | Highest. | Lowest. | Mean Max. Temp. | Mean Min. Temp. | Mean Temp. for Month. | Wet Days. | Fall. | |||
| °Fahr. | °Fahr. | °Fahr. | °Fahr. | °Fahr. | No. | Inches. | Inches. | |||
| Auckland (lat. 36° 50′ S.; long. 174° 50′ 04′ E.; alt. 125 ft.)— | January | 79.5 | 52.0 | 74.8 | 59.6 | 67.2 | 6 | 1.32 | .. | SW. |
| February | 77.0 | 50.0 | 72.3 | 60.3 | 66.3 | 9 | 1.66 | .. | N. | |
| March | 77.0 | 49.0 | 72.0 | 57.5 | 64.7 | 6 | 2.22 | .. | NW, N. | |
| April | 73.0 | 46.5 | 66.9 | 54.5 | 60.7 | 20 | 4.21 | .. | NW, SW. | |
| May | 65.0 | 39.0 | 59.6 | 48.5 | 54.0 | 19 | 4.71 | .. | SW, S. | |
| June | 63.0 | 39.5 | 56.2 | 46.4 | 51.3 | 22 | 3.32 | .. | SW. | |
| July | 62.5 | 36.5 | 55.9 | 44.6 | 50.2 | 23 | 4.08 | .. | SW. | |
| August | 60.0 | 40.5 | 56.5 | 45.0 | 50.7 | 20 | 1.16 | .. | W, SW. | |
| September | 68.5 | 39.0 | 59.0 | 47.6 | 53.3 | 13 | 1.41 | .. | SW. | |
| October | 66.0 | 44.0 | 62.0 | 49.3 | 55.6 | 11 | 1.15 | .. | SW. | |
| November | 71.5 | 47.5 | 64.6 | 52.2 | 58.4 | 16 | 1.41 | .. | SW, W. | |
| December | 74.0 | 48.5 | 67.2 | 53.9 | 60.5 | 12 | 1.77 | .. | SW. | |
| Rotorua (lat. 38° 9′ S.; long. 176° 15′ E.; alt. 932 ft.)— | January | 83.0 | 43.0 | 76.4 | 54.0 | 65.2 | 5 | 0.92 | .. | SW, NE. |
| February | 75.0 | 34.0 | 69.1 | 52.5 | 60.8 | 7 | 2.36 | .. | SW. | |
| March | 78.0 | 36.0 | 71.9 | 50.9 | 61.4 | 7 | 2.43 | .. | S. | |
| April | 72.0 | 33.0 | 61.9 | 47.1 | 54.5 | 19 | 6.40 | .. | SW. | |
| May | 64.0 | 30.0 | 59.2 | 41.3 | 50.3 | 15 | 2.99 | .. | SW. | |
| June | 59.0 | 28.0 | 54.1 | 37.3 | 45.7 | 11 | 3.04 | .. | SW. | |
| July | 60.0 | 24.0 | 53.2 | 35.5 | 44.4 | 13 | 3.78 | .. | SW. | |
| August | 61.0 | 27.0 | 55.9 | 34.7 | 45.3 | 5 | 0.94 | .. | SW. | |
| September | 67.0 | 29.0 | 60.6 | 38.6 | 49.6 | 7 | 2.41 | .. | SW, N. | |
| October | 73.0 | 32.0 | 64.5 | 42.6 | 53.5 | 5 | 1.36 | .. | W, N. | |
| November | 72.0 | 33.0 | 67.3 | 44.8 | 56.0 | 4 | 0.98 | .. | W. | |
| December | 77.0 | 37.0 | 67.6 | 46.8 | 57.2 | 7 | 2.09 | .. | W. | |
| Gisborne (lat. 38° 30′ S.; long. 178° 03′ E.; alt. 20 ft.)— | January | 91.0 | 46.0 | 82.5 | 56.8 | 69.6 | 3 | 0.59 | 30.003 | W. |
| February | 86.0 | 42.0 | 76.7 | 54.8 | 65.7 | 11 | 2.30 | 29.950 | W. | |
| March | 84.0 | 43.0 | 72.0 | 54.9 | 63.4 | 18 | 8.83 | 30.057 | W, S. | |
| April | 76.0 | 32.0 | 67.9 | 48.5 | 58.2 | 16 | 4.39 | 29.945 | W. | |
| May | 66.0 | 32.0 | 59.9 | 45.9 | 52.9 | 19 | 12.91 | 29.934 | W. | |
| June | 66.0 | 29.0 | 58.1 | 38.5 | 48.3 | 13 | 2.53 | 29.936 | W, S.W. | |
| July | 66.0 | 25.0 | 58.2 | 36.4 | 47.3 | 9 | 0.89 | 29.958 | W. | |
| August | 67.0 | 30.0 | 59.0 | 39.0 | 49.0 | 10 | 3.60 | 30.092 | W. | |
| September | 74.0 | 30.0 | 63.1 | 42.1 | 52.6 | 9 | 0.69 | 30.165 | W, S. | |
| October | 81.0 | 32.0 | 67.9 | 44.3 | 56.1 | 5 | 0.60 | 30.082 | W, S. | |
| November | 78.0 | 33.0 | 70.6 | 48.3 | 59.4 | 7 | 1.12 | 29.904 | W. | |
| December | 83.0 | 32.0 | 73.8 | 50.0 | 61.9 | 3 | 0.26 | 29.885 | W. | |
| Greenmeadows (Napier), (lat. 39° 32′ S.; long. 176° 53′ E.; alt. 70 ft.)— | January | 92.5 | 48.0 | 82.5 | 58.4 | 70.4 | 3 | 0.25 | 29.991 | W, S. |
| February | 88.0 | 44.5 | 77.1 | 56.9 | 67.0 | 3 | 2.10 | 29.952 | W. | |
| March | 84.0 | 43.5 | 71.8 | 54.8 | 63.3 | 12 | 5.42 | 30.080 | S, NW. | |
| April | 80.5 | 37.0 | 67.6 | 51.3 | 59.4 | 7 | 3.14 | 29.936 | NW, SW. | |
| May | 66.0 | 35.0 | 58.3 | 45.4 | 51.8 | 11 | 7.40 | 29.971 | SW. | |
| June | 65.0 | 32.5 | 55.5 | 40.4 | 47.9 | 2 | 0.12 | 29.945 | SW. | |
| July | 62.5 | 30.0 | 55.9 | 39.0 | 47.4 | 3 | 0.24 | 29.955 | W, SW. | |
| August | 65.5 | 32.0 | 57.9 | 41.1 | 49.5 | 8 | 1.05 | 30.082 | SW. | |
| September | 73.5 | 35.0 | 62.5 | 43.3 | 52.9 | 2 | 0.32 | 30.163 | S. | |
| October | 77.0 | 36.0 | 68.6 | 47.2 | 57.9 | 2 | 0.21 | 30.078 | S. | |
| November | 85.0 | 36.5 | 71.1 | 49.3 | 60.2 | 6 | 1.23 | 29.893 | W. | |
| December | 87.0 | 41.5 | 75.1 | 51.1 | 63.1 | 4 | 0.65 | 29.857 | NW, W. | |
| Wellington (lat. 41° 16′ S.; long. 174° 46′ E.; alt. 8 ft.)— | January | 79.6 | 48.6 | 71.2 | 59.0 | 65.1 | 11 | 2.60 | 29.977 | N. |
| February | 79.0 | 45.4 | 69.7 | 56.9 | 63.3 | 11 | 1.93 | 29.958 | NW, S. | |
| March | 77.0 | 43.4 | 66.7 | 55.1 | 60.9 | 16 | 2.32 | 30.098 | NW, S. | |
| April | 71.0 | 40.6 | 62.9 | 52.8 | 57.8 | 21 | 2.56 | 29.907 | N, NW. | |
| May | 63.6 | 35.2 | 55.6 | 45.2 | 50.4 | 20 | 7.97 | 30.016 | S, N. | |
| June | 60.0 | 33.8 | 54.6 | 42.5 | 48.5 | 17 | 3.84 | 29.954 | N, S. | |
| July | 57.4 | 31.2 | 53.1 | 42.7 | 47.9 | 15 | 2.49 | 29.962 | N. | |
| August | 62.8 | 31.4 | 55.5 | 41.8 | 48.7 | 8 | 1.16 | 30.075 | NW, N. | |
| September | 69.0 | 34.0 | 58.8 | 45.6 | 52.2 | 7 | 1.52 | 30.147 | N. | |
| October | 69.0 | 38.8 | 61.3 | 49.9 | 55.6 | 8 | 1.54 | 30.090 | N, S. | |
| November | 68.8 | 41.8 | 61.3 | 51.1 | 56.2 | 11 | 1.98 | 29.892 | N. | |
| December | 72.0 | 42.0 | 63.4 | 51.6 | 57.5 | 11 | 1.99 | 29.833 | N, NW. | |
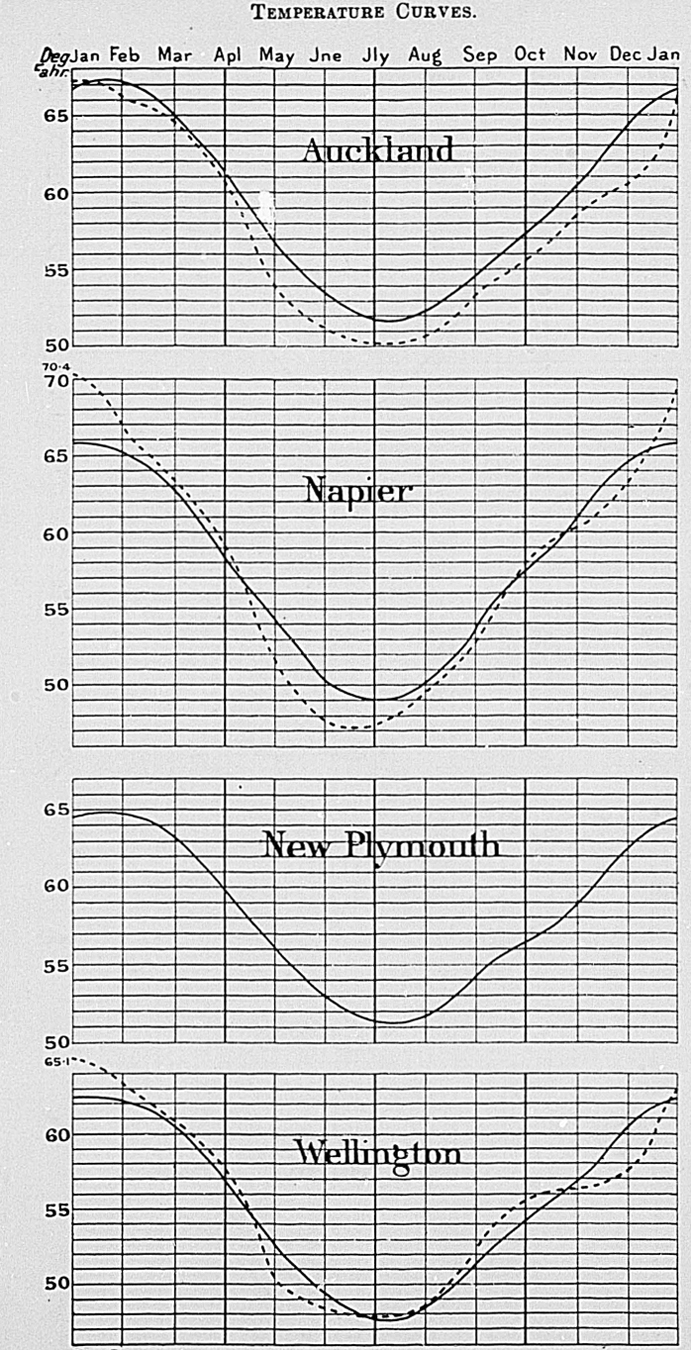
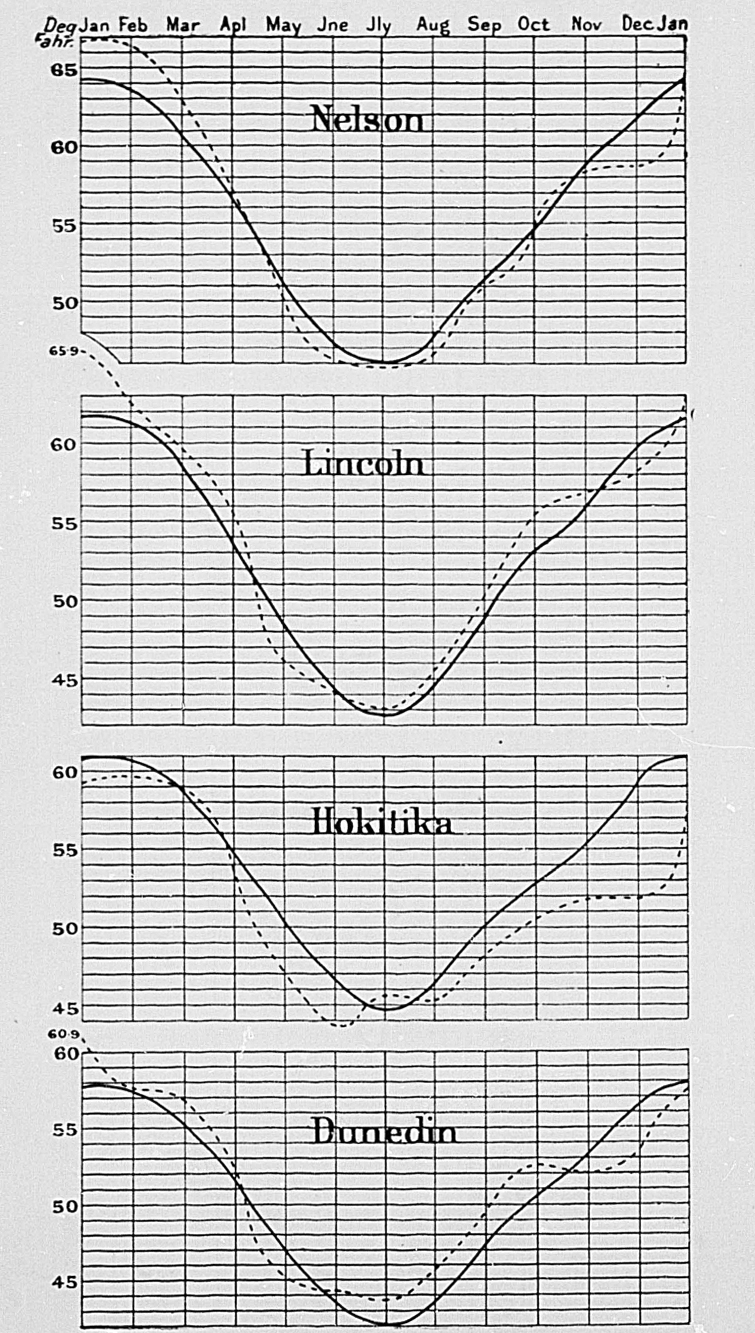
| Temperature in Shade. | Rainfall. | |||||||||
|---|---|---|---|---|---|---|---|---|---|---|
| Stations | Months. | Highest. | Lowest. | Mean Max. Temp. | Mean Min. Temp. | Mean Temp. for Month. | Wet Days. | Fall. | Mean Height of Barometer. | Prevailing Winds. |
| °Fahr. | °Fahr. | °Fahr. | °Fahr. | °Fahr. | No. | Inches. | ||||
| Nelson (lat. 41° 16′ 17′ S.; long. 173° 18′ 46′ E.; alt. 34 ft.)— | January | 85.0 | 48.0 | 77.4 | 56.1 | 66.8 | 7 | 1.03 | .. | N. |
| February | 83.0 | 45.0 | 76.3 | 56.8 | 66.5 | 8 | 2.88 | .. | N. | |
| March | 79.0 | 47.0 | 72.6 | 53.3 | 62.9 | 7 | 1.71 | .. | SW, SE. | |
| April | 75.0 | 35.0 | 65.9 | 48.5 | 57.2 | 17 | 4.86 | .. | SW, S. | |
| May | 65.0 | 32.0 | 59.0 | 41.4 | 50.2 | 9 | 3.43 | .. | S. | |
| June | 63.0 | 30.0 | 55.1 | 37.6 | 46.3 | 8 | 2.94 | .. | S. | |
| July | 58.0 | 29.0 | 54.5 | 37.3 | 45.9 | 7 | 3.13 | .. | S, SE. | |
| August | 63.0 | 31.0 | 56.2 | 36.8 | 46.5 | 7 | 0.55 | .. | S. | |
| September | 68.0 | 34.0 | 60.8 | 41.2 | 51.0 | 5 | 0.36 | .. | NW, SW. | |
| October | 70.0 | 37.0 | 64.6 | 45.0 | 54.8 | 6 | 0.56 | .. | SW. | |
| November | 76.0 | 41.0 | 67.7 | 49.1 | 58.4 | 10 | 2.71 | .. | SW. | |
| December | 77.0 | 38.0 | 69.8 | 47.9 | 58.8 | 10 | 1.85 | .. | SW. | |
| Hokitika (lat. 42° 41′ 30′ S. long. 170° 49′ E.; alt. 12 ft.)— | January | 72.0 | 44.0 | 65.3 | 53.2 | 59.2 | 23 | 13.74 | 29.998 | NW, SW. |
| February | 72.0 | 44.0 | 66.5 | 52.6 | 59.6 | 9 | 5.97 | 29.941 | SW, W. | |
| March | 76.0 | 43.5 | 66.0 | 51.8 | 58.9 | 10 | 3.30 | 30.069 | E. | |
| April | 69.5 | 32.5 | 61.0 | 46.5 | 53.8 | 23 | 11.65 | 29.871 | E. | |
| May | 59.0 | 31.0 | 56.0 | 38.2 | 47.1 | 13 | 9.81 | 29.971 | E. | |
| June | 58.0 | 29.0 | 51.9 | 35.5 | 43.7 | 18 | 5.75 | 29.965 | E. | |
| July | 57.0 | 30.5 | 52.2 | 39.1 | 45.6 | 21 | 7.98 | 29.950 | E. | |
| August | 60.0 | 30.0 | 53.1 | 37.3 | 45.2 | 16 | 6.00 | 30.080 | E. | |
| September | 63.5 | 31.5 | 55.6 | 40.6 | 48.1 | 15 | 7.64 | 30.178 | E, SE. | |
| October | 61.5 | 32.0 | 57.0 | 43.9 | 50.4 | 21 | 6.59 | 30.116 | SW, W. | |
| November | 61.5 | 37.0 | 57.1 | 46.6 | 51.9 | 24 | 19.16 | 29.916 | SW, NW. | |
| December | 64.5 | 38.0 | 58.4 | 45.5 | 51.9 | 21 | 14.73 | 29.873 | SW. | |
| Christchurch (lat. 43° 31′ 50′ S.; long. 172° 30′ 09′ E.; alt. 25 ft.)— | January | 88.8 | 44.8 | 75.6 | 54.4 | 65.0 | 10 | 1.36 | 29.858 | NE. |
| February | 87.5 | 37.5 | 69.7 | 52.7 | 61.2 | 5 | 1.03 | 29.908 | SW, NE. | |
| March | 77.0 | 36.8 | 66.5 | 49.5 | 58.0 | 9 | 1.01 | 30.069 | NE, SW. | |
| April | 79.0 | 28.1 | 63.6 | 45.9 | 54.7 | 13 | 2.50 | 29.832 | SW, NE. | |
| May | 66.8 | 26.4 | 53.7 | 36.7 | 45.2 | 16 | 3.85 | 30.034 | SW. | |
| June | 62.4 | 27.5 | 51.3 | 33.7 | 42.5 | 16 | 2.74 | 29.904 | SW, NE. | |
| July | 59.0 | 25.3 | 50.9 | 33.0 | 42.0 | 12 | 0.51 | 29.901 | SW. | |
| August | 63.7 | 27.3 | 53.3 | 33.9 | 43.6 | 12 | 0.82 | 30.024 | SW, NE. | |
| September | 66.5 | 28.2 | 59.0 | 37.5 | 48.2 | 5 | 0.65 | 30.043 | NE, SW. | |
| October | 87.8 | 28.3 | 65.2 | 41.6 | 53.4 | 5 | 1.02 | 29.977 | NE. | |
| November | 81.6 | 35.0 | 65.6 | 45.1 | 55.4 | 11 | 2.07 | 29.787 | SW. | |
| December | 78.3 | 34.2 | 68.4 | 45.7 | 57.0 | 10 | 2.34 | 29.720 | NE. | |
| Lincoln (lat. 43° 32′ 16′ S.; long. 172° 38′ 39′ E.; alt. 42 ft.)— | January | 91.6 | 43.4 | 77.6 | 54.3 | 65.9 | 8 | 2.06 | 29.844 | NE. |
| February | 88.8 | 40.6 | 72.1 | 53.3 | 62.7 | 6 | 1.38 | 29.919 | SW, NE. | |
| March | 81.1 | 37.7 | 69.4 | 50.2 | 59.8 | 12 | 1.55 | 30.081 | NE, SW. | |
| April | 79.0 | 31.6 | 64.5 | 46.8 | 55.7 | 14 | 2.54 | 29.832 | NE, SW. | |
| May | 67.0 | 27.7 | 54.2 | 38.2 | 46.2 | 14 | 4.31 | 30.027 | SW. | |
| June | 61.3 | 28.3 | 51.9 | 36.3 | 44.1 | 14 | 1.95 | 29.919 | NE, SW. | |
| July | 62.2 | 27.8 | 51.7 | 34.4 | 43.0 | 7 | 0.52 | 29.926 | NE, SW. | |
| August | 63.8 | 28.5 | 55.2 | 35.5 | 45.4 | 7 | 0.54 | 30.051 | NE, SW. | |
| September | 69.9 | 30.4 | 60.3 | 39.9 | 50.1 | 5 | 0.63 | 30.061 | NE, SW. | |
| October | 87.2 | 30.6 | 67.7 | 43.0 | 55.3 | 8 | 1.37 | 29.968 | NE, NW. | |
| November | 81.8 | 36.6 | 67.8 | 46.1 | 56.9 | 12 | 1.98 | 29.805 | NE, SW. | |
| December | 80.1 | 35.0 | 6.8 | 46.4 | 58.1 | 13 | 2.12 | 29.716 | SW, NE. | |
| Dunedin (lat. 43° 52′ S.; long. 170° 31′ E.; alt 300 ft.)— | January | 80.0 | 41.0 | 69.4 | 52.3 | 60.9 | 16 | 3.68 | 29.812 | SW, NE. |
| February | 81.0 | 40.0 | 65.5 | 50.0 | 57.7 | 9 | 3.20 | 29.874 | SW. | |
| March | 74.0 | 42.0 | 64.1 | 49.7 | 56.9 | 8 | 1.79 | 30.024 | SW, NE. | |
| April | 71.0 | 37.0 | 58.9 | 45.5 | 52.2 | 14 | 3.46 | 29.777 | SW, NE. | |
| May | 64.0 | 32.0 | 52.5 | 38.0 | 45.2 | 12 | 2.63 | 29.959 | N, SW. | |
| June | 61.0 | 33.0 | 49.8 | 38.7 | 44.2 | 15 | 2.78 | 29.852 | SW. | |
| July | 68.0 | 30.0 | 49.4 | 38.2 | 43.8 | 15 | 2.13 | 29.861 | SW, N. | |
| August | 68.0 | 29.0 | 53.0 | 38.5 | 45.8 | 8 | 0.74 | 29.972 | N, W. | |
| September | 74.0 | 32.0 | 58.3 | 40.9 | 49.6 | 17 | 1.69 | 30.004 | SW. | |
| October | 83.0 | 33.0 | 62.4 | 42.8 | 52.6 | 9 | 1.81 | 29.914 | SW. | |
| November | 78.0 | 36.0 | 60.3 | 43.8 | 52.0 | 17 | 3.48 | 29.747 | SW. | |
| December | 79.0 | 38.0 | 62.0 | 45.2 | 53.6 | 15 | 3.92 | 29.665 | SW. | |
| Comparative Table: Year 1914. | |||||||||
|---|---|---|---|---|---|---|---|---|---|
| Temperature in Shade. | Rainfall. | ||||||||
| Stations. | Highest, and Date. | Lowest, and Date. | Mean Max. Temp. for Year. | Mean Min Temp. for Year. | Mean Temp. for Year. | Days on which Rain fell. | Total Fall. | Mean Height of Barometer | Prevailing Winds. |
| °Fahr. | °Fahr. | °Fahr. | °Fahr. | °Fahr. | No. | Inches. | |||
| Auckland | 79.5 Jan. 15 | 36.5 July 18 | 63.9 | 51.6 | 57.7 | 177 | 28.42 | .. | SW, W. |
| Rotorua | 83.0 Jan. 19 | 24.0 July 18 | 63.4 | 43.8 | 53.6 | 105 | 29.70 | .. | SW, W. |
| Gisborne | 91.0 Jan. 13 | 25.0 July 6 | 67.5 | 46.6 | 57.0 | 123 | 38.71 | 29.992 | W, S. |
| Greenmeadows (Napier) | 92.5 Jan. 13 | 30.0 July 6, 18 | 67.0 | 48.2 | 57.6 | 63 | 22.13 | 29.992 | W, SW. |
| Wellington | 79.6 Jan. 30 | 31.2 July 5 | 61.1 | 49.5 | 55.3 | 156 | 31.90 | 29.992 | N, S. |
| Nelson | 85.0 Jan. 19 | 29.0 July 18, 26 | 65.0 | 45.9 | 55.4 | 101 | 26.01 | .. | S, SW. |
| Hokitika | 76.0 March 29 | 29.0 June 21 | 58.3 | 44.2 | 51.2 | 214 | 112.32 | 29.994 | E, SW. |
| Christchurch | 88.8 Jan. 2 | 25.3 July 18 | 61.9 | 42.5 | 52.2 | 124 | 19.90 | 29.921 | NE, SW. |
| Lincoln | 91.6 Jan. 13 | 27.7 May 11 | 63.5 | 43.7 | 53.6 | 120 | 20.95 | 29.929 | NE, SW. |
| Dunedin | 81.0 Feb. 23 | 29.0 Aug. 13 | 58.8 | 43.6 | 51.2 | 155 | 31.31 | 29.872 | SW, NE. |
Table of Contents
THE estimated population of the Dominion on the 31st December, 1914, was 1,095,994 persons, an increase of 11,332 during the year. The total shown does not include Maoris or residents of the Cook and other Pacific islands annexed in 1901. The Maori population at the census of 1911 was found to be 49,844, while the annexed islands had at the same date a population of 12,598, of which number only 232 were classified as Europeans or as half-castes living as Europeans.
The details of the population as estimated at the 31st December, 1914, are as follows:—
| Males. | Females. | Totals. | |
|---|---|---|---|
| Population, excluding Maoris and residents of islands annexed in 1901 | 568,161 | 527,833 | 1,095,994 |
| Maori population (census 1911) | 26,475 | 23,369 | 49,844 |
| Population of annexed islands (census, 1911) | 6,449 | 6,149 | 12,598 |
| Totals | 601,085 | 557,351 | 1,158,436 |
It has hitherto been impossible to prepare intercensal estimates in regard to the Maori population or of the population of the Cook and other Pacific islands, on account of the fact that registration of births and deaths of Maoris has only recently come into operation, and so far there is no provision for the registration of births and deaths in the annexed islands.
The Cook Islands are not included in any of the statistics of New Zealand quoted throughout this book. Figures re Maoris are included in the general details in a few cases—i.e., imports and exports, savings-bank deposits, &c.—but in other cases are either not taken into account or are shown separately. In cases where Maoris are included they swell totals to a much less extent per head than the European population. The figures given below therefore do not include Maoris and residents of Cook Islands, information concerning whom is given at the end of this section.
The estimated population, excluding Maoris, &c., at the end of each of the past ten years, and the numerical and centesimal increase during each year, are given in the following table. The mean population for each of the ten years is also shown.
| Estimated Population at End of Year. | Increase during Year. | |||||
|---|---|---|---|---|---|---|
| Year. | Males. | Females. | Totals. | Numerical. | Per Cent. | Mean Population for Year. |
| 1905 | 467,366 | 415,096 | 882,462 | 24,923 | 2.91 | 870,000 |
| 1906 | 481,651 | 427,075 | 908,726 | 26,264 | 2.98 | 895,594 |
| 1907 | 492,649 | 436,835 | 929,484 | 20,758 | 2.28 | 919,105 |
| 1908 | 510,329 | 450,313 | 960,642 | 31,158 | 3.35 | 945,063 |
| 1909 | 520,406 | 462,520 | 982,926 | 22,284 | 2.32 | 971,784 |
| 1910 | 529,998 | 474,388 | 1,004,386 | 21,460 | 2.18 | 992,802 |
| 1911 | 539,729 | 485,677 | 1,025,406 | 21,020 | 2.09 | 1,014,896 |
| 1912 | 553,212 | 499,415 | 1,052,627 | 27,221 | 2.65 | 1,039,016 |
| 1913 | 569,109 | 515,553 | 1,084,662 | 32,035 | 3.04 | 1,068,644 |
| 1914 | 568,161 | 527,833 | 1,095,994 | 11,332 | 1.04 | 1,090,328 |
The smallness of the increase in 1914 is due in great part to the war. There was little immigration during the latter part of the year, while the emigration figures were swelled by the departure of troops for the front. Figures of emigration quoted later on in this section do not include members of Expeditionary Forces.
The increase of population at successive census periods has been,—
| Date of Enumeration. | Population. | Numerical Increase. | Centesimal Increase. |
|---|---|---|---|
| December, 1858 | 59,413 | 39,608 | 66.67 |
| ” 1861 | 99,021 | 73,137 | 73.86 |
| ” 1864 | 172,158 | 46,510 | 27.01 |
| ” 1867 | 218,668 | 37,725 | 17.25 |
| February, 1871 | 256,393 | 43,121 | 16.82 |
| March, 1874 | 299,514 | 114,898 | 38.36 |
| ” 1878 | 414,412 | 75,521 | 18.22 |
| April, 1881 | 489,933 | 88,549 | 18.07 |
| March, 1886 | 578,482 | 48,176 | 8.33 |
| April, 1891 | 626,658 | 76,702 | 12.24 |
| ” 1896 | 703,360 | 69,359 | 9.86 |
| March, 1901 | 772,719 | 115,859 | 14.99 |
| April, 1906 | 888,578 | 119,890 | 13.49 |
| ” 1911 | 1,008,468 |
Intercensal estimates of population are made from the records of births and deaths and the returns of migration. These estimates, especially of late years, are found to be remarkably near the truth, as will be seen from the following table, showing the estimated population as at 31st March in each of the last seven census years compared with the population as ascertained by the census in the same years:—
| Year. | Estimated Population, 31st March. | Census Population. | Difference. |
|---|---|---|---|
| 1881 | 488,649 | 489,933 | 1,284 |
| 1886 | 585,844 | 578,482 | 7,362 |
| 1891 | 631,898 | 626,658 | 5,240 |
| 1896 | 701,383 | 703,360 | 1,977 |
| 1901 | 775,123 | 772,719 | 2,404 |
| 1906 | 889,971 | 888,578 | 1,393 |
| 1911 | 1,006,761 | 1,008,468 | 1,707 |
The population of New Zealand has shown a continuous though not a regular increase in each year since 1855, the first year in which accurate records of births and deaths were obtained, and used in conjunction with the returns of immigration and emigration. The greatest increase in any year was in 1874, when 32,118 assisted immigrants were brought into the country in accordance with the immigration and public-works policy of the Government. The next greatest increase of population was in 1863, following the discovery of gold in Otago. The accompanying diagram shows the fluctuations in the yearly increase of population (male, female, and total). The diagram represents numerical increase, and not the percentage of the increase on the population at the end of the preceding year.
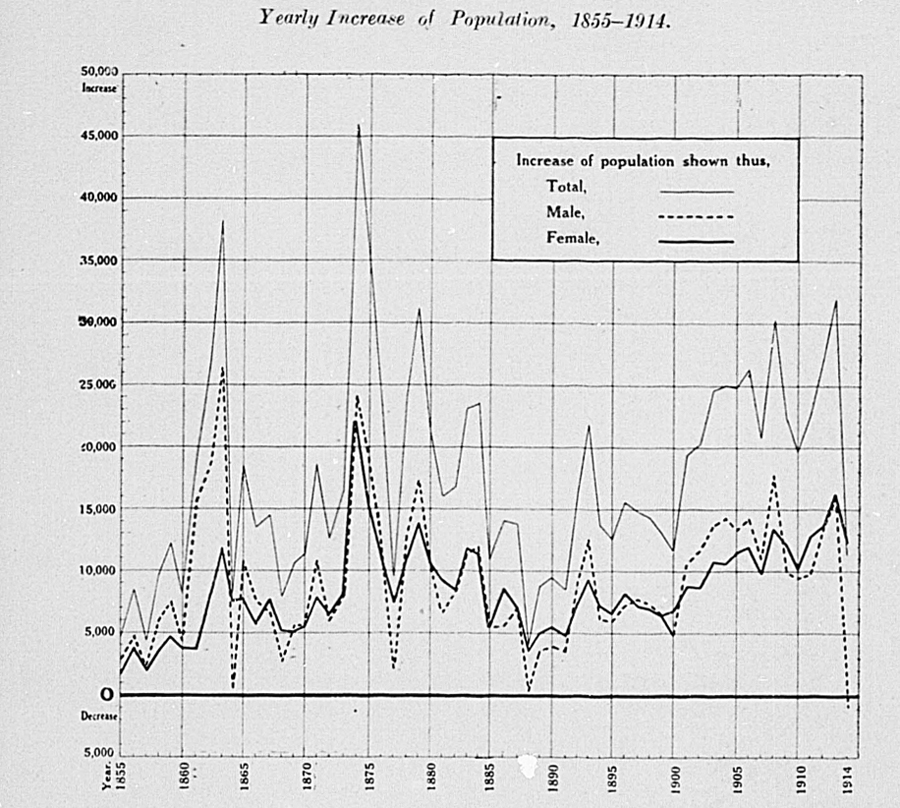
It will be noticed that there is a much greater fluctuation in the male increases than in the female. In the earlier years of the period the increase of population was much greater among males than among females. In 1863 especially is this noticeable. For later years, however, the curves for the two sexes run largely very close together, with the male and female elements preponderating in alternate series of years. The increase of female population has been greater than that of males in each year since and including 1909. The year 1914, referred to above, is the first occasion on which there has been an actual decrease of male population, though in 1864 and again in 1888 the increase of males was less than 1,000, due in each case to an excess of emigration over immigration. The annual increase of female population has never fallen below 3,000 in any year since 1860.
An examination of the increase for each quarter of the past ten years discloses a considerable amount of irregularity, due to fluctuations in migration.
| Increase of Population during each Quarter, 1905–14. | |||||
|---|---|---|---|---|---|
| Year. | First Quarter. | Second Quarter. | Third Quarter. | Fourth Quarter. | Total Increase. |
| 1905 | 7,434 | 2,395 | 5,518 | 9,576 | 24,923 |
| 1906 | 7,509 | 3,809 | 5,797 | 11,646 | 28,761 |
| 1907 | 5,141 | 720 | 4,595 | 10,302 | 20,758 |
| 1908 | 8,105 | 3,232 | 6,965 | 12,856 | 31,158 |
| 1909 | 7,690 | 1,034 | 4,025 | 9,535 | 22,284 |
| 1910 | 4,555 | 792 | 4,084 | 10,322 | 19,753 |
| 1911 | 4,082 | 1,024 | 4,769 | 11,145 | 21,020 |
| 1912 | 6,094 | 2,936 | 5,841 | 12,350 | 27,221 |
| 1913 | 9,118 | 3,969 | 7,779 | 11,169 | 32,035 |
| 1914 | 5,162 | 1,329 | 4,700 | 141 | 11,332 |
The natural increase of population is shown in the following table:—
| Natural Increase of Population, 1905–14. | ||||
|---|---|---|---|---|
| Excess of Births over Deaths. | ||||
| Year | Males. | Females. | Persons. | Natural Increase per 1,000 of Mean Population. |
| 1905 | 7,420 | 8,201 | 15,621 | 17.95 |
| 1906 | 7,462 | 8,451 | 15,913 | 17.77 |
| 1907 | 7,080 | 7,948 | 15,028 | 16.35 |
| 1908 | 8,045 | 8,852 | 16,897 | 17.88 |
| 1909 | 8,256 | 9,309 | 17,565 | 18.07 |
| 1910 | 7,838 | 8,507 | 16,345 | 16.46 |
| 1911 | 7,937 | 8,883 | 16,820 | 16.58 |
| 1912 | 8,622 | 9,672 | 18,294 | 17.61 |
| 1913 | 8,566 | 9,250 | 17,816 | 16.67 |
| 1914 | 8,549 | 9,641 | 18,190 | 16.68 |
The average rate of natural increase for the above period was 17.20 per 1,000.
Fuller discussion of natural increase, with an illustrative diagram, will be found in the Vital Statistics Section of this hook.
The number of persons arriving in and departing from New Zealand is compiled from the records of the Customs Department, and the departures from the Dominion are checked by special returns furnished by the pursers of passenger-steamers, so that where persons who did not book their passages have been omitted, the necessary additions can be made. The pursers' returns also serve to prevent the occasional omission of the full number of persons leaving by any one vessel, which sometimes happened prior to the introduction of this check. Unless more passengers are at any time of great pressure taken away from New Zealand than can lawfully be carried, the returns of outgo of population should prove nearly correct.
The total number of arrivals and departures during the past ten years, distinguishing the sexes and the number of those under or over twelve years of age, is given in the table following. Departures in 1914, as stated above, do not include members of Expeditionary Forces.
| Arrivals and Departures, 1905–14. | |||||
|---|---|---|---|---|---|
| Over 12 Years of Age. | Under 12 Years of Age. | ||||
| Year. | Males. | Females. | Males. | Females. | Total. |
| ARRIVALS. | |||||
| 1905 | 19,541 | 9,606 | 1,803 | 1,735 | 32,685 |
| 1906 | 23,374 | 11,651 | 2,233 | 1,975 | 39,233 |
| 1907 | 21,266 | 11,080 | 1,962 | 1,800 | 36,108 |
| 1908 | 26,664 | 13,269 | 2,678 | 2,359 | 44,970 |
| 1909 | 21,763 | 12,480 | 2,302 | 2,105 | 38,650 |
| 1910 | 20,161 | 11,832 | 1,974 | 1,802 | 35,769 |
| 1911 | 22,881 | 13,953 | 2,452 | 2,103 | 41,389 |
| 1912 | 24,026 | 15,442 | 2,749 | 2,443 | 44,660 |
| 1913 | 22,872 | 15,801 | 3,019 | 2,896 | 44,588 |
| 1914 | 20,360 | 13,020 | 2,166 | 2,100 | 37,646 |
| DEPARTURES. | |||||
| 1905 | 14,468 | 7,164 | 922 | 829 | 23,383 |
| 1906 | 16,023 | 8,082 | 1,188 | 1,092 | 26,385 |
| 1907 | 17,968 | 9,823 | 1,342 | 1,245 | 30,378 |
| 1908 | 18,364 | 9,779 | 1,343 | 1,223 | 30,709 |
| 1909 | 20,772 | 10,373 | 1,472 | 1,314 | 33,931 |
| 1910 | 19,032 | 10,629 | 1,419 | 1,281 | 32,361 |
| 1911 | 21,730 | 12,190 | 1,809 | 1,460 | 37,189 |
| 1912 | 20,151 | 12,278 | 1,763 | 1,541 | 35,733 |
| 1913 | 17,188 | 10,518 | 1,372 | 1,291 | 30,369 |
| 1914 | 18,460 | 11,227 | 1,565 | 1,254 | 32,506 |
In the next table are shown the quarterly increases or decreases of population by migration during the last ten years. The second quarter of each of the ten years shows an excess of departures over arrivals, due to the fact that visitors to New Zealand usually take their departure just before the winter season. Autumn is, moreover, the favourite season for residents of the Dominion to commence a journey abroad for pleasure, the return being usually made in spring or summer.
| Year. | First Quarter. | Second Quarter. | Third Quarter. | Fourth Quarter. | Net Increase |
|---|---|---|---|---|---|
*Expeditionary Forces taken into account. The minus sign (–) denotes decrease. | |||||
| 1905 | 3,448 | – 1,384 | 1,705 | 5,533 | 9,302 |
| 1906 | 3,426 | – 190 | 1,897 | 7,715 | 12,848 |
| 1907 | 1,513 | – 3,106 | 1,092 | 6,231 | 5,730 |
| 1908 | 3,548 | – 715 | 3,117 | 8,311 | 14,261 |
| 1909 | 3,435 | – 3,517 | – 167 | 4,968 | 4,719 |
| 1910 | 577 | – 3,430 | 184 | 6,077 | 3,408 |
| 1911 | – 157 | – 3,174 | 850 | 6,681 | 4,200 |
| 1912 | 1,535 | – 1,603 | 1,423 | 7,572 | 8,927 |
| 1913 | 4,565 | – 397 | 3,492 | 6,559 | 14,219 |
| 1914 | 501 | – 3,108 | 298* | – 4,549* | – 6,858* |
Nearly two-thirds of the oversea arrivals come from Australia, while five-sixths of the departures are booked for the Commonwealth. The numbers of departures for Australian ports are, however, inflated by the inclusion of many persons who sail from New Zealand for Australia to make that country a starting-point for further travel, and who may or may not return by the same route. The real destination and original place of departure when returning are not ascertained in these cases.
| Quarterly Increase of Population by Migration, 1905–14. | |||||
|---|---|---|---|---|---|
| Countries. | 1910. | 1911. | 1912. | 1913. | 1914. |
| ARRIVALS. | |||||
| United Kingdom | 9,367 | 11,379 | 12,912 | 14,707 | 8,579 |
| Commonwealth of Australia | 24,502 | 26,909 | 28,522 | 26,764 | 25,967 |
| Other British possessions | 932 | 1,620 | 2,072 | 1,968 | 1,915 |
| Foreign countries | 968 | 1,481 | 1,154 | 1,149 | 1,185 |
| 35,769 | 41,389 | 44,660 | 44,588 | 37,646 | |
| DEPARTURES. | |||||
| United Kingdom | 2,509 | 2,755 | 2,605 | 2,649 | 2,574 |
| Commonwealth of Australia | 27,100 | 30,918 | 30,141 | 24,961 | 26,693 |
| Other British possessions | 1,396 | 1,540 | 1,426 | 1,496 | 1,810 |
| Foreign countries | 1,356 | 1,976 | 1,561 | 1,263 | 1,429 |
| 32,361 | 37,189 | 35,733 | 30,369 | 32,506 | |
Residents in the Dominion may, by application on the proper form, secure a passage at assisted rates for any person residing in the United Kingdom who is a near relative by blood or marriage to the person making such application.
Applications for assisted passages are also received from residents of the Dominion nominating domestic servants, farmers, or farm labourers, irrespective of the relationship existing between the domestic or agriculturist and the person making such application.
The payments required are—second class, £27; third class (two-berth cabin), £12; third class (four-berth cabin), £10. The passage-money, which must be paid in full before passages are booked, can be paid to the Immigration Department in Wellington or to the High Commissioner for New Zealand in London. The Department will cable any nomination, together with a remittance, if so desired, for the extra charge of £1.
Domestic servants and farm labourers granted assisted passages as such are required to follow in New Zealand their respective occupations of domestic and farm work for a period of one year after their arrival in the Dominion. If it is found that some occupation other than domestic or farm work is entered into by any such assisted immigrant before the expiration of one year after arrival in New Zealand, the nominator will be called upon to pay the Government the difference between the assisted rate and the full fare.
Children between three and twelve years of age travelling with their parents are charged half-rates. One child under three years of age in each family is taken free. A quarter-fare is charged for each additional child under three years of age.
Passages are granted on vessels belonging to the Shaw, Savill, and Albion Company, the New Zealand Shipping Company, and the Federal Steam Navigation Company.
Unhealthy persons should not be nominated, as passages at reduced rates will not be granted to them. When cases of lung, chest, or other like complaints are discovered in any member of a family by the Medical Officer at London or Liverpool, the whole family will be prevented from sailing.
Questions as to the suitability of any person nominated for a reduced passage are decided by the High Commissioner.
The foregoing applies to persons of not more than fifty years of age in the case of nominated persons and farmers or farm labourers, and not more than thirty-five years of age in the case of domestic servants.
In the case of immigrants under twenty-one years of age, special arrangements have to be entered into for their protection on the voyage where deemed necessary or advisable.
The High Commissioner is authorized to grant to suitable and healthy farmers, farm labourers, and domestic servants, who apply to him in London, a passage to New Zealand at the following rates:—
| Farmers and Farm Labourers. | Domestic Servants. | |||||
|---|---|---|---|---|---|---|
| £ | s. | d. | £ | s. | d. | |
| Third class: 6-berth cabin | 8 | 0 | 0 | 2 | 16 | 0 |
| ” 4-berth cabin | 10 | 0 | 0 | 4 | 16 | 0 |
| ” 2-berth cabin | 12 | 0 | 0 | 6 | 16 | 0 |
These sums, together with landing-money, to be fixed at what the High Commissioner considers requisite, can be paid in part or in full before embarkation, or they can be, where the High Commissioner so decides, wholly advanced by him in London, provided the immigrant undertakes to repay cut of future earnings the sum so advanced.
The same authority extends for sanction being given to parties of boy immigrants to come to New Zealand, under the conditions that an officer of the Immigration Department be appointed guardian of each boy until his majority, and that each boy undertake to engage in farm work for a fixed number of years. During this time he must be kept by the farmer employing him in proper clothes, food, nourishment, and lodgings, and, in addition, be paid a weekly wage of not less than 7s. 6d., increasing each year, part of such wage to be given him for his pocket-money and part banked to repay the cost of his passage. When the amount of his passage-money has been repaid, then the whole of his wages are paid to him.
The total number of persons embarking from England for New Zealand at assisted rates during each of the last ten years, the total capital possessed by these, and the net expenditure by the Government on immigration, are shown below.
| Year ended 31st March. | Immigrants Assisted. | Capital possessed by Assisted Immigrants. £ | Net Government Expenditure on Immigration. £ |
|---|---|---|---|
| 1906 | 2,469 | 110,204 | 8,753 |
| 1907 | 3,712 | 114,689 | 14,352 |
| 1908 | 3,104 | 70,056 | 9,131 |
| 1909 | 4,953 | 96,055 | 15,077 |
| 1910 | 2,672 | 34,688 | 17,002 |
| 1911 | 2,624 | 37,735 | 9,441 |
| 1912 | 3,300 | 24,088 | 11,681 |
| 1913 | 3,928 | 32,006 | 14,694 |
| 1914 | 5,064 | 39,701 | 33,914 |
| 1915 | 2,986 | 16,313 | 33,220 |
Under the immigration policy of years prior to the above the following persons were assisted:—
| Year. | Immigrants. |
|---|---|
| 1871 | 303 |
| 1872 | 4,736 |
| 1873 | 8,754 |
| 1874 | 32,118 |
| 1875 | 20,370 |
| 1876 | 9,677 |
| 1877 | 5,344 |
| 1878 | 6,618 |
| 1879 | 10,311 |
| 1880 | 2,689 |
| 1881 | 103 |
| 1882 | 726 |
| 1883 | 5,902 |
| 1884 | 3,888 |
| 1885 | 1,072 |
| 1886 | 917 |
| 1887 | 1,286 |
| 1888 | 485 |
| 1889 | 91 |
| 1890 | 144 |
| 1891 | 44 |
| 1904 | 1,058 |
| 1905 | 1,751 |
Free passages were granted in the majority of these cases up to 1884. The system of nomination of friends for reduced passages was in vogue up to 1890, but was discontinued on the 16th December of that year, forty-four persons previously nominated arriving, however, in 1891.
During the years 1892 to 1903, inclusive, no assisted passages to immigrants were granted.
On arrival in New Zealand the immigrants are met on board by officers of the Immigration Department, who accompany the Port Health Officer to the ship. Whilst the ship is in the stream it is the special duty of such officers to afford to the assisted immigrants all necessary information as regards transhipment, &c. Arrangements are made for safety and transhipment of luggage.
Each immigrant is seen as he passes towards the doctor for examination, and is handed an official letter containing information as to where his ticket will be arranged for, and the place and time of departure of his connecting train or boat (if any). The immigrant is also requested to see the Immigration Officer on board, or to come to the office, which is near the wharf in Wellington (Union Steamship Company's building), if he requires information or advice beyond what is given in the letter. The addresses of the district agencies of the Labour Department in the large centres of the Dominion are also supplied to male assisted immigrants. It is the practice of the Department to send out advices, by wire if necessary, to friends and relatives of immigrants about to arrive, and to get back information as to where the new-comers will be met. These messages, often together with private letters, &c., are given out on board to those to whom they are addressed. Information of this nature is much appreciated, especially by wives joining their husbands.
Assisted immigrants requiring work are referred to the office of the Immigration Department, and their cases are there dealt with.
As regards the female assisted domestic workers, who are chosen after application at Home to the High Commissioner, and who are sent to New Zealand under the supervision of one or more responsible matrons, the following applies:—
The Government advertises the fact that the books of the Department are open to record the names of those people in the Dominion desirous of securing the services of an assisted girl. Such advertisements bring into the office many applications, especially pending the arrival of a ship.
Each matron in charge on board is instructed by communications awaiting her at Hobart to classify the girls under two heads: (a) those with work already arranged or friends to go to; (b) those without either friends or work. On arrival they are met by the Girls' Superintendent of the Immigration Department. Arrangements are made for sending to their destinations those girls who are going to friends or to definite positions. Those requiring accommodation are directed to homes or hostels approved by the Minister of Immigration for this purpose. The Superintendent then separately considers the case of each girl, and arranges to place her with an applicant for a Government assisted girl. In placing these girls at present, considerable reliance has necessarily to be placed on the statements made by them. The Department is, however, taking steps to get full and independent details of the work that the girl was actually engaged in before she left the Mother-country. After a girl has been placed, the Department endeavours to keep in touch with her by correspondence.
The Immigration Restriction Act prohibits the landing of lunatics or idiots, persons suffering from a dangerous or loathsome contagious disease, certain convicted criminals, and any person other than of British birth who fails to write out and sign, in any European language, a prescribed form of application. Shipwrecked persons are excepted. The Act does not apply to officers and crews of any mercantile vessels, provided they are not discharged in New Zealand, and are on board the vessel when she clears outward. There are other exemptions under the Act, including His Majesty's land and sea forces, and the officers and crew of any ship of war of any Government, and certain persons may be specially exempted by the Minister of Internal Affairs. Heavy penalties may be incurred for breaches of this law. Regulations under the Act were published in the New Zealand Gazette of the 26th November, 1908.
The law of the Commonwealth of Australia, with a view to the restriction of Asiatic immigration, prohibits the landing of any person who, when asked to do so by a public officer, fails to write out from dictation and sign a passage of fifty words in any prescribed language. An Act, having a similar purpose, was passed by the Parliament of New Zealand in 1907, requiring that any Chinese proposing to land in the Dominion shall be able to read a printed passage of not less than one hundred words of the English language. This measure became law on the 23rd October, 1908, and is now incorporated in the Immigration Restriction Act, 1908.
Persons of other than European descent are classified in the immigration returns as “race aliens.” Immigrants of this class have since 1908 been required to pass an education test before admission to the Dominion. In spite of this fact, there appears to be an increase in alien immigration, as the table following will show.
| Year. | ||||||||||
|---|---|---|---|---|---|---|---|---|---|---|
| Birthplace. | 1905. | 1906. | 1907. | 1908. | 1909. | 1910. | 1911. | 1912. | 1913. | 1914. |
| British Possessions— | ||||||||||
| India | 34 | 45 | 20 | 24 | 157 | 80 | 190 | 325 | 133 | 257 |
| Pacific Islands | 30 | 73 | 1 | 11 | 22 | 9 | 24 | 51 | 48 | 8 |
| Other | 1 | 7 | .. | 31 | 30 | 43 | 1 | 4 | 34 | 7 |
| Total, British Possessions | 65 | 125 | 21 | 66 | 209 | 132 | 215 | 380 | 215 | 272 |
| Foreign Countries— | ||||||||||
| China | 239 | 260 | 255 | 538 | 171 | 209 | 546 | 348 | 325 | 511 |
| Syria | 6 | 30 | 3 | 32 | 23 | 12 | 9 | 20 | 19 | 9 |
| Asia Minor | 5 | .. | 4 | 6 | 12 | 4 | 4 | 8 | 2 | .. |
| Japan | 1 | 10 | 3 | 3 | 7 | 1 | 4 | 9 | 17 | 13 |
| Pacific Islands | 24 | 28 | 27 | 10 | 18 | 7 | 25 | 24 | 4 | 6 |
| Other | 1 | 1 | 1 | .. | 2 | 2 | 1 | 14 | 7 | 12 |
| Total, foreign countries | 276 | 329 | 293 | 589 | 233 | 235 | 589 | 423 | 374 | 551 |
| Total, “Race Aliens” | 341 | 454 | 314 | 655 | 442 | 367 | 804 | 803 | 589 | 823 |
Of the race aliens arriving in New Zealand, a large proportion are Chinese, most of whom, however, have been formerly resident in the Dominion. Hindus and other natives of India are also of late years arriving in considerable numbers, the total of these for the past five years being 985 as against 280 during the preceding quinquennium.
Since July, 1914, records of departures of race aliens have been kept, and these show that a total of 156 race aliens left the Dominion during the latter half of the year, comprising 79 Chinese, 74 Natives of India, 2 Japanese, and 1 South American. These figures would seem to indicate that a large proportion of the Hindus arriving in the Dominion are coolies in transit to the Pacific islands. The total Chinese departures for the year were 537.
At the census of 1881, the year in which taxation was first imposed on Chinese landing in New Zealand, the Chinese population numbered 5,004 persons, which fell to 4,542 in 1884, and further to 3,711 in 1896. During the period 1881–96 the poll-tax was £10 per head, and this seemed sufficient for the purpose of preventing a large influx of the Chinese. During the years 1894 and 1895, however, the arrivals shown by the Customs returns were found to be somewhat greater than the departures, and in 1896 an Act was passed, raising the poll-tax on Chinese immigrants to £100 per head and limiting the number of Chinese passengers that may be carried by vessels to New Zealand to one for every 200 tons burthen. According to the census of 1901 the Chinese population was 2,857, and in 1906 it was 2,570, while at the census of 1911 the total was 2,630, of whom 88 were females. The decrease still continues, deaths exceeding births and the departures being more than the arrivals. Since the census of 1911, excess of deaths over births has reduced the Chinese by 72, while excess of departures over arrivals has caused a further reduction of 92. The estimated Chinese population of the Dominion on the 31st December, 1914, was 2,466, of whom, however, 117 were females, an increase of 29 of that sex since the census.
When any alien residing in New Zealand desires to be naturalized, he may present to the Governor a memorial signed and verified by a statutory declaration setting forth—
His name, age, birthplace, residence, and occupation:
The length of his residence in New Zealand, and his desire to settle therein;
A request that letters of naturalization may be granted to him.
Every memorial must have written upon it or attached to it a certificate signed by some Magistrate or Justice to the effect that the applicant is known to the person certifying and is of good repute. On taking the oath of allegiance he shall enjoy within New Zealand all the rights and capacities that a natural-born subject of the United Kingdom can enjoy or transmit, excepting such rights (if any) as are specially excepted in the letters of naturalization granted to him.
Any person who has been previously naturalized in the United Kingdom, or any British possession, may obtain letters of naturalization in New Zealand upon presentation of his certificate or letters to the Governor, with satisfactory evidence of his bona fides.
An alien woman married to a natural-born or naturalized British subject shall be deemed to be herself naturalized. Where the father, or the mother, being a widow, has become naturalized in New Zealand, every child of such father or mother who during minority resides with such parent shall also be deemed to be naturalized.
Every alien resident in New Zealand may inherit or otherwise acquire, hold, and dispose of every description of property in the same manner as if he were a natural-born British subject, but may not become the owner of any ship, or of a share in any ship, registered in New Zealand. Any person born in foreign territory whose mother is a natural-born British subject shall be capable of acquiring property in New Zealand by purchase, or under a will or intestacy.
No fee is payable for naturalization except in the case of Chinese, who are charged £1.
During 1914 letters of naturalization were granted to 162 males and 3 females belonging to the nationalities shown below. No naturalizations were effected during the latter half of the year.
| Natives of— | M. | F. |
|---|---|---|
| Austria-Hungary | 95 | .. |
| Germany | 15 | 2 |
| Denmark | 9 | .. |
| Russia | 5 | .. |
| Sweden | 10 | .. |
| Switzerland | 8 | .. |
| Norway | 4 | .. |
| United States of America | 1 | .. |
| Italy | 9 | .. |
| France | 2 | .. |
| Abyssinia | 1 | .. |
| Netherlands | 1 | .. |
| Roumania | 1 | .. |
| Turkey | 1 | .. |
| Total | 162 | 3* |
| *Not including four English women and one Australian woman married to foreigners. | ||
The number of natives of each country naturalized during the last twenty years is next shown.
| Natives of— | Persons. |
|---|---|
| Austria-Hungary | 1,529 |
| Germany | 1,159 |
| Denmark | 676 |
| Sweden | 671 |
| Norway | 455 |
| Russia | 346 |
| Italy | 231 |
| Switzerland | 186 |
| France | 159 |
| Syria | 147 |
| China | 146 |
| United States of America | 144 |
| Netherlands | 61 |
| Greece | 61 |
| Portugal and Possessions | 60 |
| Belgium | 40 |
| Spain | 16 |
| Japan | 11 |
| Turkey | 11 |
| Other countries | 52 |
| Total | 6,161 |
The table following shows the birthplaces of the population, exclusive of Maoris, for five census years. The total number of British-born has increased during the period by 63 per cent., while the number of foreign-born has remained stationary. Persons born in New Zealand have increased 92 per cent. The Commonwealth of Australia is represented by 50,029 persons, a large increase since 1891. Against this there were 31,868 persons, natives of New Zealand, residing in the Commonwealth in 1911 as compared with 25,788 in 1901. Persons born in the United Kingdom numbered 218,834 in 1891 and 228,684 in 1911.
| Number in each Census Year. | |||||
|---|---|---|---|---|---|
| Birthplace. | 1891. | 1896. | 1901. | 1906. | 1911. |
| Persons. | Persons. | Persons. | Persons. | Persons. | |
| New Zealand | 366,716 | 441,661 | 516,106 | 606,247 | 702,779 |
| Commonwealth of Australia | 15,943 | 21,631 | 26,991 | 47,256 | 50,029 |
| England | 117,070 | 116,541 | 111,964 | 116,560 | 133,811 |
| Wales | 2,214 | 2,148 | 1,765 | 2,144 | 2,206 |
| Scotland | 51,916 | 50,435 | 47,858 | 47,767 | 51,709 |
| Ireland | 47,634 | 46,037 | 43,524 | 42,460 | 40,958 |
| Other British possessions | 3,703 | 3,901 | 4,273 | 4,560 | 5,234 |
| Total British | 605,196 | 682,354 | 752,481 | 866,994 | 986,726 |
| Austria-Hungary | 564 | 881 | 1,874 | 2,212 | 2,131 |
| German Empire | 4,663 | 4,595 | 4,217 | 4,174 | 4,015 |
| Denmark | 2,053 | 2,125 | 2,120 | 2,277 | 2,262 |
| Chinese Empire | 4,470 | 3,719 | 2,902 | 2,602 | 2,611 |
| Other foreign countries | 7,400 | 7,760 | 7,480 | 8,602 | 8,552 |
| Total foreign | 19,150 | 19,080 | 18,593 | 19,867 | 19,571 |
| At sea | 1,295 | 1,322 | 1,203 | 1,245 | 1,392 |
| Not stated | 1,017 | 604 | 442 | 472 | 779 |
| Totals | 626,658 | 703,360 | 772,719 | 888,578 | 1,008,468 |
The population of foreign origin shows a small increase since 1891, while the native-born portion becomes rapidly greater. The table next shows the proportionate strength of the different nationalities represented in the Dominion.
| Proportion of each Nationality in— | |||||
|---|---|---|---|---|---|
| Birthplace. | 1891. | 1896. | 1901. | 1906. | 1911. |
| Per Cent. | Per Cent. | Per Cent. | Per Cent. | Per Cent. | |
| New Zealand | 58.61 | 62.85 | 66.83 | 68.26 | 69.74 |
| Commonwealth of Australia | 2.55 | 3.08 | 3.49 | 5.32 | 4.97 |
| England | 18.71 | 16.58 | 14.50 | 13.30 | 13.28 |
| Wales | 0.35 | 0.31 | 0.22 | 0.24 | 0.22 |
| Scotland | 8.30 | 7.18 | 6.20 | 5.38 | 5.13 |
| Ireland | 7.61 | 6.55 | 5.64 | 4.78 | 4.06 |
| Other British possessions | 0.59 | 0.55 | 0.55 | 0.51 | 0.52 |
| Total British | 96.72 | 97.10 | 97.43 | 97.62 | 97.92 |
| Austria-Hungary | 0.09 | 0.13 | 0.24 | 0.25 | 0.21 |
| German Empire | 0.75 | 0.65 | 0.55 | 0.47 | 0.40 |
| Denmark | 0.33 | 0.30 | 0.27 | 0.26 | 0.22 |
| Chinese Empire | 0.71 | 0.53 | 0.38 | 0.29 | 0.26 |
| Other foreign countries | 1.19 | 1.10 | 0.97 | 0.97 | 0.85 |
| Total foreign | 3.07 | 2.71 | 2.41 | 2.24 | 1.94 |
| At sea | 0.21 | 0.19 | 0.16 | 0.14 | 0.14 |
| 100.00 | 100.00 | 100.00 | 100.00 | 100.00 | |
The number of persons at each year of age is ascertained from the census household schedules. In the following tables these numbers have been condensed in customary groups, and the information disclosed at the census of 1911 is compared with that for two previous censuses. Chinese are included, but not Maoris.
| Number. | ||||||
|---|---|---|---|---|---|---|
| Age-groups. | 1891 | 1901 | 1911 | |||
| Males. | Females. | Males. | Females. | Males. | Females | |
| Under 5 years | 42,259 | 40,945 | 44,324 | 42,482 | 59,975 | 57,934 |
| 5 years and under 10 years | 43,494 | 42,586 | 43,314 | 42,422 | 53,844 | 52,163 |
| 10 “ 15 “ | 40,755 | 40,329 | 43,100 | 42,125 | 46,421 | 44,992 |
| 15 “ 20 “ | 32,579 | 32,658 | 42,456 | 42,358 | 44,798 | 43,660 |
| 20 “ 25 “ | 28,337 | 29,805 | 41,196 | 41,960 | 49,692 | 46,124 |
| 25 “ 30 “ | 23,704 | 22,376 | 35,307 | 33,233 | 54,694 | 47,520 |
| 30 “ 35 “ | 22,021 | 17,890 | 29,694 | 27,272 | 49,410 | 42,714 |
| 35 “ 40 “ | 20,513 | 15,106 | 24,301 | 21,217 | 39,458 | 33,437 |
| 40 “ 45 “ | 17,755 | 13,436 | 21,589 | 17,347 | 31,198 | 27,259 |
| 45 “ 50 “ | 17,028 | 11,832 | 19,134 | 13,997 | 24,214 | 20,696 |
| 50 “ 55 “ | 16,770 | 9,922 | 15,413 | 11,991 | 20,290 | 16,573 |
| 55 “ 60 “ | 10,945 | 6,150 | 13,711 | 9,963 | 16,686 | 12,609 |
| 60 “ 65 “ | 7,685 | 4,468 | 12,803 | 8,017 | 12,816 | 10,225 |
| 65 “ 70 “ | 3,923 | 2,564 | 10,160 | 6,028 | 10,935 | 8,707 |
| 70 “ 75 “ | 2,504 | 1,877 | 5,348 | 3,236 | 8,691 | 6,030 |
| 75 “ 80 “ | 1,191 | 936 | 2,285 | 1,679 | 5,212 | 3,260 |
| 80 and over | 718 | 629 | 1,425 | 1,192 | 2,735 | 2,130 |
| Unspecified minors | 30 | 36 | 24 | 15 | 59 | 42 |
| ” adults | 666 | 236 | 408 | 193 | 782 | 483 |
| All ages | 332,877 | 293,781 | 405,992 | 366,727 | 531,910 | 476,558 |
A calculation of the proportion per cent. at each age-group to the total of males and females shows the effect of a declining birth-rate on the ages tinder 15, the proportion of males at these ages being 30.19 per cent. in 1911 against 38.08 per cent. in 1891, and of females 32.58 per cent. against 42.20 per cent. respectively.
Of the males, those 15.24 years formed 18.35 per cent. of the total in 1891, and 17.79 per cent. in the later year. At the ages 15.64 the proportions were 59.42 per cent. and 64.62 per cent. in 1891 and 1911 respectively. From 65 years upwards the proportions increased from 2.50 per cent. to 5.19 per cent. during the period under review.
Females at ages 15.44 increased in proportion to the total from 44.73 per cent. in 1891 to 50.56 per cent. in 1911. At 45 years and over there was 13.07 per cent. in 1891 and 16.86 per cent. in 1911 of the number of this sex.
| Proportion per Cent. of Males. | Proportion per Cent. of Females. | |||||
|---|---|---|---|---|---|---|
| Age-groups. | 1891. | 1901. | 1911 | 1891. | 1901. | 1911. |
| Per Cent. | Per Cent. | Per Cent. | Per Cent. | Per Cent. | Per Cent. | |
| Under 5 years | 12.72 | 10.93 | 11.29 | 13.95 | 11.59 | 12.16 |
| 5 years and under 10 years | 13.09 | 10.68 | 10.15 | 14.51 | 11.57 | 10.96 |
| 10 “ 15 “ | 12.27 | 10.62 | 8.75 | 13.74 | 11.49 | 9.46 |
| 15 “ 20 “ | 9.82 | 10.47 | 8.43 | 11.12 | 11.56 | 9.18 |
| 20 “ 25 “ | 8.53 | 10.16 | 9.36 | 10.16 | 11.45 | 9.68 |
| 25 “ 30 “ | 7.14 | 8.71 | 10.30 | 7.62 | 9.07 | 9.98 |
| 30 “ 35 “ | 6.63 | 7.32 | 9.30 | 6.10 | 7.44 | 8.97 |
| 35 “ 40 “ | 6.18 | 5.99 | 7.43 | 5.15 | 5.79 | 7.02 |
| 40 “ 45 “ | 5.34 | 5.32 | 5.87 | 4.58 | 4.73 | 5.73 |
| 45 “ 50 “ | 5.13 | 4.72 | 4.56 | 4.03 | 3.82 | 4.35 |
| 50 “ 55 “ | 5.05 | 3.80 | 3.82 | 3.38 | 3.27 | 3.48 |
| 55 “ 60 “ | 3.29 | 3.38 | 3.14 | 2.10 | 2.72 | 2.65 |
| 60 “ 65 “ | 2.31 | 3.16 | 2.41 | 1.52 | 2.19 | 2.15 |
| 65 “ 70 “ | 1.18 | 2.51 | 2.06 | 0.87 | 1.65 | 1.83 |
| 70 “ 75 “ | 0.75 | 1.32 | 1.64 | 0.64 | 0.88 | 1.27 |
| 75 “ 80 “ | 0.36 | 0.56 | 0.98 | 0.32 | 0.46 | 0.69 |
| 80 and over | 0.21 | 0.35 | 0.51 | 0.21 | 0.32 | 0.44 |
| 100.00 | 100.00 | 100.00 | 100.00 | 100.00 | 100.00 | |
The declining proportions at the earlier ages 0–19 years may be ascribed to a falling birth-rate, while the increase at the higher ages is due to the advanced age of the then mostly adult immigrants introduced during the early stages of settlement. These form the greater portion of the groups 60 years and over, numbering 70,741 persons in 1911, only 3,862 of these being New-Zealand-born. The latter element in the population is assuming larger proportions each year, while the influence of the numbers recruited from abroad on the age-constitution is gradually waning.
The distribution of population (exclusive of Maoris) between the North and South Islands is shown according to age-groups in the following table:—
| Island. | Under 5 | 5 and under 20 | 20 and under 35 | 35 and under 50 | 50 and under 65 | 65 and over. | Unspecified. | Totals. |
|---|---|---|---|---|---|---|---|---|
| North | 66,888 | 160,015 | 165,117 | 100,190 | 48,183 | 22,457 | 879 | 563,729 |
| South | 50,997 | 125,793 | 124,951 | 76,030 | 40,985 | 25,235 | 486 | 444,477 |
| Totals | 117,885 | 285,808 | 290,068 | 176,220 | 89,168 | 47,692 | 1,365 | 1,008,206 |
The following table is interesting as showing the gradual equalization of the sexes, the number of females to 100 males having risen from 62.16 in 1861 to 90.33 in 1901. The proportion was slightly lower in 1906 and 1911, but has risen to 92.90 in 1914.
| Census Year. | Males. | Females. | Females to 100 Males. |
|---|---|---|---|
| 1861 | 61,062 | 37,959 | 62.16 |
| 1871 | 150,356 | 106,037 | 70.52 |
| 1881 | 269,605 | 220,328 | 81.72 |
| 1891 | 332,877 | 293,781 | 88.26 |
| 1901 | 405,992 | 366,727 | 90.33 |
| 1906 | 471,008 | 417,570 | 88.65 |
| 1911 | 531,910 | 476,558 | 89.59 |
In the 1913 and 1914 issues of this book are given tables and short articles dealing with various characteristics of the population as ascertained at the census of 1911 and former censuses—viz., conjugal condition, religion, infirmity, and occupation. Lack of space prevents their being repeated in this issue.
The increase in the density of population and dwellings at successive censuses is illustrated in the table following. The average number of persons to an inhabited dwelling is also shown.
| Census Year | Number of Persons to a Square Mile.* | Number of Inhabited Dwellings to a Square Mile. | Number of Persons to an Inhabited Dwelling. |
|---|---|---|---|
| * Excluding Maoris. | |||
| 1861 | 0.944 | 0.214 | 4.42 |
| 1871 | 2.456 | 0.548 | 4.48 |
| 1881 | 4.693 | 0.917 | 5.12 |
| 1891 | 6.024 | 1.191 | 5.06 |
| 1901 | 7.427 | 1.527 | 4.86 |
| 1906 | 8.541 | 1.773 | 4.82 |
| 1911 | 9.690 | 2.070 | 4.68 |
The density of population in various countries is shown in the next table. The figures relate in nearly every case to the year 1911, in which year a census was taken throughout the British Empire, and in several other countries. The Statesman's Year-book for 1913 has been referred to in all cases, but wherever possible the information extracted therefrom has been verified by reference to official publications of the countries concerned. In several cases the figures are only rough estimates, and in some instances various estimates are in existence in respect of the same country. For example, the population of the Chinese Empire ranges in various publications from 250 to 450 millions. In the table now given the usually accepted total, 400 millions, is shown. The figures for the Balkan States relate to the various States as they now stand—i.e., after the recent alterations of boundaries.
| Density of Population in Various Countries. | ||
|---|---|---|
| Country. | Population. | |
| Total. | Per Square Mile. | |
* Inclusive of Maoris, also Cook Islands and their inhabitants. † Including aboriginals, estimated at 100,000. | ||
| Macao | 63,991 | 15,997.75 |
| Gibraltar | 25,367 | 13,529.07 |
| Monaco | 19,121 | 2,390.12 |
| Malta | 228,534 | 1,953.28 |
| Gambia Colony | 7,700 | 1,925.00 |
| French India | 282,386 | 1,440.74 |
| Singapore | 305,439 | 1,407.55 |
| Channel Islands | 96,900 | 1,384.29 |
| Hong Kong and Territory | 463,715 | 1,144.98 |
| Bermudas | 21,326 | 1,104.97 |
| Barbados | 171,982 | 1,036.04 |
| Kiau-Chau | 168,896 | 844.48 |
| England | 34,045,290 | 669.00 |
| Belgium | 7,423,784 | 652.76 |
| Java and Madura | 30,098,008 | 595.36 |
| Aden and Perim | 46,165 | 577.06 |
| Madeira | 169,777 | 540.69 |
| Mauritius | 377,083 | 523.73 |
| Wei-hai-wei | 147,177 | 516.41 |
| Grenada | 66,750 | 501.88 |
| Penang | 278,003 | 480.14 |
| Martinique | 184,004 | 477.93 |
| Netherlands | 6,022,452 | 476.16 |
| St. Pierre | 4,209 | 420.90 |
| St. Kitts | 26,283 | 404.35 |
| Kwantung | 488,089 | 388.61 |
| Bahrein Islands | 90,000 | 360.00 |
| Portuguese India | 531,798 | 324.66 |
| Italy | 34,671,377 | 313.63 |
| Germany | 64,925,993 | 310.98 |
| Porto Rico | 1,118,012 | 310.04 |
| Guadeloupe and Dependencies | 212,430 | 308.76 |
| Samos | 53,424 | 296.80 |
| Japan | 52,000,000 | 296.23 |
| San Marino | 10,791 | 283.97 |
| St. Vincent | 41,877 | 279.18 |
| Wales | 2,025,202 | 272.42 |
| Azores | 242,613 | 263.14 |
| Luxemburg | 259,891 | 260.41 |
| Nevis | 12,945 | 258.90 |
| Formosa | 3,443,679 | 255.88 |
| Austria | 28,571,934 | 246.56 |
| Switzerland | 3,741,971 | 234.22 |
| Labuan | 6,546 | 229.68 |
| Isle of Man | 52,034 | 229.22 |
| Antigua | 38,899 | 228.82 |
| British India | 244,267,542 | 222.49 |
| Ellice Islands | 3,089 | 220.64 |
| Pemba | 83,437 | 219.57 |
| St. Lucia | 48,637 | 208.74 |
| Haiti Republic | 2,029,700 | 198.91 |
| Jamaica | 831,383 | 197.95 |
| Danish West Indies | 27,086 | 196.28 |
| France | 39,601,509 | 191.26 |
| Zanzibar | 115,477 | 180.43 |
| Reunion | 173,822 | 179.20 |
| Denmark | 2,775,076 | 178.09 |
| Trinidad and Tobago | 330,074 | 176.70 |
| Montserrat | 5,562 | 173.81 |
| Turkey in Europe | 1,891,000 | 173.77 |
| Malacca | 124,081 | 172.33 |
| Balearic Islands | 325,703 | 168.32 |
| Hungary | 20,886,487 | 166.57 |
| Seychelles | 26,000 | 162.50 |
| Portugal | 5,545,595 | 161.90 |
| Gilbert Islands | 26,863 | 161.83 |
| Ceylon | 4,110,367 | 161.31 |
| Salvador | 1,161,426 | 160.75 |
| Scotland | 4,759,445 | 156.53 |
| Korea | 13,461,299 | 156.53 |
| Comoro Islands | 94,844 | 152.97 |
| Cochin China | 3,050,785 | 152.54 |
| Liechtenstein | 9,854 | 151.60 |
| Canary Islands | 419,809 | 149.56 |
| Sierra Leone Colony | 75,572 | 146.74 |
| Rumania | 7,516,418 | 140.52 |
| Ireland | 4,390,219 | 137.67 |
| Curacao | 54,469 | 135.16 |
| Servia | 4,547,992 | 134.19 |
| Tonking | 6,119,720 | 131.89 |
| Union Islands | 914 | 130.57 |
| Bali and Lombok | 523,535 | 128.79 |
| Principé & St. Thomas Islands | 42,103 | 116.70 |
| Anguilla | 4,075 | 116.43 |
| Dominica | 33,863 | 116.37 |
| Wallis Archipelago | 4,500 | 112.50 |
| Bulgaria | 4,752,997 | 109.76 |
| Annam | 5,554,822 | 106.62 |
| Greece | 4,363,000 | 104.05 |
| Indian Feudatory States | 70,864,995 | 102.52 |
| Crete | 342,151 | 101.68 |
| Marshall Islands | 15,179 | 101.20 |
| Spain, including Ceuta | 18,843,176 | 99.15 |
| Southern Nigeria | 7,857,399 | 98.37 |
| Norfolk Island | 967 | 96.70 |
| Cape Verde Islands | 142,552 | 96.32 |
| Bosnia & Herzegovina | 1,898,044 | 96.02 |
| Virgin Islands | 5,562 | 95.90 |
| Bismarck Archipelago | 188,870 | 94.43 |
| Caroline & Pelew Is'lds | 52,674 | 94.06 |
| Chinese Empire | 400,000,000 | 93.52 |
| Nepal | 5,000,000 | 92.59 |
| Montenegro | 516,000 | 92.09 |
| Cyprus | 274,108 | 76.48 |
| American Samoa | 7,249 | 76.31 |
| Albania | 825,000 | 75.00 |
| St. Helena | 3,520 | 74.89 |
| Pitcairn Island | 145 | 72.50 |
| Mayotte | 9,989 | 71.35 |
| Russia in Europe | 138,274,500 | 69.23 |
| Philippine Islands | 8,368,427 | 65.45 |
| Tonga | 23,737 | 60.86 |
| Guam | 12,517 | 59.60 |
| Portuguese Guinea | 820,000 | 58.82 |
| Sierra Leone Protectorate | 1,327,560 | 54.41 |
| Cuba | 2,220,278 | 50.27 |
| Turkey in Asia | 21,000,000 | 48.92 |
| Protected Malay States | 720,000 | 46.15 |
| Liberia | 1,800,000 | 45.00 |
| Slam | 8,117,953 | 41.61 |
| Guatemala | 1,992,000 | 41.25 |
| Portuguese Timor | 300,000 | 40.93 |
| Tunis | 1,923,217 | 38.46 |
| Federated Malay States | 1,036,999 | 37.70 |
| Santo Domingo | 708,000 | 36.64 |
| Cambodia | 1,634,252 | 36.32 |
| Northern Nigeria | 9,269,000 | 36.25 |
| French Somali Coast | 208,000 | 35.92 |
| Basutoland | 405,903 | 34.65 |
| German Samoa | 34,480 | 34.48 |
| Turks & Caicos Islands | 5,615 | 33.93 |
| Natal | 1,194,043 | 33.84 |
| Khiva | 800,000 | 33.33 |
| Sweden | 5,522,403 | 31.94 |
| United States | 91,972,266 | 30.93 |
| Gambia Protectorate | 138,400 | 30.76 |
| Andorra | 5,231 | 29.89 |
| Hawaii | 191,909 | 29.76 |
| Togo | 1,000,000 | 29.67 |
| Fernando Po, &c. | 23,844 | 29.29 |
| Egypt | 11,287,359 | 28.22 |
| German East Africa | 10,000,000 | 26.04 |
| Banca | 115,189 | 25.91 |
| Nyasaland Protectorate | 1,000,000 | 25.12 |
| Sumatra | 4,029,503 | 24.93 |
| Finland | 3,084,000 | 24.54 |
| Uganda Protectorate | 2,843,325 | 24.16 |
| Afghanistan | 5,900,000 | 23.60 |
| Morocco | 4,580,000 | 20.91 |
| French Oceania | 31,477 | 20.71 |
| Jarvis Island | 30 | 20.00 |
| Billiton | 36,858 | 19.78 |
| Mexico | 15,063,207 | 19.64 |
| Norway | 2,391,782 | 19.27 |
| Gold Coast | 1,504,599 | 18.81 |
| Fiji | 139,541 | 18.77 |
| Abyssinia | 8,000,000 | 18.50 |
| Dutch Timor | 308,600 | 17.44 |
| Costa Rica | 388,266 | 16.88 |
| Spanish Guinea | 200,000 | 16.67 |
| Belgian Congo | 15,000,000 | 16.49 |
| Uruguay | 1,177,560 | 16.31 |
| Algeria | 5,563,828 | 16.20 |
| British East Africa Protectorate | 4,038,000 | 16.15 |
| Swaziland | 99,959 | 15.29 |
| Transvaal | 1,686,212 | 15.27 |
| Persia | 9,500,000 | 15.13 |
| Bokhara | 1,250,000 | 15.06 |
| French Equatorial Africa | 10,000,000 | 14.95 |
| Kamerun | 2,720,000 | 14.23 |
| New Hebrides | 70,000 | 13.73 |
| Madagascar | 3,104,881 | 13.62 |
| Panama | 426,928 | 13.18 |
| Bahama Islands | 55,944 | 12.71 |
| Bhutan | 250,000 | 12.50 |
| Nicaragua | 600,000 | 12.20 |
| Ecuador | 1,400,000 | 12.07 |
| Honduras Republic | 553,446 | 11.97 |
| Celebes | 851,905 | 11.92 |
| Sarawak | 500,000 | 11.90 |
| Colombia | 5,475,961 | 11.86 |
| Chile | 3,415,060 | 11.67 |
| Mozambique | 3,120,000 | 10.63 |
| German Marianne Isld's | 2,646 | 10.58 |
| Orange Free State | 528,174 | 10.48 |
| Isle of Pines | 600 | 10.34 |
| *New Zealand | 1,070,910 | 10.31 |
| British Solomon Islands | 150,000 | 10.14 |
| Fanning Island | 150 | 10.00 |
| Eritrea | 450,000 | 9.83 |
| Molucca Islands | 407,906 | 9.30 |
| Cape of Good Hope | 2,564,965 | 9.26 |
| Socotra | 12,000 | 8.68 |
| Angola | 4,119,000 | 8.50 |
| Kaiser Wilhelm's Land | 531,723 | 7.60 |
| Brunei | 30,000 | 7.50 |
| French West Africa | 11,100,000 | 7.35 |
| Brazil | 23,070,969 | 7.01 |
| Venezuela | 2,743,841 | 6.96 |
| Riau Lingga Archipel'o | 112,216 | 6.88 |
| British North Borneo | 208,183 | 6.69 |
| New Caledonia | 50,608 | 6.62 |
| Laos | 644,877 | 6.58 |
| Argentine Republic | 7,201,910 | 6.25 |
| Oman | 500,000 | 6.10 |
| Dutch Borneo | 1,233,655 | 5.80 |
| Peru | 4,000,000 | 5.75 |
| Newfoundland (proper) | 238,670 | 5.59 |
| Miquelon | 443 | 5.34 |
| Southern Rhodesia | 709,471 | 5.18 |
| Maiden Island | 168 | 4.80 |
| British Honduras | 40,458 | 4.71 |
| Paraguay | 800,000 | 4.66 |
| Somaliland Protector'te | 300,000 | 4.41 |
| Russia in Asia | 25,664,500 | 4.08 |
| Phœnix Islands | 59 | 3.69 |
| Japanese Sakhalin | 43,273 | 3.46 |
| Northern Rhodesia | 1,000,000 | 3.45 |
| Bolivia | 2,267,935 | 3.38 |
| British Guiana | 299,044 | 3.31 |
| Anglo-Egyptian Sudan | 3,000,000 | 3.05 |
| Papua | 272,057 | 3.00 |
| Italian Somaliland | 400,000 | 2.87 |
| Iceland | 85,188 | 2.14 |
| Canada | 7,204,838 | 2.00 |
| Surinam | 86,233 | 1.87 |
| French Guiana | 49,009 | 1.61 |
| Australian Commonwealth | 4,668,707† | 1.57 |
| Dutch New Guinea | 200,000 | 1.32 |
| Tripoli and Cyrenaica | 530,000 | 1.30 |
| Falkland Islands | 3,275 | 0.50 |
| Bechuanaland Protectorate | 125,350 | 0.46 |
| German South - west Africa | 99,744 | 0.31 |
| Greenland (Danish) | 13,517 | 0.29 |
| Ascension | 34 | 0.18 |
| Rio de Oro and Adrar | 12,000 | 0.16 |
| Alaska | 64,356 | 0.11 |
| Labrador | 3,949 | 0.03 |
The principal natural divisions in New Zealand are the North, South, and Stewart Islands. These contain nearly the whole population of European descent, the Cook and other annexed islands being inhabited almost solely by coloured Natives.
The population of the two main Islands, with that of Stewart Island and the Chatham Islands, the former being included in the South and the latter in the North Island, at each census period, is given in the next table, together with the proportion per cent. that the population of each division bears to the total population of the Dominion.
| Population of the North and South Islands, 1858–1911. | |||||
|---|---|---|---|---|---|
| Census Year. | Population (excluding Maoris). | Proportions per Cent. | |||
| North Island and Chatham Islands. | South and Stewart Islands. | Total. | North Island and Chatham Islands. | South and Stewart Islands. | |
| 1858 | 34,179 | 25,234 | 59,413 | 57.53 | 42.47 |
| 1861 | 41,691 | 57,330 | 99,021 | 42.10 | 57.90 |
| 1864 | 65,349 | 106,809 | 172,158 | 37.96 | 62.04 |
| 1867 | 80,097 | 138,571 | 218,668 | 36.63 | 63.37 |
| 1871 | 97,008 | 159,385 | 256,393 | 37.84 | 62.16 |
| 1874 | 112,063 | 187,451 | 299,514 | 37.41 | 62.59 |
| 1878 | 158,404 | 256,008 | 414,412 | 38.22 | 61.78 |
| 1881 | 193,289 | 296,644 | 489,933 | 39.45 | 60.55 |
| 1886 | 250,681 | 327,801 | 578,482 | 43.33 | 56.67 |
| 1891 | 281,745 | 344,913 | 626,658 | 44.96 | 55.04 |
| 1896 | 340,872 | 362,488 | 703,360 | 48.46 | 51.54 |
| 1901 | 390,786 | 381,933 | 772,719 | 50.57 | 49.43 |
| 1906 | 476,934 | 411,645 | 888,578 | 53.67 | 46.33 |
| 1911 | 563,991 | 444,477 | 1,008,468 | 55.93 | 44.07 |
It will be seen that in 1858 the North Island had the larger population, this position being reversed at the succeeding enumerations until 1901, in which year the North Island was found to have a slightly larger population than the South, a position which it has since considerably improved upon. The Maori war which broke out in 1860 retarded settlement in the North, while a large area of land reserved for the Maoris was until quite recently a serious hindrance to the development of this portion of the Dominion. The construction of railways, roads, and bridges is now giving access to larger areas of new lands, which are being offered for selection in blocks intended for close settlement, and are quickly occupied. The South Island was practically free from Maori troubles, and settlement was more rapid, though much of the land was disposed of in large areas. The discovery of gold in Otago in 1861 and in the West Coast in 1864 attracted to these localities considerable numbers of miners.
In 1870 a policy of vigorous construction of railways and other developmental public works and of assistance to immigrants was inaugurated, resulting in a large increase to the population, including nearly ninety thousand Government immigrants introduced between 1873 and 1879.
Intercensal estimates of population of the various provincial districts have been made for many years past, but have not been very reliable, on account of the lack of any record of internal migration. Since March, 1913, however, returns of inter-island migration have been obtained, and the population can now be allocated with a high degree of accuracy as between the two main islands. In addition a close watch is kept on the relative progress of the various divisions of the Dominion, thus enabling a more reliable estimate to be made as regards the populations of provincial districts. Estimates as at the 31st December, 1914, are given in the following table:—
| Estimated Population 31st December, 1914. | |||
|---|---|---|---|
| Provincial District. | Males. | Females. | Totals. |
| Auckland | 152,346 | 138,077 | 290,423 |
| Taranaki | 29,970 | 26,877 | 56,847 |
| Hawke's Bay | 27,584 | 25,408 | 52,992 |
| Wellington | 110,638 | 103,644 | 214,282 |
| Marlborough | 9,405 | 8,115 | 17,520 |
| Nelson | 28,678 | 23,690 | 52,368 |
| Westland | 9,219 | 7,810 | 17,029 |
| Canterbury | 94,896 | 93,009 | 187,905 |
| Otago— | |||
| Otago portion | 71,060 | 70,942 | 142,002 |
| Southland portion | 34,365 | 30,261 | 64,626 |
| Totals for the Dominion | 568,161 | 527,833 | 1,095,994 |
The counties contain what is understood to be the rural population, but this is not strictly correct, as some of the towns not municipalized, and forming part of counties, have considerable populations. On the other hand the population of a few of the smaller boroughs might be classed as rural, as will be noticed further on. A list of counties and their populations (exclusive of interior boroughs and town districts not forming parts of counties) is given. The populations shown are as estimated to 1st April, 1915.
| County. | Estimated Population. |
|---|---|
| Akaroa | 2,442 |
| Akitio | 1,379 |
| Amuri | 2,028 |
| Ashburton | 11,107 |
| Ashley | 767 |
| Awakino | 699 |
| Awatere | 1,701 |
| Bay of Islands | 3,230 |
| Bruce | 5,231 |
| Buller | 7,810 |
| Castlepoint | 610 |
| Chatham Islands | 267 |
| Cheviot | 1,630 |
| Clifton | 2,494 |
| Clutha | 7,861 |
| Collingwood | 1,458 |
| Cook | 6,110 |
| Coromandel | 2,995 |
| Dannevirke | 5,117 |
| East Taupo | 610 |
| Eden | 16,440 |
| Egmont | 3,703 |
| Eketahuna | 1,884 |
| Edesmere | 4,081 |
| Eltham | 3,978 |
| Eyre | 2,026 |
| Featherston | 2,482 |
| Fiord | 45 |
| Franklin | 8,462 |
| Geraldine | 5,900 |
| Great Barrier | 426 |
| Grey | 5,676 |
| Halswell | 2,053 |
| Hawera | 4,372 |
| Hawke's Bay | 8,912 |
| Heathcote | 4,496 |
| Hobson | 4,399 |
| Hokianga | 3,121 |
| Horowhenua | 5,984 |
| Hutt | 4,509 |
| Inangahua | 5,263 |
| Kaikoura | 2,082 |
| Kairanga | 4,298 |
| Kaitieke | 1,638 |
| Kawhia | 1,011 |
| Kiwitea | 3,083 |
| Kowai | 2,249 |
| Lake | 2,055 |
| Levels | 5,205 |
| Mackenzie | 2,525 |
| Makara | 2,874 |
| Malvern | 3,742 |
| Manawatu | 4,945 |
| Mangonui | 3,186 |
| Maniototo | 2,925 |
| Manukau | 5,107 |
| Marlborough | 7,205 |
| Masterton | 3,860 |
| Matamata | 3,407 |
| Mauriceville | 935 |
| Mount Herbert | 502 |
| Murchison | 1,184 |
| Ohinemuri | 6,547 |
| Ohura | 1,713 |
| Opotiki | 1,632 |
| Oroua | 3,977 |
| Otamatea | 3,829 |
| Oxford | 2,021 |
| Pahiatua | 3,296 |
| Paparua | 4,427 |
| Patangata | 2,115 |
| Patea | 3,373 |
| Peninsula | 2,050 |
| Piako | 3,701 |
| Pohangina | 1,992 |
| Raglan | 3,362 |
| Rangiora | 3,125 |
| Rangitikei | 8,580 |
| Rodney | 3,808 |
| Rotorua | 1,333 |
| Selwyn | 1,371 |
| Sounds | 1,276 |
| Southland | 28,234 |
| Springs | 2,046 |
| Stewart Island | 355 |
| Stratford | 6,093 |
| Taieri | 6,710 |
| Takaka | 2,176 |
| Taranaki | 8,667 |
| Tauranga | 2,645 |
| Tawera | 1,343 |
| Thames | 4,750 |
| Tuapeka | 6,201 |
| Vincent | 3,936 |
| Waiapu | 1,910 |
| Waihemo | 1,782 |
| Waikato | 6,118 |
| Waikohu | 3,279 |
| Waikouaiti | 670 |
| Waimairi | 10,626 |
| Waimarino | 2,261 |
| Waimate | 7,259 |
| Waimate West | 2,134 |
| Waimea | 10,384 |
| Waipa | 4,891 |
| Waipara | 2,127 |
| Waipawa | 3,321 |
| Waipukurau | 588 |
| Wairarapa South | 2,050 |
| Wairewa | 966 |
| Wairoa | 2,085 |
| Waitaki | 10,680 |
| Waitemata | 6,478 |
| Waitomo | 4,158 |
| Waitoara | 2,538 |
| Wallace | 9,809 |
| Wanganui | 4,130 |
| Weber | 574 |
| Westland | 3,855 |
| West Taupo | 1,137 |
| Whakatane | 1,223 |
| Whangamomona | 1,953 |
| Whangarei | 7,591 |
| Whangaroa | 795 |
| Woodville | 2,053 |
The next table shows the distribution of the population in counties and boroughs at each quinquennial census since 1881.
| Percentage. | |||||
|---|---|---|---|---|---|
| Census Year. | Counties. | Boroughs. | Counties. | Boroughs. | Shipboard and Islands. |
| 1881 | 291,238 | 194,981 | 59.44 | 39.80 | 0.76 |
| 1886 | 327,328 | 245,612 | 56.58 | 42.46 | 0.96 |
| 1891 | 352,097 | 270,343 | 56.18 | 43.14 | 0.68 |
| 1896 | 391,735 | 307,294 | 55.69 | 43.69 | 0.62 |
| 1901 | 417,596 | 350,202 | 54.04 | 45.32 | 0.64 |
| 1906 | 158,797 | 424,614 | 51.63 | 47.79 | 0.58 |
| 1911 | 496,779 | 505,598 | 49.26 | 50.14 | 0.60 |
Prior to the year 1900 there was no statutory limitation to the number of inhabitants necessary to constitute a borough, and consequently many small centres, the residents being mainly engaged in rural occupations, became municipalities. The Municipal Corporations Act now imposes a limit as to area, and provides that no new borough may be constituted unless the proposed area contains at least 1,000 inhabitants.
Boroughs which in 1911 had a population of 1,000 or over contained an aggregate of 491,836 persons in that year, as against an aggregate of 252,722 persons for boroughs of 1,000 and over in 1891, an increase of 239,114 persons, or 94.62 per cent. The name of each borough, with the number of inhabitants estimated as at 1st April, 1915, is given in the next table.
| Estimated Population of Boroughs on the 1st April, 1915. | |
|---|---|
| Borough. | Estimated Population. |
| Akaroa | 682 |
| Alexandra | 809 |
| Arrowtown | 425 |
| Ashburton | 2,885 |
| Auckland (City) | 65,005 |
| Balclutha | 1,364 |
| Birkenhead | 2,219 |
| Blenheim | 3,885 |
| Brunner | 1,013 |
| Cambridge | 1,692 |
| Campbelltown | 1,949 |
| Carterton | 1,501 |
| Christchurch (City) | 58,169 |
| Cromwell | 615 |
| Dannevirke | 3,680 |
| Dargaville | 1,392 |
| Devonport | 7,863 |
| Dunedin (City) | 49,446 |
| Eastbourne | 650 |
| Eketahuna | 794 |
| Eltham | 2,074 |
| Feilding | 3,505 |
| Foxton | 1,814 |
| Frankton | 1,287 |
| Geraldine | 1,019 |
| Gisborne | 9,859 |
| Gore | 3,566 |
| Green Island | 2,011 |
| Greymouth | 5,663 |
| Greytown | 1,015 |
| Hamilton | 4,097 |
| Hampden | 375 |
| Hastings | 7,085 |
| Hawera | 3,259 |
| Hokitika | 2,238 |
| Inglewood | 1,444 |
| Invercargill | 14,592 |
| Invercargill South | 1,727 |
| Kaiapoi | 1,972 |
| Kaitangata | 1,695 |
| Karori | 1,620 |
| Kumara | 685 |
| Lawrence | 984 |
| Levin | 1,779 |
| Lower Hutt | 4,623 |
| Lyttelton | 4,396 |
| Maori Hill | 2,347 |
| Marton | 1,663 |
| Masterton | 5,690 |
| Mataura | 1,311 |
| Milton | 1,457 |
| Miramar | 1,771 |
| Mornington | 5,374 |
| Mosgiel | 1,727 |
| Motueka | 1,521 |
| Mount Albert | 9,105 |
| Mount Eden | 11,802 |
| Napier | 11,125 |
| Naseby | 325 |
| Nelson (City) | 8,565 |
| New Brighton | 2,119 |
| Newmarket | 2,842 |
| New Plymouth | 7,625 |
| Northcote | 1,791 |
| Oamaru | 5,560 |
| Ohakune | 1,335 |
| Onehunga | 5,035 |
| Onslow | 2,006 |
| Opotiki | 1,030 |
| Otahuhu | 2,013 |
| Pahiatua | 1,311 |
| Palmerston | 856 |
| Palmerston North | 12,206 |
| Patea | 1,060 |
| Petone | 7,107 |
| Picton | 1,471 |
| Port Chalmers | 2,273 |
| Pukekohe | 1,364 |
| Queenstown | 730 |
| Rangiora | 1,984 |
| Riccarton | 3,121 |
| Richmond | 820 |
| Riverton | 1,057 |
| Ross | 572 |
| Roxburgh | 476 |
| Runanga | 1,575 |
| Spreydon | 4,035 |
| St. Kilda | 5,398 |
| Stratford | 3,076 |
| Sumner | 2,159 |
| Taihape | 1,874 |
| Takapuna | 3,023 |
| Tapanui | 359 |
| Taumarunui | 1,341 |
| Tauranga | 1,483 |
| Te Aroha | 1,500 |
| Te Awamutu | 1,330 |
| Te Kuiti | 1,465 |
| Temuka | 1,878 |
| Thames | 3,761 |
| Timaru | 13,123 |
| Waihi | 5,475 |
| Waikouaiti | 744 |
| Waimate | 1,900 |
| Waipawa | 1,182 |
| Waipukurau | 1,139 |
| Wairoa | 1,210 |
| Waitara | 1,647 |
| Wanganui | 13,955 |
| Wellington (City) | 67,446 |
| West Harbour | 1,975 |
| Westport | 5,527 |
| Whangarei | 2,825 |
| Winton | 617 |
| Woodville | 1,272 |
| Woolston | 3,820 |
With the boroughs is also now included for some purposes the town of Rotorua, constituted under the Rotorua Town Act, 1907. The estimated population of Rotorua on 1st April, 1915, was 2,763.
The principal cities of New Zealand are Auckland and Wellington in the North Island, Christchurch and Dunedin in the South Island. The population of each of these cities and their suburbs, as estimated at 1st April, 1915, is given below:—
| Estimated Population. | |
|---|---|
| Auckland and Suburbs. | |
| Auckland City | 65,005 |
| Suburban boroughs— | |
| Newmarket | 2,842 |
| Mount Eden | 11,802 |
| Mount Albert | 9,105 |
| Birkenhead | 2,219 |
| Northcote | 1,791 |
| Devonport | 7,863 |
| Takapuna | 3,023 |
| Other suburbs | 14,143 |
| Total, Greater Auckland | 117,793 |
| Wellington and Suburbs. | |
| Wellington City | 67,446 |
| Suburban boroughs— | |
| Onslow | 2,006 |
| Karori | 1,620 |
| Miramar | 1,771 |
| Eastbourne | 650 |
| Other suburbs | 1,318 |
| Total, Greater Wellington | 74,811 |
| Christchurch City | 58,169 |
| Suburban boroughs— | |
| Woolston | 3,820 |
| New Brighton | 2,119 |
| Sumner | 2,159 |
| Spreydon | 4,035 |
| Riccarton | 3,121 |
| Other suburbs | 14,333 |
| Total, Greater Christchurch | 87,756 |
| Dunedin and Suburbs. | |
| Dunedin City | 49,446 |
| Suburban boroughs— | |
| West Harbour | 1,975 |
| Maori Hill | 2,347 |
| Mornington | 5,374 |
| St. Kilda | 5,398 |
| Green Island | 2,011 |
| Other suburbs | 2,607 |
| Total, Greater Dunedin | 69,158 |
The only other city in New Zealand is Nelson. There are, however, six towns possessing, with suburbs, larger populations than Nelson, and information concerning these is shown below. The populations given are as estimated to the 1st April, 1915.
| Estimated Population. | |
|---|---|
| North Island. | |
| GISBORNE | 9,859 |
| Suburbs— | |
| Mangapapa Town District | 1,103 |
| Kaiti, Te Hapara, Tamarau, and Whataupoko | 840 |
| Total, Gisborne and Suburbs | 11,802 |
| NAPIER | 11,125 |
| Suburbs— | |
| Napier South Town District | 765 |
| West Shore | 535 |
| Awatoto | 276 |
| Total, Napier and Suburbs | 12,701 |
| WANGANUI | 13,955 |
| Suburbs— | |
| Gonville Town District | 1,801 |
| Mosstown | 202 |
| Putiki | 172 |
| Marybank | 105 |
| Total, Wanganui and Suburbs | 16,235 |
| PALMERSTON NORTH | 12,206 |
| South Island. | |
| NELSON | 8,565 |
| Suburbs— | |
| Bishopdale | 39 |
| Tahunanui | 144 |
| Total, Nelson and Suburbs | 8,748 |
| TIMARU | 13,123 |
| INVERCARGILL | 14,592 |
| Suburbs— | |
| Invercargill South Borough | 1,727 |
| Otatata | 220 |
| Grassmere, Waikiwi, and Prestonville | 933 |
| Waverley | 40 |
| Lindisfarne, Richmond Grove, Inglewood, Adamsons, and Hawthorne | 555 |
| Total, Invercargill and Suburbs | 18,067 |
The several stages in the growth of a New Zealand town may be marked thus: The village, taxed by the parent county, and dependent upon the latter for all public works; then the legally constituted town district, still subordinate to the county in some matters, its affairs administered by a Board presided over by a Chairman. When its population exceeds 500 the town district may become independent of the county, and control the whole of its revenues. When the population reaches 1,000, full municipal powers may be obtained, with the dignity of a Council presided over by a Mayor, and finally, if the number of inhabitants should reach 20,000 or over, the title of “city” may be assumed, although the constitution remains unaltered. The name of each town district and its population are as follows:—
| (a.) Town Districts not forming Parts of Counties. | |
|---|---|
| Town District. | Estimated Population. |
| Bay | 1,126 |
| Bull's | 600 |
| Castlecliff | 716 |
| Ellerslie | 1,058 |
| Featherston | 712 |
| Gonville | 1,801 |
| Hempstead | 1,609 |
| Havelock North | 703 |
| Helensville | 705 |
| Hikurangi | 734 |
| Hunterville | 739 |
| Huntly | 1,525 |
| Johnsonville | 1,003 |
| Manaia | 640 |
| Mangapapa | 1,103 |
| Mangaweka | 580 |
| Manunui | 582 |
| Martinborough | 605 |
| Napier South | 765 |
| New Lynn | 636 |
| Ngaruawahia | 553 |
| Otaki | 763 |
| Otautau | 840 |
| Papakura | 713 |
| Pleasant Point | 531 |
| Raetihi | 505 |
| Rangataua | 957 |
| Taradale | 995 |
| Te Puke | 584 |
| Tinwald | 580 |
| Upper Hutt | 1,095 |
| Warkworth | 735 |
| Waverley | 710 |
| Whakatane | 650 |
| Wyndham | 724 |
| (b.) Town Districts forming Parts of Counties. | |
|---|---|
| Town District. | Estimated Population. |
| Amberley | 373 |
| Clinton | 487 |
| Edendale | 366 |
| Havelock | 334 |
| Kamo | 356 |
| Kaponga | 458 |
| Kawakawa | 324 |
| Kawhia | 181 |
| Kihikihi | 299 |
| Kohukohu | 363 |
| Leamington | 437 |
| Lethbridge | 290 |
| Mercer | 350 |
| Morrinsville | 654 |
| Normanby | 527 |
| Norsewood | 229 |
| Onerahi | 253 |
| Opunake | 553 |
| Ormondville | 394 |
| Otane | 284 |
| Outram | 463 |
| Raglan | 284 |
| Rongotea | 347 |
| Southbridge | 451 |
| Tuakau | 233 |
| Waiuku | 520 |
Populations of small centres as at 2nd April, 1911, were extracted from the census results, and published in the Government Statistician's Report on the census. The list is too long to insert here.
Adjacent to the main Islands are many smaller islands, some of which are of considerable area, and are under cultivation: others are but islets used as sites for lighthouses, while others again are barren and unfitted for human habitation. The Chatham Islands and Great Barrier Island have been constituted counties, and their populations are shown in the list of counties already given. The name and population of each of the inhabited islands as at the census of 1911 are shown in the following table:—
| Islands. | Population. |
|---|---|
| Mokohinau Lighthouse | 7 |
| Kawau | 60 |
| Motuketekete | 3 |
| Moturekareka | 7 |
| Little Barrier | 2 |
| Waiheke | 227 |
| Pahiki Lighthouse | 4 |
| Ponui | 43 |
| Rakino | 8 |
| Motutapu | 14 |
| Motuihi | 5 |
| Brown's | 4 |
| Rotoroa | 110 |
| Pakatoa | 22 |
| Bean Rock Lighthouse | 1 |
| Tiritiri Lighthouse | 7 |
| Slipper | 2 |
| Cuvier Lighthouse | 14 |
| Motiti | 3 |
| Somes and Lighthouse | 8 |
| Kapiti | 2 |
| The Brothers Lighthouse | 3 |
| D'Urville | 77 |
| Stephen Lighthouse | 7 |
| Ripa | 2 |
| Dog Island Lighthouse | 12 |
| Centre Island Lighthouse | 9 |
| Total | 663 |
Since 1901 the boundaries of New Zealand have been extended to include the Cook and certain other Pacific islands, the population of which is shown elsewhere in this section.
Prior to the colonization of New Zealand by Europeans, the earliest navigators and explorers found a race of people already inhabiting both Islands. Papers written in 1874 by Mr. (afterwards Sir) William Fox and Sir Donald McLean (then Native Minister) state that at what time the discovery of these Islands was made by the Maoris, or from what place they came, are matters of tradition only, and that much has been lost in the obscurity enveloping the history of a people without letters. Nor is there anything on record respecting the origin of the Maori people themselves, beyond the general tradition of the Polynesian race, which seems to show a series of successive migrations from west to east, probably by way of Malaysia to the Pacific. Little more can now be gathered from their traditions than that they were immigrants and that they probably found inhabitants on the east coast of the North Island belonging to the same race as themselves—the descendants of a prior migration, whose history is lost. The tradition runs that, generations ago, the Maoris dwelt in a country named Hawaiki, and that one of their chiefs, after a long voyage, reached the northern island of New Zealand. Returning to his home with a flattering description of the country he had discovered, this chief, it is said, persuaded a number of his kinsfolk and friends, who were much harassed by war, to set out with a fleet of double canoes for the new land. The names of most of the canoes are still remembered, and each tribe agrees in its account of the doings of the people of the principal canoes after their arrival in New Zealand; and from these traditional accounts the descent of the numerous tribes has been traced. The position of the legendary Hawaiki is unknown, but many places in the South Seas have been thus named in memory of the motherland. The Maoris speak a very pure dialect of the Polynesian language, the common tongue, with more or less variation, in all the eastern Pacific islands. When Captain Cook first visited New Zealand he availed himself of the services of a Native from Tahiti, whose speech was easily understood by the Maoris. In this way much information respecting the early history of the country and its inhabitants was obtained which could not have otherwise been had.
A census of the Maori population is taken every five years, the information being obtained by the collectors either directly or through the chief or head of the tribe or hapu. The name, sex, and age, so far as it can be ascertained, of each Maori is entered; but, owing to the nomadic habits of the race and lack of definite knowledge in some particulars, it has been a difficult task in the past. The results of the past five enumerations are as follows:—
| Census Year. | Males. |
|---|---|
| 1891 | 22,861 |
| 1896 | 21,673 |
| 1901 | 23,112 |
| 1906 | 25,538 |
| 1911 | 26,475 |
| 19,132 | 41,993 |
| 18,181 | 39,854 |
| 20,031 | 43,143 |
| 22,193 | 47,731 |
| 23,369 | 49,844 |
The number of half-castes living as members of Maori tribes, and the number living as and among Europeans, is given in the next table for five census periods. Those under the first heading are already included among Maoris in the preceding table, the others being classed among the European population. It is a matter of some difficulty to ascertain the number of half-castes living as Maoris. There has been no definite rule to guide collectors in deciding when a half-caste should be classified as living as a Maori—indeed, it might be said that all the half-castes and a large proportion of the Maoris in the South Island live in European fashion. They mostly have separate holdings of land and separate homes, and have adopted the habits of the Europeans.
| HALF-CASTES. | |||
|---|---|---|---|
| Half-castes. | |||
| Census Year. | Living as Members of Maori Tribes. | Living as and among Europeans. | Total. |
| 1891 | 2,681 | 2,184 | 4,865 |
| 1896 | 3,503 | 2,259 | 5,762 |
| 1901 | 3,133 | 2,406 | 5,539 |
| 1906 | 3,938 | 2,578 | 6,516 |
| 1911 | 4,181 | 2,879 | 7,060 |
The number of Maoris (including half-castes living as Maoris) in each county and on adjacent islands, as ascertained at the census of 1911, was as follows:—
| NUMBER OF MAORIS INEACH COUNTY, CENSUS 1911. | |
|---|---|
| Counties. | Persons |
| Mangonui | 2,330 |
| Whangaroa | 626 |
| Hokianga | 3,228 |
| Bay of Islands | 2,623 |
| Hobson | 818 |
| Otamatea | 454 |
| Whangarei | 941 |
| Rodney | 155 |
| Great Barrier Island | 72 |
| Eden (including Waiheke and Chamberlin Islands) | 426 |
| Waitemata | 186 |
| Manukau | 776 |
| Waikato | 603 |
| Raglan | 1,720 |
| Kawhia | 588 |
| Awakino | 86 |
| East Taupo | 1,046 |
| Matamata | 403 |
| West Taupo | 1,299 |
| Waitomo | 1,523 |
| Waipa | 375 |
| Piako | 231 |
| Ohinemuri | 661 |
| Thames | 770 |
| Coromandel | 498 |
| Ohura | 61 |
| Tauranga | 1,718 |
| Whakatane | 2,228 |
| Opotiki | 1,427 |
| Rotorua | 1,461 |
| Waiapu | 2,952 |
| Cook | 1,424 |
| Waikohu | 549 |
| Wairoa | 2,660 |
| Hawke's Bay | 1,262 |
| Waipawa | 324 |
| Patangata | 134 |
| Akitio | 56 |
| Castlepoint | 26 |
| Featherston | 348 |
| Wairarapa South | 114 |
| Pahiatua | 33 |
| Masterton | 279 |
| Waipukurau | 7 |
| Dannevirke | 162 |
| Weber | 3 |
| Eketahuna | 9 |
| Mauriceville | 15 |
| Hutt and Makara | 311 |
| Waitotara | 430 |
| Manawatu | 248 |
| Kairanga | 171 |
| Rangitikei | 387 |
| Wanganui | 656 |
| Horowhenua | 1,295 |
| Waimarino | 632 |
| Oroua, Pohangina, Kiwitea | 221 |
| Patea | 258 |
| Hawera | 570 |
| Eltham | 38 |
| Whangamomona | 51 |
| Taranaki | 474 |
| Waimate West | 153 |
| Clifton | 388 |
| Egmont | 659 |
| Sounds | 218 |
| Marlborough | 162 |
| Waimea | 133 |
| Collingwood | 5 |
| Takaka | 48 |
| Buller | 36 |
| Westland | 82 |
| Kaikoura | 109 |
| Ashley | 230 |
| Malvern | 5 |
| Selwyn | 83 |
| Heathcote | 5 |
| Akaroa | 25 |
| Mount Herbert | 106 |
| Wairewa | 107 |
| Geraldine | 174 |
| Levels | 41 |
| Mackenzie | 4 |
| Waimate | 71 |
| Waitaki | 96 |
| Waikouaiti | 138 |
| Peninsula | 140 |
| Waihemo | 7 |
| Taieri | 59 |
| Clutha | 39 |
| Southland | 190 |
| Wallace | 327 |
| Stewart Island | 63 |
| Chatham Islands | 219 |
| Ruapuke Island | 41 |
During the year 1901, the boundaries of the Dominion were extended to include the Cook Group and certain other of the South Pacific islands. No record of the population of these islands was then obtainable, but at each subsequent census an account of the number and birthplaces of the inhabitants was taken. The results for the census of 1911 are shown in the following table:—
| Whites and Half-castes living as Whites. | Natives and Half-castes living as Natives. | Total. | |
|---|---|---|---|
* Not including 513 absentees. † Labourers temporarily employed on these islands. (a) Birthplaces.—United Kingdom, 52; New Zealand, 30; Australia, 4; Tasmania, 1; Rarotonga, 22; Mangaia, 2; Atiu, 1; Aitutaki, 1; France, 6; Germany, 3; Sweden, 1; United States of America, 9; Holland, 1; Pitcairn Island, 2; Tahiti, 2; not stated, 2. (b) Birthplaces.—United Kingdom, 3; New Zealand, 1; Australia, 1. (c) Birthplaces.—United Kingdom, 5; New Zealand, 1; Rarotonga, 1; Aitutaki, 4; France, 2; Germany, 1; Norway, 2. (d) Birthplaces.—United Kingdom, 1; Society Islands, 1. (e) Birthplaces.—United Kingdom, 2; Mauke, 6; Germany, 2. (f) Birth places.—Denmark, 1. (g) Birthplaces not stated. (h) Birthplaces.—United Kingdom, 2; New Zealand, 1. (i) Birthplaces.—United Kingdom, 1; New Zealand, 1; France, 2. SUMMARY OF BIRTHPLACES.—United Kingdom, 66; New Zealand, 34; Australia, 5; Tasmania, 1; Rarotonga, 23; Mangaia, 2; Atiu, 1; Mauke, 6; Aitutaki, 5; France, 10; Germany, 6; Sweden, 1; United States of America, 9; Holland, 1; Pitcairn Island, 2; Norway, 2; Tahiti, 2; Society Islands, 1; Denmark, 1; not stated, 54 (52 of these on Niue Island). | |||
| Rarotonga | 139(a) | 2,620 | 2,759 |
| Mangaia | 5(b) | 1,466 | 1,471 |
| Aitutaki | 16(c) | 810 | 826 |
| Atiu | 2(d) | 1,221 | 1,223 |
| Mauke | 10(e) | 447 | 457 |
| Mitiaro | 1(f) | 198 | 199 |
| Total Cook Group | 173 | 6,762 | 6,935 |
| Niue (or Savage Island) | 52(g) | 3,891 | 3,943* |
| Palmerston | .. | 107 | 107 |
| Penrhyn | 3(h) | 332 | 335 |
| Manihiki | 4(i) | 440 | 444 |
| Rakaanga | .. | 315 | 315 |
| Danger (or Pukapuka) | .. | 490 | 490 |
| Hervey Islands | .. | 29† | 29† |
| Total other islands | 59 | 5,604 | 5,663 |
| Total population of Pacific islands | 232 | 12,366 | 12,598 |
Table of Contents
REGISTRATION of births in New Zealand dates as far back as 1847, in which year was passed a Registration Ordinance which made provision for a record of births and deaths being kept by the State. Under this ordinance many registrations were effected, some of births as far back as 1840. Compulsory registration did not, however, come into force until 1855.
The earlier Registration Acts and their amendments provided for very little information being given in the case of births, the register containing merely date and place of birth, name and sex of child, names of father and mother, and occupation of father. In 1875, however, a new Registration Act was passed, under which information was recorded as to ages and birthplaces of parents. A recent amendment to the Act provides for sexes and ages of previous issue of the marriage being given.
The law as to registration of births is now embodied in the Births and Deaths Registration Act, 1908, and the Births and Deaths Registration Amendment Act, 1912. The provisions generally as to registration are that a birth may be registered within sixty-two days without fee. After sixty-two days and within six months a birth is registrable only after solemn declaration made before the Registrar by the parent or some person present at birth, and on payment of a late fee of 5s., which may, however, be remitted at the discretion of the Registrar-General. When six months have elapsed a birth cannot be registered except within a month after conviction of one of the responsible parties for neglect. But an information for such neglect must be laid within two years of date of birth. Registration of still-births was not compulsory until the 1st March, 1913, on which date the Amendment Act referred to above came into force.
The Infant Life Protection Act of 1907 provided for notification of births, in addition to registration, the time allowed for notification being seventy-two hours (since reduced to forty-eight hours) if in a city or borough, and twenty-one days in every other case. Further information concerning infant-life protection is given in the subsection dealing with deaths.
In the successive Registration Acts special provision was made for exemption from the necessity of registration in the case of births and deaths of Maoris, though registration could be effected if desired. Section 20 of the Births and Deaths Registration Amendment Act, 1912, however, empowered the Governor in Council to make regulations providing for the registration of births and deaths of Maoris either throughout the whole Dominion or in such districts as might be determined. Regulations were made accordingly, and were published in the New Zealand Gazette of the 27th March, 1913, page 946. Registrars of Maori births and deaths have been appointed in 175 districts, 163 of these being in the North Island, where the great majority of the Maori population is located. Every Native settlement of any size is within easy reach of one of these Registrars. Maori registrations are entered in a separate register, and the numbers of births given below do not include those of Maoris, which are dealt with towards the end of this subsection.
The number of births registered during 1914 was 28,338, or 25.99 in every 1,000 persons living. The number is 403 above that for the year 1913, an increase of 1.44 per cent., but the rate is lower by 0.15 per thousand. The births registered in a year numbered 19,846 in 1884, and, after falling to 17,876 in 1892, have risen to the number first stated above.
The number of male children born during 1914 was 14,535, and of female children 13,803.
The following table shows the number of births registered, the birth-rate calculated on the total population, and comparison with the average rate for 1882–86 taken as 100. There was a steady decrease from 1886 until 1899, in which year the lowest rate was recorded. From 1899 there was a fairly regular increase until 1908, when the rate stood at 27.45 per 1,000. Each of the next three years showed a fall in the rate, which in 1911 was only 25.97 per 1,000, rising, however, in the following year to 26.48, but falling to 26.14 in 1913 and 25.99 in 1914.
| BIRTHS, NUMBERS AND RATES. | |||
|---|---|---|---|
| Birth-rate. | |||
| Year. | Total Number of Births registered. | Per 1,000 of Population. | Compared with Rate in 1882–86, taken as 100. |
* Average of 5 years. | |||
| 1882–86 | 19,410* | 35.40 | 100 |
| 1887 | 19,135 | 32.09 | 91 |
| 1888 | 18,902 | 31.22 | 88 |
| 1889 | 18,457 | 30.07 | 85 |
| 1890 | 18,278 | 29.44 | 83 |
| 1891 | 18,273 | 29.01 | 82 |
| 1892 | 17,876 | 27.83 | 79 |
| 1893 | 18,187 | 27.50 | 78 |
| 1894 | 18,528 | 27.28 | 77 |
| 1895 | 18,546 | 26.78 | 76 |
| 1896 | 18,612 | 26.33 | 74 |
| 1897 | 18,737 | 25.96 | 73 |
| 1898 | 18,955 | 25.74 | 73 |
| 1899 | 18,835 | 25.12 | 71 |
| 1900 | 19,546 | 25.60 | 72 |
| 1901 | 20,491 | 26.34 | 74 |
| 1902 | 20,655 | 25.89 | 73 |
| 1903 | 21,829 | 26.61 | 75 |
| 1904 | 22,766 | 26.94 | 76 |
| 1905 | 23,682 | 27.22 | 77 |
| 1906 | 24,252 | 27.08 | 76 |
| 1907 | 25,094 | 27.30 | 77 |
| 1908 | 25,940 | 27.45 | 77 |
| 1909 | 26,524 | 27.29 | 77 |
| 1910 | 25,984 | 26.17 | 74 |
| 1911 | 26,354 | 25.97 | 73 |
| 1912 | 27,508 | 26.48 | 75 |
| 1913 | 27,935 | 26.14 | 74 |
| 1914 | 28,338 | 25.99 | 73 |
A declining birth-rate is noticeable in many civilized countries, and attention has been drawn by statisticians and political economists to the serious consequences that may result.
The decline of the birth-rate in New Zealand has been partially compensated for by a decrease in the death-rate. Nevertheless, the rate of natural increase of population has fallen from 31.19 per 1,000 of mean population in 1870 to 16.68 per 1,000 in 1914. The following table will no doubt be of interest as showing the fall in all three rates:—
| Annual Rates per 1,000 living. | |||
|---|---|---|---|
| Period. | Births. | Deaths. | Natural Increase. |
| 1871–1875 | 39.88 | 12.67 | 27.21 |
| 1876–1880 | 41.21 | 11.80 | 29.41 |
| 1881–1885 | 36.36 | 10.95 | 25.41 |
| 1886–1890 | 31.15 | 9.85 | 21.30 |
| 1891–1895 | 27.68 | 10.15 | 17.53 |
| 1896–1900 | 25.75 | 9.55 | 16.20 |
| 1901–1905 | 26.60 | 9.91 | 16.69 |
| 1906–1910 | 27.06 | 9.75 | 17.31 |
| 1911 | 25.97 | 9.39 | 16.58 |
| 1912 | 26.48 | 8.87 | 17.61 |
| 1913 | 26.14 | 9.47 | 16.67 |
| 1914 | 25.99 | 9.31 | 16.68 |
In spite of the fact that the birth-rate in New Zealand is low compared with other countries, yet so low is the Dominion's death-rate that New Zealand has, so far as is known, the third highest rate of natural increase among countries keeping records of birth and deaths. The rates of natural increase in various countries are as follows:—
| RATES OF NATURAL INCREASE OF POPULATION. | ||
|---|---|---|
| Country. | Quinquennium. | Rate per 1,000. |
| Bulgaria | 1906–10 | 18.3 |
| Australian Commonwealth | 1910–14 | 17.1 |
| New Zealand | 1910–14 | 16.8 |
| Roumania | 1909–13 | 16.4 |
| Russia (European) | 1905–09 | 16.1 |
| Hungary | 1908–12 | 15.8 |
| Jamaica | 1909–13 | 15.2 |
| The Netherlands | 1909–13 | 15.1 |
| Denmark | 1909–13 | 13.9 |
| Servia | 1908–12 | 13.6 |
| Finland | 1908–12 | 13.2 |
| German Empire | 1908–12 | 13.1 |
| Norway | 1909–13 | 12.4 |
| Italy | 1908–12 | 11.9 |
| Japan | 1906–10 | 11.8 |
| England and Wales | 1909–13 | 10.7 |
| Scotland | 1909–13 | 10.7 |
| Austria | 1908–12 | 10.7 |
| Ontario | 1909–13 | 10.6 |
| Sweden | 1909–13 | 10.4 |
| Switzerland | 1908–12 | 9.7 |
| Spain | 1909–13 | 9.3 |
| Belgium | 1908–12 | 7.8 |
| Chile | 1908–12 | 7.7 |
| Ceylon | 1909–13 | 6.5 |
| Ireland | 1909–13 | 6.3 |
| France | 1909–13 | 0.1 |
The diagram which follows shows the rates of births and deaths and of natural increase per 1,000 of mean population each year from 1855 to 1914. The marriage-rate is also shown.
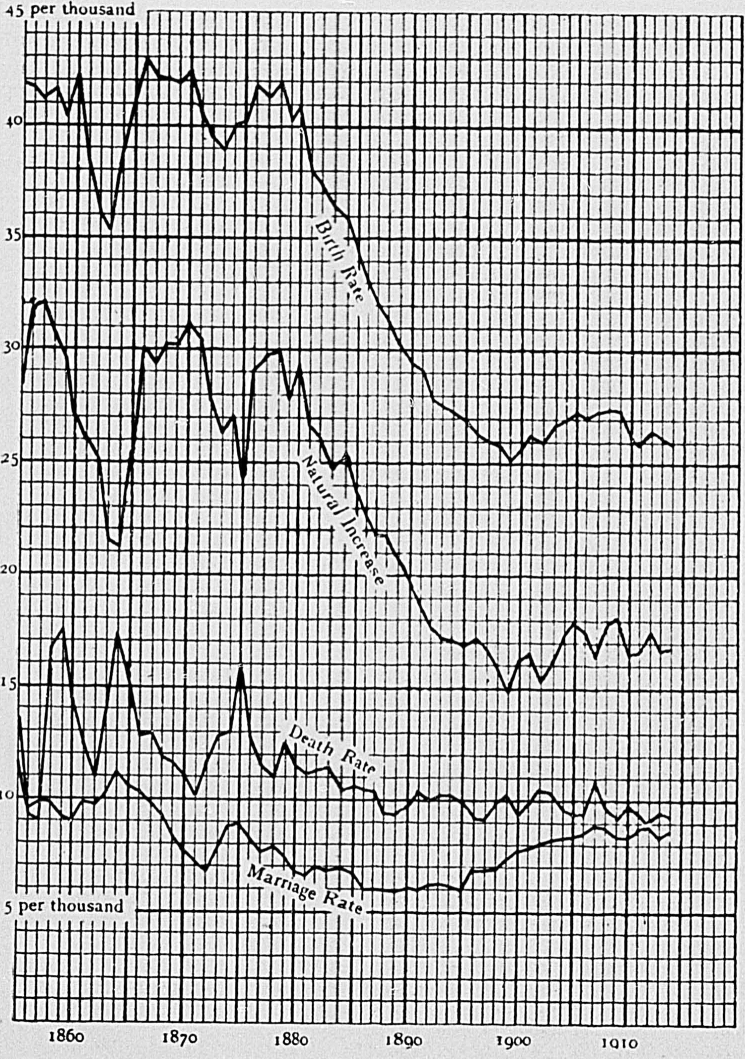
That fertility among women in New Zealand has decreased, from whatever causes, further facts will tend to show. Taking the number of married women in New Zealand at what may be considered the child-bearing ages (i.e., from 15 to 45 years, inclusive) as shown by each census since 1878, and for the same years the number of legitimate births (excluding plural) registered, the birth-rate per 1,000 married women of the above-stated ages is easily found, and is shown to be steadily declining. In 1878 the rate was 337 per 1,000, in 1896 it had fallen to 252, in 1901 to 244, in 1906 to 228, and in 1911 to 209; or, in other words, in 1878 one in every three of the married women between the ages specified gave birth to a child, while in 1911 the rate was only one in nearly five. The figures for each census year are given below.
| BIRTH-RATES (LEGITIMATE) PER 1,000 MARRIED WOMEN AT CHILD-BEARING AGES FOREACH CENSUS YEAR, 1878 TO 1911. | ||||
|---|---|---|---|---|
| Year (Census). | Number of Married Women between 15 and 45 Years of Age. | Proportion per Cent. of Married Women in the Female Population aged 15 to 45 Years. | Number of Legitimate Births (Confinements). | Birth-rate per 1,000 Married Women of from 15 to 45 Years of Age. |
| 1878 | 50,995 | 63.50 | 17,196 | 337.2 |
| 1881 | 57,458 | 59.76 | 18,003 | 313.3 |
| 1886 | 62,704 | 53.19 | 18,532 | 295.5 |
| 1891 | 63,165 | 48.12 | 17,455 | 276.3 |
| 1896 | 69,807 | 44.12 | 17,596 | 252.1 |
| 1901 | 79,406 | 43.30 | 19,355 | 243.8 |
| 1906 | 98,211 | 46.15 | 22,352 | 227.6 |
| 1911 | 119,355 | 49.59 | 24,972 | 209.2 |
Another table is given, showing for a period of thirty years the numbers of married women at quinquennial groups of age belonging to the full term 15 to 45 years, with the proportions that those numbers bear to every 100 married women living at 15–45. These proportions are found to have diminished appreciably at the earlier ages, 15–20 and 20–25; but the effect of this lesser number of wives at the earlier ages in reducing the birth-rate would not be serious. It is, however, undoubtedly a fact that to have a growing proportion of wives at the earlier productive ages is the best position, but it is not the one which obtains at present in New Zealand.
| MARRIED WOMEN UNDER 45 YEARS OF AGE.—NUMBERS AND PROPORTIONS PER CENT., IN AGE-GROUPS. | ||||||||
|---|---|---|---|---|---|---|---|---|
| Age-groups. | Married Women under 45, excluding Chinese | |||||||
| Numbers | Proportions per Cent. | |||||||
| 1881. | 1891. | 1901. | 1911. | 1881. | 1891. | 1901. | 1911. | |
| 15–20 | 1,233 | 750 | 777 | 968 | 2.14 | 1.19 | 0.98 | 0.81 |
| 20–25 | 8,996 | 8,862 | 10,053 | 12,829 | 15.66 | 14.03 | 12.66 | 10.75 |
| 25–30 | 13,133 | 14,540 | 17,923 | 27,762 | 22.86 | 23.02 | 22.57 | 23.26 |
| 30–35 | 12,656 | 14,576 | 19,617 | 30,992 | 22.03 | 23.08 | 24.70 | 25.96 |
| 35–40 | 11,811 | 12,959 | 16,854 | 25,466 | 20.55 | 20.51 | 21.23 | 21.34 |
| 40–45 | 9,629 | 11,478 | 14,182 | 21,338 | 16.76 | 18.17 | 17.86 | 17.88 |
| Totals | 57,458 | 63,165 | 79,406 | 119,355 | 100.00 | 100.00 | 100.00 | 100.00 |
In April, 1906, New Zealand had 102,745 children living under the age of five years, an increase of 15,939, or 18.36 per cent., on the figures for 1901; and in April, 1911, the number was 117,909, an increase of 15,164, or 14.76 per cent., on 1906; although the population at all ages increased in the quinquennium by only 13.49 per cent. Between 1891 and 1896 the increase was only 455, or 0.55 per cent., while between 1886 and 1891 the children living under five years actually decreased in number by 3,624, the increase of population of all ages (8.33 per cent.) being less than between 1891 and 1896 (12.24 per cent.), 1896 and 1901 (9.86 per cent.), or 1901 and 1906 (14.99 per cent.). The number of children under one year to the total population at all ages, and the proportion per 1,000, according to the results of six censuses, were,—
| Total Population (all Ages). | Children under One Year. | Children under One Year per 1,000 of Population. | |
|---|---|---|---|
| Census 1886 | 578,482 | 18,355 | 31.73 |
| ” 1891 | 626,658 | 16,443 | 26.24 |
| ” 1896 | 703,360 | 17,070 | 24.27 |
| ” 1901 | 772,719 | 18,381 | 23.79 |
| ” 1906 | 888,578 | 22,289 | 25.08 |
| ” 1911 | 1,008,468 | 24,340 | 24.14 |
Thus, in 1886, with a population of 578,482 persons, there were 18,355 children under one year, against 24,340 children of that age in 1911, with a population of 1,008,468 persons.
The births registered in 1885 were 19,693, against 25,984 in 1910. The birth-rate fell from 34.35 per 1,000 of the population in 1885 to 26.17 in 1910.
Deducting 1,760, the number of deaths of children under one year registered in 1910, from 25,984, the number of births for that year, leaves 24,224, or within 116 of the living children under one year at the time of the last census.
A little explanation is necessary in regard to the birth-rates of the four chief centres for 1913 and 1914 as compared with previous years.
As explained in last year's issue of this book, all births occurring in the four centres up to and including 1912 were treated as belonging to the centres. Owing chiefly to the fact that many women living in country districts go to the cities to enter public or private maternity homes, it was found that the birth-rates for the centres were usually well above the rate for the whole Dominion. For 1913 and 1914 information as to domicile of parents was obtained, and the births allocated accordingly, the result being that many births which in former years would have been included in the municipalized area were excluded, the rates being reduced accordingly. No proper comparison is therefore possible as between 1913 and previous years, the apparent decrease in 1913, as compared with 1912, being due not to any actual falling-off in numbers, but to the alteration in system explained above.
The total number of births registered as belonging to the four chief cities and their suburban boroughs in 1914 was 7,311, as against a total of 7,341 occurring in the municipalized areas for the previous year. The birth-rates last year were,—
| Birth-rates per 1,000 of Mean Population. | |
|---|---|
| Auckland City | 23.94 |
| ” and seven suburban boroughs | 24.78 |
| Wellington City | 25.25 |
| ” and four suburban boroughs | 25.38 |
| Christchurch City | 20.56 |
| ” and five suburban boroughs | 22.22 |
| Dunedin City | 20.87 |
| ” and five suburban boroughs | 21.70 |
By the inclusion of the suburbs the rate is lowered in the case of all four centres. Excluding the suburbs, it will be observed that Wellington has the highest rate, Auckland next highest, Dunedin and Christchurch following. The birth-rate for the Dominion last year was 25.99 per thousand, so that each of the four centres is below the average.
The rates for five years, 1910 to 1914, are given below. As stated above, however, the years 1913 and 1914 cannot properly be compared with previous years.
| Births per 1,000 of Population. | |||||
|---|---|---|---|---|---|
| 1910. | 1911. | 1912. | 1913. | 1914. | |
| Auckland (including suburbs) | 26.01 | 27.25 | 29.66 | 25.93 | 24.78 |
| Wellington “ | 24.19 | 26.08 | 27.49 | 24.67 | 25.38 |
| Christchurch “ | 25.83 | 26.84 | 28.29 | 24.31 | 22.22 |
| Dunedin “ | 25.29 | 26.52 | 27.13 | 22.53 | 21.70 |
The birth-rate of New Zealand in 1909 was higher than that of the Australian Commonwealth, 26.69 per 1,000 of population; but in 1913 while the Commonwealth rate increased to 28.05 per 1,000 of population, the rate in New Zealand decreased to 25.99.
The movement over ten years is calculated as follows:—
| BIRTH-RATES PER 1,000 OF POPULATION. | ||||||||||
|---|---|---|---|---|---|---|---|---|---|---|
| State. | 1905. | 1906. | 1907. | 1908. | 1909. | 1910. | 1911. | 1912. | 1913. | 1914. |
| Queensland | 25.76 | 26.15 | 26.79 | 26.79 | 27.29 | 27.33 | 27.65 | 29.67 | 30.24 | 29.46 |
| New South Wales | 26.85 | 27.21 | 27.34 | 26.99 | 27.40 | 27.83 | 28.75 | 29.86 | 28.86 | 28.96 |
| Victoria | 24.96 | 25.41 | 25.59 | 25.07 | 25.01 | 24.51 | 24.84 | 26.39 | 25.82 | 25.45 |
| South Australia | 24.54 | 24.57 | 25.05 | 25.81 | 25.91 | 26.50 | 26.89 | 28.65 | 29.08 | 29.33 |
| Western Australia | 30.74 | 30.66 | 30.18 | 30.08 | 28.87 | 27.99 | 28.21 | 28.83 | 29.36 | 28.45 |
| Tasmania | 28.50 | 28.94 | 28.63 | 29.95 | 28.91 | 29.25 | 28.57 | 30.53 | 30.03 | 30.33 |
| New Zealand | 27.22 | 27.08 | 27.30 | 27.45 | 27.29 | 26.17 | 25.97 | 26.48 | 26.14 | 25.99 |
The information contained in the following table is extracted from the Seventy-third Annual Report of the Registrar-General for England.
| LEGITIMATE-BIRTH RATES. | ||||
|---|---|---|---|---|
| Proportion of Legitimate Births per 1,000 Wives aged 15–45 Years. | ||||
| Approximate Periods. | ||||
| Country | 1880–2. | 1890–2. | 1900–2. | Increase (+) or Decrease (–) per Cent. in Fertility during 20 Years. |
| Australasia— | ||||
| New Zealand | 322.1 | 277.5 | 243.2 | -24.5 |
| Queensland | 329.0 | 320.6 | 252.8 | -23.2 |
| New South Wales | 337.8 | 298.5 | 234.3 | -30.6 |
| Victoria | 299.2 | 297.8 | 226.8 | -24.2 |
| South Australia | 326.5 | 307.5 | 235.0 | -28.0 |
| Western Australia | 323.9 | 338.8 | 246.4 | -23.9 |
| Tasmania | .. | 311.0 | 256.4 | .. |
| European Countries— | ||||
| England and Wales | 286.0 | 263.8 | 235.5 | -17.7 |
| Scotland | 311.5 | 296.4 | 271.8 | -12.7 |
| Ireland | 282.9 | 287.6 | 289.4 | + 2.3 |
| The Netherlands | 347.5 | 338.8 | 314.6 | - 9.5 |
| Norway | 314.5 | 306.8 | 302.8 | - 3.7 |
| German Empire | 310.2 | 300.9 | 284.2 | - 8.4 |
| Prussia | 312.6 | 307.6 | 290.4 | - 7.1 |
| Austria | 281.4 | 292.4 | 283.7 | + 0.8 |
| Italy | 276.2 | .. | 269.4 | - 2.5 |
| Sweden | 293.0 | 280.0 | 269.0 | - 8.2 |
| Switzerland | 284.1 | 274.0 | 265.9 | - 6.4 |
| Denmark | 287.1 | 278.1 | 259.1 | - 9.8 |
| Spain | 257.7 | 263.9 | 258.7 | + 0.4 |
| Belgium | 312.7 | 285.1 | 250.7 | -19.8 |
| France | 196.2 | 173.5 | 157.5 | -19.7 |
A further table shows the declining birth-rate and the marriage-rate in the United Kingdom.
| BIRTH AND MARRIAGE RATES INTHE UNITED KINGDOM, 1886, 1891, 1896, 1901, 1906, AND 1911. | |||||
|---|---|---|---|---|---|
| Year. | Mean Population. | Births. | Marriages. | ||
| Number. | Rate per 1,000 of Population. | Number. | Rate per 1,000 of Population. | ||
| 1886 | 36,313,582 | 1,145,577 | 31.5 | 241,180 | 6.6 |
| 1891 | 37,802,440 | 1,148,259 | 30.4 | 275,970 | 7.3 |
| 1896 | 39,599,072 | 1,152,144 | 29.0 | 296,089 | 7.5 |
| 1901 | 41,550,773 | 1,162,975 | 28.0 | 313,351 | 7.5 |
| 1906 | 43,353,000 | 1,170,622 | 27.0 | 325,842 | 7.5 |
| 1911 | 45,216,665 | 1,104,986 | 24.4 | 329,986 | 7.3 |
The birth-rates for ten years in Great Britain and Ireland, and certain countries of the European Continent, are also given. The decline is steady and continuous, except in the case of Roumania, where the rate is very high, and Ireland, where the rate is low.
| BIRTH-RATES IN EUROPEAN COUNTRIES, 1904 TO 1913. | ||||||||||
|---|---|---|---|---|---|---|---|---|---|---|
| Number of Births per 1,000 of Mean Population | ||||||||||
| Country. | 1904. | 1905. | 1906. | 1907. | 1908. | 1909. | 1910. | 1911. | 1912. | 1913. |
| Roumania | 40.1 | 38.3 | 39.9 | 41.1 | 40.3 | 41.1 | 39.2 | 42.3 | 43.4 | 42.1 |
| Hungary | 37.4 | 36.3 | 36.5 | 36.7 | 36.9 | 37.7 | 35.7 | 35.0 | 36.3 | .. |
| Spain | 34.3 | 35.2 | 34.0 | 33.6 | 34.0 | 33.5 | 33.1 | 31.2 | 32.6 | 30.4 |
| Italy | 32.9 | 32.7 | 32.1 | 31.7 | 33.7 | 32.7 | 33.3 | 31.5 | 32.4 | .. |
| Austria | 35.6 | 33.9 | 35.0 | 34.0 | 33.7 | 33.4 | 32.5 | 31.4 | 31.3 | .. |
| German Empire | 34.1 | 32.9 | 33.1 | 32.3 | 32.1 | 31.0 | 29.8 | 28.6 | 28.3 | .. |
| Netherlands | 31.4 | 30.8 | 30.4 | 30.0 | 29.7 | 29.1 | 28.6 | 27.8 | 28.1 | 28.1 |
| Denmark | 28.9 | 28.4 | 28.5 | 28.2 | 28.5 | 28.2 | 27.5 | 26.7 | 26.7 | 25.6 |
| Scotland | 29.1 | 28.6 | 28.6 | 27.7 | 28.1 | 27.3 | 26.2 | 25.6 | 25.9 | 25.5 |
| Norway | 28.1 | 27.4 | 26.7 | 26.4 | 26.3 | 26.3 | 26.1 | 25.9 | 25.6 | 25.2 |
| Switzerland | 27.3 | 26.9 | 26.9 | 26.2 | 26.4 | 25.5 | 25.0 | 24.2 | 24.1 | .. |
| England and Wales | 28.0 | 27.3 | 27.2 | 26.5 | 26.7 | 25.8 | 25.1 | 24.4 | 23.8 | 23.9 |
| Sweden | 25.8 | 25.7 | 25.7 | 25.5 | 25.7 | 25.6 | 24.7 | 24.0 | 23.7 | 23.1 |
| Ireland | 23.6 | 23.4 | 23.5 | 23.2 | 23.3 | 23.4 | 23.3 | 23.2 | 23.0 | 22.8 |
| Belgium | 27.1 | 26.1 | 25.7 | 25.3 | 24.9 | 23.7 | 23.7 | 22.9 | 22.6 | .. |
| France | 20.9 | 20.6 | 20.6 | 19.7 | 20.1 | 19.5 | 19.6 | 18.7 | 19.0 | 19.0 |
The figures show that during each year there has been a preponderance of births of male children. It would appear, however, that this excess of male births is not sufficient to compensate for the heavier mortality which occurs amongst that sex. Of the total population of New Zealand in 1871 there were 70.52 females to every 100 males, but at the census of 1911 the proportion of females to 100 males had risen to 89.59.
| Number of Births of | |||
|---|---|---|---|
| Year. | Males. | Females. | Proportion of Births of Males to every 100 Females. |
| 1895 | 9,493 | 9,053 | 104.9 |
| 1896 | 9,511 | 9,101 | 104.5 |
| 1897 | 9,600 | 9,137 | 105.1 |
| 1898 | 9,615 | 9,340 | 102.9 |
| 1899 | 9,724 | 9,111 | 106.7 |
| 1900 | 10,107 | 9,439 | 107.1 |
| 1901 | 10,471 | 10,020 | 104.5 |
| 1902 | 10,653 | 10,002 | 106.5 |
| 1903 | 11,217 | 10,612 | 105.7 |
| 1904 | 11,762 | 11,004 | 106.9 |
| 1905 | 12,109 | 11,573 | 104.6 |
| 1906 | 12,397 | 11,855 | 104.6 |
| 1907 | 12,835 | 12,259 | 104.7 |
| 1908 | 13,369 | 12,571 | 106.3 |
| 1909 | 13,502 | 13,022 | 103.7 |
| 1910 | 13,442 | 12,542 | 107.2 |
| 1911 | 13,532 | 12,822 | 105.5 |
| 1912 | 13,996 | 13,512 | 103.6 |
| 1913 | 14,433 | 13,502 | 106.9 |
| 1914 | 14,535 | 13,803 | 105.3 |
There were 350 cases of twin births (700 children) and 6 cases of triplets registered in 1914. The number of children born was 28,338; the number of mothers was 27,976: thus, on an average, one mother in every 79 gave birth to twins, against 87 in 1913, 82 in 1912, 86 in 1911, and 89 in 1910.
The number of plural births and the proportion per 1,000 of all births during the past five years was,—
| Year. | All Births. | Cases of Twins. | Cases of Triplets. | Plural Births per 1,000 of all Births. |
|---|---|---|---|---|
| 1910 | 25,984 | 288 | 2 | 11.16 |
| 1911 | 26,354 | 300 | 2 | 11.46 |
| 1912 | 27,508 | 329 | 3 | 12.07 |
| 1913 | 27,935 | 314 | 1 | 11.28 |
| 1914 | 28,338 | 350 | 6 | 12.56 |
Of the twin births registered in 1914, it is found that in 105 cases both children were males, and in 116 cases both females, while in the remaining 130 cases the children were of opposite sex. In one of the cases of triplets all three children were females, in one case two were males and the other a female, and in each of the other four cases two children were females and one a male.
Information as to the relative ages of parents of legitimate children whose births were registered in 1914 is shown in the following table:—
| RELATIVE AGES OF PARENTS. | ||||||||||||
|---|---|---|---|---|---|---|---|---|---|---|---|---|
| Age of Fathers, in Years. | ||||||||||||
| Age of Mother, in Years. | Under 21. | 21 and under 25. | 25 and under 30. | 30 and under 35. | 35 and under 40. | 40 and under 45. | 45 and under 50. | 50 and under 55. | 55 and under 65. | 65 and over. | Not stated. | Totals. |
| (a.) Single Births. | ||||||||||||
* Includes twenty-six cases where plural births would have been registered had not one child been still-born. * Includes six cases of triplets. | ||||||||||||
| 15 and under 16 | .. | .. | 1 | .. | .. | .. | .. | .. | .. | .. | .. | 1 |
| 16 “ 17 | .. | 7 | 5 | .. | .. | .. | .. | 1 | .. | .. | .. | 13 |
| 17 “ 18 | 4 | 18 | 22 | 4 | 1 | 1 | .. | .. | .. | 1 | .. | 51 |
| 18 “ 19 | 10 | 92 | 59 | 15 | 5 | 1 | .. | .. | .. | .. | .. | 182 |
| 19 “ 20 | 24 | 148 | 133 | 54 | 10 | 1 | 4 | .. | .. | .. | .. | 374 |
| 20 “ 21 | 13 | 189 | 245 | 79 | 24 | 5 | .. | 1 | .. | .. | .. | 556 |
| 21 “ 25 | 21 | 861 | 2,144 | 1,051 | 313 | 74 | 17 | 5 | 2 | .. | .. | 4,488 |
| 25 “ 30 | 6 | 302 | 3,023 | 3,167 | 1,303 | 335 | 104 | 23 | 9 | .. | .. | 8,272 |
| 30 “ 35 | 1 | 31 | 640 | 2,789 | 2,175 | 834 | 243 | 67 | 29 | 5 | .. | 6,814 |
| 35 “ 40 | .. | 1 | 83 | 499 | 1,656 | 1,134 | 557 | 145 | 65 | 10 | .. | 4,150 |
| 40 “ 45 | .. | 2 | 4 | 38 | 164 | 502 | 352 | 164 | 65 | 6 | .. | 1,297 |
| 45 “ 46 | .. | .. | .. | 1 | 1 | 14 | 41 | 12 | 8 | .. | .. | 77 |
| 46 “ 47 | .. | .. | 1 | .. | 1 | 1 | 18 | 12 | 6 | .. | .. | 39 |
| 47 “ 48 | .. | .. | .. | .. | .. | 2 | 3 | 7 | .. | .. | .. | 12 |
| 48 “ 49 | .. | .. | .. | .. | 1 | .. | 2 | 4 | 1 | .. | .. | 8 |
| 49 “ 50 | .. | .. | .. | .. | .. | 1 | 2 | 1 | .. | .. | .. | 4 |
| 50 “ 51 | .. | .. | .. | .. | .. | .. | .. | 1 | 1 | .. | .. | 2 |
| Not stated | .. | .. | .. | .. | .. | .. | .. | .. | .. | .. | 1 | 1 |
| Totals | 79 | 1,651 | 6,360 | 7,697 | 5,654 | 2,905 | 1,343 | 443 | 186 | 22 | 1 | 26,341* |
| (b.) Plural Births. | ||||||||||||
| 16 and under 17 | .. | 1 | .. | .. | .. | .. | .. | .. | .. | .. | .. | 1 |
| 18 “ 19 | 1 | 2 | .. | .. | .. | .. | .. | .. | .. | .. | .. | 3 |
| 19 “ 20 | .. | .. | 1 | .. | .. | .. | .. | .. | .. | .. | .. | 1 |
| 20 “ 21 | .. | 4 | 4 | .. | .. | .. | .. | .. | .. | .. | .. | 8 |
| 21 “ 25 | .. | 5 | 18 | 5 | 3 | 1 | .. | .. | .. | .. | .. | 32 |
| 25 “ 30 | .. | 6 | 28 | 46 | 17 | 3 | .. | .. | .. | 1 | .. | 101 |
| 30 “ 35 | 1 | 2 | 18 | 37 | 28 | 13 | 7 | 1 | 1 | .. | .. | 108 |
| 35 “ 40 | .. | .. | .. | 10 | 34 | 19 | 8 | 1 | .. | .. | .. | 72 |
| 40 “ 45 | .. | .. | .. | 1 | 2 | 11 | 4 | 1 | .. | .. | .. | 19 |
| Totals | 2 | 20 | 69 | 99 | 84 | 47 | 19 | 3 | 1 | 1 | .. | 345* |
| Grand totals | 81 | 1,671 | 6,429 | 7,796 | 5,738 | 2,952 | 1,362 | 446 | 187 | 23 | 1 | 26,686 |
Information as to the previous issue of the parents is now required in connection with the registration of births. Tables are given showing information as to number of previous issue in conjunction with (1) age of mother, and (2) duration of marriage.
| LEGITIMATE BIRTHS REGISTERED, 1914. | |||||||||||
|---|---|---|---|---|---|---|---|---|---|---|---|
| (a) Age of Mother and Number of Previous Issue. | |||||||||||
| Age of Mother. | Number of Previous Issue. | Totals. | |||||||||
| Not Stated. | 0 | 1 | 2 | 3 | 4 | 5 | 6 and under 10 | 10 and under 15 | 15 and over. | ||
* This number represents 26,341 single cases and 345 plural cases. | |||||||||||
| 15 and under 16 | .. | 1 | .. | .. | .. | .. | .. | .. | .. | .. | 1 |
| 16 “ 17 | .. | 14 | .. | .. | .. | .. | .. | .. | .. | .. | 14 |
| 17 “ 18 | .. | 46 | 4 | 1 | .. | .. | .. | .. | .. | .. | 51 |
| 18 “ 19 | 1 | 165 | 18 | 1 | .. | .. | .. | .. | .. | .. | 185 |
| 19 “ 20 | 1 | 288 | 74 | 12 | .. | .. | .. | .. | .. | .. | 375 |
| 20 “ 21 | 3 | 376 | 156 | 26 | 2 | 1 | .. | .. | .. | .. | 564 |
| 21 “ 25 | 44 | 2,365 | 1,356 | 536 | 172 | 34 | 9 | 4 | .. | .. | 4,520 |
| 25 “ 30 | 91 | 2,674 | 2,280 | 1,585 | 943 | 488 | 190 | 122 | .. | .. | 8,373 |
| 30 “ 35 | 83 | 1,192 | 1,395 | 1,355 | 1,096 | 766 | 458 | 563 | 14 | .. | 6,922 |
| 35 “ 40 | 27 | 422 | 529 | 600 | 644 | 561 | 462 | 872 | 102 | 3 | 4,222 |
| 40 “ 45 | 9 | 89 | 115 | 113 | 144 | 136 | 133 | 439 | 131 | 7 | 1,316 |
| 45 “ 46 | 1 | 2 | 7 | 3 | 4 | 2 | 7 | 39 | 11 | 1 | 77 |
| 46 “ 47 | .. | 2 | 1 | 4 | .. | 2 | 3 | 14 | 10 | 3 | 39 |
| 47 “ 48 | .. | 2 | .. | 2 | .. | 1 | .. | 4 | 2 | 1 | 12 |
| 48 “ 49 | .. | .. | 1 | .. | .. | 1 | .. | 2 | 4 | .. | 8 |
| 49 “ 50 | .. | .. | 1 | 1 | .. | .. | 1 | .. | 1 | .. | 4 |
| 50 “ 51 | .. | .. | .. | .. | .. | .. | .. | 1 | 1 | .. | 2 |
| Not stated | 1 | .. | .. | .. | .. | .. | .. | .. | .. | .. | 1 |
| Totals | 261 | 7,638 | 5,937 | 4,239 | 3,005 | 1,992 | 1,263 | 2,060 | 276 | 15 | 26,686* |
| (b) Duration of Marriage and Number of Previous Issue. | |||||||||||
|---|---|---|---|---|---|---|---|---|---|---|---|
| Duration of Marriage, in Years. | Number of Previous Issue. | Totals | |||||||||
| Not Stated | 0 | 1 | 2 | 3 | 4 | 5 | 6 and under 10 | 10 and under 15 | 15 and over. | ||
| * This number represents 26,341 single cases and 345 plural cases. | |||||||||||
| Under 1 | 9 | 4,044 | 20 | .. | .. | .. | .. | .. | .. | .. | 4,073 |
| 1 and under 2 | 12 | 2,186 | 851 | 18 | .. | .. | .. | .. | .. | .. | 3,067 |
| 2 “ 3 | 88 | 689 | 1,914 | 164 | 2 | .. | .. | .. | .. | .. | 2,857 |
| 3 “ 4 | 37 | 262 | 1,164 | 683 | 57 | 3 | 1 | .. | .. | .. | 2,207 |
| 4 “ 5 | 27 | 144 | 665 | 867 | 222 | 20 | 2 | .. | .. | .. | 1,947 |
| 5 “ 6 | 21 | 90 | 445 | 679 | 441 | 69 | 8 | 3 | .. | .. | 1,756 |
| 6 “ 7 | 8 | 59 | 313 | 531 | 524 | 183 | 36 | 3 | .. | .. | 1,657 |
| 7 “ 8 | 5 | 41 | 183 | 377 | 428 | 268 | 67 | 19 | .. | .. | 1,388 |
| 8 “ 9 | 4 | 37 | 115 | 259 | 365 | 281 | 115 | 39 | .. | .. | 1,215 |
| 9 “ 10 | 6 | 22 | 79 | 199 | 234 | 253 | 142 | 76 | .. | .. | 1,011 |
| 10 “ 15 | 32 | 52 | 153 | 405 | 614 | 750 | 659 | 965 | 25 | .. | 3,655 |
| 15 “ 20 | 7 | 10 | 30 | 52 | 105 | 153 | 201 | 708 | 103 | .. | 1,369 |
| 20 “ 25 | 4 | 2 | 5 | 5 | 13 | 11 | 29 | 229 | 122 | 11 | 431 |
| 25 and over | .. | .. | .. | .. | .. | 1 | 3 | 18 | 26 | 4 | 52 |
| Not stated | 1 | .. | .. | .. | .. | .. | .. | .. | .. | .. | 1 |
| Totals | 261 | 7,638 | 5,937 | 4,239 | 3,005 | 1,992 | 1,263 | 2,060 | 276 | 15 | 26,686* |
In these two tables plural births are included, twins counting as only one birth. Another table is appended, giving in more detail the duration of the marriage in cases where less than one year had elapsed before the birth of the first child. Illegitimate births are also shown.
| FIRST ISSUE AND ILLEGITIMATE BIRTHS, 1914. | ||||||||||
|---|---|---|---|---|---|---|---|---|---|---|
| Age of Mother, in Years. | Illegitimate Births. | Duration of Marriage, in Months. | Total Legitimate First Births within One Year after Marriage. | |||||||
| Under 3. | 3 and under 6. | 6 and under 7. | 7 and under 8. | 8 and under 9. | 9 and under 10. | 10 and under 11. | 11 and under 12. | |||
| Under 21 | 577 | 118 | 266 | 105 | 64 | 42 | 53 | 50 | 30 | 728 |
| 21 and under 25 | 247 | 125 | 301 | 159 | 111 | 139 | 277 | 226 | 171 | 1,509 |
| 25 “ 30 | 235 | 72 | 185 | 94 | 77 | 108 | 270 | 238 | 203 | 1,247 |
| 30 “ 35 | 122 | 23 | 48 | 28 | 26 | 31 | 90 | 103 | 61 | 410 |
| 35 “ 40 | 81 | 9 | 14 | 9 | 15 | 13 | 28 | 20 | 20 | 128 |
| 40 “ 45 | 25 | 4 | 2 | 3 | 1 | 2 | 1 | 4 | 2 | 19 |
| 45 and over | 4 | .. | 1 | .. | .. | .. | 1 | 1 | .. | 3 |
| Totals | 1,291 | 351 | 817 | 398 | 294 | 335 | 720 | 642 | 487 | 4,044 |
A table is added showing occupations of fathers in cases of legitimate births registered during 1914. In conjunction with the information as to occupations, numbers of previous issue have been extracted, and are shown in certain groups of numbers. A table giving full details is published in the Statistics of the Dominion of New Zealand.
| BIRTHS, 1914.—OCCUPATIONS OF FATHERS, WITH NUMBER OF PREVIOUS ISSUE. | |||||||
|---|---|---|---|---|---|---|---|
| Previous Issue. | |||||||
| Occupations of Fathers. | Not stated | 0 | 1 and under 5. | 5 and under 10. | 10 and under 15. | 15 and under 20. | Totals. |
| Class I.—Professional. | |||||||
| General Government | 2 | 39 | 74 | 9 | .. | .. | 124 |
| Local Government | .. | 9 | 26 | 7 | 1 | .. | 43 |
| Defence | .. | 27 | 58 | 3 | .. | .. | 88 |
| Law and order | 7 | 79 | 161 | 15 | 4 | .. | 266 |
| Religion | .. | 34 | 63 | 5 | .. | .. | 102 |
| Health | 4 | 90 | 115 | 7 | .. | .. | 216 |
| Literature | .. | 10 | 39 | .. | .. | .. | 49 |
| Science | 1 | 1 | 3 | .. | .. | .. | 5 |
| Civil, mechanical engineering, architecture, and surveying | 1 | 46 | 63 | 7 | 1 | .. | 118 |
| Education | 4 | 53 | 105 | 7 | .. | .. | 169 |
| Fine arts | 1 | 9 | 36 | 4 | 1 | .. | 51 |
| Music | 1 | 15 | 13 | 3 | 1 | .. | 33 |
| Amusements | .. | 17 | 36 | 8 | .. | .. | 61 |
| Total Professional | 21 | 429 | 792 | 75 | 8 | .. | 1,325 |
| Class II.—Domestic. | |||||||
| Hotelkeepers and assistants | .. | 44 | 99 | 13 | .. | .. | 156 |
| Others engaged in providing board and lodging | .. | 14 | 36 | 3 | 1 | .. | 54 |
| Cooks | .. | 36 | 25 | 5 | .. | .. | 66 |
| Coachmen and grooms | 1 | 8 | 14 | 3 | .. | .. | 26 |
| Hairdressers and barbers | .. | 34 | 72 | 7 | .. | .. | 113 |
| Others engaged in domestic service | .. | 12 | 21 | 11 | .. | .. | 44 |
| Total Domestic | 1 | 148 | 267 | 42 | 1 | .. | 459 |
| Class III.—Commercial. | |||||||
| Banking and finance | 1 | 35 | 64 | 3 | .. | .. | 103 |
| Insurance and valuation | 1 | 33 | 55 | 10 | 3 | .. | 102 |
| Land and household property | .. | 19 | 45 | 8 | 1 | .. | 73 |
| Trade— | |||||||
| Books, stationery, advertisements, &c. | 1 | 24 | 28 | 7 | .. | .. | 60 |
| Musical instruments | .. | 2 | 4 | 1 | .. | .. | 7 |
| Prints, pictures, and art materials | .. | .. | 2 | .. | .. | .. | 2 |
| Ornaments, minor art products | .. | 2 | 1 | 1 | .. | .. | 4 |
| Watches, clocks, jewellery, &c. | .. | .. | 2 | .. | .. | .. | 2 |
| Machinery, tools, and implements | .. | 2 | 5 | .. | .. | .. | 7 |
| Carriages and vehicles | 1 | 11 | 28 | 1 | .. | .. | 41 |
| Ships, boats, and marine stores | .. | .. | 3 | 1 | .. | .. | 4 |
| Building materials and house-fittings | .. | .. | 2 | .. | .. | .. | 2 |
| Furniture | .. | 3 | 7 | 2 | .. | .. | 12 |
| Textile fabrics | 3 | 109 | 144 | 18 | .. | .. | 274 |
| Dress | 2 | 19 | 30 | 3 | .. | .. | 54 |
| Animal food | 8 | 166 | 279 | 56 | 5 | .. | 514 |
| Vegetable food | 1 | 30 | 39 | 8 | 1 | .. | 79 |
| Groceries, drinks, narcotics, and stimulants | 2 | 92 | 143 | 19 | .. | .. | 256 |
| Living animals | 2 | 31 | 67 | 9 | .. | .. | 109 |
| Leather, raw materials, &c. | .. | .. | 2 | .. | .. | .. | 2 |
| Wool, and other animal matter | .. | 6 | 11 | .. | .. | .. | 17 |
| Seeds, plants, flowers, &c. | .. | 11 | 11 | 1 | .. | .. | 23 |
| Timber | 1 | 3 | 13 | 4 | .. | .. | 21 |
| Wood, coal, &c. | .. | 7 | 22 | 6 | 1 | .. | 36 |
| Stone, clay, earthenware, &c. | .. | 2 | .. | .. | .. | .. | 2 |
| Metals, other than gold or silver | 2 | 23 | 39 | 2 | 2 | .. | 68 |
| Merchants, shopkeepers, &c. | 3 | 80 | 201 | 36 | 2 | .. | 322 |
| Dealers, hawkers | .. | 10 | 17 | 6 | 2 | .. | 35 |
| Agents, brokers, &c. | .. | 24 | 48 | 11 | .. | .. | 83 |
| Officers of public companies | 2 | 14 | 25 | 2 | .. | .. | 43 |
| Accountants, clerks, &c. | 6 | 274 | 396 | 35 | 1 | .. | 712 |
| Commercial travellers, salesmen | 4 | 153 | 201 | 21 | 3 | .. | 382 |
| Storemen (so described), and others engaged in storage | 2 | 90 | 168 | 23 | 2 | .. | 285 |
| Other mercantile persons | .. | 8 | 2 | 1 | .. | .. | 11 |
| Total, Commercial | 42 | 1,283 | 2,104 | 295 | 23 | .. | 3,747 |
| Class IV.—Transport and Communication. | |||||||
| Railway traffic | 8 | 278 | 569 | 97 | 5 | .. | 957 |
| Tramways | 4 | 47 | 118 | 9 | .. | .. | 178 |
| Road | 7 | 345 | 564 | 150 | 17 | 1 | 1,084 |
| Sea and river traffic | 4 | 132 | 268 | 52 | 2 | .. | 458 |
| Postal service | 1 | 30 | 55 | 8 | .. | .. | 94 |
| Telegraph and telephone service | 1 | 71 | 93 | 7 | .. | .. | 172 |
| Delivery of parcels, &c., by hand | .. | 9 | 1 | 2 | .. | .. | 12 |
| Total, Transport and Communication | 25 | 912 | 1,668 | 325 | 24 | 1 | 2,955 |
| Class V.—Industrial. | |||||||
| Books and publications | 4 | 67 | 113 | 17 | .. | .. | 201 |
| Musical instruments | .. | 5 | 4 | 1 | .. | .. | 10 |
| Prints, pictures, and art materials | .. | 8 | 11 | 1 | .. | .. | 20 |
| Ornaments and minor art products | 1 | 11 | 8 | 2 | .. | .. | 22 |
| Equipment for sports and games | .. | 1 | 1 | .. | .. | .. | 2 |
| Designs, medals, type, and dies | .. | 11 | 5 | .. | .. | .. | 16 |
| Watches, clocks, and scientific instruments | .. | 9 | 19 | 2 | .. | .. | 30 |
| Arms, ammunition, and explosives | .. | 2 | 3 | 1 | .. | .. | 6 |
| Engines, machines, tools, &c. | 2 | 63 | 105 | 19 | 1 | .. | 190 |
| Carriages and vehicles | 1 | 66 | 96 | 14 | 3 | .. | 180 |
| Harness, saddlery, leatherware | 3 | 25 | 64 | 7 | 1 | .. | 100 |
| Ships, boats, and equipments | .. | 10 | 25 | 6 | 1 | .. | 42 |
| Furniture | 1 | 66 | 113 | 13 | 1 | .. | 194 |
| Building-material (wood) | 5 | 113 | 275 | 62 | 4 | .. | 459 |
| Chemicals and by-products | .. | .. | 5 | .. | .. | .. | 5 |
| Textile fabrics | .. | 14 | 20 | 2 | .. | .. | 36 |
| Dress | 4 | 123 | 247 | 54 | 5 | .. | 433 |
| Fibrous material | 1 | 12 | 24 | 12 | .. | .. | 49 |
| Animal food | 2 | 79 | 142 | 25 | 2 | .. | 250 |
| Vegetable food | 1 | 82 | 151 | 33 | 3 | .. | 270 |
| Groceries, drinks, narcotics, and stimulants | .. | 24 | 50 | 4 | .. | .. | 78 |
| Soap and candles, currier, &c. | 1 | 11 | 27 | 6 | 1 | .. | 46 |
| Working in wood, n.o.e. | .. | 1 | 6 | 1 | .. | .. | 8 |
| Paper-manufacture | .. | 1 | 1 | 1 | .. | .. | 3 |
| Marble, clay, cement, glass, &c. | 1 | 12 | 43 | 9 | .. | .. | 65 |
| Precious metals | 2 | 21 | 24 | 3 | .. | .. | 50 |
| Metals, other than gold or silver | 12 | 168 | 338 | 64 | 7 | 1 | 590 |
| Fuel, light, &c. | 2 | 59 | 72 | 9 | .. | .. | 142 |
| Building and construction— | |||||||
| Builders and contractors | 6 | 90 | 180 | 27 | 1 | .. | 304 |
| Stonemasons | .. | 5 | 12 | 4 | .. | .. | 21 |
| Bricklayers | 1 | 33 | 87 | 17 | 1 | .. | 139 |
| Carpenters | 12 | 266 | 462 | 104 | 4 | 1 | 849 |
| Slaters, tillers | .. | 1 | 4 | .. | .. | .. | 5 |
| Plasterers | .. | 16 | 33 | 5 | .. | .. | 54 |
| Painters and glaziers | 2 | 117 | 204 | 32 | 2 | .. | 357 |
| Signwriters | .. | 5 | 8 | 3 | .. | .. | 16 |
| Plumbers and gasfitters | 1 | 82 | 129 | 23 | 1 | .. | 236 |
| Roads, railways, and earthworks | 3 | 20 | 87 | 21 | 2 | .. | 133 |
| Disposal of dead | .. | 2 | 4 | 2 | .. | .. | 8 |
| Disposal of refuse | .. | .. | 3 | .. | .. | .. | 3 |
| Other industrial workers— | |||||||
| Mechanics, manufacturers | .. | 30 | 34 | 4 | 1 | .. | 69 |
| Factory-worker manager, &c. | 3 | 49 | 73 | 6 | 1 | .. | 132 |
| Engineers, engine-drivers | 8 | 202 | 441 | 81 | 2 | 1 | 735 |
| Machinists | .. | 24 | 49 | 8 | .. | .. | 81 |
| Contractors, managers, &c. | 2 | 74 | 155 | 58 | 5 | .. | 294 |
| Labourers, undefined | 22 | 854 | 1,933 | 566 | 56 | 8 | 3,439 |
| Total, Industrial | 103 | 2,934 | 5,890 | 1,329 | 105 | 11 | 10,372 |
| Class VI.—Agriculture, Pastoral, and Mining Pursuits, &c. | |||||||
| Bees and wild animals | .. | 5 | 15 | 2 | .. | .. | 22 |
| Fisheries | .. | 13 | 39 | 18 | .. | .. | 70 |
| Forestry | 1 | 45 | 98 | 26 | .. | .. | 170 |
| Conservation of water | .. | 4 | 5 | 2 | .. | .. | 11 |
| Kauri-gum diggers | 2 | 4 | 14 | 2 | .. | .. | 22 |
| Fruit-growers | .. | 21 | 56 | 10 | 1 | .. | 88 |
| Gardeners | 2 | 70 | 157 | 30 | 2 | .. | 261 |
| Other agricultural pursuits | .. | 9 | 13 | 4 | 1 | .. | 27 |
| Sheep-farmers | 8 | 162 | 297 | 57 | 4 | .. | 528 |
| Dairy -farmers | 1 | 6 | 41 | 11 | 2 | .. | 61 |
| Other pastoral pursuits | .. | 14 | 40 | 8 | 1 | .. | 63 |
| Farming undefined | 48 | 1,393 | 3,255 | 950 | 94 | 3 | 5,743 |
| Coal-mining | 5 | 1 | 181 | 45 | 5 | .. | 317 |
| Gold-mining | .. | 1 | 161 | 70 | 3 | .. | 305 |
| Mining and quarrying, other, or undefined | 1 | 26 | 66 | 20 | 2 | .. | 115 |
| Total, Agricultural, &c. | 68 | 1,924 | 4,438 | 1,255 | 115 | 3 | 7,803 |
| Class VII.—Indefinite. | |||||||
| Independent means | .. | 5 | 5 | .. | .. | .. | 10 |
| Retired | .. | 3 | 8 | 2 | .. | .. | 13 |
| Not stated | 1 | .. | .. | .. | .. | .. | 1 |
| Total, Indefinite | 1 | 8 | 13 | 2 | .. | .. | 24 |
| Total, all classes | 261 | 7,638 | 15,172 | 3,323 | 276 | 15 | 26,685 |
The births of 1,302 children were illegitimate: thus 46 in every 1,000 children registered were born out of wedlock, against 42 in 1913, 43 in 1912, and 41 in 1911.
The ages of the mothers of the illegitimate children registered during the year are as shown below. It will be seen that of the 1,291 mothers, 477 or 36.95 per cent. were under 21 years of age.
| ILLEGITIMATE CHILDREN, 1914.—AGES OF MOTHERS. | ||
|---|---|---|
| Age. | Single Cases. | Plural Cases. |
| Years. | ||
| 14 | 7 | .. |
| 15 | 17 | .. |
| 16 | 38 | .. |
| 17 | 73 | .. |
| 18 | 110 | .. |
| 19 | 115 | 1 |
| 20 | 114 | 2 |
| 21 | 102 | .. |
| 22 | 84 | 1 |
| 23 | 80 | .. |
| 24 | 80 | .. |
| 25 | 54 | .. |
| 26 | 59 | 1 |
| 27 | 38 | 1 |
| 28 | 44 | 2 |
| 29 | 36 | .. |
| 30 | 30 | .. |
| 31 | 20 | .. |
| 32 | 22 | .. |
| 33 | 19 | .. |
| 34 | 31 | .. |
| 35 | 17 | .. |
| 36 | 16 | 1 |
| 37 | 10 | .. |
| 38 | 20 | 1 |
| 39 | 15 | 1 |
| 40 | 7 | .. |
| 41 | 6 | .. |
| 42 | 6 | .. |
| 43 | 1 | .. |
| 44 | 5 | .. |
| 45 | 3 | .. |
| 46 | 1 | .. |
| Totals | 1,280 | 11 |
The proportion of illegitimate births per 1,000 unmarried women—i.e., spinsters and widows—at the reproductive ages, covering a period of twenty years, is shown.
| Year. | Unmarried Women aged 15–45 Years. | Illegitimate Births. | Illegitimate-birth Rate per 1,000 Unmarried Women. |
|---|---|---|---|
| 1891 | 68,990 | 638 | 9.25 |
| 1896 | 89,722 | 834 | 9.30 |
| 1901 | 105,420 | 937 | 8.89 |
| 1906 | 116,506 | 1,132 | 9.72 |
| 1911 | 116,726 | 1,078 | 9.24 |
The rates of illegitimacy in Australasia are quoted. For 1911 and 1912 the rate was lower in New Zealand than in any of the Australian States, but in 1913 the New Zealand rate was slightly higher than that of South Australia.
| PROPORTION OF ILLEGITIMATE BIRTHS INEVERY 100 BIRTHS. | |||||||
|---|---|---|---|---|---|---|---|
| Year. | Queensland. | New South Wales. | Victoria. | South Australia. | Western Australia. | Tasmania. | New Zealand. |
| 1904 | 6.90 | 7.12 | 5.74 | 4.00 | 4.36 | 5.82 | 4.52 |
| 1905 | 6.97 | 7.37 | 5.61 | 4.36 | 4.19 | 5.52 | 4.57 |
| 1906 | 7.68 | 7.04 | 5.58 | 3.99 | 4.78 | 5.78 | 4.67 |
| 1907 | 7.68 | 6.92 | 5.62 | 4.10 | 3.86 | 5.78 | 4.61 |
| 1908 | 7.54 | 6.80 | 5.77 | 4.44 | 4.35 | 5.24 | 4.26 |
| 1909 | 7.05 | 6.44 | 5.94 | 4.18 | 3.95 | 5.45 | 4.61 |
| 1910 | 6.39 | 6.28 | 5.60 | 4.32 | 4.13 | 5.33 | 4.47 |
| 1911 | 6.22 | 6.14 | 5.96 | 4.21 | 4.47 | 5.33 | 4.09 |
| 1912 | 6.14 | 5.64 | 5.72 | 4.71 | 4.39 | 4.78 | 4.28 |
| 1913 | 6.22 | 5.35 | 6.03 | 4.18 | 4.40 | 5.18 | 4.23 |
These figures show the proportion of illegitimate births to every 100 births for New Zealand to be fairly steady during the period, the rate for 1911, 1912, and 1913, however, being somewhat below the average.
An important Act was passed in 1894 and re-enacted in 1908, intituled the Legitimation Act, which makes provision for the legitimation of children born before marriage on the subsequent intermarriage of their parents. Under this Act any child born out of wedlock, whose parents afterwards intermarry, is deemed to be legitimized by such marriage on the birth being registered in the manner prescribed by the Act. For legitimation purposes Registrars must register a birth when called upon to do so by any person claiming to be the father of an illegitimate child; but such person is required to make a solemn declaration that he is the father, and that at the time of the birth there existed no legal impediment to his marriage with the mother of the child. He has also to produce the evidence of his marriage. It will thus be seen that registration becomes the test of legitimacy. The following is the number of legitimations in each year, and the total to 1914, since the Act came into force:—
| Number Of Children Legitimized. | |||
|---|---|---|---|
| Year. | Previously Registered | Not Previously Registered. | Total. |
| 1894 | 9 | 2 | 11 |
| 1895 | 55 | 13 | 68 |
| 1896 | 45 | 11 | 56 |
| 1897 | 34 | 14 | 48 |
| 1898 | 32 | 27 | 59 |
| 1899 | 28 | 13 | 41 |
| 1900 | 30 | 32 | 62 |
| 1901 | 28 | 19 | 47 |
| 1902 | 55 | 41 | 96 |
| 1903 | 41 | 24 | 65 |
| 1904 | 44 | 43 | 87 |
| 1905 | 48 | 36 | 84 |
| 1906 | 73 | 52 | 125 |
| 1907 | 75 | 39 | 114 |
| 1908 | 84 | 35 | 119 |
| 1909 | 67 | 62 | 129 |
| 1910 | 75 | 46 | 121 |
| 1911 | 76 | 46 | 122 |
| 1912 | 86 | 51 | 137 |
| 1913 | 89 | 72 | 161 |
| 1914 | 99 | 66 | 165 |
| Totals | 1,178 | 744 | 1,917 |
The Act came into operation only during the latter end of 1894, which fact accounts for the small number of legitimations shown for that year.
The registration of still births has been made compulsory in New Zealand as from the 1st March, 1913. During the ten months ended the 31st December, 1913, 467 still-births were registered and a further 679 during 1914. Still births are not included either as births or as deaths in the various numbers and rates shown in this subsection and that relating to deaths.
In the 679 still-births registered in 1914, are included 12 cases of twins, and in addition there were 26 cases where one child of twins was still-born and the other born alive.
| STILL-BIRTHS, 1914.—AGES OF PARENTS. | ||||||||||||
|---|---|---|---|---|---|---|---|---|---|---|---|---|
| Age of Father, in Years. | ||||||||||||
| Age of Mother, in Years. | Under 21. | 21 and under 25. | 25 and under 30. | 30 and under 35. | 35 and under 40. | 40 and under 45. | 45 and under 50. | 50 and under 65. | 65 and over. | Not Stated. | Illegitimate Cases. | Totals. |
* This number represents 655 single cases and 12 plural cases. | ||||||||||||
| 16 and under 17 | .. | .. | .. | .. | .. | .. | .. | .. | .. | .. | 2 | 2 |
| 17 “ 18 | .. | .. | .. | .. | .. | .. | .. | .. | .. | .. | 3 | 3 |
| 18 “ 19 | .. | 3 | 1 | .. | .. | .. | .. | .. | .. | .. | 5 | 9 |
| 19 “ 20 | .. | 1 | 2 | 1 | .. | .. | .. | .. | .. | .. | 4 | 8 |
| 20 “ 21 | .. | 1 | .. | 2 | 1 | .. | .. | .. | .. | .. | 3 | 7 |
| 21 “ 25 | 1 | 20 | 40 | 13 | 3 | 1 | .. | .. | .. | .. | 9 | 87 |
| 25 “ 30 | .. | 11 | 80 | 58 | 22 | 6 | 5 | .. | .. | .. | 7 | 189 |
| 30 “ 35 | .. | 1 | 21 | 68 | 48 | 21 | 6 | 4 | .. | .. | 2 | 171 |
| 35 “ 40 | .. | .. | 3 | 18 | 48 | 39 | 21 | 5 | .. | .. | 2 | 136 |
| 40 “ 45 | .. | .. | .. | .. | 8 | 25 | 9 | 5 | .. | .. | .. | 47 |
| 45 “ 46 | .. | .. | .. | .. | .. | 1 | .. | 3 | .. | .. | .. | 4 |
| 46 “ 47 | .. | .. | .. | .. | .. | .. | 1 | .. | .. | .. | .. | 1 |
| 50 “ 51 | .. | .. | .. | .. | .. | .. | .. | .. | 1 | .. | .. | 1 |
| Not stated | .. | .. | .. | .. | .. | .. | .. | .. | .. | 2 | .. | 2 |
| Totals | 1 | 37 | 147 | 160 | 130 | 93 | 42 | 17 | 1 | 2 | 37 | 667* |
The number of births of Maoris registered during 1914, under the provisions of section 20 of the Births and Deaths Registration Amendment Act, 1912, was 857 (457 males, 400 females). The number registered between March and December, 1913, was 586. Only 4 Maori births were registered under the main Act in 1914, as against 17 in 1913.
The procedure under the law as to vaccination is as follows: The Registrar issues a notice when a birth is registered, with forms for certificate as to the result of vaccination attached. Vaccination is compulsory, if exemption is not secured in four months from date of birth. But everything is subject to the provisions of the “exemption clause,” which is the main feature, and governs the rest. Any parent or custodian who has conscientious objections—believing that vaccination would be injurious to the child's health—can apply for a certificate of exemption to a Magistrate or to a Registrar of Births; and when the child's parent or guardian is resident outside of a borough, the application may be made to and certificate granted by a Justice of the Peace.
When no exemption certificate is obtained, the law allows the parent twelve months from date of birth in which to vaccinate, and a similar period from date of taking charge of child in case of a custodian. There are penalties for not vaccinating, but one conviction for neglecting to vaccinate a child removes liability until the child is four years of age.
In 1899 the proportion of successful vaccinations of children under one year of age to the total births was 17.94 per cent. In 1901 the proportion fell to 9.68 per cent., but rose in 1903 to 25.50 on account of a slight outbreak of smallpox. The rate per 100 births then fell year by year until in 1912 it reached only 1.26, the vaccinations of children under one year of age numbering 347, and the total vaccinations for the year being 545, exclusive of Maoris.
An outbreak of smallpox occurred in the latter half of 1913, principally among the Maoris of the Auckland District, this resulting in an unprecedented number of vaccinations. The total successful vaccinations for the year were approximately 139,250, of which 132,800 were in the North Island. These figures include adults and children, Europeans and Maoris, it being impossible to obtain complete figures as to race and age of those vaccinated.
Forty-six thousand five hundred and nineteen exemption certificates were issued from the 13th October, 1900, to the end of the year 1913. Of these only 3,502 belong to the year 1913, as against 7,270 in the preceding year.
No information is available as to vaccinations and exemptions during 1914.
MARRIAGE may be solemnized in New Zealand only on the authority of a Registrar's certificate, either by a person whose name is on the list of officiating ministers under the Marriage Act, or before a Registrar or Deputy Registrar of Marriages duly appointed. No marriage can be legally solemnized before 8 o'clock in the forenoon or after 4 o'clock in the afternoon.
Notice of intended marriage must be given to the Registrar of the district within which the marriage is to be solemnized, and the party giving notice must have resided for three full days in the district. If the parties dwell in different districts, notice must be given to and a certificate obtained from the Registrar of each district.* In the case of a person under twenty-one not being a widow or widower, the consent of parent or guardian is necessary before the Registrar's certificate can be issued.
The system of notice and certificate has obtained in New Zealand since 1855. By this system it is ensured not only that marriages are in order, but that no legally solemnized marriage escapes registration. Officiating ministers and Registrars are required to send to the Registrar-General returns of all marriages solemnized; and as the returns come in they are checked off with the entries in the Registrars' lists of notices received and certificates issued. In case of the non-arrival of a marriage return corresponding to any entry in the list of notices, inquiries are made as to whether solemnization has been effected. Inquiries are made similarly in respect of any marriage for which return is received, but for which there is no corresponding return of notice and certificate.
The marriage of a man with his deceased wife's sister was legalized in New Zealand in the year 1881, and the marriage of a woman with her deceased's husband's brother in 1901. Both Acts are retrospective, including in their provisions marriages solemnized before as well as those contracted after the statutes were passed, and declaring all such marriages to be valid, and the issue born thereof to be deemed born in lawful wedlock.
The marriages for 1914 show an increase of 467 on the figures for the previous year, the number solemnized in 1914 being 9,280, as against 8,813 in 1913. The rate per 1,000 of the mean population was 8.25 in 1913 and 8.51 in 1914. The number solemnized in 1914 is the highest yet recorded in any year, and the rate for the year has been exceeded only four times since 1868—namely, in 1907, 1908, 1911, and 1912.
In the following table are shown the numbers and rates in each year since 1887. A column is added showing the index number for each year as compared with the average of the five years 1882–86, taken as 100.
*An amendment to the Marriage Act passed in 1915 dispenses with the necessity of a second certificate where the bridegroom is a member of an Expeditionary Force under the Expeditionary Forces Act, 1908.
| Marriages, Number and Rate. | |||
|---|---|---|---|
| Marriage-rate. | |||
| Year. | Total Number of Marriages registered. | Per 1,000 of Population. | Compared with Rate in 1882–86, taken as 100. |
| 1882–86 | 3,663* | 6.68 | 100 |
*Average for five years. | |||
| 1887 | 3,563 | 5.97 | 89 |
| 1888 | 3,617 | 5.97 | 89 |
| 1889 | 3,632 | 5.93 | 89 |
| 1890 | 3,797 | 6.12 | 92 |
| 1891 | 3,805 | 6.04 | 90 |
| 1892 | 4,002 | 6.23 | 93 |
| 1893 | 4,115 | 6.22 | 93 |
| 1894 | 4,178 | 6.15 | 92 |
| 1895 | 4,110 | 5.94 | 89 |
| 1896 | 4,843 | 6.85 | 103 |
| 1897 | 4,928 | 6.83 | 102 |
| 1898 | 5,091 | 6.91 | 103 |
| 1899 | 5,461 | 7.28 | 109 |
| 1900 | 5,860 | 7.67 | 115 |
| 1901 | 6,095 | 7.83 | 117 |
| 1902 | 6,394 | 8.01 | 120 |
| 1903 | 6,748 | 8.23 | 123 |
| 1904 | 6,983 | 8.26 | 124 |
| 1905 | 7,200 | 8.28 | 124 |
| 1906 | 7,592 | 8.48 | 127 |
| 1907 | 8,192 | 8.91 | 133 |
| 1908 | 8,339 | 8.82 | 132 |
| 1909 | 8,094 | 8.33 | 125 |
| 1910 | 8,236 | 8.30 | 124 |
| 1911 | 8,825 | 8.70 | 130 |
| 1912 | 9,149 | 8.81 | 132 |
| 1913 | 8,813 | 8.25 | 124 |
| 1914 | 9,280 | 8.51 | 127 |
The marriage-rate for the period under review shows a general upward tendency, having been above 8 per 1,000 in each year since and including 1902. Reference to the diagram on page 127 will show that the marriage-rate was at its lowest in the period 1885 to 1895, and that the rate in the early years of registration was considerably in excess of that in even the best of recent years.
The decrease in number and rate in 1913 as compared with 1912 was partly attributable to the industrial disturbances during the latter part of the year. Industrial disturbances have the effect of postponing marriage in a proportion of cases, and if spread over any length of time seriously affect the marriage-rate. As pointed out in last year's issue of this book, however, the first nine months of 1913 (prior to the strike period) showed a decrease as compared with the corresponding nine months of 1913. Whatever the cause or combination of causes, the fact remains that marriages felt from 9,149 in 1912 to 8,813 in 1913, and rose to 9,280 in 1914.
There is little data available as to the effect of the war on the marriage-rate. The number of marriages solemnized in 1914 is only 131 in excess of the number in 1912, while the rate is lower. Most of the marriages assumed to be postponed from 1913 on account of the strike would probably be solemnized in 1914, and in the ordinary course of events the total solemnized during 1914 could have been expected to be somewhat more than 9,280. The war has had the effect of hastening some marriages, and of delaying others, and the facts seem to point to those delayed being somewhat in excess of those hastened. The marriages in each quarter of 1914 were: March, 2,219; June (including Easter), 2,625; September, 2,181; December, 2,255.
The marriage-rate, measured by the total population, does not show the true position when, as in the case of New Zealand, the age constitution of the people fluctuates considerably. A more satisfactory standard is found in the number of persons of marriageable age, defined as meaning the unmarried and widowed of males aged twenty years and upwards and of females aged fifteen years and upwards. The rates are given for six census years:—
| Proportion of Unmarried per 1,000 of Total | Proportion of Marriages per 1,000 of the | |||||
|---|---|---|---|---|---|---|
| Year of Census. | Males. | Females. | Marriageable Men. | Marriageable Women. | Marriageable Persons. | Total Population. |
| 1886 | 235.0 | 238.2 | 47.32 | 54.56 | 25.36 | 5.99 |
| 1891 | 238.2 | 268.5 | 47.78 | 47.97 | 23.94 | 6.04 |
| 1896 | 258.8 | 308.9 | 50.14 | 47.00 | 24.26 | 6.85 |
| 1901 | 275.5 | 331.8 | 54.11 | 49.78 | 25.93 | 7.83 |
| 1906 | 294.3 | 328.2 | 54.36 | 54.93 | 27.72 | 8.48 |
| 1911 | 286.5 | 314.9 | 57.60 | 58.38 | 28.99 | 8.70 |
A comparison of the marriage-rate for each State of the Australian Commonwealth with New Zealand for the last ten years is given. For the Commonwealth the rate in 1914 was 8.80 per 1,000, as against 8.67 in 1913 of mean population.
| Marriages per 1,000 of Mean Population in Australia and New Zealand. | |||||||
|---|---|---|---|---|---|---|---|
| Year. | Queensland. | New South Wales. | Victoria. | South Australia (Proper). | Western Australia. | Tasmania. | New Zealand. |
| 1905 | 6.00 | 7.46 | 7.28 | 7.14 | 8.61 | 7.40 | 8.28 |
| 1906 | 6.69 | 7.68 | 7.36 | 7.30 | 8.89 | 7.59 | 8.48 |
| 1907 | 7.56 | 7.89 | 7.81 | 8.29 | 8.27 | 7.63 | 8.91 |
| 1908 | 7.24 | 8.03 | 7.53 | 8.18 | 7.80 | 7.64 | 8.82 |
| 1909 | 7.97 | 8.15 | 7.48 | 8.38 | 7.59 | 7.85 | 8.33 |
| 1910 | 8.06 | 8.76 | 7.98 | 9.17 | 7.77 | 7.82 | 8.30 |
| 1911 | 8.41 | 9.24 | 8.34 | 9.81 | 8.44 | 7.76 | 8.70 |
| 1912 | 8.91 | 9.60 | 8.65 | 9.62 | 8.37 | 7.86 | 8.81 |
| 1913 | 8.67 | 9.02 | 8.13 | 9.40 | 8.19 | 8.27 | 8.25 |
| 1914 | 8.73 | 9.37 | 8.31 | 9.11 | 8.22 | 7.78 | 8.51 |
The rate for New Zealand is higher than the rate for most of the European countries given in the table following.
| Marriages per 1,000 of Mean Population in European Countries. | ||
|---|---|---|
| Country. | Year. | Rate. |
| Servia | 1911 | 10.3 |
| Roumania | 1913 | 9.2 |
| Bulgaria | 1910 | 9.0 |
| Hungary | 1912 | 8.6 |
| Belgium | 1912 | 8.0 |
| Russia | 1909 | 7.9 |
| German Empire | 1912 | 7.9 |
| England and Wales | 1913 | 7.7 |
| Netherlands | 1913 | 7.7 |
| France | 1913 | 7.5 |
| Italy | 1912 | 7.5 |
| Austria | 1912 | 7.3 |
| Switzerland | 1912 | 7.2 |
| Denmark | 1913 | 7.2 |
| Scotland | 1913 | 7.1 |
| Spain | 1913 | 6.7 |
| Norway | 1913 | 6.3 |
| Sweden | 1913 | 5.9 |
| Finland | 1912 | 5.8 |
| Ireland | 1913 | 5.1 |
The table which follows gives information as to the conjugal condition of persons married in each of the pant ten years, divorced men and women being classed as bachelors and spinsters.
| Marriages contracted between | ||||||
|---|---|---|---|---|---|---|
| Year. | Bachelors and Spinsters. | Bachelors and Widows. | Widowers and Spinsters. | Widowers and Widows. | Number of Divorced Persons married (included previously). | Total Marriages registered. |
| 1905 | 6,582 | 196 | 316 | 106 | 87 | 7,200 |
| 1906 | 6,925 | 265 | 286 | 116 | 98 | 7,592 |
| 1907 | 7,499 | 231 | 335 | 127 | 128 | 8,192 |
| 1908 | 7,622 | 254 | 344 | 119 | 129 | 8,339 |
| 1909 | 7,375 | 230 | 357 | 132 | 152 | 8,094 |
| 1910 | 7,440 | 306 | 342 | 148 | 150 | 8,236 |
| 1911 | 8,036 | 258 | 365 | 166 | 165 | 8,825 |
| 1912 | 8,350 | 253 | 413 | 133 | 204 | 9,149 |
| 1913 | 8,034 | 274 | 370 | 135 | 218 | 8,813 |
| 1914 | 8,672 | 276 | 398 | 134 | 204 | 9,280 |
The figures for 1914 are given herewith in more detail as to conjugal condition of bride and bridegroom immediately prior to the marriage.
| Condition of Bridegrooms. | Condition of Brides. | |||
|---|---|---|---|---|
| Spinsters | Divorced Women. | Widows. | Total. | |
| Bachelors | 8,312 | 88 | 260 | 8,660 |
| Divorced Men | 65 | 7 | 16 | 88 |
| Widowers | 377 | 21 | 134 | 532 |
| Total | 8,754 | 116 | 410 | 9,280 |
Included amongst widows in 1914 are thirteen married women, and amongst the widowers five men, who elected to go through the form of marriage with other persons under the protection of the provisions of section 224, subsection (5), of the Crimes Act, which reads, “No one commits bigamy by going through a form of marriage if he or she has been continually absent from his or her wife or husband for seven years then last past, and is not proved to have known that his wife or her husband was alive at any time during those seven years.”
The results of three censuses in respect of the number of bachelors of twenty years and upwards, and the number of spinsters of fifteen years and upwards, show some interesting features. In 1896 there was an excess of spinsters over bachelors amounting to 1,786, and the census of 1901 shows that this excess had increased to 3,572. But by 1906 not only had the preponderance of the female element been lost, but an excess of bachelors over spinsters was reported amounting to 9,633. This result, no doubt, is largely due to the arrival from abroad of numbers of young men who have settled in New Zealand. The census of 1911 again shows a further increase of the bachelors to 12,713.
It is noticeable how differently the numbers for the provincial districts have been affected by the process in operation. An excess of bachelors was preserved in Auckland, Taranaki, Hawke's Bay, Wellington, Marlborough, Nelson, and Westland from 1896 to 1906. Auckland in 1906 showed an excess of bachelors of 3,383, and in 1911 this number had increased to 7,263. The excess of bachelors in Wellington decreased from 4,389 in 1906 to 2,308 in 1911. In Canterbury, an excess of spinsters in 1896 of 3,997, which increased to 4,918 in 1901, decreased to 2,117 in 1906, and again increased in 1911 to 2,299; while in Otago an excess of 2,066 spinsters in 1896 diminished in 1901 when there were 1,899 more spinsters than bachelors, and again in 1906, when the number of spinsters was 954 greater than the number of bachelors. The census of 1911 shows an excess of spinsters over bachelors of 2,765 for the Otago portion of the province, while in the Southland portion there were 1,519 more bachelors than spinsters. Both Canterbury and Otago have lost large numbers of bachelors by departures to the North Island. The following table exhibits the particulars for each provinicial district:—
| Census 1896. | Census 1901. | Census 1906. | Census 1911. | |||||
|---|---|---|---|---|---|---|---|---|
| Provincial District. | Excess of Bachelors over Spinsters. | Excess of Spinsters over Bachelors. | Excess of Bachelors Over Spinsters. | Excess of Spinsters over Bachelors. | Excess of Bachelors over Spinsters. | Excess of Spinsters over Bachelors. | Excess of Bachelors Over Spinsters. | Excess of Spinsters over Bachelors. |
| Excess for Dominion | .. | 1,786 | .. | 3,572 | 9,633 | .. | 12,713 | .. |
| Auckland | 703 | .. | 521 | .. | 3,383 | .. | 7,263 | .. |
| Taranaki | 524 | .. | 805 | .. | 754 | .. | 1,370 | .. |
| Hawke's Bay | 1,142 | .. | 425 | .. | 1,151 | .. | 1,003 | .. |
| Wellington | 637 | .. | 32 | .. | 4,389 | .. | 2,308 | .. |
| Marlborough | 183 | .. | 158 | .. | 532 | .. | 610 | .. |
| Nelson | 580 | .. | 637 | .. | 1,550 | .. | 2,629 | .. |
| Westland | 501 | .. | 666 | .. | 935 | .. | 1,033 | .. |
| Canterbury | .. | 3,997 | .. | 4,918 | .. | 2,117 | .. | 2,299 |
| Otago | .. | 2,066 | .. | 1,899 | .. | 954 | .. | 2,765 |
| Southland | .. | .. | .. | .. | .. | .. | 1,519 | .. |
| Chatham Islands | 7 | .. | 1 | .. | 10 | .. | 14 | .. |
| Kermadec Islands | .. | .. | .. | .. | .. | .. | 1 | .. |
Of the persons married in 1914, 195 bridegrooms and 1,438 brides were under twenty-one years of age. Of the bridegrooms, two were between sixteen and seventeen, and two between seventeen and eighteen, while fourteen were between eighteen and nineteen. Of the brides, four were between fifteen and sixteen, and forty-four between sixteen and seventeen years of age. A table is given showing relative ages of bridegrooms and brides in groups of years.
| Ages of Persons married, 1914. | ||||||||
|---|---|---|---|---|---|---|---|---|
| Age of Bride, in Years | ||||||||
| Age of Bridegroom, in Years. | Under 21. | 21 and under 25 | 25 and under 30 | 30 and under 35 | 35 and under 40 | 40 and under 45 | 45 and over. | Total Bridegrooms. |
| Under 21 | 125 | 61 | 8 | 1 | .. | .. | .. | 195 |
| 21 and under 25 | 621 | 1,003 | 365 | 44 | 10 | 2 | .. | 2,045 |
| 25 “ 30 | 490 | 1,374 | 1,253 | 279 | 62 | 6 | 1 | 3,465 |
| 30 “ 35 | 162 | 521 | 662 | 404 | 109 | 27 | 10 | 1,895 |
| 35 “ 40 | 27 | 131 | 228 | 203 | 148 | 46 | 12 | 795 |
| 40 “ 45 | 8 | 44 | 88 | 100 | 118 | 57 | 65 | 480 |
| 45 and over | 5 | 11 | 36 | 66 | 75 | 57 | 155 | 405 |
| Total brides | 1,438 | 3,145 | 2,639 | 1,098 | 522 | 195 | 243 | 9,280 |
The following are the proportions of men and women married at each of certain age-periods to every 100 marriages in the years 1894, 1904, and 1914:—
| Age, in Years. | M. | F. | M. | F. | M. | F. |
|---|---|---|---|---|---|---|
| Under 21 | 1.44 | 19.53 | 1.73 | 17.61 | 2.10 | 15.49 |
| 21 and under 25 | 26.45 | 42.25 | 24.95 | 38.25 | 22.04 | 33.89 |
| 25 “ 30 | 36.74 | 23.84 | 40.03 | 28.03 | 37.34 | 28.44 |
| 30 “ 40 | 25.82 | 10.99 | 25.30 | 12.53 | 28.99 | 17.46 |
| 40 “ 50 | 6.25 | 2.27 | 5.30 | 2.53 | 7.04 | 3.44 |
| 50 “ 60 | 2.49 | 0.86 | 1.52 | 0.70 | 1.61 | 0.94 |
| 60 “ 70 | 0.67 | 0.19 | 0.97 | 0.32 | 0.73 | 0.29 |
| 70 and upwards | 0.14 | 0.07 | 0.20 | 0.03 | 0.15 | 0.05 |
| 100.00 | 100.00 | 100.00 | 100.00 | 100.00 | 100.00 |
| Mean Age at Marriage. | ||
|---|---|---|
| Year. | Mean Age of Bridegrooms. | Mean Age of Brides. |
| 1896 | 29.74 | 25.28 |
| 1897 | 29.62 | 25.21 |
| 1898 | 29.95 | 25.30 |
| 1899 | 29.86 | 25.48 |
| 1900 | 29.91 | 25.29 |
| 1901 | 29.72 | 25.54 |
| 1902 | 29.89 | 25.63 |
| 1903 | 29.89 | 25.84 |
| 1904 | 29.60 | 25.44 |
| 1905 | 29.65 | 25.75 |
| 1906 | 29.76 | 25.97 |
| 1907 | 29.83 | 26.07 |
| 1908 | 29.86 | 26.11 |
| 1909 | 30.11 | 26.40 |
| 1910 | 29.91 | 26.32 |
| 1911 | 30.12 | 26.48 |
| 1912 | 29.95 | 26.39 |
| 1913 | 30.15 | 26.42 |
| 1914 | 30.09 | 26.69 |
The average age of bridegrooms has remained fairly constant during the period, but there is a gradual increase in the average age of the brides. In England the mean age of those whose ages were stated was (in the year 1913) 29.11 years for men, and 26.80 years for women. Thus the average age at marriage in New Zealand would appear to be higher for men, but lower for women, than in England. The average age of all spinsters married in New Zealand in 1914 was 25.90 years.
Of every 1,000 men married in 1914, 21 were under twenty-one years of age, while 155 in every 1,000 brides were under twenty-one. The proportion of bridegrooms under twenty-one is much less in New Zealand than in England, where in 1913 the proportion was 42 per 1,000 of bridegrooms of specified age. On the other hand, brides in New Zealand include more minors per 1,000 than in England, there being 144 minors in every 1,000 brides whose ages are given in the English records, as against 155 in New Zealand. In this respect it is worthy of note that in the Dominion ages of all parties married are obtainable, either from the marriage register itself, or, in cases where the age is signified in the register by such words as “full” or “minor,” by reference to the Registrar's return of certificates issued.
A table is given showing the number of bridegrooms and brides under and over the age of twenty-one during each of the past ten years, together with the percentages of minors included in the totals of grooms and brides.
| Bridegrooms and Brides under and over Twenty-one, 1905–14. | ||||||
|---|---|---|---|---|---|---|
| Bridegrooms. | Brides. | Minors, per 100 Marriages. | ||||
| Year. | Adults. | Minors. | Adults. | Minors. | Bridegrooms. | Brides. |
| 1905 | 7,067 | 133 | 5,986 | 1,214 | 1.80 | 16.90 |
| 1906 | 7,467 | 125 | 6,388 | 1,204 | 1.65 | 15.86 |
| 1907 | 8,061 | 131 | 6,896 | 1,296 | 1.60 | 15.82 |
| 1908 | 8,162 | 177 | 7,001 | 1,338 | 2.12 | 16.05 |
| 1909 | 7,951 | 143 | 6,785 | 1,309 | 1.76 | 16.17 |
| 1910 | 8,080 | 156 | 6,975 | 1,261 | 1.95 | 15.70 |
| 1911 | 8,653 | 172 | 7,499 | 1,326 | 1.95 | 15.02 |
| 1912 | 8,947 | 172 | 7,688 | 1,461 | 1.88 | 15.97 |
| 1913 | 8,654 | 159 | 7,419 | 1,394 | 1.80 | 15.82 |
| 1914 | 9,085 | 195 | 7,842 | 1,438 | 2.10 | 15.50 |
Registrars of Marriages are prohibited by law from issuing certificates for the marriage of minors without the consent of the parents or lawful guardians, if there be any in New Zealand. If a declaration is made in any case that there is no such parent or lawful guardian resident in the Dominion, then a certificate may be issued after the expiration of fourteen days following the date on which the notice of intended marriage was given.
The ages at which persons may contract binding marriages are the same as in England—twelve years for females and fourteen for males. Marriage may be contracted at earlier ages than those stated, but would be voidable at the discretion of either of the parties upon reaching the age of twelve or fourteen, as the case may be, and without the necessity of proceedings in Court.
Although in New Zealand the age at which girls may legally marry is as above, nevertheless, by the criminal law, to unlawfully carnally know a girl under the age of sixteen years is now a punishable offence. The age of consent was raised from fifteen to sixteen by statute passed in 1906.
The bridegrooms married during 1914 are given below according to their occupations, arranged in the classification used at the census of 1911. Fuller details are given in the Volume of Statistics of New Zealand.
| Occupations and Ages of Bridegrooms, 1914. | ||||||
|---|---|---|---|---|---|---|
| Ages, in Years. | ||||||
| Occupation. | Under 20. | 20 and under 25. | 25 and under 45. | 45 and under 65. | 65 and over. | Total Bridegrooms. |
| Professional class | 4 | 102 | 429 | 25 | 2 | 562 |
| Domestic class | 2 | 55 | 156 | 8 | .. | 221 |
| Mercantile class | 8 | 347 | 1,204 | 74 | 6 | 1,639 |
| Engaged in transport and communication | 12 | 240 | 715 | 22 | 1 | 990 |
| Engaged in manufacturing | 17 | 356 | 853 | 30 | 4 | 1,260 |
| Engaged in building and construction | 4 | 190 | 509 | 31 | 4 | 738 |
| Other industrial workers | 14 | 337 | 1,012 | 48 | 6 | 1,417 |
| Agricultural and pastoral class | 19 | 458 | 1,559 | 94 | 12 | 2,142 |
| Working in mines and quarries | .. | 50 | 126 | 10 | .. | 186 |
| Other primary producers | 1 | 17 | 63 | 4 | 1 | 86 |
| Independent means | .. | 2 | 7 | 13 | 8 | 30 |
| Occupations not stated | 1 | 4 | 2 | 1 | 1 | 9 |
| Totals | 82 | 2,158 | 6,635 | 360 | 45 | 9,280 |
Of the men married in 1914, seven or 0.75 in every 1,000, and of the women fourteen or 1.51 per 1,000, signed the register by mark.
The illiteracy of the people, as measured by the proportion of persons who affix marks instead of signatures to the marriage register, has greatly decreased of late, having fallen since 1881 from 32.04 per 1,000 to 0.75 per 1,000 among men and from 57.98 per 1,000 to 1.51 per 1,000 among women. This is shown by the following table:—
| Persons in every 1,000 married who signed by Mark. | |||||||
|---|---|---|---|---|---|---|---|
| — | 1881. | 1891. | 1901. | 1911. | 1912. | 1913. | 1914. |
| Male | 32.04 | 13.93 | 4.59 | 1.13 | 0.66 | 1.25 | 0.75 |
| Female | 57.98 | 16.82 | 6.23 | 2.38 | 2.30 | 2.50 | 1.51 |
The numbers upon which the above rates are worked are comparatively small, and they should not be used as a basis for any conclusion as to the education of the people as a whole. It may be pointed out that of the fourteen brides who attached mark signatures in 1914, four were Maori wives of European husbands, one was a Chinese, and one was described in the register as unable to sign on account of partial blindness. Of the seven males signing by mark, one was an Austrian, one a Norwegian, and one an East Indian. In nine of the remaining cases of mark signature, the party so signing was over the age of fifty-five.
Of the 9,280 marriages registered in 1914, Church of England clergymen officiated at 2,439, Presbyterians at 2,419, Methodists at 1,141, and Roman Catholics at 1,027, while 1,742 marriages were celebrated before Registrars. The year is somewhat exceptional in that for the first time in eleven years more marriages were solemnized by Anglican than by Presbyterian ministers.
The following table shows the proportions of marriages by ministers of the principal denominations in the past five years:—
| Percentage of Marriages. | |||||
|---|---|---|---|---|---|
| Denomination. | 1910. | 1911. | 1912. | 1913. | 1914. |
| Church of England | 24.38 | 25.60 | 25.99 | 25.02 | 26.28 |
| Presbyterians | 26.20 | 26.54 | 26.48 | 26.88 | 26.07 |
| Methodists | 14.49 | 13.83 | 13.43 | 12.57 | 12.30 |
| Roman Catholics | 11.85 | 10.86 | 10.90 | 11.73 | 11.07 |
| Other denominations | 6.31 | 6.54 | 6.22 | 6.24 | 5.51 |
| Before Registrars | 16.77 | 16.63 | 16.98 | 17.56 | 18.77 |
| 100.00 | 100.00 | 100.00 | 100.00 | 100.00 | |
The above figures must not be taken as a true indication of the religions of the parties married, as it does not necessarily follow that both parties are members of the Church whose officiating minister performed the ceremony, and persons married before Registrars may belong, in greater or lesser proportion, to any of the denominations.
In cases where both parties to a marriage are of the Native race there is no necessity under the Marriage Act to comply with the provisions of that Act, though the parties are at liberty to take advantage thereof. Considerable inconvenience, however, has been found to exist on account of the non-registration of Maori marriages, and a section was inserted in the Native Land Act, 1909, whereby it was laid down that Maori marriages must be celebrated either under the provisions of the Marriage Act or in the presence of a registered officiating minister, but without complying with the other requirements of the Act. Ministers solemnizing the latter class of marriages must send returns to the Registrar-General.
Returns of 260 marriages in which both parties were of the Native race were received during the year 1914. Of these 41 were in accordance with the provisions of the Marriage Act. Maori marriages are not included in the numbers shown elsewhere in this subsection, nor are they taken into account in the computation of marriage-rates.
The number of names on the list of officiating ministers under the Marriage Act is (August, 1915) 1,528, and the denominations to which they belong are shown hereunder:—
| Denomination. | No. |
|---|---|
| Specified in statute— | |
| Church of England | 461 |
| Presbyterian Church of New Zealand | 343 |
| Roman Catholic Church | 237 |
| Methodist Church of New Zealand | 264 |
| Congregational Independents | 35 |
| Baptists | 53 |
| Lutheran Church | 9 |
| Hebrew Congregations | 7 |
| Not specified in statute— | |
| Church of Christ | 29 |
| Salvation Army | 38 |
| Catholic Apostolic Church | 5 |
| Unitarians | 3 |
| Brethren | 5 |
| Seventh Day Adventists | 4 |
| Free Methodist Church of New Zealand | 3 |
| Latter-day Saints | 3 |
| Church of the Seven Rules of Jehovah | 8 |
| Ringatu Church | 10 |
| Others | 11 |
| Total | 1,528 |
The Ringatu Church and the Church of the Seven Rules of Jehovah are Maori denominations.
COMPULSORY registration of deaths was instituted in New Zealand in 1855. As in the case of births, a system of non-compulsory registration had obtained since 1848.
Until the year 1876 the only information provided for in the death-registration entry was as to date, place, and cause of death, and name, sex, age, and occupation of deceased. The Registration of Births and Deaths Act, 1875, required information to be recorded as regards parentage, conjugal condition, and issue of deceased. Particulars re burial had also to be entered, as well as more detailed information regarding cause of death. Subsequent amendments to the Act have made it requisite to give additional information concerning issue, and, in the case of married males, age of widow.
Every death occurring in New Zealand should be registered within three days after the day of the death if in a city or borough, or seven days in any other case. There is a penalty up to £10 for neglect, the undertaker in charge of the funeral being by the Amendment Act of 1912 made solely responsible for registration. Prior to 1913 the undertaker was primarily looked to for registration, but in addition the occupier of the house, and every person present at death were also responsible parties.
The law does not impose any limit of time after which a death may not be registered as it does in the case of a birth. It is not necessary to register the death of any still-born child.
Any person burying, or permitting, or taking part in the burial of the body of any deceased person without a certificate of cause of death signed by a duly registered medical practitioner, a Coroner's order to bury the body, or a Registrar's certificate of registration of the death, renders himself liable to a fine of £10.
The deaths registered in 1914 were 10,148, representing a rate of 9.31 per 1,000 of mean population. The number is the highest registered in any year, being 29 in excess of the previous record (10,119, in 1913), but the rate is lower than that for 1913 (9.47 per 1,000). The lowest rate, 8.87 per 1,000, was recorded in 1912.
The following table shows the number of deaths, and the death-rate per 1,000 of the living population; also a comparison with the average rate for 1882–86:—
| Death-rate. | |||
|---|---|---|---|
| Year. | Total Number of Deaths. | Per 1,000 of Population. | Compared with Rate in 1882–86, taken as 100 |
* Average for five years. | |||
| 1882–86 | 5,944* | 10.84 | 100 |
| 1887 | 6,137 | 10.29 | 95 |
| 1888 | 5,708 | 9.43 | 87 |
| 1889 | 5,772 | 9.44 | 87 |
| 1890 | 5,994 | 9.66 | 89 |
| 1891 | 6,518 | 10.35 | 95 |
| 1892 | 6,459 | 10.06 | 93 |
| 1893 | 6,767 | 10.23 | 94 |
| 1894 | 6,918 | 10.19 | 94 |
| 1895 | 6,863 | 9.91 | 91 |
| 1896 | 6,432 | 9.10 | 84 |
| 1897 | 6,595 | 9.14 | 84 |
| 1898 | 7,244 | 9.84 | 91 |
| 1899 | 7,680 | 10.24 | 94 |
| 1900 | 7,200 | 9.43 | 87 |
| 1901 | 7,634 | 9.81 | 90 |
| 1902 | 8,375 | 10.50 | 97 |
| 1903 | 8,528 | 10.40 | 96 |
| 1904 | 8,087 | 9.57 | 88 |
| 1905 | 8,061 | 9.27 | 86 |
| 1906 | 8,339 | 9.31 | 86 |
| 1907 | 10,066 | 10.95 | 101 |
| 1908 | 9,043 | 9.57 | 88 |
| 1909 | 8,959 | 9.22 | 85 |
| 1910 | 9,639 | 9.71 | 89 |
| 1911 | 9,534 | 9.39 | 87 |
| 1912 | 9,214 | 8.87 | 82 |
| 1913 | 10,119 | 9.47 | 87 |
| 1914 | 10,148 | 9.31 | 86 |
The death-rates of males and females for the last ten years are shown separately in the next table, and also the number of male deaths to every 100 female deaths:—
| Deaths per 1,000 of the Total Population. | ||||
|---|---|---|---|---|
| Year. | Males. | Females. | Total. | Male Deaths to every 100 Female Deaths. |
| 1905 | 10.18 | 8.24 | 9.27 | 139 |
| 1906 | 10.40 | 8.08 | 9.31 | 145 |
| 1907 | 11.81 | 9.98 | 10.95 | 133 |
| 1908 | 10.62 | 8.38 | 9.57 | 143 |
| 1909 | 10.18 | 8.14 | 9.22 | 141 |
| 1910 | 10.67 | 8.63 | 9.71 | 139 |
| 1911 | 10.46 | 8.21 | 9.39 | 142 |
| 1912 | 9.83 | 7.79 | 8.87 | 140 |
| 1913 | 10.46 | 8.38 | 9.47 | 138 |
| 1914 | 10.53 | 7.98 | 9.31 | 144 |
Males of tender years are more delicate than females, and, later in life, males are the more liable to accident. These disadvantages are partly compensated for by the preponderance of male births, but were it not for the fact that excess of immigration over emigration has given the country many more males than females, the tendency would be for the female population to exceed the male.
For the purpose of considering the mortality in New Zealand more closely than can be done by means of crude death-rates, it is desirable to ascertain the rates at different age-periods of the population.
| DEATH-RATES PER 1,000 LIVING AT VARIOUS AGE-PERIODS. | |||||||
|---|---|---|---|---|---|---|---|
| Ages, in Years. | Average, 1905–9. | 1910. | 1911. | 1912. | 1913. | 1914. | Decrease 1905–9 to 1914. |
* Increase. | |||||||
| Per Cent. | |||||||
| Under 5 | 20.55 | 19.48 | 16.67 | 14.39 | 16.74 | 15.01 | 26.96 |
| 5 and under 10 | 1.71 | 1.85 | 1.89 | 1.62 | 1.48 | 1.76 | + 292* |
| 10 “ 15 | 1.53 | 1.21 | 1.48 | 1.33 | 1.38 | 1.19 | 22.22 |
| 15 “ 20 | 2.66 | 2.06 | 2.19 | 2.11 | 2.18 | 1.95 | 26.69 |
| 20 “ 25 | 3.84 | 2.82 | 2.95 | 2.77 | 2.83 | 2.78 | 27.60 |
| 25 “ 35 | 4.12 | 4.54 | 4.09 | 3.48 | 3.92 | 3.60 | 12.62 |
| 35 “ 45 | 5.54 | 6.06 | 5.64 | 5.76 | 6.27 | 6.18 | + 11.55* |
| 45 “ 55 | 9.70 | 9.54 | 9.82 | 9.13 | 10.25 | 10.21 | +5.26* |
| 55 “ 65 | 19.45 | 19.53 | 19.54 | 18.96 | 19.82 | 19.84 | + 2.01* |
| 65 “ 75 | 47.01 | 45.60 | 47.76 | 46.09 | 44.39 | 47.71 | + 1.49* |
| 75 and upwards | 105.03 | 162.03 | 126.53 | 130.02 | 136.00 | 138.31 | + 31.69* |
| All ages | 9.67 | 9.71 | 9.39 | 8.87 | 9.47 | 9.31 | 4.76 |
Besides advantages of climate New Zealand possesses a population younger in age constitution than that of most other countries, conditions favourable to a low rate of mortality. Another table is given comparing death-rates at eighteen age-periods for 1913 with those of England and Wales. Here the extremely low rate of mortality in New Zealand among children under five years of age is remarkable, and the difference at some of the groups at the more advanced ages is considerable. The New Zealand rate for males is higher than that for females at all groups excepting 10–15, 20–25, 25–30, and 40–45, while for England and Wales the male rate is lower than that for females at 10–15 years, and is higher in every other instance.
| DEATH-RATE PER 1,000 PERSONS LIVING, ACCORDING TO SEX, FOR THE YEAR 1913, COMPARED WITH ENGLAND AND WALES. | ||||
|---|---|---|---|---|
| Ages, in Years. | New Zealand. | England and Wales. | ||
| Males. | Females. | Males. | Females. | |
| Under 5 | 18.68 | 14.81 | 39.16 | 32.20 |
| 5 and under 10 | 1.72 | 1.58 | 3.15 | 3.10 |
| 10 “ 15 | 1.30 | 1.46 | 1.89 | 1.97 |
| 15 “ 20 | 2.24 | 2.13 | 2.72 | 2.54 |
| 20 “ 25 | 2.59 | 3.09 | 3.48 | 3.01 |
| 25 “ 30 | 3.27 | 3.52 | 4.06 | 3.42 |
| 30 “ 35 | 4.71 | 4.41 | 5.19 | 4.30 |
| 35 “ 40 | 6.33 | 5.30 | 6.97 | 5.65 |
| 40 “ 45 | 6.61 | 6.95 | 9.19 | 7.41 |
| 45 “ 50 | 9.61 | 8.52 | 12.64 | 9.78 |
| 50 “ 55 | 12.64 | 10.24 | 17.73 | 13.46 |
| 55 “ 60 | 17.81 | 15.05 | 25.24 | 19.09 |
| 60 “ 65 | 26.88 | 19.63 | 37.63 | 27.89 |
| 65 “ 70 | 37.21 | 31.78 | 52.03 | 39.65 |
| 70 “ 75 | 58.15 | 55.07 | 83.79 | 67.05 |
| 75 “ 80 | 108.77 | 87.77 | 123.62 | 101.14 |
| 80 “ 85 | 179.20 | 172.73 | 178.16 | 151.50 |
| 85 and upwards | 296.20 | 217.81 | 266.82 | 240.95 |
| All ages | 10.46 | 8.38 | 14.65 | 12.76 |
The deaths occurring during 1914 are tabulated below in single ages up to five years, and thereafter in groups, showing males and females separately:—
| Ages. | Males. | Females. | Total. |
|---|---|---|---|
| Months. | |||
| Under 1 | 467 | 351 | 818 |
| 1–3 | 137 | 104 | 241 |
| 3–6 | 100 | 92 | 192 |
| 6–12 | 124 | 81 | 205 |
| Years. | |||
| 1–2 | 102 | 97 | 199 |
| 2–3 | 66 | 52 | 118 |
| 3–4 | 52 | 28 | 80 |
| 4–5 | 35 | 28 | 63 |
| 5–10 | 101 | 101 | 202 |
| 10–15 | 66 | 52 | 118 |
| 15–20 | 103 | 84 | 187 |
| 20–25 | 147 | 141 | 288 |
| 25–30 | 183 | 171 | 354 |
| 30–35 | 223 | 181 | 404 |
| 35–40 | 249 | 203 | 452 |
| 40–45 | 263 | 164 | 427 |
| 45–50 | 257 | 172 | 429 |
| 50–55 | 284 | 191 | 475 |
| 55–60 | 326 | 217 | 543 |
| 60–65 | 366 | 215 | 581 |
| 65–70 | 454 | 297 | 751 |
| 70–75 | 649 | 375 | 1,024 |
| 75–80 | 537 | 340 | 877 |
| 80–85 | 457 | 245 | 702 |
| 85–90 | 174 | 126 | 300 |
| 90–95 | 49 | 42 | 91 |
| 95–100 | 14 | 12 | 26 |
| 100 | 1 | .. | 1 |
| Totals | 5,986 | 4,162 | 10,148 |
The average age at death of persons of either sex, in each of the ten years 1905–14, was as follows:—
| Males. | Females. | |
|---|---|---|
| 1905 | 43.03 years. | 39.13 years. |
| 1906 | 44.39 “ | 39.35 “ |
| 1907 | 40.43 “ | 36.66 “ |
| 1908 | 42.50 “ | 39.14 “ |
| 1909 | 42.76 “ | 38.78 “ |
| 1910 | 44.47 “ | 42.25 “ |
| 1911 | 46.17 “ | 42.37 “ |
| 1912 | 47.19 “ | 44.91 “ |
| 1913 | 46.26 “ | 43.04 “ |
| 1914 | 46.97 “ | 44.27 “ |
Information as to the average expectation of life, and of death-rates for each year of age is given in subsection D of this section.
A table is given showing the death-rates of the Australian States and Commonwealth and of New Zealand in each of the past ten years.
| DEATH-RATES OF AUSTRALASIA PER 1,000 OF MEAN POPULATION, 1905–14. | ||||||||||
|---|---|---|---|---|---|---|---|---|---|---|
| Country. | 1905. | 1906. | 1907. | 1908. | 1909. | 1910. | 1911. | 1912. | 1913. | 1914. |
| Queensland | 10.40 | 9.50 | 10.31 | 10.20 | 9.70 | 9.71 | 10.65 | 10.96 | 10.39 | 9.97 |
| New South Wales | 10.18 | 9.95 | 10.63 | 10.20 | 9.89 | 9.89 | 10.37 | 10.86 | 10.89 | 10.11 |
| Victoria | 12.17 | 12.55 | 11.86 | 12.71 | 11.45 | 11.49 | 11.45 | 12.23 | 11.11 | 11.59 |
| South Australia (Proper) | 10.45 | 10.66 | 10.16 | 10.14 | 9.74 | 10.09 | 9.89 | 10.28 | 10.82 | 10.71 |
| Western Australia | 10.98 | 12.12 | 11.47 | 11.17 | 10.27 | 10.11 | 10.19 | 11.06 | 9.34 | 9.41 |
| Tasmania | 10.00 | 10.91 | 10.81 | 11.36 | 9.68 | 11.10 | 10.13 | 10.73 | 10.87 | 9.67 |
| Commonwealth | 10.88 | 10.92 | 10.99 | 11.07 | 10.33 | 10.43 | 10.66 | 11.23 | 10.78 | 10.51 |
| New Zealand | 9.27 | 9.31 | 10.95 | 9.57 | 9.22 | 9.71 | 9.39 | 8.87 | 9.47 | 9.31 |
New Zealand has a lower death-rate than any of the Australian States, which again have considerably lower rates than other countries. A diagram is given showing the death-rates of England, Australia, and New Zealand, in each year since 1887. The rates of England and Australia show a considerable fall throughout the period, but are in no year lower than the New Zealand rate.
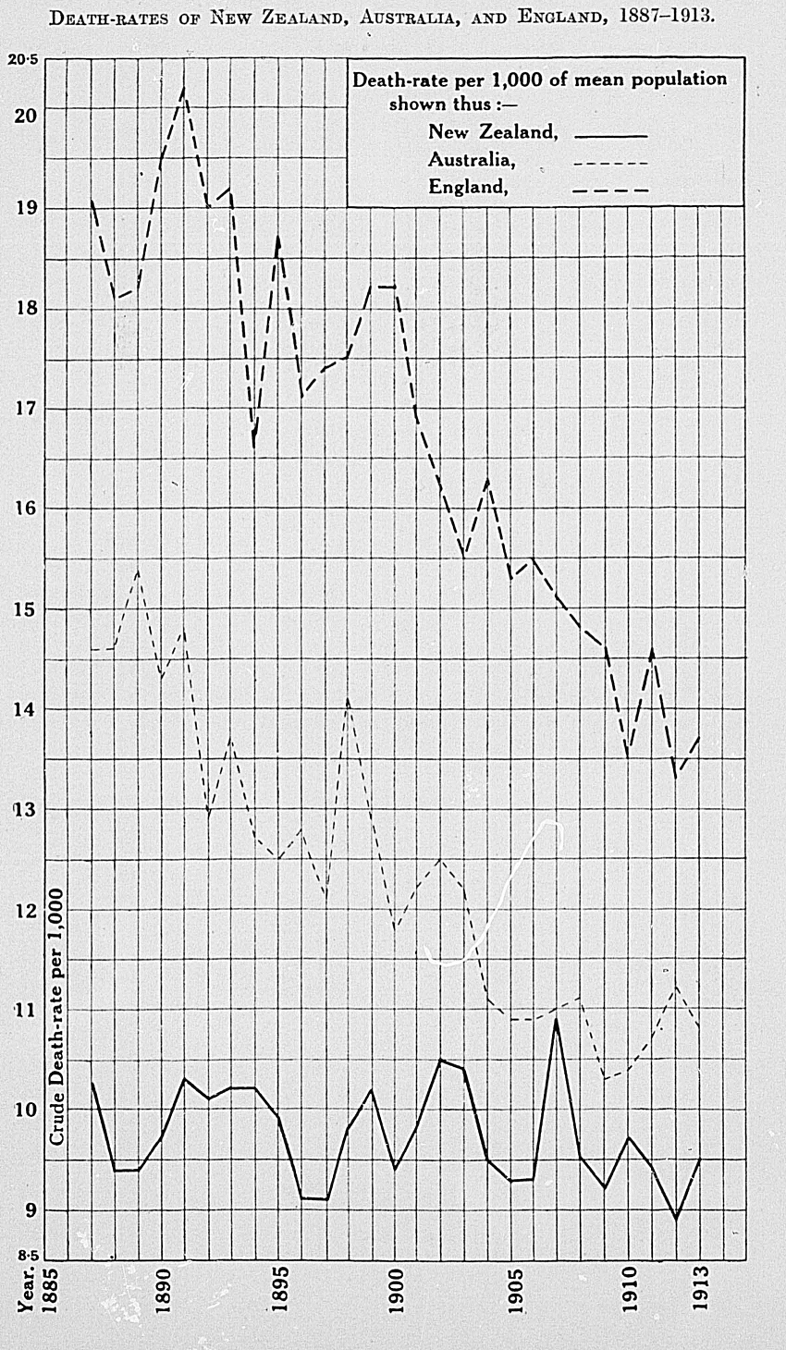
The death-rates of certain of the principal European and other countries are also given.
| DEATH-RATES PER 1,000 OF MEAN POPULATION. | ||
|---|---|---|
| Country. | Average of Five Years, 1908–12 | Year 1913. |
* Registration Area. † 1912 figures. | ||
| Netherlands | 13.8 | 12.3 |
| Denmark | 13.5 | 12.5 |
| Ontario | 13.3 | 12.7 |
| Norway | 13.6 | 13.2 |
| Sweden | 14.1 | 13.6 |
| England and Wales | 14.2 | 13.7 |
| United States* | 14.5 | 14.1 |
| Switzerland | 15.4 | 14.1† |
| Belgium | 15.7 | 14.8† |
| Scotland | 15.6 | 15.5 |
| German Empire | 16.9 | 15.6† |
| Finland | 16.9 | 16.3† |
| Ireland | 16.9 | 17.1 |
| France | 18.6 | 17.7 |
| Italy | 20.8 | 18.2† |
| Austria | 21.8 | 20.5† |
| Servia | 23.6 | 21.1† |
| Jamaica | 22.9 | 21.7 |
| Spain | 23.2 | 22.1 |
| Hungary | 24.6 | 23.3† |
| Roumania | 25.6 | 25.9 |
| Ceylon | 31.1 | 28.4 |
| Chile | 30.9 | 29.7† |
Perfect accuracy in comparing one country with another can be attained only by the use of what is termed an “index of mortality.” The proportions of the living vary in regard to the different age-groups, and the ordinary death-rate—which is calculated on the population as a whole—does not afford a true means of judging of the relative healthiness of the places compared. But by taking a population like that of Sweden, and applying the percentage at each age-group to the death-rates, a standard of health or index of mortality can be arrived at. This has been done for New Zealand, in accordance with a resolution of the Statistical Conference held at Hobart in 1902, and the result is expressed in tabular form.
| INDEX OF MORTALITY IN NEW ZEALAND FOR 1914. | |||||
|---|---|---|---|---|---|
| Ages, in Years. | Estimated Mean Population. | Number of Deaths. | Death-rate per 1,000. | Percentage of Population of Sweden, 1890 (Standard). | Index of Mortality in New Zealand per 1,000. |
| Under 1 | 26,351 | 1,456 | 55.25 | 2.55 | 1.41 |
| 1 and under 20 | 410,804 | 967 | 2.35 | 39.80 | 0.94 |
| 20 “ 40 | 393,051 | 1,498 | 3.81 | 26.96 | 1.03 |
| 40 “ 60 | 183,535 | 1,874 | 10.21 | 19.23 | 1.96 |
| 60 and upwards | 76,587 | 4,353 | 56.84 | 11.46 | 6.51 |
| Totals | 1,090,328 | 10,148 | 9.31 | 100.00 | 11.85 |
A similar calculation for the States of the Australian Commonwealth has been made for 1913. The results, when compared with the actual rates, exhibit to what degree the age-constitution of the population affects the death-rate. New Zealand figures are also given.
| INDEX OF MORTALITY, 1913. | ||||||||
|---|---|---|---|---|---|---|---|---|
| — | Queensland. | New South Wales. | Victoria. | South Australia. | Western Australia. | Tasmania. | Commonwealth. | New Zealand. |
| Index | 13.25 | 13.61 | 13.50 | 13.25 | 12.58 | 13.54 | 13.47 | 11.92 |
| Actual | 10.39 | 10.89 | 11.11 | 10.82 | 9.34 | 10.87 | 10.78 | 9.47 |
An index of mortality worked by the same method has been obtained for England and Wales for the year 1913. The index is found to be 16.14 as against an actual rate of 13.68.
BIRTHPLACES OF DECEASED PERSONS.
| TABLE SHOWINGTHE BIRTHPLACES AND AGES OFTHE PERSONS WHOSE DEATHS WEREREGISTERED DURINGTHE YEAR 1914. | |||||||||
|---|---|---|---|---|---|---|---|---|---|
| Ages, in Years. | |||||||||
| Birthplace. | Under 10 | 10 and under 20 | 20 and under 30 | 30 and under 40 | 40 and under 50 | 50 and under 60 | 60 and under 70 | 70 and upwards. | Totals. |
| British. | |||||||||
| Australasia— | |||||||||
| New Zealand | 2,083 | 275 | 486 | 511 | 393 | 234 | 142 | 72 | 4,196 |
| Queensland | .. | 1 | 2 | .. | 1 | .. | .. | .. | 4 |
| New South Wales | 3 | 2 | 9 | 15 | 11 | 12 | 13 | 11 | 76 |
| Victoria | 1 | .. | 11 | 14 | 23 | 51 | 14 | 7 | 121 |
| South Australia | .. | 1 | 3 | 1 | 2 | 5 | 6 | 2 | 20 |
| Western Australia | .. | .. | .. | .. | .. | .. | .. | 1 | 1 |
| Tasmania | .. | .. | 2 | 7 | 6 | 16 | 12 | 17 | 60 |
| Australia (State not named) | .. | .. | 3 | 2 | 4 | 6 | 3 | 2 | 20 |
| United Kingdom— | |||||||||
| England and Wales | 22 | 15 | 63 | 167 | 183 | 306 | 502 | 1,193 | 2,451 |
| Scotland | 3 | 6 | 22 | 46 | 70 | 117 | 222 | 726 | 1,212 |
| Ireland | 1 | 1 | 10 | 30 | 58 | 141 | 235 | 597 | 1,073 |
| Other British possessions— | |||||||||
| India | .. | .. | .. | 1 | 2 | 6 | 6 | 3 | 18 |
| North America | .. | .. | .. | 1 | 1 | 2 | 10 | 27 | 41 |
| South Africa | 1 | .. | 2 | .. | 1 | 2 | .. | 1 | 7 |
| Others | .. | .. | .. | 3 | .. | 2 | 4 | 7 | 16 |
| Foreign. | |||||||||
| Austria | .. | .. | 3 | .. | 2 | 1 | 4 | 4 | 14 |
| Belgium | .. | .. | .. | 1 | .. | 2 | .. | 3 | 6 |
| Denmark | .. | .. | 1 | 4 | 2 | 6 | 6 | 24 | 43 |
| Finland | .. | .. | .. | 2 | 2 | 2 | .. | 1 | 7 |
| France | .. | .. | .. | 2 | .. | .. | 1 | 3 | 6 |
| Germany | .. | .. | .. | 2 | 7 | 7 | 23 | 56 | 95 |
| Italy | .. | .. | 3 | .. | 1 | 1 | 2 | 2 | 9 |
| Norway | .. | .. | .. | 2 | 2 | 3 | 6 | 12 | 25 |
| Poland | .. | .. | .. | .. | .. | .. | .. | 6 | 6 |
| Russia | .. | .. | 1 | 2 | 1 | 2 | 1 | 3 | 10 |
| Sweden | .. | .. | .. | 2 | 2 | 4 | 10 | 18 | 36 |
| Switzerland | 1 | .. | 1 | .. | 1 | .. | .. | 4 | 7 |
| United States of America | .. | .. | .. | .. | 2 | 1 | 5 | 7 | 15 |
| China | .. | .. | 2 | .. | 7 | 4 | 17 | 11 | 41 |
| Others | .. | .. | 3 | 1 | 5 | 7 | 3 | 13 | 32 |
| At sea | 2 | .. | .. | 4 | 5 | 8 | 5 | 5 | 29 |
| Unspecified | 1 | 4 | 15 | 36 | 62 | 70 | 80 | 183 | 451 |
| Totals | 2,118 | 305 | 642 | 856 | 856 | 1,018 | 1,332 | 3,021 | 10,148 |
The occupations of males who died during 1914, arranged according to the census classification, are shown in the following table:—
| OCCUPATIONS OF DECEASED MALES. | |||||||
|---|---|---|---|---|---|---|---|
| Ages, in Years. | |||||||
| Occupations. | Number of Deaths of Males. | Under 15. | 15 and under 20. | 20 and under 25. | 25 and under 45. | 45 and under 65. | 65 and upwards |
| Class I.—Professional. | |||||||
| General Government | 27 | .. | .. | .. | 5 | 9 | 13 |
| Local Government | 4 | .. | .. | .. | 2 | 1 | 1 |
| Defence | 15 | .. | .. | 1 | 3 | 4 | 7 |
| Law and order | 41 | .. | .. | 2 | 10 | 15 | 14 |
| Religion | 26 | .. | .. | .. | 2 | 9 | 15 |
| Health | 36 | .. | .. | 2 | 10 | 10 | 14 |
| Literature | 13 | .. | .. | .. | 4 | 1 | 8 |
| Science | 2 | .. | .. | .. | 1 | 1 | .. |
| Civil and mechanical engineering, architecture, and surveying | 29 | .. | 2 | .. | 4 | 12 | 11 |
| Education | 33 | .. | .. | 1 | 3 | 10 | 19 |
| Fine arts | 5 | .. | .. | .. | 3 | 1 | 1 |
| Music | 3 | .. | .. | .. | 2 | .. | 1 |
| Amusements | 11 | .. | .. | .. | 6 | 3 | 2 |
| Total Professional | 245 | .. | 2 | 6 | 55 | 76 | 106 |
| Class II.—Domestic. | |||||||
| Hotelkeepers and assistants | 63 | .. | .. | 1 | 20 | 21 | 21 |
| Others engaged in providing board and lodging | 45 | .. | .. | 2 | 14 | 15 | 14 |
| Coachmen and grooms | 5 | .. | .. | 2 | 2 | 1 | .. |
| Laundrymen | 3 | .. | .. | .. | .. | 1 | 2 |
| Hairdressers | 6 | .. | .. | .. | 2 | 3 | 1 |
| Others engaged in domestic service | 14 | .. | .. | .. | 4 | 7 | 3 |
| Total Domestic | 136 | .. | .. | 5 | 42 | 48 | 41 |
| Class III.—Commercial. | |||||||
| Banking and finance | 11 | .. | .. | 1 | 1 | 5 | 4 |
| Insurance and valuation | 16 | .. | .. | 3 | 4 | 5 | 4 |
| Land and household property | 8 | .. | .. | .. | 1 | 2 | 5 |
| Trade— | |||||||
| Books, publications, and advertising | 18 | .. | .. | .. | 1 | 6 | 11 |
| Stationery, &c. | 1 | .. | .. | .. | .. | 1 | .. |
| Carriages and vehicles | 1 | .. | .. | .. | .. | 1 | .. |
| Textile fabrics | 40 | .. | .. | 2 | 11 | 13 | 14 |
| Dress | 2 | .. | .. | .. | 1 | .. | 1 |
| Animal food | 46 | .. | 1 | .. | 16 | 18 | 11 |
| Vegetable food | 10 | .. | .. | 1 | 3 | 4 | 2 |
| Groceries, drinks, narcotics, and stimulants | 23 | .. | 1 | .. | 6 | 9 | 7 |
| Living animals | 10 | .. | .. | .. | 3 | 4 | 3 |
| Wool and other animal matter | 2 | .. | .. | .. | .. | .. | 2 |
| Seeds, Plants, &c. | 2 | .. | .. | .. | 1 | .. | 1 |
| Timber | 3 | .. | .. | .. | .. | .. | 3 |
| Wood, coal, &c. | 3 | .. | .. | .. | 1 | 2 | .. |
| Stone, earthenware, glass, &c. | 1 | .. | .. | .. | .. | .. | 1 |
| Metals other than gold and silver | 8 | .. | 1 | .. | 1 | 3 | 3 |
| Merchants, shopkeepers, &c. | 68 | .. | 1 | 2 | 6 | 23 | 36 |
| Dealers and hawkers | 16 | .. | .. | .. | 2 | 10 | 4 |
| Agents, brokers, &c. | 15 | .. | .. | .. | 2 | 4 | 9 |
| Accountants, clerks, &c. | 126 | .. | 8 | 11 | 27 | 38 | 42 |
| Commercial travellers, salesmen | 36 | .. | .. | .. | 12 | 15 | 9 |
| Officer of public company, society | 4 | .. | .. | .. | .. | 3 | 1 |
| Storemen and others engaged in storage | 19 | .. | .. | .. | 7 | 7 | 5 |
| Other mercantile persons | 8 | .. | .. | .. | 5 | 1 | 2 |
| Total Commercial | 497 | .. | 12 | 20 | 111 | 174 | 180 |
| Class IV.—Transport and Communication. | |||||||
| Railway traffic | 43 | .. | 2 | 3 | 16 | 7 | 15 |
| Tramways | 7 | .. | .. | 1 | 4 | 2 | .. |
| Road | 86 | .. | 4 | 3 | 24 | 28 | 27 |
| Sea and river traffic | 161 | .. | 3 | 6 | 45 | 50 | 57 |
| Postal service | 15 | .. | 3 | .. | 2 | 6 | 4 |
| Telegraph and telephone service | 8 | .. | 1 | 1 | 5 | .. | 1 |
| Delivery of parcels, &c., by hand | 8 | .. | .. | 1 | 1 | 6 | .. |
| Total Transport and Communication | 328 | .. | 13 | 15 | 97 | 99 | 104 |
| Class V.—Industrial. | |||||||
| Books and publications | 26 | .. | .. | 2 | 4 | 8 | 12 |
| Musical instruments | 2 | .. | .. | .. | 1 | .. | 1 |
| Prints, pictures, and art materials | 3 | .. | .. | .. | 1 | 1 | 1 |
| Ornaments, minor art products, &c. | 5 | .. | .. | .. | .. | 1 | 4 |
| Designs, medals, type, and dies | 4 | .. | .. | .. | .. | .. | 4 |
| Watches, clocks, and scientific instruments | 10 | .. | .. | .. | 1 | 5 | 4 |
| Arms, ammunition, and explosives | 1 | .. | .. | .. | .. | .. | 1 |
| Engines, machines, tools, &c. | 18 | .. | .. | 1 | 8 | 1 | 8 |
| Carriages and vehicles | 13 | .. | .. | 1 | 3 | 1 | 8 |
| Harness, saddlery, and leatherware | 10 | .. | .. | 1 | 1 | 4 | 4 |
| Ships, boats, and equipments | 22 | .. | .. | .. | 3 | 2 | 17 |
| Furniture | 15 | .. | .. | 1 | 4 | 2 | 8 |
| Building-material (wood) | 44 | .. | .. | 5 | 14 | 8 | 17 |
| Chemicals | 1 | .. | .. | .. | .. | .. | 1 |
| Textile fabrics | 7 | .. | .. | 1 | .. | 2 | 4 |
| Dress— | |||||||
| Tailors | 29 | .. | .. | .. | 7 | 8 | 14 |
| Bootmakers | 62 | .. | 2 | 1 | 9 | 11 | 39 |
| Others engaged in manufacture of dress | 2 | .. | .. | .. | .. | .. | 2 |
| Fibrous materials | 6 | .. | .. | .. | 1 | 3 | 2 |
| Animal food | 9 | .. | .. | 2 | 2 | 4 | 1 |
| Vegetable food | 50 | .. | .. | 1 | 10 | 6 | 33 |
| Groceries, drinks, narcotics, and stimulants | 9 | .. | .. | .. | 1 | 4 | 4 |
| Wool-scouring, soap, and candles, &c. | 7 | .. | .. | 1 | 1 | 3 | 2 |
| Woodwork | 1 | .. | .. | .. | .. | .. | 1 |
| Marble, clay, cement, glass, &c. | 9 | .. | .. | .. | 2 | 2 | 5 |
| Jewellery and precious stones | 8 | .. | .. | .. | 4 | .. | 4 |
| Metals, other than gold or silver— | |||||||
| Blacksmiths | 57 | .. | 1 | 2 | 10 | 10 | 34 |
| Moulders, iron and brass | 8 | .. | .. | .. | 2 | 3 | 3 |
| Tinsmiths | 4 | .. | .. | .. | 1 | 2 | 1 |
| Others | 9 | .. | .. | .. | 6 | 1 | 2 |
| Fuel, light, &c. | 7 | .. | 1 | .. | 2 | 2 | 2 |
| Building and construction— | |||||||
| Builders and contractors | 33 | .. | .. | .. | 2 | 8 | 23 |
| Stonemasons | 12 | .. | .. | .. | 3 | 1 | 8 |
| Bricklayers | 15 | .. | .. | .. | 2 | 5 | 8 |
| Carpenters | 132 | .. | 1 | 3 | 30 | 19 | 79 |
| Plasterers | 6 | .. | 1 | 1 | 2 | .. | 2 |
| Painters, glaziers, and signwriters | 35 | .. | .. | 1 | 9 | 13 | 12 |
| Plumbers and gasfitters | 20 | .. | .. | 1 | 12 | 2 | 5 |
| Roads, railways, and earthworks | 23 | .. | .. | .. | 5 | 6 | 12 |
| Disposal of the dead | 3 | .. | .. | .. | .. | .. | 3 |
| Other industrial workers— | |||||||
| Mechanics, manufacturers | 7 | .. | .. | .. | 3 | 2 | 2 |
| Factory workers, managers, &c. | 14 | .. | 1 | 3 | 4 | 4 | 2 |
| Contractors, managers, &c. | 29 | .. | .. | .. | 5 | 7 | 17 |
| Machinists, machine hands | 5 | .. | .. | .. | 2 | 2 | 1 |
| Engineers, engine-drivers | 78 | .. | .. | 2 | 27 | 28 | 21 |
| Labourers undefined | 707 | .. | 12 | 27 | 162 | 210 | 296 |
| Total industrial | 1,577 | .. | 19 | 57 | 366 | 401 | 734 |
| Class VI.—Agricultural, Pastoral, and Mining Pursuits, &c. | |||||||
| Fisheries, wild animals, &c. | 21 | .. | .. | 3 | 5 | 7 | 6 |
| Forestry | 17 | .. | 1 | 1 | 6 | 7 | 2 |
| Conservation of water | 1 | .. | .. | .. | .. | .. | 1 |
| Kauri-gum diggers | 34 | .. | 1 | .. | 2 | 14 | 17 |
| Fruit-growers | 13 | .. | .. | .. | 2 | 3 | 8 |
| Gardeners | 115 | .. | .. | .. | 11 | 27 | 77 |
| Other agricultural pursuits | 2 | .. | .. | .. | 2 | .. | .. |
| Sheepfarmers, shearers, &c. | 78 | .. | .. | 1 | 15 | 24 | 38 |
| Other pastoral pursuits | 34 | .. | .. | .. | 3 | 15 | 16 |
| Farming, undefined | 954 | .. | 16 | 16 | 114 | 235 | 573 |
| Coal-mining | 112 | .. | 8 | 6 | 34 | 24 | 40 |
| Gold-mining | 166 | .. | .. | .. | 21 | 25 | 120 |
| Quarrying | 4 | .. | .. | .. | .. | 1 | 3 |
| Mining undefined | 38 | .. | .. | .. | 5 | 8 | 25 |
| Total agricultural, pastoral, and mining | 1,589 | .. | 26 | 27 | 220 | 390 | 926 |
| Class VII.—Indefinite. | |||||||
| Independent means, &c. | 95 | .. | .. | 1 | 4 | 8 | 82 |
| Dependent relatives (including persons under 20 years of age with no specified occupation) | 1,287 | 1,250 | 31 | 6 | .. | .. | .. |
| Dependent upon the State or upon public or private support | 54 | .. | .. | .. | .. | .. | 54 |
| Undefined or unknown | 178 | .. | .. | 10 | 23 | 37 | 108 |
| Total indefinite | 1,614 | 1,250 | 31 | 17 | 27 | 45 | 244 |
| Total deaths of Males | 5,986 | 1,250 | 103 | 147 | 918 | 1,233 | 2,335 |
The total number of deaths registered for the four centres in 1914 was 3,052—viz., 2,461 in the cities, and 591 in the suburban boroughs.
By including the suburbs the death-rate for last year is lowered at all of the four centres. The rates for the year are,—
| Death-rates per 1,000 of Mean Population. | |
|---|---|
| Auckland City | 10.43 |
| ” and seven suburban boroughs | 9.42 |
| Wellington City | 10.73 |
| ” and four suburban boroughs | 10.47 |
| Christchurch City | 10.02 |
| ” and five suburban boroughs | 9.58 |
| Dunedin City | 11.00 |
| ” and five suburban boroughs | 10.22 |
The death-rates for the cities, including suburban boroughs, for five years are as below:—
| Deaths per 1,000 of Population. | |||||
|---|---|---|---|---|---|
| 1910. | 1911. | 1912. | 1913. | 1914. | |
| Auckland (including suburbs) | 9.73 | 10.93 | 9.73 | 10.61 | 9.42 |
| Wellington “ | 8.95 | 10.08 | 9.13 | 9.08 | 10.47 |
| Christchurch “ | 10.41 | 10.36 | 10.34 | 10.15 | 9.58 |
| Dunedin “ | 10.24 | 10.43 | 10.43 | 11.03 | 10.22 |
If the number of deaths of infants under one year be excluded, the mortality among the rest of the population is found to have been for 1913 and 1914 in the following ratio to the 1,000 living:—
| 1913. | 1914. | |
|---|---|---|
| Auckland (including suburbs) | 8.74 | 8.19 |
| Wellington “ | 7.79 | 8.59 |
| Christchurch “ | 8.82 | 8.25 |
| Dunedin “ | 9.59 | 9.25 |
In the portion of the births subsection dealing with births and birth-rates of the chief centres it is explained that a new system of allocating births and of computing birth-rates for the centres has been adopted. The birth-rates obtained under the new system are lower than those that would be arrived at under the former system, and the new system is also responsible to a slight degree for a higher rate of infantile mortality as reckoned on per 100 births. The greater part of the increase in 1913 as compared with 1912 is, however, due to an actual excess in point of numbers of deaths of infants registered. The rates per 100 births in 1912, 1913, and 1914 are,—
| 1912. | 1913. | 1914. | |
|---|---|---|---|
| Auckland (including suburbs) | 5.70 | 8.08 | 5.76 |
| Wellington “ | 6.13 | 6.02 | 8.26 |
| Christchurch “ | 6.00 | 6.35 | 6.82 |
| Dunedin “ | 3.81 | 7.34 | 5.43 |
Again, the percentage of deaths of children under 5 to the total number of deaths in 1914 was—in Auckland, 20.99; in Wellington, 25.36; in Christchurch, 18.10; in Dunedin, 13.15.
Excluding suburbs, and dealing with the deaths at all ages in the four cities or central boroughs only, the rates at Auckland, Christchurch, and Dunedin for 1914 are found to be lower than those for the previous year. The figures for five years are given:—
| Deaths per 1,000 of Population. | |||||
|---|---|---|---|---|---|
| 1910. | 1911. | 1912. | 1913. | 1914. | |
| Auckland (excluding suburbs) | 11.88 | 13.68 | 11.65 | 11.49 | 10.43 |
| Wellington “ | 9.31 | 10.32 | 9.43 | 9.30 | 10.73 |
| Christchurch “ | 10.54 | 10.95 | 10.63 | 10.40 | 10.02 |
| Dunedin “ | 10.99 | 11.79 | 11.57 | 11.98 | 11.00 |
Omitting the deaths of infants under one year, and calculating the rate on the population of one year of age and upwards, a decrease in the rate is shown at three of the four centres. The mean of the rates for five years are also given:—
| Deaths per 1,000 of Population, excluding Infants under One Year of Age. | |||
|---|---|---|---|
| 1913. | 1914. | Mean of Five Years. | |
| Auckland (excluding suburbs) | 9.42 | 9.14 | 10.04 |
| Wellington “ | 8.03 | 8.72 | 8.13 |
| Christchurch “ | 9.06 | 8.64 | 9.01 |
| Dunedin “ | 10.54 | 10.00 | 10.27 |
The death-rates of the four chief centres compare very favourably with those of the capital cities of the various Australian States. The following table shows the numbers and rates of births and deaths for the year 1914. Rates for Perth are not available.
| Cities (including Suburbs). | Estimated Mean Population. | Births. | Deaths. | Excess of Births over Deaths | ||
|---|---|---|---|---|---|---|
| Total Number. | Rate per 1,000 of Population. | Total Number. | Rate per 1,000 of Population. | |||
*Ten-mile radius. | ||||||
| Sydney | 741,200 | 20,821 | 28.09 | 7,603 | 10.26 | 13,218 |
| Melbourne | 662,500 | 17,767 | 26.80 | 8,609 | 12.99 | 9,158 |
| Adelaide | 203,180 | 6,519 | 32.08 | 2,791 | 13.74 | 3,728 |
| Brisbane* | 152,642 | 5,246 | 34.37 | 1,931 | 12.67 | 3,312 |
| Hobart | 39,294 | 1,402 | 35.68 | 573 | 14.58 | 829 |
| Auckland | 96,638 | 2,395 | 24.78 | 910 | 9.42 | 1,485 |
| Wellington | 73,471 | 1,865 | 25.33 | 769 | 10.47 | 1,096 |
| Christchurch | 72,619 | 1,614 | 22.22 | 696 | 9.58 | 918 |
| Dunedin | 66,227 | 1,437 | 21.70 | 677 | 10.22 | 760 |
The low birth rates of the New Zealand cities as compared with the Australian capitals is largely due to the difference in system of allocation of births.
The table following shows the number of living issue (male, female, and total) left by married men whose deaths were registered during the ten years 1905–14, the information being given according to age of father and of issue. It will be seen that during the period under review 21,479 fathers left issue to the number of 105,216, an average of 4.90. There were also 3,665 married men who died without living issue.
| NUMBER AND AGES OF ISSUE LEFTBY MARRIED MEN, 1905–14. | |||||||||
|---|---|---|---|---|---|---|---|---|---|
| Number of Issue left by Fathers dying within the Age-groups shown at Head of Column. | |||||||||
| Age of Issue, in Years. | 20 and under 30. | 30 and under 40. | 40 and under 50. | 50 and under 60. | 60 and under 65. | 65 and under 70. | 70 and under 80. | 80 and over. | Totals. |
| Males. | |||||||||
| 0 | 50 | 129 | 53 | 23 | 5 | 3 | .. | .. | 263 |
| 1 | 44 | 144 | 93 | 30 | 8 | 5 | 2 | .. | 326 |
| 2 | 74 | 231 | 110 | 50 | 9 | 11 | 4 | .. | 489 |
| 3 | 37 | 187 | 156 | 72 | 9 | 8 | 3 | 1 | 473 |
| 4 | 35 | 203 | 182 | 78 | 13 | 8 | 7 | 1 | 527 |
| 5 | 11 | 220 | 186 | 84 | 16 | 13 | 9 | .. | 539 |
| 6 | 12 | 193 | 186 | 91 | 19 | 12 | 9 | 1 | 523 |
| 7 | 5 | 181 | 197 | 120 | 22 | 25 | 14 | 1 | 565 |
| 8 | 2 | 149 | 231 | 142 | 39 | 20 | 15 | 2 | 600 |
| 9 | .. | 116 | 208 | 147 | 34 | 25 | 20 | 2 | 552 |
| 10 | .. | 120 | 237 | 183 | 46 | 18 | 24 | 2 | 630 |
| 11 | .. | 79 | 193 | 201 | 45 | 40 | 35 | 3 | 596 |
| 12 | .. | 61 | 255 | 205 | 67 | 45 | 26 | 3 | 662 |
| 13 | .. | 32 | 204 | 242 | 75 | 66 | 40 | 7 | 666 |
| 14 | .. | 38 | 239 | 276 | 82 | 90 | 54 | 7 | 786 |
| 15 | .. | 21 | 177 | 274 | 96 | 75 | 58 | 6 | 707 |
| 16 | .. | 15 | 201 | 296 | 97 | 85 | 89 | 12 | 795 |
| 17 | .. | 6 | 192 | 343 | 149 | 125 | 94 | 8 | 917 |
| 18 | .. | 7 | 173 | 337 | 145 | 121 | 105 | 10 | 898 |
| 19 | .. | 3 | 132 | 368 | 177 | 147 | 145 | 19 | 991 |
| 20 | .. | 2 | 141 | 32 | 195 | 151 | 156 | 14 | 1,011 |
| 21 and over | .. | 3 | 317 | 3,708 | 4,188 | 6,419 | 15,748 | 7,838 | 38,221 |
| Unspecified | 14 | 71 | 184 | 294 | 154 | 23 | 520 | 46 | 1,536 |
| Total male issue | 284 | 2,211 | 4,247 | 7,916 | 5,690 | 7,765 | 17,177 | 7,983 | 53,273 |
| Females. | |||||||||
| 0 | 56 | 119 | 76 | 22 | 4 | 1 | 1 | .. | 279 |
| 1 | 66 | 162 | 102 | 43 | 8 | 3 | 2 | .. | 386 |
| 2 | 41 | 205 | 137 | 60 | 8 | 4 | 2 | .. | 457 |
| 3 | 47 | 207 | 148 | 71 | 12 | 3 | 3 | .. | 491 |
| 4 | 22 | 196 | 147 | 72 | 13 | 11 | 9 | .. | 470 |
| 5 | 12 | 191 | 179 | 98 | 15 | 11 | 10 | 3 | 519 |
| 6 | 17 | 171 | 176 | 104 | 12 | 15 | 8 | 2 | 505 |
| 7 | 7 | 159 | 198 | 125 | 28 | 21 | 10 | .. | 548 |
| 8 | 2 | 125 | 207 | 150 | 28 | 24 | 22 | 1 | 559 |
| 9 | 3 | 130 | 208 | 152 | 33 | 28 | 14 | 2 | 576 |
| 10 | .. | 101 | 223 | 172 | 32 | 30 | 21 | 5 | 584 |
| 11 | .. | 89 | 207 | 203 | 55 | 30 | 25 | 2 | 611 |
| 12 | .. | 68 | 231 | 216 | 59 | 52 | 38 | 5 | 669 |
| 13 | .. | 48 | 191 | 241 | 85 | 52 | 38 | 4 | 659 |
| 14 | .. | 33 | 209 | 242 | 80 | 65 | 58 | 2 | 689 |
| 15 | .. | 22 | 186 | 277 | 88 | 75 | 60 | 4 | 712 |
| 16 | .. | 19 | 204 | 307 | 122 | 91 | 84 | 4 | 831 |
| 17 | .. | 7 | 167 | 320 | 144 | 119 | 87 | 10 | 854 |
| 18 | .. | 5 | 171 | 320 | 153 | 131 | 122 | 6 | 908 |
| 19 | .. | 1 | 152 | 382 | 173 | 146 | 130 | 16 | 1,000 |
| 20 | .. | 1 | 122 | 365 | 175 | 144 | 123 | 15 | 915 |
| 21 and over | .. | .. | 311 | 3,612 | 4,114 | 6,484 | 15,149 | 7,511 | 37,211 |
| Unspecified | 8 | 75 | 175 | 264 | 181 | 235 | 507 | 35 | 1,480 |
| Total female issue | 281 | 2,140 | 4,157 | 7,818 | 5,622 | 7,775 | 16,523 | 7,627 | 51,943 |
| Both Sexes. | |||||||||
| 0 | 106 | 248 | 129 | 45 | 9 | 4 | 1 | .. | 542 |
| 1 | 110 | 306 | 195 | 73 | 16 | 8 | 4 | .. | 712 |
| 2 | 115 | 436 | 247 | 110 | 17 | 15 | 6 | .. | 946 |
| 3 | 84 | 394 | 304 | 143 | 21 | 11 | 6 | 1 | 964 |
| 4 | 57 | 399 | 329 | 150 | 26 | 19 | 16 | 1 | 997 |
| 5 | 23 | 411 | 365 | 182 | 31 | 24 | 19 | 3 | 1,058 |
| 6 | 29 | 364 | 362 | 195 | 31 | 27 | 17 | 3 | 1,028 |
| 7 | 12 | 340 | 395 | 245 | 50 | 46 | 24 | 1 | 1,113 |
| 8 | 4 | 274 | 438 | 292 | 67 | 44 | 37 | 3 | 1,159 |
| 9 | 3 | 252 | 416 | 299 | 67 | 53 | 34 | 4 | 1,128 |
| 10 | .. | 221 | 460 | 355 | 78 | 48 | 45 | 7 | 1,214 |
| 11 | .. | 168 | 400 | 404 | 100 | 70 | 60 | 5 | 1,207 |
| 12 | .. | 129 | 486 | 421 | 126 | 97 | 64 | 8 | 1,331 |
| 13 | .. | 80 | 395 | 483 | 160 | 118 | 78 | 11 | 1,325 |
| 14 | .. | 71 | 448 | 518 | 162 | 155 | 112 | 9 | 1,475 |
| 15 | .. | 43 | 363 | 551 | 184 | 150 | 118 | 10 | 1,419 |
| 16 | .. | 34 | 405 | 603 | 219 | 176 | 173 | 16 | 1,626 |
| 17 | .. | 13 | 359 | 663 | 293 | 244 | 181 | 18 | 1,771 |
| 18 | .. | 12 | 344 | 657 | 298 | 252 | 227 | 16 | 1,806 |
| 19 | .. | 4 | 284 | 750 | 350 | 293 | 275 | 35 | 1,991 |
| 20 | .. | 3 | 263 | 717 | 370 | 295 | 279 | 29 | 1,956 |
| 21 and over | .. | 3 | 658 | 7,320 | 8,302 | 12,903 | 30,897 | 15,349 | 75,432 |
| Unspecified | 22 | 146 | 359 | 558 | 335 | 488 | 1,027 | 81 | 3,016 |
| Grand totals | 565 | 4,351 | 8,404 | 15,734 | 11,312 | 15,540 | 33,700 | 15,610 | 105,216 |
| Total male deaths | 3,531 | 4,131 | 4,212 | 5,289 | 3,278 | 4,518 | 10,122 | 4,719 | 39,800 |
| Married men who died— | |||||||||
| (a) Without living issue | 199 | 436 | 460 | 489 | 277 | 418 | 942 | 444 | 3,665 |
| (b) Leaving issue | 334 | 1,634 | 2,196 | 3,179 | 2,072 | 2,811 | 6,204 | 3,049 | 21,479 |
Several tables dealing with orphanhood are given in full in the annual volume of Statistics of the Dominion. Two of these showing respectively number of issue under 14 and 21 years of age left by married men whose deaths were registered during 1914 are summarized and given below.
| ISSUE UNDER AGE 14 LEFT BY MARRIED MEN, YEAR 1914. | ||||||||
|---|---|---|---|---|---|---|---|---|
| Married Men who died leaving Number of Issue under 14 Years of Age shown at Head of Column. | ||||||||
| Age at Death, in Years. | 1 | 2 | 3 | 4 | 5 | 6 | 7 and over. | Total Number of Married Men who died leaving Issue under Age 14. |
| 20 and under 25 | 1 | 1 | .. | .. | .. | .. | .. | 2 |
| 25 “ 30 | 16 | 11 | 3 | 1 | .. | .. | .. | 31 |
| 30 “ 35 | 29 | 21 | 15 | 9 | 3 | 3 | .. | 80 |
| 35 “ 40 | 33 | 20 | 28 | 10 | 11 | 3 | 3 | 108 |
| 40 “ 45 | 33 | 39 | 24 | 14 | 7 | 5 | 2 | 124 |
| 45 “ 50 | 29 | 20 | 24 | 13 | 7 | 7 | 2 | 102 |
| 50 “ 55 | 44 | 28 | 16 | 8 | 4 | 2 | 1 | 103 |
| 55 “ 60 | 33 | 18 | 14 | 8 | .. | 1 | .. | 74 |
| 60 “ 65 | 18 | 10 | 2 | 1 | .. | .. | .. | 31 |
| 65 “ 70 | 19 | 14 | 5 | .. | .. | .. | .. | 38 |
| 70 “ 75 | 12 | 4 | .. | .. | .. | .. | .. | 16 |
| 75 “ 80 | 4 | 1 | .. | .. | .. | .. | .. | 5 |
| 80 and over | 3 | 3 | .. | .. | .. | .. | .. | 7 |
| Totals | 274 | 190 | 131 | 64 | 32 | 21 | 8 | 720 |
| ISSUE UNDER AGE 21 LEFT BY MARRIED MEN, YEAR 1914. | ||||||||
|---|---|---|---|---|---|---|---|---|
| Married Men who died leaving Number of Issue under 21 Years of Age shown at Head of Column. | ||||||||
| Age at Death, in Years. | 1 | 2 | 3 | 4 | 5 | 6 | 7 and over. | Total Number of Married Men who died leaving Issue under Age 21. |
| 20 and under 25 | 1 | 1 | .. | .. | .. | .. | .. | 2 |
| 25 “ 30 | 16 | 11 | 3 | 1 | .. | .. | .. | 31 |
| 30 “ 35 | 29 | 21 | 15 | 9 | 3 | 3 | .. | 80 |
| 35 “ 40 | 32 | 24 | 24 | 12 | 13 | 3 | 3 | 111 |
| 40 “ 45 | 29 | 33 | 26 | 17 | 13 | 5 | 11 | 134 |
| 45 “ 50 | 21 | 23 | 20 | 23 | 15 | 10 | 16 | 128 |
| 50 “ 55 | 36 | 25 | 24 | 23 | 16 | 10 | 8 | 142 |
| 55 “ 60 | 43 | 36 | 19 | 21 | 13 | 7 | 9 | 148 |
| 60 “ 65 | 50 | 30 | 16 | 7 | 3 | .. | 2 | 108 |
| 65 “ 70 | 48 | 25 | 9 | 5 | 5 | 5 | 1 | 98 |
| 70 “ 75 | 37 | 14 | 9 | 3 | 1 | 3 | .. | 67 |
| 75 “ 80 | 9 | 9 | 2 | .. | 2 | .. | 1 | 23 |
| 80 and over | 9 | 3 | 5 | 4 | 1 | .. | .. | 22 |
| Totals | 360 | 255 | 172 | 125 | 85 | 46 | 51 | 1,094 |
Of the 3,019 married men or widowers whose deaths were registered in 1914, 745 were shown to have been widowers, and 2,216 to have left widows, while in the remaining 58 cases there was no information given as to whether the deceased left a widow. Of the married men leaving widows 1,920 had living issue also at time of death, and 296 had no living issue. In 638 cases widowers left issue and in 107 cases no issue. In 38 of the 58 cases where no information was given as to whether a widow was left there was living issue.
A table is given showing the relative ages of married men dying in 1914, and their widows:—
| DEATHS, 1914.—AGES OF MARRIED MEN DYING, AND THEIR WIDOWS. | |||||||||
|---|---|---|---|---|---|---|---|---|---|
| Age of Deceased, in Years. | |||||||||
| Age of Widow, in Years. | 20 and under 30. | 30 and under 40. | 40 and under 50. | 50 and under 60. | 60 and under 70. | 70 and under 80. | 80 and under 90. | 90 and upwards. | Totals. |
| 19 | 1 | .. | .. | .. | .. | .. | .. | .. | 1 |
| 20 and under 25 | 18 | 10 | 4 | .. | .. | .. | .. | .. | 32 |
| 25 “ 30 | 22 | 54 | 5 | 5 | 1 | .. | .. | .. | 87 |
| 30 “ 35 | 3 | 78 | 25 | 7 | .. | 1 | .. | .. | 114 |
| 35 “ 40 | 1 | 62 | 83 | 13 | 4 | 1 | 1 | 1 | 166 |
| 40 “ 45 | .. | 10 | 86 | 52 | 14 | 6 | .. | .. | 168 |
| 45 “ 50 | .. | 4 | 68 | 100 | 34 | 13 | 1 | .. | 220 |
| 50 “ 55 | 1 | .. | 12 | 119 | 57 | 21 | 6 | .. | 216 |
| 55 “ 60 | .. | .. | 3 | 51 | 123 | 47 | 11 | 1 | 236 |
| 60 “ 65 | .. | .. | .. | 9 | 122 | 98 | 19 | 1 | 249 |
| 65 “ 70 | .. | .. | .. | 2 | 69 | 147 | 32 | 4 | 254 |
| 70 “ 75 | .. | .. | .. | 1 | 21 | 109 | 40 | 3 | 174 |
| 75 “ 80 | .. | .. | .. | 1 | 2 | 67 | 53 | .. | 123 |
| 80 “ 85 | .. | .. | .. | .. | 2 | 11 | 31 | 2 | 46 |
| 85 “ 90 | .. | .. | .. | .. | .. | 1 | 2 | 1 | 4 |
| 90 and upwards | .. | .. | .. | .. | .. | .. | 1 | 1 | 2 |
| Ages not specified | 3 | 12 | 9 | 12 | 27 | 38 | 21 | 2 | 124 |
| Totals | 49 | 230 | 295 | 372 | 476 | 560 | 218 | 16 | 2,216 |
Subjoined is a classified statement of the deaths of infants under one year during 1914, with the ratio of the deaths in each class to the 1,000 births during the year:—
| Sex. | Under 1 Month. | 1 and under 3 Months. | 3 and under 6 Months. | 6 and under 12 Months. | Total under 12 Months. |
|---|---|---|---|---|---|
| NUMBER OF DEATHS. | |||||
| Male | 467 | 137 | 100 | 124 | 828 |
| Female | 351 | 104 | 92 | 81 | 628 |
| DEATHS TOTHE 1,000 BIRTHS. | |||||
| Male | 32.13 | 9.43 | 6.88 | 8.53 | 56.97 |
| Female | 25.43 | 7.53 | 6.67 | 5.87 | 45.50 |
Fifty-seven out of every thousand male children born, and forty-five of every thousand females, are found to have died before attaining the age of one year. The mortality was thus one in eighteen of male children and one in twenty-two of females.
It will be seen from the figures that the chances of living during the first year of age are greater for female than for male infants. Thus, in proportion to the number of children of each sex born in 1914, there were during the year—
100 deaths of males to 79 deaths of females under 1 month of age;
100 “ 80 “ from 1 to 3 months of age;
100 “ 97 “ from 3 to 6 months of age;
100 “ 69 “ from 6 to 12 months of age;
100 “ 80 “ under 12 months of age.
Dealing with the results for ten years, the deaths of infants under one year are in the large proportion of three-fourths of the total deaths under five, as might be expected, the first year being the tenderest period.
| DEATHS OF CHILDREN UNDER FIVE YEARS AND PROPORTION TO DEATHS ATALL AGES. | ||||||||
|---|---|---|---|---|---|---|---|---|
| Year. | Deaths of Children under 5 Years of Age. | Total Deaths at all Ages | Deaths under 5 Years: Per Cent. of Mortality at all Ages. | |||||
| Under 1 Year. | 1 Year and under 2 Years. | 2 Years and under 3 Years. | 3 Years and under 4 Years. | 4 Years and under 5 Years. | Total under 5 Years | |||
| 1905 | 1,599 | 176 | 97 | 61 | 46 | 1,979 | 8,061 | 24.55 |
| 1906 | 1,506 | 177 | 87 | 58 | 37 | 1,865 | 8,339 | 22.36 |
| 1907 | 2,228 | 350 | 165 | 94 | 49 | 2,886 | 10,066 | 28.67 |
| 1908 | 1,761 | 231 | 103 | 88 | 45 | 2,228 | 9,043 | 24.64 |
| 1909 | 1,634 | 242 | 115 | 75 | 44 | 2,110 | 8,959 | 23.55 |
| 1910 | 1,760 | 253 | 95 | 76 | 54 | 2,238 | 9,639 | 23.22 |
| 1911 | 1,484 | 206 | 122 | 99 | 69 | 1,980 | 9,534 | 20.77 |
| 1912 | 1,409 | 157 | 93 | 45 | 46 | 1,750 | 9,214 | 18.99 |
| 1913 | 1,653 | 223 | 104 | 65 | 54 | 2,099 | 10,119 | 20.74 |
| 1914 | 1,456 | 199 | 118 | 80 | 63 | 1,916 | 10,148 | 18.88 |
| Average of ten years | 1,649 | 221 | 110 | 74 | 51 | 2,105 | 9,312 | 22.64 |
| NOTE.—The total number of deaths of children under 5 years for the period included in this table is 21,051. | ||||||||
| DEATHS OF INFANTS UNDER ONE YEAR, AND PROPORTIONTO BIRTHS. | |||||||
|---|---|---|---|---|---|---|---|
| Year. | Deaths of Infants under 1 Year of Age. | Total Births registered. | Proportion of Deaths of Infants under 1 Year to every 1,000 Births. | ||||
| Under 1 Month | 1 Month and under 3 Months. | 3 Months and under 6 Months. | 6 Months and under 12 Months. | Total under 12 Months. | |||
| NOTE—The total number of deaths of infants under 1 year for the period included in the table is 16,490. | |||||||
| 1905 | 714 | 285 | 290 | 310 | 1,599 | 23,682 | 67.52 |
| 1906 | 717 | 247 | 244 | 298 | 1,506 | 24,252 | 62.10 |
| 1907 | 763 | 446 | 500 | 519 | 2,228 | 25,094 | 88.79 |
| 1908 | 810 | 242 | 347 | 362 | 1,761 | 25,940 | 67.89 |
| 1909 | 794 | 285 | 258 | 297 | 1,634 | 26,524 | 61.60 |
| 1910 | 786 | 298 | 333 | 343 | 1,760 | 25,984 | 67.73 |
| 1911 | 751 | 217 | 234 | 282 | 1,484 | 26,354 | 56.31 |
| 1912 | 827 | 188 | 192 | 202 | 1,409 | 27,508 | 51.22 |
| 1913 | 830 | 283 | 238 | 302 | 1,653 | 27,935 | 59.17 |
| 1914 | 818 | 241 | 192 | 205 | 1,456 | 28,338 | 51.38 |
| Average of ten years | 781 | 273 | 283 | 312 | 1,649 | 26,161 | 63.37 |
| RATES OF INFANTILE MORTALITY IN NEW ZEALAND AND FOUR CHIEF CENTRES (DEATHS UNDER 1 YEAR OF AGE PER 1,000 BIRTHS) EACH YEAR 1905–14. | |||||
|---|---|---|---|---|---|
| Year. | New Zealand. | Auckland and Suburban Boroughs. | Wellington and Suburban Boroughs. | Christchurch and Suburban Boroughs. | Dunedin and Suburban Boroughs. |
| 1905 | 67.52 | 91.52 | 96.21 | 88.99 | 67.13 |
| 1906 | 62.10 | 85.80 | 71.88 | 74.37 | 72.60 |
| 1907 | 88.79 | 97.19 | 117.80 | 126.16 | 95.36 |
| 1908 | 67.89 | 81.87 | 81.67 | 67.82 | 74.54 |
| 1909 | 61.60 | 61.85 | 84.21 | 62.78 | 48.52 |
| 1910 | 67.73 | 79.02 | 84.59 | 69.40 | 79.08 |
| 1911 | 56.31 | 63.02 | 73.36 | 62.90 | 43.42 |
| 1912 | 51.22 | 56.95 | 61.32 | 60.03 | 38.11 |
| 1913 | 59.17 | 80.81 | 60.23 | 63.49 | 73.42 |
| 1914 | 51.38 | 57.62 | 82.57 | 68.15 | 54.28 |
Although 16,490 infants under one year were lost to the Dominion by death during the ten years 1905–14, and, including these, 21,051 children under five, the next table shows more satisfactory results for New Zealand than for New South Wales, Victoria, or the Australian Commonwealth in the matter of the preservation of infant life. Dealing with averages of five years, in New Zealand only 59.21 infants under one year are found to die out of every 1,000 born, against 73.36 in New South Wales, 72.39 in Victoria, and 71.76 in the Commonwealth as a whole.
| DEATHS OF INFANTS UNDER 1 YEAR OF AGE TOEVERY 1,000 BIRTHS. | ||||
|---|---|---|---|---|
| Year. | New Zealand. | New South Wales. | Victoria. | Australian Commonwealth. |
| 1909 | 61.60 | 73.87 | 71.36 | 71.56 |
| 1910 | 67.73 | 74.71 | 76.88 | 74.81 |
| 1911 | 56.31 | 69.46 | 68.70 | 68.49 |
| 1912 | 51.22 | 71.00 | 74.48 | 71.74 |
| 1913 | 59.17 | 77.78 | 70.53 | 72.21 |
| Means of five years | 59.21 | 73.36 | 72.39 | 71.76 |
Graphs follow showing the rates of infantile mortality (male and female) since 1870. The male and female birth-rates are also shown. The tendency for variations in the rates of the two sexes to occur simultaneously is very noticeable.
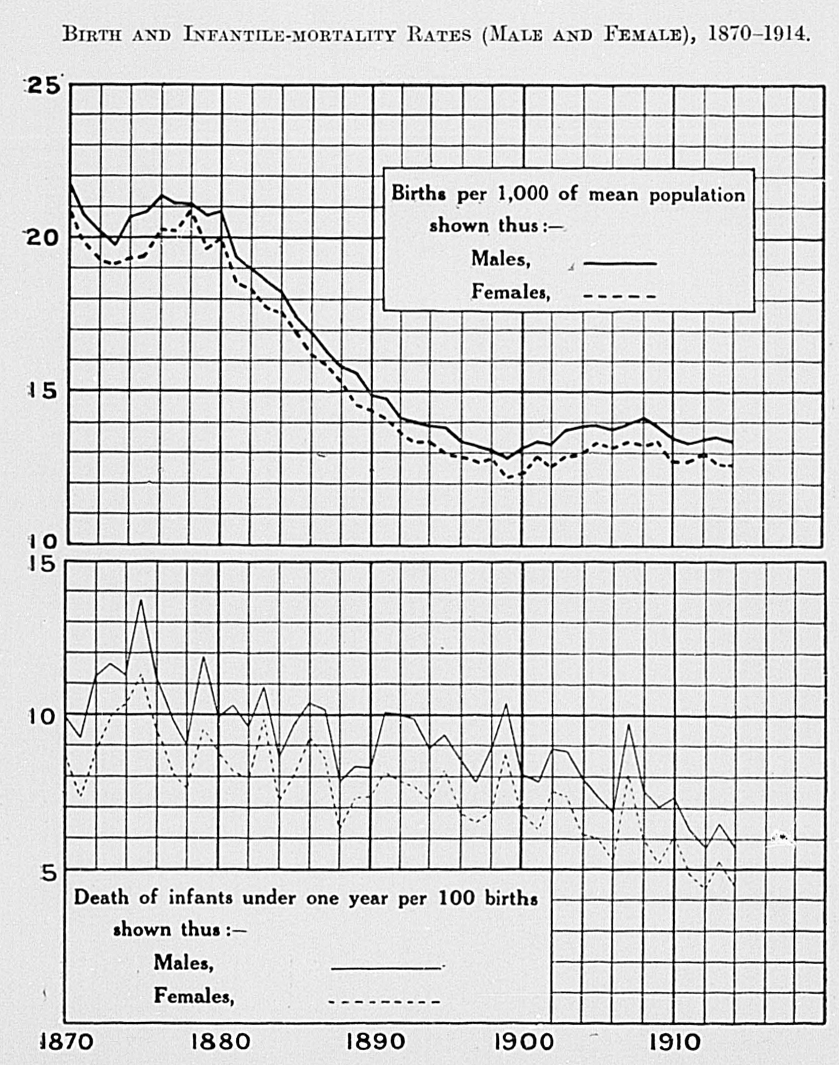
The table following, giving the rates of infantile mortality in various countries and cities, shows that as regards the preservation of infant life far better conditions obtain in New Zealand than in most other countries:—
| RATES OF INFANTILE MORTALITY. | |||||
|---|---|---|---|---|---|
| Country or City. | Year 1912. | Latest Year obtainable. | |||
| Rate of Infantile Mortality.* | Birth-rate.† | Year. | Rate of Infantile Mortality.* | Birth-rate.† | |
* Per 1,000 births. † Per 1,000 of mean population. | |||||
| New Zealand | 51 | 26.5 | 1914 | 51 | 26.0 |
| Auckland | 57 | 29.7 | 1914 | 58 | 24.8 |
| Wellington | 61 | 27.5 | 1914 | 83 | 25.4 |
| Christchurch | 60 | 28.3 | 1914 | 68 | 22.2 |
| Dunedin | 38 | 27.1 | 1914 | 54 | 21.7 |
| Australian Commonwealth | 72 | 28.7 | 1913 | 72 | 28.3 |
| Sydney | 76 | 29.9 | 1914 | 69 | 28.1 |
| Melbourne | 90 | 27.5 | 1914 | 84 | 26.8 |
| Adelaide | 53 | 30.2 | 1914 | 84 | 32.1 |
| Brisbane | 82 | 32.8 | 1914 | 69 | 34.4 |
| Perth | 96 | .. | 1914 | 69 | .. |
| Hobart | 83 | 35.0 | 1914 | 110 | 35.7 |
| United Kingdom | .. | .. | 1911 | 125 | 24.4 |
| England and Wales | 95 | 23.8 | 1912 | 95 | 23.8 |
| London | 91 | 24.5 | 1912 | 91 | 24.5 |
| Scotland | .. | .. | 1911 | 112 | 25.6 |
| Edinburgh | 113 | 20.9 | 1912 | 113 | 20.9 |
| Glasgow | 124 | 28.1 | 1912 | 124 | 28.1 |
| Ireland | 86 | 23.0 | 1912 | 86 | 23.0 |
| Dublin | 140 | 27.4 | 1912 | 140 | 27.4 |
| Belfast | 129 | 27.8 | 1912 | 129 | 27.8 |
| France | 78 | 19.0 | 1912 | 78 | 19.0 |
| Paris | 103 | 16.8 | 1912 | 103 | 16.8 |
| Belgium | .. | .. | 1911 | 167 | 22.9 |
| The Netherlands | 87 | 28.1 | 1912 | 87 | 28.1 |
| The Hague | 66 | 23.6 | 1912 | 66 | 23.6 |
| Amsterdam | 64 | 23.3 | 1912 | 64 | 23.3 |
| Rotterdam | 79 | 29.0 | 1912 | 79 | 29.0 |
| Denmark | 93 | 26.7 | 1912 | 93 | 26.7 |
| Copenhagen | 108 | 24.9 | 1912 | 108 | 24.9 |
| Norway | .. | .. | 1911 | 65 | 25.9 |
| Christiana | 107 | 22.7 | 1912 | 107 | 22.7 |
| Sweden | .. | .. | 1911 | 72 | 24.0 |
| Stockholm | 82 | 21.0 | 1912 | 82 | 21.0 |
| Finland | 109 | 29.1 | 1912 | 109 | 29.1 |
| Russia (European) | .. | .. | 1909 | 248 | 44.0 |
| St. Petersburg | 249 | 26.5 | 1912 | 249 | 26.5 |
| Moscow | 333 | 28.9 | 1912 | 333 | 28.9 |
| German Empire | 147 | 28.3 | 1912 | 147 | 28.3 |
| Berlin | 142 | 20.4 | 1912 | 142 | 20.4 |
| Hamburg | 130 | 21.8 | 1912 | 130 | 21.8 |
| Dresden | 116 | 20.2 | 1912 | 116 | 20.2 |
| Breslau | 163 | 26.3 | 1912 | 163 | 26.3 |
| Munich | 134 | 21.9 | 1912 | 134 | 21.9 |
| Switzerland | .. | .. | 1911 | 123 | 24.1 |
| Spain | .. | .. | 1907 | 158 | 33.6 |
| Italy | .. | .. | 1911 | 153 | 31.5 |
| Milan | 102 | 23.4 | 1912 | 102 | 23.4 |
| Austria | 180 | 31.3 | 1912 | 180 | 31.3 |
| Vienna | 149 | 19.1 | 1912 | 149 | 19.1 |
| Prague | 139 | 19.9 | 1912 | 139 | 19.9 |
| Trieste | 184 | 29.7 | 1912 | 184 | 29.7 |
| Hungary | 186 | 36.3 | 1912 | 186 | 36.3 |
| Budapest | 141 | 25.5 | 1912 | 141 | 25.5 |
| Servia | .. | .. | 1911 | 146 | 36.2 |
| Bulgaria | .. | .. | 1909 | 171 | 40.7 |
| Roumania | 186 | 43.4 | 1912 | 186 | 43.4 |
| Ceylon | 215 | 33.3 | 1912 | 215 | 33.3 |
| Japan | .. | .. | 1910 | 160 | 33.9 |
| Ontario, Canada | 110 | 22.4 | 1912 | 110 | 22.4 |
| Toronto. | .. | .. | 1911 | 114 | 22.2 |
| Jamaica | 193 | 38.8 | 1912 | 193 | 38.8 |
| Chile | .. | .. | 1911 | 332 | 38.5 |
The principal causes of mortality in children under one year for New Zealand are given, with the numbers of deaths for five years from such causes. Premature birth stands first in order of importance, congenital debility next, followed by diarrhœa and enteritis. Here it is seen how much mortality is attributed to these causes according to the medical certificates.
| DEATHS OF CHILDREN UNDER ONE YEAR.—CAUSES, 1910–14. | ||||||||||
|---|---|---|---|---|---|---|---|---|---|---|
| Causes. | Number of Deaths from each Cause. | Percentage of Total. | ||||||||
| 1910. | 1911. | 1912. | 1913. | 1914. | 1910. | 1911. | 1912. | 1913. | 1914. | |
| Whooping-cough | 101 | 12 | 6 | 87 | 53 | 5.74 | 0.81 | 0.43 | 5.26 | 3.64 |
| Convulsions | 80 | 89 | 51 | 71 | 51 | 4.54 | 6.00 | 3.62 | 4.29 | 3.50 |
| Bronchitis and pneumonia | 157 | 161 | 126 | 157 | 115 | 8.92 | 10.85 | 8.94 | 9.50 | 7.90 |
| Dairrhœa and enteritis | 343 | 244 | 178 | 214 | 163 | 19.49 | 16.44 | 12.63 | 12.95 | 11.19 |
| Malformations | 58 | 51 | 117 | 89 | 98 | 3.30 | 3.43 | 8.30 | 5.38 | 6.73 |
| Premature birth | 407 | 337 | 398 | 418 | 420 | 23.12 | 22.71 | 28.25 | 25.29 | 28.85 |
| Congenital Debility | 281 | 263 | 254 | 296 | 246 | 15.97 | 17.72 | 18.03 | 17.91 | 16.90 |
| Other causes | 333 | 327 | 279 | 321 | 310 | 18.92 | 22.04 | 19.80 | 19.42 | 21.29 |
| Totals | 1,760 | 1,484 | 1,409 | 1,653 | 1,456 | 100.00 | 100.00 | 100.00 | 100.00 | 100.00 |
It is unlawful for any person to take charge of an infant under the age of six years, for the purpose of nursing or maintaining it apart from its parents or guardians, for a longer period than seven consecutive days, unless such person is licensed as a foster-patent.
Provision is made by law for the granting and revocation of licenses, and for the method of payment of maintenance-money. No payment is to be made to or received by a foster-parent except in pursuance of an agreement approved by the Secretary for Education, and if default be made in payment under the agreement the amount due, or part thereof, may be paid by the Secretary, and shall be recoverable as a debt due to the Crown. When and so long as any money so recoverable remains unpaid, the Secretary shall have and may exercise the powers of a guardian until the child attains the age of fifteen years. Provision is also made for the inspection of foster-homes, and in case of the removal or death of foster-children. The Act applies to any adopted infant in the same manner and to the same extent as if no such adoption had taken place. The Department of Education is the authority by whom the Act is administered.
The New Zealand Legislature in 1907 introduced provisions for early notification of birth, allowing seventy-two hours after birth if in a city or borough, or twenty-one days in any other case. The time allowed for notification in the case of a birth in a city or borough has now been reduced to forty-eight hours.
The classification of causes of death was made in 1908 for the first time in New Zealand according to the Bertillon Index of Diseases. This system has been adopted by the Commonwealth of Australia and the principal European and American countries. It is highly desirable for comparative purposes that uniformity of statistical method should obtain when possible.
The Bertillon system differs materially from that formerly in use, and comparisons of certain causes of mortality between years prior and subsequent to 1908 are impossible owing to changes in the classification. This applies more particularly to diseases of the digestive, nervous, respiratory, and circulatory systems. There are however, certain principal causes of death which are unaffected and retain their comparative value, such as cancer, tubercular diseases, typhoid fever, whooping-cough, measles, influenza, scarlet fever, diabetes, appendicitis, liver and puerperal diseases, suicide, and old age.
A comparison of the causes of deaths in 1913 and 1914 arranged according to an abridged classification, the percentage of each group to the total deaths, and the proportion per 10,000 persons living, is given in the following table:—
| Class. | Number of Deaths. | Proportion to Total Deaths. | Proportion per 10,000 living. | |||
|---|---|---|---|---|---|---|
| 1913. | 1914. | 1913. | 1914. | 1913. | 1914. | |
| I. General diseases | 2,511 | 2,454 | 24.81 | 24.18 | 23.50 | 22.51 |
| II. Diseases of the nervous system and of the organs of special sense | 1,008 | 1,028 | 9.96 | 10.13 | 9.43 | 9.43 |
| III. Diseases of the circulatory system | 1,557 | 1,676 | 15.39 | 16.52 | 14.57 | 15.37 |
| IV. Diseases of the respiratory system | 949 | 949 | 9.38 | 9.35 | 8.88 | 8.70 |
| V. Diseases of the digestive system | 836 | 766 | 8.26 | 7.55 | 7.82 | 7.03 |
| VI. Diseases of the genitourinary system and annexa | 405 | 429 | 4.60 | 4.23 | 4.35 | 3.93 |
| VII. Puerperal condition | 100 | 118 | 0.99 | 1.16 | 0.94 | 1.08 |
| VIII. Diseases of the skin and of the cellular tissue | 40 | 40 | 0.39 | 0.39 | 0.37 | 0.37 |
| IX. Diseases of the organs of locomotion | 25 | 18 | 0.25 | 0.18 | 0.23 | 0.16 |
| X. Malformations | 97 | 113 | 0.96 | 1.11 | 0.91 | 1.04 |
| XI. Infancy | 797 | 768 | 7.88 | 7.57 | 7.46 | 7.04 |
| XII. Old-age | 809 | 812 | 7.99 | 8.00 | 7.57 | 7.45 |
| XIII. Violence | 787 | 784 | 7.78 | 7.73 | 7.37 | 7.19 |
| XIV. Ill-defined causes | 138 | 193 | 1.36 | 1.90 | 1.29 | 1.77 |
| Totals | 10,119 | 10,148 | 100.00 | 100.00 | 94.69 | 93.07 |
The next table shows the number of deaths from certain principal causes for the five years 1910–14, and the proportion per 10,000 of the population.
| Cause. | Number of Deaths | Proportion per 10,000 of Mean Population. | ||||||||
|---|---|---|---|---|---|---|---|---|---|---|
| 1910. | 1911. | 1912. | 1913. | 1914. | 1910. | 1911. | 1912. | 1913. | 1914. | |
| Typhoid fever | 62 | 67 | 46 | 60 | 48 | 0.62 | 0.66 | 0.44 | 0.56 | 0.44 |
| Measles | 1 | 41 | 15 | 26 | 33 | 0.01 | 0.41 | 0.14 | 0.24 | 0.30 |
| Scarlet fever | 13 | 9 | 7 | 11 | 22 | 0.13 | 0.09 | 0.07 | 0.10 | 0.20 |
| Whooping-cough | 148 | 17 | 10 | 128 | 74 | 1.49 | 0.17 | 0.10 | 1.20 | 0.68 |
| Diphtheria | 75 | 62 | 46 | 61 | 78 | 0.76 | 0.61 | 0.44 | 0.57 | 0.72 |
| Influenza | 141 | 63 | 65 | 56 | 63 | 1.42 | 0.62 | 0.63 | 0.52 | 0.58 |
| Pulmonary tuberculosis | 582 | 584 | 567 | 656 | 576 | 5.86 | 5.75 | 5.46 | 6.14 | 5.28 |
| Other forms of tuberculosis | 149 | 154 | 149 | 156 | 152 | 1.50 | 1.52 | 1.43 | 1.46 | 1.39 |
| Cancer | 742 | 809 | 812 | 856 | 904 | 7.47 | 7.97 | 7.82 | 8.01 | 8.29 |
| Diabetes | 123 | 129 | 147 | 150 | 152 | 1.24 | 1.27 | 1.41 | 1.40 | 1.40 |
| Exophthalmic goitre | 22 | 26 | 40 | 19 | 31 | 0.22 | 0.26 | 0.39 | 0.18 | 0.28 |
| Anæmia, Chlorosis | 76 | 56 | 53 | 64 | 76 | 0.77 | 0.55 | 0.51 | 0.60 | 0.70 |
| Simple meningitis | 142 | 138 | 136 | 127 | 140 | 1.43 | 1.36 | 1.31 | 1.19 | 1.28 |
| Apoplexy, cerebral hæmorrhage | 372 | 348 | 389 | 412 | 441 | 3.75 | 3.43 | 3.75 | 3.86 | 4.05 |
| Epilepsy | 66 | 54 | 69 | 54 | 51 | 0.67 | 0.53 | 0.66 | 0.51 | 0.47 |
| Convulsions of children under 5 years of age | 107 | 109 | 57 | 93 | 62 | 1.08 | 1.08 | 0.55 | 0.87 | 0.57 |
| Organic heart-disease | 1,154 | 1,205 | 1,271 | 1,227 | 1,301 | 11.62 | 11.87 | 12.23 | 11.48 | 11.93 |
| Arteriosclerosis | 44 | 54 | 74 | 89 | 106 | 0.44 | 0.53 | 0.71 | 0.83 | 0.97 |
| Embolism, thrombosis | 67 | 56 | 80 | 63 | 101 | 0.68 | 0.55 | 0.77 | 0.59 | 0.93 |
| Bronchitis | 297 | 295 | 238 | 281 | 262 | 2.99 | 2.91 | 2.29 | 2.63 | 2.40 |
| Bronchopneumonia | 135 | 153 | 114 | 154 | 139 | 1.36 | 1.51 | 1.10 | 1.44 | 1.28 |
| Pneumonia | 300 | 349 | 297 | 336 | 321 | 3.02 | 3.44 | 2.86 | 3.15 | 2.94 |
| Gastritis | 53 | 53 | 48 | 29 | 47 | 0.53 | 0.52 | 0.46 | 0.27 | 0.43 |
| Diarrhœa and enteritis | 500 | 404 | 271 | 344 | 265 | 5.04 | 3.98 | 2.61 | 3.22 | 2.43 |
| Appendicitis and typhlitis | 98 | 103 | 72 | 91 | 86 | 0.99 | 1.02 | 0.69 | 0.85 | 0.79 |
| Intestinal obstruction | 58 | 63 | 55 | 63 | 73 | 0.58 | 0.62 | 0.53 | 0.59 | 0.67 |
| Cirrhosis of liver | 38 | 44 | 48 | 47 | 44 | 0.38 | 0.43 | 0.46 | 0.44 | 0.40 |
| Simple peritonitis | 66 | 62 | 65 | 61 | 53 | 0.67 | 0.61 | 0.62 | 0.57 | 0.49 |
| Nephritis, Bright's disease | 271 | 293 | 270 | 317 | 261 | 2.73 | 2.89 | 2.60 | 2.96 | 2.39 |
| Cystitis | 38 | 50 | 40 | 31 | 45 | 0.38 | 0.49 | 0.38 | 0.29 | 0.41 |
| Diseases and accidents of puerperal condition | 117 | 114 | 100 | 100 | 113 | 1.18 | 1.12 | 0.96 | 0.94 | 1.08 |
| Congenital debility | 283 | 268 | 256 | 301 | 252 | 2.85 | 2.64 | 2.46 | 2.82 | 2.31 |
| Premature birth | 407 | 337 | 398 | 418 | 420 | 4.10 | 3.32 | 3.83 | 3.91 | 3.85 |
| Senility | 660 | 661 | 706 | 809 | 812 | 6.65 | 6.51 | 6.80 | 7.57 | 7.45 |
| Violence (1) suicide | 100 | 124 | 124 | 148 | 137 | 1.01 | 1.22 | 1.19 | 1.38 | 1.26 |
| (2) accident, &c. | 567 | 590 | 514 | 639 | 647 | 5.71 | 5.81 | 4.95 | 5.98 | 5.93 |
| Other causes | 1,565 | 1,590 | 1,565 | 1,642 | 1,755 | 15.70 | 15.67 | 15.07 | 15.37 | 16.10 |
| Totals | 9,639 | 9,534 | 9,214 | 10,119 | 10,148 | 97.09 | 93.94 | 88.68 | 94.69 | 93.07 |
Typhoid Fever.—Deaths from this cause numbered 48 in 1914, against 60 in 1913 and 46 in 1912.
Measles.—Very few deaths occur from this cause. In 1911 the number was 42, but in 1910 there was only one, while in 1914, 33 deaths were attributed to measles.
Scarlet Fever.—The number of deaths from this cause during recent years has been very low. The number registered in 1914 (22) is the highest since 1909, when 26 deaths were attributed to scarlet fever.
Whooping-cough.—The number of deaths from whooping-cough fluctuates considerably. Only 10 deaths were recorded in 1912, while the number for 1913 was 128, and for 1910, 148. The number in 1914 (74) was slightly below the average of the four preceding years.
Diphtheria.—Seventeen more deaths were attributed to this cause in 1914 than 1913, and 32 more than in 1912. The average for the past five years was 64.
Influenza.—As in the case of whooping-cough, the number of deaths in 1910 (141) was much above the average. Sixty-three deaths from influenza were registered in 1914.
Tuberculosis.—Deaths from pulmonary tuberculosis numbered 576, or 5.28 per 10,000 of the population, against 656 deaths or 6.14 per 10,000 in 1913. The average for the past ten years was 592, or 6.05 per 10,000.
| Year. | Deaths from Pulmonary Tuberculosis. | Rate per 10,000. |
|---|---|---|
| 1905 | 496 | 5.70 |
| 1906 | 556 | 6.21 |
| 1907 | 612 | 6.66 |
| 1908 | 663 | 7.02 |
| 1909 | 624 | 6.42 |
| 1910 | 582 | 5.86 |
| 1911 | 584 | 5.75 |
| 1912 | 567 | 5.46 |
| 1913 | 656 | 6.14 |
| 1914 | 576 | 5.28 |
For the first of the three years shown, the numbers and rates refer only to those deaths definitely certified to as being due to phthisis or tuberculosis of the lungs. For later years miliary tuberculosis and tuberculosis, not otherwise defined, are also included.
The following table gives information as to age and length of residence in the Dominion of the 544 persons certified to as having died from phthisis or tuberculosis of the lungs. Twenty deaths due to tuberculosis (undefined) and twelve due to acute miliary tuberculosis are excluded.
Reference to the table will show that 341 persons known to have been born in the Dominion died during 1914 from phthisis, a proportion of 4.60 per 10,000 of the estimated native-born white population, and 92 persons born elsewhere but resident in New Zealand for fifteen years or over succumbed to the disease.
| DEATHS FROM PHTHISIS, 1914. | |||||||||||
|---|---|---|---|---|---|---|---|---|---|---|---|
| Length of Residence in the Dominion. | Age at Death, in Years. | ||||||||||
| Under 5 | 5 and under 10. | 10 and under 15. | 15 and under 25. | 25 and under 35. | 35 and under 45. | 45 and under 55. | 55 and under 65. | 65 and under 75. | 75 and up wards. | Total. | |
| Males. | |||||||||||
| Under 1 month | … | … | … | … | … | 1 | … | … | … | … | 1 |
| 1 month and under 6 | … | … | … | … | … | … | … | … | … | … | … |
| 6 months “ 12 | … | … | … | 2 | 1 | 2 | … | … | … | … | 5 |
| 1 year “ 2 | … | … | … | … | 1 | … | … | … | … | … | 1 |
| 2 years “ 3 | … | … | … | … | 2 | 1 | … | 1 | … | … | 4 |
| 3 “ “ 4 | … | … | … | … | 3 | … | … | … | … | … | 3 |
| 4 “ “ 5 | … | … | … | … | 3 | 2 | 1 | … | … | … | 6 |
| 5 “ “ 10 | … | … | … | 2 | 5 | 8 | 4 | … | … | … | 19 |
| 10 “ “ 15 | … | … | … | 2 | 7 | 5 | 5 | 1 | … | … | 20 |
| 15 “ “ 20 | … | … | … | … | 1 | 4 | … | … | … | … | 5 |
| 20 “ “ 25 | … | … | … | 1 | … | 2 | 2 | … | … | … | 5 |
| 25 years and upwards | … | … | … | … | 1 | 6 | 11 | 18 | 9 | 3 | 48 |
| Not known or not stated | … | … | … | … | 5 | 5 | 4 | 3 | 3 | … | 20 |
| Born in Dominion | 3 | 1 | 1 | 37 | 50 | 41 | 22 | 5 | 1 | 1 | 162 |
| Totals | 3 | 1 | l | 44 | 79 | 77 | 49 | 28 | 13 | 4 | 299 |
| Females. | |||||||||||
| Under 1 month | … | … | … | … | … | … | … | … | … | … | … |
| 1 month and under 6 | … | … | … | … | … | … | … | … | … | … | … |
| 6 months “ 12 | … | … | … | 1 | 2 | … | … | … | … | … | 3 |
| 1 year “ 2 | … | … | … | 1 | 2 | … | … | … | … | … | 3 |
| 2 years “ 3 | … | … | … | … | … | … | … | … | … | … | … |
| 3 “ “ 4 | … | … | … | 1 | 2 | … | 1 | … | … | … | 4 |
| 4 “ “ 5 | … | … | … | … | … | … | … | 1 | … | … | 1 |
| 5 “ “ 10 | … | … | 2 | … | 2 | 3 | 1 | … | … | … | 8 |
| 10 “ “ 15 | … | … | … | 3 | 1 | 1 | … | … | … | … | 5 |
| 15 “ “ 20 | … | … | … | 1 | … | … | 1 | … | … | … | 2 |
| 20 “ “ 25 | … | … | … | … | 2 | 4 | … | … | … | … | 6 |
| 25 years and upwards | … | … | … | … | 2 | 5 | 6 | 6 | 4 | 3 | 26 |
| Not known or not stated | … | … | … | 1 | 2 | 1 | 3 | 1 | … | … | 8 |
| Born in Dominion | 1 | 3 | 3 | 58 | 65 | 34 | 13 | 1 | … | 1 | 179 |
| Totals | l | 3 | 5 | 66 | 80 | 48 | 25 | 9 | 4 | 4 | 245 |
| Totals of both sexes | 4 | 4 | 6 | 110 | 159 | 125 | 74 | 37 | 17 | 8 | 544 |
The mortality from all forms of tuberculosis decreased from 7.79 per 10,000 of the population in 1905 to 6.67 in 1914. The percentage of total deaths from all causes decreased from 841 to 7.17 in the ten years.
| DEATHS AND DEATH-RATES FROM TUBERCULOSIS AND PERCENTAGE OF TOTAL DEATHS, 1905–14. | ||||
|---|---|---|---|---|
| Year. | Mean Population. | Number of Deaths from Tubercular Diseases. | Rate per 10,000. | Percentage of Total Deaths from all Causes. |
| 1905 | 870,000 | 678 | 7.79 | 8.41 |
| 1906 | 895,594 | 720 | 8.04 | 8.63 |
| 1907 | 919,105 | 856 | 9.31 | 8.50 |
| 1908 | 945,063 | 839 | 8.87 | 9.28 |
| 1909 | 971,784 | 800 | 8.23 | 8.93 |
| 1910 | 992,802 | 731 | 7.36 | 7.58 |
| 1911 | 1,014,896 | 738 | 7.27 | 7.74 |
| 1912 | 1,039,016 | 716 | 6.89 | 7.77 |
| 1913 | 1,068,644 | 812 | 7.60 | 8.02 |
| 1914 | 1,090,328 | 728 | 6.67 | 7.17 |
| AGES OF PERSONS WHODIED FROM TUBERCULAR DISEASES, 1914. | |||
|---|---|---|---|
| Ages. | Males | Females. | Total. |
| Under 5 years | 28 | 17 | 45 |
| 5 years and under 10 | 7 | 13 | 20 |
| 10 “ 15 | 5 | 12 | 17 |
| 15 “ 20 | 20 | 27 | 47 |
| 20 “ 25 | 39 | 57 | 96 |
| 25 “ 30 | 44 | 59 | 103 |
| 30 “ 35 | 50 | 44 | 94 |
| 35 “ 40 | 46 | 31 | 77 |
| 40 “ 45 | 45 | 24 | 69 |
| 45 “ 50 | 30 | 20 | 50 |
| 50 “ 55 | 26 | 15 | 41 |
| 55 “ 60 | 17 | 6 | 23 |
| 60 “ 65 | 15 | 3 | 18 |
| 65 “ 70 | 7 | 1 | 8 |
| 70 “ 75 | 8 | 4 | 12 |
| 75 “ 80 | 3 | 2 | 5 |
| 80 and upwards | 1 | 2 | 3 |
| Total deaths | 391 | 337 | 728 |
The New Zealand rate of deaths from tubercular diseases, as well as those of the Australian States, compares very favourably with that of England and Wales, which has, however, also decreased considerably of late years, the rate for 1913 being lower than in any previous year. The Scottish rate for 1913 (1.70 per 1,000) is the lowest yet recorded in that country
| DEATH-RATES FROM TUBERCULOSIS AND PERCENTAGE OF TOTAL DEATHS, 1913. | ||
|---|---|---|
| Death-rates (per 1,000) from Tuberculosis. | Percentile of Total Deaths. | |
| England and Wales | 1.34 | 9.80 |
| Scotland | 1.70 | 10.96 |
| Queensland | 0.60 | 5.73 |
| New South Wales | 0.78 | 7.19 |
| Victoria | 0.87 | 7.86 |
| South Australia | 0.90 | 8.29 |
| Western Australia | 0.74 | 7.91 |
| Tasmania | 0.74 | 6.80 |
| New Zealand | 0.76 | 8.02 |
Cancer.—There were 904 deaths assigned to this cause in 1914, a proportion of 8.29 per 10,000 persons, both number and rate being higher than in any previous year. The average number and rate for the five years 1910–14 were 825 and 7.91 respectively. Deaths of males during 1914 numbered 510 and of females 394. The death-rate from cancer is now greater than that from tubercular diseases, and its increasing tendency is a matter of grave concern.
The diagram following illustrates on the one hand the increase in the cancer death-rate and on the other the decrease in the rate of deaths from tuberculosis.
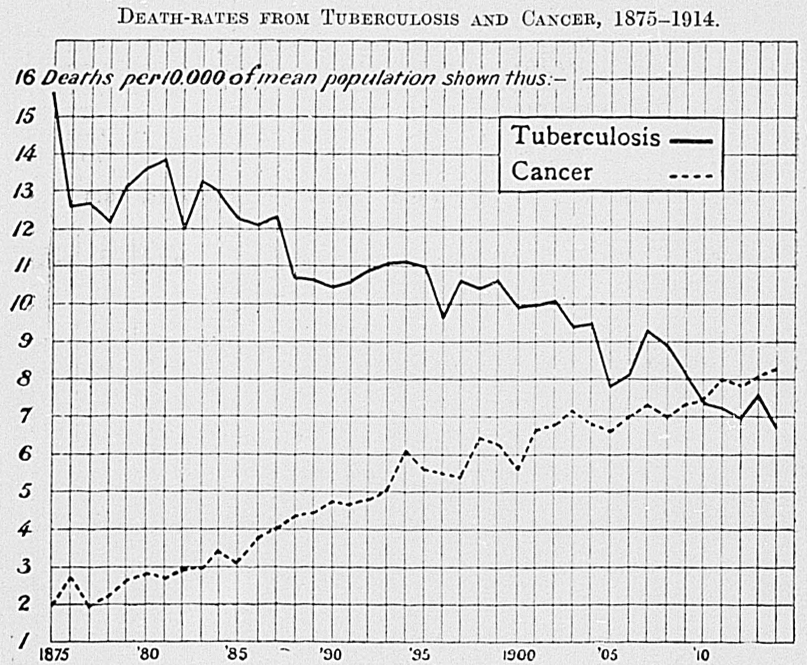
| NUMBER OF PERSONS WHODIED FROM CANCER, THE PROPORTION PER 10,000 PERSONS LIVING, AND THE PERCENTAGE OFALL DEATHS, 1905–14. | ||||
|---|---|---|---|---|
| Year. | Deaths from Cancer. | Total Deaths, all Causes. | Deaths from Cancer per 10,000 of Living Persons. | Deaths flora Cancer per 100 of All Deaths. |
| 1905 | 566 | 8,061 | 6.51 | 7.02 |
| 1906 | 623 | 8,339 | 6.96 | 7.47 |
| 1907 | 674 | 10,066 | 7.33 | 6.70 |
| 1908 | 657 | 9,043 | 6.95 | 7.27 |
| 1909 | 711 | 8,959 | 7.32 | 7.94 |
| 1910 | 742 | 9,639 | 7.47 | 7.70 |
| 1911 | 809 | 9,534 | 7.97 | 8.49 |
| 1912 | 812 | 9,214 | 7.82 | 8.81 |
| 1913 | 856 | 10,119 | 8.01 | 8.46 |
| 1914 | 904 | 10,148 | 8.29 | 8.91 |
The part of the body most commonly affected is the stomach. Among females the generative and mammary organs are frequently the seat of the disease.
| CANCER: SEAT OF DISEASE, 1914. | |||
|---|---|---|---|
| Seat of Disease. | Males. | Females. | Total. |
| Buccal cavity | 58 | 4 | 62 |
| Stomach and liver | 240 | 125 | 365 |
| Peritoneum, intestines, rectum | 69 | 53 | 122 |
| Female genital organs | .. | 81 | 81 |
| Breast | .. | 53 | 53 |
| Skin | 5 | 4 | 9 |
| Other organs or organs not specified | 138 | 74 | 212 |
| Totals | 510 | 394 | 904 |
Ninety-six per cent. of the deaths were at the ages 35 years and upward, and 58 per cent. at the ages 60 years and upwards.
| AGES OF PERSONS WHODIED FROM CANCER, 1914. | |||
|---|---|---|---|
| Ages. | M. | F. | Total. |
| Under 5 years | 6 | 2 | 8 |
| 5 years and under | 1 | 1 | 2 |
| 10 “ | 3 | 1 | 4 |
| 15 “ | 1 | .. | 1 |
| 20 “ | 1 | 1 | 2 |
| 25 “ | 7 | 1 | 8 |
| 30 “ | 5 | 7 | 12 |
| 35 “ | 6 | 15 | 21 |
| 40 “ | 17 | 25 | 42 |
| 45 “ | 38 | 43 | 81 |
| 50 “ | 43 | 37 | 80 |
| 55 “ | 58 | 57 | 115 |
| 60 “ | 66 | 39 | 105 |
| 65 “ | 81 | 61 | 142 |
| 70 “ | 91 | 47 | 138 |
| 75 “ | 50 | 34 | 84 |
| 80 years and upwards | 36 | 23 | 59 |
| Totals | 510 | 394 | 904 |
The proportion of deaths from cancer to the 1,000 persons living in some of the principal countries of the world as shown below leads to the conclusion that there is a general tendency to increase. The rate for England and Wales for 1913 (1.05 per 1,000) is the highest yet recorded in that country.
| CANCER DEATH-RATES PER 1,000 LIVING INCERTAIN COUNTRIES. | |||||
|---|---|---|---|---|---|
| Country. | Average of 5 Years, 1896–1900. | Average of 5 Years, 1906–10. | Increase per Cent. during 10 Years. | Rate for Last Year ascertainable. | |
* Decrease. | |||||
| Year. | Rate. | ||||
| New Zealand | 0.59 | 0.72 | 22.03 | 1914 | 0.83 |
| Commonwealth of Australia | 0.58 | 0.70 | 20.69 | 1913 | 0.75 |
| England and Wales | 0.80 | 0.94 | 17.50 | 1913 | 1.05 |
| Scotland | 0.77 | 1.00 | 29.87 | 1913 | 1.09 |
| Ireland | 0.58 | 0.79 | 36.21 | 1913 | 0.89 |
| German Empire | 0.66 | 0.84 | 27.27 | 1912 | 0.89 |
| Austria | 0.69 | 0.78 | 13.04 | 1912 | 0.81 |
| Italy | 0.51 | 0.64 | 25.49 | 1912 | 0.65 |
| Norway | 0.86 | 0.97 | 12.79 | 1912 | 1.05 |
| Denmark | 0.45 | 0.54 | 20.00 | 1912 | 0.61 |
| Netherlands | 0.92 | 1.03 | 11.96 | 1913 | 1.10 |
| Switzerland | 1.27 | 1.26 | *0.79 | 1912 | 1.27 |
Diabetes.—There were 152 deaths in 1914, a rate of 1.40 per 10,000, the averages for the last five years being 140 and 1.34 respectively. Deaths from this cause appear to be on the increase.
Exophthalmic Goitre.—Thirty-one deaths from this cause were registered in 1914, as against 19 in 1913 and 40 in 1912.
Anæmia and Chlorosis.—Seventy-six deaths were recorded in 1914. In 1913 the number was 64 and in 1912, 53, the average for the five years 1910–14 being 65, and the average rate per 10,000 being 0.63.
Simple Meningitis.—Very little fluctuation is shown as regards deaths from this cause. The number for 1914 was 140, while the rate per 10,000 was 1.28.
Apoplexy, Cerebral Hæmorrhage.—The number of deaths in 1914 (441) was the highest for some years past. Deaths from apoplexy and cerebral hæmorrhage appear to be on the increase.
Epilepsy.—The number of deaths from this cause (51) was lower in 1914 than in any of the four preceding years.
Convulsions of Children.—As regards both number and rate, 1914 shows a considerable decrease on the preceding year. The rate fell from 1.08 per 10,000 in 1910 to 0.57 per 10,000 in 1914. The figures for 1912 are also much below the average.
Organic Heart-disease.—More deaths occur from this cause than from any other. Under the Bertillon classification deaths occurring from heart-disease, combined with bronchitis, pneumonia, rheumatic fever, or Blight's disease, must be allocated to heart-disease, this being the reverse of the system formerly followed. Included in the total for 1914 are the following cases of heart-disease combined with other diseases: Bright's disease, 22; bronchitis, 52; pneumonia, 11; congestion of lungs, 7; rheumatism, 2. Number and rate of deaths from heart-disease show a tendency to increase.
Arteriosclerosis.—A rapid increase of deaths from this cause is apparent, the number in 1914 being 106, as against only 44 in 1910.
Embolism and Thrombosis.—In common with other diseases of the circulatory system, numbers and rates show a general tendency to increase, the figures for 1914 being considerably higher than the average of the quinquennium. The number of deaths in 1914 was 101, while the rate per 10,000 was 0.93.
Bronchitis.—The number (262) and rate (2.40 per 10,000) of deaths from this cause in 1914 were about equal to the averages of the five years. The year 1910 shows the highest number as well as the highest rate.
Bronchopneumonia.—The deaths from this cause in 1914 numbered 139, as against 154 in 1913 and 114 in 1912.
Pneumonia.—The number and rate in 1914 were slightly lower than in 1913, but about equal to the average of the quinquennium.
Gastritis.—There were 47 deaths from this cause in 1914, as compared with 29 in 1913 and 48 in 1912.
Diarrhœa and Enteritis.—Considerable fluctuation is shown as regards deaths from diarrhœa and enteritis. The number fell from 500 in 1910 to 404 in 1911, and 271 in 1912, rising, however, in 1913 to 344. Last year only 265 deaths were attributed to this cause.
Appendicitis and Typhlitis.—Eighty-six deaths were registered in 1914, a decrease of 5 on the figures for 1913. The average for the five years 1910–14 was 90, while the average rate per 10,000 was 0.87.
Intestinal Obstruction.—Seventy-three deaths (a rate of 0.67 per 10,000) were registered in 1914. Little movement is shown as regards deaths from this cause.
Cirrhosis of Liver.—The number of deaths in 1914 (44) was three less than in 1913. Here also very little fluctuation is shown.
Simple Peritonitis.—Still another cause deaths from which show little fluctuation, 53 deaths being registered in 1914, the number being somewhat below the average of the quinquennium.
Nephritis, Bright's Disease.—The number of deaths attributed to this cause in 1914 (261) was lower than in any of the four preceding years. The number in 1913 was 317.
Cystitis.—The number of deaths registered in 1914 (45) was 14 more than in 1913, and 5 more than in 1912.
Puerperal Accidents and Diseases.—The deaths certified to these causes in 1914 numbered 118 as against 100 in 1913. Included in the number in 1914 were: Accidents of pregnancy, 21; puerperal hæmorrhage, 17; other accidents of labour, 19; puerperal septicæmia, 35; puerperal albuminuria and convulsions 18. The number of deaths to every 1,000 confinements (where children were born alive) for each of ten years is shown.
| Year. | Deaths of Mothers to every 1,000 Confinements. |
|---|---|
| 1905 | 4.22 |
| 1906 | 3.91 |
| 1907 | 4.62 |
| 1908 | 4.64 |
| 1909 | 5.14 |
| 1910 | 4.55 |
| 1911 | 4.38 |
| 1912 | 3.73 |
| 1913 | 3.62 |
| 1914 | 4.22 |
Congenital Debility.—The number in 1914 was lower than in any of the four years immediately preceding, being 252 as against 301 in 1913 and 256 in 1912.
Premature Birth.—Deaths from this cause have remained fairly steady during the past three years. The year 1911 was a good year as regards deaths from premature birth.
Senility.—No fewer than 809 deaths were attributed to this cause in 1913 and 812 in 1914.
Violence.—The deaths from external violence, apart from suicide, numbered 647 in 1914—males 552, females 95, the total being higher than the average of the quinquennium 1910–14, which was 591. The rate per 10,000 living was 5.71 in 1910, 5.81 in 1911, 4.95 in 1912, 5.98 in 1913, and 5.93 in 1914. The various forms of violent deaths (excluding suicides) in 1914 are shown in the following table:—
| VIOLENT DEATHS (EXCLUDING SUICIDE), 1914. | |||
|---|---|---|---|
| Cause of Death. | M. | F. | Total. |
| Poisoning | 12 | 3 | 15 |
| Drowning | 156 | 24 | 180 |
| Shooting | 18 | 2 | 20 |
| Falls | 24 | 3 | 27 |
| Starvation | 1 | — | 1 |
| Exposure | 4 | — | 4 |
| Homicide | 7 | 6 | 13 |
| Fractures | 43 | 13 | 56 |
| Burns and scalds | 29 | 17 | 46 |
| Suffocation, gas, &c. | 8 | 6 | 14 |
| In mines and quarries | 62 | — | 62 |
| By machinery | 5 | — | 5 |
| By vehicles, railways, &c. | 122 | 16 | 138 |
| By cutting or piercing instruments | 3 | — | 3 |
| Injuries by animals | 18 | 1 | 19 |
| Effects of heat | 6 | 1 | 7 |
| Electrocution | 4 | — | 4 |
| Other external violence | 30 | 3 | 33 |
| Totals | 552 | 95 | 647 |
Suicide.—The suicidal deaths in 1914 were 137—males 114 and females 23. The rate per 10,000 living was 1.26 in 1914, against an average of 1.21 for the past five years. The means most frequently resorted to by males were shooting and hanging, and by females, poison. The following table shows the means of self-destruction employed:—
| SUICIDES, 1914. | |||
|---|---|---|---|
| Mode of Death. | M. | F. | Total. |
| Hanging or strangulation | 27 | 6 | 33 |
| Firearms | 31 | 3 | 34 |
| Cutting or piercing instruments | 20 | 1 | 21 |
| Poison | 24 | 8 | 32 |
| Drowning | 3 | 1 | 4 |
| Other modes | 9 | 4 | 13 |
| Total suicides | 114 | 23 | 137 |
Under the provisions of section 20 of the Births and Deaths Registration Amendment Act, 1912, the deaths of 723 persons of the Maori race were registered in 1914. This number includes 382 males and 341 females. In addition 42 Maori deaths were registered under the main Act. These numbers are not included in the numbers of deaths quoted elsewhere in this subsection.
FROM the results of the last five censuses, in combination with the records of deaths, mortality tables have been prepared in the Government Statistician's office covering the four quinquennial periods, 1891–95, 1896–1900, 1901–5, and 1906–10. This is the first investigation of the kind undertaken in New Zealand since the preparation by Mr. George Leslie of tables covering the period 1880–92.
In the following pages are given tables of mortality-rates (qx), survivorship (lx), and expectation of life (ex) for each year of age, for each sex, and for each of the four quinquennial periods covered. These are preceded by an introductory note supplied by Mr. A. T. Traversi (A.I.A., London), Actuary to the New Zealand Friendly Societies Office, who recommended the system followed in the investigation, and whose actuarial advice and assistance were largely availed of throughout.
Diagrams are appended giving various comparisons of the rates of mortality brought out. Regarding these, the following remarks will be of interest:—
Diagram 1.—Gives comparisons of rates of mortality of New Zealand males for successive periods commencing with 1880–92, showing clearly that there has been a consistent fall in the rates.
Diagram 2.—Gives a similar comparison for females. It illustrates a like result.
Diagram 3.—Gives a comparison of the mortality-rates of males for New Zealand, New South Wales, and Victoria, demonstrating that the mortality is considerably lower in New Zealand than in the Australian States mentioned.
Diagram 4.—Gives a similar comparison for females, the results again being similar.
Diagrams 5 and 6.—Give comparisons (for males and females respectively) of the rates of mortality in New Zealand, Australia, and England. Here, again, the lowest rates are exhibited by New Zealand, though in the case of females there is a crossing of the curves which is no doubt partly due to peculiarities of graduations.
Diagram 7.—Gives a comparison of the rates of mortality among males and females in New Zealand for the five years 1906–10. The female rate is lower than that of the males for all ages except 23 to 36 inclusive.
The diagrams as a whole furnish striking evidence of the constant improvement which has been taking place in the vitality of the New Zealand population for years past, and demonstrate that the mortality-rates in New Zealand are lower than those of Australia and England.
Mr. A. T. Traversi
(A.I.A., London).
An important question presenting itself in constructing a series of mortality tables for the New Zealand population was whether the observations should be taken over periods of five or of ten years. It is usually considered in the case of a comparatively small population like that of New Zealand that a period of five years is rather too short to give a stable basis, and, in fact, the only tables hitherto published for New Zealand are for ten-year periods. After consideration, however, it was concluded that valuable results would be elicited by adopting a five-year period, particularly as the mortality-rates were known to be falling and as it was intended to take out the neighbouring periods also. The result has proved the Wisdom of this course, bringing out the very important fact that the mortality-rates in each five-year period are successively lower than those of the previous period. Under these circumstances tables constructed over a ten-year period would have had the serious disadvantage of mixing up ancient and recent rates of mortality, and therefore giving a result which was neither one thing nor another.
The technical principles upon which the tables were constructed are as follows:—
From the results of two censuses taken approximately five years apart, the number of years of life lived in five exact calendar years were calculated for quinquennial groups of ages: 5 to 9, 10 to 14, &c., and designated w6w10, &c. The deaths for the same period were grouped similarly. Then, by mean; of the ordinary central third difference formula,—
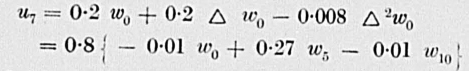
the years of life and deaths were interpolated for the central ages 12, 17, &c., enabling the values of qx at the central ages mentioned to be got by well-known methods.
This procedure sufficed for the main portion of the tables (with the exceptions mentioned below). The two ends of the tables, however, required special treatment. For the older ages a special formula based upon third differences was employed, whilst at the infantile ages the values of qx at each age up to age 5 were got by Dr. Farr's methods—namely, by taking the deaths in the five calendar years at the given age and measuring them against the relative births less deaths at previous ages. For instance, to get q1 for the 1906–10 mortality table, the deaths in the years 1906 to 1910 were divided by the births from the middle of 1904 to the middle of 1909 less deaths under 1 year of age during the five years 1905–9. Both at the older and the younger ages some adjustment was found necessary to produce reasonable smoothness in the curve. These slight adjustments were effected by a graphic process.
In the case of males 1891–95, females 1891–95, and females 1896–1900 tables, an exception was made in regard to the method followed for the main portion of the table. It was found that the formula set out above was not quite suitable owing to the fact that the deaths in five-age groups did not in some instances run altogether regularly. It appeared more satisfactory to deal with the matter in ten-age groups, and a formula was devised upon that basis, giving the values of u12 and u17 from three ten-age groups, the formula being an ordinary third difference one giving
u12 = 0.0115 w0 + 0.1020 w10 −0.0135 w20
u17 = −0.0135 w0 + 0.1020 w10 + 0.0115 w20.
The results so obtained were found, when plotted out, to give what was equivalent to a satisfactory graduation of the irregular results obtained from the first-mentioned formula. These processes having furnished the values of qx for ages 12, 17, 22, &c., as well as for the infantile ages, the intermediate values were interpolated by means of an osculatory third difference formula. It is hardly necessary to set out the processes by which the remaining functions were derived from qx. It may be mentioned that the whole of the work from beginning to end was specially adapted for and was performed upon the Millionaire calculating-machine, which lent itself thereto with great facility.
| RATE OF MORTALITY (qx)—MALES. | ||||
|---|---|---|---|---|
| (Rate of mortality in New Zealand during each year of age per 1,000 males who enter upon such age.) | ||||
| Age (Years). | 1891–95. | 1896–1900. | 1901–5. | 1906–10. |
| 0 | 96.71 | 88.48 | 83.06 | 77.96 |
| 1 | 18.14 | 13.59 | 12.19 | 11.22 |
| 2 | 7.46 | 5.63 | 5.85 | 5.30 |
| 3 | 5.42 | 4.19 | 4.36 | 3.86 |
| 4 | 4.38 | 3.34 | 3.48 | 2.85 |
| 5 | 3.61 | 2.79 | 2.82 | 2.38 |
| 0 | 3.11 | 2.48 | 2.50 | 2.10 |
| 7 | 2.75 | 2.21 | 2.25 | 1.89 |
| 8 | 2.44 | 1.96 | 2.00 | 1.70 |
| 9 | 2.20 | 1.77 | 1.80 | 1.53 |
| 10 | 2.08 | 1.67 | 1.68 | 1.46 |
| 11 | 2.07 | 1.66 | 1.69 | 1.47 |
| 12 | 2.12 | 1.71 | 1.74 | 1.52 |
| 13 | 2.26 | 1.81 | 1.85 | 1.63 |
| 14 | 2.51 | 2.00 | 2.05 | 1.84 |
| 15 | 2.83 | 2.24 | 2.30 | 2.09 |
| 16 | 3.15 | 2.52 | 2.57 | 2.35 |
| 17 | 3.43 | 2.79 | 2.82 | 2.58 |
| 18 | 3.67 | 3.10 | 3.07 | 2.78 |
| 19 | 3.90 | 3.45 | 3.34 | 2.98 |
| 20 | 4.12 | 3.81 | 3.60 | 3.17 |
| 21 | 4.33 | 4.13 | 3.83 | 3.34 |
| 22 | 4.54 | 4.36 | 4.00 | 3.49 |
| 23 | 4.76 | 4.48 | 4.09 | 3.60 |
| 24 | 4.98 | 4.51 | 4.10 | 3.67 |
| 25 | 5.19 | 4.50 | 4.09 | 3.72 |
| 26 | 5.38 | 4.48 | 4.08 | 3.79 |
| 27 | 5.52 | 4.50 | 4.13 | 3.87 |
| 28 | 5.59 | 4.55 | 4.22 | 3.98 |
| 29 | 5.61 | 4.59 | 4.34 | 4.10 |
| 30 | 5.61 | 4.65 | 4.48 | 4.22 |
| 31 | 5.62 | 4.75 | 4.64 | 4.37 |
| 32 | 5.69 | 4.89 | 4.80 | 4.54 |
| 33 | 5.83 | 5.12 | 4.98 | 4.75 |
| 34 | 6.01 | 5.42 | 5.17 | 4.99 |
| 35 | 6.21 | 5.75 | 5.38 | 5.25 |
| 36 | 6.41 | 6.06 | 5.59 | 5.50 |
| 37 | 6.61 | 6.33 | 5.80 | 5.73 |
| 38 | 6.78 | 6.51 | 5.99 | 5.90 |
| 39 | 6.92 | 6.63 | 6.16 | 6.02 |
| 40 | 7.07 | 6.75 | 6.35 | 6.15 |
| 41 | 7.28 | 6.92 | 6.59 | 6.34 |
| 42 | 7.57 | 7.22 | 6.94 | 6.64 |
| 43 | 7.93 | 7.68 | 7.40 | 7.10 |
| 44 | 8.35 | 8.26 | 7.95 | 7.67 |
| 45 | 8.83 | 8.89 | 8.56 | 8.30 |
| 46 | 9.40 | 9.54 | 9.20 | 8.94 |
| 47 | 10.08 | 10.14 | 9.85 | 9.54 |
| 48 | 10.91 | 10.63 | 10.51 | 10.06 |
| 49 | 11.88 | 11.04 | 11.18 | 10.52 |
| 50 | 12.92 | 11.48 | 11.87 | 11.01 |
| 51 | 13.97 | 12.04 | 12.60 | 11.58 |
| 52 | 14.98 | 12.81 | 13.36 | 12.30 |
| 53 | 15.83 | 13.85 | 14.11 | 13.22 |
| 54 | 16.57 | 15.10 | 14.83 | 14.27 |
| 55 | 17.35 | 16.48 | 15.61 | 15.42 |
| 56 | 18.34 | 17.90 | 16.53 | 16.63 |
| 57 | 19.70 | 19.31 | 17.67 | 17.84 |
| 58 | 21.53 | 20.55 | 19.04 | 18.95 |
| 59 | 23.72 | 21.69 | 20.58 | 19.97 |
| 60 | 26.12 | 22.92 | 22.29 | 21.10 |
| 61 | 28.57 | 24.44 | 24.17 | 22.49 |
| 62 | 30.95 | 26.45 | 26.23 | 24.34 |
| 63 | 33.06 | 28.99 | 28.34 | 26.61 |
| 64 | 35.02 | 31.92 | 30.50 | 29.18 |
| 65 | 37.08 | 35.19 | 32.90 | 32.09 |
| 66 | 39.48 | 38.74 | 35.73 | 35.41 |
| 67 | 42.49 | 42.49 | 39.19 | 39.19 |
| 68 | 46.07 | 46.36 | 43.34 | 43.46 |
| 69 | 50.06 | 50.38 | 48.04 | 48.17 |
| 70 | 54.49 | 54.71 | 53.20 | 53.29 |
| 71 | 59.40 | 59.47 | 58.75 | 58.78 |
| 72 | 64.80 | 64.80 | 64.57 | 64.57 |
| 73 | 70.86 | 70.86 | 70.56 | 70.56 |
| 74 | 77.56 | 77.56 | 76.77 | 76.77 |
| 75 | 84.66 | 84.66 | 83.39 | 83.39 |
| 76 | 91.92 | 91.92 | 90.60 | 90.60 |
| 77 | 99.09 | 99.09 | 98.58 | 98.58 |
| 78 | 105.93 | 105.93 | 107.50 | 107.50 |
| 79 | 112.62 | 112.62 | 117.24 | 117.24 |
| 80 | 119.50 | 119.50 | 127.55 | 127.55 |
| 81 | 126.91 | 126.91 | 138.18 | 138.18 |
| 82 | 135.21 | 135.21 | 148.87 | 148.87 |
| 83 | 144.17 | 144.17 | 159.10 | 159.10 |
| 84 | 153.54 | 153.54 | 169.01 | 169.01 |
| 85 | 163.69 | 163.69 | 179.43 | 179.43 |
| 86 | 174.95 | 174.95 | 191.17 | 191.17 |
| 87 | 187.68 | 187.68 | 205.03 | 205.03 |
| 88 | 200.76 | 200.76 | 219.47 | 219.47 |
| 89 | 213.95 | 213.95 | 233.94 | 233.94 |
| 90 | 228.94 | 228.94 | 250.77 | 250.77 |
| 91 | 247.40 | 247.40 | 272.29 | 272.29 |
| 92 | 271.00 | 271.00 | 300.85 | 300.85 |
| 93 | 295.58 | 295.58 | 334.89 | 334.89 |
| 94 | 320.02 | 320.02 | 372.85 | 372.85 |
| 95 | 350.58 | 350.58 | 417.05 | 417.05 |
| 96 | 393.49 | 393.49 | 469.84 | 469.84 |
| 97 | 455.00 | 455.00 | 533.53 | 533.53 |
| 98 | 541.62 | 541.62 | 611.32 | 611.32 |
| 99 | 649.17 | 649.17 | 701.67 | 701.67 |
| 100 | 767.91 | 767.91 | 799.77 | 799.77 |
| 101 | 888.10 | 888.10 | 900.82 | 900.82 |
| RATE OF MORTALITY (qx)—FEMALES. | ||||
|---|---|---|---|---|
| (Rate of mortality in New Zealand during each year of age per 1,000 females who enter upon such age.) | ||||
| Age (Years). | 1891–95. | 1896–1900. | 1901–5. | 1906–10. |
| 0 | 78.28 | 72.04 | 68.54 | 62.03 |
| 1 | 15.83 | 11.98 | 11.63 | 10.58 |
| 2 | 7.44 | 5.14 | 5.41 | 5.27 |
| 3 | 5.39 | 3.95 | 4.22 | 3.31 |
| 4 | 4.37 | 3.10 | 3.31 | 2.52 |
| 5 | 3.69 | 2.58 | 2.65 | 2.24 |
| 6 | 3.65 | 2.25 | 2.25 | 1.90 |
| 7 | 2.66 | 2.00 | 2.00 | 1.85 |
| 8 | 2.20 | 1.73 | 1.69 | 1.61 |
| 9 | 1.93 | 1.58 | 1.52 | 1.42 |
| 10 | 1.80 | 1.54 | 1.46 | 1.38 |
| 11 | 1.78 | 1.58 | 1.47 | 1.41 |
| 12 | 1.84 | 1.66 | 1.52 | 1.46 |
| 13 | 2.02 | 1.83 | 1.65 | 1.56 |
| 14 | 2.35 | 2.11 | 1.87 | 1.72 |
| 15 | 2.75 | 2.43 | 2.14 | 1.93 |
| 16 | 3.15 | 2.75 | 2.43 | 2.15 |
| 17 | 3.48 | 3.02 | 2.68 | 2.36 |
| 18 | 3.73 | 3.22 | 2.90 | 2.56 |
| 19 | 3.94 | 3.40 | 3.12 | 2.77 |
| 20 | 4.13 | 3.55 | 3.33 | 2.98 |
| 21 | 4.31 | 3.70 | 3.54 | 3.20 |
| 22 | 4.50 | 3.84 | 3.74 | 3.40 |
| 23 | 4.71 | 3.98 | 3.94 | 3.60 |
| 24 | 4.93 | 4.10 | 4.14 | 3.81 |
| 25 | 5.14 | 4.22 | 4.33 | 4.01 |
| 26 | 5.34 | 4.34 | 4.49 | 4.19 |
| 27 | 5.50 | 4.46 | 4.61 | 4.34 |
| 28 | 5.61 | 4.58 | 4.66 | 4.44 |
| 29 | 5.68 | 4.69 | 4.65 | 4.50 |
| 30 | 5.73 | 4.81 | 4.62 | 4.55 |
| 31 | 5.79 | 4.94 | 4.62 | 4.61 |
| 32 | 5.89 | 5.10 | 4.69 | 4.72 |
| 33 | 6.04 | 5.29 | 4.85 | 4.89 |
| 34 | 6.22 | 5.51 | 5.08 | 5.11 |
| 35 | 6.42 | 5.74 | 5.34 | 5.34 |
| 36 | 6.60 | 5.97 | 5.60 | 5.55 |
| 37 | 6.77 | 6.18 | 5.84 | 5.72 |
| 38 | 6.89 | 6.35 | 6.04 | 5.80 |
| 39 | 6.98 | 6.49 | 6.22 | 5.83 |
| 40 | 7.07 | 6.64 | 6.40 | 5.84 |
| 41 | 7.19 | 6.81 | 6.58 | 5.89 |
| 42 | 7.36 | 7.04 | 6.77 | 6.02 |
| 43 | 7.58 | 7.33 | 6.93 | 6.23 |
| 44 | 7.82 | 7.67 | 7.07 | 6.50 |
| 45 | 8.11 | 8.03 | 7.22 | 6.81 |
| 46 | 8.44 | 8.42 | 7.45 | 7.17 |
| 47 | 8.83 | 8.83 | 7.81 | 7.57 |
| 48 | 9.26 | 9.22 | 8.32 | 8.01 |
| 49 | 9.74 | 9.62 | 8.95 | 8.49 |
| 50 | 10.27 | 10.05 | 9.66 | 9.01 |
| 51 | 10.87 | 10.53 | 10.41 | 9.58 |
| 52 | 11.53 | 11.09 | 11.16 | 10.21 |
| 53 | 12.23 | 11.68 | 11.87 | 10.90 |
| 54 | 12.97 | 12.29 | 12.56 | 11.63 |
| 55 | 13.79 | 12.98 | 13.31 | 12.42 |
| 56 | 14.72 | 13.83 | 14.15 | 13.29 |
| 57 | 15.80 | 14.91 | 15.16 | 14.26 |
| 58 | 17.00 | 16.25 | 16.33 | 15.24 |
| 59 | 18.31 | 17.81 | 17.60 | 16.23 |
| 60 | 19.75 | 19.54 | 19.01 | 17.33 |
| 61 | 21.34 | 21.39 | 20.56 | 18.67 |
| 62 | 23.12 | 23.33 | 22.27 | 20.35 |
| 63 | 25.03 | 25.28 | 24.06 | 22.37 |
| 64 | 27.05 | 27.26 | 25.91 | 24.64 |
| 65 | 29.27 | 29.40 | 27.95 | 27.18 |
| 66 | 31.75 | 31.80 | 30.32 | 30.01 |
| 67 | 34.58 | 34.58 | 33.15 | 33.15 |
| 68 | 37.66 | 37.64 | 36.37 | 36.49 |
| 69 | 40.94 | 40.92 | 39.89 | 40.03 |
| 70 | 44.55 | 44.54 | 43.81 | 43.91 |
| 71 | 48.65 | 48.65 | 48.24 | 48.27 |
| 72 | 53.36 | 53.36 | 53.25 | 53.25 |
| 73 | 58.75 | 58.75 | 58.93 | 58.93 |
| 74 | 64.72 | 64.72 | 65.19 | 65.19 |
| 75 | 71.19 | 71.19 | 71.95 | 71.95 |
| 76 | 78.07 | 78.07 | 79.12 | 79.12 |
| 77 | 85.26 | 85.26 | 86.62 | 86.62 |
| 78 | 92.59 | 92.59 | 94.37 | 94.37 |
| 79 | 100.12 | 100.12 | 102.43 | 102.43 |
| 80 | 108.11 | 108.11 | 110.91 | 110.91 |
| 81 | 116.85 | 116.85 | 119.90 | 119.90 |
| 82 | 126.61 | 126.61 | 129.50 | 129.50 |
| 83 | 137.44 | 137.44 | 139.25 | 139.25 |
| 84 | 149.18 | 149.18 | 149.07 | 149.07 |
| 85 | 161.71 | 161.71 | 159.68 | 159.68 |
| 86 | 174.94 | 174.94 | 171.77 | 171.77 |
| 87 | 188.78 | 188.78 | 186.07 | 186.07 |
| 88 | 201.12 | 201.12 | 201.02 | 201.02 |
| 89 | 212.02 | 212.02 | 216.15 | 216.15 |
| 90 | 224.64 | 224.64 | 233.78 | 233.78 |
| 91 | 242.13 | 242.13 | 256.22 | 256.22 |
| 92 | 267.63 | 267.63 | 285.79 | 285.79 |
| 93 | 299.05 | 299.05 | 320.94 | 320.94 |
| 94 | 334.29 | 334.29 | 360.14 | 360.14 |
| 95 | 376.49 | 376.49 | 405.69 | 405.69 |
| 96 | 428.80 | 428.80 | 459.90 | 459.110 |
| 97 | 494.36 | 494.36 | 525.07 | 525.07 |
| 98 | 577.73 | 577.73 | 604.58 | 604.58 |
| 99 | 676.80 | 676.80 | 696.87 | 696.87 |
| 100 | 784.76 | 784.76 | 796.91 | 796.91 |
| 101 | 894.77 | 894.77 | 899.64 | 899.64 |
| SURVIVORS
(lx.)—MALES. (Numbers surviving at each age in New Zealand out of 100,000 males born.) | ||||
|---|---|---|---|---|
| 0 | 100,000 | 100,000 | 100,000 | 100,000 |
| 1 | 90,329 | 91,152 | 91,694 | 92,204 |
| 2 | 88,690 | 89,913 | 90,576 | 91,169 |
| 3 | 88,028 | 80,407 | 90,046 | 90,686 |
| 4 | 87,551 | 89,032 | 89,653 | 90,336 |
| 5 | 87,168 | 88,735 | 89,341 | 90,079 |
| 6 | 86,853 | 88,487 | 89,089 | 89,865 |
| 7 | 86,583 | 88,263 | 88,866 | 89,676 |
| 8 | 86,345 | 88,073 | 88,666 | 89,507 |
| 9 | 86,134 | 87,900 | 88,489 | 89,355 |
| 10 | 85,945 | 87,744 | 88,330 | 89,218 |
| 11 | 85,766 | 87,597 | 88,182 | 89,088 |
| 12 | 85,588 | 87,452 | 88,033 | 88,957 |
| 13 | 85,407 | 87,302 | 87,880 | 88,822 |
| 14 | 85,214 | 87,144 | 87,717 | 88,677 |
| 15 | 85,000 | 86,970 | 87,537 | 88,514 |
| 16 | 84,759 | 86,775 | 87,335 | 88,329 |
| 17 | 84,492 | 86,556 | 87,111 | 88,121 |
| 18 | 84,202 | 86,315 | 86,860 | 87,894 |
| 19 | 83,893 | 86,047 | 86,593 | 87,650 |
| 20 | 83,566 | 85,750 | 86,304 | 87,389 |
| 21 | 83,222 | 85,423 | 85,993 | 87,112 |
| 22 | 82,862 | 85,070 | 85,664 | 86,821 |
| 23 | 82,486 | 84,699 | 85,321 | 86,518 |
| 24 | 82,093 | 84,320 | 84,972 | 86,207 |
| 25 | 81,684 | 83,940 | 84,624 | 85,891 |
| 26 | 81,260 | 83,562 | 84,278 | 85,571 |
| 27 | 80,823 | 83,188 | 83,934 | 85,247 |
| 28 | 80,377 | 82,814 | 83,587 | 84,917 |
| 29 | 79,928 | 82,437 | 83,234 | 84,579 |
| 30 | 79,480 | 82,059 | 82,873 | 84,232 |
| 31 | 79,034 | 81,677 | 82,502 | 83,877 |
| 32 | 78,590 | 81,289 | 82,119 | 83,510 |
| 33 | 78,143 | 80,891 | 81,725 | 83,131 |
| 34 | 77,687 | 80,477 | 81,318 | 82,736 |
| 35 | 77,220 | 80,041 | 80,898 | 82,323 |
| 36 | 76,740 | 79,581 | 80,463 | 81,891 |
| 37 | 76,248 | 79,099 | 80,013 | 81,441 |
| 38 | 75,744 | 78,598 | 79,549 | 80,974 |
| 39 | 75,230 | 78,086 | 79,073 | 80,496 |
| 40 | 74,709 | 77,568 | 78,586 | 80,011 |
| 41 | 74,181 | 77,044 | 78,087 | 79,519 |
| 42 | 73,641 | 76,511 | 77,572 | 79,015 |
| 43 | 73,084 | 75,959 | 77,034 | 78,490 |
| 44 | 72,504 | 75,376 | 76,464 | 77,933 |
| 45 | 71,899 | 74,753 | 75,856 | 77,335 |
| 46 | 71,264 | 74,088 | 75,207 | 76,693 |
| 47 | 70,594 | 73,381 | 74,515 | 76,007 |
| 48 | 69,882 | 72,637 | 73,781 | 75,282 |
| 49 | 69,120 | 71,865 | 73,006 | 74,525 |
| 50 | 68,299 | 71,072 | 72,190 | 73,741 |
| 51 | 67,417 | 70,256 | 71,333 | 73,929 |
| 52 | 66,475 | 69,410 | 70,434 | 72,084 |
| 53 | 65,479 | 68,521 | 69,493 | 71,197 |
| 54 | 64,442 | 67,572 | 68,512 | 70,256 |
| 55 | 63,374 | 66,552 | 67,496 | 69,253 |
| 56 | 62,274 | 65,455 | 66,442 | 68,185 |
| 57 | 61,132 | 64,283 | 65,344 | 67,051 |
| 58 | 59,928 | 63,042 | 64,189 | 65,855 |
| 59 | 58,638 | 61,746 | 62,967 | 64,607 |
| 60 | 57,247 | 60,407 | 61,671 | 63,317 |
| 61 | 55,752 | 59,022 | 60,296 | 61,981 |
| 62 | 54,159 | 57,580 | 58,839 | 60,587 |
| 63 | 52,483 | 56,057 | 57,296 | 59,112 |
| 64 | 50,748 | 54,432 | 55,672 | 57,539 |
| 65 | 48,971 | 52,695 | 53,974 | 55,860 |
| 66 | 47,15 | 50,841 | 52,198 | 54,067 |
| 67 | 45,293 | 48,871 | 50,333 | 52,152 |
| 68 | 43,369 | 46,794 | 48,360 | 50,108 |
| 69 | 41,371 | 44,65 | 46,264 | 47,930 |
| 70 | 39,300 | 42,377 | 44,041 | 45,621 |
| 71 | 37,159 | 40,059 | 41,698 | 43,190 |
| 72 | 34,952 | 37,677 | 39,248 | 40,651 |
| 73 | 32,687 | 35,236 | 36,714 | 38,026 |
| 74 | 30,371 | 32,739 | 34,123 | 35,343 |
| 75 | 28,65 | 30,200 | 31,503 | 32,630 |
| 76 | 25,643 | 27,643 | 28,876 | 29,909 |
| 77 | 23,286 | 25,102 | 26,260 | 27,199 |
| 78 | 20,979 | 22,615 | 23,071 | 24,518 |
| 79 | 18,757 | 20,219 | 21,126 | 21,882 |
| 80 | 16,615 | 17,942 | 18,649 | 19,317 |
| 81 | 14,656 | 15,798 | 16,270 | 16,853 |
| 82 | 12,796 | 13,793 | 14,022 | 14,524 |
| 83 | 11,066 | 11,928 | 11,935 | 12,362 |
| 84 | 9,471 | 10,208 | 10,036 | 10,395 |
| 85 | 8,017 | 8,641 | 8,340 | 8,638 |
| 86 | 6,705 | 7,227 | 6,844 | 7,088 |
| 87 | 5,532 | 5,963 | 5,536 | 5,733 |
| 88 | 4,494 | 4,844 | 4,401 | 4,558 |
| 89 | 3,592 | 3,872 | 3,435 | 3,558 |
| 90 | 2,823 | 3,044 | 2,631 | 2,726 |
| 91 | 2,177 | 2,347 | 1,971 | 2,042 |
| 92 | 1,638 | 1,766 | 1,434 | 1,486 |
| 93 | 1,194 | 1,287 | 1,003 | 1,039 |
| 94 | 841 | 907 | 667 | 691 |
| 95 | 572 | 617 | 418 | 433 |
| 96 | 371 | 401 | 244 | 252 |
| 97 | 225 | 243 | 129 | 134 |
| 98 | 123 | 132 | 60 | 63 |
| 99 | 56 | 61 | 23 | 24 |
| 100 | 20 | 21 | 7 | 7 |
| 101 | 5 | 5 | 1 | 1 |
| SURVIVORS
(lx)—FEMALES. (Numbers surviving at each age in New Zealand out of 100,000 females born.) | ||||
|---|---|---|---|---|
| 0 | 100,000 | 100,000 | 100,000 | 100,000 |
| 1 | 92,172 | 92,769 | 93,146 | 93,797 |
| 2 | 90,713 | 91,658 | 92,063 | 92,805 |
| 3 | 90,038 | 91,187 | 91,565 | 92,316 |
| 4 | 89,553 | 90,827 | 91,179 | 92,010 |
| 5 | 89,162 | 90,545 | 90,877 | 91,778 |
| 6 | 88,833 | 90,311 | 90,636 | 91,572 |
| 7 | 88,562 | 90,108 | 90,432 | 91,398 |
| 8 | 88,326 | 89,928 | 90,251 | 91,229 |
| 9 | 88,132 | 89,772 | 90,098 | 91,082 |
| 10 | 87,962 | 89,630 | 89,961 | 90,953 |
| 11 | 87,804 | 89,492 | 89,830 | 90,827 |
| 12 | 87,648 | 89,351 | 89,698 | 90,699 |
| 13 | 87,487 | 89,203 | 89,562 | 90,567 |
| 14 | 87,310 | 89,040 | 89,414 | 90,426 |
| 15 | 87,105 | 88,852 | 89,247 | 90,270 |
| 16 | 86,865 | 88,636 | 89,056 | 90,096 |
| 17 | 86,591 | 88,392 | 88,840 | 89,902 |
| 18 | 86,290 | 88,125 | 88,602 | 89,690 |
| 19 | 85,968 | 87,841 | 88,345 | 89,460 |
| 20 | 85,629 | 87,542 | 88,069 | 89,212 |
| 21 | 85,275 | 87,231 | 87,776 | 88,946 |
| 22 | 84,907 | 86,908 | 87,465 | 88,661 |
| 23 | 84,525 | 86,574 | 87,138 | 88,360 |
| 24 | 84,127 | 86,229 | 86,795 | 88,042 |
| 25 | 83,712 | 85,875 | 86,436 | 87,707 |
| 26 | 83,282 | 85,513 | 86,062 | 87,355 |
| 27 | 82,837 | 85,142 | 85,676 | 86,989 |
| 28 | 82,381 | 84,762 | 85,281 | 86,611 |
| 29 | 81,919 | 84,374 | 84,884 | 86,226 |
| 30 | 81,454 | 83,978 | 84,489 | 85,838 |
| 31 | 80,987 | 83,574 | 84,099 | 85,447 |
| 32 | 80,518 | 83,160 | 83,710 | 85,053 |
| 33 | 80,044 | 82,736 | 83,317 | 84,652 |
| 34 | 79,561 | 82,298 | 82,913 | 84,238 |
| 35 | 79,066 | 81,845 | 82,492 | 83,808 |
| 36 | 78,558 | 81,375 | 82,051 | 83,360 |
| 37 | 78,040 | 80,889 | 81,592 | 82,897 |
| 38 | 77,512 | 80,389 | 81,116 | 82,423 |
| 39 | 76,978 | 79,878 | 80,626 | 81,945 |
| 40 | 76,441 | 79,360 | 80,125 | 81,467 |
| 41 | 75,901 | 78,833 | 79,612 | 80,991 |
| 42 | 75,355 | 78,296 | 79,088 | 80,514 |
| 43 | 74,800 | 77,745 | 78,553 | 80,029 |
| 44 | 74,233 | 77,175 | 78,009 | 79,530 |
| 45 | 73,652 | 76,583 | 77,457 | 79,013 |
| 46 | 73,055 | 75,968 | 76,898 | 78,475 |
| 47 | 72,438 | 75,328 | 76,325 | 77,912 |
| 48 | 71,798 | 74,663 | 75,729 | 77,322 |
| 49 | 71,133 | 73,975 | 75,099 | 76,703 |
| 50 | 70,440 | 73,263 | 74,427 | 76,052 |
| 51 | 69,717 | 72,527 | 73,708 | 75,367 |
| 52 | 68,959 | 71,763 | 72,941 | 74,645 |
| 53 | 68,164 | 70,967 | 72,127 | 73,883 |
| 54 | 67,330 | 70,138 | 71,271 | 73,078 |
| 55 | 66,457 | 69,276 | 70,376 | 72,228 |
| 56 | 65,541 | 68,377 | 69,439 | 71,331 |
| 57 | 64,576 | 67,431 | 68,456 | 70,383 |
| 58 | 63,556 | 66,426 | 67,418 | 69,379 |
| 59 | 62,476 | 65,347 | 66,317 | 68,322 |
| 60 | 61,332 | 64,183 | 65,150 | 67,213 |
| 61 | 60,121 | 62,929 | 63,911 | 66,048 |
| 62 | 58,838 | 61,583 | 62,597 | 64,815 |
| 63 | 57,478 | 60,146 | 61,203 | 63,496 |
| 64 | 56,039 | 58,626 | 59,730 | 62,076 |
| 65 | 54,523 | 57,028 | 58,182 | 60,546 |
| 66 | 52,927 | 55,351 | 56,556 | 58,900 |
| 67 | 51,247 | 53,591 | 54,841 | 57,132 |
| 68 | 49,475 | 51,738 | 53,023 | 55,238 |
| 69 | 47,612 | 49,791 | 51,095 | 53,222 |
| 70 | 45,663 | 47,754 | 49,057 | 51,092 |
| 71 | 43,629 | 45,627 | 46,908 | 48,849 |
| 72 | 41,506 | 43,407 | 44,645 | 46,491 |
| 73 | 39,291 | 41,091 | 42,268 | 44,015 |
| 74 | 36,983 | 38,677 | 39,777 | 41,421 |
| 75 | 34,589 | 36,174 | 37,184 | 38,721 |
| 76 | 32,127 | 33,599 | 34,509 | 35,935 |
| 77 | 29,619 | 30,976 | 31,779 | 33,092 |
| 78 | 27,094 | 28,335 | 29,026 | 30,226 |
| 79 | 24,585 | 25,711 | 26,287 | 27,374 |
| 80 | 22,124 | 23,137 | 23,594 | 24,570 |
| 81 | 19,732 | 20,636 | 20,977 | 21,845 |
| 82 | 17,426 | 18,225 | 18,462 | 19,226 |
| 83 | 15,220 | 15,918 | 16,071 | 16,736 |
| 84 | 13,128 | 13,730 | 13,833 | 14,406 |
| 85 | 11,170 | 11,682 | 11,771 | 12,258 |
| 86 | 9,364 | 9,793 | 9,891 | 10,301 |
| 87 | 7,726 | 8,080 | 8,192 | 8,532 |
| 88 | 6,267 | 6,555 | 6,668 | 6,944 |
| 89 | 5,007 | 5,237 | 5,328 | 5,548 |
| 90 | 3,945 | 4,127 | 4,176 | 4,349 |
| 91 | 3,059 | 3,200 | 3,200 | 3,332 |
| 92 | 2,318 | 2,425 | 2,380 | 2,478 |
| 93 | 1,698 | 1,776 | 1,700 | 1,770 |
| 94 | 1,190 | 1,245 | 1,154 | 1,202 |
| 93 | 792 | 829 | 738 | 769 |
| 96 | 494 | 517 | 439 | 457 |
| 97 | 282 | 295 | 237 | 247 |
| 98 | 143 | 149 | 113 | 117 |
| 99 | 60 | 63 | 44 | 46 |
| 100 | 19 | 20 | 13 | 14 |
| 101 | 4 | 4 | 3 | 3 |
| EXPECTATION OF LIFE
(ex)—MALES. (Expectation of life or average after-life time in New Zealand at each year of age.) | ||||
|---|---|---|---|---|
| Years. | Years. | Years. | Years. | Years. |
| 0 | 55.294 | 57.373 | 58.092 | 59.165 |
| 1 | 60.161 | 61.893 | 62.308 | 63.125 |
| 2 | 60.263 | 61.739 | 62.071 | 62.836 |
| 3 | 59.712 | 61.086 | 61.433 | 62.168 |
| 4 | 59.035 | 60.341 | 60.700 | 61.407 |
| 5 | 58.292 | 59.541 | 59.911 | 60.581 |
| 6 | 57.502 | 58.706 | 59.079 | 59.724 |
| 7 | 56.680 | 57.851 | 58.225 | 58.849 |
| 8 | 55.835 | 56.978 | 57.356 | 57.959 |
| 9 | 54.970 | 56.089 | 56.469 | 57.057 |
| 10 | 54.090 | 55.188 | 55.570 | 56.144 |
| 11 | 53.202 | 54.279 | 54.663 | 55.225 |
| 12 | 52.311 | 53.369 | 53.755 | 54.306 |
| 13 | 51.421 | 52.459 | 52.848 | 53.388 |
| 14 | 50.537 | 51.553 | 51.945 | 52.474 |
| 15 | 49.662 | 50.656 | 51.050 | 51.570 |
| 16 | 48.802 | 49.768 | 50.167 | 50.677 |
| 17 | 47.955 | 48.893 | 49.295 | 49.795 |
| 18 | 47.118 | 48.028 | 48.436 | 48.923 |
| 19 | 46.290 | 47.176 | 47.583 | 48.058 |
| 20 | 45.469 | 46.338 | 46.741 | 47.200 |
| 21 | 44.655 | 45.513 | 45.908 | 46.348 |
| 22 | 43.847 | 44.700 | 45.083 | 45.502 |
| 23 | 43.045 | 43.893 | 44.262 | 44.659 |
| 24 | 42.248 | 43.088 | 43.442 | 43.819 |
| 25 | 41.457 | 42.281 | 42.618 | 42.979 |
| 26 | 40.671 | 41.470 | 41.791 | 42.137 |
| 27 | 39.888 | 40.655 | 40.960 | 41.296 |
| 28 | 39.107 | 39.836 | 40.128 | 40.454 |
| 29 | 38.324 | 39.016 | 39.296 | 39.614 |
| 30 | 37.537 | 37.193 | 38.465 | 38.775 |
| 31 | 36.746 | 37.370 | 37.636 | 37.937 |
| 32 | 35.951 | 36.546 | 36.809 | 37.101 |
| 33 | 35.154 | 35.723 | 35.984 | 36.268 |
| 34 | 34.357 | 34.904 | 35.162 | 35.439 |
| 35 | 33.562 | 34.091 | 34.342 | 34.614 |
| 36 | 32.768 | 33.286 | 33.525 | 33.794 |
| 37 | 31.977 | 32.486 | 32.711 | 32.978 |
| 38 | 31.186 | 31.689 | 31.899 | 32.166 |
| 39 | 30.395 | 30.894 | 31.088 | 35.353 |
| 40 | 29.604 | 30.097 | 30.278 | 30.540 |
| 41 | 28.811 | 29.298 | 29.468 | 29.726 |
| 42 | 28.019 | 28.498 | 28.660 | 28.913 |
| 43 | 27.229 | 27.702 | 27.857 | 28.103 |
| 44 | 26.442 | 26.912 | 27.061 | 27.300 |
| 45 | 25.661 | 26.132 | 26.274 | 26.507 |
| 46 | 24.885 | 25.362 | 25.496 | 25.725 |
| 47 | 24.116 | 24.602 | 24.728 | 24.952 |
| 48 | 23.357 | 23.849 | 23.969 | 24.188 |
| 49 | 22.609 | 23.100 | 23.219 | 23.429 |
| 50 | 21.875 | 22.352 | 22.475 | 22.672 |
| 51 | 21.154 | 21.606 | 21.739 | 21.919 |
| 52 | 20.447 | 20.863 | 21.010 | 21.170 |
| 53 | 19.750 | 20.127 | 20.289 | 20.428 |
| 54 | 19.060 | 19.403 | 19.572 | 19.695 |
| 55 | 18.373 | 18.693 | 18.859 | 18.972 |
| 56 | 17.688 | 17.997 | 18.151 | 18.262 |
| 57 | 17.009 | 17.316 | 17.447 | 17.562 |
| 58 | 16.341 | 16.647 | 16.752 | 16.872 |
| 59 | 16.690 | 15.986 | 16.068 | 16.188 |
| 60 | 15.659 | 16.330 | 15.395 | 15.508 |
| 61 | 14.449 | 14.677 | 14.734 | 14.831 |
| 62 | 13.859 | 14.033 | 14.087 | 14.161 |
| 63 | 13.286 | 13.400 | 13.453 | 13.502 |
| 64 | 12.723 | 12.785 | 12.831 | 12.857 |
| 65 | 12.167 | 12.191 | 12.218 | 12.229 |
| 66 | 11.616 | 11.617 | 11.617 | 11.618 |
| 67 | 11.073 | 11.065 | 11.029 | 11.026 |
| 68 | 10.542 | 10.524 | 10.459 | 10.455 |
| 69 | 10.027 | 10.022 | 9.910 | 9.907 |
| 70 | 9.59 | 9.527 | 9.385 | 9.383 |
| 71 | 9.050 | 9.049 | 8.884 | 8.884 |
| 72 | 8.590 | 8.510 | 8.407 | 8.407 |
| 73 | 8.150 | 8.150 | 7.953 | 7.953 |
| 74 | 7.734 | 7.734 | 7.519 | 7.519 |
| 75 | 7.342 | 7.342 | 7.102 | 7.102 |
| 76 | 6.975 | 6.975 | 6.703 | 6.703 |
| 77 | 6.630 | 6.630 | 6.321 | 6.321 |
| 78 | 6.304 | 6.304 | 5.958 | 5.958 |
| 79 | 5.992 | 5.992 | 5.615 | 5.615 |
| 80 | 5.689 | 5.689 | 5.294 | 5.294 |
| 81 | 5.393 | 5.393 | 4.995 | 4.995 |
| 82 | 5.104 | 5.104 | 4.716 | 4.716 |
| 83 | 4.824 | 4.824 | 4.453 | 4.453 |
| 84 | 4.553 | 4.553 | 4.201 | 4.201 |
| 85 | 4.288 | 4.288 | 3.954 | 3.954 |
| 86 | 4.029 | 4.029 | 3.709 | 3.709 |
| 87 | 3.778 | 3.778 | 3.467 | 3.467 |
| 88 | 3.535 | 3.535 | 3.233 | 3.233 |
| 89 | 3.297 | 3.297 | 3.001 | 3.001 |
| 90 | 3.059 | 3.059 | 2.765 | 2.765 |
| 91 | 2.818 | 2.818 | 2.523 | 2.523 |
| 92 | 2.580 | 2.580 | 2.280 | 2.280 |
| 93 | 2.354 | 2.354 | 2.046 | 2.046 |
| 94 | 2.132 | 2.132 | 1.825 | 1.825 |
| 95 | 1.900 | 1.900 | 1.613 | 1.613 |
| 95 | 1.655 | 1.655 | 1.409 | 1.409 |
| 97 | 1.405 | 1.405 | 1.214 | 1.214 |
| 98 | 1.161 | 1.161 | 1.030 | 1.030 |
| 99 | 0.941 | 0.941 | 0.864 | 0.864 |
| 100 | 0.758 | 0.758 | 0.720 | 0.720 |
| 101 | 0.612 | 0.612 | 0.599 | 0.599 |
| EXPECTATION OF LIFE (ex)—FEMALES. | ||||
|---|---|---|---|---|
| (Expectation of life or average after-life time in New Zealand at each year of age.) | ||||
| 0 | 58.087 | 59.952 | 60.549 | 61.764 |
| 1 | 61.988 | 63.567 | 63.967 | 64.816 |
| 2 | 61.977 | 63.332 | 63.714 | 64.503 |
| 3 | 61.438 | 62.656 | 63.058 | 63.843 |
| 4 | 60.768 | 61.903 | 62.323 | 63.053 |
| 5 | 60.033 | 61.094 | 61.528 | 62.211 |
| 6 | 59.253 | 60.250 | 60.689 | 61.350 |
| 7 | 58.433 | 59.385 | 59.825 | 60.465 |
| 8 | 57.588 | 58.503 | 58.944 | 59.576 |
| 9 | 56.714 | 57.604 | 58.043 | 58.672 |
| 10 | 55.822 | 56.694 | 57.131 | 57.754 |
| 11 | 54.922 | 55.781 | 56.213 | 56.834 |
| 12 | 54.019 | 54.868 | 55.295 | 55.913 |
| 13 | 53.118 | 53.959 | 54.379 | 54.994 |
| 14 | 52.224 | 53.057 | 53.468 | 54.079 |
| 15 | 51.346 | 52.168 | 52.567 | 53.172 |
| 16 | 50.486 | 51.294 | 51.679 | 52.273 |
| 17 | 49.644 | 50.434 | 50.803 | 51.385 |
| 18 | 48.816 | 49.585 | 49.939 | 50.505 |
| 19 | 47.997 | 48.744 | 49.082 | 49.634 |
| 20 | 47.185 | 47.908 | 48.234 | 48.770 |
| 21 | 46.378 | 47.077 | 47.394 | 47.914 |
| 22 | 45.577 | 46.250 | 46.561 | 47.067 |
| 23 | 44.781 | 45.426 | 45.733 | 46.226 |
| 24 | 43.990 | 44.606 | 44.912 | 45.391 |
| 25 | 43.206 | 43.787 | 44.097 | 44.562 |
| 26 | 42.426 | 42.971 | 43.287 | 43.740 |
| 27 | 41.651 | 42.156 | 42.480 | 42.922 |
| 28 | 40.879 | 41.343 | 41.674 | 42.107 |
| 29 | 40.107 | 40.531 | 40.867 | 41.292 |
| 30 | 39.333 | 39.719 | 40.055 | 40.477 |
| 31 | 38.557 | 38.909 | 39.239 | 39.659 |
| 32 | 37.778 | 38.100 | 38.419 | 38.841 |
| 33 | 36.999 | 37.293 | 37.597 | 38.023 |
| 34 | 36.221 | 36.488 | 36.778 | 37.207 |
| 35 | 35.445 | 35.688 | 35.963 | 36.396 |
| 36 | 34.670 | 34.891 | 35.154 | 35.588 |
| 37 | 33.897 | 34.097 | 34.349 | 34.784 |
| 38 | 33.125 | 33.306 | 33.548 | 33.981 |
| 39 | 32.351 | 32.516 | 32.749 | 33.177 |
| 40 | 31.575 | 31.725 | 31.950 | 32.368 |
| 41 | 30.797 | 30.934 | 31.153 | 31.555 |
| 42 | 30.016 | 30.142 | 30.356 | 30.739 |
| 43 | 29.235 | 29.353 | 29.560 | 29.923 |
| 44 | 28.454 | 28.566 | 28.762 | 29.107 |
| 45 | 27.675 | 27.783 | 27.964 | 28.294 |
| 46 | 26.897 | 27.003 | 27.163 | 27.485 |
| 47 | 26.122 | 26.228 | 26.363 | 26.680 |
| 48 | 25.350 | 25.458 | 25.567 | 25.880 |
| 49 | 24.582 | 24.690 | 24.777 | 25.085 |
| 50 | 23.819 | 23.925 | 23.997 | 24.295 |
| 51 | 23.061 | 23.163 | 23.226 | 23.511 |
| 52 | 22.309 | 22.404 | 22.465 | 22.734 |
| 53 | 21.563 | 21.650 | 21.713 | 21.963 |
| 54 | 20.824 | 20.900 | 20.968 | 21.200 |
| 55 | 20.091 | 20.153 | 20.228 | 20.443 |
| 56 | 19.365 | 19.412 | 19.494 | 19.694 |
| 57 | 18.647 | 18.677 | 18.767 | 18.953 |
| 58 | 17.938 | 17.952 | 18.048 | 18.220 |
| 59 | 17.240 | 17.240 | 17.339 | 17.494 |
| 60 | 16.552 | 16.544 | 16.641 | 16.774 |
| 61 | 15.875 | 15.864 | 15.954 | 16.061 |
| 62 | 15.211 | 15.200 | 15.278 | 15.357 |
| 63 | 14.559 | 14.551 | 14.615 | 14.666 |
| 64 | 13.920 | 13.915 | 13.963 | 13.990 |
| 65 | 13.293 | 13.291 | 13.321 | 13.331 |
| 66 | 12.679 | 12.678 | 12.689 | 12.689 |
| 67 | 12.078 | 12.078 | 12.070 | 12.067 |
| 68 | 11.493 | 11.493 | 11.467 | 11.463 |
| 69 | 10.923 | 10.923 | 10.881 | 10.878 |
| 70 | 10.368 | 10.368 | 10.312 | 10.311 |
| 71 | 9.828 | 9.828 | 9.762 | 9.762 |
| 72 | 9.305 | 9.305 | 9.231 | 9.231 |
| 73 | 8.801 | 8.801 | 8.722 | 8.722 |
| 74 | 8.319 | 8.319 | 8.237 | 8.237 |
| 75 | 7.860 | 7.860 | 7.777 | 7.777 |
| 76 | 7.424 | 7.424 | 7.341 | 7.341 |
| 77 | 7.011 | 7.011 | 6.929 | 6.929 |
| 78 | 6.618 | 66.18 | 6.539 | 6.539 |
| 79 | 6.242 | 6.242 | 6.168 | 6.168 |
| 80 | 5.881 | 5.881 | 5.815 | 5.815 |
| 81 | 5.533 | 5.533 | 5.478 | 5.478 |
| 82 | 5.199 | 5.199 | 5.156 | 5.156 |
| 83 | 4.880 | 4.880 | 4.848 | 4.848 |
| 84 | 4.578 | 4.578 | 4.552 | 4.552 |
| 85 | 4.293 | 4.293 | 4.262 | 4.262 |
| 86 | 4.025 | 4.025 | 3.976 | 3.976 |
| 87 | 3.772 | 3.772 | 3.697 | 3.697 |
| 88 | 3.534 | 3.534 | 3.428 | 3.428 |
| 89 | 3.297 | 3.297 | 3.165 | 3.165 |
| 90 | 3.050 | 3.050 | 2.900 | 2.900 |
| 91 | 2.789 | 2.789 | 2.632 | 2.632 |
| 92 | 2.520 | 2.520 | 2.366 | 2.366 |
| 93 | 2.258 | 2.258 | 2.113 | 2.113 |
| 94 | 2.009 | 2.009 | 1.876 | 1.876 |
| 95 | 1.760 | 1.766 | 1.650 | 1.650 |
| 96 | 1.531 | 1.531 | 1.436 | 1.436 |
| 97 | 1.305 | 1.305 | 1.232 | 1.232 |
| 98 | 1.091 | 1.091 | 1.042 | 1.042 |
| 99 | 0.900 | 0.900 | 0.871 | 0.871 |
| 100 | 0.738 | 0.738 | 0.723 | 0.723 |
| 101 | 0.605 | 0.605 | 0.600 | 0.600 |
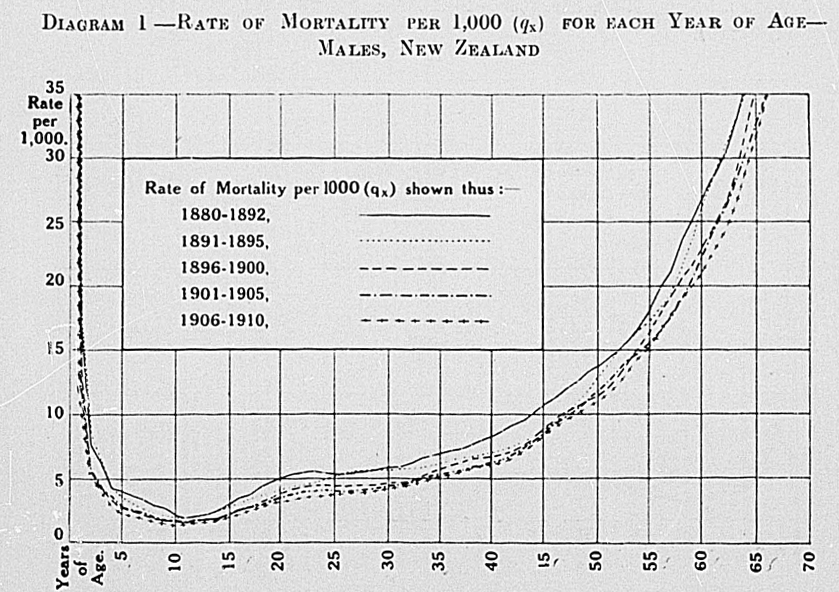
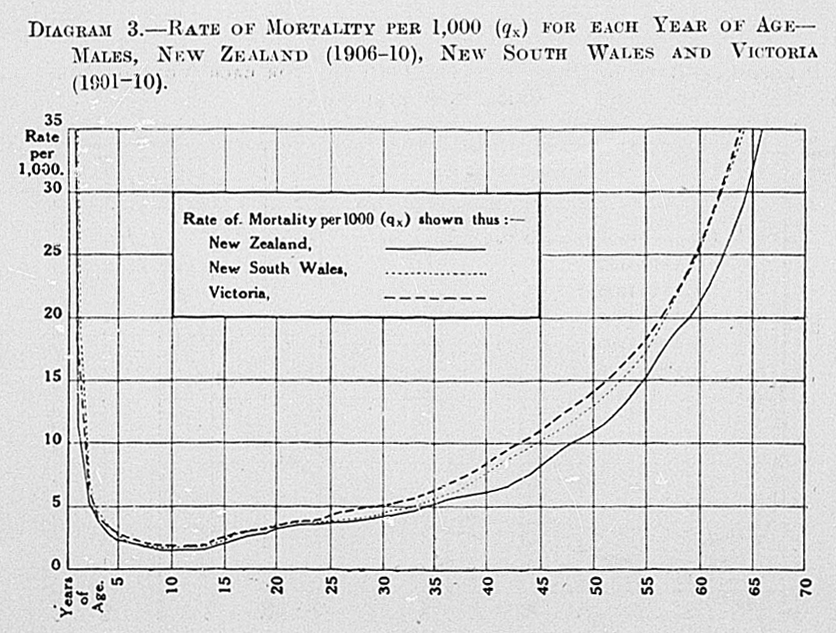
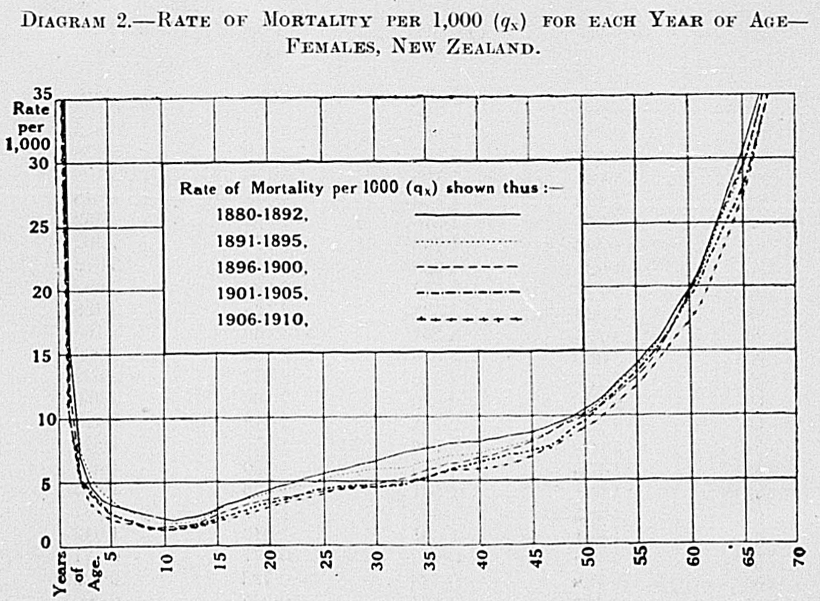
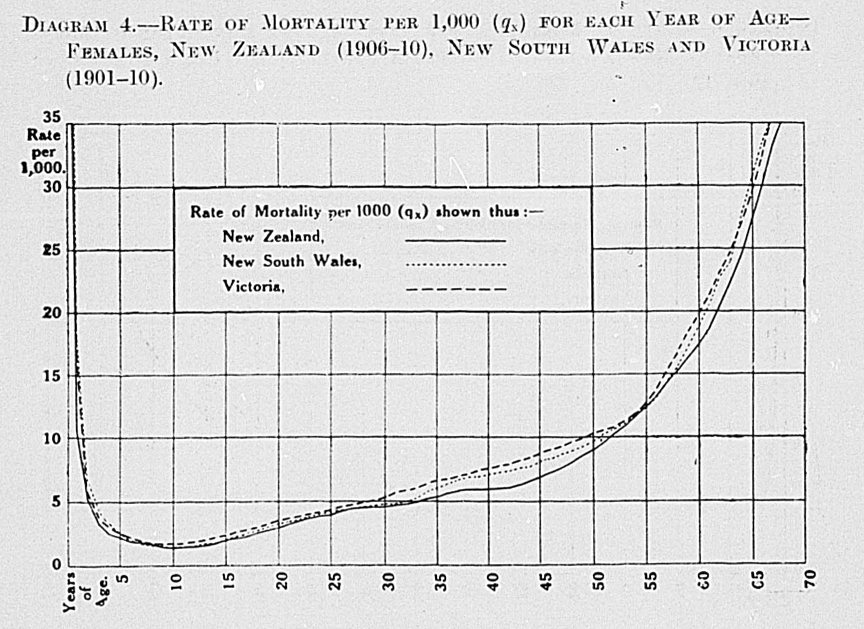
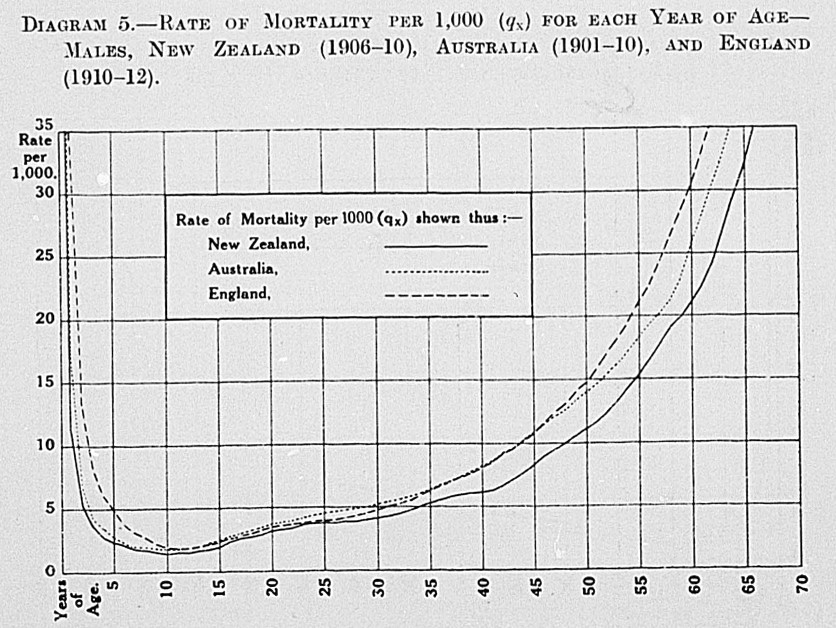
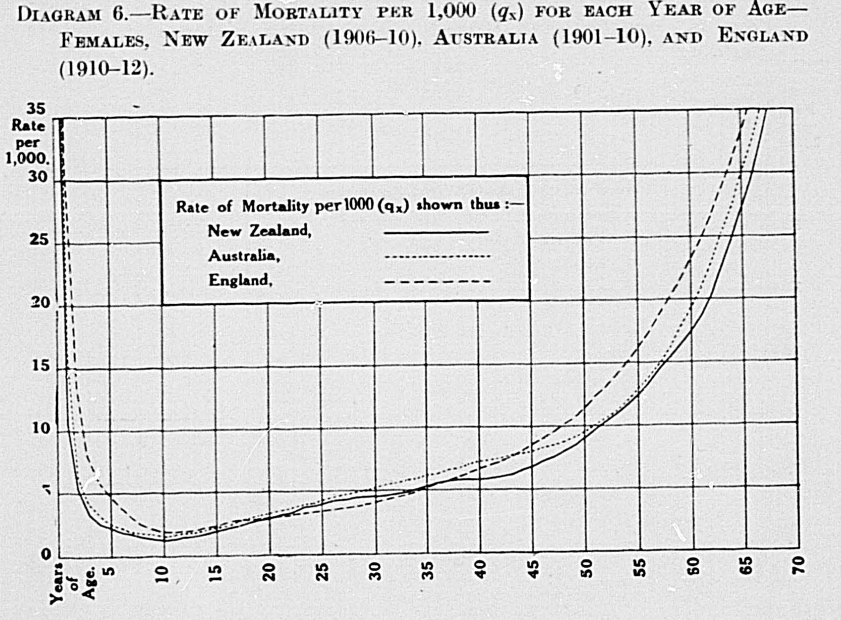
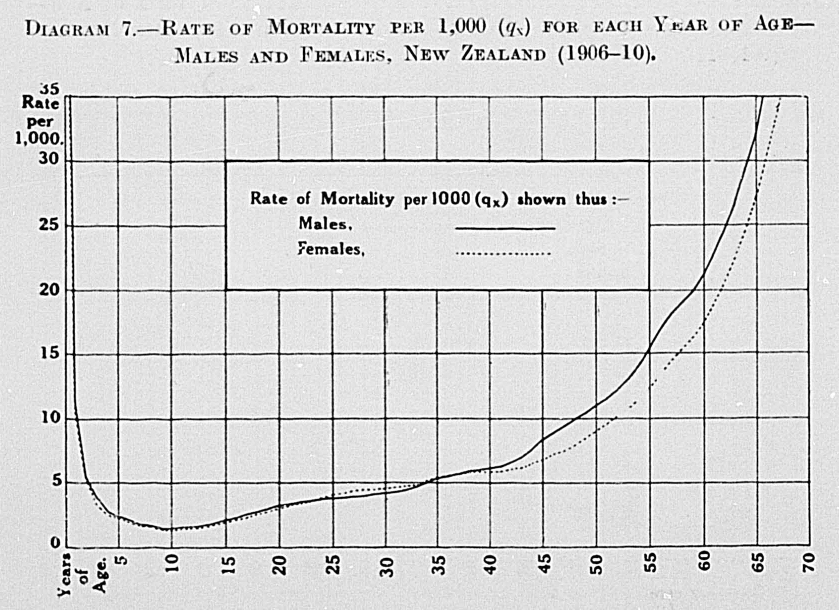
Death-rates are of great value as indicating the relative healthiness of different countries, or for different years. The statistics of causes of registered deaths are of further use as showing the incidence of fatal diseases or accidents, and as indicating in a general way the relative rise or fall of diseases over a series of years. For instance, the fall in the incidence of tuberculosis and the increase in cancer (discussed in Subsection C of this section) can be readily traced from the records of deaths attributed to these causes in different years.
In comparisons of healthiness based on death-rates, however, the effect of the advance of medical science in recent years is not taken into account. It is common knowledge that many diseases regarded a few decades age as incurable now give a fair percentage of recoveries. Similarly the death-rates in epidemics are now much lower than formerly, owing partly to the steps taken to prevent the spread of the disease, partly to the necessity of early notification in most countries, and partly to increased medical knowledge. Again, many diseases seldom or never result fatally.
Of recent years much attention has been devoted in different countries to the possibility or otherwise of obtaining reliable statistics of sickness. In certain of the American States an attempt has been made to obtain from medical men returns of all patients dealt with, giving the nature and duration of illness. It is too early to state whether good results have been obtained. In Russia, also, there has been inaugurated a system of notification of cases of sickness.
In New Zealand certain infectious diseases are notifiable, but beyond this the only record of sickness other than fatal is that ascertainable from the returns of discharges from public hospitals. In the absence of full statistics of sickness, however, the information obtained from the two sources mentioned is of considerable use, covering as it does some 35,000 cases in the year 1914, and giving a fair indication of the prevalence of the more important diseases.
The diseases declared to be infectious diseases in the meaning of the Public Health Act, and consequently notifiable, are,—
* Including cerebro-spinal fever, cerebral typhus, petechial fever, malignant purpuric fever. † Including milk-fever, sapræmia, acute sepsis, septicæmia. | |
|---|---|
| Enteric fever. | Septicæmia. |
| Typhus fever. | Actinomycosis. |
| Smallpox. | Beriberi. |
| Scarlet fever, scarlatina | Tuberculosis. |
| Diphtheria. | Cerebro-spinal meningitis.* |
| Cholera. | Polio-myelitis. |
| Plague. | Hydatids. |
| Leprosy. | Puerperal fever.† |
| Chicken-pox. | |
During the year 1914 a total of 6,033 cases of infectious disease were notified to the Public Health Department, scarlet fever taking first place with 1,506. The figures are as follows:—
| Health District. | |||||
|---|---|---|---|---|---|
| Disease. | Auckland | Wellington, Hawke's Bay, Nelson, and Marlborough. | Canterbury and Westland. | Otago and Southland. | Totals. |
| Enteric fever | 537 | 269 | 34 | 19 | 859 |
| Smallpox | 63 | .. | .. | .. | 63 |
| Scarlet fever | 109 | 536 | 521 | 340 | 1,506 |
| Diphtheria | 379 | 350 | 255 | 111 | 1,095 |
| Chicken-pox | 513 | 370 | 147 | 93 | 1,123 |
| Septicemia (including puerperal) | 65 | 55 | 16 | 26 | 162 |
| Tuberculosis | 245 | 307 | 235 | 170 | 957 |
| Polio-myelitis, cerebro-spinal meningitis | 14 | 37 | 83 | 134 | 268 |
| Infantile paralysis. | |||||
| Totals | 1,925 | 1,924 | 1,291 | 893 | 6,033 |
The corresponding totals for 1913 for the first seven of the diseases mentioned were,—
| Enteric fever | 863 |
| Smallpox | 470 |
| Scarlet fever | 1,614 |
| Diphtheria | 747 |
| Chicken-pox | 1,137 |
| Septicæmia | 118 |
| Tuberculosis | 1,018 |
| Totals | 5,967 |
The whole of the smallpox cases reported in 1913 and 1914 were in the Auckland Health District. A large percentage of the chicken-pox cases were also in the Auckland District. Diphtheria appears to he much less prevalent in Otago than in the more northern portions of the Dominion, and enteric fever is practically confined to the North Island. It is interesting to note the seasonal incidence of the various notifiable infectious diseases. A table has been compiled showing the number of cases reported during each month of 1914:—
| Month. | Enteric Fever. | Small-pox. | Scarlet Fever. | Diphtheria. | Chicken-pox. | Septicæmia (including Puerperal) | Tuberculosis. | Poliomyelitis, &c. |
|---|---|---|---|---|---|---|---|---|
| January | 83 | 47 | 85 | 57 | 49 | 17 | 80 | 13 |
| February | 96 | 3 | 82 | 46 | 27 | 11 | 75 | 39 |
| March | 105 | 11 | 119 | 83 | 83 | 7 | 89 | 81 |
| April | 74 | 1 | 137 | 99 | 80 | 11 | 66 | 52 |
| May | 67 | 132 | 124 | 93 | 24 | 63 | 26 | |
| June | 50 | 175 | 165 | 93 | 20 | 88 | 13 | |
| July | 60 | 110 | 124 | 125 | 12 | 73 | 3 | |
| August | 94 | 124 | 80 | 153 | 17 | 79 | 8 | |
| September | 70 | 1 | 153 | 104 | 118 | 11 | 77 | 9 |
| October | 71 | 149 | 62 | 101 | 12 | 102 | 9 | |
| November | 50 | 137 | 70 | 101 | 9 | 75 | 9 | |
| December | 39 | 103 | 81 | 100 | 11 | 90 | 6 | |
| Totals | 859 | 63 | 1,506 | 1,095 | 1,123 | 162 | 957 | 268 |
The total admissions to public hospitals in New Zealand during 1914 numbered 28,908. There were 2,220 patients in hospital at the beginning of the year, the total cases dealt with during the year being thus 31,128, equal to 273 per 10,000 of mean population, including Maoris. The total number of persons treated is somewhat less than the number of cases, each admission being counted a separate case.
Of the 31,128 cases. 19,366 were discharged as recovered, including a number of tuberculosis cases in which the patient was described as able to work or as having had the disease arrested. In 6,132 cases the patient was discharged relieved, and in 965 cases as unrelieved. Deaths in hospital numbered 2,284, or 7.34 per cent. of cases dealt with. The number of deaths in hospital is equal to 22 per cent. of the total deaths registered in 1914, including Maoris. The figures of admissions, discharges, and deaths for each of the public hospitals of the Dominion, other than St. Helens Maternity Homes, are given in the table following, together with the numbers of patients in hospital at the beginning and end of the year. There are 63 public general hospitals, 4 fever or infectious-diseases hospitals, and 5 sanatoria for consumptives.
| PUBLIC HOSPITALS.—ADMISSIONS, DISCHARGES, ETC., 1914. | |||||||
|---|---|---|---|---|---|---|---|
| Discharges during 1914. | |||||||
| Hospital. | Patients remaining on 1st January, 1914. | Admissions during 1914. | Recovered. | Believed. | Unrelieved. | Deaths in Hospital during 1914. | Patients remaining on 31st. December, 1914. |
| Mangonui | 9 | 76 | 60 | 14 | .. | 5 | 6 |
| Bay of Islands | 4 | 72 | 63 | 4 | .. | 5 | 4 |
| Hokianga | 9 | 98 | 67 | 17 | 2 | 8 | 13 |
| Northern Wairoa | 7 | 171 | 117 | 29 | 2 | 14 | 16 |
| Whangarei | 25 | 504 | 365 | 103 | 4 | 32 | 25 |
| Auckland | 253 | 3,621 | 1,737 | 1,424 | 109 | 338 | 266 |
| Waikato | 93 | 1,170 | 918 | 136 | 41 | 64 | 104 |
| Cambridge Sanatorium | 44 | 122 | 46 | 44 | 19 | 9 | 48 |
| Taumarunui | 12 | 132 | 115 | 20 | 1 | 4 | 4 |
| Waihi | 33 | 387 | 289 | 69 | .. | 26 | 36 |
| Thames | 29 | 642 | 500 | 81 | 4 | 44 | 42 |
| Coromandel | 9 | 83 | 41 | 33 | 1 | 6 | 11 |
| Mercury Bay | 4 | 81 | 60 | 14 | 2 | 7 | 2 |
| Waiapu | 7 | 53 | 53 | 3 | .. | 1 | 3 |
| Cook | 53 | 625 | 483 | 82 | 13 | 42 | 58 |
| Wairoa | 4 | 196 | 132 | 45 | 7 | 9 | 7 |
| Napier | 112 | 3,016 | 775 | 124 | 3 | 107 | 119 |
| Waipawa | 20 | 319 | 209 | 73 | 7 | 21 | 29 |
| Dannevirke | 22 | 276 | 217 | 33 | 9 | 16 | 23 |
| Taranaki | 56 | 580 | 461 | 69 | 11 | 45 | 50 |
| Stratford | 8 | 217 | 153 | 45 | 1 | 12 | 14 |
| Hawera | 19 | 287 | 206 | 54 | 1 | 23 | 22 |
| Patea | 6 | 168 | 144 | 8 | .. | 12 | 10 |
| Wanganui | 54 | 918 | 749 | 59 | 30 | 56 | 78 |
| Taihape | 9 | 169 | 100 | 52 | 5 | 11 | 10 |
| Palmerston North | 46 | 856 | 705 | 72 | 32 | 50 | 43 |
| Pahiatua | 6 | 103 | 68 | 28 | .. | 9 | 4 |
| Masterton | 20 | 341 | 193 | 119 | 13 | 15 | 21 |
| South Wairarapa | 30 | 154 | 129 | 18 | 6 | 14 | 17 |
| Wellington | 288 | 3,812 | 3,352 | 108 | 81 | 280 | 279 |
| Otaki | 8 | 153 | 106 | 14 | 15 | 16 | 10 |
| Otaki Sanatorium | 24 | 72 | 38 | 19 | 14 | .. | 25 |
| Wairau | 12 | 298 | 228 | 27 | 13 | 15 | 27 |
| Havelock | .. | 24 | 18 | 4 | 1 | .. | 1 |
| Picton | 13 | 161 | 136 | 17 | 3 | 6 | 12 |
| Nelson | 57 | 511 | 323 | 114 | 38 | 51 | 42 |
| Buller | 22 | 208 | 151 | 26 | 3 | 35 | 15 |
| Reefton | 28 | 138 | 84 | 35 | 5 | 14 | 28 |
| Denniston | 1 | 37 | 29 | 5 | .. | 1 | 3 |
| Grey River | 58 | 467 | 347 | 56 | 18 | 63 | 41 |
| Westland | 34 | 137 | 89 | 21 | 2 | 24 | 35 |
| Otira | .. | 45 | 41 | 4 | .. | .. | .. |
| Kumara | 24 | 66 | 30 | 15 | 3 | 10 | 32 |
| Totara | 11 | 33 | 21 | 9 | 1 | 2 | 11 |
| Kaikoura | 1 | 38 | 20 | 15 | 1 | 1 | 2 |
| Christchurch | 184 | 3,035 | 1,545 | 1,053 | 200 | 235 | 186 |
| Lyttelton Casualty Ward | .. | 23 | .. | 19 | .. | 4 | .. |
| Bottle Lake Fever Hospital | 6 | 186 | 159 | 3 | .. | 4 | 26 |
| Cashmere Hills Sanatorium | 53 | 60 | 38 | 15 | 9 | 1 | 50 |
| Coronation Hospital for Consumptives | .. | 67 | 1 | 15 | 4 | 15 | 32 |
| Akaroa | 1 | 25 | 11 | 13 | 2 | .. | .. |
| Ashburton | 11 | 268 | 127 | 98 | 7 | 31 | 16 |
| Timaru | 65 | 630 | 390 | 184 | 19 | 52 | 50 |
| Timaru Infectious Diseases | 5 | 70 | 69 | .. | .. | 3 | 3 |
| Waimate | 4 | 146 | 115 | 16 | 2 | 8 | 9 |
| Oamaru | 8 | 230 | 143 | 49 | 8 | 25 | 13 |
| Palmerston Sanatorium | 41 | 83 | 35 | 30 | 18 | 3 | 38 |
| Port Chalmers | .. | 8 | 5 | 2 | .. | 1 | .. |
| Logan Pt. Fever Hospital | 2 | 62 | 51 | .. | .. | .. | 13 |
| Dunedin | 136 | 2,624 | 1,403 | 815 | 122 | 239 | 181 |
| Tuapeka | 5 | 85 | 65 | 8 | .. | 9 | 8 |
| Kaitangata | .. | 36 | 10 | 26 | .. | .. | .. |
| Tapanui | 2 | 63 | 44 | 17 | .. | 2 | 2 |
| Maniototo | 5 | 101 | 60 | 35 | 1 | 4 | 6 |
| Dunstan | 2 | 49 | 30 | 17 | 1 | .. | 3 |
| Cromwell | .. | 50 | 31 | 13 | 2 | 3 | 1 |
| Arrow | 5 | 60 | 31 | 20 | 1 | 10 | 3 |
| Wakatipu | 2 | 40 | 20 | 9 | 1 | 6 | 6 |
| Gore | 11 | 204 | 160 | 25 | 7 | 8 | 15 |
| Southland | 62 | 802 | 449 | 240 | 40 | 79 | 56 |
| Kew Infectious Diseases | 8 | 15 | 23 | .. | .. | .. | .. |
| Wallace and Fiord | 18 | 240 | 183 | 49 | .. | 19 | 16 |
| Totals | 2,220 | 28,908 | 19,366 | 6,132 | 965 | 2,284 | 2,381 |
The ages of patients discharged from or dying in public hospitals during 1913 and 1914 are as shown in the following summary:—
| PUBLIC HOSPITALS.—AGES OF PATIENTS DISCHARGED OR DYING. | ||||||
|---|---|---|---|---|---|---|
| Ages of Patients in Years. | 1913. | 1914. | ||||
| Males. | Females. | Total. | Males. | Females. | Total. | |
| Under 5 | 1,396 | 863 | 2,259 | 1,466 | 1,012 | 2,478 |
| 5 and under 10 | 1,159 | 953 | 2,112 | 1,404 | 1,153 | 2,557 |
| 10 “ 15 | 840 | 727 | 1,567 | 1,044 | 814 | 1,858 |
| 15 “ 25 | 2,580 | 2,130 | 4,710 | 2,956 | 2,291 | 5,247 |
| 25 “ 35 | 2,793 | 2,203 | 4,996 | 3,200 | 2,662 | 5,862 |
| 35 “ 45 | 2,162 | 1,354 | 3,516 | 2,267 | 1,578 | 3,845 |
| 45 “ 55 | 1,356 | 742 | 2,098 | 1,607 | 853 | 2,460 |
| 55 “ 65 | 1,207 | 441 | 1,648 | 1,220 | 478 | 1,698 |
| 65 and over | 1,834 | 466 | 2,300 | 1,920 | 529 | 2,449 |
| Unspecified | 44 | 32 | 76 | 172 | 121 | 293 |
| Totals | 15,371 | 9,911 | 25,282 | 17,256 | 11,491 | 28,747 |
The Bertillon system of classification of diseases and causes of death divides such into fourteen well-defined classes, which are further subdivided into 189 orders. The table following shows that Class I, “General diseases,” is first on the list as regards both discharges and deaths. Diseases of the digestive system come next in point of numbers, but the death-rate is low. Violence comes third on the list, and here again the death-rate is low, owing to the preponderance of simple fractures, cuts, bruises, &c.
| PUBLIC HOSPITALS.—CLASSIFICATION OF DISEASES, 1914. | ||||||||
|---|---|---|---|---|---|---|---|---|
| Class. | Discharges. | Deaths. | Total Discharges and Deaths. | |||||
| Recovered. | Relieved. | Unrelieved. | Males. | Females. | Males. | Females. | ||
| I. General diseases | 3,503 | 1,619 | 357 | 487 | 279 | 3,659 | 2,586 | |
| II. Diseases of the nervous system and of the organs of special sense | 821 | 777 | 206 | 122 | 72 | 1,255 | 743 | |
| III. Diseases of the circulatory system | 778 | 474 | 36 | 234 | 72 | 1,128 | 466 | |
| IV. Diseases of the respiratory system | 2,702 | 493 | 24 | 154 | 71 | 2,078 | 1,366 | |
| V. Diseases of the digestive system | 4,003 | 708 | 80 | 152 | 89 | 2,907 | 2,125 | |
| VI. Diseases of the genitourinary system and annexa | 1,781 | 621 | 87 | 117 | 44 | 913 | 1,737 | |
| VII. Puerperal condition | 743 | 99 | 28 | .. | 31 | .. | 896 | |
| VIII. Diseases of the skin and of the cellular tissue | 831 | 245 | 12 | 11 | 8 | 723 | 384 | |
| IX. Diseases of the organs of locomotion | 591 | 310 | 12 | 12 | 7 | 652 | 280 | |
| X. Malformations | 206 | 45 | 9 | 10 | 2 | 232 | 40 | |
| XI. Infancy | 44 | 6 | .. | 21 | 12 | 50 | 33 | |
| XII. Old age | 22 | 85 | 33 | 63 | 13 | 164 | 52 | |
| XIII. Violence | 3,071 | 547 | 39 | 131 | 29 | 3,216 | 601 | |
| XIV. Ill-defined causes | 270 | 103 | 47 | 25 | 16 | 279 | 182 | |
| Totals | 19,366 | 6,132 | 965 | 1,539 | 745 | 17,256 | 11,491 | |
More detailed information concerning certain of the principal diseases and groups of diseases is given in the following pages. The Statistics of the Dominion of New Zealand (Volume I) contain detailed information for each hospital.
The first diseases in the Bertillon classification are the “General diseases.” the first nineteen orders of which cover epidemic diseases. The principal epidemic general diseases dealt with in public hospitals are scarlet fever and diphtheria. There are four special hospitals for the treatment of these and similar infectious diseases, all situated in the South Island. Several hospitals have fever wings attached.
A table of the epidemic general diseases dealt with in public hospitals during 1914 is given. The figures in this and following tables throughout this subsection deal with the discharges and deaths only, and not with patients remaining in hospital at the end of the year, who will be included in the figures for 1915 or such other year of discharge or death.
| EPIDEMIC GENERAL DISEASES, 1914. | |||||||
|---|---|---|---|---|---|---|---|
| Discharges. | Deaths. | Total Discharges and Deaths. | |||||
| Disease. | Recovered. | Relieved. | Unrelieved. | Males. | Females. | Males. | Females. |
| Typhoid fever | 325 | 22 | 4 | 31 | 12 | 253 | 141 |
| Malaria | 9 | 5 | .. | .. | .. | 12 | 2 |
| Measles | 154 | 7 | 1 | 2 | 1 | 115 | 50 |
| Scarlet fever | 680 | 17 | 6 | 7 | 6 | 326 | 390 |
| Whooping-cough | 24 | 6 | 1 | 3 | 2 | 17 | 19 |
| Diphtheria | 575 | 14 | 5 | 22 | 17 | 290 | 343 |
| Croup | 3 | .. | .. | .. | .. | 2 | 1 |
| Influenza | 212 | 21 | .. | 4 | .. | 170 | 67 |
| Dysentery | 19 | 3 | .. | 1 | .. | 20 | 3 |
| Erysipelas | 58 | 5 | 1 | 4 | 2 | 39 | 31 |
| Chicken-pox | 13 | .. | .. | .. | .. | 8 | 5 |
| Mumps | 2 | 1 | .. | .. | .. | 2 | 1 |
| Varicella | 7 | .. | .. | .. | .. | 4 | 3 |
| Rotheln | 1 | .. | .. | .. | .. | .. | 1 |
| Totals | 2,082 | 101 | 18 | 74 | 40 | 1,258 | 1,057 |
The rate of mortality over the whole group was very low, slightly under 5 per cent. Typhoid fever caused more deaths than diphtheria, and considerably more than scarlet fever.
Tuberculosis occupies eight orders in the classification of diseases, but is usually divided into two groups—viz., pulmonary tuberculosis and other forms of tuberculosis. In the following table an attempt has been made to show in detail the part of the body affected. Pulmonary tuberculosis, with which is included tuberculosis (undefined) and acute miliary tuberculosis, comprises nearly 66 per cent. of the total of 1,475 cases of tubercular diseases, and more than 76 per cent. of the deaths.
| TUBERCULOSIS CASES IN HOSPITALS. 1914. | |||||||
|---|---|---|---|---|---|---|---|
| From of Tuberculosis. | Discharges. | Deaths. | Total Discharges and Deaths. | ||||
| Recovered. | Relieved. | Unrelieved. | Males. | Females | Males. | Females | |
| Tuberculosis of lungs | 206 | 428 | 142 | 126 | 62 | 549 | 415 |
| Acute miliary tuberculosis | .. | .. | .. | 2 | 2 | 2 | 2 |
| Tubercular meningitis | .. | 2 | .. | 15 | 13 | 17 | 13 |
| Abdominal tuberculosis | 20 | 24 | 6 | 2 | 8 | 23 | 37 |
| Tuberculosis of the spine | 1 | 12 | 2 | 3 | 1 | 11 | 8 |
| Spinal caries | 2 | 8 | 2 | .. | 2 | 9 | 5 |
| Pott's disease | 5 | 8 | 2 | 1 | .. | 3 | 13 |
| Spinal abscess | 1 | 2 | .. | .. | .. | 2 | 1 |
| Lumbar abscess | 5 | 5 | .. | .. | .. | 7 | 3 |
| Psoas abscess | 5 | 2 | 1 | 1 | .. | 7 | 2 |
| Tuberculosis of hip | 20 | 44 | 6 | .. | 1 | 50 | 21 |
| ” knee | 8 | 14 | 1 | .. | .. | 15 | 8 |
| ” ankle | 4 | 7 | 1 | 1 | .. | 7 | 6 |
| ” shoulder | 1 | 2 | .. | .. | .. | 2 | 1 |
| ” elbow | 2 | 3 | .. | .. | .. | 3 | 2 |
| ” joints of hand | 6 | 2 | .. | .. | .. | 6 | 2 |
| ” foot | 7 | 1 | .. | .. | .. | 4 | 4 |
| Morbus coxarius | 3 | 4 | .. | .. | .. | 4 | 3 |
| Tuberculosis of eye | 1 | 1 | .. | .. | .. | 2 | .. |
| Tubercular pharyngitis | .. | .. | 1 | .. | .. | 1 | .. |
| Tuberculosis of breast | 1 | .. | .. | .. | .. | .. | 1 |
| ” bones | 8 | 9 | .. | .. | .. | 13 | 4 |
| ” kidneys | 10 | 15 | 1 | 3 | .. | 18 | 11 |
| ” glands | 48 | 36 | 4 | 1 | 1 | 37 | 53 |
| ” bladder | .. | 6 | .. | .. | .. | 4 | 2 |
| ” genital organs | 11 | 10 | .. | .. | .. | 17 | 4 |
| Tubercular abscess | 3 | 9 | .. | .. | .. | 11 | 1 |
| ” sinus | 2 | 6 | .. | .. | 1 | 7 | 2 |
| ” ulcers | .. | 4 | .. | .. | .. | 1 | 3 |
| Lupus | 1 | 7 | .. | .. | .. | 3 | 5 |
| Scrofula | 1 | 1 | .. | .. | .. | 2 | .. |
| Disseminated tuberculosis | 1 | .. | .. | 3 | 2 | 3 | 3 |
| Totals | 383 | 672 | 169 | 158 | 93 | 840 | 635 |
Five sanatoria for the treatment of tuberculosis cases are situated in suitable districts throughout the Dominion. The classification in use at these institutions is somewhat different to that of general hospitals as regards condition of patients on discharge. The actual classifications in use at the various sanatoria are,—
Cambridge: Much improved: improved; stationary.
Otaki: Able to work; relieved; unrelieved.
Cashmere Hills and Coronation Hospital. Christchurch: Disease arrested; much improved; improved: not improved.
Palmerston: Apparently cured: disease arrested: improved: unimproved.
The figures of recoveries given above include the first-mentioned class in each case (the first two for Palmerston). The last-mentioned corresponds to “unrelieved” in each case, and all other classifications rank as “relieved.”
The total number of discharges and deaths in which the disease was definitely shown to be venereal was 353, including 13 deaths. Syphilis was the disease assigned in 197 cases, and various forms of gonococcic infection in the remaining 156 cases. There is reason to believe that the totals given do not include all such cases dealt with in the public hospitals, incomplete classification on the return cards being probably responsible for a number of venereal cases being placed elsewhere in the tabulation. Again, the Medical Superintendent of a hospital, in stating the disease for which a patient is treated, is concerned not with the cause of the complaint, but rather with the actual facts of the case as they appear before him, so that most cases of diseases of syphilitic origin in which, for the time being at least, the venereal disease has ceased to be of primary importance are returned under the heading of the disease for which the patient is treated.
Of recent years cancer has come into great prominence amongst causes of death, now ranking in New Zealand second only to heart-disease in point of number of deaths. Information as to deaths and death-rates from cancer is given in Subsection C of this section.
The total number of deaths in public hospitals in 1914 where cancer was assigned as the cause was 258 (males 173, females 85). In addition 143 patients treated for cancer were discharged as recovered, 192 as relieved, and 97 as unrelieved. Very few of the recoveries were in cases of internal cancer, and but a small proportion of the deaths in cases of surface cancer. It is noticeable that with but six exceptions cancer of the mouth and its annexa was confined to males. A table is given showing the seat of the disease in all cases of discharge or death during 1914. In 59 cases the location cannot be given on account of the disease being returned merely as “cancer.” In a number of other similar cases the nature of the operation was the only means of enabling the seat of the disease to be allocated.
| CANCER CASES.—DISCHARGES FROMAND DEATHS IN PUBLIC HOSPITALS, 1914. | ||||||||
|---|---|---|---|---|---|---|---|---|
| Seat of Disease. | Discharges. | Deaths. | ||||||
| Recovered. | Relieved. | Unrelieved. | ||||||
| Males. | Females | Males. | Females | Males. | Females | Males. | Females | |
| Mouth | 2 | .. | 3 | .. | 1 | .. | 2 | .. |
| Jaw | 4 | .. | 8 | 1 | 4 | .. | 3 | .. |
| Lip | 22 | 2 | 20 | .. | 1 | .. | 4 | .. |
| Gum | .. | 1 | .. | .. | .. | .. | .. | .. |
| Tongue | 9 | 1 | 7 | .. | 3 | 1 | 9 | .. |
| Cheek | .. | .. | 3 | .. | 1 | .. | .. | .. |
| Palate | .. | .. | 2 | .. | .. | .. | 1 | .. |
| Tonsils | .. | .. | 1 | .. | .. | .. | 1 | .. |
| Pharynx | .. | .. | 1 | .. | 2 | .. | .. | .. |
| œsophagus | .. | .. | 2 | .. | 2 | .. | 9 | 1 |
| Stomach | 5 | .. | 12 | 4 | 11 | 3 | 37 | 12 |
| Pylorus | .. | .. | 2 | .. | 1 | 1 | 2 | 1 |
| Liver | 1 | 1 | 4 | 1 | 5 | 4 | 9 | 7 |
| Gill-bladder | 1 | .. | .. | 2 | .. | .. | 1 | .. |
| Bile-duct | .. | .. | .. | .. | .. | .. | 1 | 1 |
| Ventricule | .. | .. | .. | 1 | .. | .. | .. | .. |
| Duodenum | .. | .. | 2 | .. | .. | .. | .. | .. |
| Bowels | .. | .. | 4 | 1 | 1 | .. | 10 | 4 |
| Cæcum | .. | .. | 2 | 1 | 1 | .. | .. | .. |
| Colon | 1 | .. | 1 | 4 | 1 | .. | 1 | 1 |
| Sigmoid | .. | .. | .. | 2 | 1 | 1 | 3 | 1 |
| Rectum | 4 | .. | 7 | 4 | 5 | 1 | 3 | 4 |
| Ileum | .. | .. | .. | 1 | .. | 1 | .. | .. |
| Mesentery | .. | .. | 1 | .. | .. | .. | .. | 1 |
| Uterus | .. | 16 | .. | 6 | .. | 7 | .. | 12 |
| Neck of uterus | .. | 5 | .. | 10 | .. | 4 | .. | 6 |
| Ovary | .. | .. | .. | .. | .. | .. | .. | 3 |
| Breast | .. | 22 | .. | 13 | .. | 2 | .. | 7 |
| Ear | 2 | .. | 1 | .. | .. | .. | .. | .. |
| Nose | 1 | .. | 2 | .. | .. | .. | .. | 1 |
| Eye (rodent ulcer) | .. | .. | 1 | .. | .. | .. | .. | .. |
| Face | .. | 1 | 5 | 2 | .. | 1 | 4 | .. |
| Skin (undefined) | 6 | 4 | 6 | .. | .. | .. | 2 | .. |
| Eye (carcinoma) | .. | 1 | 1 | .. | .. | 1 | 1 | .. |
| Brain | .. | .. | .. | 1 | .. | .. | .. | 1 |
| Parotid | 1 | 1 | .. | .. | .. | .. | .. | .. |
| Neck | .. | .. | 5 | 2 | 1 | .. | 4 | 2 |
| Glands of neck | 4 | .. | 7 | 3 | 4 | .. | 1 | 1 |
| Throat | 1 | .. | 2 | .. | 1 | .. | 2 | .. |
| Larynx | .. | .. | .. | .. | .. | .. | 2 | .. |
| Lung | .. | .. | .. | .. | .. | .. | 1 | 2 |
| Thorax | .. | .. | .. | .. | .. | .. | 2 | .. |
| Shoulder | .. | 1 | .. | .. | .. | .. | .. | .. |
| Axilla | .. | .. | 2 | 1 | .. | .. | .. | .. |
| Forearm | 1 | .. | .. | .. | .. | .. | .. | .. |
| Hand | 1 | .. | .. | .. | .. | .. | .. | .. |
| Abdomen | 1 | .. | .. | .. | 1 | 1 | .. | .. |
| Pancreas | .. | .. | .. | .. | .. | 1 | 9 | 3 |
| Kidney | .. | .. | 2 | .. | 2 | 1 | 1 | 1 |
| Spleen | .. | .. | .. | .. | 1 | .. | .. | .. |
| Bladder | .. | .. | 1 | 2 | 2 | .. | 3 | .. |
| Prostate | .. | .. | .. | .. | 3 | .. | 9 | .. |
| Pelvis | .. | .. | 1 | 1 | 1 | .. | 1 | 2 |
| Male genitals | 1 | .. | .. | .. | 1 | .. | .. | .. |
| Thigh | .. | .. | .. | .. | 1 | .. | .. | 1 |
| Hip | 2 | .. | .. | .. | .. | .. | .. | .. |
| Leg | .. | 1 | .. | 1 | .. | .. | 1 | .. |
| Knee | 1 | .. | .. | .. | .. | .. | .. | .. |
| Tibia | .. | 1 | .. | .. | .. | .. | .. | .. |
| Joints of foot | .. | 1 | .. | .. | .. | .. | .. | .. |
| Unspecified | 4 | 9 | 4 | 6 | 3 | 1 | 24 | 8 |
| Totals | 75 | 68 | 122 | 70 | 66 | 31 | 173 | 85 |
The principal of the remaining general diseases are as follows:—
| Discharges | Total Discharges and Deaths. | |||||
|---|---|---|---|---|---|---|
| Disease. | Recovered | Relieved. | Unrelieved. | Deaths. | Males. | Females. |
| Non-puerperal septicæmia | 25 | 5 | .. | 28 | 29 | 29 |
| Tetanus | 6 | .. | .. | 4 | 9 | 1 |
| Rickets | 7 | 9 | .. | 1 | 9 | 8 |
| Non-malignant tumours | 121 | 31 | 11 | .. | 74 | 89 |
| Acute rheumatism | 198 | 96 | 4 | 7 | 198 | 107 |
| Chronic rheumatism and gout | 85 | 103 | 13 | 4 | 143 | 62 |
| Diabetes | 7 | 31 | 5 | 25 | 29 | 39 |
| Exophthalmic goitre | 19 | 31 | 3 | 11 | 11 | 53 |
| Leucæmia | .. | 9 | 3 | 8 | 16 | 4 |
| Anæmia and chlorosis | 44 | 54 | 2 | 15 | 40 | 75 |
| Alcoholism | 214 | 107 | 11 | 17 | 284 | 65 |
Diabetes, exophthalmic goitre, leucæmia, and pernicious anæmia are usually fatal, and if occurring in conjunction with practically any other disease must take precedence as the cause of death. Only 2 recoveries are recorded in the case of pernicious anæmia, the remaining 42 being due to other forms of anæmia. Thirteen of the 15 deaths from anæmia are due to the pernicious type of the disease.
The diseases of the nervous system, following the Bertillon classification, are as follows:—
| Disease. | Discharges. | Total Discharges and Dentils. | ||||
|---|---|---|---|---|---|---|
| Recovered. | Relieved. | Unrelieved. | Deaths. | Males. | Females. | |
| Abscess of brain | .. | 1 | .. | 13 | 11 | 3 |
| Meningitis | 16 | 1 | 1 | 43 | 41 | 20 |
| Locomotor ataxia | 10 | 11 | 9 | 2 | 33 | 2 |
| Other diseases of the spinal cord | 30 | 94 | 19 | 14 | 107 | 50 |
| Apoplexy, cerebral hæmorrhage | 12 | 19 | 2 | 52 | 61 | 24 |
| Paralysis, without specified cause | 37 | 69 | 15 | 41 | 111 | 51 |
| General paralysis of the insane | .. | 1 | 3 | 1 | 5 | .. |
| Other forms of mental alienation | 13 | 30 | 70 | 3 | 65 | 31 |
| Epilepsy | 30 | 59 | 13 | 5 | 79 | 28 |
| Convulsions | 15 | 10 | 1 | 6 | 3 | 29 |
| Convulsions of infants | 10 | 3 | 1 | 2 | 11 | 5 |
| Chorea | 16 | 8 | 1 | 1 | 9 | 17 |
| Neuralgia, neuritis | 99 | 104 | 7 | .. | 115 | 95 |
| Other nervous diseases | 112 | 114 | 34 | 10 | 132 | 138 |
| Totals | 400 | 527 | 176 | 193 | 783 | 513 |
This class shows a fairly high death-rate over the whole group, the rate, however, being greatly reduced by the inclusion of such minor complaints as neuralgia and neurasthenia, which represent a fair proportion of the total cases dealt with. Among the discharges it is noticed that the number of cases returned as recovered is considerably less than those classified as relieved or unrelieved.
The diseases included under “Other diseases of the spinal cord” are,—
| Discharges. | Deaths. | |
|---|---|---|
| Spinal scleros | 10 | 3 |
| Myelitis | 10 | 4 |
| Polio-myelitis | 54 | 3 |
| Syringo myelitis | 1 | .. |
| Haematoma-myelitis | 1 | .. |
| Congenital paralysis | 2 | .. |
| Infantile paralysis | 49 | 1 |
| Spinal paralysis | 4 | .. |
| Paralysis agitans | 1 | .. |
| Spastic paralysis | 5 | 1 |
| Landry's paralysis | 1 | 1 |
| Progressive muscular atrophy | 2 | 1 |
| Tabes dorsalis | 1 | .. |
| Charcot's disease | 2 | .. |
| Totals | 143 | 14 |
The large percentage of mental cases shown as unrelieved is due to the inclusion of a number of such cases being admitted to hospital for observation. It is not usual for mental patients to be treated in hospital for any length of time. Many mental patients are transferred from the public general hospitals to the mental hospitals.
The fact that 29 of the 32 patients treated for convulsions (other than of infants or of women in childbirth) were females leads to the conclusion that in a number of cases the treatment was for puerperal convulsions, but was not so returned on the discharge-cards.
Neurasthenia was the complaint in 182 of the 270 cases shown above for “Other nervous diseases.” Cerebral tumours accounted for 8 of the 10 deaths.
Eye troubles were responsible for admission to hospital in no fewer than 571 of the cases discharged from hospital during 1914. There were no deaths from these causes. A summary of the various diseases of the eyes dealt with may be of interest.
| DISEASES OFTHE EYES.—DISCHARGES FROM HOSPITAL, 1914. | ||||||||
|---|---|---|---|---|---|---|---|---|
| Disease. | Recovered. | Relieved. | Unrelieved. | Total. | ||||
| Males. | Females. | Males. | Females. | Males. | Females. | Males. | Females. | |
| Foreign body in eye | 36 | 6 | 7 | 2 | 3 | 1 | 46 | 9 |
| Strabismus | 7 | 11 | 3 | 6 | .. | .. | 10 | 17 |
| Keratitis | 3 | .. | 9 | 6 | 1 | 1 | 13 | 7 |
| Glaucoma | 15 | 5 | 10 | 9 | .. | 2 | 25 | 16 |
| Iritis | 17 | 2 | 14 | 8 | .. | .. | 31 | 10 |
| Corneal ulcer | 26 | 6 | 18 | 3 | 3 | .. | 47 | 9 |
| Cataract | 48 | 31 | 34 | 29 | 7 | 3 | 89 | 63 |
| Conjunctivitis | 51 | 5 | 16 | 5 | 1 | .. | 68 | 10 |
| Diplopia | .. | .. | 2 | .. | 1 | .. | 3 | .. |
| Pterygium | 3 | 1 | 2 | .. | .. | .. | 5 | 1 |
| Other diseases (including undefined) | 51 | 18 | 6 | 14 | 2 | 1 | 59 | 33 |
| Totals | 257 | 85 | 121 | 82 | 18 | 8 | 396 | 175 |
Injuries to the eyes, other than those due to the presence of some foreign body, are included in the “accident” class. There were 78 cases of injury to the eyes in 1914.
Diseases of the cars dealt with in hospital appear to be much fewer than eye-diseases. The total number in 1914 was 131, including otitis media 66, and otorrhœa 20. Only 1 death was recorded.
Organic diseases of the heart are the most important in this class, both as regards number of cases dealt with and in percentage of deaths. The deaths of 196 males and 49 females in hospital were due to heart-disease, while the returns show that 96 patients treated for various forms of organic heart-disease were discharged as recovered, 281 as relieved, and 20 as unrelieved. One hundred and forty-two patients were treated for varicose veins, 85 for varicose ulcers, 96 for varicocele, and 168 for hæmorrhoids, only 1 death resulting. Diseases of the glands and other diseases of the lymphatic system were returned in 246 cases, none of which were fatal.
Diseases of the circulatory system do not occupy a very prominent position in the statistics of hospital cases. Evidently in a high proportion of the large number of deaths registered, in which heart-disease is assigned as the cause, the general state of health has not been such as to cause admission to hospital.
In the classification of diseases adenoids rank as a disease of the respiratory system, while treatment of the tonsils is included under the digestive system. As, however, many children are admitted to hospital for the removal of tonsils and adenoids at the same time, it is well to discuss these two complaints together.
During 1914, adenoids alone was the cause shown in 425 cases, tonsils alone in 379 cases, while in 737 cases the treatment was for both tonsils and adenoids. Only 1 death was recorded. The medical inspection of school-children is responsible for the admission of a large proportion of these cases to public hospitals.
Bronchitis, broncho-pneumonia, and pneumonia represent a big proportion of the non-tuberculous diseases of the respiratory system. The figures for hospitals for 1914 are,—
| — | Discharges. | Deaths. | Totals. | |||
|---|---|---|---|---|---|---|
| Recovered. | Relieved. | Unrelieved. | Males. | Females. | ||
| Acute bronchitis | 98 | 14 | 1 | 7 | 77 | 43 |
| Chronic bronchitis | 190 | 139 | 1 | 37 | 245 | 122 |
| Broncho-pneumonia | 155 | 14 | 1 | 41 | 117 | 94 |
| Pneumonia | 565 | 42 | 1 | 102 | 493 | 217 |
| Totals | 1,008 | 209 | 4 | 187 | 932 | 476 |
Diseases of the respiratory system, not already enumerated, include,—
| Disease. | Cases. |
|---|---|
* Other than adenoids. | |
| Pleurisy | 252 |
| Empyema | 61 |
| Goitre | 55 |
| Laryngitis | 47 |
| Diseases of nose and nasal fossæ* | 203 |
| Asthma | 117 |
| Hæmoptysis | 20 |
| Hydatids of lungs | 21 |
| Other diseases | 98 |
| Total | 874 |
The principal diseases of the stomach were as follows:—
| Disease. | Cases. |
|---|---|
| Gastritis | 294 |
| Ulcer of stomach | 144 |
| Dyspepsia | 60 |
| Gastric catarrh | 26 |
| Hæmatemesis | 18 |
| Other diseases | 37 |
| Total | 579 |
Diseases of the œsophagus, numbering 31, are not included.
Ulcer of the stomach was fatal in 11 cases, gastritis in 2. hæmate-mesis in 2, and other diseases in 3
The total cases of diarrhœa and enteritis included in the returns were 434, including 54 deaths. Thirty-four of the deaths were of children under two years of age.
Appendicitis ranks high among hospital cases, but the death-rate is exceedingly low. During 1914 only 43 deaths occurred out of a total of 1,803 cases dealt with, representing a percentage of 2.38. Of the discharges, 1,607 were returned as recoveries, 138 as relieved, and 15 as unrelieved. The males dealt with numbered 977 and females 826.
Hernia cases included in the returns of discharges and deaths for 1914 numbered 729, including 16 deaths. Included in the total are 311 shown as inguinal hernia. 15 as umbilical hernia. 59 as ventral hernia, 37 as femoral hernia, and 307 as hernia undefined. Intussusception cases numbered 22, and intestinal obstruction, so defined, 66 cases, of which 31 were fatal.
Non-cancerous diseases of the liver were responsible for 28 deaths in hospital during 1914. Discharges of patients treated for liver-diseases numbered 261. Of the total discharges and deaths, 133 cases were attributed to gallstones (including 100 females), 28 to cirrhosis, 31 to jaundice. 43 to cholecystitis, and 47 to hydatids.
Diseases of the kidneys and other portions of the urinary system numbered 1,016; details are given in the following table:—
| DISEASES OFTHE URINARY SYSTEM. | ||||||
|---|---|---|---|---|---|---|
| Disease. | Discharges. | Deaths. | Total Discharges and Deaths. | |||
| Recovered. | Relieved. | Unrelieved. | Males. | Females. | ||
| Acute nephritis | 15 | 9 | .. | 9 | 22 | 11 |
| Bright's disease | 10 | 13 | 1 | 15 | 30 | 9 |
| Chronic nephritis | 30 | 38 | 2 | 29 | 64 | 35 |
| Uræmia | 5 | 1 | .. | 9 | 11 | 4 |
| Albuminuria | 5 | 7 | 2 | .. | 5 | 9 |
| Pyelitis | 42 | 28 | 1 | 2 | 10 | 63 |
| Hæmaturia | 15 | 11 | 2 | 2 | 26 | 4 |
| Movable kidney | 21 | 7 | 3 | .. | 5 | 26 |
| Pyelonephritis | 6 | 1 | .. | 2 | 1 | 8 |
| Pyonephrosis | 3 | 4 | 1 | 2 | 4 | 6 |
| Hydronephrosis | 3 | 2 | .. | .. | 2 | 3 |
| Abscess of kidney | 7 | 1 | .. | 2 | 8 | 2 |
| Other kidney diseases | 16 | 6 | 2 | 4 | 16 | 12 |
| Renal colic | 7 | 11 | 1 | .. | 15 | 4 |
| Renal stone | 16 | 28 | 3 | 3 | 40 | 10 |
| Stone in bladder or urethra | 12 | .. | .. | 1 | 12 | 1 |
| Retention of urine | 19 | 17 | 3 | 5 | 42 | 2 |
| Cystitis | 100 | 57 | 7 | 17 | 99 | 82 |
| Other diseases of bladder | 19 | 12 | 4 | 7 | 27 | 15 |
| Stricture of urethra | 67 | 57 | 2 | 6 | 117 | 15 |
| Enlargement of prostate | 63 | 46 | 5 | 25 | 139 | .. |
| Totals | 481 | 356 | 39 | 140 | 695 | 321 |
Non-venereal diseases of the male genital organs numbered 218, including orchitis 55, and hydrocele 54. Only 2 deaths in hospital were due to these causes.
Diseases of the female genital organs, other than cancer or those diseases shown to be venereal or puerperal, are an important group in hospital cases, though the death-rate is exceedingly low. The total cases passing through public hospitals in 1914 were 1,317, including only 19 deaths. The list is shown on the next page.
| DISEASES OF FEMALE GENITAL ORGANS. | |||||
|---|---|---|---|---|---|
| Disease. | Discharges. | Deaths. | Total Discharges and Deaths. | ||
| Recovered. | Relieved. | Unrelieved. | |||
| Uterine hæmorrhage | 61 | 14 | 2 | .. | 77 |
| Uterine tumour | 67 | 13 | 2 | 3 | 85 |
| Prolapse of uterus | 116 | 21 | 4 | 1 | 142 |
| Retroflexion of uterus | 68 | 6 | 3 | .. | 77 |
| Retroversion of uterus | 173 | 32 | 6 | 1 | 212 |
| Anteflexion of uterus | 2 | 1 | .. | .. | 3 |
| Endometritis | 133 | 20 | 3 | 2 | 158 |
| Metritis | 26 | 2 | 1 | .. | 29 |
| Parametritis | 5 | .. | 1 | 1 | 7 |
| Dysmenorrhœa | 24 | 15 | 1 | .. | 40 |
| Leucorrhœa | 10 | 12 | 2 | .. | 24 |
| Menopause | 1 | 3 | .. | .. | 4 |
| Pelvic cellulites | 26 | 6 | 1 | .. | 33 |
| Pelvic abscess | 11 | 6 | .. | 1 | 18 |
| Pelvic inflammation | 25 | 1 | 1 | .. | 27 |
| Other diseases of uterus | 56 | 5 | 16 | .. | 77 |
| Ovarian cysts | 94 | 14 | 1 | 4 | 113 |
| Salpingitis | 89 | 39 | 1 | 5 | 134 |
| Other diseases | 48 | 8 | .. | 1 | 57 |
| Totals | 1,035 | 218 | 45 | 19 | 1,317 |
The above figures do not include 99 cases of diseases of the female breast (mastitis 29, tumour 26, abscess 44).
A total of 896 cases come under the heading of puerperal. This number includes 135 cases of normal childbirth dealt with at public general hospitals, but does not cover maternity cases in St. Helens Hospitals. Nineteen of the 31 deaths in this class were due to puerperal septicæmia.
| PUERPERAL ACCIDENTS, ETC. | |||||
|---|---|---|---|---|---|
| Disease. | Discharges. | Deaths. | Total Discharges and Deaths. | ||
| Recovered. | Relieved. | Unrelieved. | |||
| Miscarriage | 131 | 13 | .. | 2 | 146 |
| Abortion | 246 | 32 | .. | 3 | 281 |
| Ectopic gestation | 57 | 4 | .. | 2 | 63 |
| Other accidents of pregnancy | 29 | 22 | 17 | .. | 68 |
| Normal labour | 135 | .. | .. | .. | 135 |
| Puerperal hæmorrhage | 24 | 3 | .. | 1 | 28 |
| Ruptured perinæum | 39 | 5 | 1 | 1 | 6 |
| Lacerated perinæum | 31 | 10 | 1 | .. | 42 |
| Other accidents of labour | 9 | 1 | .. | 1 | 11 |
| Puerperal septicæmia | 23 | 4 | .. | 19 | 46 |
| Puerperal albuminuria | 8 | 2 | .. | 2 | 12 |
| Puerperal phlebitis and phlegmasia | 5 | .. | .. | .. | 5 |
| Puerperal mania | 6 | 3 | 4 | .. | 13 |
| Totals | 743 | 99 | 23 | 31 | 896 |
The principal diseases of the skin and annexa were as follows:—
| Disease. | Cases. |
|---|---|
| Abscess | 289 |
| Ulcers | 206 |
| Cellulitis | 130 |
| Eczema | 124 |
| Sinus | 42 |
| Dermatitis | 32 |
| In grown nail | 27 |
| Whitlow | 26 |
| Carbuncle | 25 |
| Furuncle | 24 |
| Herpes | 23 |
| Boils | 22 |
| Gangrene | 21 |
| Other | 116 |
| Total | 1,107 |
Deaths numbered 19, including 6 from cellulitis, 4 from abscess, and 5 from gangrene.
Non-tuberculous diseases of the bones and of the organs of locomotion numbered 932, including 19 deaths. Eleven of the deaths were due to osteo-myelitis. The principal diseases in this class, following the order of the classification, were —
| Disease. | Cases. |
|---|---|
| Caries | 27 |
| Necrosis | 69 |
| Oste-omyelitis | 95 |
| Periostitis | 55 |
| Osteitis | 14 |
| Mastoiditis | 109 |
| Sinusitis | 46 |
| Antrum disease | 15 |
| Other diseases of bones | 38 |
| Arthritis | 44 |
| Synovitis | 114 |
| Other diseases of joints | 53 |
| Amputations (cause not shown) | 5 |
| Bursitis | 65 |
| Talipes | 52 |
| Lumbago | 30 |
| Muscular rheumatism | 16 |
| Other diseases of organs of locomotion | 75 |
| Total | 932 |
Male infants to the number of 162 were discharged from hospital after treatment for phimosis. Other malformations were,—
| Cases. | |
|---|---|
| Cleft palate | 33 |
| Hare-lip | 24 |
| Nævus | 9 |
| Hypospadias | 6 |
| Hydrocephalus | 5 |
| Spina bifida | 4 |
| Others | 29 |
| Total | 110 |
Only 2 deaths were recorded, 1 each from hare-lip and spina bifida.
Hospital returns show a total of 63 male deaths and 13 female deaths from old age during 1914. In addition 22 old people treated for senility were discharged recovered, 85 relieved, and 33 unrelieved. These totals include the returns of five hospitals which are also old peoples' homes.
The principal headings included in this class are fractures and injuries in regard to which no specified cause is shown. In death-registrations the cause of death is asked for, and in cases of deaths resulting from fractures and other injuries the actual cause is obtained. The Medical Superintendents are, however, concerned not with causes but with natures of injuries, and the returns, in the great majority of cases, are classed to the headings “fractures” and “injuries.” which in death statistics would be regarded as somewhat indefinite, but which in morbidity statistics are invaluable on account of the fact that the part of the body affected is given in most of the cases. Fractures and injuries are dealt with in detail further on.
Six suicidal deaths in hospital were returned in 1914, and 30 of the patients discharged were admitted for treatment for self-inflicted injuries. A number of cases of lysol poisoning included among accidental poisoning may have been attempts at suicide.
Accidental poisoning, including cases not shown to be suicidal, was returned in 114 cases, including 10 of ptomaine poisoning. Two hundred cases of burns 91 of accidental shooting, 282 of injuries by cutting or piercing instruments, 8 by falls, and 120 by crushing, are also shown. Nine persons were treated for effects of heat, 1 for effects of excessive cold, 2 for electrocution, 9 for injuries inflicted by animals, 8 for injuries due to explosions, and 22 for foreign body in larynx or pharynx. The total violent deaths in hospitals during the year were 160, out of a total of 3,817 cases.
The part of the body affected in the 1,385 cases of fractures referred to above is shown in full in the next table:—
| Fractures. | Cases |
|---|---|
| Fracture of skull | 89 |
| Fracture of cheek-bone | 4 |
| Fracture of jaw | 43 |
| Fracture of nose | 7 |
| Fracture of clavicle | 59 |
| Dislocation of shoulder | 46 |
| Fracture of humerus | 85 |
| Dislocation of elbow | 33 |
| Fracture of radius | 42 |
| Fracture of ulna | 7 |
| Fracture of arm | 55 |
| Dislocation of wrist | 8 |
| Colles fracture | 17 |
| Dislocation of fingers | 24 |
| Fracture of spine | 16 |
| Fracture of sternum | 3 |
| Fracture of ribs | 78 |
| Fracture of pelvis | 20 |
| Dislocation of hip | 18 |
| Fracture of femur | 150 |
| Fracture of patella | 19 |
| Dislocation of knee | 8 |
| Dislocation of semi-lunar cartilege | 33 |
| Fracture of tibia | 196 |
| Fracture of fibula | 54 |
| Fracture of leg | 78 |
| Pott's fracture | 44 |
| Sprained ankle | 64 |
| Dislocation of foot | 5 |
| Fracture of metatarses | 9 |
| Dislocation of toe | 5 |
| Fracture, undefined | 66 |
| Total | 1,385 |
The total shown includes 59 deaths, 28 of which were due to fracture of the skull.
A fist is given showing the part of the body affected in those cases of accidental injuries, other than fractures, in which the cause is not shown on the patients' discharge-cards. Only 29 deaths are included, 14 of which were due to injuries to the head or brain. The indefinite designation “injury” or “wound” was returned in 75 cases.
| Location. | Cases. |
|---|---|
| Head and brain | 210 |
| Scalp | 53 |
| Eye | 68 |
| Face | 62 |
| Neck, &c. | 25 |
| Shoulder | 20 |
| Arm | 47 |
| Elbow | 15 |
| Wrist | 10 |
| Hand | 159 |
| Fingers | 143 |
| Back | 85 |
| Ribs and chest | 38 |
| Kidneys | 11 |
| Abdomen | 35 |
| Groin | 27 |
| Hip | 32 |
| Thigh | 25 |
| Knee | 98 |
| Leg | 107 |
| Ankle | 24 |
| Foot | 137 |
| Tendon | 24 |
| Undefined | 75 |
| Total | 1,530 |
Table of Contents
THE Public Health Act, 1900, repealed eight amending and allied Acts dating from 1876 to 1900. The Public Health Act, 1900, with amendments in 1901, 1902, 1903, 1904, and 1907, in the general consolidation of the New Zealand Statutes, now forms the Public Health Act, 1908 This consists of four parts.
Part I provides for the constitution of a Department of Public Health under the control of a Minister of the Crown, called the Minister of Public-Health, and also enables the Dominion to be divided up into health districts, each health district being placed under a District Health Officer, who must possess special knowledge of sanitary and bacteriological science. These officers, and such inspectors and other officers who may be appointed by the Governor, are under the control of and responsible to the Chief Health Officer.
Part II deals with sanitation and the prevention of infectious diseases. The initial clauses under this part are more particularly designed to be made use of in the case of the outbreak of any dangerous infectious disease. These diseases have been declared to be plague, smallpox, leprosy, and cholera. The subsequent sections of this part deal with the notification and prevention of the spread of infectious diseases. By the Hospitals and Charitable Institutions Amendment Act, 1910, the Hospital Boards throughout the Dominion are made the local authorities under this Act for all matters relating to infectious diseases. Notification of the latter is required to be made to the Hospital Board and the District Health Officer.
Under “Sanitation” the abatement of nuisances, the prevention of pollution of watercourses, the control of offensive trades, the removal or repairing of insanitary buildings, and other similar matters are dealt with: and the functions of the District Health Officer and the Inspectors in regard thereto are laid down. Generally speaking, in addition to his duties under the Public Health Act, the District Health Officer acts in the advisory capacity of a medical officer of health to the several municipalities and other local governing bodies in his district.
Part III deals with quarantine, which is referred to below. Part IV deals with vaccination, to which reference is made in the Vital-Statistics section of the Year-book.
The New Zealand University Amendment Act, 1912, confers on the Senate of the New Zealand University the power to grant diplomas in public health, and to make regulations for the examination of candidates for such diplomas.
The quarantine laws are administered by the officers of the Department of Public Health, under authority of the Public Health Act. 1908. The Act provides for the proclamation of infected places in or beyond the Dominion, and every ship arriving at a New Zealand port from or after having touched at an infected place is liable to quarantine, and this liability extends to every person on board such ship. No persons or goods are allowed to be landed from an infected ship, except at the appointed quarantine-ground, and any restrictions that may be deemed necessary to prevent the spread of infection may be enforced by the health officers. Heavy fines may be inflicted for any breach of these laws.
A medical practitioner may be appointed to take charge of passengers and crew of a ship liable to quarantine, and the owners or agents of the ship are liable for the cost of such attendance. It is the duty of the owners or agents of the ship to supply the passengers with such wholesome provisions and medicines as the medical man in charge directs or requires. All expenses incurred in connection with the disinfection or destruction of infected goods are a charge against the ship.
Regulations under the Act direct the manner in which the ship and the quarantine quarters must be disinfected, and the precautions to be taken by those on board the ship. Suspected ships are liable to the same precautions as those infected, and healthy ships—i.e., those on board which there has been no case of infectious disease though they have sailed from or touched at an infected port, or have communicated with an infected ship—are liable to fumigation if directed by the Health Officer, and the method of mooring is set out.
No vessel may be admitted to pratique between the hours of sunset and sunrise, unless under exceptional circumstances.
To be registered as a medical practitioner in New Zealand application should be made to the Registrar of Births and Deaths at Auckland, Wellington, Christchurch, or Dunedin.
An applicant must be a graduate in medicine and surgery of the New Zealand University, or registered or eligible for registration as a medical practitioner in the United Kingdom, or the holder of a diploma approved by the Medical Board and granted by any university or institution other than the University of New Zealand or than a university or institution situated in the United Kingdom, after a course of not less than five years' study of the subjects pertaining to a medical and surgical degree or license.
The Board may refuse to approve any diploma unless graduates in medicine and surgery of the University of New Zealand are without further examination entitled to be registered as medical practitioners in the country in which that diploma has been granted.
No person is entitled to be registered if he has been at any time convicted of any offence punishable by imprisonment with hard labour for a term of two years or upwards, or is otherwise not of good fame or character.
One month's notice of intended application must be given, and such notice advertised once in the New Zealand Gazette and also in a newspaper circulating near the residence of the applicant. Residence in New Zealand is therefore essential before notice can be given.
The fee for registration is £3 3s., payable on deposit of evidence of qualification.
A table is appended showing the additions to and removals from the Medical Register during the last two years, with the numbers on the register on the 1st January and 31st December of each year.
| MEDICAL REGISTER.—ADDITIONS AND REMOVALS. | ||
|---|---|---|
| — | 1913 | 1914 |
| Number on register on 1st January | 1,199 | 1,240 |
| Number added during year by registration | 47 | 41 |
| Number removed during year on evidence of death | 6 | 13 |
| Number on register on 31st December | 1,240 | 1,268 |
Application for registration as a dentist should be made to the Registrar-General, Wellington, accompanied by a fee of £1.
Every adult person is entitled to be registered as a dentist in New Zealand who is the holder of a degree in dental surgery of the University of New Zealand, or a certificate of proficiency in dentistry obtained from the Senate of the University, or is registered or entitled to be registered as a dentist in the United Kingdom, or is the holder of such degree in dentistry granted in a British possession or a foreign country as may be recognized by the Senate of the New Zealand University. Evidence of good character is required in every case.
A table is appended showing the additions to and removals from the Dentists' Register during the years 1913 and 1914, with the numbers on the register on the 1st January and 31st December of each year.
| DENTISTS' REGISTER.—ADDITIONS AND REMOVALS. | ||
|---|---|---|
| — | 1913. | 1914. |
| Number on register on 1st January | 769 | 771 |
| Number added during year by registration | 3 | 1 |
| Number removed during year on evidence of death | 1 | 3 |
| Number on register on 31st December | 771 | 769 |
In order to make better provision for the sale of food and drugs in a pure state, the Sale of Food and Drugs Act was passed by the Legislature, and came into operation on the 1st January, 1908. This Act forms part of and is to be read together with the Public Health Act, 1908.
The Act is administered by the officers of the Public Health Department, and provides for the analysis, by public analysts, of any article of food or drink, or of any drug, which may be sold, offered for sale, or exposed for sale, and for the inspection of any place where there is any food or drug intended for sale. If any such article be proved to be unfit for human consumption, or likely to cause injury to health if consumed, heavy penalties may be inflicted on the person or persons responsible.
Stringent measures are provided for the prevention of adulteration of food, drink, or drugs, and for the inspection of places where such things are manufactured or packed. The selling of light-weight bread is an offence under the Act, as is also the taking back of bread after it has been in the possession of the purchaser for more than an hour.
Any person may, on payment of the prescribed fee, together with the cost of the sample, require any authorized officer to purchase a sample of any food or drug and submit the same for analysis.
Regulations under the Act were published in the New Zealand Gazette of the 20th February, 1908, 17th September, 1908, 13th January, 1910, 17th February, 1910, and 6th October, 1910. Standards for the control of the purity of food stuffs and of drugs, on the lines recommended by the Australian Inter-State Conference, were gazetted as a complete set of regulations on 6th March, 1913.
During the year 1914 183 charges under the Sale of Food and Drug Act were dealt with in Magistrates' Courts, resulting in 112 convictions. The totals shown comprise the following:—
| Offence with which charged. | Charges. | Convictions. |
|---|---|---|
| Selling adulterated milk | 152 | 97 |
| ” light-weight bread | 24 | 8 |
| ” adulterated food | 3 | 3 |
| ” adulterated paraffin | 2 | 2 |
| ” adulterated whisky | 1 | 1 |
| ” butter without label | 1 | 1 |
| Totals | 183 | 112 |
This Act, passed during the session of 1912, provided for the setting-up of a Board, to be called the Plumbers' Board of New Zealand. This Board consists of five members—viz., the Chief Health Officer or his Deputy, who shall be chairman; the Inspector-General of Schools; a city or borough engineer nominated by the cities and boroughs which have a population of over 5,000 inhabitants, and appointed by the Governor: a master plumber, and a journeyman plumber elected by their respective associations.
The functions of the Board are to decide what persons may be registered under the Act, in what districts sanitary plumbing shall be performed only by registered plumbers, and what shall be the scope of the examinations to be held in the future as a part of the process of securing registration.
The main principle underlying the Act is that of securing trained and certificated sanitary plumbers, and that such registered plumbers shall not be required to pay any license fee or pass any examination order any local authorities controlling sanitary plumbing-works.
Prior to the abolition of provinces the hospitals of the Dominion were supported mainly out of provincial revenues. After that event the expenditure for hospitals was for the most part charged against the revenue of counties and municipal corporations, until October. 1885, when the Hospitals and Charitable Institutions Act. 1885 (re-enacted in 1908), came into force.
Under this Act that portion of New Zealand included within the three principal islands—the North, South, and Stewart Islands—was divided into thirty-six hospital districts, each consisting of one or more counties with the interior boroughs and certain town districts having a population of live hundred or more, presided over by thirteen Hospital Boards, twenty-three combined Hospital and Charitable Aid Boards, and six Charitable Aid Boards.
The Hospitals and Charitable Institutions Act, 1909, is described in the preamble as “An Act to consolidate and amend the law relating to public hospitals and charitable institutions, the distribution of charitable aid, and the establishment of private hospitals” All previous enactments relating to these matters are repealed.
The main provisions of the Act are thus briefly described: The distinction between Hospital Boards and Charitable-aid Boards has been abolished, and every Board now possesses the double function of maintaining hospitals and administering charitable relief. The Board consists of representatives of the various contributory local districts, counties, boroughs, town districts, and in some instances road districts, as the case may be, lying within the hospital district.
Representation on the Board is proportionate to the population and the value of the rateable property in the contributory district, the total number of members of any Board not to be less than eight nor more than twenty. The representatives are elected by the electors of the local authority of the contributory district, casual vacancies being filled by nomination by the local authority itself. Small contributory districts may be combined, and return a representative in common. The representatives of each contributory district retire at every general election of the local authority of that district, and their places are filled at an election held at the same time as that general election. All property in connection with the purposes of the Act, including the hospitals for infectious diseases, is vested in the Boards, excepting that belonging to certain hospitals, four in number, and six charitable institutions, which are specifically exempted on the ground that they are self-supporting so far as the local authorities are concerned.
The revenues of the Boards accrue from the following sources:—
Rents and profits of land and endowments.
Voluntary contributions and bequests.
Contributions from local authorities.
Subsidies from the Consolidated Fund as follows:—
Ten shillings in the pound on all devises or bequests, provided the subsidy shall not exceed £500 in respect of the estate of any single testator.
Twenty-four shillings in the pound on voluntary contributions other than bequests.
Pound for pound on contributions by local authorities in respect of capital expenditure, and in respect of other expenditure on a sliding scale, the amounts ranging from 12s. 3d. in the pound when the capital rateable value of property in the district exceeds £450 per head of the population, and the rate of levy per head is not under 4s., to 24s. 3d. when the value per head is less than £100 and the levy per head less than 2s.
The amount to be contributed by the local authorities is determined by estimating the expenditure for the ensuing year, including any deficiency brought forward, and deducting from the amount so ascertained the probable revenue from all sources excepting contributions from local authorities: the balance must be provided by the contributory bodies either out of their ordinary revenues or by special rates. Should any body fail to pay the required contribution, the amount due may be deducted from any subsidy or grant payable by the Government to the said local authority. The revenues of the Boards are thus secured absolutely.
When funds are required for the purpose of acquiring land as a site for any building, or for erecting, adding to, or altering any building, the contributory authority may raise the amount required by way of loan from the State Advances Board, repaying the loan by instalments.
Provision is made by which the contributory authorities may demand an inquiry if they consider the proposed expenditure is unnecessary or extravagant, and if such contention is upheld an amended estimate and fresh apportionment must be made.
The Inspector-General of Hospitals has the general administration of the Act under the direction of the Minister of Public Health, and is intrusted with authority to inspect institutions within the meaning of the Act at any time he may think lit. If a Board fails or refuses to perform any duty imposed by the Act, the Inspector-Geneal may by direction of the Minister take the matter in hand and remedy it, charging the Board with any expense incurred in so doing.
The Dominion is divided into thirty-nine hospital and charitable-aid districts, each of which is under the control of a Board elected as mentioned above.
Besides the administration of hospitals and charitable aid, these Boards are the responsible authorities as regards certain public health matters, being especially responsible for the control of infectious diseases. This duty was placed upon the Boards by the Hospitals and Charitable Institutions Amendment Act, 1910.
Expenditure on hospitals and charitable aid has risen from £177,724 in 1894-95 to £578,838 in 1914-15. The expenditure per head of mean population has increased in the same time from 5s. 2½d. to 10s. 6¾d. The figures for each of the past twenty years are given in the following table:—
| HOSPITAL AND CHARITABLE-AID EXPENDITURE, 1895-96 TO 1914-15. | ||||
|---|---|---|---|---|
| Year ended 31st March. | Mean Population. | Hospital and Charitable Aid and other Expenditure. | Expenditure per Head of Mean Population. | |
| £ | s. | d. | ||
| 1896 | 696,331 | 199,463 | 5 | 8¾ |
| 1897 | 710,418 | 186,047 | 5 | 2¾ |
| 1898 | 724,681 | 181,773 | 5 | 0 |
| 1899 | 739,193 | 198,823 | 5 | 4½ |
| 1900 | 752,644 | 185,860 | 4 | 11¼ |
| 1901 | 765,668 | 197,408 | 5 | 1¾ |
| 1902 | 781,356 | 212,215 | 5 | 5 |
| 1903 | 802,419 | 231,185 | 5 | 9 |
| 1904 | 826,902 | 243,000 | 5 | 10½ |
| 1905 | 851,964 | 259,616 | 6 | 1 |
| 1906 | 877,469 | 270,710 | 6 | 2 |
| 1907 | 901,920 | 288,808 | 6 | 4½ |
| 1908 | 925,727 | 315,197 | 6 | 10 |
| 1909 | 945,063 | 359,941 | 7 | 7¼ |
| 1910 | 977,906 | 375,075 | 7 | 8 |
| 1911 | 997,974 | 416,384 | 8 | 4¼ |
| 1912 | 1,019,984 | 482,645 | 9 | 5½ |
| 1913 | 1,046,624 | 500,442 | 9 | 6¾ |
| 1914 | 1,075,788 | 579,606 | 10 | 9¼ |
| 1915 | 1,095,206 | 578,838 | 10 | 6¾ |
Capital expenditure is included, and this being variable would cause some slight fluctuation in the rate per head of the population.
The figures of expenditure for the two last years are given herewith in greater detail:—
| Head of Expenditure. | Year ended 31st March. | |
|---|---|---|
| 1914. | 1915. | |
| £ | £ | |
| Hospital maintenance | 265,267 | 283,893 |
| Charitable aid— | ||
| Indoor relief | 68,510 | 74,081 |
| Outdoor relief | 34,451 | 37,413 |
| Administration | 22,720 | 24,266 |
| New buildings and additions | 143,529 | 117,983 |
| Other expenses | 45,129 | 41,202 |
| Totals | 579,606 | 578,838 |
The total receipts for 1914-15 (£560,458) include only £89,592 on account of patients. Receipts from the State amounted to £217,152 and from local authorities £189,886. The receipts for each of the last two years are as follows:—
| Source of Receipts. | Year ended 31st March. | |
|---|---|---|
| 1914. | 1915. | |
| £ | £ | |
| From Government | 219,520 | 217,152 |
| From local authorities | 175,120 | 189,886 |
| Voluntary contributions | 49,856 | 25,227 |
| Payments on account of persons relieved | 84,026 | 89,592 |
| From other sources | 56,881 | 38,601 |
| 585,403 | 560,458 | |
The number of public general hospitals at 31st March, 1915, was 63. In addition there were four infectious-diseases hospitals and five sanatoria for consumptives.
Information as to the number of public general hospitals and their staff and accommodation is given for each of the past five years.
| Number of | Year ended 31st March. | ||||
|---|---|---|---|---|---|
| 1911. | 1912. | 1913. | 1914. | 1915. | |
| Institutions | 57 | 60 | 63 | 63 | 63 |
| Medical staff (stipendiary) | 83 | 84 | 86 | 88 | 100 |
| Nursing staff— | |||||
| Trained nurses | 234 | 246 | 252 | 300 | 301 |
| Probationers | 503 | 479 | 570 | 578 | 647 |
| Domestic staff | 437 | 532 | 550 | 576 | 623 |
| Beds | 2,863 | 3,057 | 3,176 | 3,292 | 3,531 |
Further particulars concerning the public general hospitals of the Dominion for the years ended the 31st March, 1914 and 1915 are given in the next table.
| – | Year ended 31st March. | |
|---|---|---|
| 1914. | 1915. | |
| Average number of patients per diem | 2,233 | 2,364 |
| Number of patients under treatment | 28,885 | 31,366 |
| Deaths | 2,179 | 2,210 |
| Individual average day's stay | 28 | 28 |
| Average number of occupied beds to each of nursing staff | 2.5 | 2.6 |
| Average annual cost of maintenance per occupied bed | £109.3 | £109.4 |
| Average annual payment by patient per occupied bed | £23.5 | £25.4 |
| Number of out-patients attended during year | 16,986 | 15,442 |
As previously remarked, State charitable institutions are administered by combined Hospital and Charitable Aid Boards, who also distribute outdoor relief. Most of the aged needy are provided with old-age pensions of £26 per annum, but many of these old people prefer to enter a public home, where they are cared for better and at less cost than could be possible with individuals. In these cases the pension is received by the officers of the Hoard, as payment for the maintenance of the pensioner, but a proportion is handed over to the latter to be expended as he or she may choose.
Where public and private charitable organizations operate side by side independently of each other there is sure to be an overlapping in the collection of funds and the distribution of relief. The Inspector-General of Charitable Institutions has taken steps to endeavour to secure co-operation between public and private charities, in order to avoid any duplication in future. The average cost of maintenance and administration per occupied bed of the old people's homes under the control of Hospital Boards for the year 1914-15 was £35 18s.; the average number of inmate daily 1,183; the number of beds available being 1,517.
The Private Hospitals Act, which came into force on the 1st January, 1907, is now superseded by the Hospitals and Charitable Institutions Act, 1909, which provides for the licensing, management, and inspection of private hospitals. All such institutions must be licensed, and every application for a license must be accompanied by a statement giving full description of the house proposed to be used, number of patients, and class of cases proposed to be received. The licensee shall state whether it is in respect of a lying-in private hospital or a surgical and medical private hospital, or if for both classes of cases, and no private hospital may be used for any purpose other than that in respect of which the license is granted and purposes reasonably incidental thereto.
For every private hospital there must be a resident manager, either the licensee or some person appointed by the licensee, and in every case the manager must be a legally qualified medical practitioner or a registered nurse in the case of a surgical and medical hospital, or a registered midwife in the case of a lying-in hospital, or a registered nurse and midwife, or a registered nurse having as resident assistant a registered midwife in the case of a hospital licensed for both purposes. No license shall be granted in respect of a house not previously licensed until such house and annexed buildings have been approved by the Inspector-General of Hospitals, and no addition shall be made to any private hospital until it has been so approved. No license shall be granted until the character and fitness of the applicant have been proved satisfactory, and the license must be renewed on the 1st January of each year.
In every private hospital there must be kept a register of patients showing particulars as to name, age, abode, and date of reception of each patient, date when such patient left, or in the event of death the date thereof, name of medical practitioner attending, and such other details as may be prescribed. Inquiry may be made at any time as to the management and conduct of any such private hospital, and if such inquiry prove unsatisfactory the license may be revoked, and no new license shall be granted to the person whose license is so revoked, for a period of five years.
Provision is made for the visitation and inspection of private hospitals in the same manner as for public institutions of the like nature.
The Governor may from time to time make such regulations as are necessary for carrying the Act into effect, and substantial penalties are provided for breaches of its provisions.
There are four State maternity hospitals now open for the use of the public, one at each of the principal centres. The St. Helens Hospital at Wellington was opened in June, 1905, and a new and up-to-date building in July, 1912; that at Dunedin in October, 1905; that at Auckland in June, 1906: and that at Christchurch in April, 1907. During the year ended 31st March. 1915, a total of 794 confinements took place in the four hospitals, and 410 confinements were attended by the institution nurses outside the hospitals, as compared with 803 and 495 confinements respectively during the previous twelve months. These institutions are a development of the policy begun by legislation in 1901, when the Nurses Registration Act was passed, followed in 1904 by the Midwives Act, the latter providing that after a certain date only those midwives who were duly registered would be qualified to practise on their own account
Tables are given showing information as to births and deaths in each institution during the year ended 31st March, 1915, and the totals for each of the past five years. Births in cases dealt with outside St. Helens Hospitals by the nurses attached to the institutions are also shown.
| ST. HELENS HOSPITALS, 1914-15. | ||||
|---|---|---|---|---|
| City. | Confinements in Institution. | Confinements attended outside | ||
| Births. | Deaths of Mothers. | Deaths of Infants. | ||
| Auckland | 202 | 1 | 3 | 152 |
| Wellington | 203 | 4 | 5 | 91 |
| Christchurch | 212 | 1 | 7 | 83 |
| Dunedin | 177 | .. | 5 | 84 |
| Totals | 794 | 6 | 20 | 410 |
| ST. HELENS HOSPITALS, 1910-11 TO 1914-15. | |||||||
|---|---|---|---|---|---|---|---|
| Year ended 31st March. | Confinements in Institution. | Confinements attended outside. | |||||
| Births. | Deaths of Mothers. | Deaths of Infants. | |||||
| 1911 | 827 | 4 | 9 | 355 | |||
| 1912 | 886 | 2 | 17 | 460 | |||
| 1913 | 920 | 4 | 17 | 454 | |||
| 1914 | 803 | 5 | 11 | 495 | |||
| 1915 | 794 | 6 | 20 | 410 | |||
The expenditure of the four St. Helens Maternity Hospitals for the year ended 31st March, 1915, was as follows:—
| Head of Expenditure. | Auckland. | Wellington. | Christchurch. | Dunedin. |
|---|---|---|---|---|
| £ | £ | £ | £ | |
| Maintenance | 1,486 | 2,024 | 1,594 | 1,641 |
| Buildings, &c. | 97 | 35 | .. | 13 |
| Administration | 83 | 75 | 75 | 79 |
| Totals | 1,666 | 2,134 | 1,669 | 1,733 |
The maternity hospitals are not intended in any sense to be charitable institutions, and it is expected that they will be self-supporting.
There is a maternity hospital attached to the Medical School at Dunedin, which also serves as a training-school for medical students and midwives. During the year ended 31st March, 1915, 150 patients were admitted to this institution.
There is a maternity hospital established at Gisborne by the Cook County Women's Guild on the same lines as the St. Helens Hospitals and recognized as a training school for midwives. There are ten beds.
Charitable Maternity Homes are established at Auckland, Otahuhu, Napier, Wellington, Christchurch, and Invercargill for the reception of unfortunate girls. The Salvation Army have similar institutions at Auckland, Wellington, Christchurch, and Dunedin.
The Nurses Registration Act provides that every person who has attained the age of twenty-three years and is certified as having had three years' training as a nurse in a recognized general hospital, together with systematic instruction in theoretical and practical nursing from the medical officer and the matron of that hospital, and who passes the prescribed examination, is entitled to registration. During the year ended 31st March, 1915, there were 146 candidates for the final examination in medical and surgical nursing, and 128 passed.
On 31st March, 1915, the number of registered midwives was 1,373. Of these 690 are trained and certificated, the remainder having satisfied the Registrar that at the date of the passing of the Act they had been for at least three years in bona fide practice as midwives, and that they bear a good character.
Exclusive of industrial schools there are so far as is known some thirty-five institutions that may be described as orphanages or children's homes. The Education Act provides for the inspection of all orphanages and cognate institutions by Inspectors of the Education Department, with a view to securing that as regards education of the children and general management these organizations are acting consistently with the laws governing the education, care, and upbringing of children who are maintained in kindred institutions.
Under the control of the Education Department come also the various institutions for deaf and dumb, blind, or mentally defective children. These are dealt with in the section of this book dealing with Education.
There are seven public mental hospitals in the Dominion, maintained wholly or in part out of the public revenue. There is also one private hospital, licensed by the Governor for the reception of the mentally afflicted.
Information concerning the law dealing with the treatment of mental defectives is given in the 1914 issue of this book.
The number of patients under treatment at the end of 1914 was 4,111, consisting of 2,408 males and 1,703 females. These numbers include Maoris, of whom there were 19 male and 8 female patients.
The patients on the register at the end of the year 1914 were distributed as shown below (Maoris are included):—
| Mental Hospital. | Males. | Females. | Total. |
|---|---|---|---|
| Auckland | 558 | 359 | 917 |
| Tokanui | 94 | .. | 94 |
| Porirua | 519 | 422 | 941 |
| Nelson | 84 | 108 | 192 |
| Hokitika | 190 | 62 | 252 |
| Christchurch | 338 | 324 | 662 |
| Dunedin (Seacliff and Waitati) | 528 | 388 | 916 |
| Ashburn Hall (private mental hospital) | 21 | 23 | 44 |
| Absent on probation | 76 | 17 | 93 |
| Totals | 2,408 | 1,703 | 4,111 |
The number of patients remaining at the close of each of the past five years, and the proportion per 10,000 of the population, excluding Maoris, are shown in the following table:—
| NUMBER REMAINING (EXCLUDING MAORIS), 1910-14. | ||||||
|---|---|---|---|---|---|---|
| Year. | Number remaining at Close of Year. | Proportion per 10,000 of Population. | ||||
| Males. | Females. | Total. | Males. | Females. | Total. | |
| 1910 | 2,132 | 1,496 | 3,628 | 40.60 | 31.99 | 36.54 |
| 1911 | 2,193 | 1,525 | 3,718 | 40.61 | 31.40 | 36.26 |
| 1912 | 2,243 | 1,628 | 3,871 | 40.55 | 32.60 | 36.77 |
| 1913 | 2,301 | 1,624 | 3,925 | 38.41 | 31.50 | 36.19 |
| 1914 | 2,389 | 1,695 | 4,084 | 42.05 | 32.11 | 37.26 |
| Means of five years | 2,252 | 1,593 | 3,845 | 40.44 | 31.92 | 36.60 |
The total number of patients under oversight, care, or control during 1914 was 4,856 (males 2,858, females 1,998), as against 4,805 in 1913. The average number resident in mental hospitals was 3,849 in 1913 and 3,950 in 1914.
The total admissions to mental hospitals during the year 1914 were 868 (509 males and 359 females), this number not including 24 transfers from one institution to another. The causes of insanity as assigned on admission are given below with information as to associated causes, where known. In a few cases there were more than two causes in combination.
| ADMISSIONS TO MENTAL HOSPITALS.—CAUSES AND ASSOCIATED FACTORS, 1914. | ||||||||||||
|---|---|---|---|---|---|---|---|---|---|---|---|---|
| Causes | No Correlated Cause or Factor assigned. | Associated Factors. | Total Incidence of each Cause or Factor either Alone or in Combination. | |||||||||
| Heredity. | Congenital. | Deprivation of Special Senses. | Previous Attack. | Critical Period. | Child-bearing. | Mental Stress. | Physiological Defect or Error. | Toxic. | Diseases of Nervous System | |||
| Heredity | 146 | .. | .. | .. | 1 | 1 | .. | 2 | .. | 1 | .. | 151 |
| Congenital | 83 | .. | .. | .. | .. | 1 | .. | .. | .. | .. | .. | 84 |
| Deprivation of special sense | .. | 1 | .. | .. | .. | .. | .. | .. | .. | .. | .. | 1 |
| Previous attack | 63 | 1 | .. | .. | .. | .. | .. | .. | .. | .. | .. | 64 |
| Critical periods— | ||||||||||||
| Puberty and adolescence | 26 | .. | 1 | .. | .. | .. | .. | .. | .. | .. | .. | 27 |
| Climacteric | 26 | .. | .. | .. | .. | .. | .. | 2 | .. | .. | .. | 28 |
| Senility | 106 | .. | .. | .. | .. | .. | .. | .. | .. | .. | .. | 106 |
| Child-bearing— | .. | .. | .. | .. | .. | .. | .. | .. | .. | .. | .. | .. |
| Puerperal state | 27 | .. | .. | .. | .. | .. | .. | .. | .. | 1 | .. | 28 |
| Mental stress— | ||||||||||||
| Sudden: Shock | 1 | .. | .. | .. | .. | .. | .. | .. | .. | .. | .. | 3 |
| ” Grief | 2 | .. | .. | .. | .. | .. | .. | .. | .. | .. | .. | .. |
| Prolonged: Worry, domestic | 5 | .. | .. | .. | .. | .. | .. | .. | .. | .. | .. | .. |
| ” Worry, financial | 3 | 1 | .. | .. | .. | .. | .. | .. | .. | .. | .. | .. |
| ” Religious excitement | 2 | .. | .. | .. | .. | 1 | .. | .. | .. | .. | .. | 48 |
| ” Solitude | 13 | .. | .. | .. | .. | 1 | .. | .. | 1 | .. | .. | .. |
| ” Nature undefined | 20 | 1 | .. | .. | .. | .. | .. | .. | .. | .. | .. | .. |
| Physiological defect or error— | .. | .. | .. | .. | .. | .. | .. | .. | .. | .. | .. | .. |
| Privation | 1 | .. | .. | .. | .. | .. | .. | .. | .. | .. | .. | 1 |
| Over-exertion, physical | 2 | .. | .. | .. | .. | .. | .. | .. | .. | .. | .. | 2 |
| Masturbation | 4 | .. | .. | .. | .. | .. | .. | .. | .. | .. | .. | 4 |
| Sexual excess | 4 | .. | .. | .. | .. | .. | .. | .. | .. | .. | .. | 4 |
| Toxic— | .. | .. | .. | .. | .. | .. | .. | .. | .. | .. | .. | .. |
| Alcohol | 111 | 1 | .. | .. | .. | .. | .. | 1 | .. | .. | 1 | 114 |
| Drug habit | 2 | .. | .. | .. | .. | .. | .. | .. | .. | .. | .. | 2 |
| Lead-poisoning | 1 | .. | .. | .. | .. | .. | .. | .. | .. | .. | .. | 1 |
| Tuberculosis | 2 | .. | .. | .. | .. | .. | .. | .. | .. | .. | .. | 2 |
| Enteric fever | 1 | .. | .. | .. | .. | .. | .. | .. | .. | .. | .. | 1 |
| Syphilis (acquired) | 48 | .. | .. | .. | .. | .. | 1 | .. | .. | .. | .. | 49 |
| Constipation | 1 | .. | .. | .. | .. | .. | .. | .. | .. | .. | .. | 1 |
| Traumatic— | ||||||||||||
| Injury | 11 | .. | .. | .. | .. | .. | .. | .. | .. | .. | .. | 11 |
| Diseases of nervous system— | ||||||||||||
| Organic brain-disease | 2 | .. | .. | .. | .. | .. | .. | .. | .. | .. | .. | 2 |
| Epilepsy | 27 | .. | .. | .. | .. | .. | .. | .. | .. | 1 | .. | 28 |
| Apoplexy | 2 | .. | .. | .. | .. | .. | .. | .. | .. | .. | .. | 2 |
| Chorea | 1 | .. | .. | .. | .. | .. | .. | .. | .. | .. | .. | 1 |
| Neurosis (undefined) | 1 | .. | .. | .. | .. | .. | .. | .. | .. | .. | .. | 1 |
| Other bodily diseases— | ||||||||||||
| Anæmia, pernicious | 1 | .. | .. | .. | .. | .. | .. | .. | .. | .. | .. | 1 |
| Goitre | 2 | .. | .. | .. | .. | .. | .. | .. | .. | .. | .. | 2 |
| Arterio sclerosis | 1 | .. | .. | .. | .. | .. | .. | .. | .. | 1 | .. | 1 |
| Bright's disease | 1 | .. | .. | .. | .. | .. | .. | .. | .. | .. | .. | 1 |
| Rheumatism | 1 | .. | .. | .. | .. | .. | .. | .. | .. | .. | .. | 1 |
| Ill health (undefined) | 31 | .. | .. | .. | .. | .. | .. | .. | .. | .. | .. | 31 |
| Unknown | 71 | .. | .. | .. | .. | .. | .. | .. | .. | .. | .. | 71 |
Of the 868 persons admitted to mental hospitals dining 1914, those admitted for the first time to any mental hospital in New Zealand numbered 734 (males, 440: females, 294), and those not admitted for the first time, 134 (males, 69; females, 65). Of the first admissions 13 were immigrants, who became insane within a year of landing in the Dominion. Of this number, 6 men and 2 women came from the United Kingdom, 3 men and 1 woman came from the Commonwealth of Australia, and 1 from a foreign country. In addition, 2 New-Zealanders were admitted shortly after their return from residence abroad.
Excluding the Native race the number of first admissions and rate per 10,000 of population for each of the past five years were as follows:—
| FIRST ADMISSIONS AND RATE PER 10,000 OF MEAN POPULATION, 1910-14. | ||||||
|---|---|---|---|---|---|---|
| Year. | Number of First Admissions. | Proportion per 10,000 of Population. | ||||
| Males | Females. | Total. | Males. | Females. | Total. | |
| 1910 | 397 | 242 | 639 | 7.56 | 5.17 | 6.44 |
| 1911 | 362 | 249 | 611 | 6.77 | 5.19 | 6.02 |
| 1912 | 390 | 287 | 677 | 7.14 | 5.83 | 6.52 |
| 1913 | 387 | 261 | 648 | 6.90 | 5.14 | 6.06 |
| 1914 | 430 | 293 | 723 | 7.56 | 5.62 | 6.63 |
| Means of five years | 393 | 267 | 660 | 7.19 | 5.39 | 6.33 |
The figures for 1914 represent one first admission for every 1,500 persons in the Dominion.
In England and Wales during 1913 every 10,000 of the general population contributed 4.98 first admissions and 6.04 total admissions (idiot establishments excluded); in Scotland the ratio for total admissions was 7.78 and in Ireland 7.89.
Persons labouring under mental defect, but capable of understanding the meaning of the procedure, may seek admission to a mental hospital as voluntary boarders. At the beginning of 1914 there were 21 (6 males, 15 females) boarders in residence, and during the year 47 (17 males, 30 females) were admitted. If a voluntary boarder should after admission show mental defect sufficiently pronounced and sustained to render it improper to classify him any longer as such, application for a reception order is made to a Magistrate. During the year 1914, 14 (7 of each sex) were transferred from the voluntary to the ordinary register, and 2 died, while 31 (9 males, 22 females) were discharged, leaving the total at the end of the year the same as at the beginning.
The number of Maoris admitted as patients to the mental hospitals is small. These and the number remaining at the close of each of the past five years are shown below:—
| MAORIS ADMITTEDAND REMAINING, 1910-14. | ||||
|---|---|---|---|---|
| Year. | Admitted. | Remaining at Close of Year. | ||
| Males. | Females. | Males. | Females. | |
| 1910 | 13 | 3 | 28 | 14 |
| 1911 | 12 | 4 | 27 | 11 |
| 1912 | 12 | 5 | 30 | 12 |
| 1913 | 9 | 5 | 31 | 8 |
| 1914 | 10 | 1 | 19 | 8 |
Dealing with patients of all races, the next table gives the average number resident, those who were discharged as recovered, and those who died, during the period 1910-14:—
| Year | Average Number Resident. | Discharged as recovered. | Died. | ||
|---|---|---|---|---|---|
| Number. | Per Cent. of Average Number Resident. | Number. | Per Cent. of Average Number Resident. | ||
| 1910 | 3,473 | 327 | 9.42 | 263 | 8.15 |
| 1911 | 3,601 | 331 | 9.19 | 303 | 8.41 |
| 1912 | 3,697 | 325 | 8.79 | 260 | 7.57 |
| 1913 | 3,849 | 337 | 8.76 | 307 | 7.98 |
| 1914 | 3,950 | 369 | 9.34 | 281 | 7.11 |
| Means of five years | 3,714 | 338 | 9.10 | 291 | 7.84 |
With regard to the deaths in 1914, 66 were due to senile decay, representing 23.49 per cent. of the total deaths for the year, as against 34.53 per cent. for 1913. It is also noted that in a considerable number of the deaths from other causes advancing years was a factor, 46.38 per cent. of the patients who died in 1914 at specified ages being over sixty years of age. Deaths from general paralysis numbered 36, while various forms of tuberculosis accounted for 36 of the total deaths.
A table is added showing for all admissions since 1876 the percentages of patients discharged (as recovered, relieved, and not improved, separately) dying, and remaining.
| — | Males. | Females. | Both Sexes. |
|---|---|---|---|
| Discharged— | |||
| Recovered | 37.48 | 43.61 | 39.93 |
| Relieved | 7.56 | 9.32 | 8.27 |
| Not improved | 9.53 | 9.75 | 9.62 |
| Died | 30.61 | 20.71 | 26.64 |
| Remaining at end of 1914 | 14.82 | 16.61 | 15.54 |
| 100.00 | 100.00 | 100.00 |
A license may be granted to enable a private mental hospital to receive patients for treatment. Stringent conditions are attached to the issue of such licenses, which may be revoked at any time. The Inspector-General has wide powers in the regulation and control of private institutions, which are placed practically on the same footing as public mental hospitals in regard to inspection and other matters.
There is only one licensed private institution in the Dominion, that at Wakari, near Dunedin, established in 1882. Particulars of admissions, discharges, deaths, and patients remaining, for the last five years, are as follows. These figures are included in the tables given above.
| PRIVATE MENTAL HOSPITAL (included in previous figures). | ||||
|---|---|---|---|---|
| Year. | Admissions. | Discharges. | Deaths. | Patients remaining at End of Year. |
| 1910 | 11 | 12 | 1 | 42 |
| 1911 | 15 | 13 | 1 | 43 |
| 1912 | 19 | 16 | 1 | 45 |
| 1913 | 22 | 16 | 7 | 44 |
| 1914 | 13 | 10 | 2 | 45 |
The 45 patients shown as remaining at the end of the year include one male absent on probation.
The amount of sleeping-accommodation provided in each of the public mental hospitals is shown in tabular form, giving separately the number and cubic content of the sleeping-rooms intended for one person only, and of the dormitories occupied by several inmates conjointly, together with the number of beds for patients:—
| Sleeping-rooms for One Person only. | Dormitories for more than One Person. | |||||
|---|---|---|---|---|---|---|
| — | Number of Rooms. | Aggregate Number of Cubic Feet. | Number of Beds. | Number of Dormitories. | Aggregate Number of Cubic Feet. | Number of Beds. |
* Information for Christchurch not available. | ||||||
| Auckland | 165 | 116,660 | 165 | 32 | 351,647 | 753 |
| Tokanui | 3 | 3,060 | 3 | 4 | 64,317 | 93 |
| Porirua | 154 | 150,605 | 154 | 28 | 444,945 | 674 |
| Nelson | 29 | 25,114 | 29 | 16 | 106,948 | 166 |
| Hokitika | 57 | 47,759 | 57 | 14 | 131,718 | 213 |
| Christchurch | 101 | * | 101 | 40 | 293,320 | 554 |
| Seacliff | 247 | 163,093 | 247 | 62 | 348,424 | 669 |
| Totals | 756 | * | 756 | 196 | 1,741,319 | 3,122 |
At Ashburn Hall, Wakari, there are seventy-eight rooms, each for one person only, with an aggregate cubic content of 78,028 ft In addition there is open-air accommodation for two patients.
The total expenditure on maintenance of mental hospitals (not including the cost of new buildings and additions), and receipts from patients and for sale of produce, &c., during the past five years, were as follows:—
| Year. | Total Expenditure. | Receipts from Patients, Sale of Produce. &c. | Net Expenditure. |
|---|---|---|---|
| £ | £ | £ | |
| 1910 | 118,268 | 32,133 | 86,135 |
| 1911 | 125,227 | 40,840 | 84,387 |
| 1912 | 143,006 | 41,865 | 101,141 |
| 1913 | 150,111 | 47,228 | 102,883 |
| 1914 | 165,095 | 46,787 | 118,308 |
The total net expenditure out of the Public Works Fund for buildings and equipment from 1st July, 1877, to 31st March, 1915, was £732,621.
Farms are conducted in connection with the various mental hospitals, the inmates themselves doing most of the labour. During 1914, sales of produce brought in £6,640, while the value of produce grown on the farms and consumed in the institutions was estimated at £14,943. Expenses in connection with the farms amounted to £11,669, so that the year's working shows a credit balance of £9,914.
Table of Contents
OF every 100 persons in New Zealand 83.78 could read and write, 0.86 could read only, and 15.36 could neither read nor write at the time of the census of 1911. The proportion able to read and write has increased, and that of persons who cannot read has decreased, steadily since 1874. The figures are given for five censuses:—
| Read and Write. | Read only. | Cannot Read. | |
|---|---|---|---|
| Census 1874 | 68.15 | 8.09 | 23.76 |
| ” 1886 | 74.01 | 4.80 | 21.19 |
| ” 1896 | 80.60 | 2.89 | 16.51 |
| ” 1906 | 83.50 | 1.60 | 14.90 |
| ” 1911 | 83.78 | 0.86 | 15.36 |
To ascertain, however, how completely education is carried out, accepting as a test the knowledge of reading and writing, it is necessary to show the position in respect of age periods, which is accordingly given.
At the period under five years only 0.01 in every hundred were returned as able to read and write, and 0.02 to read; 99.97 being unable to do either on account of extreme youth. At five to ten years 68.05 could read and write, and 4.31 read only, leaving 27.64 who could not read. But this last includes only three years of the compulsory school-going period.
With the subsequent periods up to forty years figures under “Read only” and “Cannot read” are reduced to small percentages. At forty-five to fifty years those who “cannot read” are over 1 per cent., and the proportion goes on increasing regularly, as will be seen from the following table:—
| Ages, in Years. | Read and Write. | Read only. | Cannot Read. |
|---|---|---|---|
| Under 5 | 0.01 | 0.02 | 99.97 |
| 5 and under 10 | 68.05 | 4.31 | 27.64 |
| 10 “ 15 | 99.51 | 0.15 | 0.34 |
| 15 “ 20 | 99.69 | 0.05 | 0.26 |
| 20 “ 25 | 99.68 | 0.07 | 0.25 |
| 25 “ 30 | 99.37 | 0.06 | 0.27 |
| 30 “ 35 | 99.53 | 0.12 | 0.35 |
| 35 “ 40 | 99.33 | 0.17 | 0.50 |
| 40 “ 45 | 99.11 | 0.23 | 0.66 |
| 45 and under 50 | 98.43 | 0.45 | 1.12 |
| 50 “ 55 | 97.48 | 0.88 | 1.64 |
| 55 “ 60 | 96.19 | 1.49 | 2.32 |
| 60 “ 65 | 94.92 | 2.19 | 2.89 |
| 65 “ 70 | 92.30 | 3.39 | 4.31 |
| 70 “ 75 | 91.03 | 4.07 | 4.90 |
| 75 “ 80 | 88.77 | 5.06 | 6.17 |
| 80 and over | 85.22 | 6.65 | 8.13 |
| All ages | 83.70 | 0.86 | 15.36 |
In the following tables an attempt has been made to analyse the public expenditure on the various branches of education. The first table shows the total amount expended both from the Public Account and out of income from endowments during the years ended 31st March, 1914 and 1915. The figures are given to the nearest £1,000.
| ANALYSIS OF EXPENDITURE ON EDUCATION IN NEW ZEALAND FORTHE YEARS 1913-14 AND 1914-15.(Figures given in every case to the nearest £1,000.) | ||||||
|---|---|---|---|---|---|---|
| 1913-14. | 1914-15. | |||||
| Branch of Education. | Out of Public Funds. | Out of Income from Re-serves. | Total for all Items from all Public Sources. | Out of Public Funds. | Out of Income from Reserves. | Total for all Items from all Public Sources. |
| £ | £ | £ | £ | £ | £ | |
| Primary (including Native schools and training colleges) | 1,003,000 | 92,000 | 1,095,000 | 1,071,000 | 113,000 | 1,184,000 |
| Secondary (including secondary schools and secondary departments of district high schools) | 108,000 | 54,000 | 162,000 | 120,000 | 55,000 | 175,000 |
| Continuation and technical | 55,000 | 8,000 | 63,000 | 53,000 | 8,000 | 61,000 |
| Higher (including university and higher technical) | 47,000 | 26,000 | 73,000 | 47,000 | 29,000 | 76,000 |
| 1,213,000 | 180,000 | 1,393,000 | 1,291,000 | 205,000 | 1,496,000 | |
| Industrial schools | 47,000 | 2,000 | 49,000 | 49,000 | 2,000 | 51,000 |
| Other special schools (deaf and blind, and home for backward children) | 8,000 | 1,000 | 9,000 | 9,000 | 1,000 | 10,000 |
| Superannuation and miscellaneous | 33,000 | .. | 33,000 | 29,000 | .. | 29,000 |
| Totals | 1,301,000 | 183,000 | 1,484,000 | 1,378,000 | 208,000 | 1,586,000 |
In 1913-14 teachers' salaries and allowances amounted to £732,000; repairs and rebuilding, £87,000; new buildings, £82,000; all other expenses, £194,000. In 1914-15 the corresponding expenditure was £796,000, £91,000, £86,000, and £211,000 respectively. The amount expended per head of population, including Maoris, but excluding residents of the Cook and other Pacific islands, was as follows:—
| Branch of Education. | 1913-14. | 1915-15. | ||||||||||
|---|---|---|---|---|---|---|---|---|---|---|---|---|
| Out of Public Funds. | Out of Income from Reserves. | Total. | Out of Public Funds. | Out of Income from Reserves. | Total. | |||||||
| s. | d. | s | d. | s. | d. | s. | d. | s. | d. | s. | d. | |
| Primary (including Native schools and training colleges) | 17 | 8 | 1 | 7 | 19 | 3 | 18 | 9 | 2 | 0 | 20 | 9 |
| Secondary (including secondary departments of district high schools) | 1 | 11 | 0 | 11 | 2 | 10 | 2 | 1 | 1 | 0 | 3 | 1 |
| Continuation and technical | 1 | 0 | 0 | 2 | 1 | 2 | 0 | 11 | 0 | 2 | 1 | 1 |
| Higher (including university and higher technical) | 0 | 10 | 0 | 6 | 1 | 4 | 0 | 9 | 0 | 6 | 1 | 3 |
| 21 | 5 | 3 | 2 | 24 | 7 | 22 | 6 | 3 | 8 | 26 | 2 | |
| Industrial schools | 0 | 10 | .. | 0 | 10 | 0 | 11 | 0 | 1 | 1 | 0 | |
| Special schools (deaf, blind, &c.) | 0 | 2 | .. | 0 | 2 | 0 | 2 | 0 | 1 | 0 | 3 | |
| Superannuation and miscellaneous | 0 | 7 | .. | 0 | 7 | 0 | 6 | .. | 0 | 6 | ||
| Totals | 23 | 0 | 3 | 2 | 26 | 2 | 24 | 1 | 3 | 10 | 27 | 11 |
The following figures show the approximate cost of primary education per head, excluding new schools and additions, contributed out of public funds (general and local) in New Zealand and some other countries:—
| s. | d. | |
|---|---|---|
| New Zealand | 19 | 3 |
| England | 13 | 2 |
| Wales | 16 | 11 |
| Scotland | 17 | 6 |
| United States | 17 | 7 |
The following table shows the total amount expended on education out of the public funds only, and the amount per head of population for 1898-99 and 1903-4, and for the last six years:—
| Year. | Amount expended out of Public Funds. | Expenditure per Head of Population out of Public Funds. | |
|---|---|---|---|
| £ | s. | d. | |
| 1898-99 | 519,000 | 13 | 4 |
| 1903-4 | 679,000 | 15 | 6 |
| 1909-10 | 998,000 | 19 | 5 |
| 1910-11 | 1,083,000 | 20 | 8 |
| 1911-12 | 1,133,000 | 21 | 5 |
| 1912-13 | 1,237,000 | 22 | 5 |
| 1913-11 | 1,301,000 | 23 | 0 |
| 1914-15 | 1,378,000 | 24 | 1 |
The Dominion is divided into thirteen education districts, over each of which an Education Hoard presides, and into smaller districts, in each of which a School Committee elected by the householders has authority, subject to the general control of the Board, which is elected by the Committees of the district. The Board of an education district receives and disburses the money voted by the General Assembly for purposes of instruction, and, subject to the condition of consultation with the Committee of the school district, appoints the teachers. The Governor in Council makes general regulations for the inspection and examination of the schools, and also makes the regulations under which certificates are granted to teachers after examination and adequate experience. The Inspectors of Schools are now officers of the Education Department.
Education at the public schools is free and purely secular. The attendance of all children between the ages of seven and fourteen is compulsory, except when special exemptions are granted, or a child is being otherwise sufficiently educated.
In accordance with the Education Act, 1914, the programme of primary instruction includes English, arithmetic, geography, history, drawing and handwork (including, in the case of girls, needlework), nature-study and elementary science (including elementary agriculture and elementary home science), vocal music, physical instruction, and such lessons on the chief laws of health, on the duties of citizens, and on other subjects of moral instruction as may be prescribed. No child, however, is compelled to receive instruction in history whose parents or guardians object thereto.
The system of physical education, based with some slight modifications on the syllabus of physical exercises for schools issued by the English Board of Education in 1909, which was established in 1912, made good progress during the year 1914. The number of teachers who have received instruction in the system up to March, 1915, is 3,728, representing 1,606 schools and 135,000 children. Particular attention is given to the instruction of students at the training colleges. The course of instruction specially prepared for teachers attending classes includes (1) the theory and practice of exercise; (2) a definite series of progressive daily exercises in physical drill and correct methods of breathing; (3) personal hygiene; (4) a course of organized games; (5) swimming, life-saving, and resuscitation drill.
The total expenditure on physical education for the year ended the 31st March, 1915, was £8,831.
The medical inspection of schools and school-children is carried on by four medical inspectors working from the four chief centres. During the year 1914 403 primary schools were visited, and 16,019 children medically examined; of these, 10,248 were pupils taken at the routine examination, and 5,771 were special cases thought by the teachers to be suffering from some defects.
The medical inspectors do not treat cases, but, where necessary, recommend the parents to obtain medical attention for their children. Generally this advice appears to be followed; but there is a proportion of cases in which the expense of treatment is an obstacle. It is clear, however, that a great amount of good is being done by the medical inspectors in cases where other medical assistance is unnecessary. Remedies that cost little or nothing are recommended, and wrong and harmful methods of rearing the children corrected. Often dullness and incapacity have been found to be due to some physical defect, such as defective eyesight or hearing, or throat or nose troubles.
In addition to the work carried out by the medical inspectors, school-teachers examine as many children as they conveniently can, keeping a record of such particulars of physical condition as they are qualified to observe. The heights and weights of over 17,000 children were observed and recorded by teachers during the year, and according to the statistics thus obtained the average New Zealand child is superior to the English child in these particulars.
The medical inspectors give courses of lectures and practical instruction to the training-college students in the work of medical inspection. This is regarded as one of the most important parts of the scheme of medical inspection.
The medical inspectors report on school buildings in respect of lighting, heating, ventilation, cleanliness, &c., and have been able to suggest many improvements where little or no expense is involved. Emphasis is placed on the value of fresh air, open-air teaching being strongly recommended. One open-air class-room has been built in Wellington, and the experiment of teaching children in it throughout the year is at present being mode.
The expenditure on medical inspection for the year ending 31st March, 1915, was £2,302.
Since the year 1895 children out of the reach of a primary school, but living near to a convenient line of railway, have been granted free passes to the nearest public school or private school; in 1902 this privilege was extended to holders of scholarships and free places in secondary schools, district high schools, and technical schools; and at the beginning of the year 1909 the same concession was granted to other secondary pupils who were compelled to travel by rail in order to attend school. The amount paid in railway fares on this account in 1914-15 was £16,156.
Where conveyance by rail is not possible, grants are made to Education Boards to provide children with conveyance by road or water. In addition, when through the impracticability of conveyance a child has to live away from home to attend a public school, an amount is allowed for its board and lodging. The rates of payment are 6d. per return trip for a child travelling to school, and 2s. 6d. per week for a child living away from home, plus half the amount paid by Education Boards on conveyance and board in excess of the grants named. The total amount paid in 1914-15 for conveyance by road and water and for board of children was £7,204.
Grants are made for establishing and maintaining school and class libraries. The grants come under two heads:—
A capitation grant at the rate of 3d. per head on the average attendance is paid annually to Education Boards for the purpose of supplying schools with supplementary continuous readers in sufficient numbers for class-reading in P to 86 inclusive, and also for the free supply of class-books in necessitous cases or in cases where a newly entered pupil has already purchased elsewhere class-books different from those in use in the school. After provision has been made for the supply of such books, the balance of the grant, if any, is to be spent on approved books suitable for individual reading in school or at home.
Further to encourage school libraries provision has been made for the payment of subsidies of £1 for £1 on moneys raised by voluntary contributions for the purpose of establishing, maintaining, or increasing the utility of school libraries that contain books suitable for individual reading in school or at home. For the year ended the 31st December, 1913, the subsidies on moneys so raised for any school library during that year could not exceed 9d. per head on the average attendance at the school for the year 1912, and in no case could the subsidy for any one school exceed £10. Similarly, for the year 1914, the subsidy could not exceed 6d. per head on the average attendance for the preceding year, and in no case could the subsidy for any one school exceed £7 10s. In 1915 and subsequent years the amounts are 3d. and £5 respectively.
The books purchased are to be suitable for individual reading in school or at home, and are to be approved by the Education Board or an Inspector of Schools. Due attention is to be paid to providing books suitable for the individual reading of pupils in the lower classes.
Under the Education Act, 1914, provision is made for the payment by the Government of subsidies on all voluntary contributions received by public schools for such purposes of the schools as are to be defined by regulations. In consequence, the special subsidy hitherto payable on voluntary contributions for school libraries will in future form part of the subsidies paid under this general authorization. In addition, however, Education Boards are now required to provide a further subsidy on amounts raised locally by public subscription or otherwise for school and class libraries.
An illustrated paper, called the School Journal, is published monthly by the Education Department, for free circulation among pupils attending public primary schools, and for sale to private schools. The Journal is issued in three parts, each part being adapted to the educational attainments of pupils in two of the classes S1 to S6. It is claimed that although the Journal aims primarily at being instructive rather than recreative there is ample evidence that its appearance each month is welcomed by the children, and that its influence tends to the very desirable end of fostering the habit and the love of reading. It differs from most of the miscellaneous Readers in that, being composed largely of articles belonging to well-defined series of courses, it preserves a continuity absent from ordinary Readers. These courses deal with the history and geography of New Zealand, of the rest of the British Empire, and foreign countries, from the point of view of the human interests involved, so far as these appeal to a child's mind; with nature-knowledge of various kinds—the object being to extend what the pupils have learnt by their own observation, not to give information as a substitute for actual observation; with practical matters of hygiene; with civics and moral instruction; and with current topics, such as Antarctic exploration, Empire Day, Arbor Day, &c. Of the November issue of 1914, the number of copies printed was, Part I, 53,150; Part II, 51,200; Part III. 40,300.
In addition to the illustrations appearing in the pages of the School Journal, pictures and prints illustrating geography, history, and nature-study are issued separately on cards as aids to oral instruction on modern lines in these subjects.
The number of scholars and students as in 1914 is shown in the following summary. Pupils of private schools not inspected by the Education Department are excluded:—
| NUMBER OF SCHOLARS AND STUDENTS IN ATTENDANCE DURING 1914. | |
|---|---|
| Primary education— | |
| Public schools | 173,470 |
| Native village schools | 5,053 |
| Chatham Island schools | 98 |
| Private primary schools | 16,309 |
| Lower departments of secondary schools | 362 |
| Special schools | 732 |
| 196,024 | |
| Secondary education— | |
| Secondary schools | 6,056 |
| Secondary departments of district high schools | 2,100 |
| Day technical schools | 1,839 |
| Maori secondary schools | 435 |
| Private secondary schools | 850 |
| 11,280 | |
| Technical and continuation (excluding day technical schools) | 16,602 |
| Higher education— | |
| University colleges (including training-college students) | 2,257 |
| Lincoln Agricultural College | 53 |
| 2,310 | |
| Total under instruction | 226,216 |
This is an increase of 9,235 on the number under instruction during the previous year.
The public primary schools numbered 2,301 in 1914, against 2,255 in 1913. The number of aided or endowed colleges, grammar, and high schools was 33. The number of private schools from which returns were received by the Government Statistician was 321, an increase of 17. There were also 12 industrial schools, State and private, at which education was given, as well as State schools for the deaf and for backward children, and a school for the blind, subsidized by the State.
The number of primary and secondary schools established for the education of the Native or Maori race was 125.
Compared with 1913, there was in 1914 an increase of 6,341 in the number of pupils belonging to the public schools at the end of the year, and the average attendance shows an increase of 6,892 for the whole year.
| SCHOOLS AND SCHOLARS, 1878 TO 1914. | |||||
|---|---|---|---|---|---|
| Year. | Number of Schools. | Pupils at End of Year. | Mean of Average Weekly Roll. | Average Attendance, Whole Year. | Average Attendance as Percentage of Weekly Roll. |
| 1878 | 748 | 65,040 | .. | 48,773 | .. |
| 1883 | 971 | 92,476 | 90,859 | 69,838 | 76.9 |
| 1888 | 1,158 | 112,685 | 113,636 | 90,108 | 79.3 |
| 1893 | 1,375 | 124,686 | 125,692 | 100,321 | 79.8 |
| 1898 | 1,655 | 131,621 | 133,782 | 111,636 | 83.4 |
| 1903 | 1,786 | 133,568 | 134,748 | 113,047 | 83.9 |
| 1904 | 1,827 | 135,475 | 136,282 | 116,506 | 85.5 |
| 1905 | 1,851 | 137,623 | 138,471 | 120,265 | 86.9 |
| 1906 | 1,921 | 139,302 | 140,320 | 121,958 | 86.9 |
| 1907 | 1,963 | 141,071 | 141,946 | 120,026 | 84.6 |
| 1908 | 1,998 | 147,428 | 145,974 | 127,160 | 87.1 |
| 1909 | 2,057 | 152,416 | 151,142 | 132,773 | 87.8 |
| 1910 | 2,096 | 156,324 | 154,756 | 135,738 | 87.7 |
| 1911 | 2,166 | 161,648 | 159,299 | 142,186 | 89.3 |
| 1912 | 2,214 | 166,264 | 164,492 | 146,282 | 88.9 |
| 1913 | 2,255 | 172,168 | 169,530 | 151,242 | 89.2 |
| 1914 | 2,301 | 178,509 | 175,570 | 158,134 | 90.1 |
For each quarter of the year 1914 the average of the weekly roll numbers showed an increase over that for the corresponding quarter of 1913. The mean of the average weekly roll for the four quarters was 175,570 in 1914, against 169,530 for 1913, an increase of 6,040, making the total roll greater than in any previous year. Although the additions to the roll were most marked in the North Island, every district showed at least some increase. The number on the roll at the end of the year was 178,509, as against 172,168 for the previous year, an increase of 6,341.
The following table shows the age and sex of the pupils on the rolls of the public schools of the Dominion at the end of 1£ 1914 and the percentage of the roll for each age:—
| AGE AND SEX OF PUPILS, DECEMBER, 1914. | ||||||||
|---|---|---|---|---|---|---|---|---|
| Ages. | Boys. | Girls. | Total. | Percentages for Five Years. | ||||
| 1910. | 1911. | 1912. | 1913. | 1914 | ||||
| 5-6 years | 7,356 | 6,858 | 14,211 | 8.4 | 8.4 | 7.9 | 8.0 | 8.0 |
| 6-7 “ | 10,099 | 9,254 | 19,353 | 11.2 | 11.1 | 10.9 | 10.6 | 10.9 |
| 7-8 “ | 10,544 | 9,906 | 20,450 | 11.5 | 12.0 | 11.9 | 11.8 | 11.5 |
| 8-9 “ | 10,908 | 9,894 | 20,802 | 11.4 | 11.5 | 11.9 | 11.8 | 11.7 |
| 9-10 “ | 10,528 | 9,906 | 20,434 | 11.3 | 11.1 | 11.2 | 11.7 | 11.4 |
| 10-11 “ | 10,559 | 9,696 | 20,255 | 10.9 | 10.9 | 10.8 | 10.9 | 11.3 |
| 11-12 “ | 9,745 | 9,041 | 18,786 | 10.2 | 10.5 | 10.7 | 10.5 | 10.5 |
| 12-13 “ | 9,213 | 8,500 | 17,713 | 10.0 | 9.6 | 10.2 | 10.2 | 9.9 |
| 13-14 “ | 7,983 | 7,315 | 15,298 | 8.5 | 8.4 | 8.2 | 8.4 | 8.6 |
| 14-15 “ | 4,342 | 3,562 | 7,904 | 4.5 | 4.5 | 4.3 | 4.3 | 4.4 |
| 91,277 | 83,932 | 175,209 | 97.9 | 98.0 | 98.0 | 98.2 | 98.2 | |
| 15 and over | 1,808 | 1,492 | 3,300 | 2.1 | 2.0 | 2.0 | 1.8 | 1.8 |
| Totals | 93,085 | 85,424 | 178,509 | 100.0 | 100.0 | 100.0 | 100.0 | 100.0 |
Of the children in the public schools, 54 per cent. are under ten, and 46 per cent. are over that age. The proportion remains stationary.
The proportion of boys to girls remains about the same as for the previous decade—that is, 92 girls to every 100 boys on the roll.
The number of teachers in the public schools, exclusive of those employed in the secondary departments of district high schools, is shown for a number of years. The figures are as in December of the years given.
| Year. | Adults. | Pupil-teachers. | ||||
|---|---|---|---|---|---|---|
| Males. | Females. | Total. | Males. | Females. | Total. | |
* Excluding probationers, as follows: 1910—Males 32, females 151; 1911—males 41, females 178; 1912—males 36, females 186; 1903—males 41, females 224; 1914—males 45, females 278. | ||||||
| 1878 | 707 | 454 | 1,161 | 181 | 332 | 450 |
| 1883 | 905 | 656 | 1,561 | 159 | 571 | 730 |
| 1888 | 1,039 | 887 | 1,926 | 219 | 694 | 913 |
| 1893 | 1,107 | 1,096 | 2,203 | 238 | 825 | 1,063 |
| 1898 | 1,234 | 1,370 | 2,604 | 229 | 831 | 1,060 |
| 1903 | 1,270 | 1,726 | 2,996 | 147 | 552 | 699 |
| 1904 | 1,272 | 1,797 | 3,069 | 144 | 505 | 649 |
| 1905 | 1,302 | 1,835 | 3,137 | 151 | 528 | 679 |
| 1906 | 1,314 | 1,887 | 3,201 | 153 | 518 | 671 |
| 1907 | 1,332 | 1,955 | 3,287 | 172 | 478 | 650 |
| 1908 | 1,331 | 2,021 | 3,352 | 161 | 476 | 637 |
| 1909 | 1,406 | 2,208 | 3,614 | 166 | 530 | 696 |
| 1910 | 1,456 | 2,252 | 3,708 | 174* | 526* | 700* |
| 1911 | 1,493 | 2,351 | 3,844 | 179* | 528* | 707* |
| 1912 | 1,555 | 2,550 | 4,105 | 162* | 476* | 638* |
| 1913 | 1,603 | 2,659 | 4,262 | 142* | 474* | 616* |
| 1914 | 1,628 | 2,820 | 4,448 | 139* | 470* | 609* |
The total number of teachers, including probationers, in 1914 was 5,380 (1,812 males, 3,568 females), and the average number of pupils per teacher was 33.2. For the schools above Grade I having only one teacher—that is, schools with 16 to 35 children in average attendance — the average number of children per teacher was 23.2. Taking all schools with two or more teachers, it is found that the average number of pupils per adult teacher, reckoning two pupil-teachers as equivalent to one adult, was 38.7; and with the same assumption the average for all schools of Grade II and upwards was 35.9.
Omitting teachers of schools below Grade II, the ratio of adult men teachers to adult women teachers in 1913 was 100 to 152; and in 1914, 100 to 159. The proportion of men to women in charge of schools of Grade I and Grade 0 was 100 to 349 in 1913, and 100 to 385 in 1914. If all public schools and all adult teachers are included, it is found that the ratio of adult men teachers to adult women teachers was 100 to 166 in 1913, and 100 to 173 in 1914.
The ratio of male pupil-teachers to female pupil-teachers was 100 to 334 in 1913, and 100 to 338 in 1914.
It may be interesting to note the corresponding proportions for primary-school teachers, secondary teachers in district high schools and secondary schools (exclusive of visiting teachers), and for students in training colleges, respectively. Schools where the average attendance is fifteen or fewer pupils are not included.
| TEACHERS OR STUDENTS—NUMBER OF WOMEN PER 100 MEN. | |||||
|---|---|---|---|---|---|
| 1910. | 1911. | 1912. | 1913. | 1914. | |
| Adult primary teachers | 141 | 142 | 151 | 152 | 159 |
| Pupil-teachers | 302 | 295 | 293 | 334 | 338 |
| Secondary teachers | 85 | 84 | 82 | 83 | 83 |
| Training-college students | 219 | 197 | 252 | 251 | 249 |
| All teachers and students | 156 | 155 | 161 | 164 | 180 |
Out of a total of 5,874 persons engaged in the above-named branches of the teaching profession there were in 1914 2,101 men and 3,773 women.
Remembering that a much larger number of women than of men leave the profession after a few years of service, some idea may be formed of the extent to which New Zealand has been affected by the general tendency all over the world towards the increase of women in the teaching profession.
So far as can be gathered from the reports received from England, Scotland, and the United States, the following statement shows the number of women teachers per hundred men teachers:—
| England. | Scotland. | United States. | New Zealand. | |
|---|---|---|---|---|
| Adult primary teachers | 292 | 274 | 378 | 159 |
| Secondary teachers | 98 | .. | 130 | 88 |
| Training-college students | 175 | 496 | 400 | 249 |
Information as to the Teachers' Superannuation Fund will be found in the section of this book dealing with Pensions, Superannuation, &c.
Pour training colleges for teachers have now for some time been in active operation. At the close of the year the students in attendance numbered 430, of whom 123 were men and 307 were women. The corresponding total for the close of 1913 was 139, of whom 125 were male students. Among those attending during the year have also to be reckoned a few students who left before the close of the period either to go into active service under the Boards or for some other reason. A number of students left towards the close of the year 1914 to take up military service or to relieve teachers who had enlisted for active service The total provision in contemplation is for 125 students in each of the centres. Towards this number, out of the total reported, Auckland contributes 106; Wellington, 107; Christchurch, 102; and Dunedin, 115.
The management of the training colleges is entrusted to the local Education Boards, subject to general regulations which include certain reservations for the approval of the Minister of Education. The standard of admission generally is that of the University Matriculation Examination, and the course; pursued is brought into as intimate a relation as possible with the courses of lectures in the University college adjoining. All students are required to attend lectures in at least one subject other than education at the University college, to which the principal of the training college is in each case also attached as the University college lecturer on education. Of the number in attendance at the training colleges about 90 per cent. had already completed their course as pupil-teachers or probationers before entering the college, the remaining 10 per cent. being made up mainly of students who had qualified for admission by passing the Matriculation or a higher University examination, but were without previous teaching experience.
The ordinary course of training is for two years, so that approximately 200 students annually complete their training and pass into the schools. There is also provision for a one-year course which, under certain conditions, may be taken by University graduates or matriculated students who have had some University training in agriculture or home science. In addition, the Act of 1914 provides for short-period studentships for the benefit of teachers deemed worthy of further training in professional work.
For students in training allowances are provided. A student who has completed a pupil-teacher course receives an allowance of £40 a year, with a further allowance of £25 if he or she is obliged to live away from home to attend a training college. Those who have not been pupil-teachers receive an allowance of £20 a year, together with a boarding-allowance of £25 where necessary. In all cases free instruction at the University college classes approved by the principal is also given.
The Training College Regulations make provision for the granting of training-college certificates without further examination on the production of evidence of a satisfactory completion of the training-college course, and set out the essential requirements of that course. Provision is also made for some increase to the staff, and for the inclusion of at least four “model schools” of various types with a view to improving the students' opportunities of observation and teaching.
The amount paid during 1914 for the training of teachers was £47,217, made up as follows:—
| Training college— | £ |
|---|---|
| Salaries of staff (half charged to public-school salaries) | 8,096 |
| Students' allowances | 20,067 |
| University fees of students | 3,272 |
| Special instruction | 1,471 |
| Buildings | 5,007 |
| Total | £37,913 |
| Other training— | |
| Grants for special instruction in certificate subjects, including science, agriculture, and handwork, of teachers other than training-college students | £3,050 |
| Railway fares of teachers and instructors | 6,249 |
| Sundries | 5 |
| Total | £9,304 |
It must be remembered, however, that this total provides not only for the efficient training of 430 teachers, but also in part for the instruction of more than nineteen hundred children in attendance at the practising schools.
The total income of the various Education Boards for the year 1914 was £1,230,787, including £33,853 of refunds, fines, fees, donations, interest, &c. The grants by the State amounted to £1,196,933. These grants include education reserves revenue and payments to the Board of every district of a sum sufficient to pay the salaries of teachers and pupil-teachers in the district, and further payments of a sum of £250 per annum, together with a sum of 12s. per annum for each child in daily average attendance at a public school. Sums granted for the maintenance of training colleges and for manual and technical instruction are also included.
The receipts and expenditure of the Education Boards, numbering thirteen altogether, are tabulated below, with farther particulars:—
| RECEIPTS AND EXPENDITURE OF EDUCATION BOARDS, 1914. | |||||||||
|---|---|---|---|---|---|---|---|---|---|
| £ | s. | d. | |||||||
| Receipts. | |||||||||
| £ | s. | d. | |||||||
| Salaries of teachers (exclusive of secondary departments of district high schools), salaries and allowances of pupil teachers, and half of the total cost of the training-college staff,— | |||||||||
| Revenue from reserves | 64,158 | 10 | 8 | ||||||
| Revenue from other sources | 193 | 11 | 5 | ||||||
| Balance paid from Consolidated Fund | 652,632 | 9 | 1 | ||||||
| 716,984 | 11 | 2 | |||||||
| Salaries of relieving-teachers | 3,901 | 1 | 1 | ||||||
| Free school-books | 2,509 | 11 | 4 | ||||||
| General administration | 106,615 | 15 | 2 | ||||||
| Training colleges,— | |||||||||
| Salaries of staff (half of the total cost) | 7,765 | 14 | 1 | ||||||
| Allowances for students | 23,163 | 1 | 1 | ||||||
| Incidental expenses | 1,820 | 3 | 5 | ||||||
| Training of teachers (other than at training colleges) | 4,476 | 8 | 11 | ||||||
| 37,225 | 7 | 6 | |||||||
| Secondary education,— | |||||||||
| Scholarships— | £ | s. | d. | ||||||
| Board | 10,487 | 12 | 7 | ||||||
| National | 3,858 | 4 | 10 | ||||||
| Special | 293 | 15 | 7 | ||||||
| 14,639 | 13 | 0 | |||||||
| District high schools— | |||||||||
| Salaries of staffs of secondary departments | 17,375 | 4 | 9 | ||||||
| Other receipts— | |||||||||
| (a.) Voluntary contributions and subsidies | 2,112 | 0 | 9 | ||||||
| (b.) Fees from pupils | 116 | 11 | 8 | ||||||
| (c.) High School Boards' grants | 487 | 16 | 8 | ||||||
| 2,716 | 9 | 1 | |||||||
| 34,731 | 6 | 10 | |||||||
| Manual and technical,— | |||||||||
| School classes— | |||||||||
| Capitation | 31,185 | 8 | 8 | ||||||
| Voluntary contributions and bequests and subsidies | 1,455 | 17 | 11 | ||||||
| 32,641 | 6 | 7 | |||||||
| Special and associated classes— | |||||||||
| Capitation | 17,354 | 5 | 6 | ||||||
| Free and compulsory pupils | 2,980 | 6 | 6 | ||||||
| Material | 1,198 | 19 | 7 | ||||||
| Voluntary contributions and bequests and subsidies | 2,208 | 3 | 2 | ||||||
| Fees from pupils at special classes | 3,688 | 3 | 10 | ||||||
| Associated classes | 26,903 | 1 | 1 | ||||||
| 54,332 | 19 | 8 | |||||||
| Direction and administration (schools and special classes) | 51 | 4 | 5 | ||||||
| 87,025 | 10 | 8 | |||||||
| Buildings: Maintenance, rebuilding, rent,— | |||||||||
| Teachers' house allowances | 18,053 | 11 | 0 | ||||||
| Maintenance and small additions and ordinary rebuilding | 90,707 | 2 | 3 | ||||||
| Rebuilding schools destroyed by fire | 1,915 | 0 | 0 | ||||||
| Rents of buildings and sites for school purposes | 3,444 | 13 | 11 | ||||||
| Rents of buildings for manual and technical instruction | 662 | 8 | 4 | ||||||
| 114,782 | 15 | 6 | |||||||
| New buildings, furniture, additions, sites,— | |||||||||
| Public schools | 94,317 | 1 | 8 | ||||||
| Manual instruction | 2,612 | 18 | 4 | ||||||
| Technical instruction | 17,458 | 15 | 5 | ||||||
| 114,388 | 15 | 5 | |||||||
| Sites sales | 3,604 | 16 | 1 | ||||||
| Other separate accounts,— | |||||||||
| Contractors' deposits | 2,913 | 3 | 11 | ||||||
| Wanganui School site | 4,484 | 4 | 3 | ||||||
| Rees Bequest Fund | 50 | 0 | 0 | ||||||
| Sundry accounts | 35 | 10 | 4 | ||||||
| Superannuation | 217 | 7 | 4 | ||||||
| War funds | 1,317 | 14 | 6 | ||||||
| 9,018 | 0 | 4 | |||||||
| Totals | 1,230,787 | 11 | 1 | ||||||
| Expenditure. | |||||||||
| Salaries of teachers (exclusive of secondary departments of district high schools), salaries and allowances of pupil-teachers, and half of the total cost of the training-college staff | 716,749 | 8 | 11 | ||||||
| Salaries of relieving-teachers | 4,353 | 0 | 1 | ||||||
| Free school-books | 2,354 | 12 | 3 | ||||||
| General administration,— | |||||||||
| (a.) Incidental expenses of schools (cleaning, fuel, &c., in terms of Board's regulations, but exclusive of cost of works paid for out of Government grant for maintenance of school buildings and included below under that heading) | 46,677 | 11 | 4 | ||||||
| (b.) Conveyance of school-children | 6,398 | 15 | 8 | ||||||
| (c.) Board of school-children | 926 | 18 | 0 | ||||||
| (d.) Office staff (including Secretary, Inspectors, &c.), salaries, and clerical assistance | 32,209 | 18 | 3 | ||||||
| (e.) Office contingencies | 16,426 | 0 | 0 | ||||||
| (f.) Refunds and sundries | 535 | 5 | 8 | ||||||
| (g.) Rents | 37 | 6 | 10 | ||||||
| 103,211 | 15 | 9 | |||||||
| Training colleges,— | |||||||||
| Salaries of staff (half of the total cost) | 7,784 | 7 | 2 | ||||||
| Allowances for students | 22,371 | 19 | 0 | ||||||
| Incidental expenses | 2,303 | 17 | 1 | ||||||
| Training of teachers (other than at training college) | 4,719 | 19 | 7 | ||||||
| 37,180 | 2 | 10 | |||||||
| Secondary education,— | |||||||||
| Scholarships— | £ | s. | d. | ||||||
| Board | 10,465 | 16 | 9 | ||||||
| National | 3,842 | 1 | 0 | ||||||
| Special | 361 | 3 | 0 | ||||||
| 14,669 | 0 | 9 | |||||||
| District high schools— | |||||||||
| Salaries of staffs of secondary departments | 17,489 | 9 | 10 | ||||||
| General Purposes— | |||||||||
| (a.) Voluntary contributions and subsidies | 2,061 | 2 | 11 | ||||||
| (b.) Fees from pupils | 10 | 0 | 0 | ||||||
| (c.) High School Boards grants | 206 | 15 | 3 | ||||||
| 19,767 | 8 | 0 | |||||||
| Manual and technical,— | 34,436 | 8 | 9 | ||||||
| School classes | 32,393 | 14 | 4 | ||||||
| Special and associated classes | 51,164 | 6 | 0 | ||||||
| Direction and administration (school and special classes) | 5,791 | 18 | 4 | ||||||
| 89,349 | 18 | 8 | |||||||
| Buildings: Maintenance, rebuilding, rent,— | |||||||||
| (a) Maintenance and small additions | 69,600 | 8 | 5 | ||||||
| (b) Ordinary rebuilding | 6,585 | 8 | 9 | ||||||
| Rebuilding schools destroyed by fire | 1,339 | 7 | 3 | ||||||
| Rents of buildings and sites for school purposes | 3,414 | 17 | 11 | ||||||
| Rent of buildings for manual and technical instruction purposes | 815 | 4 | 5 | ||||||
| Teachers' house allowances | 17,892 | 5 | 3 | ||||||
| 99,647 | 12 | 0 | |||||||
| New buildings, furniture, additions, sites,— | |||||||||
| Public schools | 92,590 | 17 | 8 | ||||||
| Manual instruction | 2,699 | 9 | 6 | ||||||
| Technical instruction | 14,945 | 9 | 0 | ||||||
| 110,235 | 16 | 2 | |||||||
| Purchase of sites | 7,646 | 13 | 2 | ||||||
| Other separate accounts,— | |||||||||
| Superannuation | 217 | 7 | 4 | ||||||
| Contractors' deposits | 3,076 | 14 | 2 | ||||||
| Wanganui School sites | 1,192 | 12 | 2 | ||||||
| Rees Bequest Fund | 0 | 10 | 0 | ||||||
| War funds | 1,237 | 18 | 1 | ||||||
| Sundry accounts | 11 | 13 | 4 | ||||||
| 5,736 | 15 | 1 | |||||||
| Totals | 1,210,902 | 3 | 8 | ||||||
| Net balance at beginning of year 1914 | 31,617 | 12 | 0 | ||||||
| Net balance at the end of year 1914 | 51,501 | 19 | 5 | ||||||
Excluding the expenditure on buildings, the chief items of expenditure in 1913 and 1914 were as follows:—
| 1913. | 1914. | |
|---|---|---|
| £ | £ | |
| Boards' administration | 48,004 | 48,267 |
| Incidental expenses of schools | 46,412 | 46,678 |
| Teachers' salaries | 668,094 | 716,749 |
| Training colleges | 37,664 | 37,180 |
| Scholarships and district high schools | 33,072 | 34,436 |
| Manual and technical instruction | 82,030 | 89,350 |
The increase in teachers' salaries is due to the increase in the number of children receiving instruction, and the yearly increment in salaries as provided by section 14 (2) of the Education Amendment Act, 1913.
The proportion of the expenditure by Boards for administration to their whole income and the corresponding proportion of the incidental expenses of schools (through School Committees) for the last rive years have been as follows:—
| Boards. Per Cent. | Committees. Per Cent. | Total. Per Cent. | |
|---|---|---|---|
| 1910 | 4.3 | 3.9 | 8.2 |
| 1911 | 4.4 | 4.3 | 8.7 |
| 1912 | 4.3 | 4.0 | 8.3 |
| 1913 | 4.3 | 4.1 | 8.4 |
| 1914 | 3.9 | 3.8 | 7.7 |
There were 321 private schools at the end of 1914, an increase of 17 on the number in 1913: 31 were for boys, 64 for girls, and 226 for children of both sexes. The number of pupils attending them was 22,080—namely, 9,641 boys and 12,439 girls, not counting 167 Maoris, 78 boys and 89 girls. The number of European pupils at these schools was greater than in 1913 by 965. Of the private schools, 180 were Roman Catholic, with an attendance of 16,471 pupils, an increase of 25 schools and 1,634 pupils as compared with 1913.
The following gives, for the past ten years, the number of private schools and of European scholars attending them, the number of Roman Catholic schools and pupils being also shown separately:—
| Year. | Number of Private Schools. | Pupils. | Included in Previous Numbers. | |||
|---|---|---|---|---|---|---|
| Boys. | Girls. | Totals. | Roman Catholic Schools. | Pupils at Roman Catholic Schools. | ||
| 1905 | 291 | 6,837 | 9,802 | 16,639 | 146 | 11,738 |
| 1906 | 308 | 7,026 | 10,105 | 17,131 | 154 | 11,948 |
| 1907 | 302 | 7,510 | 10,578 | 18,088 | 152 | 12,650 |
| 1908 | 307 | 7,653 | 10,714 | 18,367 | 149 | 12,538 |
| 1909 | 306 | 7,597 | 10,333 | 17,930 | 150 | 12,611 |
| 1910 | 318 | 8,036 | 10,945 | 18,981 | 156 | 13,161 |
| 1911 | 326 | 8,310 | 11,558 | 19,868 | 158 | 13,941 |
| 1912 | 310 | 8,801 | 11,437 | 20,238 | 156 | 14,476 |
| 1913 | 304 | 9,146 | 11,969 | 21,115 | 155 | 14,837 |
| 1914 | 321 | 9,641 | 12,439 | 22,080 | 180 | 16,471 |
The distribution of the private schools in the various provincial districts is shown on the next page.
| PRIVATE SCHOOLS. 1914.–SUMMARY BY PROVINCIAL, DISTRICTS. | |||||||||||||
|---|---|---|---|---|---|---|---|---|---|---|---|---|---|
| Provincial Districts. | Number of Schools | Number of Teachers. | Number of Scholars (exclusive of Maoris). | Daily Average Attendance. | |||||||||
| Boys. | Girls. | Mixed. | Total. | Male. | Female. | Total. | Male. | Female. | Total. | Male. | Female. | Total. | |
* Exclusive of 167 Maoris (78 boys, 89 girls). | |||||||||||||
| Auckland | 6 | 13 | 53 | 72 | 35 | 245 | 280 | 2,453 | 3,223 | 5,676 | 2,186 | 2,946 | 5,132 |
| Taranaki | 1 | 3 | 13 | 17 | 3 | 41 | 44 | 483 | 608 | 1,091 | 455 | 555 | 1,010 |
| Hawke's Bay | 2 | 3 | 14 | 19 | 7 | 73 | 80 | 523 | 789 | 1,312 | 481 | 743 | 1,224 |
| Wellington | 9 | 16 | 52 | 77 | 40 | 221 | 261 | 2,339 | 2,633 | 4,972 | 2,103 | 2,359 | 4,462 |
| Marlborough | 1 | 1 | 4 | 6 | … | 14 | 14 | 119 | 158 | 277 | 104 | 148 | 252 |
| Nelson | 1 | 4 | 10 | 15 | 13 | 43 | 56 | 597 | 626 | 1,223 | 540 | 569 | 1,109 |
| Westland | 1 | 2 | 10 | 13 | 3 | 32 | 35 | 407 | 457 | 864 | 361 | 397 | 758 |
| Canterbury | 7 | 12 | 38 | 57 | 18 | 171 | 189 | 1,527 | 2,142 | 3,669 | 1,348 | 1,892 | 3,240 |
| Otago Otago portion | 2 | 8 | 24 | 34 | 13 | 104 | 117 | 889 | 1,400 | 2,289 | 805 | 1,294 | 2,099 |
| Southland portion | 1 | 2 | 8 | 11 | 3 | 25 | 28 | 304 | 403 | 707 | 272 | 361 | 633 |
| Totals | 31 | 64 | 226 | 321 | 135 | 969 | 1,104 | 9,641 | 12,439 | 22,080 | 8,655 | 11,264 | 19,919 |
Denominational schools, such as Roman Catholic and Anglican, are included in the above as private schools. Particulars for the Roman Catholic schools in December, 1914, are as under:—
| SUMMARY OF ROMAN CATHOLIC SCHOOLS. | |||||||||||||
|---|---|---|---|---|---|---|---|---|---|---|---|---|---|
| Provincial Districts. | Number of Schools | Number of Teachers. | Number of Scholars (exclusive of Maoris). | Daily Average Attendance. | |||||||||
| Boys. | Girls. | Mixed. | Total. | Male. | Female. | Total. | Male. | Female. | Total. | Male. | Female. | Total. | |
| Auckland | 3 | 5 | 25 | 33 | 13 | 127 | 140 | 1,779 | 2,145 | 3,924 | 1,589 | 1,957 | 3,546 |
| Taranaki | … | 1 | 9 | 10 | … | 29 | 29 | 409 | 510 | 919 | 385 | 468 | 853 |
| Hawke's Bay | 1 | … | 8 | 9 | 3 | 26 | 29 | 425 | 501 | 926 | 395 | 466 | 861 |
| Wellington | 5 | 8 | 18 | 31 | 20 | 105 | 125 | 1,559 | 1,680 | 3,239 | 1,416 | 1,540 | 2,956 |
| Marlborough | 1 | … | 3 | 4 | … | 12 | 12 | 108 | 149 | 257 | 94 | 139 | 233 |
| Nelson | 1 | 4 | 8 | 13 | 13 | 39 | 52 | 574 | 601 | 1,175 | 519 | 546 | 1,665 |
| Westland | 1 | 2 | 9 | 12 | 3 | 30 | 33 | 404 | 449 | 853 | 358 | 389 | 747 |
| Canterbury | 3 | 6 | 19 | 28 | 9 | 79 | 88 | 1,007 | 1,232 | 2,239 | 910 | 1,110 | 2,020 |
| Otago Otago portion | 2 | 8 | 22 | 32 | 13 | 102 | 115 | 880 | 1,393 | 2,273 | 796 | 1,287 | 2,083 |
| Southland portion | 1 | 2 | 5 | 8 | 3 | 21 | 24 | 288 | 378 | 666 | 259 | 338 | 597 |
| Totals | 18 | 36 | 126 | 180 | 77 | 570 | 647 | 7,433 | 9,038 | 16,471 | 6,721 | 8,240 | 14,961 |
Any private primary school may apply to have the school inspected, and the school thereupon becomes “subject to inspection.” Such schools are inspected by officers of Education Boards. At the end of 1914 the number of private primary schools subject to inspection was 186. The total roll number was 16,309, and the average attendance 14,809.
The roll number of the private secondary schools subject to inspection was 850.
The number of Native village schools in operation at the end of 1914 was 115. In addition, there were thirteen private schools at which education for Maori boys and girls is provided. Of these ten are maintained from the incomes arising out of lands held in trust for educational purposes by various denominational bodies; the others are supported by private resources.
As required by law, instruction in all Native schools is given through the medium of the English language only. The subjects of the school course are English, arithmetic, drawing and handwork, nature-study and geography, health and moral instruction and civics, singing, and physical drill.
Instruction in woodwork is given in thirteen schools, and the girls are taught practical dressmaking and plain cookery in an increasing number of schools. Elementary agriculture is taught in about twelve schools. In the majority of schools some form or other of elementary handwork is taken with success.
At one or other of the ten boarding-schools—Otaki, St. Stephen's (Auckland), Te Aute, Waerenga-a-hika, and Hikurangi for boys, and Hukarere, St. Joseph's (Napier), Queen Victoria (Auckland), Turakina, and Te Waipounamu Schools for girls—the Government provides a number of free places, tenable for two years, for children of predominantly Maori race who pass the higher standards at the Maori village schools. At the end of the year the number of pupils on the rolls of these schools was 435. Free places were also held by Maori pupils at the Sacred Heart College, Auckland (2), the Boys' and Girls' Grammar Schools. Auckland (2), and the Auckland Technical College (1).
The number of scholarships or free places open to Maori children was 150, of which 112 were current at the end of 1914.
Senior free places for boys take the form of industrial scholarships, enabling the holders to be apprenticed to suitable trades—carpentry, black-smithing, engineering, or farming. The payment made under the scheme enables the lads to support themselves in the first years of their apprenticeship. The results obtained under this scheme have been very satisfactory, the only obstacle to an extension of the scheme being the difficulty of finding positions for many deserving candidates. At the end of 1914 there were six industrial scholarships current—three of the holders being apprenticed to carpentry, one to blacksmithing, one to bootmaking, and one to engineering.
The senior free places offered to girls take the form of nursing-scholar ships. At present there are three junior nursing scholars or pupil nurses, while four, having completed the primary course, are on the hospital staff as probationers.
On the rolls of the 115 schools at the 31st December, 1914, there were 5,072 children (including 551 Europeans), as against 4,647 at the end of 1913. The average attendance for the year was 4,385, the percentage of regularity being 86.7. The average weekly roll number shows an increase of 218, being 5,053 as against 4,835. The total number of pupils on the rolls of the Native mission schools was 127, and on those of the secondary schools 435. At the end of the year, therefore, the total roll number of all the Native schools inspected by officers of the Education Department was 5,634, the average weekly roll being 5,590, and the gross average attendance 4,871.
The total net expenditure on Native schools during the year ended the 31st March, 1915, including £2,757 paid from reserves funds, was £37,133. Included in this is the sum of £29,010 expended on teachers' salaries, £537 expended on new buildings and additions, £1,012 on maintenance of buildings, repairs, &c., and £2,184 on secondary education, including boarding-school fees for holders of scholarships from village schools, apprenticeship charges, and nursing-scholarships.
The stall's of the village schools included eighty-seven masters, twenty-seven mistresses in charge, 126 assistants, and three sewing-teachers. The average salary of the head teachers was £171 10s. 11d., and of assistants £66 13s. 1d. (including lodging-allowance).
Besides the children of the Maori race who are receiving instruction in the Native schools at the end of 1914, there is a still larger number attending public schools; so that the total number of primary pupils of Maori race (including those in the Mission schools) is 9,553, made up as follows:—
| Attending Government Native schools | 4,521 |
|---|---|
| ” public schools | 4,905 |
| ” Mission schools | 127 |
| 9,553 |
The number of Maori children in the public schools continues to show an increase, owing principally to the fact that the policy has been steadily followed of handing over Native schools to the Education Boards as soon as the pupils have become, educationally at least, so far European in character that they can be conveniently taught with European children. This point is reached when the Maori can use English fluently in his ordinary conversation. It is part of the same policy to assimilate the programme of work in Native schools as nearly as possible to that in public schools. Thirty certificates of proficiency and eleven certificates of competency were gained by Maori children in public schools in 1914.
Of the children on the rolls of the Native schools in December, 1914, 86.5 per cent. were Maoris speaking Maori in their homes, 2.6 per cent. were Maoris speaking English, and 10.9 per cent. were Europeans. In connection with this classification it is to be noted that the term “Maori” applies only to children who are by birth full Maori, three-quarter Maori, or half-caste, and excludes children who are three-quarter European.
So far as can be ascertained from the statistics obtainable the number of children of Maori or mixed race on the rolls of primary schools, secondary schools, Native mission schools, and secondary Native schools, together with such pupils as were receiving special technical training, at the end of 1914 was as follows:—
| — | Actual Number. | Number per 10,000 of Maori Population at Census of 1911. |
|---|---|---|
| I. Primary schools— | ||
| (a.) Government Native schools | 4,521 | 907 |
| (b.) Mission schools | 127 | 26 |
| (c.) Public schools | 4,905 | 984 |
| II. Secondary schools | 435 | 87 |
| III. Special technical training | 9 | 2 |
| Totals | 9,997 | 2,006 |
The special schools of the Dominion provide for the instruction of children who are deaf, blind, feeble-minded, epileptic, delinquent, neglected, or indigent. The function of such schools in the educational system of a country is to endeavour to overcome as far as practicable the disabilities under which these young people suffer, and ultimately to give them an equipment for their work in life that will enable them to maintain themselves without assistance from the public funds or from their friends.
By the Education Amendment Act which became law in 1910 extended provision was made for the education and training of young persons who are deaf, blind, feeble-minded, or epileptic. They now come under efficient and suitable instruction at the age of six years, and remain so until they reach twenty-one years, unless previous to that time the Education Department is satisfied that their educational attainments or their proficiency in some art or handicraft or other calling enable them to provide for their future needs without further instruction.
If the near relative of a child so affected does not provide the education required, the Minister of Education may direct that the child be sent to a school where he will have the special instruction suited to his needs, the cost of maintenance and training to be borne by the relatives according to their means and as agreed upon between them and the Minister. In the event of the Minister's direction not being complied with, a Magistrate may order the child's admission to a special school and fix the rate of the maintenance payment. The question whether or not a child is sufficiently affected to warrant his being regarded as coming under these provisions of the Act is determined by his ability to receive proper benefit from ordinary school instruction. Charitable Aid Boards are made responsible in necessitous cases for payment to a limited extent for the maintenance of children in these schools.
Parents, school-teachers (either public or private), constables, or officers of charitable or kindred institutions who are aware of the place of residence of blind, deaf, epileptic, or feeble-minded children, and the occupier of the house in which such a child lives, are required to notify the Education Department.
On the average the total number belonging to special schools during 1914 was 3,224, an increase of 111 over the number for the previous year; and the net charge on the public funds for the year was £57,309. The figures for each class of school were as follows:—
| Number under Government Control. | Net Cost. | |
|---|---|---|
| £ | ||
| School for the Deaf | 101 | 3,979 |
| Jubilee Institute for the Blind | 34 | 158 |
| Special School for Boys of Feeble Mind | 71 | 5,754 |
| Under control of Industrial Schools (State and private) | 3,018 | 47,418 |
| 3,224 | £57,309 |
Of the total cost, £4,987 represents the amount expended in the purchase of land, erection of new buildings, and equipment of institutions. The total amount collected from parents and guardians by way of payment towards the cost of education and maintenance was £9,598.
A special school has been established for the training of boys of feeble mind, and there is good ground for anticipating that its effect in training boys of this class to make a living for themselves will fully justify its existence. A similar school for girls is being equipped at Richmond, near Nelson, and will shortly be ready for the reception of pupils.
In 1909 important amendments were made by the Legislature in the Industrial Schools Act Power is given to a Magistrate to extend from time to time the period of control over a young man or woman who is adjudged by him to be morally degenerate or otherwise not (in the public interest) a fit person to be free from control. Another far-reaching provision is that giving power to the police to bring before a Magistrate on warrant, with a view to admission to an industrial school, any boy or girl under sixteen years of age who “is not under proper control.”
In December, 1914, the total number of children on the books of industrial schools was 3,018, or 110 more than at the close of 1913; on the books of the State schools there were 2,580, an increase of 88 over the corresponding number for 1913; on the books of the private schools there were 438, or 22 more than at the end of the previous year. The number in residence at State schools was 701 and at private schools 296, so that 997 was the total number of inmates actually in residence. The number boarded out was 1,056.
There were eight State industrial schools in existence in 1914, and the numbers of inmates on their books at the end of the year were as follows: Auckland (Mount Albert), 235; Boys' Training Farm, Weraroa, 367; Receiving Home, Wellington, 611; Boys' Training Farm, Nelson, 247; Receiving Home, Christchurch, 380; Burnham Boys' Reformatory, 261; Te Oranga Home, Girls' Reformatory, 114; Caversham, 365: total, 2,580. Those belonging to private schools were distributed as follows: St. Mary's, Auckland, 227; St. Joseph's, Upper Hutt, 68; St. Mary's, Nelson, 78; St. Vincent de Paul's, Dunedin, 65: total, 438.
| NUMBERS UNDER CONTROL, 31ST DECEMBER, 1914. | |||||||||||||||||||||
|---|---|---|---|---|---|---|---|---|---|---|---|---|---|---|---|---|---|---|---|---|---|
| Location. | State Industrial Schools. | Private Industrial Schools. | All Industrial Schools. | ||||||||||||||||||
| Auckland. | Boys' Training Farm, Weraroa. | Receiving Home, Wellington. | Boys' Training Farm, Nelson. | Te Oranga Home. | Receiving Home, Christchurch. | Burnham. | Caversham. | St. Mary's, Auckland. | St. Joseph's, Upper Hutt | St. Mary's, Nelson. | St. Vincent de Paul's, Dunedin. | Boys. | Girls. | Total. | |||||||
| B. | G | B. | B. | G. | B. | G. | B. | G. | B. | B. | G. | B. | G. | G. | B. | G. | G. | ||||
| In the schools | .. | 46 | 193 | 5 | 2 | 158 | 76 | .. | 7 | 170 | .. | 44 | 72 | 57 | 52 | 34 | 37 | 44 | 632 | 365 | 997 |
| Boarded out | 56 | 51 | .. | 272 | 200 | 23 | .. | 132 | 123 | .. | 105 | 89 | 1 | 1 | .. | 1 | .. | 1 | 590 | 466 | 1,056 |
| With friends | 8 | 10 | 21 | 29 | 31 | 16 | 2 | 7 | 7 | 33 | 22 | 17 | 22 | 10 | 6 | 1 | .. | 5 | 159 | 88 | 247 |
| At service | 6 | 37 | 121 | 37 | 22 | 48 | 25 | 27 | 44 | 21 | 26 | 32 | 28 | 35 | 3 | .. | 4 | 12 | 307 | 214 | 521 |
| Under guardianship | 4 | .. | 2 | 1 | 2 | 1 | .. | 7 | 5 | 1 | 15 | 5 | .. | 2 | .. | .. | .. | 1 | 31 | 15 | 46 |
| Committed, but on probation | 1 | 1 | 9 | .. | .. | .. | .. | .. | .. | 3 | .. | .. | .. | .. | .. | .. | .. | .. | 13 | 1 | 14 |
| In hospitals, convalescent homes, &c. | .. | 1 | 1 | .. | 2 | 1 | 1 | 2 | 2 | .. | 1 | .. | .. | .. | 1 | .. | 1 | 1 | 5 | 9 | 14 |
| In mental hospitals | .. | 1 | 1 | .. | .. | .. | 3 | 2 | .. | 1 | .. | .. | .. | .. | .. | .. | .. | .. | 4 | 4 | 8 |
| At School for the Deaf | .. | .. | .. | .. | 1 | 1 | .. | .. | .. | .. | .. | .. | .. | .. | .. | .. | .. | .. | 1 | 1 | 2 |
| At Special School, Otekaike | 2 | .. | 2 | 3 | .. | .. | .. | 5 | .. | 1 | 2 | .. | .. | .. | .. | .. | .. | .. | 15 | .. | 15 |
| At Jubilee Institute or the Blind | .. | .. | 1 | .. | .. | .. | .. | .. | .. | .. | .. | .. | .. | .. | .. | .. | .. | .. | 1 | .. | 1 |
| Under control of refuges or cognate institutions | .. | 9 | .. | .. | 1 | .. | 4 | .. | 2 | .. | .. | 1 | .. | 1 | 1 | .. | .. | .. | .. | 19 | 19 |
| Under control of orphanages, cottage homes, &c. | 1 | 1 | .. | .. | 2 | .. | .. | 1 | 3 | .. | 5 | .. | .. | .. | 4 | .. | .. | 1 | 7 | 11 | 18 |
| With the Expeditionary Forces | .. | .. | .. | .. | .. | 1 | .. | .. | .. | 3 | .. | .. | .. | .. | .. | .. | .. | .. | 4 | .. | 4 |
| In gaol | .. | .. | .. | .. | .. | .. | .. | .. | .. | 6 | .. | .. | .. | .. | .. | .. | .. | .. | 6 | .. | 6 |
| Absent without leave | .. | .. | 16 | 1 | .. | .. | 3 | 3 | 1 | 22 | 1 | .. | .. | .. | .. | .. | .. | .. | 46 | 4 | 50 |
| Totals | 78 | 157 | 367 | 343 | 263 | 247 | 114 | 186 | 194 | 261 | 177 | 188 | 121 | 106 | 68 | 36 | 42 | 65 | 1,821 | 1,197 | 3,018 |
The numbers of children on the books at the end of the years 1913 and 1914 respectively whose maintenance was a charge against the public funds were as follows:—
| 1913. | 1914. | |||||
|---|---|---|---|---|---|---|
| In the schools | 916 | 997 | ||||
| Boarded out | 996 | 1,056 | ||||
| With friends | 297 | 247 | ||||
| At service | 500 | 521 | ||||
| At other institutions, under guardianship, &c. | 199 | 197 | ||||
| Totals | 2,908 | 3,018 | ||||
| 1913. | 1914. | |||||
| £ | s. | d. | £ | s. | d. | |
| Amount of parental contributions | 8,092 | 0 | 0 | 7,538 | 0 | 0 |
| Rate per head for children maintained | 4 | 5 | 5 | 3 | 13 | 9 |
| EXPENDITURE ON STATE INDUSTRIAL SCHOOLS, 1914-15. | |||||||
|---|---|---|---|---|---|---|---|
| School. | Number of Inmates belonging at 31st December, 1914. | Cost of School, including Buildings and other Works. | Boarding out. [Included in column (2).] | Salaries. [Included in column (2).] | New Buildings and other Works. [Included in column (2).] | Recoveries from Parents and Others, and Sales from Farms, &c. | Net Cost. [Column (2) less column (6).] |
| (1.) | (2.) | (3.) | (4.) | (5.) | (6.) | (7.) | |
* Exclusive of cost of administration, inspection, &c. | |||||||
| £ | £ | £ | £ | £ | £ | ||
| Auckland | 235 | 4,537 | 2,095 | 820 | … | 1,815 | 2,722 |
| Boys' Training Farm, Weraroa | 367 | 8,987 | … | 2,807 | ... | 2,274 | 6,713 |
| Receiving Home, Wellington | 611 | 12,305 | 9,213 | 1,016 | … | 6,959 | 5,346 |
| Boys' Training Farm, Nelson | 247 | 10,159 | 557 | 2,592 | 2,416 | 1,689 | 8,470 |
| Receiving Home, Christchurch | 380 | 7,792 | 5,659 | 921 | … | 2,718 | 5,074 |
| Te Oranga Home | 114 | 3,253 | … | 1,228 | … | 219 | 3,034 |
| Burnham | 261 | 9,271 | … | 3,413 | 12 | 879 | 8,392 |
| Caversham | 365 | 7,095 | 4,151 | 1,156 | 314 | 3,794 | 3,301 |
| Totals | 2,580 | 63,399 | *21,705 | 13,953 | 2,742 | 20,347 | 43,052 |
| Salaries, travelling allowances and expenses of certain departmental officers (Inspectors, visiting officers, &c.) | 2,550 | ||||||
| Amount paid to Postal Department for payment of boarding-out orders* | 100 | ||||||
| Sundries | 49 | ||||||
| Total net cost | 45,751 | ||||||
The next table shows payments made by the State on account of inmates in private industrial schools, the recoveries, and the net expenditure by the State. The contributions from Charitable Aid Boards to these schools, being made directly to the managers, are not included in the recoveries shown.
| EXPENDITURE ON PRIVATE INDUSTRIAL SCHOOLS. 1914–15. | |||
|---|---|---|---|
| Name of School. | Gross Cost. | Recoveries. | Net Cost. |
| £ | £ | £ | |
| St. Mary's, Auckland | 1,444 | 396 | 1,048 |
| St. Joseph's, Upper Hutt | 257 | 126 | 131 |
| St. Mary's, Nelson | 519 | 156 | 363 |
| St. Vincent de Paul's, Dunedin | 74 | 34 | 40 |
| Totals | 2,294 | 712 | 1,582 |
This institution is governed by a Board of Trustees, four of whom are appointed by the Government, and the remaining five elected by the subscribers to the funds of the institute. As the institute comes within the scope of the Hospitals and Charitable Institutions Act, subsidy at the rate of 24s. in the pound is payable by the State on voluntary subscriptions received by the Board, and 10s. in the pound on the value of bequests. The amount of such subsidy paid to the Board during its last financial year was £1,803.
The State contributed £804 towards the cost of training 34 pupils. The amount recovered from parents and Charitable Aid Boards was £646, so that the net cost to the State was £158. The amount of contributions by parents and guardians for 1914 was £265; for 1913 it was £329.
The Education Department maintains a school for deaf children at Sumner, the numbers belonging to the institution at the end of 1913 and 1914 being 103 and 101 respectively.
The method of instruction used is the oral method, in favour of which there is a vast predominance of expert opinion.
The following classes of deaf children are admitted to the institution, mental soundness being in all cases a necessity:—
Children born deaf, or who have lost their hearing before learning to speak.
Children who can hear a little, but are too deaf to be taught in an ordinary school.
Children who have lost their hearing after having learned to speak.
Twelve pupils were removed from school at the end of the year 1914, having reached a satisfactory standard of education. The length of their school life varied from five and a half to eleven years. Of twelve new pupils received during the year six were over ten years of age, and three of these were over twelve years of age.
The cost of the school for the years 1913-14 and 1914-15 respectively was as follows:—
| 1913-14. | 1914-15. | |
|---|---|---|
| £ | £ | |
| Salaries | 3,574 | 3,959 |
| Maintenance of pupils and sundries | 1,796 | 1,883 |
| Maintenance of buildings, and water charges | 216 | 270 |
| Additional buildings | 1,553 | .. |
| Less—Amount collected from parents by way of maintenance contributions | 1,173 | 1,027 |
| Amounts collected from Charitable Aid Boards | 1,210 | 1,100 |
| Sundry other recoveries | 1 | 6 |
| Net expenditure on the institution | 4,755 | 3,979 |
This school is situated at Otekaike, in North Otago, near the Oamaru–Hakataramea Railway. It is not yet fully organized; but additional buildings that are now nearing completion will provide accommodation for a considerably increased number of pupils. This school deals only with those who are capable of being trained in some degree; those more severely afflicted are dealt with by the Mental Hospitals Department.
By order of a Magistrate a young person who is epileptic or feebleminded may be kept under the guidance and control of a special school beyond the age of twenty-one years if it is considered that he is not fit to guide his own life, or that it is otherwise in the public interest desirable that he should be under institutional oversight. In connection with proceedings of this kind the Magistrate appoints counsel to represent the inmate at the hearing. The period of extended guidance is not to exceed four years in the first instance, but on its expiry it may be renewed from time to time by similar procedure, and thus, where necessary, lifelong control is retained. In such cases orders for maintenance against the near relatives may be made.
At present there are sixty-live boys in residence at the Otekaike School. There are also four girls under control, who are boarded out.
The inmates are instructed in the occupations of basket-making, coir-mat making, and wood-carving, and the quantity and quality of the articles produced is evidence of the usefulness and success of the instruction given. Farm and garden work is also carried out by the inmates, the institution producing more of such commodities as milk, fruit, and vegetables than its own requirements demand. Much of the school-work takes the form of handwork and kindergarten occupations.
The cost of the school for 1913-14 was £3,886, and for 1914-15 £5,754, made up as follows:—
| 1913-14. | 1914-15. | |
|---|---|---|
| £ | £ | |
| Salaries | 2,471 | 2,510 |
| Maintenance of pupils | 2,426 | 2,212 |
| Maintenance of buildings | 315 | 172 |
| Farm and stock | 270 | 165 |
| Additional buildings, furniture, &c. | 121 | 2,245 |
| Less—Amount collected from parents by way of maintenance contributions | 777 | 723 |
| Amount collated from Charitable Aid Boards | 857 | 694 |
| Sundry other recoveries | 83 | 133 |
| Net expenditure on the institution | 3,886 | 5,754 |
The infant-life protection system deals with children under six years of age who are placed privately by their parents or guardians in foster-homes for payment. To a large extent they are the illegitimate children of young girls. They are not, as industrial-school children are, under State guardianship, but the homes of the foster-parents are licensed to receive children, the number that may be retained in the home being limited strictly according to the capacity of the home.
The number of homes thus licensed was 1,122 at the end of 1914, and the number of children in them under oversight during the year was 1,423, an increase of 93 over the previous year. Of this total the number of infants under one year was 570.
Twenty children died, being 1.4 per cent. of those in the homes. Of the twenty children who died in 1914, ten were in foster-homes and ten in hospitals or nursing-homes to which they had been removed for treatment, so that the deaths in foster-homes represented 0.7 per cent. of the total number dealt with.
The expenditure for the year ended the 31st March, 1915, was £1,374, as follows:—
| £ | |
|---|---|
| Salaries of visiting nurses and local representatives | 1,018 |
| Travelling-expenses of district agents, visiting nurses, and local representatives | 216 |
| Payment to foster-parents for board of infants | 120 |
| Medical attendance | 15 |
| Office expenses (including rent) and sundries | 76 |
| 1,445 | |
| Less recoveries | 71 |
| Total | 1,374 |
The Education Act provides for public instruction in such subjects of manual training and of art, science, and technology as are set forth in regulations. The Act provides also for manual instruction in primary and secondary schools. Classes recognized under the Act are eligible for grants in aid of necessary buildings, equipment, and material, for capitation, and for subsidies of £1 for £1 on voluntary contributions.
Free technical education is also provided for. Persons complying with the conditions prescribed by the regulations are entitled to hold junior free places at technical schools or classes. These free places are tenable for two years, and may be continued under certain conditions for three years more as senior free places. In order that the substratum on which technical education is based may be sound, it is made a condition of the tenure of junior free places that the holders shall receive instruction in one or more subjects of general instruction, such as English and arithmetic or some other branch of mathematics, in addition to instruction in technical subjects. Holders of senior free places are required to take up definite courses of technical instruction. The Act also empowers a School Committee to request an Education Board to frame regulations requiring the attendance at continuation or technical classes of boys or girls within the school district between the ages of fourteen and seventeen who are not otherwise receiving a suitable education or who are not specially exempted by the regulations.
The controlling authorities of classes for manual and technical instruction are Education Boards, governing bodies of secondary schools and University colleges, and, in the case of certain classes in existence prior to 1904, the managers of those classes. School classes, or classes held in connection with primary or secondary schools, are under the control of the Education Boards or of the governing bodies respectively. “Special” classes—i.e., classes the controlling authority of which is an Education Board or the governing body of a secondary school—continue to he the most numerous and the most widely distributed. Most of the classes in the smaller centres come under this heading. “Associated '” classes—i.e., classes conducted by managers representing bodies contributing to the funds of the classes—though held at a comparatively small number of centres, constitute most of the largest and best-equipped schools in the Dominion. In a few cases only do the managers of associated classics conduct classes in more than one centre. “College” classes are conducted by the governing bodies of the University colleges, four in number, and include some classes not of university rank.
In connection with the annual grants made by the Government to University colleges for specialization, the Auckland University College and the Otago University have each established a School of Mines, providing for courses for the University degree of B.Sc. or for the associateship in mining and metallurgy. The Canterbury College has an endowed School of Engineering and Technical Science, providing for courses for the University degree of B.Sc. in mechanical, electrical, or civil engineering, or for the associateship in engineering.
There are also several Schools of Mines located in districts in which mining is actively carried on. Particulars relating to these will be found in the Mining Section of this book.
The Otago University has established a home-science department, at which there were in 1914 thirteen degree students, twelve diploma students, and twenty-two other students taking single subjects or group courses, making a total of forty-seven students.
The Canterbury Agricultural College has an endowment of about 77,800 acres of land, of the rental value of about £2,800 per annum, and possesses extensive buildings, and an experimental farm of a very complete character. The institution offers an opportunity to acquire a thorough knowledge of the science and practice of agriculture. Two years' residence at the college is accepted by the University of New Zealand as part of the curriculum qualifying for the degree of B.Sc. in agriculture. The college accommodated fifty-three students in 1914.
With the view of encouraging attendance, arrangements have been made by which students attending registered classes may obtain railway tickets at special rates. Free railway tickets are issued to holders of free places at technical schools, and to public-school teachers attending approved training-classes, and to public-school pupils attending manual-training centres.
During the year 1914 manual instruction, in accordance with the regulations, was given in 56 per cent. of the public schools, and elementary handwork at 66 per cent. of the schools.
| Manual Instruction in Public Schools. | ||
|---|---|---|
| Number of Classes. | ||
| Subjects of Instruction. | 1913. | 1914. |
| Woodwork and ironwork | 419 | 507 |
| Agriculture and dairy-work | 1,087 | 1,199 |
| Elementary science | 223 | 234 |
| Domestic subjects | 615 | 782 |
| Swimming and life-saving | 233 | 254 |
| Totals | 2,577 | 2,976 |
The number of public schools in which manual instruction was given in 1914 was 1,298, and in which elementary handwork was taught. 1,513. The payments by way of capitation and subsidies on voluntary contributions were £31,830; special grants for buildings and equipment totalled £2,033.
Of the various forms of handwork taken in the standard classes those that afford opportunities not only for useful manipulative exercises, but also for concrete illustrations of other subjects of the syllabus, continue to receive the most attention. Such forms include modelling in plasticine, and constructive work with bricks, paper, and cardboard In the paper standards woodwork, cookery, and laundry-work are taught on the central system and by special instructors. There are over eighty fully equipped buildings for instruction in these subjects. Those in the larger centres take the form of special manual-training schools, while in the smaller centres accommodation is provided in the local technical school, secondary school, or district high school, as the case may be. During 1914 507 classes for wood or iron work, and 782 classes for domestic subjects (cookery, laundry-work, and dressmaking, associated in nearly every case with suitable instruction in domestic economy and hygiene), were held. Increasing attention is given to subjects bearing on the home, and there is evidence of a general advance in the methods of instruction adopted, due largely to the fact that the teaching staff is being gradually strengthened by the addition of teachers trained in accordance with modern ideas. Of the prospective teachers of domestic subjects who have taken advantage of the special bursaries provided by the State in connection with the home-science courses at the Otago University, several, having completed the course for the diploma or the degree in home science, are now engaged in teaching. Compared with the previous year, the number of classes for domestic subjects shows an increase of 27 per cent.
Instruction in elementary agriculture was given in 1,199 classes, as compared with 1,087 in the previous year. The instruction, which includes both observational and experimental work in connection with school gardens and plots, combined, in an increasing number of cases, with elementary dairy-work, is in most of the education districts supervised by special itinerant instructors, of whom there are nineteen stationed in various parts of the Dominion. In addition to numerous prizes offered for competition, contributions in money and kind to the value of about £500 have been received by Education Boards during the year. Such contributions carry a Government subsidy of £1 for £1.
Full courses of instruction bearing on rural pursuits (having a domestic trend in the case of girls), occupying not less than twenty hours a week throughout the year, were carried on during the year in connection with the secondary departments in 55 per cent. of the district high schools (sixty-two in number) as follows:—
| District. | Number of Schools. | Number of Pupils. | Capitation earned. |
|---|---|---|---|
| £ | |||
| Auckland | 4 | 98 | 615 |
| Taranaki | 1 | 67 | 471 |
| Wanganui | 8 | 204 | 1,168 |
| Wellington | 6 | 210 | 1,328 |
| Hawke's Bay | 3 | 96 | 726 |
| North Canterbury | 4 | 85 | 550 |
| South Canterbury | 2 | 59 | 359 |
| Otago | 6 | 165 | 1,085 |
| Totals, 1914 | 34 | 984 | £6,302 |
| Totals, 1913 | 33 | 1,016 | £6,434 |
The special capitation paid to Education Boards on account of these rural courses amounted in 1914 to £6.4 per pupil. About 70 per cent. of the district high schools are now well equipped for laboratory-work in physics or chemistry. About 230 classes in 1914 took courses in various branches of elementary science, chiefly elementary physics and chemistry. In the primary schools where laboratories are not available useful courses in physical measurements have in a few cases been taken up.
Recognized classes were carried on in connection with twenty-seven of the secondary schools (thirty in number) in receipt of Government grants. The subjects most generally taken up and the number of classes were as follows:—
| Number of Classes. | ||
|---|---|---|
| Subjects of Instruction. | 1913. | 1914. |
| Free and instrumental drawing | 25 | 41 |
| Domestic subjects | 61 | 62 |
| Woodwork and ironwork | 26 | 29 |
| Experimental and natural science | 215 | 240 |
| Swimming and life-saving | 28 | 30 |
| Elementary agriculture and dairy-work | 18 | 24 |
| 373 | 426 | |
Capitation payments amounted to £1,765, being at the rate of £4.1 per class. Special grants in aid of buildings and equipment totalled £1,336.
About sixty specially designed and well-equipped buildings are available for purposes of technical instruction. In the smaller and more remote centres, where special buildings have not yet been provided, classes are held in suitable rented buildings or in the local schools. During 1914 classes were held at twenty-two such centres in the Wanganui District, at eighteen in the Taranaki District, at thirteen in the Otago District, and at eight in the Southland District.
Classes were held at 138 centres during 1914. The status of the classes, their number, and the number of individual students in attendance were as follows:—
| Status. | Number of Classes. | Number of Students. | ||
|---|---|---|---|---|
| 1913. | 1914. | 1913. | 1914. | |
| “Special” classes | 903 | 940 | 8,523 | 8,942 |
| “Associated” classes | 540 | 621 | 5,951 | 6,651 |
| “College” classes | 18,3 | 170 | 732 | 1,009 |
| Totals | 1,626 | 1,731 | 15,206 | 16,602 |
The number of classes held during 1913 and 1914 in certain subjects of technical instruction is as follows:—
| Subjects of Instruction. | Number of Classes. | |
|---|---|---|
| 1913. | 1914. | |
| Commercial subjects | 268 | 277 |
| Mathematics and science | 118 | 153 |
| Mathematics and science applied to trades and industries | 408 | 432 |
| Domestic science | 299 | 339 |
| Art and art-crafts | 314 | 295 |
| Continuation classes | 219 | 235 |
| Total | 1,626 | 1,731 |
In addition to classes for higher commercial work at each of the four University colleges full courses of instruction, both elementary and advanced, are provided at all of the larger technical schools.
Classes for mechanical, electrical, and civil engineering are well supported. The number of recognized classes in operation during the year was 150. As regards mechanical engineering, ten technical schools, including those in the four chief centres, are provided with well-equipped workshops, and offer fairly full courses, both elementary and advanced. Courses of universe-rank in each of the three branches of engineering are provided at the School of Engineering in connection with Canterbury College.
There has been a considerable increase in the number of classes for domestic subjects. During the year 339 classes were held, an increase of about 12 per cent. The subjects most in demand were cookery (including invalid and high-class cookery), home nursing, dressmaking, and millinery. The special courses in home science and domestic arts at the Otago University meet with satisfactory support. Of the forty-seven students who attended during the year thirteen were taking the course for the diploma, and twelve for the degree. Three students completed the former and one the latter course. State bursaries were awarded to nineteen students who had signified their intention to qualify as teachers of domestic subjects. Seven of the students who have completed their courses are mow engaged in teaching in various parts of the Dominion. With the view of affording special facilities for training in housecraft a hostel has been established in connection with the University. The number of students in residence is fifteen.
The elementary and advanced courses in pure and applied art provided by the schools in the larger centres attract a satisfactory number of students. Classes having special reference to the application of art to industries are becoming increasingly popular.
Controlling authorities and managers of technical schools provide facilities for instruction in subjects relating to rural pursuits, and their efforts in this direction appear to he meeting with some success. During the year classes attended by over 1,500 students were held at some sixty centres. Instruction was given in wool sorting and classing, shearing, dairying, veterinary science, agriculture, and horticulture.
The number of students in 1913 and 1914 taking group courses of instruction occupying not less than four hours a week and eighty hours a year is as follows:—
| Course of Instruction. | Number of Students. | |
|---|---|---|
| 1913. | 1914. | |
| Elementary and higher commercial, and general (including public examinations) | 1,980 | 2,117 |
| Practical mathematics and science | 105 | 97 |
| Mathematics and science applied to trades and industries | 1,149 | 1,378 |
| Domestic science | 401 | 583 |
| Arts and art-crafts | 655 | 646 |
| Totals | 4,290 | 4,821 |
Regulations requiring the attendance of young persons between the ages of fourteen and seventeen who are not otherwise receiving a suitable education, or who are not specially exempted from attendance, were in operation in 1914 in seven school districts in Wanganui, in two in Auckland, and in one in Hawke's Bay. The classes established under these regulations were attended by 436 students, of whom 256 were males.
In the following table are given the number and sex of pupils receiving free education under the regulations for free places:—
| — | 1913. | 1914. | |||||||
|---|---|---|---|---|---|---|---|---|---|
| Males. | Females. | Total. | Males. | Females. | Total. | ||||
| Junior free pupils— | |||||||||
| First year | 840 | 506 | 1,346 | 847 | 510 | 1,357 | |||
| Second year | 471 | 264 | 735 | 555 | 365 | 920 | |||
| Senior free pupils— | |||||||||
| First year | 341 | 276 | 617 | 374 | 306 | 680 | |||
| Second year | 190 | 131 | 321 | 247 | 208 | 455 | |||
| Third year | 73 | 79 | 152 | 95 | 77 | 172 | |||
| Totals | 1,915 | 1,256 | 3,171 | 2,118 | 1,466 | 3,584 | |||
About one-fifth of the total number of students attending classes held free places as above. The total number of junior free pupils was 2,277, and of senior free pupils 1,307. The figures for the previous year were 2,081 and 1,090 respectively. About 48 per cent. of the students who entered on junior free places in 1913 continued to attend in 1914. Of the total number of senior free pupils in their first year over 24 per cent. had completed two years at technical classes as junior free pupils. The remainder were admitted from day technical schools, secondary schools, or district high schools. Capitation payments made during the year on account of free places amounted to £7,196, being at the rate of £2 a pupil. In addition to the students receiving free education under the regulations for free places, scholarships or free places were awarded locally to 314 students.
The following technical schools had roll numbers of 500 and over, exclusive of the day technical schools carried on in connection with some of them:—
| Roll Number. | ||
|---|---|---|
| School. | 1913. | 1914. |
| Auckland Technical College | 1,345 | 1,620 |
| Wanganui Technical College | 666 | 741 |
| Wellington Technical College | 1,180 | 1,119 |
| Christchurch Technical College | 1,063 | 1,295 |
| Dunedin Technical College | 1,055 | 1,195 |
| Dunedin School of Art | 685 | 617 |
| Palmerston North Technical School | .. | 545 |
| School of Art, Christchurch | .. | 544 |
These schools (eight in number) provide courses, of secondary grade, in science and technology, domestic science, agriculture, and commercial instruction. They form part of the technical schools at Auckland (397 pupils), Wanganui (185 pupils), Wellington (285 pupils), Napier (79 pupils), Westport (14 pupils), Christchurch (414 pupils), Dunedin (288 pupils), and Invercargill (177 pupils). The total roll number was 1,839, an increase of 175 over that of the preceding year. The schools appear to meet the needs of a number of young people who would not otherwise proceed to secondary schools. The courses of instruction taken up by pupils were as follows:—
| Males. | Females. | Totals. | |
|---|---|---|---|
| Industrial | 470 | .. | 470 |
| Commercial | 252 | 640 | 892 |
| Domestic | .. | 313 | 313 |
| Agricultural | 91 | .. | 91 |
| General | 46 | 23 | 69 |
| Art | 1 | 3 | 4 |
| Totals | 860 | 979 | 1,839 |
Capitation payments on account of day technical schools during 1914 totalled £19,890, being at the rate of £10.8 per pupil.
Following are some particulars regarding free pupils at day technical schools:—
| – | 1913. | 1914. | ||||
|---|---|---|---|---|---|---|
| Males. | Females. | Total. | Males. | Females. | Total. | |
| Junior free pupils — | ||||||
| First year | 404 | 464 | 868 | 465 | 489 | 954 |
| Second year | 207 | 265 | 472 | 238 | 303 | 541 |
| Senior free pupils— | ||||||
| First year | 50 | 86 | 136 | 57 | 91 | 148 |
| Second year | 12 | 14 | 26 | 13 | 16 | 29 |
| Third year | 3 | 2 | 5 | 1 | 1 | 2 |
| Totals | 676 | 831 | 1,507 | 774 | 900 | 1,674 |
Of the total number of pupils in attendance 91 per cent. were receiving free education under the regulations for free places. Junior free places were held by 1,495 pupils, and senior free places by 179 pupils. 48 per cent. of the junior free pupils who entered in 1913 continued to attend in 1914, while about 25 per cent. of the pupils who completed the second year of their junior free places in 1913 qualified for and were admitted to senior free places in 1914. Of the pupils who left the day technical schools on the completion of their junior free places, 12 per cent. qualified for senior free places and were admitted to evening classes. Most of these pupils left to take up employment.
The following is a summary of the expenditure by the State on manual and technical instruction during the year ended the 31st March, 1915:—
| Manual instruction— | £ | £ | |
|---|---|---|---|
| Capitation on classes | 32,007 | ||
| Subsidies on voluntary contributions | 193 | ||
| Grants for buildings, equipment, rent, &c. | 3,205 | ||
| —— | 35,495 | ||
| Technical instruction— | |||
| Capitation— | |||
| Day technical schools | 18,854 | ||
| Other classes (including free places) | 26,209 | ||
| Subsidies on voluntary contributions | 5,427 | ||
| Grants for buildings, equipment, material, rent, &c. | 22,665 | ||
| —— | 73,155 | ||
| Manual and technical instruction— | |||
| Railway fares, &c., of instructors and students | 9,046 | ||
| Bursaries | 1,142 | ||
| Examinations | 475 | ||
| Inspection and other expenses | 1,136 | ||
| —— | 11,799 | ||
| 120,359 | |||
| Less recoveries (examination fees, &c.) | 178 | ||
| £120,181 | |||
Secondary education is carried on at secondary schools, district high schools, day technical schools, Maori secondary schools, and private secondary schools.
The number of secondary schools in operation during 1914 was thirty-three (boys' and girls' schools counted separately).
The number of district high schools was sixty, day technical schools eight, and Maori secondary schools ten. In addition there were a number of private secondary schools, thirteen of which were inspected by the Inspectors of the Education Department.
The total number of pupils attending the thirty-three secondary school in the last terms of 1913 and 1914 respectively were as follows: —
| 1913 | 1914 | |||||
|---|---|---|---|---|---|---|
| Boys. | Girls. | Total. | Boys. | Girls. | Total. | |
| Roll (exclusive of lower departments) | 3,413 | 2,390 | 5,803 | 3,606 | 2,450 | 6,056 |
| Number in lower departments | 222 | 129 | 351 | 236 | 126 | 362 |
| Total | 3,635 | 2,519 | 6,151 | 3,842 | 2,576 | 6,418 |
| Number of boarders (included above) | 765 | 169 | 934 | 804 | 161 | 965 |
In the same years these schools were staffed as follows: —
| 1913 | 1914 | |||||
|---|---|---|---|---|---|---|
| M. | F. | Total. | M. | F. | Total. | |
| Regular staff | 168 | 120 | 288 | 172 | 127 | 299 |
| Part-time teachers | 46 | 33 | 79 | 41 | 32 | 73 |
The average number of pupils per teacher (excluding part-time teachers) was thus 21.4 in 1913 and 21.5 in 1914.
The average number of pupils on the roll of the secondary departments of district high schools in the year 1914 was 2,100. In 1913 it was 2,073.
Besides the head teachers, who generally lake some part in the secondary instruction, there were employed in 1914 in the secondary departments of district high schools 88 special assistants 39 men and 49 women: in 1913 there were 37 men and 51 women. The average number of pupils per teacher on the roll number at the end of the year 1914 was 21.5; on the average attendance for the year, 22.1.
Tables are given showing for each secondary school particulars as to (1) pupils and fees, and (2) staff and salaries, as in December, 1914. The classification of secondary schools, as shown in the tables, may be interpreted thus:—
A. Schools established under special Acts of the Legislature, with endowments derived from grants of money from the public revenue, or from grants of land. It is optional with these schools to admit free pupils or offer scholarships equal in value to one-fifth of the net annual income derived from endowments.
B. High schools established in places where there are no secondary or district high schools. These; schools must admit free pupils, for which they receive grants according to scale.
C. Schools which, though endowed, do not admit, nor are empowered to admit, free pupils.
| ROLL AND FEES OF SECONDARY SCHOOLS ASIN DECEMBER, 1914. | |||||||||||||||||||||
|---|---|---|---|---|---|---|---|---|---|---|---|---|---|---|---|---|---|---|---|---|---|
| Schools. | Total Roll for Last Term of 1914. | Lower Departments included in Total Roll. | Boarders included in | Annual Rates of Fees. | Average Attendance (Lower Departments excluded). | ||||||||||||||||
| Boys. | Girls. | ||||||||||||||||||||
| Under 12 Years. | 12 to 15. | 15 to 18. | Over 18. | Total. | Under 12 Years | 12 to 15. | 15 to 18. | Over 18. | Total. | Boys. | Girls. | Boys. | Girls. | For Tuition. | For Board, exclusive of Tuition. | ||||||
| A. Endowed Schools included in the Eighth Schedule to the Education Act, 1908. | |||||||||||||||||||||
| Whangarei High School | .. | 11 | 39 | 3 | 53 | .. | 14 | 34 | 3 | 51 | .. | .. | 9 | .. | 8 | 8 | 0 | 35 | 0 | 0 | 111 |
| Auckland Boys' Grammar School | .. | 207 | 399 | 35 | 641 | .. | .. | .. | .. | .. | .. | .. | .. | .. | 10 | 10 | 0 | .. | 668 | ||
| Auckland Girls' Grammar School | .. | .. | .. | .. | .. | .. | 126 | 310 | 3 | 439 | .. | .. | .. | .. | 10 | 10 | 0 | .. | 456 | ||
| Thames High School | .. | 21 | 39 | .. | 60 | .. | 7 | 36 | 2 | 45 | .. | .. | .. | .. | 8 | 8 | 0 | .. | 111 | ||
| New Plymouth Boys' High School | 20 | 58 | 78 | 14 | 170 | .. | .. | .. | .. | .. | 47 | .. | 40 | .. | 6 | 6 | 0 | 39 | 0 | 0 | 126 |
| New Plymouth Girls' High School | .. | .. | .. | .. | .. | .. | 19 | 37 | 8 | 64 | .. | .. | .. | 8 | 6 | 8 | 0 | 36 | 0 | 0 | 61 |
| Wanganui Girls' College | .. | .. | .. | .. | .. | 4 | 62 | 85 | 15 | 166 | .. | 30 | .. | 79 | 13 | 10 | 0 | 40 | 0 | 0 | 140 |
| Wellington Boys' College | .. | 147 | 244 | 18 | 409 | .. | .. | .. | .. | .. | .. | .. | 53 | .. | 11 | 17 | 9 | 42 | 0 | 0 | 401 |
| Wellington Girls' College | .. | .. | .. | .. | .. | 31 | 128 | 168 | 12 | 339 | .. | 29 | .. | .. | 11 | 17 | 9 | .. | 302 | ||
| Napier Boys' High School | 6 | 37 | 57 | 10 | 110 | .. | .. | .. | .. | .. | 34 | .. | 15 | .. | 9 | 9 | 0 | 42 | 0 | 0 | 82 |
| Napier Girls' High School | .. | .. | .. | .. | .. | 15 | 38 | 64 | 3 | 120 | .. | 39 | .. | 28 | 9 | 9 | 0 | 45 | 3 | 0 | 82 |
| Gisborne High School | 4 | 38 | 40 | 3 | 85 | 3 | 22 | 31 | .. | 56 | 15 | 6 | 14 | 6 | 9 | 0 | 0 | 42 | 0 | 0 | 115 |
| Marlborough High School | .. | 17 | 32 | 2 | 51 | .. | 11 | 37 | 3 | 51 | .. | .. | .. | .. | 8 | 11 | 0 | .. | 105 | ||
| Nelson Boys' College | 2 | 76 | 120 | 15 | 213 | .. | .. | .. | .. | .. | 20 | .. | 96 | .. | 12 | 0 | 0 | 46 | 10 | 0 | 204 |
| 8 | 8 | 0 | |||||||||||||||||||
| Nelson Girls' College | .. | .. | .. | .. | .. | 5 | 46 | 102 | 12 | 165 | .. | 7 | .. | 40 | 12 | 0 | 0 | 46 | 10 | 0 | 158 |
| 8 | 8 | 0 | |||||||||||||||||||
| Christchurch Boys' High School | 4 | 106 | 82 | 5 | 197 | .. | .. | .. | .. | .. | 12 | .. | .. | .. | 10 | 10 | 0 | .. | 173 | ||
| 7 | 10 | 0 | |||||||||||||||||||
| Christchurch Girls' High School | .. | .. | .. | .. | .. | 5 | 113 | 169 | 10 | 297 | .. | 15 | .. | .. | 12 | 12 | 0 | .. | 273 | ||
| 9 | 9 | 0 | |||||||||||||||||||
| Rangiora High School | .. | 14 | 20 | 1 | 35 | .. | 6 | 23 | 2 | 31 | .. | .. | 9 | .. | 9 | 9 | 0 | 29 | 5 | 0 | 69 |
| Ashburton High School | .. | 30 | 35 | 1 | 66 | .. | 10 | 35 | 1 | 46 | .. | .. | .. | .. | 6 | 6 | 0 | .. | 111 | ||
| Timaru Boys' High School | .. | 37 | 80 | 6 | 123 | .. | .. | .. | .. | .. | .. | .. | 47 | .. | 9 | 0 | 0 | 40 | 0 | 0 | 124 |
| Timaru Girls' High School | .. | .. | .. | .. | .. | .. | 22 | 42 | 7 | 71 | .. | .. | .. | .. | 9 | 0 | 0 | .. | 65 | ||
| Waitaki Boys' High School | 4 | 81 | 162 | 12 | 259 | .. | .. | .. | .. | .. | 29 | .. | 174 | .. | 7 | 10 | 0 | 46 | 0 | 0 | 238 |
| Waitaki Girls' High School | .. | .. | .. | .. | .. | .. | 14 | 49 | 6 | 69 | .. | .. | .. | .. | 7 | 10 | 0 | .. | 68 | ||
| Otago Boys' High School | .. | 99 | 216 | 18 | 333 | .. | .. | .. | .. | .. | .. | .. | 32 | .. | 10 | 0 | 0 | 43 | 10 | 0 | 367 |
| Otago Girls' High School | .. | .. | .. | .. | .. | .. | 66 | 121 | 14 | 201 | .. | .. | .. | .. | 10 | 0 | 0 | .. | 200 | ||
| Southland Boys' High School | .. | 70 | 93 | 4 | 167 | .. | .. | .. | .. | .. | .. | .. | .. | .. | 10 | 0 | 0 | .. | 173 | ||
| Southland Girls' High School | .. | .. | .. | .. | .. | .. | 43 | 104 | 3 | 150 | .. | .. | .. | .. | 10 | 0 | 0 | .. | 145 | ||
| Totals | 40 | 1049 | 1,736 | 147 | 2,972 | 63 | 747 | 1447 | 104 | 2,361 | 157 | 126 | 489 | 161 | .. | .. | 5,128 | ||||
| B. Secondary Schools established under Section 94 of the Education Act. | |||||||||||||||||||||
| Hamilton High School | .. | 33 | 49 | .. | 82 | .. | 25 | 38 | .. | 63 | .. | .. | .. | .. | 10 | 0 | 0 | .. | 150 | ||
| Palmerston North High School | 9 | 66 | 82 | 2 | 159 | .. | 26 | 38 | 1 | 65 | 20 | .. | 32 | .. | 10 | 9 | 0 | 40 | 19 | 0 | 201 |
| 9 | 9 | 0 | |||||||||||||||||||
| Dannevirke High School | .. | 19 | 26 | 3 | 48 | .. | 19 | 19 | 3 | 41 | .. | .. | .. | .. | 10 | 0 | 0 | .. | 89 | ||
| Gore High School | .. | 16 | 46 | 8 | 70 | .. | 10 | 33 | 3 | 46 | .. | .. | .. | .. | 10 | 0 | 0 | .. | 120 | ||
| Totals | 9 | 134 | 203 | 13 | 359 | .. | 80 | 128 | 7 | 215 | 20 | .. | 32 | .. | .. | .. | 560 | ||||
| C. Endowed Secondary Schools not corning within the Definition of Section 89 of the Education Act. | |||||||||||||||||||||
| Wanganui Collegiate School | .. | 104 | 111 | 5 | 220 | .. | .. | .. | .. | .. | .. | .. | .. | .. | 12 | 0 | 0 | 63 | 0 | 0 | 218 |
| Christ's College Grammar School | 49 | 122 | 107 | 13 | 291 | .. | .. | .. | .. | .. | 5 | .. | 110 | .. | 16 | 10 | 0 | 45 | 0 | 0 | 232 |
| 10 | 10 | 0 | 42 | 0 | 0 | ||||||||||||||||
| Totals | 49 | 226 | 218 | 18 | 511 | .. | .. | .. | .. | .. | 59 | .. | 283 | .. | .. | .. | 450 | ||||
| Grand totals for 1914 | 98 | 1409 | 2,157 | 178 | 3,842 | 63 | 827 | 1575 | 111 | 2,576 | 236 | 126 | 804 | 161 | .. | .. | 6,138 | ||||
| Grand totals for 1913 | 99 | 1363 | 1,995 | 178 | 3,635 | 60 | 825 | 1518 | 116 | 2,519 | 222 | 129 | 765 | 169 | .. | .. | 5,835 | ||||
| Difference | – | 46 | 162 | .. | 207 | 3 | 2 | 57 | –5 | 57 | 14 | –3 | 39 | –8 | .. | .. | 303 | ||||
| STAFF AND SALARIES OF SECONDARY SCHOOLS ASIN DECEMBER, 1914. | |||||||||
|---|---|---|---|---|---|---|---|---|---|
| Schools. | Staff. | Salaries at Rate paid at End of Year. | Notes. | ||||||
| Regular. | Part-time. | Regular Staff. | Part-time Teachers. | ||||||
| Men. | Women. | Men. | Women. | Men. | Women. | Men. | Women. | ||
| A. Endowed Schools included in the Eighth Schedule to the Education Act. 1908. | |||||||||
| Whangarei High School | 3 | 2 | 1 | 1 | 750 | 305 | .. | .. | Paid on capitation basis. |
| Auckland Boys' Grammar School | 21 | .. | .. | .. | 6,055 | .. | .. | .. | .. |
| Auckland Girls' Grammar School | .. | 18 | 1 | 1 | .. | 3,247 | 90 | .. | .. |
| Thames High School | 3 | 1 | .. | .. | 800 | 175 | .. | .. | Principal has residence. |
| New Plymouth Boys' High School | 7 | .. | 2 | .. | 1,585 | .. | 100 | .. | Principal and one assistant have residence, one assistant has allowance, and three assistants have hoard. |
| New Plymouth Girls' High School | .. | 4 | .. | .. | .. | 775 | .. | .. | .. |
| Wanganui Girls' College | .. | 12 | 2 | 5 | .. | 2,560 | 234 | 67 | Principal has board and residence. |
| Wellington Boys' College | 19 | .. | 2 | .. | 5,255 | .. | 100 | .. | .. |
| Wellington Girls' College | .. | 17 | 2 | 6 | .. | 3,170 | 85 | 224 | .. |
| Napier Boys' High School | 7 | .. | 2 | .. | 1,632 | .. | 125 | .. | Two masters have board and residence. |
| Napier Girls' High School | .. | 7 | .. | 4 | .. | 1,265 | .. | 100 | .. |
| Gisborne High School | 5 | 2 | 1 | 2 | 1,375 | 320 | 45 | 40 | Four teachers have allowances. |
| Marlborough High School | 3 | 2 | .. | .. | 1,000 | 300 | .. | .. | Principal has residence. |
| Nelson Boys' College | 9 | .. | 1 | .. | 2,475 | .. | 60 | .. | Principal has board and residence, one assistant has residence, five assistants have board, and two assistants have house allowance. |
| Nelson Girls' College | .. | 8 | .. | 1 | .. | 1,380 | .. | 50 | Principal and five assistants have board and residence. |
| Christchurch Boys' High School | 10 | .. | 5 | .. | 3,093 | .. | 560 | .. | .. |
| Christchurch Girls' High School | .. | 16 | 2 | 5 | .. | 2,893 | 94 | 387 | .. |
| Rangiora High School | 3 | 2 | .. | .. | 908 | 225 | .. | .. | Principal has residence, and two assistants have allowances. |
| Ashburton High School | 3 | 2 | .. | .. | 890 | 335 | .. | .. | .. |
| Timaru Boys' High School | 6 | .. | 1 | .. | 1,575 | .. | 20 | .. | Two assistants have board. |
| Timaru Girls' High School | .. | 4 | .. | 1 | .. | 870 | .. | 15 | .. |
| Waitaki Boys' High School | 9 | .. | 1 | 1 | 2,410 | .. | 32 | 3d | Principal has residence, and five assistants have board. |
| Waitaki Girls' High School | .. | 4 | .. | 1 | .. | 700 | .. | 50 | .. |
| Otago Boys' High School | 12 | .. | 3 | .. | 3,555 | .. | 260 | .. | Principal has residence. |
| Otago Girls' High School | .. | 9 | 2 | 2 | .. | 1,810 | 125 | 135 | .. |
| Southland Boys' High School | 6 | .. | 2 | .. | 1,810 | .. | 110 | .. | Principal has residence. |
| Southland Girls' High School | .. | 7 | 3 | 1 | .. | 1,295 | 130 | 15 | .. |
| Totals | 126 | 117 | 33 | 31 | 35,168 | 21,625 | 2,170 | 1,119 | |
| B. Secondary Schools established under Section 94 of the Education Act. | |||||||||
| Hamilton High School | 4 | 3 | .. | .. | 1,095 | 440 | .. | .. | Principal has residence. |
| Palmerston North High School | 7 | 3 | 2 | 1 | 1,805 | 500 | 100 | 13 | Including £100 house allowance for principal. |
| Dannevirke High School | 2 | 2 | .. | .. | 650 | 355 | .. | .. | .. |
| Gore High School | 4 | 2 | 1 | .. | 1,210 | 350 | 5 | .. | .. |
| Totals | 17 | 10 | 3 | 1 | 4,760 | 1,645 | 105 | 13 | |
| C. Endowed Secondary Schools not coming within the Definition of Section 89 of the Education Act. | |||||||||
| Wanganui Collegiate School | 13 | .. | 1 | .. | 4,714 | .. | 85 | .. | Principal has residence, and two assistants have board. |
| Christ's College Grammar School | 16 | .. | 4 | .. | 4,080 | .. | 364 | .. | Acting-Principal has residence and £200 allowance, and two assistants have residence. |
| Totals | 29 | .. | 5 | .. | 8,794 | .. | 449 | .. | |
| Grand totals | 172 | 127 | 41 | 32 | 48,722 | 23,270 | 2,724 | 1,132 | |
The total numbers on the roll of day technical schools at any time during the years 1913 and 1914 were as follows: —
| 1913. | 1914. | |
|---|---|---|
| Boys | 739 | 860 |
| Girls | 925 | 979 |
| Totals | 1,664 | 1,839 |
The following was the average roll of pupils in secondary schools for Maoris (all of whom were boarders) for the respective years:—
| 1913. | 1914. | |
|---|---|---|
| Boys | 202 | 211 |
| Girls | 217 | 224 |
| Totals | 419 | 435 |
Summarizing all these figures, and excluding pupils in the lower departments of secondary schools, we obtain the following statement of the numbers receiving some form or other of secondary instruction during the years 1913 and 1914 (as nearly as can be estimated):—
| 1913. | 1914. | |
|---|---|---|
| Secondary schools | 5,803 | 6,056 |
| District high schools | 2,073 | 2,100 |
| Day technical schools | 1,664 | 1,839 |
| Maori secondary schools | 419 | 435 |
| Private secondary schools | 545 | 850 |
| Totals | 10,504 | 11,280 |
Based on the estimated population of New Zealand as at the 31st December last the proportion of persons receiving some form of day secondary education is 98 per 10,000 of population, as compared with 93 for the previous year.
Under the regulations free places are divided into two classes—junior and senior—both being tenable at secondary schools and district high schools, or, under somewhat different conditions, at technical schools.
Generally speaking, junior free places are tenable for two years, with a possible extension in certain cases to three years. In the case of their being held at district high schools they are tenable to the age of seventeen. The qualifications are a certificate of proficiency, or a junior scholarship, or special Junior Free Place Examination. Senior free places may be obtained on passing the Intermediate Examination, or without external examination after the satisfactory completion of a two-years secondary course, on the recommendation of the principal of the school attended, to which the Director of Education concurs. The latter form of qualification is becoming increasingly applicable, there being 791 cases of complete exemption from examination and thirty-three cases of partial exemption in 1914. Senior free places in secondary schools, district high schools, and technical high schools are tenable up to the age of nineteen. To technical schools other than technical high schools this age-limit does not apply.
The following are some of the figures for 1913 and 1914 in regard to free places in secondary schools:—
| 1913. | 1914. | |
|---|---|---|
* Including three schools not giving free tuition. | ||
| Number of secondary schools giving free tuition | 30 | 30 |
| *Total roll number, excluding lower departments | 5,803 | 6,056 |
| Number of free-place holders | 4,592 | 5,061 |
| Free-place holders as a percentage of roll number | 79 per cent. | 84 per cent. |
| Total annual payment by Government for free places | £51,917 | £56,186 |
| Cost to Government per free pupil | £10 15s. 11d. | £11 2s. 0d |
There are now only sixteen pupils in every 100 who pay fees for admission to secondary schools. That the free-place system has undoubtedly been fully taken advantage of by the people of New Zealand is evidenced by the enormous increase in free places in the last few years. In 1903 there were 1,600 free pupils at secondary schools; now the number is more than three times as great.
In order to arrive at the total number of pupils in New Zealand receiving free secondary instruction it is necessary to include also 171 holders of scholarships or exhibitions carrying free instruction not otherwise enumerated, granted by the secondary schools included above or by endowed secondary schools not coming under the conditions for free places; 2,100 pupils in attendance at district high schools, almost all of whom were free pupils; 107 Maori pupils receiving free education in Maori secondary schools; and 1,674 holders of free places in day technical schools. Consequently, there are approximately 8,942 pupils receiving free secondary education in the Dominion, exclusive of those holders of free places in technical schools (mostly evening students), who, while not taking full-day courses, were nevertheless receiving free education of secondary grade.
The following table gives a summary of the various secondary free places at the end of the past two years for which payment was made by the State: —
| Free Places in December, 1913 and 1914. | ||||||
|---|---|---|---|---|---|---|
| 1913 | 1914 | |||||
| Boys. | Girls. | Total. | Boys. | Girls. | Total. | |
| (i.) Secondary schools— | ||||||
| (a.) Junior free pupils | 1,815 | 1,466 | 3,281 | 2,024 | 1,556 | 3,580 |
| (b.) Senior free pupils | 759 | 552 | 1,311 | 864 | 617 | 1,481 |
| Totals | 2,574 | 2,018 | 4,592 | 2,888 | 2,173 | 5,061 |
| (ii.) District high schools | 900 | 937 | 1,837 | 1,067 | 1,033 | 2,100 |
| (iii.) Maori secondary schools | 53 | 55 | 108 | 48 | 59 | 107 |
| (iv.) Day technical schools— | ||||||
| (a.) Junior free pupils | 611 | 729 | 1,340 | 703 | 792 | 1,495 |
| (b.) Senior free pupils | 65 | 102 | 167 | 71 | 108 | 179 |
| Grand totals | 4,203 | 3,841 | 8,044 | 4,777 | 4,165 | 8,94 |
These scholarships are of four kinds—viz., National Scholarships, Education Board Scholarships, Foundation (or Governors') Scholarships (given by the governing bodies of secondary schools), private scholarships (endowed by private donors).
Junior National Scholarships have up to the present been allotted to the several education districts practically on the basis of population, there having been offered annually one scholarship for each 4,000 or part of 4,000 children in average yearly attendance at public schools. The scholarships are awarded on the results of an examination, and the Education Boards exercise a certain control over the holders, and pay over to them from time to time the amounts falling due.
Under the Education Act, 1914, and regulations issued under its authority, the arrangements for scholarships have been remodelled. Junior and Senior National Scholarships, to be awarded under a national scheme, replace the older Junior National and the Education Board Junior Scholarships and the Education Board Senior Scholarships respectively. The University Entrance Scholarships, which have hitherto been called Senior National Scholarships, will in future be known, in accordance with the University Amendment Act, 1914, as University National Scholarships.
Under the scheme thus introduced junior and senior scholarships, in the proportion of nine to five, are to be awarded, the standard of qualification in any year for the respective grades being determined beforehand in such manner as approximately to provide one scholarship for every five hundred in yearly average attendance. For pupils of schools below Grade III a slightly lower standard is to be provided.
The qualifications of candidates for Junior National Scholarships will be tested in an examination of somewhat greater difficulty than the certificate of proficiency examination. For the testing of the qualifications of applicants for the new Senior National Scholarships there will be, alternative to the examination based on the Public Service Entrance Examination, an examination of equal difficulty provided to suit the needs of those candidates who are being instructed on the lines of the rural or domestic courses now adopted in many schools.
The following table, showing the number and value of Junior National Scholarships current in December, 1913, and December, 1914, respectively, deals with the Junior National Scholarships of the older conditions. The first award of scholarships under the new conditions will be made as from the beginning of next year:—
| Number of scholarships,— | 1913. | 1914. |
|---|---|---|
| Boys | 68 | 76 |
| Girls | 62 | 59 |
| Totals | 130 | 135 |
| Number receiving boarding-allowance (included in the above total) | 72 | 77 |
| Number receiving travelling-allowance (similarly included) | 2 | 3 |
| Number held at secondary schools | 114 | 117 |
| Number held at district high schools | 16 | 18 |
| Total annual rate of payment | £3,460 | £3,650 |
The scholarship funds of the Boards have for many years up to the present been provided by grants which amounted to 1s. 6d. per head of the average attendance. The conditions of the scholarships have been determined by regulations approved in the case of each Board by the Minister of Education. For the award of the junior scholarships all the Boards have now for some years used the Junior National Scholarship Examination, and for their senior scholarships the Intermediate Examination as arranged for scholarship candidates: but the awards themselves and the subsequent control of the holders have been entirely in the hands of the Boards. The number of scholarships awarded by the Boards in 1914 was 626, and the total expenditure thereon £10,466. The scholarships varied in value from £2 10s. to £40 per annum.
Future awards of junior and senior scholarships will entitle the holders to receive, in addition to free places, the sums of £5 and £10 a year respectively, in addition to a lodging-allowance of £35 a year if they are required to live away from home to prosecute their studies at the secondary school, or its equivalent, which is approved by the Minister for the purpose. The Board scholarships current will gradually disappear until they are entirely replaced by national scholarships.
These are of two kinds, those offered by the Governors of secondary schools not granting free places under the Act, and those offered as additional scholarships by the Governors of schools providing free places.
These are derived from funds provided by private donors at certain schools, by bequest or otherwise.
The number of foundation and private scholarships in the last term of 1914 was 198. Of the holders, forty-five were also Government free pupils under the regulations. The total annual value of the scholarships in cash was £826. In addition, free tuition was given by the schools to holders of foundation and private scholarships to the value of £1,859, the value of the Government free places already mentioned not being included in this amount.
The income of secondary schools is derived from the following sources:—
Rents from the special reserves allocated to them by statute:
Statutory grants, given in lieu of special reserves:
Interest upon moneys derived from the sale of reserves, and invested in accordance with the Education Reserves Act:
Income from the secondary-school reserves controlled by the Land Boards, divided among the secondary schools in the several land districts in proportion to the number of pupils in average attendance lower departments excluded:
Government payments—(a) Statutory capitation upon free pupils under the Act; (b) subsidies on voluntary contributions for the general purposes of the school:
Government payments—(a) Capitation for manual-instruction classes; (b) subsidies on voluntary contributions for manual-instruction purposes:
Special Government grants for buildings and apparatus:
Tuition fees of pupils:
Boarding fees of pupils:
Miscellaneous sources, such as interest on moneys (other than those obtained by the sale of reserves), donations, and special endowments (for scholarships, prizes, &c.), rent of premises, loans raised, &c.
The revenue derived from the sources (i) to (iv) is the income derived from endowments, and the “net annual income derived from endowments” is the average of this revenue for the three preceding years, less the expenditure upon the endowments and investments and, subject to some qualification, upon buildings, and less mortgage and other charges. In regard to new buildings, the Education Act, 1914, provides that the expenditure shall not be deducted unless the Minister is satisfied that the buildings are necessary for the purposes of the secondary school.
The Tenth Schedule to the Education Act, 1914, provides for more liberal payments than formerly to secondary schools admitting free pupils. In addition to a lump sum of £100 payable yearly to each school, the maximum rate of capitation for each face pupil has been increased from £12 10s. to £13 10s. per annum, and other rates proportionately. The schedule lays down certain conditions as to staffing and salaries of teachers as necessary before full rates of payment on account of the attendance of free pupils can be claimed.
The following is a summary of the receipts and expenditure of all secondary schools for the year 1914:—
| RECEIPTS AND EXPENDITURE OF SECONDARY SCHOOLS, 1914. | |
|---|---|
| Receipts. | |
| £ | |
| Credit balances on 1st January, 1914 | 31,723 |
| Endowment reserves sold, mortgage-moneys repaid, and insurance | 607 |
| Rents, &c., of reserves vested in Boards | 36,595 |
| Interest on moneys invested | 1,246 |
| Reserves revenue (not apportioned) | 8,671 |
| Government payments— | |
| For manual instruction, capitation, and subsidies | 1,713 |
| For free places, capitation, and subsidies | 54,986 |
| Grants for buildings, sites, furniture, &c. | 9,715 |
| Statutory grant (Marlborough High School) | 400 |
| School fees (tuition) | 19,308 |
| Boarding-school fees, &c. | 30,338 |
| For technical instruction, from Government and other sources | 2,908 |
| Transfers from Capital Account, loans and sundries not classified | 31,213 |
| Debit balances, 31st December, 1914 | 20,232 |
| £252,665 | |
| Expenditure. | |
| £ | |
| Debit balances on 1st January, 1914 | 23,856 |
| Expenses of management | 5,057 |
| School salaries | 78,086 |
| Boarding-school Account | 22,513 |
| Scholarships and prizes | 2,772 |
| Printing, stationery, fuel, light, &c. | 6,061 |
| Land, buildings, furniture, insurance, rent, and rates | 50,848 |
| On endowments | 7,000 |
| On manual instruction, exclusive of buildings | 1,514 |
| On technical instruction | 2,575 |
| Interest and repayments of mortgages | 11,029 |
| Temporary advances to pupils, and sundries not classified | 9,237 |
| Credit balances, 31st December, 1914 | 32,107 |
| £252,665 | |
The following table gives a comparison of the chief items of income and expenditure for the years 1912, 1913, and 1914:—
| 1912. | 1913. | 1914. | |
|---|---|---|---|
* Expenses of management only. | |||
| Income. | £ | £ | £ |
| Income from reserves and endowments | 42,156 | 48,492 | 46,512 |
| Grants from Government (exclusive of building grants) | 53,548 | 54,848 | 57,099 |
| Building grants | 5,254 | 4,964 | 9,715 |
| Tuition fees (exclusive of boarding-school fees) | 17,973 | 18,784 | 19,308 |
| Expenditure. | |||
| Salaries of staff | 69,806 | 74,523 | 78,086 |
| Working-expenses (lower departments excluded) | 4,336* | 11,701 | 11,802 |
| Buildings, &c. | 37,982 | 44,982 | 50,849 |
Thirteen Boards of secondary schools show a credit balance at the end of the year, and eleven a debit balance. The net credit balance of all schools taken together is £11,875, as compared with £17,008 in 1913. The decrease is mainly owing to building operations carried on during the year.
For the whole Dominion, if there are taken into account only the secondary schools that admit free pupils under the Act, we find the following position as at the 1st March. 1914:—
| 1913. | 1914. | |
|---|---|---|
| Total number of pupils, excluding lower departments (roll number beginning of first term, 1914) | 5,693 | 6,009 |
| Total net income from endowments (average of three years ended 31st December, 1914) | £11,533 | £9,781 |
| Net income from endowments per head | £2.02 | £1.63 |
| Approximate annual rate of capitation | £10.79 | £10.60 |
| Total available net income per free pupil for salaries and management | £12.82 | £12.23 |
| Total expenditure on salaries of staff | £60,297 | £62,805 |
| ” working-expenses | £9,909 | £9,804 |
| ” staff salaries, and working-expenses | £70,206 | £72,609 |
| Expenditure per head on staff salaries | £10.59 | £10.45 |
| ” on working-expenses | £1.74 | £1.63 |
| Total expenditure per head on staff salaries, and working-expenses | £12.33 | £12.08 |
The last figure given shows as nearly as may be the actual cost per annum for each pupil, exclusive of those in the lower departments.
The Education Act provides that pupils who have not obtained a certificate of competency in the subjects of Standard V or a higher standard of the public-school syllabus may be admitted to a lower department of a secondary school if they are taught in a separate building or class-room, and if no part of the actual cost of their instruction is met out of the endowments of the secondary school. There were lower departments in thirteen secondary schools during 1914; the total number of pupils in those departments was 362: the total expenditure on salaries of teachers was £2,400; the total amount of fees received on their account was £3,152.
The number of district high schools in operation at the end of 1914 was sixty. In the secondary departments of these schools the teachers employed, apart from the principals, who may or may not have taken part in the secondary instruction, but whose added responsibility is in all cases recognized by some increment of salary, numbered eighty-nine, and the number of pupils on the roll at the end of 1914 was 1,896.
The course of instruction usually followed in the secondary departments of the district high schools of the Dominion has hitherto been drawn up largely with a view to preparing pupils for the Public Service Entrance, Matriculation, and Education Board Scholarship Examinations. In many cases the curriculum itself and the methods of teaching have been dominated by examination results. In several education districts, however, an earnest endeavour is being made to bring the course of instruction more into harmony with local conditions by providing suitable rural courses, based generally on a suggestive programme issued by the Department. Rural courses were in 1914 in operation at thirty-four district high schools, and were taken by 984 pupils. The course for boys is not intended to fit them for carrying on agricultural and pastoral pursuits, but is intended to give them a knowledge of the scientific principles upon which the successful practice of these pursuits depends. Similarly, the course for girls is intended to fit them for the work which they, as members of families engaged in such pursuits, may have to perform or superintend. In most instances it has been found possible not only to provide reasonably full courses with a distinct bias towards rural and domestic pursuits, but also to secure adequate opportunities for pupils preparing for the various public examinations. The special payment of £5 10s. per annum provided for each pupil in the secondary department of a district high school taking an approved rural course has enabled Education Boards to augment the available teaching staff by the addition thereto of specially qualified itinerant instructors to teach the significant subjects included in the course.
The following table gives particulars of the attendance, staff, and salaries at district high schools in 1914:—
| SECONDARY DEPARTMENTS OF DISTRICT HIGH SCHOOLS, 1914. | |||||||
|---|---|---|---|---|---|---|---|
| Education District. | Number of Schools. | Average Attendance. 1914. | Number of Assistant Teachers. | Average Number of Pupils per Teacher. | Statutory Annual Rate of Salaries. | ||
| M. | F. | Total. | |||||
| £ | |||||||
| Auckland | 11 | 226 | 3 | 10 | 13 | 17.4 | 2,812 |
| Taranaki | 1 | 132 | 1 | 3 | 4 | 33.0 | 723 |
| Wanganui | 8 | 222 | 8 | 3 | 11 | 20.2 | 2,236 |
| Wellington | 9 | 303 | 4 | 10 | 14 | 21.6 | 3,100 |
| Hawke's Bay | 8 | 131 | 3 | 2 | 5 | 26.2 | 1,075 |
| Nelson | 4 | 90 | 2 | 3 | 5 | 18.0 | 1,068 |
| Grey | 1 | 25 | 1 | 1 | 2 | 12.5 | 420 |
| Westland | 1 | 65 | 1 | 1 | 2 | 32.5 | 420 |
| North Canterbury | 10 | 372 | 8 | 7 | 15 | 24.8 | 3,317 |
| South Canterbury | 3 | 106 | 3 | 2 | 5 | 21.2 | 1,073 |
| Otago | 9 | 277 | 5 | 7 | 12 | 23.1 | 2,685 |
| Totals for 1914 | 60 | 1,949 | 39 | 49 | 88 | 22.1 | 19,929 |
| Totals for 1913 | 59 | 1,880 | 37 | 51 | 88 | 21.4 | 17,295 |
The University of New Zealand has power to confer degrees, but is not itself a teaching body, undergraduates for the most part keeping their terms at one or other of the four affiliated institutions—Otago University, Canterbury College, Auckland University College, and Victoria College. The Otago University was constituted the power of conferring degrees, but in 1874 it put this power in abeyance and became affiliated to the University of New Zealand. At the same time it was stipulated that the University of New Zealand should not directly exercise functions of teaching.
State assistance in various forms is given to the affiliated institutions. Auckland and Victoria University Colleges receive annual statutory grants of £4,000 each, and, in addition, they received in 1914 £2,700 and £3,000 respectively for the general purposes of the institutions. Each of the four affiliated institutions specializes in certain directions, and to further this purpose the Government makes to each an additional annual grant to provide for the special studies pursued. This annual grant normally amounts to £2,000 in each case, but in the case of Otago University has been during the past year increased to £4,500 to meet the special expenses attached to the medical school. Otago University has both medical and dental schools, and a school of mining and metallurgical engineering; Canterbury College has a school of engineering (mechanical, electrical, and civil); at Auckland University College the grant is allocated for mining and commerce; and at Victoria University College it is in consideration especially of law subjects and science.
Under the provisions of the New Zealand University Amendment Act of 1914 new arrangements are made for the payment of fixed grants to each of the affiliated institutions of the University; and, in addition, provision is made for the payment to such institutions of one-seventh part of the National Endowment Account available for purposes of education. Two-thirds of the amount is to be distributed among the four colleges, the remaining third being paid to the University of New Zealand in trust to be distributed according to the decision of the Senate.
The amendment also provides for the establishment of a Board of Studies consisting of twenty members, five of whom are to be appointed by each of the Professorial Boards of the four institutions affiliated to the University. The Board is to have power to make recommendations to the Senate as to the appointment of examiners and as to degrees, diplomas, scholarships, prizes, courses of study, and examinations, and to receive recommendations as to any of these matters from the Professorial Boards or other bodies concerned.
The total number of graduates who have so far obtained direct degrees from the New Zealand University is 1,879.
There were in 1914 2,134 students actually in attendance at the four University colleges, a decrease of 84 on the number for the previous year. Of these, 108 were graduates, 1,461 were undergraduates, and 565 were unmatriculated students. In addition to the matriculated students mentioned above, there were 123 students attached to the various University colleges, but exempt from lectures—that is, they were prevented by distance of by the necessity of earning their living from attending lectures at the college, but were allowed to keep terms, except in certain science and professional subjects, by passing the annual college examination. The numbers of students at the affiliated institutions during 1914 were as follows: At the Auckland University College 425 matriculated, 185 non-matriculated, and 16 exempt; at Victoria University College 325 matriculated, 52 non-matriculated, and 67 exempt; at Canterbury College 330 matriculated, 208 non-matriculated, and 7 exempt; at Otago University 489 matriculated, 120 non-matriculated, and 33 exempt.
University scholarships may be divided into three broad classes—
(1) Entrance scholarships, (2) scholarships awarded during the degree course, (3) post-graduate scholarships.
University entrance scholarships are awarded annually on the results of the University Junior Scholarship Examination, and are as follows: University Junior, University National, and Taranaki Scholarships, in addition to some thirty or forty local and privately endowed scholarships awarded on the results of the same examination. In addition to the scholarships, and partly in connection therewith, a scheme of bursaries entitling students to free tuition is also in operation.
Scholarships awarded during the degree course are the Senior University, Tinline, and Sir George Grey Scholarships. The first two are tenable by candidates sitting for their final examination for B.A. or B.Sc, and may therefore be regarded in a sense as post-graduate.
The chief scholarships awarded at the end of the University course are the Rhodes Scholarship, the 1851 Exhibition Scholarship, the Medical Travelling Scholarship, and the National Research Scholarships. The first three are all tenable abroad. The Research Scholarships are each of the value of £100 per annum, with laboratory fees and expenses. They have hitherto been offered annually by the Government, one to each of the affiliated institutions, to promote research-work likely to be of benefit to New Zealand industries. The Research Scholarships are now placed under the control of the University of New Zealand.
So far twelve Rhodes Scholarships have been granted, of which five have been gained by students of Auckland University College, four by students of Otago University, two by students of Victoria University College, and one by a student of Canterbury College.
So far sixteen Research Scholarships have been awarded under the old conditions. Of these, four were in active operation in 1914, and two were taken up at the beginning of 1915. The subjects of research undertaken have been in each case closely connected with some New Zealand industry, or with some industry which, though not yet undertaken in this Dominion, may at an early date be an industry of importance in New Zealand. Of recent years the inclination of Professorial Boards has been to endeavour to arrange for new research scholars to carry on the work as from the stage at which it has been left by former students. Such a method, taking into consideration the fact that the tenure is for two years only (though with a possible extension to a third year), is more likely to result in discoveries of economic value.
The University bursaries that were awarded up to the end of 1914 were, on the coming into force of the University Amendment Act of that year, divided into two classes—University bursaries proper and educational bursaries. The Act provided that the former, awarded on the credit pass in the University Entrance Scholarship Examination or on a higher leaving-certificate qualification, should pass under the control of the University of New Zealand, while the latter were provided for by regulations under the Education Act, 1914. Any matriculated student is entitled to an educational bursary who—
Has within six months immediately preceding completed his term of service as a pupil-teacher or probationer in some education district in accordance with regulations and to the satisfaction of the Education Board and of the Senior Inspector of that district, and declares his intention of entering a recognized training college on the completion of the tenure of his bursary; or
Has satisfactorily completed his course of training at a recognized training college and gained a trained-teacher's certificate; or
Has otherwise gained a teacher's certificate of a class not lower than Class C.
A University bursary is tenable for three years, with a possible extension to a fourth, and the conditions applying to University national scholars apply also to University bursars, with some relaxation of the rule regarding the keeping of terms. An educational bursary is tenable for three years, with possibly two yearly extensions, at a University college or recognized school of agriculture. The classes taken must be such as to form part of a course in arts, science, or agriculture, and proof of satisfactory progress must be given.
The number of bursaries held in 1914 was 286, of which number 110 were held under clause 1 (a) or 1 (b) of the older regulations, and 175 under clause (1) (c), 1 (d), or 1 (e) of those regulations. The total amount paid in fees on account of the bursaries was £3,469, of which amount £2,574 was in respect of the former class of bursaries. Holders of bursaries under clause 1 (a) or 1 (b) will be eligible to continue as University bursars in 1915. There are 155 such cases. Bursaries under clause 1 (c), 1 (d), or 1 (e) will be tenable as educational bursaries under the new conditions. There will be 100 such bursaries, distributed as follows: Auckland University College, 13; Victoria University College, 32; Canterbury College, 30; Otago University, 25.
With the view of extending the sphere of usefulness of the special courses in home science and domestic arts inaugurated by the Council of the Otago University, regulations providing for the award of bursaries in connection therewith were issued in November, 1912, under the Regulations for Manual and Technical Instruction. These bursaries may be awarded on the recommendation of the Council to students who have been resident in the Dominion for not less than twelve months. Applicants must have—
Passed the Matriculation Examination or some other examination approved for the purpose; or
Obtained at least a partial pass in the examination for the Class D teachers' certificate: or
Gained a higher leaving certificate or, in the case of pupil-teachers or probationers, a lower leaving certificate.
Applicants are required to make a declaration that they will on completion of their course engage in teaching for not less than three years.
The term of a bursary is two years, but may be extended for one year longer. A bursar under these regulations receives £20 per annum, together with the fees for the course for the degree or the diploma in home science and domestic arts, and, if obliged to live away from home, an allowance of £39 per annum. These bursaries are not tenable by holders of any other bursaries or of any scholarship of the value of £20 and upwards.
Bursaries of this kind have been awarded to six students for the year 1915, making in all twenty-one bursars in attendance at classes. Fifteen bursars are taking the course for the degree, and six that for the diploma. The degree of bachelor of science in home science has been conferred on two students, while five have qualified for the diploma.
The following table shows the number of scholarships, bursaries, and studentships held at each University college during the year 1914:—
| SCHOLARSHIPS, BURSARIES, EXHIBITIONS, AND STUDENTSHIPS HELDAT THE AFFILIATED INSTITUTIONS IN 1914.* | |||||
|---|---|---|---|---|---|
| Scholarships, &c. | Auckland University College. | Victoria University College. | Canterbury College. | Otago University. | Total. |
* Exclusive of Rhodes Scholarships and International Exhibition Scholarships (which are tenable out of New Zealand), and exclusive also of Research Scholarships. † Including nineteen home-science bursars. | |||||
| Junior University Scholarships | 7 | 6 | 4 | 11 | 28 |
| Senior National Scholarships | 13 | 11 | 14 | 19 | 57 |
| Taranaki Scholarships | .. | 3 | .. | 3 | 6 |
| Senior University Scholarships | 4 | 2 | .. | 5 | 11 |
| University bursaries | 49 | 75 | 56 | 106 | 286 |
| Sir George Grey Scholarships | 1 | 1 | .. | 1 | 3 |
| Other scholarships and exhibitions | 2 | 3 | 8 | 31† | 44 |
| Training-college studentships | 108 | 105 | 96 | 115 | 424 |
| Totals 1914 | 184 | 206 | 178 | 291 | 859 |
| Totals, 1913 | 154 | 170 | 168 | 260 | 752 |
| Difference | 30 | 36 | 10 | 31 | 107 |
Early in 1915 New Zealand was visited by representatives of the Workers' Educational Association, Sydney branch, and as a result of their visit branches of the association have been formed in the four University districts. Each district is organized separately in connection with the local University College, and the government of the association follows the English model. The Senate of the University granted £1,200 for the work of the association, leaving the administration of the funds to the four colleges. No State subsidy has yet been granted; but local bodies have contributed to the funds of the movement.
The main work of the association is the establishment of tutorial classes, some University subject. Classes have been formed in each centre, and the numbering from twenty to thirty students, who take a three-years course in subjects chosen have been, among others, economics, economic history, psychology, electricity.
The Workers' Educational Association also undertakes the provision of public lectures on educational subjects, the formation of study circles, &c. So far, the work has been confined to the centres: but it is hoped in the near future to extend the scope of the association's activities to the smaller towns and the rural districts. The aim of the association is to put within the reach of worker; University education in a single subject. The expense of the classes is borne by the University, which also provides a small library for each class, and the cost to the student is a nominal fee, retained by the class itself, and the provision of a text-book.
Annual examinations are conducted by the Education Department for the various purposes of Junior National Scholarships, junior and senior free places in secondary schools, district high schools, and technical schools, and teachers' certificates. On behalf of the various Education Boards examinations are conducted for Junior and Senior Board Scholarships and for the First Examination of Pupil-teachers. Also, by arrangement with the Public Service Commissioner, examinations are held for admission to and promotion in the Public Service.
The following table shows collectively, in comparison with the preceding year, the number who entered for the various examinations above enumerated, the number present, and the number of absentees:—
| Number who entered, 1914–15 | 10,126 |
| ” 1913–14 | 9,613 |
| Number who actually sat for examination, 1914–15 | 8,727 |
| ” “ “ 1913–14 | 8,305 |
| Number of absentees, 1914–15 | 1,399 |
| ” 1913–14 | 1,308 |
The number of candidates who actually presented themselves in the examination-room is given below. For the sake of comparison the figures for the previous three years are also given:—
| 1911–12. | 1912–13. | 1913–14. | 1914–15 | |
|---|---|---|---|---|
| Junior National and Education Board Scholarships and junior free places | 2,564 | 2,934 | 3,154 | 3,562 |
| Intermediate (Education Board Senior Scholarships, senior free places, First Pupil-teachers) and Public Service Entrance | 2,563 | 2,770 | 2,756 | 2,739 |
| Teachers D and C | 1,626 | 1,753 | 1,524 | 1,576 |
| Public Service Senior | 518 | 574 | 871 | 804 |
| Typists' Examination | .. | .. | .. | 46 |
| Totals | 7,271 | 8,031 | 8,305 | 8,727 |
The Department's examination for Junior National Scholarships has latterly been used by all the Education Boards of the Dominion for the award of their junior scholarships, superseding thus without exception any examination locally conducted in earlier years for this purpose. For the award of their senior scholarships Education Boards have used the Intermediate Examination as arranged for this purpose, the papers set being the same as those provided for the Public Service Entrance Examination, and the terms in each case being determined by the regulations of the several Boards offering senior scholarships for competition. Other purposes for which the Intermediate Examination of 1914 was used, with certain modifications to suit a purely qualifying or non-competitive candidature, were—(1) The award by examination of senior free places in secondary schools and district high schools; (2) as an examination for pupil-teachers of the second or third year, and for appointment to pupil-teacherships of the second year or to probationerships under the provisions of the Education Amendment Act, 1908; and (3) general purposes of educational certificates of this standing.
Under the provisions of the Education Act, 1914. Junior and Senior Board Scholarships will no longer be awarded, being replaced entirely by National Scholarships. National Scholarship Examinations will now lose their competitive character, all candidates who reach the standard fixed for the year, and are otherwise eligible, receiving junior or senior scholarships. For the senior examination the Public Service Entrance Examination papers will still largely be used.
A further change will result from the issue of the new Regulations for Pupil-teachers made in December last. As no provision is made for special examinations for pupil-teachers in subjects other than those of professional training, the examination hitherto known as the First Examination of Pupil-teachers will now disappear.
The cost of conducting the Department's examinations was as follows:—
| £ | ||
| Total expenses, including cost of additional clerical services temporarily employed | 6,919 | |
| Less recoveries— | ||
| Fees paid by candidates for teachers' certificates and others | £2,024 | |
| Paid by Public Service Commissioner for expense of conducting examinations— | ||
| Public Service Entrance | 729 | |
| Public Service Senior | 1,048 | 3,801 |
| £3,118 |
With a view to subsidizing libraries, especially small and struggling institutions in sparsely populated districts, Parliament has frequently voted sums of money for distribution on a fixed basis. In 1914 Parliament voted the sum of £4,000 for payment of subsidies to public libraries. The method of distribution of the vote was the same as that adopted in previous years—viz., a nominal addition of £25 was made to the amount of the income of each library derived from subscriptions, donations, and rates, provided that the receipts for the year were not less than £2, and the vote was distributed according to the amount thus augmented; but no library received credit for a larger income than £75—that is, in no case did the augmented amount on which distribution was based exceed £100.
The number of libraries among which the subsidy was divided in March, 1915, was 380, the vote yielding a subsidy of 4s. 10.96d. in the pound on the nominal income, and the subsidies paid ranging from £6 12s. 7d. to £24 11s. 4d. The number of libraries participating in the vote shows a decrease of twenty-one as compared with the number aided in the previous year. This is largely accounted for by the fact that many applications had to be refused owing to the income from subscriptions, &c., having been less than £2. Many applications were also received too late to be considered.
In order that the purpose intended to be served by the vote may be attained, it is made a condition that the whole of the subsidy granted to each library must be expended in the purchase of books. It is further enjoined upon the authorities in charge of the libraries that a due proportion of the books purchased shall be books having a permanent value.
The Secretary for Education, in his annual report, remarks as follows: “There is still room for very great improvement in this respect, although 75.9 per cent. of the books purchased this year were works of fiction, as compared with 83 per cent. in the previous year. If the additions made by the large libraries were not taken into consideration the proportion of novels purchased would be 86.8 per cent. In the case of 110 libraries practically all of the books added during the year were works of fiction. It is realized that many books coining under this heading form useful reading-matter, but it is feared that a large proportion of the books purchased have little or no educational or instructive value.”
Table of Contents
THE liability of all male inhabitants of the Dominion for service in the Military Forces is laid down in the Defence Act and Regulations as under:—
The Act provides for the gradual military training of every male from the age of fourteen to the age of twenty-five, after which he will serve in the Reserve up to the age of thirty. There are no distinctions and no exceptions. The principle is that every one, unless physically unfit, must take his share in the defence of the Dominion. Those who, in consequence of the doctrines of their religion, have a conscientious objection to bearing arms in the service of their country will be trained as far as possible in the non-combatant branches, of which ambulance work is made a special feature, or under very exceptional conditions such persons may apply to a Magistrate for exemption from military training on the certificate of a minister of religion. Subject to the full establishment of Territorials required being maintained, the regulations admit of a man of good character, who has proved himself to be thoroughly efficient, being transferred to the Reserve after four years' service—viz., at the age of twenty-two.
Those liable for service are required to be registered as such. Any person who fails to take any stop necessary to secure his registration is liable to a line of £5, and may be deprived of civil rights for any period not exceeding ten years. Any person so deprived of civil rights shall during the period of deprivation be incapable of being appointed to any office or employment, whether permanent or temporary, in the Public Service, and shall not be entitled to be or remain registered on any electoral roll under the Legislature Act. No such deprivation of civil rights shall affect the obligation of the offender to render personal service under the Defence Act, and the Act shall continue to apply to him in all respects as if no such order of deprivation had been made.
Under section 27 (1), Defence Act, 1909, all male inhabitants of New Zealand between the ages of seventeen and fifty-five, not exempted, are liable to serve in the Militia. Under section 28 (1), Defence Act, 1909, the whole or any part of the Militia may be called out in time of war by Proclamation, and, when so called out, becomes a part of the Defence Forces.
From the age of twelve to the age of fourteen a boy at a primary school performs a certain amount of physical elementary training under the direction of the Education Department. This is not considered military training under the Defence Act.
On reaching the age of fourteen, or on leaving a primary school, the boy is transferred to the Senior Cadets, and then becomes a member of the Military Forces, though not liable to be called out to fight.
He remains a Senior Cadet till he is eighteen, on reaching which age ha is, if found, on being medically examined, to be physically fit, drafted into the Territorial Force. As a Territorial soldier he is liable to be called out at any time for service within the Dominion.
On reaching the age of twenty-five, if still serving, he is transferred to the Reserve. He remains in the Reserve till he reaches the age of thirty, when he will be discharged. As a Reservist he will be liable to be called back to his regiment in case of war or other national emergency.
If he belongs to a Rifle Club he will, as long as he remains a member, be liable up to the age of fifty-five to be called up as part of a secondary Reserve to fill the ranks of the Territorial Force after its own Reserve has been used up. A male of an age rendering him liable to undergo military training may in certain circumstances be allowed to undergo training as a member of a Defence Rifle Club under approved conditions where the nearest drill centre of a Territorial unit is too far distant for him to attend parades.
Provision exists under which Rifle Clubs absorb and train about 35 per cent. of enrolled strength of those liable to serve in the Territorial Force.
As far as possible arrangements are made to post the incoming recruits to the branch of the service and the drill centre they desire to be trained in, and care is taken not to post to the same unit more persons out of any business concern than the employer can spare at the same time.
All exemptions and temporary exemptions on medical grounds are to be granted and issued, and all transfers and discharges from the Territorial Force of those qualified are made, in June each year.
The total number of registrations for military training since the inception of the scheme of universal service up to the 30th April, 1915, is as follows:—
| District. | Territorials. | Senior Cadets. | Total. |
|---|---|---|---|
| Auckland | 9,677 | 13,419 | 23,096 |
| Wellington | 8,804 | 18,155 | 26,959 |
| Canterbury | 6,686 | 15,446 | 22,132 |
| Otago | 6,406 | 10,704 | 17,110 |
| 31,573 | 57,724 | 89,297 |
During the year 1914 8,223 recruits for the Territorial Force were medically examined. Of these, 246 (3 per cent.) were classified as unfit to serve during the current year, and 415 (5 per cent.) were declared totally unfit for service; 7,562 recruits were found to be fit for service in the Territorial Force and General Training Section.
The Minister of Defence is responsible to Parliament for both the Navy and the Army of New Zealand.
The General Officer Commanding the New Zealand Forces is the responsible adviser of the Minister, and, under him, controls the Military Forces. He is assisted by the following heads of departments:—
The Chief of the General Staff;
The Adjutant-General;
The Quartermaster-General.
The Chief of the General Staff is responsible for war policy; staff organization; staff tours; record of officers suitable for Staff employ; instructions and training for war; education and examination of officers; training-manuals; arrangements for examination of candidates for British Army and Royal Australian Military College manœuvres; estimates for and allocation of training and manœuvres grants; military library; exemption from training; intelligence: plan of local defence and distribution of Forces; mapping and reconnaissance; war establishments and war organization; plans for mobilization; censorship; policy regarding Rifle Clubs, rifle ranges and associations, military tournaments, arms, ammunition, armament, artillery, coast defences, engineers.
Under the charge of the Adjutant-General are peace policy and peace establishment; administration; discipline; martial, military, and international law; supervision of Record-office work; mobilization of personnel; Military Regulations, including Mobilization Regulations; medical services; courts-martial; administrative arrangements in connection with training and education; ceremonial; personnel; editing and issuing of orders (other than operation orders); Army List; leave of absence (except exemption from training); registration, enrolment, and posting; appointment to and distribution of Permanent Staff; returns; personal records, N.Z. Forces; chaplains; medals; war-medal claims and military pensions; honorary Territorials: National Reserves; prisoners of war; personnel of reinforcements; statistics; casualties.
The Quartermaster-General has under his supervision transport service, including railways, ordnance, mobilization, and store buildings and drill-halls; mobilization stores, supplies for peace and war; mobilization, administration, distribution, and technical training of personnel of these services; duties of accounting officers and approving officer; armament; clothing and equipment and general stores (excepting artillery and engineers); dress regulations; quartering supplies and quartering; inspection and care of machine guns and small-arms; veterinary services and remounts; remount-depot; compilation of parliamentary estimates; contracts; pay duties; watching progress of expenditure and liabilities; financial advice; financial instructions and allowance regulations; Motor Service Corps; Defence Department vessels; travelling claims and allowances; hire of buildings, and caretakers for same; postal services; military lands and manœuvre areas; patterns, experiments, and trials; mobilization store tables; stationery; pay of Expeditionary Force.
The Dominion of New Zealand is divided into four military districts (two in each Island), each under a Permanent District Commander assisted by a Staff, as follows:—
Officer Commanding—
General Staff:—
Attached to General Staff,—
Instructor in Mounted Duties.
Instructor in Infantry Duties.
Instructor in Musketry.
Intelligence Officer (unpaid Territorial officer).
Administrative Staff:—
Assistant Adjutant and Quartermaster-General.
Assistant Director of Supplies and Transport.
Principal Medical Officer (partially paid Territorial officer).
District Sanitary Officer (unpaid Territorial officer).
Principal Veterinary Officer (partially paid Territorial officer).
District Accountant.
District Storekeeper.
Each district is divided into four or five “area groups” or “areas,” each commanded by a Permanent officer. An area, as a rule, furnishes a complete Infantry regiment (of one battalion), as well as other units, or portions of units, and Cadets.
An area is divided into two or, as a rule, more sub-areas, each in charge of a Permanent non-commissioned officer.
The organization and establishments of units are, speaking generally, the same in peace as in war. They are composed of Territorial officers and men. There are no units composed wholly of Permanent men. Territorial units include members of the Permanent Forces as follows:—
Each battalion of Infantry and regiment of Mounted Rifles has a Permanent Adjutant, sergeant-major, and quartermaster-sergeant.
Each Field Artillery brigade has an Adjutant, a battery sergeant-major, a battery quartermaster-sergeant, a farrier-sergeant, and a saddler-quartermaster-sergeant. In addition, each battery has a Permanent cadre of two non-commissioned officers and eight men (gunners and drivers) and twelve horses. This personnel belongs to the Royal New Zealand Artillery.
Each fort has a small cadre of Permanent Garrison Artillery. These cadres supply the assistant instructors, specialists, district gunners, &c., necessary when the forts are manned for service practice or instruction. These also belong to the Royal New Zealand Artillery.
The Military Forces of New Zealand are organized for war into a field army and its reserves, coast-defence troops, and lines-of-communication troops. The field army is organized into two Mounted Rifle brigades (one in each Island) and two divisions (one in each Island). Composition and detail are as follows:—
A division consists of—
Headquarters;
1 Mounted Rifle brigade;
2 Infantry brigades;
and the following divisional troops:—
2 Field Artillery brigades (four-gun batteries);
Divisional ammunition column;
2 Field companies Engineers;
Divisional signal services;
4 companies Army Service Corps;
2 Field Ambulances;
1 Mounted Field Ambulance.
(b.) An independent Mounted Rifle brigade consists of—
Headquarters;
3 Mounted Rifle regiments;
1 Mounted Signal troop;
1 company Army Service Corps;
1 Mounted Field Ambulance.
(c.) Coast-defence troops consist of—
Detachment Permanent Force (the Regiment of Royal New Zealand Artillery);
2 divisions Garrison Artillery (each 3 companies) and 3 independent companies;
1 Infantry regiment and 7 companies;
1 Mountain battery.
(d.) Lines-of-communication troop consist of—
2 Railway battalions;
2 battalions Post and Telegraph Corps;
Army Service Corps and other services as required.
The New Zealand Territorial Force (including the Territorial Reserve) is the first line of defence of the Dominion after the Imperial Navy. Its position cannot be fairly compared with that of the Territorial Force in the United Kingdom, which has the Regular Army and Special Reserve in front of it. The New Zealand Territorial Force must be able to take the field at once on the outbreak of war. It is the New Zealand Army; and the Permanent officers of the Staff Corps, the Permanent Regiment of the Royal New Zealand Artillery, and the warrant and non-commissioned officers of the Permanent Staff are its auxiliaries to control, guide, and instruct it.
The Territorial Force is maintained at a strength of about thirty thousand, and is organized in field and coast-defence units with practically the same establishment for peace as for war. In each of the four military districts into which the Dominion is divided there is a brigade of Infantry, a brigade of Mounted Rifles, and a brigade of Field Artillery, as well as the necessary number of Garrison Artillery for coast-defence (three companies each in Wellington and Auckland, and one company each at Dunedin, Lyttelton, and Westport), a field company of Engineers, Medical units, and other departmental troops. An Infantry brigade includes four battalions and a Signal company; a Mounted brigade, three regiments of Mounted Rifles and a Signal company; and a brigade of Artillery, two four-gun batteries.
The Force is fully armed and equipped according to the most modern standard; the men are uniformed by the State, and are paid and rationed during the annual camp.
The units of the Force are commanded and trained by their own officers, assisted by the State Corps, the Permanent Force, and the Permanent Staff. Each Regimental Commander has a certain number of professional soldiers to help him and to relieve him of administrative duties, but no one to interfere between him and his regiment. The officers are drawn from the ranks on the recommendation of the Commanding Officers, and are appointed, promoted, and retired in accordance with definite regulations calculated to ensure their efficiency and their status.
The following are the rates of pay per diem for officers, warrant officers, non-commissioned officers, and men:—
| £ | s. | d. | |
|---|---|---|---|
| Colonels | 1 | 1 | 0 |
| Lieut. Colonels | 0 | 15 | 0 |
| Majors | 0 | 12 | 0 |
| Captains | 0 | 10 | 0 |
| Lieutenants and 2nd Lieutenants | 0 | 8 | 0 |
| Sergeants-major, staff sergeants, and colour-sergeants | 0 | 5 | 6 |
| Sergeants | 0 | 5 | 0 |
| Corporals | 0 | 4 | 6 |
| Other ranks | 0 | 4 | 0 |
The strength of the Territorial Force at the end of each of the last four military years was as follows:—
| 1911–12 | 22,614 |
|---|---|
| 1912–13 | 23,804 |
| 1913–14 | 25,902 |
| 1914–15 | 29,447 |
The strength of the Volunteer Force at the end of the year 1909–10 was 14,249.
Civilian committees have been formed in several of the leading centres of population for the purpose of enrolling citizens over tile age of liability for service as honorary Territorials, whose object it is to encourage and assist in various ways the regiments of which they are honorary members.
Men of the Territorial Force Reserve are borne on the reserve lists of their late unit or corps, and perform their annual parades with some part of that unit or corps.
The unit of organization and training in the Senior Cadets is the company of Infantry. Companies composed of Cadets belonging to any school or other recognized organization (such as the Boy Scouts) form part of that school or organization, and are subject to its discipline, supplemented by the regulations. In dealing with such companies and in the appointment of their officers the military authorities co-operate with headmasters and with the heads of other recognized organizations. The Senior Cadets are officered by officers holding Territorial commissions on the Unattached List, with the same qualifications and liabilities as other Territorial officers.
In order to simplify the control of Cadets it was decided by the Ministers of Education and Defence that for training purposes (not registration—all over fourteen must register) all pupils attending primary schools will be considered Junior Cadets, and all pupils attending secondary schools will be considered Senior Cadets, irrespective of their ages.
Excluding expenses connected with instruction, the cost of the Senior Cadets is approximately £21,000 per annum.
On the 30th April, 1915, there were 26,446 Senior Cadets.
The Rifle Clubs, being part of the New Zealand Military Forces in virtue of the liability of their members to serve as a second line of defence, are governed by the Military Regulations, and are required to carry out each year a prescribed course of musketry. Members of Rifle Clubs liable to undergo military training are required to attend at least eighteen afternoon or evening drills at convenient drill centres. The drill centres are as far as possible arranged so as not to entail more than one hour's walk or one hours ride from the men's homes, as in the case of Territorials and Senior Cadets.
It is found that only about 5 per cent. of those liable for service are totally unfit: about 60 per cent. are posted to the Territorial Force and about 35 per cent. to the Rifle Clubs.
The Defence Forces of New Zealand, in view of this accession of strength to Rifle Clubs, are placed in two categories in their relation to training and defence:—
First line—The Territorial Force and the Territorial Reserve.
Second line—The Rifle Clubs and the training sections affiliated to Rifle Clubs.
On the 31st March, 1915, there were 240 Defence Rifle Clubs in the Dominion, with a total enrolled strength of 8,770. The strength of a Rifle Club varies according to population and situation. Membership of a club is limited to fifteen as a minimum, and one hundred as a maximum, consisting of (1) ordinary members, (2) honorary members, and (3) General Training Section attached. Each Rifle Club receives a yearly allowance of 150 rounds of ammunition per member, and a further 200 rounds per member may be obtained at reduced rates. The number of Rifle Clubs in an area depends on the personnel available, as in the case of Senior Cadets. The instruction in Rifle Clubs is undertaken by Permanent officers and N.C.O.s. The cost of existing Rifle Clubs is approximately £20,000 per annum.
A number of Mounted Rifle Clubs have recently been formed.
The National Reserve movement, which began in a small way within the past two or three years, received a great impetus through the outbreak of the European War.
The National Reserve consists of those who, though under no obligation for service, still desire to organize and assist in the protection of the Dominion in time of emergency. In order to lit in with the New Zealand Defence scheme, if called up under the terms of the Militia Act, members are organized into platoons, companies, squadrons, batteries, &c., in the area in which they reside.
In each military district the affairs of the National Reserve are administered by an executive committee consisting of a President, Vice-President, and ten other members.
The military authorities do not undertake to drill or train the National Reserve in peace-time, nor do they provide arms or equipment, but they do all in their power to advise and assist the executive.
The training of the Cadet and soldier throughout his service is strictly territorial—that is to say, it will, except for the period annually spent by the Territorial soldier in camp, be carried out within reach of his own home, and at convenient times. The whole of the training is arranged with every possible consideration for the interests both of the employer and of those who are being trained. The annual training-camps are held by brigades and coast-defence commands, the aim being to properly train in organized bodies an efficient held force of the best material available.
The minimum amount of training which must be performed each year by every member of the Territorial Force. Reserve, Senior Cadets, and Rifle Clubs is as follows:—
Thirty drills, twenty of these to be out-of-door parades.
Twelve half-day or six whole-day parades, all of which are to be exercises in the field, except in the case of Garrison Artillery units, which are exercised at the works of defence to which they are allotted on mobilization.
Seven days annual training in camp (exclusive of the days of arrival and departure.)
Mounted Rifles and country companies of Infantry spend eleven days in camp, four days being in lieu of a proportionate number of parades and drills held: forage and rations, but not pay, are granted for the extra four days in camp.
Prescribed course of musketry.
Prescribed course of musketry and eighteen afternoon or evening drills.
A drill in the Territorial Force is one hour and a half continuous instruction. A drill in the Senior Cadets is one hour continuous instruction. A half-day parade is three hours continuous instruction. A whole-day parade is six hours continuous instruction.
An out-of-door parade may be carried out in the evening, and will not be devoted entirely to drill, but will include route marching, outposts by day and by night, entrenching, signalling, driving, &c., and such work as cannot conveniently be carried out indoors. In the case of Artillery and Technical corps the proportion of outdoor parades may be reduced at the discretion of the Commanding Officer. 'The principle is that the drill-shed should be avoided as far as possible.
The Field Artillery is completely equipped with modern 18-pr. field guns and 4.5 in. howitzers. The latest type of gun has been ordered for the mountain battery.
The Infantry is armed with the Lee-Enfield rifle. Sufficient rifles and carbines exist to arm the Territorial Force and its reserves. With few exceptions, the Cadets are armed with the same rifle as the Citizen Forces.
Mounted Rifle regiments and Infantry battalions are equipped with machine guns and pack transport for the same.
The Territorial Force is clothed throughout in khaki serge of service pattern, manufactured in the Dominion. Each Territorial soldier receives, on joining, one complete suit, a greatcoat, a hat, and a cap; no boots are issued. A reserve of clothing to meet the yearly quota of recruits is kept in stoic. The clothing contractors are prepared to increase their output tenfold in emergency. The Territorial Infantry are equipped with the web field service equipment; Mounted units use the bandolier leather equipment. Each individual in the Mounted Rifles supplies his own saddlery.
The Cadets' uniform consists of blouse and shorts of khaki serge with khaki hat and puttee stockings. They have a waist-belt and pouch.
By the Australian Defence Act, 1887, provision was made for the payment by New Zealand of a proportional part of the cost of establishment and maintenance of a British Naval Force to be employed for the protection of trade in Australasian waters. Under this Act a sum of approximately £20,000 per annum was paid by New Zealand to the Imperial Government.
In 1903, consequent on the passing of the Australian and New Zealand Naval Defence Act, the annual contribution payable by New Zealand was raised to “a sum not exceeding £40,000.”
By the Naval Subsidy Act, 1908, the contribution of the Dominion was again increased, this time to a sum of £100,000 payable annually for ten years from the 12th May, 1909.
The year 1909 was an important one in the history of the Dominion. At what was generally regarded as a critical period for the whole Empire, New Zealand presented a battle-cruiser to the Home Government. Full information concerning this vessel and her visit to New Zealand in 1913 appears in the 1913 issue of this book (pages 932–941).
In the same year an Imperial Defence Conference met at London, and an agreement was arrived at for the establishing of a Pacific Fleet, to consist of three units, in the East Indies, Australia, and the China seas. Under this agreement it was arranged that the Dominion's gift ship should be the flagship of the China unit, and that seven vessels of this unit were to be stationed in peace-time in New Zealand waters, the ships to be manned as far as possible by New Zealand officers and men.
Subsequent events made it necessary to revise the arrangement entered into, and the “New Zealand” was stationed by consent in English waters. Instead of the seven vessels of the China unit of the Pacific Fleet which it had been intended to place in New Zealand waters, only a few small vessels of the former Australasian Squadron had their headquarters transferred to the Dominion.
The Naval Defence Act, 1913, provides for the establishment of a New Zealand Naval Force, to be raised and maintained by voluntary enlistment only, enlistment being for a prescribed period of not less than two years. In time of war the Naval Force (including vessels acquired for defence purposes) is to be at the disposal of the British Government. The establishment of a New Zealand Royal Naval Reserve is also provided for under the Act. The third-class cruiser “Philomel” was lent by the English Admiralty to the New Zealand Government to serve as a training-ship for the forming of a nucleus of the Naval Force.
The Dominion Rifle Association was formed to encourage the members of the New Zealand Defence Forces to become efficient in the use of the rifle and to promote rifle - shooting generally as a necessary element for the defence of the Empire. It was established in 1879, the annual rifle meetings prior to that date having been conducted and controlled by the military authorities. For some years after its formation its movements from year to year were peripatetic, but it is now definitely fixed at Trentham, near Wellington, where a range accommodation of seventy-five targets with all necessary equipment and suitable buildings have been made available for the rifle championship meetings, which are conducted annually under the control of the Dominion Rifle Association. The following is a statement of entries and prize-money (exclusive of trophies) for the five years 1910 to 1914. No meeting was held in 1915:—
| Number of Competitors. | Entry Fees. | Prize-money. | |
|---|---|---|---|
| 1910 | 568 | 1,704 | 1,702 |
| 1911 | 583 | 1,927 | 1,931 |
| 1912 | 310 | 1,154 | 1,524 |
| 1913 | 351 | 1,269 | 1,609 |
| 1914 | 347 | 1,220 | 1,520 |
The Association receives an annual grant from the State.
Railway passes are granted to Territorials and members of Rifle Clubs up to a distance of 100 miles to attend rifle-shooting competitions.
Table of Contents
THE ordinary civil jurisdiction of Magistrates' Courts is limited generally to claims not exceeding £100, but extended jurisdiction is exercised by some Magistrates, the limit being £200. Justices of the Peace may hear and decide civil cases when the sum in dispute does not exceed £20. The number of plaints issued, cases tried, amount sued for, and amount for which judgment was recorded in the lower Courts during the ten years 1905–14 is shown in the following table:—
| Year. | Cases entered. | Cases tried. | |||
|---|---|---|---|---|---|
| Number. | Total Amount claimed. | Number. | Total Amount sued for. | Total Amount for which Judgment entered. | |
*No information. | |||||
| £ | £ | £ | |||
| 1905 | 37,157 | 379,941 | 20,161 | * | 202,923 |
| 1906 | 40,540 | 419,198 | 23,381 | * | 236,643 |
| 1907 | 42,561 | 429,379 | 24,435 | * | 232,306 |
| 1908 | 42,877 | 529,271 | 27,578 | * | 282,932 |
| 1909 | 52,456 | 597,831 | 29,782 | * | 326,040 |
| 1910 | 55,225 | 562,115 | 29,698 | * | 293,326 |
| 1911 | 53,394 | 557,158 | 34,627 | * | 296,629 |
| 1912 | 57,079 | 592,943 | 36,815 | 420,073 | 331,020 |
| 1913 | 61,759 | 670,925 | 39,086 | 427,484 | 366,981 |
| 1914 | 62,471 | 706,953 | 39,233 | 455,197 | 398,760 |
These figures show a marked increase in recent years in both the number of litigants and the amount sued for. It would appear that the practice of using the Courts as media for the collection of small debts is growing not only in New Zealand, but in other countries. In 1913 the civil cases brought before County Courts and Courts of Petty Sessions in Victoria numbered 40,422, the total amount sued for being £469,438. The figures for 1900 were 18,366 cases, the amount sued for in that year being £256,566. The limit of jurisdiction in Victoria is £500 in County Courts and £50 in the Courts of Petty Sessions.
The number of actions commenced, cases tried, and judgments entered, together with the total amount for which judgments were recorded in the Supreme and District Courts of New Zealand during each of the ten years 1905–14 were as follows:—
| SUPREME AND DISTRICT COURTS: CIVIL JURISDICTION. | |||||
|---|---|---|---|---|---|
| * Cases tried. | Judgments recorded. | ||||
| Year. | Number of Actions commenced. | With Jury. | Without Jury. | Number. | Amount. |
* Supreme Courts only, District Courts abolished. | |||||
| £ | |||||
| 1905 | 654 | 62 | 221 | 155 | 50,031 |
| 1906 | 599 | 73 | 240 | 189 | 44,955 |
| 1907 | 703 | 57 | 197 | 177 | 47,872 |
| 1908 | 849 | 70 | 243 | 225 | 73,687 |
| 1909 | 870 | 67 | 222 | 267 | 91,638 |
| 1910* | 569 | 52 | 211 | 193 | 83,427 |
| 1911* | 729 | 76 | 170 | 211 | 84,822 |
| 1912* | 755 | 64 | 233 | 235 | 102,657 |
| 1913* | 788 | 75 | 243 | 284 | 79,610 |
| 1914* | 792 | 95 | 251 | 281 | 91,286 |
It would appear that the greater number of cases are settled out of Court, the actions tried in the Supreme Court in 1914 representing only 43.69 per cent. of those commenced.
Under the Bankruptcy Act, 1908—a consolidation of the then existing laws—a person may seek the protection of the Bankruptcy Court by filing a petition with a declaration of insolvency, or one or more creditors may petition the Court to have a debtor declared insolvent. The Dominion is divided into four districts for administrative purposes, each district being in charge of a State officer styled the Official Assignee, who is assisted by deputies stationed at the principal business centres. The number of transactions in bankruptcy during the past ten years was as follows:—
| Year. | Petitions by Debtors. | Adjudications on Petitions by Creditors. | Cases in which Composition accepted. | Orders of Immediate discharge granted. | Cases in which Orders of Discharge were suspended. |
|---|---|---|---|---|---|
| 1905 | 267 | 37 | 5 | 68 | 24 |
| 1906 | 305 | 42 | .. | 103 | 20 |
| 1907 | 302 | 48 | 1 | 107 | 31 |
| 1908 | 354 | 52 | 4 | 105 | 34 |
| 1909 | 412 | 59 | 1 | 122 | 24 |
| 1910 | 329 | 64 | 4 | 135 | 14 |
| 1911 | 281 | 63 | 1 | 123 | 14 |
| 1912 | 278 | 34 | 2 | 88 | 13 |
| 1913 | 296 | 47 | 1 | 108 | 12 |
| 1914 | 322 | 69 | .. | 61 | 11 |
Private assignments and compositions are not registered, and particulars respecting this class of insolvency are not procurable.
The following table shows the total number of petitions, the amount of the unsecured assets, the amounts of debts proved, and the amount paid in dividends and preferential claims for the years 1905–14:—
| Year. | Number of Petitions in Bankruptcy. | Debtors' Statements of Assets, excluding Amounts secured to Creditors. | Amounts realized by Official Assignees. | Amount of Debts proved. | Amounts paid in Dividends and Preferential Claims. |
|---|---|---|---|---|---|
| £ | £ | £ | £ | ||
| 1905 | 304 | 100,813 | 47,798 | 146,332 | 28,150 |
| 1906 | 347 | 106,376 | 50,761 | 192,927 | 35,448 |
| 1907 | 350 | 77,698 | 59,849 | 158,663 | 42,459 |
| 1908 | 406 | 200,447 | 67,018 | 199,069 | 47,800 |
| 1909 | 471 | 204,187 | 71,351 | 259,017 | 44,110 |
| 1910 | 393 | 127,634 | 79,100 | 176,001 | 47,796 |
| 1911 | 344 | 88,592 | 40,009 | 133,517 | 28,757 |
| 1912 | 312 | 64,398 | 39,965 | 120,325 | 26,825 |
| 1913 | 343 | 155,582 | 42,735 | 228,829 | 25,812 |
| 1914 | 391 | 174,410 | 61,153 | 199,251 | 33,910 |
Of the bankruptcies in 1914: in 17 cases the liabilities were under £50; in 41, from £50 to £100; in 113, from £100 to £250; in 88, from £250 to £500; in 66, from £500 to £1,000; in 40, from £1,000 to £2,000; in 19, from £2,000 to £5,000; in 5, £5,000 and upwards.
A table showing the occupations of the bankrupts in 1914 is published in full in the volume of Statistics of the Dominion of New Zealand, and is summarized here:—
| OCCUPATIONS OF BANKRUPTS, 1914. | ||||
|---|---|---|---|---|
| Class. | Employers. | Working on Own Account. | Working for Wages. | Totals. |
| Professional | 4 | 11 | 4 | 19 |
| Domestic | 17 | 7 | .. | 24 |
| Commercial | 47 | 27 | 13 | 87 |
| Transport and communication | 8 | 7 | 3 | 18 |
| Industrial | 56 | 35 | 72 | 163 |
| Agricultural, pastoral, and mining | 14 | 38 | 9 | 61 |
| Indefinite | 1 | 11 | 5 | 17 |
| Totals | 147 | 136 | 106 | 389 |
| No information | .. | .. | .. | 2 |
| 391 | ||||
Under the provisions of the Judicature Amendment Act, 1913, the Court of Appeal now consists of two divisions, each composed of five Judges of the Supreme Court, the Chief Justice and the two senior Judges being members of both divisions. The two divisions sit separately, but the Governor in Council may authorize them to sit together for the purpose of determining any appeal deemed to be of special difficulty or importance.
The Chief Justice or, in his absence, the senior Judge presides. The decision of the Court must be in accordance with the opinion of a majority of the Judges present. Certain proceedings may by order of the Supreme Court be removed to the Court of Appeal. The decision of the Court of Appeal is final as regards the tribunals of New Zealand, but the Court may, in civil proceedings, give leave to either party to appeal to the Privy Council In criminal cases any party aggrieved by the judgment of the Supreme Court or any conviction or order removed into such Court, or on appeal against any such order, may appeal to the Court of Appeal. The number of cases brought before this Court, and the judgments thereon, for the past ten years will be seen in the following table:—
| Year. | Crown Criminal Cases. | Civil. | |||||
|---|---|---|---|---|---|---|---|
| Appeals. | Cases removed. | ||||||
| Number. | Convictions affirmed. | Number. | Allowed. | Number. | Judgments for Plaintiffs. | Judgments for Defendants. | |
| 1905 | 5 | 2 | 13 | 3 | 10 | 7 | 2 |
| 1906 | 4 | 2 | 26 | 10 | 6 | 5 | 1 |
| 1907 | 6 | 6 | 16 | 7 | 7 | 5 | 2 |
| 1908 | 9 | 5 | 15 | 6 | 13 | 8 | 4 |
| 1909 | 7 | 4 | 16 | 7 | 15 | 9 | 6 |
| 1910 | 8 | 8 | 17 | 10 | 11 | 6 | 5 |
| 1911 | 11 | 5 | 24 | 8 | 17 | 11 | |
| 1912 | 6 | 4 | 20 | 4 | 20 | 11 | 8 |
| 1913 | 8 | 5 | 18 | 4 | 20 | 13 | 6 |
| 1914 | 4 | 4 | 13 | 5 | 16 | 13 | 2 |
So far back as 1867 a Divorce and Matrimonial Causes Act was passed in New Zealand. Under this Act a husband might obtain a divorce on the grounds of adultery, but adultery alone was insufficient grounds for a wife to obtain a divorce from her husband. The actual grounds for divorce in cases where the husband was respondent must be: Incestuous adultery, or bigamy with adultery, or rape, &c., or adultery coupled with such cruelty as would otherwise have entitled the wife to a decree for a divorce a mensâ et thoro under English law, or adultery coupled with desertion without reasonable excuse for two years or upwards. A decree for a judicial separation might be obtained by either husband or wife on the grounds of adultery, or of cruelty, or of desertion without cause for a period of two years. The law as to judicial separation still holds.
The divorce law was revised in 1898. An Act passed in that year placed persons of either sex practically on an equality as regards petitions for dissolution of marriage; the same grounds, in substance, for a decree of divorce applying to man or woman. The grounds for divorce were altered as under:—
Adultery, on either side.
Wilful desertion continuously during five years or more.
Habitual drunkenness during four years and upwards on the part of husband, along with failing to support wife, or habitual cruelty; or habitual drunkenness for a like period and neglect, with unfitness to discharge her household duties, on the part of the wife.
Conviction, with sentence of imprisonment or penal servitude for seven years or upwards, for attempting to take life of petitioner.
Every decree for dissolution of marriage is in the first instance to be a decree nisi, not to be made absolute till after the expiration of such time, being not less than three months from the pronouncing thereof, as the Court shall by order from time to time direct. The petitioner need not necessarily move to make absolute any decree nisi that may be pronounced.
The Acts of 1867 and 1898 were consolidated in 1904. An amendment was passed by the Legislature in 1907, and after having been reserved for the Royal assent became law on the 9th May, 1908. By this Act failure to comply with a decree for restitution of conjugal rights ceased to be a ground for divorce proceedings. On the other hand, the following grounds were added, viz.:—
That the respondent has been convicted of the murder of a child of the petitioner or respondent.
That the respondent is a lunatic or person of unsound mind, and has been confined as such in any asylum or other institution or house in accordance with the provisions of the Lunatics Act for a period or periods not less in the aggregate than ten years within twelve years immediately preceding the filing of the petition, and that the respondent is unlikely to recover from such lunacy or unsoundness of mind. The period has since been reduced to seven years.
It is provided that where the ground of the petition is lunacy or unsoundness of mind the Solicitor-General shall take such steps as he may consider necessary in the interests of the respondent.
All enactments of the General Assembly of New Zealand relating to divorce, judicial separation, restitution of conjugal rights, and summary separation, prior to 1908, were consolidated in that year, and re-enacted under the title of the Divorce and Matrimonial Causes Act, 1908.
The Divorce and Matrimonial Causes Amendment Act, 1912, amended the main Act in various respects. In particular, section 2 reduced to seven years the period of detention in an institution for a mentally defective person necessary to constitute a ground of divorce.
Section 3 laid down that divorced persons may remarry at any time after the making of a decree absolute for the dissolution of a prior marriage, and section 4 declared that no appeal shall lie from such a decree absolute. Section 5 made valid any marriage already celebrated after the making of a decree absolute but before the expiration of the time limited for an appeal therefrom.
By an amendment to the Act passed in 1913, the respondent is empowered to apply for the order making the decree absolute. Section 6 of this Amendment Act provides that a husband who, while separated from his wife by mutual consent or judicial decree, habitually and without cause leaves her without reasonable maintenance, shall for the purposes of the main Act (relating to grounds of divorce) be deemed to have deserted her wilfully and without just cause or reasonable excuse, and to have left her so deserted.
The petitions for divorce in 1914 under the Divorce and Matrimonial Causes Act were 290 in number, being 30 more than those for 1913: 234 decrees for dissolution of marriage were granted. The proceedings under the Act for the years 1905–14 were as follows:—
| Year. | Divorce. | Judicial Separation granted. | Nullity of Marriage. | Restitution of Conjugal Rights. | |||
|---|---|---|---|---|---|---|---|
| Petitions. | Decrees. | Petitions. | Decrees. | Petitions. | Decree. | ||
| 1905 | 163 | 114 | .. | 2 | 1 | 17 | 11 |
| 1906 | 171 | 125 | 1 | 6 | 6 | 30 | 20 |
| 1907 | 192 | 147 | 1 | 3 | 2 | 30 | 21 |
| 1908 | 207 | 171 | 3 | 2 | 1 | 11 | 9 |
| 1909 | 219 | 163 | .. | 3 | 2 | 2 | 1 |
| 1910 | 200 | 154 | 2 | 7 | 6 | .. | .. |
| 1911 | 226 | 161 | .. | 2 | 1 | .. | .. |
| 1912 | 274 | 222 | 2 | 4 | 4 | .. | .. |
| 1913 | 260 | 223 | .. | 5 | 3 | .. | .. |
| 1914 | 290 | 234 | .. | 1 | 1 | .. | .. |
In the year 1897 there was one application for restitution of conjugal rights, but it was not till some years later that this means of establishing a ground for divorce was resorted to with frequency. As before stated, disobedience of an order for restitution is no longer a ground of petition for dissolution of marriage.
The Act of 1898 has evidently operated in the direction of increasing largely the number of petitions and decrees for dissolution of marriage or judicial separation.
The proportion of petitions and decrees for dissolution of marriage to the number of marriages was up till 1898 higher in New Zealand than in England and Wales, but lower than in New South Wales or Victoria. The full effect of the operation of the law of 1898 in New Zealand is now, however, being experienced.
As early as 1889 an Act was passed in Victoria to allow of divorces being granted for wilful desertion, habitual drunkenness with cruelty or neglect, imprisonment of either party under certain circumstances, and adultery on the part of the husband. This multiplication of the causes for divorce largely increased the proportion of decrees in that State.
An Act of a similar tenor was passed in New South Wales in 1892, and brought into working in August of that year, under which, and an amending Act of 1893, in addition to adultery since marriage on the part of the wife, and adultery and cruelty on the part of the husband, petitions for divorce can now be granted in that State on any of the following grounds:—
Husband v. wife: Desertion for not less than three years; habitual drunkenness for a similar period; refusing to obey an order for restitution of conjugal rights; being imprisoned under a sentence of three years or upwards; attempt to murder or inflict grievous bodily harm, or repeated assaults on him within one year previously.
Wife v. husband: Adultery, provided that at the time of the institution of the suit the husband is domiciled in. New South Wales; desertion for not less than three years; habitual drunkenness with cruelty or neglect to support for the same period; refusing to obey an order for restitution of conjugal rights; being imprisoned for three years or upwards, or having within five years undergone' various sentences amounting in all to not less than three years; attempt to murder, or assault with intent to inflict grievous bodily harm, or repeated assaults within one year previously.
To entitle either party to seek relief on these grounds, he or she must have been domiciled in the State at the time of instituting the suit for three years or upwards, and should not have resorted to the State for the purpose of the suit. When a wife seeks for a decree on the ground of three years' desertion, if she was domiciled in New South Wales when the desertion commenced, she shall not be deemed to have lost her domicile by reason of her husband having thereafter acquired a foreign domicile.
The divorces in New South Wales and Victoria since the divorce law has been altered in the direction of increasing the grounds for decrees are as under. With these are given the figures for New Zealand under the old law up to 1898, and according to the Act of 1898 up to 1913. The figures for New South Wales and Victoria appearing in the table are taken from official publications of those States.
| Year. | New South Wales. Divorces. | Victoria. Divorces. | New Zealand. Divorces. |
|---|---|---|---|
| 1894 | 313 | 81 | 20 |
| 1895 | 301 | 85 | 18 |
| 1896 | 234 | 106 | 36 |
| 1897 | 246 | 117 | 33 |
| 1898 | 229 | 87 | 31 |
| 1899 | 205 | 105 | 46 |
| 1900 | 217 | 93 | 85 |
| 1901 | 208 | 83 | 101 |
| 1902 | 239 | 109 | 90 |
| 1903 | 183 | 101 | 124 |
| 1904 | 216 | 140 | 99 |
| 1905 | 182 | 136 | 114 |
| 1906 | 157 | 123 | 125 |
| 1907 | 148 | 134 | 147 |
| 1908 | 206 | 151 | 171 |
| 1909 | 287 | 138 | 163 |
| 1910 | 257 | 140 | 154 |
| 1911 | 206 | 211 | 161 |
| 1912 | 343 | 247 | 222 |
| 1913 | 313 | 234 | 223 |
On the 31st March last the strength of the Police Force in New Zealand was 911 of all ranks, being an increase of 41 during the year. The total is made up as follows: 4 superintendents, 7 inspectors, 8 sub-inspectors, 21 senior sergeants, 79 sergeants, 748 constables, 4 chief detectives, 14 detective sergeants, 19 detectives, 7 acting-detectives. There were also 4 police surgeons, 4 matrons, 14 district constables, and 7 Native constables.
The following table shows the number of stations and of police in each Police District:—
| Police District. | No. of Stations. | No. of Police. |
|---|---|---|
| Auckland | 52 | 186 |
| Hamilton | 36 | 61 |
| Napier | 30 | 56 |
| Wanganui | 39 | 82 |
| Wellington | 40 | 177 |
| Greymouth | 24 | 42 |
| Christchurch | 45 | 147 |
| Dunedin | 39 | 109 |
| Invercargill | 21 | 40 |
| Unattached | .. | 11 |
The proportion of police to population is 1 to every 1,257 persons, and the expenditure (exclusive of the cost of buildings) on the whole Police Force for the year ended the 31st March, 1915, was 4s. 1d. per head of population.
The following table shows the growth of the Police Force since 1878, prior to which each province had its own Police Force, and reliable data are not available:—
| Year ended 31st March. | Officers. | Non-commissioned Officers. | Detectives. | Constables. | Total. | Police to Population (including Maoris). | Cost per Inhabitant. |
|---|---|---|---|---|---|---|---|
| 1878 | 25 | 90 | 14 | 329 | 458 | 1 to 944 | .. |
| 1885 | 20 | 65 | 17 | 372 | 474 | 1 to 1,293 | 3/0¾ |
| 1890 | 12 | 66 | 13 | 403 | 494 | 1 to 1,346 | 2/10¾ |
| 1895 | 7 | 51 | 13 | 416 | 487 | 1 to 1,495 | 2/6¾ |
| 1900 | 11 | 56 | 20 | 499 | 586 | 1 to 1,359 | 2/10¾ |
| 1905 | 12 | 65 | 25 | 553 | 655 | 1 to 1,375 | 2/10¼ |
| 1910 | 16 | 86 | 34 | 639 | 775 | 1 to 1,330 | 3/3½ |
| 1911 | 15 | 87 | 38 | 648 | 788 | 1 to 1,333 | 3/4½ |
| 1912 | 15 | 89 | 39 | 692 | 835 | 1 to 1,287 | 3/5 |
| 1913 | 17 | 93 | 41 | 695 | 846 | 1 to 1,303 | 3/8 |
| 1914 | 17 | 94 | 40 | 719 | 870 | 1 to 1,304 | 3/9 |
| 1915 | 19 | 100 | 37 | 755 | 911 | 1 to 1,257 | 4/1 |
The proportion of police to population is much lower in New Zealand than in any of the Australian States, and the cost of police per inhabitant is, as might be expected, also lower in New Zealand than in the Commonwealth. If, however, the proportion of police to population were the same in each of the Australian States as in New Zealand, the cost per inhabitant would be higher in the Dominion than in any of the States with the exception of Western Australia. Figures are given in the following table:—
| POLICE, NEW ZEALAND AND AUSTRALIA, 1914–15. | |||||
|---|---|---|---|---|---|
| State. | Number of Police. | Proportion of Police to Population. | Cost of Police per Inhabitant | Index Number.* | |
* Showing relative cost per inhabitant were proportions of police to population the same in each State. New Zealand =100.) | |||||
| s. | d. | ||||
| New Zealand | 911 | 1 to 1,257 | 4 | 1 | 100 |
| Queensland | 1,090 | 1 to 620 | 8 | 1 | 98 |
| New South Wales | 2,518 | 1 to 740 | 6 | 3¼ | 90 |
| Victoria | 1,735 | 1 to 824 | 5 | 1¾ | 83 |
| South Australia | 562 | 1 to 793 | 6 | 1½ | 95 |
| Western Australia | 495 | 1 to 652 | 8 | 6 | 104 |
| Tasmania | 235 | 1 to 857 | 4 | 8¼ | 78 |
The total number of charges brought before Magistrates in 1914, and number of convictions obtained, are shown in the following table:—
| Arrested or summoned. | Convicted. | |||
|---|---|---|---|---|
| How brought before Magistrate. | Total Offences, including Multiple Charges. | Distinct Arrests or Summonses, excluding Multiple Charges. | Total Summary Convictions, including Multiple Charges. | Distinct Summary Convictions, excluding Multiple Charges. |
| By Arrest | 21,487 | 17,845 | 19,523 | 16,685 |
| By Summons | 29,483 | 26,288 | 22,200 | 20,117 |
| Totals | 50,970 | 44,133 | 41,723 | 36,802 |
If the Maoris be excluded,' the number of charges in 1914 is found to have been 49,371, an increase of 2,524 upon the number for 1913; and the proportion per 1,000 of population 45.28 as against 43.84.
Persons charged with lunacy and committed to mental hospitals have been excluded from the calculations for this and previous years shown.
The figures, both numerical and proportional, covering a period of thirty years, are subjoined:—
| Charges before Magistrates. | ||
|---|---|---|
| Year. | Number. | Proportion per 1,000 of Mean Population. |
| 1885 | 22,297 | 38.89 |
| 1888 | 18,370 | 30.35 |
| 1891 | 16,714 | 26.54 |
| 1894 | 16,820 | 24.76 |
| 1897 | 19,390 | 26.87 |
| 1900 | 24,084 | 31.54 |
| 1901 | 25,825 | 33.20 |
| 1902 | 28,076 | 35.19 |
| 1903 | 30,753 | 37.50 |
| 1904 | 30,934 | 36.60 |
| 1905 | 30,741 | 35.33 |
| 1906 | 32,866 | 36.70 |
| 1907 | 36,852 | 40.09 |
| 1908 | 36,286 | 38.40 |
| 1909 | 36,902 | 37.97 |
| 1910 | 38,207 | 38.48 |
| 1911 | 38,095 | 37.54 |
| 1912 | 42,394 | 40.80 |
| 1913 | 46,847 | 43.84 |
| 1914 | 49,371 | 45.28 |
The summary convictions in 1914 numbered 41,723, including 1,313 Maoris. In addition 542 persons (32 of whom were Maoris) were committed for sentence, and 553 (22 of whom were Maoris) were committed for trial at the Supreme Courts, the commitments representing a net increase of 141 on the number for 1913.
Dealing with the summary convictions for all offences, the figures for 1905 and onward (excluding the Maoris) are,—
| Year. | Offences against the Person. | Offences against Property. | Other Offences. | Totals. | ||||
|---|---|---|---|---|---|---|---|---|
| Total Number. | Per 1,000 Mean Population. | Total Number. | Per 1,000 Mean Population | Total Number. | Per 1,000 Mean Population. | Number. | Per 1,000 Mean Population. | |
| 1905 | 648 | 0.74 | 1,901 | 2.18 | 22,445 | 25.80 | 24,994 | 28.72 |
| 1906 | 640 | 0.71 | 2,056 | 2.30 | 24,432 | 27.28 | 27,128 | 30.29 |
| 1907 | 752 | 0.82 | 2,179 | 2.38 | 27,525 | 29.94 | 30,456 | 33.14 |
| 1908 | 733 | 0.78 | 2,531 | 2.68 | 27,036 | 28.60 | 30,300 | 32.06 |
| 1909 | 772 | 0.79 | 2,228 | 2.30 | 27,697 | 28.50 | 30,697 | 31.59 |
| 1910 | 655 | 0.66 | 2,080 | 2.09 | 29,245 | 29.47 | 31,980 | 32.22 |
| 1911 | 654 | 0.64 | 2,146 | 2.11 | 29,239 | 28.81 | 32,039 | 31.56 |
| 1912 | 595 | 0.57 | 2,407 | 2.32 | 31,984 | 30.78 | 34,986 | 33.67 |
| 1913 | 646 | 0.60 | 2,852 | 2.67 | 35,250 | 32.99 | 38,748 | 36.26 |
| 1914 | 726 | 0.67 | 2,740 | 2.51 | 36,944 | 33.88 | 40,410 | 37.06 |
In dealing with the summary convictions in the Magistrates' Courts in the above table each offence is reckoned as a distinct person. The total number is from time to time swelled by the inclusion of breaches of statutes, the provisions of which give rise to fresh offences against the public welfare not strictly criminal, so that comparisons with past years are adversely affected. As a case in point may be mentioned the fact that the convictions in 1913 and 1914 include 4,819 and 4,154 respectively for broaches of the Defence Act, as against 1,924 in 1912, and only 12 in 1911. The numbers of prosecutions under this Act were 28 in 1911, 3,187 in 1912, 7,030 in 1913, and 6,440 in 1914.
The total of summary convictions for offences against the person (excluding Maoris) was 726 for the year 1914, which is 80 more than that for 1913 (646). Of the 726 summary convictions in 1914, the greater number (640) were on account of common and aggravated assaults, and there were 73 for attempt to commit suicide.
Of offences against property, theft (not otherwise described) is the most common, showing 1,985 summary convictions during 1914. There were besides 5 for specific kinds of theft, arid 59 for housebreaking. Obtaining money and goods under false pretences caused 150 summary convictions, and wilful damage to property 482. These are the principal items only.
Under the heading “Other Offences” (those relating to good order included), drunkenness comes first with 13,145 summary convictions, of which 1,012 were in respect of females. Prohibition orders numbered 2,302, including 164 made against women. The subject of drunkenness is specially dealt with under a separate heading.
Further offences against good order include 5,795 summary convictions simply defined as for “breach of by-laws,” 952 for obscene, threatening, or abusive language, 1,013 for indecent, riotous, or offensive conduct, and 270 for assaulting or resisting police. Under “Vagrancy,” there were 949 summary convictions, including 255 against women. The chief items only are referred to above.
Information in connection with charges brought before Magistrates is now obtained on cards, and it is possible to give particulars in regard to the ages and birthplaces of persons arrested. Ages and birthplaces in summons cases are not obtainable.
From the following table it will be seen that of the total convictions of persons arrested (19,055) the distinct arrests amounted to 16,303, the difference being accounted for by multiple charges against the same person. If distinct persons only are taken this total is further reduced to 11,143, representing 10.22 for every 1,000 of the mean population. Convictions of Maoris are not included.
| ARRESTS ONLY. | ||||
|---|---|---|---|---|
| Offences against | Total Convictions, including Multiple Charges. | Distinct Convictions, excluding Multiple Charges. | Distinct Persons convicted, most Serious Offence recorded. | Proportion of Distinct Persons convicted, per 1,000 of Mean Population. |
| The person | 379 | 340 | 333 | 0.31 |
| Property | 1,878 | 1,309 | 1,179 | 1.08 |
| Good order | 15,527 | 13,889 | 9,174 | 8.41 |
| Other offences | 1,271 | 765 | 457 | 0.42 |
| Total | 19,055 | 16,303 | 11,143 | 10.22 |
Of the 11,143 distinct persons arrested and convicted during 1914 no fewer than 9,174 were for offences against good order, and of these 7,916 were for drunkenness (including 34 habituals and 7 prohibition orders), 287 for indecent, riotous, or offensive conduct, 151 for using obscene, threatening, or abusive language, 665 for vagrancy, 54 for assaulting, resisting, or obstructing the police, 28 for soliciting prostitution, 53 for offences relating to gambling, and 20 for other offences against good order.
Of the 333 distinct persons arrested and convicted during 1914 of offences against the person 261 were for common assault; and of the 1,179 distinct-persons arrested and convicted of offences against property 894 were for theft, not otherwise described, and 183 for wilful damage.
The next three tables give the offences and ages, offences and birthplaces, and birthplaces and ages of the distinct persons (excluding Maoris) arrested and convicted during 1914.
| OFFENCES AND AGES (ARRESTS ONLY), 1914. | ||||||
|---|---|---|---|---|---|---|
| Offences against | Under 20. | 20 and under 25. | 25 and under 30. | 30 and under 40. | 40 and over.*. | Totals. |
* Including unspecified. | ||||||
| The person | 9 | 58 | 70 | 107 | 89 | 333 |
| Property | 182 | 185 | 188 | 331 | 293 | 1,179 |
| Good order | 69 | 599 | 1,135 | 2,817 | 4,554 | 9,174 |
| Other offences | 99 | 71 | 75 | 124 | 88 | 457 |
| Totals | 359 | 913 | 1,468 | 3,379 | 5,024 | 11,143 |
| OFFENCES AND BIRTHPLACES (ARRESTS ONLY), 1914. | |||||||
|---|---|---|---|---|---|---|---|
| Offences against | New Zealand. | England and Wales. | Scotland. | Ireland. | Australia. | Elsewhere. | Totals. |
| The person | 146 | 82 | 23 | 23 | 29 | 30 | 333 |
| Property | 643 | 214 | 76 | 80 | 98 | 68 | 1,179 |
| Good order | 3,373 | 2,211 | 1,112 | 1,282 | 565 | 631 | 9,174 |
| Other offences | 178 | 119 | 22 | 16 | 28 | 94 | 457 |
| Totals | 4,340 | 2,626 | 1,233 | 1,401 | 720 | 823 | 11,143 |
| BIRTHPLACES AND AGES (ARRESTS ONLY), 1914. | ||||||
|---|---|---|---|---|---|---|
| Birthplace. | Under 20. | 20 and under 25. | 25 and under 30. | 30 and under 40. | 40 and over.* | Totals. |
*Including unspecified. | ||||||
| New Zealand | 310 | 527 | 773 | 1,538 | 1,192 | 4,340 |
| England and Wales | 20 | 167 | 303 | 747 | 1,389 | 2,626 |
| Scotland | 3 | 53 | 121 | 338 | 718 | 1,233 |
| Ireland | 2 | 27 | 87 | 284 | 1,001 | 1,401 |
| Australia | 10 | 73 | 102 | 267 | 268 | 720 |
| Elsewhere | 14 | 66 | 82 | 205 | 456 | 823 |
| Totals | 359 | 913 | 1,468 | 3,379 | 5,024 | 11,143 |
The offences and ages of the distinct New-Zealand-born (excluding Maoris) arrested and convicted during 1914 are shown in the following table:—
| OFFENCES AND AGES.—NEW-ZEALAND-BORN (ARRESTSONLY), 1914. | ||||||
|---|---|---|---|---|---|---|
| Offences against | Under 20. | 20 and under 25. | 25 and under 30. | 30 and under 40. | 40 and over. | Totals. |
| The person | 7 | 28 | 36 | 52 | 23 | 146 |
| Property | 165 | 127 | 118 | 154 | 79 | 643 |
| Good order | 56 | 351 | 594 | 1,297 | 1,075 | 3,373 |
| Other offences | 82 | 21 | 25 | 35 | 15 | 178 |
| Totals | 310 | 527 | 773 | 1,538 | 1,192 | 4,340 |
The offences and sentences for convictions in arrest and summons cases (including multiple charges) are shown below.
| Offences against | Convicted and discharged or ordered to come up for Sentence | Fined. | Imprisoned. | Other. | Total Convictions. |
|---|---|---|---|---|---|
* Including 42 released under the First Offenders' Probation Act, 327 committed to industrial schools, 59 whipped, 59 bound over, and 4,403 against whom an order was made. | |||||
| The person | 132 | 412 | 133 | 49 | 726 |
| Property | 1,019 | 566 | 761 | 394 | 2,740 |
| Good order | 5,742 | 13,652 | 3,032 | 2,735 | 25,161 |
| Other offences | 1,678 | 7,368 | 1,025 | 1,712 | 11,783 |
| Totals | 8,571 | 21,998 | 4,951 | 4,890* | 40,410 |
Included in the figures of total charges and convictions for the year 1914 are a number dealing with offences committed by juvenile offenders—i.e., persons under the age of sixteen. A summary of these cases is given, showing for the various classes of offences the number of charges, dismissals, committals to Supreme Court, and summary convictions.
| JUVENILE OFFENDERS, 1914. | ||||
|---|---|---|---|---|
| Class of Offence. | Charges. | Dismissed or discharged. | Committed for Sentence or Trial. | Summary Convictions. |
| Against the person | 14 | 4 | 2 | 8 |
| Against property | 809 | 204 | 1 | 604 |
| Against good order | 202 | 80 | .. | 122 |
| Other | 359 | 43 | .. | 316 |
| Totals | 1,384 | 331 | 3 | 1,050 |
Another table is given showing the punishments meted out in cases where a summary conviction was recorded in 1914. Of the 1,050 convictions, in 318 cases the offender was discharged, and in 143 ordered to come up for sentence. Magistrates are adopting the latter course in an increasing number of cases, the intention being that it rests largely with the offender himself whether any further steps will be taken. In very few oases does the future conduct of the convicted person render it necessary for him to be brought before the Magistrate again for sentence. In other words, the recording of a conviction and the ordering of the prisoner to come up for sentence has usually the effect of deterring him from further crime, and is probably more efficacious than a definite punishment would be.
| CONVICTIONS OF JUVENILE OFFENDERS, 1914. | |||||||
|---|---|---|---|---|---|---|---|
| Class of Offence. | Total Summary Convictions. | Convicted and discharged. | Convicted and ordered to come up for Sentence. | Committed to an Industrial School. | Fined. | Whipping. | Older made. |
| Against the person | 8 | 3 | 2 | 1 | .. | 2 | .. |
| Against property | 604 | 241 | 133 | 97 | 18 | 56 | 59 |
| Against good order | 122 | 69 | 1 | 3 | 43 | .. | 6 |
| Other | 316 | 5 | 7 | 207 | 20 | .. | 77 |
| Totals | 1,050 | 318 | 143 | 308 | 81 | 58 | 142 |
The whole of the 72 persons (excluding Maoris) convicted in the superior Courts during the year 1914 for offences against the person were males. Assault, with or without robbery, caused 32 convictions, while robbery with violence was the offence in 3 cases. There were also 8 convictions for indecent assault on females, and 6 for rape and carnal knowledge of young girls (including attempt). For murder, attempted murder, and manslaughter 6 persons were convicted.
The convictions for offences against property were 87 more than those against the person, amounting to 159, of which 5 were of females. Theft of various forms, including robbery and burglary, was responsible for 110 of the 159 convictions.
Besides the above, there were 18 convictions for forgery and uttering, and 23 for obtaining goods on false pretences and for receiving stolen goods.
Outside of convictions for offences against person and property, 29 of a miscellaneous nature remain, making (exclusive of Maoris) a total of 260 convictions in the higher Courts, not counting 192 persons sent for sentence by Magistrates.
During the ten years 1905–14 the number of persons convicted and sentenced in the Supreme and District Courts, and of those who, on pleading guilty in the lower Courts, were committed to the Supreme Court for sentence, was as follows:—
| SUPERIOR COURTS—CONVICTIONS, ETC., 1905–14. | |||||
|---|---|---|---|---|---|
| Year. | Offences against the Person. | Offences against Property. | Other Offences. | Total Convictions. | Number committed for Sentence included in previous Columns. |
* Supreme Courts only, District Courts abolished. | |||||
| 1905 | 89 | 302 | 37 | 428 | 156 |
| 1906 | 104 | 270 | 33 | 407 | 167 |
| 1907 | 104 | 312 | 34 | 450 | 148 |
| 1908 | 121 | 338 | 42 | 501 | 232 |
| 1909 | 117 | 352 | 46 | 514 | 256 |
| 1910* | 89 | 355 | 34 | 478 | 243 |
| 1911* | 88 | 279 | 36 | 403 | 185 |
| 1912* | 105 | 269 | 21 | 395 | 185 |
| 1913* | 123 | 238 | 21 | 382 | 171 |
| 1914* | 90 | 315 | 47 | 452 | 192 |
Where a Magistrate, after the preliminary hearing of an information, proposes to commit any accused person for trial for an indictable offence not punishable by death, the accused may plead guilty and be then sent to the Supreme Court for sentence without further trial. The offences committed by the 192 persons who elected to be so dealt with during the year 1914 included 18 against the person, made up as follows: Assault, 4: abortion, 2; concealment of birth, 1; carnally knowing girl under sixteen, 2; rape, 1; indecent assault, 5; unnatural offence, 2; robbery with violence, 1. Of 156 charges for offences against property the most numerous were: For theft, 55; breaking and entering, with or without theft, 44; forgery and uttering, 38.
The distinct persons convicted in the Supreme Court in 1914 numbered 270, including 10 Maoris. To this number should be added the 213 persons (including 21 Maoris) sent from Magistrates' Courts for sentence, thus bringing the total to 483. Particulars of sentences for higher Courts, and of the punishments consequent on summary convictions in the lower Courts, are appended.
| SENTENCES OF CRIMINALS TRIEDAND CONVICTEDIN SUPREME COURTS, 1910–14. | |||||
|---|---|---|---|---|---|
| Sentences. | 1910. | 1911. | 1912. | 1913. | 1914. |
* Including 16 Maoris. † Including 24 Maoris. ‡ Including 33 Maoris. § Including 27 Maoris. || Including 21 Maoris. | |||||
| Death | .. | 2 | .. | 1 | 1 |
| Imprisonment with or without hard labour | 363 | 270 | 277 | 217 | 272 |
| Imprisoned for reformative treatment | .. | 56 | 40 | 55 | 71 |
| Pined | 10 | 11 | 21 | 7 | 21 |
| Released on probation | 83 | 59 | 52 | 76 | 62 |
| Held to bail, or awaiting pleasure of Court | 35 | 26 | 31 | 49 | 52 |
| Sent to industrial school | 3 | 3 | 7 | 4 | 4 |
| Totals | *494 | t†427 | ‡428 | §409 | ||483 |
The number of convictions for breaches of the licensing laws by publicans and for selling liquor without a license during the past five years was as follows (Maoris are not included):—
| Convictions for | ||
|---|---|---|
| Year. | Breaches of Licensing Laws by Publicans. | Selling Liquor without a License. |
| 1910 | 177 | 135 |
| 1911 | 130 | 162 |
| 1912 | 164 | 108 |
| 1913 | 174 | 78 |
| 1914 | 78 | 108 |
The charges against publicans include soiling liquor after hours or on Sundays, failing to admit the police promptly, allowing drunkenness on premises, supplying prohibited or intoxicated persons, failing to keep light burning in front of premises, &c.
The number of convictions (exclusive of Maoris, 335 of whom were convicted of drunkenness during the year—329 males and 6 females) for drunkenness and drunkenness with disorderly conduct recorded during 1914 was 12,133 against males and 1,012 against females. The following table shows the number of convictions for drunkenness recorded, and the proportion per 1,000 of the mean population of each sex, excluding Maoris, during the past ton years:—
| CONVICTIONS FOR DRUNKENNESS (EXCLUSIVE OF MAORIS), 1905–14. | ||||||
|---|---|---|---|---|---|---|
| Year. | Convictions recorded against. | Per 1,000 of Mean Population. | ||||
| Males. | Females. | Total. | Males. | Females. | Total. | |
| 1905 | 7,875 | 850 | 8,725 | 17.09 | 2.08 | 10.03 |
| 1906 | 8,561 | 859 | 9,420 | 18.04 | 2.04 | 10.52 |
| 1907 | 9,374 | 812 | 10,186 | 19.24 | 1.88 | 11.08 |
| 1903 | 9,892 | 717 | 10,609 | 19.73 | 1.62 | 11.23 |
| 1909 | 9,942 | 755 | 10,697 | 19.29 | 1.68 | 11.01 |
| 1910 | 10,808 | 805 | 11,613 | 20.58 | 1.72 | 11.70 |
| 1911 | 10,559 | 841 | 11,400 | 19.74 | 1.75 | 11.23 |
| 1912 | 10,688 | 843 | 11,531 | 19.56 | 1.71 | 11.10 |
| 1913 | 10,815 | 783 | 11,598 | 19.27 | 1.54 | 10.85 |
| 1914 | 12,133 | 1,012 | 13,145 | 21.34 | 1.94 | 12.06 |
If the Maoris are included, the total convictions for drunkenness during 1914 will amount to 13,480 (12,462 males and 1,018 females). Of these, 12,899 (11,898 males and 1,001 females) were arrested, while 581 (564 males and 17 females) were brought before the Magistrate by summons. The following table shows the birthplaces and ages of all persons (including Maoris) arrested and convicted for drunkenness during the year. Birthplaces and ages in summons cases are not obtainable.
| BIRTHPLACES AND AGES OF PERSONS CONVICTEDFOR DRUNKENNESS (ARRESTS ONLY), 1914. | |||||||
|---|---|---|---|---|---|---|---|
| Birth place. | Under 120. | 20 and under 25. | 25 and under 30. | 30 and under 40. | 40 and under 60. | 60 and over, and unspecified. | Totals. |
| New Zealand– | |||||||
| Maoris | 2 | 46 | 42 | 56 | 91 | 19 | 256 |
| Others | 31 | 351 | 688 | 1,796 | 1,343 | 106 | 4,320 |
| Australia | .. | 40 | 85 | 278 | 335 | 29 | 767 |
| England and Wales | 8 | 122 | 270 | 823 | 1,299 | 482 | 3,004 |
| Scotland | 1 | 40 | 123 | 484 | 763 | 289 | 1,700 |
| Ireland | 2 | 26 | 96 | 376 | 1,067 | 445 | 2,012 |
| Other European | .. | 34 | 49 | 158 | 280 | 82 | 603 |
| Asia | .. | .. | 2 | 6 | 18 | 2 | 28 |
| Africa | .. | .. | .. | 2 | 15 | .. | 17 |
| America | .. | 3 | 15 | 32 | 82 | 22 | 154 |
| Other (including unspecified) | .. | 1 | 2 | 5 | 17 | 13 | 38 |
| Totals | 44 | 663 | 1,372 | 4,016 | 5,315 | 1,489 | 12,899 |
Among the New-Zealand-born population of European descent there is evidence of less drunkenness than among persons who have come from abroad. At the census of 1911, out of the total population of New Zealand of 20 years of age or over, 53.96 per cent. were found to have been born in the Dominion; while the proportion of the convictions for drunkenness of New-Zealand-born Europeans to the total convictions of persons over 20 years of age (excluding Maoris) in the year 1914 was only 34.04 per cent.
Excluding persons under 20 years of age and taking each age-group to be in the same proportions as found at the census, the rates per 1,000 of New-Zealand-born and others arrested and convicted of drunkenness appear to be as follows:—
| CONVICTIONS FOR DRUNKENNESS DURING 1914 OF NEW-ZEALAND-BORN (EXCLUDING MAORIS) AND OTHERS—ARRESTS ONLY. | ||||||
|---|---|---|---|---|---|---|
| — | 20 and under 25. | 25 and under 30. | 30 and under 40. | 40 and under 60. | 60 and over and unspecified. | Total (over age 20). |
| New Zealand-born– | ||||||
| Estimated mean population | 84,918 | 81,649 | 115,342 | 65,061 | 4,703 | 351,673 |
| Number of convictions | 351 | 688 | 1,796 | 1,348 | 106 | 4,289 |
| Proportion per 1,000 | 4.13 | 8.43 | 15.57 | 20.72 | 22.54 | 12.20 |
| Born elsewhere— | ||||||
| Estimated mean population | 18,676 | 28,862 | 63,072 | 118,225 | 73,148 | 301,983 |
| Number of convictions | 266 | 642 | 2,164 | 3,876 | 1,364 | 8,312 |
| Proportion per 1,000 | 14.24 | 22.24 | 34.31 | 32.78 | 18.65 | 27.52 |
Repeated charges against the same person are included in the totals shown above, and dealing with arrests only (males. 11,646; females, 997: total, 12,643), but excluding Maoris, it is found that the number of distinct persons convicted of this offence was 7,909 (7,502 males and 407 females), or 62.56 per cent. of the total “arrest” convictions (excluding Maoris) for drunkenness.
The total convictions (exclusive of those of Maoris) for all offences (arrests only) in 1914 were 19,055, but the distinct convictions amounted to only 16,303, the former total including 2,752 convictions for multiple charges against the same person. Of the latter 1,574 were in conjunction with arrests for drunkenness. Details of the offences are given in the following table:—
| OFFENCES FORWHICH CONVICTIONS WEREENTERED AGAINST PERSONS ARRESTED (AND CONVICTED) AT THESAME TIME FOR DRUNKENNESS. | |||||
|---|---|---|---|---|---|
| Convicted of Drunkenness and | Number of Maoris. | Number, excluding Maoris. | Total. | ||
| M. | F. | M. | F. | ||
| I. Offences against the person– | |||||
| Assault (common) | .. | .. | 62 | 1 | 63 |
| Assault (aggravated) | .. | .. | 1 | .. | 1 |
| Attempt to commit suicide | .. | .. | 3 | .. | 3 |
| II. Offences against property — | |||||
| Theft and attempt at | 1 | .. | 41 | 3 | 45 |
| Fraud and false pretences | .. | .. | 1 | 4 | 5 |
| Wilful damage | 7 | 2 | 16 | 24 | 159 |
| III. Offences against good order— | |||||
| Assaulting, resisting, or obstructing police | 5 | .. | 142 | 2 | 149 |
| Indecent, riotous, or offensive conduct | 2 | .. | 150 | 1 | 153 |
| Obscene, threatening, or abusive language | 5 | .. | 276 | 37 | 318 |
| Vagrancy | .. | .. | 72 | 33 | 105 |
| Breaches of by-laws | 1 | .. | 19 | .. | 20 |
| Other offences against good order | .. | .. | 12 | 9 | 21 |
| IV. Offences not included above— | |||||
| Breach of Licensing Act | 7 | 2 | 412 | 122 | 543 |
| Other offences | .. | .. | 18 | 3 | 21 |
| Total convictions for other offences against persons arrested (and convicted) at the same time for drunkenness | 28 | 4 | 1,335 | 239 | 1,606 |
| Number of Prohibition Orders against persons convicted at the same time of drunkenness | 15 | .. | 141 | 22 | 178 |
| Total | 43 | 4 | 1,476 | 261 | 1,784 |
| Number of convictions for drunkenness of persons arrested | 252 | 4 | 11,646 | 997 | 12,899 |
| Total convictions entered against persona arrested for drunkenness | 295 | 8 | 13,122 | 1,258 | 14,683 |
| Number of distinct persons arrested (and convicted) for drunkenness | 221 | 3 | 7,502 | 407 | 8,133 |
| Number of convictions for drunkenness in summons cases (not included above) | 77 | 2 | 487 | 15 | 581 |
Any person who has been three times convicted for drunkenness within the nine months immediately preceding any conviction for drunkenness may be declared an habitual drunkard. A Magistrate may, in addition to or in lieu of a penalty, commit an habitual drunkard to any institution authorized by the Governor to receive and detain such persons for any period not being less than twelve months. The law makes provision in respect of the discharge of inmates, their good conduct, discipline, and punishment for offences during detention, and for the proper inspection of such institutions.
A calculation of the amount of alcoholic liquor consumed per head of mean population during the past five years is given below.
| CONSUMPTION OF BEER, WINE, AND SPIRITS PER HEAD OF MEAN POPULATION. | ||||||
|---|---|---|---|---|---|---|
| Beer. | Wine. | Spirits. | Beer. | Wine. | Spirits | |
| Including Maoris. | Excluding Maoris. | |||||
| Gal. | Gal. | Gal. | Gal. | Gal. | Gal. | |
| 1910 | 9.294 | 0.147 | 0.737 | 9.741 | 0.154 | 0.773 |
| 1911 | 9.205 | 0.134 | 0.745 | 9.657 | 0.141 | 0.781 |
| 1912 | 9.261 | 0.141 | 0.793 | 9.705 | 0.148 | 0.831 |
| 1913 | 9.209 | 0.132 | 0.777 | 9.639 | 0.138 | 0.813 |
| 1914 | 9.340 | 0.137 | 0.778 | 9.767 | 0.144 | 0.814 |
The quantity of each kind of alcoholic liquor used in the Dominion during the same period was as follows:—
| Beer for Consumption. | Wine for Consumption. | Spirits for Consumption. | |
|---|---|---|---|
| Gals. | Gals. | Gals. | |
| 1910 | 9,671,030 | 153,430 | 767,620 |
| 1911 | 9,800,610 | 143,138 | 792,794 |
| 1912 | 10,083,482 | 153,611 | 863,797 |
| 1913 | 10,300,416 | 147,137 | 869,124 |
| 1914 | 10,649,090 | 156,513 | 887,116 |
The annual consumption per head of population for the years 1908–12 is given in the following table for New Zealand (excluding Maoris) and certain other countries. The figures for the other countries are from returns prepared by the British Board of Trade.
| TABLE SHOWING CONSUMPTION OF BEER, WINE, AND SPIRITS INCERTAIN COUNTRIES, 1908–12. (GALLONS PER HEAD OF POPULATION.) | |||||
|---|---|---|---|---|---|
| Country. | 1908. | 1909. | 1910. | 1911. | 1912. |
| Beer. | |||||
| New Zealand | 10.2 | 9.7 | 9.7 | 9.7 | 9.7 |
| Australia | 11.3 | 11.1 | 11.8 | 12.4 | 13.2 |
| United Kingdom | 26.9 | 26.2 | 26.4 | 27.3 | 26.8 |
| Canada | 5.9 | 5.9 | 6.2 | 6.8 | 7.3 |
| United States | 16.9 | 15.9 | 16.5 | 17.2 | 16.6 |
| Germany | 23.1 | 21.7 | 21.7 | 23.4 | 22.3 |
| France | 8.1 | 7.9 | 8.6 | 9.9 | 8.8 |
| Wine. | |||||
| New Zealand | 0.16 | 0.14 | 0.15 | 0.14 | 0.15 |
| Australia | 0.92 | 1.09 | 0.84 | 1.09 | 0.93 |
| United Kingdom | 0.26 | 0.26 | 0.28 | 0.25 | 0.25 |
| Canada | 0.09 | 0.11 | 0.12 | 0.12 | 0.14 |
| United States | 0.48 | 0.56 | 0.54 | 0.56 | 0.48 |
| Germany | 1.41 | 0.97 | 0.68 | 1.39 | 1.03 |
| France | 36.50 | 32.80 | 19.10 | 29.30 | 37.00 |
| Spirits. | |||||
| New Zealand | 0.80 | 0.74 | 0.77 | 0.78 | 0.83 |
| Australia | 0.71 | 0.79 | 0.80 | 0.85 | 0.86 |
| United Kingdom | 0.86 | 0.70. | 0.65 | 0.68 | 0.67 |
| Canada | 0.88 | 0.91 | 0.98 | 1.06 | 1.15 |
| United States | 1.01 | 0.96 | 1.04 | 1.07 | 1.05 |
| Germany | 1.47 | 1.61 | 1.08 | 1.17 | 1.12 |
| France | 1.33 | 1.33 | 1.38 | 1.56 | 1.49 |
The number of convictions of Maoris brought before Magistrates' Courts for the past ten years is shown in the following table:—
| SUMMARY CONVICTIONS OF MAORIS (MAGISTRATES' COURTS), 1905–14. | ||||||
|---|---|---|---|---|---|---|
| Offences. | ||||||
| Year. | Against the Person. | Against Property. | Against Good Order. | Other Offences. | Total. | Convictions for Drunkenness, included previously. |
| 1905 | 22 | 46 | 248 | 61 | 377 | 134 |
| 1906 | 26 | 58 | 358 | 100 | 542 | 181 |
| 1907 | 21 | 80 | 271 | 73 | 445 | 167 |
| 1908 | 28 | 102 | 347 | 75 | 552 | 200 |
| 1909 | 34 | 81 | 258 | 81 | 454 | 140 |
| 1910 | 28 | 67 | 303 | 57 | 455 | 167 |
| 1911 | 42 | 123 | 636 | 189 | 990 | 322 |
| 1912 | 44 | 126 | 671 | 364 | 1,205 | 320 |
| 1913 | 45 | 23 | 626 | 243 | 937 | 294 |
| 1914 | 51 | 191 | 665 | 406 | 1,313 | 335 |
These numbers apply only to the Maoris residing in the main Islands of the Dominion. Prior to 1911 statistics of crime were compiled from returns of criminal business brought before Magistrates furnished by Clerks of Courts, on which the numbers of offences by Maoris included in the return were to be marked, but since 1911 a card for each offence has been obtained. The figures for the past four years can be relied on as correct, and from the number of convictions in those years it would appear that the figures for previous years are understated. Clerks of Courts would probably have omitted to mark on the returns the Maori cases in some instances. There has also been an increase in the police stationed in Maori districts.
The number of convictions in the higher Courts exhibits the extent of serious crime amongst the Native race. Persons who pleaded guilty in the lower Court and were remanded to the Supreme Court for sentence have been included.
| Maoris convicted or sentenced in Supreme Court for | ||||
|---|---|---|---|---|
| Year. | Offences against the Person. | Offences against Property. | Miscellaneous Offences. | Total. |
| 1910 | 4 | 10 | 2 | 16 |
| 1911 | 2 | 21 | 1 | 24 |
| 1912 | 5 | 28 | .. | 33 |
| 1913 | 5 | 19 | 3 | 27 |
| 1914 | 4 | 24 | 3 | 31 |
Twenty-one of the number for 1914 had been sent up from the Magistrates' Court for sentence.
The following table gives for the year 1914 the prison accommodation, the number of prisoners received, the number in prison at end of year, and the daily average in confinement:—
| Name of Prison. | Number for whom there is Accommodation. | Number received daring Year. | Number in Confinement at End of Year. | Daily average in Confinement. |
|---|---|---|---|---|
| Auckland | 359 | 1,697 | 292 | 287.16 |
| Waipa Valley | 33 | 27 | 26 | 26.30 |
| Kaingaroa | 52 | 49 | 35 | 33.65 |
| Waikeria | 60 | 46 | 54 | 49.14 |
| New Plymouth | 59 | 108 | 44 | 45.11 |
| Roto-aira | 26 | 32 | 26 | 18.00 |
| Napier | 74 | 223 | 18 | 23.49 |
| Wellington | 273 | 1,754 | 219 | 190.76 |
| Addington | 45 | 141 | 32 | 21.68 |
| Lyttelton | 178 | 741 | 149 | 137.39 |
| Dunedin | 42 | 415 | 25 | 21.61 |
| Invercargill | 96 | 139 | 92 | 97.31 |
| Minor prisons | 167 | 1,000 | 33 | 28.21 |
| Totals | 1,464 | 6,372 | 1,045 | 979.81 |
The total number of prisoners received in the different gaols during the year 1914 was 6,372 (males 5,645, females 727), as compared with 6,101 (males 5,552, females 549) in 1913, counting each admission as a distinct person.
Omitting those received by transfer from another prison, 446 (males 427, females 19), the debtors and lunatics received, 135 (males), and the duplicate receptions of the same prisoner on the same charge, 138 (males 135, females 3), it is found that the total receptions for criminal offences during 1914 were 5,738 (males 5,028, females 710). In this total are included 85 (males 80, females 5) persons on remand or awaiting sentence from the previous year. The following table shows how the prisoners received were disposed of, classified according to ages; the number of distinct convicted prisoners being 3,488, including 102 Maoris:—
| Number of Prisoners convicted and sentenced for Criminal Offences. | Number of Distinct Convicted Prisoners received during the Year 1914. | |||||||
|---|---|---|---|---|---|---|---|---|
| Age, in Years. | Total Receptions (excluding Duplicates) for Criminal Offences. | Handled to Police for Trial elsewhere, and not returned to Prison. | Acquitted or discharged. | On Remand and awaiting Trial or Sentence at End of Year. | Summary. | Indictments. | Excluding Maoris. | Maoris. |
* Includes 85 on remand or awaiting trial from previous year. | ||||||||
| Under 21 | 11 | 43 | 4 | 122 | 59 | 144 | 30 | |
| 21 and under 25 | 430 | 12 | 90 | 5 | 249 | 74 | 264 | 20 |
| 25 “ 30 | 828 | 32 | 121 | 15 | 570 | 90 | 500 | 19 |
| 30 “ 35 | 921 | 17 | 97 | 12 | 724 | 71 | 552 | 17 |
| 35 “ 40 | 889 | 40 | 77 | 9 | 719 | 44 | 550 | 5 |
| 40 “ 45 | 731 | 5 | 61 | 8 | 627 | 30 | 407 | 7 |
| 45 “ 50 | 520 | 0 | 58 | 4 | 433 | 15 | 297 | .. |
| 50 “ 55 | 391 | 4 | 47 | 3 | 324 | 13 | 242 | 3 |
| 55 “ 60 | 317 | 2 | 27 | .. | 279 | 9 | 181 | 1 |
| 60 “ 65 | 251 | 3 | 27 | 3 | 211 | 7 | 134 | .. |
| 65 and over | 221 | 40 | 1 | 177 | 2 | 115 | .. | |
| Totals | 5,738* | 137 | 688 | 64 | 4,435 | 414 | 3,386 | 102 |
The number of persons in gaol (including Maoris) at the end of each of the past ten years, and the proportion per 10,000 of population as at the 31st December, is given in the next table:—
| PRISONERS IN GAOL (31ST DECEMBER.) | |||||
|---|---|---|---|---|---|
| Number of Prisoners | Proportion per 10,000 of Population. | ||||
| Year. | Undergoing Sentence. | On Remand and awaiting Trial. | Total. | Undergoing Sentence. | Total in Confinement. |
| 1905 | 760 | 50 | 810 | 8.21 | 8.75 |
| 1906 | 833 | 58 | 891 | 8.71 | 9.32 |
| 1907 | 791 | 56 | 847 | 8.09 | 8.67 |
| 1908 | 815 | 64 | 879 | 8.08 | 8.72 |
| 1909 | 877 | 72 | 949 | 8.51 | 9.21 |
| 1910 | 843 | 38 | 881 | 8.01 | 8.38 |
| 1911 | 802 | 71 | 873 | 7.46 | 8.12 |
| 1912 | 821 | 45 | 866 | 7.45 | 7.86 |
| 1913 | 834 | 85 | 919 | 7.35 | 8.10 |
| 1914 | 981 | 64 | 1,045 | 8.56 | 9.12 |
Besides the returns from the Prisons Department, a separate card for each admission is furnished for every gaol. Such cards as show convictions are arranged alphabetically according to name of prisoner, and where several are found referring to the same person, all but one are thrown out; then the number of cards retained equals the actual number of distinct convicted prisoners received in the various gaols during the year. In 1914 this number (excluding Maoris) was 3,386, an increase of 157 on the number in 1913. These figures do not include children committed to the industrial schools simply on the ground that they are neglected or destitute.
In classifying the offences a prisoner convicted of more than one offence during the year is reckoned once only, under the heading of the principal offence—e.g., a prisoner convicted three times of drunkenness, twice of vagrancy, and once of theft is counted only once, under the heading “Offences against Property.” Debtors and lunatics received into gaol are omitted. The figures under the heading “Drunkenness” do not represent the full number of persons punishable for that offence, the punishment usually being by fine.
The following tables show the number of distinct persons (exclusive of Maoris) received into prison after conviction during 1914, classified according to birthplaces and offences, ages and offences, and ages and previous convictions:—
| BIRTHPLACES AND OFFENCES OF DISTINCT CONVICTED PRISONERS (EXCLUDING MAORIS) RECEIVED INTO GAOL DURING 1914. | |||||
|---|---|---|---|---|---|
| Nature of Offence. | |||||
| Birthplace. | Against the Person. | Against Property. | Drunkenness. | Other Offences. | Totals. |
| New Zealand | 64 | 411 | 282 | 523 | 1,280 |
| Australian States | 16 | 54 | 76 | 109 | 255 |
| England and Wales | 43 | 153 | 292 | 370 | 358 |
| Scotland | 8 | 41 | 142 | 142 | 333 |
| Ireland | 14 | 50 | 142 | 148 | 354 |
| Other British possessions | 1 | 12 | 7 | 15 | 35 |
| China | 1 | .. | .. | 20 | 21 |
| Other countries | 22 | 33 | 82 | 113 | 250 |
| Totals | 169 | 754 | 1,023 | 1,440 | 3,386 |
| AGES AND OFFENCES OF DISTINCT CONVICTED PRISONERS (EXCLUDING MAORIS RECEIVEDINTO PRISONDURING 1914. | ||||||||
|---|---|---|---|---|---|---|---|---|
| Age, in Years. | Offences against the Person. | Theft and other Offences against Property. | Offences not included previously. | Totals | ||||
| Sexual Offences. | Assaults. | Other. | Vagrancy. | Drunkenness. | Other. | |||
| Under 21 | 2 | 7 | 1 | 84 | 7 | 2 | 41 | 144 |
| 21 and under 25 | 6 | 21 | .. | 98 | 14 | 34 | 91 | 264 |
| 25 “ 30 | 4 | 33 | 2 | 150 | 42 | 104 | 165 | 500 |
| 30 “ 35 | 3 | 27 | .. | 136 | 62 | 150 | 174 | 552 |
| 35 “ 40 | 1 | 19 | 2 | 105 | 79 | 187 | 157 | 550 |
| 40 “ 45 | 3 | 7 | .. | 69 | 63 | 141 | 124 | 407 |
| 45 “ 50 | .. | 4 | 1 | 47 | 54 | 114 | 77 | 297 |
| 50 “ 55 | .. | 12 | 1 | 23 | 25 | 109 | 72 | 242 |
| 55 “ 60 | .. | 6 | 1 | 18 | 23 | 81 | 52 | 181 |
| 60 “ 65 | .. | 2 | 2 | 14 | 29 | 50 | 37 | 134 |
| 65 and over | 1 | .. | 1 | 10 | 27 | 51 | 25 | 115 |
| Totals | 20 | 138 | 11 | 754 | 425 | 1,023 | 1,015 | 3,386 |
| AGES AND PREVIOUS CONVICTIONS OF DISTINCT CONVICTED PRISONERS (EXCLUDING MAORIS) RECEIVED INTO PRISON DURING 1914. | ||||||||
|---|---|---|---|---|---|---|---|---|
| Age, in Years. | Not previously convicted. | Previous Convictions. | Total District Convicted Prisoners. | |||||
| Once. | Twice. | Three Times. | Four Times. | Over Four Times. | Total. | |||
| Under 21 | 104 | 24 | 8 | 2 | 2 | 4 | 40 | 144 |
| 21 and under 25 | 170 | 35 | 14 | 13 | 9 | 23 | 94 | 264 |
| 25 “ 30 | 281 | 73 | 28 | 26 | 20 | 72 | 219 | 500 |
| 30 “ 35 | 251 | 74 | 32 | 27 | 13 | 155 | 301 | 552 |
| 35 “ 40 | 230 | 68 | 39 | 27 | 24 | 162 | 320 | 550 |
| 40 “ 45 | 165 | 45 | 31 | 23 | 13 | 130 | 242 | 407 |
| 45 “ 50 | 95 | 46 | 15 | 6 | 20 | 115 | 202 | 297 |
| 50 “ 55 | 90 | 34 | 10 | 11 | 6 | 91 | 152 | 242 |
| 55 “ 60 | 54 | 23 | 9 | 10 | 7 | 78 | 127 | 181 |
| 60 “ 65 | 41 | 16 | 5 | 5 | 4 | 63 | 93 | 134 |
| 65 and over | 34 | 18 | 9 | 3 | 5 | 46 | 81 | 115 |
| Totals | 1,515 | 456 | 200 | 153 | 123 | 939 | 1,871 | 3,386 |
The next table gives the offences and gravest previous offences of the distinct persons received into prison after conviction during 1914:—
| OFFENCES AND GRAVEST PREVIOUS OFFENCES OF DISTINCT CONVICTED PRISONERS, 1914. | |||||||||
|---|---|---|---|---|---|---|---|---|---|
| Offences. | Gravest Previous Offences | ||||||||
| Against the Person. | Theft and other Offences against Property. | Offences not included previously. | Total. | ||||||
| Sexual Offences. | Assaults. | Other. | Vagrancy. | Drunkenness. | Other. | ||||
| Against the person— | |||||||||
| Sexual offences | 1 | 1 | .. | 1 | 1 | .. | 1 | 5 | |
| Assaults | 1 | 19 | .. | 14 | 2 | 6 | 17 | 59 | |
| Other | .. | .. | .. | 1 | .. | .. | 2 | 3 | |
| Against property | .. | 13 | 8 | 334 | 20 | 26 | 49 | 450 | |
| Offences not included above— | |||||||||
| Vagrancy | 2 | 7 | 2 | 119 | 146 | 47 | 32 | 355 | |
| Drunkenness | 5 | 9 | 2 | 80 | 39 | 302 | 97 | 534 | |
| Other | 2 | 23 | .. | 106 | 41 | 112 | 181 | 465 | |
| Totals | 11 | 72 | 12 | 655 | 249 | 493 | 379 | 1,871 | |
The number of distinct persons (exclusive of Maoris) imprisoned after conviction in each of the past twenty years, counting one offence only when the same person was imprisoned more than once, with the proportion per 10,000 persons living, is added.
| DISTINCT PERSONS IMPRISONEDAFTER CONVICTION. | ||
|---|---|---|
| Year. | Prisoners. | Proportion per 10,000 of Mean Population. |
| 1895 | 1,930 | 27.87 |
| 1896 | 1,936 | 27.11 |
| 1897 | 1,884 | 25.84 |
| 1898 | 1,982 | 26.92 |
| 1899 | 2,125 | 28.33 |
| 1900 | 2,116 | 27.71 |
| 1901 | 2,345 | 30.14 |
| 1902 | 2,396 | 30.03 |
| 1903 | 2,842 | 34.65 |
| 1904 | 2,896 | 34.27 |
| 1905 | 2,796 | 32.14 |
| 1906 | 2,966 | 33.12 |
| 1907 | 3,091 | 33.63 |
| 1908 | 3,009 | 31.84 |
| 1909 | 3,159 | 32.51 |
| 1910 | 3,242 | 32.66 |
| 1911 | 2,877 | 28.35 |
| 1912 | 3,023 | 29.09 |
| 1913 | 3,229 | 30.22 |
| 1914 | 3,386 | 31.05 |
It must be understood that the actual number of imprisonments was much in excess of the figures given, as many persons were several times imprisoned, either for offences differing in kind or for repetitions of the same offence. Thus, persons returned as imprisoned for larceny underwent other imprisonments for drunkenness, &c. Some returned as convicted of drunkenness were several times in gaol during the year for the same offence, or for another, such as assault, riotous or indecent conduct, &c. Often there were several charges preferred against the same person at the one time, of which the most serious followed by conviction has been selected.
While the New-Zealand-born formed at the last census 70 per cent. of the whole population (excluding Maoris), they contributed in 1914 only 37.80 per cent. of the prisoners received in gaol. Of the New-Zealand-born population, however, a large number are under fifteen years of age, a period of life at which there are very few prisoners; and therefore another comparison is necessary. It is found that the New-Zealand-born over fifteen years formed 47 per cent. of the total population above that age; but, as before stated, New-Zealanders constituted only 37.8 per cent. of the total number received in gaols.
The number of New-Zealand-born distinct prisoners (excluding Maoris) received for the year 1914:—1,280 persons—is 126 more than the number for 1913. Of the number received in 1914, 81 were under twenty years of age. As before stated, the plan adopted in preparing the foregoing tables is to count each prisoner once only, and to exclude all who are not convicted prisoners, besides dealing only with the number received during the year, instead of with the full number in gaol, which would, of course, include those brought forward from the previous year. The comparative results for a series of years given by this method are held to be more valuable than those brought out by one which includes prisoners merely awaiting trial, and continual repetitions of the same individuals.
The ages of New-Zealand-born distinct convicted prisoners (excluding Maoris) are given in the following table for the past ten years:—
| DISTINCT NEW-ZEALAND-BORN CONVICTED PRISONERS RECEIVEDINTO PRISON, 1905–14. | |||||||
|---|---|---|---|---|---|---|---|
| Year. | Under 15. | 15 and under 20. | 20 and under 25. | 25 and under 30. | 30 and under 40. | 40 and over. | Totals. |
| 1905 | 1 | 84 | 197 | 223 | 233 | 116 | 854 |
| 1906 | 2 | 91 | 209 | 245 | 288 | 138 | 973 |
| 1907 | 3 | 84 | 204 | 246 | 300 | 132 | 969 |
| 1908 | 6 | 75 | 207 | 227 | 330 | 140 | 985 |
| 1909 | 2 | 70 | 189 | 264 | 351 | 220 | 1,096 |
| 1910 | 2 | 78 | 208 | 284 | 382 | 210 | 1,164 |
| 1911 | 4 | 62 | 171 | 206 | 377 | 203 | 1,023 |
| 1912 | 2 | 96 | 204 | 222 | 402 | 208 | 1,134 |
| 1913 | 2 | 88 | 182 | 203 | 449 | 230 | 1,154 |
| 1914 | 2 | 79 | 163 | 247 | 474 | 315 | 1,280 |
Eighty-seven persons were placed on probation in the year 1914, as against 136 in 1913. Of these 24 were discharged after satisfactorily carrying out the conditions of their licenses, 13 were rearrested, 4 absconded, and 46 remained under the supervision of Probation Officers.
The following table gives the ages and terms of probation of offenders placed under the Act during the year 1914:—
| Term of Probation. | |||||
|---|---|---|---|---|---|
| Age. | Under One Year. | One Year and under Two Years. | Two Years and under Three Years. | Three Years and over. | Totals. |
| 15 and under 20 | 4 | 9 | 6 | 5 | 24 |
| 20 “ 25 | 1 | 12 | 5 | 4 | 22 |
| 25 “ 30 | 5 | 12 | 4 | 3 | 24 |
| 30 “ 40 | 5 | 5 | 1 | .. | 11 |
| 40 “ 50 | .. | 2 | 2 | .. | 4 |
| 50 “ 60 | .. | 1 | .. | .. | 1 |
| 60 and over | .. | .. | 1 | .. | 1 |
| Totals | 15 | 41 | 19 | 12 | 87 |
The amount ordered by the various Courts to be paid towards the cost of prosecution during the year 1914 was £447 8s. 11d., of which £363 0s. 2d. was actually paid.
In 1906 provision was made by law for the detention and control of habitual criminals and offenders. Habitual criminals comprise those persons previously convicted on indictment' of the following offences: (Class I) sexual offences, abortion: (Class II) wounding, robbery, burglary and housebreaking, theft, false pretences, extortion, forgery, and mischief. On two previous convictions for any offence in Class I, or four previous convictions in Classes I and II, the Court may order as part of the sentence that the person is an habitual criminal, whether such previous convictions took place within or out of New Zealand, and whether before or after the coming into operation of the Act. Habitual offenders comprise all persons previously convicted on at least six occasions as idle and disorderly persons, rogues and vagabonds, or incorrigible rogues, and persons previously convicted as above under Classes I and II and convicted summarily of any offence punishable by not less than three months' imprisonment, provided such person's have been previously summarily convicted at least six times of any offence punishable by not less than three months' imprisonment.
By the Crimes Amendment Act, 1910, which came into force in 1911, every person who before the coming into force of that Act had been declared, in pursuance of the Crimes Act. 1908, or the Habitual Criminals and Offenders Act. 1906, to be an habitual criminal or habitual offender remained subject to the provisions of section 32 of the Crimes Act of 1908 in the same manner as if that section had not been repealed, save that after the commencement of the amending Act of 1910 no habitual criminal or habitual offender can be discharged under the provisions of that section, and save also that every prison is deemed to be a reformatory prison within the meaning and purposes of that section.
A Judge before whom any person is convicted or committed for sentence may, if he thinks fit, “having regard to the conduct, character, associations, or mental condition of such person, the nature of the offence, or any special circumstances of the case,” in addition to or in lieu of an ordinary term of imprisonment, sentence him to prison for reformatory purposes for a period not exceeding ten years. In like manner and after a like weighing of the circumstances a Magistrate may impose a similar sentence, upon any person brought before him and summarily convicted of an offence punishable by imprisonment for more than three months, save that the maximum of reformative detention in that case is limited to three years.
The jurisdiction conferred upon a Magistrate is not exercised by any Justice of the Peace other than a Magistrate.
Every person sentenced by a Magistrate to a term of reformative detention may, within fourteen days, apply to a fudge of the Supreme Court to review that sentence on the ground that the same is excessive or ought not to have been passed, and such Judge may uphold or reverse the sentence or reduce the term.
The length of the reformative part of the sentence actually served in prison in any particular case (including habitual criminals or offenders) is determined by His Excellency the Governor upon recommendation as to probation, etc., made by the Prisons Board set up under the Act.
Persons undergoing any sentence, whether of imprisonment or reformative detention, are to be employed in such labour as is prescribed by regulations (gazetted on 10th July, 1913) or directed by the Minister of Justice. Wages according to scale for the class of labour in which any such person is employed may be credited to him, and the amount from time to time standing to his credit is to be applied wholly or in part towards maintaining the wife and children (if any) of the prisoner, and any balance standing to his credit on his release shall thereupon be paid to him either in a lump sum or in such instalments as the Minister directs.
The following table shows the distinct convicted prisoners (excluding Maoris) received in prison during 1914 after being sentenced to reformative treatment or having been declared habitual criminals, classified according to sentences:—
| Sentenced to Reformative Treatment for a Period of | |||||
|---|---|---|---|---|---|
| Original Sentence. | Under 2 Years | 2 and under 5 Years. | 5 Years and over. | Declared Habitual Criminals. | Totals. |
| Reformative treatment only | 29 | 44 | 3 | 1 | 77 |
| Under 1 year | 6 | 20 | 1 | 8 | 35 |
| 1 year and under 2 | 1 | 10 | 1 | 14 | 26 |
| 2 years and under 3 | .. | 4 | 1 | 2 | 7 |
| 3 “ 4 | .. | .. | 2 | 3 | 5 |
| 5 “ 7 | .. | 1 | .. | 1 | 2 |
| Totals | 36 | 79 | 8 | 29 | 152 |
There are two tree-planting prison-camps established—viz., Kaingaroa and Waipa Valley, both in the North island. There were 61 prisoners at these; camps at the end of 1914, and a considerable amount of planting, clearing, fencing, and other work was carried out during the year. A certain amount of tree-planting was also carried out by prisoners near Point Halswell, on the Miramar Peninsula. The total area planted in trees since the inauguration of the system in 1901 is 9,776 acres, and the total number of trees planted is 31,000,000. The labour-value of the work is assessed at £51,000.
For the purposes of the Crimes Amendment Act of 1910 there is constituted a Prisons Board of not less than three nor more than seven members, one of whom must be a Judge of the Supreme Court, who is ex officio President. The members of the Board are appointed by the Governor in Council for a period of three years, and may be reappointed. The Board meets at such times as the President determines, and, subject to the provisions of the Act and regulations, may determine its own procedure.
It is the duty of the Board to make' inquiry from time to time whether there is reasonable cause for belief that any habitual criminal undergoing sentence or reformative detention is sufficiently reformed to be released on probation or discharged, or for granting discharge to any person who has been released on probation; and to make recommendations to the Governor as to the release or discharge of any habitual criminal, habitual offender, or person under sentence of reformative detention, and as to the conditions which may be imposed on any such release or probation. The Board is required to take into consideration the case of every habitual criminal, &c., at least once a year, and to make a report to the Minister of Justice annually as to the operations of the Board, numbers dealt with, and the operation and effect of the Act.
During the year 1914 the Board considered a total of 449 cases, representing 259 individuals, 69 of whom were habitual criminals and offenders, the remaining 190 being prisoners undergoing reformative detention. The Board recommended 15 habitual criminals and offenders for release on probation, and 4, already on probation, for absolute discharge. Twelve of those released on probation broke the conditions of their license, and 9 were returned to prison. The total number released on probation during the four years 1911–14 was 89, and of these 20 were convicted of fresh offences, viz.: In 1911, 5; in 1912, 6; in 1913, 4; and in 1914, 5.
The number of persons under reformative treatment who were recommended for release or discharge by the Board was 101. The Board endeavours to provide for a part of the term of reformative treatment being served out of prison on license, and so far the results of this method have been sufficiently satisfactory to be encouraging. In 20 cases the probationary license has been cancelled, 9 having been found guilty of a specific new offence, and 11 having committed breaches of the terms of their license.
The table following gives information concerning the habitual criminals and the prisoners undergoing reformative detention whose cases have been considered by the Board since the 1st January, 1911:—
| Habitual Criminals. | Prisoners undergoing Reformative Detention. | |
|---|---|---|
| Cases considered | 136 | 429 |
| Released on recommendation of Board | 96 | 281 |
| Returned to prison on conviction for further offences | 24 | 25 |
| Returned to prison for breach of probationary license | 18 | 29 |
| Absconded | 10 | 11 |
| Whereabouts unknown | 3 | 2 |
| Discharged | 12 | 16 |
| Reformatory-detention period expired | 132 | |
| 67 | 215 | |
| Reporting on probation | 29 | 66 |
| 96 | 281 |
The gross expenditure on the prisons (exclusive of the cost of buildings) for the year ended the 31st December, 1914, was £55,479, made up of the following items:—
| Salaries and allowances | 27,848 |
|---|---|
| Uniforms | 1,000 |
| Bedding and clothing, furniture, &c. | 3,508 |
| Fuel, light, water, sanitation, &c. | 3,438 |
| Gratuities | 1,273 |
| Medicines and medical comforts | 822 |
| Rations | 10,816 |
| Tobacco | 739 |
| Incidental expenses, including tools and material | 2,474 |
| Travelling-expenses and conveyance of prisoners | 3,561 |
| Total | £55,479 |
It is the duty of a Coroner or Deputy Coroner, or, in their absence, a Justice of the Peace, to inquire into the manner of death of any person who is killed or drowned, or dies suddenly, or in prison, or while detained in a mental hospital, and an inquest must be held on the body of every person executed to certify that the sentence was duly carried out.
The jurisdiction of a Coroner extends throughout the Dominion, but he is not compelled to hold any inquest at a greater distance than twenty miles from his residence; but the duties of a Deputy Coroner or Justice of the Peace are in each case strictly limited to the above radius. A Coroner may, if he thinks fit, take an inquest either by himself or by a jury of not less than four nor more than six, unless specially directed by the Attorney-General to summon a jury. A post-mortem examination of a body may be ordered by a Coroner, and, if considered advisable, an analysis. Jurors need not view the body, but the Coroner is exempt from this duty only when it is certified by a medical man that the deceased died of an infectious disease.
Any person interested may, by permission of the Coroner, attend an inquest personally or by counsel, and may examine and cross-examine witnesses. When a verdict of murder or manslaughter is returned against a particular person the Coroner may issue a warrant to apprehend and take the accused before a Justice. It shall also be the duty of the Coroner, in case of such a verdict, whether charging any person or not, to send a copy of the verdict and all depositions to the Attorney-General, who may take such steps as he deems desirable.
Jurors are entitled to payment at the rate of 8s. per day of more than four hours, or 4s. for less than four hours. Witnesses are allowed 6s. for each day and 4s. for each night of absence from home.
The number of bodies on which inquests were held in 1914 was 1,495, including 44 Maoris. In 1,162 cases the bodies were of males, and in 333 of females.
The verdicts given at the inquests held in 1914 may be classified as under:—
| Inquests on Persons. | |||
|---|---|---|---|
| Nature of Verdict. | Males. | Females. | Totals. |
| Accident | 500 | 80 | 580 |
| Disease and natural causes | 537 | 220 | 757 |
| Homicide | 8 | 6 | 14 |
| Legal execution | 1 | .. | 1 |
| Suicide | 116 | 27 | 143 |
| 1,162 | 333 | 1,494 | |
Of the accidental deaths, drowning is the most fatal form. The verdicts-show that. 172 deaths were due to this cause, giving a percentage of 29.66 on the accidental deaths from all causes.
The inquests on suicidal deaths in 1914 show a decrease on the number for the previous year. The figures for each of the last ten years were.—
| Year. | Inquests on Suicides. | ||
|---|---|---|---|
| Males. | Females. | Totals. | |
| 1905 | 73 | 23 | 96 |
| 1906 | 85 | 15 | 100 |
| 1907 | 94 | 7 | 101 |
| 1908 | 87 | 15 | 102 |
| 1909 | 94 | 22 | 116 |
| 1910 | 90 | 16 | 106 |
| 1911 | 109 | 25 | 134 |
| 1912 | 111 | 15 | 126 |
| 1913 | 118 | 33 | 151 |
| 1914 | 116 | 27 | 143 |
In case of tire, causing the destruction of any building, ship, or merchandise, or any stack of grain, pulse, or hay, or any growing crop, a Coroner may hold an inquiry into the cause of such fire, the procedure being similar to that of inquests into cause of death.
The inquests on fires held during 1914 numbered 12. In 5 cases the verdict was incendiarism, and in the remaining 7 cases no evidence was forthcoming.
The Gaming Act is designed to suppress gambling by confining all' betting to totalizators on racecourses. It contains provisions for the closing of “tote” shops and for the declaration by the Supreme Court of “common gaming-houses” on the affidavit of a Superintendent or Inspector of Police-showing reasonable grounds for suspecting that any premises are used as a common gaming-house or as a means of access thereto or exit therefrom; Notice of such declaration is advertised and gazetted, served on the owner or occupier, and posted up on the premises.
There are also provisions for determining any such declaration on proof that the premises are not used as a common gaming-house or in conjunction therewith. The Act provides penalties for carrying on business in, the continued use of, and being found on the premises during the currency of the declaration, and includes a club, in certain cases, in the term “common gaming-house.”
Constables have power of entry over the premises, and may use such force as may be necessary. To obstruct or give warning of the approach of a constable in the performance of his duty is an offence. Any game of chance is unlawful, and the definition of “occupier” has been extended. The Gaming Act applies to lotteries whether promoted in New Zealand or elsewhere.
Street betting is punishable by a fine of not less than £20 or more than £100 for the first offence, and by imprisonment not exceeding three months for a second or any subsequent offence. The terms “betting” and “bet” in the Act of 1910 include the act of any person in betting, wagering, offering, or agreeing to bet or wager, paying, receiving, or settling any bet or wager, whether on his own behalf or on behalf of any other person.
A constable on duty, or person acting under instructions from any Superintendent or Inspector of Police, is not deemed an offender or accomplice in the commission of any offence against the Gaming Act.
The number of charges laid in the Magistrates' Courts for breaches of the gaining laws, and the manner in which such charges were disposed of, are shown for five years in the following table:—
| Year. | Number of Charges. | Discharged or dismissed. | Convictions recorded. |
|---|---|---|---|
| 1910 | 332 | 69 | 263 |
| 1911 | 194 | 51 | 143 |
| 1912 | 403 | 85 | 318 |
| 1913 | 218 | 67 | 151 |
| 1914 | 346 | 91 | 255 |
The Minister of Internal Affairs may, on the application of any racing club, grant to such lacing club a license to use the totalizator or wagering-machine at horse-race meetings held under the control or management of such club, subject to the following conditions:—
The license shall be revocable at any time the Minister thinks fit to determine the same. No more than three totalizators shall be used by the club at any one time, and none outside the race-grounds within the control of the club. The machine must be under the care and management of some competent person appointed by the club, and under the direct supervision of the stewards.
Every license shall be issued in respect of a single race meeting, and shall specify the number of days on which the totalizator may be used at that meeting. The aggregate number of days on which the totalizator may be used by racing clubs in any one year was fixed in 1910 at 250, and the number of days for any one race meeting must not exceed four.
By a short amendment to the Gaming Act passed in 1914, authority is given for the Minister of Internal Affairs to grant in a year not more than thirty-one additional totalizator licenses to clubs not holding such licenses. The additional licenses are to be allocated as follows:—
| To racing clubs, not more than | 15 |
| To hunt “ “ | 8 |
| To trotting “ “ | 8 |
A race meeting at which the totalizator is authorized to be used on four days shall not extend over a longer period than eight consecutive days; meetings at which the totalizator is authorized to be used on three days shall not extend over a period of six consecutive days; and a race meeting at which the totalizator is authorized to be used for two days shall not extend over a longer period than four consecutive days; and on expiry of any such maximum period the license to use the totalizator shall lapse; Provided that when at any race meeting a racing club is compelled by inclement weather or any extraordinary circumstances to postpone any racing to a later day, it is lawful for the club to extend that race meeting over such longer period as is rendered necessary.
Racing clubs must not accept any totalizator investment by telegram or telephone, and no investment may be received otherwise than in money, bank-notes, or cheque before or at the time of investment. No investment shall be received from any person under the age of twenty-one years, and any member, agent, or servant of a racing club who permits or authorizes to be received an investment on the totalizator made by any person under twenty-one years is guilty of an offence, and is liable to a fine not exceeding £100; and any person who falsely represents himself as being of the age of twenty-one or upwards is liable to a fine not exceeding £50. The publication of dividends (except on the racecourse) is prohibited, and racing tips and the “double” totalizator are abolished. The totalizator must be closed not later than the time advertised for the starting of a race.
Information as to totalizator licenses issued, amount of investments by the public, and amount paid to the Treasury as percentage of investments is given in the portion of this book dealing with Taxation.
Table of Contents
FOR purposes of the representation of the people in the House of Representatives New Zealand is at present divided into seventy-six districts with one member for each. The boundaries of the districts are adjusted every five years upon a population basis, each having, as nearly as possible, the same number of inhabitants.
In computing the population for electoral purposes an addition of 28 per cent. is made to the country population—i.e., all persons living outside towns of 2,000 inhabitants and over. The total population (other than Maoris), with the addition aforesaid, having been ascertained, is then divided by the number of European members to be elected, and the quotient thus obtained forms the quota. Inasmuch as it would be difficult to divide the country into a given number of districts all having exactly the precise quota of population, the law permits the Commissioners to make an allowance of 550 persons by way of addition to or deduction from the population of rural districts, and of 100 in case of city electorates, and a proportionate number for districts where the population is partly city and partly rural, so that more consideration can be given to community of interest, facilities of communication, and topographical features when defining the boundaries of the districts.
The proposed boundaries of the new districts are then notified in the Gazette, and objections to such proposals may be lodged with the Commissioners, who consider and decide any objections before coming to a final determination.
The census is the only means of ascertaining correctly the distribution of the people, and for this reason is essential to the work of dividing the Dominion anew into electorates of even population. The internal movement of the people cannot be ascertained correctly except by a census, though the natural increase (excess of births over deaths) added to the excess of arrivals over departures gives a fairly correct estimate of increase of population for the whole country. Latterly fairly reliable estimates of population of divisions have been made through keeping records of inter-island migration and obtaining reports from local bodies and from district officers of the Valuation Department.
An instance of the effect of the census in adjusting the representation of the people for Parliament is afforded by the figures relating to the North and South Islands for successive census years,—
| North Island. | South Island. | |
|---|---|---|
| Prior to the census of 1891 | 30 members | 40 members. |
| ” 1896 | 31 ” | 39 ” |
| ” 1901 | 34 ” | 36 ” |
| ” 1906 | 38 ” | 38 ” |
| ” 1911 | 41 ” | 35 ” |
The districts have been again defined on the basis of the population as shown by the census taken in April. 1911, with the result that the South Island now returns only thirty-four members us against forty-two for the North Island.
These districts are, as before, stated, for purposes of European representation. Rut the Dominion is again divided into four districts for purposes of Maori representation, under the electoral law, each district having one Native member elected by the Maoris: making the House of Representatives consist of eighty members altogether—seventy-six Europeans and four Maoris.
Every male registered as an elector is qualified to be a member of Parliament for any electoral district, provided he is not an undischarged bankrupt, a member of the Legislative Council, or a Civil servant, or is not directly interested in any contract with the Government exceeding the value of £50. Except in case of a dissolution in the meantime, a general election of members of the House of Representatives is held every three years.
All male and female adults who are British subjects either by birth or by naturalization in New Zealand, and who are not debarred by law, may be registered as electors, provided they have resided twelve months in New Zealand and one month immediately preceding registration in the district wherein they desire to be enrolled, and no person may be registered for more than one district.
In every year in which a general election is held the general (or main) roll in each district is closed for printing on a date fixed by the Governor in Council, after which date no names may be entered on such general roll. All claims for enrolment received by the Registrar of Electors for any district between the date of closing of the general roll and 6 p.m. on the day of issue of the writ for the election are entered on a supplementary roll. Electors” rights for seamen, and absent-voters' permits for persons who expect to be absent from their districts at the time of an election, may be issued from the district wherein they are enrolled, to enable them to record their votes for such district in any part of the Dominion. Such rights or permits are available for twelve months from date of issue.
The Minister may from time to time direct that an electoral census be taken of every or any electoral district for the purpose of enrolling all persons qualified to be enrolled and who are not already enrolled. Every master or mistress of any licensed public house, lodging house, or private dwellinghouse shall, on the application of an enrolment officer, give all information as to names, occupations, and qualifications for enrolment of all persons residing in that house. Persons failing to give faithful information on request are liable to a fine of £5.
Not later than seven days after the dissolution or expiry of Parliament, writs for a general election are issued under warrant from the Governor. In the writs the date of polling-day is appointed. A Returning Officer is appointed for each district, the polling-places being appointed by the Governor.
Candidates for election must be nominated by not less than two electors of the district, and each nomination-paper must reach the Returning Officer not later than noon on the tenth day before polling-day. No elector may nominate more than one candidate. Each candidate must signify his consent to nomination, such consent to reach the Returning Officer before the time fixed for close of nominations; and with his consent each candidate must deposit £10 with the Returning Officer. If the total number of votes received by any unsuccessful candidate is less than one-fourth of the total number of votes recorded for the successful candidate, such deposit shall be forfeited and paid into the Consolidated Fund. Any candidate may withdraw not later than noon on the day of closing of nominations, by giving notice in writing to the Returning Officer, and his deposit in such case is returned.
The Returning Officer appoints a deputy for each polling-booth, and each candidate may appoint a scrutineer for each booth. In thirty-five districts the poll closes at 7 p.m., and in forty-one districts at 6 p.m. The elector records his or her vote by striking out on the ballot-paper the names of the candidates for whom he or she does not wish to vote. As soon as he ascertains from the various booths the result of the poll the Returning Officer declares the candidate who has received an absolute majority of votes to be elected. If two or more candidates receive an equal number of votes the Returning Officer is required to give a casting-vote. In no other instance is the Returning Officer allowed to vote.
Provision is made to secure the secrecy of the ballot and the maintenance of law and order, and every precaution is taken to guard against undue influence or interference with electors on polling-day. Every person who commits the offence of personation is liable to two years” imprisonment with hard labour. Persons guilty of corrupt or illegal practices are liable to heavy penalties.
A candidate requiring a recount of the votes may apply to a Magistrate for same, at the same time depositing £20. The recount is made in the presence of the Magistrate. Petitions against the return of candidates must be delivered to the Returning Officer, and security given to the amount of £200. Such petitions are tried before two Judges of the Supreme Court, and their decision is final.
For the election of the four Maori members every adult Maori is entitled to vote in the district where he or she resides: and every Maori male qualified as an elector is also qualified to become a member of Parliament for any Maori electoral district. Half-castes registered on any European roll are not entitled to vote for the election of Maori representatives. Similar provisions apply as in the case of European elections in regard to registration, the issue of writs, appointment of Returning Officers and deputies, polling-places, nomination of candidates, deposit of £10 by candidates, and withdrawal from candidature. The hours of polling are from 9 a.m. to 4 p.m. Each Deputy Returning Officer has associated with him a Maori or a half-caste. Candidates may appoint a scrutineer for each booth to act at the count of the votes after the poll. The elector on entering a booth states his or her full name, tribe, hapu, and abode, such information being entered by the deputy or his associate on the counterfoil of the ballot-paper. The elector is then asked the name of the candidate for whom he or she desires to vote, and the deputy writes such candidate's name on the ballot-paper. Arrangements are made to secure the secrecy of the ballot and maintenance of order. Any person guilty of the offence of personation is liable to imprisonment for two years with hard labour. As soon as he has ascertained the result of the poll from the various booths the Returning Officer declares the candidate with the highest number, of votes to be elected.
The Second Ballot Act, which was in operation at the general elections of 1908 and 1911 and for a number of by-elections, and winch was fully described in previous issues of the Year-book, was repealed by a short amendment of the Legislature Act passed in 1913.
An Act was passed on the 4th September, 1914, to enable members of Expeditionary Forces sent from New Zealand in connection with the war to record their votes for the general election of 1914 before leaving the Dominion. In the case of those who had already left, provision was made for the votes to be recorded outside New Zealand. All members of Expeditionary Forces were entitled to vote, including those not yet of the full age of twenty-one years. Instead of the names of candidates the voting-paper contained the three words “Government,” “Opposition,” “Labour,” and the voter was required to strike out the designations of the two parties for which he did not desire to vote.
The votes cast for the various parties were to be allocated to the representative candidates of the respective parties for the districts in which the voters resided, the representative candidates to be selected as follows:—
In the case of the Government party, by the Prime Minister.
In the case of the Opposition party, by the leader of the Opposition.
In the case of the Labour party, by two members of the House of Representatives appointed as selectors on the recommendation of a majority of the Labour members of the House.
Later in the session a similar Act was passed to enable members of Maori Expeditionary Forces to record their votes.
Under the provisions of the Legislative Council Act, 1914, members of the Council are to be elected under a system of proportional representation. For the purpose of the elections New Zealand is divided into four electoral divisions, to be known respectively as the First, Second, Third, and Fourth Electoral Divisions. The divisions are formed by grouping a number of electoral districts together. Based on the 1911 census figures, the following electoral districts constitute the four divisions:—
First Electoral Division.—Bay of Islands, Marsden, Kaipara, Waitemata, Parnell, Auckland West, Auckland Central, Auckland East, Grey Lynn, Eden, Manukau, Thames, Franklin, Raglan, Ohinemuri, Tauranga, Waikato, Taumarunui, Bay of Plenty, Gisborne, Hawke's Bay.
Second Electoral Division.—Stratford, Taranaki, Egmont, Patea, Waimarino, Wanganui, Rangitikei, Oroua, Waipawa, Napier, Pahiatua, Palmerston, Otaki, Masterton, Wairarapa, Hutt, Wellington Suburbs and Country Districts, Wellington North, Wellington Central, Wellington East, Wellington South.
Third Electoral Division.—Motueka, Nelson, Wairau, Buller, Grey, Westland, Hurunui, Kaiapoi, Riccarton. Avon, Christchurch East, Christchurch North, Christchurch South, Lyttelton, Ellesmere, Selwyn, Ashburton.
Fourth Electoral Division.—Temuka, Timaru, Waitaki, Wakatipu, Otago Central, Oamaru, Chalmers, Dunedin North, Dunedin West, Dunedin Central, Dunedin South, Bruce, Clutha, Mataura, Invercargill, Awarua. Wallace.
At the first election of the Council seven members are to be elected for each of the First and Second Electoral Divisions, and five for each of the Third and Fourth Electoral Divisions. At every election held after the first election and until the Representation Commissions alter the boundaries the total number to be elected is forty, eleven from each of the First and Second Divisions and nine from each of the Third and Fourth Divisions. Whenever the Representation Commissions sit for the purpose of dividing New Zealand into electoral districts as required by the Legislature Act they are required to determine the number of members of the Legislative Council to be elected from each of the North and South Islands. The Representation Commissions for each Island sit as a joint Commission for the purpose of determining the boundaries of the electoral divisions and the number of members to be elected for each electoral division.
The provisions of the Act as far as it relates to elections do not apply to persons of the Native race. Under section 21 the Governor is given authority to appoint not more than three Maori members.
Candidates are required to be nominated by not less than two electors. The provisions of the Legislature Act having reference to the conduct of elections apply to elections held under the Legislative Council Act. Returning Officers appointed for the conduct of elections of members of the House of Representatives act as Assistant Returning Officers to the Returning Officers appointed under the Legislative Council Act. In lieu of marking the ballot-paper by drawing a line through the name of the candidate or candidates an elector does not wish to vote for, as provided by the Legislature Act, the elector is required to place in the squares opposite the respective names of three candidates the figures 1, 2, 3, so as to indicate the order of his preference. He may also indicate the order of his preference for as many of the other candidates, if any, as he pleases by placing in the square opposite their respective names other figures next in numerical order after those already used by him. The method of counting the votes, which is fully set out in the Third Schedule of the Act, provides for the transfer of surplus votes to the candidates, not declared elected, next in order of the voters' respective preference.
Polling-day, 10th December. 1914; number of polling-places, 2,791.
Dealing with the population of both sexes, it is found that the total number of persons on the rolls was 616,043. The number of persons who voted, or who went to the poll, was 521,525 or 84.66 per cent. of the number on the rolls, a somewhat larger proportion than obtained in 1911— viz., 83.67 per cent.
| Year of General Election. | Estimated Total Adult Persons. | Number on Rolls. | Proportion per Cent. of Adult Persons registered as Electors. | Number of Persons who voted. | Proportion per Cent. of Persons on Rolls who voted. |
|---|---|---|---|---|---|
* Excluding figures for three electorates in which there was no contest. † Including 4,974 informal votes. ‡ Including 5,468 informal votes. § Including 4,596 informal votes. || Including 4,143 informal votes, and excluding 6,812 votes recorded at licensing poll in Gisborne Electorate, where there was no parliamentary contest. | |||||
| 1893 | 319,010 | 302,997 | 94.98 | 220,082 | 75.25* |
| 1896 | 356,658 | 339,230 | 95.11 | 258,254 | 76.13 |
| 1899 | 386,146 | 373,744 | 96.79 | 279,330 | 77.59* |
| 1902 | 429,385 | 415,789 | 96.83 | 318,859† | 76.69 |
| 1905 | 500,108 | 476,473 | 95.28 | 396,657‡ | 83.25 |
| 1908 | 538,950 | 537,003 | 99.64 | 428,648§ | 79.82 |
| 1911 | 594,532 | 590,042 | 99.24 | 486,100|| | 83.67 |
| 1914 | 641,708 | 616,043 | 95.99 | 521,525 | 84.66 |
Dealing with men only, the number on the rolls was 335,697. The males who voted in 1914 were 286,799, or 85.43 per cent. of those on the rolls, against 84.58 per cent. in 1911.
| Year of General Election. | Estimated Total Adult Males. | Number of Males on Rolls. | Proportion per Cent. of Adult Males registered as Electors. | Number who voted. | Proportion per Cent. of Males on Rolls who voted. |
|---|---|---|---|---|---|
* Excluding figures for three electorates in which there were no contests. † The number on the rolls was in excess of the estimated adult male population at the date of the election. ‡ Including informal. § Does not include 4,068 votes recorded at licensing poll in Gisborne Electorate, where there was no parliamentary contest. | |||||
| 1893 | 179,539 | 193,536 | † | 129,792 | 69.61* |
| 1896 | 197,002 | 196,925 | 99.96 | 149,471 | 75.90 |
| 1899 | 214,773 | 210,529 | 98.02 | 159,780 | 79.06* |
| 1902 | 233,602 | 229,845 | 98.39 | 180,294‡ | 78.44 |
| 1905 | 273,175 | 263,597 | 96.49 | 221,611‡ | 84.07 |
| 1908 | 295,446 | 294,073 | 99.54 | 238,534‡ | 81.11 |
| 1911 | 321,324 | 321,033 | 99.91 | 266,986§ | 84.58 |
| 1914 | 344,600 | 335,697 | 97.42 | 286,799 | 85.43 |
The number of women who voted. 234,726, is 83.73 per cent. of the females on the rolls, while in 1911 there were 219,114 who voted, giving a proportion of 82.57 per cent.
| Year of General Election. | Estimated Total Adult Females. | Number of Females on Rolls. | Proportion per Cent. of Adult Females registered as Electors. | Number who voted. | Proportion per Cent. of Females on Rolls who voted. |
|---|---|---|---|---|---|
* Excluding figures for three electorates in which there were no contests. † Including informal. ‡ Does not include 2,744 votes recorded at licensing poll in Gisborne Electorate, where there was no parliamentary contest. | |||||
| 1893 | 139,471 | 109,461 | 78.48 | 90,290 | 85.18* |
| 1896 | 159,656 | 142,305 | 89.13 | 108,783 | 76.44 |
| 1899 | 171,373 | 163,215 | 95.24 | 119,550 | 75.70* |
| 1902 | 195,783 | 185,944 | 94.97 | 138,565† | 74.52 |
| 1905 | 226,933 | 212,876 | 93.80 | 175,046† | 82.23 |
| 1908 | 243,504 | 242,930 | 99.76 | 190,114† | 78.26 |
| 1911 | 273,208 | 269,009 | 98.46 | 219,114‡ | 82.57 |
| 1914 | 297,168 | 280,346 | 94.34 | 234,726 | 83.73 |
| RESULT OF GENERAL ELECTION, 1914. | |||
|---|---|---|---|
| Electoral Districts and Names of Candidates. | Number of Votes recorded. | Number of Electors on Roll. | Population at Census, 1911. |
| Bay of Islands,— | |||
| Reed, V. H. | 2,328 | 7,227 | 12,080 |
| Buck, P. H. | 2,220 | ||
| Wilkinson, G. | 1,576 | ||
| Informal | 61 | ||
| Total | 6,185 | ||
| Marsden,— | |||
| Mander, F. | 3,469 | 7,288 | 12,555 |
| Purdie, B. C. | 2,529 | ||
| Informal | 42 | ||
| Total | 6,040 | ||
| Kaipara,— | |||
| Coates, J. G. | 3,596 | 7,076 | 11,588 |
| Hoe, R. | 2,478 | ||
| Informal | 92 | ||
| Total | 6,166 | ||
| Waitemata,— | |||
| Harris, A. | 4,881 | 10,444 | 14,687 |
| Tewsley, H. C. | 3,868 | ||
| Informal | 95 | ||
| Total | 8,844 | ||
| Eden,— | |||
| Parr, C. J. | 5,231 | 11,239 | 14,220 |
| Tuck, W. R. | 2,775 | ||
| Richards, W. E. | 1,682 | ||
| Informal | 86 | ||
| Total | 9,774 | ||
| Auckland East,— | |||
| Myers, A. M. | 5,039 | 9,746 | 15,195 |
| Holmes, A. S. | 2,532 | ||
| Informal | 120 | ||
| Total | 7,691 | ||
| Auckland Central,— | |||
| Glover, A. E. | 4,053 | 9,114 | 15,153 |
| Savage, M. J. | 1,751 | ||
| Richardson, W., sen | 1,315 | ||
| Informal | 100 | ||
| Total | 7,219 | ||
| Auckland West.— | |||
| Poole, C. H. | 4,827 | 9,895 | 15,214 |
| Bradney, J. H. | 3,416 | ||
| Informal | 84 | ||
| Total | 8,327 | ||
| Grey Lynn,— | |||
| Payne, J. | 2,933 | 9,994 | 15,182 |
| McLean, M. | 2,844 | ||
| Fowlds, G. | 2,838 | ||
| Informal | 145 | ||
| Total | 8,760 | ||
| Marsden,— | |||
| Dickson, J. S. | 5,212 | 11,287 | 15,163 |
| Sullivan, J. J. | 4,040 | ||
| Lawry, F. | 39 | ||
| Informal | 132 | ||
| Total | 9,423 | ||
| Manukau,— | |||
| Lang, F. W. | 5,293 | 11,103 | 14,668 |
| McLarin, J. W., sen | 4,074 | ||
| Informal | 118 | ||
| Total | 9,490 | ||
| Marsden,— | |||
| Massey, W. F. | 4,818 | 7,953 | 12,277 |
| Glass, A. G. C. | 1,890 | ||
| Informal | 68 | ||
| Total | 6,776 | ||
| Marsden,— | |||
| Bollard, R. F. | 4,002 | 7,934 | 11,813 |
| Thompson, W. D. | 2,554 | ||
| Furniss, J. | 96 | ||
| Informal | 83 | ||
| Total | 6,735 | ||
| Marsden,— | |||
| Rhodes, T. W. | 3,150 | 6,764 | 12,526 |
| Taylor, B. H. | 2,635 | ||
| Informal | 54 | ||
| Total | 5,839 | ||
| Marsden,— | |||
| Poland, H. | 2,899 | 6,554 | 13,319 |
| Clark, J. | 2,799 | ||
| Informal | 52 | ||
| Total | 5,750 | ||
| Marsden,— | |||
| Herries, W. H. | 4,399 | 8,051 | 12,234 |
| Stewart, R. D. | 2,407 | ||
| Informal | 102 | ||
| Total | 6,908 | ||
| Marsden,— | |||
| Young, J. A. | 5,083 | 9,796 | 13,013 |
| Scholes, A. | 2,890 | ||
| Informal | 101 | ||
| Total | 8,074 | ||
| Bay of Plenty,— | |||
| MacDonald, W. D. S. | 4,033 | 8,816 | 12,249 |
| Williams, K. S. | 3,068 | ||
| Informal | 94 | ||
| Total | 7,195 | ||
| Marsden,— | |||
| Jennings, W. T. | 4,012 | 9,609 | 12,246 |
| Wilson, C. K. | 3,807 | ||
| Shortland, F. W. | 37 | ||
| Informal | 61 | ||
| Total | 7,917 | ||
| Marsden,— | |||
| Carroll, J. | 4,669 | 10,013 | 14,023 |
| de Lautour, H. D. | 3,420 | ||
| Smith, G. | 64 | ||
| Informal | 58 | ||
| Total | 8,211 | ||
| Hawke's Bay,— | |||
| McNab, R. | 4,217 | 10,245 | 13,387 |
| Campbell, H. McL. | 4,177 | ||
| Informal | 100 | ||
| Total | 8,494 | ||
| Marsden,— | |||
| Brown, J. V. | 4,748 | 8,787 | 14,556 |
| Venables, G. W. | 2,533 | ||
| Informal | 81 | ||
| Total | 7,362 | ||
| Marsden,— | |||
| Hunter, G. | 3,282 | 7,558 | 12,967 |
| Jull, A. E. | 3,144 | ||
| Informal | 95 | ||
| Total | 6,521 | ||
| Marsden,— | |||
| Escott, J. H. | 2,906 | 6,241 | 12,168 |
| Mathews, J. D. | 2,223 | ||
| Informal | 39 | ||
| Total | 5,168 | ||
| Marsden,— | |||
| Sykes, G. R. | 3,273 | 7,590 | 12,904 |
| Hogg, A. W. | 3,080 | ||
| Informal | 35 | ||
| Total | 6,388 | ||
| Marsden,— | |||
| Hornsby, J. T. M. | 3,164 | 7,149 | 11,563 |
| Buchanan, W. C. | 3,104 | ||
| Informal | 38 | ||
| Total | 6,306 | ||
| Marsden,— | |||
| Hine, J. B. | 2,856 | 6,200 | 12,334 |
| Hawkins, W. H. | 2,219 | ||
| Informal | 56 | ||
| Total | 5,131 | ||
| Marsden,— | |||
| Okey, H. J. H. | 3,759 | 7,140 | 13,090 |
| Hughes, D. J. | 2,558 | ||
| Informal | 90 | ||
| Total | 6,407 | ||
| Marsden,— | |||
| Wilkinson, C. A. | 3,317 | 6,436 | 11,718 |
| Astbury, D. L. A. | 2,423 | ||
| Informal | 49 | ||
| Total | 5,789 | ||
| Patea,— | |||
| Pearce, G. V. | 3,388 | 7,877 | 12,724 |
| Morrison, W. | 3,270 | ||
| Informal | 64 | ||
| Total | 6,722 | ||
| Marsden,— | |||
| Veitch, W. A. | 3,330 | 9,344 | 14,185 |
| Pirani, F. | 2,478 | ||
| Hogan, J. T. | 2,086 | ||
| Informal | 75 | ||
| Total | 7,969 | ||
| Marsden,— | |||
| Smith, E. W. | 4,093 | 9,184 | 12,255 |
| Speed, H. M. | 2,098 | ||
| Informal | 56 | ||
| Total | 6,247 | ||
| Marsden,— | |||
| Guthrie, D. H. | 3,279 | 6,526 | 12,929 |
| Morrison, J. | 2,160 | ||
| Informal | 53 | ||
| Total | 5,492 | ||
| Marsden,— | |||
| Newman, E. | 3,159 | 6,528 | 11,524 |
| Hornblow, R. E. | 2,256 | ||
| Informal | 39 | ||
| Total | 5,454 | ||
| Marsden,— | |||
| Buick, D. | 2,844 | 8,913 | 14,194 |
| Thorn, J. | 1,735 | ||
| Crabb, E. H. | 1,546 | ||
| Nash, J. A. | 1,071 | ||
| Informal | 85 | ||
| Total | 7,281 | ||
| Marsden,— | |||
| Field, W. H. | 3,024 | 6,552 | 12,157 |
| Robertson, J. | 2,384 | ||
| Informal | 77 | ||
| Total | 5,485 | ||
| Marsden,— | |||
| Wilford, T. M. | 3,977 | 8,443 | 14,502 |
| Samuel, A. M. | 3,034 | ||
| Informal | 143 | ||
| Total | 7,154 | ||
| Wellington North,— | |||
| Herdman, A. L. | 4,550 | 9,936 | 15,268 |
| Turnbull, W. H. | 1,895 | ||
| Holland, H. E. | 1,688 | ||
| Informal | 104 | ||
| Total | 8,237 | ||
| Wellington Central,— | |||
| Fletcher, B. | 5,208 | 9,673 | 15,248 |
| Fisher, F. M. 13. | 2,879 | ||
| Informal | 84 | ||
| Total | 8,171 | ||
| Wellington East,— | |||
| Newman, A. K. | 4,062 | 9,532 | 15,275 |
| McLaren, D. | 4,014 | ||
| Informal | 64 | ||
| Total | 8,140 | ||
| Wellington South,— | |||
| Hindmarsh, A. II. | 4,279 | 8,835 | 15,238 |
| Luke, J. P. | 3,064 | ||
| Williams, R. B. | 221 | ||
| Informal | 221 | ||
| Total | 7,624 | ||
| Wellington Suburbs and Country Districts,— | |||
| Wright, R. A. | 3,258 | 7,858 | 14,136 |
| Moore, F. T. | 2,256 | ||
| Fitzgerald, J. E. | 922 | ||
| Informal | 58 | ||
| Total | 6,494 | ||
| Marsden,— | |||
| Field, T. A. H. | 3,406 | 7,779 | 13,287 |
| Atmore, H. | 3,316 | ||
| Informal | 75 | ||
| Total | 6,797 | ||
| Marsden,— | |||
| Hudson, R. P. | 2,760 | 5,985 | 11,503 |
| McKenzie, R. | 2,158 | ||
| Informal | 16 | ||
| Total | 4,934 | ||
| Marsden,— | |||
| Colvin, J. | 3,594 | 6,597 | 12,618 |
| Powell, G. M. | 1,399 | ||
| Gillen, H. | 371 | ||
| Informal | 73 | ||
| Total | 5,437 | ||
| Marsden,— | |||
| Webb, P. C. | 3,841 | 7,843 | 12,658 |
| Michel, H. L. | 2,861 | ||
| Informal | 118 | ||
| Total | 6,820 | ||
| Marsden,— | |||
| Seddon, T. E. Y. | 3,236 | 6,474 | 12,166 |
| Paape, A. A. | 2,410 | ||
| Informal | 45 | ||
| Total | 5,691 | ||
| Wairau,— | |||
| McCallum, R. | 3,517 | 7,766 | 12,926 |
| Duncan, J. | 3,148 | ||
| Turner, G. | 25 | ||
| Informal | 109 | ||
| Total | 6,799 | ||
| Marsden,— | |||
| Forbes, G. W. | 3,233 | 6,015 | 11,441 |
| Banks. W. A. | 1,747 | ||
| Informal | 46 | ||
| Total | 5,026 | ||
| Marsden,— | |||
| Buddo, D. | 3,606 | 6,887 | 11,927 |
| Jones, D. | 2,425 | ||
| Informal | 32 | ||
| Total | 6,063 | ||
| Christchurch North,– | |||
| Isitt. L. M. | 5,222 | 10,746 | 15,225 |
| Toogood, H. F. | 4,005 | ||
| Informal | 101 | ||
| Total | 9,328 | ||
| Christchurch East,— | |||
| Thacker, H. T. J. | 4,093 | 8,747 | 15,189 |
| Hunter, II. | 2,203 | ||
| Macfarlane, G. D. | 1,350 | ||
| Informal | 70 | ||
| Total | 7,716 | ||
| Christchurch South,— | |||
| Ell, H. G. | 4,507 | 9,149 | 15,172 |
| Whiting, G. R. | 2,174 | ||
| Hughes, F. B. | 1,281 | ||
| Informal | 131 | ||
| Total | 8,093 | ||
| Marsden,— | |||
| Witty, G. | 4,354 | 8,693 | 14,126 |
| Bunn. B. | 3,139 | ||
| Informal | 69 | ||
| Total | 7,562 | ||
| Marsden,— | |||
| Russell, G. W. | 3,642 | 9,673 | 15,155 |
| Sullivan, D. G. | 2,569 | ||
| Acland, H. D. | 2,261 | ||
| Informal | 52 | ||
| Total | 8,524 | ||
| Marsden,— | |||
| McCombs, J. | 4,276 | 8,419 | 14,189 |
| Miller, M. J. | 2,678 | ||
| Informal | 105 | ||
| Total | 7,059 | ||
| Marsden,— | |||
| Rhodes, R. H. | 2,897 | 6,622 | 11,822 |
| Free, J. C. | 2,624 | ||
| Informal | 66 | ||
| Total | 5,587 | ||
| Selwyn— | |||
| Dickie, W. J. | 2,888 | 6,384 | 11,474 |
| Sheat, G. | 1,661 | ||
| Hamlet. J. W. | 988 | ||
| Informal | 44 | ||
| Total | 5,581 | ||
| Marsden,— | |||
| Nosworthy, W. | 3,186 | 7,098 | 12,025 |
| Maslin. W. S. | 3,039 | ||
| Informal | 62 | ||
| Total | 6,287 | ||
| Marsden,— | |||
| Craigie, J. | 4,308 | 9,075 | 14,298 |
| Smith, F. H. | 3,198 | ||
| Informal | 86 | ||
| Total | 7,592 | ||
| Marsden,— | |||
| Talbot. C. J. | 3,047 | 6,699 | 11,575 |
| Kerr. C. E. | 2,640 | ||
| Informal | 20 | ||
| Total | 5,707 | ||
| Marsden,— | |||
| Anstey, J. | 3,071 | 6,622 | 11,573 |
| Francis, N. | 2,915 | ||
| Informal | 30 | ||
| Total | 6,016 | ||
| Marsden,— | |||
| Lee, E. P. | 3,408 | 7,516 | 13,392 |
| Macpherson. J. A. | 3,070 | ||
| Informal | 99 | ||
| Total | 6,577 | ||
| Otago Central,— | |||
| Scott. K. | 3,417 | 6,923 | 12,137 |
| Bodkin, W. A. | 2,418 | ||
| Informal | 42 | ||
| Total | 5,877 | ||
| Dunedin North,— | |||
| Walker, A. | 4,073 | 9,201 | 15,141 |
| Thomson, G. M. | 3,751 | ||
| Informal | 88 | ||
| Total | 7,912 | ||
| Dunedin West,— | |||
| Stewart, W. D. | 4,038 | 9,336 | 15,106 |
| Johnson, J. T. | 3,693 | ||
| Maguire, W. E. J. | 95 | ||
| Informal | 77 | ||
| Total | 7,903 | ||
| Dunedin Central,— | |||
| Statham, C. E. | 3,744 | 9,171 | 15,092 |
| Munro, J. W. | 3,732 | ||
| Informal | 199 | ||
| Total | 7,675 | ||
| Dunedin South,— | |||
| Sidey, T. K. | 5,374 | 9,726 | 15,110 |
| Dalton, T. H. | 2,677 | ||
| Informal | 98 | ||
| Total | 8,149 | ||
| Marsden,— | |||
| Dickson. J. McC. | 3,199 | 7,626 | 13,226 |
| Mason. W. D'A. | 2,513 | ||
| Thomson, G. S. | 657 | ||
| Informal | 82 | ||
| Total | 6,451 | ||
| Marsden,— | |||
| Allen. J. | 3,084 | 6,534 | 11,433 |
| Smith. C. R. | 2,391 | ||
| Informal | 54 | ||
| Total | 5,529 | ||
| Marsden,— | |||
| Malcolm. A. S. | 33,038 | 6,180 | 11,712 |
| Jenkinson, J. E. | 2,029 | ||
| Informal | 27 | ||
| Total | 5,094 | ||
| Marsden,— | |||
| Fraser, W. | 2,775 | 5,705 | 11,647 |
| Stephens, J. | 1,878 | ||
| Informal | 32 | ||
| Total | 4,685 | ||
| Marsden,— | |||
| Anderson, G. J. | 2,908 | 6,467 | 12,304 |
| Mehaffey, W. G. | 2,734 | ||
| Informal | 29 | ||
| Total | 5,671 | ||
| Marsden,— | |||
| Thomson, J. C. | 3,036 | 6,230 | 11,468 |
| Rodger, A. W., jun. | 2,155 | ||
| Informal | 53 | ||
| Total | 5,244 | ||
| Marsden,— | |||
| Hanan, J. A. | 4,618 | 9,338 | 14,645 |
| Lillicrap. J. F. | 3,028 | ||
| Informal | 61 | ||
| Total | 7,707 | ||
| Marsden,— | |||
| Ward, J. G. | 3,132 | 6,067 | 11,715 |
| Hamilton, J. R. | 1,906 | ||
| Informal | 34 | ||
| Total | 5,072 | ||
The abolition of the second ballot has been responsible for a large decrease in the number of candidates in 1914 as compared with 1911 and 1908. The total number of candidates in 1908 was 219, in 1911, 220, and in 1914, 174. In fifty-five of the seventy-six electorates in 1914 only two candidates went to the poll, in twenty electorates the number was three, and in one electorate (Palmerston) four.
(Polling-day, 11th December, 1911; number of polling-places, 352.)
Of a Maori population amounting to 49,844 persons at the census of 1911, 18,621 voted at the general election held in December, 1914. In 1914, when no contest was held in the Eastern Maori Electorate, the votes recorded were 11,768, or 261 more than in the remaining three electorates in 1914. In 1893 the voters, numbered 11,269, or 1,739 persons fewer than in 1896, when 13,008 Maoris recorded their votes, while at the general election held in December, 1899, the number of Maoris who voted was 13,628; in 1902 it was 14,271: in 1905, 16,045: in 1908, 16,365; and in 1914, as stated above, 18,621.
The number of votes recorded in the several districts for each candidate was.—
| Electoral Districts and Names of Candidates. | Number of Votes recorded. |
|---|---|
| Northern Maori: | |
| Tau Henare | 885 |
| Hemi te Paa | 709 |
| Riapo Timoti Puhipi | 696 |
| Nau Paraone Kawiti | 662 |
| Neho Hemi Papakakura | 382 |
| Heremia te Wake | 218 |
| Paraone Hoori | 187 |
| Anaru Ngawaka | 183 |
| Total | 3,922 |
| Eastern Maori: | |
| Apirana Turupa Ngata | 4,934 |
| Hetekia te Kani Pere | 2,109 |
| Votes disallowed | 71 |
| Total | 7,114 |
| Western Maori: | |
| Maui Pomare | 3,416 |
| Hema Ropata te Ao | 1,309 |
| Pepene Eketone | 1,074 |
| Rangi Mawhete | 703 |
| Hori Tiro Paora | 166 |
| Tuwhakaririka Patena | 125 |
| Total | 6,793 |
| Southern Maori: | |
| Taare Parata | 434 |
| Teone Matapura Erihana | 196 |
| Hapareta Rore | 162 |
| Total | 792 |
| Grand total | 18,621 |
Three by-elections have been held since the general election of December, 1914—viz., in the electorates of Dunedin Central, Bay of Islands, and Taumarunui. As in the majority of electorates at the general election, only two candidates stood for each of the three by-elections. The voting was as follows:—
| Electoral District. | Date of Election. | Names of Candidates. | Number of Votes recorded. | Number of Electors on Boll. |
|---|---|---|---|---|
| 1915. | ||||
| Dunedin Central | 3 Feb. | Statham, Charles Ernest | 4,033 | 9,413 |
| Munro, James Wright | 3,926 | |||
| Informal | 11 | |||
| Total | 7,970 | |||
| Bay of Islands | 8 June | Stewart, William | 3,264 | 6,790 |
| Menzies, George Gardiner | 2,221 | |||
| Informal | 6 | |||
| Total | 5,491 | |||
| Taumarunui | 15 June | Jennings, William Thomas | 3,899 | 9,418 |
| Wilson, Charles Kendall | 3,741 | |||
| Informal | 15 | |||
| Total | 7,655 |
The sexes of the electors on the rolls and of those who voted at the by-elections are as follows:—
| Electors on Roll. | Votes recorded. | |||
|---|---|---|---|---|
| Electoral District. | Males. | Females. | By Males. | By Females. |
| Dunedin Central | 4,503 | 4,910 | 3,758 | 4,212 |
| Bay of Islands | 4,488 | 2,302 | 3,685 | 1,806 |
| Taumarunui | 6,142 | 3,276 | 5,171 | 2,484 |
The occupations of European members show that farmers or runholders furnish more members than any other class. Twenty-nine of these were returned in 1914. There were thirteen barristers or solicitors, and five journalists. The number of members returned at each general election since 1902 was seventy-six, against seventy in 1896 and 1899:—
| Occupations. | 1896. | 1899. | 1902. | 1905. | 1908. | 1911. | 1914. |
|---|---|---|---|---|---|---|---|
| Scientist | — | — | — | — | 1 | 1 | — |
| Minister of religion | — | — | — | — | 1 | — | — |
| Law student | — | — | — | — | 1 | 1 | — |
| Secretary, Y.M.C.A. | — | — | — | 1 | 1 | — | — |
| Barrister, solicitor | 5 | 9 | 10 | 9 | 8 | 11 | 13 |
| Journalist | 9 | 8 | 5 | 5 | 6 | 4 | 5 |
| Mining advocate, interpreter, lecturer, teacher | 3 | 4 | 1 | 3 | 1 | — | — |
| Chemist | — | — | 1 | 1 | 1 | — | — |
| Dentist | — | — | — | — | — | 1 | 1 |
| Doctor of medicine | — | — | — | — | — | 1 | 1 |
| Master mariner | — | — | — | — | — | 1 | — |
| Instructor technical school | — | — | — | — | — | 1 | — |
| Hotelkeeper | — | — | 1 | — | — | — | — |
| Insurance manager | — | — | — | 1 | 1 | — | — |
| Land-broker, estate agent | — | — | 2 | 3 | 2 | 1 | 2 |
| Auctioneer | 1 | 1 | 2 | — | — | — | — |
| Director of financial company | — | 1 | 1 | 1 | 1 | — | — |
| Native agent | — | 1 | 1 | 1 | — | — | — |
| Stationer, bookseller, draper, grocer, butcher | 3 | 6 | 5 | 3 | 2 | 3 | 3 |
| Merchant, iron-merchant, timber-merchant | 3 | 2 | 4 | 3 | 5 | 6 | 7 |
| Storekeeper | 1 | 2 | 2 | 2 | 1 | — | — |
| Commission agent, clerk, accountant, commercial traveller | 3 | 2 | 3 | 3 | 2 | 3 | 4 |
| Coach-proprietor | — | — | 1 | — | — | — | — |
| Tailor, shoemaker, dyer | 2 | 2 | 3 | 3 | 1 | — | — |
| Millowner, ship-rigger, builder, metallurgical engineer, mine-manager | 4 | 2 | 2 | 2 | 1 | 2 | 1 |
| Railway employee | — | — | — | 1 | 1 | — | — |
| Blacksmith | — | — | 1 | 1 | — | — | — |
| Mechanical engineer, engine-driver | — | — | — | — | 1 | 1 | 1 |
| 'Painter, sign-writer | — | — | — | — | 1 | 2 | 1 |
| Builder and contractor | — | — | — | — | 1 | — | — |
| Secretary, Workers' Union | — | — | — | — | 1 | 1 | 1 |
| Brewer | — | — | — | — | — | 1 | — |
| Contractor | 3 | 3 | 3 | 3 | 1 | 1 | — |
| Printer, newspaper-proprietor | — | — | 2 | 1 | 2 | 1 | 2 |
| Farmer | 11 | 13 | 12 | 16 | 16 | 21 | 25 |
| Sheep-farmer, run-holder, grazier, stock-owner | 14 | 7 | 9 | 5 | 9 | 6 | 4 |
| Settler, gentleman, &c. | 8 | 7 | 5 | 8 | 7 | 6 | 5 |
A summary of the population, number of electors on the rolls, and the total number of votes recorded at each of the last eight general elections is next given:—
| Year. | Total Population at Last Census. | Total Number of Electors on Rolls. | Number of Votes recorded. | Total Number of Electors who recorded their Votes. | ||
|---|---|---|---|---|---|---|
| For Members elected. | For Candidates defeated. | Total Valid Votes. | ||||
| 1893 | 626,359 | 302,997 | 153,663 | 149,413 | 303,076 | 220,082 |
| 1896 | 703,119 | 339,230 | 184,929 | 174,475 | 359,404 | 258,254 |
| 1899 | 703,119 | 373,744 | 202,324 | 185,305 | 387,629 | 279,330 |
| 1902 | 772,504 | 415,789 | 235,083 | 181,879 | 416,962 | 318,859 |
| 1905 | 772,504 | 476,473 | 216,378 | 173,811 | 390,189 | 396,657 |
| 1908 | 888,376 | 537,003 | 233,328 | 177,178 | 410,506 | 428,648 |
| 1911 | 1,008,206 | 590,042 | 257,349 | 208,219 | 465,568 | 492,912 |
| 1914 | 1,008,206 | 616,043 | 286,433 | 229,474 | 515,917 | 521,525 |
Prior to the general election of 1905 the cities of Auckland. Wellington, Christchurch, and Dunedin each formed a single electorate returning three members, consequently every elector on the rolls of these places could exercise one vote for each of the three candidates. The total of votes recorded was therefore greatly in excess of the number of persons who voted. In 1903 these cities were divided into single electorates, each returning one member, so that now in no case may an elector vote for more than one candidate.
The difference between the totals of votes recorded and the number of electors who voted (for the last four elections) is on account of informal votes being included in the latter total, and in 1908 and 1911 on account of a number of voters recording their votes at the first ballot and not at the second.
The number of votes rejected as informal in 1914 was 5,618, as against 4,143 (second-ballot figures) in 1911. In districts where a second ballot was held in 1914 electors to the number of 23,201 voted at the first ballot but not at the second. The corresponding total for 1908 was 13,546. As stated above, there was no second ballot prior to 1908 nor in 1914.
In the succeeding table will be found a statement giving the results of each general election since the year 1853 for purposes of European representation.
| GENERAL ELECTIONS FOR EUROPEAN REPRESENTATIVES HELDSINCE THE YEAR 1853. | |||||||||
|---|---|---|---|---|---|---|---|---|---|
| Parliament. | Year of General Election. | Number of Names on Roll of Electors. | Number of Members returned. | Number of Members returned unopposed. | Numbers of Votes recorded (or of Voters recording Votes). | Estimated Population at End of Year. | Average Number of | ||
| Persons to each Member. | Persons to each Elector. | Electors to each Member. | |||||||
* Information not obtainable. 1 Including 100, the estimated number in Akaroa district, for which there is no return. 2 Including 800, the estimated number in the electorates of Town of New Plymouth. Grey and Bell, and Omata, for which districts there are no returns. 3 Electors for the Electoral District of “The Otago Goldfields” not included. 4 Men and women. 5 Voters recording votes. | |||||||||
| First | 1853 | 1 5,934 | 37 | * | * | 30,000 | 811 | 5.1 | 160 |
| Second | 1855 | 2 10,324 | 37 | * | * | 37,192 | 1,005 | 3.6 | 279 |
| Third | 1861 | 13,466 | 53 | * | * | 79,711 | 1,504 | 5.9 | 254 |
| Fourth | 1866 | 3 33,338 | 72 | * | * | 190,607 | 2,647 | 5.7 | 463 |
| Fifth | 1871 | 47,275 | 74 | * | * | 248,400 | 3,357 | 5.3 | 639 |
| Sixth | 1875 | 61,755 | 84 | * | * | 375,856 | 4,474 | 6.1 | 735 |
| Seventh | 1879 | 82,271 | 84 | 14 | 43,776 | 463,729 | 5,521 | 5.6 | 979 |
| Eighth | 1881 | 120,972 | 91 | 11 | 69,985 | 500,910 | 5,505 | 4.1 | 1,329 |
| Ninth | 1884 | 137,686 | 91 | 11 | 74,672 | 564,304 | 6,201 | 4.1 | 1,513 |
| Tenth | 1887 | 175,410 | 91 | 5 | 111,911 | 603,361 | 6,630 | 3.4 | 1,928 |
| Eleventh | 1890 | 183,171 | 70 | 6 | 136,337 | 625,508 | 8,936 | 3.4 | 2,617 |
| Twelfth | 1893 | 4 302,997 | 70 | 3 | 4 5 220,082 | 672,265 | 9,604 | 2.2 | 4,328 |
| Thirteenth | 1896 | 4 339,230 | 70 | .. | 4 5 258,254 | 714,162 | 10,202 | 2.1 | 4,853 |
| Fourteenth | 1899 | 4 373,744 | 70 | 3 | 4 5 279,330 | 756,505 | 10,807 | 2.0 | 5,339 |
| Fifteenth | 1902 | 4 415,789 | 76 | .. | 4 5 318,859 | 807,929 | 10,631 | 1.9 | 5,471 |
| Sixteenth | 1905 | 4 476,473 | 76 | .. | 4 5 396,657 | 882,462 | 11,611 | 1.9 | 6,269 |
| Seventeenth | 1908 | 4 537,003 | 76 | .. | 4 5 428,648 | 960,642 | 12,640 | 1.8 | 7,066 |
| Eighteenth | 1911 | 4 590,042 | 76 | 1 | 4 5 492,912 | 1,025,406 | 13,492 | 1.7 | 7,764 |
| Nineteenth | 1914 | 4 616,043 | 76 | .. | 4 5 521,525 | 1,095,994 | 14,421 | 1.8 | 8,106 |
Table of Contents
THE total number of persons engaged in or connected with the sale or manufacture of wine, spirits, beer, cordials, &c., was returned at the census of 1911 as under:—
| Occupation. | Males. | Females. | Persons. |
|---|---|---|---|
| Hotelkeeper | 1,207 | 166 | 1,373 |
| Relative assisting | 64 | 1,131 | 1,195 |
| Manager, clerk | 124 | 50 | 174 |
| Hotel servant | 2,036 | 2,643 | 4,679 |
| Manager, secretary, steward, servant of clubhouse | 259 | 34 | 293 |
| Barman, barmaid | 500 | 543 | 1,043 |
| Wine, spirits, ale, merchant | 64 | 1 | 65 |
| Assistant | 23 | .. | 23 |
| Clerk, book-keeper, accountant, traveller, storeman, carter | 137 | .. | 137 |
| Cordial, &c., merchant, salesman | 2 | .. | 2 |
| Brewer, bottler | 119 | 1 | 120 |
| Manager, clerk, traveller | 135 | 6 | 141 |
| Relative assisting, apprentice | 1 | .. | 1 |
| Cellarman, assistant, carter, &c. | 581 | 1 | 582 |
| Maltster and assistant | 121 | .. | 121 |
| Winemaker, bottler | 8 | .. | 8 |
| Cordial, &c., maker | 260 | 4 | 264 |
| Clerk, book-keeper, traveller, assistant | 372 | 10 | 382 |
| Relative assisting | 12 | 1 | 13 |
| Totals | 6,025 | 4,591 | 10,616 |
During the year ended the 31st March, 1914, 1,799 licenses for the sale of intoxicating liquors were granted. Of these, 1,218 were publicans' and accommodation licenses, 6 New Zealand wine, 60 packet, 157 wholesale, and 358 conditional licenses. The fees paid amounted to £42,283, and formed part of the revenue of the local governing bodies of the districts in which the licenses were issued. Particulars are given in the following table:—
| NUMBER OF LICENSES GRANTEDDURING THE YEAR 1913–14, AND THE AMOUNT OF FEES PAIDTO LOCAL BODIES THEREFOR. | ||||
|---|---|---|---|---|
| Licenses. | In Counties. | In Boroughs. | In Town Districts. | Total. |
| Publicans' licenses | 392 | 598 | 38 | 1,028 |
| Accommodation licenses | 186 | .. | 4 | 190 |
| Total licensed houses | 578 | 598 | 42 | 1,218 |
| New Zealand wine licenses | 1 | 5 | .. | 6 |
| Packet licenses | 5 | 55 | .. | 60 |
| Wholesale licenses | 11 | 145 | 1 | 157 |
| Conditional licenses | 235 | 119 | 4 | 358 |
| Total licenses granted | 830 | 922 | 47 | 1,799 |
| Amount of license fees paid to local bodies | £12,860 | £27,859 | £1,564 | £42,283 |
The number of publicans' and accommodation licenses granted in counties, boroughs, and independent town districts during each of the past ten years is given, together with the total amount of fees paid for all licenses for the sale of intoxicating liquor.
| Year ended 31st March. | Counties. | Boroughs. | Town Districts. | Total. | Total Fees. |
|---|---|---|---|---|---|
*Included in figures for counties. | |||||
| £ | |||||
| 1905 | 767 | 648 | * | 1,415 | 50,558 |
| 1906 | 765 | 657 | * | 1,422 | 51,144 |
| 1907 | 710 | 628 | 29 | 1,367 | 48,865 |
| 1908 | 704 | 630 | 30 | 1,364 | 48,775 |
| 1909 | 695 | 635 | 34 | 1,364 | 49,017 |
| 1910 | 643 | 580 | 34 | 1,257 | 44,900 |
| 1911 | 630 | 582 | 36 | 1,248 | 43,843 |
| 1912 | 617 | 590 | 28 | 1,235 | 42,572 |
| 1913 | 594 | 592 | 32 | 1,218 | 42,456 |
| 1914 | 578 | 598 | 42 | 1,218 | 42,283 |
The average number of persons to each licensed house in counties, boroughs, and independent town districts respectively for 1913–14 is next shown:—
| Number of Licensed Houses.* | Estimated Population. | Number of Persons to each Licensed House. | |
|---|---|---|---|
* I.e., houses holding publicans' or accommodation licenses. | |||
| Counties | 578 | 494,947 | 856 |
| Boroughs | 598 | 569,614 | 954 |
| Town districts | 42 | 25,034 | 596 |
| Totals | 1,218 | 1,089,595 | 895 |
The average number of persons to a licensed house increased from 824 in 1911–12 to 852 in 1912–13 and 895 in 1913–14.
The annual fees paid for licenses are—
| (1.) For a publican's license— | £ |
|---|---|
| (a.) Within the limits of a borough or town district | 40 |
| (b.) Outside the aforesaid limits | 25 |
| (2.) For a New Zealand wine license | 1 |
| (3.) For an accommodation license, a sum to be determined by the Licensing Committee, not exceeding | 20 |
| (4.) For a packet license— | |
| (a.) For a vessel exceeding 50 tons register | 10 |
| (b.) For a vessel not exceeding 50 tons register | 5 |
| (5.) For a wholesale license | 20 |
| (6.) For a conditional license, according to duration of license, a sum not exceeding | 30 |
The approximate capital value of the licensed houses in the counties for the year ended 31st March, 1914, was stated at £673,430, in certain of the boroughs at £1,391,976, and in the town districts at £101,935. There was, besides, an annual value of £124,919 for other licensed houses in the boroughs, which, capitalized at 6 per cent., would represent £2,081,983. The capital value of all licensed houses would therefore be about £4,249,324.
During 1914 there were 78 convictions (69 of males, 9 of females) against publicans and 2,647 convictions (2,378 of males and 269 of females) against others for breaches of the licensing laws.
There were 169 charges of selling liquor without a license (including storing liquor for sale) investigated in 1914 in the Magistrates' Courts with the following results: 21 were discharged for want of prosecution or want of evidence. 40 dismissed on the merits, and 108 convicted.
The fines imposed on sly-grog sellers during 1914 amounted to £2,547, as against £1,714 in 1913.
Each electoral district constituted in New Zealand for the election of a member of the House of Representatives is a licensing district, and electors for the House of Representatives are also electors under the licensing laws. Three of the electorates in the four chief centres. Auckland (Fast. Central, and West). Wellington (North. Central, and Fast). Christchurch (North, East', and South), and Dunedin (North, Central, and West) in each case form one electorate for the purpose of taking a local-option poll.
The local no-license and national-prohibition polls are taken on the same day as the general election of members of the House of Representatives.
At every licensing poll there is submitted for the determination of the electors of every licensing district (other than a no-license district) the question whether licenses shall continue in that district.
The method of determining the result of the poll in each district by the Returning Officer is as follows:—
If the number of votes recorded in favour of the continuance of existing licenses is an absolute majority of all the voters whose votes were recorded, the proposal is deemed to be carried, and the licenses continue until the next poll, subject to certain provisions in special cases.
If the number of votes recorded in favour of the proposal that no license shall be granted is not less than three-fifths of all the voters whose votes were recorded, the proposal is declared to be carried.
If neither of the proposals respecting licenses is carried by the prescribed majority, the licenses continue as they are until next poll, subject to certain provisions in special cases.
If, as the result of a previous decision, there are no licenses existing in a district, the questions submitted to the electors of such district shall be whether licenses be restored or not restored, but a three-fifths majority in favour of restoration is needed in order to carry that issue.
When the population of any riding or county in which the Counties Act, 1908, is in force, or any road district outside of any such county, has increased in a large degree, and a petition signed by not less than 100 residents thereof has been presented to the Governor praying that power be granted to the Licensing Committee to issue publicans' licenses, the Governor may, unless the determination of the electors has been previously made that no licenses shall be granted, by Order in Council grant such authority, and thereupon publicans' licenses may be granted in the said riding or road district, at the ratio of one licensed house to every 700 persons residing within a radius of two miles from such licensed house.
The Licensing Act provides for a poll to be taken on the question of national prohibition, in addition to the local-option poll. If the total number of votes recorded in favour of national prohibition is not loss than three-fifths of the total number of the votes so recorded throughout New Zealand, the determination of the electors shall be deemed to be in favour of national prohibition: and this determination shall, when it comes into force, supersede the determination of the electors of any licensing district. Any such determination in favour of national prohibition shall come into force on the expiration of four years after the date of the general election on which the licensing polls were taken, and shall remain in force until superseded by a determination of the electors in favour of restoration.
At the first general election of members of Parliament held after the expiration of three years from the day of the coming into force of any determination of the electors in favour of national prohibition, and at every general election thereafter so long as that determination remains in force, a licensing poll shall be taken, and at that poll there shall be submitted to the electors of each licensing district the question whether licenses shall be restored in the Dominion. If the result of the polls is that the total number of votes recorded in favour of the proposal that licenses be restored is not less than three-fifths of all the votes recorded, then that proposal shall be deemed to be carried. Any determination in favour of restoration shall come into force on the expiration of three months after the poll has been taken.
Under the Licensing Amendment Act of 1910 no female is permitted to serve in any capacity in the bar of any licensed premises while the bar is open for the sale of liquor, with the exception of (a) the wife, sister, or daughter of the licensee: (b) the licensee, being a woman; (c) any person registered as a barmaid. The Barmaids Registration Act. 1912, prohibits the employment of unregistered barmaids in private as well as in public bars. Under the latter Act registration of barmaids cannot be effected after 1st June. 1913.
The local-option poll taken on the 10th December, 1914, did not result in any alteration of the position in licensing districts. No-license was not carried in any license district, nor was restoration carried in any no-license district. The national-prohibition poll resulted in 257,442 votes being recorded for continuance and 247,217 for prohibition. The details of the voting were as follows:—
| Local Option. | National Prohibition. | ||||||
|---|---|---|---|---|---|---|---|
| District. | Number of Electors on Roll. | For Continuance. | For No-license. | Total Valid Votes. | For Continuance. | or Prohibition. | Total Valid Votes. |
* For restoration. | |||||||
| LICENSE DISTRICTS. | |||||||
| Bay of Islands | 7,227 | 3,235 | 2,755 | 5,990 | 3,100 | 2,918 | 6,018 |
| Marsden | 7,288 | 2,798 | 3,037 | 5,835 | 2,591 | 3,276 | 5,867 |
| Kaipara | 7,076 | 3,029 | 2,896 | 5,925 | 2,749 | 3,194 | 5,943 |
| Waitemata | 10,444 | 4,242 | 4,370 | 8,612 | 4,097 | 4,510 | 8,607 |
| Auckland | 28,755 | 12,671 | 9,908 | 22,579 | 12,140 | 10,357 | 22,497 |
| Parnell | 11,287 | 4,560 | 4,575 | 9,135 | 4,466 | 4,653 | 9,119 |
| Manukau | 11,103 | 4,372 | 4,831 | 9,203 | 4,272 | 4,918 | 9,190 |
| Franklin | 7,953 | 3,150 | 3,383 | 6,533 | 2,993 | 3,565 | 6,558 |
| Raglan | 7,934 | 3,135 | 3,383 | 6,518 | 2,887 | 3,639 | 6,526 |
| Thames | 6,764 | 2,877 | 2,774 | 5,651 | 2,494 | 3,167 | 5,661 |
| Tauranga | 8,051 | 3,517 | 3,143 | 6,660 | 3,141 | 3,564 | 6,705 |
| Waikato | 9,796 | 3,848 | 3,903 | 7,751 | 3,352 | 4,500 | 7,852 |
| Bay of Plenty | 8,816 | 4,207 | 2,698 | 6,905 | 3,807 | 3,178 | 6,985 |
| Taumarunui | 9,609 | 4,597 | 2,788 | 7,385 | 4,413 | 3,254 | 7,667 |
| Gisborne | 10,013 | 4,707 | 3,269 | 7,976 | 4,215 | 3,872 | 8,087 |
| Hawke's Bay | 10,245 | 4,748 | 3,250 | 7,998 | 4,180 | 3,882 | 8,062 |
| Napier | 8,787 | 4,404 | 2,678 | 7,082 | 4,067 | 3,051 | 7,118 |
| Waipawa | 7,558 | 3,628 | 2,564 | 6,192 | 3,299 | 2,948 | 6,247 |
| Pahiatua | 6,241 | 2,852 | 2,124 | 4,976 | 2,561 | 2,413 | 4,974 |
| Wairarapa | 7,149 | 3,808 | 2,271 | 6,079 | 3,483 | 2,559 | 6,042 |
| Stratford | 6,200 | 2,445 | 2,416 | 4,861 | 2,180 | 2,725 | 4,905 |
| Taranaki | 7,440 | 3,123 | 3,004 | 6,127 | 2,712 | 3,475 | 6,187 |
| Egmont | 6,436 | 2,765 | 2,692 | 5,457 | 2,412 | 3,066 | 5,478 |
| Patea | 7,877 | 3,411 | 3,020 | 6,431 | 3,023 | 3,477 | 6,500 |
| Wanganui | 9,344 | 4,331 | 3,308 | 7,639 | 3,777 | 3,906 | 7,683 |
| Waimarino | 9,184 | 3,883 | 2,132 | 6,015 | 3,630 | 2,422 | 6,052 |
| Oroua | 6,526 | 2,930 | 2,359 | 5,289 | 2,544 | 2,750 | 5,294 |
| Rangitikei | 6,528 | 3,098 | 2,115 | 5,213 | 2,868 | 2,394 | 5,262 |
| Palmerston | 8,913 | 3,968 | 3,032 | 7,000 | 3,554 | 3,519 | 7,073 |
| Otaki | 6,552 | 3,020 | 2,213 | 5,233 | 2,960 | 2,299 | 5,259 |
| Hutt | 8,443 | 4,248 | 2,661 | 6,909 | 3,870 | 3,067 | 6,937 |
| Wellington | 29,141 | 14,626 | 9,141 | 23,767 | 13,891 | 9,782 | 23,673 |
| Nelson | 7,779 | 3,819 | 2,725 | 6,544 | 3,600 | 2,907 | 6,507 |
| Motueka | 5,985 | 3,055 | 1,729 | 4,784 | 2,850 | 1,879 | 4,729 |
| Buller | 6,597 | 2,601 | 2,618 | 5,219 | 2,336 | 2,881 | 5,217 |
| Grey | 7,843 | 3,836 | 2,753 | 6,589 | 3,466 | 3,118 | 6,584 |
| Westland | 6,474 | 3,437 | 1,973 | 5,410 | 3,135 | 2,266 | 5,401 |
| Wairau | 7,766 | 3,961 | 2,539 | 6,500 | 3,780 | 2,732 | 6,512 |
| Hurunui | 6,015 | 3,136 | 1,749 | 4,885 | 2,956 | 1,918 | 4,874 |
| Kaiapoi | 6,887 | 3,067 | 2,811 | 5,878 | 2,877 | 2,992 | 5,869 |
| Christchurch | 28,642 | 13,537 | 10,979 | 24,516 | 12,635 | 11,836 | 24,471 |
| Riccarton | 8,693 | 4,140 | 3,240 | 7,380 | 3,897 | 3,426 | 7,323 |
| Avon | 9,673 | 4,329 | 3,968 | 8,297 | 4,060 | 4,247 | 8,307 |
| Lyttelton | 8,419 | 3,688 | 3,206 | 6,894 | 3,483 | 3,418 | 6,901 |
| Ellesmere | 6,622 | 3,055 | 2,362 | 5,417 | 2,912 | 2,458 | 5,370 |
| Selwyn | 6,384 | 3,201 | 2,234 | 5,435 | 3,070 | 2,316 | 5,386 |
| Timaru | 9,075 | 3,988 | 3,407 | 7,395 | 3,561 | 3,819 | 7,380 |
| Temuka | 6,699 | 3,089 | 2,458 | 5,547 | 2,858 | 2,666 | 5,524 |
| Waitaki | 6,622 | 3,018 | 2,832 | 5,850 | 2,732 | 3,123 | 5,855 |
| Otago Central | 6,923 | 3,339 | 2,359 | 5,698 | 3,044 | 2,613 | 5,657 |
| Dunedin | 27,708 | 12,499 | 10,314 | 22,813 | 11,708 | 11,033 | 22,741 |
| Dunedin South | 9,726 | 4,604 | 3,375 | 7,979 | 4,298 | 3,656 | 7,954 |
| Chalmers | 7,626 | 3,200 | 3,025 | 6,225 | 2,933 | 3,209 | 6,142 |
| Wakatipu | 5,705 | 2,750 | 1,772 | 4,522 | 2,584 | 1,915 | 4,499 |
| Wallace | 6,230 | 2,998 | 2,034 | 5,032 | 2,791 | 2,215 | 5,006 |
| Awarua | 6,067 | 2,308 | 2,308 | 4,916 | 2,425 | 2,457 | 4,882 |
| Totals | 520,840 | 237,188 | 187,463 | 424,651 | 219,719 | 205,400 | 425,119 |
| NO-LICENSE DISTRICTS. | |||||||
| Eden | 11,239 | *3,193 | 6,257 | 9,450 | 3,477 | 6,028 | 9,505 |
| Grey Lynn | 9,994 | *3,290 | 5,193 | 8,483 | 3,495 | 5,051 | 8,546 |
| Ohinemuri | 6,554 | *2,912 | 2,693 | 5,605 | 2,562 | 3,045 | 5,607 |
| Masterton | 7,590 | *3,478 | 2,753 | 6,231 | 3,331 | 2,895 | 6,226 |
| Wellington South | 8,835 | *3,714 | 3,634 | 7,348 | 3,788 | 3,624 | 7,412 |
| Wellington Suburbs and Country Districts | 7,858 | *2,939 | 3,328 | 6,267 | 3,213 | 3,152 | 6,365 |
| Ashburton | 7,098 | *3,511 | 2,611 | 6,122 | 3,449 | 2,683 | 6,132 |
| Oamaru | 7,516 | *3,124 | 3,256 | 6,380 | 3,166 | 3,203 | 6,369 |
| Bruce | 6,534 | *2,512 | 2,872 | 5,384 | 2,663 | 2,712 | 5,375 |
| Clutha | 6,180 | *2,273 | 2,658 | 4,931 | 2,359 | 2,599 | 4,958 |
| Mataura | 6,467 | *2,585 | 2,901 | 5,486 | 2,564 | 2,927 | 5,491 |
| Invercargill | 9,338 | *3,686, | 3,855 | 7,541 | 3,656 | 3,898 | 7,554 |
| Totals | 95,203 | *37,217 | 42,011 | 79,228 | 37,723 | 41,817 | 79,540 |
| Grand totals | 616,043 | 274,405 | 229,474 | 503,879 | 257,442 247,217 504,659 | ||
From the foregoing table it will be seen that in connection with the local-option poll 237,188 votes were recorded in favour of continuing existing licenses—not including twelve districts, where 37,217 votes were recorded for the restoration of the licenses cancelled at the polls taken in previous years. The number of votes cast for no-license was 229,474 (including 41,817 votes cast for non-restoration in no-license districts).
In only eight of the fifty-six license districts was a majority of votes recorded in favour of no-license, and in no case was the majority sufficient to carry the proposal. In four of the no-license districts a majority of the votes recorded was in favour of restoration, but the three-fifths majority was not obtained in any case. These figures, taken in conjunction with previous polls, indicate a falling-off in the voting for no-license. In 1908 the number of license districts having a majority of votes recorded for no-license was 38: in 1911, 25: and in 1914, as above stated, only 8.
A comparison for the last seven no-license polls of the votes recorded and the number of persons who went to the poll is shown in the next table:
| Year. | Number of Persons on Bolls. | Number of Persons who recorded Votes (including informal). | Votes recorded for | ||||
|---|---|---|---|---|---|---|---|
| Males. | Females. | Totals. | Continuance. | Reduction. | No-license. | ||
* Reduction issue has not been submitted to electors since 1908. | |||||||
| 1896 | 339,230 | 151,235 | 108,663 | 259,898 | 139,580 | 94,555 | 98,312 |
| 1899 | 373,744 | 163,006 | 122,419 | 285,425 | 143,961 | 109,450 | 120,542 |
| 1902 | 415,789 | 180,294 | 138,565 | 318,859 | 148,449 | 132,240 | 151,524 |
| 1905 | 476,473 | 221,674 | 174,743 | 396,417 | 182,884 | 151,057 | 198,768 |
| 1908 | 537,003 | 235,554 | 186,399 | 421,953 | 188,140 | 162,562 | 221,471 |
| 1911 | 590,042 | 271,054 | 221,858 | 492,912 | 237,025 | * | 234,656 |
| 1914 | 616,043 | 286,799 | 234,726 | 521,525 | 274,405 | * | 229,474 |
The increases in the number of votes recorded for no-license or reduction up to the year 1908 are prominent features in the above table, while the figures for the 1911 poll show a majority for continuance of 2,369, and for 1914 of 52,073.
The table following shows the districts in which no-license has been carried, with particulars of votes for no-license and continuance (omitting votes for reduction), and of votes for and against the restoration of licenses at the last three polls:—
| District. | No-license carried. | Voting on Restoration Issue at Poll of | |||||||
|---|---|---|---|---|---|---|---|---|---|
| Year. | Votes for. | Votes Against. | 1908. | 1911. | 1914. | ||||
| For. | Against. | For. | Against. | For. | Against. | ||||
| Clutha | 1893 | 1,642 | 487 | 981 | 1,839 | 2,067 | 2,723 | 2,273 | 2,658 |
| Ashburton | 1902 | 2,870 | 1,734 | 3,085 | 2,636 | 3,175 | 2,709 | 3,511 | 2,611 |
| Mataura | 1902 | 2,939 | 1,877 | 2,013 | 2,544 | 2,402 | 2,828 | 2,585 | 2,901 |
| Grey Lynn | 1905 | 3,426 | 1,941 | 2,050 | 5,076 | 2,031 | 4,768 | 3,290 | 5,193 |
| Oamaru | 1905 | 3,142 | 1,818 | 1,946 | 2,849 | 2,890 | 3,295 | 3,124 | 3,256 |
| Invercargill | 1905 | 3,409 | 2,573 | 2,394 | 3,046 | 3,344 | 3,888 | 3,686 | 3,855 |
| Eden | 1908 | 4,057 | 2,249 | .. | .. | 2,012 | 4,511 | 3,193 | 6,257* |
| Ohinemuri | 1908 | 3,333 | 2,035 | .. | .. | 3,073 | 2,958 | 2,912 | 2,693 |
| Masterton | 1908 | 3,287 | 2,111 | .. | .. | 3,044 | 2,875 | 3,478 | 2,753 |
| Wellington South | 1908 | 4,054 | 2,241 | ., | .. | 3,035 | 3,979 | 3,714 | 3,634 |
| Wellington Suburbs and Country Districts | 1908 | 4,334 | 2,448 | .. | .. | 2,648 | 3,305 | 2,939 | 3,328 |
| Bruce | 1908 | 2,988 | 1,872 | .. | .. | 2,381 | 3,179 | 2,512 | 2,872 |
The voting for restoration in Clutha in 1896 was 1,618 for and 1,989 against; in 1899, 1,393 for and 2,170 against; in 1902, 1,368 for and 2,245 against: and in 1905, 1,495 for and 2,536 against.
The figures for Ashburton for 1905 are: For restoration, 2,663; for no-license, 2,458. In Mataura, in 1905, votes recorded for restoration numbered 2,048, and for no-license 2,995.
There seems to be a willingness on the part of electors in most of the no-license districts to let the existing system continue. It is noted, however, that of the valid votes recorded in the twelve no-license districts in 1914 46.97 per cent. were for restoration, as against 43.83 per cent. in 1911.
Coming now to the national-prohibition polls of 1911 and 1914, it is seen that fewer votes were recorded for the proposal in 1914 than in 1911, though the total number of valid votes was considerably higher. The figures for the two polls are,—
| Votes recorded for | Percentage of Total. | |||
|---|---|---|---|---|
| Year of Poll. | Prohibition. | Continuance. | Prohibition. | Continuance. |
| 1911 | 259,943 | 205,661 | 55.83 | 44.17 |
| 1914 | 247,217 | 257,442 | 48.99 | 51.01 |
An actual majority of the valid votes recorded were for national prohibition in 31 of the 68 districts in 1914, as against 59 in 1911.
A comparison with the local-option poll shows that in 1914 16,963 more votes were cast for local continuance or restoration than against national prohibition, and 17,743 more votes were recorded for national prohibition than for local no-license. The corresponding figures for 1911 were 31,364 and 25,287.
Table of Contents
FROM the very earliest times New Zealand has inevitably been dependent upon foreign intercourse for its development and progress. The first European residents in New Zealand seem to have been the small party of sealers from Sydney who settled at Dusky Sound for ten months in 1792–93, and built there the first vessel made from local timber. The seals and whales of the South Seas seem to have attracted the first attention to the Islands as a convenient depot, and by 1800 there were established many little settlements where the blubber was tried out. In 1794 the timber trade was inaugurated by the visit of the “Fancy,” and the export of timber, mainly kahikatea (white-pine), rapidly grew to goodly proportions. The native flax (Phormium tenax) was also early recognized as a source of wealth, and a considerable export arose.
Thus, irregularly, the settlement of New Zealand went hand in hand with external trade, and was indeed promoted by the hope of commercial gain. The small community which grew up mainly in the northern peninsula was adventurous and lawless in the extreme. The early exports were all local products, as enumerated above, with the gruesome addition of the tattooed Maori heads, while the imports were mainly muskets and powder.
The arrival of the New Zealand Company's expedition in 1840 stimulated the development of a more stable trade—wool had been exported to Hobart in 1838—and gradually the exports and imports of New Zealand took on their modern form. In 1852 the young colony was granted representative government, and from that date there is an accurate record of the external trade of the country. By 1856 full responsible or cabinet government was established.
By 1853 the export of flax had been practically ruined owing to increased competition from other sources, and the amount exported in that year was negligible. Timber, however, retained its place as a principal export, supplying 31 per cent. of the total exports (£93,000), while wool had increased to £66,507 (22 per cent.); the value of grain exported was small, only £19,000 (6 per cent.); oil amounted to £22,000, and potatoes to £30,000. The total exports in 1853 were £303,282, and the total imports £597,827.
The following table shows the increase in the total trade since the year 1853:—
| TOTAL TRADE, IMPORTS AND EXTORTS OF NEW ZEALAND, 1853–1914. | ||||||||||||
|---|---|---|---|---|---|---|---|---|---|---|---|---|
| Year. | Total Virtue. | Value per Head. | ||||||||||
| Total Trade. | Imports. | Exports. | Total Trade. | Imports. | Exports. | |||||||
| £ | £ | £ | £ | s. | d. | £ | s. | d. | £ | s. | d. | |
| 1853 | 901,110 | 597,828 | 303,282 | 30 | 0 | 9 | 19 | 10 | 7 | 10 | 2 | 2 |
| 1854 | 1,212,092 | 891,201 | 320,891 | 38 | 15 | 1 | 28 | 9 | 11 | 10 | 5 | 2 |
| 1855 | 1,179,328 | 813,460 | 365,868 | 33 | 16 | 4 | 23 | 6 | 6 | 10 | 9 | 10 |
| 1856 | 1,029,302 | 710,869 | 318,433 | 24 | 17 | 8 | 17 | 3. | 8 | 7 | 14 | 0 |
| 1857 | 1,362,390 | 992,995 | 369,395 | 28 | 11 | 7 | 20 | 16 | 7 | 7 | 15 | 0 |
| 1858 | 1,599,296 | 1,141,273 | 458,023 | 29 | 5 | 9 | 20 | 18 | 0 | 8 | 7 | 9 |
| 1859 | 2,102,514 | 1,551,030 | 551,484 | 32 | 2 | 0 | 23 | 13 | 7 | 8 | 8 | 5 |
| 1860 | 2,137,286 | 1,548,333 | 588,953 | 28 | 5 | 0 | 20 | 9 | 4 | 7 | 15 | 8 |
| 1861 | 3,864,058 | 2,493,811 | 1,370,247 | 43 | 4 | 9 | 27 | 18 | 1 | 15 | 6 | 8 |
| 1862 | 7,048,816 | 4,626,082 | 2,422,734 | 62 | 14 | 1 | 41 | 3 | 0 | 21 | 11 | 1 |
| 1863 | 10,510,079 | 7,024,674 | 3,485,405 | 72 | 10 | 5 | 48 | 9 | 5 | 24 | 1 | 0 |
| 1864 | 10,402,322 | 7,000,655 | 3,401,667 | 61 | 17 | 8 | 41 | 12 | 11 | 20 | 4 | 9 |
| 1865 | 9,308,195 | 5,594,977 | 3,713,218 | 51 | 6 | 4 | 30 | 16 | 11 | 20 | 9 | 5 |
| 1866 | 10,414,937 | 5,894,863 | 4,520,074 | 52 | 15 | 5 | 29 | 17 | 5 | 22 | 18 | 1 |
| 1867 | 9,989,285 | 5,344,607 | 4,644,678 | 47 | 5 | 1 | 25 | 5 | 8 | 21 | 19 | 5 |
| 1868 | 9,414,946 | 4,985,748 | 4,429,198 | 42 | 5 | 9 | 22 | 7 | 11 | 19 | 17 | 11 |
| 1869 | 9,200,986 | 4,976,126 | 4,224,860 | 39 | 13 | 5 | 21 | 9 | 1 | 18 | 4 | 4 |
| 1870 | 9,461,771 | 4,639,015 | 4,822,756 | 38 | 19 | 3 | 19 | 2 | 1 | 19 | 17 | 2 |
| 1871 | 9,360,277 | 4,078,193 | 5,282,084 | 35 | 18 | 3 | 15 | 12 | 11 | 20 | 5 | 4 |
| 1872 | 10,333,616 | 5,142,951 | 5,190,665 | 37 | 16 | 3 | 18 | 16 | 5 | 18 | 19 | 10 |
| 1873 | 12,075,058 | 6,464,687 | 5,610,371 | 41 | 19 | 3 | 22 | 9 | 4 | 19 | 9 | 11 |
| 1874 | 13,373,081 | 8,121,812 | 5,251,209 | 41 | 14 | 0 | 25 | 6 | 6 | 16 | 7 | 6 |
| 1875 | 13,857,799 | 8,029,172 | 5,828,627 | 38 | 12 | 3 | 22 | 7 | 6 | 16 | 4 | 9 |
| 1876 | 13,578,636 | 6,905,171 | 5,673,465 | 32 | 9 | 3 | 17 | 16 | 5 | 14 | 12 | 10 |
| 1877 | 13,300,890 | 6,973,418 | 6,327,472 | 32 | 11 | 5 | 17 | 1 | 6 | 15 | 9 | 11 |
| 1878 | 14,771,363 | 8,755,663 | 6,015,700 | 34 | 17 | 7 | 20 | 13 | 6 | 14 | 4 | 1 |
| 1879 | 14,117,711 | 8,374,585 | 5,743,126 | 31 | 10 | 1 | 18 | 13 | 9 | 12 | 16 | 4 |
| 1880 | 12,514,703 | 6,162,011 | 6,352,692 | 26 | 7 | 8 | 12 | 19 | 10 | 13 | 7 | 10 |
| 1881 | 13,517,911 | 7,457,045 | 6,060,866 | 27 | 7 | 11 | 15 | 2 | 3 | 12 | 5 | 8 |
| 1882 | 15,267,278 | 8,609,270 | 6,658,008 | 29 | 19 | 6 | 16 | 18 | 1 | 13 | 1 | 5 |
| 1883 | 15,070,037 | 7,974,038 | 7,095,999 | 28 | 9 | 5 | 15 | 1 | 3 | 13 | 8 | 2 |
| 1884 | 14,755,555 | 7,663,888 | 7,091,667 | 26 | 14 | 0 | 13 | 17 | 4 | 12 | 16 | 8 |
| 1885 | 14,299,860 | 7,479,921 | 6,819,939 | 25 | 6 | 2 | 13 | 4 | 9 | 12 | 1 | 5 |
| 1886 | 13,431,804 | 6,759,013 | 6,672,791 | 23 | 1 | 5 | 11 | 12 | 2 | 11 | 9 | 3 |
| 1887 | 13,111,684 | 6,245,515 | 6,866,169 | 21 | 19 | 8 | 10 | 9 | 5 | 11 | 10 | 3 |
| 1888 | 13,709,225 | 5,941,900 | 7,767,325 | 22 | 12 | 11 | 9 | 16 | 4 | 12 | 16 | 7 |
| 1889 | 15,650,727 | 6,308,863 | 9,341,864 | 25 | 9 | 11 | 10 | 5 | 6 | 15 | 4 | 5 |
| 1890 | 16,072,245 | 6,260,525 | 9,811,720 | 25 | 13 | 10 | 10 | 0 | 2 | 15 | 13 | 8 |
| 1891 | 16,070,246 | 6,503,849 | 9,566,397 | 25 | 10 | 4 | 10 | 6 | 6 | 15 | 3 | 10 |
| 1892 | 16,477,907 | 6,943,056 | 9,534,851 | 25 | 13 | 2 | 10 | 16 | 3 | 14 | 16 | 11 |
| 1893 | 15,896,879 | 6,911,515 | 8,985,364 | 24 | 0 | 9 | 10 | 9 | 0 | 13 | 11 | 9 |
| 1894 | 16,019,067 | 6,788,020 | 9,231,047 | 23 | 11 | 9 | 9 | 19 | 11 | 13 | 11 | 10 |
| 1895 | 14,930,353 | 6,400,129 | 8,550,224 | 21 | 11 | 10 | 9 | 4 | 10 | 12 | 7 | 0 |
| 1896 | 16,458,425 | 7,137,320 | 9,321,105 | 23 | 5 | 8 | 10 | 1 | 11 | 13 | 3 | 9 |
| 1897 | 18,072,216 | 8,055,223 | 10,016,993 | 25 | 0 | 11 | 11 | 3 | 3 | 13 | 17 | 8 |
| 1898 | 18,748,555 | 8,230,600 | 10,517,955 | 25 | 9 | 3 | 11 | 3 | 7 | 14 | 5 | 8 |
| 1899 | 20,677,968 | 8,739,633 | 11,938,335 | 27 | 11 | 5 | 11 | 13 | 1 | 15 | 18 | 4 |
| 1900 | 23,892,257 | 10,646,096 | 13,246,161 | 31 | 5 | 9 | 13 | 18 | 10 | 17 | 6 | 11 |
| 1901 | 24,699,339 | 11,817,915 | 12,881,424 | 31 | 15 | 0 | 15 | 3 | 10 | 16 | 11 | 2 |
| 1902 | 24,971,700 | 11,326,723 | 13,644,977 | 31 | 6 | 0 | 14 | 3 | 11 | 17 | 2 | 1 |
| 1903 | 27,799,053 | 12,788,675 | 15,010,378 | 33 | 17 | 10 | 15 | 11 | 10 | 18 | 0 | 0 |
| 1904 | 28,040,042 | 13,291,694 | 14,748,348 | 33 | 3 | 8 | 15 | 14 | 7 | 17 | 9 | 1 |
| 1905 | 28,484,804 | 12,828,857 | 15,655,947 | 32 | 14 | 10 | 14 | 14 | 11 | 17 | 19 | 11 |
| 1906 | 33,306,540 | 15,211,403 | 18,095,137 | 37 | 3 | 9 | 16 | 19 | 8 | 20 | 4 | 1 |
| 1907 | 37,371,818 | 17,302,861 | 20,068,957 | 40 | 13 | 3 | 18 | 16 | 6 | 21 | 16 | 9 |
| 1908 | 33,788,778 | 17,471,284 | 16,317,494 | 35 | 15 | 1 | 18 | 9 | 9 | 17 | 5 | 4 |
| 1909 | 35,336,715 | 15,674,719 | 19,661,996 | 36 | 7 | 3 | 16 | 2 | 7 | 20 | 4 | 8 |
| 1910 | 39,231,792 | 17,051,583 | 22,180,209 | 39 | 10 | 4 | 17 | 3 | 6 | 22 | 6 | 10 |
| 1911 | 38,574,369 | 19,545,879 | 19,028,490 | 38 | 0 | 2 | 19 | 5 | 2 | 18 | 15 | 0 |
| 1912 | 42,747,155 | 20,976,574 | 21,770,581 | 41 | 2 | 10 | 20 | 3 | 9 | 20 | 19 | 1 |
| 1913 | 45,275,024 | 22,288,302 | 22,986,722 | 42 | 7 | 3 | 20 | 17 | 1 | 21 | 10 | .2 |
| 1914 | 48,117,543 | 21,856,096 | 26,261,447 | 44 | 2 | 8 | 20 | 0 | 11 | 24 | 1 | 9 |

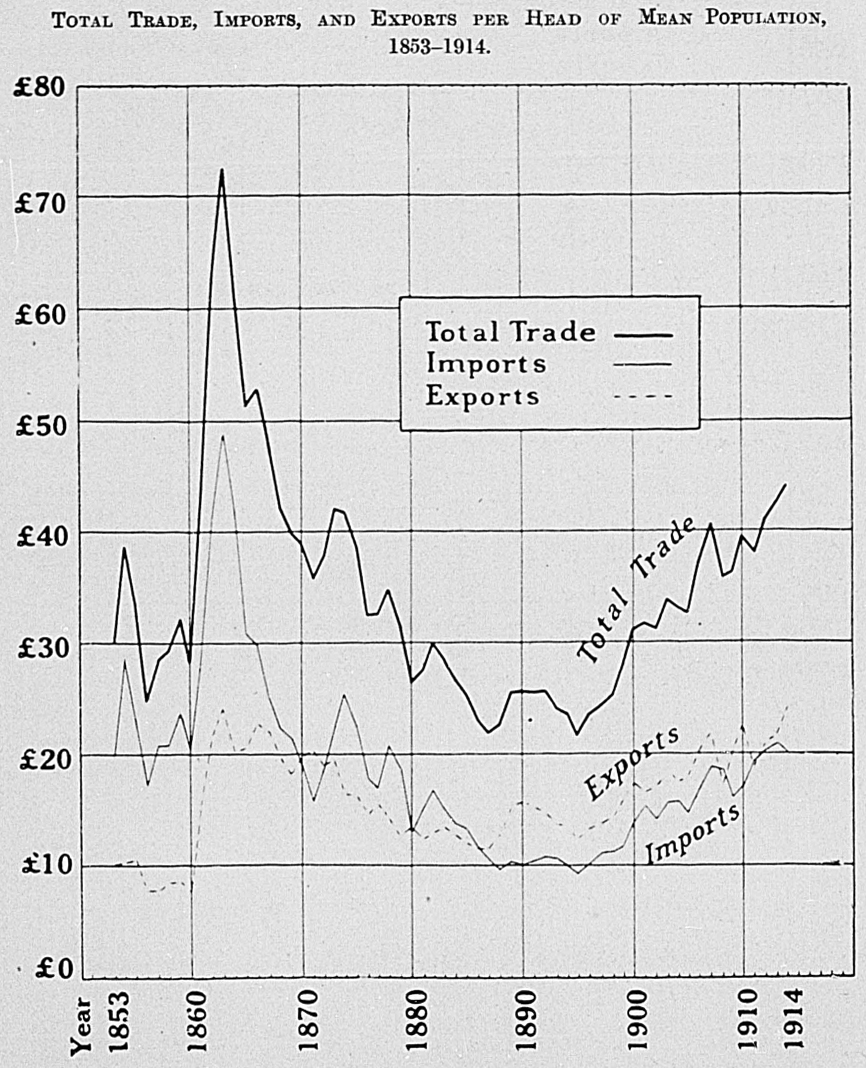
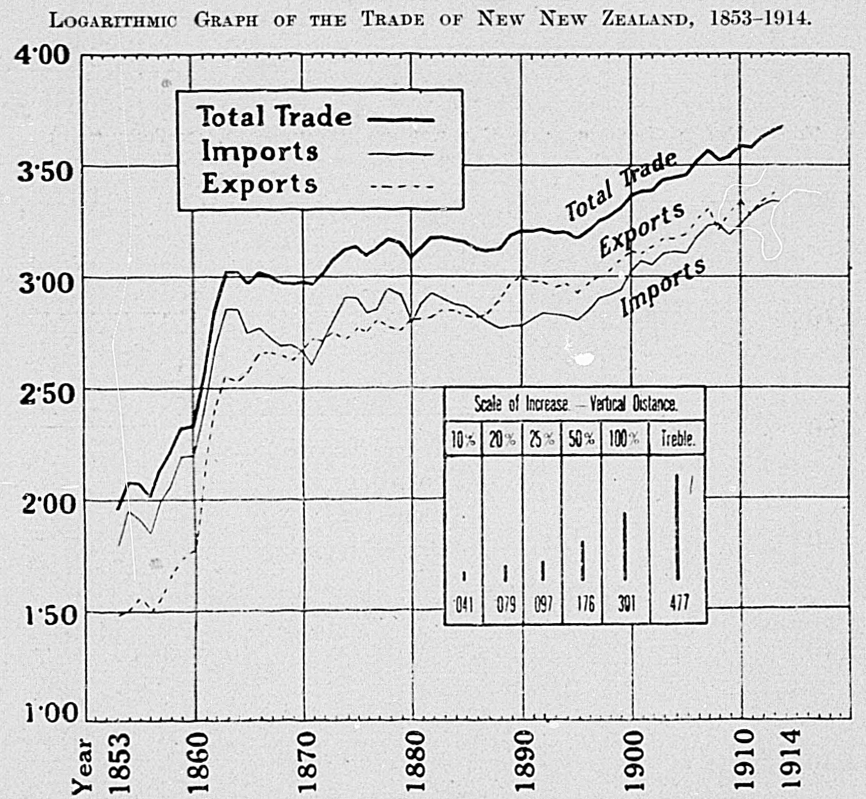
The graph representing the external trade of New Zealand bears on its surface the economic history of the Dominion. A low and fluctuating level of trade was turned in 1860–63 into a rapidly increasing volume by the effect of the gold-discoveries which occurred in the early “sixties.” Both imports and exports were stimulated, the former to feed and clothe an ever-increasing population, the latter by the export of gold.
Trade remained stationary till the expenditure of borrowed money brought the land-boom of the early “seventies.” A great temporary increase of trade was succeeded by violent fluctuations and but slowly increasing trade, as the effects of the bubble were slowly worked off. It is significant that from 1873 till 1895 the world level of prices was falling continuously, and this factor contributed not a little to the depression of New Zealand. Little headway could be made against a falling price of wool and a decreasing production of gold, which were the main features of those twenty years.
But in 1895 world prices began to rise, and the effect is seen immediately in the upward shoot of the external trade. Only twice has this upward tendency been checked—in 1908, when the commercial crisis which was felt in the Old World a year previously affected New Zealand, and again in 1913 on the occasion of another depression of trade.
It must be remembered, however, that along with the great development in trade—or, rather, preceding it—went a steady increase in population. The growth of population has been continuous throughout the history of New Zealand, and increasing numbers have naturally caused a development of overseas trade. For a long period, however, the external trade, while increasing absolutely, was declining relatively, and therefore attention has been directed to the per capita trade of the Dominion.
The trade per head was fairly great in the early years, after 1853; but the amount was swelled by the relatively large imports which were necessary for the development of the young colony. The gold-discoveries raised the level both of imports and exports, and after 1870 the borrowing policy which was inaugurated greatly inflated trade, and especially imports. The highest level, apart from the abnormal years of the early “sixties,” was reached in 1874, and the consequent reaction saw a continuously decreasing per capita trade both in imports and exports till 1895.
It is significant that the turning-point should have come in 1895, the year in which prices turned to rise all over the world. Since 1895 there has been a constant increase, and while imports have not yet attained once more to the level of 1874, exports have in late years surpassed all previous records, except the abnormal level of the year 1863.
The logarithmic curve shows the ratio of increase, instead of the actual increment in each successive year, plotting the geometrical instead of the arithmetical increase. The curve represents the same figures as are plotted on the natural scale in the first graph considered.
By this method the relative increase is emphasized. As the amount of trade increases, a smaller percentage increase shows up as a great fluctuation in the natural scale; but the logarithmic sale is free from this defect. The relative increases are measured by vertical distances as shown in the scale.
The main feature of the graph therefore is its emphasis of the enormous increase of trade due to the gold-rushes. The threefold increase since 1895 is also well illustrated.
| TOTAL TRADE, 1914. | ||
|---|---|---|
| 1914. | 1913. | |
| £ | £ | |
| Total trade | 48,117,543 | 45,275,024 |
| Imports | 21,856,096 | 22,288,302 |
| Exports | 26,261,417 | 22,986,722 |
The total trade, which had been advancing so rapidly since 1895, and even more rapidly in recent years, showed another big increase in 1914, the figures for which eclipsed all previous records.
Owing to the influence of the war, imports show a slight decrease from 1913; but exports have increased by £3,274,725, or 144; per cent., in one year. The nature and extent of this increase is discussed more fully in the subsection devoted to exports.
The relation between imports and exports is of the greatest importance to a young country like New Zealand. In the very earliest years of occupation by Europeans the exports of phormium, timber, and skins were greatly in excess of the few imports, mainly muskets and gunpowder, a fact which is explained partly by the temporary residence of the traders and more by the weaker bargaining-power of the Maori. With the settlement of the regular colony in 1840 there was evident an inflation of imports occasioned by the amount of capital the new colonists brought in for the development of the country. From 1853 to 1870 there was an excess of imports, which, however, was tending to decrease.
A temporary excess of exports was changed in the early “severities” by another great increase of imports due to the borrowing policy inaugurated in that period. Except for a big decrease in 1880, imports continued to be greater than exports until 1886.
From that year onward there is a continued excess of exports, except for two bad years, 1908 and 1913. The divergence from 1886 to 1895 is most marked. Since 1895 the lines of imports and exports run almost parallel, as a reference to the smoothed curves given below will show; but fluctuations in exports always precede by a year similar fluctuations in imports.
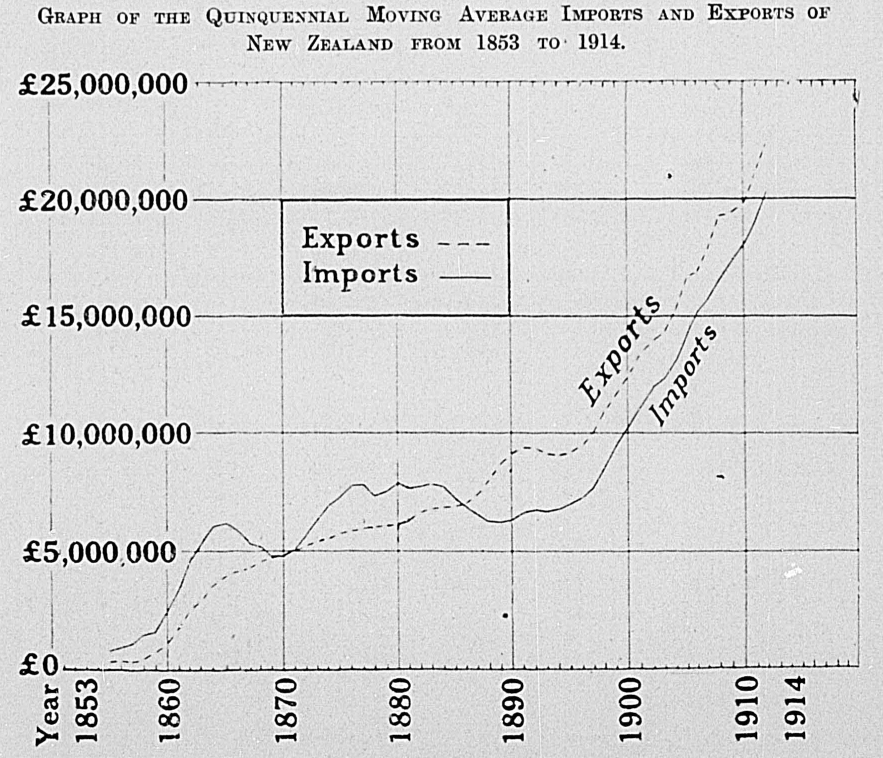
The balance of trade is intimately bound up, in later years especially, with the large imports of capital which have been brought in to assist in the development of the country. This has already been made evident in discussing the balance of trade in early years. The excess of imports from 1853 to 1870, and again from 1872 to 1886, can definitely be traced to the import of capital in those periods.
The excess of exports in later years consists mainly of profits, interest, and other charges on the debt of New Zealand, public, local, and private. Other items, such as remittances abroad and subsidies, also swell the balance of exports. The amount necessary in each year to pay the interest on the debt of New Zealand cannot be definitely stated, owing to the lack of data concerning the private investments in the Dominion.
The amount of interest payable on the public debt as at the 31st March, 1915, was £3,739,327, but of this amount about one-sixth must be deducted for stock held in the Dominion (see section on “Public Finance”). Added to this there is the interest on the local bodies' debt of 17½ millions, of which, however, less than 7½ millions was raised abroad, and the private debts of the Dominion, for which no statistics are available. It is evident that some four to five millions is needed each year to defray the charges on the various debts of New Zealand.
Against this outgoing must be set the amount of new imports of capital in the shape of loans. While the expenditure on interest is fairly constant from year to year, the amount of new loans raised varies, and these variations are a big factor in the fluctuations of the balance of trade. The following table shows the comparison of this balance with the increase in the public debt since 1865:—
| COMPARISON OF BALANCE OF TRADE AND INCREASE OF PUBLIC DEBT. | |||||
|---|---|---|---|---|---|
| Period. | Annual Average. | ||||
| Imports.* | Exports.* | Excess of Imports.* | Excess of Exports.* | Increase of Net Debt.* | |
* In millions of pounds. | |||||
| 1865–69 | 5.36 | 4.31 | 1.05 | .. | 1.03 |
| 1870–74 | 5.69 | 5.23 | 0.46 | .. | 1.20 |
| 1875–79 | 7.81 | 5.92 | 1.89 | .. | 2.14 |
| 1880–84 | 7.77 | 6.65 | 1.12 | .. | 1.60 |
| 1885–89 | 6.55 | 7.49 | .. | 0.94 | 1.30 |
| 1890–94 | 6.68 | 9.43 | .. | 2.75 | 0.34 |
| 1895–99 | 7.71 | 10.07 | .. | 2.36 | 1.49 |
| 1900–4 | 11.97 | 13.91 | .. | 1.94 | 2.41 |
| 1905–9 | 15.70 | 17.96 | .. | 2.26 | 3.05 |
| 1910–14 | 20.34 | 22.45 | .. | 2.11 | 4.96 |
If the effect of these new loans is eliminated it will be seen that the balance of trade is much more stable than is the case when the balance is obscured by their inclusion. In the following table the amount of the increase of the public debt for the last twenty years has been deducted from the imports, so that the excess of exports is freed from this opposing factor.
| — | Imports.* | Increase of Debt.* | Net Imports.* | Exports.* | Excess of Exports.* | Interest on Debt.*† | |
|---|---|---|---|---|---|---|---|
| Over Gross Imports. | Over Net Imports. | ||||||
*000 omitted. † For year ending 31st March following. ‡ Excess of gross imports over exports. | |||||||
| 1895 | 6,400 | 2,664 | 3,736 | 8,550 | 2,150 | 4,814 | 1,696 |
| 1896 | 7,137 | 3,980 | 3,157 | 9,321 | 2,184 | 6,164 | 1,739 |
| 1897 | 8,055 | 4,576 | 3,479 | 10,017 | 1,962 | 6,538 | 1,751 |
| 1898 | 8,231 | 1,975 | 6,256 | 10,518 | 2,287 | 4,262 | 1,787 |
| 1899 | 8,740 | 936 | 7,804 | 11,938 | 3,198 | 4,134 | 1,817 |
| 1900 | 10,646 | 1,717 | 8,929 | 13,246 | 2,600 | 4,317 | 1,876 |
| 1901 | 11,818 | 3,375 | 8,443 | 12,881 | 1,063 | 4,438 | 1,993 |
| 1902 | 11,327 | 2,933 | 8,394 | 13,645 | 2,318 | 5,251 | 2,072 |
| 1903 | 12,789 | 1,623 | 11,166 | 15,010 | 2,221 | 3,844 | 2,151 |
| 1904 | 13,292 | 2,390 | 10,902 | 14,748 | 1,456 | 3,846 | 2,244 |
| 1905 | 12,829 | 2,279 | 10,550 | 15,656 | 2,827 | 5,106 | 2,332 |
| 1906 | 15,211 | 1,988 | 13,223 | 18,095 | 2,884 | 4,872 | 2,401 |
| 1907 | 17,303 | 2,275 | 15,028 | 20,069 | 2,766 | 5,041 | 2,478 |
| 1908 | 17,471 | 4,485 | 12,986 | 16,317 | –1,154‡ | 3,331 | 2,641 |
| 1909 | 15,675 | 3,952 | 11,723 | 19,662 | 3,987 | 7,939 | 2,782 |
| 1910 | 17,052 | 6,187 | 10,865 | 22,180 | 5,128 | 11,315 | 2,999 |
| 1911 | 19,546 | 3,276 | 16,270 | 19,028 | -518+ | 2,758 | 3,112 |
| 1912 | 20,977 | 5,707 | 15,270 | 21,771 | 794 | 6,501 | 3,326 |
| 1913 | 22,288 | 4,693 | 17,595 | 22,987 | 699 | 5,392 | 3,713 |
| 1914 | 21,856 | 4,955 | 16,901 | 26,261 | 4,405 | 9,361 | 3,739 |
There is no Mint in New Zealand, while there is a fairly considerable production of gold bullion. Gold therefore ranks as an ordinary export of the Dominion, along with wool, frozen meat, and dairy-produce. In earlier days this export of gold was much more important than now, amounting in 1863 to 70 per cent. of the total exports, from which figure it has shrunk steadily to 6 per cent. in 1913. In 1914 the war caused a restriction of export, and the figure therefore dropped to 3½ per cent.
On the other hand, the coin necessary for the commerce of the Dominion must all be imported from abroad—silver from the United Kingdom and gold from Australia.
The movement of specie since 1870 serves to throw light on the trade-conditions of the country. It will be seen that a bad year is reflected in an export of specie, while prosperous years show a steady inflow.
| VALUE OF SPECIE IMPORTED AND EXPORTED SINCE 1870. | ||||
|---|---|---|---|---|
| Year. | Total. | Balance. | ||
| Imports. | Exports. | In. | Ont. | |
| £ | £ | £ | £ | |
| 1870 | 112,690 | 106,090 | 6,600 | .. |
| 1871 | 203,043 | 210 | 202,833 | .. |
| 1872 | 240,638 | 1,525 | 239,113 | .. |
| 1873 | 280,976 | 11,910 | 269,066 | .. |
| 1874 | 152,701 | 1,250 | 151,451 | .. |
| 1875 | 265,937 | 231,295 | 34,642 | .. |
| 1876 | 106,412 | 61,936 | 44,476 | .. |
| 1877 | 426,585 | 158,247 | 268,338 | .. |
| 1878 | 333,140 | 109,550 | 223,590 | .. |
| 1879 | 351,075 | 75,082 | 274,993 | .. |
| 1880 | 164,849 | 120,304 | 44,545 | .. |
| 1881 | 155,029 | 165,748 | .. | 10,719 |
| 1882 | 265,320 | 262,543 | 2,777 | .. |
| 1883 | 200,072 | 83,971 | 116,101 | .. |
| 1884 | 337,680 | 1,440 | 336,240 | .. |
| 1885 | 201,820 | 81,077 | 120,743 | .. |
| 1886 | 439,790 | 138,278 | 301,512 | .. |
| 1887 | 181,234 | 185,397 | .. | 4,163 |
| 1888 | 511,850 | 364,119 | 147,731 | .. |
| 1889 | 328,280 | 157,910 | 170,370 | .. |
| 1890 | 331,630 | 242,404 | 89,226 | .. |
| 1891 | 72,748 | 5,538 | 67,210 | .. |
| 1892 | 200,512 | 43,931 | 156,581 | .. |
| 1893 | 417,236 | 304,519 | 112,717 | .. |
| 1894 | 797,843 | 9,497 | 788,346 | .. |
| 1895 | 284,176 | 32,105 | 252,071 | .. |
| 1896 | 101,941 | 21,198 | 80,743 | .. |
| 1897 | 61,022 | 275,771 | .. | 214,749 |
| 1898 | 19,191 | 68,117 | .. | 48,926 |
| 1899 | 125,977 | 14,913 | 111,064 | .. |
| 1900 | 438,770 | 22,903 | 415,867 | .. |
| 1901 | 464,499 | 11,614 | 452,885 | .. |
| 1902 | 368,685 | 9,581 | 359,167 | .. |
| 1903 | 712,716 | 38,452 | 674,264 | .. |
| 1904 | 391,664 | 9,598 | 382,066 | .. |
| 1905 | 347,679 | 13,878 | 333,801 | .. |
| 1906 | 908,233 | 102,657 | 805,576 | .. |
| 1907 | 763,154 | 7,316 | 755,838 | .. |
| 1908 | 224,122 | 242,289 | .. | 18,167 |
| 1909 | 857,257 | 25,845 | 831,412 | .. |
| 1910 | 303,360 | 27,736 | 275,624 | .. |
| 1911 | 763,271 | 48,305 | 714,966 | .. |
| 1912 | 399,995 | 258,955 | 141,040 | .. |
| 1913 | 634,670 | 176,359 | 458,311 | .. |
| 1914 | 711,869 | 7,522 | 704,347 | .. |
The amount of gold bullion exported is shown in the following table:—
| EXPORTS OF GOLD FROM NEW ZEALAND, 1870–1914. | |||||
|---|---|---|---|---|---|
| Year. | Exports. | Percentage of Total Exports. | |||
| To United Kingdom. | To Australia. | To other Countries. | Total. | ||
| £ | £ | £ | |||
| 1870 | 368,259 | 1,789,779 | 5,872 | 2,163,910 | 44.87 |
| 1871 | 705,257 | 2,050,488 | 32,623 | 2,788,368 | 52.79 |
| 1872 | 477,331 | 1,203,782 | 49,879 | 1,730,992 | 33.35 |
| 1873 | 622,765 | 1,333,094 | 31,566 | 1,987,425 | 35.42 |
| 1874 | 451,255 | 1,020,806 | 33,270 | 1,505,331 | 28.67 |
| 1875 | 541,007 | 839,146 | 27,617 | 1,407,770 | 24.15 |
| 1876 | 692,987 | 551,056 | 24,556 | 1,268,599 | 22.36 |
| 1877 | 1,035,037 | 422,153 | 19,122 | 1,476,312 | 23.33 |
| 1878 | 593,380 | 633,305 | 17,505 | 1,244,190 | 20.68 |
| 1879 | 142,694 | 978,704 | 13,243 | 1,134,641 | 19.76 |
| 1880 | 204,876 | 992,985 | 22,402 | 1,220,263 | 19.21 |
| 1881 | 176,114 | 642,231 | 178,522 | 996,867 | 16.45 |
| 1882 | 127,805 | 542,178 | 251,681 | 921,664 | 13.84 |
| 1883 | 278,584 | 407,554 | 206,307 | 892,445 | 12.58 |
| 1884 | 270,599 | 699,064 | 19,290 | 988,953 | 13.95 |
| 1885 | 386,081 | 281,051 | 222,924 | 890,056 | 13.05 |
| 1886 | 288,581 | 578,889 | 72,178 | 939,648 | 14.08 |
| 1887 | 110,959 | 575,720 | 61,199 | 747,878 | 10.89 |
| 1888 | 527,288 | 328,739 | 58,282 | 914,309 | 11.77 |
| 1889 | 420,226 | 321,616 | 43,648 | 785,490 | 8.41 |
| 1890 | 166,016 | 516,062 | 69,282 | 751,360 | 7.66 |
| 1891 | 209,693 | 710,714 | 86,765 | 1,007,172 | 10.53 |
| 1892 | 325,760 | 593,861 | 32,342 | 951,963 | 9.98 |
| 1893 | 299,365 | 562,732 | 53,824 | 915,921 | 10.19 |
| 1894 | 426,626 | 412,827 | 48,412 | 887,865 | 9.62 |
| 1895 | 618,329 | 543,852 | .. | 1,162,181 | 13.59 |
| 1896 | 553,544 | 438,281 | 49,603 | 4,041,428 | 11.17 |
| 1897 | 550,022 | 375,017 | 55,165 | 980,204 | 9.79 |
| 1898 | 379,479 | 502,976 | 198,236 | 1,080,691 | 10.27 |
| 1899 | 855,490 | 645,850 | 11,840 | 1,513,180 | 12.67 |
| 1900 | 675,012 | 764,590 | .. | 1,439,602 | 10.87 |
| 1901 | 847,125 | 750,178 | 156,481 | 1,753,784 | 13.61 |
| 1902 | 794,440 | 1,156,986 | .. | 1,951,426 | 14.30 |
| 1903 | 933,750 | 1,104,082 | .. | 2,037,832 | 13.58 |
| 1904 | 894,665 | 1,092,495 | 341 | 1,987,501 | 13.48 |
| 1905 | 689,292 | 1,402,769 | 1,875 | 2,093,936 | 13.37 |
| 1906 | 487,214 | 1,783,442 | 248 | 2,270,904 | 12.55 |
| 1907 | 899,977 | 1,127,513 | .. | 2,027,490 | 10.10 |
| 1908 | 1,067,427 | 937,372 | .. | 2,004,799 | 12.29 |
| 1909 | 1,124,525 | 882,375 | .. | 2,006,900 | 10.21 |
| 1910 | 996,081 | 900,237 | .. | 1,896,318 | 8.55 |
| 1911 | 379,596 | 1,435,655 | .. | 1,815,251 | 9.54 |
| 1912 | 394,425 | 950,706 | .. | 1,345,131 | 6.18 |
| 1913 | 353,763 | 1,105,720 | 16 | 1,459,499 | 6.35 |
| 1914 | 159,499 | 735,811 | 57 | 895,367 | 3.41 |
The geographical position of New Zealand inevitably prevents her from developing any entrepôt or transit trade, so that her import, except for a small forwarding trade to the Pacific islands,” are for her own consumption, and, similarly, the overwhelming bulk of her exports are commodities of domestic production. The proportion of special trade—i.e., imports for home consumption and exports of domestic products—for the last ten years is shown in the table below:—
| “SPECIAL” AND “ENTREPOT” TRADE OF NEW ZEALAND. | |||||||
|---|---|---|---|---|---|---|---|
| Year. | Trade (excluding Specie). | Re-exports (included in two preceding columns). | Percentage of Re-exports. | ||||
| Imports. | Exports. | Total. | To Imports | To Exports | To Total Trade. | ||
| £ | £ | £ | £ | ||||
| 1905 | 12,481,178 | 15,642,069 | 28,123,247 | 138,539 | 1.11 | 0.89 | 0.98 |
| 1906 | 14,303,170 | 17,992,480 | 32,295,650 | 152,134 | 1.06 | 0.85 | 0.94 |
| 1907 | 16,539,707 | 20,061,641 | 36,601,348 | 278,503 | 1.68 | 1.39 | 1.52 |
| 1908 | 17,247,162 | 16,075,205 | 33,322,367 | 180,675 | 1.5 | 1.12 | 1.08 |
| 1909 | 14,817,462 | 19,636,151 | 34,453,613 | 173,215 | 1.17 | 0.88 | 1.01 |
| 1910 | 16,748,223 | 22,152,473 | 38,900,696 | 208,310 | 1.24 | 0.94 | 1.07 |
| 1911 | 18,782,608 | 18,980,185 | 37,762,793 | 198,287 | 1.06 | 1.04 | 1.05 |
| 1912 | 20,576,579 | 21,511,626 | 42,088,205 | 239,221 | 1.16 | 1.11 | 1.14 |
| 1913 | 21,653,632 | 22,810,363 | 44,463,995 | 232,473 | 1.07 | 1.02 | 1.05 |
| 1914 | 21,144,227 | 26,253,925 | 47,398,152 | 269,208 | 1.27 | 1.03 | 1.14 |
Before comparisons may properly be made with the trade of other countries care must be taken to ensure that the statistics are comparable in their methods of compilation and definition. The value of imports in New Zealand is reckoned c.i.f., of exports f.o.b.; but in the United States and Canada the values of imports also are calculated f.o.b., and the difference, representing freight, insurance, and charges, amounts to about 10 per cent. of the total value. In New Zealand the values of imports are declared by the importers, and declarations are supported by production of invoices; but in the United Kingdom the values both of imports and exports are obtained by assessment at current market prices.
The total trade of a country must also be divided into two classes, “special” and “other.” Many countries such as Belgium, France, and the United Kingdom have a considerable transit or entrepôt trade in addition to the real exchange of domestic productions for imports for home consumption. In New Zealand, as has been shown, this entrepôt trade is practically negligible.
A comparison of the “special” trade of various countries, as far as may be ascertained, is shown in the table given below, which is reproduced from the Commonwealth Official Year-book, 1914, page 545. Such a comparison necessarily ignores many of the elements considered above, but gives a sufficiently accurate idea of the relative trade of the various countries.
| “SPECIAL” TRADE OF VARIOUS COUNTRIES, INCLUDING BULLION AND SPECIE, FOR THE LATEST YEARS AVAILABLE. | |||||||||||||
|---|---|---|---|---|---|---|---|---|---|---|---|---|---|
| Country. | Year ended. | Trade. | Trade per Inhabitant | ||||||||||
| Imports. | Exports. | Total. | Imports. | Exports. | Total. | ||||||||
*Preliminary figures. | |||||||||||||
| £ | £ | £ | £ | s. | d. | £ | s. | d. | £ | s. | d. | ||
| New Zealand | 31/12/14 | 21,587,000 | 25,985,000 | 47,572,000 | 19 | 16 | 0 | 23 | 16 | 8 | 43 | 12 | 8 |
| United Kingdom | 31/12/14* | 623,052,000 | 430,231,000 | 1,053,283,000 | 13 | 8 | 0 | 9 | 5 | 0 | 22 | 13 | 0 |
| ″ | 31/12/13 | 671,046,000 | 525,245,000 | 1,196,291,000 | 14 | 11 | 2 | 11 | 7 | 10 | 25 | 19 | 0 |
| Australia | 31/12/14* | 71,149,000 | 64,564,000 | 135,713,000 | 14 | 9 | 1 | 13 | 2 | 4 | 27 | 11 | 5 |
| ″ | 31/12/13 | 77,010,000 | 75,138,000 | 152,148,000 | 16 | 0 | 8 | 15 | 12 | 10 | 31 | 13 | 6 |
| Canada | 31/3/14 | 132,019,000 | 89,915,000 | 221,934,000 | 16 | 13 | 6 | 11 | 7 | 2 | 28 | 0 | 8 |
| United States of America | 30/6/13 | 342,106,000 | 436,547,000 | 778,653,000 | 3 | 12 | 11 | 4 | 13 | 1 | 8 | 6 | 0 |
| Argentine Republic | 31/12/12 | 84,187,000 | 96,195,000 | 180,382,000 | 11 | 9 | 2 | 13 | 1 | 8 | 24 | 10 | 10 |
| Austria-Hungary | 31/12/12 | 149,026,000 | 121,345,000 | 270,371,000 | 2 | 19 | 4 | 2 | 8 | 4 | 5 | 7 | 8 |
| Belgium | 31/12/12 | 210,211,000 | 160,054,000 | 370,265,000 | 27 | 15 | 3 | 21 | 2 | 10 | 48 | 18 | 1 |
| Brazil | 31/12/12 | 63,425,000 | 74,649,000 | 138,074,000 | 2 | 12 | 1 | 3 | 1 | 2 | 5 | 13 | 3 |
| Denmark | 31/12/12 | 41,954,000 | 33,940,000 | 75,894,000 | 14 | 19 | 8 | 14 | 2 | 5 | 27 | 2 | 1 |
| France | 31/12/12 | 350,482,000 | 281,495,000 | 631,977,000 | 8 | 16 | 9 | 7 | 1 | 11 | 15 | 18 | 8 |
| German Empire | 31/12/12 | 541,675,000 | 447,392,000 | 989,067,000 | 8 | 3 | 9 | 6 | 15 | 3 | 14 | 9 | 0 |
| Italy | 31/12/12 | 149,113,000 | 97,536,000 | 246,649,000 | 4 | 5 | 2 | 2 | 15 | 8 | 7 | 0 | 10 |
| Japan | 31/12/12 | 66,007,000 | 57,972,000 | 123,979,000 | 1 | 5 | 3 | 1 | 2 | 2 | 2 | 7 | 5 |
| Norway | 31/12/12 | 28,756,000 | 18,147,000 | 46,903,000 | 11 | 15 | 9 | 7 | 8 | 10 | 19 | 4 | 7 |
| Portugal | 31/12/12 | 17,035,000 | 7,867,000 | 24,902,000 | 3 | 0 | 10 | 1 | 8 | 2 | 4 | 9 | 0 |
| Spain | 31/12/12 | 42,089,000 | 41,826,000 | 83,915,000 | 2 | 2 | 9 | 2 | 2 | 6 | 4 | 5 | 3 |
| Sweden | 31/12/12 | 44,095,000 | 42,257,000 | 86,352,000 | 7 | 17 | 4 | 7 | 10 | 10 | 15 | 8 | 2 |
| Switzerland | 31/12/12 | 81,577,000 | 55,629,000 | 137,206,000 | 21 | 6 | 7 | 14 | 10 | 11 | 35 | 17 | 6 |
| Uruguay | 31/12/11 | 9,333,000 | 8,840,000 | 18,173,000 | 7 | 18 | 6 | 7 | 10 | 1 | 15 | 8 | 7 |
With the exception of Belgium, it will be seen that New Zealand has a greater total trade per head than any other country in the world. The exports per head from New Zealand are also greater than those from any other country.
By themselves statistics of foreign trade are not a sure test of a country's prosperity, and they must always be interpreted with a knowledge of local conditions. An increase of imports may not be the result of increased purchasing-power, but may merely represent loans from another country, or even a failure of the home supply of certain commodities. Similarly, increased exports may mean greater productivity and increased purchasing-power, but they may also denote the payments on greatly increased liabilities.
In all countries the home trade is greatly in excess of the external trade, and in larger countries which are more self-contained a decrease in foreign trade may be due to development within the country itself. But New Zealand is far from self-contained, and from her position must attach a great importance to external trade. Under present conditions, only by export can a sufficient market be obtained for her rich resources, and only from abroad can be obtained the manufactures which are needed for common use. The development of the external trade since 1895 has been accompanied by increasing prosperity, and every advance in exports, followed in the next year by larger imports, represents an increase in the wealth of the Dominion.
In New Zealand the Department of H.M. Customs requires for every package exported a declared statement of contents, value, and destination. Various measures are taken to safeguard the accuracy of these export entries, and the values especially are carefully checked by comparison with current prices. Since 1914 the statistics have been compiled in the Head Office of the Customs Department at Wellington instead of at the branch offices, and this centralization has given greater opportunity for a more complete system of checking.
In all cases exports are valued “free on board at the port of shipment.” In many cases, however, the goods are not sold till arrival at their destination, and therefore values must be assessed in New Zealand with reference to current prices. It is possible, therefore, that an interim change in the markets of London may to some extent falsify the values given to exports.
No account is taken in the export values of “ships' stores” except where they are shipped “ex warehouse”—that is, from a bonded store under Customs control. The exports of New Zealand produce are separated from re-exports of foreign goods.
The ultimate destination of the goods is distinguished as far as is practicable; but it is impossible to discover what proportion of the exports is intended for home consumption in the country of destination. Goods for transhipment on a through bill of lading are, however, credited to the ultimate destination shown.
Mention has been made in the section on total trade of the beginnings of trade in New Zealand. There are no systematic records of the extent of the early exports of whale-oil, seal-skins, flax, and timber—exports which began in the last decade of the eighteenth century; but Dr. McNab (“Historical Records of New Zealand,” Vol. i) gives an interesting return of the exports from New Zealand to Sydney for eight months, from January to August, 1830. These figures are reproduced below:—
| £ | ||
|---|---|---|
| Flax | 500½ tons | 12,513 |
| Salt provisions | 69,136 lb. | 798 |
| Lard | 3 cwt. | 5 |
| Pine boards and spars | 35,200 ft. | 273 |
| Potatoes | 36 tons | 189 |
| Maize | 40 bushels | 10 |
| Seal-skins | 4,091 | 4,480 |
| Whale-oil | 500 gallons | 40 |
| Pigs | 75 | 81 |
| Curiosities | Sundry | 17 |
| Fishing-lines | 1 bundle | 20 |
| £18,426 |
With the continuous settlement of the colony after 1840 agriculture became more important, while sheep had early been introduced, and a shipment of wool had been seat to Hobart in 1839. In 1853, the first year for which complete records are available, the main exports were timber, potatoes, wool, grain, and whale-oil. A useful summary of the growth of the exports from New Zealand will be found in the “Statistical View of Fifty Years' Progress in New Zealand,” published later in this issue.
For a decade after 1853 there were considerable fluctuations in the prosperity of the colony, since its principal market, Australia, was greatly disorganized by a succession of gold-rushes. In 1857, however, payable gold was discovered at Collingwood, in Nelson, and in 1861 the famous Gabriel's Gully goldfield was discovered in Otago, followed by Coromandel la the next year, Westland in 1864, and Thames in 1867. For a time the expert of gold overshadowed every other commodity, amounting in 1863 to 70 per cent. of the total exports, while in the same year wool was 24 per cent.
As the alluvial gold became worked out the relative importance of gold in the exports dropped steadily, while that of wool increased till in the later “seventies” wool accounted for 60 per cent. and gold for only 20 per cent. of the total exports. The early “seventies” saw a revival of agriculture, and the value of grain exported steadily increased till in 1883 it amounted to over £1,250,000, or 18 per cent. of the total exports.
The year 1882, however, saw the first shipment of frozen meat from New Zealand, and this trade expanded rapidly till about 1900 it represented approximately 20 per cent. of the exports, from which position it had receded slightly till the last two or three years.
Refrigeration had a beneficial effect, too, upon the dairying industry, and the exports of butter have steadily grown since 1882, while the first decade of the twentieth century saw a huge increase in the exports of cheese.
At the same time exports of tallow, skins, hides, and other by-products of meat have increased in sympathy with the export of meat: but the relative proportions of gold and grain have steadily decreased.
The following table gives particulars of the main exports from New Zealand during the last twenty years. Necessarily the table is only a summary, and fuller details will be found later in this subsection. In this table, however, the main commodities are shown separately, and the progress of the Dominion during the last two decades is strikingly illustrated.
The main feature of the table is the prominence given to the primary products of the soil. The extractive industries of New Zealand have always supplied the overwhelming bulk of the exports, and, though the proportion of the different classes has varied from time to time, there has never been any considerable or even noticeable export of manufactured goods.
In former years the statistical tables have included a heading “Manufactures,” which showed a considerable total value in each year, reaching £987,072 in 1913. Included in this group, however, was phormium, the value of which was in 1913 £721,924; and, though the phormium is stripped and prepared in New Zealand, it leaves the Dominion as a raw fibre, which can hardly be termed a “manufacture.” Similarly, leather in 1313 amounted to £31,945, and copra was also included in this heading. There are some genuine manufactures exported, such as ale and beer, cordage, soap, woollens, but their value is very insignificant compared with the primary products.
Practically every item considered shows a great increase over the twenty years, and the total exports show a threefold increase in the period. This increase is practically continuous: there are two slight checks in 1901 and 1904, and more serious decreases in 1908 and 1911. The figures for 1914 constitute a record for export values, being 14½ per cent. greater than 1913.
| EXPORTS OF NEW ZEALAND PRODUCE.—PASTORAL PRODUCE. | |||||||
|---|---|---|---|---|---|---|---|
| Year. | Wool. | Frozen Meat. | Butter. | Cheese. | Tallow. | Skins, Hides and Pelts. | Other Pastoral Produce.* |
* The main items in this heading are bacon and hams, beef and pork (salted), live-stock, preserved meats, sausage-skins. | |||||||
| £ | £ | £ | £ | £ | £ | £ | |
| 1895 | 3,662,131 | 1,262,711 | 227,601 | 150,909 | 260,999 | 273,994 | 169,969 |
| 1896 | 4,391,848 | 1,251,993 | 281,716 | 130,166 | 208,821 | 235,072 | 169,729 |
| 1897 | 4,443,144 | 1,566,286 | 402,605 | 150,517 | 259,964 | 245,614 | 164,181 |
| 1898 | 4,645,804 | 1,698,750 | 403,690 | 135,776 | 302,141 | 323,418 | 184,501 |
| 1899 | 4,324,627 | 2,088,856 | 571,799 | 141,818 | 311,649 | 385,443 | 185,544 |
| 1900 | 4,749,196 | 2,123,881 | 740,620 | 229,111 | 368,473 | 363,119 | 212,458 |
| 1901 | 3,699,103 | 2,253,262 | 822,406 | 238,685 | 351,710 | 365,095 | 238,936 |
| 1902 | 3,354,563 | 2,718,763 | 1,205,802 | 163,539 | 550,131 | 472,988 | 339,082 |
| 1903 | 4,041,274 | 3,197,043 | 1,318,067 | 194,998 | 517,871 | 564,912 | 240,798 |
| 1904 | 4,673,826 | 2,793,599 | 1,380,460 | 185,486 | 357,974 | 496,000 | 192,063 |
| 1905 | 5,381,333 | 2,694,432 | 1,408,557 | 205,171 | 347,888 | 666,553 | 217,587 |
| 1906 | 6,765,655 | 2,877,031 | 1,560,235 | 341,002 | 455,026 | 874,998 | 266,413 |
| 1907 | 7,657,278 | 3,420,664 | 1,615,345 | 662,355 | 560,965 | 1,036,963 | 290,158 |
| 1908 | 5,332,781 | 3,188,515 | 1,171,182 | 783,419 | 481,335 | 752,683 | 244,532 |
| 1909 | 6,305,888 | 3,601,093 | 1,639,380 | 1,105,390 | 648,452 | 990,440 | 341,608 |
| 1910 | 8,308,410 | 3,850,777 | 1,811,975 | 1,195,373 | 756,841 | 1,104,299 | 487,714 |
| 1911 | 6,491,707 | 3,503,406 | 1,576,917 | 1,192,057 | 607,257 | 876,004 | 496,312 |
| 1912 | 7,105,483 | 3,909,569 | 2,088,809 | 1,680,393 | 684,739 | 1,047,031 | 414,785 |
| 1913 | 8,057,620 | 4,449,933 | 2,061,651 | 1,770,297 | 663,088 | 1,148,854 | 367,343 |
| 1914 | 9,318,114 | 5,863,062 | 2,338,576 | 2,564,125 | 694,348 | 1,314,156 | 437,136 |
| EXPORTS OF NEW ZEALAND PRODUCE.—MINING AND AGRICULTURAL PRODUCE. | ||||||||
|---|---|---|---|---|---|---|---|---|
| Year. | Wheat. | Oats. | Other Agricultural Produce.* | Gold. | Coal. | Kaurigum. | Phormium. | Timber. |
* The main items in this heading are bran and sharps, chaff, Hour, barley, beans and peas, maize, malt, hops, oatmeal, potatoes, and seeds. | ||||||||
| £ | £ | £ | £ | £ | £ | £ | £ | |
| 1895 | 1,891 | 156,302 | 167,836 | 1,162,181 | 83,342 | 418,766 | 21,040 | 141,892 |
| 1896 | 78,988 | 220,070 | 273,297 | 1,041,428 | 71,984 | 431,323 | 32,985 | 133,511 |
| 1897 | 14,703 | 167,229 | 313,243 | 980,204 | 69,595 | 398,010 | 30,674 | 154,169 |
| 1898 | 2,463 | 87,924 | 320,290 | 1,080,691 | 50,381 | 580,767 | 74,556 | 164,723 |
| 1899 | 338,476 | 286,102 | 289,100 | 1,513,180 | 83,085 | 607,919 | 184,411 | 196,749 |
| 1900 | 351,494 | 552,270 | 326,801 | 1,439,602 | 98,136 | 622,293 | 332,182 | 232,174 |
| 1901 | 276,111 | 922,301 | 333,974 | 1,753,784 | 142,176 | 446,114 | 195,728 | 294,699 |
| 1902 | 31,074 | 666,664 | 348,248 | 1,951,426 | 154,747 | 450,223 | 534,031 | 203,005 |
| 1903 | 14,068 | 453,702 | 277,075 | 2,037,832 | 128,927 | 631,102 | 595,634 | 240,713 |
| 1904 | 126,035 | 212,724 | 220,484 | 1,987,501 | 139,898 | 501,817 | 710,281 | 254,021 |
| 1905 | 144,374 | 99,664 | 184,242 | 2,093,936 | 107,062 | 561,444 | 696,467 | 318,895 |
| 1906 | 9,915 | 76,981 | 183,646 | 2,270,904 | 122,614 | 522,486 | 776,106 | 304,941 |
| 1907 | 326 | 4,656 | 157,985 | 2,027,490 | 114,737 | 579,888 | 832,068 | 311,862 |
| 1908 | 344 | 108,997 | 156,389 | 2,004,799 | 85,846 | 372,798 | 396,288 | 375,235 |
| 1909 | 305,902 | 453,314 | 216,954 | 2,006,900 | 183,961 | 552,693 | 306,973 | 337,740 |
| 1910 | 216,657 | 44,299 | 220,566 | 1,896,318 | 259,562 | 465,044 | 448,414 | 407,658 |
| 1911 | 219,196 | 9,211 | 184,408 | 1,815,251 | 204,379 | 395,707 | 300,209 | 439,353 |
| 1912 | 95,702 | 483,756 | 481,147 | 1,345,131 | 216,170 | 401,305 | 376,264 | 490,508 |
| 1913 | 11,816 | 29,252 | 238,908 | 1,459,499 | 205,010 | 549,106 | 721,924 | 319,055 |
| 1914 | 3,580 | 165,930 | 278,894 | 895,367 | 282,163 | 497,444 | 455,214 | 422,550 |
In the last twenty years the proportions of the principal exports have changed a good deal. Wool reached its maximum percentage, 47.9, in 1897, showed a tendency to decline till 1902, but has since partially regained its position. Frozen meat had over the whole period supplied just under 20 per cent. of the total exports, but the figures for 1914, owing to war demands, are a record.
The main feature of the period has been the great advance, relatively and absolutely, of dairy-produce, which has risen from £378,510 to £4,902,701, or from 4½ to 19 per cent. of the total, the actual increase being 1,198 per cent. On the other hand, gold has decreased from 14 to 3 per cent. of the total, though the export of gold has been checked in the last three years by industrial troubles and by conditions of war. Both phormium and agricultural produce show fluctuating exports, the latter reaching its highest percentage in 1899–1901, the period of the South African War. The proportion of other produce keeps fairly constant, since this group consists principally of by-products of the primary industries.
The relative importance of the main commodities is shown on the graph given below, plotted on a uniform basis.
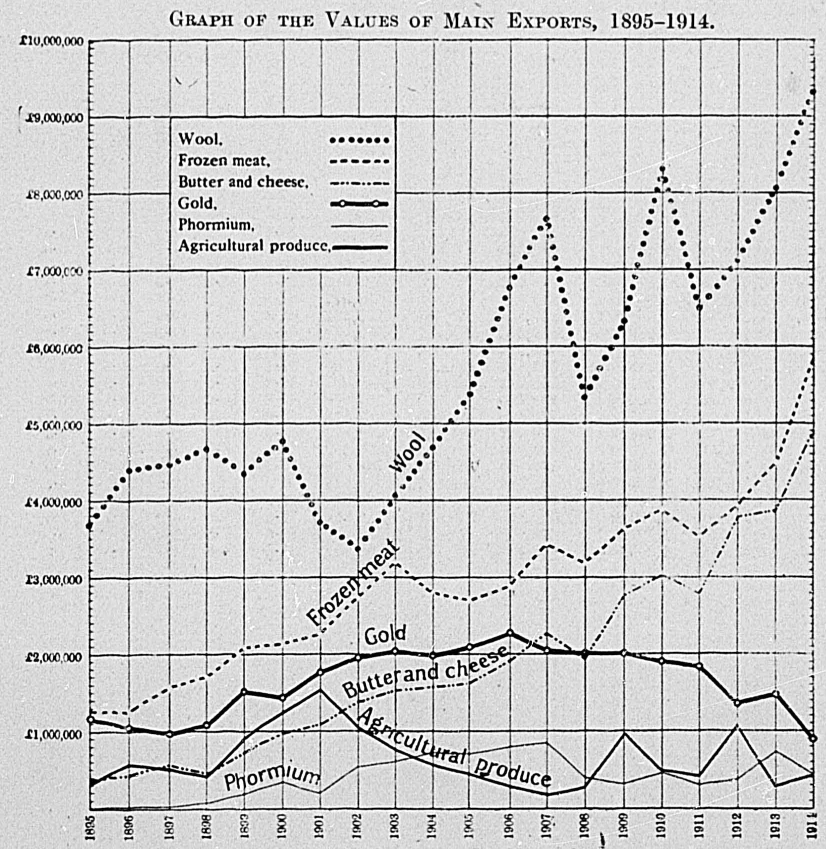
In the following table the exports are classified under the main industries, according to a broad division, to illustrate the relative importance of the pastoral, agricultural, mining, forest, and other industries as far as the export trade is concerned. It must be remembered that the home trade may be relatively more important than the external trade to a particular industry.
The table indicates a tendency for the Dominion to rely more and more upon the pastoral industry for her main exports. The four main products of that industry—wool, frozen meat, butter, and cheese—provide an ever-increasing proportion of the total quantity of goods shipped overseas. On the other hand, the proportion of minerals tends to fall, through decreased exports of gold. Forest products tend to increase steadily, but never as fast as pastoral exports: while agricultural exports fluctuate with a downward tendency. It would seem that New Zealand is restricting her agriculture to a level just sufficient to provide for her own needs in the matter of foodstuffs, and only in exceptionally good years is there a surplus available for export.
| TABLE SHOWING PROPORTIONS OF EXPORTS SUPPLIEDBY THE MAIN INDUSTRIES. | ||||||||||
|---|---|---|---|---|---|---|---|---|---|---|
| – | Exports. | Percentage of Total Exports. | ||||||||
| Pastoral. | Mining. | Agricultural. | Forest. | Other. | Pastoral. | Mining. | Agricultural. | Forest. | Other. | |
| £ | £ | £ | £ | £ | Per Cent. | Per Cent. | Per Cent. | Per Cent. | Per Cent. | |
| 1895 | 6,008,314 | 1,259,429 | 326,029 | 574,722 | 381,730 | 70.3 | 14.7 | 3.8 | 6.7 | 4.5 |
| 1896 | 6,669,345 | 1,126,371 | 572,355 | 577,409 | 375,625 | 71.6 | 12.1 | 6.1 | 6.2 | 4.0 |
| 1897 | 7,232,331 | 1,080,943 | 495,175 | 564,539 | 644,005 | 72.2 | 10.8 | 4.9 | 5.6 | 6.5 |
| 1898 | 7,694,080 | 1,174,543 | 410,677 | 761,370 | 477,285 | 73.2 | 11.2 | 3.9 | 7.2 | 4.5 |
| 1899 | 8,009,736 | 1,644,101 | 913,678 | 817,743 | 553,077 | 67.1 | 13.8 | 7.7 | 6.8 | 4.0 |
| 1900 | 8,786,858 | 1,590,212 | 1,230,565 | 863,144 | 775,382 | 66.3 | 12.0 | 9.3 | 6.5 | 5.9 |
| 1901 | 7,969,197 | 1,969,963 | 1,532,386 | 754,457 | 655,421 | 61.9 | 15.3 | 11.9 | 5.9 | 5.0 |
| 1902 | 8,804,868 | 2,183,211 | 1,045,986 | 670,962 | 939,950 | 64.5 | 16.0 | 7.7 | 4.9 | 6.9 |
| 1903 | 10,074,963 | 2,265,604 | 744,845 | 885,257 | 1,039,709 | 67.1 | 15.1 | 5.0 | 5.9 | 6.9 |
| 1904 | 10,079,408 | 2,251,108 | 559,243 | 769,188 | 1,089,401 | 68.3 | 15.3 | 3.8 | 5.2 | 7.4 |
| 1905 | 10,921,521 | 2,329,858 | 428,280 | 891,410 | 1,084,878 | 69.8 | 14.9 | 2.7 | 5.7 | 6.9 |
| 1906 | 13,140,360 | 2,555,551 | 270,542 | 841,166 | 1,287,518 | 72.6 | 14.1 | 1.5 | 4.6 | 7.2 |
| 1907 | 15,243,728 | 2,344,903 | 162,967 | 904,486 | 1,412,873 | 76.0 | 11.7 | 0.8 | 4.5 | 7.0 |
| 1908 | 11,954,447 | 2,279,520 | 265,730 | 758,115 | 1,059,682 | 73.3 | 14.0 | 1.6 | 4.6 | 6.5 |
| 1909 | 14,032,251 | 2,378,775 | 976,170 | 905,930 | 768,870 | 74.4 | 12.1 | 5.0 | 4.6 | 3.9 |
| 1910 | 17,515,389 | 2,344,348 | 481,522 | 889,603 | 949,347 | 79.0 | 10.6 | 2.2 | 4.0 | 4.2 |
| 1911 | 14,743,660 | 2,165,137 | 412,815 | 843,310 | 863,568 | 77.5 | 11.4 | 2.2 | 4.4 | 4.5 |
| 1912 | 16,930,809 | 1,660,280 | 1,060,605 | 900,671 | 1,218,216 | 77.8 | 7.6 | 4.9 | 4.1 | 5.6 |
| 1913 | 18,518,786 | 1,791,777 | 279,976 | 874,110 | 1,522,073 | 80.6 | 7.8 | 1.2 | 3.8 | 6.6 |
| 1914 | 22,529,517 | 1,263,892 | 448,404 | 927,482 | 1,092,152 | 85.8 | 4.8 | 1.7 | 3.5 | 4.2 |
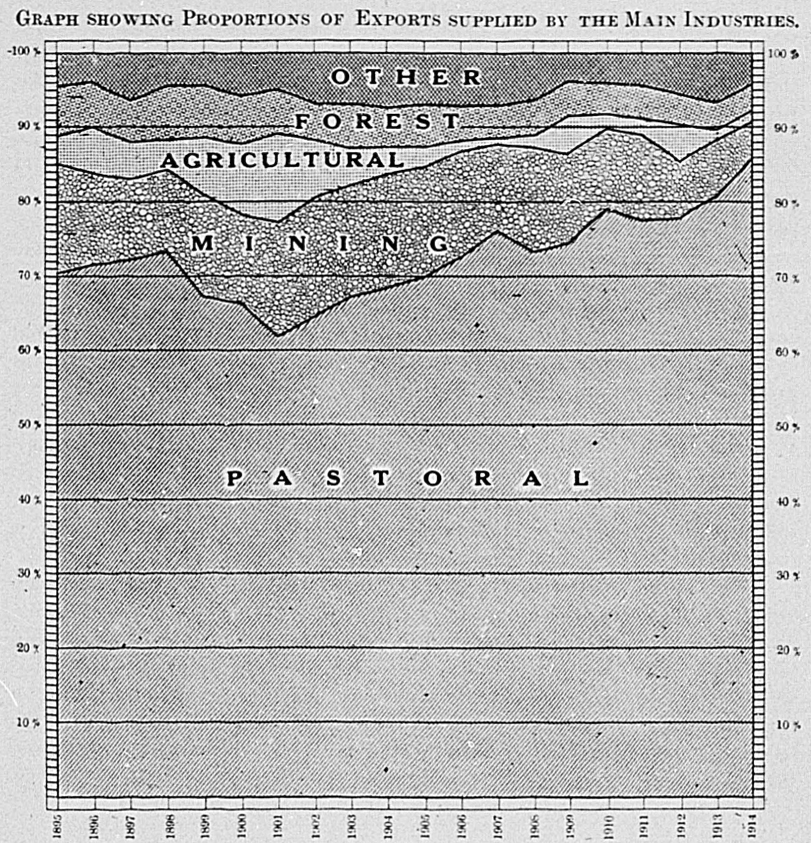
The graph just given shows clearly the relative importance in the external trade of the main classes of exports. The most noticeable feature is the extremely high proportion of the exports supplied by the pastoral industries. The percentage supplied by this group was high in the late “nineties,” but in the early years of the new century fell relatively, owing mainly to increased exports of agricultural and mining produce. Since 1901, however, the percentage has increased almost continuously, till in 1914 it reached more than So per cent. of the total.
On the whole, mining products are growing less important to New Zealand, mainly because of the overwhelming increase of the pastoral products. In later years especially this tendency to diminish is noticeable.
Agricultural exports show an abnormal increase from 1899 to 1903, the period which overs the South African War: but since then their importance steadily declines. Forest products, too, though steady, are not increasing as fast as pastoral products, and therefore the strip representing them tapers toward the latter years.
| EXPORTS IN 1914. | |
|---|---|
| £ | |
| 1914 | 26,261,447 |
| 1913 | 22,986,722 |
The war year saw a very great increase over the previous years exports, amounting to 14¼ per cent. The actual increase in value was £3,274,725, and represents mainly increases in the four main exports — wool, meat, butter, and cheese. The wool-clip of 1914–15 was ready early, and the prices at the first sales were such as to cause brokers and owners to rush the wool on the market as quickly as possible, so that the exports for 1914 were abnormally swollen. Prices, however, mainly owing to the unusually heavy offering, fell in the big sales, and therefore little of the increase in export values is due to the influence of prices. A fuller discussion of the effect of prices will be found later in this subsection.
The greatest increase, however, was in the export of frozen meat, which, until the scarcity of shipping early in 1915, increased both in quantity and in value, so that the amount of the increase was greater than that of the wool, and the amount exported constitutes a record.
The exports of cheese continued their rapid expansion, and increased 45 per cent. over 1913. Since 1905 the exports of cheese have multiplied themselves more than twelve times, and even since 1911 have more than doubled. Butter also showed an increase of over a quarter of a million, which is all the more creditable when the great increase of cheese is remembered.
Gold shows a decreased export of more than half a million, mainly owing to the restrictions on export since the war began. The Banking Amendment Act, 1914, was passed, prohibiting the export of gold unless with the consent of the Minister of Finance. Shortly after the outbreak of the war, also, the Government was asked to purchase gold on behalf of the Bank of England, and a very considerable amount has been so purchased. The following table shows the changes in the main items comparing 1914 with 1913: —
| INCREASES OR DECREASES INTHE MAIN EXPORTS IN 1914. | ||||||
|---|---|---|---|---|---|---|
| Value. | Amount of | Percentage. | ||||
| Article. | 1914. | 1913. | Increase. | Decrease. | Increase. | Decrease. |
| £ | £ | £ | £ | Per Cent. | Per Cent. | |
| Wool | 9,318,114 | 8,057,620 | 1,260,494 | .. | 15.6 | .. |
| Frozen meat | 5,863,062 | 4,449,933 | 1,413,129 | .. | 31.8 | .. |
| Butter | 2,338,576 | 2,061,651 | 276,925 | .. | 13.4 | .. |
| Cheese | 2,564,125 | 1,770,297 | 793,828 | .. | 44.8 | .. |
| Tallow | 694,348 | 663,088 | 31,260 | .. | 4.7 | .. |
| Skins, hides and pelts | 1,314,156 | 1,199,375 | 114,781 | .. | 9.6 | .. |
| Wheat | 3,580 | 11,816 | .. | 8,236 | .. | 69.7 |
| Oats | 165,930 | 29,252 | 136,678 | .. | 46.7 | .. |
| Gold | 895,367 | 1,459,499 | .. | 564,132 | ., | 38.7 |
| Coal | 282,163 | 205,010 | 77,153 | .. | 37.6 | .. |
| Kauri-gum | 497,444 | 549,106 | .. | 51,662 | .. | 9.4 |
| Phormium | 492,230 | 797,062 | .. | 304,832 | .. | 38.2 |
| Timber | 422,550 | 319,055 | 103,495 | .. | 32.4 | .. |
| Total Exports | 2,6261,447 | 22,986,722 | 3,274,725 | .. | 14.25 | .. |
In 1914 a new method of classification was adopted, and both imports and exports were divided into classes, which will in the future be adhered to in all statistical comparisons. The total exports of each class are shown in the following table:—
| EXPORTS BY CLASSES. | |||
|---|---|---|---|
| No. | Class. | Value, 1914. | |
| Domestic Produce. | Foreign Produce. | ||
| £ | £ | ||
| I | Foodstuffs of animal origin (excluding live animals) | 11,097,892 | 10,835 |
| II | Foodstuffs of vegetable origin, and common salt. | 415,336 | 13,070 |
| III | Beverages (non-alcoholic), and substances used in making up the same | 1,747 | 4,623 |
| IV | Spirits and alcoholic liquors | 1,769 | 6,710 |
| V | Tobacco, and preparations thereof | .. | 15,208 |
| VI | Live animals | 122,900 | 1,160 |
| VII | Animal substances (mainly unmanufactured), not being foodstuffs | 10,649,468 | 275 |
| VIII | Vegetable substances and non-manufactured fibres | 600,650 | 12,645 |
| IXA | Apparel | 14,326 | 9,168 |
| IXB | Textiles | 12,282 | 24,656 |
| IXc | Manufactured fibres | 5,480 | 3,780 |
| X | Oils, fats, and waxes | 704,542 | 11,742 |
| XI | Paints and varnishes | 222 | 4,509 |
| XII | Stones and minerals used industrially | 786,703 | 4,836 |
| XIII | Specie | .. | 7,522 |
| XIVA | Metal (unmanufactured and partly manufactured), and ores | 995,660 | 1,944 |
| XIVB | Metal manufactures, other than machinery and machines | 4,978 | 22,205 |
| XV | Machinery and machines | 9,422 | 20,458 |
| XVIA | Indiarubber and manufactures thereof (not including tires) | 4,395 | 2,257 |
| XVIB | Leather and manufactures thereof, including substitutes | 41,038 | 531 |
| XVIIA | Timber | 422,864 | 136 |
| XVIIB | Wood, cane, and wicker manufactures | 3,279 | 1,302 |
| XVIII | Earthenware, china, glass, stoneware, cement, and cement materials | 12,791 | 2,600 |
| XIXA | Paper | 162 | 242 |
| XIXB | Stationery | 10,332 | 10,006 |
| XX | Jewellery, timepieces, and fancy goods | 467 | 7,045 |
| XXI | Optical, surgical, and scientific instruments | 349 | 16,424 |
| XXIIA | Drugs, chemicals, and druggists' wares | 3,739 | 10,222 |
| XXIIB | Manures | 302 | 18 |
| XXIII | Miscellaneous | 17,152 | 50,601 |
| .. | Parcels-post | 44,470 | .. |
| Total | 25,984,717 | 276,730 | |
It will be seen that the great bulk of the exports fall into two classes— I, which includes butter and cheese, frozen meat and fish: and VII, which includes wool, hides, skins, pelts, and hair. Mineral products fall under XII and XIVA, and timber under XVIIA: tallow is the main item in X, phormium, seeds, and fungus in VIII, while the main agricultural products are included in II.
The re-exports are clearly shown to be spread over various manufactured items, and, indeed, are mainly returned imports, since the genuine entrepôt trade is very small.
The principal items of export may conveniently be grouped under six definite heads, and for over forty years a decennial table has been published in the Statistics of New Zealand using this method of summary. Figures from 1905 to 1914 may be found in the Statistics of New Zealand for 1914, Vol. ii.
A comparative statement is given below for the last five years, following the classification therein adopted.
Practically all the main commodities are homogeneous articles, and it is therefore possible to give the quantities exported. For some purposes quantities are preferable to values, since the latter contain the variable element of price.
| QUANTITIES OFTHE PRINCIPAL ARTICLES OF NEW ZEALAND PRODUCE EXPORTED, 1910–14. | |||||
|---|---|---|---|---|---|
| Articles. | 1910. | 1911. | 1912. | 1913. | 1914. |
| The mine— | |||||
| Coal (tons) | 27,011 | 223,275 | 229,012 | 211,749 | 302,908 |
| Gold (oz.) | 478,286 | 454,837 | 343,163 | 376,161 | 227,954 |
| Silver “ | 1,711,235 | 1,311,043 | 801,165 | 975,616 | 599,162 |
| Other minerals (tons) | 263 | 303 | 137 | 227 | 337 |
| The fisheries— | |||||
| Fish (cwt.) | 10,306 | 14,522 | 14,284 | 12,038 | 14,601 |
| Oysters (doz.) | 339,690 | 280,925 | 378,896 | 361,225 | 302,163 |
| Whalebone (lb.) | 2,576 | 10,752 | 11,992 | 6,272 | 3,024 |
| Whale-oil (gal.) | 23,323 | 34,828 | 28,295 | 247,831 | 44,616 |
| The forest— | |||||
| Fungus (cwt.) | 6,321 | 3,359 | 3,790 | 2,304 | 2,455 |
| Kauri-gum (tons) | 8,693 | 7,587 | 7,908 | 8,780 | 8,473 |
| Timber, sawn hewn and (sup. ft.) | 81,940,062 | 86,309,570 | 94,454,491 | 63,469,105 | 83,342,949 |
| Pastoral products— | |||||
| Bacon and hams (cwt.) | 2,699 | 2,035 | 2,736 | 1,020 | 1,389 |
| Beef and pork, salted ” | 11,704 | 10,493 | 8,822 | 6,883 | 6,201 |
| Butter ” | 356,535 | 302,387 | 378,117 | 372,258 | 434,067 |
| Cheese ” | 451,915 | 439,174 | 577,070 | 611,663 | 863,776 |
| Hides (number) | 175,347 | 129,841 | 146,796 | 169,333 | 215,401 |
| Live-stock | |||||
| Cattle (number) | 227 | 371 | 379 | 273 | 401 |
| Horses ” | 5,643 | 5,471 | 2,022 | 738 | 2,914 |
| Sheep ” | 6,335 | 7,909 | 6,475 | 11,803 | 8,066 |
| Pigs ” | 729 | 696 | 510 | 198 | 293 |
| Preserved meats (cwt.) | 62,520 | 57,098 | 43,493 | 36,885 | 36,338 |
| Frozen meats ” | 2,654,196 | 2,250,565 | 2,573,238 | 2,578,963 | 3,210,205 |
| Sausage-skins ” | 22,375 | 21,911 | 31,576 | 30,801 | 40,322 |
| Rabbit-skins (number) | 9,103,954 | 7,455,288 | 8,937,035 | 6,267,608 | 4,512,171 |
| Sheep-skins and pelts ” | 7,810,586 | 7,619,915 | 7,920,972 | 8,171,275 | 8,525,611 |
| Tallow (cwt.) | 520,180 | 413,120 | 470,900 | 454,860 | 490,300 |
| Wool (lb.) | 204,368,957 | 169,424,811 | 188,361,790 | 186,533,036 | 220,472,898 |
| Agricultural products— | |||||
| Bran and sharps (tons) | 3,420 | 912 | 4,203 | 1,944 | 4,758 |
| Chaff ” | 142 | 161 | 844 | 198 | 1,471 |
| Flour ” | 127 | 118 | 307 | 206 | 62 |
| Grain— | |||||
| Barley (bushel) | 42,928 | 103,602 | 225,841 | 4,747 | 27,317 |
| Beans and peas ” | 193,527 | 332,227 | 464,609 | 339,998 | 183,032 |
| Maize ” | 247 | 197 | 4,081 | 197 | 52 |
| Malt ” | 4 | 2,181 | 25 | 14 | 89 |
| Oats ” | 444,586 | 72,826 | 4,123,920 | 239,268 | 529,345 |
| Wheat ” | 1,294,328 | 1,254,557 | 505,205 | 62,338 | 10,248 |
| Hops (cwt.) | 3,851 | 1,833 | 2,473 | 4,447 | 3,476 |
| Oatmeal ” | 25 | 20 | 232 | 12 | 30 |
| Potatoes (tons) | 505 | 1,263 | 19,964 | 1,556 | 1,744 |
| Seeds (grass and clover) (bushel) | 307,698 | 103,253 | 203,526 | 199,298 | 39,572 |
| Miscellaneous— | |||||
| Ale and beer (pal.) | 16,583 | 18,172 | 17,490 | 14,189 | 15,774 |
| Cordage (cwt.) | 1,168 | 1,254 | 881 | 1,282 | 2,945 |
| Leather ” | 4,317 | 4,093 | 6,593 | 4,450 | 5,138 |
| Phormium-fibre (tons) | 20,645 | 17,366 | 18,641 | 28,092 | 23,928 |
| Soap (cwt.) | 6,927 | 7,452 | 6,193 | 7,350 | 6,470 |
The values of these principal commodities are tabulated in the following pages, and the statement of exports is rendered complete by the addition of miscellaneous groups and the provision of totals for each group and for all combined.
| VALUE OF PRINCIPAL ARTICLES EXPORTEDFOR THE YEARS 1910–14. | |||||
|---|---|---|---|---|---|
| Articles. | 1910. | 1911. | 1912. | 1913. | 1914. |
| The mine— | £ | £ | £ | £ | £ |
| Coal | 259,562 | 204,379 | 216,170 | 205,010 | 282,163 |
| Gold | 1,896,318 | 1,815,251 | 1,345,131 | 1,459,499 | 895,367 |
| Silver | 171,562 | 131,587 | 84,739 | 103,866 | 62,085 |
| Other minerals | 16,906 | 18,920 | 14,240 | 23,402 | 24,277 |
| Totals | 2,344,348 | 2,165,137 | 1,660,280 | 1,791,777 | 1,263,892 |
| The fisheries— | |||||
| Fish | 20,600 | 27,608 | 33,746 | 23,721 | 34,778 |
| Oysters | 2,617 | 2,178 | 2,984 | 2,813 | 2,396 |
| Whalebone | 1,010 | 4,552 | 3,196 | 1,537 | 1,243 |
| Whale-oil | 1,609 | 2,732 | 2,052 | 18,481 | 2,910 |
| Other | 285 | 233 | 222 | 26,959 | 2,166 |
| Totals | 26,121 | 37,303 | 42,200 | 73,511 | 43,493 |
| The forest— | |||||
| Fungus | 16,447 | 7,558 | 8,433 | 5,655 | 6,706 |
| Kauri-gum | 465,044 | 395,707 | 401,305 | 549,106 | 497,444 |
| Timber, sawn and hewn | 407,658 | 439,353 | 490,508 | 319,055 | 422,705 |
| Other | 454 | 692 | 425 | 294 | 627 |
| Totals | 889,603 | 843,310 | 900,671 | 874,110 | 927,482 |
| Pastoral products— | |||||
| Bacon and hams | 8,876 | 7,504 | 11,282 | 4,991 | 6,594 |
| Beef and pork, salted | 15,855 | 14,619 | 13,730 | 11,220 | 10,317 |
| Butter | 1,811,975 | 1,576,917 | 2,088,809 | 2,061,651 | 2,338,576 |
| Cheese | 1,195,373 | 1,192,057 | 1,680,393 | 1,770,297 | 2,564,125 |
| Hides | 230,267 | 165,769 | 221,594 | 261,744 | 358,618 |
| Live-stock— | |||||
| Cattle | 3,177 | 4,744 | 3,810 | 3,515 | 6,056 |
| Horses | 167,075 | 171,593 | 86,198 | 38,049 | 84,481 |
| Sheep | 21,528 | 22,018 | 21,747 | 37,071 | 30,703 |
| Pigs | 2,170 | 1,813 | 1,474 | 535 | 726 |
| Other | 678 | 877 | 1,382 | 1,050 | 929 |
| Preserved meats | 146,529 | 141,549 | 119,178 | 108,995 | 111,217 |
| Frozen meats | 3,850,777 | 3,503,406 | 3,909,569 | 4,449,933 | 5,863,062 |
| Sausage-skins | 77,307 | 76,560 | 91,688 | 93,251 | 139,452 |
| Rabbit-skins | 132,773 | 76,712 | 118,234 | 86,756 | 48,383 |
| Sheep-skins and pelts | 741,259 | 633,523 | 707,203 | 800,354 | 856,832 |
| Tallow | 756,841 | 607,257 | 684,739 | 663,088 | 694,348 |
| Wool | 8,308,410 | 6,491,707 | 7,105,483 | 8,057,620 | 9,318,114 |
| Other | 44,519 | 55,035 | 64,296 | 66,666 | 96,974 |
| Totals | 17,515,389 | 14,743,660 | 16,930,809 | 18,518,786 | 22,529,517 |
| Agricultural products— | |||||
| Bran and sharps | 11,259 | 3,896 | 19,648 | 8,097 | 19,582 |
| Chaff | 659 | 1,081 | 3,924 | 1,153 | 7,609 |
| Flour | 1,419 | 1,019 | 2,861 | 1,685 | 701 |
| Grain— | |||||
| Barley | 8,479 | 22,915 | 48,621 | 959 | 9,090 |
| Beans and peas | 48,851 | 78,805 | 112,135 | 89,124 | 91,078 |
| Maize | 52 | 39 | 808 | 47 | 21 |
| Malt | 2 | 464 | 12 | 7 | 32 |
| Oats | 44,299 | 9,211 | 483,756 | 29,252 | 165,030 |
| Wheat | 216,657 | 219,196 | 95,702 | 11,816 | 3,580 |
| Hops | 20,447 | 11,221 | 21,348 | 22,680 | 21,811 |
| Oatmeal | 289 | 266 | 2,632 | 184 | 219 |
| Potatoes | 3,509 | 6,374 | 150,303 | 7,443 | 7,014 |
| Seeds (grass and clover) | 113,568 | 40,317 | 69,694 | 60,492 | 73,551 |
| Other | 12,032 | 18,011 | 49,161 | 47,037 | 48,186 |
| Totals | 481,522 | 412,815 | 1,060,605 | 279,976 | 448,404 |
| Miscellaneous— | |||||
| Ale and beer | 1,944 | 2,338 | 1,910 | 1,383 | 1,743 |
| Apparel | 3,488 | 3,692 | 2,122 | 1,397 | 11,875 |
| Cordage | 2,219 | 2,329 | 1,644 | 2,565 | 5,332 |
| Leather | 23,721 | 27,263 | 38,454 | 31,945 | 40,965 |
| Phormium-fibre | 448,414 | 300,209 | 376,264 | 721,924 | 492,230 |
| Soap | 7,414 | 9,037 | 8,209 | 8,882 | 7,935 |
| Woollen-manufactures | 10,653 | 10,754 | 14,599 | 11,213 | 13,755 |
| Other | 151,975 | 182,373 | 205,356 | 220,593 | 198,094 |
| Totals | 649,828 | 537,995 | 636,795 | 987,072 | 771,929 |
| Total exports (domestic produce) | 21,944,163 | 18,781,898 | 21,272,405 | 22,577,890 | 25,984,717 |
| Specie | 27,736 | 48,305 | 258,955 | 176,359 | 7,522 |
| Re-exports | 208,310 | 198,287 | 239,221 | 232,473 | 269,208 |
| Total exports | 22,180,209 | 19,028,490 | 21,770,581 | 22,986,722 | 26,261,447 |
The first exports from New Zealand went naturally to the earlier-developed sister colony, and for a considerable time Australia had a monopoly of our trade. In 1865 70 per cent., and even in 1871 44 per cent., of the total exports went to Australia. But with the introduction of direct shipping lines with the United Kingdom the proportion of exports shipped to the Motherland has become of overwhelming importance, while Australia's share has dwindled steadily down to 10–15 per cent. in the last few years. Abnormal years, however, especially those in which a drought affects Australia, are reflected in increased exports from New Zealand to that country.
For the last forty years the exports to the United Kingdom have fluctuated between 70 and 80 per cent. of the total, reaching 84 per cent. in 1877, 86 per cent. in 1894, and 84 per cent. again in 1910, while the figure for 1914 was 81 per cent. The only other countries which offer a steady market for New Zealand exports are—United States, 3 to 5 per cent.; the Pacific islands, about 2 per cent.: Canada, 2 per cent.: and Germany. 2 per cent. The remaining countries, all added together, can account for only about 3 per cent. Practically all of New Zealand's exports are sent direct to the United Kingdom.
| — | United Kingdom. | Australia. | Canada. | Pacific Islands.* | United States. | Germany. | Other Countries.† | Total. |
|---|---|---|---|---|---|---|---|---|
* Includes Cook Islands prior to 1902. † The principal other countries are Gibraltar, Ceylon, South African Union, Belgium, France, Japan, Uruguay. | ||||||||
| £ | £ | £ | £ | £ | £ | £ | £ | |
| 1893 | 7,045,646 | 1,035,753 | 122 | 125,643 | 316,639 | 2,481 | 23,940 | 8,550,224 |
| 1890 | 7,541,981 | 1,287,001 | 113 | 126,759 | 326,589 | 5,190 | 33,472 | 9,321,105 |
| 1897 | 8,168,123 | 1,323,784 | 1,026 | 117,365 | 375,096 | 5,468 | 26,131 | 10,016,993 |
| 1898 | 8,265,499 | 1,475,157 | 3,716 | 108,315 | 623,133 | 17,244 | 24,891 | 10,517,955 |
| 1899 | 9,427,515 | 1,708,036 | 6,363 | 133,896 | 433,499 | 28,027 | 200,999 | 11,938,335 |
| 1900 | 10,259,342 | 1,858,582 | 287 | 183,641 | 458,796 | 24,186 | 461,327 | 13,246,161 |
| 1901 | 9,295,375 | 1,993,831 | 2,118 | 157,594 | 519,079 | 10,470 | 902,957 | 12,881,424 |
| 1902 | 9,450,648 | 2,684,350 | 7,366 | 159,214 | 489,964 | 9,389 | 844,046 | 13,644,977 |
| 1903 | 11,345,075 | 2,233,996 | 2,421 | 160,133 | 669,649 | 17,584 | 581,520 | 15,010,378 |
| 1904 | 11,876,273 | 1,317,622 | 15,961 | 166,767 | 598,921 | 23,931 | 248,873 | 14,748,348 |
| 1905 | 12,087,818 | 2,294,971 | 51,329 | 170,210 | 716,301 | 38,958 | 296,360 | 15,655,947 |
| 1906 | 14,047,176 | 2,882,522 | 29,815 | 188,755 | 642,792 | 54,952 | 249,125 | 18,095,137 |
| 1907 | 16,533,493 | 2,221,260 | 78,015 | 186,839 | 714,063 | 66,489 | 268,798 | 20,068,957 |
| 1908 | 13,143,780 | 2,103,161 | 24,051 | 203,581 | 326,415 | 40,191 | 476,315 | 16,317,494 |
| 1909 | 16,193,188 | 1,918,115 | 180,975 | 258,164 | 684,810 | 77,969 | 348,775 | 19,661,996 |
| 1910 | 18,633,118 | 2,010,751 | 160,842 | 296,244 | 553,603 | 205,931 | 319,720 | 22,180,209 |
| 1911 | 15,134,743 | 2,515,168 | 199,587 | 324,306 | 434,586 | 170,493 | 249,607 | 19,028,490 |
| 1912 | 16,861,256 | 2,848,664 | 542,271 | 338,621 | 620,988 | 254,703 | 304,078 | 21,770,581 |
| 1913 | 18,130,160 | 2,315,747 | 606,662 | 295,032 | 912,051 | 337,448 | 389,622 | 22,986,722 |
| 1914 | 21,383,891 | 1,928,410 | 595,611 | 326,025 | 1,028,054 | 456,163 | 543,293 | 26,261,447 |
The exports to Australia show a considerable degree of fluctuation, but on the whole tend to increase. Canada shows a rapid development, especially in the last few years since 1908, and now ranks as the fourth market. The Pacific islands increase in much the same proportion as the total exports.
Exports to the United States show big fluctuations all through the period, but the figures for 1913–14 are the largest on record. The development of trade with Germany, too, is a striking feature of the table, and exports have increased tenfold in the last decade, notwithstanding the fact that the figures for 1914 represent only seven months' exports.
The total for other countries is swollen in 1899–1902 by the abnormal diversion of trade caused by the South African War; but, apart from this period, shows a steady increase as New Zealand's trade with outside countries naturally develops.
Mainly owing to the predominance of the United Kingdom, New Zealand's exports go almost wholly to the British Empire. The great bulk of the trade goes to the United Kingdom: Australia accounts for four-fifths of the exports to the colonies; and Canada and the Pacific islands take most of the remainder. Foreign countries are still less than the colonies, though the irate of increase in recent years is relatively greater. The principal foreign countries are United States, Germany. France, and Japan.
Included in the exports to the United Kingdom, however, are considerable quantities of wool and similar commodities which are shipped to London merely as a convenient depot, and which are retransferred to the Continent or America. The following figures, taken from the Board of Trade statement Cd. 7585, will show the extent to which the United Kingdom serves as a distributing centre for our exports:—
| IMPORTS INTOAND RE-EXPORTS FROMTHE UNITED KINGDOM OF NEW ZEALAND PRODUCE. | ||||||||||
|---|---|---|---|---|---|---|---|---|---|---|
| Article | Imports from New Zealand. | Re-exports. | ||||||||
| 1909. | 1910. | 1911. | 1912. | 1913. | 1909. | 1910. | 1911. | 1912. | 1913. | |
* Re-exports greater than imports. | ||||||||||
| £ | £ | £ | £ | £ | £ | £ | £ | £ | £ | |
| Butter | 1,472,219 | 2,001,398 | 1,495,242 | 2,148,192 | 1,351,285 | 59,796 | 100,903 | 136,777 | 267,900 | 216,465 |
| Cheese | 1,113,714 | 1,310,550 | 1,209,549 | 1,882,840 | 1,685,472 | 2,123 | 2,164 | 2,729 | 3,272 | 3,861 |
| Wheat | 131,297 | 239,526 | 280,822 | 124,227 | 23,210 | 3,440 | 36 | 2,560 | 102 | 85 |
| Oats | 554,551 | 43,838 | 15 | 123,466 | 41,818 | 247 | 1,256 | 96* | 1,137 | 313 |
| Beef (fresh and frozen) | 660,319 | 797,535 | 372,424 | 429,624 | 393,429 | 396 | 878 | 394 | .. | 185 |
| Mutton (fresh and frozen) | 3,499,053 | 4,238,173 | 3,926,751 | 4,555,786 | 4,965,310 | 5,719 | 5,511 | 5,336 | 5,444 | 4,482 |
| Sausage-skins | 144,083 | 174,459 | 144,914 | 125,119 | 167,565 | 168,190* | 141,680 | 131,225 | 122,699 | 131,189 |
| Kauri-gum | 765,917 | 628,778 | 537,412 | 558,828 | 593,729 | 711,898 | 520,200 | 466,544 | 475,999 | 482,850 |
| Hemp (dressed, undressed) and tow | 229,233 | 456,916 | 337,984 | 395,222 | 718,959 | 204,292 | 330,616 | 272,363 | 309,986 | 553,480 |
| Copra | 104,285 | 154,678 | 140,265 | 133,206 | 161,664 | 63,115 | 151,205 | 115,610 | 110,012 | 81,321 |
| Sheep-skins (undressed) | 610,671 | 622,939 | 599,247 | 677,734 | 641,853 | 454,907 | 410,676 | 321,966 | 396,805 | 464,500 |
| Rabbit-skins “ | 66,977 | 102,129 | 76,547 | 103,561 | 92,149 | 62,207 | 54,789 | 38,426 | 21,751 | 15,299 |
| Tallow | 700,067 | 818,932 | 680,588 | 724,303 | 717,264 | 237,316 | 204,313 | 143,584 | 106,350 | 78,645 |
| Wool | 6,935,431 | 8,526,757 | 7,476,011 | 7,701,364 | 8,165,408 | 2,001,051 | 1,728,883 | 1,563,529 | 2,220,397 | 1,829,105 |
| Total | 17,730,866 | 20,943,142 | 17,850,063 | 20,302,062 | 20,338,057 | 4,083,367 | 3,820,774 | 3,301,598 | 4,308,291 | 4,065,815 |
From this table it may be seen that the bulk of the re-exports consists of wool, which, to the value of nearly £2,000,000 annually, is redistributed from London to the manufacturing centres of Belgium, northern France, and Germany. This amounts to a big proportion of the Dominion's wool exports, averaging about 25 per cent.
Of late years there has evidently been an increasing tendency to reexport butter; but the highest value yet reached is £267,900. Practically all the cheese, wheat, oats, beef, and mutton is consumed in the United Kingdom itself, but there are several other items which are re-exported in great quantities.
Most of these items are by-products such as sausage-skins, or are used in special manufactures by Continental countries. Practically all the kauri-gum is re-exported, three-fourths of the phormium, most of the copra, three-fourths of the sheep-skins.
The re-exports of rabbit-skins and of tallow, both of which were relatively heavy in the earlier years, show a distinct tendency to decrease. The total re-exports fluctuate about £4,000,000 annually.
It would seem, then, that on the average only about four-fifths of the exports from New Zealand to the United Kingdom are retained in that country, and the remaining fifth is distributed to Europe and America. Even deducting this re-export trade, the exports retained in the United Kingdom amount to about 65 per cent. of the total. The following table must be read subject to the remarks made above:—
| Year. | United Kingdom. | British Colonies and Possessions. | Foreign Countries. | Total. |
|---|---|---|---|---|
| £ | £ | £ | £ | |
| 1895 | 7,045,646 | 1,091,062 | 413,516 | 8,550,224 |
| 1896 | 7,541,981 | 1,346,544 | 432,580 | 9,321,105 |
| 1897 | 8,168,123 | 1,380,502 | 468,368 | 10,016,993 |
| 1898 | 8,265,499 | 1,532,511 | 719,945 | 10,517,955 |
| 1899 | 9,427,515 | 1,850,239 | 660,581 | 11,938,335 |
| 1900 | 10,259,342 | 2,332,780 | 654,039 | 13,246,161 |
| 1901 | 9,295,375 | 2,907,412 | 678,637 | 12,881,424 |
| 1902 | 9,450,648 | 3,577,815 | 616,514 | 13,644,977 |
| 1903 | 11,345,075 | 2,821,608 | 843,695 | 15,010,378 |
| 1904 | 11,876,273 | 2,088,691 | 783,384 | 14,748,348 |
| 1905 | 12,087,818 | 2,591,802 | 976,327 | 15,655,947 |
| 1906 | 14,047,176 | 3,141,327 | 906,634 | 18,095,137 |
| 1907 | 16,533,493 | 2,559,631 | 975,833 | 20,068,957 |
| 1908 | 13,143,780 | 2,414,521 | 759,193 | 16,317,494 |
| 1909 | 16,193,188 | 2,449,691 | 1,019,117 | 19,661,996 |
| 1910 | 18,633,118 | 2,468,119 | 1,078,972 | 22,180,209 |
| 1911 | 15,134,743 | 2,966,952 | 926,795 | 19,028,490 |
| 1912 | 16,861,256 | 3,641,276 | 1,268,049 | 21,770,581 |
| 1913 | 18,130,160 | 3,135,957 | 1,720,605 | 22,986,722 |
| 1914 | 21,383,891 | 2,724,965 | 2,152,591 | 26,261,447 |
The following table shows in more detail the exports for the five years ending with 1914, according to the countries of destination. The British possessions are stated first, according to geographical order, and then foreign countries in the same order.
| DESTINATION OF EXPORTS FROM NEW ZEALAND, 1910–14. | |||||
|---|---|---|---|---|---|
| Country. | 1910. | 1911. | 1912. | 1913. | 1914. |
* Till 1914 included in Samoa. | |||||
| £ | £ | £ | £ | £ | |
| United Kingdom | 18,633,118 | 15,134,743 | 16,861,256 | 18,130,160 | 21,383,891 |
| British Possessions. | |||||
| Europe— | |||||
| Gibraltar | 9,780 | 5,287 | 19,165 | 10,907 | 16,431 |
| Malta | 799 | 5 | .. | 2 | .. |
| 10,579 | 5,292 | 19,165 | 10,909 | 16,431 | |
| Asia— | |||||
| Burma | 128 | 22 | 12 | 6 | 17 |
| Ceylon | 129,119 | 97,780 | 41,754 | 43,675 | 41,871 |
| Hong Kong | 16,822 | 8,038 | 7,921 | 5,545 | 7,151 |
| India | 3,386 | 2,318 | 1,659 | 729 | 1,512 |
| Straits Settlements | 181 | 87 | 42 | 45 | 769 |
| Other Asiatic possessions | .. | 33 | 15 | 9 | 37 |
| 149,636 | 108,278 | 51,406 | 50,009 | 51,357 | |
| Africa— | |||||
| Mauritius | 4 | 5 | 5 | 6 | 3 |
| South African Union | 45,555 | 43,745 | 83,229 | 61,651 | 60,826 |
| Other African possessions | 117 | 32 | 128 | 64 | 48 |
| 45,676 | 43,782 | 83,362 | 61,721 | 60,877 | |
| America— | |||||
| British West Indies | 4 | 1 | 2 | 2 | 6 |
| Canada | 160,842 | 199,587 | 542,271 | 606,662 | 595,611 |
| Other American possessions | 3 | 6 | 3 | 4 | |
| 160,846 | 199,591 | 542,279 | 606,667 | 595,621 | |
| Pacific Islands— | |||||
| Australia | 2,010,751 | 2,515,168 | 2,848,664 | 2,315,747 | 1,928,410 |
| Fiji | 88,331 | 93,226 | 95,134 | 88,789 | 67,557 |
| Other Pacific islands | 1,714 | 1,615 | 1,266 | 1,115 | 4,712 |
| 2,100,796 | 2,610,009 | 2,945,064 | 2,405,651 | 2,000,679 | |
| Foreign Countries and Possessions. | |||||
| Europe— | |||||
| Austria | 2,680 | 3,985 | 4,647 | 2,809 | 1,260 |
| Belgium | 25,398 | 30,876 | 24,218 | 18,522 | 33,484 |
| France | 46,528 | 40,204 | 94,382 | 178,336 | 227,027 |
| Germany | 205,931 | 170,493 | 254,703 | 337,448 | 456,163 |
| Hungary | 439 | 1 | .. | 3 | 46 |
| Italy | 879 | 451 | 514 | 322 | 907 |
| Netherlands | 240 | 1,989 | 1,675 | 3,986 | 749 |
| Norway | 27 | 25 | 11 | 25,295 | 35 |
| Sweden | 799 | 899 | 978 | 733 | 599 |
| Other European countries | 10,174 | 3,126 | 1,698 | 3,028 | 1,232 |
| 293,095 | 252,049 | 382,826 | 570,482 | 721,502 | |
| Asia— | |||||
| China | 2,805 | 100 | 768 | 124 | 167 |
| Japan | 647 | 377 | 1,460 | 2,901 | 59,508 |
| Other Asiatic countries | 561 | 130 | 460 | 523 | 198 |
| 4,013 | 607 | 2,688 | 3,548 | 59,873 | |
| Africa— | |||||
| Egypt | 3 | 13 | 5 | 3 | 51,786 |
| Other African countries | 370 | 456 | 147 | 488 | 66 |
| 373 | 469 | 152 | 491 | 51,852 | |
| America— | |||||
| Argentina | 3,420 | 622 | 4,951 | 7,532 | 8,413 |
| Brazil | 600 | 2,518 | 1,807 | 1,236 | 4,969 |
| United States of America | 553,603 | 434,586 | 620,988 | 912,051 | 1,028,054 |
| Uruguay | 15,401 | 5,418 | 9,747 | 19,554 | 23,838 |
| Other American countries | 2,175 | 1,021 | 2,667 | 1,583 | 334 |
| 575,199 | 444,165 | 638,160 | 941,956 | 1,065,608 | |
| Pacific islands— | |||||
| German Samoa | 48,606 | 55,438 | 64,534 | 61,158 | 59,938 |
| Hawaii | 301 | 448 | 2,484 | 5,911 | 12,262 |
| Society Islands | 44,986 | 62,815 | 68,145 | 80,487 | 72,039 |
| Tonga | 99,334 | 97,510 | 98,682 | 41,746 | 36,393 |
| Tutuila* | .. | .. | .. | .. | 1,025 |
| Other foreign Pacific islands | 13,651 | 13,254 | 8,376 | 14,826 | 72,099 |
| 206,878 | 229,465 | 242,221 | 204,128 | 253,756 | |
| PRINCIPAL ARTICLES EXPORTEDTO THE UNITED KINGDOM DURINGTHE YEARS 1910–14. | |||||||
|---|---|---|---|---|---|---|---|
| Class. | Item. | Article. | 1910. | 1911. | 1912. | 1913. | 1914. |
* Includes horse-hides. † Not shown in 1910–11. ‡ New headings, 1914. | |||||||
| £ | £ | £ | £ | £ | |||
| I | 1 | Butter | 1,750,256 | 1,471,167 | 1,726,631 | 1,576,631 | 1,925,222 |
| 4 | Cheese | 1,187,181 | 1,181,237 | 1,664,859 | 1,760,814 | 2,551,758 | |
| 14 | Honey | 1,625 | 2,824 | 936 | 3,471 | 4,993 | |
| Meats, poultry and game— | |||||||
| 19 | Beef, frozen | 592,114 | 288,251 | 318,509 | 283,199 | 979,614 | |
| 20 | Beef, salted | 3,695 | 2,364 | 1,043 | 40 | 2,018 | |
| 24 | Kidneys, frozen | 15,729 | 13,216 | 11,343 | 12,848 | 19,738 | |
| 25 | Lamb, whole carcases, frozen | 1,878,786 | 1,935,127 | 1,925,741 | 2,332,369 | 2,482,272 | |
| 27 | Meat-extract | 7,550 | 2,539 | 5,379 | 6,438 | 8,216 | |
| 28 | Mutton, whole carcases, frozen | 1,192,920 | 1,104,421 | 1,512,240 | 1,624,275 | 2,107,068 | |
| 29 | Mutton, joints, frozen | 58,629 | 43,927 | 55,186 | 31,728 | 33,202 | |
| 30 | Pork, frozen | 20,736 | 25,714 | 1,044 | 5,843 | 1,833 | |
| 32 | Potted and preserved | 75,955 | 67,443 | 41,522 | 38,499 | 41,984 | |
| 34 | Rabbits, frozen in skins | 70,049 | 79,358 | 54,403 | 74,514 | 68,270 | |
| 36 | Sausage - casings and skins | 75,497 | 72,181 | 84,671 | 85,624 | 125,546 | |
| 37 | Veal, frozen | 96 | 464 | 767 | 752 | 8,703 | |
| 38 | Other kinds; frozen | 7,349 | 7,308 | 8,651 | 7,337 | 12,745 | |
| II | Grain and pulse— | ||||||
| Unprepared— | |||||||
| 78 | Barley | 962 | 1 | 37,000 | 1 | 5,165 | |
| 79 | Beans and peas | 43,633 | 74,454 | 98,906 | 79,696 | 78,095 | |
| 81 | Oats | 24,848 | 13 | 137,427 | 329 | 141,590 | |
| 83 | Wheat | 214,900 | 216,706 | 94,953 | 10,965 | 2,910 | |
| Prepared or manufactured— | |||||||
| 86 | Bran | 3,154 | 358 | 2,293 | 1,530 | 6,041 | |
| 101 | Hops | 5,370 | 3,030 | 10,707 | 7,845 | 2,089 | |
| 102 | Infants' and invalids' foods n.o.e. | 2 | 3,462 | 11,957 | 4,188 | 12,332 | |
| VII | 192 | Hair not made up | 4,471 | 5,028 | 5,531 | 4,847 | 5,126 |
| Hides, pelts, and skins, undressed— | |||||||
| 193 | Calf | 4,053 | 418 | 2,474 | 10,185 | 5,681 | |
| 194 | Cattle | 5,752* | 318* | 929* | 14,577* | 52,856 | |
| 196 | Rabbit | 131,690 | 75,997 | 117,133 | 85,580 | 46,140 | |
| 198 | Sheep, with wool | 188,118 | 166,538 | 145,980 | 182,228 | 179,408 | |
| 199 | Sheep, without wool | 393,088 | 355,438 | 398,722 | 410,853 | 432,596 | |
| Wool— | |||||||
| 204 | Greasy | 6,338,498 | 4,691,378 | 4,971,535 | 5,706,024 | 6,612,226 | |
| 205 | Scoured | 759,951 | 783,590 | 740,721 | 772,819 | 740,148 | |
| 206 | Sliped | 772,915 | 684,489 | 778,058 | 770,257 | 947,623 | |
| 207 | Washed | 19,479 | 12,774 | 18,280 | 21,966 | 25,030 | |
| VIII | 208 | Copra | 41,158 | 29,550 | 29,213 | 20,497 | 10,615 |
| 216 | Phormium tenax | 341,109 | 242,498 | 290,633 | 538,324 | 291,701 | |
| 217 | Rags | 1,982 | 2,102 | 2,887 | 3,680 | 2,625 | |
| 218 | Tow | 25,994 | 18,295 | 23,474 | 55,059 | 26,224 | |
| 223 | Seeds, grass and clover | 68,998 | 21,396 | 33,804 | 28,622 | 20,635 | |
| IXA | 234 | Apparel and ready-made clothing n.o.e. | 21 | 327 | 108 | 88 | 9,312 |
| X | 310 | Glycerine, unrefined | 1,702 | 2,307 | 2,056 | 2,789 | 1,656 |
| 313 | Lard and refined animal fats n.o.e. | 4,564 | 3,562 | 4,341 | 2,328 | 3,004 | |
| Tallow— | |||||||
| 340 | Mutton-stock and oleomargarine | 110,309 | 83,534 | 87,859 | 81,543 | 96,050 | |
| 341 | Unrefined | 643,087 | 522,665 | 595,401 | 580,973 | 595,826 | |
| XII | Coals— | ||||||
| 357 | Bunker | 180,649 | 143,680 | 138,387 | 143,413 | 149,165 | |
| 358 | Cargo | .. | |||||
| 360 | Kauri-gum | 151,319 | 130,767 | 114,640 | 187,547 | 148,370 | |
| Gold— | |||||||
| XIVA | 384 | Bar, dust, ingot, and sheet | 996,081 | 379,596 | 380,530 | 344,547 | 150,519 |
| 385 | Concentrates, slimes, tailings, &c. | † | † | 14,378 | 12,244 | 10,483 | |
| 397 | Metals, scrap (except iron and steel), not being precious | 5,954 | 8,089 | 6,877 | 4,303 | 7,605 | |
| 400 | Scheelite | 272 | 434 | 3,624 | 3,046 | 4,344 | |
| 401 | Silver | 43,090 | 35,574 | 42,941 | 55,450 | 16,472 | |
| XVIA | 574 | Indiarubber, old | 1,735 | 1,650 | 2,465 | 5,072 | 1,786 |
| Leather— | |||||||
| 587 | Hide-leathers, crust or rough tanned but undressed‡ | 20,117 | 24,563 | 35,133 | 30,869 | 5,823 | |
| 591 | Sheep-skins and lambskins n.o.e.‡ | 4,740 | |||||
| 592 | Sole, pump, and skirt leather‡ | 25,350 | |||||
| XVIIA | Timber— | ||||||
| 605 | Flitches, other‡ | .. | .. | .. | .. | 16,635 | |
| Sawn, n.o.e., rough— | |||||||
| 635 | Kauri‡ | .. | .. | .. | .. | 5,430 | |
| 636 | New Zealand white-pine and kahikatea‡ | .. | .. | .. | .. | 5,159 | |
| Parcels-post | 20,973 | 24,486 | 26,671 | 33,350 | 26,449 | ||
| PRINCIPAL ARTICLES EXPORTEDTO OTHER COUNTRIES DURINGTHE YEARS 1910–14. | |||||||
|---|---|---|---|---|---|---|---|
| Class. | Item. | Article. | 1910. | 1911. | 1912. | 1913. | 1914. |
* Includes horse-hides. † Includes cargo coals. * Includes “ordinary,” 1910–13. † New heading, 1914. ‡ Includes horse-hides, 1910–13. § Not available, 1910–11. * New heading, 1914. † Includes horse-hides, 1910–13. | |||||||
| Gibraltar. | |||||||
| £ | £ | £ | £ | £ | |||
| I | 19 | Beef, frozen | 6,348 | 3,448 | 13,863 | 6,836 | 6,626 |
| 28 | Mutton, frozen | 3,432 | 1,839 | 5,502 | 4,071 | 3,839 | |
| Ceylon. | |||||||
| II | 81 | Grain and pulse—Oats | 1,678 | 2,923 | 2,904 | 2,252 | 2,488 |
| XIVA | 401 | Silver | 127,185 | 94,637 | 38,604 | 40,951 | 39,263 |
| Hong Kong. | |||||||
| VIII | 220 | Fungus | 13,242 | 6,171 | 7,590 | 5,151 | 6,343 |
| XIII | 374 | Gold specie | 3,040 | 1,450 | .. | .. | .. |
| South African Union. | |||||||
| I | 1 | Butter | 36,350 | 28,300 | 66,366 | 48,641 | 51,356 |
| 4 | Cheese | 5,323 | 7,202 | 8,617 | 4,731 | 5,952 | |
| VIII | 223 | Seeds (grass and clover) | 844 | 2,265 | 2,507 | 1,563 | 660 |
| Canada. | |||||||
| I | 1 | Butter | 986 | 52,359 | 246,011 | 320,136 | 291,849 |
| 19 | Meats—Beef, frozen | .. | 61 | 693 | 53,807 | 8,108 | |
| II | 134 | Vegetables—Onions | 931 | 605 | 1,790 | 1,338 | 2,312 |
| Hides, pelts, and skins— | |||||||
| Undressed— | |||||||
| VII | 193 | Calf | 15,211 | 28,815 | 30,653 | 29,081 | 30,018 |
| 194 | Cattle | 87,859* | 73,640* | 150,313* | 93,452* | 150,787 | |
| 198 | Sheep, with wool | 21,619 | 6,149 | 51,397 | 33,294 | 31,994 | |
| 199 | Sheep, without, wool | 3,769 | 6,655 | 4,776 | 4,022 | 7,666 | |
| Wool— | |||||||
| 204 | Greasy | .. | 7,747 | 4,339 | 2,239 | 8,872 | |
| 205 | Scoured | 144 | .. | 75 | 19,140 | 6,622 | |
| 206 | Sliped | 18,907 | 17,682 | 36,039 | 24,322 | 31,981 | |
| 207 | Washed | .. | 150 | .. | 686 | 1,073 | |
| VIII | 216 | Phormium tenax | .. | .. | 1,533 | 1,070 | 4,677 |
| XII | 357 | Coals, bunker | .. | 708† | 2,942 | 1,760 | 2,071 |
| 360 | Kauri-gum | 7,687 | 1,061 | 3,370 | 4,618 | 2,114 | |
| Australia. | |||||||
| I | 1 | Butter | 2,814 | 216 | 10,609 | 62 | 3,262 |
| 4 | Cheese | 1,865 | 2,353 | 5,135 | 2,813 | 5,086 | |
| 9 | Fresh oysters | 2,203 | 1,836 | 2,546 | 2,399 | 2,396 | |
| 10 | Fish, fresh or preserved by cold process (other than oysters) | 13,159 | 20,769 | 19,887 | 18,754 | 21,741 | |
| 11 | Fish, preserved in tins or other airtight vessels | 4,752 | 4,744 | 9,766 | 3,862 | 11,945 | |
| 30 | Pork, frozen | 2,239 | .. | 2,354 | .. | 2,364 | |
| 32 | Meats, potted and preserved | 14,290 | 13,641 | 17,605 | 10,242 | 18,015 | |
| 36 | Sausage-casings and skins | 1,064 | 2,046 | 2,993 | 2,320 | 4,484 | |
| II | 54 | Foods for animals—Chaff | 14 | .. | 2,622 | .. | 3,742 |
| Grain and pulse— | |||||||
| Unprepared— | |||||||
| 78 | Barley | 7,159 | 22,439 | 47,991 | 436 | 3,527 | |
| 79 | Beans and peas | 4,509 | 4,223 | 9,453 | 6,298 | 9,066 | |
| 81 | Oats | 15,957 | 4,925 | 339,457 | 22,424 | 18,885 | |
| Prepared or manufactured— | |||||||
| 86 | Bran | 2,923 | 176 | 10,154 | 1,389 | 7,986 | |
| 101 | Hops | 14,220 | 5,899 | 10,150 | 14,529 | 19,522 | |
| 102 | Infants' and invalids' foods n.o.e. | .. | 185 | 1,640 | 11,094 | 26,731 | |
| Vegetables— | |||||||
| 134 | Onions | 375 | 51 | 3,911 | 1,603 | 2,662 | |
| Potatoes | 33 | 398 | 140,633 | 2,847 | 3,104 | ||
| VI | 175 | Cattle for stud purposes* | 801 | 689 | 80 | 524 | 1,654 |
| Horses— | |||||||
| 176 | Ordinary † | 24,644 | |||||
| For stud purposes— | |||||||
| 177 | Entires† | 157,557 | 165,821 | 82,247 | 35,266 | 6,736 | |
| 178 | Mares† | 3,483 | |||||
| 183 | Sheep for breeding purposes* | 7,157 | 14,970 | 11,292 | 24,282 | 20,145 | |
| VII | 192 | Hair, not made up, other | 2,008 | 2,089 | 2,272 | 2,515 | 2,528 |
| Hides, pelts, and skins— | |||||||
| Undressed— | |||||||
| 193 | Calf | 5,460 | 4,703 | 10,246 | 8,538 | 10,096 | |
| 194 | Cattle‡ | 133,270 | 88,729 | 67,500 | 138,720 | 107,507 | |
| 198 | Sheep, with wool | 10,327 | 383 | 142 | 1,006 | 3,668 | |
| 199 | Sheep, without wool | 16,718 | 7,549 | 9,343 | 8,105 | 16,487 | |
| 201 | Horns, hoofs, and glue pieces | 2,602 | 1,965 | 1,277 | 1,625 | 1,754 | |
| Wool— | |||||||
| 204 | Greasy | 19,635 | 11,410 | 15,391 | 43,735 | 8,612 | |
| 206 | Sliped | 410 | .. | 702 | 914 | 1,619 | |
| VIII | 216 | Phormium tenax | 98,045 | 34,414 | 51,196 | 102,210 | 96,672 |
| 218 | Tow | 5,905 | 6,497 | 7,778 | 9,775 | 9,771 | |
| 223 | Seeds (grass and clover) | 28,120 | 14,506 | 29,744 | 21,113 | 47,897 | |
| 224 | Linseed | 2,999 | 6,201 | 14,657 | 4,270 | 4,672 | |
| 225 | Seeds, other | 1,637 | 1,580 | 2,549 | 2,668 | 3,333 | |
| IXB | 288 | Rugs, woollen | 3,497 | 2,548 | 6,702 | 6,188 | 6,759 |
| IXC | 302 | Twine, binder | 134 | 340 | 5,997 | 4,927 | 1,507 |
| IX | 318 | Oil, whale | 794 | 2,360 | 1,696 | 12,620 | 2,910 |
| XII | 357 | Coal, bunker | 41,781 | 42,947 | 44,027 | 50,340 | 22,633 |
| 358 | Coal, cargo | 18,546 | |||||
| 360 | Kauri-gum | 4,444 | 2,559 | 2,487 | 2,362 | 1,720 | |
| 367 | Pumice-sand | 3,720 | 4,922 | 3,241 | 7,022 | 5,251 | |
| XIVA | 379 | Bronze—Blocks, bars, &c. | .. | .. | .. | .. | 2,993 |
| Gold— | |||||||
| 384 | Bar, dust, ingot, and sheet | 909,372 | 1,435,679 | 939,314 | 1,085,422 | 708,573 | |
| 385 | Concentrates, slimes, tailings, &c. | § | § | 11,514 | 21,327 | 27,757 | |
| 397 | Metals, scrap (except iron and steel), not being precious | 1,137 | 431 | 1,101 | 2,143 | 2,545 | |
| 401 | Silver | 1,287 | 1,376 | 926 | 1,806 | 3,171 | |
| XVIA | 574 | Indiarubber, old | 2,773 | 1,080 | 2,479 | 2,240 | 1,907 |
| XVIB | 591 | Leather—Sheep-skins and lamb-skins n.o.e.† | .. | .. | .. | .. | 2,314 |
| Timber— | |||||||
| XVIIA | 605 | Flitches, other† | .. | .. | .. | .. | 7,712 |
| Sawn, n.o.e., rough— | |||||||
| 632 | Beechwood† | .. | .. | .. | .. | 4,058 | |
| 635 | Kauri† | .. | .. | .. | .. | 89,230 | |
| 636 | New Zealand white-pine and kahikatea† | .. | .. | .. | .. | 224,934 | |
| 638 | Rimu or red-pine† | .. | .. | .. | .. | 53,915 | |
| XVIII | 666 | Cement—Building, Portland, and other structural | .. | .. | 9,507 | 4,451 | 7,542 |
| XIXB | 698 | Books, papers, music, printed, n.o.e. | 4,258 | 5,473 | 5,686 | 2,656 | 2,486 |
| Parcels-post | 9,153 | 9,732 | 7,727 | 11,473 | 10,703 | ||
| Fiji. | |||||||
| I | 1 | Butter | 5,361 | 4,806 | 5,622 | 4,992 | 4,631 |
| 16 & 21 | Bacon and hams | 2,154 | 1,657 | 2,479 | 2,218 | 2,719 | |
| 32 | Meats, potted and preserved | 21,316 | 18,142 | 17,151 | 12,825 | 8,054 | |
| II | 86 | Bran | 3,235 | 1,134 | 3,661 | 2,517 | 2,495 |
| 135 | Potatoes | 1,718 | 1,748 | 3,513 | 2,457 | 2,204 | |
| VI | 176 | Horses, ordinary | 3,789 | 4,501 | 2,798 | 1,193 | 1,869 |
| 182 | Sheep, ordinary | 2,666 | 1,876 | 2,224 | 1,973 | 1,158 | |
| IXA | 234 | Apparel and ready-made clothing | 2,961 | 2,781 | 1,611 | 1,083 | 633 |
| Coal— | |||||||
| XII | 357 | Bunker | 12,071 | 7,149 | 12,178 | 13,116 | 2,439 |
| 358 | Cargo | 5,464 | |||||
| Timber— | |||||||
| XVIIA | 628 | Sawn, n.o.e., dressed—Kauri* | .. | .. | .. | .. | 2,032 |
| 635 | Sawn, n.o.e., rough—Kauri* | .. | .. | .. | .. | 4,548 | |
| XVIII | 666 | Cement, building, Portland, and other structural | 182 | 1,335 | 1,842 | 5,939 | 2,662 |
| Austria. | |||||||
| XII | 360 | Kauri-gum | 2,575 | 3,968 | 4,611 | 2,617 | 329 |
| Belgium. | |||||||
| VII | 204 | Wool, greasy | 23,385 | 26,497 | 18,607 | 11,735 | 27,637 |
| XII | 360 | Kauri-gum | 1,899 | 3,990 | 5,088 | 5,120 | 1,519 |
| France. | |||||||
| Wool— | |||||||
| VII | 204 | Greasy | 43,316 | 31,126 | 89,910 | 173,961 | 218,252 |
| 206 | Sliped | .. | 2,863 | .. | .. | .. | |
| XII | 360 | Kauri-gum | 1,656 | 5,774 | 3,037 | 3,995 | 3,599 |
| XIVA | 400 | Scheelite | .. | .. | .. | .. | 3,562 |
| Germany. | |||||||
| I | 3 | Casein. | .. | .. | 960 | 6,452 | 6,703 |
| 36 | Sausage-skins | 500 | .. | 1,249 | 2,640 | 7,619 | |
| VII | 198 | Skins, sheep, with wool | 98 | .. | .. | .. | 2,736 |
| 204 | Wool, greasy | 157,740 | 124,161 | 206,359 | 277,938 | 396,793 | |
| VIII | 223 | Seeds, grass and clover | 1,523 | 17 | 765 | 1,655 | 1,821 |
| XII | 360 | Kauri-gum | 28,016 | 34,062 | 32,964 | 27,880 | 21,193 |
| XIVA | 400 | Scheelite | 14,685 | 10,545 | 8,893 | 16,139 | 13,007 |
| Japan. | |||||||
| VII | 204 | Wool, greasy | 271 | .. | 556 | 2,645 | 59,222 |
| Argentina. | |||||||
| II | 67 | Apples | .. | .. | .. | 6,463 | 7,872 |
| 73 | Pears.. | .. | |||||
| VI | 183 | Sheep for breeding | 1,780 | .. | 2,593 | .. | 180 |
| United States | |||||||
| I | 1 | Butter | 5,965 | 8,658 | 18,963 | 95,857 | 44,773 |
| 19 | Beef, frozen | .. | 62 | .. | 338 | 29,478 | |
| 25 | Lamb, whole carcases, frozen | .. | .. | .. | 1 | 71,214 | |
| 28 | Mutton, whole carcases, frozen | 299 | .. | .. | 62 | 3,038 | |
| 32 | Meats, potted and preserved | .. | .. | .. | 1,054 | 2,416 | |
| 37 | Veal, frozen | .. | .. | .. | .. | 8,143 | |
| II | 79 | Beans and peas | 479 | 1 | 2,524 | 1,692 | 2,686 |
| Hides, pelts, and skins— | |||||||
| Undressed— | |||||||
| VII | 193 | Calf | 18 | 1,579 | 1,213 | 2,141 | 4,523 |
| 194 | Cattle† | .. | 20 | 2,032 | 14,988 | 43,169 | |
| 198 | Sheep, with wool | 3,001 | .. | .. | 6,834 | 11,277 | |
| 199 | Sheep, without wool | 103,629 | 89,756 | 96,265 | 153,753 | 168,448 | |
| Wool— | |||||||
| 204 | Greasy | 147,547 | 93,911 | 222,157 | 228,693 | 203,914 | |
| 205 | Scoured | 310 | .. | 27 | .. | 4,291 | |
| 206 | Sliped | 544 | 3,744 | 739 | .. | 15,216 | |
| VIII | 216 | Phormium tenax | 9,135 | 19,242 | 31,729 | 79,057 | 62,154 |
| 223 | Seeds, grass and clover | 11,781 | 2,747 | 3,085 | 7,742 | 1,945 | |
| XII | 357 | Coals, bunker* | .. | .. | 2,946 | 2,972 | 9,704 |
| 360 | Kauri-gum | 263,375 | 209,216 | 232,566 | 308,456 | 316,200 | |
| .. | .. | Parcels-post | 931 | 2,378 | 1,144 | 1,353 | 2,881 |
| Uruguay. | |||||||
| II | 67 | Apples | 195 | 78 | 36 | 3,941 | 8,994 |
| 73 | Pears | 62 | |||||
| VI | 183 | Sheep for breeding | 8,540 | 2,943 | 4,307 | 8,287 | 6,366 |
| VIII | 221 | Plants, trees, and shrubs | 16 | 15 | 132 | 3,432 | 4,182 |
| Bismarck Archipelago. | |||||||
| XII | 358 | Coals, cargo | .. | 3,036 | 1,937 | 2,751 | 2,594 |
| Samoa (Navigator Islands). | |||||||
| I | 1 | Butter | ‡ | 2,422 | 2,526 | 2,672 | 3,611 |
| 20 | Beef, salted | ‡ | 8,401 | 8,979 | 8,286 | 5,406 | |
| 32 | Meats, potted and preserved | ‡ | 12,641 | 15,117 | 11,724 | 11,965 | |
| II | 130 | Sugar, refined | ‡ | 2,907 | 4,173 | 4,329 | 2,876 |
| XXIII | 875 | Soap, common bar (yellow and blue mottled) | ‡ | 2,298 | 1,791 | 1,536 | 1,916 |
| Sandwich Islands. | |||||||
| I | 1 | Butter | ‡ | .. | 1,690 | 2,588 | 5,889 |
| 19 | Beef, frozen | ‡ | .. | 14 | 2,643 | 5,349 | |
| Society Islands. | |||||||
| I | 1 | Butter | ‡ | 6,943 | 7,910 | 8,308 | 6,606 |
| 32 | Meats, potted and preserved | ‡ | 10,472 | 11,621 | 16,403 | 14,620 | |
| II | 130 | Sugar, refined | ‡ | 2,290 | 4,474 | 5,039 | 3,456 |
| VI | 174 | Cattle, ordinary | ‡ | 1,645 | 1,406 | 2,265 | 3,451 |
| XII | 357 | Coal, bunker* | ‡ | 1,921 | 2,993 | 2,724 | 1,406 |
| XXIII | 875 | Soap, common bar (yellow and blue mottled) | ‡ | 5,494 | 5,252 | 6,422 | 5,153 |
| Friendly Islands. | |||||||
| I | 32 | Meats, potted and preserved | ‡ | 15,461 | 11,872 | 7,885 | 8,833 |
| II | 43 | Biscuits, ships' plain | ‡ | 6,233 | 8,320 | 3,224 | 2,148 |
| 130 | Sugar, refined | ‡ | 4,806 | 6,037 | 2,584 | 1,708 | |
In order to give further detail concerning the destination of the main exports a number of tables are appended showing the details for five years for each of the principal articles:—
| Country to which exported. | 1910. | 1911. | 1912. | 1913. | 1914. |
|---|---|---|---|---|---|
* Includes cargo coal, 1910–13. † German Samoa only in 1914. ‡ Not shown separately 1910. | |||||
| WOOL. | |||||
| lb. | lb. | lb. | lb. | lb. | |
| United Kingdom | 194,455,535 | 161,110,735 | 172,512,073 | 168,153,780 | 195,612,290 |
| Canada | 420,610 | 551,398 | 908,772 | 872,260 | 906,829 |
| Australia | 676,722 | 358,606 | 567,476 | 1,292,548 | 272,269 |
| Belgium | 585,194 | 720,641 | 551,891 | 308,551 | 695,850 |
| France | 1,190,810 | 1,039,109 | 2,899,114 | 4,254,506 | 5,686,732 |
| Germany | 3,870,116 | 3,298,139 | 5,786,837 | 6,907,786 | 10,305,579 |
| Japan | 9,611 | .. | 20,413 | 61,638 | 1,821,999 |
| United States of America | 3,047,913 | 2,346,183 | 5,104,689 | 4,681,967 | 5,014,714 |
| Other countries | 112,446 | .. | 10,525 | .. | 154,636 |
| Totals | 204,368,957 | 169,424,811 | 188,361,790 | 186,533,036 | 220,472,898 |
| FROZEN MEAT. | |||||
| Cwt. | Cwt. | Cwt. | Cwt. | Cwt. | |
| United Kingdom | 2,645,480 | 2,246,291 | 2,557,918 | 2,525,761 | 3,149,624 |
| Canada | .. | 122 | 929 | 43,447 | 8,663 |
| Pacific Islands | 83 | 228 | 227 | 1,833 | 3,726 |
| Australia | 983 | 86 | 703 | 13 | 869 |
| Gibraltar | 7,315 | 3,676 | 13,147 | 7,371 | 7,088 |
| United States of America | 224 | 32 | .. | 268 | 59,918 |
| Other countries | 102 | 130 | 314 | .. | 85 |
| Totals | 2,654,196 | 2,250,565 | 2,573,238 | 2,578,693 | 3,229,973 |
| BUTTER. | |||||
| United Kingdom | 345,400 | 283,505 | 316,857 | 288,224 | 361,381 |
| South African Union | 6,938 | 5,370 | 10,891 | 8,318 | 8,941 |
| Canada | 186 | 9,224 | 42,461 | 56,149 | 51,599 |
| Pacific Islands | 2,334 | 2,481 | 3,052 | 2,939 | 3,607 |
| Australia | 516 | 39 | 1,839 | 11 | 560 |
| United States of America | 1,156 | 1,757 | 3,015 | 16,616 | 7,917 |
| Other countries | 5 | 2 | 2 | 1 | 62 |
| Totals | 356,535 | 302,387 | 378,117 | 372,258 | 434,067 |
| CHEESE. | |||||
| United Kingdom | 449,167 | 435,616 | 572,562 | 608,933 | 859,986 |
| South African Union | 2,057 | 1,572 | 2,645 | 2,088 | 1,917 |
| Pacific Islands | 209 | 168 | 253 | 189 | 286 |
| Australia | 389 | 610 | 1,521 | 391 | 1,483 |
| Other countries | 93 | 208 | 89 | 62 | 104 |
| Totals | 451,915 | 439,174 | 577,070 | 611,663 | 863,776 |
| TALLOW. | |||||
| Tons. | Tons. | Tons. | Tons. | Tons. | |
| United Kingdom | 25,903 | 20,624 | 23,497 | 22,723 | 24,437 |
| Pacific Islands | 7 | 4 | .. | 19 | 30 |
| Australia | 77 | 28 | 42 | 1 | 2 |
| Other countries | 22 | .. | 6 | .. | 46 |
| Totals | 26,009 | 20,656 | 23,545 | 22,743 | 24,515 |
| HIDES (HORSE AND CATTLE). | |||||
| Number. | Number. | Number. | Number. | Number. | |
| United Kingdom | 4,610 | 302 | 600 | 8,962 | 31,689 |
| Canada | 64,544 | 58,946 | 93,410 | 60,196 | 82,034 |
| Australia | 105,754 | 70,576 | 51,138 | 90,853 | 70,633 |
| United States of America | .. | 17 | 1,508 | 9,318 | 28,709 |
| Other countries | 439 | .. | 140 | 4 | 2,336 |
| Totals | 175,347 | 129,841 | 146,796 | 169,333 | 215,401 |
| RABBIT-SKINS. | |||||
| United Kingdom | 8,995,559 | 7,346,660 | 8,850,584 | 6,196,639 | 4,278,542 |
| Canada | .. | .. | .. | .. | 43,431 |
| Australia | 108,395 | 108,628 | 85,801 | 68,869 | 45,842 |
| United States of America | .. | .. | .. | .. | 140,006 |
| Other countries | .. | .. | 650 | 2,100 | 4,350 |
| Totals | 9,103,954 | 7,455,288 | 8,937,035 | 6,267,608 | 4,512,171 |
| SHEEP-SKINS AND PELTS. | |||||
| Number. | Number. | Number. | Number. | Number. | |
| United Kingdom | 6,112,637 | 5,945,762 | 6,010,351 | 6,213,562 | 5,870,438 |
| Canada | 144,239 | 121,741 | 256,016 | 179,940 | 183,105 |
| Australia | 281,532 | 142,647 | 162,416 | 109,182 | 300,661 |
| United States of America | 1,267,902 | 1,408,766 | 1,492,005 | 1,667,252 | 2,139,614 |
| Other countries | 4,276 | 999 | 184 | 1,339 | 31,793 |
| Totals | 7,810,586 | 7,619,915 | 7,920,972 | 8,171,275 | 8,525,611 |
| SAUSAGE-SKINS. | |||||
| Cwt. | Cwt. | Cwt. | Cwt. | Cwt. | |
| United Kingdom | 21,363 | 20,144 | 29,203 | 28,356 | 35,374 |
| Canada | 42 | 23 | 142 | 52 | 45 |
| Australia | 620 | 1,067 | 1,235 | 1,167 | 1,938 |
| Germany | 342 | 298 | 461 | 757 | 2,394 |
| Russia | .. | 241 | 422 | 280 | 408 |
| United States of America | .. | 4 | 106 | 170 | 153 |
| Other countries | 8 | 134 | 7 | 19 | 10 |
| Totals | 22,375 | 21,911 | 31,576 | 30,801 | 40,322 |
| WHEAT. | |||||
| Centals. | Centals. | Centals. | Centals. | Centals. | |
| United Kingdom | 771,039 | 744,534 | 300,992 | 35,092 | 8,569 |
| Pacific Islands | 1,045 | 1,479 | 2,040 | 2,277 | 1,658 |
| Australia | 4,513 | 4,510 | 91 | 34 | .. |
| Other countries | .. | 2,211 | .. | .. | 21 |
| Totals | 776,597 | 752,734 | 303,123 | 37,403 | 10,248 |
| OATS. | |||||
| United Kingdom | 101,847 | 35 | 462,436 | 1,064 | 450,146 |
| Ceylon | 6,386 | 9,164 | 8,972 | 7,090 | 8,101 |
| South African Union | 892 | .. | 1,114 | 1,487 | .. |
| Pacific Islands (other than Fiji) | 1,178 | 1,846 | 2,141 | 2,509 | 2,497 |
| Australia | 63,329 | 16,185 | 1,165,846 | 75,609 | 63,358 |
| Fiji | 2,015 | 1,096 | 3,725 | 1,270 | 330 |
| Brazil | .. | 778 | 370 | 906 | 442 |
| Uruguay | 1,000 | 26 | 1,706 | 5,018 | 890 |
| Other countries | 1,187 | .. | 3,258 | 754 | 3,581 |
| Totals | 177,834 | 29,130 | 1,649,568 | 95,707 | 529,345 |
| BEANS AND PEAS. | |||||
| United Kingdom | 109,921 | 191,601 | 255,940 | 186,508 | 159,851 |
| Canada | .. | 22 | 1,324 | 1,277 | 1,174 |
| South African Union | 500 | 209 | 612 | 367 | 390 |
| Australia | 7,929 | 7,465 | 17,588 | 10,807 | 15,728 |
| Fiji | 14 | 10 | 100 | 70 | 70 |
| France | .. | .. | 300 | 120 | .. |
| United States of America | 744 | 1 | 2,876 | 2,434 | 5,114 |
| Other countries | 8 | 28 | 25 | 2,416 | 705 |
| Totals | 119,116 | 199,336 | 278,765 | 203,999 | 183,032 |
| POTATOES. | |||||
| Tons. | Tons. | Tons. | Tons. | Tons. | |
| Pacific Islands (other than Fiji) | 157 | 223 | 487 | 168 | 212 |
| Australia | 6 | 124 | 18,659 | 874 | 958 |
| Fiji | 251 | 351 | 562 | 389 | 485 |
| Argentine Republic | .. | 46 | 30 | .. | .. |
| Brazil | 91 | 360 | 224 | 122 | 45 |
| Other countries | .. | 159 | 2 | 3 | 44 |
| Totals | 505 | 1,263 | 19,964 | 1,556 | 1,744 |
| SEEDS (GRASS AND CLOVER). | |||||
| Cwt. | Cwt. | Cwt. | Cwt. | Cwt. | |
| United Kingdom | 29,777 | 8,163 | 13,059 | 15,332 | 10,392 |
| Canada | 115 | 387 | 457 | 287 | 257 |
| Pacific Islands (other than Fiji) | 3 | 4 | 12 | 1 | 1 |
| South African Union | 413 | 707 | 1,108 | 613 | 198 |
| Australia | 16,341 | 7,620 | 19,270 | 12,802 | 26,702 |
| Fiji | .. | 2 | 3 | 3 | .. |
| Denmark | 1,074 | .. | 172 | 62 | .. |
| Germany | 1,317 | 100 | 210 | 922 | 901 |
| Argentine Republic | 192 | .. | 2 | 22 | .. |
| United States of America | 5,454 | 1,363 | 2,026 | 5,150 | 1,121 |
| Uruguay | 260 | 92 | 25 | 41 | .. |
| Other countries | .. | .. | .. | 345 | .. |
| Totals | 54,946 | 18,438 | 36,344 | 35,580 | 39,572 |
| GOLD. | |||||
| Oz. | Oz. | Oz. | Oz. | Oz. | |
| United Kingdom | 252,567 | 103,840 | 106,620 | 99,460 | 45,044 |
| Australia | 225,719 | 350,960 | 236,543 | 276,696 | 182,896 |
| Other countries | .. | 37 | .. | 5 | 14 |
| Totals | 478,286 | 454,837 | 343,163 | 376,161 | 227,954 |
| COAL. | |||||
| Tons. | Tons. | Tons. | Tons. | Tons. | |
| United Kingdom | 185,127 | 145,107 | 137,922 | 141,540 | 139,943 |
| Canada | .. | 710 | 2,860 | 1,760 | 2,050 |
| Pacific Islands (other than Fiji) | 25,375 | 15,556 | 13,177 | 16,983 | 89,199 |
| Australia | 49,343 | 53,141 | 56,588 | 33,185 | 50,330 |
| Fiji | 12,978 | 8,488 | 12,543 | 13,781 | 9,988 |
| Argentine Republic | 1,328 | .. | .. | .. | .. |
| Chile | 1,990 | 240 | 599 | 1,300 | 250 |
| United States of America | .. | .. | 3,653 | 3,200 | 9,556 |
| Other countries | 870 | 33 | 1,670 | .. | 1,592 |
| Totals | 277,011 | 223,275 | 229,012 | 211,749 | 302,908 |
| KAURI-GUM. | |||||
| United Kingdom | 3,253 | 2,378 | 2,468 | 3,390 | 3,335 |
| Canada | 66 | 9 | 40 | 62 | 70 |
| Australia | 66 | 75 | 39 | 80 | 19 |
| Belgium | 29 | 78 | 123 | 126 | 34 |
| Austria-Hungary | 124 | 131 | 159 | 112 | 14 |
| France | 19 | 75 | 37 | 45 | 42 |
| Germany | 913 | 1,142 | 1,053 | 833 | 373 |
| Italy | 23 | 15 | 15 | 9 | 23 |
| Netherlands | 6 | 55 | 42 | 60 | 8 |
| Russia | 15 | 80 | 2 | 53 | 3 |
| Sweden | 30 | 35 | 35 | 15 | 20 |
| United States of America | 4,149 | 3,514 | 3,894 | 3,995 | 4,531 |
| Other countries | .. | .. | 1 | .. | 1 |
| Totals | 8,693 | 7,587 | 7,908 | 8,780 | 8,473 |
| PHORMIUM-FIBRE. | |||||
| Tons. | Tons. | Tons. | Tons. | Tons. | |
| United Kingdom | 15,731 | 14,152 | 14,495 | 20,992 | 12,784 |
| Canada | .. | .. | 51 | 51 | 255 |
| Australia | 4,485 | 2,035 | 2,477 | 3,941 | 3,948 |
| United States of America | 424 | 1,091 | 1,617 | 3,056 | 2,715 |
| Other countries | 5 | 88 | 1 | 52 | .. |
| Totals | 20,645 | 17,366 | 18,641 | 28,092 | 19,702 |
| TIMBER (SAWN AND HEWN). | |||||
| Sup. ft. | Sup. ft. | Sup. ft. | Sup. ft. | Sup. ft. | |
| United Kingdom | 7,777,129 | 2,761,799 | 2,120,340 | 877,438 | 2,851,070 |
| Pacific Islands (other than Fiji) | 628,871 | 1,002,116 | 807,176 | 332,122 | 632,402 |
| Australia | 73,174,664 | 82,102,498 | 91,190,131 | 62,052,406 | 78,874,633 |
| Fiji | 359,398 | 443,157 | 336,844 | 192,240 | 961,080 |
| Other countries | .. | .. | .. | 14,899 | 23,763 |
| Totals | 81,940,062 | 86,309,570 | 94,454,491 | 63,469,105 | 83,342,848 |
The forwarding trade of New Zealand has never at any time been of great significance, and the amount has only twice (in 1907 and 1914) exceeded a quarter of a million sterling. The proportion varies very little, and is usually about 1 per cent. of the total exports (excluding specie). These items of re-exports consist largely of goods returned from New Zealand either as unsuitable or as finished with: for instance, the largest single item in 1914 was cinematograph-films, £14,621, though the bulk of the total amount was made up by various classes of machinery, hardware, metal manufactures, motor-cars, and also items like apparel, books, tobacco, and spirits.
There is, however, a genuine entrepôt trade with the islands of the Pacific, though the amount is still comparatively small. This amount, moreover, does not include the exports to Cook Islands, which are treated as part of the Dominion.
The amounts for the last twenty years of the re-exports of New Zealand are shown in the table below:—
| RE-EXPORTS OF BRITISH, FOREIGN, AND OTHER COLONIAL PRODUCE (EXCLUDING SPECIE). | |
|---|---|
| £ | |
| 1895 | 127,966 |
| 1896 | 122,571 |
| 1897 | 144,955 |
| 1898 | 124,850 |
| 1899 | 123,682 |
| 1900 | 168,009 |
| 1901 | 179,350 |
| 1902 | 136,860 |
| 1903 | 133,734 |
| 1904 | 136,963 |
| 1905 | 138,539 |
| 1906 | 152,134 |
| 1907 | 278,503 |
| 1908 | 180,675 |
| 1909 | 173,215 |
| 1910 | 208,310 |
| 1911 | 198,287 |
| 1912 | 239,221 |
| 1913 | 232,473 |
| 1914 | 269,208 |
The destination of this re-export trade is shown in the following table for 1910–14:—
| Country. | 1910. | 1911. | 1912. | 1913. | 1914. |
|---|---|---|---|---|---|
* Not available 1910. | |||||
| £ | £ | £ | £ | £ | |
| United Kingdom | 70,347 | 43,888 | 50,448 | 41,448 | 50,481 |
| Australia | 71,136 | 77,576 | 106,404 | 96,181 | 136,308 |
| Fiji | 10,798 | 12,297 | 11,017 | 12,430 | 11,546 |
| Canada | 1,558 | 781 | 2,277 | 3,476 | 3,260 |
| Germany | 328 | 46 | 401 | 2,148 | 753 |
| United States of America | 2,581 | 2,695 | 3,055 | 4,253 | 8,284 |
| Tonga or Friendly Islands | * | 23,331 | 23,590 | 11,908 | 11,066 |
| Samoa or Navigator Islands | * | 11,726 | 13,739 | 15,829 | 16,673 |
| Tahiti or Society Islands | * | 22,163 | 23,463 | 29,483 | 22,779 |
It is widely recognized that the price of wool and of the other principal exports has a vital hearing on New Zealand's prosperity, and the following pages are an attempt to analyse the influence exerted upon the exports by these changes of prices. New Zealand has always been peculiarly dependent for her prosperity upon her external trade, and the early vicissitudes of the several settlements were caused in great part by the difficulty of finding an assured market for their products. After the gold-discoveries of the “sixties,” there was always a steady export of that metal; but the great development of sheep-farming caused the export of wool to outstrip and finally to overshadow gold. Before refrigeration these two commodities comprised the overwhelming bulk of New Zealand's exports—on the average from 90 to 95 per cent.
This was the position when, in the early “seventies,” the world level of prices began to fall, and continued to fall steadily till 1895. About this time the first alluvial deposits of gold began to work out, and exports constantly decreased. At the same time the price of wool fell lower and lower, and the colony found both its great sources of wealth shrinking fast. An ambitious borrowing policy, followed by a period of land speculation, precipitated the country into the severest crisis it has yet experienced, and economic conditions became rapidly worse, till a long period of depression ended in the early “nineties” in a banking crisis.
All through this period the quantities of goods exported constantly increased. Refrigeration came in 1882, and frozen meat and dairy-produce added to the country's wealth. But the depressing influence of falling prices continually minimized the effect of the strenuous efforts at increased production, and the condition of the country remained unpromising.
The years 1895–96 saw a complete change, which can be ascribed only to two facts that the world level of prices turned then to rise, while the beneficial effects of refrigeration began to make themselves felt; so that from this period dates the prosperity of New Zealand. Under the stimulus of rising prices, which always benefit debtors and producers, exports have increased by leaps and bounds, as will be seen by a reference to the graphs in the subsection on “Total Trade.” Following the increase of exports, there has been a great development of imports and of the home trade.
It is an economic axiom that rising prices tend to benefit producers, for the reason that all prices do not rise equally, and the main prices which lag behind the general level are the prices of the two biggest expenses of production—labour and capital. So that the producer gets the benefit of rising prices for his produce, while his wages-bill and the interest on his borrowed capital do not increase so fast. It is the latter fact which is of value to New Zealand. The amount of interest which must be paid by New Zealand in each year (see subsection on “Total Trade”) is paid by the export of domestic produce, and is represented by a continued excess of exports over imports. In times of rising prices fewer bales of wool and carcases of mutton need be shipped each year to discharge this obligation.
At the same time New Zealand derives an extra benefit from the fact that her exports are rising faster than the average level of prices. Investigations into prices, not only in New Zealand but also in the older countries, show that raw materials and foodstuffs rise much faster than other commodities, and this feature is especially marked in animal products. In New Zealand Dr. McIlraith has demonstrated that prices of exports constantly rise faster than prices of imports.
All these influences, which are the principal effects of rising prices, tend to stimulate and increase production: but their exact extent can never be separated from the other causes of increased productivity: all that may be measured is the apparent effect upon the exports as disclosed by changing values. From this data it is possible to ascertain with some accuracy what extra value has been added by the element of prices; but the important influences increasing productivity are not touched by this method.
Practically all the main exports of New Zealand are primary products, either raw materials or foodstuffs. From their nature it is possible in nearly every case to obtain the quantities exported as well as the values. It is then an easy matter of computation to find what the value would have been, assessing the quantities for each year at the prices of a selected base year or period, and by comparison with the actual values recorded to estimate the effect of price-changes.
This method is used by the Board of Trade and by the Commonwealth Statistician, and it is very suitable for application to New Zealand. Of the total exports of New Zealand produce, 99 per cent. can, for the purpose of the present inquiry, be treated in this fashion, leaving only 1 per cent. to be calculated pro rata. In all the following computations gold is necessarily treated separately, since its price is fixed and cannot change.
The first table given is based on the year 1901, and is useful for comparison with the similar figures published for Australia (Commonwealth Year-book for 1914, page 543).
| NEW ZEALAND EXPORTS, SHOWING VALUES ASACTUALLY RECORDEDAND ASSESSEDAT THE PRICES OF 1901. | ||||||
|---|---|---|---|---|---|---|
| Year. | Exports (excluding Gold). | Gold Bullion exported. | Total Exports (Domestic Produce). | Index Number of Export Values. | ||
| Recorded Value. | Value at 1901 Prices. | Recorded Value. | Value at 1901 Prices. | |||
| £ | £ | £ | £ | £ | £ | |
| 1901 | 10,936,676 | 10,936,676 | 1,753,784 | 12,690,460 | 12,690,460 | 1,000 |
| 1902 | 11,547,173 | 11,649,294 | 1,951,426 | 13,498,599 | 13,600,720 | 992 |
| 1903 | 12,800,360 | 11,805,815 | 2,037,832 | 14,838,192 | 13,843,647 | 1,072 |
| 1904 | 12,614,286 | 10,797,317 | 1,987,501 | 14,601,787 | 12,784,818 | 1,142 |
| 1905 | 13,409,594 | 10,471,132 | 2,093,936 | 15,503,530 | 12,565,068 | 1,234 |
| 1906 | 15,569,442 | 11,384,110 | 2,270,904 | 17,840,346 | 13,655,014 | 1,306 |
| 1907 | 17,755,648 | 12,508,957 | 2,027,490 | 19,783,138 | 14,536,447 | 1,361 |
| 1908 | 13,889,731 | 11,366,102 | 2,004,799 | 15,894,530 | 13,370,901 | 1,189 |
| 1909 | 17,456,036 | 14,350,499 | 2,006,900 | 19,462,936 | 16,363,399 | 1,189 |
| 1910 | 20,047,845 | 15,043,367 | 1,896,318 | 21,944,163 | 16,939,685 | 1,295 |
| 1911 | 16,966,647 | 12,968,508 | 1,815,251 | 18,781,898 | 14,783,759 | 1,270 |
| 1912 | 19,927,274 | 14,821,997 | 1,345,131 | 21,272,405 | 16,167,128 | 1,316 |
| 1913 | 21,118,391 | 14,483,211 | 1,459,499 | 22,577,890 | 15,942,710 | 1,416 |
| 1914 | 25,089,350 | 17,072,531 | 895,367 | 25,984,717 | 17,967,898 | 1,445 |
In this table the base used is the same as that used in Australia; and similar information is given in the “New Zealand Official Year-book” for 1914, pages 349–354, based on the year 1900, the base used by the Board of Trade.
The feature of the table is the constant tendency to rise shown by the index number of export values especially in recent years. This upward tendency is always retarded by the influence of gold, which does not change in price. In recent years, however, the influence of gold is becoming less, not only because the export is decreasing, but because other exports are increasing very greatly. The comparison of the recorded value with that assessed at the prices of 1901 shows how much New Zealand benefits from this factor of rising prices.
In order to show the effect of changes in price from year to year, and particularly in the latter years, it is interesting to construct a series of index numbers basing the figures for each year upon the prices of the previous year. In this way it is possible to compare succeeding years directly, instead of comparing each year with a given base. The method used is the same, except that the base is changed.
| TABLE OF EXPORTS OF NEW ZEALAND PRODUCE FOREACH YEAR, 1901–14, SHOWING ACTUAL VALUES AND VALUES ASSESSEDAT PRICES OFTHE PREVIOUS YEAR. | ||||||||
|---|---|---|---|---|---|---|---|---|
| Year. | Exports (excluding Gold). | Gold Bullion exported. | Total Exports (Domestic Produce). | Effect of Price-changes. | Index Number of Export Values. | |||
| Recorded Value. | Value at Prices of Previous Year. | Recorded Value. | Value at Prices of Previous Year. | Gain. | Loss. | |||
| £ | £ | £ | £ | £ | £ | £ | £ | |
| 1901 | 10,936,676 | .. | 1,753,784 | 12,690,460 | .. | .. | .. | 1,000 |
| 1902 | 11,547,173 | 11,649,294 | 1,951,426 | 13,498,599 | 13,600,720 | .. | 102,121 | 992 |
| 1903 | 12,800,360 | 11,702,322 | 2,037,832 | 14,838,192 | 13,740,154 | 1,098,038 | .. | 1,080 |
| 1904 | 12,614,286 | 11,706,904 | 1,987,501 | 14,601,787 | 13,694,405 | 907,382 | .. | 1,066 |
| 1905 | 13,409,594 | 12,233,211 | 2,093,936 | 15,503,530 | 14,327,147 | 1,176,383 | .. | 1,082 |
| 1906 | 15,569,442 | 14,578,776 | 2,270,904 | 17,840,346 | 16,849,680 | 990,666 | .. | 1,059 |
| 1907 | 17,755,648 | 17,107,835 | 2,027,490 | 19,783,138 | 19,135,325 | 647,813 | .. | 1,034 |
| 1908 | 13,889,731 | 16,133,439 | 2,004,799 | 15,894,530 | 18,138,238 | .. | 2,243,708 | 876 |
| 1909 | 17,456,036 | 17,544,090 | 2,006,900 | 19,462,936 | 19,550,990 | .. | 88,054 | 995 |
| 1910 | 20,047,845 | 18,291,198 | 1,896,318 | 21,944,163 | 20,187,516 | 1,756,647 | .. | 1,087 |
| 1911 | 16,966,647 | 17,282,741 | 1,815,251 | 18,781,898 | 19,097,992 | .. | 316,094 | 983 |
| 1912 | 19,927,274 | 19,391,560 | 1,345,131 | 21,272,405 | 20,736,691 | 535,714 | .. | 1,026 |
| 1913 | 21,118,391 | 19,471,797 | 1,459,499 | 22,577,890 | 20,931,296 | 1,646,594 | .. | 1,079 |
| 1914 | 25,089,350 | 24,893,953 | 895,367 | 25,984,717 | 25,789,320 | 195,397 | .. | 1,008 |
The comparison of each year with the preceding year brings out the advantage gained by a rise in prices. The gain shown represents the surplus value added by rising prices to the exports of any year, and, similarly, the loss shows how falling prices penalize New Zealand. The figures for the crisis years 1908–9, and for 1911, are eloquent of what falling prices would mean for the Dominion.
It has been noticed repeatedly that the calendar year is a bad period for which to calculate exports of New Zealand produce. These exports consist almost wholly of seasonal products, and the calendar year often splits the seasons. The largest export, wool, is sheared from the sheep in the early summer, and the wool-sales are held in December and January. Exports of any season's wool-clip are therefore split up between one year and the next in varying proportion. A favourable season or, as in 1914, a sudden demand may cause a great increase of exports in the December quarter, with the result that the March quarter of the next year shows low figures. The wool trade invariably bases its calculations on each season's clip, not on calendar years.
The same argument holds good in the case of butter and cheese, which are almost wholly exported in December and March quarters. It is desirable, therefore, to tabulate New Zealand's exports for years ending in June instead of December, since this division does not split the seasonal production of any main commodity, and more truly shows the results of each season as compared with previous seasons.
The following table gives this information for the principal items of export from 1890:—
| PRINCIPAL EXPORTS FROM NEW ZEALAND FOR YEARS ENDING 30TH JUNE. | |||||||||
|---|---|---|---|---|---|---|---|---|---|
| Article. | 1890–91. | 1891–92. | 1892–93. | 1893–94. | 1894–95. | 1895–96. | 1896–97. | 1897–98. | |
| The mine— | £ | £ | £ | £ | £ | £ | £ | £ | |
| Coal | 76,486 | 81,232 | 71,788 | 79,024 | 81,195 | 80,724 | 65,770 | 56,701 | |
| Gold | 897,918 | 923,663 | 926,556 | 950,946 | 923,931 | 1,117,918 | 1,076,504 | 997,978 | |
| Silver | 7,920 | 5,746 | 7,200 | 7,232 | 9,329 | 9,501 | 15,350 | 25,538 | |
| Fisheries— | |||||||||
| Fish | 7,885 | 8,390 | 6,782 | 5,766 | 6,519 | 9,482 | 16,042 | 16,409 | |
| The forest— | |||||||||
| Kauri-gum | 430,700 | 466,286 | 544,712 | 440,656 | 422,147 | 427,213 | 385,363 | 500,752 | |
| Timber (sawn and hewn) | 179,328 | 127,317 | 99,742 | 98,579 | 136,980 | 134,408 | 145,038 | 163,114 | |
| Pastoral products— | |||||||||
| Beef, salted | 13,488 | 11,545 | 6,881 | 5,667 | 5,650 | 5,191 | 6,025 | 6,249 | |
| Butter | 128,306 | 198,363 | 208,909 | 303,951 | 231,700 | 250,885 | 357,187 | 404,049 | |
| Cheese | 95,866 | 91,670 | 95,903 | 106,280 | 160,061 | 121,993 | 151,298 | 136,146 | |
| Hides | 35,506 | 24,985 | 10,411 | 6,280 | 5,239 | 7,355 | 4,903 | 20,562 | |
| Live-stock | 43,113 | 36,083 | 26,023 | 42,534 | 43,076 | 26,952 | 16,432 | 13,585 | |
| Meats, preserved | 119,167 | 92,303 | 56,271 | 51,232 | 61,706 | 75,131 | 75,176 | 93,999 | |
| ” frozen | 1,188,620 | 1,140,571 | 1,067,780 | 1,054,537 | 1,322,810 | 1,276,232 | 1,340,169 | 1,691,546 | |
| Sausage-skins | 28,042 | 23,484 | 25,949 | 31,068 | 40,610 | 46,435 | 45,838 | 43,161 | |
| Skins, rabbit | 115,070 | 130,912 | 137,759 | 126,195 | 91,548 | 71,024 | 59,498 | 46,683 | |
| ” sheep | 148,583 | 166,391 | 182,876 | 157,868 | 161,423 | 184,674 | 159,842 | 245,736 | |
| Tallow | 157,688 | 197,278 | 181,999 | 183,797 | 239,952 | 252,513 | 216,528 | 301,206 | |
| Wool | 4,216,419 | 4,229,683 | 4,072,342 | 4,353,415 | 4,028,651 | 4,393,574 | 4,357,244 | 4,732,542 | |
| Agricultural products— | |||||||||
| Beans and peas | 22,176 | 19,608 | 16,873 | 32,102 | 23,345 | 21,000 | 12,089 | 11,081 | |
| Oats | 271,228 | 365,195 | 226,723 | 185,792 | 159,356 | 172,759 | 218,467 | 97,262 | |
| Wheat | 469,717 | 379,803 | 363,952 | 146,162 | 2,567 | 47,201 | 45,802 | 3,222 | |
| Hops | 17,573 | 10,221 | 9,512 | 10,765 | 9,604 | 9,036 | 15,118 | 6,691 | |
| Potatoes | 82,265 | 47,689 | 31,797 | 21,244 | 5,177 | 12,320 | 9,163 | 52,885 | |
| Seeds, grass and clover | 33,929 | 51,939 | 46,911 | 46,196 | 63,762 | 66,966 | 71,170 | 73,936 | |
| Miscellaneous— | |||||||||
| Leather | 59,046 | 70,146 | 75,303 | 76,400 | 103,876 | 103,361 | 86,791 | 105,905 | |
| Phormium | 267,176 | 239,779 | 245,245 | 114,143 | 33,026 | 32,739 | 28,865 | 28,883 | |
| Other New Zealand produce | 386,228 | 297,119 | 246,139 | 152,898 | 163,121 | 223,790 | 360,287 | 278,708 | |
| Totals | 9,499,443 | 9,437,401 | 8,992,338 | 8,790,729 | 8,536,361 | 9,180,377 | 9,341,959 | 10,154,529 | |
| PRINCIPAL EXPORTS FROM NEW ZEALAND FOR YEARS ENDING 30TH JUNE. | |||||||||
|---|---|---|---|---|---|---|---|---|---|
| Article. | 1898–99. | 1899–00. | 1900–01. | 1901–02. | 1902–03. | 1903–04. | 1904–05. | 1905–06. | 1906–7 |
| The mine— | £ | £ | £ | £ | £ | £ | £ | £ | £ |
| Coal | 77,544 | 86,425 | 128,999 | 128,420 | 148,751 | 136,751 | 126,169 | 113,466 | 123,772 |
| Gold | 1,303,672 | 1,457,540 | 1,589,632 | 1,798,345 | 2,039,797 | 2,084,095 | 1,974,739 | 2,153,047 | 2,106,889 |
| Silver | 39,105 | 38,896 | 46,391 | 76,440 | 84,584 | 96,318 | 114,177 | 136,226 | 164,899 |
| Fisheries— | |||||||||
| Fish | 18,826 | 19,528 | 18,704 | 16,618 | 16,811 | 14,389 | 19,286 | 21,770 | 19,018 |
| The forest— | |||||||||
| Kauri-gum | 590,598 | 639,914 | 482,469 | 480,851 | 515,517 | 615,785 | 480,718 | 561,965 | 561,364 |
| Timber (sawn and hewn) | 162,336 | 219,213 | 259,782 | 249,157 | 209,911 | 260,041 | 298,517 | 303,148 | 313,040 |
| Pastoral products— | |||||||||
| Beef, salted | 5,766 | 10,002 | 8,677 | 8,891 | 11,518 | 8,218 | 13,587 | 11,332 | 11,427 |
| Butter | 451,269 | 693,666 | 858,543 | 1,044,317 | 1,211,223 | 1,445,814 | 1,417,984 | 1,540,327 | 1,631,174 |
| Cheese | 127,209 | 224,238 | 239,325 | 171,886 | 186,412 | 194,779 | 180,215 | 300,056 | 568,058 |
| Hides | 29,963 | 40,422 | 42,865 | 48,546 | 54,817 | 44,914 | 74,348 | 118,169 | 171,549 |
| Live-stock | 25,283 | 29,168 | 22,315 | 19,119 | 112,301 | 38,277 | 34,549 | 76,191 | 75,409 |
| Meats, preserved | 85,916 | 92,662 | 88,389 | 126,339 | 110,711 | 79,846 | 79,799 | 93,516 | 89,367 |
| ” frozen | 1,776,843 | 2,298,140 | 2,193,494 | 2,526,661 | 3,310,073 | 2,846,082 | 2,714,026 | 2,882,387 | 3,143,764 |
| Sausage-skins | 46,146 | 44,413 | 41,056 | 50,090 | 72,209 | 50,388 | 50,298 | 55,408 | 65,464 |
| Skins, rabbit | 61,024 | 69,135 | 45,711 | 59,679 | 51,311 | 37,987 | 45,790 | 71,556 | 45,898 |
| ” sheep | 245,602 | 298,124 | 267,963 | 308,844 | 460,829 | 420,471 | 417,419 | 640,513 | 763,664 |
| Tallow | 274,996 | 381,803 | 332,366 | 524,108 | 548,961 | 367,079 | 347,620 | 419,576 | 533,14 |
| Wool | 4,241,984 | 4,889,101 | 3,890,573 | 3,079,271 | 4,034,712 | 4,313,018 | 5,468,566 | 6,605,790 | 7,415,486 |
| Agricultural products— | |||||||||
| Beans and Peas | 8,410 | 17,501 | 30,892 | 20,920 | 28,362 | 22,161 | 30,396 | 42,098 | 34,388 |
| Oats | 185,057 | 460,513 | 672,341 | 927,109 | 457,674 | 323,825 | 158,510 | 103,649 | 37,874 |
| Wheat | 120,364 | 329,623 | 365,823 | 160,644 | 33,528 | 83,689 | 62,174 | 130,386 | 5,495 |
| Hops | 25,281 | 14,899 | 17,366 | 15,849 | 14,414 | 27,277 | 27,584 | 16,076 | 11,573 |
| Potatoes | 125,974 | 25,076 | 35,843 | 89,194 | 63,458 | 12,151 | 6,454 | 2,073 | 1,018 |
| Seeds, grass and clover | 55,998 | 64,665 | 97,145 | 68,120 | 91,391 | 105,342 | 84,045 | 106,491 | 71,273 |
| Miscellaneous— | |||||||||
| Leather | 105,731 | 101,714 | 115,082 | 104,282 | 93,702 | 78,136 | 58,207 | 51,596 | 61,247 |
| Phormium | 128,639 | 356,380 | 174,549 | 383,380 | 578,204 | 691,649 | 720,931 | 721,457 | 899,111 |
| Other New Zealand produce | 232,569 | 313,842 | 376,505 | 264,071 | 362,464 | 289,853 | 220,696 | 263,373 | 315,288 |
| Totals | 10,552,105 | 13,216,603 | 12,442,800 | 12,751,151 | 14,903,645 | 14,688,835 | 15,226,794 | 17,541,642 | 19,241,023 |
| PRINCIPAL EXPORTS FROM NEW ZEALAND FOR YEARS ENDING 30TH JUNE. | ||||||||
|---|---|---|---|---|---|---|---|---|
| Article. | 1907–08. | 1908–09. | 1909–10. | 1910–11. | 1911–12. | 1912–13. | 1913–14. | 1914–15. |
| The mine— | £ | £ | £ | £ | £ | £ | £ | £ |
| Coal | 89,096 | 108,011 | 284,206 | 185,578 | 208,011 | 252,790 | 173,475 | 380,170 |
| Gold | 2,129,042 | 1,944,652 | 1,948,212 | 1,898,910 | 1,710,021 | 1,232,725 | 1,485,920 | 438,234 |
| Silver | 159,899 | 182,637 | 181,401 | 144,288 | 122,725 | 82,013 | 89,643 | 57,311 |
| Fisheries— | ||||||||
| Fish | 19,285 | 23,322 | 18,578 | 25,170 | 27,555 | 35,090 | 29,575 | 32,454 |
| The forest— | ||||||||
| Kauri-gum | 462,688 | 466,050 | 529,051 | 456,353 | 358,336 | 462,604 | 590,341 | 315,038 |
| Timber (sawn and hewn) | 341,542 | 355,633 | 343,805 | 435,485 | 474,483 | 427,517 | 372,380 | 377,184 |
| Pastoral products— | ||||||||
| Beef, salted | 13,434 | 10,734 | 20,697 | 17,176 | 14,250 | 12,100 | 12,488 | 7,197 |
| Butter | 1,133,665 | 1,491,837 | 1,712,659 | 1,685,033 | 1,891,235 | 2,027,822 | 2,197,662 | 2,336,862 |
| Cheese | 761,100 | 977,358 | 1,275,148 | 1,093,715 | 1,496,730 | 1,914,238 | 2,317,970 | 2,277,509 |
| Hides | 175,564 | 189,328 | 238,722 | 194,602 | 160,614 | 253,334 | 323,359 | 412,236 |
| Live-stock | 51,597 | 63,817 | 133,219 | 236,030 | 145,490 | 81,086 | 83,310 | 235,265 |
| Meat, preserved | 94,724 | 115,272 | 149,794 | 146,223 | 134,220 | 112,413 | 122,096 | 134,567 |
| ” frozen | 3,165,048 | 3,775,990 | 3,631,122 | 3,875,379 | 3,671,948 | 4,315,444 | 5,079,228 | 5,737,657 |
| Sausage-skins | 54,859 | 77,273 | 75,517 | 73,105 | 80,491 | 93,343 | 132,039 | 165,527 |
| Skins, rabbit | 54,239 | 62,765 | 115,429 | 123,547 | 72,911 | 118,482 | 90,350 | 32,981 |
| ” sheep | 598,246 | 610,519 | 738,741 | 698,568 | 648,600 | 765,926 | 880,660 | 821,536 |
| Tallow | 475,890 | 625,235 | 756,619 | 658,962 | 640,451 | 660,224 | 711,858 | 704,797 |
| Wool | 5,649,636 | 5,965,283 | 7,962,669 | 7,164,844 | 6,965,416 | 8,217,644 | 8,262,153 | 9,907,670 |
| Agricultural products— | ||||||||
| Beans and peas | 13,131 | 32,667 | 65,869 | 74,348 | 68,222 | 116,815 | 80,704 | 72,609 |
| Oats | 21,675 | 250,486 | 314,024 | 26,948 | 254,779 | 253,414 | 36,129 | 258,083 |
| Wheat | 369 | 117,974 | 257,786 | 294,515 | 90,965 | 76,780 | 14,253 | 801 |
| Hops | 10,925 | 5,323 | 19,079 | 12,276 | 28,040 | 14,293 | 24,106 | 15,249 |
| Potatoes | 1,279 | 2,243 | 3,487 | 5,059 | 13,152 | 143,548 | 6,052 | 22,129 |
| Seeds, grass and clover | 75,153 | 46,502 | 115,490 | 78,388 | 57,067 | 64,045 | 77,092 | 47,805 |
| Miscellaneous— | ||||||||
| Leather | 39,765 | 37,807 | 25,584 | 25,773 | 30,824 | 32,032 | 40,474 | 45,232 |
| Phormium | 539,712 | 282,084 | 441,377 | 349,610 | 320,637 | 630,089 | 600,048 | 428,364 |
| Other New Zealand produce | 318,795 | 320,669 | 369,990 | 326,867 | 461,460 | 528,004 | 483,533 | 642,790 |
| Totals | 16,450,358 | 18,141,471 | 21,728,275 | 20,306,752 | 20,148,633 | 22,923,815 | 24,316,898 | 25,907,263 |
It was stated earlier in this paragraph that the present period of price-movements began in 1895. Since that time the level of prices and exports has risen continuously, and this period is quite a distinct epoch in New Zealand's economic history. A series of tables has therefore been compiled to illustrate more definitely the effect of prices upon the exports, and therefore upon New Zealand's prosperity since 1890. The tables have been compiled throughout for June years.
The period 1890–99 has been chosen as the base in preference to any single year, since by obtaining the average of a period of years the effect of any temporary fluctuations cannot vitiate the results. The base has been chosen at the beginning of the period to be considered, because the object is to contrast prices in 1915 with 1895, and to show up the benefit New Zealand has received from a constantly rising price-level. The decade 1890–99 is a good base, showing as it does both falling and rising prices, and is a fair level from which to begin comparisons.
The rise in prices is reflected by the following table of index numbers of export values for the principal commodities and all exports:—
| INDEX NUMBERS OF EXPORT VALUES OFTHE PRINCIPAL EXPORTS FOR YEARS ENDING 30TH JUNE. | |||||
|---|---|---|---|---|---|
| (Base: Average annual value, 1890–99 = 1,000.) | |||||
| Year. | Wool. | Frozen Meat. | Butter. | Cheese. | Total Exports (Domestic). |
| 1890–91 | 1,158 | 1,046 | 892 | 1,023 | 1,081 |
| 1891–92 | 1,132 | 1,034 | 961 | 1,097 | 1,069 |
| 1892–93 | 1,018 | 1,048 | 1,100 | 1,040 | 1,028 |
| 1893–94 | 1,018 | 1,031 | 1,015 | 1,055 | 1,017 |
| 1894–95 | 930 | 989 | 956 | 980 | 943 |
| 1895–96 | 1,011 | 1,027 | 979 | 889 | 1,006 |
| 1896–97 | 979 | 997 | 974 | 946 | 985 |
| 1897–98 | 940 | 924 | 1,000 | 956 | 952 |
| 1898–99 | 875 | 985 | 998 | 1,002 | 937 |
| 1899–1900 | 1,006 | 993 | 1,041 | 1,065 | 1,010 |
| 1900–1 | 814 | 1,033 | 1,044 | 1,136 | 938 |
| 1901–2 | 604 | 1,067 | 1,102 | 1,055 | 907 |
| 1902–3 | 737 | 1,165 | 1,159 | 1,272 | 991 |
| 1903–4 | 902 | 1,227 | 1,074 | 1,108 | 1,044 |
| 1904–5 | 1,110 | 1,354 | 1,075 | 1,088 | 1,135 |
| 1905–6 | 1,284 | 1,301 | 1,167 | 1,233 | 1,215 |
| 1906–7 | 1,351 | 1,100 | 1,195 | 1,377 | 1,253 |
| 1907–8 | 1,063 | 1,290 | 1,203 | 1,370 | 1,165 |
| 1908–9 | 932 | 1,275 | 1,245 | 1,371 | 1,099 |
| 1909–10 | 1,208 | 1,230 | 1,229 | 1,303 | 1,209 |
| 1910–11 | 1,155 | 1,330 | 1,222 | 1,303 | 1,206 |
| 1911–12 | 1,101 | 1,338 | 1,317 | 1,401 | 1,201 |
| 1912–13 | 1,264 | 1,493 | 1,348 | 1,427 | 1,325 |
| 1913–14 | 1,238 | 1,528 | 1,307 | 1,454 | 1,321 |
| 1914–15 | 1,437 | 1,810 | 1,372 | 1,526 | 1,499 |
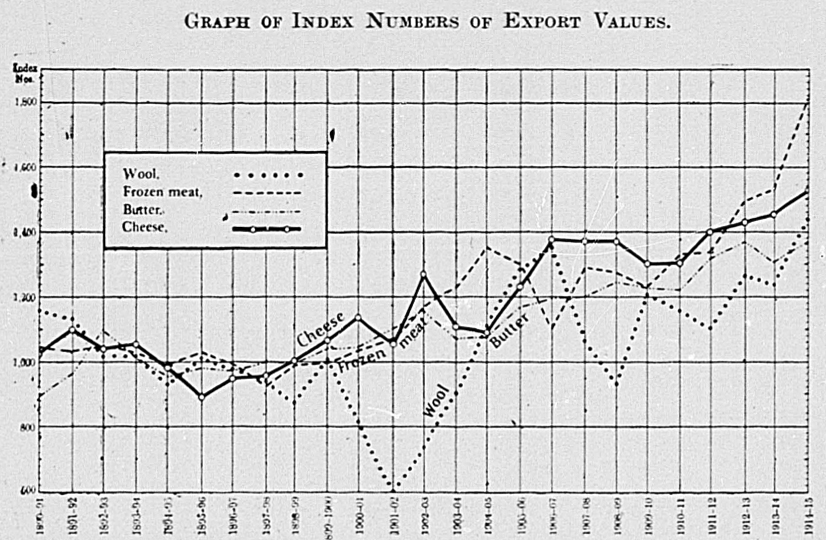
The values of the main exports were higher in 1890–91 than in the middle of that decade, and for five or six years the fall is well marked. It is hard from a scrutiny of the index numbers for each item to fix on the turning-point, but the average for all exports puts it in 1894–95, thus corroborating other investigations into this subject.
Since this time, though there have been a good many fluctuations, particularly in wool, the general tendency has been very decidedly upward. The index number for all exports shows that in 1914 the immediate gain from rising prices was as much as 50 per cent., exports being worth half as much again as they would have been at the average prices of 1890–99. The most serious set-back was in 1907–8 and 1908–9.
The course of wool-values has shown remarkable fluctuations. The seasons 1900–1, 1901–2, and 1902–3 show exceptionally low prices; and again in 1908–9 wool is responsible for lowering the value of exports. Like most other exports, this last season's wool has shown very much higher values.
The increase in 1914–15 is especially noticeable in the case of meat, where the index number reaches the very high figure of 1,810—that is, the export of meat was worth 81 per cent. more than at the prices of 1890–99, or nearly double its value at the prices of 1897–98.
Perhaps a better illustration of the effect of increased value will be found in the table given below, where the recorded values of exports are contrasted with values assessed on the basis of 1890–99 prices. Gold, which does not change in price, is necessarily calculated separately from the other commodities.
| NEW ZEALAND EXPORTS FOR YEARS ENDING 30TH JUNE, SHOWING VALUES ASACTUALLY RECORDEDAND ASSESSEDAT THE AVERAGE PRICES OF 1890–99. | ||||||
|---|---|---|---|---|---|---|
| Year. | Exports (excluding Gold). | Total Exports (Domestic Produce). | Index Number of Export Values. | |||
| Recorded Value. | Value at Prices of 1890–99. | Gold Bullion Exported. | Recorded Value. | Value at Prices of 1890–99. | ||
| £ | £ | £ | £ | £ | £ | |
| 1890–91 | 8,601,525 | 7,891,864 | 897,918 | 9,499,443 | 8,789,782 | 1,081 |
| 1891–92 | 8,504,738 | 7,894,711 | 923,663 | 9,428,401 | 8,818,374 | 1,069 |
| 1892–93 | 8,065,782 | 7,821,133 | 926,556 | 8,992,338 | 8,747,689 | 1,028 |
| 1893–94 | 7,839,783 | 7,690,658 | 950,946 | 8,790,729 | 8,641,604 | 1,017 |
| 1894–95 | 7,612,430 | 8,128,360 | 923,931 | 8,536,361 | 9,052,291 | 943 |
| 1895–96 | 8,062,459 | 8,007,754 | 1,117,918 | 9,180,377 | 9,125,672 | 1,006 |
| 1896–97 | 8,265,455 | 8,406,001 | 1,076,504 | 9,341,959 | 9,482,505 | 985 |
| 1897–98 | 9,156,551 | 9,664,411 | 997,978 | 10,154,529 | 10,662,389 | 952 |
| 1898–99 | 9,248,433 | 9,961,865 | 1,303,672 | 10,552,105 | 11,265,537 | 937 |
| 1899–1900 | 11,759,063 | 11,631,573 | 1,457,540 | 13,216,603 | 13,089,113 | 1,010 |
| 1900–1 | 10,853,168 | 11,671,369 | 1,589,632 | 12,442,800 | 13,261,001 | 938 |
| 1901–2 | 10,952,806 | 12,261,296 | 1,798,345 | 12,751,151 | 14,059,641 | 907 |
| 1902–3 | 12,863,848 | 12,993,919 | 2,039,797 | 14,903,645 | 15,033,716 | 991 |
| 1903–4 | 12,604,740 | 11,991,834 | 2,084,095 | 14,688,835 | 14,075,929 | 1,044 |
| 1904–5 | 13,252,055 | 11,440,392 | 1,974,739 | 15,226,794 | 13,415,131 | 1,135 |
| 1905–6 | 15,388,595 | 12,280,611 | 2,153,047 | 17,541,642 | 14,433,658 | 1,215 |
| 1906–7 | 17,134,134 | 13,251,715 | 2,106,889 | 19,241,023 | 15,358,604 | 1,253 |
| 1907–8 | 14,321,316 | 11,996,945 | 2,129,042 | 16,450,358 | 14,125,987 | 1,165 |
| 1908–9 | 16,196,819 | 14,568,412 | 1,944,652 | 18,141,471 | 16,513,064 | 1,099 |
| 1909–10 | 19,780,063 | 16,022,222 | 1,948,212 | 21,728,275 | 17,970,434 | 1,209 |
| 1910–11 | 18,407,842 | 14,938,728 | 1,898,910 | 20,306,752 | 16,837,638 | 1,206 |
| 1911–12 | 18,438,612 | 15,068,559 | 1,710,021 | 20,148,633 | 16,778,580 | 1,201 |
| 1912–13 | 21,691,090 | 16,066,627 | 1,232,725 | 22,923,815 | 17,299,352 | 1,325 |
| 1913–14 | 22,830,978 | 16,927,383 | 1,485,920 | 24,316,898 | 18,413,303 | 1,321 |
| 1914–15 | 25,469,029 | 16,842,014 | 438,234 | 25,907,263 | 17,280,248 | 1,499 |
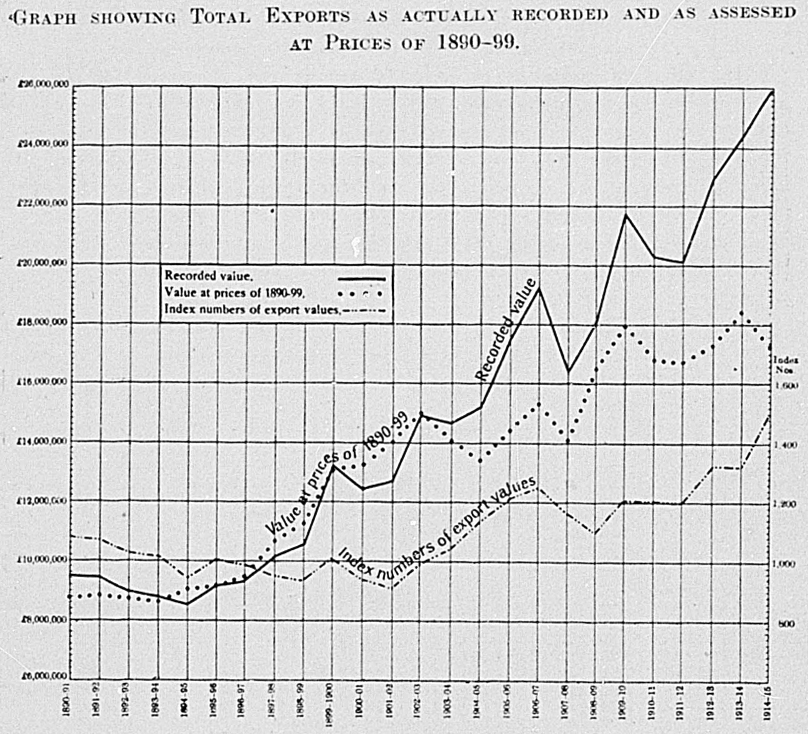
The graph which illustrates the effect of prices on export values is very illuminating in its course. Since the period 1890–99 is the base, and during those years the relative levels have been equated, the lines naturally run together. It will be noticeable, however, that for the first years, while the quantity exported remained about stationary, the value fell owing to falling prices.
The rate of increase in the last twenty years is very high, though broken in 1907–8 and 1911–12. Both the quantity exported and its value show great increases. The dotted line which shows the quantities assessed at the uniform values of 1890–99 varies in the same direction as the recorded value, and it is significant that the greatest fluctuations are apparently due to variations in the quantity exported.
The effect of rising prices is measured by the divergence of the two lines, which constantly increases till in 1914 our exports were worth just half as much again as they would have been at the prices of 1890–99.
This divergence has been plotted separately by a curve showing the index numbers of export values, the scale for which is charted on the right-hand side of the graph. The index number for 1914 was 1,499.
Similarly, the following table and the graphs attached show the divergence for the four main exports—wool, frozen meat, butter, and cheese:—
| EXPORTS OF WOOL, FROZEN MEAT, BUTTER, AND CHEESE FOR YEARS ENDING 30TH JUNE, SHOWING VALUES ASACTUALLY RECORDEDAND ASSESSEDAT THE AVERAGE PRICES OF 1890–99. | |||||||||
|---|---|---|---|---|---|---|---|---|---|
| Year. | Wool. | Frozen Meat. | Butter. | Cheese. | |||||
| Recorded Value. | Value at Average Prices, 1890–99. | Recorded Value. | Value at Average Prices, 1890–99. | Recorded Value. | Value at Average Prices, 1890–99. | Recorded Value. | Value at Average Prices, 1890–99. | ||
| £ | £ | £ | £ | £ | £ | £ | £ | ||
| 1890–91 | 4,216,419 | 3,641,768 | 1,188,620 | 1,136,432 | 128,306 | 143,796 | 95,866 | 93,699 | |
| 1891–92 | 4,229,683 | 3,735,461 | 1,140,571 | 1,103,579 | 198,363 | 206,478 | 91,670 | 83,578 | |
| 1892–93 | 4,072,342 | 3,990,329 | 1,067,780 | 1,018,744 | 208,909 | 189,978 | 95,903 | 92,232 | |
| 1893–94 | 4,353,415 | 4,274,711 | 1,054,537 | 1,022,559 | 303,951 | 299,575 | 106,280 | 100,779 | |
| 1894–95 | 4,028,651 | 4,329,769 | 1,322,810 | 1,337,768 | 231,700 | 242,471 | 160,061 | 163,260 | |
| 1893–96 | 4,393,574 | 4,345,449 | 1,276,232 | 1,243,269 | 250,885 | 256,159 | 121,993 | 137,210 | |
| 1896–97 | 4,357,244 | 4,449,230 | 1,340,169 | 1,344,449 | 357,187 | 366,728 | 151,298 | 150,899 | |
| 1897–98 | 4,732,542 | 5,032,162 | 1,691,546 | 1,831,138 | 404,049 | 404,127 | 136,146 | 142,455 | |
| 1898–99 | 4,241,984 | 4,847,271 | 1,776,843 | 1,804,212 | 451,269 | 452,348 | 127,209 | 126,913 | |
| 1899–1900 | 4,889,101 | 4,859,806 | 2,298,140 | 2,315,097 | 693,666 | 666,625 | 224,238 | 210,638 | |
| 1900–1 | 3,890,573 | 4,781,059 | 2,193,494 | 2,122,519 | 858,543 | 822,599 | 239,325 | 210,630 | |
| 1901–2 | 3,079,271 | 5,094,446 | 2,526,661 | 2,367,931 | 1,044,317 | 947,782 | 171,886 | 162,912 | |
| 1902–3 | 4,034,712 | 5,475,277 | 3,310,073 | 2,840,937 | 1,211,223 | 1,045,407 | 186,412 | 146,500 | |
| 1903–4 | 4,313,018 | 4,779,745 | 2,846,082 | 2,318,958 | 1,445,814 | 1,345,834 | 194,779 | 175,808 | |
| 1904–5 | 5,468,566 | 4,927,285 | 2,714,026 | 2,003,709 | 1,417,984 | 1,319,133 | 180,215 | 165,619 | |
| 1905–6 | 6,605,790 | 5,144,559 | 2,882,387 | 2,215,618 | 1,540,327 | 1,319,385 | 300,056 | 243,318 | |
| 1906–7 | 7,415,486 | 5,487,427 | 3,143,764 | 2,858,903 | 1,631,174 | 1,365,022 | 568,058 | 412,533 | |
| 1907–8 | 5,649,636 | 5,314,779 | 3,165,048 | 2,453,043 | 1,133,665 | 942,588 | 761,100 | 555,439 | |
| 1908–9 | 5,965,283 | 6,397,453 | 3,775,990 | 2,961,113 | 1,491,837 | 1,198,433 | 977,358 | 712,921 | |
| 1909–10 | 7,962,669 | 6,594,295 | 3,631,122 | 2,952,041 | 1,712,659 | 1,393,613 | 1,275,148 | 978,653 | |
| 1910–11 | 7,164,844 | 6,202,335 | 3,875,379 | 2,914,507 | 1,685,033 | 1,378,474 | 1,093,715 | 839,158 | |
| 1911–12 | 6,965,416 | 6,328,167 | 3,671,948 | 2,743,477 | 1,891,235 | 1,435,884 | 1,496,730 | 1,068,174 | |
| 1912–13 | 8,217,644 | 6,503,545 | 4,315,444 | 2,890,424 | 2,027,822 | 1,504,318 | 1,914,238 | 1,341,035 | |
| 1913–14 | 8,262,153 | 6,673,803 | 5,079,228 | 3,323,433 | 2,197,662 | 1,681,915 | 2,317,970 | 1,504,670 | |
| 1914–15 | 9,907,670 | 6,893,420 | 5,737,657 | 3,169,706 | 2,336,862 | 1,702,856 | 2,277,509 | 1,492,725 | |
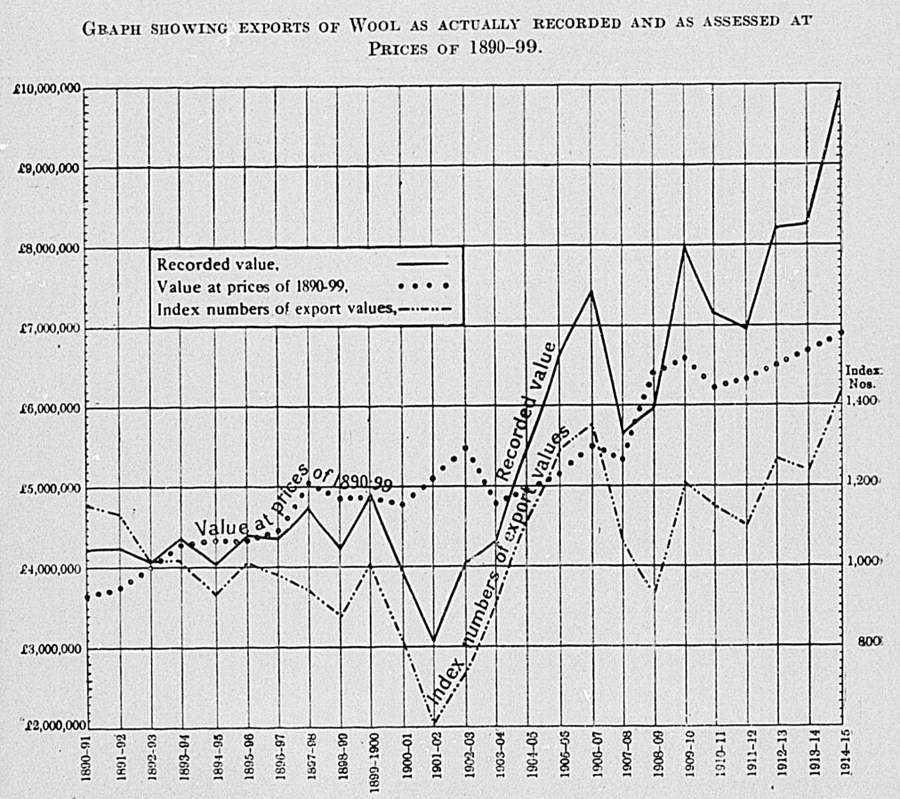

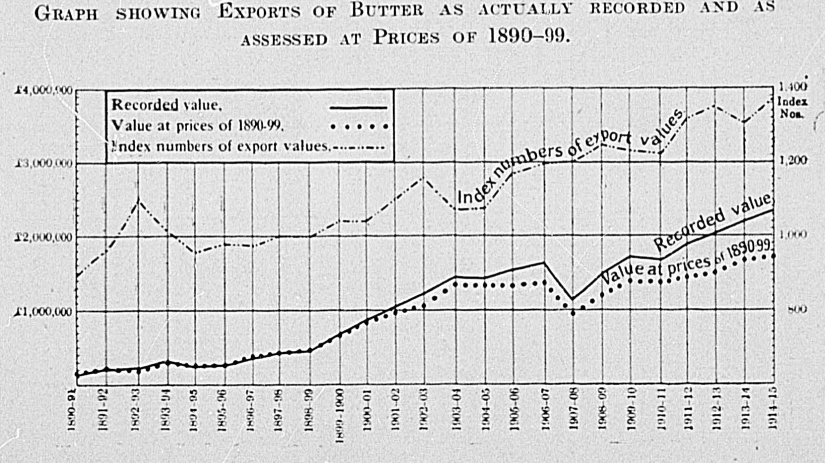
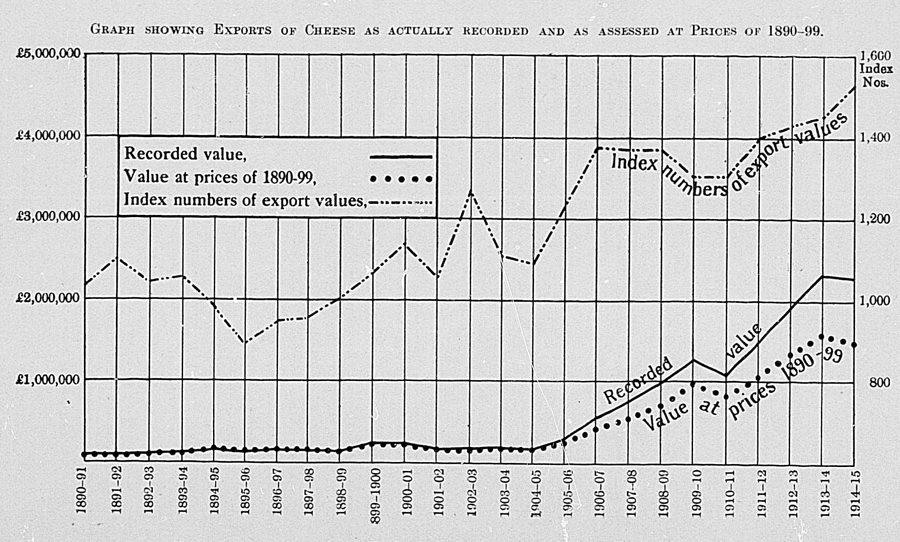
The following tables show the effect of the increases in prices in 1914 as compared with 1913 upon the principal exports of New Zealand produce as shown by the declared export values. The seven commodities selected account for 80 per cent. of the total exports (in 1913 £18,000,000 out of £23,000,000, and in 1914 over £21,500,000 out of £26,000,000). This excludes gold, which never varies in price.
| Item. | 1913. | 1914. | ||||
|---|---|---|---|---|---|---|
| Quantity. | Value. | Quantity. | Value. | Value on 1913 Basis. | Difference. | |
| £ | £ | £ | £ | £ | £ | |
| Wool (lb.) | 186,533,036 | 8,057,620 | 220,472,898 | 9,318,114 | 9,523,768 | –205,654 |
| Frozen meat (cwt.) | 2,578,693 | 4,449,933 | 3,229,973 | 5,863,062 | 5,573,816 | 289,246 |
| Butter | 372,258 | 2,061,651 | 434,067 | 2,338,576 | 2,403,964 | –65,388 |
| Cheese | 611,663 | 1,770,297 | 863,776 | 2,564,125 | 2,499,972 | 64,153 |
| Skins (sheep, with wool) (lb.) | 6,805,449 | 223,362 | 6,675,350 | 230,333 | 219,092 | 11,241 |
| Skins (sheep, without wool) (lb.) | 20,670,937 | 576,992 | 21,922,891 | 626,499 | 611,934 | 14,565 |
| Tallow (ton) | 22,743 | 663,088 | 24,515 | 694,348 | 714,752 | –20,404 |
| .. | 17,802,943 | .. | 21,635,057 | 21,547,298 | 87,759 | |
The excess of exports in 1914 over 1913 amounted to £3,274,725. This excess was made up, as will be seen from the table, almost wholly by an increase in the quantity exported: for instance, wool increased from 186,533,036 lb. in 1913 to 220,472,898 lb. in 1914.
It will be seen that difference in price accounted for very little of the increase in export values—less than £100,000 in an increase of over £3,000,000. Some of the most important commodities—e.g., wool and butter–show, on the average, decreased values. This fact is probably due to two causes: (1) The wool season does not begin till late in the year—most of the exports of 1914 represent the 1913 clip. Therefore the increased prices realized for wool since the war are not reflected in the export values till 1915. (2.) The Customs export values are declared in many cases before the wool is actually marketed in London, and therefore it is probable that the wool in the latter months of 1914 actually realized more than the value placed upon it in New Zealand. Moreover, the big increases in the price of wool did not show till the first sales of 1915. The November sales showed good prices, and owing to the favourable season the quantity offered was greatly in advance of the usual November sales; but the December sales showed a decided set-back in price.
A better idea of the effect on our exports of the increased prices since the war is seen in the comparison of the first six months of 1915 with the first six months of 1914, which is given below.
| Item. | First Six Months, 1914. | First Six Months, 1915. | ||||
|---|---|---|---|---|---|---|
| Quantity. | Value as declared. | Quantity. | Value as declared. | Value on 1914 Basis. | Difference. | |
| £ | £ | £ | £ | £ | £ | |
| Wool (lb.) | 167,640,834 | 6,959,377 | 152,359,359 | 7,548,933 | 6,324,989 | 1,223,944 |
| Frozen meat (cwt.) | 2,145,469 | 3,889,636 | 1,716,707 | 3,822,566 | 3,112,310 | 710,256 |
| Butter “ | 234,997 | 1,246,348 | 212,719 | 1,244,634 | 1,128,193 | 116,441 |
| Cheese “ | 643,731 | 1,909,430 | 511,704 | 1,622,814 | 1,517,812 | 105,002 |
| Skins (sheep, with wool) (lb.) | 3,388,839 | 112,261 | 2,24,176 | 91,537 | 76,992 | 14,545 |
| Skins (sheep, without wool) (lb.) | 15,223,944 | 436,962 | 15,583,328 | 422,390 | 447,273 | –24,883 |
| Tallow (ton) | 17,206 | 493,506 | 17,257 | 503,955 | 494,969 | 8,986 |
| .. | 15,047,520 | .. | 15,256,829 | 13,102,538 | 2,154,291 | |
From the above table it is evident that the quantities exported in 1915 are generally less than in 1914. This is probably due partly to a proportion of the new season's wool being hurried away in 1914 in order to meet the rapid increase in demand which was occasioned by the war, but principally to the lack of shipping in the first two or three months of 1915, which is reflected mainly in the decreased exports of meat and dairy-produce.
Though the quantities are much less in 1915, the values are slightly more, owing to the great increase in prices.
If the quantities for 1915 are based on the values ruling in 1914 the total exports would amount to only £13,000,000, so that the gain from the increased prices may be said to have exceeded £2,000,000 in the first six months of 1915. This gain would have been proportionately greater if the quantity of frozen meat and dairy-produce exported had not been checked by the scarcity of shipping-space.
The following table show the total values of the exports from each port of New Zealand, arranged in order of magnitude in 1914. In order to eliminate any temporary fluctuation an annual average has been taken over five-yearly periods since 1894 and contrasted with the figures for 1914.
Some changes will be noticeable from the figures given in the table, particularly the great development of Wellington as an exporting centre; Auckland also has increased its total rapidly; but Lyttelton, from first in 1898–1902, has fallen to third place, and Dunedin has been displaced by Napier. Some of the smaller ports have increased enormously—e.g., Poverty Bay and Patea; and all round there is a considerable development, only three ports—Hokitika, Kaipara, and Oamaru—showing decreased exports over the period.
The amounts credited to each port do not represent the actual goods passing over the wharf, since exports are credited as far as possible to the districts in which they are produced.
| Yearly Average of Quinquennial Periods. | |||||
|---|---|---|---|---|---|
| Ports. | 1895–99. | 1900–4. | 1905–9. | 1910–14. | Year 1914. |
| £ | £ | £ | £ | £ | |
* Included in New Plymouth. | |||||
| Wellington | 1,544,887 | 2,474,814 | 3,393,645 | 3,742,148 | 7,674,256 |
| Auckland | 1,495,981 | 2,219,342 | 3,111,357 | 5,206,637 | 4,062,530 |
| Lyttelton | 1,969,933 | 2,444,322 | 2,567,234 | 3,007,494 | 3,253,575 |
| Napier | 970,667 | 890,652 | 1,505,122 | 1,851,551 | 2,346,324 |
| Dunedin | 1,069,271 | 1,477,752 | 1,494,761 | 1,529,095 | 1,555,232 |
| Invercargill | 671,285 | 858,241 | 1,084,922 | 1,334,216 | 1,322,049 |
| Bluff | |||||
| Poverty Bay | 284,886 | 482,684 | 874,791 | 1,222,651 | 1,506,842 |
| Timaru | 554,225 | 854,611 | 1,093,127 | 1,022,173 | 1,326,577 |
| Patea | 43,887 | 180,391 | 450,506 | 614,082 | 439,776 |
| New Plymouth | 272,477 | 407,795 | 502,480 | 538,131 | 334,591 |
| Wanganui | 308,138 | 346,717 | 409,909 | 531,362 | 672,201 |
| Greymouth | 241,889 | 388,151 | 381,458 | 373,543 | 326,075 |
| Waitara | * | 95,701 | 250,392 | 323,471 | 389,684 |
| Wairau and Picton | 130,249 | 170,785 | 268,517 | 318,829 | 339,627 |
| Oamaru | 242,436 | 252,014 | 235,240 | 211,527 | 258,943 |
| Nelson | 61,253 | 84,027 | 80,763 | 157,981 | 163,932 |
| Kaipara | 101,499 | 148,717 | 140,536 | 129,416 | 127,783 |
| Westport | 37,469 | 73,663 | 56,523 | 63,972 | 100,671 |
| Hokitika | 61,961 | 38,624 | 31,019 | 25,172 | 16,309 |
| Tauranga | 8 | 129 | .. | .. | |
In 1901 a group of Pacific islands was annexed to New Zealand, and has since been administered by the Dominion. The islands are fertile and rich in tropical products, so that there is a growing trade between them and the Dominion proper. This trade is not regarded as external to New Zealand, but merely as interchange between different parts of the Dominion, and it is therefore not included in the account of the external trade. Separate returns are made of the transactions between the Dominion and its dependent islands, and these are summarized below.
| TOTAL VALUE OF EXPORTS FROM NEW ZEALAND TO COOK ANDOTHER ANNEXED ISLANDS SINCE 1901. | |
|---|---|
| Year. | Exports. |
| £ | |
| 1901 | 21,849 |
| 1902 | 22,973 |
| 1903 | 27,965 |
| 1904 | 28,644 |
| 1905 | 29,098 |
| 1906 | 35,452 |
| 1907 | 38,288 |
| 1908 | 39,284 |
| 1909 | 40,204 |
| 1910 | 60,647 |
| 1911 | 56,131 |
| 1912 | 75,774 |
| 1913 | 72,046 |
| 1914 | 59,056 |
The trade with these islands is practically the only entrepôt trade open to New Zealand, and the exports consist of manufactures and similar goods which cannot be produced in the islands. In 1914 the principal items so exported were,—
| EXPORTS TO COOK ISLANDS, 1914. | ||||||
|---|---|---|---|---|---|---|
| Class. | Item. | Article. | Quantity. | Value. | ||
| Produce of New Zealand. | Other. | Total. | ||||
| £ | £ | £ | £ | £ | £ | |
| I | 1 | Butter | 211 cwt. | 1,320 | .. | 1,320 |
| 32 | Meats, potted and preserved | 2,735 cwt. | 8,331 | 3 | 8,334 | |
| 41 | Provisions, n.o.e. | .. | 551 | 511 | 1,062 | |
| II | 43 | Biscuits, ships' plain | 3,415 cwt. | 4,593 | .. | 4,593 |
| 87 | Flour, wheaten | 4,695 centals | 2,346 | 315 | 2,661 | |
| 130 | Sugar, refined | 3,045 cwt. | 2,597 | 7 | 2,604 | |
| IXA | 234 | Apparel and ready - made clothing, n.o.e. | .. | 956 | 1,169 | 2,125 |
| IXB | 267 | Drapery, n.o.e. | .. | 166 | 1,455 | 1,621 |
| 278 | Cotton piece-goods, n.o.e. | .. | .. | 2,131 | 2,131 | |
| XII | 357 | Coal, bunkers | 1,653 tons | 1,593 | 137 | 1,730 |
| XIVB | 430 | Iron, plate and sheet, corrugated, galvanized | 1,638 tons | .. | 1,425 | 1,425 |
| XVIIA | 635 | Timber, sawn, n.o.e., rough, kauri | 1,523,663 s.ft. | 7,061 | .. | 7,061 |
| XXIII | 875 | Soap, common bar | 846 cwt. | 1,093 | .. | 1,093 |
| NOTE.—The above table includes all items of a total value of £1,000 or more. | ||||||
A table is attached showing all the exports of New Zealand produce to German Samoa during the year 1914. In addition to the items shown below there was some re-export trade with the islands. It will be seen that the main items of export are foodstuffs, such as butter, bacon, salted beef, preserved meats, biscuits, bran, sugar.
| EXPORTS OF NEW ZEALAND PRODUCE TO GERMAN SAMOA, 1914. | |||||
|---|---|---|---|---|---|
| (Arranged according to classification.) | |||||
| Class. | Item. | Article. | Quantity. | Value. | |
| £ | £ | £ | |||
| I | 1 | Butter | (cwt.) | 562 | 3,611 |
| 4 | Cheese | ″ | 95 | 307 | |
| 5 | Eggs, in shell | (doz.) | 315 | 33 | |
| 7 | ” liquid white and yolk | .. | .. | 1 | |
| 10 | Fish, preserved (not oysters) | (cwt.) | 2 | 13 | |
| 11 | ” preserved in tins, &c. | (lb.) | 3,220 | 130 | |
| 12 | ” smoked, dried. &c., n.o.e. | (cwt.) | 17 | 38 | |
| 14 | Honey | (lb.) | 72 | 4 | |
| 16 | Bacon | ″ | 26,449 | 1,043 | |
| 19 | Beef, frozen | (cwt.) | 37 | 99 | |
| 20 | ” salted | ″ | 3,168 | 5,406 | |
| I | 21 | Hams | (lb.) | 12,008 | 555 |
| 27 | Meat-extract | ″ | 20 | 9 | |
| 32 | Potted and preserved meat | (cwt.) | 3,672 | 11,965 | |
| 38 | Meats, other, frozen | ″ | 8 | 24 | |
| 40 | Milk, cream (condensed, preserved, &c.) | (lb.) | 14,240 | 249 | |
| 41 | Provisions, n.o.e. | .. | 797 | ||
| Total | .. | 24,284 | |||
| II | 43 | Biscuits, ships' plain | (cwt.) | 930 | 1,129 |
| 44 | ” other | (lb.) | 1,810 | 48 | |
| 52 | Confectionery, n.o.e. | ″ | 714 | 16 | |
| 54 | Foods, animal (chaff) | (tons) | 74 | 446 | |
| 55 | ” “ (hay) | ″ | 1 | 4 | |
| 58 | ” “ (n.o.e.) | .. | .. | 77 | |
| 59 | Fruits, bottled and preserved | (doz.) | 26 | 11 | |
| 67 | ” fresh | (lb.) | 3,568 | 49 | |
| 70 | Grapes | ″ | 62 | 5 | |
| 73 | Pears | ″ | 420 | 6 | |
| 74 | Plums, cherries, quinces, tomatoes | ″ | 216 | 2 | |
| 78 | Barley | (centals) | 2 | 1 | |
| 79 | Beans and peas | ″ | 68 | 41 | |
| 80 | Maize | ″ | 27 | 13 | |
| 81 | Oats | ″ | 1,919 | 653 | |
| 83 | Wheat | ″ | 561 | 210 | |
| 86 | Grain and pulse—Bran | ″ | 5,352 | 1,095 | |
| 87 | Flour, wheaten | .. | 496 | 311 | |
| 92 | Malt, other | (bushels) | 11 | 5 | |
| 93 | Oatmeal | (centals) | 56 | 46 | |
| 95 | Pollard and sharps | ″ | 22 | 9 | |
| 99 | Wheatmeal and rolled oats | ″ | 145 | 54 | |
| 100 | Grain and pulse, n.o.e. | .. | 327 | 100 | |
| 101 | Hops | (lb.) | 502 | 41 | |
| 102 | Infants' and invalids' foods, n.o.e. | .. | .. | 5 | |
| 103 | Jams, jellies, &c. (marmalade and served ginger) | (lb.) | 26,028 | 368 | |
| 104 | Jellies, concentrated | ″ | 192 | 3 | |
| 110 | Walnuts, shelled or unshelled | ″ | 70 | 2 | |
| 112 | Oilmen's stores, n.o.e. | .. | .. | 2 | |
| 114 | Peel, lemon and orange, in brine | (lb.) | 34 | 2 | |
| 116 | Pickles | (gal.) | 44 | 19 | |
| 117 | Sauces, chutneys, with soy | ″ | 28 | 6 | |
| 123 | Spices, n.o.e., ground | (lb.) | 48 | 3 | |
| 127 | Sugar—Golden syrup | (cwt.) | 10 | 10 | |
| 130 | ” refined | ″ | 3,479 | 2,876 | |
| 133 | Vegetables, dried and preserved | .. | .. | 4 | |
| 134 | ” onions | (tons) | 10 | 119 | |
| 135 | ” potatoes | ″ | 77 | 474 | |
| 136 | ” other fresh | ″ | .. | 10 | |
| 137 | Vinegar | (gal.) | 62 | 9 | |
| Total | .. | .. | 8,284 | ||
| III | 138 | Aerated mineral waters | .. | 329 | |
| 143 | Coffee, raw | (lb.) | 870 | 35 | |
| 144 | ” roasted | ″ | 3,738 | 180 | |
| 145 | Limejuice, &c. | .. | .. | 22 | |
| 146 | ” “ unsweetened containers, of 10 gals. or over | (gal.) | 100 | 18 | |
| 147 | ” “ unsweetened containers under 10 gals. | (gal.) | 18 | 5 | |
| Total | .. | .. | 589 | ||
| IV | 151 | Ale, beer, porter, cider, perry, containing more than 2 per cent. proof spirit | (gal.) | 420 | 70 |
| 161 | Essences, culinary, flavouring, n.o.e. | .. | .. | 8 | |
| Total | .. | .. | 78 | ||
| VI | 174 | Cattle, ordinary | (number) | 20 | 203 |
| 175 | ” for stud purposes | ″ | 18 | 162 | |
| 176 | Horses, ordinary | ″ | 7 | 123 | |
| 178 | ” mares for stud purposes | ″ | 12 | 300 | |
| 179 | Pigs, ordinary | ″ | 32 | 133 | |
| 180 | ” breeding | ″ | 1 | 4 | |
| 181 | Poultry | ″ | 445 | 98 | |
| 182 | Sheep, ordinary | ″ | 40 | 61 | |
| 185 | Other mammals | ″ | 1 | 4 | |
| Total | .. | .. | 1,088 | ||
| VIII | 223 | Seeds, grass and clover | .. | .. | 2 |
| 227 | Starch, other | (lb.) | 48 | 1 | |
| Total | .. | .. | 3 | ||
| IX | 234 | Apparel, &c., n.o.e. | .. | .. | 828 |
| 244 | Boots, other | (doz. prs.) | 10 | 62 | |
| 251 | Hats and caps | (doz.) | 3 | 7 | |
| 252 | Hatmakers' materials | .. | .. | 4 | |
| 261 | Umbrellas, parasols, sunshades | .. | .. | 23 | |
| 263 | Textiles, articles made up of | .. | .. | 34 | |
| 264 | Blankets, woollen | (pairs) | 5 | 14 | |
| 267 | Drapery, n.o.e. | .. | .. | 19 | |
| 288 | Rugs, woollen | .. | .. | 31 | |
| 301 | Cordage and rope, n.o.e. | (cwt.) | 150 | 292 | |
| 302 | Twine, binder | ″ | 12 | 23 | |
| Total | .. | .. | 1,337 | ||
| X | 311 | Greases, axle-grease, &c. | .. | .. | 1 |
| 313 | Lard and refined animal fat, n.o.e | (cwt.) | 152 | 429 | |
| 317 | Oil, neatsfoot, in bulk | (gal.) | 10 | 2 | |
| 332 | ” linseed | ″ | 10 | 2 | |
| 338 | ” not essential, &c. | .. | .. | 5 | |
| 341 | ” unrefined | .. | .. | 2 | |
| Total | .. | .. | 441 | ||
| XI | 348 | Paint ground in oil or turpentine | (cwt.) | 1 | 3 |
| Total | .. | .. | 3 | ||
| XII | 357 | Coal, bunker | (tons) | 972 | 972 |
| 358 | ” cargo | ″ | 1,226 | 950 | |
| 359 | Coke | .. | .. | 1 | |
| 371 | Stones, other | .. | .. | 30 | |
| Total | .. | .. | 1,953 | ||
| XIV | 422 | Hardware and ironmongery | .. | .. | 44 |
| 425 | Iron and steel, galvanized, manufactures | .. | .. | 481 | |
| 442 | Load piping | .. | .. | 2 | |
| 454 | Nails, roofing (lead-beaded) | (cwt.) | 27 | 53 | |
| 476 | ” other | .. | .. | 35 | |
| 482 | Tools and implements, other | .. | .. | 1 | |
| 489 | Wire notting | .. | .. | 22 | |
| 495 | Metal manufactures, n.o.e. | .. | .. | 27 | |
| Total | .. | .. | 665 | ||
| XVI | 587 | Hide-leather, other than East India kip, undressed | (lb.) | 43 | 6 |
| 592 | Sole, pump, and skirt leather | ″ | 55 | 5 | |
| 602 | Leather manufactures, n.o.e. | .. | .. | 133 | |
| Total | .. | .. | 144 | ||
| XVII | 628 | Timber, n.o.e., dressed, kauri | (sup. ft.) | 72,022 | 1,168 |
| 635 | ” “ rough “ | .. | 30,812 | 423 | |
| 643 | Basket and wickerware | .. | .. | 6 | |
| 648 | Wheels | .. | .. | 7 | |
| 649 | Doors and sashes | .. | .. | 7 | |
| 653 | Furniture, n.o.e. | .. | .. | 34 | |
| 655 | Handles, other | .. | .. | 1 | |
| 657 | Mouldings, panels, &c. | .. | .. | 24 | |
| 661 | Woodenware and turnery, n.o.e., &c. | .. | .. | 110 | |
| Total | .. | .. | 1,780 | ||
| XVIII | 664 | Bricks, fire | (number) | 1,000 | 11 |
| 669 | Earthenware, stoneware, &c. n.o.e. | .. | .. | 27 | |
| 680 | Lime | (cwt.) | 144 | 18 | |
| Total | .. | .. | 56 | ||
| XIX | 685 | Bags, paper, n.o.e. | (cwt.) | 1 | 4 |
| 694 | Paper—Wrapping, unprinted | .. | 34 | 52 | |
| 695 | ” Writing (not less than “demy”) | .. | 1 | 2 | |
| 702 | Directories of New Zealand or parts | .. | .. | 6 | |
| 706 | Stationery, manufactured, n.o.e. | .. | .. | 16 | |
| 709 | Pictures, n.o.e. | .. | .. | 1 | |
| 711 | Stationery, n.o.e. | .. | .. | 5 | |
| Total | .. | .. | 86 | ||
| XX | 712 | Fancy goods and toys | .. | .. | 14 |
| XXII | 746 | Drugs, &c., baking-powder, yeast foods, &c. | .. | .. | 16 |
| 757 | Insecticides, disinfectants | .. | .. | 1 | |
| 759 | N.o.e. | .. | .. | 1 | |
| 765 | Medicinal preparations and other sundries, &c. | .. | .. | 5 | |
| 781 | Soda, bicarbonate and carbonate | (cwt.) | 1 | 1 | |
| Total | .. | .. | 24 | ||
| XXIII | 843 | Boats, launches, &c., and other vessels when exported in any vessel | (number) | 1 | 33 |
| 846 | Ship-chandlery, n.o.e. | .. | .. | 4 | |
| 847 | Brushes, brushware, brooms | .. | .. | 27 | |
| 854 | Fish-ova | .. | .. | 11 | |
| 875 | Soap, common bar | (cwt.) | 1,597 | 1,916 | |
| 876 | ” powder, dry, soft. liquid, and extracts of, &c. | .. | .. | 4 | |
| 877 | ” n.o.e. | .. | .. | 95 | |
| 880 | Tar | .. | .. | 3 | |
| 884 | Bicycles and parts | .. | .. | 1 | |
| 891 | Vehicles—Carriages | (number) | 1 | 27 | |
| 892 | ” Carts, drays, wagons | ″ | 2 | 170 | |
| 902 | Miscellaneous manufactures | .. | .. | 6 | |
| .. | Parcels-post | .. | .. | 139 | |
| Total | .. | .. | 2,436 | ||
| Grand total | .. | .. | 43,265 | ||
An exact and detailed account is kept of all imports of merchandise into New Zealand from overseas, and the Customs Department insists on full and accurate descriptions of all goods passing under its control. Entries must be passed and invoices presented for every package imported, and the quantities and values stated on the entries must be supported by declaration. The detailed nature of the tariff makes it essential that all goods should be described minutely under the tariff headings, and care is also taken to furnish statistical information concerning quantities. In the case of goods chargeable with specific duties, the quantities are ascertained by examination in support of the invoices; but where no duty is involved the invoiced quantities are accepted.
The import value taken is the c.i.f. or landed value in New Zealand, thus including freight into the Dominion. For free goods and goods liable to specific duties this landed value in New Zealand is insisted upon. But the landed value for ad valorem goods is defined as the fair market value of the goods when sold for home consumption in the principal markets of the country whence imported, and at the time whence imported, plus 10 per cent.—i.e., the f.o.b. invoice value plus a uniform 10 per cent. to cover the cost of freight, &c. Fair market value is accepted as the wholesale; value less all the usual trade discounts, but including all special discounts. Since 1914 the ordinary cash discount has been allowed, and the value of casing or packing may also be deducted, if shown separately.
Passengers' baggage is omitted from the total of imports in each year, except where dutiable items are included. Personal luggage is exempt from duty upon declaration that the goods are personal property, not intended for sale, have been in use for twelve months, and do not exceed £100 in value.
The earliest trade in New Zealand, as of most colonies, consisted more of exploitation and appropriation by visiting traders than of regular exchange. The whalers and sealers brought with them sufficient provisions to last their season, and they were never more than passing visitors to the Islands. The first genuine import trade sprang up when the Maoris became sensible of the great wealth to be won by bartering their flax for iron and other treasures of the white man. Each tribe became anxious to secure the services of a pakeha-Maori, a white resident trader, to aid them in their exchanges, and several of these man were adopted into the different tribes. At the same time small permanent settlements began to spring up in the North. A new element was introduced when the Maori adopted the musket in preference to the old hand weapons, for the possession of firearms became a necessary precaution against the danger of extermination. Intertribal warfare was conducted on an ever-increasing scale, and muskets were the most prized of all possessions, so that when the chief Hongi returned from his visit to England in 1821 he changed all his valuable presents into firearms as soon as he reached Sydney.
In 1830 the imports into New Zealand from Sydney according to a return quoted by Dr. McNab (“Historical Records of New Zealand,” Vol. I), were made up of the following items:—
| TOTAL QUANTITIES, DESCRIPTION, AND VALUE OF GOODS EXPORTEDFROM SYDNEY TO NEW ZEALAND FROM 1ST JANUARY TO 14TH AUGUST, 1830. | ||||
|---|---|---|---|---|
| Description. | Quantity. | Value. | ||
| £ | s. | d. | ||
| Bread | 203½ cwt. | 260 | 0 | 0 |
| Bricks | 7,000 | 10 | 5 | 0 |
| Beer | 730 gallons | 75 | 0 | 0 |
| Cedar | 1,793 ft. | 33 | 0 | 0 |
| Cheese | 335 lb. | 14 | 0 | 0 |
| Flour | 87,992 lb. | 787 | 0 | 0 |
| Shingles | 24,970 | 25 | 0 | 0 |
| Cartouche boxes | 142 | 39 | 0 | 0 |
| Corks | 30 gross | 7 | 0 | 0 |
| Earthen and glassware | Sundry packs | 75 | 0 | 0 |
| Flints | 12,000 | 18 | 0 | 0 |
| Groceries | Sundry packs | 44 | 0 | 0 |
| Gunpowder | 11,052 lb. | 862 | 0 | 0 |
| Hardware | Sundry packs | 639 | 0 | 0 |
| Muskets | 2,120 | 2,938 | 0 | 0 |
| Rope | 80 cwt. | 220 | 0 | 0 |
| Salt | 249 cwt. | 51 | 10 | 0 |
| Tobacco-pipes | 65 gross | 26 | 0 | 0 |
| Salt provisions | 87 cwt. | 200 | 0 | 0 |
| Shot | 836 lb. | 8 | 0 | 0 |
| Water-casks | 260 tons | 235 | 0 | 0 |
| Slops | Sundry packs | 458 | 0 | 0 |
| Staves | 3,400 | 300 | 0 | 0 |
| Woollens | 1,426 yards | 104 | 0 | 0 |
| Rice | 2,540 lb. | 21 | 0 | 0 |
| Rum and whisky | 2,429 gallons | 424 | 0 | 0 |
| Brandy and gin | 1,607 gallons | 300 | 0 | 0 |
| Sugar | 7,149 lb. | 138 | 0 | 0 |
| Tea | 1,696 lb. | 115 | 0 | 0 |
| Tobacco | 5,062 lb. | 310 | 0 | 0 |
| Horned cattle | 2 | 10 | 0 | 0 |
| Blankets | 78 pairs | 76 | 0 | 0 |
| Iron | 8 tons | 152 | 0 | 0 |
| Linen | 2,700 yards | 220 | 0 | 0 |
| Cutlasses | 50 | 15 | 0 | 0 |
| Leather, manufactured | Sundry packs | 67 | 0 | 0 |
| Wine | 120 gallons | 18 | 0 | 0 |
| Sundries not enumerated above | .. | 297 | 0 | 0 |
| 9,591 | 15 | 0 | ||
However, with the incoming of the regular colonists, trade assumed its more modern form, and the import of firearms was quickly overshadowed by the more peaceful requirements of the settlers. It was not for many years that the Maori finally gave up the appeal to force in order to sustain his claims or his rights; but since the second Maori War in the “sixties” the Natives have settled more and more into European habits.
Permanent settlement in 1840 rendered necessary the continued and increasing import of clothing, metals, and manufactures to sustain the colonists and develop the colony. For many years after the first landing imports were greatly in excess of exports, and this excess represents the import of capital which was necessary to put the young colony on a firm footing. Especially in the early years, New Zealand, while supplying foodstuffs from her own resources, has been dependent upon the outside world for a great proportion of the manufactures necessary for development, and also of the luxuries and amenities of modern life.
The gold rushes brought a huge increase of population and also of imports, and reference to the subsection on “Total trade” will show the effect of the stimulus given by the gold discoveries. In the later “sixties” imports were declining; but the borrowing policy pursued in the “seventies” resulted once more in an increase of imports for a time. Violent fluctuations succeed, with a general tendency to diminish until, in sympathy with the increased exports, the value of imports rapidly increases from 1895. The worst check was received in 1909, following the bad year of exports in 1908.
The nature of the imports has changed little from the time of the first settlement in New Zealand, though new commodities have naturally been introduced, the principal groups of commodities being clothing and textiles, metals and machinery, sugar, tea, alcoholic liquors, tobacco, paper and stationery, motor vehicles. The proportions of these imports have changed little for many years, except that motor vehicles have increased very rapidly during the last decade.
The following table shows the total imports for New Zealand during the last decade:—
| IMPORTS, 1905–14. | ||||||||
|---|---|---|---|---|---|---|---|---|
| Year. | Value. | Value per Head. | ||||||
| Including Specie. | Excluding Specie. | Including Specie. | Excluding Specie. | |||||
| £ | £ | £ | s. | d. | £ | s. | d. | |
| 1905 | 12,828,857 | 12,481,178 | 14 | 14 | 11 | 14 | 6 | 11 |
| 1906 | 15,211,403 | 14,303,170 | 16 | 19 | 8 | 15 | 19 | 5 |
| 1907 | 17,302,861 | 16,539,707 | 18 | 16 | 6 | 17 | 19 | 11 |
| 1908 | 17,471,284 | 17,247,162 | 18 | 9 | 9 | 18 | 5 | 0 |
| 1909 | 15,674,719 | 14,817,462 | 16 | 2 | 7 | 15 | 4 | 11 |
| 1910 | 17,051,583 | 16,748,223 | 17 | 3 | 6 | 16 | 17 | 5 |
| 1911 | 19,545,879 | 18,782,608 | 19 | 5 | 2 | 18 | 10 | 2 |
| 1912 | 20,976,574 | 20,576,579 | 20 | 3 | 9 | 19 | 16 | 1 |
| 1913 | 22,288,302 | 21,653,632 | 20 | 17 | 1 | 20 | 5 | 3 |
| 1914 | 21,856,096 | 21,144,227 | 20 | 0 | 11 | 19 | 7 | 10 |
The main groups of imports according to the classification followed in the “Statistics of New Zealand.” Volume II, are given below for the five years 1910–14. Owing to the very varied nature of the import trade, it is not possible to summarize it as satisfactorily as is possible with exports, and the classification is necessarily rough. The big totals for the general heading, such as “Other metals and manufactures.” indicate the difficulty of summarizing such varied articles.
| MAIN GROUPS OF IMPORTS, 1910–14. | |||||
|---|---|---|---|---|---|
| Group of Principal Articles imported. | 1910. | 1911. | 1912. | 1913. | 1914. |
* Includes methylated and perfumed spirits, and spirits of wine. | |||||
| £ | £ | £ | £ | £ | |
| Apparel, including hats and caps | 1,053,074 | 1,201,065 | 1,331,841 | 1,554,361 | 1,438,838 |
| Boots and shoes | 271,984 | 312,049 | 347,104 | 411,955 | 386,576 |
| Drapery, haberdashery, linens, woollens, and other textiles | 2,283,668 | 2,489,837 | 2,378,468 | 2,403,178 | 2,382,911 |
| Hosiery | 163,861 | 171,469 | 187,725 | 209,846 | 200,561 |
| Silks | 59,437 | 76,059 | 103,936 | 97,591 | 140,261 |
| Totals | 3,832,024 | 4,250,479 | 4,349,074 | 4,676,931 | 4,559,147 |
| Iron and steel (pig, wrought, wire, &c., and galvanized) | 1,173,716 | 1,401,442 | 1,387,758 | 1,510,681 | 1,261,159 |
| Railway and tramway plant | 200,653 | 209,222 | 205,593 | 269,412 | 164,198 |
| Machinery | 640,189 | 725,578 | 989,714 | 1,039,307 | 967,568 |
| Sewing and knitting machines | 57,068 | 52,118 | 64,245 | 54,971 | 43,948 |
| Hardware and ironmongery | 417,402 | 474,822 | 485,266 | 472,137 | 408,654 |
| Tools and implements (including agricultural) | 299,560 | 342,464 | 397,816 | 397,846 | 373,215 |
| Nails | 70,232 | 69,931 | 70,560 | 58,272 | 58,592 |
| Other metals and metal manufactures | 494,747 | 606,841 | 720,730 | 726,933 | 834,710 |
| Totals | 3,353,567 | 3,882,418 | 4,321,682 | 4,529,559 | 4,112,044 |
| Sugar | 623,538 | 676,395 | 814,202 | 812,528 | 699,307 |
| Tea | 293,955 | 331,461 | 320,289 | 296,933 | 430,001 |
| Totals | 917,493 | 1,007,856 | 1,134,491. | 1,109,461 | 1,129,308 |
| Beer | 53,086 | 51,978 | 62,711 | 57,854 | 62,292 |
| Spirits* | 332,734 | 327,983 | 382,396 | 398,225 | 413,427 |
| Tobacco | 447,407 | 434,461 | 488,392 | 466,159 | 614,029 |
| Wine | 77,826 | 78,220 | 86,476 | 77,034 | 79,326 |
| Totals | 911,053 | 892,642 | 1,019,975 | 999,272 | 1,169,074 |
| Paper | 305,584 | 351,717 | 381,024 | 377,494 | 378,535 |
| Printed books | 213,328 | 235,017 | 265,985 | 248,668 | 252,160 |
| Stationery | 192,483 | 209,162 | 223,584 | 232,960 | 224,099 |
| Totals | 711,395 | 795,896 | 870,593 | 859,122 | 854,794 |
| Miscellaneous (specified articles)— | |||||
| Arms, ammunition, and explosives | 136,982 | 181,156 | 236,098 | 225,268 | 173,994 |
| Automobiles, motorcars, and motorcycles, and materials for | 293,015 | 567,452 | 776,650 | 1,021,613 | 1,158,143 |
| Bags and sacks | 211,763 | 132,519 | 213,466 | 233,799 | 222,122 |
| Bicycles and tricycles | 31,139 | 27,170 | 27,886 | 17,843 | 14,304 |
| Bicycle and tricycle fittings | 176,899 | 181,432 | 148,065 | 116,020 | 41,048 |
| Candles | 37,960 | 34,253 | 30,821 | 30,665 | 40,217 |
| Canvas | 59,806 | 64,438 | 87,402 | 103,065 | 91,384 |
| Carpeting and drug-geting | 73,473 | 87,063 | 93,709 | 100,984 | 101,442 |
| Carts, carriages, and materials for | 78,277 | 91,640 | 94,058 | 81,161 | 92,782 |
| Cement | 52,496 | 47,816 | 41,756 | 18,649 | 19,773 |
| China, porcelain, earthenware, and parianware | 143,168 | 169,700 | 166,320 | 193,799 | 167,874 |
| Coal | 230,765 | 186,263 | 365,414 | 466,286 | 558,564 |
| Drugs, chemicals, and druggists' wares | 415,904 | 402,573 | 450,547 | 442,614 | 639,038 |
| Fancy goods and toys | 234,118 | 276,265 | 290,564 | 294,005 | 264,198 |
| Fish (potted and preserved) | 68,635 | 89,703 | 108,185 | 90,545 | 92,058 |
| Floorcloth and oil-cloth | 125,255 | 147,057 | 143,540 | 145,172 | 92,165 |
| Fruits (including fresh, preserved, bottled, and dried) | 340,281 | 422,059 | 433,508 | 322,101 | 375,358 |
| Furniture, cabinet-ware, and upholstery | 74,471 | 98,030 | 104,781 | 110,493 | 49,914 |
| Glass and glassware | 184,627 | 188,717 | 202,950 | 250,976 | 178,895 |
| Leather and leather-manufactures | 169,141 | 167,114 | 212,698 | 226,865 | 211,102 |
| Manures | 273,383 | 320,034 | 392,296 | 377,422 | 512,193 |
| Musical instruments and materials for | 133,414 | 148,295 | 172,013 | 164,021 | 150,453 |
| Seeds | 100,110 | 160,401 | 167,342 | 148,277 | 157,815 |
| Oil | 414,742 | 471,965 | 556,919 | 570,062 | 772,303 |
| Timber | 258,076 | 364,092 | 278,036 | 504,931 | 404,582 |
| Woolpacks and wool-pockets | 57,628 | 71,406 | 63,053 | 74,449 | 77,056 |
| Total miscellaneous (specified articles) | 4,375,828 | 5,098,613 | 5,848,077 | 6,331,085 | 6,658,777 |
| Other imports (excluding specie) | 2,646,863 | 2,854,704 | 3,032,687 | 3,148,202 | 2,661,083 |
| Total imports (excluding specie) | 16,748,223 | 18,782,608 | 20,576,579 | 21,653,632 | 21,144,227 |
| Specie imported | 303,360 | 763,271 | 399,995 | 634,670 | 711,869 |
| Total imports | 17,051,583 | 19,545,879 | 20,976,574 | 22,288,302 | 21,856,096 |
From this table it may be seen that the imports into New Zealand cover many varied items, so that it is not possible to classify them so completely as exports were classified. There are two big groups of items, however, which are of dominating importance, and are, moreover, fairly homogeneous. The first, “Clothing and textiles,” comprises practically all woven articles; but the second, “Metals and machinery,” is not altogether complete, since there are many items in the “Miscellaneous” group which are metal manufactures. The other three groups are well defined, and the value imported in each is steady. A very striking feature is the enormous increase in the imports of motor-cars and accessories, from £293,015 to £1,158,143 in five years. This increase is at the rate of a quarter of a million pounds each year. Practically every items in the tables participates in the steady increase in the value of imports during the last five years.
The increase in the last decade is shown by the following table, which, for each of the groups treated above, contrasts 1914 with 1904. A great increase will be evident in all the main items.
| – | Years. | Annual Imports from | |||||
|---|---|---|---|---|---|---|---|
| United Kingdom. | British Possessions. | Foreign Countries. | |||||
| United States. | Germany. | Others. | Totals. | ||||
| £ | £ | £ | £ | £ | £ | ||
| Textiles, boots and shoes, drapery and clothing | 1904 | 2,742,541 | 158,730 | 123,847 | 30,429 | 61,994 | 3,117,541 |
| 1914 | 4,052,309 | 179,030 | 117,781 | 37,087 | 172,940 | 4,559,147 | |
| Iron and steel, machinery, hardware, tools, and other manufactures of iron and steel | 1904 | 2,066,436 | 237,739 | 493,844 | 54,646 | 84,902 | 2,937,567 |
| 1914 | 2,903,497 | 394,383 | 615,419 | 96,699 | 102,046 | 4,112,044 | |
| Sugar and tea | 1904 | 1,806 | 736,492 | 4,002 | 9 | 249 | 742,558 |
| 1914 | 1,114 | 1,101,415 | 9,850 | 858 | 16,071 | 1,129,308 | |
| Beer, wine, spirits, and tobacco | 1904 | 336,616 | 90,796 | 155,283 | 8,670 | 22,822 | 614,187 |
| 1914 | 740,717 | 233,799 | 99,530 | 9,788 | 85,240 | 1,169,074 | |
| Paper, books, and stationery | 1904 | 390,559 | 91,895 | 69,992 | 20,954 | 10,123 | 583,523 |
| 1914 | 542,241 | 221,720 | 42,964 | 21,441 | 26,428 | 854,794 | |
| Miscellaneous articles | 1904 | 2,444,379 | 1,340,252 | 680,947 | 194,096 | 244,980 | 4,904,654 |
| 1914 | 3,714,398 | 2,853,391 | 1,397,422 | 454,527 | 900,122 | 9,319,860 | |
| Specie | 1904 | 3 | 391,450 | .. | .. | 211 | 391,664 |
| 1914 | 31,670 | 680,100 | .. | .. | 99 | 711,869 | |
| Total imports | 1904 | 7,982,340 | 3,047,354 | 1,527,915 | 308,804 | 425,281 | 13,291,694 |
| 1914 | 11,985,946 | 5,663,838 | 2,282,966 | 620,400 | 1,302,946 | 21,856,096 | |
The following table gives the average annual value of the imports at each port in New Zealand for the last four quinquennial periods, together with similar figures for 1914. Some changes in the relative positions have taken place; but the towns are ranged in order of magnitude in the last period 1910–14. Auckland still retains a slight advantage over Wellington, and both these towns have increased their imports far more rapidly than the two other big ports, while Lyttelton has displaced Dunedin. Napier in 1914 had become the fifth port in the Dominion, as far as imports are concerned, displacing Invercargill. Nelson and Westport have also increased not quite as fast as the average.
It will be seen, however, that the trade is not concentrated in one port; but that a great number of ports both large and small participate in the direct importing trade of the Dominion.
The imports credited to each port consist of the goods actually landed over the wharf at that port, not, as in the case of exports, of the goods credited to the district in which they are produced. The figures given in the following table therefore represent the actual shipping trade of each port, though from the central ports the goods are afterwards distributed over the country, either by rail or by coastal shipping.
| IMPORTS BY PORTS. | |||||
|---|---|---|---|---|---|
| Annual Average. | |||||
| Port. | 1895–99. | 1900–4. | 1905–9. | 1910–14. | 1914. |
* Parcels post now included under the headings of the various ports. | |||||
| £ | £ | £ | £ | £ | |
| Auckland | 2,016,890 | 3,028,741 | 4,057,393 | 5,990,044 | 6,548,880 |
| Wellington | 1,824,956 | 3,340,436 | 4,072,689 | 5,676,335 | 6,503,056 |
| Lyttelton and Christchurch | 1,297,202 | 1,986,820 | 2,463,777 | 3,095,788 | 3,332,734 |
| Dunedin | 1,601,899 | 2,122,087 | 2,311,755 | 2,669,296 | 2,619,829 |
| Invercargill and Bluff | 197,550 | 322,632 | 441,188 | 581,646 | 584,772 |
| Napier | 188,669 | 224,656 | 369,203 | 519,604 | 618,035 |
| Timaru | 102,670 | 166,468 | 272,984 | 366,188 | 415,376 |
| Wanganui | 96,973 | 154,988 | 208,390 | 263,744 | 294,789 |
| Poverty Bay | 29,557 | 55,297 | 113,405 | 187,816 | 192,523 |
| New Plymouth | 47,432 | 82,486 | 106,766 | 173,528 | 206,928 |
| Nelson | 124,177 | 135,558 | 130,368 | 143,774 | 155,927 |
| Greymouth | 38,334 | 72,626 | 88,934 | 113,638 | 106,183 |
| Oamaru | 37,093 | 54,352 | 65,232 | 86,112 | 109,788 |
| Wairau | 10,493 | 17,465 | 28,162 | 52,025 | 66,810 |
| Picton | 950 | 1,978 | 5,594 | ||
| Westport | 20,468 | 35,855 | 46,009 | 49,679 | 47,151 |
| Patea | 12,311 | 18,263 | 24,557 | 29,773 | 28,371 |
| Hokitika | 12,276 | 15,945 | 16,426 | 13,018 | 13,115 |
| Kaipara | 3,224 | 6,729 | 9,554 | 7,188 | 5,040 |
| Tauranga | 3,374 | 3,151 | 1,231 | 6,466 | 6,789 |
| Parcels post | 46,083 | 127,688 | 264,208 | * | * |
| Totals | 7,712,581 | 11,974,221 | 15,697,825 | 20,343,687 | 21,856,096 |
Information as to amount of certain principal articles of food and drink entered for home consumption on importation and ex warehouse is given in the tables which follow. The figures shown for beer include also beer manufactured in the Dominion on which excise duty was paid. In all other cases the articles shown are not produced (in the raw) in the Dominion, or, if so, only in very small quantities, so that the figures shown in the second of the tables practically represent the per capita consumption of the various commodities. Coffee-essence, of which £16,616 worth was entered for home consumption in 1914, is not included in the figures given for coffee.
| TOTAL AMOUNTS ENTEREDFOR HOME CONSUMPTION. | ||||||
|---|---|---|---|---|---|---|
| Article. | Unit of Quantity. | 1910. | 1911. | 1912. | 1913. | 1914. |
* Not including chocolate confectionery. | ||||||
| Tea | lb. | 7,582,530 | 8,066,151 | 7,682,572 | 7,070,429 | 9,951,774 |
| Coffee, raw and roasted | ″ | 282,837 | 277,560 | 311,942 | 320,064 | 337,976 |
| Cocoa and chocolate* | ″ | 562,522 | 556,255 | 610,982 | 597,656 | 555,292 |
| Cocoa-beans | ″ | 375,444 | 404,771 | 363,173 | 504,215 | 669,211 |
| Rice | ″ | 8,528,240 | 9,519,104 | 7,745,248 | 6,619,648 | 9,808,400 |
| Sago and tapioca | ″ | 2,391,872 | 2,770,544 | 2,695,728 | 2,800,560 | 3,487,456 |
| Currants, dried | ″ | 2,856,753 | 3,153,936 | 3,429,779 | 944,053 | 3,366,514 |
| Raisins | ″ | 4,622,078 | 4,338,041 | 7,051,044 | 3,132,827 | 4,913,674 |
| Figs, dates, and prunes | ″ | 3,983,935 | 4,270,604 | 3,411,629 | 2,976,075 | 3,166,768 |
| Sugar | Cwt. | 1,055,342 | 1,153,168 | 1,256,519 | 1,290,752 | 1,013,780 |
| Salt | ″ | 441,060 | 395,340 | 398,060 | 477,720 | 443,940 |
| Spices | lb. | 485,808 | 662,194 | 610,429 | 608,367 | 758,187 |
| Mustard | ″ | 245,432 | 276,039 | 253,866 | 254,053 | 239,500 |
| Tobacco | ″ | 2,801,893 | 2,851,840 | 3,029,076 | 3,024,506 | 3,146,926 |
| Beer | Gal. | 9,671,030 | 9,800,610 | 10,083,482 | 10,300,416 | 10,649,090 |
| Wine | ″ | 153,430 | 143,138 | 153,611 | 147,137 | 156,513 |
| Spirits | ″ | 767,620 | 792,794 | 863,797 | 869,124 | 877,173 |
| AMOUNTS PER HEAD ENTEREDFOR HOME CONSUMPTION. | |||||||
|---|---|---|---|---|---|---|---|
| Article. | Unit of Quantity. | 1910. | 1911. | 1912. | 1913. | 1914. | Average of 5 Years. |
* Not including chocolate confectionery. | |||||||
| (a) Including Maoris. | |||||||
| Tea | lb. | 7.29 | 7.58 | 7.06 | 6.32 | 8.73 | 7.40 |
| Coffee, raw and roasted | ″ | 0.27 | 0.26 | 0.29 | 0.29 | 0.30 | 0.28 |
| Cocoa and chocolate* | ″ | 0.54 | 0.52 | 0.56 | 0.53 | 0.49 | 0.53 |
| Cocoa-beans | ″ | 0.36 | 0.38 | 0.33 | 0.45 | 0.59 | 0.42 |
| Rice | ″ | 8.20 | 8.94 | 7.11 | 5.92 | 8.60 | 7.75 |
| Sago and tapioca | ″ | 2.30 | 2.60 | 2.48 | 2.50 | 3.06 | 2.59 |
| Currants, dried | ″ | 2.75 | 2.96 | 3.15 | 0.84 | 2.95 | 2.53 |
| Raisins | ″ | 4.41 | 4.07 | 6.48 | 2.80 | 4.31 | 4.41 |
| Figs, dates, and prunes | ″ | 3.83 | 4.01 | 3.13 | 2.66 | 2.78 | 3.28 |
| Sugar | ″ | 113.59 | 121.31 | 129.24 | 129.25 | 99.58 | 118.59 |
| Salt | ″ | 47.47 | 41.59 | 40.94 | 47.84 | 43.60 | 44.29 |
| Spices | ″ | 0.47 | 0.62 | 0.56 | 0.54 | 0.66 | 0.57 |
| Mustard | ″ | 0.24 | 0.26 | 0.23 | 0.23 | 0.21 | 0.23 |
| Tobacco | ″ | 2.69 | 2.68 | 2.78 | 2.70 | 2.76 | 2.72 |
| Beer | Gal. | 9.29 | 9.20 | 9.26 | 9.21 | 9.34 | 9.26 |
| Wine | ″ | 0.15 | 0.13 | 0.14 | 0.13 | 0.14 | 0.14 |
| Spirits | ″ | 0.74 | 0.74 | 0.79 | 0.78 | 0.77 | 0.76 |
| (b) Excluding Maoris. | |||||||
| Tea | lb. | 7.64 | 7.95 | 7.39 | 6.62 | 9.13 | 7.75 |
| Coffee, raw and roasted | ″ | 0.28 | 0.27 | 0.30 | 0.30 | 0.31 | 0.29 |
| Cocoa and chocolate* | ″ | 0.57 | 0.55 | 0.59 | 0.56 | 0.51 | 0.56 |
| Cocoa-beans | ″ | 0.38 | 0.40 | 0.35 | 0.47 | 0.61 | 0.44 |
| Rice | ″ | 8.59 | 9.38 | 7.45 | 6.19 | 9.00 | 8.12 |
| Sago and tapioca | ″ | 2.41 | 2.73 | 2.59 | 2.62 | 3.20 | 2.71 |
| Currants, dried | ″ | 2.88 | 3.11 | 3.30 | 0.88 | 3.09 | 2.65 |
| Raisins | ″ | 4.66 | 4.27 | 6.79 | 2.93 | 4.51 | 4.63 |
| Figs, dates, and prunes | ″ | 4.01 | 4.21 | 3.28 | 2.78 | 2.90 | 3.44 |
| Sugar | ″ | 119.06 | 127.26 | 135.44 | 135.28 | 104.14 | 124.24 |
| Salt | ″ | 49.76 | 43.63 | 42.91 | 50.07 | 45.60 | 46.39 |
| Spices | ″ | 0.49 | 0.65 | 0.59 | 0.57 | 0.70 | 0.60 |
| Mustard | ″ | 0.25 | 0.27 | 0.24 | 0.24 | 0.22 | 0.24 |
| Tobacco | ″ | 2.82 | 2.81 | 2.92 | 2.83 | 2.89 | 2.85 |
| Beer | Gal. | 9.74 | 9.66 | 9.70 | 9.64 | 9.77 | 9.70 |
| Wine | ″ | 0.15 | 0.14 | 0.15 | 0.14 | 0.14 | 0.14 |
| Spirits | ″ | 0.77 | 0.78 | 0.83 | 0.81 | 0.80 | 0.80 |
The average consumption of the main items of food and drink is, of course, very steady from year to year; but it is interesting to compare the figures for 1914 with the average of the five years. Tea shows a very high average consumption in 1914, and the increase over 1913 is extraordinary; rice also shows an increase, perhaps due to the comparative scarcity and high prices of bread, flour, &c., the figures for dried fruits are most variable, since one of the main sources of supply has of late years been vexed by continual wars. The quantity of sugar imported in 1914 shows a sharp decline, owing to the failure of the Fiji season, and the figures for last year are much below the average.
In 1914 the statistics, both of imports and exports, were collected for the first time upon a new plan, a statistical classification being adopted, which assembles the items in well-defined classes, so that all similar commodities are grouped as far as may be. The advantages of a stereotyped classification of this kind over an alphabetical arrangement of items are obvious. In the preparation of the classes adopted, a good deal of weight has been attached to the recommendations of the Dominions Royal Commission which toured New Zealand in 1913. In a memorandum prepared for the Commission, Professor A. L. Bowley submitted a scheme for uniformity of statistical work within the Empire, and suggested that New Zealand statistics should follow as closely as possible the lines laid down by Australia. The advantages of similarity of treatment in Australia and New Zealand are apparent, and in the classification of imports and exports, as in other matters, the statistics of New Zealand are being made comparable with those of Australia as far as possible.
The main classes of imports in 1914 are presented below.
| IMPORTS IN CLASSES, 1914. | ||
|---|---|---|
| No. | Class. | Value in 1914. |
| £ | ||
| I | Foodstuffs of animal origin (excluding live animals) | 184,865 |
| II | Foodstuffs of vegetable origin and common salt | 1,827,997 |
| III | Beverages (non-alcoholic) and substances used in making up the same | 550,670 |
| IV | Spirits and alcoholic liquors | 555,566 |
| V | Tobacco and preparations thereof | 614,029 |
| VI | Live animals | 29,231 |
| VII | Animal substances (mainly unmanufactured) not being foodstuffs | 42,700 |
| VIII | Vegetable substances and non-manufactured fibres | 379,624 |
| IXA | Apparel | 2,509,211 |
| IXB | Textiles | 2,440,244 |
| IXC | Manufactured fibres | 391,133 |
| X | Oils, fats, and waxes | 825,986 |
| XI | Taints and varnishes | 182,998 |
| XII | Stones and minerals, used industrially | 601,026 |
| XIII | Specie | 711,869 |
| XIVA | Metal unmanufactured, partially manufactured, and ores | 330,798 |
| XIVB | Metal manufactures, other than machinery and machines | 2,551,167 |
| XV | Machinery and machines | 1,235,059 |
| XVIA | Indiarubber and manufactures thereof (not including tires) | 47,941 |
| XVIB | Leather and manufactures thereof, including substitutes | 242,668 |
| XVIIA | Timber | 404,582 |
| XVIIB | Wood, cane, and wicker manufactures | 135,755 |
| XVIII | Earthenware, china, glass, stoneware, cements and cement materials | 379,121 |
| XIXA | Paper | 416,671 |
| XIXB | Stationery | 467,941 |
| XX | Jewellery, timepieces, and fancy goods | 433,930 |
| XXI | Optical, surgical, and scientific instruments | 172,740 |
| XXIIA | Drugs, chemicals, and druggists' wares | 639,051 |
| XXIIB | Manures | 512,193 |
| XXIII | Miscellaneous | 2,039,330 |
| Total | 21,856,096 | |
No one of the twenty-three classes can be said to dominate the table; but a little consideration will bring out the nature of the principal imports. Each class is a definite grouping of allied commodities, and the classes are well defined and distinct. Practically all the exports were contained in classes I and VII; but imports in these classes are very small.
Class II owes most of its total to the import of sugar and fruits, though there are a great many items in the class; similarly the biggest item in class III is tea. It is permissible to group Classes IXA, IXB, and IXC, since the commodities included are closely allied, and these three classes make one of the most important groups in the table. Kerosene, motor-spirit, &c., come in Class X, and coal is the biggest item in XII. Another big group is made up by Classes XIVA and B, and XV, all metal goods. All the other classes are well defined; but it should be said that in 1914 manures continued the increase which has been so evident in recent years. The last class consists of ninety-three items of the most varied character, including arms and ammunition, asbestos, brushware, candles, musical instruments, matches, soap, bicycles, and motor-cars.
The import trade of the Dominion, though spread over more countries than the export trade, is yet confined mainly to the United Kingdom, Australia, and the United States. In the days of the first settlement Australia was the source from which the young colony drew most of its supplies, and for a long period imports from Australia overshadowed imports from the United Kingdom. The proportion of imports from Australia has, however, tended steadily to decrease till from 60 per cent. in 1862 it has fallen to about 14 per cent. in recent years. It is noticeable, however, that in a year of low imports the proportion brought from Australia increases.
Most of the goods brought to New Zealand from overseas come from the United Kingdom, which in normal times supplies about 60 per cent. of the total imports. This proportion has, however, fallen a good deal of recent years—in the “eighties” and “nineties” the figure was nearer 70 per cent. than 60 per cent. on the average.
The cause of this decline is to be found in the development of trade with other countries in quite recent years, particularly with Germany, the United States, Japan, and in a less degree with France, Belgium, Holland, and other European countries. The United States were sending goods to New Zealand practically from the foundation of the colony, and the share of the imports which was given to that country steadily increased, till in the first decade of the present century it was 11 or 12 per cent. But the adoption of Imperial preference seems to have caused a drop in the figure to about 7 per cent., though the proportion is steadily climbing up again, and has now almost reached its old level. The development of trade with Germany is more recent, but has grown steadily in the last decade, amounting in recent years to about 3 per cent.
India captured the New Zealand jute market in the early “eighties,” and since then there has been a regular import of corn-sacks, wool-packs, &c. In former times the colony imported its sugar from Mauritius, but after 1890 Fiji supplanted Mauritius, so that the imports from the Pacific islands are swelled to 4 per cent., while Mauritius practically disappears from the list of countries. Similarly the import of China tea gave way about the same time to imports from Ceylon.
The present position is illustrated by the tables which follow. It will be seen that there is a big increase in the imports from every country considered. The greatest absolute increase is, of course, in the United Kingdom; but the relative increase is naturally greatest in some of the countries which are just entering the trade. Particularly noticeable are the increases in Canada, United States, and Germany.
| IMPORTS FROM PRINCIPAL COUNTRIES, 1895–1914. | ||||||||
|---|---|---|---|---|---|---|---|---|
| Year. | United Kingdom. | Australia. | Canada. | India. | Ceylon. | Fiji. | United States of America. | Germany |
| £ | £ | £ | £ | £ | £ | £ | £ | |
| 1895 | 3,992,359 | 1,261,125 | 14,508 | 153,241 | 79,892 | 224,517 | 394,233 | 78,034 |
| 1896 | 4,714,476 | 1,090,374 | 19,687 | 125,498 | 95,961 | 234,840 | 492,840 | 101,381 |
| 1897 | 5,392,738 | 1,001,003 | 60,925 | 189,477 | 114,147 | 223,663 | 628,044 | 157,066 |
| 1898 | 5,148,833 | 1,158,865 | 71,491 | 202,295 | 113,813 | 320,886 | 800,411 | 153,102 |
| 1899 | 5,526,645 | 1,336,828 | 63,250 | 213,041 | 116,833 | 250,706 | 775,309 | 160,605 |
| 1900 | 6,504,484 | 1,776,978 | 41,165 | 256,779 | 123,333 | 364,510 | 1,061,873 | 182,074 |
| 1901 | 6,885,831 | 1,979,320 | 42,178 | 332,747 | 134,742 | 349,706 | 1,415,267 | 198,521 |
| 1902 | 6,851,452 | 1,715,295 | 53,374 | 286,061 | 125,891 | 327,972 | 1,318,937 | 210,560 |
| 1903 | 7,512,668 | 2,154,966 | 68,329 | 252,570 | 138,959 | 461,988 | 1,441,358 | 274,297 |
| 1904 | 7,982,340 | 1,893,036 | 113,485 | 276,106 | 172,759 | 516,539 | 1,527,915 | 308,804 |
| 1905 | 7,795,284 | 1,815,717 | 96,119 | 297,128 | 179,809 | 456,629 | 1,438,501 | 277,467 |
| 1906 | 9,003,229 | 2,775,312 | 157,088 | 290,725 | 189,288 | 378,050 | 1,405,781 | 336,960 |
| 1907 | 10,278,019 | 3,127,553 | 215,232 | 370,655 | 220,102 | 625,644 | 1,425,596 | 351,634 |
| 1908 | 10,441,837 | 2,841,426 | 268,259 | 345,180 | 210,675 | 557,709 | 1,643,937 | 389,531 |
| 1909 | 9,287,786 | 2,764,210 | 198,384 | 367,999 | 230,499 | 590,214 | 1,166,063 | 327,847 |
| 1910 | 10,498,771 | 2,359,393 | 261,402 | 399,991 | 248,476 | 580,084 | 1,399,737 | 391,795 |
| 1911 | 11,787,300 | 2,944,991 | 283,410 | 326,360 | 275,672 | 728,806 | 1,682,129 | 480,617 |
| 1912 | 12,499,787 | 2,583,887 | 394,249 | 395,298 | 289,008 | 764,790 | 2,049,618 | 653,230 |
| 1913 | 13,312,193 | 2,914,848 | 452,519 | 421,209 | 275,350 | 846,493 | 2,107,990 | 687,935 |
| 1914 | 11,985,946 | 3,376,371 | 479,140 | 486,978 | 394,444 | 738,751 | 2,282,966 | 620,400 |
The next table gives greater detail and shows all the main countries which shipped goods to New Zealand, arranged in geographical order. A quinquennial comparison is made, so as to eliminate any temporary fluctuations.
| IMPORTS FROM MAIN COUNTRIES, 1910–14. | |||||
|---|---|---|---|---|---|
| Country. | 1910. | 1911. | 1912. | 1913. | 1914. |
| £ | £ | £ | £ | £ | |
| British Possessions. | |||||
| United Kingdom | 10,498,771 | 11,787,300 | 12,499,787 | 13,312,193 | 11,985,946 |
| Europe— | |||||
| Gibraltar | 1 | .. | .. | 2 | 1 |
| Malta | 151 | 13 | 185 | 283 | 74 |
| 152 | 13 | 185 | 285 | 75 | |
| Asia— | |||||
| Burma | 10,885 | 21,615 | 11,791 | 17,569 | 29,026 |
| Ceylon | 248,476 | 275,672 | 289,008 | 275,350 | 394,444 |
| Hong Kong | 20,313 | 15,329 | 18,072 | 14,747 | 32,472 |
| India | 399,991 | 326,360 | 395,298 | 421,209 | 486,978 |
| Straits Settlements | 51,500 | 79,404 | 74,610 | 68,484 | 57,499 |
| Other Asiatic possessions | 27 | 789 | 485 | 779 | 452 |
| 731,192 | 719,169 | 789,264 | 798,138 | 1,000,871 | |
| Africa— | |||||
| South African Union | 7,443 | 9,936 | 13,733 | 7,796 | 33,229 |
| Other African possessions | 2,535 | 5,656 | 8,225 | 109 | 13,513 |
| 9,978 | 15,592 | 21,958 | 7,905 | 46,742 | |
| America— | |||||
| British West Indies | 1,061 | 1,484 | 1,145 | 2,211 | 6,511 |
| Canada, via East Coast | 261,402 | 283,410 | 394,249 | 452,519 | 380,340 |
| Canada, via West Coast | 98,800 | ||||
| Newfoundland | .. | .. | .. | 149 | .. |
| Other American possessions | .. | .. | .. | .. | .. |
| 262,463 | 284,894 | 395,394 | 454,879 | 485,651 | |
| Pacific Islands— | |||||
| Australia | 2,359,393 | 2,944,991 | 2,583,887 | 2,914,848 | 3,376,371 |
| Fiji | 580,084 | 728,806 | 764,790 | 846,493 | 738,751 |
| Other Pacific Islands | 15,216 | 16,575 | 18,007 | 13,508 | 15,377 |
| 2,954,693 | 3,690,372 | 3,366,684 | 3,774,849 | 4,130,499 | |
| Foreign Countries. | |||||
| Europe— | |||||
| Austria | 9,892 | 13,980 | 15,357 | 17,863 | 11,228 |
| Belgium | 100,749 | 129,320 | 153,766 | 203,326 | 110,391 |
| Denmark | 7,341 | 7,149 | 11,411 | 15,169 | 9,804 |
| France | 127,230 | 137,157 | 150,024 | 150,777 | 147,877 |
| Germany | 391,795 | 480,617 | 653,230 | 687,935 | 620,400 |
| Greece | 29,945 | 29,462 | 37,326 | 10,907 | 25,043 |
| Hungary | 205 | 43 | 591 | 489 | 551 |
| Italy | 33,478 | 36,660 | 49,920 | 65,425 | 55,315 |
| Netherlands | 58,189 | 60,537 | 91,233 | 84,015 | 127,038 |
| Norway | 18,534 | 35,998 | 41,686 | 53,850 | 67,771 |
| Portugal | 3,810 | 3,639 | 5,440 | 5,551 | 6,008 |
| Russia | 3,069 | 1,792 | 6,454 | 13,131 | 6,198 |
| Spain | 13,844 | 15,428 | 16,588 | 14,928 | 14,518 |
| Sweden | 42,728 | 50,240 | 90,034 | 93,093 | 79,817 |
| Switzerland | 12,171 | 33,581 | 76,356 | 67,623 | 67,827 |
| Turkey | 13,864 | 16,287 | 15,816 | 7,927 | 13,974 |
| Other European countries | .. | .. | 11 | 1 | .. |
| 866,844 | 1,051,890 | 1,415,243 | 1,492,210 | 1,363,760 | |
| Asia— | |||||
| Asiatic Turkey | 40,297 | 44,934 | 41,512 | 17,215 | 32,805 |
| China | 10,019 | 19,951 | 25,396 | 24,448 | 32,847 |
| Japan | 103,113 | 123,248 | 154,587 | 151,106 | 187,501 |
| Java | 75,965 | 38,106 | 136,905 | 50,490 | 57,412 |
| Sumatra | 34 | .. | .. | 30,289 | 135,843 |
| Other Asiatic countries | 14,604 | 19,398 | 26,997 | 20,417 | 24,072 |
| 244,032 | 245,637 | 385,397 | 293,965 | 470,480 | |
| Africa— | |||||
| Egypt | 1,732 | 1,021 | 1,881 | 2,234 | 1,741 |
| Other African countries | 116 | 125 | 4,746 | 156 | 39,004 |
| 1,848 | 1,146 | 6,627 | 2,390 | 40,745 | |
| America— | |||||
| Argentina | 1 | 13 | 43 | 3 | 23 |
| Brazil | 96 | 182 | 655 | 124 | 165 |
| Chile | 12 | .. | .. | .. | 1 |
| United States of America— | |||||
| Via East Coast | 1,234,960 | 1,388,808 | 1,708,648 | 1,715,342 | 1,851,046 |
| Via West Coast | 164,777 | 293,321 | 340,970 | 392,648 | 431,920 |
| Other American countries | 3,299 | 2,639 | 2,774 | 3,153 | 8,094 |
| 1,403,145 | 1,684,963 | 2,053,090 | 2,111,270 | 2,291,249 | |
| Pacific Islands— | |||||
| German Samoa | 2,542 | 3,142 | 2,249 | 1,823 | 8,049 |
| Hawaii | 30 | 54 | 262 | 55 | 367 |
| Society Islands | 11,964 | 17,653 | 18,146 | 14,305 | 19,423 |
| Tonga (Tutuila) | 45,797 | 31,700 | 14,514 | 15,708 | 12,122 |
| Other Pacific Islands | 18,132 | 12,354 | 7,054 | 8,327 | 117 |
| 78,465 | 64,903 | 42,225 | 40,218 | 40,078 | |
| Grand total | 17,051,583 | 19,545,879 | 20,976,574 | 22,288,302 | 21,856,096 |
In 1914 a change was made in the system of compilation of trade statistics, and for the first time statistics of imports were obtained for countries of origin as well as countries of shipment. Before 1914 it was the practice to credit imports to the country from which the goods were shipped to the Dominion, and considerable care was taken to ensure that the original port of shipment was ascertained. But there was no means of discovering where the goods were actually made, and this was felt as a great gap in the statistics. Arrangements were made accordingly, so that importers are now required to declare the country of origin as well as the country of shipment of all goods imported. The following table shows the result for the first year in which the new system was followed.
| IMPORTS FROM VARIOUS COUNTIES IN 1914. | ||||
|---|---|---|---|---|
| Imports according to | ||||
| Country. | Country of Shipment. | Country of Origin. | ||
| Value. | Per Cent. of Total. | Value. | Per Cent. of Total. | |
| £ | £ | |||
| United Kingdom | 11,985,946 | 54,84 | 11,257,720 | 51,51 |
| British Possessions. | ||||
| Europe— | ||||
| Gibraltar | 1 | .. | .. | .. |
| Malta | 74 | .. | 535 | .. |
| 75 | .. | 535 | .. | |
| Asia— | ||||
| Burma | 29,026 | 0.13 | 32,101 | 0.15 |
| Ceylon | 394,444 | 1.80 | 420,181 | 1.92 |
| Hong Kong | 32,472 | 0.15 | 15,489 | 0.07 |
| India | 486,978 | 2.24 | 502,495 | 2.30 |
| Straits Settlements | 57,499 | 0.26 | 58,852 | 0.27 |
| Other Asiatic possessions | 452 | .. | 103 | .. |
| 1,000,871 | 4.58 | 1,029,221 | 4.71 | |
| Africa— | ||||
| Seychelles | 13,298 | 0.06 | 13,303 | 0.06 |
| South African Union | 33,229 | 0.15 | 98,437 | 0.45 |
| Other African possessions | 215 | .. | 2,670 | 0.01 |
| 46,742 | 0.21 | 114,410 | 0.52 | |
| America— | ||||
| British West Indies | 6,511 | 0.03 | 13,656 | 0.06 |
| Canada via East Coast | 380,340 | 1.74 | 455,468 | 2.09 |
| Canada via West Coast | 98,800 | 0.45 | 540 | .. |
| Other American possessions | .. | .. | .. | .. |
| 485,651 | 2.22 | 469,664 | 2.15 | |
| Pacific Islands— | £ | £ | ||
| Australia | 3,376,371 | 15.45 | 2,682,218 | 12.27 |
| Fiji | 738,751 | 3.38 | 738,428 | 3.38 |
| Maiden Island | 15,174 | 0.07 | 15,174 | 0.07 |
| Other Pacific possessions | 203 | .. | 10,126 | 0.05 |
| 4,130,499 | 18.90 | 3,445,946 | 15.77 | |
| Foreign Countries. | ||||
| Europe— | ||||
| Austria | 11,228 | 0.05 | 49,084 | 0.22 |
| Belgium | 110,391 | 0.51 | 135,514 | 0.62 |
| Denmark | 9,804 | 0.04 | 11,704 | 0.05 |
| France | 147,877 | 0.68 | 399,259 | 1.83 |
| Germany | 620,400 | 2.84 | 1,016,016 | 4.65 |
| Greece | 25,043 | 0.11 | 28.342 | 0.13 |
| Hungary | 551 | .. | 788 | .. |
| Italy | 55,315 | 0.25 | 121,708 | 0.56 |
| Luxemburg | .. | .. | 847 | .. |
| Netherlands | 127,038 | 0.58 | 150,557 | 0.69 |
| Norway | 67,771 | 0.31 | 72,661 | 0.33 |
| Portugal | 6,008 | 0.03 | 11,152 | 0.05 |
| Russia | 6,198 | 0.03 | 15,907 | 0.07 |
| Spain | 14,518 | 0.07 | 28,248 | 0.13 |
| Sweden | 79,817 | 0.37 | 92.180 | 0.42 |
| Switzerland | 67,827 | 0.31 | 217,507 | 1.00 |
| Turkey | 13,974 | 0.06 | 20,646 | 0.09 |
| Other European countries | .. | .. | 50 | .. |
| 1,363,760 | 6.24 | 2,372,170 | 10.84 | |
| Asia— | ||||
| Asiatic Turkey | 32,805 | 0.15 | 39,400 | 0.18 |
| China | 32,847 | 0.15 | 58,237 | 0.27 |
| Dutch Borneo | .. | .. | 3,920 | 0.02 |
| Japan | 187,501 | 0.86 | 232,364 | 1.07 |
| Java | 57,412 | 0.26 | 63,628 | 0.29 |
| Persia | 1,751 | 0.01 | 3,196 | 0.01 |
| Philippine Islands | 20,012 | 0.09 | 21,091 | 0.10 |
| Siberia | 1,314 | 0.01 | 2,281 | 0.01 |
| Sumatra | 135,843 | 0.62 | 132,041 | 0.60 |
| Other Asiatic countries | 995 | .. | 2,296 | 0.01 |
| 470,480 | 2.15 | 558,454 | 2.56 | |
| Africa— | ||||
| Egypt | 1,741 | 0.01 | 2,211 | 0.01 |
| Madagascar | 9,566 | 0.04 | 10,191 | 0.04 |
| Portuguese East Africa | 29,240 | 0.14 | 88 | .. |
| Zanzibar | 76 | .. | 1,027 | 0.01 |
| Other African countries | 122 | .. | 1,255 | 0.01 |
| 40,745 | 0.19 | 14,772 | 0.07 | |
| America— | ||||
| Brazil | 165 | .. | 4,693 | 0.02 |
| Cuba | 7,780 | 0.04 | 10,079 | 0.05 |
| Mexico | 14 | .. | 1,010 | 0.01 |
| United States of America— | ||||
| Via East Coast | 1,851,046 | 8.46 | 2,537,545 | 11.61 |
| Via West Coast | 431,920 | 1.98 | ||
| Other American countries | 324 | .. | 2,932 | 0.01 |
| 2,291,249 | 10.48 | 2,556,259 | 11.70 | |
| Pacific Islands— | ||||
| German Samoa | 8,049 | 0.04 | 5,548 | 0.03 |
| Society Islands | 19,423 | 0.09 | 18,880 | 0.09 |
| Tonga | 12,122 | 0.06 | 11,895 | 0.05 |
| Other Pacific Islands | 484 | .. | 622 | .. |
| 40,078 | 0.19 | 36,945 | 0.17 | |
| Grand Total | 21,856,096 | 100.00 | 21,856,096 | 100.00 |
The additional information given by the above table is very interesting as throwing extra light on the origin of New Zealand imports. It will be noticed that the value of goods made in the United Kingdom is less by three-quarters of a million pounds than the value of direct shipments from that country. These figures, however, are not a good indication of the extent to which the United Kingdom acts as a depot for transhipping goods to New Zealand; because the value of British goods shipped from Australia counteracts the effect of foreign goods shipped from Britain.
Ceylon and India also send a good quantity of goods via Australia; but it will be seen that Hong Kong acts as a transhipping port for Chinese goods. The most striking feature of our trade with Africa is the great quantify of goods which is produced in South Africa and sent to New Zealand via Portuguese East Africa on account of the harbour of Lorenzo Marquez, or shipped to New Zealand from Australia. Both the British West Indies and Canada also produce more of the imports than they ship direct.
It would seem that after the United Kingdom, Australia is the biggest market in which New Zealand buys, and goods to the value of nearly three-quarters of a million pounds are sent here from Australia, after being produced in other countries. The countries of origin seem to be the United Kingdom, the various Eastern counties, and the Pacific islands. The goods produced in “other Pacific Islands” consist mainly of returned New Zealand produce.
The goods produced in the European countries are often shipped via United Kingdom, and as was expected, the total produce of these countries in every instance greatly exceeds the value shipped direct from their ports. The two most important countries, France and Germany, afford a good illustration of the position. Asiatic countries generally show similar results; but Hong Kong and Australia take part of the entrepot trade. United States, too, seems to ship to New Zealand a fair quantity of goods made in Canada.
In order to give more detailed information concerning the trade of New Zealand with other countries the following tables have been compiled, giving the main items of import from all the principal countries with which New Zealand trades. The tables give a five-yearly comparison, and in order to do this it was necessary to take the value of goods shipped from each country, a value which does not necessarily agree with the amount produced in that country.
Account has been taken only of those items of a value of £5,000 or more, so that the tables are not made too complicated by the additions of great numbers of small items. The full detail will be found in the “Statistics of New Zealand,” Volume II.
| PRINCIPAL IMPORTS. | ||||||||
|---|---|---|---|---|---|---|---|---|
| Class. | Item. | Article. | 1910. | 1911. | 1912. | 1913. | 1914. | |
* New heading, 1914. † Included under various items, 1914. | ||||||||
| United Kingdom. | ||||||||
| £ | £ | £ | £ | £ | ||||
| 1 | 11 | Fish, preserved | 23,873 | 24,806 | 27,510 | 25,966 | 21,773 | |
| 40 | Milk and cream, preserved, &c. | 5,354 | 4,030 | 4,814 | 6,556 | 21,283 | ||
| 41 | Provisions n.o.e. | 10,048 | 12,856 | 12,900 | 17,129 | 19,815 | ||
| 44 | Biscuits, other | 5,253 | 4,958 | 6,067 | 6,907 | 6,120 | ||
| 46 | Cocoa-butter, &c. Chocolate Confectionery— | 8,810 | 13,642 | 13,439 | 12,169 | 16,015 | ||
| 48 | In fancy packages | 29,714 | 39,595 | 40,856 | 38,228 | 43,886 | ||
| 49 | In plain trade packages | 5,880 | 8,627 | 9,653 | 11,034 | 12,071 | ||
| 52 | Confectionery n.o.e. | 23,267 | 30,045 | 32,329 | 37,381 | 37,910 | ||
| Grain and pulse, prepared— | ||||||||
| 88 | Maizena and cornflour | 16,995 | 16,165 | 14,751 | 16,743 | 16,830 | ||
| 100 | Unenumerated | 5,011 | 5,894 | 5,369 | 6,507 | 5,704 | ||
| 102 | Infants' and invalids' foods, n.o.e. | 13,729 | 13,486 | 14,515 | 9,812 | 9,609 | ||
| 103 | Jams, jellies, and preserves | 9,070 | 12,444 | 6,449 | 7,183 | 6,546 | ||
| 112 | Oilmen's stores n.o.e. | 13,872 | 14,385 | 13,048 | 16,054 | 15,056 | ||
| 117 | Sauces and chutneys | 12,095 | 11,076 | 11,344 | 11,793 | 10,892 | ||
| Salt— | ||||||||
| 120 | Rock | 33,056 | 44,01 | 37,489 | 47,170 | 2,438 | ||
| 121 | Table preparations | 1,945 | ||||||
| 122 | Other | 39,543 | ||||||
| 137 | Vinegar | 7,930 | 7,219 | 5,608 | 7,662 | 8,701 | ||
| III | 140 | Cocoa and chocolate | 27,472 | 23,915 | 25,441 | 29,335 | 30,626 | |
| 142 | Coffee-essence | 18,651 | 15,140 | 16,343 | 18,399 | 16,947 | ||
| IV | 151 | Ale and beer, &c. | 50,229 | 49,774 | 60,209 | 54,348 | 59,500 | |
| Spirits— | ||||||||
| 154 | Brandy | 22,816 | 22,779 | 22,175 | 24,735 | 16,470 | ||
| 155 | Gin, geneva, and schnapps | 10,755 | 10,031 | 10,766 | 11,708 | 10,035 | ||
| 158 | Whisky | 232,014 | 224,255 | 275,183 | 284,248 | 283,239 | ||
| 160 | Essences, flavouring spirituous | 9,236 | 9,667 | 9,203 | 11,403 | 10,796 | ||
| 163 | Spirits, perfumed | 4,207 | 4,824 | 3,473 | 5,336 | 5,651 | ||
| Wine— | ||||||||
| 166 | Sparkling | 12,014 | 14,306 | 13,674 | 10,827 | 5,920 | ||
| 167 | Still | 12,220 | 12,573 | 11,797 | 12,742 | 10,040 | ||
| V | 168 | Cigarettes | 131,459 | 145,571 | 152,906 | 169,909 | 221,809 | |
| 169 | Cigars | 4,063 | 5,650 | 6,303 | 19,461 | 7,817 | ||
| Tobacco, manufactured— | ||||||||
| 171 | Cut | 82,370 | 94,323 | 82,218 | 66,872 | 95,148 | ||
| 172 | Other | 4,839 | ||||||
| VI | 177 | Horses—Entires* | .. | .. | .. | .. | 5,015 | |
| VIII | 209 | Cork, cut | 3,150 | 4,261 | 4,703 | 4,532 | 9,778 | |
| 211 | Engineers' cotton-waste | 8,160 | 9,887 | 6,717 | 10,887 | 7,784 | ||
| Seeds— | ||||||||
| 223 | Grass and clover | 25,673 | 51,103 | 39,400 | 32,665 | 35,444 | ||
| 225 | Other | 27,722 | 47,229 | 40,396 | 38,933 | 50,779 | ||
| 233 | Yarns, other | 10,260 | 17,665 | 15,568 | 19,226 | 22,941 | ||
| IXA | 234 | Apparel and ready-made clothing n.o.e. | 779,320 | 905,354 | 1,015,439 | 1,186,024 | 1,092,539 | |
| 235 | Apparel made to order | 1,223 | 1,508 | 927 | 1,146 | 6,287 | ||
| Hoots and shoes | ||||||||
| 236 | Childrens', 0–6 | 18,234 | 18,444 | 20,172 | 23,950 | 20,257 | ||
| 239 | Goloshes, slippers, &c. | 12,353 | 12,737 | 13,749 | 17,078 | 18,665 | ||
| 240 | Grindery | 26,713 | 25,494 | 31,543 | 30,909 | 30,803 | ||
| 243 | Vamps, uppers, and lace | 9,039 | 8,953 | 10,532 | 10,711 | 11,030 | ||
| 244 | Other | 193,205 | 240,476 | 270,301 | 322,885 | 310,102 | ||
| 245 | Corsets* | .. | .. | .. | .. | 11,145 | ||
| 246 | Furs, and fur trimmings | 16,296 | 9,385 | 7,932 | 13,835 | 20,864 | ||
| 247 | Gloves n.o.e.* | .. | .. | .. | .. | 46,356 | ||
| Haberdashery— | ||||||||
| 249 | Buttons, tapes, &c. | 33,089 | 38,571 | 38,609 | 49,437 | 46,951 | ||
| 250 | Unenumerated | 1,738 | 1,017 | 1,780 | 921 | 16,931 | ||
| 251 | Hats and caps | 88,274 | 90,537 | 87,212 | 114,632 | 119,916 | ||
| 252 | Hatmakers materials | 26,254 | 24,082 | 24,527 | 22,589 | 15,837 | ||
| 253 | Hosiery | 160,654 | 168,611 | 183,265 | 206,264 | 192,990 | ||
| 254 | Lace and laces n.o.e. | 58,704 | 48,543 | 46,604 | 42,287 | 44,598 | ||
| Millinery— | ||||||||
| 256 | Other ornamental feathers | 6,856 | 6,194 | 8,550 | 13,713 | 12,653 | ||
| 257 | Unenumerated | 68,827 | 71,843 | 83,362 | 92,344 | 89,526 | ||
| 258 | Minor articles n.o.e. for making up apparel, &c. | 6,558 | 7,189 | 8,627 | 9,924 | 8,784 | ||
| 259 | Ribbon and crape | 53,825 | 45,532 | 44,978 | 42,508 | 71,444 | ||
| 260 | Tailors' trimmings | 62,591 | 66,702 | 75,987 | 80,971 | 69,353 | ||
| 261 | Umbrellas, parasols, and sunshades | 9,634 | 7,700 | 5,757 | 6,204 | 5,807 | ||
| 262 | Umbrellas, parasols, &c., materials for making | 14,054 | 10,805 | 8,638 | 10,068 | 6,206 | ||
| IXB | 263 | Articles n.o.e., partly or wholly made up from textiles | 21,032 | 21,215 | 23,638 | 30,599 | 30,438 | |
| 266 | Carpets, druggets, &c. | 72,120 | 82,761 | 88,946 | 95,981 | 95,810 | ||
| 267 | Drapery n.o.e. | 363,623 | 406,297 | 353,295 | 309,885 | 251,412 | ||
| 268 | Felt, sheathing | 5,034 | 4,707 | 6,703 | 6,314 | 6,187 | ||
| 270 | Matting n.o.e. and mats | 7,153 | 6,627 | 7,310 | 8,738 | 7,990 | ||
| 271 | Oilcloths, linoleum, &c.* | .. | .. | .. | .. | 89,189 | ||
| 274 | Canvas, sailcloth, and unbleached double-warped duck | 53,191 | 60,990 | 78,300 | 94,091 | 82,911 | ||
| 275 | Butter and cheese cloth | 6,432 | 5,851 | 6,537 | 8,278 | 7,603 | ||
| 276 | Candle-wick | 6,462 | 6,891 | 5,436 | 7,984 | 6,325 | ||
| 277 | Tubular woven cotton cloth, for meat-wraps | 38,836 | 43,975 | 47,594 | 43,177 | 49,634 | ||
| 278 | Cotton piece-goods n.o.e. | 757,224 | 791,974 | 780,691 | 831,504 | 736,062 | ||
| 279 | Hessians n.o.e. and scrim | 29,189 | 31,951 | 29,157 | 42,115 | 45,917 | ||
| 280 | Leather-cloth | 8,615 | 8,994 | 9,116 | 8,354 | 7,202 | ||
| 281 | Linen piece-goods | 96,491 | 96,309 | 56,558 | 56,073 | 41,800 | ||
| 283 | Silks, satins, velvets, and plushes | 25,920 | 22,061 | 29,076 | 36,135 | 55,673 | ||
| 286 | Woollen piece-goods n.o.e. | 206,739 | 308,731 | 319,567 | 385,145 | 345,091 | ||
| 287 | Textile piece-goods n.o.e. | 336,475 | 290,479 | 218,936 | 157,515 | 139,452 | ||
| VIIIB | Rugs— | |||||||
| 288 | Woollen | 18,123 | 19,979 | 21,106 | 25,047 | 11,424 | ||
| 289 | Other | 10,880 | ||||||
| 290 | Sewing threads, silks, cotton, &c. | 71,850 | 76,565 | 73,412 | 67,115 | 67,147 | ||
| 291 | Tents, tarpaulins, sails, &c. | 2,216 | 2,229 | 2,216 | 6,905 | 7,477 | ||
| Cordage and rope— | ||||||||
| IX | 300 | Iron and steel | 30,081 | 34,772 | 33,339 | 42,700 | 34,027 | |
| 301 | Unenumerated | 39,612 | 15,236 | 16,242 | 15,280 | 11,924 | ||
| 309 | Twine n.o.e. | 23,722 | 26,100 | 21,815 | 29,514 | 28,307 | ||
| Oils— | ||||||||
| X | 325 | Mineral, lubricating | 6,925 | 6,583 | 10,805 | 14,916 | 15,554 | |
| 332 | Vegetable, linseed | 56,389 | 91,120 | 87,645 | 77,211 | 39,200 | ||
| 338 | Oils in vessels containing less than J. gallon | 7,084 | 6,308 | 5,749 | 16,054 | 6,060 | ||
| Paints— | ||||||||
| XI | 348 | Ground in oil or turpentine | 69,711 | 70,637 | 80,465 | 91,653 | 83,215 | |
| 350 | Other | 25,714 | 23,402 | 32,360 | 33,749 | 32,641 | ||
| 351 | Unenumerated | 14,465 | 13,153 | 13,143 | 14,802 | 12,461 | ||
| 354 | Varnishes, lacquers, and gold-size | 17,465 | 13,883 | 16,863 | 18,198 | 15,234 | ||
| XII | 371 | Stone, other, dressed or polished, and manufactures | 5,542 | 7,876 | 6,542 | 7,307 | 7,718 | |
| Specie— | ||||||||
| XIII | 374 | Gold | .. | .. | .. | .. | 21,000 | |
| 375 | Silver | 23 | 70 | 101,520 | 80,655 | 6,900 | ||
| Iron and steel— | ||||||||
| XIVA | 388 | Bar, bolt, and rod | 156,501 | 206,862 | 181,620 | 248,087 | 172,176 | |
| 391 | Pig | 34,534 | 35,800 | 43,928 | 42,587 | 38,675 | ||
| 402 | Tin—Ingots, pigs, bars, &c. | 7,718 | 9,534 | 9,864 | 13,735 | 18,474 | ||
| 405 | Metal, unmanufactured, n.o.e.* | .. | .. | .. | .. | 5,558 | ||
| XIVB | 408 | Bolts and nuts | 28,623 | 29,280 | 34,235 | 40,929 | 44,155 | |
| 414 | Chains and chain cables | 13,340 | 12,176 | 17,990 | 16,955 | 13,256 | ||
| 416 | Copper, plate and sheet, plain* | .. | .. | .. | .. | 19,629 | ||
| 417 | Cutlery* | .. | .. | .. | .. | 35,298 | ||
| 422 | Hardware, hollow-ware, and ironmongery n.o.e. | 332,773 | 380,109 | 386,119 | 361,730 | 273,709 | ||
| Iron and steel— | ||||||||
| 423 | Angle and tee | 9,014 | 11,834 | 12,436 | 16,749 | 8,816 | ||
| 424 | Channels and girders* | .. | .. | .. | .. | 37,759 | ||
| 426 | Hoop, black, n.o.e. | 21,399 | 16,738 | .. | 28,632 | 20,833 | ||
| 430 | Corrugated, galvanized | 270,603 | 306,337 | 279,424 | 329,293 | 249,101 | ||
| Plate and sheet— | ||||||||
| 431 | Plain black | 50,335 | 58,689 | 60,381 | 87,460 | 47,186 | ||
| 432 | Plain galvanized | 51,886 | 79,178 | 66,293 | 71,691 | 53,430 | ||
| Tubes, pipes, &c.— | ||||||||
| 433 | Cast over 9 in. diam. | 85,9651 | 246,917 | 232,145 | 252,831 | 12,301 | ||
| 434 | Cast under 9 in. diam. | 27,916 | ||||||
| 435 | Wrought over 6 in. diam. | 8,235 | ||||||
| 436 | Wrought under 6 in. diam. | 165,381 | ||||||
| Lamps, &c.— | ||||||||
| 439 | Gas-mantles* | .. | .. | .. | .. | 6,131 | ||
| 441 | Other | 25,808 | 32,728 | 5,506 | 37,092 | 25,075 | ||
| 443 | Lead, sheet* | .. | .. | .. | .. | 10,182 | ||
| Meters— | ||||||||
| 447 | Electricity, household supply* | .. | .. | .. | .. | 9,691 | ||
| 448 | Gas, household supply* | .. | .. | .. | .. | 17,920 | ||
| 450 | Water* | .. | .. | .. | .. | 6,244 | ||
| 455 | Nails, other | 22,066 | 27,911 | 35,929 | 27,331 | 20,936 | ||
| XIVB | 456 | Plate and platedware | 77,327 | 83,541 | 91,855 | 92,868 | 87,749 | |
| 458 | Printing materials—Type and materials n.o.e. | 8,275 | 7,823 | 9,772 | 11,461 | 7,927 | ||
| Railway and tramway plant— | ||||||||
| 461 | Rails, &c. | 54,833 | 42,629 | 38,076 | 66,445 | 104,156 | ||
| 462 | Wagons, cars, &c. | 8,943 | ||||||
| 463 | Other | 34,707 | ||||||
| 465 | Rivets and washers | 9,864 | 10,808 | 10,358 | 11,655 | 10,176 | ||
| 469 | Stoves and ranges, gas* | .. | .. | .. | .. | 5,588 | ||
| 472 | Tanks and cisterns | 13,003 | 17,350 | 19,047 | 17,875 | 17,089 | ||
| 473 | Telephones and accessories* | .. | .. | .. | .. | 11,793 | ||
| 474 | Tinned sheets and plates, plain | 55,573 | 72,218 | 75,473 | 77,859 | 75,536 | ||
| 476 | Tinware, other | 13,100 | 16,251 | 16,200 | 15,382 | 18,074 | ||
| 481 | Spades, shovels, and forks | 7,166 | 8,750 | 9,534 | 11,495 | 11,794 | ||
| 482 | Tools and implements, other | 56,281 | 66,372 | 74,527 | 73,231 | 54,846 | ||
| Wire— | ||||||||
| 484 | Bare copper* | .. | .. | .. | .. | 21,495 | ||
| Iron— | ||||||||
| 485 | Fencing, barbed | 30,997 | 30,973 | 31,977 | 22,643 | 22,707 | ||
| 486 | Fencing, plain | 69,041 | 73,295 | 82,077 | 57,278 | 66,704 | ||
| 488 | N.o.e.* | .. | .. | .. | .. | 5,482 | ||
| 489 | Netting | 51,151 | 53,782 | 64,242 | 53,245 | 56,182 | ||
| 491 | Other plain | 1,127 | 814 | 5,528 | 7,717 | 9,929 | ||
| Metal manufactures, other— | ||||||||
| 494 | Free | 61,459 | 67,814 | 79,631 | 87,824 | 15,929 | ||
| 495 | 20 per cent. | 92,874 | 149,137 | 170,017 | 171,383 | 115,141 | ||
| Machinery— | ||||||||
| moreXV | 1511 | Agricultural, other* | .. | .. | .. | .. | 37,898 | |
| 517 | Dairying—Cream-separating machines* | .. | .. | .. | .. | 8,139 | ||
| Electrical— | ||||||||
| 525 | Generators, motors and transformers, &c. | 137,621 | 178,637 | 274,027 | 308,131 | 59,122 | ||
| 526 | Insulated cable and wire | 111,045 | ||||||
| 527 | Lamps, &c. | 21,683 | ||||||
| 528 | Materials, &c. | 6,416 | ||||||
| 529 | N.o.e. Engines— | 64,829 | ||||||
| 531 | Gas, &c., for motorcars | 67,149 | 105,961 | 149,126 | 160,243 | 62,662 | ||
| 532 | Gas, &c., other | 68,137 | ||||||
| 533 | Portable and traction | 27,033 | 22,617 | 31,498 | 20,673 | 15,804 | ||
| 535 | Steam n.o.e., under 11,000 i.h.p. | 10,744 | 8,693 | 29,692 | 8,106 | 5,725 | ||
| 536 | Boilers for, over 500 i.h.p. | |||||||
| 553 | Mining, unenumerated* | .. | .. | .. | .. | 16,187 | ||
| 557 | Printing — Printing machines and presses* | .. | .. | .. | .. | 19,240 | ||
| 559 | Road rollers and graders* | .. | .. | .. | .. | 7,307 | ||
| 560 | Sewing-machines | 26,899 | 18,396 | 15,318 | 14,882 | 5,030 | ||
| 501 | Tools — Engineers' machine and hand tools, &c. | 28,786 | 41,061 | 44,947 | 45,327 | 34,545 | ||
| 562 | Typewriters | 5,804 | 5,133 | 4,620 | 5,764 | 5,504 | ||
| 567 | Woollen-mill, unenumerated | 5,423 | 14,127 | 6,468 | 9,811 | 7,864 | ||
| XVmor | 569 | Unenumerated (5 per cent.) | 7,438 | 3,648 | 4,393 | 8,572 | 5,493 | |
| 570 | N.o.e. (20 per cent.) | 55,025 | 74,343 | 70,411 | 66,004 | 67,370 | ||
| 572 | Materials for parts of (free) | 9,136 | 9,335 | 14,170 | 23,488 | 27,151 | ||
| XVIA | 573 | Indiarubber, hose and piping, &c. | 14,546 | 10,604 | 13,143 | 11,288 | 11,844 | |
| XVIB | 579 | Belting, other than leather | 26,087 | 27,405 | 26,243 | 35,006 | 26,862 | |
| Leather— | ||||||||
| 585 | Goat and kid skins* | .. | .. | .. | .. | 7,669 | ||
| 592 | Sole, pump, and skirt leather* | .. | .. | .. | .. | 38,259 | ||
| 597 | Portmanteaux | 4,056 | 7,818 | 7,953 | 13,590 | 9,840 | ||
| Saddlery and harness— | ||||||||
| 598 | Collar-check | 8,100 | 8,431 | 7,545 | 9,652 | 13,864 | ||
| 600 | Saddlers' ironmongery | 21,729 | 27,640 | 5,045 | 25,076 | 15,634 | ||
| 602 | Unenumerated | 29,952 | 33,841 | 40,226 | 24,797 | 18,889 | ||
| Furniture—- | ||||||||
| XVIIB | 651 | Materials for—Blind webbing and tape, &c. | 7,007 | 6,829 | 10,389 | 8,115 | 7,840 | |
| 653 | Unenumerated | 16,035 | 14,573 | 17,226 | 16,934 | 10,382 | ||
| 661 | Woodenware and turnery n.o.e. | 10,948 | 11,734 | 14,265 | 14,205 | 11,807 | ||
| XVIII | 666 | Cement, building, Portland, and other structural | 52,338 | 46,495 | 41,040 | 18,429 | 19,252 | |
| 667 | China, porcelain, and parianware | 29,819 | 36,904 | 35,009 | 39,015 | 28,957 | ||
| 669 | Earthenware n.o.e. Glass— | 80,753 | 97,597 | 99,557 | 105,774 | 75,275 | ||
| 671 | Bottles, plain, empty | 29,480 | 29,936 | 28,247 | 32,421 | 25,391 | ||
| 673 | Crown, sheet and common window | 20,520 | 20,597 | 22,422 | 22,856 | 13,476 | ||
| 674 | Glassware n.o.e. | 13,043 | 15,390 | 11,395 | 12,385 | 12,034 | ||
| 676 | Mirrors and looking-glasses | 6,973 | 7,255 | 6,027 | 8,192 | 5,971 | ||
| 678 | Plate, other | 20,417 | 17,266 | 16,754 | 22,237 | 12,625 | ||
| 679 | Unenumerated* | .. | .. | .. | .. | 6,430 | ||
| 682 | Tiles n.o.e. — Flooring, wall, hearth, and garden* | .. | .. | .. | .. | 10,771 | ||
| XIXA | 685 | Paper bags, unenumerated | 7,420 | 6,781 | 12,342 | 9,065 | 8,934 | |
| 686 | Bookbinders' materials | 6,148 | 7,597 | 8,818 | 7,355 | 7,948 | ||
| 689 | Cardboard boxes, materials for, other | 12,212 | 13,226 | 11,505 | 13,944 | 9,877 | ||
| 692 | Paperhangings Paper | 39,652 | 39,441 | 42,536 | 40,171 | 34,750 | ||
| 693 | Printing | 92,025 | 119,680 | 114,464 | 114,446 | 99,995 | ||
| 694 | Wrapping | 7,071 | 8,371 | 6,763 | 6,030 | 5,934 | ||
| 695 | Writing | 40,704 | 54,733 | 55,167 | 54,497 | 49,331 | ||
| XIXB | 697 | Artists' materials* | .. | .. | .. | .. | 5,837 | |
| 698 | Books, papers and music, printed n.o.e. | 151,000 | 161,596 | 186,138 | 170,792 | 179,957 | ||
| 699 | Calendars and showcards* | .. | .. | .. | .. | 10,710 | ||
| 703 | Handbills, circulars, &c. | 8,203 | 8,196 | 10,490 | 10,954 | 14,303 | ||
| 704 | Inks, printing | 4,577 | 5,007 | 5,348 | 5,574 | 5,548 | ||
| 706 | Stationery, manufactured | 49,255 | 52,606 | 53,958 | 61,021 | 50,049 | ||
| 709 | Pictures, paintings, &c., n.o.e. | 5,219 | 5,512 | 8,068 | 8,773 | 6,705 | ||
| 71 | Stationery n.o.e. | 8,170 | 7,365 | 62,115 | 66,090 | 58,360 | ||
| XX | 712 | Fancy goods and toys | 145,036 | 164,063 | 166,546 | 181,425 | 118,000 | |
| 714 | Precious stones, cut, unmounted | 35 | 30 | 19 | 159 | 14,435 | ||
| 715 | Jewellery, other | 8,189 | 8,120 | 4,338 | 5,926 | 52,318 | ||
| XX | 716 | Sporting, gaming, and athletic requisites n.o.e.* | .. | .. | .. | .. | 31,655 | |
| 717 | Clocks | 5,093 | 7,065 | 5,691 | 7,792 | 6,254 | ||
| 719 | Watches | 8,333 | 8,878 | 11,266 | 12,156 | 45,337 | ||
| 721 | Tobacco-pipes, cigarette-cases, &c. | 18,601 | 25,267 | 26,450 | 23,519 | 29,366 | ||
| 725 | Cinematograph, &c., films* | .. | .. | .. | .. | 13,465 | ||
| XXI | 728 | Microscopes and telescopes* | .. | .. | .. | .. | 9,171 | |
| Photo goods— | ||||||||
| 729 | Cameras and lenses | 5,660 | 5,657 | 6,941 | 6,303 | 8,390 | ||
| 730 | Sensitized surfaces, &c. | 16,670 | 16,084 | 15,348 | 19,006 | 19,771 | ||
| Instruments— | ||||||||
| 732 | Scientific n.o.e. | 5,037 | 5,810 | 7,837 | 6,756 | 5,989 | ||
| 733 | Surgical and dental | 16,074 | 19,374 | 19,277 | 21,085 | 24,358 | ||
| XXIIA | 752 | Cyanide of potassium and sodium | 52,323 | 43,064 | 37,110 | 25,474 | 40,270 | |
| 757 | Disinfectants | 12,991 | 13,490 | 13,484 | 15,177 | 14,568 | ||
| 759 | Insecticides and tree-washes n.o.e. | 2,924 | 2,551 | 1,451 | 2,339 | 6,434 | ||
| 761 | Sheep-dip | 50,522 | 30,328 | 47,003 | 51,994 | 43,270 | ||
| 765 | Medicinal preparations n.o.e. | 79,934 | 88,677 | 87,392 | 99,164 | 100,222 | ||
| 768 | Oils, essential, other | 4,416 | 29 | 5,068 | 5,920 | 6,298 | ||
| 772 | Perfumery—Toilet preparations | 11,796 | 13,322 | 13,149 | 18,365 | 20,638 | ||
| Soda— | ||||||||
| 780 | Ash | 6,261 | 7,868 | 6,478 | 6,255 | 6,676 | ||
| 781 | Carbonate and bicarbonate | 6,986 | 5,940 | 4,629 | 7,170 | 7,083 | ||
| 782 | Caustic | 13,541 | 11,561 | 10,514 | 13,766 | 13,219 | ||
| XXIIB | 798 | Basic slag and Thomas' phosphate* | .. | .. | .. | .. | 67,817 | |
| 803 | Superphosphates* Arms, &c.— | .. | .. | .. | .. | 48,954 | ||
| XXIII | 815 | Cartridges, shot, 10–24 bore | 23,078 | 23,221 | 27,330 | 19,045 | 24,926 | |
| 822 | Firearms for New Zealand Government (not ordnance stores) | 239 | 35,012 | 42 | 24,405 | 9,164 | ||
| 824 | Firearms, other | 5,525 | 6,367 | 8,394 | 5,930 | 8,609 | ||
| 831 | Gelignite* | .. | .. | .. | .. | 46,412 | ||
| 834 | Ordnance stores | 8,591 | 7,171 | 74,602 | 62,692 | 13,653 | ||
| 835 | Powder, blasting | 17,325 | 13,244 | 18,954 | 15,872 | 17,049 | ||
| 838 | A. and M.S. | 20,967 | 24,171 | 25,351 | 28,814 | 19,608 | ||
| 839 | Asbestos, sheets, slates, and tiles* | .. | .. | .. | .. | 19,658 | ||
| 842 | Blue, laundry | 8,693 | 7,727 | 8,359 | 6,217 | 8,999 | ||
| 847 | Brushes, brushware and brooms | 38,185 | 43,782 | 52,467 | 50,323 | 36,948 | ||
| 848 | Brushmakers' materials | 5,489 | 6,401 | 9,905 | 8,441 | 10,804 | ||
| 849 | Candles | 29,136 | 20,724 | 23,574 | 18,953 | 23,806 | ||
| 853 | Educational apparatus Instruments, musical— | 6,592 | 6,993 | 7,845 | 8,251 | 5,661 | ||
| 859 | Pianos | 61,890 | 68,515 | 74,155 | 79,926 | 61,325 | ||
| 860 | Pianolas and gramophones* | .. | .. | .. | .. | 9,456 | ||
| 861 | Records for pianolas, &c.* | .. | .. | .. | .. | 7,966 | ||
| 862 | Other | 6,958 | 7,771 | 9,527 | 13,623 | 8,980 | ||
| Matches and vestas— | ||||||||
| 863 | Wax | 20,166 | 19,410 | 10,335 | 17,184 | 22,257 | ||
| 864 | Wooden | 2,026 | 944 | 3,896 | 7,310 | 7,013 | ||
| 867 | Engine-packing | 12,370 | 11,947 | 13,409 | 13,437 | 11,587 | ||
| Polishes— | ||||||||
| 870 | Blacking | 27,031 | 7,157 | 5,748 | 4,767 | 5,723 | ||
| 871 | Blacklead | 6,121 | 7,238 | 8,653 | 6,520 | 5,343 | ||
| 872 | Metal polishes* | .. | .. | .. | .. | 5,169 | ||
| Soap— | ||||||||
| XXIII | 876 | Powder, &c. | 11,287 | 14,116 | 15,817 | 13,079 | 15,689 | |
| 877 | Unenumerated | 17,307 | 18,362 | 18,419 | 20,372 | 23,704 | ||
| 882 | Bicycles and tricycles | 37,473 | 53,600 | 27,435 | 17,354 | 13,760 | ||
| 883 | Rubber tires for* | .. | .. | .. | .. | 14,327 | ||
| 886 | Motor bicycles and tricycles | 7,401 | 21,469 | 43,238 | 49,280 | 40,565 | ||
| 887 | Rubber tires for* | .. | .. | .. | .. | 28,900 | ||
| 888 | Other materials (free)* | .. | .. | .. | .. | 21,465 | ||
| 889 | Other materials (20 per cent.)* | .. | .. | .. | .. | 18,569 | ||
| Motor vehicles— | ||||||||
| 893 | Bodies for | 31,307 | 49,003 | 60,059 | 69,307 | 66,613 | ||
| 894 | Chassis for | 126,011 | 186,101 | 196,080 | 270,857 | 281,551 | ||
| 895 | Rubber tires* | .. | .. | .. | .. | 108,846 | ||
| Vehicles— | ||||||||
| 899 | Axles, axle-arms, &c. | 15,050 | 15,937 | 20,338 | 19,343 | 9,500 | ||
| 900 | Springs, &c. | 23,952 | 42,588 | 19,510 | 22,437 | 21,628 | ||
| 902 | Miscellaneous manufactures | 17,398 | 19,263 | 23,281 | 25,129 | 11,126 | ||
| Parcels post | 241,067 | 279,607 | 423,974 | 364,191 | † | |||
| Burmah. | ||||||||
| Wax— | ||||||||
| X | 343 | Paraffin | 2,481 | 5,133 | 3,353 | 3,551 | 9,468 | |
| XXIII | 849 | Candles | 5,578 | 13,025 | 6,688 | 11,465 | 16,297 | |
| Ceylon. | ||||||||
| II | 47 | Coconut, desiccated | 4,859 | 5,716 | 6,306 | 4,575 | 9,347 | |
| III | 139 | Cocoa-beans, uncrushed | 1,741 | 3,700 | 4,887 | 6,276 | 6,571 | |
| 149 | Tea, in bulk | 237,146 | 260,978 | 271,010 | 258,738 | 372,795 | ||
| Hong Kong. | ||||||||
| II | 103 | Jams, Jellies, and preserves | 4,477 | 4,133 | 4,152 | 3,763 | 7,516 | |
| India. | ||||||||
| III | 149 | Tea, in bulk | 24,921 | 29,256 | 23,286 | 19,294 | 24,679 | |
| IXB | 272 | Bagging and sacking — | ||||||
| Hessian and jute | 1,618 | 2,786 | 29,847 | 32,285 | 43,307 | |||
| 279 | Hessians and scrim | 24,800 | 23,213 | 11,352 | 12,964 | 11,080 | ||
| Bags and sacks— | ||||||||
| IXC | 294 | Corn-sacks | 191,007 | 111,354 | 174,434 | 194,046 | 183,170 | |
| 295 | Jute and hessian n.o.e. | 16,137 | 17,013 | 15,714 | 25,987 | 30,595 | ||
| 290 | Woolpacks | 56,140 | 70,349 | 61,955 | 74,213 | 75,691 | ||
| Oils, vegetable— | ||||||||
| X | 329 | Castor | 15,591 | 25,050 | 18,911 | 17,808 | 21,183 | |
| 332 | Linseed | 3,959 | 1,740 | 4,453 | 4,157 | 7,088 | ||
| XII | 358 | Coal—Cargo* | .. | .. | .. | .. | 39,184 | |
| XXIIB | 800 | Manures—-Bonedust* | .. | .. | .. | .. | 16,140 | |
| Straits Settlements. | ||||||||
| II | 59 | Fruits—Bottled and preserved | 10,308 | 16,307 | 8,609 | 11,311 | 7,323 | |
| 119 | Sago and tapioca | 14,027 | 19,526 | 20,972 | 17,164 | 17,422 | ||
| 124 | Spices, unground | 5,150 | 9,681 | 11,423 | 9,412 | 14,266 | ||
| XXIIB | 802 | Manures—Guano and rock phosphates* | .. | .. | .. | .. | 13,257 | |
| Seychelles. | ||||||||
| XXIIB | 802 | Manures — Guano and rock phosphates* | .. | .. | .. | .. | 13,298 | |
| South African Union. | ||||||||
| IV | 167 | Wine—Still | 6,430 | 6,472 | 5,513 | 5,437 | 5,324 | |
| XII | 358 | Coal—Cargo* | .. | .. | .. | .. | 22,918 | |
| Canada. | ||||||||
| I | 11 | Fish, preserved | 24,323 | 34,399 | 47,608 | 34,173 | 36,546 | |
| II | 67 | Fruits, fresh—Apples | .. | 344 | 7,269 | 15,022 | 6,875 | |
| VIII | 223 | Seeds, grass and clover | 8,544 | 8,755 | 9,589 | 8,021 | 9,694 | |
| IXA | 234 | Apparel and ready-made clothing n.o.e. | 7,528 | 9,056 | 13,871 | 11,289 | 6,754 | |
| 245 | Corsets* | .. | .. | .. | .. | 7,123 | ||
| XIVB | 436 | Iron pipes, wrought, under 6 in. diam.* | .. | .. | .. | .. | 19,828 | |
| Iron wire, fencing— | ||||||||
| 485 | Barbed | 30,997 | 4,869 | 111 | 982 | 5,257 | ||
| 486 | Plain | 523 | 9,464 | 517 | 3,035 | 13,264 | ||
| Machinery, agricultural— | ||||||||
| XV | 499 | Drills and sowers* | .. | .. | .. | .. | 15,097 | |
| 511 | Parts of* | .. | .. | .. | .. | 7,504 | ||
| XIXA | 692 | Paperhangings | 408 | 3,911 | 5,456 | 5,307 | 5,443 | |
| 693 | Paper, printing | 69,033 | 72,111 | 91,951 | 103,606 | 122,889 | ||
| Motor vehicles— | ||||||||
| XXIII | 893 | Bodies for | 3,667 | 2,141 | 21,989 | 27,999 | 27,886 | |
| 894 | Chassis for | 16,489 | 18,597 | 57,152 | 81,548 | 78,346 | ||
| 900 | Carriages—Springs, &c. | 23,952 | 241 | 165 | 72 | 7,413 | ||
| Australia. | ||||||||
| Fruits, dried— | ||||||||
| II | 61 | Currants | 1,137 | 1,851 | 3,359 | 584 | 13,826 | |
| 65 | Raisins | 3,512 | 3,712 | 8,557 | 6,526 | 17,929 | ||
| Fruits, fresh— | ||||||||
| 67 | Apples* | .. | .. | .. | .. | 7,821 | ||
| 71 | Lemons | 9,363 | 8,893 | 7,918 | 7,328 | 6,458 | ||
| 72 | Oranges* | .. | .. | .. | .. | 10,546 | ||
| 75 | Other* | .. | .. | .. | .. | 14,909 | ||
| Grain and pulse— | ||||||||
| 83 | Unprepared—Wheat | 633 | 1,843 | 277 | 24 | 24,841 | ||
| Prepared - | ||||||||
| 87 | Flour | 26,884 | 20,348 | 18,179 | 26,479 | 97,498 | ||
| 96 | Rice, dressed | 25,676 | 32,273 | 31,505 | 29,763 | 44,695 | ||
| 97 | Rice, undressed | 1,935 | ||||||
| 98 | Rice-meal refuse | 1,619 | 4,890 | 6,845 | 4,806 | 7,645 | ||
| 102 | Infants' and invalids' foods n.o.e. | 4,965 | 12,162 | 10,856 | 11,141 | 8,834 | ||
| 122 | Salt, other* | .. | .. | .. | .. | 8,487 | ||
| 130 | Sugar, refined | 10,072 | 9,421 | 10,020 | 11,122 | 16,697 | ||
| 134 | Onions | 12,090 | 12,916 | 7,973 | 12,325 | 12,043 | ||
| III | 149 | Tea, in bulk | 29,838 | 38,008 | 23,622 | 17,139 | 29,225 | |
| Spirits— | ||||||||
| IV | 158 | Whisky | 3,803 | 3,575 | 4,160 | 3,845 | 7,310 | |
| 164 | Spirits of wine | 7,232 | 7,738 | 8,463 | 8,012 | 10,438 | ||
| 167 | Wine, still | 27,687 | 18,509 | 29,882 | 25,416 | 32,856 | ||
| Tobacco, manufactured— | ||||||||
| V | 171 | Cut | 127,007 | 121,633 | 132,742 | 119,022 | 96,333 | |
| 172 | Other | 63,572 | ||||||
| VI | 176 | Horses, ordinary* | .. | .. | .. | .. | 6,997 | |
| VII | 204 | Wool, greasy | 7,709 | 6,199 | 8,118 | 4,477 | 20,650 | |
| VIII | 221 | Plants, trees, and shrubs | 8,886 | 10,476 | 13,004 | 9,552 | 10,472 | |
| 229 | Tanning material, crude—Bark | 28,121 | 33,164 | 41,914 | 28,797 | 27,195 | ||
| IXA | 234 | Apparel and ready-made clothing n.o.e. | 17,743 | 15,812 | 16,699 | 13,207 | 15,889 | |
| 240 | Grindery | 8,255 | 8,417 | 8,959 | 7,938 | 13,881 | ||
| IXB | 278 | Cotton piece-goods n.o.e. | 23,980 | 18,143 | 22,234 | 15,904 | 19,037 | |
| 286 | Woollen piece-goods n.o.e. | 6,689 | 3,472 | 8,684 | 8,465 | 11,215 | ||
| X | 325 | Oils, mineral, lubricating | 2,829 | 2,586 | 4,259 | 6,175 | 11,169 | |
| XII | 358 | Coal—Cargo | 230,627 | 186,254 | 365,414 | 466,286 | 459,243 | |
| Specie— | ||||||||
| XIII | 374 | Gold | 295,000 | 760,000 | 290,000 | 540,000 | 653,000 | |
| 375 | Silver | 3,500 | 39 | 1,230 | .. | 27,100 | ||
| XIVA | 381 | Copper—Angle, strip, tee, &c. | 6,794 | 7,574 | 13,639 | 13,068 | 13,256 | |
| 388 | Iron and steel—Bar, bolt, and rod | 4,003 | 7,231 | 6,994 | 6,194 | 5,421 | ||
| 393 | Lead—Pig and bar | 15,627 | 18,580 | 29,052 | 20,236 | 21,458 | ||
| 402 | Tin—Ingot, pig, bar, &c. | 26,997 | 26,936 | 34,580 | 27,807 | 27,896 | ||
| XIVB | 422 | Hard ware, hollow-ware, and ironmongery | 9,156 | 8,585 | 7,915 | 9,231 | 10,975 | |
| 436 | Iron and steel pipes, &c., wrought, under 6 in.* | .. | .. | .. | .. | 5,412 | ||
| Metal manufactures, other— | ||||||||
| 494 | Free | 6,097 | 6,735 | 7,038 | 7,570 | 7,806 | ||
| 495 | 20 per cent. | 11,877 | 13,162 | 16,948 | 14,079 | 14,517 | ||
| Machines— | ||||||||
| XV | 522 | Dairying, other* | .. | .. | .. | .. | 12,838 | |
| Electrical— | ||||||||
| 526 | Insulated cable and wire* | .. | .. | .. | .. | 9,180 | ||
| 529 | N.o.e.* | .. | .. | .. | .. | 10,471 | ||
| 561 | Tools, engineers, &c., machine and hand | 3,694 | 7,354 | 8,749 | 6,451 | 7,608 | ||
| 562 | Typewriters | 3,315 | 3,113 | 4,819 | 7,527 | 6,842 | ||
| 570 | N.o.e. (20 per cent.) | 11,578 | 8,759 | 9,202 | 6,162 | 14,065 | ||
| 572 | Materials for and parts of (free) | 3,182 | 4,017 | 5,430 | 4,440 | 5,536 | ||
| India rubber— | ||||||||
| XVIA | 573 | Hose, tubing, &c. | 4,753 | 6,633 | 9,591 | 9,733 | 19,997 | |
| 575 | Other (free) | 8,114 | 5,214 | 9,878 | 7,667 | 7,045 | ||
| Leather— | ||||||||
| XVIB | 580 | Belt, harness, &c.* | .. | .. | .. | .. | 5,195 | |
| 585 | Goat and kid skins* | .. | .. | .. | .. | 15,188 | ||
| Timber— | ||||||||
| Logs, hewn— | ||||||||
| XVIIA | 613 | Ironbark* | .. | .. | .. | .. | 57,532 | |
| 614 | Jarrah* | .. | .. | .. | .. | 34,588 | ||
| 617 | Other* | .. | .. | .. | .. | 16,525 | ||
| 618 | Logs, round—Ironbark* | .. | .. | .. | .. | 20,337 | ||
| 625 | Palings, split | 4,514 | 3,845 | 6,425 | 3,854 | 5,113 | ||
| Timber, sawn, n.o.e., rough— | ||||||||
| 633 | Ironbark* | .. | .. | .. | .. | 19,445 | ||
| 634 | Jarrah* | .. | .. | .. | .. | 108,170 | ||
| 639 | Other* | .. | .. | .. | .. | 46,163 | ||
| XVIIB | 646 | Carriage materials—shafts, spokes, and felloes, rough | 9,334 | 5,375 | 10,187 | 3,544 | 9,182 | |
| XVIII | 671 | Glass bottles, plain, empty | 9,778 | 8,678 | 7,899 | 5,671 | 5,626 | |
| XIXA | 698 | Books, papers, &c., printed, n.o.e. | 52,611 | 64,166 | 69,937 | 65,817 | 60,076 | |
| XIXB | 703 | Handbills, circulars, &c. | 4,901 | 5,099 | 4,814 | 5,125 | 7,482 | |
| 706 | Stationery, manufactured | 10,593 | 10,089 | 11,292 | 8,591 | 9,601 | ||
| XX | 712 | Fancy goods and toys | 31,775 | 28,886 | 26,110 | 19,214 | 7,945 | |
| 714 | Precious stones, cut, unmounted | 2 | .. | .. | .. | 42,578 | ||
| 725 | Cinematograph, &c., films* | .. | .. | .. | .. | 22,321 | ||
| XXI | 730 | Sensitized surfaces | 3,701 | 3,524 | 5,364 | 5,025 | 7,518 | |
| 733 | Instruments, surgical and dental | 3,173 | 11,228 | 5,318 | 4,085 | 6,853 | ||
| XXIIA | 740 | Acid, sulphuric | 588 | 563 | 518 | 2,964 | 8,776 | |
| 762 | Anhydrous ammonia | 2,958 | 4,563 | 4,517 | 2,931 | 10,302 | ||
| 763 | Liquefied and compressed gases n.o.e.* | .. | .. | .. | .. | 8,102 | ||
| 765 | Medicinal preparations, &c., n.o.e. | 49,908 | 48,076 | 55,626 | 56,849 | 78,995 | ||
| 772 | Perfumery—Toilet preparations | 4,709 | 4,677 | 5,029 | 6,126 | 8,078 | ||
| XXIIB | 792 | Ammonia, sulphate of* | .. | .. | .. | .. | 7,315 | |
| 795 | Gypsum* | .. | .. | .. | .. | 10,203 | ||
| 799 | Blood and bone* | .. | .. | .. | .. | 7,512 | ||
| 800 | Bonedust* | .. | .. | .. | .. | 38,307 | ||
| 802 | Guano and rock phosphates* | .. | .. | .. | .. | 5,877 | ||
| 803 | Superphosphates* | .. | .. | .. | .. | 25,428 | ||
| XXIII | 860 | Pianolas, gramophones, &c. | .. | .. | .. | .. | 5,927 | |
| 861 | Records for pianolas, gramophones, &c.* | .. | .. | .. | .. | 8,486 | ||
| 877 | Soap n.o.e. | 28,397 | 28,457 | 31,733 | 32,535 | 37,565 | ||
| 883 | Bicycles, rubber tires for Motor vehicles— | 49,571 | 54,923 | 33,317 | 24,461 | 14,059 | ||
| 887 | Rubber tires for | 457 | 1,718 | 29,899 | 51,241 | 27,069 | ||
| 894 | Chassis for | 6,235 | 7,626 | 6,015 | 2,632 | 7,368 | ||
| 895 | Bodies for | 803 | 956 | 987 | 728 | 61,119 | ||
| 902 | Miscellaneous manufactures | 6,782 | 8,208 | 8,620 | 6,072 | 6,356 | ||
| Parcels post | 32,347 | 41,613 | 52,990 | 52,304 | † | |||
| Fiji. | ||||||||
| II | 68 | Fruits, fresh—Bananas* | .. | .. | .. | .. | 81,038 | |
| 129 | Sugar, raw | 546,522 | 655,885 | 696,235 | 778,066 | 650,630 | ||
| Malden Island. | ||||||||
| XXIIB | 802 | Manures — Guano and rock phosphates* | .. | .. | .. | .. | 15,174 | |
| Belgium. | ||||||||
| II | 48 | Chocolate confectionery, in fancy packages | 4,892 | 1,990 | 968 | 3,725 | 6,998 | |
| XV | 526 | Machinery, electric—Insulated cable and wire* Glass— | .. | .. | .. | .. | 5,971 | |
| XVIII | 673 | Crown, sheet, and common window | 15,546 | 16,015 | 19,462 | 29,610 | 16,688 | |
| 678 | Plate, other | 7,458 | 11,017 | 10,564 | 20,490 | 8,168 | ||
| France. | ||||||||
| IV | 154 | Spirits—Brandy | 8,361 | 10,365 | 11,801 | 12,933 | 23,752 | |
| 166 | Wine, sparkling | 8,833 | 10,553 | 12,943 | 10,238 | 13,290 | ||
| IXB | 283 | Silk piece-goods n.o.e. | 2,063 | 3,667 | 3,313 | 8,216 | 10,100 | |
| X | 339 | Stearine | 3,919 | 5,581 | 5,996 | 6,352 | 6,864 | |
| XVIII | 683 | Tiles—Glass or earthen, roofing* | .. | .. | .. | .. | 17,420 | |
| XXIIA | 751 | Cream of tartar | 32,733 | 40,142 | 32,809 | 17,358 | 18,987 | |
| XXIII | 894 | Motor vehicles, chassis for | 9,542 | 9,208 | 16,807 | 13,295 | 10,403 | |
| Germany. | ||||||||
| VIII | 223 | Seeds—Grass and clover | 18,208 | 28,939 | 47,737 | 31,163 | 20,265 | |
| IXA | 234 | Apparel and ready-made clothing n.o.e. | 5,602 | 3,746 | 7,322 | 5,650 | 8,515 | |
| IXB | 267 | Drapery n.o.e. | 3,634 | 5,302 | 12,723 | 7,287 | 5,956 | |
| XIVB | 422 | Hardware, hollow-ware, and ironmongery | 15,539 | 18,249 | 24,316 | 28,923 | 15,043 | |
| 486 | Iron wire, fencing, plain | 8,213 | 2,858 | 10,508 | 5,822 | 8,332 | ||
| XV | 526 | Machinery, electric—Insulated cable and wire* | .. | .. | .. | .. | 15,040 | |
| XVIII | 667 | China, porcelain, and parianware | 8,742 | 8,735 | 10,376 | 12,055 | 6,958 | |
| Glass and glassware— | ||||||||
| 671 | Bottles, plain, empty | 9,858 | 12,330 | 21,565 | 30,079 | 17,887 | ||
| 674 | Glassware n.o.e. | 11,607 | 13,100 | 18,504 | 19,108 | 10,699 | ||
| XIXA | 687 | Butter - paper, waxed paper, &c. | 3,385 | 4,145 | 4,816 | 3,347 | 5,341 | |
| XX | 712 | Fancy goods and toys | 32,194 | 6,127 | 51,541 | 52,404 | 27,471 | |
| XXIIA | 751 | Cream of tartar | 487 | 215 | 12,959 | 20,136 | 21,351 | |
| 753 | Dyes | 1,834 | 3,943 | 4,347 | 5,645 | 5,322 | ||
| XXIIB | 798 | Basic slag and Thomas' phosphate | 18,329 | 26,001 | 31,889 | 45,869 | 46,532 | |
| 803 | Superphosphates | 62,267 | ||||||
| 805 | Kainit | 7,996 | ||||||
| 807 | Sulphate of potash | 16,936 | ||||||
| 808 | Manures, other | 6,336 | ||||||
| XXIII | 839 | Asbestos—Sheets, plates, and tiles* | .. | .. | .. | .. | 6,304 | |
| 859 | Pianos | 41,957 | 55,485 | 63,570 | 51,871 | 31,661 | ||
| Motor-cars— | ||||||||
| 894 | Chassis for | 200 | 260 | 2,815 | 3,098 | 5,413 | ||
| 895 | Rubber tires for | 4,852 | 17,795 | 28,760 | 67,362 | 59,222 | ||
| Parcels post | 8,417 | 9,217 | 12,133 | 11,566 | † | |||
| Greece. | ||||||||
| II | 61 | Fruits, dried—Currants | 21,818 | 29,222 | 31,421 | 8,335 | 21,669 | |
| Italy. | ||||||||
| II | 108 | Nuts—Almonds, shelled or unshelled | 9,944 | 11,555 | 13,247 | 11,058 | 13,359 | |
| IXA | 251 | Hats and caps | 3,310 | 5,239 | 7,180 | 12,230 | 7,105 | |
| Netherlands. | ||||||||
| II | 46 | Cocoa-butter | 412 | 1,375 | 4,539 | 5,247 | 8,192 | |
| III | 140 | Cocoa and chocolate | 28,523 | 30,308 | 34,008 | 28,292 | 25,269 | |
| IV | 156 | Spirits—Geneva and gin, unsweetened | 11,390 | 10,989 | 14,239 | 17,330 | 17,339 | |
| XXIIB | 803 | Manures — Superphosphates* | .. | .. | .. | .. | 37,925 | |
| Norway. | ||||||||
| I | 11 | Fish, preserved | 846 | 18,095 | 18,316 | 17,978 | 24,771 | |
| XXIIA | 748 | Calcium carbide | 7,052 | 9,948 | 13,793 | 24,362 | 29,198 | |
| Spain. | ||||||||
| VIII | 209 | Cork, cut | 8,068 | 8,911 | 10,170 | 10,315 | 6,594 | |
| Sweden. | ||||||||
| XIVB | 473 | Telephones and accessories* | .. | .. | .. | .. | 16,904 | |
| XV | 517 | Machinery, dairying — Cream-separators* | .. | .. | .. | .. | 20,304 | |
| XXIIA | 748 | Carbide of calcium | 4,073 | 9,948 | 5,906 | 5,680 | 7,357 | |
| Switzerland. | ||||||||
| II | 48 | Chocolate confectionery in fancy packages | 4,668 | 24,010 | 56,296 | 38,010 | 50,440 | |
| Asiatic Turkey. | ||||||||
| Fruits, dried— | ||||||||
| II | 62 | Dates* | .. | .. | .. | .. | 6,660 | |
| 65 | Raisins* | 20,127 | 22,820 | 26,221 | 9,816 | 17,414 | ||
| China. | ||||||||
| IXB | 283 | Silk piece-goods n.o.e. | 3,232 | 7,398 | 11,301 | 12,233 | 12,421 | |
| Japan. | ||||||||
| IXA | 234 | Apparel and ready-made clothing n.o.e. | 4,941 | 9,731 | 9,835 | 12,003 | 13,410 | |
| 249 | Haberdashery—Buttons, tapes, &c. | 924 | 1,343 | 2,386 | 1,845 | 6,620 | ||
| IXB | 267 | Drapery n.o.e. | 8,207 | 12,104 | 10,816 | 9,143 | 11,294 | |
| 278 | Cotton piece-goods n.o.e. | 2,185 | 3,132 | 10,431 | 14,683 | 12,828 | ||
| 283 | Silk piece-goods n.o.e. | 20,604 | 28,910 | 48,684 | 35,417 | 52,352 | ||
| XII | 358 | Coal, cargo* | .. | .. | .. | .. | 7,875 | |
| XX | 712 | Fancy goods and toys | 3,987 | 6,756 | 8,934 | 8,373 | 11,956 | |
| XXIIB | 803 | Manures — Superphosphates* | .. | .. | .. | .. | 24,526 | |
| Java. | ||||||||
| II | 130 | Sugar, refined | 20 | 1,084 | 32 | 910 | 10,581 | |
| VIII | 214 | Kapok | 17,648 | 36,086 | 38,377 | 47,993 | 42,785 | |
| Philippine Islands. | ||||||||
| VIII | 213 | Hemp | 10,559 | 11,038 | 16,384 | 9,549 | 13,842 | |
| Sumatra. | ||||||||
| X | 319 | Oils, mineral—Benzine* | .. | .. | .. | .. | 135,120 | |
| Madagascar. | ||||||||
| XXIIB | 802 | Manures — Guano and rock phosphates* | .. | .. | .. | .. | 9,255 | |
| Portuguese East Africa. | ||||||||
| XII | 358 | Coal, cargo* | .. | .. | .. | .. | 29,240 | |
| Cuba. | ||||||||
| V | 100 | Cigars | .. | .. | .. | .. | 7,780 | |
| United States of America. | ||||||||
| I | 36 | Sausage casings and skins | 15,707 | 16,391 | 25,219 | 23,016 | 20,766 | |
| II | 52 | Confectionery n.o.e. | 3,137 | 4,558 | 5,108 | 5,845 | 5,780 | |
| 59 | Fruits, bottled and preserved | 17,967 | 21,236 | 26,706 | 25,492 | 19,375 | ||
| Fruits, dried— | ||||||||
| 60 | Apples and apricots | 10,405 | 4,015 | 12,940 | 10,309 | 8,983 | ||
| 64 | Prunes* | .. | .. | .. | .. | 11,648 | ||
| 65 | Raisins | 27,786 | 37,897 | 67,669 | 24,582 | 25,290 | ||
| Fruits, fresh— | ||||||||
| 67 | Apples* | .. | .. | .. | .. | 14,626 | ||
| 72 | Oranges* | .. | .. | .. | .. | 9,307 | ||
| 88 | Grain and pulse—Maizena and cornflour | 5,276 | 5,860 | 6,317 | 5,950 | 8,234 | ||
| 122 | Salt, other | 85 | .. | 64 | 3,707 | 8,977 | ||
| 125 | Sugar—Glucose | 7,313 | 5,538 | 8,121 | 8,767 | 9,752 | ||
| V | 168 | Cigarettes | 23,837 | 3,744 | 8,819 | 6,307 | 6,805 | |
| Tobacco, manufactured— | ||||||||
| 171 | Cut | 60,334 | 43,726 | 76,335 | 74,799 | 46,199 | ||
| 172 | Other | 40,361 | ||||||
| VII | 222 | Rosin | 2,877 | 8,076 | 8,808 | 10,793 | 5,354 | |
| 223 | Seeds—Grass and clover | 6,361 | 858 | 8,079 | 16,295 | 24,197 | ||
| TXA | 234 | Apparel and ready-made clothing n.o.e. | 17,700 | 30,439 | 27,041 | 42,172 | 28,239 | |
| 240 | Grindery | 14,478 | 6,782 | 9,410 | 10,198 | 8,676 | ||
| 241 | Gum boots | 4,320 | 5,634 | 14,324 | 10,174 | 8,595 | ||
| 244 | Boots, other | 8,355 | 5,842 | 5,602 | 6,555 | 8,023 | ||
| 245 | Corsets* | .. | .. | .. | .. | 17,201 | ||
| IXB | 278 | Cotton piece-goods, unenumerated | 12,063 | 19,586 | 22,414 | 19,001 | 31,716 | |
| Oils— | ||||||||
| Mineral— | ||||||||
| X | 319 | Benzine* | .. | .. | .. | .. | 156,878 | |
| 324 | Kerosene | 180,661 | 188,342 | 163,380 | 105,851 | 159,339 | ||
| 325 | Lubricating | 13,556 | 15,937 | 23,613 | 30,584 | 41,014 | ||
| 326 | Motor-spirit n.o.e.* | .. | .. | .. | .. | 114,909 | ||
| Vegetable— | ||||||||
| 334 | Turpentine | 13,666 | 25,677 | 18,756 | 14,726 | 6,438 | ||
| 336 | Other | 9,084 | 4,770 | 2,740 | 1,590 | 5,664 | ||
| 343 | Waxes—Paraffin | 21,414 | 17,488 | 16,842 | 15,546 | 12,840 | ||
| XI | 348 | Paints, ground in oil or turpentine | 1,983 | 3,080 | 2,050 | 2,461 | 5,718 | |
| 350 | Paints and colours, mixed ready for use | 7,554 | 8,672 | 10,848 | 9,787 | 12,213 | ||
| XIVB | 418 | Fencing-staples | 9,564 | 10,975 | 7,067 | 6,808 | 10,420 | |
| 422 | Hardware, hollow-ware, and ironmongery | 54,976 | 62,767 | 60,659 | 63,919 | 61,655 | ||
| 436 | Iron and steel—Pipes, &c., wrought, under 6 in.* | .. | .. | .. | .. | 6,434 | ||
| 441 | Lamps, other | 9,192 | 15,437 | 15,182 | 14,257 | 8,937 | ||
| 455 | Nails, other | 20,728 | 26,344 | 28,679 | 26,579 | 22,731 | ||
| Tools and implements— | ||||||||
| 477 | Axes and hatchets | 3,662 | 10,363 | 9,702 | 5,467 | 10,816 | ||
| 482 | Other | 41,091 | 54,088 | 60,169 | 62,258 | 56,100 | ||
| Wire— | ||||||||
| 485 | Fencing, barbed | 24,695 | 22,704 | 30,150 | 15,141 | 27,543 | ||
| 486 | Fencing, plain | 39,609 | 40,691 | 57,448 | 37,100 | 46,816 | ||
| 490 | Wove wire, expanded metal lathing, &c.* | .. | .. | .. | .. | 5,120 | ||
| 495 | Metal manufactures, other (20 per cent.) | 21,264 | 29,942 | 36,302 | 43,672 | 41,606 | ||
| Machinery— | ||||||||
| Agricultural implements— | ||||||||
| XV | 499 | Drills, &c.* | .. | .. | .. | .. | 8,920 | |
| 505 | Ploughs* | .. | .. | .. | .. | 5,927 | ||
| 507 | Reapers, &c.* | .. | .. | .. | .. | 8,522 | ||
| 511 | Other* | .. | .. | .. | .. | 19,020 | ||
| 514 | Cash-registers | 4,368 | 11,213 | 9,522 | 12,001 | 11,565 | ||
| Electric— | ||||||||
| 525 | Generators, motors, &c.* | .. | .. | .. | .. | 17,020 | ||
| 527 | Lamps* | .. | .. | .. | .. | 5,894 | ||
| 529 | N.o.e.* | .. | .. | .. | .. | 22,003 | ||
| 532 | Engines, gas, &c., other | 15,931 | 20,105 | 21,959 | 24,074 | 16,719 | ||
| 558 | Printing—Typesetting and casting* | .. | .. | .. | .. | 11,414 | ||
| 560 | Sewing-machines | 14,375 | 21,214 | 33,025 | 24,831 | 24,135 | ||
| 561 | Tools—Engineers, &c., machine and hand | 9,678 | 14,372 | 17,353 | 17,134 | 15,135 | ||
| 562 | Typewriters | 10,109 | 11,367 | 10,188 | 10,495 | 10,821 | ||
| 570 | N.o.e. (20 per cent.) | 18,185 | 22,008 | 30,667 | 22,476 | 16,569 | ||
| 572 | Materials for, &c. (free) | 627 | 45 | 985 | 7,609 | 7,678 | ||
| XVIB | 585 | Leather—Goat and kid skins* | .. | .. | .. | .. | 6,474 | |
| Timber, sawn n.o.e., rough— | ||||||||
| XVIIA | 637 | Oregon pine | 16,453 | 72,753 | 31,515 | 83,270 | 45,199 | |
| 638 | Other | 26,784 | ||||||
| XVIIB | 653 | Furniture n.o.e | 5,822 | 6,308 | 7,297 | 8,660 | 6,362 | |
| 655 | Handles for tools, other* | .. | .. | .. | .. | 9,970 | ||
| 657 | Mouldings and panels for picture-frames, &c. | 5,329 | 5,173 | 6,750 | 7,230 | 6,527 | ||
| 661 | Woodenware n.o.e. | 18,825 | 18,509 | 15,626 | 17,484 | 10,136 | ||
| XVIII | 674 | Glassware n.o.e. | 7,028 | 9,043 | 6,627 | 8,811 | 5,930 | |
| 675 | Glass jars, plain* | .. | .. | .. | .. | 6,780 | ||
| XIXA | 689 | Card board boxes, materials for, other | 2,205 | 1,386 | 4,816 | 5,633 | 5,534 | |
| XIXB | 698 | Books, papers, &c., printed n.o.e. | 8,691 | 7,223 | 7,649 | 9,969 | 11,416 | |
| 711 | Stationery n.o.e. | 3,908 | 3,374 | 5,230 | 4,706 | 5,618 | ||
| XX | 712 | Fancy goods and toys | 13,381 | 12,301 | 14,687 | 11,652 | 6,291 | |
| 717 | Timepieces—Clocks | 8,944 | 10,622 | 10,917 | 16,153 | 9,641 | ||
| XXI | 733 | Instruments, surgical and dental | 7,361 | 9,720 | 10,495 | 7,477 | 22,089 | |
| XXIIA | 765 | Medicinal preparations, &c., n.o.e. | 15,845 | 18,154 | 21,037 | 20,551 | 22,057 | |
| 772 | Perfumery — Toilet preparations | 4,800 | 5,435 | 6,358 | 11,566 | 8,861 | ||
| XXIII | 814 | Cartridges, 25 calibre and under* | .. | .. | .. | .. | 6,889 | |
| 824 | Firearms, other | 5,826 | 5,867 | 7,124 | 6,400 | 7,016 | ||
| 876 | Soap-powder, &c. | 1,917 | 1,716 | 2,883 | 3,812 | 6,455 | ||
| 877 | Soap n.o.e. Motor vehicles —- | 9,588 | 10,278 | 10,148 | 13,020 | 14,711 | ||
| 893 | Bodies for | 3,910 | 29,409 | 51,903 | 57,051 | 68,204 | ||
| 894 | Chasses for | 19,851 | 90,202 | 139,987 | 146,237 | 192,015 | ||
| 895 | Rubber tires, &c. | 1,128 | 17,650 | 19,925 | 24,635 | 24,697 | ||
| 900 | Vehicles — Springs and other materials | 10,579 | 1,270 | 4,841 | 2,671 | 7,484 | ||
| 902 | Miscellaneous manufactures | 10,856 | 8,842 | 11,762 | 14,659 | 10,461 | ||
| Parcels post | 12,029 | 17,552 | 21,123 | 22,666 | † | |||
| Society Islands. | ||||||||
| II | 72 | Fresh fruit—Oranges* | .. | .. | .. | .. | 8,407 | |
| XXIIA | 790 | Vanilla beans | 2,091 | 2,806 | 5,351 | 3,687 | 6,352 | |
| Tonga or Friendly Islands. | ||||||||
| VIII | 208 | Copra | 28,176 | 18,393 | 11,242 | 3,206 | 10,422 | |
A small group of Pacific islands were annexed to the Dominion in 1902 and have since been administered as the “Cook and other annexed islands.” The following table shows the growth of the import trade from this group—previous figures are included with those for the other Pacific islands.
| Year. | Imports. |
|---|---|
| £ | |
| 1902 | 32,163 |
| 1903 | 38,708 |
| 1904 | 45,517 |
| 1905 | 44,179 |
| 1906 | 63,477 |
| 1907 | 61,922 |
| 1908 | 67,483 |
| 1909 | 73,469 |
| 1910 | 90,039 |
| 1911 | 92,382 |
| 1912 | 105,943 |
| 1913 | 109,095 |
| 1914 | 94,620 |
The principal articles imported for the last five years are as follows:—
| Class. | Item. | Article. | 1910. | 1911. | 1912. | 1913. | 1914. |
|---|---|---|---|---|---|---|---|
| £ | Fruits, fresh— | £ | £ | £ | £ | £ | |
| II | 68 | Bananas | 70,271 | 72,916 | 77,457 | 82,223 | 37,443 |
| 72 | Oranges | 34,005 | |||||
| 74 | Plums, cherries, &c. | 568 | |||||
| 75 | Other | 1,328 | |||||
| Nuts— | |||||||
| 109 | Coconuts | 341 | 409 | 611 | 570 | 1,502 | |
| 111 | Other | 125 | 1 | 307 | 326 | 97 | |
| 135 | Potatoes | .. | .. | .. | 819 | 224 | |
| III | 143 | Coffee, raw | 677 | 150 | 1,819 | 638 | 500 |
| VII | 202 | Pearlshell | .. | .. | .. | .. | 566 |
| VIII | 208 | Copra | 14,389 | 14,155 | 16,667 | 19,673 | 13,149 |
| IXA | 251 | Hats and caps | 2,757 | 2,714 | 836 | 1,277 | 1,979 |
| XIII | 374 | Specie—Gold | 500 | .. | .. | 350 | 500 |
| XXI | 725 | Cinematograph films | .. | .. | .. | .. | 1,524 |
It was natural that the tariff should early promise a means of obtaining a sure revenue for the Colony, and the first Customs Ordinance was proclaimed in 1841, by the Governor, Captain Hobson, with the advice of the Legislative Council. This Ordinance, which repealed the New South Wales Ordinance then in force in these Islands, was the first of two long series of enactments dealing with Customs law and the tariff of Customs duties. The Customs law has been constantly revised and extended, Acts being passed in 1858, 1868, 1882, 1892, 1908, and finally revised, extended, and consolidated by the Customs Act of 1914.
The first tariff, contained in the Ordinance of 1841, covered only a few items, and may be given in full as a type of all the early tariffs. It is noteworthy that, following the old mercantilist policy of colonial administration, preference was given to certain products of the Motherland. The full schedule of duties was as follows:—
| £ | s. | d. | |
|---|---|---|---|
| Spirits or strong waters, not being the produce of the United Kingdom, of any British possession in America, or of New South Wales, or of Van Diemen's Land, per proof gallon | 0 | 5 | 0 |
| Spirits or strong waters, the produce of United Kingdom, of any British possession in America, or of New South Wales, or of Van Diemen's Land | 0 | 4 | 0 |
| Wine, for every hundred pounds' value | 15 | 0 | 0 |
| Tobacco, unmanufactured, per pound | 0 | 0 | 9 |
| Tobacco, manufactured, except cigars and snuff, per pound | 0 | 1 | 0 |
| Cigars and snuff, per pound | 0 | 2 | 0 |
| Tea, sugar, flour, meal, wheat, rice, and other grain and pulse, for every hundred pounds' value | 5 | 0 | 0 |
| On all other goods (except goods the produce and manufacture of the United Kingdom, or of New South Wales, or of Van Diemen's Land), for every hundred pounds' value | 10 | 0 | 0 |
In 1844 alterations were made in the direction of increasing most of the duties, while the preference to the United Kingdom was dropped, A very interesting item was the duty of 30 per cent. imposed “On all guns or weapons of any description, or gunpowder, or any munition of war,” evidently imposed to check the growing import of firearms for the Maoris. The rate of duty on all unspecified goods, except personal baggage, living animals, and specie was 5 per cent.
In 1846 again preference was introduced by the imposition of a duty of 12½ per cent. on all foreign unspecified goods, while similar British goods paid only 10 per cent. At the same time there appears the germ of the later free list, five items—glass bottles, bullion, live animals, books, seeds and bulbs—being proclaimed free of duty.
The tariff of 1851 was the first elaborate scale of duties, and is noticeable for the liberal use of ad valorem duties, mainly at the rate of 10 per cent., though cottons, woollens, &c. were charged by the yard, calico by the bolt, and trowsers by the pair.
The first tariffs seem to have been purely for revenue purposes, and there is little protective design in them. The number of commodities chargeable with duty was few, and as time went on successive Governments continually raised the rates on these revenue-producing articles. There is a constant succession of increases in the duty levied on spirits, from the 4s. per gallon of the first tariff to the 17s. per gallon of 1915, and there are similar increases in tobacco, wines, beer, &c.—indeed, in all the high-duty goods. On the other hand, sugar and tea, which at first paid a duty of 5 per cent., by 1850 were paying much higher rates at ½d. per pound and 3d. per pound respectively. Two years later the duties had been raised to 1d. per pound and 4d. per pound, and in 1864 tea was charged 6d. per pound. These rates remained till in 1878 sugar was reduced again to ½d. per pound, and in 1907 made free, while the tariff of 1895 reduced the duty on tea to 4d., that of 1900 to 2d., and that of 1903 made British tea free.
In 1856 the first Gold Duty Act was passed, empowering the Governor to collect an export duty on gold at the rate of 2s. 6d. per ounce. This rate was amended by various Acts; but in 1890 the Gold Duty Abolition Act was passed, and a system of rating in mining districts substituted for the export duty as far as the South Island was concerned. The Gold Duty Act, 1908, consolidated and repealed all previous enactments. An export duty was also imposed on timber by Acts of 1901 and 1903.
Excise duties were levied in 1881 on the manufacture of tobacco and perfumery in bond, and the amount of revenue derived from this source, though still small, has constantly increased. While sugar was liable to duty, excise was collected from the warehouses where sugar was refined; but since 1907 this revenue has disappeared. A duty was imposed on New Zealand beer in 1880, and this duty, though charged at a low rate, yields a considerable sum each year. There are no distilleries in the Dominion.
The first definite attempt at reciprocity was made in 1870, when the Colonial Reciprocity Act gave power to the Government to make reciprocal agreements with the Australian States, including Tasmania; but this Act failed to receive the Royal assent and consequently lapsed.
In 1895, however, the Customs Duties Reciprocity Act received the Royal assent, and ratified an agreement which had been tentatively proposed with South Australia, besides giving power to the Government to make further agreements with the other Australian States. In 1907 the New Zealand and South African Customs Treaty was negotiated, and there is a steady interchange of products under this agreement.
Imperial preference proper was introduced in New Zealand by the Preferential and Reciprocal Trade Act, 1903, which followed the lead given by Canada.
At first only a few items were covered by the extra duties levied upon goods of foreign origin; but the Tariff Act of 1907 extended this additional preferential duty to a great number of items.
The general tariff of 1864 comprised many items, but the duties were levied for revenue primarily, the rates were low and were mostly specific duties, even drapery being charged so-much the cubic foot. Amendments of the tariff, mostly small and affecting only a few items, followed rapidly in 1866, 1867, 1871, 1873; but in 1878 some sweeping changes were made, particularly the reduction of sugar from 1d. per pound to ½d., and similar reductions on many foodstuffs, while tools were also made free of duty. Another Act in 1879 added a few dutiable articles—in this case, however, chargeable with ad valorem duty; and the Act of 1881 was similar. All these changes, however, were revised and consolidated in the Customs Duties Consolidation Act, 1882, which also extended the range of the tariff a good deal. The tariff of 1888 was distinguished by a more liberal use of ad valorem duties, and by now (1888) the most usual rate was 20 per cent., as against 10 per cent. in the earliest years, while a primage duty was also levied.
With the year 1895 the tariff takes on its distinctive modern form, marked by the preponderance of ad valorem duties and a definitely protective intention. The scope of the tariff was greatly widened, so as to enumerate in detail a number of new items, and there were many reductions, principally of the duties on foodstuffs such as dried fruits and cocoa.
The process of subdivision and protection then begun was continued in 1900, when further steps were taken in the direction of a free breakfast table; and another notable remission was made, of the duty on kerosene.
In 1907 the Customs tariff was completely revised and some important alterations made. Among articles placed upon the free list are: Sugar, molasses and treacle, currants, raisins, figs, dates, prunes, unground spices, mustard, maizena, cornflour, almonds and nuts (excepting walnuts), carbonate and bicarbonate of soda, tartaric acid, infants' foods, forfar, dowlas and flax-sheeting, vegetable oils, fencing staples and standards, sheet lead; gas, electricity, and water meters; rubber and pneumatic tires for carriages. Children's boots Nos. 0–6 and tea in bulk are admitted free if of British manufacture or growth.
Increased rates of ordinary duty were imposed on certain articles, among which are found: Flavouring essences, n.o.e., medicinal preparations, drugs and druggists' sundries, candles, paraffin wax, hosiery, cash-registers, cartridges (shot), 10–24 bore, cartridge-cases, certain sizes of iron and fibre pipes, mouldings and panels.
Tea, the produce of British dominions, if in packages of 5 lb. in weight or over is admitted free, in packages under 5 lb. 2d. per pound. The preferential duty on tea of foreign growth is 2d. per pound if in packages of 5 lb. in weight or over, and ⅖d. per pound if in packages of a lesser weight than 5 lb.
The Customs Duties Amendment Act, 1909, imposed a surtax of 1 per cent. on the amount of duty payable on tobacco, cigars, and cigarettes, and of 2½ per cent. on the amount of duty payable on all other dutiable goods. This surtax remained in operation until the 31st March, 1911.
The Customs revenue for 1914 was increased by the sum of £116,219 in consequence of the preferential tariff, but the exemption in favour of British-grown tea has resulted in a considerable loss of revenue. The duty collected on all tea imported in 1903 was £43,606, while in 1914 only £796 was received. Sugar and molasses, from which the duty has been removed, yielded an average annual revenue of £194,000 during the years 1903–7.
The rates of duty levied by this tariff are divided into two classes, specific and ad valorem. The specific class included, in 1914, 16s. per gallon on spirits; 30s. per gallon on perfumed spirits; 7s. per pound on cigars and snuff; 17s. 6d. per 1,000, of 2½ lb. and under, on cigarettes; also 3s. 6d. per pound on manufactured and 2s. on unmanufactured tobacco. Sparkling wine is charged 9s. a gallon; Australian, 5s.; other kinds, 6s.; ale and beer, 2s. The duty on cocoa, chocolate, and chicory is 3d. per pound; roasted coffee, 3d. Opium is charged 40s. per pound; but this article, in a form suitable for smoking, cannot now be legally imported. Ad valorem duties range from 5 to 40 per cent. on the value of the goods, 20 per cent. being the commonest rate.
There is also an excise duty of 1s. per pound on tobacco; 1s. 6d. per pound on cigars and snuff; 3d. per gallon on beer; 9d. per pound on medicinal preparations (with exceptions) containing more than 50 per cent. of proof spirit, which, if less than 50 per cent., would be free. Toilet preparations subject to 16s. per liquid gallon on importation are charged 12s. the liquid gallon, or when subject to 25 per cent. duty, 6s. per gallon. Other excise duties are 12s. per gallon on culinary and flavouring essences, and 20s. on perfumed spirits. The excise duty on cigarettes made in New Zealand is now (from the 31st December, 1896) 2s. 6d. per pound on machine-made and 1s. per pound on hand-made cigarettes. All packages of manufactured tobacco must be labelled before leaving the manufactory, and it is necessary to obtain warrants to use cutting-machines for cutting duty-paid manufactured tobacco for sale (or to be used in the manufacture of cigarettes by hand), and to manufacture cigarettes by hand, under certain conditions.
In 1915 again changes were made in the rates of duty levied on certain articles, in order to meet the extraordinary expenses of the war. The principal changes were: The duty was raised on spirits from 16s. to 17s. per gallon; the 20 per cent. charged on bicycles was reduced to 10 per cent.; gas and oil engines were made subject to 10 per cent., plus an additional preferential 10 per cent. if foreign, instead of being free and 20 per cent.: electric motors, transformers, and lamps were charged 10 per cent. plus 10 per cent. instead of 10 per cent. plus 5 per cent.; and motor-cars were charged 10 per cent. plus 10 per cent. preferential surtax, whereas before the chassis was free and the body was liable to 20 per cent. duty.
The excise duties on spirituous tinctures, which formerly paid 12s. per gallon, were raised to 13s. per gallon. The beer duty was altered so as to increase according to the specific gravity of the worts used, the rate being 3¾d. per gallon when the specific gravity does not exceed 1047, and increasing by 1/16;d. per gallon for every unit of specific gravity up to 1055, and by 2/16;d. thereafter. The specific gravity of distilled water at 60° Fahrenheit is taken as 1000, and the specific gravity of the worts determined in relation thereto.
At the same time a primage duty of 1 per cent. was levied on all goods imported, with the exception of a few small classes of exempted articles. In addition, power was taken to gazette at any time an extra surtax of 50 per cent. on any goods which may be specified, when they are the produce or manufacture of any country now at war with His Majesty. Power was also taken to impose an excise duty on aerated waters, cordials, and other beverages, subject to a report by an officer of Customs to be appointed as a Commission to inquire into the advisability of controlling and regulating this manufacture.
In the earlier years of New Zealand's history the revenue derived from Customs and excise duties produced a greater proportion of the revenue than it does to-day. There has been a constant tendency for this proportion to decrease, and the table given below will show that, even in the last twenty years, this tendency has been very noticeable.
| AMOUNT OF CUSTOMS AND EXCISE REVENUE, EXPRESSED ASA PERCENTAGE OFTHE TOTAL TAXATION AND TOTAL REVENUE OF NEW ZEALAND. | |||||
|---|---|---|---|---|---|
| Customs and Excise Duties. | |||||
| Year ending 31st March. | Total Revenue. | Total Taxation. | Amount. | Percentage of Total Revenue. | Percentage of Total Taxation. |
| £ | £ | £ | Per Cent. | Per Cent. | |
| 1896 | 4,556,015 | 2,335,761 | 1,711,968 | 37.58 | 73.29 |
| 1897 | 4,798,708 | 2,521,911 | 1,887,759 | 39.34 | 74.85 |
| 1898 | 5,079,230 | 2,678,576 | 2,007,431 | 39.52 | 74.93 |
| 1899 | 5,258,228 | 2,707,099 | 2,041,231 | 38.82 | 75.40 |
| 1900 | 5,699,618 | 2,891,126 | 2,187,859 | 38.39 | 75.67 |
| 1901 | 5,906,916 | 3,042,890 | 2,266,032 | 38.36 | 74.47 |
| 1902 | 6,152,839 | 3,113,079 | 2,291,349 | 37.24 | 73.61 |
| 1903 | 6,447,435 | 3,277,964 | 2,426,043 | 37.63 | 74.01 |
| 1904 | 7,130,117 | 3,649,601 | 2,698,046 | 37.84 | 73.93 |
| 1905 | 7,347,197 | 3,754,379 | 2,728,193 | 37.13 | 72.67 |
| 1906 | 7,650,098 | 3,841,590 | 2,795,546 | 36.54 | 72.77 |
| 1907 | 8,478,957 | 4,264,555 | 3,048,622 | 35.96 | 71.49 |
| 1908 | 9,063,989 | 4,645,754 | 3,217,538 | 35.50 | 69.26 |
| 1909 | 9,001,185 | 4,377,761 | 2,917,462 | 32.41 | 66.64 |
| 1910 | 9,238,917 | 4,180,516 | 2,786,490 | 30.16 | 65.63 |
| 1911 | 10,297,273 | 4,837,322 | 3,145,929 | 30.55 | 65.03 |
| 1912 | 11,061,101 | 5,296,590 | 3,398,143 | 30.72 | 64.16 |
| 1913 | 11,734,276 | 5,606,829 | 3,531,761 | 30.10 | 62.99 |
| 1914 | 12,229,661 | 5,918,034 | 3,553,785 | 29.06 | 60.05 |
| 1915 | 12,451,945 | 5,880,811 | 3,294,943 | 26.46 | 56.03 |
Though the Customs revenue has increased greatly, the table shows that other forms of taxation and other sources of revenue have increased still faster, so that the proportion of taxation and of revenue furnished by the Customs duties constantly decreases. This relative decrease has been due in part to the extension of the governmental services in the Dominion increasing the revenue apart from taxation, to the greater use of direct taxation, and to the remissions and reductions of duty which have been made from time to time. These reductions have been mainly in foodstuffs, so that the tariff has tended towards the ideal of a free breakfast table. The following tables bring out these reductions very clearly.
Of the total Customs duties collected in 1914, only £165,998 was derived from foods and non-alcoholic drinks. The amount is little more than half that derived from this source in 1891, while the percentage to the total has decreased from 20.05 in 1891 to 4.95 in 1914. The tables hereunder show the amounts and percentages collected at intervals of five years, 1891–1911 and in 1912, 1913, and 1914, in respect of (1) foods and non-alcoholic drinks, (2) clothing and textiles, (3) alcoholic drinks and tobacco, and (4) all other articles. Excise duties on alcoholic liquors, tobacco, &c., are not included.
| PRINCIPAL CLASSES OF IMPORTS FROMWHICH CUSTOMS REVENUE DERIVED. | |||||
|---|---|---|---|---|---|
| Year. | Amount of Duty derived from | ||||
| Foods and Nonalcoholic Drinks. | Clothing and Textiles. | Alcoholic Drinks and Tobacco. | All other Articles. | Total | |
| £ | £ | £ | £ | £ | |
| 1891 | 312,809 | 276,072 | 651,680 | 320,141 | 1,560,702 |
| 1896 | 329,622 | 322,947 | 715,019 | 400,264 | 1,767,852 |
| 1901 | 321,625 | 434,112 | 928,176 | 512,853 | 2,196,766 |
| 1906 | 369,964 | 610,873 | 1,130,837 | 787,429 | 2,899,103 |
| 1911 | 147,456 | 682,710 | 1,286,601 | 1,048,890 | 3,165,657 |
| 1912 | 158,077 | 708,853 | 1,395,837 | 1,072,952 | 3,335,719 |
| 1913 | 146,938 | 790,862 | 1,408,977 | 1,078,649 | 3,425,426 |
| 1914 | 165,998 | 822,373 | 1,459,464 | 906,780 | 3,354,615 |
| PERCENTAGE OFEACH CLASS TOTHE TOTAL DUTY COLLECTED. | ||||
|---|---|---|---|---|
| Year. | Percentage of Total Duty collected on | |||
| Foods and Nonalcoholic Drinks. | Clothing and Textiles. | Alcoholic Drinks and Tobacco. | All other Articles | |
| Per Cent. | Per Cent. | Per Cent. | Per Cent. | |
| 1891 | 20.05 | 17.69 | 41.75 | 20.51 |
| 1896 | 18.64 | 18.27 | 40.45 | 22.64 |
| 1901 | 14.64 | 19.76 | 42.25 | 23.35 |
| 1906 | 12.76 | 21.07 | 39.01 | 27.16 |
| 1911 | 4.66 | 21.57 | 40.64 | 33.13 |
| 1912 | 4.74 | 21.25 | 41.84 | 32.17 |
| 1913 | 4.29 | 23.09 | 41.13 | 31.49 |
| 1914 | 4.95 | 24.51 | 43.51 | 27.03 |
The present tariff has stood since 1907, with only minor alterations and interpretations, till in 1915 new duties were imposed to meet the expenses of war. The only noticeable changes besides the decisions on new commodities, and certain exemptions made by the Governor in Council, are the imposition, first, of primage duty of 1 per cent. and later of a surtax of 2½ per cent., on imports, in order to help defray the expense of H.M.S. “New Zealand,” and some new rules of procedure laid down by the Customs Act, 1913, which came into operation on the 1st April, 1914. This latter Act, besides consolidating and revising the Customs regulations and procedure, alters some definitions, particularly that of “fair market value” by allowing cash discounts, and also excluding packing charges if shown separately on the invoices, while section 141 (2) exempts from duty all goods being the property of the Governor.
The Customs and excise duties received during the last five years are shown in detail, by the table given below, which also shows the rate of revenue per head of mean population, inclusive and exclusive of Maoris, for each year considered.
| CUSTOMS AND EXCISE REVENUE, 1910–14. | |||||
|---|---|---|---|---|---|
| — | 1910. | 1911. | 1912. | 1913. | 1914. |
*Minus quantity. † Parcels-post included under respective heads in 1914. | |||||
| Customs Duties. | £ | £ | £ | £ | £ |
| Spirits | 616,835 | 637,326 | 693,366 | 704,548 | 712,446 |
| Wine | 40,888 | 38,606 | 41,251 | 39,198 | 41,796 |
| Ale, beer, &c. | 27,159 | 27,365 | 29,636 | 29,922 | 29,285 |
| Cigars, cigarettes, and snuff | 176,347 | 190,588 | 216,594 | 229,278 | 247,144 |
| Tobacco | 400,418 | 401,936 | 420,080 | 413,135 | 425,455 |
| Coffee, cocoa, &c. | 7,832 | 7,784 | 8,462 | 8,171 | 7,636 |
| Opium | 64 | 32 | 42 | 56 | 18 |
| Other goods by weight | 214,772 | 236,747 | 217,785 | 219,402 | 218,451 |
| ” ad valorem | 1,226,072 | 1,402,811 | 1,503,000 | 1,559,647 | 1,526,774 |
| Other duties | 122,066 | 139,874 | 131,303 | 141,526 | 145,610 |
| Parcels-post | 60,177 | 65,968 | 74,175 | 80,547 | † |
| Primage | .. | .. | .. | .. | .. |
| Surtax | 62,359 | 16,620 | 25 | *4 | 1 |
| Totals, Customs duties | 2,954,989 | 3,165,657 | 3,335,719 | 3,425,426 | 3,354,616 |
| Excise Duties. | |||||
| Tinctures—New Zealand | 4,096 | 5,351 | 5,500 | 6,253 | 7,504 |
| Cigars, cigarettes, and snuff —New-Zealand-manufactured | 170 | 289 | 310 | 269 | 298 |
| Tobacco — New - Zealand - manufactured | 854 | 844 | 746 | 683 | 488 |
| Beer—New Zealand | 117,493 | 119,087 | 122,339 | 125,015 | 129,453 |
| Totals, excise duties | 122,613 | 125,571 | 128,895 | 132,220 | 137,743 |
| Revenue from Customs duties per head of mean population (excluding Maoris) | £ | s. | d. | £ | s. | d. | £ | s. | d. | £ | s. | d. | £ | s. | d. |
| 2 | 19 | 6 | 3 | 2 | 5 | 3 | 4 | 3 | 3 | 4 | 1 | 3 | 1 | 6 | |
| Ditto (including Maoris) | 2 | 16 | 9 | 2 | 19 | 7 | 3 | 1 | 3 | 3 | 1 | 3 | 2 | 18 | 10 |
| Revenue from excise duties per head of mean population (excluding Maoris) | 0 | 2 | 5.6 | 0 | 2 | 5.7 | 0 | 2 | 5.8 | 0 | 2 | 5.7 | 0 | 2 | 6.3 |
| Ditto (including Maoris) | 0 | 2 | 4.3 | 0 | 2 | 4.3 | 0 | 2 | 4.4 | 0 | 2 | 4.4 | 0 | 2 | 5.0 |
A general increase is shown, till the last year. 1914, which shows a slight decline in the amount of Customs revenue collected, a decline which is obviously due to the check that the war gave to imports. The greatest increases are shown by cigars and cigarettes and by the general goods which pay ad valorem duty. Since there has been no alteration of tariff the increases shown can be due only to the increased imports of the different items; and the higher per capita figures show also that the imports, and consequently the revenue per head, are constantly increasing.
In the next table further information is given on this point, for the last twenty years.
| CUSTOMS REVENUE COMPAREDWITH IMPORT VALUES FROM 1895. | |||||||||||||
|---|---|---|---|---|---|---|---|---|---|---|---|---|---|
| Year. | Imports. | Revenue. | Percentage of Revenue on Total Imports. | Index Numbers of Customs Revenue compared with Imports. | |||||||||
| Value. | Value per Head. | Amount. | Actual Value per Head. | Value per Head | |||||||||
| £ | £ | s. | d. | £ | £ | s. | d. | £ | s. | d. | Per Cent. | ||
| 1895 | 6,400,129 | 9 | 4 | 10 | 1,619,970 | 2 | 6 | 9 | 2 | 6 | 9 | 25.31 | 1,000 |
| 1896 | 7,137,320 | 10 | 1 | 11 | 1,765,073 | 2 | 9 | 11 | 2 | 11 | 1 | 24.73 | 977 |
| 1897 | 8,055,223 | 11 | 3 | 3 | 1,912,161 | 2 | 13 | 0 | 2 | 16 | 6 | 23.74 | 938 |
| 1898 | 8,230,600 | 11 | 3 | 7 | 1,961,726 | 2 | 13 | 3 | 2 | 16 | 7 | 23.83 | 942 |
| 1899 | 8,739,633 | 11 | 13 | 1 | 2,042,002 | 2 | 14 | 5 | 2 | 19 | 0 | 23.36 | 923 |
| 1900 | 10,646,096 | 13 | 18 | 10 | 2,170,354 | 2 | 16 | 10 | 3 | 6 | 4 | 20.39 | 805 |
| 1901 | 11,817,915 | 15 | 3 | 10 | 2,191,798 | 2 | 16 | 4 | 3 | 16 | 31 | 18.55 | 733 |
| 1902 | 11,326,723 | 14 | 3 | 11 | 2,285,043 | 2 | 17 | 3 | 3 | 11 | 10 | 20.17 | 797 |
| 1903 | 12,788,675 | 15 | 11 | 10 | 2,501,896 | 3 | 1 | 0 | 3 | 18 | 11 | 19.56 | 773 |
| 1904 | 13,291,694 | 15 | 14 | 7 | 2,650,189 | 3 | 2 | 9 | 3 | 19 | 8 | 19.94 | 788 |
| 1905 | 12,828,857 | 14 | 14 | 11 | 2,652,666 | 3 | 1 | 0 | 3 | 14 | 8 | 20.68 | 817 |
| 1906 | 15,211,403 | 16 | 19 | 8 | 2,899,103 | 3 | 4 | 9 | 4 | 6 | 0 | 19.06 | 753 |
| 1907 | 17,302,861 | 18 | 16 | 6 | 3,079,422 | 3 | 7 | 0 | 4 | 15 | 4 | 17.80 | 703 |
| 1908 | 17,471,284 | 18 | 9 | 9 | 2,903,086 | 3 | 1 | 5 | 4 | 13 | 7 | 16.62 | 656 |
| 1909 | 15,674,719 | 16 | 2 | 7 | 2,653,617 | 2 | 14 | 7 | 4 | 1 | 8 | 16.93 | 669 |
| 1910 | 17,051,583 | 17 | 3 | 6 | 2,954,989 | 2 | 19 | 6 | 4 | 6 | 11 | 17.33 | 685 |
| 1911 | 19,545,879 | 19 | 5 | 2 | 3,165,657 | 3 | 2 | 5 | 4 | 9 | 2 | 16.20 | 640 |
| 1912 | 20,976,574 | 20 | 3 | 9 | 3,335,719 | 3 | 4 | 3 | 5 | 2 | 2 | 15.90 | 628 |
| 1913 | 22,288,302 | 20 | 17 | 1 | 3,425,426 | 3 | 4 | 1 | 5 | 5 | 7 | 15.37 | 607 |
| 1914 | 21,856,096 | 20 | 0 | 11 | 3,354,616 | 3 | 1 | 6 | 5 | 1 | 6 | 15.35 | 606 |
It will be seen at once that the first four columns of the table show practically continuous increases, but that the last two columns show a constant tendency to decrease. The revenue of the country (or, viewed from the opposite direction, the Customs taxation), both the actual amount and the average per head, shows a continual increase; and not only is this increase due to greater imports, but it actually overrides a steady movement towards a diminution of the relative duty payable.
In 1895 the proportion of revenue to the total imports was more than 25 per cent.; in 1914 it was just over 15 per cent.: and this decrease has been unbroken but for four periods—a slight increase is shown in 1898, another in 1902, more serious increases in 1904 and 1905 (following the tariff of 1903), and another rise in 1909 and 1910, due as much perhaps to the financial circumstances of the preceding year as to the tariff change in 1907.
Apart from these temporary changes the ratio of the revenue to the imports steadily decreases, showing that the importation of duty-free goods increases at a faster rate than those goods on which duty is levied. This tendency is very clearly revealed by the column showing the value per head at 1895 ratio, and again by the last column.
| REVENUE BY CLASSES.—TABLE SHOWINGTHE REVENUE COLLECTEDIN 1914, ARRANGED ACCORDINGTO THE STATISTICAL CLASSIFICATION. | |||||
|---|---|---|---|---|---|
| Class. | Items. | Articles. | Revenue collected. | ||
| General. | Additional Preferential. | Total. | |||
| £ | £ | £ | |||
| I | 1–41 | Foodstuffs of animal origin (excluding live animals) | 42,032 | 1,548 | 43,580 |
| II | 42–137 | Foodstuffs of vegetable origin, and common salt | 102,875 | 6,611 | 109,486 |
| III | 138–150 | Beverages (non-alcoholic) and substances used in making up same | 11,565 | 1,367 | 12,932 |
| IV | 151–167 | Spirits and alcoholic liquors | 786,859 | 6 | 786,865 |
| V | 168–173 | Tobacco and preparations thereof | 672,599 | .. | 672,599 |
| VI | 174–186 | Live animals | 153 | .. | 153 |
| VII | 187–207 | Animal substances (mainly unmanufactured) not being foodstuffs | 425 | 29 | 454 |
| VIII | 208–233 | Vegetable substances and non-manufactured fibres | 12,182 | 1,306 | 13,488 |
| IXA | 234–262 | Apparel | 569,656 | 2,146 | 571,802 |
| IXB | 263–291 | Textiles | 239,356 | 1,015 | 240,371 |
| IXC | 292–309 | Manufactured fibres | 9,939 | 261 | 10,200 |
| X | 310–344 | Oils, fats, and waxes | 38,414 | 4,181 | 42,595 |
| XI | 345–355 | Paints and varnishes | 16,312 | 784 | 17,096 |
| XII | 356–372 | Stones and minerals, used industrially | 4,098 | 20 | 4,118 |
| XIII | 373–375 | Specie | .. | .. | .. |
| XIVA | 376–405 | Metal unmanufactured, partially manufactured, and ores | .. | 777 | 777 |
| XIVB | 406–495 | Metal manufactures, other than machinery and machines | 203,889 | 25,059 | 228,948 |
| XV | 496–572 | Machinery and machines | 60,789 | 16,109 | 76,898 |
| XVIA | 573–576 | Indiarubber, and manufactures thereof (not including tires) | 34 | 875 | 909 |
| XVIB | 577–603 | Leather, and manufactures thereof, including substitutes | 17,438 | 1,543 | 18,981 |
| XVIIA | 604–641 | Timber | 26,949 | .. | 26,949 |
| XVIIB | 642–661 | Wood, cane, and wicker manufactures | 21,874 | 4,512 | 26,386 |
| XVIII | 662–683 | Earthenware, china, glass, stoneware, cements and cement materials | 42,399 | 5,729 | 48,128 |
| XIXA | 684–696 | Paper | 6,657 | 1,967 | 8,624 |
| XIXB | 697–711 | Stationery | 44,239 | 3,865 | 48,104 |
| XX | 712–722 | Jewellery, timepieces, and fancy goods | 75,610 | 12,506 | 88,116 |
| XXI | 723–734 | Optical, surgical, and scientific instruments | 2,370 | 1,439 | 3,809 |
| XXIIA | 735–791 | Drugs, chemicals, and druggists' wares | 59,709 | 7,817 | 67,526 |
| XXIIB | 792–810 | Manures | .. | .. | .. |
| XXIII | 811–903 | Miscellaneous | 169,974 | 14,747 | 184,721 |
| Totals | 3,238,396 | 116,219 | 3,354,615 | ||
For the year 1914 it is possible to give the revenue collected on imports arranged in the statistical classes which have now been adopted by the Dominion, and this classification will show from what classes of goods New Zealand derives its Customs revenue.
The biggest figure shown by the table is the £786,865 collected on spirits and alcoholic liquors, while the duty on tobacco (£672,599) is also a considerable item. But the greatest amount of revenue is furnished by the articles of clothing and textiles which make up the three subdivisions of Class IX, and which together provide duty amounting to £822,373. In this group is included all the items of apparel, drapery, hosiery, millinery, &c., which include the bulk of the Dominion's imports. Metal manufactures also contribute revenue amounting to almost a quarter of a million sterling, though the raw metals which form Class XIVA are almost wholly free of duty. The only other classes which provide over £100,000 of revenue are XXIII, in which there are several big items, such as arms, brushware, candles, soap, motor-cars, &c.; and II, which covers the range of vegetable foodstuffs.
Two classes (manures and specie) are entirely duty-free, and a good number contribute very little to the revenue. The additional surtax on foreign goods by which New Zealand extends preference to British imports is levied mainly on the metals comprised in classes XIVA and XV, and to a less degree on the miscellaneous class, and on fancy goods, drugs, vegetable foods, and earthenware. The total surtax, however, compared with the revenue derived from the general tariff, does not amount to a very large sum, and in 1914 was 3½ per cent. of the total duties.
The main item from which excise revenue is derived is beer, which, however, pays only 3d. per gallon, as against the import duty of 2s. per gallon, so that the quantity of beer brewed in New Zealand is very much greater than the quantity imported. There are, besides, small but growing manufactures of tinctures, and of tobacco, which yield a certain amount of excise revenue. The following table will illustrate the position and growth of these excisable manufactures for the last five years.
| EXCISE DUTIES, 1910–14. | ||||||
|---|---|---|---|---|---|---|
| Item. | Duty. | 1910. | 1911. | 1912. | 1913. | 1914. |
| £ | £ | £ | £ | £ | ||
| Beer | 3d. gallon | 117,493 | 119,087 | 122,339 | 125,015 | 129,453 |
| Culinary and flavouring fences, spirituous | 12s. gallon | 1,819 | 2,446 | 2,386 | 2,452 | 3,514 |
| Medicinal preparations over 50 per cent. P.S. | 9d. lb. | 2,125 | 2,266 | 2,397 | 2,669 | 2,946 |
| Medicinal preparations under 50 per cent. P.S. | Free | .. | .. | .. | .. | .. |
| Perfumed spirits | £1 gallon | 70 | 474 | 603 | 945 | 924 |
| Toilet preparations | 6s. gallon | .. | .. | .. | .. | .. |
| ” spirituous | 12s. gallon | 82 | 165 | 114 | 187 | 120 |
| Cigarettes made by hand | 1s. lb. | .. | .. | .. | .. | 23 |
| ” manufactured by machinery | 2s. 6d. lb. | .. | .. | .. | .. | .. |
| Cigars and snuff | 1s. 6d. lb. | 170 | 289 | 310 | 269 | 275 |
| Tobacco, manufactured | 1s. lb. | 854 | 844 | 746 | 683 | 488 |
| .. | 122,613 | 125,571 | 128,895 | 132,220 | 137,743 | |
The next table gives the imports of free and dutiable goods arranged according to the statistical classification. The main features of the table are the overwhelming proportion of dutiable goods in the classes containing alcoholic liquors, tobacco, animal products, apparel, and the high proportion of free goods in non-alcoholic beverages (mainly tea), stones and minerals, (mainly coal), specie, raw metals, paper, and manures.
| FREE AND DUTIABLE GOODS IN CLASSES. | ||||||
|---|---|---|---|---|---|---|
| No. | Class. | Value of Imports. | Duty collected. | Percentage of Total. | ||
| Free. | Dutiable. | Free. | Dutiable. | |||
| £ | £ | £ | £ | £ | ||
| I | Foodstuffs of animal origin (excluding live animals) | 1,200 | 183,665 | 43,580 | 0.65 | 99.35 |
| II | Foodstuffs of vegetable origin, and common salt | 1,294,307 | 533,690 | 109,486 | 70.80 | 29.20 |
| III | Beverages (non-alcoholic) and substances used in making the same | 466,300 | 84,370 | 12,932 | 84.68 | 15.32 |
| IV | Spirits and alcoholic liquors | .. | 555,566 | 786,865 | .. | 100.00 |
| V | Tobacco and preparations thereof | 21 | 614,008 | 672,599 | .. | 100.00 |
| VI | Live animals | 10,662 | 18,569 | 153 | 36.47 | 63.53 |
| VII | Animal substances (mainly unmanufactured) not being foodstuffs | 40,711 | 1,989 | 454 | 95.34 | 4.66 |
| VIII | Vegetable substances and non-manufactured fibres | 333,670 | 45,954 | 13,488 | 87.89 | 12.11 |
| IXA | Apparel | 268,303 | 2,240,908 | 571,802 | 10.69 | 89.31 |
| IXB | Textiles | 1,240,687 | 1,199,557 | 240,371 | 50.84 | 49.16 |
| IXC | Manufactured fibres | 340,179 | 50,954 | 10,200 | 86.97 | 13.03 |
| X | Oils, fats, and waxes | 687,070 | 138,916 | 42,595 | 83.18 | 16.82 |
| XI | Paints and varnishes | 26,971 | 156,027 | 17,096 | 14.74 | 85.26 |
| XII | Stones and minerals, used industrially | 584,631 | 16,395 | 4,118 | 97.27 | 2.73 |
| XIII | Specie | 711,869 | .. | .. | 100.00 | .. |
| XIVA | Metal, unmanufactured ores | 329,321 | 1,477 | 777 | 99.55 | 0.45 |
| XIVB | Metal manufactures, other than machinery | 1,363,897 | 1,187,270 | 228,948 | 53.46 | 46.54 |
| XV | Machinery and machines | 773,216 | 461,843 | 76,898 | 62.61 | 37.39 |
| XVIA | Indiarubber and manufactures thereof | 43,343 | 4,598 | 909 | 90.41 | 9.59 |
| XVIB | Leather, and manufactures thereof | 105,743 | 136,925 | 18,981 | 43.58 | 56.42 |
| XVIIA | Timber | 186,258 | 218,324 | 26,949 | 46.04 | 53.96 |
| XVIIB | Wood, cane, and wicker manufactures | 34,529 | 101,226 | 26,386 | 25.43 | 74.57 |
| XVIII | Earthenware, &c. | 170,435 | 208,686 | 48,128 | 44.96 | 55.04 |
| XIXA | Paper | 387,533 | 29,138 | 8,624 | 93.00 | 7.00 |
| XIXB | Stationery | 282,866 | 185,075 | 48,104 | 60.45 | 39.55 |
| XX | Jewellery, timepieces, and fancy goods | 62,864 | 371,066 | 88,116 | 14.49 | 85.51 |
| XXI | Optical, surgical, and scientific instruments | 152,241 | 20,499 | 3,809 | 88.13 | 11.87 |
| XXIIA | Drugs, chemicals, and druggists' wares | 363,868 | 275,183 | 67,526 | 56.94 | 43.06 |
| XXIIB | Manures | 512,193 | .. | .. | 100.00 | .. |
| XXIII | Miscellaneous | 1,293,073 | 746,257 | 184,721 | 63.41 | 36.59 |
| 12,067,961 | 9,788,135 | 3,354,615 | 55.22 | 44.78 | ||
By classifying the different rates of duty it will be found that even if specie is excluded, on the average a little over half the imports into New Zealand are duty-free, while the value of goods which are liable to specific duties is about one-seventh. The most usual ad valorem rates are 20 per cent. and 25 per cent. The 15 - per - cent. figures are composed mainly of the imports of boots, while the 30 - per - cent. figures consist of the value of goods which are liable to 20 per cent. general duty plus an additional preferential duty of 10 per cent.
| IMPORTS CLASSIFIEDACCORDING TO DUTY.—TABLE SHOWINGFOR THE FIVE YEARS, 1910–14, THE VALUES OF IMPORTS INTO NEW ZEALAND, ACCORDING TOTHE RATE OF DUTY PAIDTHEREON. | |||||
|---|---|---|---|---|---|
| Rate of Duty. | 1910. | 1911. | 1912. | 1913. | 1914. |
* Included under various heads, 1914. | |||||
| £ | £ | £ | £ | £ | |
| Free (excluding specie) | 8,439,495 | 9,416,496 | 10,649,801 | 11,274,502 | 11,356,092 |
| Specific duties | 2,635,711 | 2,862,750 | 2,916,552 | 3,141,808 | 3,208,506 |
| Ad valorem duties— | |||||
| 5 per cent. | 59,665 | 54,042 | 71,888 | 64,450 | 69,380 |
| 10 per cent. | 85,159 | 104,392 | 148,786 | 145,682 | 126,793 |
| 15 per cent. | 236,177 | 282,181 | 327,632 | 366,584 | 360,722 |
| 19⅖ per cent. | 40 | 13 | 151 | 18 | 123 |
| 20 per cent. | 3,027,033 | 3,483,363 | 3,578,882 | 3,518,697 | 3,422,382 |
| 22¼ per cent. | .. | 12 | .. | .. | .. |
| 22½ per cent. | 39,694 | 39,281 | 40,614 | 48,777 | 51,059 |
| 24 per cent. | 14,921 | 32,766 | 65,034 | 46,122 | 71,173 |
| 24¼ per cent. | .. | .. | .. | 1 | 79 |
| 25 per cent. | 1,431,983 | 1,615,380 | 1,765,456 | 2,030,150 | 2,012,502 |
| 30 per cent. | 585,714 | 658,797 | 734,509 | 738,153 | 664,592 |
| 33¾ per cent. | 5,896 | 5,333 | 4,587 | 4,843 | 4,467 |
| 37½ per cent. | 89,641 | 102,836 | 116,082 | 131,661 | 110,903 |
| 40 per cent. | 1,326 | 1,667 | 1,235 | 1,209 | 6,668 |
| 5,577,249 | 6,389,460 | 6,854,856 | 7,096,347 | 6,900,843 | |
| Parcels-post (various) | 307,299 | 374,294 | 435,594 | 473,143 | * |
| Specie | 303,360 | 763,271 | 399,995 | 634,670 | 711,869 |
| Totals | 17,051,583 | 19,545,879 | 20,976,574 | 22,288,302 | 21,856,096 |
The value of boots imported is included under both specific and ad valorem duties: 1910, £211,531; 1911, £250,995; 1912, £280,224; 1913, £332,168; 1914, £321,214.
As already stated, general tariff revisions were made in 1895 and 1907. The table following shows for the years immediately preceding and following these changes and for 1914, the value of free and dutiable imports, the percentage admitted free of duty, and the duty per cent. on dutiable imports and on all merchandise imported.
| — | 1894. | 1896. | 1906. | 1908. | 1914. |
|---|---|---|---|---|---|
* Including excise duties levied on certain imports manufactured in bond. | |||||
| Merchandise— | £ | £ | £ | £ | £ |
| Free | 1,871,772 | 2,263,091 | 5,476,949 | 8,658,111 | 11,356,092 |
| Dutiable | 4,118,405 | 4,772,288 | 8,826,221 | 8,589,051 | 9,788,135 |
| Imports (less specie) | 5,990,177 | 7,035,379 | 14,303,170 | 17,247,162 | 21,144,227 |
| Percentage of free merchandise | Per Cent. | Per Cent. | Per Cent. | Per Cent. | Per Cent. |
| 31.25 | 32.17 | 38.29 | 50.20 | 53.78 | |
| £ | £ | £ | £ | £ | |
| Total net duty received* | 1,572,467 | 1,767,852 | 2,903,131 | 2,907,151 | 3,362,906 |
| Duty, per cent. of imports— | Per Cent. | Per Cent. | Per Cent. | Per Cent. | Per Cent. |
| (a.) On dutiable imports | 38.18 | 37.04 | 32.89 | 33.85 | 34.36 |
| (b.) On all merchandise | 26.25 | 25.18 | 20.30 | 16.86 | 15.90 |
The average rate levied on dutiable goods in 1914 was slightly higher than before the tariff revision of 1907, the increase being due to the surtax on foreign goods, but the average on all merchandise shows a decrease. The proportion of imported merchandise free of duty increased considerably since 1906, showing the effect of remissions under the new tariff.
There has been a reciprocal arrangement with British South Africa since 1907, by which New Zealand admits certain goods, mainly wine and tobacco, at reduced rates of duty, in return for similar concessions granted by the South African Union. The following table shows the growth of trade since 1907.
| Year. | imports. | Exports. |
|---|---|---|
| £ | £ | |
| 1907 | 1,067 | 63,717 |
| 1908 | 5,494 | 86,465 |
| 1909 | 6,221 | 121,931 |
| 1910 | 7,443 | 45,555 |
| 1911 | 9,936 | 43,755 |
| 1912 | 13,733 | 83,229 |
| 1913 | 7,796 | 61,651 |
| 1914 | 33,229 | 60,826 |
But the figures for imports represent only the value of goods shipped from South Africa, and in 1914 the value of imports produced there was £98,437. Very little of this trade, however, comes within the scope of the reciprocal treaty, as the following table will show.
| IMPORTS INTO NEW ZEALAND UNDERTHE BRITISH SOUTH AFRICAN RECIPROCAL TARIFF. | |||||||
|---|---|---|---|---|---|---|---|
| Class. | Item. | Article. | 1910. | 1911. | 1912. | 1913. | 1914. |
| £ | £ | £ | £ | £ | |||
| I | 11 | Fish, in airtight vessels | 9 | 131 | 211 | 40 | 232 |
| II | 80 | Maize | .. | .. | .. | .. | 723 |
| IV | 166 | Wine, sparkling | .. | .. | .. | .. | .. |
| 167 | ” still | 6,639 | 6,512 | 5,804 | 5,437 | 5,445 | |
| V | 171 | Tobacco, cut | 323 | 223 | 277 | 297 | 2,341 |
| 172 | ” other | 102 | |||||
| Ornamental feathers— | |||||||
| IX | 266 | Ostrich n.o.e. | 9 | 37 | 101 | 126 | 462 |
Though the preferential tariff of New Zealand covers a good number of items, the amount of revenue obtained from it is not of great importance. The following table shows the extent of the imports which are affected by preference, by giving the percentage of the total imports and of foreign imports so affected. It will be seen that the proportions increased after the tariff changes of 1903 and 1907 but show a tendency to decrease in normal years.
| IMPORTS AFFECTEDBY PREFERENTIAL SURTAX. | ||||||
|---|---|---|---|---|---|---|
| Year. | Value of Imports. | Imports on which Surtax was paid. | Percentage of | |||
| Total. | British Empire. | Foreign Countries. | Total Imports. | Foreign Imports. | ||
| £ | £ | £ | £ | Per Cent. | Per Cent. | |
| 19,003 | 12,788,675 | 10,648,142 | 2,140,533 | 1,752 | 0.01 | 00.08 |
| 1904 | 13,291,694 | 11,029,694 | 2,262,000 | 487,867 | 3.67 | 21.57 |
| 1905 | 12,828,857 | 10,709,642 | 2,119,215 | 599,764 | 4.68 | 28.30 |
| 1906 | 15,211,403 | 12,890,016 | 2,321,387 | 620,600 | 4.08 | 26.73 |
| 1907 | 17,302,861 | 14,942,183 | 2,360,678 | 658,027 | 3.98 | 27.87 |
| 1908 | 17,471,284 | 14,780,276 | 2,691,008 | 895,007 | 5.12 | 33.26 |
| 1909 | 15,674,719 | 13,554,962 | 2,119,757 | 842,407 | 5.37 | 39.74 |
| 1910 | 17,051,583 | 14,465,824 | 2,585,759 | 1,000,267 | 5.87 | 38.68 |
| 1911 | 19,545,879 | 16,497,340 | 3,048,539 | 1,159,342 | 5.93 | 38.03 |
| 1912 | 20,976,574 | 17,073,272 | 3,903,302 | 1,337,182 | 6.37 | 34.26 |
| 1913 | 22,288,302 | 18,348,249 | 3,940,053 | 1,325,057 | 5.95 | 33.63 |
| 1914 | 21,856,096 | 17,649,784 | 4,206,312 | 1,228,207 | 5.62 | 29.20 |
The system of recording imports was changed in 1914, and for that year statistics are given of the countries of origin as well as the countries of shipment, so that in future years it will be possible to get better comparisons of the value of goods produced each year in the various countries with which New Zealand trades. Previously the imports credited to any country were those shipped to New Zealand from that country, and it is evident that more foreign goods came into New Zealand than were shipped direct. The following tables, which are reproduced from previous issues of the Year-book, must be read subject to this qualification. The main feature of both tables, it will be observed, is that free goods increase at a very much faster rate than those on which duty is payable. The two countries shown below are not only the most important, but are typical of the other countries with which the Dominion trades.
| IMPORTS FROMTHE UNITED STATES OF AMERICA. | ||||||
|---|---|---|---|---|---|---|
| Year. | On the East Coast. | On the West Coast. | Total Imports. | |||
| Admitted Free of Duty. | On which Duty Payable. | Admitted Free of Duty. | On which Duty Payable. | Admitted Free of Duty. | On which Duty Payable. | |
| £ | £ | £ | £ | £ | £ | |
| 1903 | 522,581 | 716,954 | 57,430 | 144,393 | 580,011 | 861,347 |
| 1905 | 541,685 | 668,933 | 54,415 | 173,468 | 596,100 | 842,401 |
| 1907 | 562,805 | 708,747 | 25,324 | 128,720 | 588,129 | 837,467 |
| 1908 | 816,176 | 685,005 | 52,564 | 90,192 | 868,740 | 775,197 |
| 1909 | 563,972 | 460,926 | 39,912 | 101,253 | 603,884 | 562,179 |
| 1910 | 696,087 | 538,873 | 69,055 | 95,722 | 765,142 | 634,595 |
| 1911 | 799,762 | 589,046 | 106,517 | 186,804 | 906,279 | 775,850 |
| 1912 | 1,008,287 | 700,361 | 149,868 | 191,102 | 1,158,155 | 891,463 |
| 1913 | 993,313 | 722,029 | 125,398 | 267,250 | 1,118,711 | 989,279 |
| IMPORTS FROM GERMANY. | ||||
|---|---|---|---|---|
| Year. | Admitted Free of Duty. | On which Duty Payable. | Proportions per Cent. | |
| Admitted Free of Duty. | On which Duty Payable. | |||
| £ | £ | Per Cent. | Per Cent. | |
| 1903 | 70,191 | 204,106 | 25.59 | 74.41 |
| 1905 | 64,920 | 212,547 | 23.40 | 76.60 |
| 1907 | 102,677 | 248,957 | 29.20 | 70.80 |
| 1908 | 144,824 | 244,707 | 37.18 | 62.82 |
| 1909 | 129,574 | 198,273 | 39.52 | 60.48 |
| 1910 | 146,830 | 244,965 | 37.48 | 62.52 |
| 1911 | 208,163 | 272,454 | 43.31 | 56.69 |
| 1912 | 263,122 | 370,108 | 43.34 | 56.66 |
| 1913 | 338,574 | 349,361 | 49.22 | 50.78 |
The corresponding figures for 1914 are not strictly comparable, since they have necessarily been compiled from the statistics of country of origin; but the proportions have not changed greatly.
| — | Value of Imports. | Percentage. | ||
|---|---|---|---|---|
| Free. | Dutiable. | Free. | Dutiable. | |
| £ | £ | Per Cent. | Per Cent. | |
| United States of America | 1,422,022 | 1,115,523 | 56.04 | 43.96 |
| Germany | 488,130 | 527,886 | 48.04 | 51.96 |
A list is attached of the principal items of import which are subject to the additional preferential tariff. Only the bigger items are included, and these are arranged in the statistical order followed elsewhere in this volume.
| PRINCIPAL ITEMS SUBJECTTO PREFERENTIAL SURTAX. | ||||||
|---|---|---|---|---|---|---|
| Class. | No. | Item. | Imports from | Surtax. | ||
| British Empire. | Foreign Countries. | Rate. | Amount. | |||
* Except sardines. | ||||||
| £ | £ | £ | ||||
| I | 5 | Eggs, in shell | 2 | 922 | 10% | 92 |
| 6 | ” desiccated white and yolk | .. | 1,623 | 10% | 155 | |
| 7 | ” liquid white and yolk | .. | 1,784 | 10% | 178 | |
| 11 | Fish, preserved in tins or other airtight vessels | 56,710 | 31,180 | 1d. lb.* | 325 | |
| 13 | Gelatine | 2,384 | 6,506 | 3/10;d. lb. | 218 | |
| 15 | Isinglass | 878 | 698 | 3/10d. lb. | 10 | |
| 41 | Provisions, n.o.e. | 22,279 | 4,579 | 10% | 448 | |
| II | 48 | Chocolate confectionery in fancy packages | 36,206 | 71,173 | 4% | 2,810 |
| 52 | Confectionery, n.o.e. | 37,481 | 10,215 | ⅖d. lb. | 304 | |
| 58 | Foods for animals, n.o.e. | 2,630 | 5,427 | 10% | 552 | |
| 59 | Fruits, bottled and preserved in juice or syrup | 10,030 | 19,665 | 12½% | 2,599 | |
| 133 | Vegetables, dried and preserved | 272 | 1,504 | 10% | 134 | |
| III | 140 | Cocoa and chocolate | 25,282 | 32,235 | ⅗d. lb. | 691 |
| VIII | 209 | Cork, cut | 7,275 | 12,768 | 10% | 1,261 |
| IXA | 239 | Goloshes and overshoes, slippers, &c. | 22,491 | 3,907 | 11¼% | 465 |
| 244 | Boots, other | 309,008 | 12,206 | Various | 1,598 | |
| IXC | 301 | Cordage, n.o.e. | 13,613 | 1,367 | 10% | 140 |
| X | 311 | Axle-greases and other solid lubricants | 1,937 | 4,720 | 10% | 476 |
| 325 | Oil, mineral, lubricating | 15,295 | 48,108 | 1 1/8d, gall. | 3,186 | |
| 337 | ” unenumerated | 2,548 | 3,944 | 1 1/8d. gall. | 194 | |
| 339 | Stearine | 3,167 | 8,743 | 3/20d. lb. | 246 | |
| XI | 348 | Paints, ground in oil | 79,343 | 5,983 | 6d. cwt. | 70 |
| 350 | ” mixed ready for use | 29,046 | 12,808 | 1/cwt. | 221 | |
| 351 | ” n.o.e. | 11,997 | 2,730 | 10% | 286 | |
| 354 | Varnishes, lacquers, and goldsize | 13,088 | 4,405 | 4⅘d. gall. | 196 | |
| XIVA | 388 | Iron and steel: bar, bolt, and rod | 173,387 | 3,923 | 20% | 777 |
| XIVB | 407 | Blacksmiths' anvils, &c. | 1,745 | 1,651 | 10% | 166 |
| 412 | Capsules, metallic | 1,798 | 1,529 | 10% | 154 | |
| 417 | Cutlery | 35,290 | 5,220 | 10% | 517 | |
| 422 | Hardware, holloware, and ironmongery | 268,563 | 95,326 | 10% | 9,554 | |
| Iron and steel— | ||||||
| 427 | Hoop, galvanized | 1,648 | 990 | 33/5d. cwt. | 25 | |
| 430 | Corrugated, galvanized | 249,101 | 3,653 | 4⅘d. cwt. | 94 | |
| 432 | Plain, galvanized | 53,418 | 2,982 | 33/5d. cwt. | 57 | |
| 436 | Pipes and tubes, wrought, 6 in. and under in diameter | 166,917 | 5,785 | 20% | 1,150 | |
| 441 | Lamps, other | 21,721 | 20,885 | 10% | 2,058 | |
| 455 | Nails, other | 25,424 | 23,294 | 1/cwt. | 2,224 | |
| 456 | Plate and plated ware | 87,030 | 4,967 | 10% | 537 | |
| 458 | Printing type and materials, n.o.e. Railway and tramway plant— | 9,850 | 2,458 | 10% | 256 | |
| 461 | Rails, &c. | 106,311 | 4,473 | 20% | 789 | |
| 462 | Wagons, &c. | 8,944 | 1,206 | 10% | 123 | |
| 473 | Telephones and accessories | 10,964 | 23,270 | 10% | 163 | |
| 476 | Tinware, other | 18,525 | 3,127 | 12½% | 423 | |
| 490 | Wire—Wove wire, expanded metal, lathing, &c. | 4,125 | 5,197 | 10% | 521 | |
| 495 | Metal manufactures, n.o.e. (20 per cent.) | 123,722 | 55,025 | 10% | 5,074 | |
| Machinery— | ||||||
| XV | 522 | Dairying, other | 14,370 | 6,026 | 10% | 191 |
| 524 | Electric, batteries and cells | 1,261 | 1,927 | 10% | 200 | |
| 525 | ” generators, motors, transformers, &c. | 49,800 | 28,728 | 5% | 1,421 | |
| 527 | ” lamps | 20,825 | 16,284 | 5% | 811 | |
| 529 | ” n.o.e. | 49,985 | 24,361 | 10% | 2,437 | |
| 531 | Engines, gas, oil, &c., for motorcars | 62,697 | 4,754 | 20% | 851 | |
| 532 | ” gas and oil, other | 68,479 | 19,276 | 20% | 3,863 | |
| 546 | Locomotives | .. | 2,907 | 10% | 291 | |
| 547 | Mangles, &c. | 1,837 | 3,836 | 10% | 373 | |
| 553 | Mining, n.o.e. | 16,794 | 4,299 | 10% | 425 | |
| 557 | Printing machines and presses | 18,119 | 1,882 | 10% | 187 | |
| 569 | Unenumerated (5 per cent.) | 6,233 | 3,612 | 10% | 370 | |
| 570 | ” (20 per cent.) | 75,281 | 26,836 | 10% | 2,555 | |
| 572 | Materials for, &c. (free) | 27,753 | 14,884 | Part 10% | 47 | |
| Part 20% | 1,692 | |||||
| XVIA | 573 | Indiarubber hose, &c. | 31,482 | 4,406 | 20% | 874 |
| XVIB | 579 | Belting, other than leather | 28,348 | 3,365 | 10% | 337 |
| 596 | Leather bags, under 10 in. | 990 | 2,639 | 10% | 267 | |
| 597 | Portmanteaux, &c. | 9,759 | 3,359 | 12½% | 419 | |
| 602 | Saddlery, n.o.e. | 19,321 | 2,185 | 10% | 217 | |
| 603 | Leather manufactures, n.o.e. | 5,102 | 2,851 | 10% | 277 | |
| XVIIB | 643 | Basketware and wickerware | 1,062 | 3,985 | 10% | 405 |
| 649 | Doors and sashes | 736 | 2,344 | 10% | 223 | |
| 652 | Furniture—Picture frames, &c. | 2,877 | 1,192 | 10% | 118 | |
| 653 | ” Unenumerated | 16,000 | 13,450 | 12½% | 1,717 | |
| 661 | Woodenware and turnery, n.o.e. | 15,163 | 19,391 | 10% | 1,951 | |
| XVIII | 667 | China, porcelain, and parianware | 27,317 | 11,007 | 10% | 1,148 |
| 669 | Earthenware, &c., n.o.e. | 74,191 | 8,456 | 10% | 857 | |
| 670 | Fireclay manufactures, n.o.e. | 3,557 | 2,489 | 10% | 245 | |
| 674 | Glassware, n.o.e. | 8,025 | 25,946 | 10% | 2,547 | |
| 676 | Mirrors and looking-glasses | 4,959 | 2,115 | 12½% | 266 | |
| 677 | Glass—Plate, bevelled and silvered | 3,270 | 2,939 | 12½% | 364 | |
| 682 | Tiles, n.o.e.—Flooring, wall, hearth, &c. | 11,492 | 1,650 | 10% | 175 | |
| XIXA | 685 | Pager bags, n.o.e. | 6,797 | 3,137 | 12½% | 429 |
| 693 | Paper—Printing | 224,008 | 4,195 | 20% | 571 | |
| 691 | ” Wrapping, unprinted | 9,381 | 6,744 | 2/6 cwt. | 911 | |
| XIXB | 697 | Artists' materials | 5,217 | 1,332 | 10% | 135 |
| 699 | Calendars and show-cards | 12,980 | 3,082 | 12½% | 402 | |
| 703 | Handbills, circulars, &c. | 19,695 | 5,599 | 3/5d. lb. | 257 | |
| 704 | Ink, printing | 6,138 | 4,170 | 10% | 408 | |
| 706 | Stationery, manufactured, n.o.e. | 55,086 | 9,350 | 12½% | 1,190 | |
| 711 | ” unenumerated | 53,569 | 15,713 | 10% | 1,439 | |
| XX | 712 | Fancy goods and toys | 85,426 | 89,114 | 10% | 8,503 |
| 715 | Jewellery, other | 50,791 | 4,732 | 10% | 475 | |
| 716 | Sporting, gaming, and athletic requisites, n.o.e. | 32,880 | 1,765 | 10% | 180 | |
| 717 | Clocks | 1,951 | 17,315 | 10% | 1,732 | |
| 721 | Tobacco-pipes, cigarette-cases, &c. | 16,487 | 16,225 | 10% | 1,614 | |
| XXI | 724 | Cinematographs, &c. | 981 | 2,261 | 10% | 201 |
| 727 | Field and opera glasses | 414 | 1,847 | 10% | 185 | |
| 729 | Photographic cameras and lenses | 7,433 | 5,487 | 10% | 537 | |
| 730 | Sensitized surfaces, &c. | 26,719 | 2,089 | 10% | 200 | |
| 731 | Photographic materials, n.o.e. | 4,295 | 2,712 | 10% | 256 | |
| XXIIA | 750 | Chemicals, n.o.e. | 5,754 | 1,747 | 10% | 188 |
| 765 | Medicinal preparations, n.o.e. | 152,367 | 53,636 | 10% | 5,233 | |
| 772 | Perfumery — Toilet preparations, n.o.e. | 21,075 | 18,266 | 12½% | 2,270 | |
| XXIII | 814 | Cartridges, 25 calibre and under | 361 | 7,304 | 10% | 730 |
| 816 | Cartridges, n.o.e. | 1,048 | 1,369 | 10% | 131 | |
| 824 | Firearms, other | 8,010 | 10,560 | 10% | 1,087 | |
| 826 | Fireworks, other | 1,348 | 2,075 | 10% | 226 | |
| 847 | Brushes, brushware, and brooms | 32,067 | 14,379 | 12½% | 1,726 | |
| 850 | Combs, hair and toilet Instruments, musical— | 1,247 | 1,035 | 10% | 103 | |
| 857 | Materials, other | 762 | 954 | 10% | 85 | |
| 858 | Organs and harmoniums | 1,686 | 2,361 | 10% | 235 | |
| 859 | Pianos | 57,902 | 36,870 | 10% | 3,694 | |
| 860 | Pianolas, gramophones, &c. | 10,032 | 7,747 | 10% | 736 | |
| 861 | Records for pianolas, &c. | 11,009 | 5,787 | 10% | 454 | |
| 862 | Other | 7,364 | 5,604 | 10% | 565 | |
| Matches and vestas— | ||||||
| 863 | Wax | 22,257 | 1,685 | Various | 162 | |
| 864 | Wooden | 0,973 | 1,392 | Various | 383 | |
| Polishes, &c.— | ||||||
| 872 | Metal polishes | 5,484 | 2,137 | 10% | 216 | |
| 873 | Furniture, &c., polishes | 5,271 | 3,012 | 10% | 242 | |
| 877 | Soap, unenumerated | 59,987 | 17,201 | 12½% | 2,104 | |
| 886 | Motor bicycles and tricycles | 40,837 | 6,067 | 10% | 581 | |
| 898 | Perambulators and go-carts | 2,499 | 6,014 | 10% | 612 | |
Under section 47 of the Customs Act, 1913, the Governor was empowered to issue Orders in Council prohibiting the exportation of any goods which in his opinion may, if exported, be used for any purpose of war.
Accordingly, on the 4th August, 1914, an Order in Council was issued prohibiting the export of coal from New Zealand, and this was followed the next day by a Governor's Proclamation prohibiting the export of specie. On the 7th August a Royal Proclamation set forth the law and policy with regard to trading with the enemy, and this Proclamation was restated and extended on the 15th August, and again amended on the 15th September and 12th October. This Proclamation was extended to Austria-Hungary on the 15th September and to Turkey on the 9th November. Section 24 of the Regulation of Trade and Commerce Act, passed on the 10th August, 1914, extended the powers given to the Governor under the Act of 1913, so that if it was necessary in the public interest to prohibit the exportation of any goods, such exportation might be prohibited by Order in Council.
Following the prohibitions of coal and specie came a series of Proclamations comprehending a large number of articles, as will be seen from the following list:—
7th August, 1915: Acetone; aeroplanes, airships, balloons of all kinds, and their component parts; animals (pack, saddle, and draught) suitable for use in war; arms (rifled) of all kinds, and their component parts; benzol; carbons required for searchlights; cartridges, charges, of all kinds, and their component parts; chrome and ferro-chrome; cloth, hempen; copper, ores or unwrought, all kinds; cotton suitable for use in the manufacture of explosives; cotton-waste; creosote; dimothylaniline; engines and lorries, internal combustion, capable of carrying a load of 25 cwt. and upwards, whole or in parts; fuel oil-shale; fulminate of mercury; gunpowder; nets (torpedo); nickel and ferro-nickel; oil (coal-tar); oil (olive); oil (blast-furnace); oil (mineral lubricating); petroleum (fuel oil); petroleum (gas-oil); petroleum, spirit or motor-spirit (including shell-spirit); projectiles of all kinds and their component parts; sacks (coal); silk-cloth, silk braid, silk thread, suitable for cartridges; silk noils; surgical dressings and bandages; toluol; zinc.
On the 8th August a further Proclamation prohibited the export to all foreign ports in Europe and on the Mediterranean and Baltic Sea, with the exception of those of France, Russia (except the Baltic ports), Spain, and Portugal of the following goods:—
Aluminium; aluminium alloys; armour-plates; armour quality castings, and similar protective material; asbestos; cables (telegraph and telephone); camp equipment, articles thereof; cannon and other ordnance, and parts thereof; carbolic acid; carriages and mountings for cannon and other ordnance and for machine guns, and parts thereof; coal, steam, large; compasses and parts thereof (including fittings such as binnacles); cresol and nitro-cresol; engine and boiler packings; explosives of all kinds; fuel, unmanufactured; implements and apparatus designed exclusively for the manufacture of munitions of war, for the manufacture or repair of arms or of war material for use on land and sea; indiarubber sheet, vulcanized; manganese; mercury; mica; mineral jellies; mines and parts thereof; molybdenum; nitrate of ammonium; nitrate of potassium; nitrate of sodium; nitrate of toluol; nitric acid; picric acid and its components; range-finders and parts thereof; rope, steel, wire, and hawsers; saltpetre; sounding-machines and gear; steam vessels, fighters, and barges, of all descriptions; sulphuric acid; swords, bayonets, and other arms (not being firearms and parts thereof); pin, pin plates; torpedo-tubes, torpedoes, and parts thereof; tung sten; vanadium; four-wheeled wagons capable of carrying 1 ton and over; two-wheeled carts capable of carrying 15 cwt. and over; harness and saddlery of all kinds; barbed wire; horse and pony shoes; material for telegraph, wireless telegraph, and telephones; field-glasses; telescopes; railway materials (both fixed and rolling stock); men's marching and shooting boots; heliograph; portable forges; farriers', carpenters', wheelers', and saddlers' tools (transport service); glycerine; alcohol, as covering rectified spirits; uniform clothing and military equipment, accoutrements; walnut wood of scantling, which could be made into rifle butts and fore-ends.
On the 10th August the export of flour and oatmeal, and of wheat, oats, and other cereals, was prohibited; but on the 13th oats, barley, linseed, beans, and peas were permitted to be exported to any part of the British Dominions. On the 3rd November it was prohibited to export wool except to the British Empire or the Allied countries except by permission of the Minister of Customs, and the same Proclamation also prohibited the export to European ports, except those of the Allies, of the following goods:—
All foodstuffs for man and feeding-stuffs for animals, and all raw material for the same; aluminium; arms of all kinds, including arms for sporting purposes, and their distinctive component parts; articles of camp equipment, and their distinctive component parts; armour-plates; aeroplanes, airships, balloons, and aircraft of all kinds and their component parts, together with accessories and articles recognizable as intended for use in connection with balloons and aircraft; barbed wire, and implements for fixing and cutting the same; chrome-ore; clothing and equipment of a distinctively military character; clothing, fabrics for clothing, and boots and shoes suitable for use in war; copper, unwrought; ferro-chrome; ferro-silica; field-glasses, telescopes, chronometers, and all kinds of nautical instruments; fuel, other mineral oils; lubricants; glycerine; gold and silver in coin and bullion; paper money; gun-mountings, limber-boxes, limbers, military wagons, field forges, and their distinctive component parts; harness and saddlery; hæmatite iron-ore and hæmatite pig iron; hides of all kinds, dry or wet; pigskins, raw or dressed; leather, undressed or dressed, suitable for saddlery; harness or military boots; horse-shoes and shoeing-materials; implements and apparatus designed exclusively for the manufacture of munitions of war, for the manufacture or repair of arms or Avar-material for use on land and sea; iron-pyrites; lead (pig, sheet, or pipe); mineral oils and motor-spirit; motor vehicles of all kinds and their component parts; motor-tires; nickel-ore and nickel; powder and explosives; projectiles, charges, and cartridges of all kinds and their distinctive component parts; railway materials, both fixed and rolling stock, and materials for telegraphs, wireless telegraphs, and telephones; range-finders, and their distinctive component parts; saddle, draught, and pack animals suitable for use in war; sulphur; sulphuric acid; vehicles of all kinds (other than motor vehicles) available for use in war, and their component parts; vessels, craft, and boats of all kinds; floating-docks, parts of docks, and their component parts; warships, including boats, and their distinctive component parts of such a nature that they can only be used on a vessel of war; wooled sheep-skins.
On the 14th December, 1914, hides and sheep-skins were subjected to the same regulations as wool; and on the 17th December, 1914, the export of forage—that is, grass, clover, or oaten hay, oaten chaff, and bran —except by permission of the Minister of Defence, were prohibited from export.
Table of Contents
THE number and tonnage of the registered vessels belonging to the several ports of registry in the Dominion on the 31st December, 1914 (distinguishing sailing-vessels and steamers), were as under:—
| REGISTERED VESSELS, 31ST DECEMBER, 1914. | ||||||
|---|---|---|---|---|---|---|
| Ports. | Sailing-vessels. | Steam-vessels. | ||||
| Vessels. | Gross Tonnage. | Net Tonnage. | Vessels. | Gross Tonnage. | Net Tonnage. | |
| Auckland | 138 | 9,044 | 7,863 | 198 | 22,848 | 12,295 |
| Napier | 4 | 266 | 253 | 28 | 3,485 | 2,026 |
| Wellington | 12 | 1,014 | 888 | 43 | 12,060 | 6,171 |
| Nelson | 8 | 209 | 172 | 13 | 2,710 | 1,277 |
| Lyttelton | 14 | 3,944 | 3,834 | 16 | 4,820 | 2,162 |
| Timaru | 1 | 733 | 690 | 1 | 942 | 488 |
| Dunedin | 18 | 7,132 | 6,940 | 78 | 87,715 | 52,870 |
| Invercargill | 2 | 372 | 344 | 12 | 1,258 | 612 |
| Totals | 197 | 22,714 | 20,984 | 384 | 135,838 | 77,901 |
Auckland is the port of registry of the majority of the vessels forming New Zealand's “mosquito” fleet, the average net tonnage of the 331 vessels on the Auckland register being only 16 tons. At Dunedin most of the vessels of the Union Steamship Company of New Zealand are registered. Shortly after the outbreak of war, however, many of the principal vessels of this company were transferred to the London register, the large decrease in 1914 as compared with 1913 being due to this cause. On the 31st December, 1913, there were 616 vessels on the New Zealand register, of an aggregate tonnage of 254,117 gross and 159,310 net. Twenty-four vessels of a gross tonnage of 1,873 (net, 1,566) were added during the year 1914, and vessels were deducted as under:—
| Number. | Gross Tonnage. | Net Tonnage. | |
|---|---|---|---|
| Vessels wrecked or otherwise lost | 4 | 1,427 | 987 |
| Vessels broken up, decayed, &c. | 17 | 3,887 | 3,650 |
| Vessels converted into hulks, &c. | 9 | 5,767 | 5,390 |
| Vessels transferred to ports in the United Kingdom | 19 | 84,504 | 50,376 |
| Vessels transferred to ports in British possessions | 5 | 1,591 | 1,331 |
| Vessels registered de novo | 3 | 234 | 175 |
| Other vessels | 2 | 28 | 25 |
| Tonnage deducted in consequence of remeasurement or alteration | .. | .. | 57 |
| Total deductions in 1914 | 59 | 97,438 | 61,991 |
During the year 1914 a total of 646 vessels direct from oversea ports were entered inwards in the Dominion, this number being 1 more than the total for 1913, but 31 less than that for 1912. The effects of the strike in 1913 and the war in 1914 are apparent. Vessels entered outwards numbered 666 in 1912, 635 in 1913, and 657 in 1914. It will be noticed that the total arrivals in the two years 1913 and 1914 were 1,291 and the departures 1,292, the figures of departures for 1914 being swelled by the inclusion of a number of vessels detained at ports of the Dominion at the end of 1913 on account of the strike and the consequent delay in loading.
The actual effects of the two disturbances on oversea shipping cannot be accurately gauged, however. Of late years the number of vessels engaged in the oversea trade has not increased to any great extent; in fact, 1908 shows a greater number of vessels entered inwards and outwards than is the case in any subsequent year. The tendency is rather for vessels of a larger size to be employed in the New Zealand trade, in order to cope with the growing imports and exports of the Dominion, and for the purposes of the passenger traffic. The number of vessels entered inwards and outwards in 1904 was 1,249, of an aggregate tonnage of 2,299,333 tons, and an average of 1,841 tons. The 1,303 vessels in 1914 aggregated 3,506,830 tons, the average being 2,691 tons. Dealing with steamships only (794 in 1904 and 1,149 in 1914), the average tonnage is found to be 2,599 and 2,970 tons respectively. The number of sailing-vessels arriving and departing decreased from 455 in 1904 to 154 in 1914, the aggregate tonnage falling in the same time from 236,030 to 94,389 tons.
The number and tonnage of vessels entered and cleared in each of the last ten years, separating steam from sailing, are as shown in the following table:—
| OVERSEA SHIPPING, 1905 TO 1914. | ||||||||
|---|---|---|---|---|---|---|---|---|
| Year. | Entered. | Cleared. | ||||||
| Vessels. | Tonnage. | Vessels. | Tonnage. | |||||
| Steam. | Sailing | Steam. | Sailing. | Steam. | Sailing. | Steam. | Sailing. | |
| 1905 | 406 | 221 | 1,035,830 | 103,580 | 401 | 226 | 1,035,004 | 106,548 |
| 1906 | 431 | 198 | 1,148,598 | 95,054 | 425 | 206 | 1,138,873 | 99,341 |
| 1907 | 454 | 191 | 1,164,550 | 89,716 | 441 | 174 | 1,144,550 | 80,832 |
| 1908 | 475 | 183 | 1,269,044 | 92,003 | 463 | 193 | 1,231,193 | 100,112 |
| 1909 | 445 | 160 | 1,186,393 | 77,542 | 437 | 159 | 1,172,478 | 81,400 |
| 1910 | 475 | 134 | 1,317,284 | 71,747 | 464 | 124 | 1,299,082 | 68,125 |
| 1911 | 499 | 122 | 1,417,943 | 64,435 | 498 | 126 | 1,402,103 | 65,299 |
| 1912 | 582 | 95 | 1,619,411 | 52,681 | 572 | 94 | 1,620,057 | 48,573 |
| 1913 | 563 | 82 | 1,692,929 | 46,056 | 559 | 76 | 1,658,457 | 41,350 |
| 1914 | 567 | 79 | 1,676,840 | 48,009 | 582 | 75 | 1,735,601 | 46,380 |
Tables are given showing the number and tonnage of British, colonial, and foreign vessels entered and cleared in each of the ten years, 1905 to 1914.
| VESSELS ENTEREDAND CLEARED, 1905–14. | ||||||||
|---|---|---|---|---|---|---|---|---|
| Year. | British. | Colonial. | Foreign. | Total. | ||||
| Vessels. | Tons. | Vessels. | Tons. | Vessels. | Tons. | Vessels. | Tons. | |
| Entered | ||||||||
| 1905 | 130 | 462,851 | 423 | 500,467 | 74 | 176,092 | 627 | 1,139,410 |
| 1906 | 152 | 548,142 | 408 | 542,271 | 69 | 153,239 | 629 | 1,243,652 |
| 1907 | 194 | 636,456 | 400 | 548,916 | 51 | 68,894 | 645 | 1,254,266 |
| 1908 | 193 | 684,144 | 419 | 629,428 | 46 | 47,475 | 658 | 1,361,047 |
| 1909 | 155 | 587,235 | 407 | 633,813 | 43 | 42,887 | 605 | 1,263,935 |
| 1910 | 186 | 703,244 | 385 | 643,128 | 38 | 42,659 | 609 | 1,389,031 |
| 1911 | 169 | 707,573 | 409 | 727,969 | 43 | 46,836 | 621 | 1,482,378 |
| 1912 | 153 | 672,289 | 462 | 931,811 | 62 | 67,992 | 677 | 1,672,092 |
| 1913 | 171 | 765,943 | 430 | 905,034 | 44 | 68,008 | 645 | 1,738,985 |
| 1914 | 191 | 791,529 | 398 | 847,910 | 57 | 85,410 | 646 | 1,724,849 |
| Cleared. | ||||||||
| 1905 | 130 | 465,171 | 421 | 500,371 | 76 | 176,010 | 627 | 1,141,552 |
| 1906 | 149 | 538,494 | 413 | 545,026 | 69 | 154,694 | 631 | 1,238,214 |
| 1907 | 185 | 625,006 | 383 | 537,234 | 47 | 63,142 | 615 | 1,225,382 |
| 1908 | 194 | 682,357 | 408 | 594,842 | 54 | 54,106 | 656 | 1,331,305 |
| 1909 | 152 | 572,384 | 406 | 641,055 | 38 | 40,439 | 596 | 1,253,878 |
| 1910 | 181 | 688,143 | 371 | 637,513 | 36 | 41,551 | 588 | 1,367,207 |
| 1911 | 169 | 693,665 | 418 | 726,655 | 43 | 47,082 | 624 | 1,467,402 |
| 1912 | 152 | 680,774 | 459 | 930,627 | 55 | 57,229 | 666 | 1,668,630 |
| 1913 | 171 | 748,769 | 420 | 886,440 | 44 | 64,598 | 635 | 1,699,807 |
| 1914 | 194 | 826,358 | 407 | 867,184 | 56 | 88,439 | 657 | 1,781,981 |
British and colonial vessels have shown a steady rise in tonnage over the period under review, and the tonnage of foreign vessels has also risen in the last few years. The big drop between 1906 and 1907 in numbers and tonnage of foreign vessels was due to the discontinuance of the Oceanic Steamship Company's contract for the carrying of mails between New Zealand and San Francisco. The company maintained a three-weekly service from 1901 to 1906, using vessels registered in the United States.
The nationality of the foreign-owned vessels entered inwards and cleared outwards in 1904 and 1914 is as follows:—
| FOREIGN VESSELS, 1904 AND 1914. | ||||||||
|---|---|---|---|---|---|---|---|---|
| 1904. | 1914. | |||||||
| Nationality. | Entered. | Cleared. | Entered. | Cleared. | ||||
| Vessels. | Tons. | Vessels. | Tons. | Vessels | Tons. | Vessels. | Tons. | |
| French | 1 | 762 | 2 | 2,505 | 2 | 2,313 | 2 | 2,313 |
| Italian | 3 | 3,793 | 2 | 3,038 | 2 | 3,372 | 2 | 3,265 |
| Dutch | 1 | 1,100 | 1 | 569 | .. | .. | .. | .. |
| German | 7 | 7,720 | 7 | 7,720 | 10 | 24,833 | 9 | 22,574 |
| Danish | 2 | 3,177 | 2 | 3,177 | .. | .. | .. | .. |
| Norwegian | 17 | 11,561 | 17 | 11,479 | 27 | 39,091 | 29 | 46,726 |
| Swedish | 2 | 1,366 | 2 | 1,230 | .. | .. | .. | .. |
| Russian | .. | .. | .. | .. | 1 | 1,633 | .. | .. |
| Japanese | .. | .. | .. | .. | 2 | 6,938 | 2 | 6,938 |
| American | 37 | 132,996 | 38 | 133,815 | 13 | 7,230 | 12 | 6,623 |
| Totals | 70 | 162,475 | 71 | 163,533 | 57 | 85,410 | 56 | 88,439 |
Particulars of the number and net tonnage of vessels entered and cleared between New Zealand and various countries during the years 1904 and 1914 are given below:—
| Country. | 1904. | 1914. | ||||||
|---|---|---|---|---|---|---|---|---|
| Entered. | Cleared. | Entered. | Cleared. | |||||
| No. | Tonnage. | No. | Tonnage. | No. | Tonnage. | No. | Tonnage. | |
| United Kingdom | 99 | 366,993 | 97 | 352,065 | 83 | 431,300 | 109 | 526,246 |
| Australia | 403 | 550,400 | 427 | 608,271 | 398 | 891,430 | 410 | 938,969 |
| Norfolk Island | 4 | 872 | 4 | 872 | 2 | 806 | 2 | 806 |
| Fiji | 31 | 44,409 | 24 | 32,330 | 17 | 33,166 | 20 | 41,277 |
| Maiden Island | 4 | 1,968 | 2 | 965 | 4 | 3,564 | 4 | 3,555 |
| Hong Kong | 3 | 8,775 | 6 | 15,314 | .. | .. | .. | .. |
| Straits Settlements | .. | .. | .. | .. | 2 | 5,432 | 1 | 2,438 |
| India | 5 | 17,149 | 1 | 3,684 | 7 | 23,800 | .. | .. |
| British South Africa | 6 | 4,192 | 8 | 29,133 | 3 | 7,573 | .. | .. |
| Seychelles | .. | .. | .. | .. | 1 | 699 | .. | .. |
| Canada | .. | .. | .. | .. | 24 | 108,297 | 12 | 69,446 |
| France | 1 | 938 | .. | .. | 3 | 5,005 | 3 | 8,176 |
| Holland | 1 | 820 | .. | .. | 1 | 2,624 | .. | .. |
| Germany | .. | .. | 3 | 7,465 | 1 | 1,980 | .. | .. |
| Egypt | .. | .. | .. | .. | .. | .. | 6 | 30,321 |
| Sumatra | .. | .. | .. | .. | 3 | 4,853 | .. | .. |
| Philippine Islands | 2 | 3,344 | .. | .. | .. | .. | .. | .. |
| Japan | 2 | 4,755 | .. | .. | 2 | 5,502 | .. | .. |
| Madagascar | .. | .. | .. | .. | 2 | 1,743 | .. | .. |
| Portuguese East Africa | 4 | 3,085 | .. | .. | 2 | 5,846 | .. | .. |
| Argentina | .. | .. | .. | .. | 2 | 1,912 | .. | .. |
| Brazil | .. | .. | .. | .. | .. | 847 | .. | .. |
| Chile | .. | .. | .. | .. | 3 | 11,268 | 1 | 3,113 |
| Panama Canal Zone | .. | .. | .. | .. | 1 | 3,006 | .. | .. |
| United States | 39 | 119,760 | 22 | 69,646 | 53 | 132,506 | 28 | 68,825 |
| New Guinea | .. | .. | 1 | 769 | .. | .. | .. | .. |
| German Samoa | 2 | 217 | 3 | 94 | 4 | 4,635 | 6 | 8,172 |
| Marshall Islands | .. | .. | 1 | 670 | .. | .. | .. | .. |
| Bismarck Archipelago | .. | .. | 1 | 180 | 2 | 4,893 | 2 | 2,070 |
| Caroline Islands | .. | .. | 1 | 605 | .. | .. | 1 | 787 |
| Easter Island | .. | .. | 1 | 1,036 | .. | .. | .. | .. |
| Tonga | 16 | 17,598 | 14 | 16,809 | 9 | 10,212 | 8 | 7,833 |
| Ocean Island | 2 | 4,623 | .. | .. | .. | .. | .. | .. |
| Society Islands | .. | .. | .. | .. | 14 | 18,798 | 13 | 15,981 |
| New Caledonia | 1 | 2,842 | 3 | 4,311 | 2 | 3,152 | 6 | 12,864 |
| Surprise Island | 3 | 1,787 | 1 | 545 | .. | .. | .. | .. |
| Tuamotu Archipelago | .. | .. | .. | .. | .. | .. | 1 | 2,403 |
| Gilbert and Ellice Islands | 1 | 42 | .. | .. | .. | .. | 1 | 2,305 |
| “Guam” | .. | .. | .. | .. | .. | .. | 23 | 36,394 |
| Totals | 629 | 1,154,569 | 620 | 1,144,764 | 646 | 1,724,849 | 657 | 1,781,981 |
The net tonnage of oversea shipping entered and cleared at the various ports during the years 1904 and 1914 is given in the next table. Vessels arriving from abroad are recorded at the first port of call, and those departing oversea are cleared at the port from which they finally sail:—
| Country. | 1904. | 1014. | ||
|---|---|---|---|---|
| Entered. | Cleared. | Entered. | Cleared. | |
| Tons. | Tons. | Tons. | Tons. | |
| Auckland | 543,199 | 382,540 | 821,236 | 533,618 |
| Kaipara | 9,170 | 34,180 | 1,886 | 32,571 |
| Tauranga | .. | .. | 299 | .. |
| Gisborne | 3,984 | 377 | 5,703 | .. |
| Waitara | .. | .. | 7,237 | .. |
| New Plymouth | 740 | 779 | 8,796 | 498 |
| Wanganui | 1,227 | 426 | 7,285 | 2,913 |
| Wellington | 311,965 | 413,218 | 515,628 | 824,425 |
| Napier | 8,275 | 6,541 | 15,520 | 4,684 |
| Wairau | .. | .. | .. | 5,163 |
| Picton | 8,246 | 2,965 | 2,131 | .. |
| Nelson | 2,007 | .. | 1,516 | .. |
| Westport | 21,319 | 27,891 | 21,114 | 35,650 |
| Greymouth | 844 | 5,486 | 657 | 27,762 |
| Lyttelton | 37,803 | 40,012 | 68,487 | 73,586 |
| Timaru | 2,764 | 15,732 | 26,078 | 5,628 |
| Oamaru | 797 | 1,174 | 1,438 | 8,074 |
| Dunedin | 66,239 | 57,879 | 73,377 | 92,279 |
| Bluff | 135,990 | 155,564 | 146,461 | 135,130 |
| Totals | 1,154,569 | 1,144,764 | 1,724,849 | 1,781,981 |
The extensive coast-line and numerous harbours of New Zealand facilitate travelling and the distribution of goods by sea. The total tonnage of coastwise shipping, as shown below, includes that of oversea vessels which, after entry at the first port of arrival, proceed to other ports within the Dominion for the purpose of delivering and loading cargo, each movement, until the final sailing, being recorded as coastwise shipping.
| COASTWISE SHIPPING, 1905–14. | ||||||||
|---|---|---|---|---|---|---|---|---|
| Year. | Entered. | Cleared. | ||||||
| Vessels. | Tonnage. | Vessels. | Tonnage. | |||||
| Steam. | Sailing. | Steam. | Sailing. | Steam. | Sailing. | Steam. | Sailing. | |
| 1905 | 20,382 | 5,007 | 10,016,337 | 313,072 | 20,402 | 4,978 | 10,103,864 | 308,425 |
| 1906 | 20,475 | 4,650 | 11,024,818 | 306,943 | 20,379 | 4,625 | 11,026,354 | 295,468 |
| 1907 | 20,794 | 4,479 | 10,981,579 | 260,028 | 20,695 | 4,402 | 10,913,497 | 255,532 |
| 1908 | 21,259 | 4,448 | 11,825,857 | 251,983 | 21,170 | 4,379 | 11,795,607 | 256,133 |
| 1909 | 20,924 | 4,467 | 11,706,700 | 241,974 | 20,956 | 4,425 | 11,730,052 | 244,554 |
| 1910 | 22,272 | 4,500 | 11,839,244 | 242,652 | 22,217 | 4,478 | 11,848,680 | 241,302 |
| 1911 | 23,092 | 4,024 | 12,060,227 | 206,427 | 23,064 | 4,033 | 12,026,951 | 208,820 |
| 1912 | 23,654 | 3,843 | 12,451,499 | 180,698 | 23,622 | 3,870 | 12,457,316 | 181,718 |
| 1913 | 21,937 | 3,764 | 11,332,143 | 173,494 | 21,922 | 3,733 | 11,330,078 | 172,715 |
| 1914 | 23,019 | 3,880 | 12,217,206 | 175,757 | 23,026 | 3,846 | 12,154,108 | 179,761 |
The decrease in 1913 as compared with 1912 is largely accounted for by the strike during the latter part of the year. Many coastal vessels were laid up for several weeks during the strike period. The effect of the war on oversea shipping in 1914 was also reflected to a certain extent in the coastwise shipping, the figures all round being slightly lower than the corresponding figures for 1912, though considerably in excess of those for 1913.
In the next table is given information showing tonnage of vessels entered and cleared coastwise at each port in the years 1904 and 1914.
| TONNAGE ENTEREDAND CLEAREDAT VARIOUS PORTS, 1904 AND 1914. | ||||
|---|---|---|---|---|
| Ports. | 1904. | 1914. | ||
| Tonnage entered. | Tonnage cleared. | Tonnage entered. | Tonnage cleared. | |
| Auckland | 823,663 | 976,788 | 1,096,857 | 1,391,017 |
| Onehunga | 155,685 | 155,838 | 114,844 | 114,006 |
| Thames | 129,120 | 129,324 | 122,080 | 121,937 |
| Coromandel | 34,122 | 34,386 | 21,572 | 21,592 |
| Whitianga | .. | .. | 22,937 | 21,826 |
| Whangaparapara | .. | .. | 16,170 | 14,788 |
| Whangarei | 130,812 | 130,535 | 225,915 | 220,949 |
| Russell | 41,392 | 41,392 | 68,768 | 65,284 |
| Whangaroa | 36,021 | 36,220 | 55,232 | 54,389 |
| Mangonui | 19,124 | 19,124 | 31,743 | 31,743 |
| Hokianga | 17,748 | 17,601 | 25,377 | 17,308 |
| Herekino | .. | .. | 657 | 657 |
| Whangape | .. | .. | 2,754 | 2,754 |
| Kaipara | 37,000 | 11,937 | 35,360 | 6,941 |
| Tauranga | 12,520 | 13,520 | 56,176 | 56,277 |
| Gisborne | 522,784 | 526,548 | 730,174 | 730,044 |
| New Plymouth | 219,095 | 218,994 | 159,992 | 168,290 |
| Waitara | 49,239 | 49,264 | 68,704 | 81,294 |
| Patea | 14,233 | 14,233 | 18,104 | 17,987 |
| Wanganui | 107,938 | 110,344 | 158,700 | 163,152 |
| Foxton | .. | .. | 21,372 | 21,127 |
| Wellington | 1,912,408 | 1,834,096 | 2,859,387 | 2,543,245 |
| Napier | 668,598 | 662,301 | 893,965 | 911,021 |
| Wairau | 20,970 | 20,970 | 17,123 | 17,158 |
| Picton | 332,050 | 331,330 | 374,473 | 376,605 |
| Nelson | 337,952 | 338,814 | 329,027 | 331,462 |
| Westport | 484,171 | 474,162 | 580,192 | 567,597 |
| Greymouth | 231,257 | 229,306 | 358,248 | 332,075 |
| Hokitika | 5,675 | 5,600 | 3,253 | 3,269 |
| Lyttelton | 1,679,914 | 1,691,864 | 2,127,308 | 2,125,502 |
| Timaru | 420,599 | 421,780 | 366,564 | 384,205 |
| Oamaru | 156,266 | 155,889 | 168,637 | 160,563 |
| Dunedin | 751,783 | 760,182 | 898,652 | 885,843 |
| Bluff | 333,052 | 319,017 | 362,646 | 371,962 |
| Chatham Islands | 2,610 | 2,610 | .. | .. |
| Totals | 9,687,803 | 9,733,969 | 12,392,963 | 12,333,869 |
Looked at from the standpoint of shipping handled, Wellington is the principal port of the Dominion, followed by Lyttelton and Auckland. Wellington and Lyttelton are the termini of the daily inter-island ferry service, and to this fact is due a large part of the coastwise shipping entered and cleared from these two ports. The table which follows summarizes the shipping of the principal ports of the Dominion for the year 1914:—
| Port. | Oversea. | Coastwise. | Total. | ||
|---|---|---|---|---|---|
| Entered. | Cleared. | Entered. | Cleared. | ||
| Tons. | Tons. | Tons. | Tons. | Tons. | |
| Wellington | 515,628 | 824,425 | 2,859,387 | 2,543,245 | 6,742,685 |
| Lyttelton | 68,487 | 73,586 | 2,127,308 | 2,125,502 | 4,394,883 |
| Auckland | 821,236 | 533,618 | 1,096,857 | 1,391,017 | 3,842,728 |
| Dunedin | 73,377 | 92,279 | 898,652 | 885,843 | 1,950,151 |
| Napier | 15,520 | 4,684 | 893,965 | 911,021 | 1,825,190 |
| Gisborne | 5,703 | .. | 730,174 | 730,044 | 1,465,921 |
| Westport | 21,114 | 35,650 | 580,192 | 567,597 | 1,204,553 |
| Bluff | 146,461 | 135,130 | 362,646 | 371,962 | 1,016,199 |
| Timaru | 26,078 | 5,628 | 366,564 | 384,205 | 782,475 |
| Picton | 2,131 | .. | 374,473 | 376,605 | 753,209 |
| Greymouth | 657 | 27,762 | 358,248 | 332,075 | 718,742 |
| Nelson | 1,516 | .. | 329,027 | 331,462 | 662,005 |
Information as to pilotage, port charges, wharfage rates, &c., at these and certain other ports of the Dominion is given in the 1914 issue of this book. Particulars concerning the graving-docks at Auckland (2), Lyttelton, and Port Chalmers (2), and the patent slips at Wellington and Lyttelton, will be found in the same issue.
The coast-line and harbours of New Zealand are fairly well provided with lighthouses, and more are being added from time to time. A list of the various lighthouses, with particulars as to the lights at each, is given.
| LIGHTHOUSES. | ||||||||
|---|---|---|---|---|---|---|---|---|
| Number of Light. | Name of Lighthouse. | Order of Apparatus. | Fixed, Flashing, or Revolving. | Interval of Revolution or Flash. | Height, in Feet, above High Water. | Colour of Light. | Distance visible in Nautical Miles. | Colour of Lighthouse. |
‡ At present showing ½ sec. 11., 8 sec. ecl., pending repairs. The lighthouses marked thus (†), under the control of the Marine Department, have been equipped with flags and lamps for day and night signalling by the Morse code, and light-keepers and signalmen at those places are now competent to receive and transmit messages Those places marked thus (*) are connected with the telegraph system of the Dominion by telephone. The following-mentioned signal-stations may also be communicated with by the Morse code: Pouto (Kaipara), Manukau Heads, Hokianga Heads, and Picton Harbour. NOTE—The distance visible of lights of greater power than 5th order dioptric is calculated in nautical miles as seen from a height of 15 ft. above the sea. In very clear weather the lower-order lights may be seen at a greater distance than is given in this table. | ||||||||
| 1 | †*Cape Maria van Diemen | 1st order dioptric | Revolving | 1 minute | 330 | White | 25 | White |
| … | Fixed | … | … | Red, to show over Columbia Reef | … | … | ||
| 2 | †*Cape Brett | 1st order dioptric | Group, 2 fl. | 30 seconds | 510 | White | 30½ | White. |
| 3 | Maro Tiri (Chickens) | Acetone acetylene gas (unwatched) | Flashing | ¼ sec. fl., 3 1/12; sec. ecl. | 480 | ″ | 20 | ″ |
| 4 | † Moko Hinou | 1st order dioptric | ″ | 10 seconds | 385 | ″ | 27 | ″ |
| 5 | *Whangaparapara (Great Barrier) | 6th order port light | Fixed | … | 100 | ″ | 8 | ″ |
| 6 | † Cuvier Island | 1st order dioptric | Revolving | 30 seconds | 390 | ″ | 27 | ″ |
| 6a | Channel Island | Acetone acetylene gas (unwatched) | Flashing | ½ sec. fl., 2 sec. ecl. ½ sec. fl., 10 sec. ecl. | 260 | ″ | 20 | ″ |
| 7 | †*Tiritiri | 2nd order dioptric | Fixed | … | 300 | White, with red arc over Flat Rock | 24 | Red. |
| 8 | Bean Rock | Unwatched | Flashing | 1 sec. fl., 4 sec. ecl. | 50 | White, red, green | 10 | White. |
| 9 | Rangitoto Beacon | Pintsch's patent gaslight (unwatched) | Occulting | 5 seconds | 68 | White, showing 5 sec. flash and 5 sec. obscured | 12 | Red and white, vertical. |
| 10 | Ponui Passage | 5th order dioptric | Fixed | … | 50 | White and red | 10 | White. |
| 11 | †*East Cape | 2nd | Flashing | 10 seconds | 362 | White flash | 26 | ″ |
| 12 | Tuahinc Point | Acetone acetylene gas (unwatched) | Occulting | fl., 2 sec. ecl. 6 sec. | 53 | White | 13 | ″ |
| 13 | Gisborne Leading-lights | Dioptric side-lights | Fixed | … | 60, 40 | White and Red | 5 | ″ |
| 14 | † Portland Island | 2nd order dioptric | Revolving | 30 seconds | 300 | White | 24 | ″ |
| ″ | … | Fixed | … | … | Red, over Hull Rock | … | … | |
| 15 | Napier | Acetone acetylene gas (unwatched) | Flashing | 1½ sec. fl., 8½ sec. ecl. | 160 | White | 19 | White. |
| 16 | Napier Leading-lights | … | Fixed | … | 70,50 | White and red | 7 | ″ |
| 17 | Castlepoint | 2nd order incand'nt | Group fl., 3 fl. | 45 seconds | 170 | White | 19½ | ″ |
| 18 | †*Cape Palliser | 2nd order dioptric | Group, 2 fl. | 30 seconds | 258 | White; interval of 3 sec. between flashes | 23 | ″ |
| 19 | *Pencarrow Hd. | 2nd | Fixed | … | 322 | White | 25 | ″ |
| 20 | ″ | Wigham bcn. lamp (unwatched) | ″ | … | 32 | White and red | 10 | ″ |
| 21 | *Somes Island | 2nd order dioptric | ″ | … | 95 | White, red, and green | 15½ | ″ |
| 22 | *Manawatu River | Ordinary lamp | ″ | … | 44 | White | 5 | Flagstaff white. |
| 23 | Wanganui River | 6th order port light | ″ | … | 65 | ″ | 8 | ″ |
| 24 | Patea | Acetone acotylene gas (unwatched) | Flashing | 0.3 sec. fl., 2.7 sec. ecl. | 130 | ″ | 12 | ″ |
| 25 | †*Cape Egmont | 2nd order dioptric | Fixed | … | 103 | ″ | 16 | White. |
| 26 | New Plymouth Leading-lights | 4th and 5th order per light | ″ | … | 100,45 | Red | 16, 10 | ″ |
| 27 | Waitara | 6th order port light | ″ | … | 70 | White | 8 | Flagstaff white. |
| 28 | †*Manukau | 3rd order dioptric | ″ | … | 385 | ″ | 27 | Brown. |
| ″ | 5th order port light | ″ | … | 70 | White and green | 10 | White. | |
| 29 | †*Kaipara | 2nd order dioptric | Flashing | 10 seconds | 278 | White | 23½ | Red. |
| 30 | *Hokianga | 6th order port light | … | … | 152 | ″ | 8 | White. |
| 31 | *Nelson | 4th “ | Fixed | … | 60 | White, with red arc | 13 | ″ |
| 32 | *French Pass | 6th “ | ″ | … | 12 | White and red, with white light on beacon | 8 | ″ |
| 33 | †*Stephens Island | 1st order dioptric | Group fl., 2 fl. | 30 seconds | 600 | White | 32½ | ″ |
| 34 | Jackson Head | Pintsch's patent gas-light (unwatched) | Occulting | fl. 3 secs., ecl. 3 sec | 55 | ″ | 10 | Concrete bcn. |
| 35 | Diffenbach Point (Queen Charlotte Sound) | Acetone acetylene gas (unwatched) | Flashing | 0.3 sec., ecl. 2.7 sec. | 39 | ″ | 5 | White. |
| 36 | † The Brothers | 2nd order dioptric | ″ | 10 seconds | 258 | ″ | 23 | ″ |
| ″ | ... | … | Fixed | … | Red, over Cook Rock | … | ″ | |
| 36a | Karori Rock (building) | Acetone acetylene gas (unwatched) | Flashing | ½ sec. fl., ecl. 3½ secs. | 65 | White, with red arcs | 3½ | … |
| 37 | Tory Channel Leading-lights | 5th order port light | Fixed | … | 86, 22 | White | 10 | White. |
| 38 | *Wairau River | 6th “ | ″ | … | 38 | ″ | 8 | Flagstaff. |
| 39 | †*Cape Campbell | 2nd order dioptric | Revolving | 1 minute | 155 | ″ | 18½ | White. |
| 40 | *Godley Head | 2nd “ | Fixed | … | 450 | ″ | 29 | ″ |
| 41 | †*Akaroa Head | 2nd “ | Flashing | 10 seconds | 270 | ″ | 23 | ″ |
| 42 | Timaru | 5th order port light | Fixed | … | 85 | Red and green | 10 | ″ |
| 43 | Jack's Point | 4th order dioptric | Occulting | 10 seconds | 94 | White | 15½ | ″ |
| 44 | Oamaru | 5th “ | Flashing | 14 seconds | 120 | ″ | 10 | Light stone |
| 45 | †Moeraki | 3rd “ | Fixed | … | 170 | ″ | 19½ | White. |
| 46 | †*Taiaroa Head | 3rd “ | ″ | … | 196 | Red | 20½ | ″ |
| 47 | Otago Harbour Entrance, N. Mole Light | Wigham bcn. light | ″ | … | 29 | Green | 5 | ″ |
| 48 | †*Cape Saunders | 2nd order dioptric | Revolving | 1 minute | 210 | White | 21 | ″ |
| 49 | †*Nugget Point | 1st “ | Fixed | … | 250 | ″ | 22½ | ″ |
| 50 | †Waipapapa Point | 2nd “ | Flashing | 10 seconds | 70 | ″ | 14 | ″ |
| 51 | †*Dog Island | 1st order catadioptric | Revolving | 30 “ | 150 | ″ | 18½ | White & black bands. |
| 52 | †*Centre Island | 1st order dioptric | Fixed | … | 265 | White, with red arcs | 23 | White. |
| 53 | †*Puysegur Point | 1st “ | Flashing | 10 seconds | 180 | White | 20 | ″ |
| 54 | Hokitika | 5th “ | Fixed | … | 122 | ″ | 10 | ″ |
| 55 | Greymouth | 6th order port light | ″ | … | 62 | ″ | 8 | Flagstaff. |
| 56 | †*Cape Foulwind | 2nd order dioptric | Revolving | 30 seconds | 238 | ″ | 22 | White. |
| 57 | Westport | Dioptric masthead-1t. | Fixed | … | 50 | ″ | 8 | Flagstaff. |
| 58 | *Karamea | 6th order port light | ″ | … | 50 | ″ | 8 | ″ |
| 59 | †Kahurangi Point | 2nd order dioptric | ″ | … | 110 | White, with red sector | 16 | White. |
| 60 | †* Farewell Spit | 2nd “ | Revolving | 1 minute | 97 | White, with rod are over Spit end | 16 | Upper part white & lower part red. |
Mariners are informed that depots of provisions and clothing for castaways are established on the following islands:—
Kermadec Islands.—There are two depots, each a small iron shed, fitted with spouting and a tank to catch water, and containing a supply of clothing, biscuits, medicines, tools, &c. One is in 30° 15′ S., 178° 31′ W., at Lava Cascade, about 1½ cables south-eastward of the northern point of Macaulay Island; the other is in 30° 35′ S., 178° 36′ W., on the southern side of Macdonald Cove (crater), on the N.W. side of Curtis Island.
Three Kings.—A provision depot has been established on the largest island. It is situated on the narrow neck at the head of N.W. and S.E. bays, in latitude 34° 9′ 11′ S., longitude 172° 9′ 1′ E., 31 miles N. 52° W. of Cape Maria van Diemen Lighthouse. The house is painted white, and is plainly visible from S.E. bay. A finger-post is erected on the ridge overlooking the two bays, and is visible from the anchorage in each bay. A notice is nailed up inside the house giving instructions where to find water, and also how to attract the attention of the light-keepers at Cape Maria—namely, by making a fire on the hill to the west of the house—and that the light-keepers have been instructed to keep a constant look-out in that direction.
Snares Islands.—A depot is established in 48° 0¾′ S., 166° 35¾′ E., in Boat Harbour, at the eastern end of N.E. Island, 120 miles by sea in a S.W. direction from Bluff Harbour.
Bounty Islands.—The depot is a hut at an elevation of 120 ft., visible from the northward, and situated in 47° 42′ S., 179° 3′ E., southward of the western inlet of the principal island—the north-eastern—of the western group. It is 360 miles S. 72° E. from Port Chalmers.
Antipodes Islands.—The depot is a hut at an elevation of 100 ft., visible from some distance north-eastward, and situated in 49° 40′ S., 178° 50′ E., 300 ft. from the landing-place, on the N.E. side of the large island, and half a mile westward of its east point. It is 460 miles S. 66° E. from Bluff Harbour.
Auckland Islands.—There are three depots on the principal island: one, a square wooden house, in 50° 33¼′ S., 166° 12′ E., and a boat near the depot, on the S. side of Erebus Cove, Port Ross, on the E. side and at the northern end of the island; the second is in 50° 44½′ S., 166° 8′ E., at the head of Norman Inlet (wrongly named “Musgrave Inlet” on charts), and not at the inlet named Norman Inlet, two miles and a half northward; the third, and a boat for shipwrecked people, is in 50° 50½′ S., 166° 1′ E., in the western arm of Camp Cove, Carnley Harbour, at the S. end of the island. A lifeboat has been placed on Enderby Island, the north-eastern of the group; another at the N.W. end of Adams Island, the southern of the group; one on Rose Island, immediately S.W. of Enderby Island; and one on Disappointment Island. Port Boss is 256 miles by sea in a S.S.W. direction from Bluff Harbour.
Campbell Island.—The depot, indicated by a white staff and a boat, is in 52° 33½′ S., 169° 6½′ E., in Tucker Cove, at the head of S. or Perseverance Harbour, on the east side of the island. Perseverance Harbour is 354 miles by sea southward of Bluff Harbour.
Finger-posts to indicate the positions of the depots are erected on all these islands. The Government steamer visits the Kermadec and Three Kings Islands once a year; and the Snares, Bounty, Antipodes, Auckland, and Campbell Islands twice a year.
Table of Contents
THE history and progress of railways in New Zealand was specially described in the Year-book of 1894, as was also the line partly built by the New Zealand Midland Railway Company. An account of the line lately belonging to the Wellington and Manawatu Railway Company was published in the Year-book for 1895.
In the year 1860 a contract was let for the construction of the first New Zealand railway. Up to the year 1870 there were only 46 miles of railway in operation. In that year the construction of railways came to be part of the public-works policy just then initiated, and the Railways Act of 1870 authorized certain lines to be made and surveys of others. In 1876 the abolition of the provinces placed the earlier-constructed railways in the hands of the General Government. At that time there were 718 miles open for traffic.
In December, 1908, the State acquired by purchase the railway between Wellington and Longburn, 84 miles in length, completed in 1886 by the Wellington-Manawatu Railway Company. The entire railway system, with the exception of a few miles of private lines used for specific purposes, such as the carriage of coal, timber, or stone, is now owned and controlled by the State.
The State railway system of New Zealand comprised at the 31st March last 2,945 miles of fine open for traffic, divided into nine distinct sections as follows:—
| Section. | Length. Miles. |
|---|---|
| North Island main line | 1,101 |
| Whangarei | 74 |
| Kaihu | 20 |
| Gisborne | 44 |
| South Island main line | 1,404 |
| Westland | 157 |
| Westport | 36 |
| Nelson | 61 |
| Picton | 48 |
| Total | 2,945 |
The gauge is 3 ft. 6 in., and all lines have been uniformly constructed to that standard. For main lines the standard rail is 70 lb. per lineal yard; for branch lines 52 lb. to 56 lb. per lineal yard, with 118 miles of 40 lb. and 45 lb. per yard. Sleepers are of Australian hardwood (ironbark or jarrah) or of New Zealand totara or silver-pine.
Since 1901 all carriages and wagons required for use on the State railways have been manufactured in the railway workshops of the Dominion. The locomotives also are now all built in the Dominion, mostly in the railway workshops. The standard passenger locomotive now in use weighs 72 tons, and has a tractive power of 19,000 lb. The standard goods locomotive weighs 94 tons, and has a tractive power of 29,840 lb. Both types are of the four-cylinder balanced compound type. Standard carriages are 50 ft. in length, fitted with chair seats to accommodate forty-four passengers, and lighted by the Pintsch gas system. All rolling-stock is fitted with the Westinghouse brake.
Information as to the rolling-stock in use on the State railways of Australia and New Zealand is given in the following table:—
| ROLLING-STOCK, STATE RAILWAYSOF AUSTRALASIA. | ||||
|---|---|---|---|---|
| State. | Year ended | Locomotives. | Passenger Vehicles. | Trucks and Vans. |
| No. | No. | No. | ||
| Queensland | 30th June, 1914 | 608 | 689 | 12,604 |
| New South Wales | ” “ | 1,065 | 1,478 | 21,054 |
| Victoria | ” “ | 735 | 1,452 | 18,214 |
| South Australia | ” “ | 403 | 472 | 8,971 |
| Western Australia | ” “ | 416 | 368 | 10,064 |
| Tasmania | ” “ | 82 | 173 | 1,743 |
| New Zealand | 31st March, 1915 | 557 | 1,397 | 21,226 |
The following statement shows the number of miles of Government railways open in the Dominion, the number of train-miles travelled and of passengers carried, and the tonnage of goods traffic for the past twenty years:—
| Year ended 31st March. | Length open (Miles). | Train-mileage. | Passengers. | Season Tickets issued. | Goods and Live-stock.* |
|---|---|---|---|---|---|
* The equivalent tonnage for live-stock has been given. | |||||
| Tons. | |||||
| 1896 | 2,014 | 3,307,226 | 4,162,426 | 36,233 | 2,175,943 |
| 1897 | 2,018 | 3,409,218 | 4,439,387 | 43,069 | 2,461,127 |
| 1898 | 2,055 | 3,666,483 | 4,672,264 | 48,660 | 2,628,746 |
| 1899 | 2,090 | 3,968,708 | 4,955,553 | 55,027 | 2,744,441 |
| 1900 | 2,104 | 4,187,893 | 5,468,284 | 63,335 | 3,251,716 |
| 1901 | 2,212 | 4,620,971 | 6,243,593 | 82,921 | 3,461,331 |
| 1902 | 2,235 | 5,066,360 | 7,356,136 | 100,778 | 3,667,039 |
| 1903 | 2,291 | 5,443,333 | 7,575,390 | 118,431 | 3,918,261 |
| 1904 | 2,328 | 5,685,399 | 8,306,383 | 129,919 | 4,259,217 |
| 1905 | 2,374 | 6,107,079 | 8,514,112 | 140,453 | 4,185,468 |
| 1906 | 2,407 | 6,413,573 | 8,826,382 | 147,989 | 4,415,166 |
| 1907 | 2,458 | 6,755,454 | 9,600,786 | 165,504 | 4,824,563 |
| 1908 | 2,474 | 7,051,274 | 9,756,716 | 185,174 | 5,070,176 |
| 1909 | 2,674 | 7,458,236 | 10,457,144 | 192,547 | 5,135,408 |
| 1910 | 2,717 | 7,889,166 | 11,141,142 | 199,371 | 5,490,018 |
| 1911 | 2,753 | 8,141,075 | 11,200,613 | 222,104 | 5,863,674 |
| 1912 | 2,798 | 8,371,687 | 11,891,134 | 236,957 | 5,887,908 |
| 1913 | 2,851 | 9,016,224 | 13,123,879 | 265,259 | 6,246,128 |
| 1914 | 2,854 | 9,319,268 | 13,355,893 | 287,037 | 6,019,633 |
| 1915 | 2,945 | 9,383,420 | 13,565,772 | 302,912 | 6,453,472 |
The principal commodities carried on the State railways during each of the past twenty years were,—
| Year ended 31st March. | Wool. | Timber. | Grain. | Mineral. | Cattle. | Sheep and Pigs. |
|---|---|---|---|---|---|---|
| Tone. | Tons. | Tons. | Tons. | Number. | Number. | |
| 1896 | 99,363 | 213,132 | 374,699 | 878,659 | 39,651 | 1,893,058 |
| 1897 | 98,958 | 257,825 | 423,888 | 1,032,252 | 35,909 | 2,016,437 |
| 1898 | 103,055 | 313,073 | 427,448 | 1,048,868 | 44,935 | 2,399,379 |
| 1899 | 97,396 | 310,266 | 420,071 | 1,147,353 | 55,878 | 2,552,745 |
| 1900 | 104,621 | 334,677 | 764,033 | 1,218,698 | 65,063 | 2,559,836 |
| 1901 | 96,519 | 380,803 | 772,571 | 1,366,241 | 72,868 | 2,463,250 |
| 1902 | 101,878 | 427,153 | 813,345 | 1,443,792 | 83,458 | 2,780,019 |
| 1903 | 116,309 | 436,008 | 718,376 | 1,604,426 | 102,461 | 3,883,177 |
| 1904 | 101,316 | 509,712 | 820,453 | 1,744,323 | 107,435 | 3,826,646 |
| 1905 | 107,625 | 493,327 | 732,480 | 1,806,360 | 110,924 | 3,490,752 |
| 1906 | 116,086 | 534,533 | 772,258 | 1,938,548 | 119,311 | 3,441,387 |
| 1907 | 128,161 | 567,835 | 770,706 | 2,135,446 | 133,031 | 4,776,223 |
| 1908 | 120,593 | 616,892 | 739,568 | 2,319,913 | 150,751 | 4,719,087 |
| 1909 | 137,916 | 582,860 | 793,793 | 2,342,048 | 159,884 | 5,329,115 |
| 1910 | 151,051 | 523,845 | 1,044,468 | 2,486,121 | 176,412 | 5,253,692 |
| 1911 | 143,247 | 627,107 | 1,013,298 | 2,655,250 | 210,848 | 6,071,670 |
| 1912 | 141,607 | 718,414 | 949,556 | 2,676,783 | 207,546 | 5,601,711 |
| 1913 | 147,735 | 695,060 | 1,181,899 | 2,760,983 | 221,595 | 5,524,935 |
| 1914 | 155,709 | 676,858 | 1,050,395 | 2,551,614 | 254,291 | 7,006,268 |
| 1915 | 162,002 | 621,963 | 1,103,352 | 2,988,028 | 314,219 | 7,086,461 |
In addition to the items specified in the above table, the traffic returns for 1913–14 and 1914–15 covered,—
| 1913–14. | 1914–15. | |
|---|---|---|
* Parcels, carriages, horses, and dogs. | ||
| Coaching* | 1,471,730 | 1,485,977 |
| Drays | 3,090 | 3,090 |
| Lime and chaff (tons) | 235,980 | 218,668 |
| Firewood (tons) | 117,038 | 119,478 |
| Merchandise (tons) | 873,746 | 861,791 |
The total cost of construction of open lines up to the 31st March, 1915, was £34,133,825. The amount spent on lines in course of construction and not handed over to the Working Railways Department for traffic purposes was £1,999,330, making the total capital invested in State railways £36,133,155. The figures for each of the past five years are given.
| CAPITAL INVESTEDIN STATE RAILWAYS, 1910–11 TO 1914–15. | |||||
|---|---|---|---|---|---|
| — | 1910–11. | 1911–12. | 1912–18. | 1913–14. | 1914–15. |
| £ | £ | £ | £ | £ | |
| Lines open for traffic | 29,606,546 | 30,506,089 | 31,611,220 | 32,355,087 | 34,133,825 |
| Lines under construction | 1,903,414 | 2,183,090 | 2,220,563 | 2,625,489 | 1,999,330 |
| Totals | 31,509,960 | 32,689,179 | 33,831,783 | 34,980,576 | 36,133,155 |
The railways of New Zealand have been looked upon more as adjuncts to the settlement of the country and the development of its natural resources than as an investment from which large profits should directly accrue. For many years a profit of 3 per cent. was regarded as sufficient, and any excess over this rate was followed by reductions in passenger-charges or in freights. Consequent on the extension of settlement and the soundness of the Dominion's industries, a higher rate than 3 per cent. has been aimed at in recent years. The rate looked for in 1909–10 was 3¾ per cent., in 1910–11 4 per cent., followed in 1911–12 by a return to 3¾ per cent. These rates were obtained, as will be seen from the table following. The rates for 1913–14 and 1914–15, however, fell below expectations, a result due in the earlier year to the extended strike which obtained during nearly three months of the year and to the outbreak of smallpox in the North Island, and in the later to the outbreak of the European War.
The gross revenue from lines open for traffic during the financial year ended the 31st March, 1915, was £4,105,457, an increase of £62,129 on the amount realized for the previous year. The net revenue amounted to £1,185,002, equivalent to a return of 3.53 per cent. on the capital invested in lines open for traffic.
Information as to the revenue of the railways during each of the past twenty years is given in the following table:—
| RAILWAY REVENUE, 1895–96 TO 1914–15. | |||||||||
|---|---|---|---|---|---|---|---|---|---|
| Year ended 31st March. | Gross Revenue from | Total Gross Revenue. | Net Revenue | Percentages of Net Revenue to Capital Cost. | |||||
| Passenger-fares. | Parcels, Luggage, and Mails. | Goods and Livestock. | Rents and Miscellaneous. | ||||||
| £ | £ | £ | £ | £ | £ | £ | s. | d. | |
| 1896 | 389,234 | 54,736 | 698,115 | 40,956 | 1,183,041 | 431,673 | 2 | 16 | 0 |
| 1897 | 410,160 | 58,084 | 774,163 | 43,751 | 1,286,158 | 497,104 | 3 | 3 | 10 |
| 1898 | 433,430 | 60,872 | 837,589 | 44,117 | 1,376,008 | 518,817 | 3 | 4 | 10 |
| 1899 | 475,553 | 66,418 | 882,077 | 45,617 | 1,469,665 | 539,928 | 3 | 5 | 10 |
| 1900 | 515,020 | 68,488 | 985,723 | 54,660 | 1,623,891 | 571,533 | 3 | 8 | 5 |
| 1901 | 544,976 | 72,712 | 1,051,694 | 57,854 | 1,727,236 | 599,389 | 3 | 9 | 8 |
| 1902 | 621,019 | 79,561 | 1,110,575 | 63,431 | 1,874,586 | 622,349 | 3 | 8 | 6 |
| 1903 | 625,698 | 87,273 | 1,189,101 | 71,966 | 1,974,038 | 630,623 | 3 | 6 | 1 |
| 1904 | 704,660 | 110,151 | 1,293,169 | 72,661 | 2,180,641 | 741,917 | 3 | 11 | 8 |
| 1905 | 738,158 | 115,051 | 1,277,976 | 78,046 | 2,209,231 | 716,331 | 3 | 6 | 0 |
| 1906 | 786,873 | 142,642 | 1,346,038 | 74,151 | 2,349,704 | 728,465 | 3 | 4 | 9 |
| 1907 | 892,053 | 151,913 | 1,498,686 | 81,948 | 2,624,600 | 812,118 | 3 | 9 | 1 |
| 1908 | 912,978 | 176,876 | 1,582,328 | 89,756 | 2,761,938 | 812,179 | 3 | 6 | 8 |
| 1909 | 1,011,658 | 187,040 | 1,630,704 | 100,124 | 2,929,526 | 814,711 | 3 | 2 | 7 |
| 1910 | 1,171,040 | 192,585 | 1,772,547 | 113,613 | 3,249,790 | 1,080,316 | 3 | 16 | 0 |
| 1911 | 1,223,412 | 193,789 | 1,961,078 | 115,903 | 3,494,182 | 1,190,910 | 4 | 1 | 3 |
| 1912 | 1,319,114 | 203,334 | 2,032,785 | 121,276 | 3,676,509 | 1,210,613 | 3 | 19 | 7 |
| 1913 | 1,461,873 | 215,209 | 2,157,686 | 136,234 | 3,971,002 | 1,265,393 | 4 | 0 | 9 |
| 1914 | 1,450,480 | 236,761 | 2,209,398 | 146,689 | 4,043,328 | 1,163,005 | 3 | 12 | 3 |
| 1915 | 1,482,382 | 227,521 | 2,249,399 | 146,155 | 4,105,457 | 1,185,002 | 3 | 10 | 7 |
For 1895–96 and subsequent years the railways have been credited with the value of services performed for other Government Departments, and debited with the value of work done for the Railway Department by other Departments.
The revenue from passenger-fares during the year 1914–15 represented an expenditure on railway travel of £1 5s. 11d. per head of mean population, including Maoris. The total revenue was equal to £3 11s. 9d. per capita.
A table is added showing information as to railway revenue in each of the Australian States for the year ended the 30th June, 1914. Figures for New Zealand for the year 1914–15 are also given.
| REVENUE OF STATE RAILWAYS IN AUSTRALASIA, 1913–14. | |||||||
|---|---|---|---|---|---|---|---|
| State. | Average Miles of Line worked. | Train-miles run (,000 omitted). | Gross Revenue. | Net Revenue. | |||
| Amount. | Per Train. | Per Cent. of Capital. | |||||
* Year ended 31st December, 1913. † Year ended 31st March, 1915. | |||||||
| £ | £ | s. | d. | ||||
| Queensland | 4,507 | 11,346 | 3,660,022 | 1,288,761 | 2 | 3 | 4.05 |
| New South Wales | 3,959 | 20,550 | 7,742,241 | 2,332,421 | 2 | 3 | 3.88 |
| Victoria | 3,747 | 15,029 | 5,560,958 | 1,695,460 | 2 | 3 | 3.44 |
| South Australia | 2,293 | 7,027 | 2,413,568 | 821,701 | 2 | 4 | 5.02 |
| Western Australia | 2,910 | 5,565 | 2,257,011 | 685,003 | 2 | 6 | 4.32 |
| Tasmania | 525 | 1,001 | 330,168 | 107,455 | 2 | 2 | 2.39 |
| Commonwealth lines* | 146 | 30 | 17,566 | 923 | 0 | 7 | 0.08 |
| New Zealand† | 2,917 | 9,383 | 4,105,457 | 1,185,002 | 2 | 6 | 3.53 |
Expenditure on State railways open for traffic during the year ended the 31st March, 1915, amounted to £2,920,455, or 71.14 per cent. of the gross revenue. The figures for each of the past twenty years are as follows:—
| Year ended 31st March. | Expenditure. | |
|---|---|---|
| Amount. | Per Cent. of Revenue. | |
| £ | ||
| 1896 | 751,368 | 63.51 |
| 1897 | 789,054 | 61.35 |
| 1898 | 857,191 | 62.30 |
| 1899 | 929,737 | 63.26 |
| 1900 | 1,052,358 | 64.80 |
| 1901 | 1,127,847 | 65.30 |
| 1902 | 1,252,237 | 66.80 |
| 1903 | 1,343,415 | 68.05 |
| 1904 | 1,438,724 | 65.98 |
| 1905 | 1,492,900 | 67.58 |
| 1906 | 1,621,239 | 69.00 |
| 1907 | 1,812,482 | 69.06 |
| 1908 | 1,949,759 | 70.59 |
| 1909 | 2,114,815 | 72.19 |
| 1910 | 2,169,474 | 66.76 |
| 1911 | 2,303,272 | 65.92 |
| 1912 | 2,465,896 | 67.07 |
| 1913 | 2,705,609 | 68.13 |
| 1914 | 2,880,323 | 71.24 |
| 1915 | 2,920,455 | 71.14 |
The expenditure under various heads for each of the past ten years has been as follows:—
| Year ended 31st March. | Maintenance of Way. | Locomotive Power. | Carriages and Wagons. | Traffic. | Lake Wakatipu Steamers | Head and Departmental Offices. | Total. |
|---|---|---|---|---|---|---|---|
| £ | £ | £ | £ | £ | £ | £ | |
| 1906 | 546,805 | 468,315 | 119,437 | 442,064 | 5,227 | 70,539 | 1,621,239 |
| 1907 | 613,890 | 522,100 | 135,793 | 494,942 | 5,082 | 73,376 | 1,812,482 |
| 1908 | 638,560 | 572,586 | 160,818 | 534,634 | 5,377 | 76,082 | 1,949,759 |
| 1909 | 656,154 | 628,410 | 165,850 | 605,940 | 5,058 | 92,445 | 2,114,815 |
| 1910 | 620,008 | 669,559 | 163,833 | 615,033 | 5,139 | 95,902 | 2,169,474 |
| 1911 | 693,445 | 695,062 | 180,221 | 631,380 | 5,029 | 98,135 | 2,303,272 |
| 1912 | 735,546 | 743,443 | 209,039 | 670,631 | 5,997 | 101,240 | 2,465,896 |
| 1913 | 765,860 | 833,146 | 226,146 | 768,936 | 6,619 | 104,902 | 2,705,609 |
| 1914 | 763,207 | 921,564 | 232,745 | 838,222 | 7,046 | 117,539 | 2,880,323 |
| 1915 | 738,550 | 954,868 | 228,145 | 870,392 | 6,085 | 122,415 | 2,920,455 |
The sum of the items for the first four years shown exceeds the total by amounts of £31,148, £32,701, £38,298, and £39,042 respectively, these being credit recoveries not allocated to the branches of expenditure to which they relate.
The number of men employed in operating the State railways at the 31st March, 1915, was 14,614. The staff is divided into two divisions—namely, the first or clerical division and the second or out-of-door division, and is further classed in four branches, as shown in the following table, which gives the number of employees in March of each of the past ten years:—
| RAILWAY EMPLOYEES, 1905–6 TO 1914–15. | |||||
|---|---|---|---|---|---|
| As at 31st March. | General. | Traffic. | Maintenance. | Locomotive. | Totals. |
| 1906 | 240 | 3,076 | 3,238 | 3,241 | 9,795 |
| 1907 | 285 | 3,350 | 3,692 | 3,531 | 10,858 |
| 1908 | 307 | 3,725 | 4,192 | 4,114 | 12,338 |
| 1909 | 460 | 3,899 | 4,544 | 3,602 | 12,505 |
| 1910 | 648 | 3,758 | 3,847 | 3,971 | 12,224 |
| 1911 | 671 | 3,848 | 4,228 | 4,134 | 12,881 |
| 1912 | 673 | 4,064 | 4,308 | 4,478 | 13,523 |
| 1913 | 718 | 4,469 | 4,240 | 4,786 | 14,213 |
| 1914 | 600 | 4,676 | 3,952 | 4,948 | 14,176 |
| 1915 | 632 | 4,753 | 4,065 | 5,164 | 14,614 |
Railway employees are under a system of classification, first introduced in 1896, and revised at various times since then. In 1896 the minimum rate of pay for adult employees was 6s. per diem. The minimum has been raised from time to time, until at present no married man receives less than 9s. per diem.
Appeal Boards (one in each Island) have been constituted to hear and redress grievances of men dissatisfied with decisions respecting the withholding of annual increments, promotion, loss of status, or breaches of discipline involving fines in excess of £2. Each Board consists of a Magistrate and two members of the Railway service elected by the members thereof. The Minister of Railways has the power of veto in respect of any decision of the Board.
A superannuation fund in connection with the Railway service was established in 1903. Full information concerning this is given in the section dealing with Pensions and Superannuation Funds.
The history of railways in New Zealand has been one of comparative freedom from accidents of a serious nature. The most serious was the Rakaia accident of 1899, wherein four persons were killed and several injured. The Whangamarino accident of the 27th May, 1914, resulted in three persons being killed and others injured. A table is given dealing with railway accidents during each of the past ten years:—
| RAILWAY ACCIDENTS, 1905–6 TO 1914–15. | |||||||
|---|---|---|---|---|---|---|---|
| Year ended 31st March. | To Passengers. | To Employees. | To others. | Fatal. | Serious. | Minor. | Totals. |
| 1906 | 25 | 475 | 29 | 20 | 10 | 499 | 529 |
| 1907 | 26 | 542 | 22 | 27 | 8 | 555 | 590 |
| 1908 | 20 | 622 | 27 | 28 | 12 | 629 | 669 |
| 1909 | 24 | 673 | 25 | 29 | 5 | 688 | 722 |
| 1910 | 14 | 708 | 19 | 25 | 11 | 705 | 741 |
| 1911 | 28 | 722 | 36 | 35 | 3 | 748 | 786 |
| 1912 | 18 | 806 | 22 | 23 | 6 | 817 | 846 |
| 1913 | 8 | 868 | 39 | 22 | 5 | 888 | 915 |
| 1914 | 18 | 1,008 | 25 | 27 | 4 | 1,020 | 1,051 |
| 1915 | 15 | 973 | 28 | 28 | 7 | 981 | 1,016 |
Of the persons meeting with fatal accidents in 1914–15 3 were passengers, 12 employees, and 13 neither passengers nor employees. Of the non-fatal accidents 34 were classified as train accidents, 251 as accidents on line (other than train-running), 134 as shunting accidents, 285 as accidents on wharves and in sheds, and 284 as accidents in railway workshops.
Table of Contents
THE Post and Telegraph Department is really a “Service” rather than a “Department.” By reason of its ramifications, it has probably greater potentialities for usefulness to the public than any other organization, and in New Zealand very full use is made of it.
Around the money-order and savings-bank accounts as a nucleus there has been built up a system of accounting which receives from all the departments of the Post and Telegraph Service various revenues which are due to the Treasury, and, in addition to this, includes a vast amount of work for other Departments of the State.
In connection with the Post Office Savings-bank, information concerning which is given in the portion of this book dealing with banking, the Department receives interest-bearing deposits from the public and invests the money received in liquid securities, not dealing in any way with land or actively participating in commercial ventures. In its money-order and postal-note business it issues drafts on places both within and beyond New Zealand, and pays drafts drawn on New Zealand either by its own agencies or by the agencies of foreign countries with which it has relations.
It receives amounts for credit of almost every Department in the Government service, and clears them from its central office in Wellington. In fact, it performs for the general public and the State various duties which, in quite another sphere of activity, are usually performed by a commercial bank. On account of the smallness of the majority of its transactions, the business, which bulks very large even from the £ s. d. point of view, is very much larger from the standpoint of the number of transactions involved, which run into millions in each of the main divisions of the business.
A very large business is done both for the Public Trust Office and the State Advances Office in connection with the receipt and payment of moneys throughout the Dominion, amounting in the case of the former office to about £1,000,000, and in that of the latter to over £2,000,000, on each side of the account. Payments of all kinds, including advances on mortgages, are made upon vouchers prepared and certified in the Head Offices of these Departments, and transmitted to the Accountant's Office, General Post Office, for payment. On the other hand, lodgments are received at any money-order office in the Dominion of any moneys whatever that may be due to the Public Trustee or to the State Advances Office. A very large number of vouchers are paid on behalf of the Treasury. Last year these amounted in value to about £2,000,000. This system has been extended by making provision for the prompt payment through the Post Office of all claims against the General Government of sums of £5 and under, without pre-audit and without reference to the central authority. This is very much appreciated by small creditors, enabling them, as it does, to receive payment immediately after completion of the service.
In addition to the items mentioned where the Post Office acts as the agent or intermediary, there is a very considerable number of others, including such diverse matters as the collection of fees under the Arms Act, sale of fishing and game licenses, collection of Customs duty on parcels received from abroad, collection of goldfields revenue, collection of premiums for the Government Insurance Department, the payment of old-age, widows', and military pensions, Imperial pensions, and Civil Servants' superannuation allowances, the collection of machinery fees, of amounts for the National Provident Fund, of fees in connection with the registration of births, deaths, and marriages, of valuation revenue, of land and income tax, and of beer duty. All these entail special knowledge on the part of the officers dealing with them, and special classes of accounts. This is particularly the case in connection with the payment of both Imperial and old-age pensions, where the rules governing the payments are very elaborate and intricate. There is probably no country in the world where the machinery of the Post Office is put to a greater or more varied use. Its system and methods are so flexible that there are practically no limits to the extension of its functions.
Apart from the advantages which are enjoyed by the public under the Post Office system of the collection and disbursement of public moneys, there is a very distinct benefit to the State, as the work is performed at a fractional part of the cost which would be incurred under other conditions.
The receipts and payments of the Post and Telegraph Department for the financial year 1914–15 are shown in the following table:—
| Item. | Postal. | Telegraph. | Total | ||||||
|---|---|---|---|---|---|---|---|---|---|
* Increase under this heading due to alteration in dates of collecting half-yearly subscriptions, a proportion of which would under the old method have fallen into 1915–16 receipts. | |||||||||
| Receipts. | £ | s. | d. | £ | s. | d. | £ | s. | d. |
| Stamps for postage | 646,076 | 5 | 6½ | .. | 646,076 | 5 | 6½ | ||
| Money-order and postal-note commission | 26,698 | 1 | 3½ | .. | 26,698 | 1 | 3½ | ||
| Money-order commission received from foreign offices | 752 | 16 | 2 | .. | 752 | 16 | 2 | ||
| Private box and bag fees | 14,968 | 10 | 4 | .. | 14,968 | 10 | 4 | ||
| Miscellaneous receipts | 10,401 | 19 | 7½ | 8,709 | 9 | 3 | 19,111 | 8 | 10½ |
| Paid telegrams | 347,596 | 13 | 9 | 347,596 | 13 | 9 | |||
| Telephone exchanges* | 303,856 | 1 | 4 | 303,856 | 1 | 4 | |||
| Totals | 698,897 | 12 | 11½ | 660,162 | 4 | 4 | 1,359,059 | 17 | 3½ |
| Item. | Postal. | Telegraph. | Total. | ||||||
|---|---|---|---|---|---|---|---|---|---|
| Payments. | £ | s. | d. | £ | s. | d. | £ | s. | d. |
| Salaries (classified officers) | 288,456 | 6 | 10 | 403,664 | 9 | 0 | 692,120 | 15 | 10 |
| Salaries (country Postmasters and telephonists, and contributions to Railway Department) | 18,509 | 0 | 0 | 37,019 | 0 | 0 | 55,528 | 0 | 0 |
| Conveyance of mails by sea | 79,726 | 18 | 11 | .. | 79,726 | 18 | 11 | ||
| Conveyance of inland mails | 89,093 | 10 | 2 | .. | 89,093 | 10 | 2 | ||
| Conveyance of mails by railway | 71,546 | 11 | 1 | .. | 71,546 | 11 | 1 | ||
| Money-order commission credited to foreign offices | 2,281 | 15 | 0 | .. | 2,281 | 15 | 0 | ||
| Maintenance of telegraph and telephone lines | .. | 91,765 | 10 | 5 | 91,765 | 10 | 5 | ||
| Miscellaneous | 84,570 | 8 | 6 | 80,216 | 18 | 0 | 164,787 | 6 | 6 |
| 634,184 | 10 | 6 | 612,665 | 17 | 5 | 1,246,850 | 7 | 11 | |
| Balance of receipts over payments | 64,713 | 2 | 5½ | 47,496 | 6 | 11 | 112,209 | 9 | 4½ |
| Totals | 698,897 | 12 | 11½ | 660,162 | 4 | 4 | 1,359,059 | 17 | 3½ |
There were 2,396 post-offices in New Zealand at the end of 1914, an increase of 13 during the year.
The table following gives information covering the past five years as to number of post-offices and numbers of articles posted and delivered. Letters and letter-cards show a steady increase, while the number of parcels handled in 1914 was more than double that for 1910.
| POSTAL BUSINESS, 1910–14. | ||||||
|---|---|---|---|---|---|---|
| Year. | Post-offices open at End of Year. | Articles posted and delivered. | ||||
| Letters and Letter-cards | Post-cards. | Books and Pattern-packets. | Parcels. | Newspapers | ||
| 1910 | 2,257 | 196,768,968 | 13,681,668 | 55,008,362 | 2,471,964 | 43,305,554 |
| 1911 | 2,312 | 205,450,627 | 12,255,477 | 58,828,436 | 3,327,379 | 43,801,719 |
| 1912 | 2,350 | 214,184,119 | 11,252,527 | 61,364,917 | 3,359,397 | 43,460,016 |
| 1913 | 2,383 | 223,961,200 | 10,462,894 | 56,127,684 | 4,275,834 | 43,572,759 |
| 1914 | 2,396 | 233,901,320 | 10,585,042 | 65,709,908 | 5,055,147 | 43,779,983 |
The average number of letters, &c., posted in the Dominion per head of the mean population in each of the past ten years is as shown in the next table.
| ARTICLES POSTEDPER HEAD OF MEAN POPULATION, 1905–14. | |||||
|---|---|---|---|---|---|
| Year. | Letters and Letter-cards. | Post-cards. | Books and Parcels. | Newspapers. | Totals. |
| 1905 | 76.09 | 3.38 | 24.90 | 19.87 | 124.24 |
| 1906 | 82.13 | 5.71 | 23.97 | 19.04 | 130.85 |
| 1907 | 86.46 | 6.63 | 23.82 | 19.56 | 136.47 |
| 1908 | 91.37 | 6.58 | 26.46 | 20.14 | 144.55 |
| 1909 | 95.98 | 6.32 | 26.29 | 20.48 | 149.07 |
| 1910 | 97.14 | 5.83 | 30.04 | 18.51 | 151.52 |
| 1911 | 97.85 | 5.35 | 31.28 | 18.66 | 153.14 |
| 1912 | 102.06 | 5.00 | 31.52 | 18.89 | 157.47 |
| 1913 | 101.91 | 4.36 | 28.14 | 17.81 | 152.22 |
| 1914 | 105.01 | 4.51 | 33.37 | 18.15 | 161.04 |
During recent years the Post Office has made very substantial extensions in the establishment of rural mail deliveries. Many of these are performed by officers mounted on motor-cycles. By means of such deliveries it has been possible to give settlers living in the back country an efficient service.
The facilities afforded for the transmission of parcels through the Post Office to places within and without the Dominion have proved of much convenience to the public. The regulations admit of parcels up to 11 lb. in weight being sent to almost all the important countries of the world, and up to 28 lb. in weight for inland parcels for or from places served the whole way by railway or steamer.
The following table shows the number of parcels exchanged with the United Kingdom, the Australian States, &c., in 1913 and 1914:—
| Country. | Number of Parcels. | |||
|---|---|---|---|---|
| Received. | Despatched. | |||
| 1913. | 1914. | 1913. | 1914. | |
| United Kingdom and foreign countries via London | 111,686 | 107,767 | 15,256 | 16,681 |
| Queensland | 776 | 718 | 992 | 952 |
| New South Wales | 15,792 | 15,636 | 6,149 | 6,483 |
| Victoria | 9,382 | 8,590 | 3,464 | 3,612 |
| South Australia | 531 | 483 | 587 | 556 |
| Western Australia | 333 | 351 | 470 | 509 |
| Tasmania | 501 | 464 | 816 | 810 |
| Fiji | 170 | 176 | 780 | 768 |
| Samoa | 18 | 13 | 244 | 139 |
| Tonga | 18 | 11 | 305 | 265 |
| Canada | 1,066 | 1,256 | 720 | 651 |
| United States of America | 11,524 | 12,225 | 1,803 | 1,832 |
| Uruguay | .. | .. | 142 | 133 |
| Cape of Good Hope | 529 | 483 | 55 | 49 |
| Natal | .. | .. | 322 | 315 |
| India | 1,491 | 1,246 | 325 | 323 |
| Ceylon | 512 | 553 | 57 | 48 |
| Straits Settlements | 149 | 138 | 67 | 57 |
| Hong Kong | 453 | 457 | 147 | 93 |
| Totals | 154,931 | 150,567 | 32,701 | 34,276 |
The declared value of the parcels received from places outside the Dominion during 1914 was £448,108, on which the Customs duty amounted to £79,237.
The number and weight of parcels dealt with—i.e., the total posted plus the foreign received—from 1905 to 1914 are given below:—
| Year. | Number. | Weight. |
|---|---|---|
| lb. | ||
| 1905 | 392,017 | 1,386,723 |
| 1906 | 448,171 | 1,638,231 |
| 1907 | 801,937 | 2,863,909 |
| 1908 | 970,153 | 3,367,116 |
| 1909 | 1,148,471 | 3,903,227 |
| 1910 | 1,306,932 | 4,533,770 |
| 1911 | 1,741,736 | 6,037,050 |
| 1912 | 1,764,534 | 5,998,602 |
| 1913 | 2,231,733 | 7,783,252 |
| 1914 | 2,619,995 | 9,561,599 |
Special house-to-house deliveries of parcels are in force in many of the principal towns.
There are (January, 1915) 232 publications on the register of newspapers for New Zealand. Of these, 63 are published daily, 34 three times a week, 22 twice a week, 69 once a week, 4 fortnightly, 1 three-weekly, 1 four-weekly, and 38 monthly.
The number of offices open for the transaction of money-order business at the end of 1914 was 788.
During 1914 691,518 money-orders, for a total sum of £3,427,505, were issued at the various post-offices. The money-orders from places beyond New Zealand and payable in the Dominion numbered 42,413, for the amount of £170,357.
The number of offices open for the sale of postal notes at the end of 1914 was 988: 2,314,327 postal notes were sold, value £725,118. The notes paid numbered 2,309,828, value £715,531.
British postal orders issued in the Dominion during the year numbered 110,625, of a value amounting to £59,771. Those paid numbered 26,417, and represented £15,298.
The estimated cost on account of the Peninsular and Oriental and Orient Mail-service for the year 1914–15 is as shown below:—
| £ | |
|---|---|
| Payment to P. and O. and Orient lines | 6,288 |
| Transit charges across Australia and Europe | 6,232 |
| Mail-services to Australia (including £3,846 for New Zealand-Australian mails) | 14,423 |
| £26,943 |
The average number of days in 1914 within which the mails from London were delivered at each of the undermentioned ports in New Zealand was,—
| London to— | P. and O. Line. | Orient Line. | Via Vancouver. | Via San Francisco. | ||||
|---|---|---|---|---|---|---|---|---|
| Auckland | 37* | 45† | 36* | 46† | 33 | 36* | 40† | |
| Wellington | 38* | 46† | 37* | 47† | 34 | 34* | 39† | |
| Christchurch | 39* | 47† | 38* | 48† | 35 | 35* | 40† | |
| Dunedin | 39* | 47† | 38* | 48† | 35 | 36* | 40† | |
The time-tables by the San Francisco and Suez routes are divided into two portions owing to the outbreak of war causing delays in delivery of the mails during the latter portion of the year.
The first Government telegraph-lines in New Zealand were constructed by the provincial authorities.
The Canterbury Provincial Government opened a line between Christchurch and Lyttelton in the beginning of the year 1863. On the 12th
* Covering despatches from 1st January to 31st July, 1914.
† Covering despatches from 1st August to 31st December, 1914. February, 1864, the Southland Provincial Government opened a line between Invercargill and the Bluff. The General Government subsequently acquired both the above-named lines, and further established communication by wire between Dunedin and Invercargill, also Dunedin and Christchurch, on the 25th May, 1865.
Messrs. Driver and McLean, merchants, of Dunedin, erected a private line between Dunedin and Port Chalmers, which was opened to the public in 1861, and acquired by the General Government some time after the opening of through communication between Lyttelton, Christchurch, Dunedin, and Bluff, referred to above
There were 13,434 miles of telegraph and interurban telephone line open at the end of March, 1915, carrying 46,778 miles of wire. There were 10,827,968 telegrams transmitted during the year; of these, the private and Press messages numbered 10,716,613, which, together with telephone exchange and other telegraph receipts, yielded a revenue of £660,162.
There were 62 central telephone exchanges and 188 sub-exchanges on the 31st March, 1915. The number of connections, including extensions, increased from 49,415 in March, 1914, to 54,261 in March, 1915. The subscriptions to these exchanges during the financial year amounted to £303,856.
The capital expended on the equipment, &c., of the several telephone exchanges up to the 31st March, 1915, was £1,501,482.
At the 31st March, 1882, there were 116 direct connections to exchanges, the gross revenue from which was £613; in 1892 the connections numbered 3,083, with a gross revenue of £18,571; in 1902 the connections were 9,260, gross revenue £62,151; in 1912 the connections were 31,475, gross revenue £179,123; while at the 31st March, 1915, the connections had reached 46,260, with a gross revenue of £303,856.
The foregoing, which refers more particularly to telephone-exchange connections, indicates the extent to which public telephonic demands have increased, especially during the last thirteen years.
The telephone, moreover, has been largely availed of in extending rapid communication to outlying places which could not economically have been served by telegraph.
With the growth of the system there arose a demand for telephone facilities between centres of population, and that class of business in this Dominion, as in other countries, has necessitated the provision of a large number of circuits at considerable expenditure to meet requirements. For the year ended the 31st March, 1900, the number of bureau communications —i.e., public conversations by telephone paid for by fees—was 197,292, of a value of £5,482. These had reached 1,423,093 in number, of a value of £32,112, for the year ended the 31st March, 1909; and at the 31st March, 1915, the number had risen to 3,753,592 for the year then ended, and were of a value of £99,852. This class of business, it will be seen, has trebled itself in value in the short period of six years.
The number of telephone exchanges in the Dominion in 1900, including central and sub-exchanges, was 40. In 1907 the number was 105, and last year 250.
The total miles of wire connected with exchanges in the Dominion in 1900 were 6,343; in 1907, 15,076; and in 1915, 113,479.
Originally the system was worked by single aerial wires, but these were replaced some years ago at the more important exchanges by aerial and subterranean lead-covered cables. The system of subterranean cables and metallic telephone circuits is being largely extended.
The telephone-exchange system in use is generally of the magneto type, branching multiple switchboards being installed in the principal exchanges. In some recent installations the common battery system is in operation. Automatic telephones have been introduced to some extent, and a contract is being executed for the installation of automatic exchanges at two of the principal cities and at four less important places.
The “party” line system of telephone-exchange service was extended and improved some years ago, and the tariff was materially reduced. By this system several persons may share a common line. This has, on account of the considerable reduction in rental charges, been largely availed of, particularly by those whose premises are situated at a distance from the exchange.
The first coin-in-slot telephones erected in the Dominion were installed at Wellington on the 17th August, 1910. There are now 139 such instruments in use in the Dominion, 46 of these having been installed during the past year.
Legal provision was made in 1912 by which County Councils may borrow for the purpose of extending telephone lines in rural districts, and power has been given to levy taxation to cover interest and the redemption of such loans.
The percentage of telephones to the population for the Dominion and for the four principal centres on the 31st March, 1915, was as follows:—
| Dominion | 4.93 |
|---|---|
| Wellington | 8.80 |
| Dunedin | 6.60 |
| Auckland | 6.19 |
| Christchurch | 5.81 |
The first installation was placed in the tower of the General Post Office at Wellington in June, 1910, and experiments were carried out with different wireless systems. Later on a “Telefunken” 2½ k.w. set was installed, and a wireless-telegraph office opened for commercial work on the 26th July, 1911. At that time there were not more than half a dozen boats fitted with wireless apparatus trading to the Dominion: now there are twenty-seven New Zealand registered ships carrying wireless apparatus, as well as a large number of vessels registered in other countries and trading to New Zealand ports.
On the 14th October, 1912, the G.P.O. Station was replaced by one of 2½ k.w. upon Mount Wakefield, immediately behind the City of Wellington. The station is situated about 1,000 ft. above sea-level. Primary power is supplied from an extension of the city electric-light mains. Telephone and telegraph wires have been extended to the station so that every facility may exist for the prompt despatch of messages. The two masts are of Oregon pine, 150 ft. high, about 300 ft. apart. The aerial is of the T type, and is composed of four phosphor-bronze wires 4 ft. apart, from the middle of which four wires extend downward to the building. The earth connection consists mainly of 300 copper wires radiating each about 300 ft. from the building, which is situated about midway between the masts. The surface of the ground is irregular and of rocky formation. The results obtained have exceeded expectations. At Mount Wakefield Station, known as “Radio-Wellington,” a continuous service is maintained.
On the 24th October, 1912, a 2½ k.w. station was established on the roof of the post-office at Auckland. The masts of this station are of tubular steel, and have been erected on the two domes of the building. The height of the masts above the instrument-room is about 75 ft. The spread of the aerial is 130 ft. There are six wires about 3 ft. 3 in. apart. The “earth” is attached to the metal framework of the building. Excellent results have also been got from this station, which is not at present open for commercial work.
The installation of a wireless set of 2½ k.w. power on the Government cable steamer “Tutanekai” was completed on the 20th June, 1912. The equipment has been found to be of much service in aiding in the work of the repair of submarine cables, as it has been possible to exchange communications of an important nature between ship and shore which other-wise could not have been made.
A wireless station was opened at Chatham Islands on the 18th September, 1913, connecting this group of islands with the mainland of New Zealand, and extending the range of communication eastward. Position: 47° 57′ S., 176° 31′ W. Hours: 9 a.m. to 1 p.m., 3 p.m. to 5 p.m., and 7 p.m. to midnight. The apparatus is Telefunken, 2½ k.w. primary power, with storage battery. The prime mover is an oil-engine. The aerial is of the T type, suspended at a height of 150 ft. from two tubular steel structures 300 ft. apart. An earthed counterpoise completes the aerial equipment.
The normal range of the above-mentioned 2½ k.w. stations is 300 miles by day and 600 miles by night.
The high-power stations at Awanui and Awarua were opened for public business on the 18th December, 1913. These stations are of 30 k.w. primary power, and were undertaken primarily for defence purposes. They are required to communicate with Sydney during the day as well as at night. The aerials are suspended from towers 394 ft. in height, and the wires are spread from the summit and base of the towers over an area of about ninety acres. Position of Awanui: 34° 54′ S., 173° 18′ E.; position of Awarua: 46° 30′ S., 168° 23′ E. Both stations observe the same hours—viz., 6.30 p.m. to midnight, but a continuous listening service is kept for distress-signals.
Statement of radio-telegraphic business for the year 1914–15:—
| 1914–15. | Number of Messages. | Words. | Total Value. | ||
|---|---|---|---|---|---|
| £ | s. | d. | |||
| Forwarded | 2,418 | 47,998 | 1,077 | 5 | 1 |
| Received | 4,656 | 64,284 | 2,066 | 10 | 6 |
| Totals | 7,074 | 112,282 | 3,143 | 15 | 7 |
The above table does not include free (service) messages.
The wireless branch of the service has filled a long-felt want by keeping the mainland in touch with vessels at sea, receiving and forwarding weather reports, and advising delays to and probable time of arrival of steamers.
Radio-telegrams from ships at sea announcing their time of arrival are accepted without charge. The information is supplied to the Press and to the shipping companies, and is announced to the public by being posted on the shipping - board. It is also useful to the Department in facilitating arrangements for the receipt and despatch of mails. Weather reports to the Meteorological Office from warships and from vessels trading around the Dominion are also transmitted free of charge.
The New Zealand coast stations are all reliably connected with the land-line systems. Complete arrangements exist for the prompt transmission of wireless telegrams over them, and for ensuring that distress-signals shall be immediately communicated to the proper authorities.
The cable opened for traffic between New Zealand and Australia and Fiji on the 9th April. 1902, was completed to Bamfield, Vancouver Island, on the 31st October following, and opened for international business on the 8th December, 1902.
The route is from Auckland to Vancouver, via Norfolk Island, Fiji, and Fanning Island. The Australian connection is at Norfolk Island. The deep-sea portion of the Vancouver – Fanning Island cable is stated to be the longest in the world. Following the opening of the cable a much faster service with America and Europe has resulted.
Direct communication between Auckland and Sydney was established on the 31st December, 1912, thus giving the Pacific Cable Board an alternative route to Australia.
Table of Contents
THE Crown lands of New Zealand are administered under the Land Act, 1908, the Land for Settlements Act, 1908, the Land Laws Amendment Act, 1912, the Land Laws Amendment Act, 1913, the Land Laws Amendment Act, 1914, and the Land Laws Amendment Act, 1915, together with the regulations made thereunder.
The distinguishing features of the present system involve the principle of a tenant right to recurrent terms of lease by the occupier, and in most cases the right to acquire the freehold. Between 1892 and 1907 a very large proportion of the Crown lands were disposed of on lease for 999 years. The rentals were based on the assessed value of the land at the time of disposal, without increase or recurring valuations, and this system, like freehold, necessarily carried with it the power of sale, sublease, mortgage, or disposition by will. At the same time the improvements made in the soil by cultivation, &c., were secured to the tenant should he from any cause be obliged to forfeit or surrender his lease. This tenure was abolished by the Land Laws Amendment Act, 1907, which substituted a lease for sixty-six years (in the case of ordinary Crown lands) and thirty-three years (in the case of settlement lands), with a perpetual right of renewal for further successive terms. The Acts of 1892, 1893, 1895, and 1907 are now consolidated in the Land Act, 1908.
The values placed on the Crown lands are, as a rule, low, for the State does not so much seek to raise a revenue directly therefrom as to encourage the occupation of the lands by the people. This occupation secures an indirect increased revenue, besides the other advantages resulting from a numerous rural population.
Again, underlying the whole of the New Zealand land system is a further application of the principle of “the land for the people”—viz., the restriction in area which any person may hold. This subject has been forced upon the attention of the Legislature by defects in former systems, under which one individual with means at his command could appropriate large areas to the exclusion of his less wealthy fellow-settler. Under existing conditions, where the price at which land is offered is definitely fixed, and where choice of selection is by ballot, every would-be settler has the same chance, and may hold under the Crown an equal area of land, except that by the Land Laws Amendment Act, 1912, preference is given to landless, married, or previously unsuccessful applicants. The quantity that a selector may hold is so fixed as to encourage the class of moderate farmers, for up to the statutory limit the amount he may select is left almost entirely to himself. The Act defines the amount of land any one may hold at 666#x2154; acres of first-class land, 2,000 acres of second-class land, or 5,000 acres of third-class land. These limits apply to lands which are thrown open for optional selection, but in some cases, where the quality of the land is very good and the selectors many, the limit may by regulation be made smaller.
Part XIII of the Land Act, 1908, deals with the limitation of area to be held by private persons, and tends to prevent the aggregation of estates of lands which may hereafter be acquired from the Crown. It distinctly limits such holdings to 5,000 acres, and gives power to inflict penalties for any evasion of the Act.
In addition to the many advantages offered by the renewable-lease tenure, the Land Act provides others to meet the wants of different classes. The general rule is that ordinary Crown land thrown open for optional selection is offered to the public under three different tenures, the choice of which is left to the would be settler. The three tenures are:—
Cash, in which one-fifth of the purchase-money is paid down at once, and the remainder within thirty days. The final title is not given until certain improvements have been made on the land.
Lease with a purchasing clause, at a 5-per-cent. rental on the value of the land, the lease being for twenty-five years, with the right to purchase at the original upset price at any time after the first six years and within twenty-five years, or to convert into a renewable lease.
Renewable lease, at a rental of 4 per cent. on the capital value, the lease being for sixty-six years with perpetual right of renewal, but no right of purchase.
“Settlement” lands are opened only on renewable lease, the term being for thirty-three years instead of sixty-six years, and the rental 4½ per cent. on capital value. The lessee has the right to acquire the freehold.
The Land Act, 1892, now embodied in the Land Act, 1908, provided for a special class of settlement called small-farm associations, which found favour with the public to a very considerable extent during the first three years after the Act came into force, but is not superseded to a large extent by the improved-farm-settlement system. The small-farm-association system provides that, where not less than twelve individuals have associated themselves together for mutual help, such an association can, with the approval of the Minister of Lands, select a block of land for subdivision and settlement, but not more than 250,000 acres may be set aside in any one year. The extreme limit that one person may hold is fixed at 500 acres. Settlements of this class were formerly held on lease in perpetuity in a similar way to lands under the same tenure when thrown open for optional selection, but this is now superseded by the renewable-lease tenure. The conditions of residence and improvement are the same. The system offers many advantages to the settler, so long as the blocks of land are judiciously chosen, having regard to quality of land, access, markets, and the probability of employment being obtained in the neighbourhood. In the eagerness to obtain lands on such easy terms these points have in the past not received sufficient attention by some of the associations, and in consequence they are not all successful. At present only a very small proportion of the remaining Crown lands is suitable for selection in this manner.
The village-settlement system of New Zealand provides for the setting apart and offering for optional selection of allotments of 1 acre in area or under, and for the opening under the renewable-lease tenure (formerly lease in perpetuity) of small farms between 1 acre and 100 acres in area. These settlements were designed to enable labourers to obtain homes for themselves and their families in the immediate vicinity of their work, and gave bush-men, workers on the roads and railways, &c., an excellent chance of securing a holding upon which they could live, and which they could improve in their spare time. There has not been any great extension of this system in recent years.
The improved-farm-settlement system was first begun in order to find work for the unemployed. Considerable areas of forest-clad Crown lands were set aside, and small contracts for the clearing, burning, and sowing of these were let to the men to whom it was intended to allot them. In most cases the farms are selected or balloted for in their primitive state, and the settler is for a time paid for the improvements he makes, or, in other words, the cost of converting forest lands into grass lands is advanced from time to time by the Government. In other cases a piece of forest land is taken in hand, and men are employed at fixed rates in felling, burning, and grassing. When so much grass is laid down as will give a good start, the land is opened for selection in sections of 50 to 200 acres and balloted for among the applicants. The farms are let on lease with a purchasing clause or on renewable lease (formerly lease in perpetuity) at a rental sufficient to cover the cost of clearing, &c., together with a fair rental of the land.
The size of holdings averages about 120 acres.
Full details as to the various tenures now in force, and the conditions to be complied with by selectors of Crown land, are given in the following, pages.
The Crown lands are administered, under the authority of the Land Act, 1908, and its amendments, by the Minister of Lands at Wellington, his executive officer being the Under-Secretary of Lands, who is the permanent head of the Department of Lands and Survey. For convenience New Zealand is divided into ten land districts, each being under the local direction of a Commissioner of Crown Lands and a Land Board. The Commissioner's office is known as the principal land office, and in some of the larger districts there are one or more local land offices. It is with these land offices that the selector has to transact all business, from the first consultation of the maps to the final receipt of the Crown title.
A Land Board consists of five members, of whom the Commissioner of Crown Lands for the district is ex officio chairman. Three of the members are nominated by the Governor, the remaining one being elected by the Crown tenants of the district.
The names of the land districts and of the towns where each principal office is situated are, beginning with the most northerly and taking them geographically, as under:—
| Land District. | Town where Principal Land Office is situated. |
|---|---|
| Auckland | Auckland. |
| Taranaki | New Plymouth. |
| Hawke's Bay | Napier. |
| Wellington | Wellington. |
| Nelson | Nelson. |
| Marlborough | Blenheim. |
| Westland | Hokitika. |
| Canterbury | Christchurch. |
| Otago | Dunedin. |
| Southland | Invercargill. |
| Head Office | Government Buildings, Wellington. |
Crown lands are divided into three classes:—
Town and village lands, the upset prices of which are, respectively, not less than £20 and £3 per acre; such lands are sold by auction, or leased for ten or thirty-three years at a rental of 5 per cent. on the value of the land:
Suburban lands, the upset price of which may not be less than £2 an acre; these lands are also sold by auction, or leased as aforesaid:
Rural lands, which may be disposed of at not less than £1 per acre for first-class, 10s. an acre for second-class, and 5s. an acre for third-class lands; such lands may be sold or leased by auction, or sold or leased on application.
No rural section may be larger than 666 acres in extent if first-class land, 2,000 acres if second-class land, or 5,000 acres if third-class land, whether offered by auction or granted on application.
Every applicant must be of the age of seventeen years or upwards, and must apply for Crown land solely for his own use and benefit, and not directly or indirectly for the use or benefit of any other person, whilst, including the land he applies for, he is not to be the owner, holder, or occupier under any tenure of more than one year's duration, either severally or jointly or in common with any other person or persons, of any land anywhere in New Zealand exceeding in the whole 5,000 acres of land, computed as follows:—
Every acre of first-class land is reckoned as 7½ acres;
Every acre of second-class land is reckoned as 2½ acres;
Every acre of third-class land is reckoned as 1 acre.
In cases where a ballot is required preference is given to applicants who are landless and with children dependent on them, or who have within the two years immediately preceding the ballot, being duly qualified, applied at least twice unsuccessfully, whether under the Land Act or the Land for Settlements Act or to any member of an Expeditionary Force raised for service beyond New Zealand. An applicant is deemed landless if he does not hold under any tenure such area of land, whether Crown land or not, as is in the opinion of the Board sufficient for the maintenance of himself and his family. In the case of a husband and wife (except when they are judicially separated), if either of them is not landless, neither of them shall be deemed to be landless.
The decision of the Board as to the rejection or preference of any applicant shall be final and conclusive.
Before taking a ballot or otherwise disposing of applications for land the Board may, in such manner as it thinks fit, inquire into all matters affecting an applicant's suitability or his right of preference, and may reject any applicant who refuses or fails to answer any inquiries as to such matters to the satisfaction of the Board.
Every person who acquires an allotment, and subsequently transfers or subleases his land, shall (except under special circumstances) be disqualified for the period of ten years after the date of such disposition from acquiring an interest in any Crown or settlement land.
Crown lands may be acquired as follows: —
By auction, after survey, in which case one-fifth of the price is paid down at the time of sale, the balance within thirty days:
By application, after the lands have been notified as open for selection, in which case the applicant fills up a form (to be obtained at any of the Land Offices) and makes the declaration and undertaking required by the particular system he wishes to select under.
Under special conditions, e.g., the Land Board, with the Minister's consent, may sell small areas of Crown lands under 5 acres in extent to religious bodies, or as sites for dairy factories, cheese-factories, creameries, or fruit-preserving works, without the land having to go to public competition, but no land can be so sold at a less price than £1 per acre.
All applications, whether for surveyed or unsurveyed lands, are deemed to be simultaneous if made on the same day, and, if there be more than one applicant for the same land, the right of selection is determined by ballot.
Lands thrown open for application may be either surveyed or unsurveyed, and those not selected the first day remain open.
Lands for selection are notified as open for application on and after a stated day, and, at the option of the applicant, may be obtained on any of the three following tenures: (a) Freehold; (b) occupation with the right of purchase; (c) renewable lease.
If the land is surveyed, one-fifth of the price is to be paid down when the application is granted, and the balance within thirty days; or, if the land is not completely surveyed, the survey fee is deposited when the application is agreed to, and goes towards the purchase of the land; the balance must be paid within thirty days of notice that the survey is completed.
A certificate of occupation will issue to the purchaser on final payment, and this will be exchanged for a Crown title so soon as the Board is satisfied that the following improvements have been completed, viz.— on first-class lands, up to £1 per acre; on second-class lands, 10s. per acre; and on third-class lands, 5s. per acre. These improvements must be effected within ten years from the date of purchase, otherwise forfeiture may ensue.
Lands selected on this tenure are held under a license for twenty-five years. At any time after the expiration of not less than six years of the term of the license, after having resided and made the improvements hereinafter described, the licensee can, on payment of the upset price of the land, acquire the freehold. If the land be not purchased the license may be exchanged for a renewable lease.
The rent is 5 per cent. on the cash price of the land; if surveyed, a half-year's rent has to be paid at the time the application is approved, which represents the half-year's rent due in advance on the 1st day of January or July following the selection. If the land is unsurveyed the cost of survey has to be paid, and is credited to the selector as so much rent paid in advance.
Residence on and improvement of the land are compulsory, as hereinafter described.
Lands selected on this tenure are leased for sixty-six years, with a perpetual right of renewal for further terms of sixty-six years, subject to revaluation at the end of each term, and to the conditions of residence and improvements described below. The rental is 4 per cent. on the cash price of the land, and applications are dealt with in the same way as under the previous tenure (b), but there is at no time a right to purchase the freehold.
Two or more persons may make a joint application to hold as tenants in common under either of the two last-named tenures.
The same concession as to rebate of rent for prompt payment applies as in the previous tenure—viz., a rebate up to 10 per cent.—as also does the power to postpone payment of rent in certain cases.
A lessee may pay up to 90 per cent. of the capital value of his land at any time, when the rent shall be proportionately reduced. When he has paid up to 33 per cent. he is freed from all covenants and conditions of his lease, except the covenant to pay rent and to reside.
If in any land district the Land Board deems any Crown land (from its inferior soil or inaccessibility) not likely to be immediately productive, they may, with the consent of the Minister, open it on terms that will allow the tenants to occupy the land rent-free for a term not exceeding the first ten years of the sixty-six years' lease.
Under the two last-mentioned tenures the conditions as to residence and improvements are,—
Residence—
Must commence on bush or swamp lands within four years, and in open or partly open land within one year, from the date of selection.
Must be continuous for six years on bush or swamp land, and for seven years on open or partly open land, on lands occupied with a right of purchase:
Must be continuous for a term of ten years on renewable-lease lands.
The Board has power to dispense with residence in certain cases, such as where the selector is residing on adjacent lands, or is a youth or unmarried woman living with parents, and in a few other cases.
Residence implies the erection of a habitable house to be approved of by the Board.
The Governor has power to set apart certain areas of lands which may be selected by persons who for a certain number of years may be represented by registered substitutes, such as a near relation, who shall reside upon it in their place and make the requisite improvements, subject to special regulations which the Governor shall lay down. It is especially enacted that these regulations shall not come into force until approved by both branches of the Legislature.
Improvements which must be made are as follows:—
The holdings must be improved to an amount equal to 10 per cent. of the value of the land within one year from the date of the license or lease; within two years must be improved to the amount of another 10 per cent.; within six years must be improved to the value of another 10 per cent., making 30 per cent. in all within the six years. In addition to the above the land must be further improved to the value of £1 for every acre of first-class land, 10s. for every acre of second-class land, and 2s. 6d. for every acre of third-class land.
Improvements may consist of reclamation from swamps, clearing of bush, planting with trees or hedges, cultivation of gardens, fencing, draining, making roads, wells, water-tanks, water-races, sheep-dips, embankments or protective works, or in any way improving the character or fertility of the soil; or the erection of any building, &c.; and cultivation includes the clearing of land for cropping, or clearing and ploughing for laying down with artificial grasses, &c.
By the Land Act, 1908 (section 116), the Commissioner of Crown Lands and Receiver of Land Revenue may, in their discretion, grant to any Crown tenant who is not in arrears with his rent a rebate not exceeding one-tenth of the instalment of rent paid within one month after the day appointed for its payment.
By section 13 of the Land Laws Amendment Act, 1912, the Minister may postpone payment of rent by Crown tenants when they are unable to pay the same by reason of any natural disaster or other sufficient cause.
No lessee or licensee of Crown lands is entitled to transfer his interest therein, or to sublease his land, until he has resided continuously thereon for at least two years, and then only with the consent of the Minister and recommendation of the Land Board. But when by reason of special or unforeseen circumstance such disposition becomes, in the opinion of the Minister and Board, desirable, it may be permitted, although no such residence has taken place. This restriction does not apply to lessees of pastoral runs, nor to Crown tenants who selected land prior to the 20th November, 1907.
A Crown tenant may, however, mortgage his holding without the above consent (in the case of ordinary Crown lands), but must obtain consent during the first five years of his tenancy in the case of settlement lands.
Special conditions apply in the case of a Crown tenant mortgaging under the New Zealand State-guaranteed Advances Act, 1909 (vide section 50).
Every transferee or sublessee must make the same declaration as the original selector of the holding.
This tenure was created by the Land Act, 1892, and repealed by the Land Laws Amendment Act, 1907. It provided for a lease of 999 years, whilst the rental was fixed at 4 per cent. on the prairie value of the land. No new leases under this tenure can now be granted, but existing leases are unaffected save by the following amendments:—
A lessee can pay off up to 90 per cent. of the capital value of his land in sums of £10 at a time. By this means a settler may gradually reduce the rent he has to pay by saving his earnings in the prosperous seasons, and thus be better able to meet the losses which bad seasons may entail. So soon as he has paid up 33 per cent. of the capital value he is freed from all other covenants of his lease except the payment of rent and residence. The Land for Settlements Fund will benefit by all these payments (to be used for the purchase of further estates). In order that the territorial revenue shall not suffer to any appreciable amount by the payments made to Capital Account, it is to be credited with 4 per cent. on the total amounts so paid off.
Any holder of a lease in perpetuity may exchange his present lease for a renewable lease, and the lessee has the choice of electing whether the new rental shall be based upon the original capital value at time of selection or the present-day value (excluding the value of the improvements, which belong, to the selector).
A lessee in perpetuity may also purchase the fee-simple of the land comprised within the lease by paying the original capital value and also the difference between a rental at 5 per cent. and 4 per cent. on the original capital value, computed as from the date of the lease to date of purchase, and allowing compound interest thereon. Such a purchase can be made for cash or by deferred payments extending over twenty years. The purchase-money is paid into the Land for Settlements Account to enable new areas to be acquired for settlement.
Under special regulations, to be made by the Governor, persons may form themselves into an association, and may select and apply for a block of land to be held and occupied under prescribed conditions. No one may hold more than 500 acres, and not more than 250,000 acres can be set aside in any one year.
The capital value of lands within a special settlement is fixed after survey by special valuation, but may not be less than 10s. an acre; the rental is not less than 4 per cent. on the capital value, and the tenure is a renewable lease.
Residence, occupation, and improvements are generally the same as already described, and applications have to be made in manner prescribed by regulations.
The holders of mining district land-occupation leases for twenty-one years have the right of exchanging them for renewable sixty-six years' leases, and such an exchange will enable the lessees to apply for an increased area. The holders of pastoral lands in mining districts, under special regulations, have also the right, under certain conditions, to exchange their leases for renewable sixty-six years' leases with all their privileges, and in the case of the Hauraki Mining District to acquire the freehold.
Village settlements are disposed of under regulations made from time to time by the Governor, but the main features are as follow:—
Such settlements may be divided into—
Village' allotments not exceeding 1 acre each, which are disposed of either by auction among the applicants or by application, as already described, with option of tenure, the cash price being not less than £3 per allotment:
Homestead allotments not exceeding 100 acres each, which are available on renewable lease at a 4-per-cent. rental on a capital value of not loss than 10s. per acre.
Residence, improvements, and applications are the same as already described for rural land. The leases are exempt from liability to be seized or sold for debt or bankruptcy.
The Minister of Finance is empowered in certain cases to advance small sums for the purpose of enabling selectors to profitably occupy their allotments.
Small grazing-runs may not exceed 20,000 acres in area. The rental is to be fixed by the Land Board and approved by the Governor. Small grazing-runs are leased for terms of twenty-one years, with right of renewal for other twenty-one years, at a rent of not less than 2½ per cent. on the then value of the land. The runs are declared open for selection, and applications and declarations on the forms provided have to be filled in and left at the Land Office, together with the deposit of one half-year's rent which represents that due on the 1st day of March or September following the selection.
No holder of a pastoral run, and no holder of freehold or leasehold land of any kind whatever, over 1,000 acres in area, exclusive of the small grazing-run applied for, may be a selector under this system, and only one small grazing-run can be held by any one person except on the recommendation of the Land Board and with the approval of the Minister.
The lease entitles the holder to the grazing rights and to the cultivation of any part of the run, and to the reservation of 150 acres round his homestead through which no road may be taken, but the runs are subject to the mining laws. On the expiry of a lease of a small grazing-run the area may be disposed of in two or more allotments on lease for twenty-one years, with right of renewal for similar terms, but in such a case the outgoing lessee is entitled to receive a lease of one of the new allotments as he may choose, and is compensated for the improvements he has effected on the remainder of the run, together with the value, if any, of the right of renewal (which he would have had if the run had not been resumed and subdivided) with respect to the allotments over which he has not been granted a new lease (section 28 of the Land Laws Amendment Act, 1912). In disposing of the other allotments preference is given to applications by sons of the late lessee over twenty-one years of age who have resided on the run for not less than seven years of the ten years immediately preceding the expiry of the lease.
Residence is compulsory, if the run comprises bush or swamp land, within three years; if it is open land, within one year; and must be continuous to the end of the term, but may be dispensed with by the Board after the expiration of ten years from the date of the lease, in which case the lessee is required to provide a satisfactory substitute, who must remain in continuous residence on the land during the remainder of the term of the lease.
Improvements necessary are as follows: Within the first year to the amount of one year's rent; within the second year to another year's rent; and within six years to the value of two other years' rent, making in all a sum equal to four years' rental which must be expended within six years. In addition to these improvements bush-covered first-class runs must be improved to an amount of 10s. an acre, and second-class bush-clad runs to an amount of 5s. an acre.
After three years' compliance with the conditions a run may be divided amongst the members of the selector's family.
The fee-simple of the land comprised in any small grazing-run of ordinary Crown land or settlement land may be purchased by the lessee, provided that the area of such run does not exceed the limit of 5,000 acres in the case of ordinary Crown land, and 3,000 acres in the case of settlement land, computed as follows: (a) Every acre of first-class land is reckoned as 7½ acres; and (b) every acre of second-class land is reckoned as 2½ acres.
If the area of the run exceeds the said limits the lessee may, with the consent of the Land Board, purchase part of the run. Holders of small grazing-runs of Crown lands, not exceeding the aforesaid limit of 5,000 acres, may, on approval, exchange to the renewable-lease tenure.
Pastoral country is let either on application or by auction for varying terms not exceeding twenty-one years, with conditional right of renewal; and, excepting in extraordinary circumstances, runs must not be of a greater extent than will carry twenty thousand sheep or, four thousand head of cattle. Runs are classified from time to time by special Commissioners into: (1) Pastoral lands, which are suitable only for depasturing more than five thousand sheep; (2) pastoral-agricultural lands, suitable for subdivision into areas of under 5,000 acres, which may be either let as pastoral runs, generally for short terms, or cut up for settlement in some other form. Leases of pastoral lands may not be resumed; leases of pastoral-agricultural lands may be resumed at any time after twelve months' notice without compensation.
Except on the recommendation of the Land Board, and with the approval of the Minister of Lands, no one can hold more than one run.
Runs are offered at auction or by application from time to time, and half a year's rent has to be paid down at the time of sale, being the amount due in advance on the 1st day of March or September following the sale, and the purchaser has to make the declaration required by the Act. All leases begin on the 1st day of March, and they entitle the holder to the grazing rights, but not to the soil, timber, or minerals; and the lease terminates over any part of the run which may be leased for some other purpose, purchased, or reserved. The tenant has to prevent the burning of timber or bush except when it is intended to grass the land; in open country to prevent the growth of gorse, broom, or sweetbrier; and to destroy the rabbits on his run. With the consent of the Land Board the interest in a run may be transferred or mortgaged, but power of sale under a mortgage must be exercised within two years. A pastoral license may be extended for a term not exceeding seven years, when the holder thereof has suffered exceptional loss of live-stock by snowfalls or an inclement winter, and such loss has crippled his resources.
The Land Act, 1908 (section 237), provides that, with the consent of the Minister, the Land Board may permit the holder of any pasturage lease or license to do any one or more of the following:—
To cultivate any portion of his run for the purpose of growing winter feed for the stock depastured on the run:
To plough and sow in grass any portion of his run not exceeding 3,000 acres;
To clear by felling and burning bush or scrub any portion of his run, and sow the same in grass;
To surface-sow in grass any portion of his run.
The holder of any such pasturage lease or license may, with the permission of the Land Board, bring such area of his run under crop as is sufficient for the use and maintenance of himself and family and his employees, subject to conditions to be prescribed by the Board as to cultivation thereof by means of a proper rotation of crops.
The powers so conferred on the lessee or licensee are exercisable only on the condition that he shall, on the termination of such lease or license, leave the whole of the area ploughed or cultivated properly laid down in good permanent grasses and clovers to the satisfaction of the Board. Unoccupied pastoral areas may be set aside, and areas may be resumed from pastoral runs held on license, for grassing experiments.
In case it is decided again to lease any run on expiry of the lease, a new lease at a rental to be determined is offered to the outgoing lessee, and if such lease be not accepted the run is again offered to public competition at least twelve months before the expiry of the old lease. If such new lease be purchased by some one other than the previous lessee, valuation for improvements, to be made by an appraiser, shall be paid by the incoming tenant, excepting in the case of a rabbit-proof fence, which is to be valued separately, together with the value of the improvements authorized as above. There is, however, power for Parliament to appropriate the value of improvements to be paid to the outgoing licensee, and this value can be paid for by the incoming tenant either in one cash payment or by instalments, or the Governor may add the value of improvements to the capital value of the run (section 91 of the Reserves and Other Lands Disposal and Public Bodies' Empowering Act, 1910).
In the event of the then lessee or licensee not having become the purchaser the Board shall, at least three months before the expiry of any such lease or license, proceed to have valued by arbitration all improvements, consisting of necessary buildings, plantations, fences (other than rabbit-proof fences), and ditches for draining, and all other substantial improvements of a permanent character made on the run with the approval of the Board and the Minister. Such valuation shall be based on the worth of the said improvements to the incoming tenant, or, in the case of a subdivision of the run, to the incoming tenants of the divided portions thereof.
The outgoing tenant may, however, where the run is not again offered for lease or license, remove fences, buildings, &c. Runs may also be divided with the approval of the Board.
In cases where on the expiry of a pastoral license the land is subdivided into two or more runs the outgoing tenant has a right to a new license over one subdivision at a rent fixed by the Board for a similar term to that of the original license, or he has the right to select one of the subdivisions proposed to be sold for cash. He also has the right to receive the value of the improvements on the portion or portions of the original run over which he has not been granted a new license.
Residence on pastoral runs may, at the discretion of the Board, be made a condition of the license.
Pastoral runs comprising not more than 20,000 acres may, on approval, be exchanged to small grazing-runs.
Land within a kauri-gum district may be set aside for settlement in areas not exceeding 25 acres. It may be disposed of either under occupation-with-right-of-purchase tenure or on deferred payments extending over fifteen years. Special regulations govern the disposal of the land.
In order to aid in the establishment of the wood-pulp industry for paper-making, the Governor has been authorized to set apart land, not suitable for close settlement or for leasing under the small-grazing-run system, of a total area not exceeding 50,000 acres, and this land may be disposed of by way of lease in such areas and on such terms and conditions as have been fixed by special regulations; but no person shall be granted a lease over a greater area than 30,000 acres of such land, and no lease shall be for a longer term than twenty-one years or shall include any right of renewal. The full area of 50,000 acres was set apart by notice in the New Zealand Gazette of the 13th February, 1908.
The right to utilize the water-power of any stream on the land so disposed of, and the right to cut, fell, remove, or in any way utilize any timber growing thereon, are provided for in the regulations published in the Gazette of the 8th April, 1909.
Any land so set apart, if situated within the boundaries of a mining district under the Mining Act, 1908, shall remain subject to the provisions of that Act.
The Land Board may, with the approval of the Minister, lease by auction, for growing, cutting, or removing flax, any area not exceeding 2,000 acres, for a term not exceeding fourteen years, at such upset yearly rental as may be determined by the Board.
On the expiration of this lease a renewal may be granted to the former lessee, without auction, for a further term not exceeding fourteen years, at a rental to be determined by the Board not sooner than twelve months nor later than six months before the expiration of the first term.
These provisions apply both to land under the Land Act, 1908, and to land under the Land for Settlements Act, 1908.
Regulations giving full particulars of these leases were published in the New Zealand Gazette of the 1st April. 1909.
Section 127 of the Land Act provides liberal conditions for the selection and settlement of bush and swamp lands. Its provisions are: Land so opened is divided into three classes—(a) heavy-bush lands, (b) light-bush or swamp lands, and (c) scrub lands—according to the nature of the vegetation existing on the binds opened for sale or lease. On heavy-bush lands the selector, after payment of his first half-year's rent, is exempt from further rent for a period of four years, whilst no rate can be levied or collected by any local authority on the land for the same period; on light-bush lands or swamp lands three years' exemption from rent and rates is allowed, whilst residence for the first five years may be dispensed with on swamp lands; on scrub lands two years' exemption from rent and rates is given.
As before mentioned, section 194 provides that land not likely to be immediately productive may be opened for selection on renewable lease, and no rent shall be payable thereunder for such period (not exceeding ten years) as the Land Board and Minister of Lands shall determine. This provision may be used instead of those embodied in section 127.
Part III of the Land Laws Amendment Act, 1912, makes provision for agreements between the Minister of Lands and the owner in fee-simple of any land for the subdivision of that land and for the disposal by public tender of the allotments by way of sale or by way of lease with right of purchase. On the execution of any such agreement the Minister may advance the moneys required for rendering the land available for settlement, including the cost of subdivision and survey and the cost of the construction of roads and bridges. In the case of a sale the agreement may provide for the payment of the purchase-money by annual instalments extending over a period of from ten to twenty years, with interest on the amount for the time being unpaid not exceeding 5 per cent. per annum. In the case of a lease the term shall be for twenty-one years, and the lessee shall have the right at any time during the currency of the lease to purchase the allotment at a price to be named in the tender. The rent payable under the lease must not exceed 5 per cent. per annum of the price so named in the tender.
Section 49 provides for similar agreements between the Minister and the owners of Native freehold land in respect of the disposition by sale or lease of that land. In pursuance of such agreement a proportion (not exceeding one-third) of the proceeds may be paid over to the Native owners, and the balance is payable into a Native Land Trust Account to be invested upon trust for such Native owners.
In Part VI of the Land Laws Amendment Act, 1913, provision is made whereby the Minister of Lands may at any time in writing notify an owner that the land of such owner or a portion thereof is required for purposes of settlement. The owner is thereupon required, within six months after such notice has been gazetted, to notify the Minister whether he elects (a) to himself subdivide and offer the land for sale in subdivisions, or (b) to enter into an agreement with the Minister under the provisions of Part III of the Land Laws Amendment Act, 1912 (as described under the preceding heading), or (c) that the land shall be taken compulsorily under the Land for Settlements Act.
If the owner elects to himself subdivide the land he is required, within three years, to subdivide, road, and offer the land for sale by public auction or private contract at reasonable upset prices and upon reasonable terms and conditions. If, on the other hand, he elects to enter into an agreement with the Minister, he must do so within six months of such election.
If the owner does not elect to do either of the above things, the land may at any time within five years be taken compulsorily on payment of compensation.
In Part VI of the Land Laws Amendment Act, 1913. provision is made for compulsorily taking private land (not within a borough or town district) in cases where in the opinion of the Board of Land Purchase Commissioners such land has been acquired by way of aggregation, and where such aggregation is contrary to the public interest. Compensation for all land so taken is payable in the manner provided by the Public Works Act in respect of land taken by the Crown for a public work.
The land taken in this manner is offered to the public under renewable lease (thirty-three years) at reasonable rentals and in suitable areas.
In the earlier years of the settlement of New Zealand there were opportunities for men of capital and judgment to acquire large estates at reasonable prices, especially when money was needed for administration and roads and bridges. As the best lands in the course of years passed from the Crown the country became a series of agricultural communities interspersed with large properties, and as time went on those in search of land urged that they should be allowed to occupy these large estates instead of being compelled to go into inaccessible hack country without roads or railways. To meet this the late Sir John McKenzie, then Minister of Lands, introduced into the Legislature in the session of 1892 a Bill intituled the Land for Settlements Act, which authorized the purchase from private individuals of suitable properties for subdivision into farms, which was extended and embodied in the Land for Settlements Consolidation Act, 1900.
Under the provisions of this Act and the amending Acts, which are now consolidated into the Act of 1908 and amending Act of 1909, properties have been acquired and divided into small farms which were originally leased in perpetuity at a 5-per-cent. rental on a capital value fixed at a rate sufficient to cover first cost, together with survey, administration, and roads (if required); but by section 45 of the Act of 1908 a renewable lease for thirty-three years is substituted and the rent reduced to 4½ per cent. per annum, whilst each lease contains a perpetual right of renewal for further successive terms of thirty-three years on a rent to be determined by revaluation. Under the provisions of section 59 of the Land Laws Amendment Act, 1912, holders of renewable leases may now acquire the freehold of their holdings.
Lessees may pay off portions of the capital value of their land in sums of £10 up to 90 per cent. of the total capital value, whilst so soon as the lessee has paid up to 33 per cent. of the capital value he is freed from all other covenants of his lease except those providing for payment of rent and for residence.
Lessees in perpetuity under the former Acts have the right of exchanging their leases for renewable leases under the present Act, the new rental being 4½ per cent. upon the original capital value at the time of selection or the present-day value (excluding the value of improvements).
The usual process of acquisition is as follows: When a property is offered to the Government the Chairman of the Board of Land Purchase Commissioners has inquiries made as to the suitability for subdivision, and if found suitable a report (with a valuation) is obtained and is submitted for the consideration of the Land Purchase Board. The Board is composed of the Chairman, three other Government officers (at present the Under-Secretary of Lands, the Surveyor-General, and the local Commissioner of Crown Lands), besides a local lay member, whose training and duties qualify them to advise the Government as to whether the purchase is a suitable one, and as to the price which should be given for the property. It is only on the advice of this Board that the Government acts. The amount which may be expended per annum under the Act is £500,000. The Act also provides for the exchange of high-lying pastoral Crown lands for low-lying agricultural lands suitable for small holdings.
Lands may also be taken compulsorily in cases where the Board cannot agree with the owner as to price, &c., and where the Governor in Council decides to acquire the land for closer settlement. The amount payable to the owner is fixed by section 31 of the Land for Settlements Act, 1908, as follows: The unimproved value is that given in the valuation roll upon which the owner has been paying rates, plus 10 per cent. of the total value up to £50,000, and 5 per cent. on all amounts above that sum. The improvements are to be specially assessed under the Valuation of Land Act, 1908, as at the time when the requisition for the taking of the land is gazetted. To the total amount so ascertained as above is added another 2 per cent. by way of compensation for the compulsory taking. The owner of any estate acquired in this manner has the option of obtaining a lease of 400 acres of first-class land, or 1,000 acres of mixed classes (first, second, and third), from the Government, without competition, prior to the opening of the estate for public application.
The acquisition of lands under the Land for Settlements Acts has proved beneficial in providing homes for a large class of men of moderate capital. Sons of farmers begin life near the old home, and help from there is given in many ways. The system also affords to the small-farmer class of the Old Country an opening for building up homes for themselves where their previous experience will be of use, instead of having to learn the methods adapted to a new and wild country.
Preference is given to landless and married people and applicants who have been unsuccessful at former ballots, whilst all applicants have to satisfy the Land Board as to their means to stock and cultivate the property applied for and erect suitable buildings thereon. The Board, in fact, has a discretion as to who may become tenants.
When land acquired under this Act contains a homestead in the bona fide occupation of a tenant, the occupant may be granted, without competition, a lease of such homestead and land around it, but not exceeding 400 acres in area.
Portions of purchased estates not suitable for close settlement may be opened as pastoral areas, while, to enable such pastoral areas to be properly worked, detached areas of low-lying lands may be added to the pastoral areas although they may not be contiguous.
The number of properties considered by the Board of Land Purchase Commissioners during the year ended 31st March, 1915, was 137, of an area of 365,198 acres, of which 50,211 acres were purchased at a cost of £356,687. With the exception of 1,693 acres not yet taken delivery of, the whole has been satisfactorily settled. Further purchases have lately been made totalling 13,963 acres, valued at £108,316, and negotiations are pending for other areas.
During the year the necessary notice was served under section 64 of the Land Laws Amendment Act, 1913, upon three owners in respect of their properties, and subdivision is proceeding.
The total area purchased to the end of March, 1915, is 1,540,578 acres, at a cost of £7,293,300.
A table is given showing for each land district the number and area of estates purchased to the 31st March. 1915, together with information as to purchase-money and incidental expenses.
| SUMMARY OF ESTATES ACQUIREDTO THE 31ST MARCH, 1915. | ||||
|---|---|---|---|---|
| Land District. | Number. | Area. | Purchase-money. | Incidental Expenses, Improvements, Roads, &c. |
| Acres. | £ | £ | ||
| Auckland | 32 | 289,524 | 517,854 | 93,615 |
| Hawke's Bay | 35 | 232,071 | 1,443,314 | 105,181 |
| Taranaki | 5 | 5,356 | 90,196 | 7,755 |
| Wellington | 32 | 71,989 | 545,847 | 73,154 |
| Marlborough | 12 | 208,435 | 604,126 | 52,011 |
| Nelson | 3 | 27,292 | 34,375 | 4,622 |
| Westland | 2 | 5,125 | 8,343 | 2,923 |
| Canterbury | 106 | 392,703 | 2,605,375 | 105,738 |
| Otago | 43 | 228,485 | 1,122,452 | 99,152 |
| Southland | 12 | 79,598 | 321,418 | 25,865 |
| Totals | 282 | 1,540,578 | 7,293,300 | 570,016 |
The transfer of certain areas from Crown to settlement lands, and the adjustment of areas to account for ascertained surpluses or deficiencies, brings the total area to 1,656,455 acres at the 31st March, 1915. Of this, 48,608 acres have been sold for cash or made freehold, the total purchase-money being £138,221; and 20,631 acres are occupied by roads or by reserves unlet. At the 31st March, 1915, 5,477 selectors were holding a total of 1,480,459 acres, the annual rental for which amounts to £359,098; and the remaining 106,757 acres, of a yearly value of £8,038, were unlet. The figures for each land district are as follows:—
| POSITION OF LAND FOR SETTLEMENTS ATTHE 31ST MARCH, 1915. | ||||||
|---|---|---|---|---|---|---|
| Land District. | Net Area acquired. | Area occupied by Roads, &c. | Area unlet. | Area purchased for Cash or made Freehold. | Lands occupied on Leasehold. | |
| Area. | Number of Selectors. | |||||
| Acres. | Acres. | Acres. | Acres. | Acres. | Acres. | |
| Auckland | 288,882 | 7,499 | 72,182 | 34,011 | 175,190 | 904 |
| Hawke's Bay | 226,220 | 2,133 | .. | 2,691 | 221,396 | 688 |
| Taranaki | 5,331 | 62 | .. | 371 | 4,898 | 80 |
| Wellington | 71,815 | 784 | 4,298 | 2,002 | 64,731 | 420 |
| Nelson | 34,501 | 765 | 6,083 | 2 | 27,651 | 40 |
| Marlborough | 213,338 | 2,533 | 11,029 | 2,866 | 196,910 | 438 |
| Westland | 5,125 | 102 | .. | .. | 5,023 | 31 |
| Canterbury | 501,232 | 3,236 | 113 | 1,416 | 496,467 | 1,701 |
| Otago | 223,887 | 2,572 | 1,866 | 776 | 218,673 | 877 |
| Southland | 86,124 | 945 | 11,186 | 4,473 | 69,520 | 298 |
| Totals | 1,656,455 | 20,631 | 106,757 | 48,608 | 1,480,459 | 5,477 |
The Land for Settlements Account at the 31st March, 1915, stands as under:—
| Dr. | £ |
|---|---|
| Loans current | 7,357,687 |
| Rents, &c., received | 3,489,187 |
| Sales of settlement lands | 121,604 |
| Receipts under Land Act section 191 | 8,749 |
| Receipts under Land Act section 177 | 59,700 |
| Sale of Crown lands | 302,783 |
| Interest on investments | 3,777 |
| Premium on loan | 117 |
| Four-per-cent. stock created to cover expenses of raising loan | 349 |
| £11,343,953 | |
| Cr. | £ |
| Purchase-money | 7,293,300 |
| Incidental expenses | 636,602 |
| Interest | 2,793,492 |
| Sinking fund | 501,309 |
| Land Laws Amendment Act, section 63 | 85,171 |
| Balance | 34,079 |
| £11,343,953 |
The Land Settlement Finance Act was passed by the General Assembly on the 24th December, 1909, and came into force on the 1st January, 1910. Regulations prescribing the mode of procedure and the forms to be used were published in the New Zealand Gazette of the 3rd March, 1910.
The intention of the Act is to promote closer settlement of land by enabling groups of purchasers to buy private freehold property for subdivision among them, and to raise the purchase-money by means of a loan guaranteed by the Government. For this purpose any five or more persons may by agreement form an incorporated land-settlement association, and may purchase in the name of that association any estate consisting of not less than 250 acres. The agreement of purchase must comprise a scheme for the subdivision of the estate into allotments of not less than 25 acres and not more than 200 acres in extent, irrespective of value, or up to 500 acres, provided the unimproved value of such larger allotment does not exceed £2,500. The agreement becomes operative only if it is confirmed by Order in Council in pursuance of a recommendation of the Board of Land Purchase Commissioners. On the confirmation of the agreement the incorporated association, acting through the Public Trustee as its agent, is empowered to raise the total purchase-money of the estate by the issue of debentures under the guarantee of the Government. On the completion of the purchase the estate is transferred to the association, and the several allotments are then transferred by the association to the individual purchasers. Each purchaser gives a mortgage to the association to secure the purchase-money of his allotment, together with interest at such rate as is sufficient to moot the interest on the debentures and the incidental expenses of the association. The purchase-money of each allotment so secured by mortgage is payable by such instalments as the mortgagor chooses, not less than a specified amount in each year, and the balance must be paid in twenty years. All capital and interest moneys so paid to the association by the purchasers are expended in meeting the interest accruing due on the debentures, and the balance is accumulated in the hands of the Public Trustee as a sinking fund for the redemption of the debentures.
Each member of an association, in addition to paying the purchase-money of his allotment, will also have to pay a sum equal to ½ per cent. of the purchase-money of his allotment for the purpose of providing a fund out of which the expenses of managing an association can be paid, and possible future losses through default may be met.
By an amending Act passed on the 3rd December, 1910, it is made unlawful for any person to acquire an interest in land acquired under the Act of 1909, if the unimproved value of such land, together with the unimproved value of all other land held by him in New Zealand, exceeds the sum of £2,500.
Special commissioners may be appointed, their duties being to assist in the formation of associations by helping to secure suitable land and to afford information to intending settlers.
The title to any allotment is subject to the following restrictive provisions:—
Every purchaser must possess the qualifications required by applicants for Crown land under Part III of the Land Act, 1908.
Until at least one-third of the purchase-money has been paid off, a purchaser must reside on his allotment, and has no power to alienate it or charge it.
Transfers of any allotment are subject to the provisions of Part XIII of the Land Act, 1908, in the same manner as in the case of land now alienated in fee-simple by the Crown.
The annual report for the year ended the 31st March, 1915, states,—
“There have been six associations formed during the year, with thirty-seven members and an area of 3,279 acres, valued at £62,553.
“Several other proposals were under consideration, but for various reasons were not approved of.
“The associations already formed, with very few exceptions, appear to be prospering. The mode of procedure for the formation of an association is very cumbersome, and in several instances has been the means of preventing suitable men taking advantage of the provisions of the Act. The present Act should be repealed and replaced by a simpler one with wider powers.”
The following table shows the land-settlement finance associations incorporated from the 1st April. 1914, to the 31st March, 1915, also the total number to date:—
| Association. | Locality. | Area. | Purchase-money. | Number of Members. | Areas of Allotments. |
|---|---|---|---|---|---|
| Acres. | £ | Acres. | |||
| Auckland. | |||||
| Paparamu | Near Tirau | 865 | 10,338 | 6 | 175, 168, 169, 199, 153. |
| Clarkin | Komokorau Survey District | 623 | 15,000 | 7 | 77, 81, 100, 100,95, 68, 100. |
| 1,488 | 25,338 | 13 | |||
| Wellington. | |||||
| Lake Alice | Near Marton Junction | 378 | 10,270 | 7 | 46, 60, 141, 65, 65. |
| Westland. | |||||
| Harihari | Harihari | 586 | 3,223 | 5 | 117, 117, 117, 117, 117. |
| Canterbury. | |||||
| Eiffelton | Lowcliffe | 535 | 14,976 | 7 | 79, 66, 79, 79, 78, 77, 77. |
| Angland. | Arowhenua | 292 | 8,746 | 5 | 100, 48, 42, 54, 48. |
| 827 | 23,722 | 12 | |||
| 3,279 | 62,553 | 37 | |||
| Previously incorporated | 39,232 | 520,924 | 266 | ||
| Totals | 42,511 | 583,477 | 303 |
The Discharged Soldiers Settlement Act, 1915, was introduced with a view of settling on the land those soldiers who return from the front, and who are desirous of taking up farming in any of its branches. The Act provides for the disposal of lands to returned soldiers under two headings— viz., “ordinary tenures” and “special tenures,” and the following is a short resume of the procedure:—
In the first place the Governor sets apart by Proclamation an area of Crown or settlement land for selection by returned soldiers only, and such land is disposed of under the “ordinary tenures” of the Land Acts and the Land for Settlements Act—i.e., for cash, occupation with right of purchase, or renewable lease under the former Act, and renewable lease under the latter Act. All the provisions of the said Acts apply to selectors of lands made under the “ordinary tenures,” except that the right to apply for lands so set apart is reserved to returned soldiers only. The “ordinary-tenure” scheme was introduced with a view to affording able-bodied men, or men who have been slightly wounded, an opportunity of acquiring an area of land if they desire to take up farming.
With regard to “special tenures” the provisions are extended, as the “special-tenures” system is intended to allow of the settlement of men who have lost a limb or who have been seriously wounded, but who are still able to make a living on a small farm by means of fruit-farming, poultry-raising, dairying, &c. Land is specially set apart for selection under the “special tenures.” The Land Boards have wide powers in the matter of granting applications under the “special tenures,” and it is the duty of the various Boards to assist applicants as far as practicable in acquiring suitable allotments.
Having allotted the land to soldiers under the “special tenures,” the Board is required to take into consideration the advisability of giving financial assistance until such time as a return can be obtained from the land. Advances are given for fencing, clearing, draining, erection of buildings, and the purchase of implements, stock, trees, &c. Such advances are secured by way of mortgage in favour of the Crown.
In so far as the special tenure is concerned,' therefore, the Government finds the land, and finances the wounded soldiers until such time as they can reasonably obtain a return from the land.
Owing to the special privileges given under the Discharged Soldiers Settlement Act, 1915, it is deemed expedient to prohibit the transfer of any land acquired under the authority of the Act for a period of ten years except with the consent of the Land Board and the approval of the Minister of Lands.
For the purposes of the Workers' Dwellings Act (see section dealing with State assistance to settlers and workers in another portion of this book) Crown land may be set apart, or, if recommended by the Workers' Dwellings Board, private land may be purchased.
Crown lands may from time to time be reserved as endowments for educational purposes. They are then subject to the Education Reserves Act, 1908, and its amendments, and were formerly disposed of by the School Commissioners for each district under the provisions of that Act, or under Part XI of the Land Act, 1908, by the Land Board of the district. By the provisions of the Education Reserves Amendment Act, 1910, the School Commissioners were abolished, and all educational endowments vested in the Crown for educational purposes. They are now administered solely by the Land Board in a similar manner to Crown lands, but subject to the special provisions of the Education Reserves Acts. They may be leased either under the Land Act on renewable lease for thirty-three years, or under the Public Bodies' Leases Act, 1908, under eight different kinds of tenancy. The leases are, however, subject to determination by the Governor in Council on payment of compensation. The revenue derived from the endowments is, after deducting the expenses of administration, paid over to the Education Board of the district in the case of primary-education reserves, or to the governing bodies of secondary schools in the district in the case of secondary-education reserves.
In addition, a portion of the revenue derived from national-endowment lands is devoted to the purposes of education.
Part VII of the Land Act provided for the setting-apart of 7,000,000 acres of Crown land in New Zealand as a permanent endowment for the purposes of education and old-age pensions. In addition to this, it added to such endowment any lands which, after the passing of the National Endowment Act, 1907, might be taken up under renewable lease, or were or might afterwards be selected under lease as small grazing-runs under the provisions of Part V of the Land Act, 1908; but it enacted that so soon as the endowment should reach a total area of 9,000,000 acres no more Crown lands would thereafter become national endowment by virtue of the Act. It also expressly provided that in regard to all the lands so set apart the fee-simple thereof should not be parted with by way of cash sale, nor must any such land be disposed of under occupation-with-right-of-purchase tenure.
A separate account (known as the National Endowment Account) has been created, into which the revenue from the national-endowment area, after deducting sums payable to any local or private authority, is paid. From this revenue is deducted the cost of administration. This enables the continuation of the payment of “thirds,” “fourths,” and “halves” to local bodies, and the payment of interest on loans raised for roading purposes.
Of the balance of the revenue 70 per cent. is applied for the purpose of education, and 30 per cent. for the purpose of old-age pensions. The moneys payable for educational purposes are to be applied, without any further appropriation than the Land Act, towards payment of all amounts which, by any Act, are chargeable on the Consolidated Fund for educational purposes, whether higher, secondary, or primary, and whether general or technical. If there is any residue after these payments are made, it must be devoted towards payment of general authorities for education.
Out of the national-endowment land areas may still be set apart for all necessary public purposes, whilst power is also taken in section 267 of the Land Act, 1908, to enable the Land Board to sell, with the Minister's consent, any portion of national-endowment land (not exceeding 5 acres in any one case) as a site for any building to be erected for any educational, religious, charitable, or public purpose, or for any other purpose which, in the opinion of the Land Board and the Minister, renders such a sale expedient in the public interest. The purchase-money of land so sold is payable into the National Endowment Account.
Section 268 provides for the raising of any sum not exceeding £50,000 in any one year (in addition to sums which may be borrowed under Part V of the Land Laws Amendment Act, 1913) for the construction of roads and bridges through the national-endowment lands, to render them suitable for settlement.
Section 16 of the Land Laws Amendment Act, 1912, empowers national-endowment land to be exchanged for other land.
A summary of the transactions in connection with Crown lands during the year ended the 31st March, 1915, will be found in the following table, which shows under all descriptions of tenure the number of selectors and the area selected:—
| Nature and Tenure of Lands selected during the Year ended the 31st March, 1915 | Number of Purchasers or Selectors. | Area. |
|---|---|---|
*Includes one cash sale of 1 acre. | ||
| Ordinary Crown Lands— | Acres. | |
| Cash lands | 277 | 5,711 |
| Deferred payment | 1 | 5 |
| Occupation with right of purchase | 428 | 110,729 |
| Renewable lease | 19 | 2,704 |
| Mining districts land-occupation leases | 29 | 1,285 |
| Pastoral licenses in mining districts under special regulations | 67 | 27,398 |
| Small grazing-runs | 2 | 3,767 |
| Pastoral runs | 20 | 283,780 |
| Miscellaneous leases and licenses | 472 | 207,484 |
| Totals | 1,815 | 642,863 |
| Cheviot Estate— | ||
| Cash lands | 1 | 7 |
| Renewable lease | 1 | 14 |
| Totals | 2 | 21 |
| Land for Settlements— | ||
| Cash lands | 10 | 24 |
| Deferred payment | 17 | 22 |
| Renewable lease | 139 | 39,445 |
| Miscellaneous leases and licenses | 21 | 652 |
| Totals | 187 | 40,143 |
| Nature and Tenure of Lands selected during the Year ended the 31st March, 1915. | Number of Purchasers or Selectors. | Area. |
| National-endowment Lands— | Acres. | |
| Renewable lease | 166 | 46,237 |
| Pastoral licenses in mining districts under special regulations | 47 | 9,553 |
| Small grazing-runs | 4 | 11,036 |
| Pastoral runs | 8 | 130,558 |
| Miscellaneous leases and licenses | 37 | 43,477 |
| Totals | 262 | 240,861 |
| Thermal springs districts leases | 3 | 1 |
| Educational-endowment Lands— | ||
| Primary | 93* | 32,798 |
| Secondary | 18 | 362 |
| Totals | 111 | 33,160 |
| Grand totals | 1,880 | 957,049 |
| Other endowment lands | 13 | 827 |
The total number of selectors, the area of Crown land selected or held' the yearly rent payable, and the area made freehold at 31st March, 1915, are as follows:—
| Tenure. | Total Number of Selectors. | Total Area held. | Total Yearly Rental or Instalment payable. | Total Area made Freehold. | |
|---|---|---|---|---|---|
| Number of Purchasers. | Area. | ||||
| Ordinary Crown Lands | |||||
| Acres. | £ | Acres. | |||
| Cash | … | … | … | … | 13,164,651 |
| Deferred payment (Land Acts, 1877 and 1885) | 11 | 832 | 33 | 9,521 | 1,096,367 |
| Deferred payment (Land Laws Amendment Acts, 1912 and 1913) | 191 | 53,117 | 3,349 | 27 | 6,125 |
| Perpetual lease | 643 | 61,495 | 2,533 | 2,736 | 812,810 |
| Occupation with right of purchase | 6,030 | 1,847,471 | 127,087 | 2,104 | 556,925 |
| Lease in perpetuity | 6,407 | 1,440,676 | 54,491 | 1,060 | 219,583 |
| Renewable lease | 302 | 16,616 | 3,474 | 3 | 8 |
| Agricultural lease | 16 | 541 | 23 | 1,475 | 140,696 |
| Mining districts land-occupation leases | 695 | 24,959 | 1,424 | … | … |
| Homestead | … | … | … | 525 | 80,453 |
| Pastoral licenses in mining districts under special regulations | 499 | 122,273 | 2,962 | … | … |
| Small grazing-runs | 224 | 414,892 | 19,091 | 6 | 8,558 |
| Pastoral runs | 430 | 6,754,677 | 41,172 | ... | ... |
| Miscellaneous leases | 4,580 | 880,396 | 25,187 | ... | ... |
| Totals | 20,028 | 11,617,945 | 280,826 | ... | 16,086,376 |
| Cheviot Estate— | |||||
| Cash | … | … | … | … | 6,855 |
| Lease in perpetuity | 210 | 26,866 | 7,294 | … | … |
| Renewable lease | 14 | 659 | 509 | … | … |
| Grazing-farms | 34 | 45,021 | 6,787 | … | … |
| Pastoral runs | 1 | 1,619 | 190 | … | … |
| Miscellaneous | 53 | 1,184 | 295 | … | … |
| Totals | 312 | 75,349 | 15,075 | … | 6,855 |
| Land for Settlements— | |||||
| Cash | … | … | … | … | 539 |
| Deferred payment (Land Laws Amendment Acts, 1912 and 1913) | 232 | 31,645 | 7,995 | 41 | 1,566 |
| Lease in perpetuity | 3,358 | 630,822 | 183,925 | 184 | 20,277 |
| Renewable lease | 1,503 | 620,228 | 139,708 | 69 | 16,823 |
| Small grazing-runs | 105 | 185,627 | 25,013 | 4 | 9,403 |
| Pastoral runs | 1 | 1,530 | 125 | … | … |
| Miscellaneous | 275 | 10,607 | 2,332 | … | … |
| Totals | 5,477 | 1,180,459 | 359,098 | … | 48,608 |
| National-endowment Lands— | |||||
| Renewable lease | 2,123 | 547,115 | 26,516 | … | … |
| Mining districts land-occupation leases | 1 | 12 | 1 | … | … |
| Pastoral licenses in mining districts under special regulations | 361 | 68,126 | 1,665 | … | … |
| Small grazing-runs | 528 | 1,756,223 | 37,929 | … | … |
| Pastoral runs | 199 | 3,778,090 | 35,103 | … | … |
| Miscellaneous leases | 555 | 225,062 | 2,342 | … | … |
| Totals | 3,767 | 6,374,628 | 103,556 | … | … |
| Thermal springs (Rotorua) | 315 | 4,053 | 2,090 | … | … |
| Education Endowments— | |||||
| Primary | 3,117 | 764,822 | 71,146 | … | … |
| Secondary | 369 | 38,517 | 8,415 | … | … |
| Totals | 3,486 | 803,339 | 79,561 | … | … |
| Grand totals | 33,385 | 20,355,773 | 840,206 | ... | 16,141 |
| Other endowment lands | 816 | 376,486 | 15,443 | … | … |
| SUMMARY SHOWING TOTAL LAND HELDIN EACH LAND DISTRICT. | |||
|---|---|---|---|
| District. | Number of Selectors. | Area held. | Annual Rental. |
| Acres. | £ | ||
| Auckland | 7,814 | 1,958,420 | 106,387 |
| Hawke's Bay | 1,938 | 1,047,818 | 138,459 |
| Taranaki | 2,314 | 659,041 | 45,783 |
| Wellington | 4,124 | 1,020,848 | 88,627 |
| Nelson | 2,074 | 846,309 | 14,845 |
| Marlborough | 1,324 | 1,497,150 | 44,399 |
| Westland | 2,242 | 1,637,127 | 7,791 |
| Canterbury | 3,694 | 4,298,858 | 225,636 |
| Otago | 4,841 | 5,326,162 | 122,646 |
| Southland | 3,020 | 2,064,040 | 45,633 |
| Totals | 33,386 | 20,355,773 | 840,206 |
Tables I and II, which follow, exhibit the acreage of land taken up for settlement, and the number of holdings under each description of tenure. The lands held under pastoral license and miscellaneous leases, such as for timber and flax cutting, coal-mining, &c., are not included in these tables. Tables III and IV show the total acreage taken up year by year since the 1st April, 1905, in each land district, and the number of holdings grouped according to size, the areas varying from loss than 1 acre in extent to 1,000 acres and over.
The forfeitures and surrenders in respect of the Crown lands taken up under settlement conditions (excluding pastoral runs, miscellaneous leases and licenses, Thermal Springs District leases, and endowments other than the National Endowment and educational endowments) for the last ten years were,—
| Year. | Number of Holdings. | Acres. |
|---|---|---|
| 1905–6 | 155 | 37,858 |
| 1906–7 | 325 | 75,551 |
| 1907–8 | 271 | 51,175 |
| 1908–9 | 193 | 55,710 |
| 1909–10 | 335 | 122,089 |
| 1910–11 | 283 | 57,422 |
| 1911–12 | 272 | 60,441 |
| 1912–13 | 257 | 59,917 |
| 1913–14 | 248 | 60,954 |
| 1914–15 | 270 | 89,883 |
Forfeited and surrendered lands are again thrown open for selection as soon as possible, and in the majority of cases are taken up again by fresh selectors within a short time.
| I.—COMPARATIVE TABLESHOWING ACREAGE OF LANDS SELECTEDUNDER SETTLEMENT CONDITIONS (EXCLUDING PASTORAL RUNS, MISCELLANEOUS LEASES AND LICENSES, THERMAL SPRINGS DISTRICT LEASES, AND ENDOWMENTS OTHERTHAN THE NATIONAL ENDOWMENT AND EDUCATIONAL ENDOWMENTS) DURING THE TEN YEARS ENDED 31ST MARCH, 1915. | ||||||||||
|---|---|---|---|---|---|---|---|---|---|---|
| Tenure. | 1905–6. | 1906–7. | 1907–8. | 1908–9. | 1909–10. | 1910–11. | 1911–12. | 1912–13. | 1913–14. | 1914–15. |
| Acres. | Acres. | Acres. | Acres. | Acres. | Acres. | Acres. | Acres. | Acres. | Acres. | |
| Cash lands | 11,172 | 20,377 | 28,522 | 42,194 | 8,886 | 9,547 | 6,096 | 4,625 | 5,948 | 5,742 |
| Perpetual lease | 127 | .. | .. | .. | .. | .. | .. | .. | .. | .. |
| Deferred payment | .. | .. | .. | .. | .. | .. | .. | .. | .. | 27 |
| Occupation with right of purchase | 158,020 | 220,061 | 188,212 | 123,116 | 141,757 | 136,007 | 132,869 | 104,935 | 117,366 | 110,729 |
| Lease in perpetuity | 160,240 | 156,517 | 100,669 | 106,184 | 1,011 | 1,877 | ||||
| Renewable lease | .. | .. | 70,643 | 219,172 | 184,904 | 124,268 | 187,082 | 207,606 | 213,402 | 88,400 |
| Agricultural lease | .. | .. | 84 | .. | .. | .. | .. | .. | .. | .. |
| Mining districts land-occupation leases | 1,194 | 1,044 | 3,047 | 1,490 | 2,068 | 2,687 | 1,426 | 773 | 2,398 | 1,285 |
| Small grazing-runs | 68,587 | 114,854 | 226,757 | 28,989 | 298,494 | 128,764 | 144,617 | 37,749 | 14,691 | 14,803 |
| Pastoral licenses in mining districts under special regulations | 21,382 | 14,391 | 7,876 | 14,743 | 11,946 | 27,421 | 53,114 | 28,606 | 28,037 | 36,951 |
| Education endowments | .. | .. | .. | .. | .. | .. | 5,061 | 6,847 | 3,340 | 20,948 |
| Totals | 420,722 | 527,244 | 625,810 | 535,888 | 649,066 | 430,571 | 530,265 | 391,141 | 385,182 | 278,885 |
| NOTE.—The forfeitures and surrenders for the years dealt with in the table are shown on the preceding page. It must not be supposed that these relate to the acreages taken up during the same years; on the contrary, forfeitures and surrenders may have their origin in selections of long standing and various dates. | ||||||||||
| These figures and those shown on the next page now include pastoral licenses in mining districts issued under special regulations and educational-endowment leases. These items were not included in previous summaries. | ||||||||||
| II.—COMPARATIVE TABLE SHOWING NUMBER OF SELECTORS OF LAND UNDER SETTLEMENT CONDITIONS (EXCLUDING PASTORAL RUNS, MISCELLANEOUS LEASES AND LICENSES, THERMAL SPRINGS DISTRICT LEASES, AND ENDOWMENTS OTHERTHAN THE NATIONAL ENDOWMENT AND EDUCATIONAL ENDOWMENTS) DURING THE TEN YEARS ENDED 31ST MARCH, 1915. | ||||||||||
|---|---|---|---|---|---|---|---|---|---|---|
| Tenure. | 1905–6. | 1906–7. | 1907–8. | 1908–9. | 1909–10. | 1910–11. | 1911–12. | 1912–13. | 1913–14. | 1914–15. |
| No. | No. | No. | No. | No. | No. | No. | No. | No. | No. | |
| Cash lands | 268 | 462 | 407 | 382 | 381 | 274 | 409 | 352 | 312 | 288 |
| Perpetual lease | 1 | .. | .. | .. | .. | .. | .. | .. | .. | .. |
| Deferred payment | .. | .. | .. | .. | .. | .. | .. | .. | .. | 18 |
| Occupation with right of purchase | 393 | 451 | 360 | 382 | 528 | 498 | 388 | 362 | 489 | 428 |
| Lease in perpetuity | 810 | 654 | 499 | 193 | 4 | 15 | ||||
| Renewable lease | .. | .. | 183 | 860 | 694 | 612 | 628 | 585 | 539 | 325 |
| Agricultural lease | .. | .. | 3 | .. | .. | .. | .. | .. | .. | .. |
| Mining districts land-occupation leases | 30 | 26 | 73 | 36 | 60 | 73 | 55 | 36 | 61 | 29 |
| Small grazing-runs | 34 | 51 | 64 | 10 | 45 | 22 | 23 | 10 | 4 | 6 |
| Pastoral licenses in mining districts under special regulations | 94 | 79 | 57 | 83 | 71 | 106 | 192 | 121 | 145 | 114 |
| Education endowments | .. | .. | .. | .. | .. | .. | 18 | 142 | 59 | 102 |
| Totals | 1,630 | 1,723 | 1,646 | 1,946 | 1,783 | 1,600 | 1,713 | 1,608 | 1,609 | 1,310 |
| III—LANDS TAKENUP UNDER SETTLEMENT CONDITIONS DURINGTHE TEN YEARS ENDED 31ST MARCH, 1915 (EXCLUSIVE OF PASTORAL RUNS. MISCELLANEOUS LEASES AND LICENSES, THERMAL SPRINGS DISTRICT LEASES, AND ENDOWMENTS OTHERTHAN THENATIONAL ENDOWMENTAND EDUCATIONALENDOWMENTS). | ||||||||||
|---|---|---|---|---|---|---|---|---|---|---|
| Land District. | 1905–6. | 1906–7. | 1907–8. | 1908–9. | 1909–10. | 1910–11. | 1911–12. | 1912–13. | 1913–14. | 1914–15. |
| Acres. | Acres. | Acres. | Acres. | Acres. | Acres. | Acres. | Acres. | Acres. | Acres. | |
| Auckland | 106,138 | 171,148 | 125,531 | 89,184 | 92,884 | 114,224 | 164,594 | 118,500 | 91,168 | 96,372 |
| Hawke's Bay | 55,215 | 19,687 | 30,038 | 48,002 | 40,369 | 35,926 | 4,395 | 34,911 | 34,425 | 9,738 |
| Taranaki | 35,505 | 90,653 | 45,431 | 30,192 | 52,831 | 16,639 | 9,496 | 23,481 | 46,904 | 33,502 |
| Wellington | 43,062 | 64,582 | 74,646 | 25,558 | 55,329 | 23,362 | 30,305 | 11,647 | 25,278 | 36,673 |
| Nelson | 31,312 | 26,184 | 49,418 | 213,202 | 40,236 | 52,372 | 49,108 | 25,019 | 22,369 | 29,518 |
| Marlborough | 54,031 | 10,711 | 5,244 | 5,293 | 10,859 | 3,727 | 21,297 | 1,132 | 102,081 | 8,407 |
| Westland | 24,697 | 23,015 | 14,574 | 9,828 | 11,940 | 12,417 | 16,625 | 13,015 | 15,007 | 8,305 |
| Canterbury | 13,418 | 22,208 | 17,560 | 35,600 | 29,904 | 8,609 | 158,174 | 108,812 | 11,805 | 8,911 |
| Otago | 29,988 | 82,175 | 250,847 | 70,342 | 298,341 | 139,517 | 58,678 | 32,962 | 12,213 | 16,996 |
| Southland | 27,326 | 17,081 | 12,521 | 8,687 | 16,373 | 23,778 | 17,593 | 21,662 | 23,932 | 30,463 |
| Totals | 420,722 | 527,244 | 625,810 | 535,888 | 649,066 | 430,571 | 530,265 | 391,141 | 385,182 | 278,885 |
| IV.—HOLDINGS TAKENUP UNDER SETTLEMENT CONDITIONS DURINGTHE TEN YEARS ENDED 31ST MARCH, 1915 (EXCLUSIVE OF PASTORAL RUNS, MISCELLANEOUS LEASES AND LICENSES, THERMAL SPRINGS DISTRICT LEASES, AND ENDOWMENTS OTHERTHAN THE NATIONAL ENDOWMENT AND EDUCATIONAL ENDOWMENTS), CLASSIFIED ACCORDINGTO SIZE. | ||||||||||
|---|---|---|---|---|---|---|---|---|---|---|
| Size. | 1905–6. | 1906–7. | 1907–8. | 1908–9. | 1909–10. | 1910–11. | 1911–12. | 1912–13. | 1913–14. | 1914–15. |
| No. | No. | No. | No. | No. | No. | No. | No. | No. | No. | |
| Under 1 acre | 221 | 262 | 290 | 381 | 267 | 204 | 297 | 261 | 147 | 164 |
| 1 to 50 acres | 391 | 418 | 421 | 479 | 437 | 410 | 447 | 429 | 473 | 429 |
| 51 to 250 acres | 509 | 484 | 417 | 460 | 628 | 605 | 491 | 489 | 551 | 386 |
| 251 to 500 acres | 277 | 231 | 232 | 294 | 228 | 219 | 255 | 241 | 271 | 181 |
| 501 to 1,000 acres | 158 | 201 | 157 | 239 | 142 | 103 | 154 | 144 | 123 | 106 |
| 1,001 acres and upwards | 74 | 127 | 129 | 93 | 81 | 59 | 69 | 44 | 44 | 44 |
| Totals | 1,630 | 1,723 | 1,646 | 1,946 | 1,783 | 1,600 | 1,713 | 1,608 | 1,609 | 1,310 |
The Auckland Land District forms practically the northern half of the North Island, and covers an area of 13,525,540 acres. Its greatest length is about 365 miles, and greatest width about 180 miles. A great part of the district consists of flat and undulating land, and there is comparatively little mountainous country, few of the prominent peaks of ranges exceeding 3,000 ft. The large coast-line has many splendid harbours, and the Wairoa and Waikato Rivers and many of the inland lakes provide navigation for small trading craft.
Generally speaking, the district has an abundant water-supply, and is remarkably free from droughts. The average rainfall is about 39 in., and the mean summer temperature is under 70° in the shade.
There is great diversity in the nature and quality of the soils. In the north clays predominate, with large volcanic areas intervening here and there. In the southern part of the district there is a good deal of limestone country. In the south-east, especially near Lake Taupo, there are large areas of light pumice country. In parts of the district, notably at Tokatoka, on the Wairoa River, and on the Hauraki and Rangitaiki Plains, there are rich alluvial reclaimed swamp areas. Much of the soil of the district may be described as light and sandy.
The bulk of the lands of the district are in the hands of private owners who have acquired from the Crown or from Native owners. Dairying is the staple farming industry, and there are numerous creameries and cheese and butter factories in various parts of the district, while home separation is largely practised. Stock-raising and sheep-farming are also carried on to a considerable extent. Cropping is not extensively practised, but large quantities of maize, potatoes, and fruit are grown, and fruit exporting and canning promises to become a very important industry. Flax is cultivated to a considerable extent on the swamp lands. Drainage-works of great magnitude are in progress on the Hauraki Plains, where about 90,000 acres are being fitted for settlement, of which about 39,000 acres have already been reclaimed and settled. Similar works are also being carried out on the Rangitaiki Plains, in the Bay of Plenty.
An industry peculiar to the district is the kauri-gum industry, which employs several thousand men. The product is manufactured into varnish of the finest quality.
Several hundreds of persons are engaged in the fishing industry, and in canning and smoking the product for local consumption and for export.
The timber industry is also one of great importance, an area of over 3,000,000 acres of Crown and private lands being covered with virgin forest, much of it containing milling-timbers of exceedingly fine quality, including the kauri-tree, which is indigenous to the district. The State has large areas reserved for scenic purposes, and is undertaking extensive planting operations near Rotorua.
The Auckland District is noted for its output of gold, and quartz reefs are located in the Thames, Coromandel, Piako, and Ohinemuri Counties. Coal-mining is carried on at various places, notably at Hikurangi, Huntly, and Taupiri. The Huntly and Taupiri mines supply a household coal of good quality. Schools of Mines are carried on at Auckland and other places.
In many parts of the district there is excellent pheasant and quail shooting to be had in season. Trout-fishing is obtainable all over the district, and the lakes of Rotorua and Taupo, with their streams, furnish fine sport with the rainbow trout.
A notable feature of the district is the interest attached to the Thermal Springs locality, which attracts visitors from all parts of the globe.
At the present time there is available for selection in the Auckland Land District the following Crown lands:—
| Acres. | |
|---|---|
| Rural land, optional tenure | 30,000 |
| ” renewable lease | 30,000 |
| Pastoral areas in mining districts | 160,000 |
| Small grazing-runs, &c. | 10,000 |
| 230,000 |
while considerable additional areas in various parts of the district are being surveyed and prepared for settlement.
The Land District of Hawke's Bay comprises that part of the east coast of the North Island from Waimata Stream, near Cape Turnagain, to about 35 miles beyond the East Cape. It has a seaboard of 300 miles with an average depth of 45 miles, and covers an area of 5,508,900 acres. Its western limits are defined by the Ruahine, Kaweka, Ahimanawa, Huiarau, and other ranges forming an almost continuous line from the Manawatu Gorge to the East Cape.
The area of land held by tenants of the Crown, of whom there are 1,938 in the district, amounts to 1,047,818 acres, on which the annual rental is £138,459. There still remains for future disposal an area of about 137,500 acres, of which only a- small proportion is fit for agricultural purposes or suitable for subdivision into small areas. The most of this land is fit for pastoral purposes only, being mostly broken forest country, better suited for sheep than for cattle.
The following is a description of some of the principal areas of Crown land to be dealt with in the future:—
Waiapu County (4,007 acres).—Hikurangi Survey District: (1) 2,357 acres, altitude 4,000 ft. above sea-level, 300 acres of lower portion being covered with totara, the remainder with tawa and black-birch; (2) 150 acres, high birch country; (3) 457 acres, high birch country with no road access. Mata Survey District: 223 acres, undulating hilly pastoral land of medium quality. Raukumara East Survey District: 820 acres, very broken country with no road access.
Opotiki County (1,862 acres).—Motu Survey District: 330 acres, covered with milling-timber, on account of which land is at present withheld from sale. Moanui Survey District: 1,532 acres, very broken red-birch country, mixed bush, soil light, elevation 1,000 ft. to 3,000 ft.
Waikohu County (6,616 acres).—Motu and Ngatapa Survey Districts: 6,616 acres, good aspect, slopes generally easy, soil light, covered with milling-timber, on which account land is withheld from sale at present.
Opotiki, Waikohu, and Whakatane Counties (40,000 acres).—Moanui, Koranga, and Tuahu Survey Districts: 40,000 acres, part of Tahora Block, heavy bush and broken country, with red-birch on ridges.
Wairoa County (32,043 acres).—Tuahu and Waikaremoana Survey Districts: 20,412 acres, mixed bush with thick underscrub, well watered, soil inferior to fair. Waikaremoana and Waian Survey Districts: 4,756 acres, rough and undulating country, well watered, 1,500 ft. to 3,500 ft. above sea-level, soil fair to medium. Mahanga Survey District: 140 acres, mostly sandhills. Mangaharuru Survey District: 6,873 acres, part of Kaiwaka Block, undulating broken country, covered with manuka and light scrub, now open for selection in two areas.
Hawke's Bay County (42,458 acres).—Kidnappers Survey District: 300 acres, narrow strip of sandhills and sandy beach along Pohui Survey District: (1) 50 acres, the soil varies from fair river-silt to poor or sideling ground, mostly covered with manuka scrub; (2) 117 acres, steep broken country with dense underscrub, soil fair on limestone formation; (3) 160 acres, steep bush country running from banks of Makahu River to a height of 2,450 ft., soil light pumice. Pohui and Kaweka Survey Districts: 5,700 acres, Pastoral Run 11. about 700 acres bush, balance undulating broken country, soil light pumice, well watered, 2,000 ft. to 3,000 ft. above sea-level. Kaweka and Kuripapanga Survey Districts: 32,569 acres. Pastoral Runs 13 and 14, open rugged broken country. 2,500 ft. to 5,400 ft. above sea-level, soil light pumice, well watered. Patoka Survey District: (1) 1,280 acres, high forest country; (2) 1,042 acres, mostly shingle-bed, Tutaekuri River; (3) 1,240 acres, high forest country, soil light pumice resting on slate rock, elevation up to 3,000 ft. above sea-level.
Waipawa County (2,377 acres).—Takapau Survey District: Otawhao Block, 2,377 acres, subdivided into twenty-two sections, ranging in area from 76 acres to 153 acres; was originally covered with more or less heavy milling-timber, which has been cut out, and the land is now carrying native and exotic grasses; a considerable area recently swept by bush fires, which destroyed the grass, but has been resown in English grasses; to be offered for selection at an early date.
Patangata County (8,148 acres). — Porangahau, 8,148 acres, mostly in native and English grasses, undulating and broken country, and excellent sheep-country.
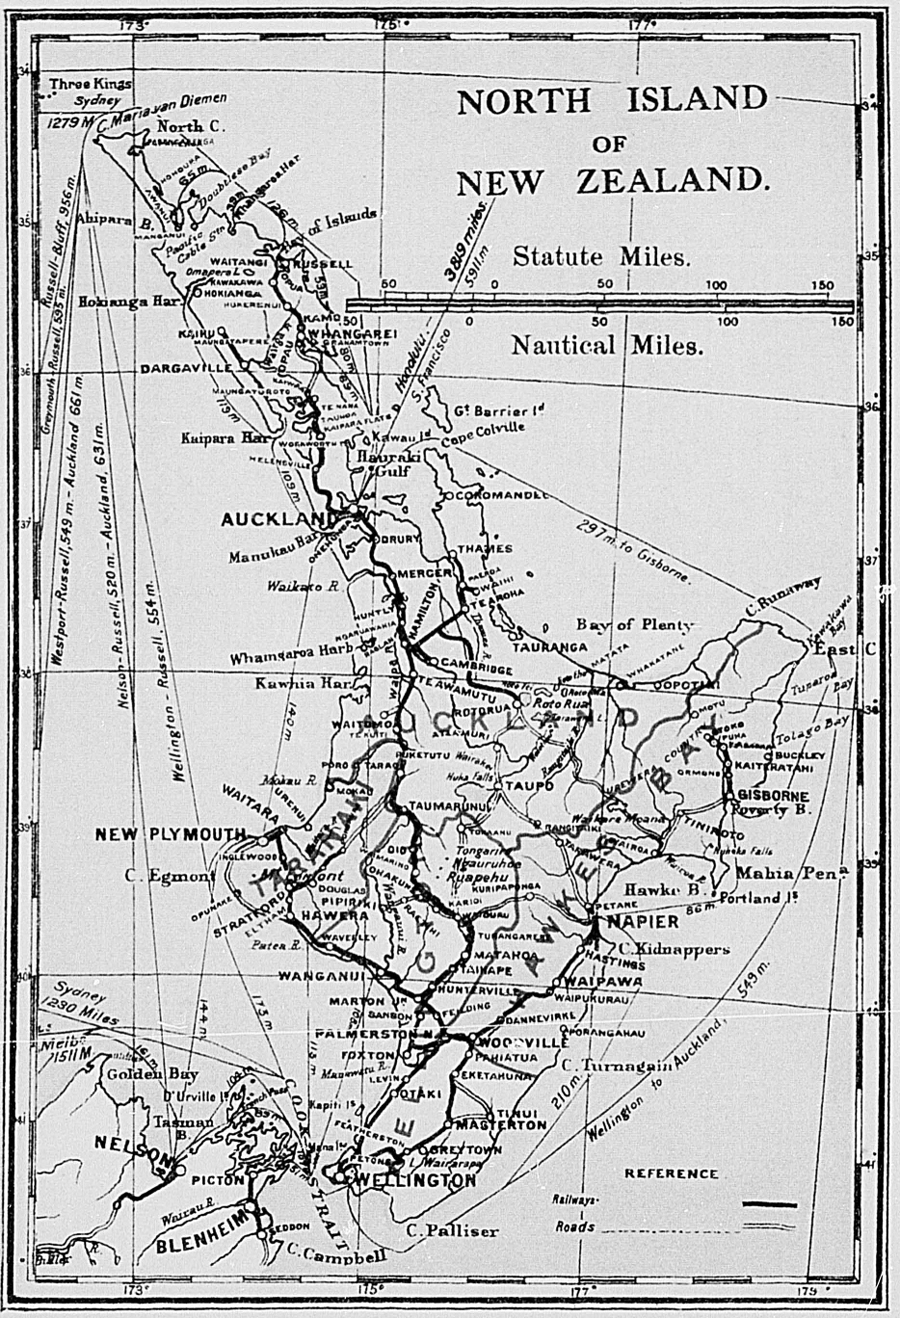
The Taranaki Land District, situated on the western side of the North Island, and covering a gross area of 2,404,500 acres, may be said to be the most fertile district of the Dominion, nearly the whole area being suitable for settlement, and quite two-thirds of it being good land. The district is well watered, numerous small streams having their source near Mount Egmont (8,260 ft.), from which they radiate in all directions to the sea. The climate generally is moist.
Nearly the whole of the district was originally covered with forest, but the greater portion of it has now been cleared, and the rich pasture lands made use of. The soil is of volcanic origin around Mount Egmont. Beyond that, from about Urenui on the north and Hawera on the south, the country varies from easy to broken hills, and the formation is papa, a calcareous blue clay, capped and intersected in many places by shelly limestone. The papa country is much richer and more lasting as pasture land than that covered by tufaceous and other volcanic soils.
In the northern end of the district the surface soil over a considerable area consists of a pumiceous loam in some parts, and in other localities rhyolite formations prevail. This is proving to be more fertile under proper treatment than was formerly anticipated, and that class of country is being rapidly brought into use. The western part of Taranaki and the flatter portions of the rest are well adapted for dairying, and support about 125 dairy factories and their creameries, &c. The rougher country is more suited for sheep-farming, and to a smaller degree for cattle-raising. The principal products of Taranaki are cheese, butter, meat, and wool.
The western part of the district is fairly well provided with good roads, but in the eastern half the roads are not so good, on account of the scarcity of metal and the liability of the country to slips in wet seasons. The construction of the Stratford – Te Koura Railway, now made for 40 miles (from Stratford to Whangamomona), will afford relief to a large area by lessening the distance to railway communication.
New Plymouth, the principal town of the district, is connected with Wellington by a railway which traverses the more settled portion of Taranaki, and is provided with a breakwater harbour. It is confidently anticipated that ocean liners will be berthed at the wharf in the near future.
A large quantity of frozen meat and wool is shipped from the river port of Waitara, about 9 miles from New Plymouth, being lightered to ocean liners anchored in the roadstead. A large quantity of dairy-produce is also shipped to Wellington by small steamers from the river port of Patea, in the southern end of the Taranaki District.
Coal is known to exist in the north part of the district near the Mokau and Tangarakau Rivers, but at present is not mined in large quantities. Boring for petroleum is being prosecuted at Moturoa, where a large refinery has been erected near the breakwater. Two bores are producing some quantity of oil.
Amongst the scenic attractions of the district is Mount Egmont (8,260 ft.), where a motor-car can be taken to a height of 3,000 ft. above sea-level. The Tangarakau Gorge and the Mokau River are places of attraction to the tourist and visitor.
The following blocks of Crown land are being or have been prepared for settlement, and will be available for selection during 1915–16:—Remainder Taurakawa Block (5,627 acres): Heavy forest, broken country, good soil on papa and sandstone. Part Whakaihuwaka Block (3,964 acres): Mixed forest, broken country, good soil on papa. Part Mohakatino Block (about 3,431 acres): Broken country, heavy forest, medium soil on papa and sandstone. Also miscellaneous sections (about 13,000 acres) in various parts of the land district. The total area for future disposal, including above lands, is about 183,000 acres.
A District Land Guide, giving particulars of all Crown lands open for selection, will he supplied gratis on application to the Commissioner of Crown Lands, New Plymouth.
The Wellington Land District comprises the southern and part of the central portion of the North Island, and contains a gross area of about 7,051,000 acres, most of which was originally covered with forest. Its greatest length from north to south is about 180 miles, and its mean width east and west about 60 miles.
The district is divided into two well-defined parts by a mountain-range which is part of the backbone of the North Island.
From the Patea River, the north-western boundary of the district, to within 30 miles of Wellington City, there is a strip of comparatively level and undulating country on the west coast, of an average width of about 15 miles, which is one of the finest parts of the Dominion, and is celebrated for its stock-raising capabilities. This tract of country is traversed by the Wellington – New Plymouth Railway, and is well served by numerous good roads. Inland of this coastal plain is broken papa country, which takes grass excellently, and, being well watered, is largely made use of for sheep-farming. This papa country extends northward to within 15 or 20 miles south of the peaks of Ruapehu, where it gives place to more level and undulating country, with soil of volcanic matter.
To the eastward of the main dividing-range is the Wairarapa Plain, bounded on the north by somewhat broken country, from where the country falls again slightly to the Upper Manawatu River, the soil in this latter portion being rich papa, though much of the Wairarapa Plain is light and stony. Generally the district is a pastoral one, though agriculture is also pursued successfully. The valley of the Hutt River, which flows into Port Nicholson, contains some very fine land, generally held in small holdings, and utilized for cropping, dairying, fruitgrowing, &c.
The sheep-farming and dairying industries are very prosperous and yearly increasing in importance. Considerable quantities of wool and frozen meat are exported.
It may be said that the Wellington Land District contains within its borders a greater quantity of good land than any other in the North Island, very little, except on the ranges and mountain-tops, being unfit for use, while some of it is of very superior quality suited for the growth of the productions of every temperate climate.
The climate is healthy and mild, the mean annual temperature being 55.1, while the mean rainfall is about 48.5 per annum. The rainfall differs, however, according to locality. Inland and near the ranges it is much greater. The top of Ruapehu Mountain is covered with perpetual snow, which lies also on the tops of Kaimanawa, Ruahine, and Tararua in the winter. Frosts are heavy in the interior.
The area of the remaining Crown lands in this district is rapidly diminishing, being now about 246,000 acres. A large portion is, however, inferior country at a high altitude, and suitable only for pastoral purposes or for climatic reservation.
New blocks, forfeited sections, &c., are placed on the market from time to time. Crown Lands Guide and sale posters, with full particulars as to areas, rents, dates of offering, &c., may be obtained from the Commissioner of Crown Lands, Wellington. Particulars may also be obtained from him of milling – timber, a large quantity of which is available for disposal.
The Land District of Marlborough, which contains 2,768,000 acres of land, occupies the north-east corner of the South Island. The district is about 120 miles in extreme length, and its greatest width is 67 miles. The climate is an excellent one, but there is considerable variation in the rainfall, which is over 65 in. per annum in the Pelorus Valley, while at Cape Campbell it is only 24 in. or 25 in.
The land may be divided into three classes—viz., open land which has been taken up for pastoral purposes; forest land, where the timber industry has developed; and intermediate land, originally partly forest and partly covered with fern or scrub, used mainly for agriculture, which, however, is also now extending into the pastoral and forest country.
The Wairau Plain, containing about 65,000 acres, is the principal block of agricultural land in the district. The soil is good and in places extremely fertile, and yields heavy crops of wheat, oats, barley, peas, and potatoes. Fruitgrowing on commercial lines is being taken up, and this year several hundred acres are being laid down in orchard, the climate being admirably adapted for apple-growing.
The area of Crown land at present available for settlement is very limited, and consists of bush country in North Marlborough. About 4,000 acres of the Upper Opouri Valley will be available for settlement as soon as the milling-timber is removed.
About 1,695,000 acres of the district are at present devoted to keeping sheep. The leaseholds in the northern parts of the district contain a large extent of scrub- and fern-covered country, now producing little or no food for sheep, but capable of improvement. On the natural pasture of the open country merino sheep are kept almost exclusively, the land carrying from half to one sheep per acre. In the forest country, on sown grass, the land keeps from two to four crossbred sheep per acre. Along the shores of the Sounds large areas of hill-land have been taken up on lease, and are now being cleared and laid down in grass expressly for keeping sheep, but generally throughout the forest country the holdings are small or of moderate size; hence this is, after the Wairau Plain, the most populous portion of the district.
The total number of stock carried is as follows: Sheep, 1,025,000; cattle, 20,000; horses, 8,500: pigs, 9,000: angora goats, 800.
The only important gold-mining is at the Golden Bar Mine, Wakamarina Valley. A little alluvial gold is obtained in several branches of the Wairau River. Scheelite has been found in payable quantities associated with the quartz in the Golden Bar Mine.
Since 1860 sawmills have been at work in various parts of the district. Havelock, on the Pelorus Sound, is at present the headquarters of the timber trade. Ten mills are now working, cutting annually about 11,000,000 ft.
The hills along the shores of the Sound will for many years furnish birch sleepers. There are other timbers left in places, but nowhere sufficient to justify the erection of a mill, unless pukatea wood, hitherto neglected, could be utilized. It is a light, tough timber, well adapted for boat-building and for packing-cases. The quantity of pine timber remaining in the Kaituna and Onamalutu Valleys is small, but there is a good supply of birch and other wood suitable for fencing and firewood. On these valleys the Wairau Plain is mainly dependent for timber.
The Pelorus Valley, with its tributaries the Wakamarina, Rai, Ronga, and Opouri Valleys, still contain about 120,000,000 ft. of convertible timbers, exclusive of the birch, of which there is a large amount of the best quality on the hills and terraces. The Wairau, Blenheim, and other districts extending southwards must depend for the future on this source for all their building material.
In the neighbourhood of Kaikoura, along the base of Mount Fyffe, and in the Hapuku Valley, there is another small block of forest-land in which three small sawmills have been erected, which cut about 300,000 ft. annually. The quantity of timber suitable for sawmill purposes in this block is very limited, but it will furnish the neighbouring country with firewood and fencing for many years.
The Nelson Land District comprises chiefly the north-western corner of the South Island, and contains an area of 4,715,000 acres. Mountain-ranges predominate, there being, however, some excellent plains and valleys between the ranges and along the rivers.
Cattle and sheep farming prevail over the greater portion of the district. There are eight butter-factories and two cheese-factories, supplied altogether by some 8,700 cows, the value of produce being about £72,000.
There are also freezing-works at Stoke, at which large numbers of sheep are annually frozen for export.
The districts fronting Tasman Bay are well adapted for fruitgrowing, an industry which is every year becoming more prosperous. There are four canning and preserving factories in this portion of the district, and, in addition to these being kept well supplied, large quantities of fruit are shipped to Wellington and South America.
Of the total area in the Nelson Land District on the 31st March, 1916, there had been sold, leased, or otherwise disposed of an area of some 1,794,000 acres, leaving an area of 2,921,000 acres, which may be classified as follows:—
| Acres. | |
|---|---|
| Lands suitable for mixed farming | 120,000 |
| Lands suitable for pastoral purposes | 1,168,000 |
| Lands mainly suitable for reservation for forest, climatic, or scenic purposes | 1,573,000 |
| Roads, lakes, and rivers, &c. | 60,000 |
The Crown lands still available for settlement may be described as chiefly pastoral and mixed-farming lands, with light to heavy bush, requiring felling, draining, and reading, as well as industry and farming skill, for their development. The blocks remaining for settlement are as follows: Howard Block, now scheduled for offering, beginning about 4 or 5 miles from the junction of the Hope River with the Buller, containing 9,500 acres; the Lamb Valley and Station Creek Blocks, about 5,800 acres, close to the Glenhope Railway-station. In the Buller Valley, between Glenhope and Murchison, is the Gowan Block of some 7,700 acres, and the Owen North Block of about 1,400 acres. There is also an extension of the Gowan Block of about 5,000 acres.
Near Charleston an area of 6,000 acres, the Waitakere Block, is under survey. In the Karamea surveys are also in progress of 5,000 acres, and near the Inangahua Junction the Orikaka Block, containing about 10,000 acres, is awaiting survey. There is also the Maruia South Block, 9,000 acres, some 39 miles distant from Murchison, and some 7,000 acres in the Glenroy Block, and near Charleston the Okari Block of about 12,000 acres.
The Westland Land District occupies the central portion of the western watershed of the South Island, joining Nelson on the north, Canterbury on the east, and Otago on the south. The mean length is 250 miles, average width 27 miles, and area 3,863,878 acres. The rainfall in Westland is very heavy, averaging about 117 in. per annum, but more sunshine is enjoyed than these figures would seem to indicate. A sunshine-recorder winch has been established at Hokitika for three years proves that the total amount of sunshine during the year compares very favourably with other districts which have only one-third of the rainfall. This is accounted for in two ways—first, that when it does rain it generally comes down very heavily; and, secondly, that a great deal of the rain falls at night, when the moisture-laden clouds drift in from the sea and come in contact with cold strata of air along the snow-clad chain of the Alps.
The district comprises for the most part hilly and undulating bush-clad country, the flat land being confined generally to the river-valleys and open swamps. An area estimated at 84,000 acres has been cleared and grassed with very satisfactory results; the draining of the swamp land has not been undertaken to any considerable extent, but with the increasing demand for land the development of this class of land is being seriously considered, and experiments are being made with a view to discovering the best means of bringing it into profitable use. The bush-clad land generally carries timber of commercial value, and is therefore not available for settlement until the bush has been cut over for sawmilling purposes. However, as there are some forty-five timber-mills in active operation, a considerable area of bush is cleared each year, and these areas are mostly taken up under the special regulations dealing with pastoral land in Westland, which leases may later on, with the consent of the Warden, be converted to the renewable lease.
On account of the moistness of the climate very little agricultural farming is at present attempted, as it is difficult to save grain crops or hay. For dairying purposes, however, a very considerable area of the land is undoubtedly well adapted, and produces rich grasses and root crops in abundance, which if supplemented with ensilage for winter feeding would produce excellent returns. The values ruling for dairy land in this district are considerably less than those demanded for similar classes of land in other parts of the Dominion. Seven butter and cheese factories have already been established, and are bringing an increasing amount of money into the district every year; other factories are in contemplation, as likewise a bacon-curing establishment.
Coal-mining is responsible for an output of some 400,000 tons yearly, which, together with an export of about 50,000,000 ft. of timber, makes Grey-mouth a very busy little port, and not only provides work for a large body of men but also a good local market for produce.
Gold-mining, which at one time was the dominant industry, has now dwindled to small proportions, though a few mines and dredges are still paying their way.
In addition to its possibilities from a pastoral and industrial view, Westland possesses a splendid asset in its scenic beauties, consisting of alternating mountain and lake, precipitous gorge and smiling valley, evergreen forest and snow-clad peak, as well as some of the most wonderful glaciers in the world, descending, as they do, through subtropical vegetation almost to the level of the sea, the whole being dominated by the mighty ramparts of Mount Cook.
Particulars of unoccupied lands are approximately as follow: Open for selection: Optional system, 227 acres; renewable lease, 40,000 acres; special regulations, 7,000 acres; pastoral runs, 400,000 acres: total, 447,227 acres. Available for future disposal: Grey County, 320,000 acres; Westland County, 180,000 acres: total, 500,000 acres.
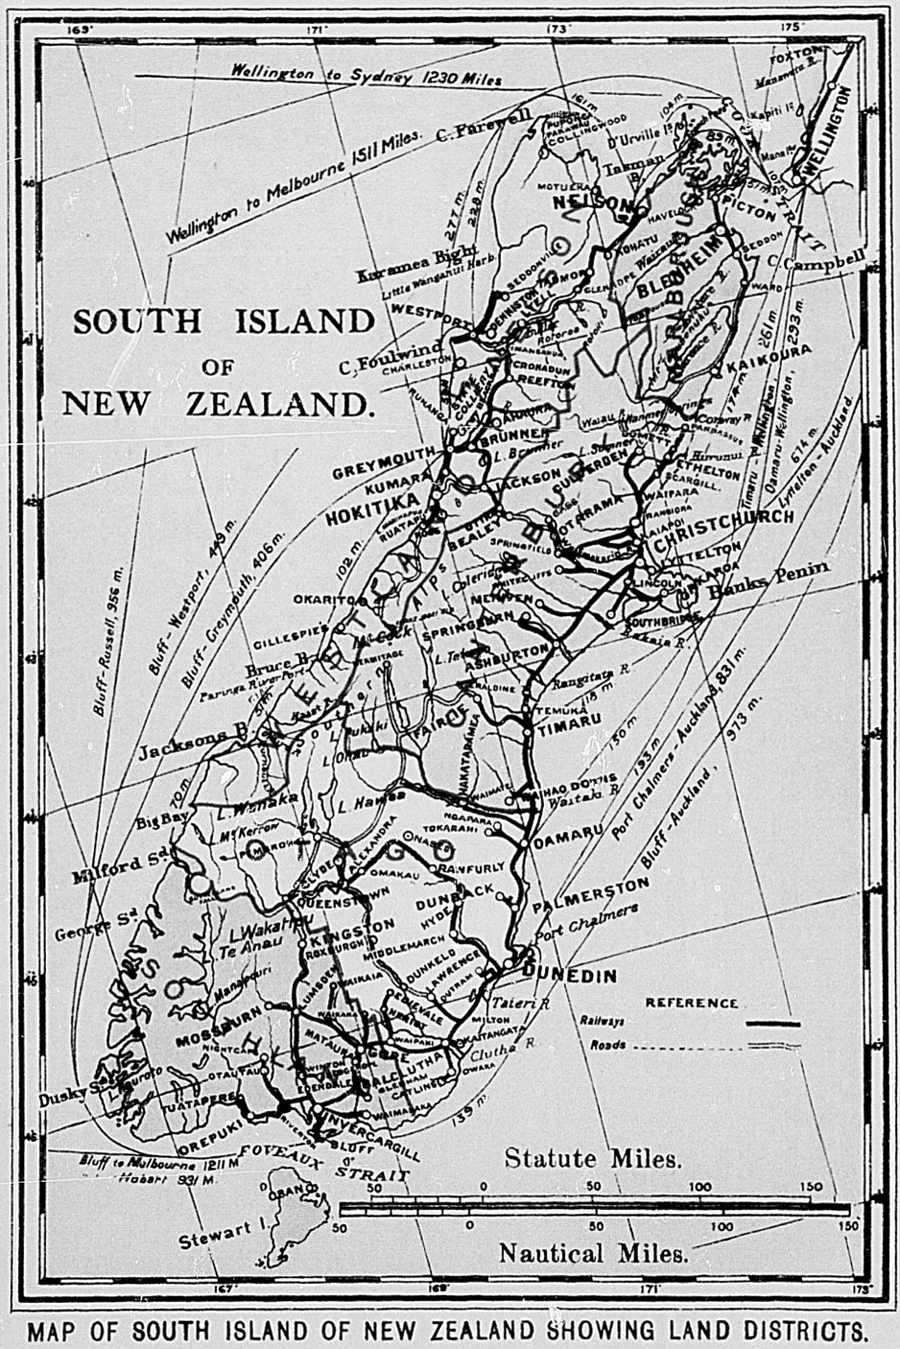
The Canterbury Land District, forming the central portion of the eastern watershed of the South Island, contains a total area of 9,533,045 acres.
The arable plains and downs, containing some 2,405,360 acres of arable land, are rich in the quality of the soil and suitable for high-class cultivation and profitable production of cereals, dairy farming, and fattening of stock, and are situate for the most part parallel with the coast line, excluding Banks Peninsula and small strips of sandy coast. These lands extend from the Conway River in the north to the Waitaki River in the south, a large portion being reclaimed swamp, having a rich loamy soil on a stiff clay subsoil, with occasional beds of peat and gravel. This strip of first-class land varies in width from 10 to 15 miles, length about 194 miles, and contains approximately one and a half million acres. Further inland the soil becomes lighter in character, with a gravelly subsoil, deposited at different periods by the action of snow-fed rivers and the alteration of their channels during their passage to the sea. This class of plain land is more subject to drought and wind storms. It extends from the Hurunui River in the north to the Orari River in the south, the distance being in length 100 miles by a width averaging 11 miles, or an area of about 640,000 acres, exclusive of waste river-beds. It is all arable, and differs in quality. Generally speaking, the soil is of too light a character for more than an occasional crop of oats or barley, but when stimulated with manures and lime will give satisfactory crops of roots, and is excellent country for rearing flocks of sheep of all breeds. All the central plain is well watered, for where the rivers are not accessible a network of water-races provides the necessary supply of water for stock during all the year. The remainder of the plain and downs improves in quality as it nears the foot of the mountains and enters the valleys for short distances. This land receives the benefit of the wash of detritus from the limestone which crops out in many places along the front hills. The loam here is deeper, and although the altitude is from 700 ft. to 1,000 ft. cereal crops can be grown to advantage. The average annual rainfall, which is 27 in. on the lower parts of the plain, increases here to 35 in., owing to the close proximity of the mountains and occasional showers from the north-west, which do not reach far from the hills.
The mountain country extends the whole length of the district, varying in width from 35 miles to 55 miles, and includes the main range of the island and its offshoots. The area of this high country, including the sub-alpine plains and valleys, is 7,102,000 acres, of which 5,146,500 acres are utilized as pastoral country, the remainder being high land unfitted for occupation, lakes, forests, and river-beds. Of the 5,146,500 acres of native-grassed lands, 3,500,000 is Crown land let to pastoral tenants, the rest being educational reserves and freeholds.
The pastoral runs, with the exception of some in the northern portion of the district on which herds of cattle are depastured, are almost exclusively devoted to grazing sheep. The climate in the high country is very variable, being subject to sudden changes of wind and temperature. The prevailing wind is from the north-west, alternating with storms from the north-east and south-west. Snow is of frequent occurrence during both summer and winter, and is permanent on the mountains above 6,000 ft. The mean annual rainfall is 60 in.
Banks Peninsula contains an area of 262,000 acres, 40,000 of which are level and ploughable slopes and 196,000 acres hills, the higher parts pastoral and the lower hills grass-seed and dairy farms. The remainder of the area consists of lakes, forests, and scenic reserves. The volcanic soil gives excellent crops of cereals, clover, grass, roots, and fruit. Cocksfoot is extensively grown for seed; dairy farming and cattle and sheep raising and fattening are all profitable to the settlers. On the coast there are two of the best harbours in the Dominion. Akaroa and Lyttelton, and numerous inlets of the sea afford opportunities for small vessels to enter and trade. Access to all the settlements can also be had by rail from Christchurch to Little River, from which terminus good roads radiate in all directions.
Access to the western high pastoral country is by branch railways from the Main Trunk line, and from all the termini there exist roads more or less good up the valleys of the chief rivers. All the plain country is well provided with access, partly by the Main Trunk Railway and partly by the branch lines, the stations (homesteads) not being more than one day's travel by farm teams. The roads are well gravelled, and the rivers bridged.
The present market prices now prevailing for the rich agricultural and dairy lands range from £25 to £60 per acre. This estimate does not include suburban land near Christchurch or other towns of size, as the price of that class is regulated by fancy and demand for building-sites, and may be any price up to £1,000 per acre.
The lighter lands of the central portion of the plain, having an altitude of 400 ft. to 1,000 ft., vary in price from £3 to £30 per acre.
The pastoral country is regulated in value on its stock-carrying capacity, its accessibility, and its safety from snow. For lands carrying only merino sheep an annual rental per head would be between 9d. and 2s., for country fit for depasturing mixed-sex flocks and crossbreds 1s. 6d. to 3s. per head, and for mixed cattle up to £1 per head.
It has been the practice of the Land Board during recent years, when the leases of the pastoral runs of large area expire, to further subdivide the runs before reoffering, provided the quality, stock-carrying capacity, contour of the country, and accessibility permit of this being done.
The lands in North Canterbury shortly to be available for settlement are 30,300 acres of pastoral country in the Upper Ashley district, to which will be added 4,954 acres of lower country recently purchased. These lands will be subdivided into suitable areas as small grazing-runs when the draining of some of the Hats has been completed.
As the present leases of several grazing-farms in the Cheviot Estate expire in 1917, it is expected that after inspection some of these may be subdivided and about three or four offered to the public.
Six educational endowments, comprising 1,342 acres, the leases of which expire, will also be submitted for public competition during the coming year, while the Kowhatu Settlement, containing 3,714 acres, will be disposed of in a short time.
On the heavy coast lands wheat yields 30 to 50 bushels per acre; oats, 45 to 90 bushels; barley, 30 to 50 bushels; rye, 35 to 50 bushels. On the lighter lands the yields are: Wheat, 15 to 20 bushels per acre; oats, 20 to 35 bushels; barley, 15 to 30 bushels; rye, 20 to 30 bushels.
On the heavy coast lands potatoes yield 6 to 12 tons per acre; mangolds, 30 to 50 tons; turnips, 15 to 25 tons.
Yields of leguminous crops on heavy land are: Beans, 30 to 45 bushel; peas, 30 to 45 bushels per acre. On the lighter lands, peas 15 to 25 bushels, and beans (which are seldom grown) 15 to 20 bushels.
The Otago Land District is situated between the Land Districts of Canterbury and Southland, and contains an area of 9,040,000 acres. Approximately 2,000,000 acres are freehold lands, and Crown tenants occupy 5,326,162 acres. Generally speaking, the most productive lands lie in a belt along the east coast. The portion immediately south of the Waitaki River carries a black loam mostly overlying a limestone foundation, eminently suited for cereals and root crops. Further south the Taieri. Tokomairiro, and Lower Clutha Plains consist of a deep soil, varying from a heavy loam on clay subsoil to alluvial deposits. The interior is more elevated and in parts mountainous, and the soil mostly decomposed schist of a light nature, so that it is naturally well adapted for sheep-grazing. In the extreme south the land originally carried a dense forest, much of which has been removed with the advent of settlement, but sawmilling operations are still carried on to some extent. In these bush districts dairying is the most profitable industry.
A great part of Otago is devoted to sheep-grazing, and as a consequence wool and frozen mutton form the chief exports. Agriculture and dairying flourish particularly in the lower-lying lands near the east coast, and in production of cheese the district is only surpassed by Taranaki. In Central Otago much progress has been made in recent years with fruit-culture, and schemes of State and private irrigation, designed to command the drier areas, are now under way, so that in the near future much larger areas will come into cultivation. Gold-mining still constitutes a feature in the production of wealth, the industry being largely confined to river-dredging in the interior.
The climate is salubrious and equable near the coast; in the interior the rainfall is more scanty, and the extremes between summer and winter temperature more pronounced.
Good agricultural or dairying land commands a high price—for the best farms as much as £50 per acre is obtainable; good farming land generally may be said to be worth from £10 to £35 per acre. Land suitable for fruitgrowing varies in price from £1 to £20 per acre. Sheep-grazing country, valued on its carrying-capacity, lets for an annual rental of 2s. to 4s. per head for ewes and crossbreds, and up to 1s. 9d. per head for merinos.
About 75,000 acres of pastoral country will be open for disposal to the public in 1917. This will probably make about nine runs, together with 1,000 acres, for closer settlement.
The Southland Land District, which occupies the extreme southern portion of the South Island, contains an area of 7,882,369 acres, of which 1,592,288 acres are held on freehold, 1,722,636 acres are leased under Crown tenures. 140,502 acres are occupied by roads, rivers, lakes, &c., 3,554,257 acres have been reserved or granted for various purposes, and the balance of 872,686 acres are unalienated Crown lands. A large portion of this latter area is, however, unsuitable for settlement.
Generally speaking; the settlers are engaged in mixed agricultural farming, dairying, and the raising of cattle, sheep, horses, &c. The progress of settlement in this district during the past decade has been of a very marked and substantial character. There was a time when the climatic conditions were looked upon as a drawback to closer and successful settlement, but during recent years a marked improvement has taken place in this respect. The climate is bracing in the winter, and warm and genial in the spring and summer. The temperature varies from 40° in winter to 70° in summer. The district is eminently suitable for the growing of various crops common to temperate climates, such as oats, wheat, barley, mangolds, rape, beet, turnips, &c. Oats frequently give 70 to 80 bushels, and wheat 40 to 60 bushels, to the acre.
The scheme initiated by the Crown for closer settlement under the Land for Settlements Act by the acquisition of private lands for subdivision has proved of immense benefit in Southland, and has been the means of settling a large number of people on the land. The success of this system has led to the subdivision of numerous large private estates representing some hundreds of thousands of acres, and the whole aspect of the district is being transformed from large stretches of virgin country into nicely cultivated and smiling farms. There is still room for a very much larger population to develop the agricultural, pastoral, and varied resources, which at present are only in their infancy.
The dairying industry is increasing in a surprising fashion, and has now developed to very important dimensions. It has proved of great benefit to all classes of settlers, more particularly those who are in occupation of bush sections, by providing them with an assured income during the process of clearing their holdings. At the present time there are sixty-five cheese-factories and four butter and condensing factories in actual operation throughout the district. Thirty of the cheese-factories have buttermaking plants for making whey butter. The intake of milk at these factories ranges from 800 to 10,000 gallons per day, the proceeds of which represent the respectable sum of £350,000 for circulation among the dairy-farmers. A sugar-of-milk factory has been established at Edendale. This factory is said to be the first of its kind in the Dominion and the second in the Empire, the only other one being in Ireland.
All classes of stock raised in this portion of the Dominion hold a high place in the estimation of stockowners both in the Commonwealth of Australia and the northern parts of New Zealand. Northern buyers are frequently purchasing numbers of Southland horses, cattle, and sheep for stud and other purposes, while large numbers of draught horses are shipped to the Commonwealth of Australia.
Sheep-breeding is very extensively carried on, and as the country is well adapted for this purpose the small farmer is enabled to buy stores at a price that pays him to fatten. Southland has long been noted for the high quality of its frozen meat, which forms an important and increasing factor in its exports. Southland has made great strides during the past few years, and it is anticipated that the output of its products will steadily increase in the future.
The Crown lands remaining comprise mostly bush-clad areas. The settlement of these lands follows the removal of the marketable timber by the sawmillers. Under ordinary circumstances from fifteen to eighteen months is the period between the axe and the first grass fit for stock. The felling costs £1 10s. to £2 per acre, logging-up 15s., and burning 5s. to 7s. 6d. Bushfelling generally commences about May, and ends about November. Burning and sowing last from the end of January to the end of April. Most of the bush land will grow good grass, which holds well by the sowing of a judicious mixture of grasses when the land is first laid down. For surface-sowing ordinary bush lands of a fairly dry and free nature the following mixture is recommended: 20 lb. cocksfoot, 10 lb. rye-grass, and 4 lb. white clover. Where the land is wet or peaty the mixture should be 11 lb. cocksfoot, 5 lb. timothy, and 10 lb. rye-grass.
Native lands and Native affairs generally are administered by the Native Department, with several subsidiary branches, the duties of each being as indicated below.
The Head Office conducts the general administration of the Department, deals with all matters to be brought before Cabinet, prepares Orders in Council, Proclamations, and parliamentary returns, and reports on petitions referred to the Government by the Native Affairs Committee of the House. The purchase of lands by the Native Land Purchase Hoard is also conducted through the Head Office.
The Native Land Court is the Court of Record of Titles, and deals, inter alia, with the partition and exchange of Native lands, succession, probate and letters of administration, consolidation of interests, incorporation of owners, and alienation.
The work of the Native Land Court is divided into seven Court districts, as follows:—
| District. | Location. |
|---|---|
| Tokerau | North Auckland. |
| Waikato-Maniapoto | South Auckland. |
| Waiariki | Bay of Plenty. |
| Tairawhiti | Gisborne. |
| Ikaroa | Wellington and Hawke's Bay. |
| Aotea | Wanganui and Taranaki. |
| South Island | South Island (office at Wellington). |
Maori Land Boards, of which there are seven, all located in the North Island, are concerned with the confirmation and approval of alienations, the administration of Native lands by way of sale or lease, and the administration of estates as farms. The Boards also act as agents for beneficial owners, and receive and pay out rents and purchase-moneys.
The Registrars of the Native Land Courts are also the administrative officers of the Maori Land Boards of the various districts.
The boundaries of the Court and Maori Land Hoard Districts are coterminous.
Maori Councils elected for defined districts and composed of Natives supervise matters generally affecting the Maori settlements and kaingas, more particularly as regards sanitary arrangements.
The terms “partition” and “individualization” as applied to Native Land Court dealings are often confused. To individualize is to partition in severalty, and not merely to define relative interests, which may be done without further partition. To partition is to cut out certain interests in a block of land, and may not necessarily be for an individual. The term “customary land,” which is also sometimes misunderstood, is applied to 'and not yet clothed with a Native Land Court title. Customary land was formerly known as papatupu land. NATIVE-LAND LEGISLATION.
Former issues of the Year-book contain information concerning the system of Maori-land tenure prior to the advent of the European, and give a short account of purchases of Native lands by the State and by private purchasers, with a summary of legislation affecting Native lands up to 1909.
All dealings with Native land are now determined by the provisions of the Native Land Act, 1909, which consolidated and repealed most of the numerous previous Acts, and came into force on the 31st March, 1910, and by the provisions of amending Acts passed in subsequent years.
The Native Land Act, 1909, repeals some seventy-one statutes or parts of statutes. The main feature of the Act is the widening of the avenue for the alienation and settlement of Native lands. Formerly the disposal of Native lands was more or less restricted, and in some cases absolutely prohibited. The Act of 1909 removes all restrictions and prohibitions on the alienation of land by a Native or on the alienation of Native land, with certain exceptions.
Under the Act the alienation of Native land may be effected in four different ways:—
Private alienation by the owners themselves.
Alienation by a Maori Land Board as the statutory trustee or agent of the owners.
Alienation by a committee of management by the incorporated owners.
Alienation in pursuance of a resolution of a majority of the owners assembled in a meeting called for that purpose by a Board.
The first of these methods is prohibited in cases where the land is owned by more than ten owners in common. Every private alienation, except a mortgage to a State Loan Department, requires confirmation by the Maori Land Board. Confirmation must be refused if the Native alienating would be left without sufficient land for his support. In the case of leases special provisions are made for securing compensation to the tenant for his improvements. Mortgages are not permitted (except in favour of a State Loan Department) unless approved by the Governor in Council.
By the second method alienation is effected by a Maori Land Board, either as a statutory trustee or as the agent of the Native owners. In respect of the former, the land is vested in the Board, and is to be disposed of by public auction or tender by way of lease or sale in equal proportions. In respect of the latter, the land is not vested in the Board, but is administered by it as agent for the owners. It may be leased by the Board to Natives only, and is inalienable by the owners themselves.
The third mode of alienation is that effected by elective committees of management of the Native owners incorporated by order of the Native-Land Court in substantial accordance with the practice existing before the coming into operation of the Act of 1909.
The fourth mode of alienation is in pursuance of a resolution of the assembled owners. A Maori Land Board may summon a meeting of the owners of any Native land to consider proposals for its alienation. A resolution proposed at any such meeting is carried if the owners voting for it own a larger area of the land affected than those who vote against it. The resolution is then submitted to the Board for confirmation, and, if confirmed, will be carried into effect either by Order in Council, instrument of alienation executed by the Board on behalf of the owners, or by such other means as is appropriate to the nature of the resolution.
Provision is made, however, both under Part XVIII of the Act of 1909 and by section 100 et seq. of the amending Act of 1913, enabling owners objecting to the resolution to file notices of dissent, and to have their interests partitioned out and reserved from the proposed alienation. Section 4 of the Native Land Amendment and Native Land Claims Adjustment Act, 1915, extends the time within which an owner may dissent from a resolution to seven clear days, and provides for the lapsing of resolutions if not confirmed within six months.
Any such meeting of assembled owners may in this manner do any of the following things:—
Yost the land in the Board for sale or lease.
Agree to incorporation by the Native Land Court.
Carry into effect any proposed alienation—e.g., a sale or lease to a particular individual.
Sell the land to the Crown.
To prevent the aggregation of large areas of Native lands a purchaser or lessee of Native land must make a declaration that the land applied for, together with all other land already held by him, does not exceed 5,000 acres of third-class land calculated as follows: First-class land as 7½ acres, and second-class land as 2½ acres, of third-class land. The class to which any lands belong shall be determined in accordance with the Act. Important amendments were introduced by the Native Land Amendment Act, 1913.
The Crown has power under Part XIX of the Act to acquire Native lands through the Native Land Purchase Board, which consists of the Native Minister, the Under-Secretary of Lands, the Under-Secretary of the Native Department, and the Valuer-General.
Any area, negotiations for which are in progress or in contemplation for purchase by the Crown, may, under section 363 of the Act, be prohibited from private alienation for the period of one year (subject to an extension of twelve months).
All offers to the Crown should be addressed to the Native Land Purchase Board, Native Department, Wellington.
All surveys are undertaken by the Lands and Survey Department, under authorities issued by the Judge of the Native Land Court or President of the Maori Land Board, and funds are provided (if necessary) as under:—
For the purpose of the purchase and settlement of Native land by the Crown the Minister of Finance is empowered to raise loans not to exceed in all £500,000 in any one financial year, and if the full amount authorized is not raised within the year the balance may be borrowed within the next year, in addition to the amount otherwise authorized for that year. The moneys so obtained may, under the Native Land Settlement Account, be applied to the following uses:—
The purchase or acquisition of Native land.
The survey of Native land.
The making of advances to Maori Land Boards for the construction of roads and bridges and otherwise opening up and preparing for settlement any Native lands under the control of the Boards, or for the purpose of discharging any mortgage or charge to which such land is subject.
The advances to any one Board are limited to £50,000 in any one financial year, and are to be a charge on the land for the benefit of which the expenditure was incurred.
The revenue derived from lands vested in a Maori Land Board, together with interest and payments received, is to be applied in the first place to the payment of interest and sinking fund on the advances, together with administrative and other necessary expenses; the balance to be paid to the Native owners, or invested for their benefit, as the Board decides.
Rules of the Native Land Court and Regulations relating to Maori Land Boards are notified on page 3243 et seq. of the New Zealand Gazette for the 27th August, 1914.
As to alienation of the lands in the South Island, these are dealt with by the South Island District Maori Land Board, and any communication in connection therewith should he made to the Registrar, Native Land Court, South Island District, Wellington.
A Native owning Native land in severalty may, upon application, have his land declared European land by the Native Appellate Court if that body thinks fit.
The Native Land Amendment Act, 1912, provides, inter alia, that any Native may apply to be declared a European for the purpose of the Act.
The Native Land Amendment Act, 1913, provides chiefly for amendments in administrative control, and for power for the Crown to acquire any Native land, no matter how held, except as provided for.
No Native land can be willed to a European other than the wife or husband of the testator, certain other exceptions being also provided for.
The Native Land Amendment Act, 1914, makes some amendments in the Act of 1913, and also contains provisions dealing with land set apart for landless Natives in the South Island.
The Native Land Amendment and Native Land Claims Adjustment Act, 1915, contains a few machinery clauses for the more effective working of Acts already in force, and provision is made to enable Natives to make contributions of lands or rents in aid of patriotic funds.
The Native Townships Act, 1910, makes better provision with respect to the ownership and disposition of land subject thereto. Under this Act land situated in a Native township may be sold to the Crown or to private persons. It is provided that the Maori Land Board administering a Native township shall be a leasing authority within the meaning of the Public Bodies' Leasing-powers Act, 1908, and may grant what are known as "Glasgow leases.” vide section 4 of the last-named Act. The provisions of the Native Land Act, 1909, apply, with certain exceptions, to a Native township. This Act repeals seven statutes or parts of statutes.
The Rating Amendment Act. 1910, provides, with certain modifications, that Native freehold land shall be liable to rating and subject to the provisions of the Rating Act, 1908, in the same manner as European land. Customary land (land, title to which has not been investigated and determined) is exempt from rating. The Rating Amendment Act. 1913, contains important amendments.
The Thermal Springs Districts Act, 1910, repeals the Act (similar title) of 1908, and thereby releases from restriction some 300,000 acres of Native land. This large area of land may now be dealt with under the provisions of the Native Land Act. 1909, subject to certain restrictions with respect to lands having thermal or mineral waters thereon.
Under the Death Duties Act, 1909, a Native succession duty at the rate of 2 per centum of the value of the property included in a succession order is imposed where such value is £200 or over. No death duty is payable in respect of property included in a succession order.
Commencing with the main Act of 1909, the legislation affecting Native lands all tends towards betterment of titles and the disposition and settlement of unoccupied lands.
Prior to 1870 conveyancing in New Zealand was based upon the English laws of real property as existing at the date of the constitution of the colony, varied in some important particulars by the Conveyancing Ordinance of 1842 and other colonial legislation, now embodied in the Property Law Act, 1908. Considerable areas of land in all parts of the Dominion are still held and dealt with under this system. Although provision is made for the registration of deeds affecting such land, registration is no guarantee of their validity, and a purchaser has to rely for the security of his title upon the skill and care of his legal adviser.
By the Land Transfer Act, 1870, the system of title by registration was introduced. This principle had long been in vogue in parts of central Europe, but was unknown in the British dominions until its introduction into the Australasian Colonies in 1856 by Sir Robert Torrens, after whom it is popularly known as the Torrens system. It was first introduced by him into South Australia, and was afterwards adopted by the other colonies. The title to land under this system is not affected by the execution of documents. Registration is the fundamental principle, and it is only on registration that any interest passes. The Land Transfer Department assumes all responsibility for the registration, and any person named in the register as taking an interest under a registered instrument acquires a practically indefeasible title.
Provision has existed since 1841 and is now contained in the Deeds Registration Act, 1908, for the registration of deeds and instruments affecting land which is not subject to the provisions of the Land Transfer Act. Registration is not essential to the validity of the instrument, but it is highly important as a record and to secure priority. The Act provides that every deed shall be void as against any person claiming for valuable consideration under any subsequent deed duly registered unless the earlier deed was registered before the subsequent one.
The Department is not responsible for the form or matter of the instruments registered beyond seeing that they are duly stamped and contain a sufficient description of the land to identify it.
Instruments are registered by being first entered in the “Book of Primary Entry,” from which the registration number is taken. Particulars are then inserted in the “Index Book” under the heading of the land affected, and they are then copied in extenso into the “Record Books.”
Provision is also made for the deposit of instruments in the Deeds Registry Office for safe custody and reference, and such deposit operates as a release from any covenant for production.
The Deeds Index and all recorded and deposited instruments are open to public inspection, and certified copies may be obtained on payment of the prescribed fees, which are given in full in the Year-book for 1914.
A table is given containing information concerning the registration of deeds during the year ended 31st March, 1915.
| DEEDS REGISTRATION, 1914–15. | |||||
|---|---|---|---|---|---|
| District. | Deeds | ||||
| Unrecorded on 31st March, 1914. | Received for Registration during the Year ended 31st March, 1915. | Registered during the same Period. | Unrecorded on 31st March, 1915. | Fees. | |
* Includes Crown-grant fees, £159; and district-agency fees, £2. | |||||
| Number. | Number. | Number. | Number. | £ | |
| Auckland | 229 | 6,776 | 6,835 | 170 | 6,593 |
| Taranaki | 20 | 669 | 684 | 5 | 651 |
| Wellington | 104 | 1,736 | 1,665 | 175 | 1,700 |
| Hawke's Bay | 124 | 1,373 | 1,307 | 190 | 1,500 |
| Poverty Bay | .. | 52 | 50 | 2 | 48 |
| Nelson | 58 | 802 | 840 | 20 | 734 |
| Marlborough | 14 | 421 | 393 | 42 | 474 |
| Canterbury | 274 | 1,170 | 1,393 | 51 | 1,111 |
| Otago | 149 | 1,909 | 2,005 | 53 | 1,825 |
| Southland | 7 | 481 | 480 | 8 | 446 |
| Westland | .. | 64 | 64 | .. | 51 |
| Totals | 979 | 15,453 | 15,716 | 716 | 15,133* |
The land-transfer system in New Zealand originated, as stated above, with the Land Transfer Act, 1870. This was re-enacted with amendments as the Land Transfer Act, 1885, and this again gave place to the consolidated Land Transfer Act, 1908. Some amendments were effected by the Land Transfer Amendment Act, 1913, and the Act as amended has been re-enacted under the Statutes Compilation Act as the Land Transfer Act, 1915.
The land subject to the Land Transfer Act comprises all land alienated from the Crown since 1870, all land included in any order under the Native Land Acts vesting such land in any person in freehold tenure, and all land vested in any person in fee-simple by virtue of any Act of the General Assembly, besides land which has been brought under the Act on the application of the proprietors after investigation and acceptance of the title by the Department.
Full information concerning the land-transfer system is given in previous issues of this book, together with the scale of fees payable under the Land Transfer Act.
The first of the tables which follow shows for the year 1914–15 the applications to bring land under the Land Transfer Act.
| APPLICATIONS UNDER LAND TRANSFER ACT, 1914–15. | ||||
|---|---|---|---|---|
| District. | Applications. | |||
| Number. | Area. | |||
| Town and Suburban. | Country. | Value. | ||
| Acres. | Acres. | £ | ||
| Auckland | 192 | 94 | 28,367 | 450,390 |
| Taranaki | 10 | 3 | 279 | 9,175 |
| Wellington | 48 | 20 | 5,213 | 111,560 |
| Hawke's Bay | 16 | 10 | 489 | 61,897 |
| Poverty Bay | 2 | .. | 66 | 1,885 |
| Nelson | 9 | 1 | 335 | 9,320 |
| Marlborough | 15 | 8 | 34,919 | 182,075 |
| Canterbury | 139 | 17 | 22,412 | 339,750 |
| Otago | 35 | 4 | 883 | 57,352 |
| Southland | 12 | 2 | 12,217 | 24,501 |
| Westland | .. | .. | .. | .. |
| Totals | 478 | 159 | 105,180 | 1,247,905 |
Similar information to that given in the above table is also given for each of the past ten years.
| APPLICATIONS UNDER LAND TRANSFER ACT, 1905–6 TO 1914–15. | ||||
|---|---|---|---|---|
| Year ended 31st March. | Applications. | Value. | ||
| Number. | Area. | |||
| Town and Suburban. | Country. | |||
| Acres. | Acres. | |||
| 1906 | 657 | 379 | 161,872 | 1,405,766 |
| 1907 | 690 | 308 | 7,719 | 1,200,942 |
| 1908 | 797 | 389 | 124,028 | 1,693,271 |
| 1909 | 617 | 526 | 9,157 | 1,061,537 |
| 1910 | 565 | 376 | 64,697 | 821,306 |
| 1911 | 705 | 324 | 73,054 | 29,990 |
| 1912 | 571 | 330 | 65,028 | 078,124 |
| 1913 | 658 | 398 | 108,945 | 1,561,589 |
| 1914 | 563 | 156 | 123,712 | 1,361,042 |
| 1915 | 78 | 159 | 105,180 | 1,247,905 |
The following table shows the number of certificates issued for the past ten years. Included in the totals are those certificates issued in lieu of Crown grant, 1,996 being the number for 1914–15.
| CERTIFICATES ISSUED, 1905–6 TO 1914–15 | |
|---|---|
| Year ended 31st March. | Number. |
| 1906 | 9,472 |
| 1907 | 10,137 |
| 1908 | 11,208 |
| 1909 | 10,570 |
| 1910 | 9,525 |
| 1911 | 11,645 |
| 1912 | 12,907 |
| 1913 | 13,075 |
| 1914 | 12,867 |
| 1915 | 11,074 |
Tables next follow showing transfers registered under the Land Transfer Act in each district during the year ended 31st March last, and in the whole Dominion for each of the past ten years.
| TRANSFERS REGISTERED. 1914–15. | ||||
|---|---|---|---|---|
| District. | Number. | Area. | Consideration money. | |
| Town and Suburban. | Country. | |||
| Acres. | Acres. | £ | ||
| Auckland | 6,376 | 2,012 | 603,851 | 4,763,461 |
| Taranaki | 1,324 | 366 | 140,952 | 1,144,724 |
| Wellington | 4,191 | 1,488 | 420,670 | 4,012,050 |
| Hawke's Bay | 1,221 | 565 | 159,646 | 1,412,605 |
| Poverty Bay | 592 | 138 | 118,301 | 566,231 |
| Nelson | 440 | 78 | 58,186 | 224,959 |
| Marlborough | 316 | 108 | 187,867 | 507,601 |
| Canterbury | 3,804 | 596 | 211,485 | 2,934,822 |
| Otago | 1,792 | 401 | 116,253 | 908,871 |
| Southland | 1,198 | 430 | 105,475 | 705,442 |
| Westland | 127 | 24 | 7,287 | 25,482 |
| Totals | 21,381 | 6,206 | 2,129,973 | 17,206,248 |
| TRANSFERS REGISTERED, 1905–6 TO 1914–15. | ||||
|---|---|---|---|---|
| Year ended 31st March. | Number. | Area. | Consideration-money. | |
| Town and Suburban. | Country. | |||
| Acres. | Acres. | £ | ||
| 1906 | 17,045 | 6,340 | 2,056,485 | 11,102,481 |
| 1907 | 18,388 | 6,683 | 2,709,539 | 13,695,013 |
| 1908 | 21,791 | 6,678 | 2,939,491 | 17,226,142 |
| 1909 | 19,096 | 6,000 | 1,925,218 | 12,209,843 |
| 1910 | 17,277 | 5,623 | 1,457,395 | 9,820,261 |
| 1911 | 22,157 | 7,394 | 1,958,709 | 14,285,759 |
| 1912 | 24,297 | 7,298 | 2,391,004 | 17,405,278 |
| 1913 | 24,495 | 7,471 | 2,516,821 | 17,325,730 |
| 1914 | 23,983 | 7,333 | 2,206,268 | 16,307,637 |
| 1915 | 21,381 | 6,206 | 2,129,973 | 17,206,248 |
One of the most notable differences between the present system of and-transfer and the former is in the form of a mortgage. Under the old system the mortgagor conveyed the land to the mortgagee subject to a right to a reconveyance or “equity of redemption” on repayment of the money. Under the Act no transfer of the property takes place, but a charge only is created, the mortgagee being specially empowered to sell the land in the event of default being made in payment. A simple receipt by the mortgagee for the amount secured releases the land from the encumbrance. Provision is made, similar to that contained in the Property Law Act, for sale through the Registrar of the Supreme Court in the event of the mortgagee desiring to buy in the mortgaged land.
During the year ended 31st March, 1915, mortgages to the number of 21,795, and representing an amount of £16,378,727, were registered under the Land Transfer Act. The figures for each land registration district were as follows:—
| MORTGAGES REGISTEREDUNDER LAND TRANSFER Act, 1914–15. | ||||
|---|---|---|---|---|
| District. | Number. | Area. | ||
| Town and Suburban. | Country. | Amount secured. | ||
| Acres. | Acres. | £ | ||
| Auckland | 6,342 | 1,595 | 903,567 | 3,662,870 |
| Taranaki | 1,707 | 268 | 347,256 | 1,290,319 |
| Wellington | 4,206 | 1,293 | 715,695 | 3,907,015 |
| Hawke's Bay | 1,252 | 485 | 262,859 | 1,383,919 |
| Poverty Bay | 812 | 234 | 351,717 | 852,640 |
| Nelson | 526 | 87 | 125,280 | 256,610 |
| Marlborough | 278 | 94 | 170,104 | 341,262 |
| Canterbury | 3,483 | 527 | 665,366 | 2,950,576 |
| Otago | 1,679 | 369 | 239,205 | 796,458 |
| Southland | 1,396 | 409 | 242,215 | 890,923 |
| Westland | 114 | 32 | 13,200 | 46,135 |
| Totals | 21,795 | 5,393 | 4,036,464 | 16,378,727 |
A table showing similar information for each of the past ten years is also given. Both in number and in amount the totals for 1914–15 are lower than those for any of the four years immediately preceding.
| MORTGAGES REGISTEREDUNDER LAND TRANSFER ACT, 1905–6 TO 1914–15. | ||||
|---|---|---|---|---|
| Year ended 31st March. | Number. | Area. | ||
| Town and Suburban. | Country. | Amount secured. | ||
| Acres. | Acres. | £ | ||
| 1806 | 15,746 | 4,760 | 2,903,882 | 10,944,149 |
| 1907 | 17,105 | 5,713 | 3,650,562 | 12,708,772 |
| 1908 | 19,795 | 5,352 | 5,090,682 | 15,637,486 |
| 1909 | 20,715 | 5,904 | 4,174,036 | 14,650,466 |
| 1910 | 19,955 | 5,379 | 3,734,962 | 13,611,123 |
| 1911 | 23,397 | 6,069 | 4,485,402 | 16,896,484 |
| 1912 | 25,127 | 8,033 | 4,784,883 | 19,128,732 |
| 1913 | 23,883 | 10,965 | 5,549,385 | 18,643,708 |
| 1914 | 23,988 | 5,642 | 4,862,163 | 18,080,701 |
| 1915 | 21,795 | 5,393 | 4,036,464 | 16,378,727 |
In regard to mortgages under the Land Transfer Act, a table is added showing the total amount remaining secured by such mortgages on the 31st March, 1915.
| LAND TRANSFER ACT.—MORTGAGES REMAININGON 31ST MARCH, 1915. | |
|---|---|
| District. | Amount. |
| £ | |
| Auckland | 18,188,239 |
| Taranaki | 9,071,855 |
| Wellington | 29,386,131 |
| Hawke's Bay | 11,470,075 |
| Poverty Bay | 3,682,285 |
| Nelson | 2,052,367 |
| Marlborough | 1,772,563 |
| Canterbury | 22,465,812 |
| Otago | 6,701,588 |
| Southland | 7,559,027 |
| Westland | 402,239 |
| Total | 112,752,181 |
The total, £112,752,181, represents a net increase of £7,060,160 during the year, the amount of mortgages paid off since 1st April, 1914, being £9,318,568 as against mortgages registered amounting to £16,378,727, shown above.
In addition to the mortgages under the Land Transfer Act, a considerable number are registered under the Deeds Registration Act. During the year ended the 31st March, 1915, the total mortgages registered were 26,559, representing £19,382,213, so that the registrations of mortgages under the Deeds Registration Act numbered 4,764, for an amount of £3,003,486.
The total amount represented by the mortgages on the register under the Land Transfer and Deeds Registration Acts on the 1st April, 1914, was £106,442,297. Those added during the year were for an amount of £19,382,213, and those discharged (17,363 in number), for £11,276,289, leaving the total at the 31st March, 1915, at £114,548,221, a net increase of £8,105,924 during the year.
It should be explained that the amounts quoted in respect of mortgages do not represent the true amounts of advances secured by deed. In cases where the property mortgaged is situated in more than one registration district the deed is registered for the full amount in each district, and thus there is some degree of duplication. On the other hand, mortgages are not all registered, those given in security for temporary loans, stock, and crop hens, bills of sale, and chattels transfers being not included in the figures.
The total amounts represented in the mortgages registered and paid off in each registration district during 1913–14 and 1914–15 were,—
| District. | 1913–14. | 1914–15. | ||
|---|---|---|---|---|
| Mortgages registered. | Mortgages discharged. | Mortgages registered. | Mortgages discharged. | |
| £ | £ | £ | £ | |
| Auckland | 4,791,065 | 2,316,173 | 4,887,517 | 2,158,814 |
| Poverty Bay | 748,103 | 418,558 | 857,321 | 539,217 |
| Hawke's Bay | 2,237,495 | 1,075,170 | 1,861,752 | 892,775 |
| Taranaki | 1,430,832 | 826,238 | 1,388,539 | 817,416 |
| Wellington | 4,994,921 | 3,377,455 | 4,358,211 | 2,801,391 |
| Nelson | 415,058 | 211,412 | 426,172 | 235,472 |
| Marlborough | 473,547 | 163,142 | 396,738 | 207,595 |
| Canterbury | 3,549,520 | 2,675,376 | 3,201,438 | 2,335,921 |
| Otago | 1,481,308 | 946,939 | 983,256 | 705,134 |
| Southland | 1,167,814 | 696,225 | 963,939 | 554,390 |
| Westland | 63,032 | 20,085 | 57,330 | 28,164 |
| Totals | 21,352,695 | 12,726,773 | 19,382,213 | 11,276,289 |
A comparison of the monthly totals of mortgages registered for the years ended the 31st March, 1914 and 1915, shows that the falling-off in the later year was not entirely due to the war, though six of the last seven months of 1914–15 show lower totals than the corresponding months of 1913–14.
| MORTGAGES REGISTEREDEACH MONTH, 1913–14 AND 1914–15. | ||||
|---|---|---|---|---|
| Month. | Number. | Amount. | ||
| 1913–14. | 1914–15. | 1913–14. | 1914–15. | |
| £ | £ | |||
| April | 2,559 | 2,136 | 1,977,836 | 1,553,949 |
| May | 2,653 | 2,593 | 2,214,750 | 1,808,883 |
| June | 2,481 | 2,566 | 2,005,115 | 1,907,502 |
| July | 2,720 | 3,243 | 2,225,066 | 2,529,341 |
| August | 2,454 | 2,861 | 1,737,046 | 1,972,251 |
| September | 2,596 | 2,425 | 1,819,076 | 1,675,769 |
| October | 2,732 | 2,230 | 1,776,650 | 1,460,698 |
| November | 2,336 | 1,777 | 1,666,098 | 1,266,972 |
| December | 2,357 | 1,782 | 1,597,447 | 1,093,713 |
| January | 1,494 | 1,129 | 925,143 | 807,275 |
| February | 2,055 | 1,683 | 1,352,995 | 1,444,125 |
| March | 2,482 | 2,134 | 2,055,473 | 1,861,735 |
| Totals | 28,919 | 26,559 | 21,352,695 | 19,382,213 |
Classified according to the various rates of interest, the amounts in the mortgage-deeds registered during 1913–14 and 1914–15 were,—
| Rate per Cent. | 1913–14. | 1914–15. |
|---|---|---|
| £ | £ | |
| 0 | 22,431 | 2,525 |
| ½ | 300 | .. |
| 1 | 1,350 | .. |
| 1 4/5 | 125 | .. |
| 2 | 615 | 970 |
| 21/8 | 2,764 | .. |
| 2½ | 1,700 | 2,321 |
| 2¾ | 1,468 | .. |
| 2 7/8; | 700 | .. |
| 3 | 8,389 | 11,842 |
| 31/8 | 1,175 | .. |
| 3 3/8; | 1,000 | .. |
| 3½ | 20,266 | 3,547 |
| 3¾ | 2,087 | 100 |
| 4 | 78,053 | 101,586 |
| 4¼ | 132 | .. |
| 4½ | 325,487 | 112,043 |
| 4¾ | 8,339 | 37,884 |
| 5 | 4,792,360 | 4,684,226 |
| 5 1/8 | 800 | 300 |
| 5¼ | 349,805 | 148,736 |
| 5 ⅓ | 62,600 | 1,694 |
| 5 7/20; | .. | 2,230 |
| 5 3/8 | 100 | .. |
| 5½ | 3,968,897 | 5,079,760 |
| 53/5 | 4,105 | .. |
| 5 5/8 | 3,600 | 15,386 |
| 5¾ | 176,044 | 98,458 |
| 6 | 6,317,723 | 4,633,633 |
| 6 1/10 | 160 | .. |
| 6¼ | 42,540 | 35,807 |
| 6⅓ | 4,485 | 2,200 |
| 6½ | 801,919 | 768,415 |
| 63/5 | .. | 8,765 |
| 6 2/3 | .. | 9,300 |
| 6¾ | 2,380 | 14,200 |
| 7 | 1,128,676 | 855,186 |
| 7 1/8 | 800 | .. |
| 7¼ | 3,632 | 1,600 |
| 7⅓ | 4,500 | .. |
| 7½ | 199,653 | 126,595 |
| 7¾ | 750 | .. |
| 8 | 814,164 | 599,603 |
| 8¼ | 350 | .. |
| 8½ | 32,560 | 12,151 |
| 9 | 64,279 | 55,667 |
| 9⅓ | 400 | .. |
| 9½ | 1,800 | 390 |
| 10 | 181,868 | 209,271 |
| 11 | 192 | .. |
| 12 | 3,687 | 740 |
| 12½ | 2,185 | 635 |
| 15 | 1,325 | 5,173 |
| 15¾ | 2,500 | .. |
| 20 | 150 | 3,945 |
| Unspecified | 1,905,325 | 1,735,329 |
| Totals | 21,352,695 | 19,382,213 |
Comparison of the foregoing with the amounts at the various rates of interest in the mortgages registered during 1895–96 show's the lowering of the rates that has taken place:—
| Year 1895–96. | |
|---|---|
| £ | |
| 26,285 | in small sums at less than 5 per cent. |
| 833,226 | at from 5 per cent. to 5¼ per cent. |
| 732,764 | at 5½ per cent. |
| 116,600 | at 5¾ per cent. |
| 1,372,261 | at from 6 per cent. to 6¼ per cent. |
| 371,896 | at from 6½ per cent. to 6¾ per cent. |
| 599,542 | at from 7 per cent. to 7¼ per cent. |
| 111,651 | at 7½ per cent. |
| 382,348 | at 8 per cent. |
| 173,416 | in small sums at rates above 8 per cent. |
| 853,801 | at rates not specified. |
| £5,573,790 |
The area of land in occupation in 1911, omitting holdings of less than 1 acre in extent, was returned at 40,238,126 acres, or 2,033,777 acres in excess of the area for the year 1908–9. The number of holdings was 75,152 in 1908–9 and 73,876 in 1911. No statistics were collected in 1909–10, nor has any collection been made since 1911.
The number of holdings returned at each of the past five collections is shown below, classified according to area:—
| OCCUPIED LANDS.—HOLDINGS. | |||||
|---|---|---|---|---|---|
| Area, in Acres. | 1905–6. | 1906–7. | 1907–8. | 1908–9. | 1911. |
| 1 to 10 inclusive | 19,787 | 20,455 | 21,186 | 21,927 | 18,075 |
| 11 “ 50 “ | 11,745 | 12,012 | 12,147 | 12,360 | 12,151 |
| 51 “ 100 “ | 7,562 | 7,767 | 7,760 | 7,780 | 7,948 |
| 101 “ 200 “ | 9,950 | 10,251 | 10,098 | 10,206 | 10,746 |
| 201 “ 320 “ | 6,531 | 6,820 | 6,827 | 6,831 | 7,083 |
| 321 “ 640 “ | 7,219 | 7,497 | 7,602 | 7,828 | 8,466 |
| 641 “ 1,000 “ | 2,750 | 2,936 | 3,011 | 3,202 | 3,611 |
| 1,001 “ 5,000 “ | 3,497 | 3,682 | 3,816 | 4,090 | 4,780 |
| 5,001 “ 10,000 “ | 408 | 415 | 436 | 458 | 526 |
| 10,001 “ 20,000 “ | 237 | 248 | 247 | 235 | 264 |
| 20,001 “ 50,000 “ | 166 | 167 | 153 | 151 | 136 |
| Over 50,000 acres | 90 | 88 | 84 | 84 | 90 |
| Totals | 69,942 | 72,338 | 73,367 | 75,152 | 73,876 |
The holdings shown include Crown lands leased for pastoral purposes, amounting in 1911 to 1,137 holdings, of a total area of 11,001,333 acres.
Holdings of from 1 to 10 acre; in extent appear to have decreased in number between 1908–9 and 1911 by 3,852. It is, however, almost certain that many small holdings of 1 or 2 acres, probably without dwellings, were omitted from the latter collection, which was made in conjunction with the census of 1911. There is also to be remembered the fact that many holdings of 5 or 10 acres near population centres are cut up into building-sites, which, being almost invariably less than 1 acre in extent, are not included in subsequent collections.
Of a total of 73,876 holdings in 1910–11, 38,174, or 51.67 per cent., were from 1 to 100 acres in extent; 48,920, or 66.22 per cent., were from 1 to 200 acres; and 56,003, or 75.81 per cent., were from 1 to 320 acres in size. The total number over 220 acres was only 17,873, or 24.19 per cent. of the whole, thus indicating a considerable degree of moderately close settlement, although the area of the holdings over the 320-acres limit necessarily shows as very large in a table which includes the Crown pastoral leases.
The acreage of occupied holdings, including Crown pastoral leases, at each of the past five collections is shown in the next table, classified according to holdings of various areas.
| OCCUPIED LANDS: ACREAGES. | |||||
|---|---|---|---|---|---|
| Sizes of Holdings, in Acres. | 1905–6. | 1906–7. | 1907–8. | 1908–9. | 1910–11. |
| Acres. | Acres. | Acres. | Acres. | Acres. | |
| 1 to 10 inclusive | 79,926 | 81,339 | 86,870 | 88,749 | 81,397 |
| 11 “ 50 “ | 324,375 | 328,657 | 340,498 | 346,453 | 335,056 |
| 51 “ 100 “ | 591,209 | 599,236 | 604,567 | 611,622 | 618,980 |
| 101 “ 200 “ | 1,514,084 | 1,544,242 | 1,533,048 | 1,544,963 | 1,628,608 |
| 201 “ 320 “ | 1,692,824 | 1,742,123 | 1,764,903 | 1,769,875 | 1,818,087 |
| 321 “ 640 “ | 3,306,475 | 3,390,762 | 3,491,728 | 3,582,822 | 3,872,809 |
| 641 “ 1,000 “ | 2,220,149 | 2,354,891 | 2,425,028 | 2,618,008 | 2,931,721 |
| 1,001 “ 5,000 “ | 6,955,310 | 7,212,587 | 7,677,624 | 8,088,931 | 9,388,126 |
| 5,001 “ 10,000 “ | 2,874,562 | 2,822,030 | 2,994,820 | 3,193,571 | 3,525,514 |
| 10,001 “ 20,000 “ | 3,278,498 | 3,536,334 | 3,365,132 | 3,234,480 | 3,751,346 |
| 20,001 “ 50,000 “ | 5,273,472 | 4,911,977 | 4,870,772 | 4,781,801 | 4,157,740 |
| Over 50,000 acres | 9,056,576 | 8,884,295 | 8,409,298 | 8,343,074 | 8,128,742 |
| 37,167,460 | 37,408,473 | 37,564,288 | 38,204,349 | 40,238,126 | |
The number of occupied holdings in each provincial district and the total acreage of such holdings at the census of 1911 are shown in the next table.
| OCCUPIED HOLDINGS IN PROVINCIAL DISTRICTS, 1911. | ||
|---|---|---|
| Provincial District. | Number of Holdings. | Area in Occupation. |
| Acres. | ||
| Auckland | 21,180 | 7,769,048 |
| Taranaki | 5,423 | 1,358,271 |
| Hawke's Bay | 4,648 | 3,211,086 |
| Wellington | 11,252 | 4,434,755 |
| Marlborough | 1,718 | 2,440,109 |
| Nelson | 3,650 | 2,314,116 |
| Westland | 945 | 961,068 |
| Canterbury | 11,576 | 6,587,587 |
| Otago— | ||
| Otago Portion | 8,020 | 7,997,952 |
| Southland Portion | 5,464 | 3,164,134 |
| Totals | 73,876 | 40,238,126 |
The occupied holdings of the North Island now considerably outnumber those of the South Island, the numbers being—North Island, 42,503; South Island, 31,373. For the year 1900–1, the returns showed 30,086 holdings for the South Island, against 32,700 for the North.
The extent of land occupied as shown in the returns according to tenure is tabulated for each provincial district. The acreage in the last column of the statement is apparently short of the actual facts, judging from the figures shown in the table of “Crown Tenants,” as given in the report of the Lands Department. The difference lies' in what has been returned for Crown pastoral leases to the agricultural-statistics collectors and the areas on which rent is paid given by the Lands Department.
| OCCUPATION OF LAND: TENURE, 1911. | |||||
|---|---|---|---|---|---|
| Provincial District. | Total of Holdings. | Freehold. | Leased from Individuals or Public Bodies. | Leased from Natives. | Held from Crown under Different Tenures. |
| Acres. | Acres. | Acres. | Acres. | Acres. | |
| Auckland | 7,769,048 | 4,382,289 | 610,095 | 787,515 | 1,989,149 |
| Taranaki | 1,358,271 | 618,246 | 257,973 | 117,565 | 364,487 |
| Hawke's Bay | 3,211,086 | 1,757,830 | 278,959 | 654,021 | 520,276 |
| Wellington | 4,434,755 | 2,518,309 | 673,605 | 462,106 | 780,735 |
| Marlborough | 2,440,109 | 804,021 | 105,561 | 41,975 | 1,488,552 |
| Nelson | 2,314,116 | 1,002,256 | 139,476 | 21,490 | 1,150,894 |
| Westland | 961,068 | 76,966 | 34,237 | 6,963 | 842,902 |
| Canterbury | 6,587,587 | 2,581,682 | 926,471 | 19,322 | 3,060,112 |
| Otago— | |||||
| Otago portion | 7,997,952 | 1,493,718 | 509,867 | 30,995 | 5,963,372 |
| Southland portion | 3,164,134 | 1,316,380 | 462,642 | 5,476 | 1,379,636 |
| Totals | 40,238,126 | 16,551,697 | 3,998,886 | 2,147,428 | 17,540,115 |
A big percentage of the area held from the Crown is represented by Crown pastoral leases. In 1891 the area of Crown pastoral leases, according to the returns of the Lands Department, was 11,915,580 acres, and in 1911 11,001,333 acres. The total area of land in occupation in the respective years was 31,867,505 acres and 40,238,126 acres.
Lands occupied cannot be properly compared with the returns of Crown lands alienated or in process of alienation, for certain lands have passed into the hands of Europeans which were never made waste lands of the Crown. Similarly, occupation of land must not be confused with ownership, a good deal of land being held which is unused and unoccupied.
From the tables following, which are compiled from the ownership entries in the valuation rolls of the Dominion, it will be seen that of the total area of New Zealand (sixty-six million acres) there was held as freehold on 31st March, 1910, more than nineteen and a half millions of acres of rural lands. The balance is in the hands of owners of urban lands, the Crown, Native owners, local bodies, church, education, friendly societies, and other public bodies. The number of freeholders of country lands (i.e., exclusive of those in boroughs and townships), with the area held, and the capital and unimproved values of same on 31st March, 1910, was as follows:—
| Size of Holdings, in Acres. | Number of Owners. | Total Area. | Capital Value. | Unimproved Value. |
|---|---|---|---|---|
| Acres. | £ | £ | ||
| 5 and under 320 | 36,234 | 3,457,551 | 39,426,890 | 26,224,383 |
| 320 “ 640 | 5,394 | 2,422,803 | 18,177,896 | 13,049,185 |
| 640 “ 1,000 | 2,063 | 1,618,609 | 11,179,793 | 8,087,573 |
| 1,000 “ 2,000 | 1,748 | 2,487,571 | 14,967,929 | 11,034,208 |
| 2,000 “ 5,000 | 1,006 | 3,966,195 | 16,733,307 | 12,612,376 |
| 5,000 “ 10,000 | 306 | 2,113,081 | 9,214,768 | 6,934,896 |
| 10,000 “ 20,000 | 121 | 1,661,381 | 6,044,068 | 4,665,446 |
| 20,000 “ 30,000 | 28 | 683,368 | 1,984,990 | 1,508,004 |
| 30,000 “ 40,000 | 5 | 175,001 | 313,003 | 232,999 |
| 40,000 “ 50,000 | 6 | 262,565 | 331,727 | 196,091 |
| 50,000 “ 100,000 | 11 | 727,156 | 723,084 | 565,858 |
| 100,000 “ 150,000 | .. | .. | .. | .. |
| 150,000 and over | .. | .. | .. | .. |
| Totals | ||||
| .. | 46,922 | 19,575,281 | 119,097,455 | 85,111,019 |
| NUMBER OF FREEHOLDERS (EXCLUSIVE OFTHOSE IN BOROUGHS OR TOWNSHIPS) WITH SIZES OF HOLDINGS. | |||||||
|---|---|---|---|---|---|---|---|
| Sizes of Holdings, in Acres. | Number of Freeholders in | ||||||
| 1883. | 1886. | 1889. | 1892. | 1902. | 1906. | 1910. | |
| 5 and under 320 | 25,407 | 28,521 | 31,324 | 32,211 | 34,800 | 35,200 | 36,234 |
| 320 “ 640 | 2,695 | 2,982 | 3,189 | 3,553 | 4,735 | 5,107 | 5,394 |
| 640 “ 1,000 | 931 | 1,043 | 1,035 | 1,143 | 1,580 | 1,862 | 2,063 |
| 1,000 “ 2,000 | 816 | 916 | 906 | 992 | 1,369 | 1,553 | 1,748 |
| 2,000 “ 5,000 | 465 | 509 | 507 | 566 | 775 | 864 | 1,006 |
| 5,000 “ 10,000 | 203 | 220 | 221 | 208 | 260 | 278 | 306 |
| 10,000 “ 20,000 | 141 | 151 | 134 | 148 | 123 | 129 | 121 |
| 20,000 “ 30,000 | 49 | 43 | 50 | 45 | 40 | 40 | 28 |
| 30,000 “ 40,000 | 23 | 31 | 26 | 30 | 21 | 14 | 5 |
| 40,000 “ 50,000 | 11 | 5 | 13 | 9 | 9 | 8 | 6 |
| 50,000 “ 100,000 | 19 | 25 | 18 | 20 | 18 | 12 | 11 |
| 100,000 “ 150,000 | 2 | 2 | 2 | 4 | 2 | .. | .. |
| 150,000 and over | 2 | 2 | 7 | 6 | 3 | 1 | .. |
| Totals | 30,764 | 34,450 | 37,432 | 38,935 | 43,735 | 45,068 | 46,922 |
Prior to the year 1906 the areas of freehold lands under 10,000 acres were not classified, but it is possible to compare the areas above that quantity as held in 1889, 1906, and 1910. Still excluding lands in the hands of Native owners, local bodies, church, education, friendly societies, and other public bodies, the figures are,—
| 1889. | 1906. | 1910. | |
|---|---|---|---|
| Area, in Acres. | Acres. | Acres | Acres. |
| 10,000 and under 20,000 | 1,911,154 | 1,817,562 | 1,661,381 |
| 20,000 “ 30,000 | 1,221,829 | 1,002,816 | 683,368 |
| 30,000 “ 40,000 | 921,435 | 474,822 | 175,001 |
| 40,000 “ 50,000 | 570,646 | 353,100 | 262,565 |
| 50,000 “ 75,000 | 723,459 | 490,507 | 560,250 |
| 75,000 “ 100,000 | 522,590 | 342,493 | 166,906 |
| 100,000 “ 150,000 | 241,423 | .. | .. |
| 150,000 and over | 1,389,664 | 223,242 | .. |
It would appear from the above that there has been a reduction in the total held in areas of 10,000 acres and over of 2,797,658 acres during the period 1889–1906, and a further reduction of 1,195,071 acres during the period 1906 to 1910, or a total reduction of 3,992,729 acres between 1889 and 1910. The average area held by owners of 10,000 acres and upwards shows a steady decrease since 1889, as follows:—
| Average Area held. | |
|---|---|
| Year. | Acres. |
| 1889 | 30,009 |
| 1892 | 29,924 |
| 1902 | 28,312 |
| 1906 | 23,061 |
| 1910 | 20,523 |
Table of Contents
THE Dominion of New Zealand is a country specially favoured for primary production. The soil covering is varied in character, a considerable portion of it being of exceptional fertility, but even the poorer soils are largely capable of profitable utilization by reason of the comparatively mild and equable weather-conditions. The best grasses and fodder plants flourish in the congenial environment, and the country has already gained a world-wide reputation for the quality of its pastures. Numerous streams intersect the country and present to the farmer a great potential source of cheap power, which is already being used in individual cases for shearing sheep, separating milk, crushing grain, cutting firewood, and lighting the home.
A conspicuous feature of New Zealand farming is that the stock do not require to be stalled in the winter, though the pastures are more or less supplemented by fodder crops in the colder months of the year. This fact, combined with the factor of soil-fertility, enables the New Zealand farmer to produce stock at a much smaller cost than the fanner in countries where artificial feeding has to be employed or where droughts periodically occur.
New Zealand is primarily a grazing-country, and, while more of the land is every year being given up to the cultivation of fodder crops, its future will, no doubt, be inseparably associated with stock-raising, principally of dairy cattle and sheep. Though not a century old, over sixteen million acres of land in the Dominion have been sown down in English grasses; and when it is considered that the area under pasture in Great Britain is only about twenty million acres, the splendid progress made by the farmers of New Zealand will be realized. A great proportion of the crops grown in the Dominion are for the production of commodities, such as meat and dairy-produce.
Grain crops, principally oats and wheat, are grown on a fairly large scale in the eastern and southern districts of the South Island. Barley is also grown, but to a very much smaller extent. Much of the crop of oats produced is chaffed for stock-feeding purposes within the country. Root crops, principally turnips, are grown on a large scale for winter feed and for stock-fattening purposes, more particularly in the South Island. Owing to the comparative difficulty of growing large areas of turnips free from disease, other stock-foods are coming into prominence. Mangolds are being cultivated to a larger extent, and farmers are beginning to realize the great value of lucerne, while silver-beet for feeding to dairy stock has had considerable attention. Ensilage-making, particularly in the stack form, is increasing in the dairying districts. Quite a feature of milk-producing operations is the growing of green fodder crops to maintain the milk-supply during the drier months of the year, and for this purpose maize is specially favoured, though such crops as barley and tares, also silver-beet, are increasing in use. It will be seen that live-stock in New Zealand are almost entirely maintained on food produced on the farm itself, there being no such thing as the use of concentrated foodstuffs, except in the case of calf and pig meals, much of which is locally manufactured.
The production of the native flax, or Phormium tenax fibre, at the present time conducted on a highly payable basis, may be regarded as a fairly permanent rural industry, as many of the larger areas of the Phormium tenax plant are in swampy locations which, under present conditions at least, are incapable of being effectively drained for agricultural purposes.
The North Island of the Dominion is remarkable for the congenial environment it furnishes for many phases of primary production. In no part is the winter really severe, and the question of stalling stock during the colder months of the year has not to be considered. It is more a grazing than an agricultural country, and practically all the cereal crops raised are used for feeding to farm stock. The dominant industries are dairying and sheep-farming. There is probably no finer sheep-country in the world than the limestone downs of the province of Hawke's Bay, while on the west coast the Waimate Plains provide an ideal environment for dairy cattle. It may be said with every confidence that there is more butter-fat produced to the acre on many farms in the Taranaki district than on any equal area in the world when it is considered that all the food provided for the stock is produced on the farm itself. Within a radius of twenty miles of the country town of Eltham the value of the dairy-produce manufactured in the year is some £2,000,000. Some idea of the expansion of the dairying industry, for which the North Island is mainly responsible, may be gauged from the fact that the value of the export of butter and cheese in 1890 was £207,687; in 1900, £969,731; in 1910, £3,007,348: while for the year 1914 it was £4,902,701. The standard of dairy-farming is steadily improving, not only by reason of special fodder being provided for the drier parts of the summer and the colder months of the year, but on account of the fact that the farmer is coming to realize the value of herd testing and culling.
Sheep-farming in the North Island has also made great headway, and with the steady increase in the area of land taken up for this purpose, particularly in the back country, the gain made in the number of the flocks more than compensates for the sheep-breeding areas on the better lands being taken up for dairy-farming.
In various parts of the Island fruit-growing, principally of apples, pears, and peaches, is being placed on a sound commercial basis. In the northern portion citrus fruits can be successfully produced, and with the adoption of better methods oranges and lemons should be cultivated on a considerable scale. Outdoor grapes are freely grown. Both the North and the South Islands have established an export trade in apples.
The remarkable demonstration provided by the Department of Agriculture at the Te Kauwhata Horticultural Station (late Waerenga Experimental Farm) in the utilization of poor pipeclay or “gum” land, considered useless for ordinary agricultural purposes, for the production of fruit, has provided a key to the unlocking of a very large area of land in the North Island. That fruit of the best quality can be successfully produced on such country is now an accomplished fact. In connection with the demonstration work at Te Kauwhata a number of fruit-farms were laid out and, as they reached the profit-making stage, were disposed of; this work is still going on. It has also been demonstrated at this station that wattle-trees thrive in some northern lands. The Department has established on the property large plantations of black-wattle that are periodically harvested for their bark, which is ground on the property and sold at remunerative prices for tanning purposes.
During recent years it has been discovered that the Waikato district and the Auckland Province in general are admirably adapted for the industry of milk-production, and dairying has made remarkable headway. The Auckland District, in fact has become easily the largest exporter of butter in the Dominion.
With the adoption of improved methods in the treatment of the land, and the demonstration, particularly at the Ruakura Farm of Instruction, of correct manurial treatment, fanning in the Auckland Province has been placed on a much more stable basis. Assisted by a favourable climate, of which a short and mild winter is a feature, stock-raising of all descriptions is being carried on with conspicuous success. The country is eminently adapted for the production of root and fodder crops, and stock can be brought to maturity and fattened for the market at a minimum of cost.
While the greater part of the North Island has been settled and is carrying a prosperous community of farmers, a large area still remains to be developed. Much of this is in somewhat remote districts, but a considerable amount of unimproved land owned by the Natives is of a fertile nature, and when settled will carry a large number of small farmers. The great productivity of the land in the best sections of the Island has led to the values of these advancing to a very high level, with the result that closer settlement of them is inevitable.
The South Island was the portion of the Dominion where agriculture property was first established, the settlement of the land being greatly facilitated by the fact that on the eastern, southern, and northern portions large fertile plains, rolling downs, and hills were available devoid of the forests which in a very large portion of the North Island have had to be cleared before the land could be utilized by the farmer. Agricultural operations in the south have been maintained at a high standard for many years, principally in Otago and Canterbury, many of the pioneers of which districts were British yeomen farmers who brought with them the best methods of the Old Land. So in the breeding of live-stock, many of the original holders of land in the south and the shepherds and herdsmen they employed were well trained in stock-management by live-stock breeders of the Mother-country. The South Island may be fairly said to have been the nursery of the live-stock of the Dominion, and the high quality of the stock bred in the country is in a large measure due to the capacity of the men who founded and developed the flocks and herds in the eastern and southern districts of the South Island.
While the climate in the southern districts of the South Island is not so congenial as that in the northern, there are only a few portions where the winter is at all rigorous. The Nelson Province, in the northwest corner of the Island, is noted for its climate, which is remarkably equable in character. Nelson has a sunshine-record which is equalled in but few parts of the Temperate Zone. The district is specially suitable for fruit-growing, which is being developed on a rapidly expanding commercial scale. At the other end of the Island, in Central Otago, a peculiar configuration of the country enables fruit-growing to be prosecuted with unique success. The winter is comparatively severe, but the warm summer sun and the absence of wind make it an ideal environment for fruitgrowing.
Generally, however, stock-raising is the main industry in the southern half of the Dominion, while in some sections, particularly in Canterbury, Otago, and Marlborough, grain-growing is prosecuted on a considerable scale. The Canterbury Plains, extending a hundred and fifty miles north and south and running inland for forty miles from the sea, represent an area of over 3,000,000 acres. This forms the principal grain-growing area. Wheat, oats, and barley are cultivated to a large extent. In Otago and Southland oats are the grain principally produced. In some of the richer lands the yield of wheat has reached very high figures, even up to 80 or 90 bushels per acre, while over 100 bushels to the acre have been recorded for crops of oats. In root crops up to 70 tons per acre of turnips have been secured, while the yield of mangolds has frequently reached 90 tons.
Under the control of the Minister of Agriculture the Department of Agriculture is a service which is mainly concerned in advancing the interests of primary production, having special branches dealing with the leading phases of the latter. Under a Secretary of Agriculture there are Directors of Divisions of Live-stock, Dairy, Fields, and Horticulture, also a Chemist and a Biologist in charge of sections. Over four hundred officers are engaged.
While the service is mainly educative, it also carries out important inspection work, such as—
Live-stock and meat inspection: All meat exported is inspected by qualified officers. Cattle are inspected for tuberculosis and other bovine troubles; sheep and swine also receive attention; slaughterhouses are licensed and controlled, and all stock exported and imported are examined by veterinary surgeons, of whom there are between twenty and thirty in the employment of the Department.
Dairy-produce is inspected and graded prior to shipment, a close supervision being also exercised over the moisture in butter and cheese, as well as over the weights of such produce; dairy-farm premises are inspected; herd-testing is promoted, and a system of semi-official testing of purebred dairy cows is in operation; milk-samples are tested for dairy companies and fanners. Altogether twenty-five dairy experts are employed.
Officers of the Fields Division conduct a close supervision over the control of noxious weeds and the suppression of rabbits. They also assist in connection with the system of co-operative field experiments. A special staff is employed to grade New Zealand phormium-fibre prior to export.
The Horticulture Division is charged with the inspection of fruit and trees imported and offered for sale, inspects orchards and apiaries, and generally controls diseases of plants and bees.
There are six main experimental farms and horticultural stations, which carry out experiments and demonstrations of national as well as local import. Plant-breeding work is conducted at two of the farms, and at three of them purebred herds of dairy cattle are being bred according to pedigree of performance. Several of the farms were established to solve local problems, and the objective in each case has been attained. Attached to three of the farms are a number of learners—lads who are being trained in up-to-date methods of agriculture.
The instructional work covers a comprehensive field, all classes of farmers being assisted by advice. Thousands of farmers visited the experimental farms last year, while large numbers of letters of advice were written by the managers. Comprehensive educational displays are made at the several winter shows, largely illustrative of the experiments conducted at the farms of the Department. Several hundred farmers are co-operating with the Department in conducting experiments on their farms. A monthly journal is published at a nominal subscription, and bulletins are frequently issued. Any farmer can obtain advice regarding his soil, have his seed examined for germination-capacity and purity, his milk tested for butter-fat content or for the presence of disease, plants identified, and diseases of either animals or plants described, and remedies suggested— all these services being rendered free of charge.
By an Act of Parliament passed in 1913 provision was made for the establishment of a Board of Agriculture, consisting of not more than twelve members appointed by the Governor, of whom not more than four were to be appointed on the recommendation of the agricultural and pastoral societies of the North Island, and an equal number on the recommendation of such societies in the South Island. The functions of the Board are to advise the Minister of Agriculture on matters relating to the development of agricultural and other rural industries in New Zealand. In particular, but without limiting the application of the term “agricultural and rural industries,” the functions of the Board extend to the following matters:—
The aiding, improving, and developing of agriculture and all rural industries, including fruit-culture, horticulture, forestry, dairying, the breeding of stock and poultry, beekeeping, and the flax industry;
The prevention and control of disease in stock and poultry, the control of rabbits and noxious weeds, and the dipping of sheep;
The establishment of agricultural colleges and agricultural education generally; and
The aiding or facilitating of the carriage and distribution of produce.
Up to and including the 1908–9 season complete agricultural statistics were collected annually, the plan adopted being similar to that used in the United Kingdom, the account of land laid down in crop being ascertained at an early date, while statistics of produce were made up after the results of threshing were known.
For the 1909–10 season full statistics were not collected, but the area under the principal grain and root crops was ascertained and an estimate made of the yields.
In conjunction with the census of 1911 complete statistics were collected covering the 1910–11 season, and these are the latest statistics available in regard to any but the principal grain, grass-seed, and root crops. In each of the past four seasons returns have been collected by post regarding the acreage and yield of the principal crops, and the results obtained should be taken as fairly reliable estimates only. The total area actually sown would probably be somewhat in excess of that obtained under the system of collection by post.
Beginning with the 1915–16 season, a new system of collection of agricultural and pastoral statistics is being instituted. The new system will ensure full returns of acreage and yield of crops being collected annually, together with supplementary information as to area of land devoted to various purposes. Detailed statistics of horses, cattle, sheep, and pigs will also be obtained.
The total area of the Dominion, excluding the Cook and other Pacific islands annexed in 1901, is 66,292,232 acres, and of this 16,265,890 acres were in cultivation at the census of 1911. A summary of the area in cultivation and in occupation in each provincial district is given on the next page. Figures for each county are given in the Year-book for 1914 (pages 580–583) in respect of land in cultivation.
| AREA IN CULTIVATION ANDIN OCCUPATION, 1910–11. | ||||||||||||
|---|---|---|---|---|---|---|---|---|---|---|---|---|
| Provincial District. | In Grain and Pulse Crops. | In Green and Root Crops. | In Fallow Land. | In Sown Grasses: Land ploughed, (For all purposes.) | In Sown Grasses: Land not ploughed. (For all purposes.) | In Hay: Area included in two Previous Columns. | In Orchard and Vineyard. | In Garden. (Market and Private.) | In Plantation. (Not Native Bush.) | Total Area in Cultivation. | In Tussock or Native Grass, and Unimproved Land. | Total Area in Occupation. |
| Acres. | Acres. | Acres. | Acres. | Acres. | Acres. | Acres. | Acres. | Acres. | Acres. | Acres. | Acres. | |
| Auckland | 52,811 | 57,502 | 56,201 | 802,262 | 2,541,999 | 16,890 | 12,035 | 3,435 | 20,401 | 3,546,646 | 4,222,402 | 7,769,048 |
| Taranaki | 11,984 | 23,982 | 3,274 | 211,189 | 793,385 | 12,397 | 953 | 610 | 1,332 | 1,046,709 | 311,562 | 1,358,271 |
| Hawke's Bay | 22,819 | 35,573 | 7,281 | 356,925 | 1,405,543 | 3,874 | 2,421 | 1,098 | 3,810 | 1,835,470 | 1,375,616 | 3,211,086 |
| Wellington | 49,327 | 58,799 | 7,183 | 357,980 | 2,699,664 | 10,149 | 3,646 | 2,745 | 5,463 | 3,184,807 | 1,249,948 | 4,434,755 |
| Marlborough | 36,344 | 11,614 | 3,189 | 100,255 | 421,898 | 1,243 | 592 | 272 | 1,927 | 576,091 | 1,864,018 | 2,440,100 |
| Nelson | 32,071 | 18,475 | 5,445 | 139,318 | 418,063 | 2,594 | 4,894 | 662 | 4,544 | 623,472 | 1,690,644 | 2,314,116 |
| Westland | 668 | 1,524 | 778 | 9,903 | 73,768 | 470 | 208 | 85 | 14 | 86,948 | 874,120 | 961,068 |
| Canterbury | 474,503 | 228,936 | 64,708 | 1,455,519 | 507,446 | 6,344 | 3,943 | 3,715 | 18,112 | 2,756,882 | 3,830,705 | 6,587,587 |
| Otago— | ||||||||||||
| Otago portion | 193,994 | 136,995 | 40,220 | 818,416 | 227,346 | 5,927 | 3,081 | 1,685 | 6,851 | 1,428,588 | 6,569,364 | 7,997,952 |
| Southland portion | 141,301 | 140,282 | 21,694 | 748,159 | 125,403 | 2,712 | 960 | 852 | 1,326 | 1,180,277 | 1,983,857 | 3,164,134 |
| Totals | 1,015,822 | 713,682 | 209,973 | 5,000,226 | 9,214,515 | 62,600 | 32,733 | 15,159 | 63,780 | 16,265,890 | 23,972,236 | 40,238,126 |
The principal crops grown in New Zealand are wheat, oats, barley, turnips, potatoes, rye-grass, and cocksfoot. Considerable areas of peas are grown in Marlborough and Canterbury, and of maize in the Bay of Plenty district. A table showing the acreage under wheat, oats, barley, rye-grass, cocksfoot, and potatoes during the past ten seasons is given.
| Season. | Wheat. | Oats. | Barley. | Rye-grass. | Cocksfoot. | Potatoes. |
|---|---|---|---|---|---|---|
* Amended area (see letterpress). | ||||||
| Acres. | Acres. | Acres. | Acres. | Acres. | Acres. | |
| 1905–6 | 222,183 | 354,291 | 29,644 | 30,626 | 37,039 | 26,834 |
| 1906–7 | 206,185 | 351,929 | 33,305 | 25,893 | 31,633 | 31,289 |
| 1907–8 | 193,031 | 386,885 | 36,177 | 40,435 | 28,731 | 27,035 |
| 1908–9 | 252,391 | 406,908 | 48,853 | 50,126 | 32,705 | 29,919 |
| 1909–10 | 311,000 | 377,000 | 41,500 | 56,550 | 29,500 | 30,500 |
| 1910–11 | 322,167 | 302,827 | 33,491 | 46,706 | 41,918 | 29,023 |
| 1911–12 | 215,528 | 400,668 | 31,644 | 77,535 | 38,297 | 28,248 |
| 1912–13 | 189,869 | 380,786 | 37,486 | 63,031 | 34,007 | 23,480 |
| 1913–14 | 166,774 | 361,741 | 32,022 | 55,936 | 25,935 | 29,164 |
| 1914–15 | 229,600* | 287,561 | 18,347 | 50,533 | 17,551 | 21,887 |
Tables are also given showing the average and total yields of these crops during the same period. The decline in the total yields in the past few seasons is very noticeable, as is also the fall in the acreage returned as under the various crops, and it will be interesting to see from the returns collected for the forthcoming season under the new system referred to above how much of the decline shown is due to the competition of the dairy industry, and how much to the omission on the part of farmers to furnish returns. In the case of wheat in 1914–15, for instance, the original returns collected from farmers showed an area of 190,000 acres, but the collection of returns of threshings (referred to below under the heading of “wheat”) disclosed the omission to supply returns in a number of cases, and the presumable sowing of additional areas after the furnishing of returns in other cases, with the result that the total area under wheat was found to be 229,600 acres.
| AVERAGE YIELD PER ACRE. | ||||||
|---|---|---|---|---|---|---|
| Season. | Wheat. | Oats. | Barley. | Rye-grass. | Cocksfoot. | Potatoes. |
* Of 2d lb. | ||||||
| Bushels. | Bushels. | Bushels. | Bushels.* | Lb. | Tons. | |
| 1905–6 | 30.60 | 35.86 | 34.54 | 32.23 | 237.14 | 4.59 |
| 1906–7 | 27.18 | 31.83 | 31.08 | 22.37 | 183.19 | 5.42 |
| 1907–8 | 28.84 | 38.82 | 32.15 | 28.69 | 144.37 | 5.28 |
| 1908–9 | 34.75 | 46.46 | 39.67 | 32.53 | 144.35 | 6.52 |
| 1909–10 | 28.00 | 37.00 | 31.00 | 33.00 | 151.00 | 6.00 |
| 1910–11 | 25.73 | 33.41 | 27.68 | 25.00 | 140.00 | 4.87 |
| 1911–12 | 33.69 | 48.71 | 39.65 | 28.36 | 182.12 | 5.13 |
| 1912–13 | 27.28 | 35.12 | 36.75 | 23.15 | 238.37 | 6.29 |
| 1913–14 | 31.37 | 40.75 | 37.65 | 19.64 | 191.11 | 5.39 |
| 1914–15 | 28.94 | 39.77 | 32.53 | 21.03 | 135.50 | 6.06 |
| TOTAL YIELDS. | ||||||
|---|---|---|---|---|---|---|
| Season. | Wheat. | Oats. | Barley. | Rye-grass. | Cocksfoot. | Potatoes. |
* Of 20 lb. | ||||||
| Bushels. | Bushels. | Bushels. | Bushels.* | Lb. | Tons. | |
| 1905–6 | 6,798,934 | 12,707,982 | 1,024,045 | 987,243 | 8,783,571 | 123,402 |
| 1906–7 | 5,605,252 | 11,201,789 | 1,035,346 | 579,399 | 5,795,915 | 169,875 |
| 1907–8 | 5,567,139 | 15,021,861 | 1,163,406 | 1,160,413 | 4,147,902 | 142,990 |
| 1908–9 | 8,772,790 | 18,906,788 | 1,938,452 | 1,630,615 | 4,721,159 | 195,206 |
| 1909–10 | 8,661,100 | 13,804,000 | 1,304,000 | 1,894,650 | 4,451,000 | 180,509 |
| 1910–11 | 8,290,221 | 10,118,917 | 927,112 | 1,167,650 | 5,868,520 | 141,510 |
| 1911–12 | 7,261,138 | 19,662,668 | 1,254,684 | 2,198,893 | 6,974,650 | 144,912 |
| 1912–13 | 5,179,626 | 13,583,924 | 1,377,610 | 1,458,947 | 8,106,249 | 147,689 |
| 1913–14 | 5,231,700 | 14,740,946 | 1,205,628 | 1,098,835 | 4,956,438 | 157,194 |
| 1914–15 | 6,644,336 | 11,436,301 | 596,828 | 1,062,810 | 2,378,160 | 132,635 |
In addition to the crops shown, returns have been collected of the following, the acreage for 1914–15 being as shown:—
| Acreage, 1914–15 | |
|---|---|
| Maize | 5,477 |
| Peas | 13,304 |
| Red clover | 5,702 |
| White clover | 1,458 |
| Other clover | 860 |
| Chewing's fescue | 7,158 |
| Turnips | 514,105 |
| Mangolds | 9,691 |
| Rape | 197,114 |
Wheat at one time ranked much higher in the list of staple products of New Zealand than it now does. In the “eighties” and “nineties” much more wheat was produced than could be consumed in the Dominion, and a heavy export trade grew up, the quantity exported in 1883 being 4,897,540 bushels, and in 1890 4,467,026 bushels. Of later years the country has been showing a decided tendency towards dairy-farming, and the relative importance of wheat has greatly declined. On only three occasions since 1900—namely, in 1909, 1910, and 1911—has the annual export of wheat reached 1,000,000 bushels. In some years the export has been practically nil. It is very seldom, however, that the country's production is insufficient for its own requirements, though in 1898 imports amounted to 60,860 bushels and exports to only 10,090 bushels. In 1914 again the production was insufficient to meet the requirements, and considerable importations had to be made, some of this at the expense of the State.
A table is given showing the area under wheat in each year since 1874.
| AREA UNDER WHEAT, 1874 TO 1914. | |
|---|---|
| Year. | Acres. |
| 1874 | 105,673 |
| 1875 | 90,804 |
| 1876 | 141,614 |
| 1877 | 243,406 |
| 1878 | 264,861 |
| 1879 | 270,198 |
| 1880 | 324,949 |
| 1881 | 365,715 |
| 1882 | 390,818 |
| 1883 | 377,706 |
| 1884 | 270,043 |
| 1885 | 173,891 |
| 1886 | 253,025 |
| 1887 | 357,359 |
| 1888 | 362,153 |
| 1889 | 335,861 |
| 1890 | 301,460 |
| 1891 | 402,273 |
| 1892 | 381,245 |
| 1893 | 242,737 |
| 1894 | 148,575 |
| 1895 | 245,441 |
| 1896 | 258,608 |
| 1897 | 315,801 |
| 1898 | 399,034 |
| 1899 | 269,749 |
| 1900 | 208,084 |
| 1901 | 167,474 |
| 1902 | 195,255 |
| 1903 | 230,959 |
| 1904 | 258,896 |
| 1905 | 222,183 |
| 1906 | 206,185 |
| 1907 | 193,031 |
| 1908 | 252,391 |
| 1909 | 311,000 |
| 1910 | 322,167 |
| 1911 | 215,528 |
| 1912 | 189,869 |
| 1913 | 166,774 |
| 1914 | 229,600 |
With the exception of 1894, the area under wheat in the 1913–14 season is the lowest in any year since 1876, when the population of the country was less than two-fifths of what it now is. The outbreak of war rendered it difficult to obtain supplies elsewhere, especially on account of the poor harvests in Australia, but the Government purchased wheat in Canada and obtained a small supply from Australia, thus obviating the danger of a wheat famine.
The outlook for the New Zealand harvest of 1915 was not promising on account of the prolonged absence of good rains in most parts of the South Island. Rain, however, fell in time to increase the yield by several bushels per acre, and the average realized was up to the average of recent years. The institution of a system of collection of returns of wheat and oats threshed was responsible for the confirmation of the suspicion that full details of acreages were not being obtained by the postal system of collection of farmers' returns. The position in 1914–15 was undoubtedly accentuated by the fact that on account of the outbreak of war many farmers made late sowings after having furnished returns. To what extent the late sowings affected the result it is impossible to say, but from the information collected by means of the threshing returns the total yield of wheat for the harvest was found to be 6,644,336 bushels from an area of 229,600 acres, as against an area of 189,567 acres shown by returns furnished by farmers. Under the system in vogue for the past few seasons the average yield per acre, and not the total yield, has been obtained from farmers, and the weighted average ascertained from the whole of the returns has been applied to the total urea shown in November as sown or intended to be sown. The weighted average yield for the harvest of 1915 was found to be 28.94 bushels, which approximates very closely to that shown by the threshing-millers returns, and the total yield was thus estimated at 5,486,069 bushels, or more than 1,000,000 bushels less than the total subsequently ascertained.
The following shows the area in wheat, and the yield (total and per acre), in each State of the Commonwealth of Australia and in New Zealand for the season 1914–15. In the case of New South Wales. Western Australia, and Tasmania the figures are subject to revision.
| State. | Wheat Crop. | ||
|---|---|---|---|
| Acres. | Bushels. | Bushels per Acre. | |
| Queensland | 127,015 | 1,585,087 | 12.48 |
| New South Wales | 3,428,859 | 12,784,529 | 3.73 |
| Victoria | 2,863,535 | 3,940,947 | 1.38 |
| South Australia | 2,502,630 | 3,527,428 | 1.41 |
| Western Australia | 1,375,424 | 2,621,325 | 1.91 |
| Tasmania | 23,865 | 384,220 | 16.10 |
| Totals for Commonwealth | 10,321,328 | 24,843,536 | 2.41 |
| New Zealand | 229,600 | 6,644,336 | 28.94 |
| Grand totals | 10,550,928 | 31,487,872 | 2.98 |
The yield per acre in Australia is never very high as compared with New Zealand, as the table following will show; but the smallness of the yield in 1914–15 is abnormal, being only the one-hundredth part of a bushel in excess of that of 1901–2, the “great drought” year. The average yield per acre in the Commonwealth and in the Dominion in each of the past fourteen years is as follows:—
| Harvest of | Average Yield per Acre. | |
|---|---|---|
| Australia. Bushels. | New Zealand. Bushels. | |
| 1902 | 7.54 | 24.76 |
| 1903 | 2.40 | 38.37 |
| 1904 | 13.32 | 34.26 |
| 1905 | 8.70 | 35.36 |
| 1906 | 11.19 | 30.60 |
| 1907 | 11.10 | 27.18 |
| 1908 | 8.29 | 28.84 |
| 1909 | 11.89 | 34.75 |
| 1910 | 13.73 | 28.00 |
| 1911 | 12.90 | 25.73 |
| 1912 | 9.64 | 33.69 |
| 1913 | 12.53 | 27.28 |
| 1914 | 11.13 | 31.37 |
| 1915 | 2.41 | 28.94 |
From figures published in the “Year-book of Agricultural Statistics,” compiled by the International Institute of Agriculture at Rome, it is possible to estimate approximately the total wheat crop of the world for 1913 (Northern Hemisphere) and 1913–14 (Southern Hemisphere). All of the principal wheat-growing countries of the world are included, but in a few cases figures for 1913 or 1913–14 are not available, and the latest year for which statistics have been published is taken. The total production of the world for the season may be set down as approximately twelve hundred millions of quintals (of 220.46 lb.). The principal countries contributing to this total are.—
| Country. | Quintals (of 220.46 lb.). |
|---|---|
| Russia | 279,683,266 |
| United States | 207,761,501 |
| India | 100,111,111 |
| France | 86,919,050 |
| Canada | 63,064,099 |
| Austria-Hungary | 62,017,333 |
| Italy | 58,452,000 |
| Germany | 46,559,560 |
| Turkey (Europe and Asia) | 44,811,672 |
| Argentine Republic | 31,000,000 |
| Spain | 30,590,794 |
| Australasia | 29,549,998 |
| Roumania | 22,913,340 |
| Bulgaria | 16,500,000 |
| United Kingdom | 15,430,207 |
| Egypt | 10,458,000 |
| Algeria | 10,028,504 |
| Japan | 6,860,339 |
| Serbia | 4,167,194 |
| Belgium | 4,019,505 |
| Chile | 3,262,000 |
| Portugal | 3,224,971 |
| Sweden | 2,539,180 |
| Tunis | 2,220,000 |
Returns so far available point to a much lower wheat-production in 1914 and 1914–15 than in the preceding year. The United States shows 242,499,187 quintals as against 207,761,501, and France, Spain, and the United Kingdom also show slight increases. On the other hand, however, Russia in Europe has fallen from 228 to 156 millions of quintals, Germany from 46½ to less than 40, Italy from 58½ to 46, India from 100 to 85, Canada from 63 to 44. Roumania from 23 to 12½, and Australasia from 29½ to 8.
The extent of land returned as having been sown for grain in 1914–15 was 287,561 acres, as against 361,741 acres in the preceding year. The area of land in oats for chaffing, ensilage, or feeding down in 1910–11 (the latest year available) was 290,569 acres.
The yield per acre was in 1914 40.75 bushels, and in 1915 39.77 bushels, and the quantity of grain produced was 14,740,946 bushels and 11,436,301 bushels for the respective years.
New Zealand has no regular export of oats, and in some years has practically no surplus available for export. The quantity exported in 1891 and succeeding years was as follows:—
| Year. | Export of Oats. Bushels. |
|---|---|
| 1891 | 4,052,414 |
| 1892 | 3,830,444 |
| 1894 | 1,963,288 |
| 1896 | 2,247,053 |
| 1898 | 816,210 |
| 1900 | 5,818,648 |
| 1901 | 10,514,924 |
| 1903 | 4,956,330 |
| 1904 | 2,693,417 |
| 1905 | 1,076,916 |
| 1906 | 734,997 |
| 1907 | 36,693 |
| 1908 | 972,896 |
| 1909 | 5,133,473 |
| 1910 | 444,586 |
| 1911 | 72,826 |
| 1912 | 4,123,920 |
| 1913 | 239,268 |
| 1914 | 1,323,362 |
Of the oats exported in 1914, the United Kingdom received 1,125,365 bushels and Australia 158,395 bushels.
The oat crop for 1913–14 in the States of the Commonwealth of Australia and in New Zealand was as follows:—
| Acres. | Bushels. | Bushels per Acre. | |
|---|---|---|---|
| Queensland | 4,093 | 56,236 | 13.74 |
| New South Wales | 103,262 | 1,832,616 | 17.75 |
| Federal Capital Territory | 154 | 2,790 | 18.12 |
| Victoria | 442,060 | 8,890,321 | 20.11 |
| South Australia | 116,940 | 1,200,740 | 10.27 |
| Western Australia | 133,625 | 1,655,681 | 12.39 |
| Tasmania | 58,886 | 1,593,664 | 27.06 |
| Totals for Commonwealth | 859,020 | 15,232,048 | 17.73 |
| New Zealand | 361,741 | 14,740,946 | 40.75 |
| Grand totals | 1,220,761 | 29,972,994 | 24.55 |
Of the total acreage under oats in Australasia, 29.63 per cent. was in New Zealand, while 49.18 per cent. of the total output belonged to the Dominion. The New Zealand average yield per acre was more than double that of the Commonwealth as a whole.
The estimated area under barley (for threshing) for the season 1913–14 was 32,022 acres, the crop being estimated at 1,205,628 bushels, an average yield per acre of 37.65 bushels. In 1914–15 the area under barley was 18,347 acres, and the yield 596,828 bushels, or 32.53 bushels per acre. The acreage in 1914–15 was the lowest for many years past.
The returns for 1914–15 show that there were 5,477 acres sown for grain, an area somewhat less than that for the previous season (5,942 acres). The yield in 1915 was 275,274 bushels of corn, an average of 50.26 bushels per acre, and in 1914 307,736 bushels, an average of 51.79 bushels per acre. Maize is grown only in the North Island, with the exception of a few acres. In 1914–15 the Provincial District of Auckland had 4,590 acres; Hawke's Bay, 566 acres; Taranaki, 61 acres; Wellington, 171 acres; Marlborough. 21 acres; Nelson, 24 acres; and Canterbury, 44 acres.
There were 4,395 acres in rye, yielding 106,271 bushels, or at the rate of 24.18 bushels per acre, in 1910–11. No figures are available for the past three years.
The area under peas for threshing in the season 1914–15 was 13,304 acres, yielding 356,015 bushels, or an average of 26.76 bushels per acre. The area in 1913–14 was 13,871 acres, the average yield per acre 31.64 bushels, and the total yield 438,878 bushels.
There were 1,798 acres under beans in 1910–11, giving a return of 72,150 bushels, the average being 40.13 bushels per acre. No returns have been collected since 1910–11.
New Zealand has a considerable export of peas and beans, the figures for the past ten years being,—
| EXPORT OF PEAS AND BEANS. | |
|---|---|
| Year. | Bushels. |
| 1905 | 187,829 |
| 1906 | 128,098 |
| 1907 | 120,905 |
| 1908 | 90,751 |
| 1909 | 181,517 |
| 1910 | 198,527 |
| 1911 | 332,227 |
| 1912 | 464,609 |
| 1913 | 339,998 |
| 1914 | 305,053 |
The area under potatoes in 1914–15 was 21,887 acres, yielding a return of 132,635 tons, or at a rate of 6.06 tons per acre, against 29,164 acres in 1913–14 and 157,194 tons (or 5.39 tons per acre).
The following table shows the average yield per acre of potatoes in each of the Australian States and in New Zealand during the past five years:—
| AVERAGE YIELD PER ACRE OF POTATOES, 1909–10 to 1913–14. | |||||
|---|---|---|---|---|---|
| State. | 1909–10. | 1910–11. | 1911–12. | 1912–13. | 1913–14. |
| Tons. | Tons. | Tons. | Tons. | Tons. | |
| Queensland | 1.76 | 1.88 | 1.70 | 1.86 | 1.64 |
| New South Wales | 2.80 | 2.72 | 1.74 | 2.69 | 2.76 |
| Victoria | 2.80 | 2.60 | 2.50 | 4.02 | 2.37 |
| South Australia | 2.28 | 3.06 | 3.06 | 3.85 | 3.05 |
| Western Australia | 3.42 | 3.27 | 3.44 | 2.62 | 3.40 |
| Tasmania | 3.46 | 2.67 | 2.85 | 2.95 | 2.61 |
| Commonwealth | 2.82 | 2.64 | 2.31 | 3.25 | 2.53 |
| New Zealand | 6.00 | 4.87 | 5.13 | 6.29 | 5.39 |
Turnips and rape form a most important crop in a sheep-breeding country such as New Zealand, and in 1892 the area of land under this crop amounted to 422,359 acres. The returns for 1898 gave only 470,582 acres, but for the 1914–15 season 711,219 acres (514,105 acres in turnips and 197,114 acres in rape) were set down as under these crops. The average yield of turnips per acre in 1914–15 was 11.75 tons.
The area under mangolds in 1914–15 was 9,691 acres, and the total yield 229,580 tons, equal to an average of 23.69 tons per acre.
Information re hops has not been obtained since 1910–11.
There were 653 acres under hops in 1910–11, as against 688 acres at the previous collection (in 1908–9). No account of the produce has been taken for some years, but in 1895 the yield was 7,556 cwt.
Of the land under hops in 1910–11, 605 acres were in the Waimea County and 14 in Takaka, both in the Provincial District of Nelson.
Official statistics of the growing of tobacco have not been collected since 1895. In 1889 34 acres were being cultivated; in 1890, 25 acres; in 1891, 16 acres; in 1892, 6 acres; in 1893, 4 acres; in 1894, 4 acres; and in 1895, 5 acres, the production in 1895 being 1,599 lb. of dried leaf. Experiments carried out at various times have proved conclusively that parts of New Zealand are well adapted to the growing of tobacco, the Hawke's Bay District being specially suited by soil and climatic conditions to the growth of pipe and cigarette tobaccos. The New Zealand Tobacco Company some few years ago took up land at Clive for the purpose of tobacco-growing, and in 1913–14 had an area under crop amounting to 60 acres, the yield of leaf being more than 50,000 lb.
Large areas in various parts of New Zealand are covered with Phormium tenax, the fibre of which is largely used for rope-making, &c. At the census of 1911 there were eighty-one mills in operation, employing 1,244 hands. The export of fibre and tow during each of the past ten years was as follows:—
| PHORMIUM EXPORTED, 1905–14. | ||
|---|---|---|
| Year. | Fibre. | Tow. |
| Tons. | Tons. | |
| 1905 | 27,877 | 3,283 |
| 1906 | 27,779 | 5,520 |
| 1907 | 28,547 | 6,885 |
| 1908 | 17,403 | 3,846 |
| 1909 | 14,318 | 2,974 |
| 1910 | 20,645 | 4,501 |
| 1911 | 17,366 | 3,283 |
| 1912 | 18,641 | 3,388 |
| 1913 | 28,092 | 6,299 |
| 1914 | 19,702 | 4,226 |
The extent of land in garden in 1910–11 was 15,159 acres, of which 10,400 acres were private gardens and 4,759 acres market gardens. In plantations of forest-trees there were 63,780 acres.
Each succeeding year sees a marked increase in the area planted in commercial orchards in the Dominion. The area being planted this year (1915) is 2,625 acres, making a total of nearly 45,000 acres for the whole of New Zealand, as compared with 28,558 acres in 1908, an increase of over 16,000 acres in seven years.
Remarkable progress is being made in the Nelson District, and the industry is also making rapid development in the Auckland, Hawke's Bay, Canterbury, and Otago Districts.
A good market exists locally for choice clean fruit, but as the large areas recently planted come into bearing, growers will have to look to outside markets to take the surplus, and it is hoped that the export of fruit will become in time one of the largest of the Dominion.
Already a good start has been made in the export trade in apples, between 60,000 and 70,000 cases having been shipped during each of the past two seasons to South America.
The Agricultural Department assists orchardists by supplying information on fruit-growing generally, and as to the most up-to-date methods to adopt for the control of diseases and insect pests, pruning, &c. Practical demonstrations of pruning, spraying, and the grading and packing of fruit are given regularly by the Orchard Instructors attached to the Department.
Co-operative fruit-testing plots are established in various parts of the Dominion. These plots are for the purpose of—
Ascertaining which varieties of fruit are best adapted to particular districts.
Demonstrating various methods of pruning.
Conducting modified manurial experiments.
Extensive experiments have been carried out in the growing of tomatoes and the control of diseases affecting them, many thousands of pounds having been lost through failure of the tomato crops grown under glass during the last few years. The results of these experiments have proved of great value, and have enabled growers to adopt successful methods for the production of large and profitable crops.
The total acreage in vineyards is 384 acres, and there are over 800 vine-houses. The growing of outdoor grapes is chiefly confined to the districts situated between the North Cape and Hawke's Bay. It is estimated that 89,800 gallons of wine were produced last season, which, at 2s. 6d. per gallon, represents a total of £11,225. A large quantity of outdoor-grown grapes are sold for table use.
Copies of full plans and specifications of a cool store capable of holding 4,000 cases of fruit have been prepared by the Department of Agriculture, and are supplied free on application.
The canning of fruit is also another important feature of the fruit industry. Plans and specifications for the building and equipment of a factory capable of turning out 4,000 cans per day are also available, free of charge, for those contemplating the erection of a factory.
State aid to the fruit-preserving industry is provided for by the Fruit-preserving Industry Act, 1913, whereby not more than £25,000 may be raised in any year for the purpose of making advances for the establishment of cold stores for fruit and of fruit-canning works and otherwise for the assistance of the fruit-growing industry. The advances during the financial year 1914–15 totalled £10,000.
New Zealand is essentially suited for grazing purposes. Wherever there is light and moisture English grasses thrive when the natural bush and fern are cleared off—in fact, the white clover gradually overcomes the fern; and, from the mildness of the winter season, there are few places where there is not some growth, even in the coldest months of the year. In all parts of the Dominion stock five, although in varying condition, without other food than such as they can pick up. Sown-grass land, as might be expected, heads the list of cultivations.
At the beginning of the year 1911 there were 14,214,741 acres under artificial grasses. Of these, 5,000,226 acres had been previously ploughed, while 9,214,515 acres had not been ploughed. Much of the latter area was bush or forest land sown down in grass after the timber had been wholly or partially burnt off.
The area under rye-grass for seed in the season 1914–15 was 50,533 acres, yielding 1,062,810 bushels of 20 lb., or a rate of 21.03 bushels per acre.
In cocksfoot there were 17,551 acres, which yielded 2,378,160 lb., or an average of 135.50 lb. per acre. The area in the previous season was 25,935 acres, and the total yield 4,956,438 lb., the average yield per acre being 191.11 lb. The area returned by farmers as being under cocksfoot is decreasing rapidly in recent years, having been 41,918 acres in 1910–11. Much of the waste land of the Dominion is laid down in cocksfoot, including a large proportion of the land enclosed with the State railway-lines. Much of this is harvested, but no record of the amount obtained from this source is kept.
Seeds for sowing pasture lands are used much as in Great Britain, the following being a common mixture: Perennial rye-grass, 25 lb. to 30 lb. per acre; cocksfoot, 2 lb.; alsike, 2 lb.; timothy, 3 lb.; cowgrass, 2 lb.; red clover, 2 lb.; white clover, 2 lb.; rape, 1 lb.: total, 39 lb. to 44 lb. per acre. Pastures are renewed at intervals of from four to eight years, according to the nature of the land.
The following shows the acreage in sown grasses in each State of Australia and in New Zealand for the 1910–11 season:—
| Acres. | |
|---|---|
| Queensland | 140,196 |
| New South Wales | 1,055,303 |
| Victoria | 991,195 |
| South Australia | 26,416 |
| Western Australia | 8,348 |
| Tasmania | 493,233 |
| New Zealand | 14,214,741 |
It will be observed that the acreage of land under sown grasses is far greater in New Zealand than in the whole of Australia and Tasmania. When compared in size with the States of, Australia, New Zealand is not large—about one-thirtieth of their total area—but in respect of grazing capabilities the relative importance of this country is much greater. Australia is generally unsuitable, owing to conditions of climate, for the growth of English grasses, and the amount of feed produced by the natural grasses throughout the year is very much less per acre than is obtained from the sown-grass lands in New Zealand; indeed, it may be said that the average productiveness of grass land is about nine times as great here as in Australia, or, in other words, that land in New Zealand covered with English grasses may be considered equal for grazing purposes to an area of Australian land about nine times as great.
In addition to the artificially sown pastures, the returns for 1910–11 show that 23,972,236 acres of unimproved land, including that in tussock or native grass, belonged to the occupied holdings, and were available for stock-feeding by the sheep-farmers and cattle-farmers.
A comparative table is presented showing the increase in live-stock since the year 1858. The figures are taken from the census as far as 1891 and for 1911, but for 1895–96 and following years up to 1910 the results of the enumeration made annually by the Department of Agriculture have been made use of. No enumeration has been taken since 1911 except as regards sheep.
| Year. | Horses. | Asses and Mules. | Cattle. | Sheep. | Goats. | Pigs. | Poultry. |
|---|---|---|---|---|---|---|---|
* Not enumerated. | |||||||
| 1858 | 14,912 | 122 | 137,204 | 1,523,324 | 11,797 | 40,734 | * |
| 1861 | 28,275 | 153 | 193,285 | 2,761,383 | 12,191 | 43,270 | 236,098 |
| 1864 | 49,409 | 339 | 249,760 | 4,937,273 | 12,005 | 61,276 | 378,414 |
| 1867 | 65,715 | 323 | 312,835 | 8,418,579 | 11,964 | 115,104 | 676,065 |
| 1871 | 81,028 | 397 | 436,592 | 9,700,629 | 12,434 | 151,460 | 872,174 |
| 1874 | 99,859 | 267 | 494,917 | 11,704,853 | 14,276 | 123,921 | 1,058,198 |
| 1878 | 137,768 | 241 | 578,430 | 13,069,338 | 14,243 | 207,337 | 1,323,542 |
| 1881 | 161,736 | 362 | 698,637 | 12,985,085 | 11,223 | 200,083 | 1,566,114 |
| 1886 | 187,382 | 297 | 853,358 | 16,564,595 | 10,220 | 277,901 | 1,679,021 |
| 1891 | 211,040 | 348 | 831,831 | 18,128,186 | 9,055 | 308,812 | 1,790,070 |
| 1895–96 | 237,418 | 426 | 1,047,901 | 19,826,604 | * | 239,778 | * |
| 1896–97 | 249,813 | 434 | 1,138,067 | 19,138,493 | * | 209,834 | * |
| 1897–98 | 252,834 | 393 | 1,209,165 | 19,687,954 | * | 186,027 | * |
| 1898–99 | 258,115 | 534 | 1,203,024 | 19,673,725 | * | 193,512 | * |
| 1899–00 | 261,931 | 459 | 1,222,139 | 19,348,506 | * | 249,751 | * |
| 1900–1 | 266,245 | 480 | 1,256,680 | 19,355,195 | * | 250,975 | * |
| 1901–2 | 279,672 | 406 | 1,361,784 | 20,233,099 | * | 224,024 | * |
| 1902–3 | 286,955 | 464 | 1,460,663 | 20,342,727 | * | 193,740 | * |
| 1903–4 | 298,714 | 468 | 1,593,547 | 18,954,553 | * | 226,591 | * |
| 1904–5 | 314,322 | 448 | 1,736,850 | 18,280,806 | * | 255,320 | * |
| 1905–6 | 326,537 | 429 | 1,810,936 | 19,130,875 | * | 249,727 | * |
| 1906–7 | 342,608 | 451 | 1,851,750 | 20,108,471 | * | 242,273 | 3,191,604 |
| 1907–8 | 352,832 | 425 | 1,816,299 | 20,983,772 | * | 241,128 | * |
| 1908–9 | 363,259 | 519 | 1,773,326 | 22,449,053 | * | 245,092 | * |
| 1909 | * | * | * | 23,480,707 | * | * | * |
| 1910 | * | * | * | 24,269,620 | * | * | * |
| 1911 | 404,284 | 404 | 2,020,171 | 23,996,126 | * | 348,754 | 3,693,137 |
| 1912 | * | * | * | 23,750,153 | * | * | * |
| 1913 | * | * | * | 24,191,810 | * | * | * |
| 1914 | * | * | * | 24,798,763 | * | * | * |
| 1915 | * | * | * | 24,901,421 | * | * | * |
The stock owned by Maoris in April, 1911, which are included in the above figures, comprised: Horses, 48,222; cattle, 61,300; sheep, 486,922; pigs, 33,290.
The following diagram will give an idea of the large increase is the number of horses, cattle, sheep, and pigs since 1858.
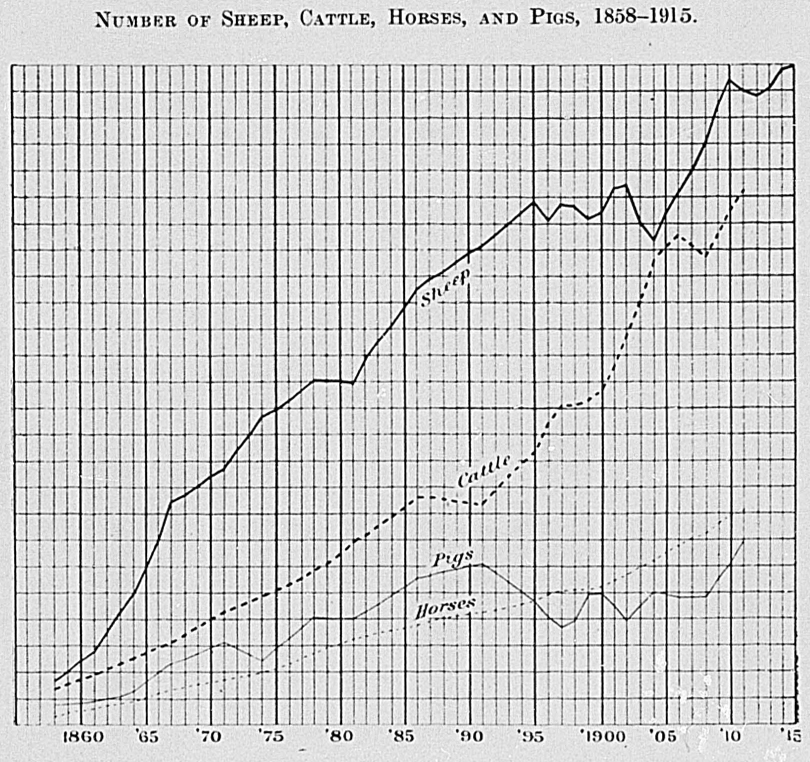
Explanation of Graphs.—The base of each small rectangle represents an interval of one year, and the vertical height the number of animals, as follows: Sheep, one million; cattle, one hundred thousand; horses and pigs, each fifty thousand.
Details of the live-stock other than sheep in each county of New Zealand as ascertained at the census of 1911 are given in the 1913 issue of this book.
The following gives the number of the principal kinds of live-stock in Australasia for the year 1914. In the case of New South Wales, Western Australia, and the Northern and Federal Territories, the figures given are official forecasts, being thus liable to revision.
| State. | Sheep. | Cattle. | Horses. | Pigs. |
|---|---|---|---|---|
* Year 1913. † Year 1911. | ||||
| New South Wales | 36,287,000 | 2,590,000 | 710,000 | 287,896* |
| Victoria | 12,051,685 | 1,362,542 | 552,053 | 243,196 |
| Queensland | 23,129,919 | 5,455,943 | 743,059 | 166,638 |
| South Australia | 4,208,461 | 300,579 | 267,877 | 69,893 |
| Western Australia | 4,474,613 | 824,227 | 161,077 | 59,751 |
| Tasmania | 1,674,845 | 176,524 | 42,232 | 34,960 |
| Northern Territory | 70,200 | 414,558 | 21,985 | 1,240 |
| Federal Territory | 136,000 | 7,000 | 1,700 | 194* |
| Totals for Commonwealth | 82,032,723 | 11,131,373 | 2,499,983 | 863,768 |
| New Zealand | 24,798,763 | 2,020,171† | 404,284† | 348,754† |
The Dominion is eminently suited for sheep-breeding, practically every description of sheep finding a favourable local habitat. In the hilly and down country of the South Island the merino has been bred for very many years, and was the original sheep depastured. In fact, the merino ewe furnished the foundation of the crossbred stock which has made Canterbury mutton famous on British meat-markets. In the early days of the Canterbury meat trade the English Leicester of the original type was the favourite ram for putting to the merino owe. Of later years the Lincoln has been largely employed to cross with the merino, and black-faced rams have been further employed to put to the crossbred owes. In the North Island the Romney sheep, which suits the rather moist climate of this portion of the Dominion, has become the moat popular sheep; it is also increasing in numbers in the South Island. The Lincoln and Border-Leicester are also favoured in both Islands, while the Southdown is displacing other breeds for fat-lamb production throughout the Dominion. The Leicesters, mainly the English variety, are still the most popular British breed in the South.
From the table following it will be seen that the flocks of the North Island increased from 5,285,907 sheep in the year 1886 to 10,009,731 in 1906 and 13,315,916 in 1915, or at the rate of 89.37 per cent. in the first twenty years of the period and of 33.03 per cent. between 1906 and 1915. Sheep in the South Island have increased comparatively little. The year 1886 was followed by a decrease in the numbers which, except for the years 1892 to 1897, 1901 and 1902, lasted till 1904. This year marks the starting-point of a fairly steady though small annual increase. In 1904 the number of sheep in the South Island was 9,076,843; in 1906 10,098,740, an increase of but 2.13 per cent. since 1886. Between 1906 and 1915 an increase of 14.72 per cent. took place.
| Year. | North Island. | South Island. | Total. |
|---|---|---|---|
| 1886 | 5,285,907 | 9,888,356 | 15,174,263 |
| 1906 | 10,009,731 | 10,098,740 | 20,108,471 |
| 1907 | 10,854,018 | 10,129,754 | 20,983,772 |
| 1908 | 11,632,201 | 10,816,852 | 22,449,053 |
| 1909 | 12,193,211 | 11,287,496 | 23,480,707 |
| 1910 | 12,917,662 | 11,351,958 | 24,269,620 |
| 1911 | 12,814,353 | 11,181,773 | 23,996,126 |
| 1912 | 12,618,089 | 11,132,064 | 23,750,153 |
| 1913 | 13,145,445 | 11,046,365 | 24,191,810 |
| 1914 | 13,155,958 | 11,642,805 | 24,798,763 |
| 1915 | 13,315,916 | 11,585,505 | 24,901,421 |
There was an increase of 5,770,546 in the total number of sheep between 1905 and 1915, representing a rate of 30.16 per cent. in the ten years.
Of the provincial districts, Wellington had most sheep in 1915, Otago came next, and Canterbury occupied the third place. The particulars given below show that in six of the nine provinces the figures for 1915 show increases on those of 1914 amounting in the aggregate to 462,424, decreases in Wellington, Canterbury, and Hawke's Bay, however, reducing the net increase to 102,658.
| Provincial District. | No. of Sheer in 1914. | No. of Sheep in 1915. | Increase. | Decrease |
|---|---|---|---|---|
* Including Chatham Islands. | ||||
| Wellington | 5,366,680 | 5,321,596 | .. | 45,084 |
| Otago | 4,781,036 | 4,831,580 | 50,544 | .. |
| Canterbury* | 4,738,365 | 4,564,650 | .. | 173,715 |
| Auckland | 3,612,261 | 3,911,539 | 299,278 | .. |
| Hawke's Bay | 3,445,168 | 3,304,201 | .. | 140,967 |
| Nelson | 1,037,710 | 1,084,891 | 47,181 | .. |
| Marlborough | 1,025,981 | 1,040,197 | 14,216 | .. |
| Taranaki | 731,849 | 778,580 | 46,731 | .. |
| Westland | 59,713 | 64,187 | 4,474 | .. |
| Totals | 24,798,763 | 24,901,421 | 102,658 | .. |
The number of sheep in each county on the 30th April, 1915, are detailed in the next table. It should be noted that the figures for breeding ewes are, in some instances, incomplete, no information being available as to the number of breeding ewes included in supplementary returns covering 76,027 sheep situated in the undermentioned counties:—
| County. | No. |
|---|---|
| Otamatea | 302 |
| East Taupo | 620 |
| Ohura | 816 |
| Waitomo | 450 |
| Patea | 179 |
| Kaitieke | 243 |
| Pohangina | 1,027 |
| Rangitikei | 375 |
| Wanganui | 1,922 |
| Bruce | 917 |
| Tuapeka | 810 |
| Chatham Islands | 68,366 |
| 76,027 |
| TABLE SHOWINGFOR EACH COUNTY THE NUMBER OF BREEDING-EWES ANDTHE TOTAL NUMBER OF SHEEP ONTHE 30TH APRIL, 1915. | ||
|---|---|---|
| County. | Sheep, April, 1915. | |
| Total (including Lambs). | Breeding ewes (included in previous Column). | |
* No information. | ||
| Mangonui | 39,187 | 18,077 |
| Whangaroa | 13,020 | 6,944 |
| Hokianga | 46,398 | 25,626 |
| Bay of Islands | 62,135 | 31,270 |
| Whangarei | 64,484 | 32,966 |
| Hobson | 78,036 | 38,441 |
| Otamatea | 62,419 | 37,460 |
| Rodney | 78,641 | 33,031 |
| Waitemata | 49,188 | 25,601 |
| Eden | 2,488 | 713 |
| Great-Barrier | 8,745 | 4,595 |
| Manukau | 45,298 | 22,822 |
| Franklin | 51,903 | 25,755 |
| Coromandel | 36,092 | 18,800 |
| Thames | 5,775 | 2,703 |
| Waikato | 60,777 | 30,816 |
| Raglan | 181,079 | 91,360 |
| Waipa | 33,140 | 18,386 |
| Kawhia | 58,121 | 33,178 |
| Waitomo | 171,146 | 83,399 |
| Awakino | 104,143 | 45,312 |
| Ohinemuri | 6,839 | 4,234 |
| Piako | 42,816 | 20,830 |
| Matamata | 26,861 | 15,840 |
| Tauranga | 11,843 | 7,920 |
| East Taupo | 8,270 | 4,305 |
| Rotorua | 18,569 | 12,028 |
| West Taupo | 20,185 | 10,019 |
| Ohura | 132,521 | 61,794 |
| Whakatane | 39,956 | 19,340 |
| Opotiki | 128,067 | 59,556 |
| Waiapu | 679,660 | 347,897 |
| Cook | 967,606 | 483,010 |
| Waikohu | 576,131 | 297,620 |
| Totals Auckland P.D. | 3,911,539 | 1,971,648 |
| Clifton | 92,520 | 45,973 |
| Taranaki | 34,499 | 18,106 |
| Egmont | 11,375 | 5,133 |
| Stratford | 122,662 | 56,460 |
| Whangamomona | 107,180 | 54,002 |
| Eltham | 63,263 | 27,372 |
| Waimate West | 975 | 709 |
| Hawera | 83,341 | 42,779 |
| Patea | 262,765 | 113,476 |
| Totals Taranaki P.D. | 778,580 | 364,010 |
| Wairoa | 731,077 | 312,874 |
| Hawke's Bay | 1,025,903 | 480,882 |
| Waipawa | 347,828 | 179,146 |
| Waipukurau | 93,010 | 45,935 |
| Patangata | 612,159 | 303,513 |
| Weber | 111,614 | 44,176 |
| Dannevirke | 286,575 | 155,998 |
| Woodville | 96,035 | 51,060 |
| Totals Hawke's Bay P.D. | 3,304,201 | 1,573,584 |
| Pahiatua | 213,609 | 118,099 |
| Akitio | 270,230 | 124,998 |
| Eketahuna | 81,491 | 52,839 |
| Waimarino | 259,434 | 119,123 |
| Kaitieke | 89,481 | 44,456 |
| Waitotara | 210,951 | 102,694 |
| Wanganui | 574,371 | 251,921 |
| Rangitikei | 953,099 | 467,923 |
| Kiwitea | 321,692 | 179,370 |
| Pohangina | 164,469 | 94,419 |
| Oroua | 156,209 | 97,888 |
| Manawatu | 127,137 | 66,787 |
| Kairanga | 117,173 | 67,856 |
| Horowhenua | 163,036 | 74,263 |
| Masterton | 562,408 | 398,881 |
| Mauriceville | 70,903 | 46,473 |
| Castlepoint | 171,985 | 85,907 |
| Wairarapa South | 180,105 | 103,769 |
| Featherston | 405,635 | 206,640 |
| Hutt | 147,085 | 77,049 |
| Makara | 81,093 | 39,970 |
| Totals Wellington P.D. | 5,321,596 | 2,731,325 |
| Sounds | 190,758 | 100,563 |
| Marlborough | 338,942 | 163,437 |
| Awatere | 289,423 | 131,626 |
| Kaikoura | 221,075 | 117,728 |
| Totals Marlborough P.D. | 1,040,197 | 513,354 |
| Collingwood | 15,565 | 6,900 |
| Takaka | 54,000 | 32,491 |
| Waimea | 328,064 | 182,601 |
| Buller | 4,879 | 2,630 |
| Inangahua | 12,411 | 4,963 |
| Murchison | 46,042 | 21,555 |
| Amuri | 429,876 | 217,640 |
| Cheviot | 194,054 | 119,413 |
| Totals Nelson P.D. | 1,084,891 | 588,193 |
| Grey | 29,109 | 13,788 |
| Westland | 35,078 | 17,602 |
| Totals Westland P.D. | 64,187 | 31,390 |
| Waipara | 360,392 | 215,010 |
| Ashley | 128,882 | 71,670 |
| Tawera | 96,896 | 45,093 |
| Selwyn | 250,582 | 134,719 |
| Waimairi | 13,122 | 7,540 |
| Malvern | 157,638 | 76,248 |
| Paparua | 37,352 | 16,982 |
| Heathcote | 8,585 | 4,925 |
| Halswell | 13,278 | 6,598 |
| Springs | 35,191 | 19,772 |
| Ellesmere | 93,095 | 49,211 |
| Mount Herbert | 54,273 | 37,589 |
| Akaroa | 102,739 | 68,137 |
| Kowai | 110,086 | 65,783 |
| Oxford | 122,685 | 59,753 |
| Rangiora | 47,163 | 24,235 |
| Eyre | 58,756 | 33,582 |
| Wairewa | 92,888 | 61,096 |
| Ashburton | 960,790 | 504,070 |
| Geraldine | 368,265 | 201,709 |
| Levels | 205,307 | 114,494 |
| Mackenzie | 522,029 | 264,545 |
| Waimate | 656,290 | 347,780 |
| Chatham Islands | 68,366 | * |
| Totals Canterbury P.D. | 4,564,650 | 2,430,541 |
| Waitaki | 642,626 | 338,673 |
| Waihemo | 146,351 | 82,255 |
| Waikouaiti | 89,249 | 48,991 |
| Taieri | 229,777 | 107,016 |
| Peninsula | 6,802 | 4,007 |
| Bruce | 187,879 | 117,047 |
| Clutha | 396,563 | 212,498 |
| Tuapeka | 465,615 | 205,398 |
| Vincent | 342,812 | 167,201 |
| Lake | 246,213 | 100,934 |
| Maniototo | 348,765 | 167,094 |
| Totals Otago Portion of Otago P.D. | 3,168,734 | 1,526,495 |
| Southland | 1,175,422 | 598,193 |
| Wallace and Fiord | 483,889 | 248,304 |
| Stewart Island | 3,535 | 1,788 |
| Totals Southland Portion of Otago P.D. | 1,662,846 | 848,285 |
| Totals Otago P.D. | 4,831,580 | 2,374,780 |
| Totals for Dominion | 24,901,421 | 12,578,825 |
| NUMBER OF FLOCKS, 1891, 1896, 1901, 1906, 1911, AND 1915. | ||||||
|---|---|---|---|---|---|---|
| Size of Flocks. | 1891. | 1896. | 1901. | 1906. | 1911. | 1915. |
| Under 500 | 8,272 | 12,028 | 11,700 | 11,793 | 11,463 | 11,539 |
| 500 and under 1,000 | 1,691 | 2,605 | 3,059 | 3,431 | 4,366 | 4,728 |
| 1,000 “ 2,000 | 969 | 1,460 | 2,877* | 3,340* | 4,833* | 5,626* |
| 2,000 “ 5,000 | 666 | 892 | ||||
| 5,000 “ 10,000 | 287 | 340 | 397 | 394 | 540 | 558 |
| 10,000 “ 20,000 | 239 | 231 | 189 | 213 | 216 | 191 |
| 20,000 and upwards | 169 | 147 | 138 | 94 | 75 | 38 |
| Totals | 12,293 | 17,703 | 18,360 | 19,265 | 21,493 | 22,680 |
| 1901. | 1906. | 1911. | 1914. | |||
| * From 1,000 to 2,500 | 2,189 | 2,558 | 3,703 | 4,339 | ||
| ” 2,500 to 5,000 | 688 | 782 | 1,130 | 1,287 | ||
| 2,877 | 3,340 | 4,833 | 5,626 | |||
The average size of the flocks is found to have been 1,081 sheep in 1896, 1,116 in 1911, and 1,095 in 1915.
Crossbreds and other longwools comprise over 92 per cent. of the New Zealand flocks, the merino being less suited for freezing. The number of the different classes composing the flocks in April, 1914, and April, 1915, was as follows: —
| North island. | South Island. | Total in Dominion. | ||||
|---|---|---|---|---|---|---|
* Excluding 76,027 sheep, of which the particulars as to classes are not available. | ||||||
| Stud Sheep and Flock | 1914. | 1915. | 1914. | 1915. | 1914. | 1915. |
| Rams— | ||||||
| Merino | 8,891 | 7,648 | 41,204 | 43,828 | 50,095 | 51,476 |
| Lincoln | 83,813 | 87,055 | 8,163 | 9,942 | 91,976 | 96,997 |
| Romney | 227,677 | 238,420 | 89,209 | 89,990 | 316,886 | 328,410 |
| Border Leicester | 8,474 | 7,481 | 80,947 | 74,431 | 89,421 | 81,912 |
| English Leicester | 8,447 | 6,468 | 65,673 | 59,333 | 74,120 | 65,801 |
| Shropshire | 4,614 | 3,781 | 13,587 | 12,244 | 18,201 | 16,025 |
| Southdown | 33,198 | 39,582 | 11,051 | 14,715 | 44,249 | 54,297 |
| Other breeds | 5,356 | 5,638 | 44,315 | 44,265 | 49,671 | 49,903 |
| Totals | 380,470 | 396,073 | 354,149 | 348,748 | 734,619 | 744,821 |
| Flock Sheep— | ||||||
| Crossbred and other longwools | 12,748,581 | 12,892,405 | 9,981,693 | 9,956,980 | 22,730,274 | 22,849,385 |
| Merino | 26,907 | 21,504 | 1,306,963 | 1,208,684 | 1,333,870 | 1,230,188 |
| Grand totals | 13,155,958 | 13,309,982 | 11,642,805 | 11,514,412 | 24,798,763 | 24,824,394* |
Figures showing sheep and lambs slaughtered for food purposes each year since 1905–6, together with the exports of frozen mutton and lamb, are given in the tables following.
| SHEEP. | ||||
|---|---|---|---|---|
| Year ended 31st March. | Sheep slaughtered for Food Purposes. | Weight. | Frozen Mutton exported. | |
| Number. | Number of Carcases, including Pieces at 60 lb. to a Sheep. | Weight. | ||
| Cwt. | Cwt. | |||
| 1906 | 1,897,118 | 1,016,313 | 1,546,722 | 776,116 |
| 1907 | 2,730,448 | 1,462,740 | 2,058,770 | 1,033,055 |
| 1908 | 2,381,264 | 1,275,677 | 1,841,332 | 906,425 |
| 1909 | 2,830,453 | 1,516,314 | 1,866,531 | 927,429 |
| 1910 | 2,793,878 | 1,496,720 | 1,775,090 | 883,361 |
| 1911 | 3,372,150 | 1,806,509 | 2,193,665 | 1,068,881 |
| 1912 | 3,189,527 | 1,708,675 | 1,867,828 | 912,926 |
| 1913 | 3,306,588 | 1,771,386 | 2,208,330 | 1,092,692 |
| 1914 | 4,019,831 | 2,153,570 | 2,557,639 | 1,271,935 |
| 1915 | 3,999,460 | 2,139,889 | 2,522,448 | 1,244,399 |
| for 10 years | 30,520,717 | 16,347,793 | 20,438,355 | 10,117,219 |
| LAMBS. | ||||
|---|---|---|---|---|
| Year ended 31st March. | Lambs slaughtered for Food Purposes. | Frozen Lamb exported. | ||
| Number. | Weight. | Number of Carcases. | Weight. | |
| Cwt. | Cwt. | |||
| 1906 | 2,544,999 | 808,035 | 1,932,214 | 616,823 |
| 1907 | 2,944,271 | 946,364 | 2,666,564 | 818,556 |
| 1908 | 2,862,067 | 919,950 | 2,732,792 | 837,141 |
| 1909 | 3,332,218 | 1,071,070 | 2,629,817 | 873,061 |
| 1910 | 3,675,676 | 1,181,467 | 3,356,702 | 1,049,113 |
| 1911 | 4,044,953 | 1,301,056 | 3,839,922 | 1,167,980 |
| 1912 | 3,192,108 | 1,026,034 | 3,093,091 | 932,835 |
| 1913 | 3,505,986 | 1,126,924 | 2,956,249 | 901,146 |
| 1914 | 4,338,180 | 1,394,415 | 3,854,348 | 1,186,638 |
| 1915 | 4,471,861 | 1,597,093 | 3,692,003 | 1,120,682 |
| Totals for 10 years | 34,912,319 | 11,372,4,08 | 30,753,702 | 9,503,975 |
In addition to the figures given above, it is estimated that 4,500,000 sheep, representing a weight of 270,000,000 lb., and about 550,000 lambs, of a weight of 20,000,000 lb., were killed by fanners for local consumption. It would therefore appear that nearly 1,200,000,000 lb. of mutton and lamb were consumed in the Dominion during the ten years shown. The average annual consumption per head of population, including Maoris, is thus over 110 lb.
The following table, contracted from the last animal report of the Colonial Consignment and Distributing Company (Limited), shows that New Zealand supplies larger quantities of frozen mutton and lamb to the United Kingdom than do either Australia or South America.
| Year. | Imports of Frozen Mutton and Lamb into United Kingdom from | ||
|---|---|---|---|
| New Zealand. | Australia. | South America. | |
| 1905 | 3,707,773 | 1,368,472 | 3,201,486 |
| 1906 | 4,147,834 | 1,732,328 | 2,919,240 |
| 1907 | 4,796,755 | 2,337,961 | 3,015,229 |
| 1908 | 4,234,512 | 1,831,245 | 3,585,786 |
| 1909 | 5,035,094 | 2,678,739 | 3,352,898 |
| 1910 | 5,407,470 | 4,219,012 | 3,353,726 |
| 1911 | 5,223,783 | 3,611,051 | 4,125,350 |
| 1912 | 5,495,251 | 2,883,505 | 3,630,378 |
| 1913 | 5,672,343 | 4,442,201 | 2,820,011 |
| 1914 | 6,180,924 | 3,721,099 | 2,884,832 |
The number of sheep in the several States of the Commonwealth of Australia and in New Zealand for the years 1900, 1905, 1910, and 1914, was as follows:—
| 1900. | 1905. | 1910. | 1914. | |
|---|---|---|---|---|
* Including Northern Territory. † Figures for April following. | ||||
| Queensland | 10,339,185 | 12,535,231 | 20,331,838 | 23,129,919 |
| New South Wales | 40,020,506 | 39,506,764 | 45,560,969 | 36,287,000 |
| Victoria | 10,841,790 | 11,455,115 | 12,882,665 | 12,051,685 |
| South Australia* | 5,283,247 | 6,339,542 | 6,324,717 | 4,278,661 |
| Western Australia | 2,434,311 | 3,120,703 | 5,158,516 | 4,474,613 |
| Tasmania | 1,683,956 | 1,583,561 | 1,788,310 | 1,674,845 |
| Federal Territory | .. | .. | .. | 136,000 |
| New Zealand† | 19,355,195 | 19,130,875 | 23,996,126 | 24,901,421 |
| Total for Australasia | 89,958,190 | 93,671,791 | 116,043,141 | 106,934,144 |
According to figures published in the Year-book of the International Institute of Agriculture at Rome, the total number of sheep in countries from which statistics could be obtained, comprising practically all the sheep-raising countries of the world, was 546,834,000. The principal countries contributing towards this total were:—
| Country. | No. of Sheep. |
|---|---|
| Australia | 85,057,402 |
| Argentina | 83,546,000 |
| Russia | 57,255,196 |
| United States of America | 52,838,748 |
| South African Union | 35,710,843 |
| British India | 31,233,065 |
| United Kingdom | 27,886,095 |
| Turkey | 27,094,678 |
| Uruguay | 26,286,296 |
| New Zealand | 24,798,763 |
| Spain | 15,829,954 |
| France | 14,559,586 |
| Austria-Hungary | 12,337,542 |
| Italy | 11,162,926 |
| Bulgaria | 8,632,388 |
| Algeria | 8,338,023 |
| Germany | 5,803,445 |
| Chile | 4,567,194 |
| Serbia | 3,818,997 |
| Portugal | 3,072,988 |
Wool is the most important product of New Zealand. The annual value of the export is over a third of the value of the total exports of the Dominion, the figures for 1913 and 1914 being—
| 1913. | 1914. | |
|---|---|---|
| £ | £ | |
| Wool | 8,057,620 | 9,318,114 |
| Total exports of New Zealand produce | 22,577,890 | 25,984,717 |
The quantity of wool exported in 1914 was 220,472,898 lb., an increase of 33,939,862 on the quantity exported in the previous year. The annual production of wool for the last twenty years, taking the exports for the twelve months immediately preceding the commencement of shearing, and adding thereto the quantity used in the Dominion for manufacturing purposes, is shown in the next table, but no addition has been made for wool on sheep-skins exported, nor for loss in scouring and washing.
| Year ended 30th September. | Quantity exported. | Quantity purchased by Local Mills. | Total. |
|---|---|---|---|
| lb. | lb. | lb. | |
| 1895 | 129,333,769 | 3,299,132 | 132,632,901 |
| 1896 | 128,309,673 | 3,989,934 | 132,299,607 |
| 1897 | 134,410,955 | 3,298,469 | 137,709,424 |
| 1898 | 150,401,399 | 3,763,831 | 154,165,230 |
| 1899 | 143,644,203 | 4,258,505 | 147,902,708 |
| 1900 | 144,829,515 | 3,223,392 | 148,052,907 |
| 1901 | 143,064,789 | 4,629,924 | 147,694,713 |
| 1902 | 155,652,563 | 4,203,312 | 159,855,875 |
| 1903 | 160,919,693 | 5,294,652 | 166,214,345 |
| 1904 | 141,031,699 | 5,191,451 | 146,223,150 |
| 1905 | 146,889,767 | 3,651,343 | 150,541,110 |
| 1906 | 152,765,232 | 4,372,472 | 157,137,704 |
| 1907 | 164,006,579 | 4,116,722 | 168,123,301 |
| 1908 | 163,930,722 | 4,779,198 | 168,709,920 |
| 1909 | 187,619,181 | 5,202,821 | 192,822,002 |
| 1910 | 194,472,934 | 5,642,113 | 200,115,047 |
| 1911 | 184,854,149 | 6,048,164 | 190,902,313 |
| 1912 | 189,553,723 | 6,234,114 | 195,837,837 |
| 1918 | 195,353,533 | 6,823,545 | 202,177,078 |
| 1914 | 196,499,896 | 6,846,960 | 203,346,856 |
From this table it will be seen that the total for the year ended 30th September, 1914, is the highest yet recorded, being 1,169,778 lb. in excess of that for 1912–13, the next highest.
The following summary is interesting as showing the various classes of wool purchased by the New Zealand mills. Greasy wool represents 96½ per cent. of the total. Nearly half of the wool used at mills is shown to be crossbred, slightly more than one quarter half-bred, and slightly less than one-quarter merino.
| CLASS OF WOOL PURCHASEDBY WOOLLEN-MILLS, 1913–14. | ||||
|---|---|---|---|---|
| Merino. | Half-bred. | Crossbred. | Totals. | |
| lb. | lb. | lb. | lb. | |
| Greasy | 1,604,244 | 1,831,465 | 3,175,658 | 6,611,367 |
| Washed | 11,408 | 17,779 | 7,290 | 36,477 |
| Scoured | 9,927 | .. | 49,087 | 59,014 |
| Sliped | 28,535 | 19,738 | 91,829 | 140,102 |
| Totals | 1,654,114 | 1,868,982 | 3,323,864 | 6,846,960 |
The percentages of greasy, scoured, and washed wool to the total quantities exported during the last ten years are,—
| Year. | Greasy, Per Cent. | Scoured and Sliped, Per Cent. | Washed, Per Cent. |
|---|---|---|---|
| 1905 | 82.09 | 16.62 | 1.09 |
| 1906 | 82.25 | 16.91 | 0.84 |
| 1907 | 83.59 | 15.87 | 0.54 |
| 1908 | 81.60 | 17.35 | 1.05 |
| 1909 | 82.40 | 17.09 | 0.51 |
| 1910 | 83.48 | 16.27 | 0.25 |
| 1911 | 80.63 | 19.16 | 0.21 |
| 1912 | 80.96 | 18.77 | 0.27 |
| 1913 | 83.28 | 16.43 | 0.29 |
| 1914 | 83.45 | 16.28 | 0.27 |
The following diagram shows the increase in the weight of wool exported since 1882, also the great expansion of the frozen-meat trade in the same period:—
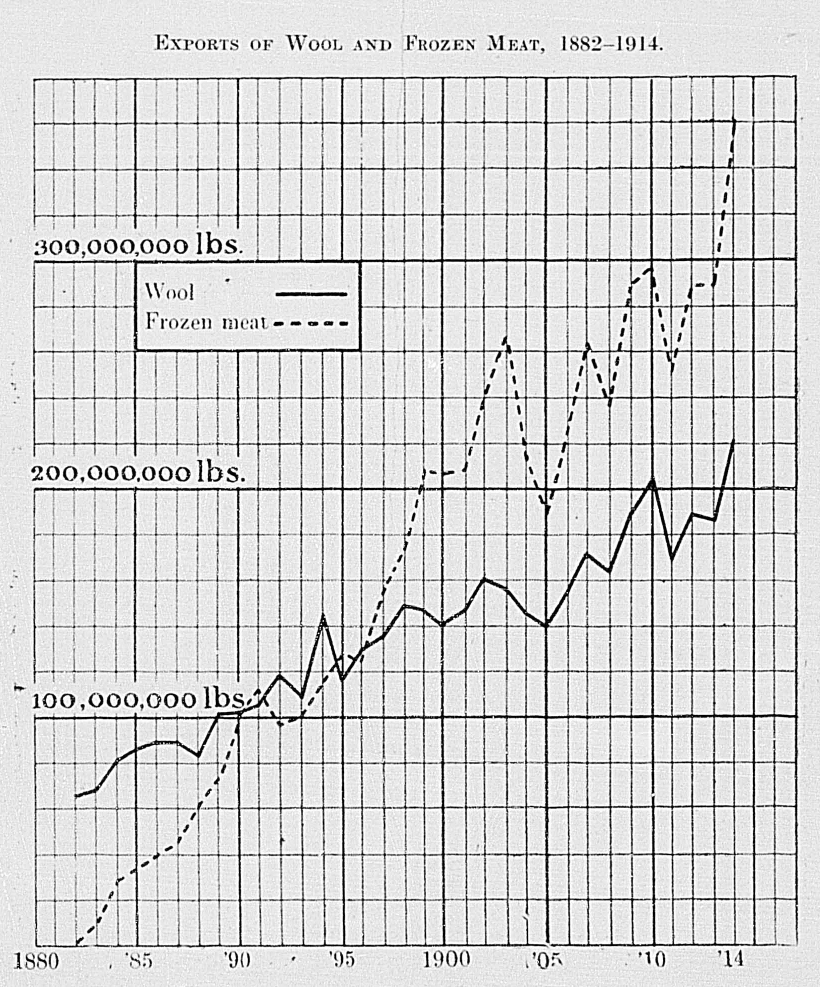
According to information contained in Dalgety's “Annual Wool Review,” the oversea shipments of wool from Australasia for the year ended 30th June, 1915, totalled 2,137,702 bales, or 703,458,464 lb., as compared with 2,527,4,63 bales or 826,924,667 lb. in the previous year, a decrease of 389,761 bales or 123,466,203 lb.
The shipment figures from each State compare as under with the previous season:—
| — | 1913–14 | 1914–15. | ||
|---|---|---|---|---|
| States— | Bales. | lb. | Bales. | lb. |
| Queensland | 387,277 | 127,414,133 | 268,120 | 89,283,960 |
| New South Wales | 853,104 | 281,259,858 | 731,218 | 242,033,158 |
| Victoria | 486,976 | 152,301,744 | 391,626 | 118,662,678 |
| South Australia | 152,930 | 46,031,930 | 101,536 | 31,476,160 |
| Western Australia | 64,921 | 19,541,221 | 65,306 | 19,657,106 |
| Tasmania | 21,368 | 5,747,992 | 17,882 | 5,078,488 |
| Commonwealth | 1,966,576 | 632,296,878 | 1,575,688 | 506,191,550 |
| New Zealand | 560,887 | 194,627,789 | 562,014 | 197,266,914 |
| Australasia | 2,527,463 | 826,924,667 | 2,137,702 | 703,458,446 |
The average value per bale of all the wool sold in Australasia during the past twelve months was £12 15s. 7d., as compared with £13 4s. 11d. for the previous year. The average weight of wool to the bale was 327.2 lb. in 1913–14, and 329.1 lb. in 1914–15.
The following table gives the latest available information as to quantity of wool used annually for manufacturing purposes in certain principal countries.
| AMOUNT OF WOOL USEDFOR MANUFACTURING PURPOSES. | |
|---|---|
| lb. | |
| United Kingdom | 515,000,000 |
| United States | 505,000,000 |
| France | 480,000,000 |
| Germany | 400,000,000 |
| Austria-Hungary | 140,000,000 |
| Italy | 60,000,000 |
The following interesting information with reference to the wool-clip, the local sales, &c., is also extracted from “Dalgety's Annual Wool Review” for the season ended 30th June, 1915. Referring to New Zealand, the Review reports as follows:—
“Speaking generally, the clip from the North Island was better grown and more attractive than its predecessor, the wools being in splendid condition and less infested with seed.
“The Wellington District produced a clip of strong crossbred, the bulk of the fleeces ranging from 36's to 46's quality. The wool opened up very attractively, and although fairly generous in condition, was well-grown and bright, whilst the hoggets' wool in particular was much sounder in the staple than usual. Bidibidi seed was less in evidence than previously. Some very fine Romney wool came on to the Wellington market during the season under review, and also some excellent lines of Romney lambs, the latter being beautifully grown, in bright condition, and very good colour. It is pleasing to note that every year the growers in this district are making genuine efforts to improve the preparation of their clips.
“The Gisborne district wools varied somewhat this year, and though some clips were well grown and in every way attractive, the output, on the whole, was not as good as that of the previous season, the wool, though light in grease, generally lacking lustre and body. The breeders of this district are ardent devotees of the strong Romney-Lincoln cross, which has given better results than any other.
“The clip from the Auckland District was an improvement on the previous one, being well grown, sound, and bulky.
“The Hawke's Bay wools were much heavier in condition than was the case in the previous year, this being particularly so in the lower grades of pieces and coarser wools, and owing to the high westerly winds which prevailed in the autumn, there was a larger proportion of dingy and dusty wool than usual. It was noticed, however, that there was considerably less cotted and tender fleece wool. As the season drew in, and lambs' wool began to come forward in some quantity, the result of the dry season and high winds became more apparent, the wool lacking its usual brightness.
“On the whole, the condition of the wool marketed in Christchurch was disappointing, and compared unfavourably with that of the previous year. The wools were, as a rule, well-grown and sound in staple, but a large proportion of the clips were dusty and heavy in condition. Many of the later shorn wools, though lighter in grease than formerly, were discoloured and somewhat tender. This may be accounted for by the long spell of dry weather and to the prevalence of high winds, causing dust throughout the spring and summer.
“An estimate of the various qualities offered in Christchurch during the past season is as follows:—
| “Merinos | 5 per cent. |
| Corriedales and half-breds (50's to 56's) | 65 “ |
| Crossbreds (below 50's) | 30 “ |
“Throughout the Province of Canterbury, Corriedale sheep seem to be displacing not only merinos, but also some of the coarser-woolled and black-faced British breeds.
“The South Canterbury wools marketed in Timaru were below the average of excellence, being much more dusty than usual, a defect due, as was the case with those sold in Christchurch, to high winds and dust-storms.
“The farther south the less the wools seemed to be affected by dust, and the Otago clip, which is handled principally in Dunedin, proved to be in splendid order, the wool being lighter and brighter than usual, in fact, one of the best seen for years, buyers estimating that the average of wools would yield 2 to 3 per cent. better than that of the previous year's growth.
“The Southland production was again a magnificent one, being in nice condition and exceptionally bright, whilst there was a marked absence of bidibidi seed, due to the lateness of the season. Some of the crossbred clips from Southland and other districts of New Zealand have given extraordinary yields of clean scoured wool, which, together with their peculiar suitability for the khaki trade, has resulted in a very high level of values being established.”
The following table setting out the prices ruling at the Dunedin sales is a good indication as to how values ruled at the New Zealand sales, as, naturally, with the same buyers attending in each centre and sales following one another at very short intervals, the position of the market was reflected at the various selling centres. The figures for the corresponding sales of the two preceding years are given by way of comparison.
| PRICES CURRENT ATTHE DUNEDIN SALES, DECEMBER, 1912, 1913, AND 1914. | |||
|---|---|---|---|
| Description. | December, 1912. | December, 1913. | December, 1914. |
| Per lb. | Per lb. | Per lb. | |
| Merino— | d. | d. | d. |
| Medium to good | 10 to 11½ | 10 to 10¾ | to 10½ |
| Inferior | 8½ to 9½ | 7½ to 9½ | 7½ to 8½ |
| Half-bred and Corriedale— | |||
| Super | 13 to 14¾ | 11½ to 12¼ | 12½ to 15¼ |
| Medium to good | 10½ to 12 | 10 to 11 | 10½ to 12½ |
| Inferior | 9 to 10 | 8 to 9½ | 9 to 10 |
| Crossbred (50's and under) — | |||
| Super | 12 to 13¾ | 9¼ to 11 | 12 to 13½ |
| Medium to good | 9½ to 11½ | 7½ to 8½ | 10 to 11½ |
| Inferior | 8½ to 9 | 5 to 6 | 7½ to 9 |
| Pieces— | |||
| Super | 10½ to 12¼ | 9¼ to 11 | 10 to 12½ |
| Medium to good | 8½ to 10 | 7½ to 8½ | 8 to 9½ |
| Inferior | 6½ to 8 | 5 to 6 | 6½ to 7½ |
| Locks | 4 to 7 | 3 to 4¾ | 3 to 6½ |
At the Dunedin sale on the 20th January, 1915, the crossbred market showed a remarkable rise of from 1d. to 3d. per lb. as compared with the December sales. Merinos were quoted higher by ½d. to 1d., but the inferior lines of half-breds declined by ½d. to ¾d. per pound.
Most of the leading breeds of the cattle of Great Britain are represented in the Dominion by herds bred on sound lines, though the beef-breeds of later years are not making much headway owing to the advance taking place in dairying operations. There are still very many fine Shorthorn herds of the beef type, while Aberdeen-Angus and Hereford cattle are also bred. There are herd-books for each of these breeds.
The breeding of dairy cattle has made considerable progress in recent years. A special Jersey herd-book has been in existence for some time, and herd-book societies are now well established for the Holstein, Ayrshire, and milking Shorthorn breeds as well. The various societies have heartily co-operated in a scheme for establishing registers of merit in connection with purebred dairy cattle, giving a great fillip to the breeding of purebred dairy stock. The ordinary dairy-farmer will be able in future to secure a bull of undoubted milking quality. He will be thus encouraged to use purebred bulls and thereby to assist materially in raising the standard of the dairy stock of the country. The farmer will further support the breeding of purebred stock, by reason of the fact that he is now coming to appreciate; the value of herd-testing work, and thus, knowing the really profitable cows in his herd, will be anxious to secure a bull which will enable thorn to perpetuate their good qualities.
An important factor responsible for the improved position of dairy cattle in New Zealand is the milking-machine, which is making the farmer more independent of hired labour. The farms generally are on a fairly large scale, but with the increasing price of land there is a gradual tendency towards smaller farms and the keeping of fewer but better cows. Also, there is a growing realization of the necessity of a more liberal system of feeding, particularly in the direction of growing special fodder crops to maintain the milk-flow at all seasons of the year. Generally, dairy-farming in New Zealand is being conducted on a sound and profitable basis, and the outlook for the industry is most encouraging.
A policy which has been partly responsible for placing the breeding of dairy cattle on up-to-date principles has been the establishment of purebred herds at three of the State experimental farms, and there breeding them according to an exact record of performance. High-priced stock have been imported in order that the foundation herds at the farms may be of the best quality. The milk of all the cattle is daily weighed and periodically tested, official check tests being conducted by experts of the Dairy Division of the Agriculture Department. The yearling bulls from these State milk-record herds command high values. The appreciation of the farming community for this officially-tested stock has been chiefly responsible for the gratifying manner in which private breeders of pedigree stock have participated in the official - register - of - merit scheme of the Department and the herd-book societies. In the season of 1910–11 the Department established a model herd-testing association in the Wairarapa district, carrying out the work of testing and of recording results free of all charge to the farmers taking part. This had the effect of creating at once wide interest in the important herd-testing movement, and the following season model associations were established in several leading dairying districts. This was intended not only to demonstrate the value of herd-testing when properly conducted and with full comparative records published at the end of the season, but also to encourage farmers to establish co-operative testing associations on their own account. The object was achieved, and many associations are now in operation.
The cattle as enumerated in 1911 for each provincial district are given in the following table, and show an increase over the figures for 1908–9 of 246,845.
| SUMMARY OF PROVINCIAL DISTRICTS. | |||||
|---|---|---|---|---|---|
| Provincial District. | Bulls (all Ages). | Dairy Cows (in Milk and Dry). | Heifers to calve next Season intended for Dairying. | All other Kinds. | Totals. |
| Auckland | 13,114 | 180,386 | 59,411 | 431,476 | 684,387 |
| Taranaki | 6,358 | 134,241 | 31,616 | 125,945 | 298,160 |
| Hawke's Bay | 2,976 | 31,401 | 8,781 | 140,040 | 183,198 |
| Wellington | 8,255 | 114,741 | 31,212 | 272,036 | 426,244 |
| Marlborough | 543 | 7,457 | 1,981 | 10,721 | 20,702 |
| Nelson | 1,142 | 15,148 | 4,080 | 24,669 | 45,039 |
| Westland | 418 | 6,650 | 2,088 | 15,458 | 24,614 |
| Canterbury | 2,837 | 51,829 | 11,506 | 54,018 | 120,190 |
| Otago: Otago prtn. | 2,536 | 46,330 | 8,620 | 47,269 | 104,755 |
| ” Southland portion | 2,691 | 45,550 | 11,050 | 53,591 | 112,882 |
| Totals | 40,870 | 633,733 | 170,345 | 1,175,223 | 2,020,171 |
The large increase in cattle is fairly evenly distributed, the only district showing a decrease being the Otago portion of the Otago Provincia District. The following table shows the respective increases, &c., of the provincial districts:—
| Provincial District. | Increase. | Decrease. |
|---|---|---|
| Auckland | 93,531 | .. |
| Taranaki | 40,767 | .. |
| Hawke's Bay | 15,907 | .. |
| Wellington | 47,040 | .. |
| Marlborough | 2,958 | .. |
| Nelson | 7,827 | .. |
| Westland | 2,954 | .. |
| Canterbury | 19,273 | .. |
| Otago: Otago portion | .. | 6,367 |
| ” Southland portion | 22,955 | .. |
| Totals | 253,212 | 6,367 |
| Net increase | 246,845 |
Out of a total of 2,020,171 cattle, the North Island is shown to have had 1,591,989, or 79 per cent., while the South Island had 428,182, or 21 per cent. The dairy cows and heifers intended for dairying in the North Island numbered 591,789, or 74 per cent., and in the South Island 212,289, or 26 per cent.
The following table shows the number and weight of cattle slaughtered for food purposes in each of the past ten years, together with the weight of beef exported:—
| Year ended 31st March. | Cattle slaughtered for Food Purposes. | Weight of Beef exported. | |
|---|---|---|---|
| Number. | Weight. | ||
| Cwt. | Cwt. | ||
| 1906 | 117,186 | 837,043 | 155,086 |
| 1907 | 173,336 | 1,238,114 | 320,815 |
| 1908 | 202,473 | 1,446,236 | 354,147 |
| 1909 | 273,269 | 1,951,921 | 373,390 |
| 1910 | 300,800 | 2,148,571 | 478,930 |
| 1911 | 286,256 | 2,044,686 | 500,022 |
| 1912 | 237,696 | 1,697,829 | 210,629 |
| 1913 | 259,935 | 1,856,679 | 260,880 |
| 1914 | 299,409 | 2,139,529 | 325,593 |
| 1915 | 347,353 | 2,481,093 | 716,289 |
| Totals for 10 years | 2,497,713 | 17,841,701 | 3,695,781 |
In addition, it is estimated that 35,000 cattle, weighing 250,000 cwt. of beef, were killed by farmers for local consumption between the 1st April, 1906, and the 31st March, 1915. The weight of beef consumed within the Dominion during the ten years may thus be reckoned at 14,395,921 cwt., or an average of 160 lb. per person per annum, or, including Maoris. 152 lb. per annum.
The Dairy Industry Act, 1908, a consolidation of previous legislation, provides for the appointment of inspectors of dairy stock and factories or other places used for the manufacture of dairy-produce, and power is given to condemn or forbid their use, if necessary. The sale of unwholesome milk or other dairy-produce is prohibited, and provision is made for the inspection, grading, and shipping of all such produce exported. Provision is made for the framing of regulations for the registration of dairies, licensing of persons carrying on the manufacture or sale of the produce, registration of trade marks or brands, and for inspection and grading. A line not exceeding £50 may be inflicted for any offence under this part of the Act.
Authority is given for State advances to dairy companies, on the security of their assets, for the purposes of acquiring land, or of erecting buildings and machinery for carrying on the manufacture of dairy-produce. Loans are repayable by equal half-yearly instalments within fifteen years, and bear interest at the rate of 5 per cent. per annum.
The Act also provides for the registration of co-operative dairy companies, and shareholders are protected in the event of certain contingencies.
A short amending Act was passed in 1915, but does not affect the main points of the measure as summarized.
The total quantity of butter exported during the year 1914 was 434,067 cwt. The estimated consumption in New Zealand at 20 lb. per head of population (including Maoris) per annum equals 203,602 cwt. Adding the quantity consumed locally to the quantity exported, the estimated total production of butter for the year would equal 637,669 cwt.
The estimated consumption of cheese for the year 1914, allowing 3 lb. per inhabitant, was 30,540 cwt., and the total quantity exported was 863,776 cwt., making an estimated total production of 894,316 cwt. for the year. An appreciable quantity of cheese is made at private factories and dairies of which no record has been obtained.
The number of butter and cheese factories in each district as in April, 1915, with the output for the previous year, is next shown. The districts shown do not in all cases correspond exactly with the provincial districts of the same name.
| Provincial District. | Number of Factories. | Skimming-stations. | Output. | ||
|---|---|---|---|---|---|
| Butter. | Cheese. | Butter. | Cheese. | ||
| Tons. | ns. | ||||
| Auckland | 54 | 24 | 115 | 13,745 | 1,855 |
| Taranaki | 54 | 99 | 91 | 5,615½ | 19,519 |
| Hawke's Bay | 9 | 19 | 17 | 968 | 2,097 |
| Wellington | 35 | 55 | 45 | 5,602 | 6,800 |
| Marlborough | 4 | 7 | .. | 151 | 720 |
| Nelson | 7 | 4 | 3 | 475 | 336 |
| Westland | 7 | 3 | 4 | 326 | 193 |
| Canterbury | 12 | 15 | 35 | 2,318½ | 1,038 |
| Otago and Southland | 20 | 104 | 35 | 2,131½ | 8,383 |
| Totals, 1915 | 202 | 330 | 345 | 31,332½ | 40,941 |
| ” 1914 | 181 | 293 | 374 | 31,475 | 38,664 |
| ” 1913 | 174 | 276 | 409 | 28,854 | 34,105 |
| ” 1912 | 172 | 224 | 427 | 26,174 | 26,663 |
| ” 1911 | 185 | 218 | 431 | 26,588½ | 23,966 |
| ” 1910 | 189 | 194 | 417 | 24,601½ | 24,037 |
| ” 1909 | 193 | 152 | 419 | 21,155½ | 17,685 |
| ” 1908 | 196 | 147 | 438 | 19,782 | 15,514½ |
| ” 1907 | 212 | 109 | 463 | 23,989 | 10,312 |
| ” 1906 | 211 | 82 | 460 | 22,466¼ | 7,671 |
In addition to the above, in April, 1915, there were 68 private dairies for butter and 24 for cheese, also 63 packing-houses.
The total export of butter and cheese in the past twenty years, and the total quantity of each commodity sent to the United Kingdom, are tabulated:—
| Year. | Total Export of Butter. | Butter exported to the United Kingdom. | Total Export of Cheese. | Cheese exported to the United Kingdom. |
|---|---|---|---|---|
| Cwt. | Cwt. | Cwt. | Cwt. | |
| 1895 | 57,964 | 55,194 | 76,743 | 73,369 |
| 1896 | 71,353 | 60,092 | 71,372 | 58,692 |
| 1897 | 99,002 | 79,849 | 77,683 | 67,681 |
| 1898 | 96,801 | 80,814 | 68,711 | 41,412 |
| 1899 | 136,086 | 121,502 | 69,440 | 40,901 |
| 1900 | 172,583 | 165,871 | 102,849 | 81,908 |
| 1901 | 201,591 | 170,903 | 104,294 | 74,510 |
| 1902 | 253,998 | 170,207 | 74,746 | 50,325 |
| 1903 | 285,106 | 249,016 | 74,780 | 64,661 |
| 1904 | 314,360 | 299,171 | 84,526 | 82,046 |
| 1905 | 305,722 | 282,275 | 88,562 | 85,653 |
| 1906 | 320,225 | 306,739 | 131,206 | 129,321 |
| 1907 | 328,441 | 314,081 | 236,833 | 234,517 |
| 1908 | 229,971 | 211,242 | 280,798 | 276,212 |
| 1909 | 321,108 | 301,693 | 400,607 | 398,619 |
| 1910 | 356,535 | 345,400 | 451,915 | 449,167 |
| 1911 | 302,387 | 283,505 | 439,174 | 435,616 |
| 1912 | 378,117 | 316,857 | 577,070 | 572,562 |
| 1913 | 372,258 | 288,224 | 611,663 | 608,933 |
| 1914 | 434,067 | 361,381 | 863,776 | 859,986 |
Exports of butter to countries other than the United Kingdom in 1914 include 51,599 cwt. to Canada, 7,917 cwt. to the United States, 8,941 cwt. to the South African Union, 995 cwt. to the Society Islands, and 1,049 cwt. to Hawaii.
The South African Union took 1,917 cwt. of cheese; Australia, 1,483 cwt.; and Fiji, 162 cwt.
The quantities of butter and cheese exported continued about equal till the close of the year 1895. During the period 1896–1907 butter assumed the lead, reaching its maximum of comparative importance in 1903, in which year the export was nearly four times that of cheese. A remarkable rise then took place in the cheese exports, and the increase in the exports continued so rapidly that 1914 saw the quantity of cheese practically double that of butter.
The increase in horses is shown for six census years:—
| Census Years. | Number of Horses. | Numerical Increase. | Increase per Cent. |
|---|---|---|---|
| 1886 | 187,382 | ||
| 1891 | 211,040 | 23,658 | 12.63 |
| 1896 | 237,418 | 26,378 | 12.50 |
| 1901 | 266,245 | 28,827 | 12.14 |
| 1906 | 326,537 | 60,292 | 22.65 |
| 1911 | 404,284 | 77,747 | 23.81 |
At the enumeration made in April, 1911, the number of horses was found to have increased to 404,688 (including 404 mules and asses), for which particulars are given. It will be seen that the Provincial District of Auckland had by far the most horses, Otago and Canterbury following, Wellington taking fourth place.
| SUMMARY OF TOTALS. | |||||
|---|---|---|---|---|---|
| Provincial District. | Entires (all Ages). | Geldings over Two Years Old. | Mares over Two Years Old. | Colts and Fillies under Two Years Old. | Total Horses (including Asses and Mules). |
* The totals include 404 asses and mules for 1911, and 519 for 1908. | |||||
| Auckland | 1,245 | 48,550 | 45,843 | 19,578 | 115,216 |
| Taranaki | 182 | 10,319 | 11,931 | 3,979 | 26,411 |
| Hawke's Bay | 280 | 12,063 | 12,050 | 4,524 | 28,917 |
| Wellington | 597 | 25,331 | 26,514 | 8,090 | 60,532 |
| Marlborough | 71 | 3,526 | 3,717 | 1,084 | 8,398 |
| Nelson | 132 | 5,804 | 5,936 | 1,776 | 13,648 |
| Westland | 59 | 1,544 | 1,507 | 669 | 3,779 |
| Canterbury | 678 | 29,523 | 29,966 | 9,840 | 70,007 |
| Otago: Otago portion | 373 | 18,591 | 19,559 | 6,839 | 45,362 |
| ” Southland portion | 201 | 13,132 | 14,081 | 5,004 | 32,418 |
| Totals 1911 | 3,818 | 168,383 | 171,104 | 61,383 | 404,688* |
| 1908 | 3,407 | 155,586 | 153,298 | 51,487 | 363,778* |
| Increase | 411 | 12,797 | 17,806 | 9,896 | 40,910 |
| Increase for horses | 41,025. |
|---|---|
| Decrease for asses and mules | 115. |
The following table shows the number of pigs and angora goats in the Dominion in 1911 compared with 1908. The angora goats, of which however there is not a large number, have more than doubled during the three years. Pigs have increased from 245,092 to 348,754, the rate of increase being 42 per cent. for the period.
| Provincial District. | Pigs. | Goats. | ||||
|---|---|---|---|---|---|---|
| 1911. | 1908. | Increase. | 1911. | 1908. | Increase. | |
| Auckland | 96,538 | 71,895 | 24,643 | 2,349 | 882 | 1,467 |
| Taranaki | 50,660 | 50,265 | 395 | 1,350 | 368 | 982 |
| Hawke's Bay | 13,700 | 8,746 | 4,954 | 375 | 336 | 39 |
| Wellington | 56,575 | 44,472 | 12,103 | 393 | 45 | 348 |
| Marlborough | 6,733 | 3,146 | 3,587 | 613 | 265 | 348 |
| Nelson | 10,563 | 6,865 | 3,698 | 709 | 527 | 182 |
| Westland | 2,606 | 1,782 | 824 | 19 | 5 | 14 |
| Canterbury | 68,209 | 32,073 | 36,136 | 269 | 64 | 205 |
| Otago: Otago portion | 25,499 | 15,773 | 9,726 | 32 | 32 | |
| ” Southland portion | 17,671 | 10,075 | 7,596 | 10 | 2 | 8 |
| Totals | 348,754 | 245,092 | 103,662 | 6,119 | 2,494 | 3,625 |
During the ten years ended the 31st March, 1915, 1,556,388 pigs were slaughtered in New Zealand for food purposes, the weight of pork, bacon, and hams being 1,806,523 cwt. Little of this was exported, and it is estimated that 96.5 per cent. was consumed in the Dominion. Figures showing the slaughter for each of the ten years are given:—
| Year ended 31st March. | Number of Pigs. | Weight of Pork, Bacon, and Hams. | Year ended 31st March. | Number of Pigs. | Weight of Pork, Bacon, and Hams. |
|---|---|---|---|---|---|
| Cwt. | Cwt. | ||||
| 1906 | 72,573 | 84,237 | 1911 | 163,307 | 189,553 |
| 1907 | 100,731 | 116,920 | 1912 | 232,091 | 269,391 |
| 1908 | 108,498 | 125,935 | 1913 | 192,407 | 223,330 |
| 1909 | 139,810 | 162,279 | 1914 | 191,797 | 222,622 |
| 1910 | 113,491 | 131,731 | 1915 | 241,683 | 280,525 |
While poultry-keeping may never come to be regarded as an independent industry in New Zealand, there are specialists who are making a living at it, but these men have exceptional qualifications and manage the business on most up-to-date principles. Poultry-keeping, however, is rapidly extending and is being recognized as a very profitable sideline to the small farmer. New Zealand is favoured in this industry. The White Leghorn breed bred in the Dominion is of a very high standard from an egg-producing point of view. At the egg-laying competitions conducted in Christchurch in 1912 the winning pen of six White Leghorns laid 1,632 eggs, an average of 272 eggs each. The winning pen of six Indian Runner ducks at the same competition laid 1,493 eggs in the 51 weeks, an average of 248 eggs each. The 360 fowls taking part in the egg-laying competition averaged 200.8 eggs for the 51 weeks, the estimated profit per bird over cost of feeding being 12s. 8½d.
The Department of Agriculture has two up-to-date poultry-breeding stations where birds are bred according to egg performance, and sold to farmers and others at a moderate cost. Stock from the Department's plants have occupied prominent positions in the egg-laying competitions. In addition to the Mediterranean breeds, general purpose breeds—Black and White Orpingtons, White Rocks, and White Wyandottes—are also bred according to egg-laying capacity. The offering of sittings of the latter breeds at reduced prices (4s. 6d. to 6s. 6d.) is with the object of encouraging farmers to produce stock which will be profitable as egg-producers while at the same time providing good table carcases. It has been proved that eggs can be shipped to British and American markets under cool temperatures in a highly satisfactory manner. Indeed, the trial shipment sent to London by the Department of Agriculture was declared by Home authorities to be equal to anything reaching that market from abroad, and it was stated that the eggs could fairly be classed as new laid. It is not expected that the export of eggs will, for a considerable time at least, develop into a permanent business, but rather that the shipments will occasionally be made when outside markets favour or to relieve any glut in the Dominion, and thereby maintain values on a payable level on the local markets.
The number of poultry in New Zealand at the time of the census was ascertained to be 3,693,137, which is on increase of 501,533 on the number for the year 1906, this last being 3,191,604.
The figures for 1906 and 1911 in respect of each class of poultry were as under:—
| 1906. | 1911. | |
|---|---|---|
| Fowls | 2,784,269 | 3,215,031 |
| Ducks | 281,999 | 329,230 |
| Turkeys | 77,101 | 97,933 |
| Cease | 44,300 | 45,389 |
| Other poultry | 3,935 | 5,554 |
Fifty-two ostriches have boon included in the number of “Other Poultry” in 1906 and 29 in 1911.
The poultry owned in the North Island numbered 1,926,283, and in the South Island 1,765,674, the remaining 1,180 belonging to the Chatham Islands.
The climate of New Zealand seems to be well adapted for bees, as they rapidly increased from their first introduction in 1839 until about the year 1880, when the foul-brood (Bacillus larvœ) began to deplete the apiaries, and as its deadly infectious nature was not at first recognized, it speedily spread from district to district until the year 1900, when there was scarcely a part of the Dominion free from disease. Beekeeping had at this time begun to attract the attention of many poisons who had hitherto no experience in the work. Many of these, when they found their colonies dying out, simply left them to their fate without trying to combat the disease. This, of course, only encouraged the spread of the infection, as when a colony became weakened other bees attacked it, carrying off the stores of honey containing the germs of foul-brood, thus disseminating them far and wide.
From then on, commercial beekeeping in New Zealand seemed doomed to failure, and it was not until the year 1905 that the Government decided to encourage the industry by the appointment of experts. The services of one of the foremost beekeepers in the country were secured, and two years later the Apiaries Act of 1907 was placed on the statute-book. This Act made the keeping of what is known as the “box” hive (a hive containing no frames) illegal, at the same time making it compulsory for owners to rid their apiaries of diseases.
Through the co-operation of the Department of Agriculture with the apicultural section of the community, four apiary instructors and inspectors supervise the main beekeeping sections of the two Islands, on the lookout for any breach of the Act. These officers give practical instruction on the best methods in management, the producing of honey under the best conditions, and the preparation of the products of the apiaries for the markets. They inspect districts for the purpose of eradicating disease, giving lectures and demonstrations where favourable opportunity occurs.
Each month an advisory column is published in the Journal of Agriculture outlining the particular branches of apiary management that should receive attention during the following month. In this way much assistance is rendered to beginners and those desiring instruction.
The census returns of 1911 show that there are 11,011 persons keeping bees in the Dominion, the total number of colonies being 71,605. With some, beekeeping is a living; with others it is a sideline; and with others again it may be merely a hobby and a means of recreation. These apiarists, principally the first-named class, have organized themselves into a number of associations, of which there are eight at present. To consolidate the whole a national association has been established comprising delegates from district branches. This body meets annually and discusses matters pertaining to improved methods of apiculture and the advancement of the industry.
The important question of marketing products of the apiary to better advantage is now receiving attention, beekeepers having combined to this end by means of a Honey-producers Association. The returns of the apiaries are increasing, and bee-farmers have turned their attention to exportation.
The Department of Agriculture has undertaken at the voluntary request of shippers to carefully grade free of charge all honey for export, as it is desirable to gain the full confidence of buyers in the Home market. It is proposed shortly to make Government grading compulsory, when the exportation of honey is well under way. At the present time shippers are taking advantage of the opportunity to have their produce officially graded before exportation. New Zealand honey goes principally to England, and is therefore graded to suit the requirements of that market.
In general quality, New Zealand honey is amongst the finest the world produces, and compares favourably with French and Italian, which are considered to be the best. These latter bring in open competition 45s. to 57s. 6d. per hundredweight. The New Zealand article has brought up to 56s., the average price being about 42s. 6d
The industry in New Zealand has certainly a bright future before it. The number of hives has probably increased since the last census, and beekeepers are adopting improved methods, leading to an increased production. An export trade is developing, and the Customs returns show that the honey sent out of the country for the year ended 31st December, 1914, was 296,153 lb., valued at £5,168.
In order to encourage the industry, a model apiary has been established at the Ruakura Farm of Instruction in the Auckland Province. This apiary is for the purpose of demonstrating the latest methods connected with honey-production. A limited number of cadets and others desirous of obtaining a knowledge of beekeeping are received each season at the apiary, which is under the supervision of an expert. No fees are charged for instruction, but applicants must find and bear the cost of accommodation, which can be obtained at a reasonable charge close to the farm. The initial experience gained at the apiary forms a good foundation for practical apiculture.
NEW Zealand possesses a large variety of trees in its native forests, there being no fewer than eighty-six different species known to botanists. The majority of these are, unfortunately, useless for commercial purposes to any great extent, through various causes, and, as a matter of fact, the following trees are practically the staple supply of the timber trade: Kauri; totara; rimu (red-pine); kahikatea (white-pine); matai (black-pine).
A short description of these timbers, with information as to the uses to which they are put, is given in former issues of this book. The puriri and rata and the various birches (or beeches, as they should be properly designated) are the only other trees which are used to any extent for general purposes.
All the indigenous trees suitable for conversion into marketable timber are slow of growth, taking under average conditions from one hundred to five hundred years to arrive at maturity. The fact that the young trees require a great deal of shade also militates against attempts to renew the indigenous trees on a large scale for future commercial purposes, and the steps taken in regard to New Zealand trees are rather in the direction of conserving the existing supply as far as practicable while allowing saw-milling to proceed under conditions that will ensure the greatest possible use being made of the timber.
Various steps have, however, been taken to provide for future requirements by planting areas of suitable trees not indigenous to the country.
One of the earlier methods of inducing the planting of suitable trees was by means of “land grants”—a settler being given a free grant of Crown land if he planted a certain portion of his freehold land in suitable trees. In Canterbury, where the system came into force in the early “seventies,” as much as 2 acres of Crown lands for 1 acre put down in plantation was sometimes granted, and every inducement was offered to the settlers to put down part of their farms in plantations. Several large plantations may now be seen in North Canterbury that were established by means of this method, and settlers are now, in many instances, getting good returns for their timber, the Finns insignis trees being cut down for their timber, which is used extensively for outbuildings, and even in a few cases for the construction of dwellings. As, however, the system referred to did not meet the growing needs of the country, it was discontinued, and it came to pass that the methods of State afforestation that had proved so successful in older countries eventually came to be adopted in New Zealand.
As a first step three experimental plantations of various trees, aggregating about 15 acres, were started by the Government on the Kaingaroa Plains, between Taupo and Rotorua. Another plantation of 15 acres was started at Tarukenga, on the Rotorua Railway-line, and another of 6 acres at Mamaku, not far away. These latter plantations were for the purpose of providing timber for railway requirements. Part of the Rotorua Town Bolt was also planted.
Encouraged by the success of these preliminary experiments, a Forestry Branch of the Department of Lands was started in 1896, and three nurseries were established—two at Tapanui and Eweburn in the Otago District of the South Island, and the other at Whakarewarewa, near Rotorua, in the North Island. The idea was conceived that, coincident with railway-extension, one or two central nurseries in each Island were sufficient for the growth of nursery stock, which could be distributed at various places in the district, according as circumstances warranted the extension of the system. Later on another nursery was formed at Hanmer, in the Canterbury District (South Island), and attempts were also made to establish nurseries at Star-borough, in the Marlborough District (South Island), and Ruatangata, near Whangarei (North Island), but from various causes these latter two nurseries, with the plantations attached to them, were not altogether a success, and have been discontinued.
The cost of afforestation operations is defrayed by the sale of timber in State forests, supplemented by contributions from the Consolidated Fund. Owing to the youth of the plantations, and the immaturity of the timber therein, no returns have yet been derived from them, but it is hoped that in a few years' time a small revenue may be received, which will increase as larger thinnings are available for disposal.
On the 31st March, 1915, there were about twenty-one million trees in the four nurseries of the Forestry Branch of the Department of Lands, and six and a half million trees had been sent out during the preceding twelve months. In the eleven plantations a total area of 24,563 acres had been planted with fifty-four million trees, the addition for the year being 2,165 acres. The annual expenditure now averages over £9,700 on the nurseries and about £19,000 on the plantations.
Further information concerning State afforestation is given in the special article on State Afforestation in the 1914 issue of this book. A summary of the findings of the 1913 Forestry Commission is also given, together with a brief account of State assistance to and encouragement of tree-planting by farmers.
Table of Contents
UP to the present time New Zealand's fisheries can scarcely be said to have attained to national importance. With a few exceptions, the fishing-grounds so far worked have been those within easy reach of the principal centres. Beyond them is an immense extent of grounds, a few sections of which have been partly prospected, but of the greater part practically nothing is known regarding the value and extent of its fish-supply.
The 1914 issue of this book contains a short summary of the various fishing-grounds worked, giving information as to the kinds of fish caught in the different sections. A short résumé of experimental trawling operations, which show that the waters round the coast of the Dominion are well stocked with fish, is also given.
In April, 1914, in accordance with arrangements made between the New Zealand and Canadian Governments, Professor Prince, the Canadian Commissioner of Fisheries, arrived in New Zealand to examine into the sea and inland fisheries of the Dominion.
For the inspection and testing of the sea-fisheries the Government steamer “Hinemoa” was used. A cruise round the South Island was commenced on the 14th April and completed on the 30th April. The “Hinemoa” left Wellington again on the 4th May for a cruise round the North Island, Professor Prince leaving the vessel at Auckland for the purpose of commencing an inspection of the lakes, rivers, and fish-hatcheries of the Dominion, and to confer with those interested in fish and fisheries.
A preliminary report has been submitted showing that the professor is very favourably impressed with the extent of New Zealand's coastal fishing-grounds, and the quantity and quality of fish obtainable, and with the possibilities of the inland fisheries of the Dominion. The report contains much interesting information on the subject of fish and fisheries, with valuable suggestions as to how New Zealand's great national asset can best be utilized. Some of the principal recommendations are—
That steps be taken towards defining the territorial limits regarded as essential for the proper preservation of New Zealand's fishery re-sources—say, an eight- or ten-mile limit.
That a State Fisheries Department be created for the administration and preservation of the fisheries, corresponding to the Fisheries Departments of the leading European and American countries.
That, in addition, an Advisory Board be created, composed of representatives of acclimatization societies, so that the Fisheries Department recommended would have the benefit of the knowledge and experience of those formerly engaged in acclimatization work, such acclimatization work in future to be entirely undertaken by the State, together with other activities of the acclimatization societies.
That the work of surveying coastal fishing-grounds be systematized and extended.
That under the recommended Fisheries Department there be instituted a uniform and universal patrol system for the supervision of fish and fisheries.
That extensive experiments be made with a view to establishing the true sea-herring in New Zealand waters.
That State encouragement, in the form of bounties and loans, be given to fishermen to employ larger vessels and more up-to-date methods of handling their catches.
That cold storage be provided, also better facilities for the preparation of chilled and dried fish.
That fishermen and the public generally be educated with regard to fish and fisheries; publications dealing with the subject should be issued, and a system of technical instruction instituted, covering the life-history of fishes, their food, habits, &c., as well as methods of treating them when caught.
The professor notes that the Dominion imports large quantities of canned fish, and points out that if the fishery resources were properly utilized the country, instead of importing fish, could provide an abundant supply for domestic use, and have an extensive export trade as well. Several suggestions are given as to how fish regarded as useless, and the waste products of fish, can be profitably utilized. The eel, which abounds in all inland waters of New Zealand, and which has caused much vexation and expense on account of its depredations among imported fishes, could, it is pointed out, be converted into fish-paste or other forms of diet. If eels could be made use of in this way their numbers would diminish, and one of the serious problems of acclimatization of imported fishes be thus considerably minimized.
Fishes which are recommended for future experiments in acclimatization are—
| Striped bass. | Sockeye salmon. |
|---|---|
| Rocky Mountain trout. | Alberta grayling. |
| Gourami. | Landlocked salmon. |
Professor Prince also suggests the introduction of the terrapin or diamond-backed turtle, the bull-frog, and the pearl-oyster. He generally commends the work of acclimatization of inland fishes hitherto carried out in the Dominion, also the valuable work performed at the Portobello Marine Fish-hatchery.
A site for a marine fish-hatchery was selected at Purakanui, Otago, in 1900, but this being found unsuitable for its intended purpose, another site was chosen at Portobello, in Otago Harbour. The erection of the hatchery was carried out by a Board set up to superintend the work of the hatchery, funds being provided by the State, and grants being made by the Otago Institute, the Australasian Association for the Advancement of Science, and a number of acclimatization societies. The State makes an annual grant towards the maintenance of the hatchery, the buildings and equipment of which have also been added to from time to time.
Experiments have been carried out with a view to introducing English food-fishes to New Zealand waters, and these have been very successful as regards the three species dealt with so far—viz., lobsters, edible crabs, and turbot. Much valuable work has also been done in the direction of hatching the spawn of various indigenous fishes and in making a study of their life habits.
The principal oyster-beds round the coast of New Zealand are those situated in Foveaux Strait, between South and Stewart Islands, and the rock-oyster beds on the east and west coasts of the Auckland peninsula. The Foveaux Strait beds are very extensive, and are considered to be inexhaustible. An official prospecting cruise was carried out in respect of these beds in 1904, resulting in a number of new beds being discovered and reliable information being ascertained concerning the areas and qualities of the various beds.
During the 1914 season 24,793 sacks of oysters, valued at £12,396, were picked from the Foveaux Strait beds. Of these, 3,285 sacks, containing 302,050 dozen oysters, valued at £2,396, were exported to Australia.
The rock-oyster beds of Auckland were worked for many years under a variety of systems, including the leasing of the beds to individuals and the licensing of pickers to take oysters on payment of a fee, but owing to stripping of the beds close seasons had frequently to be proclaimed. For some years an export duty of 6d. per hundredweight was payable on all North Island oysters exported, and in 1899 the export of rock-oysters and also of mangrove-oysters was absolutely prohibited. A further step towards conserving the beds was taken in 1908, when the picking of rock-oysters from the North Island beds was undertaken by the State, private picking being prohibited. A table is given showing the quantity and value of oysters picked and sold by the State each year since the inception of the new system; also the cost of picking and selling, this item including interest and depreciation on the cost of the oil-launches used by the Inspectors. It will be seen that a profit accrues to the State, and the scheme has, moreover, resulted in the conservation of the beds.
| Season. | Oysters sold. | Prices realized. | Cost of picking and selling. |
|---|---|---|---|
* Beds kept closed. | |||
| Sacks. | £ | £ | |
| 1908 | 11,005 | 6,939 | 5,705 |
| 1909 | 7,934 | 4,776 | 4,205 |
| 1910* | .. | .. | .. |
| 1911 | 4,782 | 3,013 | 2,447 |
| 1912 | 7,728 | 5,212 | 4,065 |
| 1913 | 9,069 | 6,168 | 4,798 |
| 1914 | 8,361 | 5,752 | 4,087 |
Large quantities of mangrove-oysters grow on the mangrove-trees in the northern part of Auckland, but there is no market for them in New Zealand. As stated above, the export of mangrove and rock oysters has been prohibited for some years past.
Various attempts were made about fifteen years ago to form artificial oyster-beds, but none of these met with success. A further attempt to plant oysters in Cook Strait is intended to be made in the near future.
In the earlier pact of the nineteenth century New Zealand was the centre of an important whale-fishery, many whaling-stations being established in the North of Auckland and in Cook and Foveaux Straits. The industry gradually declined in importance until at present only two or three stations remain. At Whangamumu, North Auckland, a whaling-steamer, fitted with the most modern appliances for killing and handling whales, has been placed in commission, and a very serviceable whaling plant has been established. The whales caught in this locality are mostly of the hump-back variety, fifty-seven of these being taken last season. These yielded 270 tons of oil and 60 tons of bonedust. Whaling operations are also carried on from Kaikoura and Tory Channel, in Marlborough.
A serious attempt to revive the whaling industry was made some two or three years ago, and a fleet of vessels was sent out from Norway, but their operations did not meet with the success anticipated.
A close season for seals existed in New Zealand from the end of August, 1894, until 1913, but owing to poaching, which it was found impossible to stop, the seals did not increase to any great extent. It was proposed a few years ago to grant licenses for the right to take seals, one of the conditions of which was that a royalty should be paid on each skin. Tenders were invited for the licenses, but none were received. It has not been possible to ascertain the number of skins taken, but 710, valued at £1,159, were exported from the Dominion during 1914.
As early as 1867 attempts were made to introduce English brown trout into New Zealand. The first attempt was not successful, but from ova imported in the two following years and hatched at Opoho the bulk of the trout now inhabiting the streams and lakes of the Dominion have descended. In later years Loch Leven and Scottish brown trout were introduced, as also rainbow trout, perch, carp, and tench.
Beginning in 1874, various attempts were made to introduce salmon into New Zealand. Up to 1889 ova of Atlantic salmon to the number of 474,000 had been imported and the fry liberated in the Aparima River, but no salmon have been caught in that river. Similarly, quinnat-salmon fry were liberated in the Waitaki River about 1878 and in various subsequent years, but up to 1900 none of the fish had been caught. Beginning with 1901, several more shipments of quinnat ova were imported, and at length, in 1905, several specimens of this fish were taken in the Waitaki River, as well as in Oamaru Bay. Every season since 1905 the quinnat salmon have returned to the Waitaki in increasing numbers, and they are now firmly established as an adjunct to the Dominion's fresh-water fisheries. Last season 234,000 quinnat ova were collected in the tributaries of the Waitaki River, of which 25,000 were supplied to the Tasmanian Government, 145,000 were sent to the West Coast for stocking the Hokitika River, and 53,000 were hatched out at Hakataramea.
Ova of the sock-eye or blue-back salmon were imported in 1902, and specimens of this fish were caught in 1907. Further efforts to introduce the Atlantic salmon have also been made in recent years, but at present it is impossible to say whether these have met with success.
Several shipments of whitefish-ova have been made since 1898, the fry being liberated in Lakes Kanieri and Tekapo. Reports as to the fish having been seen are received from time to time, but so far as is known none have yet been caught.
In 1908 the Marine Department approached the City Councils of Auckland, Wellington, Christchurch, and Dunedin to ascertain their views on the question of providing municipal fish-markets, where the fishermen and the public would be brought into closer contact.
On the 4th October, 1912, a fish-market established by the Wellington City Council near the waterfront was opened for business, and has already met with considerable success. The market is open daily from 7 a.m. to 1.30 p.m. Small fish are sold by the bundle if so made up, or at per pound if loose: large fish at per pound: rabbits are also sold (7d. each). All sales are for cash.
Fish is sold either at a price fixed by the consignor or to the best advantage, the latter system being that usually followed by fishermen. The market is in charge of a salesman, the charge for selling being 10 per cent. A smokehouse has been erected, and any surplus fish may be smoked, the charge for smoking being 6d. per dozen.
The general average of prices realized is as follows;—
| Fish. | Price. |
|---|---|
| Kahawai, horse-mackerel | 1d. to 1½d. per lb. |
| Barracouta | 1½d to 2d. “ |
| Warehou, trevalli, john-dory, conger-eels, gurnard | 2d. “ |
| Tarakihi, mullet | 2d. to 2½d. “ |
| Schnapper, hake, kingfish, moki | 2½d. “ |
| Butterfish, blue cod, hapuku | 3d. “ |
| Trumpeter (sliced) | 4d. “ |
| Flat fish, fresh trout (in season), smoked fish other than trout | 6d. “ |
| Trout (smoked) | 8d. “ |
| Whitebait (in season) | 1s. to 2s.” |
| Garfish | 6d. to 1s. per dozen. |
| Oysters | 4d. “ |
During the year ended the 31st March, 1915, fish of an approximate weight of 117 tons was sold at the market, the total amount realized being £3,039, of which £2,352 was handed to the consignors, the balance representing commission and freight charges. The total number of purchases made was 48,381, the average amount per sale being 1s. 3d. A small amount of wholesale trade is done, but no reduction in price is made.
On 21st December, 1914, a fish-market was established by the Auckland City Council in temporary buildings erected on the waterfront. The accommodation consists of receiving and cleaning sheds, three smokehouses and retail shop, chilling accommodation being in the course of construction. The business is conducted by a manager, retail salesman, smoker, and two cleaners, and the results would justify the operation being conducted on a much larger scale.
The market is open from 6 a.m. till 5 p.m. daily, winter and summer. A night staff is kept for receiving and smoking fish for next day's sales. The fish is sold wholesale and retail and a commission is charged to fishermen.
During the first three months ended 31st March, 1915, the following classes of fish were sold:—
| Average Price. | |||||
|---|---|---|---|---|---|
| — | — | Wholesale | Retail. | ||
| s. | d. | s. | d. | ||
| Schnapper | 4,599 bundles | 4 | 0 | 5 | 6 |
| (smoked, per lb.) | |||||
| Large flounder | 1,211 doz. | 4 | 0 | 5 | 6 |
| Small flounder | 306 “ | 1 | 10 | 2 | 6 |
| Fresh mullet | 224 “ | 2 | 6 | 3 | 0 |
| Smoked mullet | 345 “ | .. | 5 | 0 | |
| Hapuku | 916 lb. | 0 | 3½ | 0 | 6 |
| Gurnard | 7 doz. | 1 | 6 | 2 | 3 |
| Brim | 36 “ | 1 | 3 | 2 | 0 |
| Cod | 27 “ | .. | 4 | 0 | |
| Smoked trout | 75 lb. | .. | 0 | 8 | |
| Miscellaneous | 56 doz. | .. | .. | ||
Sales to the 31st March, 1915, totalled £1,288, and £906 was paid over to fishermen, the balance going to pay commission, cartage, and freight.
The number of customers was 17,397, the average amount per sale being 1s. 5¾d.
The registration and licensing of fishing-boats and of boats engaged in taking oysters was made compulsory in July, 1904. A table is appended showing the number licensed at the various ports of the Dominon in each of the past five years.
| FISHING-BOATS LICENSED, 1910–14. | |||||
|---|---|---|---|---|---|
| Port. | 1910. | 1911. | 1912. | 1913. | 1914. |
| Auckland | 244 | 249 | 270 | 341 | 389 |
| Blenheim | 8 | 6 | 9 | 4 | 6 |
| Bluff | 91 | 86 | 87 | 86 | 81 |
| Chatham Islands | .. | 13 | .. | .. | .. |
| Dunedin | 95 | 92 | 80 | 88 | 91 |
| Greymouth | 7 | 6 | 9 | 9 | 9 |
| Hokianga | 14 | 11 | 14 | 18 | 15 |
| Hokitika | 3 | 4 | 3 | .. | .. |
| Invercargill | 36 | 38 | 36 | 34 | 42 |
| Kaipara | 31 | 40 | 43 | 43 | 42 |
| Lyttelton | 199 | 210 | 204 | 221 | 261 |
| Mangonui | .. | 15 | .. | 13 | .. |
| Napier | 62 | 65 | 68 | 57 | 51 |
| Nelson | 51 | 57 | 54 | 70 | 83 |
| New Plymouth | 24 | 29 | 20 | 18 | 20 |
| Oamaru | 30 | 32 | 32 | 31 | 28 |
| Picton | 32 | 36 | 21 | 36 | 32 |
| Poverty Bay | 11 | 11 | 14 | 15 | 28 |
| Russell | 59 | 59 | 55 | 55 | 67 |
| Tauranga | 32 | 30 | 24 | 20 | 32 |
| Thames | 41 | 33 | 41 | 41 | 57 |
| Timaru | 28 | 30 | 26 | 23 | 26 |
| Wanganui | 11 | 6 | 9 | 7 | 13 |
| Wellington | 61 | 57 | 46 | 51 | 70 |
| Westport | 17 | 16 | 14 | 16 | 16 |
| Totals | 1,187 | 1,231 | 1,179 | 1,297 | 1,459 |
The total number of fishing-boats registered during 1914 was 1,568.
Provision exists in the Fisheries Act, 1908, whereby owners of boats and fish-curers may be required to make returns to the Marine Department in such form and in such manner as may be prescribed by the Governor in Council, but advantage of this provision has not yet been taken to enable information to be collected as to quantity of fish caught.
At the census of 1906 an attempt was made to collect information of this nature, and the results obtained are given in the 1914 issue of this book, and in greater detail in the Census volume, 1906. These cannot be taken as complete and reliable, but merely as indicative of the true facts and as demonstrating the existence of the basis of a substantial industry.
An attempt was also made to obtain some account of oyster-gathering, but only 16 returns were received, 14 boats and 33 dredges being covered.
At the census of 1911 further efforts were made to obtain statistics of the fishing industry, but the information obtained was so unreliable and incomplete that no tabulation of the results was carried out. According to the occupations returned on household schedules the number of fishermen and others employed in connection with the industry was 1,442, made up as follows:—
| Fishermen and oystermen | 899 |
|---|---|
| Fish and oyster salesmen | 456 |
| Fish-curers | 87 |
| Total | 1,442 |
The industrial returns collected at the same census showed that 20 fish curing and preserving works were in operation, 59 hands being employed. These works turned out in the year 1910 cured fish to the value of £22,599, tinned fish valued at £5,929, and other products valued at £474.
Included in New Zealand produce exported during the past five years were,—
| Item. | 1910. | 1911. | 1912. | 1913. | 1914. |
|---|---|---|---|---|---|
| £ | £ | £ | £ | £ | |
| Fish | 20,600 | 27,608 | 33,746 | 23,721 | 34,778 |
| Oysters | 2,617 | 2,178 | 2,984 | 2,813 | 2,396 |
| Whale bone | 1,010 | 4,552 | 3,196 | 1,537 | 1,243 |
| Whale-oil | 1,609 | 2,732 | 2,052 | 18,481 | 2,910 |
| Ambergris | .. | .. | .. | 26,800 | 920 |
| Other products of fisheries | 285 | 233 | 222 | 159 | 1,246 |
| Totals | 26,121 | 37,303 | 42,200 | 73,511 | 43,493 |
The value of fish imported in 1914 was £92,058.
Table of Contents
THE natural mineral resources of New Zealand are considerable, and have exercised in the past a most important influence on the development and progress of the Dominion. Gold to the value of £82,953,910 was obtained up to the 31st December, 1914, the value of the export for the year 1914 having been £895,367. In the earliest years the gold was obtained from alluvial diggings, but at the present time the greatest quantity is taken from gold-bearing quartz, which is distributed widely through several parts of the country.
The yield of silver to the end of 1914 amounted to £2,000,799 in value, the quantity exported in 1914 having been 599,162 oz., valued at £62,085.
Of other minerals, the value of the output to the same date amounts to £39,144,633, of which kauri-gum has yielded £17,257,007, and coal £21,338,020.
The quantities and values of precious metals and minerals obtained during the year 1914, and the total value of all mining produce since 1853, are,—
| 1914. | |||
|---|---|---|---|
| Total Value since 1853. | |||
| Oz. | £ | £ | |
| Gold | 227,954 | 895,367 | 82,953,910 |
| Silver | 590,162 | 62,085 | 2,000,799 |
| 827,116 | 957,452 | 84,954,709 | |
| Tons. | |||
| Copper-ore | 3 | 11 | 19,209 |
| Chrome-ore | .. | .. | 38,002 |
| Antimony-ore | .. | .. | 54,941 |
| Manganese-ore | .. | .. | 61,905 |
| Hæmatite-ore | 1 | 25 | 469 |
| Scheelite-concentrate | 204 | 21,498 | 124,696 |
| Mixed minerals | 5,191 | 7,726 | 218,125 |
| Coal | 2,275,593 | 1,268,505 | 21,338,020 |
| Kauri-gum | 8,473 | 497,444 | 17,257,007 |
| Shale | 21 | 21 | 7,236 |
| £2,752,682 | £124,074,319 | ||
In the case of gold and silver and certain of the other minerals mentioned the figures refer to the export. The export of gold and silver was prohibited during the latter part of 1914, so that the production for the year would be in excess of the amounts shown.
The total value of mineral production for Australasia to the end of the year 1913 is shown in the following table:—
| State. | Gold. | Silver and Lead. | Copper. | Tin. | Coal. | Other Minerals. | Totals. |
|---|---|---|---|---|---|---|---|
*Inclusive of kauri-gum, £16,759,563. | |||||||
| £ | £ | £ | £ | £ | £ | £ | |
| Queensland | 76,346,598 | 2,379,777 | 12,608,577 | 8,454,373 | 5,781,002 | 2,189,027 | 107,759,354 |
| New S'th Wales | 60,098,678 | 64,395,767 | 12,382,835 | 9,748,901 | 72,858,063 | 19,515,232 | 238,999,476 |
| Victoria | 293,550,928 | 222,009 | 218,590 | 789,639 | 2,737,330 | 446,347 | 297,964,843 |
| South Australia | 948,610 | 340,254 | 28,235,538 | … | … | 1,534,746 | 31,059,148 |
| N'th'u Territory | 2,078,938 | 77,047 | 329,888 | 354,424 | … | 47,102 | 2,887,399 |
| W'st'n Australia | 114,880,572 | 794,480 | 1,234,865 | 1,135,427 | 1,223,049 | 85,714 | 119,374,107 |
| Tasmania | 7,549,158 | 6,578,745 | 10,632,645 | 12,504,583 | 598,330 | 222,016 | 38,085,479 |
| New Zealand | 82,058,543 | 1,938,714 | 19,198 | 20,069,515 | 17,260,642* | 121,346,612 | |
| Totals | 637,512,025 | 76,726,793 | 65,682,136 | 32,987,349 | 103,257,289 | 41,300,826* | 957,476,418 |
Gold-mining operations in New Zealand are divided into three branches, viz.: (1) Quartz-mining, (2) alluvial mining, and (3) dredging.
The statement following shows for the year 1914 the value of the bullion production and dividends declared by gold-mines, also the number of persons ordinarily employed, and the number of mines and dredges working:—
| — | Production of Bullion (including Silver). | Dividends paid. (By Registered Companies only.) | Number of Persons ordinarily employed. | Number of Working Mines, Dredges, and Claims. |
|---|---|---|---|---|
| £ | £ | |||
| Quartz-mining | 1,154,214 | 288,265 | 2,863 | 61 |
| Dredging | 191,112 | 23,080 | 491 | 64 |
| Alluvial mining | 157,323 | 10,992 | 1,054 | 258 |
| Totals, 1914 | 1,502,649 | 322,377 | 4,408 | 383 |
As regards dredging, the bullion-production is from sixty-four dredges, but the dividends given are from only sixteen of those, the property of registered companies. The profits of privately owned dredges and mines are unobtainable.
The number of alluvial claims is 258, but the dividends are ascertainable only from those few that are the property of registered companies.
The most important gold-mining operations in New Zealand consist in the working of quartz lodes and the extraction of the precious metals therefrom by means of stamp and tube mills and by cyanidation. Quartz-mining is conducted in the North Island in the Ohinemuri, Thames, and Coromandel Counties. The mountain-ranges and hills of andesite and dacite which form the Hauraki Gold fields are intersected by lodes impregnated with gold and silver. In the South Island the most important quartz-mining operations are carried out in the Reefton and Blackwater districts, also in the Wakamarina Valley (Marlborough). In Otago, where formerly gold-quartz mining was profitably carried on, the only operations are in connection with the working of quartz-mines in which scheelite is associated with gold.
The following is a statement showing the tons of ore treated, the value of bullion produced, and the amount of dividends paid by quartz-mining companies in each of the inspection districts during the years 1913 and 1914:—
| Inspection District. | Tons of Ore treated. (2,240 lb.) | Value of Bullion. | Dividends paid. (By Registered Companies only.) | |||
|---|---|---|---|---|---|---|
| 1913. | 1914. | 1913. | 1914. | 1913. | 1914. | |
| £ | £ | £ | £ | |||
| Northern (North Island) | 327,590 | 347,194 | 865,619 | 911,733 | 260,188 | 266,165 |
| West Coast (of South Island) | 126,260 | 148,069 | 201,987 | 239,237 | 26,900 | 22,100 |
| Southern (Otago and Southland) | 10,658 | 6,076 | 4,207 | 3,244 | .. | .. |
| Totals | 464,508 | 501,339 | 1,071,813 | 1,154,214 | 287,088 | 288,265 |
Alluvial gold is found chiefly on the west coast of the South Island and in Otago, where mining operations have been conducted over an area of 17,000 square miles. On the West Coast the auriferous alluvium originated from the weathering and denudation of the gold-bearing lodes during countless ages. The rich leads or defined placers of auriferous wash are the result of concentration. The first transportation of auriferous gravel from the mountains was by streams, and following this the glaciers carried much material from the interior seawards. On the retreat of these glaciers immense masses of drift were deposited all over the low lands and even high up on the lower hills. Since glacial times the rivers have continued the movement of auriferous gravel from the interior to the sea. In Otago the conditions are different—the alluvial gold rests in the hollows of the denuded surface of the schistose rocks from which it has most probably been derived.
The method of working these deposits depends on the depth of the superincumbent strata and the elevation at which they occur; for if there is ample fall and a good supply of water hydraulic sluicing has been generally adopted; but where the material is mainly or partly below water-level, and is comparatively free from hard boulders or hard matrix, hydraulic sluicing and elevating or dredging is employed. Although no developments of importance occurred in this branch of the gold-mining industry during 1914, yet with the addition of new sluicing plants being laid down to deal with low-grade gravel on a large scale the future prospects are favourable to at least the maintenance of the present output. The production in 1914 was valued at £157,323, as against £295,704 in 1913. The approximate value of gold won by alluvial mining in New Zealand up to the 31st December last is set down at £46,000,000.
This system of gold-mining, which originated in New Zealand, is generally employed upon rivers and streams and at places where the sluicing method may not be advantageously applied owing to absence of water-supply or to excessive water in the deposits. Gold-dredging is rapidly declining in importance, the number of productive dredges having decreased from 201 during 1902, when dredge mining was at its zenith, to sixty-four during 1914. On the west coast of the South Island six dredges were in commission in. 1914, while in Otago and Southland the fleet consisted of fifty-eight dredges.
The greatest weekly output by a New Zealand gold-dredge was attained by the “Lady Ranfurly” during six days ended the 4th November, 1904, when operating on the River Molyneux (Clutha), 1,273 oz. of gold being obtained. This dredge was owned by the Electric Gold-dredging Company, which at the end of 1914 had produced by dredging gold to the value of £227,233, of which £130,643 was distributed as dividends. During 1914 the most productive dredge was the “Worksop” operating at Antonio's Flat, near Reefton, which obtained gold to the value of £14,600, of which £6,150 was distributed as dividends. During the past four years this dredge has obtained gold valued at £64,287.
The following table shows the result of dredge - mining operations in New Zealand during the past nine years:—
| Dividend-paying Dredges owned by Registered Companies. | ||||||
|---|---|---|---|---|---|---|
| Year. | Total Number of Dredges working. | Value of Production. | Average Production per Dredge. | Number. | Dividends. | Number of Persons employed |
| £ | £ | £ | ||||
| 1906 | 167 | 505,199 | 3,025 | 66 | 103,722 | .. |
| 1907 | 128 | 419,634 | 3,278 | 65 | 89,707 | 1,150 |
| 1908 | 123 | 373,818 | 3,039 | 47 | 75,800 | 1,013 |
| 1909 | 111 | 327,676 | 2,952 | 37 | 56,788 | 893 |
| 1910 | 104 | 315,237 | 3,031 | 35 | 51,918 | 838 |
| 1911 | 93 | 297,900 | 3,203 | 31 | 45,318 | 775 |
| 1912 | 87 | 257,333 | 2,958 | 28 | 38,841 | 694 |
| 1913 | 74 | 195,848 | 2,646 | 11 | 18,750 | 621 |
| 1914 | 64 | 191,112 | 2,986 | 16 | 23,080 | 491 |
The gold-yield of Australia and New Zealand (in fine ounces) during the years 1900, 1905, 1910, and 1913 was as follows:—
| 1900. | 1905. | 1910. | 1913. | |
|---|---|---|---|---|
| Fine Ounces. | Fine Ounces. | Fine Ounces. | Fine Ounces. | |
* Including Northern Territory. | ||||
| Queensland | 676,026 | 592,622 | 441,402 | 265,735 |
| New South Wales | 252,116 | 274,267 | 188,857 | 149,657 |
| Victoria | 760,319 | 747,163 | 570,363 | 434,933 |
| South Australia* | 19,418 | 18,086 | 11,703 | 9,664 |
| Western Australia | 1,414,312 | 1,955,317 | 1,470,633 | 1,314,044 |
| Tasmania | 74,445 | 73,540 | 37,048 | 33,400 |
| New Zealand | 338,912 | 492,954 | 446,431 | 343,595 |
| Totals | 3,535,548 | 4,153,949 | 3,166,437 | 2,551,028 |
The value is as follows: 1900, £15,018,040; 1905, £17,644,846; 1910, £13,450,158; 1913, £10,836,072.
The following figures showing the world's gold-production are taken from the Statistical Abstract of the United States:—
| World's Gold-production, 1903–12. | |
|---|---|
| Year. | Fine Ounces. |
| 1903 | 15,852,620 |
| 1904 | 16,804,372 |
| 1905 | 18,396,451 |
| 1906 | 19,471,080 |
| 1907 | 19,977,260 |
| 1908 | 21,422,244 |
| 1909 | 21,965,111 |
| 1910 | 22,022,180 |
| 1911 | 22,348,313 |
| 1912 | 22,549,335 |
Nearly the whole of the silver-production of New Zealand, amounting in value at the end of 1914 to £2,000,799, was obtained from the refinement of bullion from the quartz-mines, principally from those of the Hauraki Goldfield, where the two precious metals are found alloyed as an electrum, the ratio of the two metals in the alloy varying greatly. No other silver-mining operations have been carried out profitably in this country. Recently, however, the Silverstream Mines (Limited) have developed lodes near Maratoto which contain hessite or telluride of silver. A shipment to Australia of 31 tons of ore produced bullion valued at £1,115.
Scheelite, one of the principal ores of tungsten, is mined at the gold-scheelite-quartz mines at Macrae's Flat, Mount Judah, and Lake Wakatipu, Otago; also at Wakamarina Valley, Marlborough; at which places milling and concentrating plants have been installed.
The uses of tungstic acid are various—viz., as a mordant in calico-printing, as a constituent in some finer grades of paint, for the manufacture of electric-light filaments, and for rendering fabric non-inflammable. Its greatest use, however, is in the manufacture of steel of the highest grade, such as that required for lathes and for inner tubes of big guns. It imparts to the steel great density, toughness, and hardness. Scheelite occurs commonly in Otago in mica-schist and altered sedimentary rocks. At Macrae's it is found in bunches and stringers through well-defined quartz lodes, the scheelite being generally associated with gold; but where the finest deposits occur gold is scarce. In Marlborough, at the new Dominion Consolidated Development Company's Mine, the scheelite occurs associated with gold in a strong quartz lode.
The ore, after crushing and concentration to about 65 per cent. tungsten trioxide, is shipped to England. Seventeen scheelite-mines were in operation during 1914.
The following statement shows the quantity and value of scheelite exported since the year 1899:—
| Year. | Quantity exported. | Value. |
|---|---|---|
| Tons. | £ | |
| 1899 | 32 | 2,788 |
| 1900 | 54 | 2,635 |
| 1901 | 2 | 83 |
| 1902 | 39 | 1,200 |
| 1903 | 42 | 1,439 |
| 1904 | 17 | 791 |
| 1905 | 28 | 1,848 |
| 1906 | 55 | 3,407 |
| 1907 | 137 | 15,486 |
| 1908 | 68 | 6,055 |
| 1909 | 58 | 4,263 |
| 1910 | 143 | 15,070 |
| 1911 | 138 | 11,853 |
| 1912 | 135 | 13,347 |
| 1913 | 221 | 22,933 |
| 1914 | 204 | 21,498 |
| Totals | 1,373 | 124,696 |
Almost every known variety of iron-ore has been discovered in New Zealand. At Parapara, near Nelson, immense quantities of limonite ore occur on the surface of the ground. When converted, the product is of the variety called white iron. Another deposit, about 60 ft. thick, is that on the west side of Mount Peel. This ore contains 56 per cent. of metallic iron, and has been traced a distance of three miles, beyond which point it is reported to swell out to as much as a mile in width. An extensive and valuable deposit (limonite and glauconite) occurs on the western slope of Mount Royal, Otago. It contains about 37 per cent. of the metal, and as regards both quality and position this deposit is of importance.
Samples of outcrop ore taken from the Parapara deposit some years ago were found to contain 51.38 per cent. of metallic iron. By means of prospecting-drives during 1913 more definite information concerning the ore has been obtained, and the samples analysed showed the percentage of metallic iron to be 45.02. A comparison of the surface ore and ore taken from the drives is given:—
| Outcrop Ore: Average of 28 Samples. | Ore from Drives: Average of 15 Samples. | |
|---|---|---|
| Per Cent. | Per Cent. | |
| Silica | 9.56 | 16.42 |
| Alumina | 3.36 | 5.39 |
| Ferric oxide | 71.25 | 64.32 |
| Ferrous oxide | 1.94 | .. |
| Manganous oxide | 0.65 | 0.71 |
| Lime | 0.51 | .. |
| Magnesia | 0.10 | 0.16 |
| Titanium-oxide | 0.63 | 0.49 |
| Phosphoric anhydride | 0.35 | 0.31 |
| Sulphuric anhydride | 0.21 | 0.18 |
| Carbon-dioxide | 0.10 | 0.46 |
| Alkalies | 0.08 | |
| Water, and loss on ignition | 11.84 | 11.56 |
| 100.58 | 100.00 | |
| Equivalents. | ||
| Metallic iron | 51.38 | 45.02 |
| Phosphorus | 0.15 | 0.13 |
| Sulphur | 0.08 | 0.075 |
The Parapara deposit occurs about a mile south-west of the Parapara River. It is estimated that the main deposit contains nearly 64,000,000 tons of ore, but in the absence of any system of prospecting this estimate must not be regarded as in any way conclusive. There is a large deposit of nearly pure crystalline limestone on the banks of the Parapara River which would be valuable as a flux for use in blast furnaces.
In the form of sand, the chief deposits are on the seashore of the west coast of both islands, the best known being that near New Plymouth. The Taranaki ironsand has been the subject of many experiments to determine the best method of smelting it. A variety of articles have been manufactured from the product of the sand and submitted to experts, who have expressed a favourable opinion as to quality.
As the result of successful experiments in the treatment of Taranaki ironsand at the metallurgical works of the Waihi Gold-mining Company at Waikino, it is proposed to erect an experimental blast furnace near New Plymouth. The process to be adopted consists in the briquetting of 60 per cent. ironsand with 40 per cent. small coal from the Liverpool State Colliery, the coke from which contains only 0.25 per cent. sulphur. The briquettes will then be coked before introduction into the furnace. It is claimed by the patentees that by this process the titanic anhydride in the ironsand, amounting to from 8 to 9.2 per cent., will be eliminated in the furnace. If this process proves successful the iron industry may be established on the shores of Taranaki.
By the Iron and Steel Industries Ant, 1914, provision was made for the payment of bounties at the rate of 12s. per ton on pig-iron and £1 4s. per ton on puddled bar iron and steel respectively, to cover a period of three years, and with a proviso that the total sum payable as bounty shall not exceed £150,000. Regulations have since been gazetted prescribing the minimum quantity, also the standard quality of the bounty goods.
Ores of copper are found in New Zealand in no fewer than thirty-two localities, but hitherto attempts at their successful exploitation have been unprofitable, the total recorded copper-production at the end of 1914 amounting in value to only £19,209.
Copper-mines have been worked on Kawau and Great Barrier Islands in the Hauraki Gulf, and on the Dun Mountain, near Nelson. Under-ground prospecting has been carried on near Kaeo, Whangaroa; at Maharahara, near Woodville; and at Mount Radiant, near Karamea; but operations at all the last-named places were discontinued, presumably owing to shortage of capital, before any conclusive results were obtained.
At Maharahara a strong siliceous hæmatite lode in the Ruahine Range carries small but rich bunches of chalcopyrite. At Mount Radiant strong quartz lodes in porphyritic granite country carry small bunches of chalcopyrite moderately high in copper, but very low in gold and silver contents; molybdenite is also present.
On the Run Mountain, near Nelson, several copper-bearing minerals occur in much-shattered serpentine rocks, and in small and scattered lenses, which are inconsiderable in both horizontal and vertical extension.
Manganese-ore has been found at Otau, Wairoa, Bay of Islands, Purua Bay, Mangapai, Otonga, Waiheke Island, and Taieri Mouth. The principal operations have been carried on at Waiheke Island, distant about twelve miles from Auckland. On that island manganese-ore may be traced for several miles, where it occurs in massive but bunchy form and of excellent quality, bulk analyses returning 56.5 per cent. metallic manganese. Some thousands of tons have been exported, but it is supposed that fluctuating prices prevented expansion of this industry. The total quantity of manganese-ore exported amounted at the end of 1914 to 19,364£ tons, value £61,905.
Manganese-ore is used for the generation of chlorine, for bleaching purposes, also for calico-printing. The value of the common ore ranges between £3 and £4 per ton f.o.b.
This, the only valuable ore of quicksilver, occurs at Ohaeawai, near Lake Omapere, Bay of Islands, associated with large masses of pyrite, and is now being deposited from hot solutions brought up by thermal springs. An attempt was made some years ago by an English syndicate to work these deposits, but the large volume of sulphuretted hydrogen gas and intense heat of the ground led to the abandonment of operations.
At Mackaytown, near Karangahake, a lode of flint and quartz traversing andesite rocks carries small bunches of cinnabar containing about 10 per cent. of quicksilver, with occasional very rich specimens. The lode has been traced for about 15 chains on the face of the hill above the township. A few years ago an Auckland syndicate erected a Novak furnace and roasted about 50 tons of ore, but very little quicksilver was recovered.
In Otago samples of cinnabar were found in the early alluvial diggings at Nevis, Nokomai, Waipori, and Waitahuna. Some prospecting was done, and some rich ore was taken out at a shallow depth, but until 1899 there was no underground development. During that year a low-level crosscut was commenced near Waitahuna, in Tuapeka County; this intersected a lode at a distance of 231 ft., and a level 300 ft. in length was subsequently driven upon the lode, but as no ore was found in the level operations ceased.
Cassiterite in the form of “stream-tin” occurs near Port Pegasus, Stewart Island, where it has been worked to some extent. “Lode-tin” has been found in the same locality, and is now being prospected. Small quantities of cassiterite have also been detected in the stream-gravels of the Reefton, Greymouth, and Westport districts. Among other localities an which traces of tin occur are Wet Jacket Arm (Otago) and Campbell Island.
Coal, varying in grade from anthracite to lignite, occurs in many parts of New Zealand. In proportion to the present yearly consumption of somewhat under 2,500,000 tons (about 10 per cent. of which is imported) the supply may be considered relatively large, but in comparison with probable future needs it is decidedly small. It is likely, indeed, that the proved coal resources of the Dominion will be practically exhausted within a hundred years.
The following is an approximate estimate of the proved and probable coal in New Zealand:—
| Class of Coal. | Proved. | Probable. | Possible. |
|---|---|---|---|
| Imperial Tons. | Imperial Tons. | ||
| Anthracite | Very little | Very little | Small. |
| Bituminous | 374,000,000 | 477,000,000 | Moderate. |
| Semi-bituminous | 114,000,000 | 341,000,000 | Moderate. |
| Brown | 234,500,000 | 728,000,000 | Large. |
| Lignite | 278,500,000 | 839,000,000 | Large. |
| Totals | 1,001,000,000 | 2,385,000,000 | Large. |
No individual coal-seam has yet been traced for more than a few miles in any direction. The variations in thickness are extraordinary. There are many instances of seams of 10 ft. to 20 ft. thick thinning to 1 ft. or 2 ft. in distances of a quarter of a mile or less. The following instances of thick seams may be mentioned: In the Waikato district (Auckland), 50 ft. to 60 ft. of brown coal; in the Buller-Mokihinui district (Nelson), 53 ft. of bituminous coal; in the Kaitangata district (Otago), 30 ft. or more of brown coal; at Coal Creek, near Roxburgh, Central Otago, 80 ft. (or, according to Professor Park, 100 ft.) of lignite; at Nightcaps (Southland), 36 ft. of brown coal in three bands.
In New Zealand the difficulties in settling the relative ages of the principal coalfields are such that for many years the subject has been a controversial one. The known facts may be summarized as follows: Ira south-east Otago (Waikawa, Catlin's River) and in Southland (Hokonui Hills) small seams of coal occur in Jurassic rocks, but in no case is a workable seam known to be present. The chief coal-bearing rocks are probably of early Tertiary age, but late Cretaceous coal-seams almost certainly occur. There are also considerable quantities of lignite of Miocene, Pliocene, and possibly even Pleistocene age.
The following is a table showing the output of coal from each coalfield:—
| Coalfield. | Class of Coal. | Output during 1914. | Total Output to End of 1914. |
|---|---|---|---|
| Imperial Tons. | Imperial Tons. | ||
| North Auckland | Semi-bituminous | 141,133 | 3,268,246 |
| Waikato | Brown | 295,442 | 3,769,526 |
| Mokau | ″ | 3,878 | 88,998 |
| Nelson | Bituminous | 16,574 | 255,895 |
| Buller | ″ | 818,176 | 12,976,087 |
| Inangahua | ″ | 11,362 | 240,956 |
| Grey | ″ | 505,070 | 7,637,142 |
| Canterbury | Lignite | 11,707 | 683,178 |
| Otago | Brown and lignite | 312,685 | 8,277,981 |
| Southland | ″ | 159,566 | 2,426,403 |
| Totals | .. | 2,275,593 | 39,624,412 |
The following statement shows the tons of coal and shale raised, persons employed, lives lost, &c., from 1895 to 1914:—
| Year. | Output of Mineral. | Persons employed. | Tons of Mineral raised per Person employed Under-ground. | Tons of Mineral raised per Life lost. | Persons employed per Life lost. | Lives lost per Thousand Persons employed. | Number of Lives lost. |
|---|---|---|---|---|---|---|---|
* Year of Brunner explosion. † All the principal collieries were rendered idle by the strike during November and December. ‡ Year of Ralph's (Huntly) explosion. | |||||||
| 1895 | 726,654 | 1,799 | 618 | 145,331 | 360 | 3.33 | 5 |
| 1896* | 792,851 | 1,937 | 588 | 12,013 | 29 | 34.07 | 66 |
| 1897 | 840,713 | 1,912 | 609 | 210,178 | 478 | 2.09 | 4 |
| 1898 | 907,033 | 2,003 | 627 | 907,033 | 2,003 | 0.49 | 1 |
| 1899 | 975,234 | 2,153 | 609 | 325,078 | 717 | 1.39 | 3 |
| 1900 | 1,093,990 | 2,460 | 593 | 273,497 | 615 | 1.62 | 4 |
| 1901 | 1,239,686 | 2,754 | 600 | 413,228 | 918 | 1.09 | 3 |
| 1902 | 1,365,040 | 2,885 | 655 | 682,520 | 1,443 | 0.69 | 2 |
| 1903 | 1,420,229 | 2,852 | 665 | 355,057 | 713 | 1.40 | 4 |
| 1904 | 1,537,838 | 3,288 | 609 | 384,459 | 822 | 1.21 | 4 |
| 1905 | 1,585,756 | 3,269 | 651 | 264,293 | 546 | 1.83 | 6 |
| 1906 | 1,729,536 | 3,692 | 687 | 288,256 | 615 | 1.62 | 6 |
| 1907 | 1,831,009 | 3,910 | 662 | 152,584 | 326 | 3.07 | 12 |
| 1908 | 1,860,975 | 3,894 | 641 | 372,195 | 778 | 1.28 | 5 |
| 1909 | 1,911,247 | 4,191 | 633 | 273,035 | 599 | 1.79 | 7 |
| 1910 | 2,197,362 | 4,599 | 634 | 137,335 | 283 | 3.55 | 16 |
| 1911 | 2,066,073 | 4,290 | 706 | 147,577 | 306 | 3.26 | 14 |
| 1912 | 2,177,615 | 4,328 | 681 | 241,975 | 355 | 2.08 | 9 |
| 1913† | 1,888,005 | 4,250 | 590 | 314,667 | 708 | 1.38 | 6 |
| 1914‡ | 2,275,614 | 4,734 | 639 | 46,441 | 96 | 10.35 | 49 |
The State Coal-mines Act of 1901 provided for the acquisition and working of State coal-mines in New Zealand under the direct control of the Minister of Mines.
In pursuance of such authority two mines were acquired—viz., the Point Elizabeth Mine, situated on the Grey Coalfield, and distant about five miles from Greymouth, and the Westport-Cardiff Mine (subsequently renamed the Seddonville Mine), situated on the Buller Coalfield, and distant by Government railway about twenty-nine miles from Westport. The coal produced from the coalfields in which these two mines are situated is of bituminous class, and is recognized as a superior coal for general purposes. In 1902 the Point Elizabeth Mine, included within a lease of about 4,840 acres, was taken over by the State from the Grey mouth-Point Elizabeth Railway and Coal Company. The sum of £21,000 was paid by the Government to this company for the partly constructed line of railway from the mine to Greymouth, and the line was subsequently completed with funds set apart for State coal-mine purposes; but it was transferred to the Railway Department subsequently on payment of £65,548 (including the above sum of £21,000), being the total cost of purchase and completion, in addition to which interest thereon, amounting to £1,363, was also refunded.
During the construction of this branch fine of railway a new mine (the Point Elizabeth No. 1 State Colliery) was laid down near Runanga, the output stage being reached in 1904, and coal of uniformly superior quality has been produced ever since; but owing to the frequency of faults and the thinning of the seam to the dip it is believed that the profitable life of this mine will probably not be more than a few years unless further developments occur. As a State colliery this mine had produced up to the end of December, 1914, 1,865,762 tons of coal.
In 1900 the Westport-Cardiff lease was also determined by the Government. Acting upon a favourable report in 1901 by the Government mining experts, the property was prospected and subsequently developed as the Seddonville State Colliery, the output stage being reached in November, 1903, since when the colliery has been worked continuously; but the quality of the coal has been found to be extremely variable and unsatisfactory owing to the large proportion of crushed and soft coal, for which the demand is irregular.
Owing to the exhaustion of marketable coal the Seddonville colliery was finally closed during May, 1914. The total output under State control at the end of 1913 amounted to 524,691 tons, mostly small and unprofitable coal.
In addition to the mines mentioned, as the result of a favourable expert report, dated 1907, a new mine, known as the Point Elizabeth Liverpool State Colliery was laid down towards the head of Seven-mile Creek, to the north-east of the No. 1 State Colliery, and connected therewith by an extension of the Government railway about three miles in length. The line has been carried through extremely rough and broken country. The equipment of this mine is of considerable magnitude; the coal-storage bin (capacity, 4,000 tons) and screening arrangements are constructed upon the most modern design. The self-acting endless-rope system of haulage installed upon the incline connecting the mines with the new branch railway to Greymouth has been designed to transport an output of 2,000 tons per day. Three separate sections of bord-and-pillar workings are now being developed. No. 1 mine is situated at the upper terminus of the surface haulage incline, a distance of two miles from the coal-storage bin and branch railway, and 1,735 ft. above sea-level; No. 2 mine is situated about a quarter of a mile down the incline from its terminus; and No. 3 mine immediately above the coal-storage bin and branch railway terminus, the latter being about 800 ft. above sea-level. The coal-seams, of which there are several, are of exceptional quality for steam, gas-production, and for coke-manufacture, but the prevalence of faulting and the friable nature of the coal are unfavourable characteristics.
During 1913 the output stage was reached, and at the end of 1914 81,114 tons of coal had been produced. A valuable scam of superior bituminous coal was discovered at this colliery in 1914, covering an area of about 130 acres. The seam averages 17 ft. in thickness, and the estimated quantity of coal already proved amounts to 3½ millions of tons.
According to the figures published in the Statistical Abstract of the United States the world's coal-production in the four years 1910 to 1913 was,—
| Tons. | |
|---|---|
| 1910 | 1,141,600,000 |
| 1911 | 1,164,100,000 |
| 1912 | 1,363,900,000 |
| 1913 | 1,443,400,000 |
A table in the Statistical Abstract issued by the United Kingdom Board of Trade places the total production in 1912 at 1,244,700,000 metric tons (of 2,204 lb.). The principal contributors to this total are,—
| 1,000 Metric Tons. | |
|---|---|
* 1911 figures. † Estimated. | |
| United States | 484,997 |
| United Kingdom | 264,670 |
| Germany | 255,810 |
| Austria-Hungary | 52,522 |
| France | 41,308 |
| Russia | 26,423* |
| Belgium | 22,972 |
| Japan | 19,640 |
| India | 14,947 |
| China | 13,190† |
| Canada | 13,170 |
| Australia | 11,921 |
Included in the totals for Germany and Austria-Hungary are 80,935,000 and 35,422,000 tons of lignite respectively. The figures for United States and France also include a small proportion of lignite.
Indications of the existence of petroleum have been found in the Tertiary rocks of the Taranaki, Dannevirke, Gisborne, and Grey districts, and during recent years a considerable number of boreholes have been drilled in search of petroleum, ten companies having been so engaged in the North Island.
The most successful of these operations are those being carried out at Moturoa by the Taranaki Oil-wells (Limited) (formerly the Taranaki Petroleum Company), who at that place have drilled in Miocene rocks several productive wells. This company has recently laid down a refinery of modern design with a capacity of 10,000 gallons per day, and is now engaged refining the crude oil, the quality of which is very high, containing on an average 97 per cent. of oil capable of distillation.
The quantity of crude oil produced by this company amounted on 24th March, 1915, to 776,161 statute gallons, of which 525,475 gallons were refined by the company. The product meets with a ready sale at prices equal to the imported article.
The following analyses are from crude oil from this company's wells, Nos. 2 and 3, at Moturoa:—
| No. 2 Well. Per Cent. | No. 3 Well. Per Cent. | |
|---|---|---|
| Per Cent | Per Cent | |
| Water | 0.15 | .. |
| Benzene (distilling below 150° C.) | 0.85 | 6.6 |
| Burning-oil (distilling between 150° and 300° C.) | 30.00 | 37.2 |
| Lubricating-oil (distilling between 300° and 400° C.) | 48.00 | 35.2 |
| Paraffin (distilling between 300° and 400° C.) | 21.00 | 22.0 |
| Pitch or coke | .. | .. |
| Loss | .. | .. |
| 100.00 | 100.0 |
In addition to the Government bonuses which have for some years been offered for the production of crude petroleum and refined oil, two of which, amounting together to £5,000, have already been paid to the Taranaki Oil-wells (Limited) on the production of 500,000 gallons of crude oil, provision has been made in the Appropriation Act, 1914, for a loan or loans of a sum not exceeding in the aggregate £9,000 for the purpose of encouraging the production and refinement of mineral oil in New Zealand. No portion of this amount was advanced before the 31st December last, but a considerable sum has been lent since that date.
Drilling is also being carried on by various companies in Taranaki, and also at Waipatiki, Hawke's Bay, but the operations have not been very successful.
This product is the solidified turpentine of the kauri, and is a true resin, the name “kauri-gum” being a misnomer.
Kauri-resin has, next to gold, contributed more to the revenue of New Zealand than any of the minerals.
Kauri-resin formerly occurred in great abundance, and now is found in considerable quantity in the northern parts of the Auckland Provincial District from the North Cape to middle Waikato, over an approximate area of 814,000 acres. It is dug up alike on the driest fernhills and in the deepest swamps. A large quantity is also obtained from the forks of living trees, but this is considered of inferior quality, and fetches a lower price. In the fossil state kauri-resin occurs in smaller or larger lumps, from the size of a walnut to that of a man's head. Pieces have been found weighing upwards of 100 lb. When scraped the best specimens are of light colour; transparent or semi-transparent specimens fetch very high prices from collectors; occasionally specimens are found with leaves, seeds, or small insects enclosed. When obtained from swamps the resin is very dark-coloured, or even almost black, and fetches a low price. Waikato resin is the darkest of all. The great bulk of this resin is used in the manufacture of oil varnishes, and in countries where varnish of high quality is used it holds the chief place in the market. It is also used considerably in linoleum-manufacture, but for this purpose of recent years it has been replaced to some extent in American manufactories by a cheaper substitute, china-wood oil, the high price ruling for turpentine and other oils used with kauri-resin in linoleum-manufacture being to a certain extent the cause of such competition.
The following are the grades on the London market, arranged in the order of value: Palo amber; ordinary three-quarter-scraped; brown fair half and three-quarter scraped; half-scraped; fair half-scraped; and pickings.
The gum-digger's equipment is of a simple character: a light pointed iron rod fixed in a convenient handle is used to test the ground; the gum is dug out with a spade. Many diggers, notably Austrians, who are the most numerous on the fields, do not use a spear, but dig the ground over completely, sometimes to a depth of 10 ft.
During recent years it has been found that in places the remains of buried kauri forests exist above one another, and this has added considerably to the life of the kauri-gum industry.
Gum-digging has always been a standing resource for the industrious unemployed, and has enabled Auckland in years past to tide over periods of commercial depression with comparatively little difficulty. It has also been of vast benefit to hundreds of settlers with but small capital.
During the first seven months of the year 1914 and prior to the outbreak of war the kauri-gum trade had been good, most of the 8,473 tons, valued at £497,444, the export for the year, having been produced during those earlier months. Subsequently the European market for gum became closed, with the result that considerable depression was experienced on the gumfields. To afford a measure of relief the Government, in terms of the Kauri-gum Act, 1914, has since purchased from the diggers gum to the value of £5,000 on the basis of prices ruling on the 1st July, 1914, the gum thus purchased being stored in Auckland. Many of the regular gum-diggers are still working and storing their gum on the fields, being of the opinion that at the close of the war all grades of gum will command higher rates than those which have ruled hitherto.
Since 1902 there has been no sulphur exported from New Zealand, but during the five years preceding 4,927 tons, valued at £13,239, were exported from White Island. White Island consists of the summit of a volcano whereon thermal activity is unusually pronounced. From one large vent known as the “Blowhole” there is a remarkable display of solfataric and fumarolic action unrivalled in New Zealand, so-called smoke and steam being ejected to a height of about 300 ft. Around the fumaroles there are conical mounds of almost pure sulphur varying from 4 ft. to 6 ft. high, and the floors and sides of the crater are covered to an unknown depth with alternating layers of siliceous mud, ash-beds, flour of sulphur (averaging 7 ft. in thickness), and gypsum. By systematic prospecting a reserve of sulphur has been exposed, and a considerable quantity has been obtained and stacked for treatment.
During 1913 the White Island property was acquired by the New Zealand Sulphur Company, which laid down a steaming plant consisting of a steam-boiler and four retorts. A dam was also constructed for the storage of surface rain-water for the production of steam. During the early part of 1914, owing to corrosion of one of the cast-iron retorts by hydrochloric acid introduced in the sulphurous charge, an explosion occurred with fatal results to a workman, upon which operations ceased pending the installation of non-corrodible retorts.
Shortly after the further resumption of operations—viz., in September, 1914—an eruption or landslide resulted in the camp being buried to a depth of several feet. So far as is known, there is no intention on the part of the company to recommence operations.
At Clarendon and Milburn, Otago, considerable deposits of phosphate rock were discovered in 1902, and have since been actively worked. The present annual production is roughly 10,000 tons per annum. Phosphatic nodules are found in the Kaikorai Valley (near Dunedin), at Weka Pass (North Canterbury), and elsewhere. A limestone containing 10.6 per cent. of tricalcic phosphate occurs in the neighbourhood of Onewhero, Waikato district. Other districts where phosphate rock of good quality, though, so far as known, not in commercial quantities, is found, are Amberley (North Canterbury), Tutira Block (Mangaharuru Survey District, Hawke's Bay), and Whangarei.
Phosphatic minerals, the most common of which is the hydrous iron phosphate, vivianite, have been discovered in numerous other localities besides those mentioned above, but commercially these occurrences are of little importance.
The mineral nephrite, the “pounamu” of the Maori, more popularly known as one of the varieties of “greenstone,” whenever observed in situ,occurs as rounded segregations in talc or talc serpentine rocks. These segregations vary up to 2 ft. or even more in lateral dimension. As a rule they average less than 1 ft. in width. So far as known, the mineral has only been found in its original locus in the Griffin Range, Turiwhate Survey District, North Westland.
Pounamu is a deep-green semi-transparent mineral with dark opaque patches. With the wearing-away of the enclosing matrix the segregations are freed as rounded masses, and were once transported by the Arahura, Taramakau, and other glaciers, and are now found as boulders in the glacial debris along the lower streams of the Arahura and Taramakau Valleys. From boulders all greenstone ornaments have hitherto been manufactured.
The mineral known to the Maori as “tangiwai” is sometimes considered as a variety of pounamu. It is in reality bowenite, a hard variety of serpentine, but is much softer than nephrite. It is found in the form of boulders at Big Bay and Martin's Bay, Milford Sound, and in situ at Anita Bay, Milford Sound.
Prices in New Zealand for rough greenstone range between 9d. and 2s. 6d. per pound, varying with the quality. The purchase of rough blocks is speculative, as when the block is cut up the quality may be found to be entirely different to anticipation.
New Zealand possesses a great variety of handsome and durable building-stones scattered throughout both Islands. In Auckland there is basalt, andesite, porphyrite, and quartz biotite-diorite, known in the building trade as Coromandel “granite,” a hard, coarsely crystalline rock capable of taking a fine polish. Besides these rocks are the Whangarei limestone and Raglan stone, the former an excellent building-stone, the latter a good freestone. Taranaki has the hornblende andesites of New Plymouth and Mount Egmont, and Wellington the andesites of Ruapehu.
In Nelson there is the granite of Tata Island and Tonga Bay and the marble and crystalline limestones of the Pikikiruna (Riwaka) Range. West Nelson and Westland are well provided with granites and limestones of good quality, well adapted for building purposes; and in the Griffin Range, North Westland, there is found an abundance of finely coloured serpentine, unsurpassed as a decorative stone. Building-stone is scarce in Marlborough, but Canterbury is well supplied, having an abundance of Lyttelton bluestone (andesite) and Mount Somers stone, a limestone of exceptional quality. In Otago there is an abundance of excellent building-stone, ranging from the well-known Oamaru stone to the granite, gneiss, and limestones of Fiordland, all close to deep water. In Southland there is the so-called Ruapuke “granite,” the norite of the Bluff, and the granites of Stewart Island.
The principal buildings in New Zealand have been constructed in stone from local quarries.
The following is a list of building-stone which attracted a considerable amount of attention when exhibited in the Mines Department Court of the Auckland Exhibition, 1913–14:—
| Class of Stone. | Locality. | Owners of Quarry or Land | Principal Buildings erected thereof. |
|---|---|---|---|
| Quartz biotitediorite | Coromandel | New Zealand Granite Company, Auckland | Parliament House, Wellington; Post-office, Auckland. |
| Granite | Tonga Bay | J. and A. Wilson, Wellington | Post-office, Wellington. |
| ″ | Ruatuna | J. G. Coates, Esq., Matakohe | Not yet developed. |
| Trachyte | Drury | W. Parkinson, Auckland | ″ |
| Trachyte | Pukekaroro | Trachyte Stone Company, Auckland | ″ |
| Andesite | Sumner | … | … |
| Basalt | Mount Eden | Government of New Zealand | His Majesty's Prison. Auckland; Churches, &c. |
| Andesite | Christchurch | Cashmere Estate, Christchurch | Anglican Cathedral, Christchurch: Bank of New Zealand. |
| Basalt | Timaru | … | … |
| Andesite | New Plymouth | Government of New Zealand | His Majesty's Prison, New Plymouth. |
| ″ | Ruapaki | … | … |
| Fossil limestone | Whangarei Heads | … | … |
| Limestone Limestone, pink | Mt. Somers | Messrs. Blackburn and Smith, Christchurch | Banks of Australia and Australasia, Christchurch. |
| ” “T” | Oamaru | Tesche maker Estate, Oamaru | Many important buildings, including town balls, churches, and banks in New Zealand and Australia. |
| ” “K” | ″ | H. S. Bingham and Co., Dunedin | |
| Marble | Sandy Bay, Nelson | New Zealand Marble and Cement Company, Palmerston North | Quarries newly developed. In the interior of the New Zealand Houses of Parliament this marble will be used. |
| Serpentine | Griffin Range, Westland | New Zealand Greenstone (Limited), Greymouth | Now being developed and a large plant installed |
| Porphyritic granite | Kumara, West-land | Government of New Zealand | Undeveloped. |
The following is a summary of persons killed or seriously injured in metalliferous mines during the seven years 1908–14:—
| Table showing Number of Deaths from Accidents at Metal Mines during the Years 1908–14. | |||||||
|---|---|---|---|---|---|---|---|
| Cause of Accident. | 1908. | 1909. | 1910. | 1911. | 1912. | 1913. | 1914. |
| Explosion | 3 | 2 | 2 | 1 | .. | .. | .. |
| Fall of ground | 2 | 1 | 1 | 2 | 1 | 5 | 3 |
| In shafts | 1 | 3 | 5 | .. | 1 | 3 | 1 |
| Miscellaneous—Underground | 2 | 1 | .. | .. | 2 | .. | .. |
| ” On surface | 6 | 5 | 3 | 2 | .. | 2 | 2 |
| About dredges | 1 | 2 | 4 | .. | 1 | .. | .. |
| Total killed | 15 | 14 | 15 | 5 | 5 | 10 | 6 |
| Number of employees | 8,880 | 7,651 | 8,121 | 7,400 | 5,239 | 4,941 | 4,470 |
| ” persons killed per 1,000 employed | 1.69 | 1.83 | 1.84 | 0.67 | 0.95 | 2.02 | 1.34 |
The following is a summary of coal-mining accidents during 1914, with their causes:—
| — | Fatal Accidents. | Non-fatal Accidents. | ||
|---|---|---|---|---|
| Number of Separate Fatal Accidents. | Number of Deaths. | Number of Separate Non-fatal Accidents. | Number of Persons injured. | |
| Explosions of fire-damp | 1 | 43 | 2 | 6 |
| Falls in mine | 3 | 3 | 2 | 2 |
| Explosives | 1 | 1 | 1 | 1 |
| Haulage | 1 | 1 | 2 | 2 |
| Miscellaneous—Underground | .. | .. | 17 | 17 |
| On surface | 1 | 1 | 2 | 2 |
| Totals | 7 | 49 | 26 | 30 |
The number of deaths was in the proportion of 10.35 per 1,000 persons employed.
In September, 1914, forty-three lives were lost in a coal-mining accident at Taupiri, Huntly, hence the greatly increased death-rate for the year.
Since 1905, when statutory provision was made for advances by way of loans for mining development, six companies have been assisted by grants of loans aggregating £35,225, of which £33,573 has been paid by the State as the mining operations have proceeded and in accordance with the conditions upon which such loans were granted. It cannot be stated that there is any evidence that the mining industry has yet benefited by these loans, and no company so assisted has paid a dividend; in two cases, however, the developments for which the loan was granted are not yet completed, and it is premature to pronounce thereon. The provision regarding mining loans is taken advantage of by mining promoters who are unable to obtain subscribers for their shares, to make up shortage of capital on the extremely favourable terms which the State offers—4½ per cent.
The opening-up by roads of remote or inaccessible mining fields still continues; and when the rugged character of many of these fields is taken into consideration it will be found that the mining industry is now well served as regards roads and bridges. Mining being generally the pioneer for agriculture, the roads constructed in some of the older mining fields are more used by farmers than by miners. During 1914–15 the sum of £2,213 in the form of subsidies and £27,852 as direct grants out of the Public Works Fund was expended on roads on goldfields. In addition. North Island goldfields local bodies were credited with gold duty amounting to £12,450. The total amount of State aid thus given to local bodies on behalf of the mining industry during the past financial year was therefore £42,515.
The Waimea-Kumara and Mount Ida Water-races, which render possible hydraulic mining in the Kumara district, Westland, and the Naseby district, Central Otago, have supplied 105 miners with water for sluicing during 1914, the value of gold obtained being approximately £25,675.
For the year ended the 31st March, 1915, the receipts for sales of water from the races amounted to £3,493, the expenditure in upkeep and supervision during the same period being £3,782, as compared with £3,305 and £3,215 respectively during the previous year.
New branch races have been constructed to serve miners in the Waimea-Stafford districts, and a race-deviation is now being constructed from the Erin-go-bragh Water-race, recently purchased by the Government, to Argus Terrace, near Maori Point, Westland, where alluvial gold has been intermittently mined for many years.
The Kumara Water-race extension, which carries by inverted siphon a large supply of water across the valley of the River Taramakau to the northern terraces at Westbrook, has not received much support from the miners of the district. Independently of mining, this siphon is of considerable value for hydro-electric power, the water-supply being considerable and the pressure adequate.
In Central Otago the Mount Ida Race has been extended for nearly a mile towards its terminus to enable new ground to be worked.
Three diamond drills of Schram-Harker type, with a boring-capacity of 2,500 ft., 1,500 ft., and 500 ft. respectively, one diamond drill of Sullivan CN type, capacity 800 ft., also three Keystone traction placer drills of 350 ft. capacity, are lent out by the Government to mining companies and local bodies free of charge. The borrowers have, however, to keep the machines in good order, and pay all expenses and wages in connection therewith, including those of the Government Superintendent of the drill.
During the year five holes, of an aggregate depth of 889 ft., were drilled by one Keystone drill in alluvial gravel, and nine holes, of an aggregate depth of 2,502 ft., were drilled in search of coal.
There are Government subsidized schools of mines at Coromandel Thames, Waihi, Karangahake, Westport, and Reefton. Ninety-two senior students presented themselves at the annual Government examinations held at the schools during December, 1914. The following is a summary of the results:—
| Locality of School of Mines. | Average Number of Marks awarded per Paper submitted. | Number of Students examined. | Number of Papers submitted. | Total Marks awarded. |
|---|---|---|---|---|
| Thames | 46.53 | 21 | 26 | 1,210 |
| Waihi | 61.36 | 18 | 44 | 2,700 |
| Karangahake | 57.70 | 13 | 34 | 1,962 |
| Reefton | 47.37 | 13 | 21 | 995 |
| Coromandel | 36.42 | 12 | 19 | 692 |
| Westport | 48.24 | 15 | 24 | 1,158 |
| Totals, 1914 | 51.89 | 92 | 168 | 8,717 |
| ” 1913 | 51.87 | 78 | 151 | 7,338 |
The expenditure by the Government on schools of mines since their inception, exclusive of subsidies paid to the University of Otago towards the School of Mines in connection with that institution, is as follows: Subsidies towards erection and maintenance, £33,033; chemicals and apparatus, also mineralogical specimens supplied, £3,056; scholarships, £2,171; salaries of teachers, and travelling-expenses, &c., £24,685: total sum paid by the Mines Department towards the schools of mines, £62,945.
Examinations are held by the Boards of Examiners annually of candidates for certificates as first and second-class mine-managers, battery, superintendents, and dredgemasters under the Mining Act, 1908, and for certificates as first- and second-class mine-managers, underviewers, and firemen and deputies under the Coal-mines Act, 1908. No candidate is permitted to present himself for examination unless he holds an authority from the Secretary to the Board of Examiners stating that his certificates of service comply with the Acts and regulations, and have been accepted by the Board.
Table of Contents
ALTHOUGH abundant water-power is available throughout New Zealand, comparatively little use had been made of it before 1900, but during the last ten or fifteen years the development has been very extensive, and promises to be still more extensive in the early future. The Public Works Act of 1908 vests the sole right to use the water-power of the Dominion in His Majesty, subject to any existing rights, and gives the Government the right to develop such power, or to delegate such power to any local authority, or, outside a mining district, to any person or company, subject to conditions. Advantage has been taken of this in several cases, the right in the case of local authorities being issued free of royalty, and in the case of private individuals developing water-power for electrical distribution subject to a royalty of 1/20;d. per unit generated.
The following table shows the actual horse-power in use in the various districts in 1912, 1913, 1914, and 1915:—
| 1912. | 1913. | 1914. | 1915. | |
|---|---|---|---|---|
| Auckland | 5,752 | 6,551 | 13,640 | 12,933 |
| Hawke's Bay | 82 | 96 | .. | 9 |
| Taranaki | 1,892 | 1,891 | 2,782 | 2,853 |
| Wellington | 694 | 270 | 389 | 663 |
| Marlborough | 282 | 245 | 202 | 174 |
| Nelson | 922 | 1,151 | 680 | 640 |
| Westland | 942 | 1,794 | 3,662 | 3,595 |
| Canterbury | 536 | 1,282 | 1,167 | 9,682 |
| Otago | 5,258 | 7,612 | 10,617 | 10,555 |
| Southland | 1,993 | 2,021 | 1,817 | 1,912 |
| Total | 18,353 | 22,913 | 34,956 | 43,016 |
The following table gives the analysis of the purposes for which this water-power was employed as on 31st July, 1915:—
| District. | Mining. | Electric Supply. | Flax-mills. | Sawmills. | Flour-mills. | Dairying. | Construction-work. | Freezing-works. | Paper-mills. | Miscellaneous. | Totals. |
|---|---|---|---|---|---|---|---|---|---|---|---|
| Auckland | 2,117 | 246 | 4 | 10 | .. | 20 | 116 | 10 | .. | 817 | 3,340 |
| Auckland South | .. | 9,510 | 83 | .. | .. | .. | .. | .. | .. | .. | 9,593 |
| Hawke's Bay | .. | .. | .. | .. | .. | .. | .. | .. | .. | 9 | 9 |
| Taranaki | .. | 1,921 | 60 | 30 | 24 | 720 | .. | .. | .. | 98 | 2,853 |
| Wellington North | .. | 445 | 50 | .. | .. | 3 | .. | .. | .. | .. | 498 |
| Wellington | .. | 48 | .. | 20 | .. | 28 | .. | .. | .. | 69 | 165 |
| Marlborough | 16 | 9 | 94 | .. | 46 | .. | .. | .. | .. | 9 | 174 |
| Nelson North | .. | 8 | 20 | 36 | 12 | 8 | .. | .. | .. | 5 | 89 |
| Nelson South | 293 | 164 | 5 | 46 | .. | 2 | .. | .. | .. | 41 | 551 |
| Westland | 1,173 | 1,745 | 37 | 25 | .. | .. | 600 | .. | .. | 15 | 3,595 |
| Canterbury | .. | 9,196 | 56 | .. | 191 | 15 | .. | .. | .. | 110 | 9,568 |
| Canterbury South | .. | 27 | 30 | .. | 54 | .. | .. | .. | 3 | 114 | |
| Otago | 68 | 10,033 | 20 | .. | 68 | 29 | .. | .. | .. | 337 | 10,555 |
| Southland | 115 | 21 | 38 | 29 | 45 | .. | .. | 1,200 | 450 | 14 | 1,912 |
| Totals | 3,782 | 33,373 | 497 | 196 | 440 | 825 | 716 | 1,210 | 450 | 1,527 | 43,016 |
Of the 43,016 h.p. of water-power in use, 18,336 h.p. is distributed electrically for public supply from sixteen power-stations, ten operated by the local authorities, two (Lake Coleridge and Rotorua) by the State, three (Stratford, Hawera, and Reefton) by private companies, and one by a private individual. The following table gives details of these sixteen installations:—
| Locality. | Supply Authority. | Population served. | Power installed. | Distance transmitted: Miles. | Voltage of Transmission. | |
|---|---|---|---|---|---|---|
| H.P. | K.W. | |||||
| Canterbury | State | 110,000 | 6,000 | 4,500 | 65 | 66,000 |
| Dunedin | City Council | 64,237 | 9,000 | 6,000 | 32 | 35,000 |
| Rotorua | State | 2,360 | 380 | 200 | 13 | 6,600 |
| Hawera | Electric Light Company | 2,685 | 400 | 250 | 12 | 5,000 |
| Stratford | Electric Supply Company | 2,639 | 150 | 90 | 2 | 2,000 |
| New Plymouth | Borough Council | 5,238 | 1,020 | 680 | 5 | 6,600 |
| Inglewood | Borough Council | 1,273 | 200 | 120 | 3 | 3,200 |
| Patea | Borough Council | 919 | 200 | 120 | 4 | 3,000 |
| Te Aroha | Borough Council | 1,298 | 255 | 150 | 3 | 3,000 |
| Ohakune | Borough Council | 1,400 | 160 | 120 | 1 | 2,400 |
| Tauranga | Borough Council | 1,500 | 213 | 160 | 18 | 11,000 |
| Akaroa | Borough Council | 622 | 45 | 20 | 1 | 220 |
| Taihape | Borough Council | 1,577 | 133 | 100 | 2 | 460 |
| Mangaweka | Town Board | 1,800 | 47 | 35 | 3 | 2,400 |
| Brightwater | Private individual | 800 | 53 | 40 | 4 | 2,500 |
| Reefton | Electric Supply Company | 1,500 | 80 | 60 | 1 | 230 |
The Lake Coleridge works are referred to below. Of the others the only one of any size is the power-station of the Dunedin City Council on the Waipori River, thirty-two miles from the city. This plant was started in 1907 with two units of 1,000 kilowatts (1,500 h.p.) each. Two more similar units were added in 1910, and two more were installed in 1913, which brings the total capacity up to 6,000 kilowatts (9,000 h.p.). The retail rates charged range from 5d. to 1d. per unit for lighting and from 2d. to ½d. per unit for power purposes.
The output for the year 1914–15 was as follows:—
| Units sold Number | Average Price per Unit. d. | |
|---|---|---|
| Private lighting | 1,642,977 | 3.35 |
| Public lighting | 249,803 | 0.74 |
| Power and heating | 6,488,003 | 0.72 |
| Tramways | 2,618,825 | 1.25 |
The total outlay to the 31st March, 1915, was £483,952, including distribution; the total revenue for the year ended the 31st March, 1915 £57,627; and the total expenditure, including interest, sinking fund, depreciation, and renewal funds, £53,767, leaving a net profit of £3,860. The number of consumers supplied was 5,015, and the capacity of the motors connected to the mains 7,084 h.p. in addition to the tramway and lighting loads. The total connected capacity at the 31st March, 1915, was 12,722 kilowatts.
The Aid to Water-power Act of 1910 empowered the State to establish hydro-electric supply installations, and the first is now in operation at Lake Coleridge, in the Southern Alps, seventy miles west of Christchurch. This plant has been designed for a total capacity of 12,000 kilowatts (16,000 h.p.). Of this one-half is included in the first installation. The natural features of the lake and adjacent rivers allow of a very large extension of the supply up to 58,000 h.p. The transmission-line is constructed in duplicate by separate routes to Christchurch, thus ensuring continuity of supply, each line having a capacity of 7,500 k.w. The population to be served is over 110,000, and a large demand is anticipated, including the bulk supply to the Christchurch City Council and some fifteen other local bodies for retail distribution, the Christchurch Tramway Hoard, Christchurch Drainage Board, the electrification of the Christchurch-Lyttelton suburban railway-line and ultimately of the main lines, and the power-supply to the large meat-freezing works, flour-mills, woollen-mills, and other factories and industries of the Canterbury Plains. The contract entered into with the Christchurch City Council provides for a charge for the first 300 kilowatts (400 h.p.) of £8 13s. 4d. per annum per kilowatt of maximum load (equivalent to £6 10s. per horsepower) and all over 300 kilowatts at £5 per annum per kilowatt of maximum load (equivalent to £3 15s. per h.p.). This will enable the Council to retail it to the public at an average of about 3d. per unit for light and 1½d. per unit for power in small units and £10 per annum per kilowatt of maximum load for power to larger consumers. It is estimated that a capital expenditure of about £375,000 will be required to complete the 16,000 h.p. development at Lake Coleridge, completing the present design. The expenditure to the 31st March, 1915, was £288,902.
A large and comprehensive scheme is now under consideration for the supply of electrical energy in the North Island, with the object of making it generally available, as far as possible, to all the towns and districts throughout the Island, and it is anticipated that advantage will be taken of the facilities offered to work the railways by electricity and to promote a system of light railways throughout the country districts now suffering from lack of communication because of the difficulty of obtaining stone for surfacing the roads.
There are two fair-sized hydro-electric mining transmissions in service—namely, a 700 h.p. on the Fraser River, Otago, supplying the Earnscleugh Gold-mining Company's dredge, and a 1,000 h.p. installation at Lake Kanieri, supplying the Ross Gold-mining Company's underground alluvial working at Ross; the latter involves a transmission-line of twenty-three miles at a pressure of 24,000 volts.
In addition to these two mining installations in service the Waihi Gold-mining Company have installed a 9,000 h.p. plant on the Waikato River at Horahora Rapids, near Cambridge, a distance of fifty miles from the mines at Waihi and the battery at Waikino, the transmission pressure being 50,000 volts. This plant was put in service in March, 1914. In addition to the mines in the neighbourhood of Waihi, the company has also the right to supply local authorities en route with power in bulk for public distribution.
In addition to the developed power in New Zealand there is a practically unlimited amount of undeveloped power. A table in the 1914 issue of this book gave particulars concerning the more important available water-powers, over 1,000 horse-power, showing also the nearest market consisting of a city or an actual or potential port. A considerable number of these are suitable for general industrial development, but the largest ones, as a rule being in the unsettled portions of the South Island and near the deep-water sounds, are particularly suitable for utilization in connection with electro-chemical or electro-metallurgical industries.
IN connection with the following figures relating to census industrial statistics it should be mentioned, to avoid misunderstanding, that they do not purport to include all “factories” registered under the Factories Act. The figures, as in previous census collections, show the results of returns collected only from manufactories and works employing over two hands. In a number of cases where work was carried on by the same manufacturer in separate buildings a considerable distance from one another, each building would be registered as a distinct “factory,” but only one census return would be furnished. For instance, in the case of a butter-factory with, say, a dozen or more creameries separating and supplying cream, each creamery would be registered as a separate “factory,” but the particulars for all would be included in one census return. Certain industries also which are registered as factories (bakers, blacksmiths, &c.) do not furnish returns for census purposes. The present collection has followed as closely as possible the lines of previous census collections.
| MANUFACTORIES AND WORKS, 1911 AND 1906. | |||
|---|---|---|---|
| April, 1911. | April, 1906. | Increase 1906–11. | |
| Number. | Number. | Number. | |
| Number of establishments* | 4,402 | 4,186 | 216 |
| Hands employed— | |||
| Males | 42,267 | 44,946 | –2,679† |
| Females | 13,967 | 11,413 | 2,554 |
| Totals | 56,234 | 56,359 | –125† |
| 1910. | 1905. | 1905–10. | |
| Wages paid— | £ | £ | £ |
| To males | 4,865,426 | 3,979,593 | 885,833 |
| To females | 706,844 | 478,026 | 228,818 |
| Totals | 5,572,270 | 4,457,619 | 1,114,651 |
| H.p. | H.p. | H.p. | |
| Horse-power | 100,587 | 60,335 | 40,252 |
| £ | £ | £ | |
| Value of all manufactures or produce (including repairs) | 31,729,002 | 23,444,235 | 8,284,767 |
| Total approximate value of— | |||
| Land | 3,890,921 | 3,264,862 | 626,059 |
| Buildings | 5,174,890 | 3,851,902 | 1,322,988 |
| Machinery and plant | 7,665,548 | 5,392,522 | 2,273,026 |
| Totals | 16,731,359 | 12,509,286 | 4,222,073 |
The number of establishments has increased in the quinquennium by 216, but the returns show that there were 125 less hands employed in 1911 than in 1906. A remarkable feature of this is that while the number
* Omitting Government Railway Workshops and Government Printing Office.
† Decrease. of males decreased by 2,679, or at a rate of 5.96 per cent., the females actually increased by 2,554, or 22.38 per cent. In 1906 males represented 79.73 per cent. of the hands employed, and females 20.25 per cent., while in 1911 the proportions were 75.16 per cent. and 24.84 per cent. respectively.
In spite of the decrease in the hands employed and in the proportion of males, the wages paid in 1910 show a considerable increase on the figures for 1905. The wages paid in the factories or industrial works dealt with in the census returns were returned for 1905 at £4,457,619, and for 1910 at £5,572,270, the increase on the total sum being at the rate of 25 per cent.
The average amount of wages paid to male hands in 1905 was £88 10s. 11d., and in 1910 £115 2s. 3d.; for females, £41 17s. 8d. and £50 12s. 2d. in the respective years. It must be remembered that these are not adult wages, but those of persons of all ages.
The increase for the quinquennium in the horse-power stated in the returns was 40,252, equal to a rate of 66.71 per cent.
The approximate value of the land used for purposes of the factories was returned as £3,264,862 for 1905, and £3,890,921 for 1910. The value of the lands used for mining is not included in the above figures, and the value of Crown lands has been omitted throughout.
As in the previous quinquennium, a very large increase is found in the value of machinery and plant. The figures for the censuses of 1901, 1906, and 1911 are £3,852,457, £5,392,522, and £7,665,548 respectively. The rate of increase during the first of the two five-yearly periods was 39:98 per cent., and for the second 42.15 per cent.
The increase in the value of manufactures or produce (including repairs) is at the rate of 35.34 per cent. for the quinquennium, as against an increase of 31.31 per cent. for the preceding five years. The development is analysed in the following statement, which includes nearly the whole increase, and has been worked down to a limit of £20,000 to show the main features. The factories or works in connection with our great primary industries—agricultural, pastoral, timber, and flax—include the greater part of the money.
| PRINCIPAL INCREASES BETWEEN 1905 AND 1910. | |
|---|---|
| £ | |
| Meat freezing and preserving and boiling-down works | 2,493,642 |
| Butter and cheese factories | 1,337,545 |
| Sawmills, sash and door factories | 571,122 |
| Tailoring establishments | 357,821 |
| Iron and brass foundries, &c. (excluding Government Railway Workshops) | 312,077 |
| Printing and bookbinding establishments (excluding Government Printing Office) | 310,099 |
| Clothing and boot and shoe factories | 278,621 |
| Dressmaking and millinery establishments | 243,791 |
| Gasworks | 236,289 |
| Tanning, fellmongering, and wool-scouring establishments | 200,460 |
| PRINCIPAL INCREASES BETWEEN 1905 AND 1910—continued. | |
|---|---|
| £ | |
| Grain-mills | 189,315 |
| Furniture- and cabinet-making factories | 169,496 |
| Breweries and malt-houses | 141,895 |
| Sugar-boiling and confectionery works | 120,863 |
| Ham- and bacon-curing establishments | 117,684 |
| Coach building and painting works | 101,194 |
| Soap and candle works | 90,079 |
| Saddlery and harness factories | 79,551 |
| Lime and cement works | 77,011 |
| Ship- and boat-building yards | 76,447 |
| Hosiery-factories | 72,854 |
| Aerated-water factories | 61,010 |
| Paper-bag and box factories | 50,110 |
| Sail, tent, and oilskin factories | 46,928 |
| Electric light and supply works | 42,921 |
| Fruit-preserving and jam-making factories | 37,474 |
| Cooperages | 35,683 |
| Tinware-factories | 33,434 |
| Baking-powder factories | 30,602 |
| Mattress-factories | 29,023 |
| Sausage-casing factories | 28,233 |
| Agricultural-implement factories | 22,299 |
| Glass-works | 21,204 |
From this table has been omitted reference to electric tramways, returns of which were collected in 1911 for the first time, as well as certain industries included with others in 1906, but shown separately in 1911.
The amounts shown above are in some cases over the fact. For instance, some of the butter made is included in returns for meat-freezing establishments as well as in the butter-factory returns; timber cut is valued under sawmilling, and some again in the furniture-making line; while leather is valued in the tanning returns, and some part of it again in the boot and saddlery items. A certain amount of duplication is unavoidable. This is admitted in the accounts of industrial statistics of the United States of America and elsewhere.
Information as to the value of materials operated on was given in the case of most industries, but in some cases estimates had to be made to obtain completeness. The sum arrived at for the year 1910 is £20,810,211. The difference between this amount and the total value of all the manufacture and produce (with repairs) may be termed the net value of the manufacture in a sense, and duplications on account of the articles of any one kind becoming materials operated upon for another sort would be eliminated. But to arrive at any approximate estimate as to profit, £5,572,270 spent in wages ought further to be deducted, and also interest and depreciation on £16,731,359 invested in land, buildings, machinery, and plant, together with taxes, insurance, and other incidental expenses.
Particulars relating to individual industries clearly show that quantities as well as the value of manufactures have risen, so that the development is not merely a question of market prices, but of actual output. Particulars of individual industries are given in the Year-books for 1912, 1913, and 1914, and in the Census Volume and Report, 1911.
Table of Contents
THE Advances to Settlers Office was established by an Act passed in 1894. An administrative officer called the Superintendent was appointed early in the following year, and a Board set up to advise and co-operate with the Superintendent. Advances can be granted only with the consent of the Board.
The capital fund was limited to £3,000,000, which was to be raised within two years after the passing of the Act, at an annual rate of interest not higher than 4 per cent. The first issue of £1,500,000 realized £94 8s. 9d. per £100 stock. The minimum advance was fixed at £25, and the maximum at £2,500, repayable in thirty-six years and a half by half-yearly instalments of 3 per cent. on the amount borrowed.
The legislation has been amended at different times, and is now embodied in the State Advances Act, 1913. It authorizes the borrowing of moneys for the purpose of lending to settlers, workers, and local authorities. Each year there may be borrowed for advances to settlers £1,500,000, to workers £750,000, and to local authorities £1,000,000.
Money is advanced to settlers on first mortgage of lands and improvements held under certain classes of tenure, free from all encumbrances, liens, and interests other than leasehold interests.
The various classes of tenure were given in the 1914 issue of this book. To these should be added lands held under certain leases granted by the Wanganui River Trust.
Loans can be granted only on the instalment system (described here-after):—
On all freeholds, up to three-fifths of the value of the security: Provided that in the case of first-class agricultural freeholds loans may be made up to two-thirds of the value.
On leaseholds, up to three-fifths of the value of the lessee's interest in the lease.
Securities are classified by the Board in three classes—namely, first, second, and third. Loans are granted on first-class securities for a terra of 36½ years; on second-class securities, for thirty years; and on third-class, for twenty years.
The classifying of securities, the granting of advances, and the determining of what is to be considered first-class agricultural land rests solely with the Advances Board.
Where an advance is required for the purpose of erecting a building, the amount of the loan granted by the Board may either be paid over in one sum when the building is completed, or, if the applicant desires it, may be advanced in progress-payments from time to time as the erection of the building proceeds. An inspection and report must be made by an officer of the Valuation Department prior to payment of any progress-payment on account of the loan, and for each such inspection a fee as per scale below is payable by the applicant.
Not less than three inspections must be made, and, in the case of other than farm properties, the fencing must be completed before the final instalment of the loan is paid over.
A copy of the plan and specifications for a proposed building must be provided.
No loan of less than £25 or more than £2,000 can be granted. Applications for loans not exceeding £500 shall have priority over applications for larger sums. If the applicant has already obtained any advance under the Act and is desirous of obtaining a further advance, either on the same security or on a separate security, the amount of the application, added to the amount of the advances already obtained, must not exceed £2,000. The security which the applicant offers for the loan must consist of one or more holdings of the approved classes of tenure, and must be of the necessary value. If the security is leasehold, all the covenants and conditions of the lease, including the payment of rent, must have been regularly complied with.
All applications must be accompanied by a valuation fee according to the following scale:—
| Application for loan of— | Valuation Fee. | ||
|---|---|---|---|
| £ | s. | d. | |
| Not more than £100 | 0 | 10 | 6 |
| From £101 to £250 | 1 | 1 | 0 |
| From £251 to £500 | 1 | 11 | 6 |
| From £501 to £2,000 | 2 | 2 | 0 |
Mortgages are repayable by half-yearly payments of principal and interest combined. They may also be wholly repaid at any time. Interest is charged at the rate of 5 per cent., reducible to 4½ per cent. provided payment is made not later than fourteen days after due date and no arrears in respect of instalments or other payments under the mortgage remain outstanding.
Tables showing half-yearly instalments, apportioned as principal and interest payments, and showing also amount of rebate and balance of principal owing at end of half-year, were published in the 1913 issue of the Year-book.
The mortgagor may pay at any time the whole balance of principal owing with interest to date of payment, and obtain a discharge of the mortgage on payment of the fee prescribed for such discharge.
The mortgagor may also from time to time pay, in addition to the half-yearly payments, sums of £5 or a multiple of £5, which, at the next instalment due date, may be applied in payment of the half-yearly instalments of interest and principal as they fall due, until the deposit is exhausted, or in payment of as many future half-yearly instalments of principal (but not of interest) as it will cover. In the latter case, as far as such instalments are concerned, the corresponding interest will not be charged. On the next half-yearly date, however, the mortgagor will be required to continue his payments as before, the advance payment having the effect of reducing the period during which he would have to pay such instalments.
On the due date of any instalment, after at least one-tenth of the loan has been repaid by means of the half-yearly instalments or of moneys repaid in advance, or both, the mortgagor (provided he is not in arrear with any instalment or other payment due under the mortgage) may, with the consent of the Superintendent, readjust the loan by treating the balance of principal then unpaid as a fresh loan duly granted on that date for a fresh term. But no readjustment is allowed to any amounts less than £100. Under this arrangement the mortgagor will be relieved of paying interest on the original amount of the loan, and will pay only on the balance of principal owing.
By arrangements made with the Post Office, mortgagors are enabled to pay their instalments and interest to the credit of the Superintendent at any money-order office. This is an arrangement at once convenient and economical for the large number of persons scattered all over New Zealand who have financial dealings with the Advances Office. Loans may also be repaid in part or in full through the Post Office, and advances also are made through the Post Office. The total amount advanced to settlers since the establishment of the Department (including moneys repaid and again advanced) was, up to the 31st March, 1915, £15,542,400.
During the year ended the 31st March, 1915, applications for 3,870 loans were received, amounting to £1,826,265. The advances granted during the year numbered 2,073, aggregating £997,040. The number of borrowers and the sums actually advanced during the year, classified according to amount, were,—
| Category. | Number of Advances. | Amount advanced. |
|---|---|---|
| £ | ||
| Not exceeding £500 | 1,453 | 452,925 |
| Exceeding £500, but not exceeding £1,000 | 493 | 358,195 |
| ” £1,000, “ £2,000 | 125 | 181,620 |
| ” £2,000, “ £3,000 | 2 | 4,300 |
| Totals | 2,073 | £997,040 |
The nature of the security upon which these advances were made was as follows:—
| Security. | Number of Advances. | Amount advanced. |
|---|---|---|
| £ | ||
| Freehold | 1,050 | 445,450 |
| Leasehold | 1,008 | 543,005 |
| Freehold and leasehold combined | 15 | 8,585 |
| Totals | 2,073 | £997,040 |
The total loans authorized to the 31st March, 1915, classified according to provincial districts, are shown in tabular form:—
| Provincial District. | Number of Applications. | Amount of Advances authorized. |
|---|---|---|
| £ | ||
| Auckland | 13,925 | 4,741,948 |
| Taranaki | 5,010 | 2,316,039 |
| Hawke's Bay | 2,126 | 678,905 |
| Wellington | 10,368 | 4,076,713 |
| Marlborough | 1,168 | 492,000 |
| Nelson | 792 | 246,210 |
| Westland | 851 | 217,540 |
| Canterbury | 4,065 | 1,369,595 |
| Otago— | ||
| Otago portion | 2,304 | 890,630 |
| Southland portion | 2,911 | 1,067,350 |
| Totals | 43,520 | 16,096,930 |
The total sum raised by the Government for investment on mortgage is £8,990,273. Nineteen thousand six hundred and twenty-two mortgagors are indebted to the Department to the extent of £7,990,131 in respect of principal moneys.
The advances outstanding, classified according to amount, are as follows.—
| Category. | Number of Advances. | Amount outstanding. |
|---|---|---|
| £ | ||
| Not exceeding £500 | 14,814 | 3,174,829 |
| Exceeding £500, but not exceeding £1,000 | 3,203 | 2,319,277 |
| ” £1,000, “ £2,000 | 1,369 | 1,959,431 |
| ” £2,000, “ £3,000 | 216 | 536,694 |
| Totals | 19,622 | £7,990,131 |
The nature of the security for the total amount of advances outstanding on the 31st March, 1915, was,—
| Number of Advances. | Amount outstanding. | £ |
|---|---|---|
| Freehold | 11,973 | 5,678,965 |
| Leasehold | 7,348 | 2,128,205 |
| Freehold and leasehold combined | 301 | 182,961 |
| Totals | 19,622 | £7,990,131 |
The average freehold advance is £474, the average leasehold advance £289, and the average of advances secured on both freehold and leasehold combined £608. Corresponding figures for the year ended the 31st March, 1914, are freehold, £480; leasehold, £276; and combined freehold and leasehold, £610.
The number and amounts advanced on rural and urban and suburban land since the inception of the Department are,—
| Number. | Amount. | £ |
|---|---|---|
| On rural land | 12,401 | 5,264,373 |
| On urban and suburban land | 7,221 | 2,725,758 |
| Totals | 19,622 | £7,990,131 |
The average rural advance is £425, and the average urban and suburban advance is £377.
The following table shows the transactions of the State Advances Office in respect of advances to settlers during each of the financial years ended the 31st March, 1906–15, and the total transactions to the latter date:—
| ADVANCES TO SETTLERS, 1905–6 TO 1914–15. | ||||||
|---|---|---|---|---|---|---|
| Year ended 31st March. | Applications received. | Loans Authorized. | Amount advanced. | Amount repaid. | ||
| Number. | Amount. | Number | Amount. | |||
| £ | £ | £ | £ | |||
| 1906 | 2,288 | 949,432 | 2,054 | 786,735 | 633,453 | 261,381 |
| 1907 | 2,420 | 999,461 | 2,098 | 819,190 | 767,730 | 340,111 |
| 1908 | 3,183 | 1,668,135 | 2,955 | 1,355,450 | 1,197,416 | 568,655 |
| 1909 | 4,471 | 2,050,252 | 3,078 | 1,202,995 | 1,493,836 | 559,163 |
| 1910 | 4,131 | 1,539,150 | 3,201 | 1,038,340 | 1,095,120 | 545,528 |
| 1911 | 4,957 | 2,122,749 | 3,571 | 1,282,880 | 1,204,310 | 726,714 |
| 1912 | 5,355 | 2,593,084 | 4,610 | 2,191,300 | 2,174,085 | 1,018,286 |
| 1913 | 3,187 | 1,164,225 | 2,114 | 749,590 | 850,300 | 693,511 |
| 1914 | 3,604 | 1,400,248 | 2,390 | 878,855 | 973,005 | 700,253 |
| 1915 | 3,870 | 1,826,265 | 2,100 | 749,040 | 997,040 | 737,477 |
| Total to 31st March, 1915 | 56,971 | 23,269,718 | 43,520 | 16,096,930 | 15,542,400 | 7,552,268 |
The gross profits for the year ended the 31st March, 1915, were £68,512, and the cost of management £10,621, being 0.12 per cent., or 2s. 4d. per £100 on the capital employed. The net profits amounted to £57,434.
The liabilities and assets at the 31st March, 1915, of the Settlers Branch of the State Advances Office were,—
| Liabilities. | £ | s. | d. |
|---|---|---|---|
* Of the mortgage instalments overdue, a large percentage bad been received by Postmasters at 31st March, 1915, and was in course of transit. | |||
| Sundry loans | 8,990,273 | 1 | 7 |
| Temporary advances from Public Debt Sinking Fund Branch | 76,572 | 0 | 0 |
| Temporary advances from Advance's Office Sinking Fund Branch | 60,000 | 0 | 0 |
| Advances Suspense Account | 25,781 | 1 | 0 |
| Fire Loss Suspense Account | 3,580 | 2 | 11 |
| Suspense Account | 4,049 | 13 | 5 |
| Reserve Fund | 50,000 | 0 | 0 |
| Interest payable on loans, accrued but not due | 59,007 | 4 | 4 |
| Interest payable on deposits, accrued but not due | 8 | 8 | 5 |
| Profit and Loss Account | 312,226 | 15 | 7 |
| £9,581,498 | 7 | 3 | |
| Assets. | |||
| Investment Account— | |||
| Less total repayments | 7,976,974 | 1 | 9 |
| *Plus mortgage instalments overdue—principal | 13,157 | 1 | 9 |
| Total principal owing by mortgagors at 31st March, 1915 | 7,990,131 | 3 | 6 |
| *Mortgage instalments overdue—interest | 37,675 | 19 | 3 |
| Interest on mortgages, accrued but not due | 95,216 | 18 | 8 |
| Loan Charges Account | 30,000 | 0 | 0 |
| Temporary advances to Workers Branch | 50,000 | 0 | 0 |
| Office Furniture and Equipment Account | 1,135 | 9 | 3 |
| Insurance Premiums Account | 496 | 11 | 2 |
| Temporary investments | 200,000 | 0 | 0 |
| Interest on temporary investments, accrued but not due | 1,687 | 13 | 3 |
| Sinking Funds— | |||
| Public Trustee | 302,904 | 13 | 9 |
| Advances Office Sinking Fund Account | 182,180 | 2 | 2 |
| Public Debt Sinking Fund Branch | 568 | 10 | 0 |
| Cash in band and in bank at 31st March, 1915 | 689,501 | 6 | 3 |
| £9,581,498 | 7 | 3 | |
The Superintendent of the State Advances Office is authorized to lend money, for the purpose of purchasing or erecting a dwelling, to any person employed in manual or clerical work who is not in receipt of an income of more than £200 per annum, and is not the owner of any land other than the allotment on which it is proposed to build. The sum advanced must not exceed £450, nor may any advance be granted exceeding the value of the dwellinghouse to be erected. The advance is secured by a mortgage over the whole property. No loan can be granted to any person who does not take up permanent residence on the security.
The interest is payable half-yearly, together with an instalment of the principal, which by this means is fully repaid in 36½ years, thirty years, or twenty years, as the case may be, when the mortgage is released. Valuation fees and the cost of preparing and registering the necessary deeds are fixed by regulation on an exceedingly low scale, and are payable by the borrower.
The amount of the loan granted by the Board may either be paid over in one sum, or, when the dwelling is to be erected, may be advanced in progress-payments as the erection of the building proceeds. An inspection and report must be made by an officer of the Valuation Department prior to any progress-payment being made on account of the loan, and for each such inspection a fee of 7s. 6d. is payable by the applicant.
Plans and specifications, if required, are supplied to applicants free of charge, in order to enable a selection to be made. Eighteen different types of homes, containing from two to eight rooms, are covered by the plans. They are drawn with a view to getting the maximum of room and convenience for a reasonable price. The cost of the buildings varies according to the size, from £120 to £640. The plans may be inspected at the Chief Post-offices in the Dominion, and at the Valuation Offices at Invercargill, Dunedin, Christchurch, and Auckland.
The reason for including a type of building to cost £200 above the maximum authorized to be lent to workers is that an applicant may have some money saved and would wish to expend the amount on a better building than could be erected for the sum borrowed.
On securities classified by the Board as first class, loans may be granted for a term of 36½ years; second class, for thirty years; on third class, for twenty years. The classifying of securities rests entirely with the Board.
Loans are granted only on the instalment system, and may be repaid or readjusted as in the case of a loan from the Advances to Settlers Branch. Interest is charged at the rate of 5 per cent., reducible to 4½ per cent. provided payment is made not later than fourteen days after due date and no arrears or other payment under the mortgage remain outstanding.
Mortgages under the Land Transfer Act, 1908, are, if the applicant's title is free from encumbrance, prepared and completed free of charge to mortgagors, with the exception of the repayment of cash disbursements, which are deducted from the advance.
Application for a loan may be made to Postmasters or to representatives of the Valuation Department.
The total of the advances to workers up to the 31st March, 1915 (including moneys repaid and again advanced), was £2,856,750.
The applications received for loans during the year ended the 31st March, 1915, numbered 1,492, the aggregate amount required being £462,065. The advances actually granted during the year numbered 948, for an aggregate of £313,025. The tenures upon which these loans were made were,—
| Tenure. | Number of Loans. | Aggregate Amount. |
|---|---|---|
| £ | ||
| Freehold | 906 | 303,830 |
| Leasehold | 42 | 9,195 |
| Totals | 948 | £313,025 |
The total number of loans and the aggregate amount authorized in each provincial district from the inception of the system to the 31st March, 1915, are as follows:—
| Provincial District. | Number of Applications. | Amount of Advances authorized. |
|---|---|---|
| £ | ||
| Auckland | 3,160 | 893,530 |
| Taranaki | 343 | 94,270 |
| Hawke's Bay | 670 | 188,905 |
| Wellington | 2,626 | 781,670 |
| Marlborough | 344 | 98,715 |
| Nelson | 199 | 47,945 |
| Westland | 190 | 41,205 |
| Canterbury | 2,533 | 763,045 |
| Otago— | ||
| Otago portion | 804 | 223,630 |
| Southland portion | 388 | 101,815 |
| Totals | 11,257 | 3,234,730 |
The total amount advanced to the end of the financial year was £2,856,750, and the net amount outstanding at the same date was £2,402,758, secured upon the following tenures:—
| Tenure. | Number of Loans outstanding. | Aggregate Amount outstanding. |
|---|---|---|
| £ | ||
| Freehold | 7,877 | 2,297,807 |
| Leasehold | 555 | 104,951 |
| Totals | 8,432 | £2,402,758 |
The following table gives particulars of the transactions for each of the past nine years and the total transactions since the passing of the Government Advances to Workers Act on the 29th October, 1906:—
| ADVANCES TO WORKERS, 1906–7 TO 1914–15. | ||||||
|---|---|---|---|---|---|---|
| Year ended 31st March. | Applications received. | Loans authorized. | Amount advanced. | Amount repaid. | ||
| Number. | Amount. | Number. | Amount. | |||
| £ | £ | £ | £ | |||
| 1907 | 160 | 42,920 | 107 | 27,875 | 5,490 | .. |
| 1908 | 1,150 | 308,690 | 1,072 | 268,430 | 203,978 | 6,312 |
| 1909 | 1,784 | 472,989 | 1,220 | 307,495 | 298,184 | 18,792 |
| 1910 | 2,028 | 550,651 | 1,854 | 470,425 | 362,353 | 26,295 |
| 1911 | 2,125 | 660,892 | 1,521 | 473,530 | 407,760 | 47,925 |
| 1912 | 2,223 | 750,772 | 1,900 | 612,910 | 543,840 | 78,853 |
| 1913 | 1,805 | 574,493 | 1,254 | 397,175 | 449,260 | 84,771 |
| 1914 | 1,599 | 528,240 | 1,200 | 339,200 | 272,860 | 80,933 |
| 1915 | 1,492 | 462,065 | 1,129 | 337,690 | 313,025 | 110,110 |
| Total to 31st March, 1915 | 14,366 | 4,351,712 | 11,257 | 3,234,730 | 2,856,750 | 453,991 |
The financial position of the Advances to Workers Branch of the State Advances Office as on the 31st March, 1915, is shown in the following table:—
| ADVANCES TO WORKERS BRANCH: LIABILITIES AND ASSETS, 31ST MARCH, 1915. | |||
|---|---|---|---|
* Of the mortgage instalments overdue, a large percentage had been received by Postmasters at 31st March, 1915, and was in course of transit. | |||
| Liabilities. | £ | s. | d. |
| Sundry loans | 2,490,657 | 12 | 7 |
| Temporary loan from Settlers Branch | 50,000 | 0 | 0 |
| Interest payable on loans, accrued but not due | 25,391 | 3 | 8 |
| Advances Suspense Account | 11,210 | 0 | 0 |
| Fire Loss Suspense Account | 480 | 0 | 0 |
| Suspense Account | 124 | 9 | 10 |
| Reserve Fund, being net profits transferred | 14,365 | 11 | 11 |
| £2,592,228 | 18 | 0 | |
| Assets. | |||
| Investment Account— | £ | s. | d. |
| Less total repayments | 2,396,845 | 12 | 7 |
| *Plus mortgage instalments overdue—principal | 5,913 | 2 | 6 |
| Total principal owing by mortgagors at 31st March, 1915 | 2,402,758 | 15 | 1 |
| *Mortgage instalments overdue—interest | 12,686 | 4 | 7 |
| Interest on mortgages, accrued but not due | 30,521 | 13 | 8 |
| Loan Charges Account | 52,000 | 0 | 0 |
| Insurance Premiums Account | 198 | 1 | 1 |
| Sinking Funds— | |||
| Public Trustee | 2,715 | 17 | 9 |
| Advances Office Sinking Fund Account | 47,747 | 2 | 8 |
| Public Debt Extinction Fund Branch | 508 | 10 | 0 |
| Cash in hand and in bank at 31st March, 1915 | 43,029 | 13 | 2 |
| £2,592,228 | 18 | 0 | |
Loans are granted to Municipal Corporations, County Councils, Road Boards, or any other local body empowered to strike rates for the security of loans for,—
The construction of a road, including channelling;
The construction of a bridge;
The construction of waterworks for the supply of water within a district;
The construction of drainage-works or irrigation-works; or
The construction of sanitary works.
The rate of interest at which loans are granted is to be 4½ per cent. per annum, or 1/8 per cent. per annum more than the rate of interest at which the money is borrowed (whichever charge is the greater). Special provision is made for advances to local authorities for the purpose of constructing roads and bridges in outlying districts, and for metalling such roads for the first time. Applications for such loans receive preference. Loans are repayable, principal and interest, in thirty-six years and a half. Power is given to lend for a term up to fifty years, but loans for a longer term than thirty-six years and a half are not favoured by the Board. After the poll by the ratepayers is taken and the resolution levying the rate gazetted the Department does all that is necessary. The loans may be obtained by instalments (not exceeding four) as the work proceeds. The loan must he lifted within one year of the granting of the same, and so payment of interest on unused moneys avoided, as interest is charged by the Department only on moneys paid out. In any case where a local authority is authorized by the ratepayers to borrow moneys, and the Advances Board has provisionally approved or finally granted an application for a loan at a specified rate of interest, the loan, or any part thereof, may be raised at a higher rate of interest without any further consent of the ratepayers being obtained if, before the loan or any part thereof is paid to the local authority, a resolution in the prescribed form making a special rate sufficient to cover the increased payments in respect of the loan or part thereof as aforesaid is passed by the local authority at a special meeting and is gazetted. Special provisions exist in respect of joint loans. Two or more local authorities are permitted to unite and raise an aggregate amount for several works.
During the year ended the 31st March, 1915, seventy-seven new applications for loans to local bodies were provisionally approved, sixty-seven of these being for local bodies situated in the North Island. Information as to the number of applications and amount of advances provisionally approved is given for each provincial district.
| Applications provisionally approved. | ||
|---|---|---|
| Provincial | Number. | Amount. |
| District. | £ | |
| Auckland | 39 | 42,555 |
| Taranaki | 10 | 12,950 |
| Hawke's Bay | 3 | 62,300 |
| Wellington | 15 | 35,520 |
| Marlborough | 1 | 28,500 |
| Nelson | 2 | 3,000 |
| Westland | 4 | 35,045 |
| Canterbury | 1 | 200 |
| Otago | 2 | 2,000 |
| Totals | 77 | £222,070 |
The new applications finally approved during the year numbered forty-eight, and amounted to £254,430.
The amount actually paid over to local bodies during the year was £237,285.
The total sum raised by the Government for loans to local bodies to the 31st March, 1915, is £2,258,067.
Local bodies were at the 31st March last indebted to the Department to the extent of £2,098,264 in respect of principal moneys.
The transactions of the Local Authorities Branch of the State Advances Office during each of the past five years, and the total transactions to the 31st March, 1915, are as follows:—
| ADVANCES TO LOCAL AUTHORITIES, 1910–11 TO 1914–15. | ||||||
|---|---|---|---|---|---|---|
| Year ended 31st March. | Applications provisionally approved. | Loans authorized. | Amount advanced. | Amount repaid. | ||
| Number. | Amount. | Number. | Amount. | |||
| £ | £ | £ | £ | |||
| 1911 | 429 | 3,572,585 | 193 | 947,770 | 405,195 | 1,172 |
| 1912 | 257 | 1,184,133 | 227 | 1,047,484 | 790,485 | 8,010 |
| 1913 | 93 | 136,513 | 87 | 181,795 | 494,135 | 20,781 |
| 1914 | 167 | 166,165 | 72 | 84,970 | 259,430 | 29,600 |
| 1915 | 77 | 222,070 | 48 | 254,430 | 237,285 | 29,800 |
| Totals to 31st March, 1915 | 1,023 | 5,281,466 | 627 | 2,516,449 | 2,186,530 | 89,363 |
A statement of the liabilities and assets of the Local Authorities Branch as at the 31st March, 1915, is appended.
| Liabilities. | £ | s. | d. |
|---|---|---|---|
* Of the mortgage instalments overdue, a large percentage had been received by Post-masters at 31st March, 1915, and was in course of transit. | |||
| Sundry loans | 2,258,067 | 0 | 0 |
| Money received from Treasury in accordance with section 72, Local Bodies' Loans Act, 1913 | 3,208 | 8 | 9 |
| Interest on loan - moneys, accrued but not due | 33,234 | 12 | 0 |
| Suspense Account | 44 | 18 | 1 |
| £2,294,554 | 18 | 10 | |
| Assets. | £ | s. | d. |
| Investment Account, less total repayments of principal— | |||
| Local bodies | 2,057,501 | 11 | 3 |
| Section 70, Local Bodies' Loans Act, 1913 | 39,665 | 5 | 3 |
| *Plus mortgage instalments overdue—principal | 1,096 | 16 | 10 |
| Total balance of principal owing on mortgages | 2,098,263 | 13 | 4 |
| Interest on mortgages— | |||
| *Overdue at 31st March, 1915 | 2,754 | 4 | 2 |
| Accrued but not due at 31st March. 1915 | 17,857 | 1 | 2 |
| Loan Charges Account | 21,651 | 5 | 0 |
| Sinking Funds— | |||
| Public Trustee | 48,461 | 0 | 5 |
| Advances Office Sinking Fund Account | 43,099 | 8 | 8 |
| Public Debt Extinction Fund Branch | 1,137 | 0 | 0 |
| Profit and Loss Account | 45,561 | 16 | 7 |
| Cash in hand and in bank at 31st March, 1915 | 15,769 | 9 | 6 |
| £2,294,554 | 18 | 10 | |
The Workers' Dwellings Act, 1905, made provision for the erection by the State of workers' dwellings on Grown or settlement lands set apart for that purpose. It was laid down that the cost of construction must not exceed £300, and the dwellings were to be disposed of to workers on a weekly tenancy or by way of lease for a period of fifty years, with right of renewal. The rent fixed by the Act was to be at the rate of 5 per cent. on the capital value of the dwellings, plus insurance and rates. Provision was also made for a worker to acquire the freehold of the dwelling in one of three ways—viz., by a cash payment after a twenty-five years lease; by monthly payments over periods of thirty-two or forty-one years; or by taking out a life-insurance policy (with the State Office) covering a term of twenty-five, thirty-two, or forty-one years, the policy-moneys to be paid to the State on maturity.
By an amendment passed shortly after the principal Act certain lands reserved for defence purposes were set aside as sites for workers' dwellings, and the maximum cost of construction was raised to £350 in the case of a wooden dwelling, or £400 for a dwelling of brick, stone, or concrete.
A worker was defined in the Act of 1905 as one who is landless and whose earnings do not exceed £156 per annum. The maximum of annual earnings was increased in 1906 to £200, but in 1910 a new Workers' Dwellings Act was passed which fixed the maximum at £175.
The Act of 1910 contained other important alterations in the law relating to workers' dwellings. The maximum capital value was set clown at £600, and a new system of disposal of the dwellings was instituted. Dwellings could be let on a weekly or monthly tenancy at a rental of 6 per cent., plus rates and insurance, or leased for a term of twenty-one years, with right of renewal. In cases where the worker desired to acquire the freehold, he could do so on the instalment system—viz., by weekly, fortnightly, or monthly payments for a period of 25½ years, instalments being calculated at 7 per cent. (5 per cent. on account of interest and 2 per cent. on account of principal). An initial deposit of £10 was payable, and the purchaser could reduce the term of 25½ years by at any time paying off the principal the sum of £7 or any multiple thereof.
In 1914 a further amendment was passed for the purpose of facilitating the administration of the Act. In lieu of the Boards formerly constituted in the various land districts, a Central Board has been constituted in Wellington, with District Boards in the various centres where agencies of the Department of Labour are established.
The maximum capital value of a worker's dwelling was by the amendment extended from £600 to £750. This extension has been necessitated mainly by the fact that workers' dwellings are now being erected on rural allotments of about 5 acres, with the maximum unimproved value of land of £250: this allows £500 for the cost of any buildings erected.
Instead of the first instalment of £10 being required when application for a dwelling is made, only £1 is now necessary in the first instance, and the remaining £9 is called for as soon as it is decided to erect a dwelling for the applicant. Provision has also been made, in the case of a concrete or brick dwelling, to extend the period for the repayment of the principal rom 25½ to 36½ years. It is anticipated that by this means the weekly payments on a dwelling will be reduced by about 2s. 6d.
The number of dwellings erected under the original Act was 126, and up to the 31st March, 1915, 345 had been erected under the Act of 1910, while 77 were in course of construction, making a total of 548. The following table sets out the information:—
| District. | Erected under Act of 1905. | Erected under Act of 1910. | In Course of Erection on 31st March, 1915. | Total. | |
|---|---|---|---|---|---|
| To 31st March, 1914. | During Year ended 31st March, 1915. | ||||
| Auckland | 35 | 58 | 25 | .. | 118 |
| Wellington | 40 | 23 | 16 | 11 | 90 |
| Christchurch | 31 | 27 | .. | .. | 58 |
| Dunedin | 20 | 2 | .. | 4 | 26 |
| Frankton Junction | .. | .. | 6 | .. | 6 |
| Ngaruawahia | .. | .. | .. | 6 | 6 |
| Tauranga | .. | .. | .. | 6 | 6 |
| To Puke | .. | .. | 7 | .. | 7 |
| Tolaga Bay | .. | .. | 8 | .. | 8 |
| Gisborne | .. | .. | 14 | .. | 14 |
| Napier | .. | .. | 4 | 2 | 6 |
| Hastings | .. | .. | 8 | .. | 8 |
| Patea | .. | .. | 10 | .. | 10 |
| Hawera | .. | .. | .. | 4 | 4 |
| Manaia | .. | .. | .. | 2 | 2 |
| Wanganui | .. | 13 | .. | 6 | 19 |
| Palmerston North | .. | 6 | 6 | .. | 12 |
| Masterton | .. | .. | 23 | .. | 23 |
| Picton | .. | .. | .. | 5 | 5 |
| Blenheim | .. | .. | .. | 5 | 5 |
| Nelson | .. | .. | 6 | .. | 6 |
| Westport | .. | .. | 12 | .. | 12 |
| Greymouth | .. | 14 | .. | .. | 14 |
| Ashburton | .. | .. | .. | 6 | 6 |
| Temuka | .. | 9 | .. | .. | 9 |
| Timaru | .. | 19 | .. | .. | 19 |
| Fairlie | .. | .. | .. | 7 | 7 |
| Willowbridge | .. | .. | 13 | .. | 13 |
| Waimate | .. | .. | .. | 6 | 6 |
| Oamaru | .. | .. | .. | 7 | 7 |
| Invercargill | .. | 12 | 4 | .. | 16 |
| Totals | 126 | 183 | 162 | 77 | 548 |
The whole of the 126 dwellings erected under the 1905 Act were leased or let after their erection to applicants for same, but 79 have since the passing of the 1910 Act been disposed of under the instalment-purchase system provided in the latter Act. The whole of the dwellings erected under the 1910 Act were built for applicant purchasers.
The total expenditure in connection with workers' dwellings during the year ended the 31st March, 1915, was £69,345, this amount including £608 incurred for maintenance, fire insurance, rates, &c., upon the dwellings erected under the Act of 1905, and leased to occupants. The balance, £68,737, was made up as follows:—
| £ | |
|---|---|
| Acquisition of land | 7,547 |
| Preparation of land | 13,353 |
| Erection of dwellings | 59,441 |
| Administration, &c. | 396 |
| £68,737 |
The total instalments payable during the year amounted to £12,116. The average weekly instalments payable by purchasers of four- and five-roomed dwellings built under the Act are shown below. The amounts shown include fire insurance, but not rates or maintenance.
| Name of Town. | Four Rooms and Section. | Five Rooms and Section. | ||
|---|---|---|---|---|
* The higher payments for four-roomed dwellings in these cases are due to the occupants having chosen more expensive designs than the occupants of five-roomed houses. † Rural settlement. | ||||
| s. | d. | s. | d. | |
| Auckland | 15 | 7* | 14 | 9* |
| Wellington | 17 | 3 | 17 | 6 |
| Christchurch | 12 | 2 | 13 | 9 |
| Dunedin | 14 | 4 | 15 | 5 |
| Frankton Junction | 12 | 10 | 15 | 6 |
| Te Puke | 12 | 3 | 13 | 0 |
| Tolaga Bay | 14 | 8 | .. | |
| Gisborne | 13 | 6 | 15 | 3 |
| Napier | .. | 14 | 9 | |
| Hastings | 14 | 1 | 15 | 0 |
| Patea | 13 | 2 | 15 | 1 |
| Palmerston North | 12 | 8 | 16 | 0 |
| Masterton | 14 | 8 | 17 | 5 |
| Masterton† | 14 | 0 | 14 | 10 |
| Nelson | 12 | 8 | 13 | 6 |
| Westport | .. | 11 | 10 | |
| Willowbridge† | 16 | 0 | 17 | 2 |
| Fairlie† | 12 | 3 | 14 | 2 |
| Invercargill | .. | 14 | 1 | |
| Average for all towns | 13 | 10 | 14 | 11 |
The Act of 1905 contained provisions whereby the management and control of any workers' dwellings erected by the State could be placed under the control of a local body. The Municipal Corporations Act, 1908, gave authority for Borough Councils to erect workers' dwellings, and an amendment to the Counties Act, 1913, extended this authority to County Councils.
Table of Contents
THE law relating to old-age, military, and widows' pensions is contained in the Pensions Act, 1913, a consolidation of previous enactments, and in the Pensions Amendment Act, 1914. The history of legislation dealing with old-age pensions is given in previous issues of this book.
The qualifications for the old-age pension are briefly as follows:—
The applicant, if a male, must have reached the age of sixty-five, or, if a female, must have reached the age of sixty.
NOTE.—The pension age has been reduced to fifty-five for women and to sixty for men where the applicant is the parent of two or more children under fourteen years of age for the maintenance of whom he (or she) is responsible. The pension payable in such cases may be any sum up to £13 per annum, in addition to the ordinary pension payable as set out hereunder.
The applicant must have resided continuously in New Zealand for the past twenty-five years.
NOTE.—Continuous residence is not interrupted by absences not exceeding two years. An additional six months' period of absence is allowed for every additional year's residence in excess of the twenty-five years immediately preceding the date of application, provided that the applicant has resided in New Zealand during the twelve months immediately preceding the said date of application. In the case of a seaman continuous residence is not interrupted by absences on board a ship registered in New Zealand, provided the applicant establishes the fact that his home is in New Zealand.
The applicant must not during the past twelve years have been imprisoned for four months or on four occasions for an offence punishable by twelve months' imprisonment.
The applicant must not during the past twenty-five years have been imprisoned for five years for any offence.
The applicant must not during the past twelve years have deserted his wife (or husband as the case may be) and children.
The applicant must have lived a sober and reputable life during the past year.
The yearly income of the applicant, if single, must not reach £60, and, if married, £100.
The net value of accumulated property must not be £260 or over.
The applicant must not have deprived himself or herself of property or income to qualify for a pension.
All residents of New Zealand who fulfil the necessary conditions are eligible for the old-age pension, with the exception of—
Maoris who receive votes other than pensions out of the grant appropriated by the Civil List Act, 1908.
Aliens.
Naturalized subjects who have not been naturalized one year.
Chinese or other Asiatics, whether naturalized or not, and whether British subjects by birth or not.
The term “alien” is deemed not to include a woman who ceased to be a British subject by reason of marriage with an alien who is since deceased, or from whom she is legally separated.
All applications for pensions are referred to a Stipendiary Magistrate for determination. The Magistrate, who is required to hear each case in chambers, has power to dispense with the personal attendance of the applicant, if he is satisfied that the documentary evidence in support of the claim is sufficient to establish it.
The Magistrate intimates his decision to the Commissioner of Pensions, who, if the pension is allowed, issues a pension-certificate for the amount granted, without which no payment can be made.
The term of a pension is for twelve months only, and an application for renewal is required to be made each year. The first of twelve monthly instalments is paid on the first day of the next month following the granting of the pension by the Magistrate. Payment is made through the Post Office.
The original Act of 1898 provided for a pension of £18 per annum, or 6s. 11d. per week. This amount was, however, increased to £26 per annum (i.e., 10s. a week or £2 3s. 4d. a month) by the Amendment Act of 1905.
The full pension of £26 is reduced by—
£1 for every complete £1 of income over £34.
£1 for every complete £10 of net accumulated property.
£1 for every year or part of a year by which the age of the applicant is less than sixty-five years.
The income of a married applicant for pension purposes is considered to be half of the joint incomes of husband and wife. The joint incomes of a married couple must not exceed, with pension added, the sum of £100.
Income includes free board and lodging up to £26 per annum, but does not include—
Sick allowance or funeral benefits paid by a friendly society.
Relief by way of charity, or gifts from relatives, up to £52 in any year.
Grants from the Gold-miners' and Coal-miners' Relief Funds.
Capital expended for the benefit of the applicant, or the wife or husband of the applicant.
Property received on the intestacy, or under the will, of a deceased husband or wife.
The income chargeable is that derived during the twelve months preceding the date of application, the Magistrate having power to exempt all personal earnings earned at a rate not exceeding £2 a week, provided it is shown to his satisfaction that owing to loss of employment or any other cause such earnings have ceased.
Net accumulated property is the capital value of all real and personal property owned by an applicant, other than life assurance policies and annuities, or other life interests in the capital sum of which the applicant has no interest beyond the income derived therefrom, less the following deductions:—
The amount of mortgage existing on the property.
£340 from the home, including furniture and personal effects.
£50 from any other property.
The net accumulated property of a husband or wife for pension purposes is half of the total net accumulated properties of both.
The pension is not affected by any increase in the value of property used exclusively as a home, which is taken at the valuation obtaining at the date of the original grant of the pension.
Provision is made for including transferred property, or property disposed of by will by the husband or wife of an applicant, in the computation of the pension.
To ascertain whether a pensioner is entitled to a renewal of his pension he is required each year, shortly before the expiry of the certificate held by him, to furnish a statement of his income during the past year, and also of his property. On receipt of this statement the Registrar proceeds to verify the contents, and then submits it to the Magistrate, who investigates it in the same manner as an original claim, the pensioner being required to attend at the discretion of the Magistrate. The decision of the Magistrate is notified to the Commissioner, who issues a fresh pension-certificate for the amount for which the pension is renewed, and authorizes payment for another twelve months.
If a person is physically unfit to draw his pension in person he may apply to the Commissioner to have an agent appointed to collect instalments. Any authority issued to such an agent holds good only for the pension-certificate for any one year, but it may be renewed each year when the pension itself is renewed.
A pension granted to a person maintained in a charitable institution is paid to the governing body of the institution on production of an authority signed by the local Registrar. A fresh authority is required each month in cases of this nature.
When any person to whom a pension has already been granted is committed to a mental hospital, the instalments of such pension are payable to the superintendent of the institution. An inmate of a mental hospital, however, cannot lodge an original claim for a pension.
The pension, being for the personal support of the pensioner, is absolutely inalienable, whether by way of assignment, charge, execution, bankruptcy, or otherwise howsoever.
No payment is made of an instalment which falls due while a pensioner is in gaol or out of New Zealand.
On the death of a pensioner the portion of the instalment accruing to date of death, together with any unpaid instalment then payable, may be paid if applied to defray funeral expenses, or, in the case of a charitable institution, towards cost of maintenance.
If the Commissioner has reason to believe that any pension has been improperly obtained he may suspend payment and cause an inquiry to be held before a Magistrate, who has full power to act.
If during the currency of a pension-certificate a pensioner, or the wife or husband of a pensioner, becomes possessed of property or income in excess of the amount allowed by law, the Commissioner may apply to the Magistrate to have the pension cancelled or varied. A Magistrate has power on his own initiative to review any previous decision, and to cancel or amend any pension-certificate.
Any person who by a wilfully false statement obtains or attempts to obtain a pension to winch he is not entitled is liable to six months' imprisonment, or to a fine of £50, as also is any person who aids or abets such person.
It is an offence to receive money in consideration of the procuring of a pension for any person: and it is also an offence to refuse to answer any question concerning an applicant or any statement contained in an application, the penalty being a line not exceeding £10 in each case.
Where it has been found that a pensioner has been overpaid, and the Magistrate is of opinion that such overpayment was obtained by fraud, the pensioner is liable, in addition to imprisonment, to a penalty of double the amount paid in excess.
If on the death of a pensioner, or the wife or husband of a pensioner, it is found that either of them was possessed of property in excess of the amount allowed by law in respect to the amount of pension granted, double the amount of pension so overpaid may be recovered from the estate.
If a pensioner is convicted of drunkenness or of any offence punishable by imprisonment for one month or more, or misspends, wastes, or lessens his estate, the Commissioner is empowered to pay the instalments of pension to an agent for the benefit of the pensioner, or to suspend the pension for such period as he deems fit.
Any person otherwise qualified to receive a pension who owns property on which he resides, and which does not permit of the granting of a full pension, may qualify for the full pension by transferring the said property to the Public Trustee. The pensioner is permitted to reside on the property rent-free during his lifetime, but he must pay all rates and charges thereon. If a husband and wife, both being pensioners, are living together, and one dies, the survivor' is permitted to continue to reside on the property. On the death of both pensioner and survivor, or where the pensioner is no longer entitled to a pension, the Public Trustee shall sell the property, and, after deducting from the proceeds of the sale the amount of pension paid as a consequence of the transfer of the property, together with his commission and interest at the rate of 4 per cent., shall pay the balance to the person or persons entitled thereto. Provision is made for a pensioner, or survivor, or next-of-kin paying such amounts as aforesaid at any time, with a view to obtaining a re transfer of the property and obviating a sale.
The number of old-age pensions in force on the 31st March, 1915, was 19,352, an increase of 1,302 on the figures for the previous year. The annual liability was £475,970, being an average of £24 11s. 10d. per pension. The total payment in respect of old-age pensions during the year was £460,814. The number in force at the end of each year since the institution of the system, the total amount paid during each year, and the annual cost per head of population are as follows:—
| At 31st March | Pensioners. | Amount. | Cost per Head of Population. | |
|---|---|---|---|---|
| £ | s. | d. | ||
| 1899 | 7,443 | 3,124 | 0 | 1 |
| 1900 | 11,285 | 157,342 | 4 | 1 |
| 1901 | 12,405 | 197,292 | 5 | 1 |
| 1902 | 12,776 | 207,468 | 5 | 3 |
| 1903 | 12,481 | 210,140 | 5 | 2 |
| 1904 | 11,926 | 203,164 | 4 | 10 |
| 1905 | 11,770 | 195,475 | 4 | 6 |
| 1906 | 12,582 | 254,367 | 5 | 8 |
| 1907 | 13,257 | 314,184 | 6 | 10 |
| 1908 | 13,569 | 325,199 | 6 | 11 |
| 1909 | 14,396 | 336,760 | 6 | 11 |
| 1910 | 15,320 | 362,496 | 7 | 4 |
| 1911 | 16,020 | 383,393 | 7 | 7 |
| 1912 | 16,649 | 406,256 | 7 | 10 |
| 1913 | 16,509 | 415,761 | 7 | 10 |
| 1914 | 18,050 | 416,776 | 7 | 7 |
| 1915 | 19,352 | 460,814 | 8 | 4 |
The total payments to the 31st March, 1915, aggregated £4,850,011.
The number and value of existing pensions at the various rates on the 31st March, 1915, were—
| Rate per Annum. | Number. | Liability. |
|---|---|---|
| £ | £ | |
| 39 | 48 | 1,872 |
| 38 | 3 | 114 |
| 36 | 3 | 108 |
| 35 | 3 | 105 |
| 34 | 2 | 68 |
| 33 | 1 | 33 |
| 32 | 2 | 64 |
| 26 | 14,449 | 375,674 |
| 25 | 692 | 17,300 |
| 24 | 696 | 16,704 |
| 23 | 625 | 14,375 |
| 22 | 612 | 13,464 |
| 21 | 601 | 12,621 |
| 20 | 185 | 3,700 |
| 19 | 189 | 3,591 |
| 18 | 175 | 3,150 |
| 17 | 121 | 2,057 |
| 16 | 165 | 2,640 |
| 15 | 106 | 1,590 |
| 14 | 127 | 1,778 |
| 13 | 85 | 1,105 |
| 12 | 75 | 900 |
| 11 | 65 | 715 |
| 10 | 57 | 570 |
| 9 | 42 | 378 |
| 8 | 65 | 520 |
| 7 | 40 | 280 |
| 6 | 33 | 198 |
| 5 | 23 | 115 |
| 4 | 16 | 64 |
| 3 | 29 | 87 |
| 2 | 13 | 26 |
| 1 | 4 | 4 |
| Totals | 19,352 | 475,970 |
The ages of pensioners (exclusive of Maoris) on the roll on the 31st March, 1915, were as shown in the following table:—
| Age, in Years. | Number. |
|---|---|
* Not including 697 Maoris. | |
| 60 | 401 |
| 61 | 425 |
| 62 | 421 |
| 63 | 464 |
| 64 | 439 |
| 65 | 582 |
| 66 | 719 |
| 67 | 822 |
| 68 | 912 |
| 69 | 986 |
| 70 | 1,360 |
| 71 | 976 |
| 72 | 1,067 |
| 73 | 1,054 |
| 74 | 1,039 |
| 75 | 925 |
| 76 | 869 |
| 77 | 783 |
| 78 | 682 |
| 79 | 655 |
| 80 | 642 |
| 81 | 559 |
| 82 | 510 |
| 83 | 351 |
| 84 | 290 |
| 85 | 181 |
| 86 | 147 |
| 87 | 108 |
| 88 | 85 |
| 89 | 62 |
| 90 | 52 |
| 91 | 30 |
| 92 | 10 |
| 93 | 13 |
| 94 | 10 |
| 95 | 14 |
| 96 | 2 |
| 97 | 1 |
| 98 | 1 |
| 99 | 4 |
| 100 | 1 |
| 101 | 1 |
| Total | 18,655* |
Tables are also given showing (1) original nationality and (2) sex and conjugal condition of all pensioners on the roll on the 31st March, 1915.
| (1.) ORIGINAL NATIONALITIES OFALL PENSIONERS ONTHE ROLL ONTHE 31ST MARCH, 1915. | |
|---|---|
| Number. | |
| British (England) | 8,708 |
| ” (Ireland) | 3,878 |
| ” (Scotland) | 3,413 |
| ” (New Zealand) | 798 |
| ” (Australia) | 469 |
| ” (Wales) | 146 |
| ” (Canada) | 117 |
| ” (Channel Is'ds) | 71 |
| ” (South Africa) | 18 |
| ” (Isle of Man) | 14 |
| ” (West Indies) | 14 |
| ” (India) | 12 |
| British (Newfoundland) | 9 |
| ” (Fiji) | 2 |
| ” (Malta) | 2 |
| ” (Pitcairn Island) | 1 |
| German | 345 |
| Dane | 170 |
| Norwegian | 110 |
| Swede | 106 |
| Austrian | 53 |
| French | 39 |
| Italian | 38 |
| American | 37 |
| Russian | 28 |
| Swiss | 18 |
| Dutch | 14 |
| Portuguese | 12 |
| Greek | 5 |
| Belgian | 5 |
| Spaniard | 2 |
| Chilian | 1 |
| Maori | 697 |
| Total | 19,352 |
These pensioners are now all British subjects, as required by law.
| (2.) SEX AND CONJUGAL CONDITION OF PENSIONERS ONTHE ROLL ONTHE 31ST MARCH, 1915. | ||||
|---|---|---|---|---|
| Sex. | Single. | Married. | Widowed. | Totals. |
| Male | 2,159 | 4,004 | 2,598 | 8,761 |
| Female | 373 | 3,989 | 6,329 | 10,591 |
| Totals | 2,532 | 7,893 | 8,927 | 19,352 |
The conjugal condition of all old-age pensioners (43,301) admitted to the roll since the Act of 1898 came into force is as follows: Single, 7,110; married, 20,433; widowed, 15,758.
The Widows' Pensions Act, 1911, came into operation on the 1st January, 1912. The scope of this Act was widened by an Amendment Act passed in 1912, further amendments being embodied in the Act of 1913 consolidating the law relating to old age, widows', and military pensions.
Applicants for widows' pensions must be British subjects of good character, and applications require to be lodged with the local Registrar of Pensions, and to be investigated by a Magistrate, who alone has power to grant pensions. The term “widow” includes a woman whose husband is detained in a mental hospital.
The maximum pension payable is £12 per annum to a widow with one child under fourteen years of age, with £6 per annum added for each additional child under fourteen. The term “child” includes a stepchild, or a child legally adopted during the lifetime of the husband of the applicant.
For children born before the arrival of their parents in New Zealand ten years' residence is required. A child born out of New Zealand during the temporary absence of its mother, however, is not debarred from the benefits of the Act.
The foregoing rates of pension are subject to a deduction of £1 for every £1 of the annual income of the widow and her children under fourteen in excess of £30. Such annual income, however, does not include personal earnings which do not exceed £100.
Property which produces no income, or an income of less than 5 per cent. of its value, is deemed to produce an income of at least 5 per cent. of such value, and such amount is included in the computation of the annual income.
Property does not include furniture and personal effects, nor property used as a home up to £340 in value. The pension is not affected by any increase in the valuation of the home, which is charged at the valuation obtaining at the date of the original granting of the pension.
The Act does not apply to aliens, or to Chinese or other Asiatics. Similarly to old-age pensions, all payments are made through the Post Office. In practically every other respect the same conditions as apply to an old-age pension apply to a widow's pension.
Provision is also made for continuance of the pension, after the death of a widow, to the guardian of her children.
The number of pensions in force under this head on the 31st March, 1915, was 1,788, the annual value of these being £34,975. The gross payments during the year were £31,619.
The figures for each year since the institution of the system of widows' pensions are as follows:—
| Annual Value. | Annual Payments. | ||
|---|---|---|---|
| Year ended 31st March. | Number at end of Year. | £ | £ |
* Two months. | |||
| 1912 | 788 | 14,803 | 1,963* |
| 1913 | 1,313 | 24,768 | 22,114 |
| 1914 | 1,540 | 29,320 | 27,077 |
| 1915 | 1,788 | 34,975 | 31,619 |
Tables are given showing (1) ages and (2) original nationalities of widows in receipt of pensions as at the 31st March last:—
| (1.) AGES OF WIDOWS INRECEIPT OF PENSIONS ASAT 31ST MARCH, 1915. | |
|---|---|
| Age. | Number. |
* Not including 20 Maoris. | |
| 19 | 2 |
| 20 | 2 |
| 22 | 8 |
| 23 | 5 |
| 24 | 8 |
| 25 | 10 |
| 26 | 21 |
| 27 | 27 |
| 28 | 31 |
| 29 | 33 |
| 30 | 31 |
| 31 | 44 |
| 32 | 51 |
| 33 | 45 |
| 34 | 71 |
| 35 | 64 |
| 36 | 73 |
| 37 | 73 |
| 38 | 80 |
| 39 | 85 |
| 40 | 70 |
| 41 | 73 |
| 42 | 89 |
| 43 | 54 |
| 44 | 97 |
| 45 | 75 |
| 46 | 79 |
| 47 | 63 |
| 48 | 75 |
| 49 | 57 |
| 50 | 42 |
| 51 | 55 |
| 52 | 44 |
| 53 | 29 |
| 54 | 30 |
| 55 | 24 |
| 56 | 14 |
| 57 | 7 |
| 58 | 7 |
| 59 | 9 |
| 60 | 3 |
| 64 | 1 |
| 65 | 1 |
| 69 | 1 |
| (2.) ORIGINAL NATIONALITIES OF WIDOWS INRECEIPT OF PENSIONS ASAT 31ST MARCH, 1915. | |
|---|---|
| Number | |
| British (New Zealand) | 1,173 |
| ” (England) | 289 |
| ” (Ireland) | 100 |
| ” (Australia) | 100 |
| ” (Scotland) | 73 |
| ” (Wales) | 8 |
| ” (Channel Islands) | 1 |
| ” (Pitcairn Island) | 1 |
| ” (Isle of Man) | 1 |
| British (Mauritius) | 1 |
| German | 10 |
| Dane | 4 |
| Italian | 3 |
| Norwegian | 2 |
| American | 2 |
| Maori | 20 |
| Total | 1,788 |
The Military Pensions Act, 1912, was enacted to provide for payment of an annual pension of £36 to veterans of the Maori War who have been awarded the New Zealand War Medal for active service in such war. This Act is now embodied in the Pensions Act of 1913 above referred to, which consolidates the law relating to old-age, widows', and military pensions.
The qualifications of an applicant for this pension are as follows:—
He must have resided in New Zealand for the ten years immediately preceding the date of his application.
He must not have been imprisoned during the same period for any offence punishable by imprisonment for two years.
He must not during the same period have deserted or failed to provide for his wife and children.
He must be of good character and sober habit.
Unlike the old-age and widows' pensions, which require to be determined by a Stipendiary Magistrate, the military pension is obtained by applying direct to the Commissioner of Pensions at Wellington.
The number of pensions in force on the 31st March, 1915, was 1,388, representing an annual value of £49,968. The payments on account of military pensions during the year aggregated £47,616. The figures for each year since the Act of 1912 came into force are,—
| Year ended 31st March. | Number at end of Year. | Annual Value. | Annual Payments. |
|---|---|---|---|
| £ | £ | ||
| 1913 | 568 | 19,026 | 3,681 |
| 1914 | 1,240 | 44,640 | 29,447 |
| 1915 | 1,388 | 49,968 | 47,616 |
The total claims lodged to the 31st March, 1915, have been 1,765, of which number 1,580 have been established and 185 refused. Included amongst these were 359 claims from Maoris, of which 306 have been “ranted. Among the rejected applicants were 150 to whom no medal had been awarded, 6 deserters, 4 not qualified by residence, and 18 who had died. Of the 1,580 pensions granted, 191 have been terminated by death, and 1 has been cancelled. The new pensions granted during 1914–15 numbered 256, and the deaths during the year were 108. The number of pensioners on the roll is expected to decrease rapidly, the death-rate of persons of the ages covered (only 48 of the 1,105 European pensioners are under sixty-five years of age) being very high, and the final date for the lodging of applications for the war medal having been fixed at the 30th June, 1915. As a matter of fact, the number of pensions in force on the 30th September, 1915, was 1,350, a decrease of 38 in six months.
The ages of those in receipt of military pensions at 31st March, 1915, are as follows:—
| Age. | Number. |
|---|---|
Total 1,105 * * Not including 283 Maoris. | |
| 57 | 1 |
| 58 | 1 |
| 59 | 2 |
| 60 | 4 |
| 61 | 7 |
| 62 | 6 |
| 63 | 10 |
| 64 | 17 |
| 65 | 34 |
| 66 | 45 |
| 67 | 48 |
| 68 | 67 |
| 69 | 68 |
| 70 | 72 |
| 71 | 79 |
| 72 | 81 |
| 73 | 66 |
| 74 | 97 |
| 75 | 60 |
| 76 | 56 |
| 77 | 50 |
| 78 | 44 |
| 79 | 41 |
| 80 | 45 |
| 81 | 26 |
| 82 | 24 |
| 83 | 8 |
| 84 | 16 |
| 85 | 4 |
| 86 | 5 |
| 87 | 5 |
| 88 | 5 |
| 89 | 5 |
| 90 | 1 |
| 92 | 2 |
| 94 | 1 |
| 97 | 2 |
The War Pensions Act, 1915, and the Defence Amendment Act, 1915, provide for the payment of pensions to the following:—
Any disabled member of the New Zealand Forces.
Any dependant of a disabled, deceased, or missing member of the New Zealand Forces.
“Member of the Forces” includes—
A member of any New Zealand Expeditionary Force raised for service beyond New Zealand in the present war.
A member of any New Zealand Naval Force raised for service beyond New Zealand in the present war.
A member of the New Zealand Army Nursing Service who, while domiciled in New Zealand, has served beyond New Zealand in the present war and was in the pay of the New Zealand Government.
A member of the New Zealand Defence or Naval Forces temporarily attached to any other portion of His Majesty's Forces who has served beyond New Zealand in the present war and was in receipt of pay from the Imperial Government.
Any person, not being a member of any New Zealand Expeditionary or Naval Force, who, while domiciled in New Zealand, has served beyond New Zealand in the present war and was in receipt of pay from the New Zealand Government.
Any person, not being a member of any New Zealand Expeditionary Force, who has been engaged on active military service in any capacity in New Zealand in connection with the present war.
A “dependant” may be wife, child, father, mother, grandfather, grand-mother, stepfather, stepmother, grandchild, brother, sister, or mother-in-law, and, except wife or child, must have been wholly or in part dependent upon the earnings of a member of the Forces at any time during the twelve months immediately preceding the date on which the said member joined the Forces.
A “dependant” may, however, include a father or mother who was not actually dependent during the said twelve months, but is without adequate means of support. In such cases the father must be fifty-five years of age, and the mother fifty years.
A “child” means a person under the age of sixteen years, being a son, daughter, stepson, stepdaughter, or illegitimate child of a member of the Forces, or a child legally adopted by such member before he became a member of the Forces.
The death or disablement of any member of the Forces must be due to wounds, injuries, or disease contracted in the course of employment on military service in connection with the present war.
Death or disablement may have taken place in New Zealand or after departure from New Zealand.
The pension may, however, be refused to a disabled applicant if any wilful misconduct contributed to the disablement.
Forms of application, which may be obtained direct from the Commissioner of Pensions at Wellington, or from any Registrar of Pensions, or from any Chief Postmaster, either direct or through the local post-office, must be lodged, when completed, with the Registrar of Pensions in the district in which the applicant resides. It is important that this requirement be attended to, as otherwise the claim is likely to be delayed.
There are two forms of application—one for a disabled member, the other for any dependant—and it is necessary that the wife of a disabled member shall apply separately on the form required from a dependant. The wife, however, may indicate that any pension granted to her may be paid to her husband.
Claims should be lodged by disabled members of the Forces within six months after the termination of appointment or date of discharge, by the wife within six months after date of marriage if solemnized after disablement, and in the case of death by any dependant within six months after the date of the notification of such death.
All claims are forwarded to the Commissioner of Pensions at Wellington and recorded by him.
Where the applicant is the wife of a Native member of the Forces, married according to Maori custom, a certificate relating to such marriage must be supplied by a Judge, Commissioner, or Registrar of the Native Land Court. This should, if possible, be sent in with the application.
The amount of pension payable is determined by a War Pensions Board, located in Wellington, subject to the approval of the Minister of Defence.
In deciding any claim by a disabled applicant the Board is required to take into account the payment of public moneys under any Act of Parliament, but not including superannuation. The receipt of any other income or the possession of any property does not affect the pension in any way.
The Board may, when satisfied that a disabled member requires the services of an attendant and is not able to pay for such services, increase the pension by 10s. a week.
In regard to claims by dependants, the Board is required to inquire into the property and income from all sources of the applicant, and of all persons liable by law for the maintenance of the said applicant.
In the case of disablement the pension dates from the termination of the appointment or from the date of discharge.
In the case of death the pension dates from the date of death, and, where a member is missing, from the date on which he was so reported.
Should a missing member eventually be reported as living, power is given to withdraw the pension, and if necessary to adjust matters by deduction from the accumulated pay of the member.
Should the circumstances of any pensioner or applicant for pension alter, the Board may review its determination.
Any pension may be cancelled by the Board on the conviction of the pensioner for any offence punishable by imprisonment for three months or upwards. The Act provides for a fine of £100 or twelve months' imprisonment for attempted fraud.
The applicant is informed of the Board's decision by the Commissioner of Pensions.
In the matter of pensions to dependants, the claims of a wife and her children under sixteen years of age have precedence to any other claims.
Where the wife or children are receiving pensions, any other dependant, such as the father or mother, may not receive more than three-fourths of the amount payable to the wife.
Where there is no wife or child, any other dependant may receive the full amount payable to a wife, but not more than the actual amount received during the year preceding the date on which the disabled, deceased, or missing member joined the Forces.
To a disabled member of the Forces the maximum amount of pension payable ranges from £1 15s. a week for a private to £3 a week for a general; to the wife of a disabled member of the Forces, from 12s. 6d. a week for the wife of a private to £1 10s. a week for the wife of a general; to the wife of a deceased or missing member, from £1 5s. a week in the case of a private to £3 5s. a week in the case of a general.
The maximum for any child under sixteen years of age, whether in respect of death or disablement, is 5s. a week. The Board may continue the pension to a female child until the age of seventeen years, and to any infirm child for a longer period. Any orphan child may be granted a pension of 10s. a week.
A pension granted to a wife ceases on her remarriage, but the Board may grant her in that event any amount up to two years' pension as a gratuity.
Capitalized sums in lieu of pensions may be granted at the discretion of the Board.
Power is given under the Act to the Minister to continue voluntary allotments of pay after the date on which the member of the Forces dies, or is reported missing, until such time as the Board determines the rights of the person receiving such pay to a pension.
The wife and children may receive a pension payable in respect of the death of a member of the Forces at any time within seven years of the receipt of any wounds or injury, or the commencement of disease.
When a pension is granted a pension-certificate is issued to the applicant, which must be produced before payment can be made by the paying-officer.
Pensions are paid by monthly instalments at the post-office nearest to the residence of the pensioner.
Instalments will be payable on the first day of the month, and may be collected on any day during the month. If not so collected, and the authority has been returned by the Post Office, application may be made for the amount to the local Registrar of Pensions or Postmaster, or to the Commissioner at Wellington.
If a pensioner is unable to collect the instalments in person on account of disablement, age, or infirmity, an agent may be appointed on application being made direct to the Commissioner or through the local Registrar or Postmaster.
A lost pension-certificate will be replaced on application being made for a duplicate.
Under the Act no pension is payable outside of New Zealand, except in the cases of parents of members of the Forces, of nurses, and of members of the Defence Force in the pay of the Imperial Government. The Government, however, has decided to consider the claims of wives of deceased or missing members of the Forces wherever they may reside.
The maximum pensions payable are set out in detail in the following statement:—
| MAXIMUM RATES OF PENSION INCASE OF DEATH. | |||||||||
|---|---|---|---|---|---|---|---|---|---|
| Rank or Rating. | Maximum Weekly Pension. | ||||||||
| To the wife. | To the child. | Maximum of Aggregate payable. | |||||||
| £ | s. | d. | s. | d. | £ | s. | d. | ||
| Private, bombardier, lance-corporal, trooper, gunner, driver, sapper, trumpeter, bugler | 1 | 5 | 0 | 5 | 0 | 3 | 0 | 0 | |
| Able seaman and equivalent ratings | |||||||||
| Corporal | 1 | 6 | 0 | 5 | 0 | 3 | 3 | 0 | |
| Farrier, shoeing-smith, saddler, or fitter (If bombardier, lance-corporal, gunner, or private) | |||||||||
| Lance-sergeant (not paid as such) | |||||||||
| Leading seaman and equivalent ratings | |||||||||
| Sergeant, farrier-corporal, shoeing-smith corporal, saddler-corporal, corporal-fitter, farrier-sergeant, saddler-sergeant, armourer-sergeant, sergeant-fitter | 1 | 7 | 0 | 5 | 0 | 3 | 6 | 0 | |
| Lance-sergeant (paid as such) | |||||||||
| Petty officer and equivalent ratings | |||||||||
| Squadron, battery, or company sergeant-major, quartermaster-sergeant, colour-sergeant, staff sergeant, pay-clerk | 1 | 9 | 0 | 5 | 0 | 3 | 8 | 0 | |
| Chief petty officer and equivalent ratings | 1 | 10 | 0 | 5 | 0 | 3 | 9 | 0 | |
| Regimental sergeant-major, regimental quartermaster-sergeant | |||||||||
| Warrant officer and equivalent ranks (Navy) | |||||||||
| 2nd lieutenant, lieutenant (Army) | 2 | 0 | 0 | 5 | 0 | 3 | 16 | 0 | |
| Commissioned warrant officer and equivalent ranks; sub-lieutenant and equivalent ranks (Navy) | |||||||||
| Captain (Army) | |||||||||
| Lieutenant under eight years' seniority and equivalent ranks (Navy) | 2 | 5 | 0 | 5 | 0 | 4 | 3 | 0 | |
| Major | |||||||||
| Lieutenant of eight years' seniority and equivalent ranks (Navy) | 2 | 12 | 0 | 5 | 0 | 4 | 12 | 0 | |
| Lieutenant-colonel | 3 | 1 | 0 | 5 | 0 | 5 | 3 | 0 | |
| Captain under three years' seniority and equivalent ranks (Navy) | |||||||||
| Colonel | 3 | 3 | 0 | 5 | 0 | 5 | 5 | 0 | |
| Captain of three years' seniority and equivalent ranks; commanders and equivalent ranks (Navy) | |||||||||
| Brigadier-general, major-general | 3 | 5 | 0 | 5 | 0 | 5 | 9 | 0 | |
| Commodores, first and second class; rear-admiral and other equivalent ranks | |||||||||
| MAXIMUM RATES OF PENSION INCASE OF DISABLEMENT. | |||||||||||
|---|---|---|---|---|---|---|---|---|---|---|---|
| Rank or Rating. | Maximum Weekly Pension. | ||||||||||
| To the Member | To the Wife. | To each Child. | Maximum of Aggregate payable. | ||||||||
| £ | s. | d. | £ | s. | d. | s. | d. | £ | s. | d. | |
| Private, bombardier, lance - corporal, trooper, gunner, driver, sapper, trumpeter, bugler | 1 | 15 | 0 | 0 | 12 | 6 | 5 | 0 | 3 | 12 | 6 |
| Able seaman and equivalent ratings | |||||||||||
| Corporal | 1 | 15 | 0 | 0 | 13 | 0 | 5 | 0 | 3 | 13 | 0 |
| Farrier, shoeing-smith, saddler, or fitter (If bombardier, lance-corporal, gunner, or private) | |||||||||||
| Lance-sergeant (not paid as such) | |||||||||||
| Leading seaman and equivalent ratings | |||||||||||
| Sergeant, farrier-corporal, shoeing-smith corporal, saddler-corporal, corporal-fitter, farrier-sergeant, saddler-sergeant, armourer-sergeant, sergeant-fitter | 1 | 15 | 0 | 0 | 13 | 6 | 5 | 0 | 3 | 13 | 6 |
| Lance-sergeant (paid as such) | |||||||||||
| Petty officer and equivalent ratings | |||||||||||
| Squadron, battery, or company sergeant major, quartermaster-sergeant, colour-sergeant, staff sergeant, pay-clerk | 1 | 15 | 0 | 0 | 14 | 6 | 5 | 0 | 3 | 14 | 6 |
| Chief petty officer and equivalent ratings | |||||||||||
| Regimental sergeant-major, regimental quartermaster-sergeant | 1 | 15 | 0 | 0 | 15 | 0 | 5 | 0 | 3 | 15 | 0 |
| Warrant officer and equivalent ranks (Navy) | |||||||||||
| 2nd lieutenant, lieutenant (Army) | |||||||||||
| Commissioned warrant officer and equivalent ranks; sub-lieutenant and equivalent ranks (Navy) | 1 | 17 | 6 | 0 | 17 | 6 | 5 | 0 | 4 | 0 | 0 |
| Captain (Army) | 2 | 0 | 0 | 1 | 0 | 0 | 5 | 0 | 4 | 5 | 0 |
| Lieutenant under eight years' seniority and equivalent ranks (Navy) | |||||||||||
| Major | 2 | 7 | 0 | 1 | 3 | 6 | 5 | 0 | 4 | 15 | 6 |
| Lieutenant of eight years' seniority and equivalent ranks (Navy) | |||||||||||
| Lieutenant-colonel | 2 | 16 | 0 | 1 | 8 | 0 | 5 | 0 | 5 | 9 | 0 |
| Captain under three years' seniority and equivalent ranks (Navy) | |||||||||||
| Colonel | |||||||||||
| Captain of three years' seniority and equivalent ranks; commanders and equivalent ranks (Navy) | 1 | 18 | 0 | 1 | 9 | 0 | 5 | 0 | 5 | 12 | 0 |
| Brigadier-general, major-general | 3 | 0 | 0 | 1 | 10 | 0 | 5 | 0 | 5 | 15 | 0 |
| Commodores, first and second class; rear-admiral and other equivalent ranks | |||||||||||
The question of providing pensions' for the public and semi-public servants of the Dominion on their retirement has received a good deal of attention in recent years. The schemes now in force embrace the State Railways (1903), Public Service (1908) including Police (1899), and Teachers (1906), while the various local bodies are empowered to establish schemes under the Local Authorities Superannuation Act, 1908.
The Public Service Superannuation Act, 1907, now embodied in the Public Service Classification and Superannuation Act, 1908, which with its amendments includes all branches of the Public Service except the Railway Department and so much of the Education Department as is included in Part IX of the Education Act. 1908 (mainly Inspectors and teachers of public schools), came into force on the 1st January, 1908. The scheme, although optional on the part of public servants permanently employed at that date, is compulsory on all persons appointed thereafter.
The principal benefits are—
A pension for every year of service equal to one-sixtieth of the average annual salary for the last three years, payable (a) after forty years' service, or (b) at age sixty-five, or (c) on retirement owing to ill health. The maximum pension is not to exceed two-thirds of the salary, or, in the case of entrants after the 24th December, 1909, £300 per annum.
A pension of £18 per annum to the widow of a contributor or pensioner during widowhood, and £13 per annum for each child under the age of fourteen.
Females may retire after thirty years' service or at the age of fifty-five while the retiring age may be reduced in certain cases for both males and females. Special pensions may be given in the case of a member of the Police Force for injuries received on duty.
The contributions vary with the age on joining the fund: For ages under thirty they are 5 per cent. of the salary; ages thirty and under thirty-five, 6 per cent.; thirty-five and under forty, 7 per cent.; forty and under forty-five, 8 per cent.: forty-five and under fifty, 9 per cent.; fifty and over. 10 per cent.
The following table contains particulars of the public servants who were contributing to the fund at the end of the year 1914, grouped according to their respective rates of contribution:—
| Rate per Cent. of Contribution as provided by the Act. | Number. | Annual Salary. | Annual Contributions. | ||
|---|---|---|---|---|---|
| Male. | Female. | Total. | |||
| £ | £ | ||||
| 5 | 6,491 | 962 | 7,453 | 991,554 | 49,578 |
| 6 | 1,232 | 147 | 1,379 | 285,127 | 17,108 |
| 7 | 910 | 86 | 996 | 227,865 | 15,950 |
| 8 | 701 | 70 | 771 | 190,539 | 15,243 |
| 9 | 594 | 35 | 629 | 173,035 | 15,573 |
| 10 | 546 | 29 | 575 | 154,780 | 15,478 |
| Totals | 10,474 | 1,329 | 11,803 | 2,022,900 | 128,930 |
It will be seen that on the 31st December, 1914, there were 11,803 contributors paying £128,930 per annum into the fund. The pensioners at the same date numbered 959, and were entitled to £70,399 per annum, made up as follows:—
| Number. | Pension. | |
|---|---|---|
| Retired for age or length of service | 510 | 57,059 |
| Retired for ill health | 95 | 7,512 |
| Police injured on duty | 4 | 413 |
| Widows | 173 | 3,114 |
| Children | 177 | 2,301 |
| 959 | £70,399 |
The revenue and expenditure for the year ended 31st December, 1914, were as follows:—
| Revenue. | £ |
| Amount of fund at beginning of year | 537,914 |
| Members' contributions— | |
| Under section 29 (ordinary) | 126,921 |
| Transfers from other superannuation funds | 124 |
| Government contribution | 48,000 |
| Interest | 25,607 |
| Fines, &c. | 86 |
| £738,652 | |
| Expenditure. | |
| Retiring-allowances— | £ |
| To members | 62,081 |
| To widows and children | 4,824 |
| Contributions returned— | |
| Under section 46, Amendment Act (left service) | 9,659 |
| Under section 42 or 43 (death) | 1,627 |
| Under section 38 (retirement) | 471 |
| Under section 32 (ee) | 853 |
| Under section 32 (f) | 143 |
| Transfers to other superannuation funds (section 48) | 37 |
| Compensation (section 32 (f)) | 2,212 |
| Expenses— | |
| Salaries | 710 |
| Office expenses | 98 |
| Medical fees | 36 |
| Board members' travelling-expenses | 14 |
| Post Office charges | 50 |
| Election expenses | 26 |
| Amount of fund at end of year | 655,811 |
| £738,652 | |
The assets and liabilities of the fund as at 31st December last are set out in the annexed statement:—
| BALANCE-SHEET ATTHE 31ST DECEMBER, 1914. | |
|---|---|
| Liabilities. | £ |
| Fund as per Revenue Account | 655,811 |
| Retiring and other allowances due, in course of payment—Members | 1,236 |
| Widows and children | 52 |
| Refunds of contributions due, in course of payment— | |
| Under section 46, Amendment Act (left service) | 485 |
| Under section 42 or 43 (death) | 939 |
| Under section 32 (f) | 78 |
| Under section 38 (retirement) | 140 |
| Compensation (section 32 (f)) due, in course of payment | 1,165 |
| Expenses due, in course of payment— | |
| Salaries | 162 |
| Office expenses | 35 |
| Medical fees | 2 |
| Post Office charges | 50 |
| Postal Department | 243 |
| Unclaimed (contributions, &c.) | 511 |
| Contributions paid in advance and in error | 453 |
| £661,362 | |
| Assets. | |
| Amount invested with the Public Trustee | 636,872 |
| Contributions due, in transmission— | |
| Under section 29 (ordinary) | 4,472 |
| Transfers from other superannuation funds | 48 |
| Interest accrued, but not due | 19,766 |
| Fines and recoveries due, in course of transmission | 204 |
| £661,362 | |
An amendment of the law under which the fund is administered was passed during the session of 1912, abolishing the provision for reduction or postponement of allowances to widows and children in cases where compensation is paid under the Workers' Compensation Act for the death of a contributor by accident. Two widows and two children, whose allowances had been deferred previously, became entitled to payment as from the date of passing of the amendment.
The Government Actuary, in his report on the actuarial examination of the fund for the first triennium, recommended that the State subsidy be increased from £23,000 to £48,000 per annum during the succeeding triennium. By the amending Act mentioned above parliamentary sanction was given to the increased payment as from the 1st January, 1913. The increase in the subsidy was necessitated through officers retiring, with service for which they had paid no contributions, the basis of the scheme being that the State should pay for these pensions except in so far as they were provided for by the members' contributions.
The Actuary's report on the second triennium, covering the period from the 1st January, 1911, to the 31st December, 1913, has been presented to Parliament. The report sets out the position of the fund at the end of 1913, and gives an estimate of the pensions falling due during 1913, 1915, and 1916. The estimated amounts of the pensions for the three years are set down as £66,664, £74,665, and £83,058 respectively. If the amounts provided by contributions are deducted, the State subsidies required on this basis would be £60,163, £66,286, and £72,516. The Actuary advises that, in addition to the annual subsidy of £48,000 hitherto paid, further subsidies of £12,000, £18,000, and £25,000 will be necessary in 1914, 1915, and 1916, or an average of £18,000 for the three years. It is pointed out that the subsidies paid to the fund so far have in reality been old payments in a new guise, taking the place of compensation for loss of office and gratuities; for, while the State's total contribution to the fund for the six years ended the 31st December, 1913, has been £156,500, the compensation the pensioners would have been entitled to if they had not accepted pensions was £149,554. This sum is computed only to the date these pensioners joined the fund, whereas if there had been no fund there would have been further compensation from that date to the date of retirement, bringing the sum in excess of the actual subsidy.
The report of the Superannuation Board for the year 1914 shows that up to the end of that year the total amount saved to the Consolidated Fund since the initiation of the superannuation scheme has been £176,328, the State subsidies to the fund aggregating £204,500, or only £28,172 in excess of the actual saving referred to, which is reckoned only to the dale the contributors joined the fund.
There has also been a great saving in gratuities to widows and children of public servants, for while these amounted to £26,210 for the five years prior to the establishment of the fund, for the next succeeding five years they amounted to only £6,065, or a decrease of over £20,000.
The Police Provident Fund, which was established on the 1st December, 1899, under the Police Provident Act. 1899, was merged in the Public Service Superannuation Fund on the 1st April, 1910, and members of the Police Force contributing at that date now pay the same contributions and receive the same benefits (plus the special allowance if injured on duty) other members of the Public Service.
The Teachers' Superannuation Fund was established by the Teachers' Superannuation Act, 1905, which came into operation on the 1st January, 1906. Under this scheme the pensions were computed at ⅙ th of the total salary received during the years of contribution and 1/120 of the total salary received during service between the 1st January, 1878, and the 1st January, 1906, with a minimum pension of £52 per annum.
The benefits were brought into line with those of the Public Service by the Public Service Classification and Superannuation Amendment Act, 1908, and with a few exceptions all the contributors accepted the new benefits.
There are a few slight differences between the Public Service and the Teachers' Funds, the chief being that (1) the service of the teachers need not be continuous; (2) no pensions are payable on retirement for ill health unless the service exceeds fifteen years; and (3), in the case of reduction of status owing to age or infirmity, there is no provision that the pension must be computed on the higher salary as in the Public Service Fund.
Education service to which the Act applies is defined as service in any capacity for not less than twenty hours a week—
Under an Education Board; or
Under the governing body of a secondary school; or
Under the managers of associated classes under Part VII of the Education Act, 1908; or
Under the Education Department in the case of Inspectors of Schools or of Inspectors, managers, or visiting officers of industrial schools, or of teachers of any schools under the control of that Department.
Under the provisions of the Public Service Classification and Superannuation Amendment Act, 1912, those persons who were in the Education service on the 1st January, 1906, and who were still in the service, could elect, on or before the 30th June, 1913, to become contributors to the fund, contributions being payable as from the 1st January, 1906. This provision was taken advantage of by 156 persons.
Provision was also made whereby those persons employed in the University colleges at the date of the coining into operation of the Act (7th November, 1912) could elect, on or before the 30th June, 1913, to become contributors to the fund, and in these oases such contributors would be entitled to count back service. Forty-six persons joined the fund under this provision. All persons first permanently employed under the University of New Zealand and the University colleges after the date of the passing of the Amendment Act must become contributors to the fund.
It was also provided that the Government contribution to the fund as from the 1st January, 1913, should be increased from £7,000 to £17,000 per annum.
On the 31st December, 1914, there were 4,269 contributors, the annual contributions amounting to £47,831.
The pensions were 504, representing a charge of £35,191 per annum, made up of—
| Number. | Amount of Pension. | £ |
|---|---|---|
| Retired for age or length of service | 318 | 28,709 |
| Retired for ill health | 56 | 4,419 |
| Widows | 72 | 1,309 |
| Children | 58 | 754 |
| 504 | £35,191 |
The revenue and expenditure for the year ended the 31st December, 1914, were as follows:—
| Revenue. | £ |
| Funds at beginning of the year | 265,136 |
| Contributions | 49,252 |
| Re credits | 57 |
| State subsidy | 17,000 |
| Interest | 12,317 |
| £343,762 | |
| Expenditure. | |
| Pensions | 33,485 |
| Contributions refunded | 7,441 |
| Contributions transferred to other funds | 48 |
| Commission | 87 |
| Funds at the end of the year | 302,701 |
| £343,762 |
The balance-sheet of the Teachers' Superannuation Fund as at the 31st December, 1914, reads as follows:—
| Assets. | £ |
| Amount in hands of Public Trustee | 294,283 |
| Contributions in transit | 2,795 |
| Contributions outstanding | 5,120 |
| Allowances paid in advance | 15 |
| Interest accrued and outstanding | 806 |
| £303,019 | |
| Liabilities. | |
| Fund as per Revenue Account | 302,701 |
| Retiring-allowances in transit | 5 |
| Retiring-allowances unpaid | 170 |
| Refund of contributions in transit | 115 |
| Unclaimed contributions | 28 |
| £303,019 |
The Government Actuary, in his report containing the results of an actuarial examination of the fund for the triennium 1911–13, estimated that the amounts required for pensions during the next three years would be—1914, £33,309; 1915, £38,111; 1916, £42,958. Contributions paid by those benefiting would provide only a small proportion of the cost, leaving the State to contribute balances of £29,137. £32,896, and £36,600 in the respective years. The Actuary reported that, in addition to the annual subsidy of £17,000 at present being paid, further subsidies of £12,000 in 1914, £16,000 in 1915, and £20,000 in 1916 would be required. As in the case of the Public Service scheme, the amount of pension purchased by the contributions is very small, but the proportion to the total is already increasing. Most of the pensions in either scheme are for long periods of service, with, of course, only short periods of contribution.
The Government Railways Superannuation Fund was established on the 1st January, 1903, by the Government Railways Superannuation Fund Act, 1902, now embodied in the Government Railways Act, 1908.
The pension is hero also 1/60th of the annual rate of pay for every year of service, but the retiring age is sixty for both males and females, instead of ages sixty-five and fifty-five respectively as in the Public Service. The only other differences of importance are that the annual allowances to widows and children are paid only on the death of contributors before retiring on a pension, and that the pension is computed on the last salary except where the contributor has served in a lower grade within the previous five years, in which case the average for seven years is taken.
The contributions originally were: For ages not exceeding thirty when the first contribution became payable, 3 per cent.; ages thirty and under thirty-five, 4 per cent.; thirty-five and under forty, 5 per cent.; forty and under forty-five, 6 per cent.; forty-five and under fifty, 7 per cent.; fifty and over, 10 per cent.
These contributions are still payable by members who joined the scheme prior to the 1st January, 1908, but for those who joined subsequently the contributions are the same as are payable under the Public Service scheme.
The number of contributors on the 31st March, 1915, was 11,190, and at that date there were 1,373 persons on the fund, drawing annual allowances amounting to £79,936.
The revenue and expenditure for the year ended the 31st March, 1915, were—
| Revenue. | £ |
| Amount of funds on 1st April, 1914 | 295,470 |
| Contributions (including arrears) | 75,024 |
| Interest | 13,218 |
| Fines | 577 |
| Donation by His Excellency the Governor | 10 |
| State subsidy | 50,000 |
| £434,299 | |
| Expenditure. | |
| Retiring-allowances to members | 70,080 |
| Allowances to widows and children | 7,438 |
| Payments to legal representatives of deceased members | 925 |
| Contributions refunded | 9,381 |
| Contributions transferred to Public Service Superannuation Fund | 44 |
| Fines remitted | 6 |
| Expenses | 269 |
| Amount of funds at the end of the year | 346,156 |
| £434,299 |
The assets and liabilities of the fund as at the 31st March, 1915, were—
| Assets. | £ |
| Amount in hands of Public Trustee | 335,780 |
| Contributions and fines in transit | 6,992 |
| Arrears of contributions due by members in respect of casual service | 3,924 |
| £347,696 | |
| Liabilities. | |
| Fund as per Revenue Account | 346,156 |
| Life allowances not paid | 646 |
| Widows' allowances not paid | 374 |
| Contributions due to be refunded not paid | 520 |
| £347,696 |
The Local Authorities Superannuation Act, 1908, which came into force on the 10th October, 1908, applies to Borough Councils, County Councils. Town Boards, Road Boards, Harbour Boards, Charitable Aid Boards, Tramway Companies, or any body possessing rating powers over any district.
The benefits and contributions are the same as in the Public Service Fund. Under the Act of 1908 a contributor's service prior to joining the fund was not counted for pension purposes. By an amendment passed in 1912, however, local authorities were empowered, when establishing superannuation funds, to grant in respect of prior service an additional retiring-allowance not exceeding 1/60th of the annual salary for each year of such prior service.
So far as can be ascertained, three local authorities have initiated superannuation schemes under the authority of the statute—namely, Wellington Harbour Board, Auckland Harbour Board, and Buller County Council. The subsidies payable by the respective local authorities are as follows:—
Wellington Harbour Board: 65 per cent. of the members' contributions, equivalent to 5 per cent. of the salaries.
Auckland Harbour Board: 60 per cent. of the members' contributions, equivalent to 4 per cent. of the salaries.
Buller County Council: 80 per cent. of the members' contributions, equivalent to 7 per cent. of the salaries.
The Wellington Harbour Board was the first local authority to inaugurate a superannuation scheme under the authority of the Act. Its permanent employees had six months from the 1st April, 1913, in which to decide whether they would become contributors to the fund. Of a total of 328 permanent employees, 262 had decided, within the specified time, to join the fund. The number of contributors to the fund on the 30th September, 1914, was 253. It is compulsory for all new permanent employees of the Board to join the fund.
The National Provident Fund was established by Act in 1910, and came into operation on the 1st March, 1911. This measure offers facilities for voluntary thrift on the basis of mutual contributions by the State and the individual, and represents a striking departure in social legislation undertaken by the Government of New Zealand, there being particular features in this scheme that distinguish it from the provident systems of other countries.
The fund is administered by a Board composed of the Hon. the Minister of Finance as Chairman and four members appointed by the Governor, one of whom is the Superintendent of the fund.
The main object of the scheme is to provide for annuities in old age. This, however, is supplemented by benefits for the protection of the family from birth to old age.
The system is open to any person between the ages of sixteen and forty-five years residing in New Zealand, and whose average income during the three years prior to joining has not exceeded £250 per annum. There is no medical examination on entry, and the method of joining is extremely simple, the applicant having merely to fill in a form at a postal money-order office and pay a first weekly contribution.
The benefits are as follows:—
After twelve months in the fund a payment not exceeding £6 for medical attendance on the birth of a contributor's child or children.
After five years in the fund an allowance, after three months' incapacity for work, of 7s. 6d. per week for each child of a contributor under fourteen years of age.
A weekly pension at age sixty of 10s., 20s., 30s., or 40s., according to the scale of contributions.
After five years in the fund an allowance, on the death of a contributor, of 7s. 6d. per week for each child until fourteen years of age, and 7s. 6d. for the widow so long as any child is under fourteen years of age.
The maternity allowance is payable only if the combined income of a contributor and wife or husband does not exceed £200 per annum at the time of claim, but this limitation does not debar from the other benefits. The incapacity allowance is not payable where the incapacity is due to the serious misconduct of the contributor, and the amount is not to exceed the pecuniary loss which, in the opinion of the Board, the contributor has probably suffered during incapacity. Further, the income of a contributor during incapacity, independent of the fund, is not to exceed the rate of £4 per week.
The contributions range from 9d. per week at age seventeen, 1s. at age twenty-two. 1s. 3d. at twenty five, and so on to age forty-five, for the 10s. pension, the rate being two, three, or four times as much if a higher pension is applied for. A contributor may increase or decrease his pension after entry. The pension does not affect the rights of any person to the old-age pension.
The contributions are payable in weekly sums at any postal money-order office; but, as any number of contributions may be paid at one time, contributors have the choice of paying weekly, monthly, quarterly, half-yearly, yearly, or at irregular intervals.
In the event of a contributor leaving the fund or dying, all contributions (loss any benefits received) are returnable. If a contributor dies before the first five years are completed his representatives receive the contributions he has paid, less anything he received during lifetime by way of maternity benefit. Should he die after age sixty, before receiving in benefits a sum equal to the contributions paid in during his lifetime, the difference is returnable to his representatives; and, further, if the allowances paid for widow and children do not exhaust the contributions, his representatives are entitled to the residue. If a contributor dies before sixty, leaving a widow and no children, all the contributions are returnable, less benefits paid out.
The latitude allowed for arrears is very wide, and covers a period of eighteen months, but after six months a fine equal to one-eighth of the contributions is to be paid. If a contributor is drawing the incapacity allowance he pays no contributions during that period.
Moneys payable out of the fund cannot be assigned in any way, nor, on the death of a contributor, be assets to pay his debts or liabilities.
The benefits under the Act are guaranteed by the State, winch subsidizes the contributions to the extent of one-fourth of the amount paid into the fund.
Organizing lecturers are operating in the various centres and personally explaining the system to the workers at their factories, workplaces, &c., a method that is found to be productive of satisfactory results, and is consequently being extended.
An important extension of the fund was authorized by the amending Act of 1914 whereby the employees of local authorities, companies, firms, and employers generally could be enrolled in the fund for superannuation purposes.
The result of the fund's operations up to the end of the fourth year is indicated in the following table:—
| At end of— | Number of Contributors. | Annual Rate of Contribution payable. | Amount of Fund. |
|---|---|---|---|
| £ | £ | ||
| 1911 | 550 | 3,172 | 1,826 |
| 1912 | 2,660 | 11,727 | 10,038 |
| 1913 | 5,791 | 22,719 | 29,327 |
| 1914 | 6,858 | 26,520 | 53,718 |
Information as to contributors to the fund from the date of its inception to the 31st December last is shown in the next table.
| CONTRIBUTORS TO NATIONAL PROVIDENT FUND TO END OF 1914. | ||||||||||||||||
|---|---|---|---|---|---|---|---|---|---|---|---|---|---|---|---|---|
| Number of Contributors. | Annual Contributions | |||||||||||||||
| Class I. Pension Rate, 10s | Class II. Pension Rate. 20s. | Class III. Pension Rate, 30s. | Class IV. Pension Rate. 40s. | Aggregate. | ||||||||||||
| M. | F. | T. | M. | F. | T. | M. | F. | T. | M. | F. | T. | M. | P. | T. | £ | |
| Total entered | 7,411 | 509 | 7,920 | 758 | 118 | 676 | 95 | 13 | 108 | 122 | 8 | 130 | 8,386 | 648 | 9,034 | … |
| Total transferred from other classes | 129 | 3 | 132 | 33 | 6 | 39 | 5 | 2 | 7 | 6 | 1 | 7 | 173 | 12 | 185 | … |
| 7,540 | 512 | 8,052 | 791 | 124 | 915 | 100 | 15 | 115 | 128 | 9 | 137 | 8,559 | 660 | 9,219 | 35,197 | |
| Total discontinued | 1814 | 139 | 1953 | 149 | 22 | 171 | 21 | 3 | 24 | 28 | ... | 28 | 2,012 | 164 | 2,176 | … |
| Total transferred to other classes | 30 | 3 | 33 | 101 | 3 | 104 | 20 | 4 | 24 | 22 | 2 | 24 | 173 | 12 | 185 | … |
| 1844 | 142 | 1986 | 250 | 25 | 275 | 41 | 7 | 48 | 50 | 2 | 52 | 2,185 | 176 | 2,361 | 8,677 | |
| Total contributors on books at 31st December, 1914 | 5,696 | 370 | 60,666 | 541 | 99 | 640 | 59 | 8 | 67 | 78 | 7 | 85 | 6,374 | 484 | 6,858 | 26,520 |
The benefits paid out of the fund for the year ended the 31st December, 1914, amounted to only £1,816, which sum represents maternity grants paid to 306 contributors.
Table of Contents
THE Banking Act, 1908, consolidates the law of New Zealand relating to the general business of banking in the Dominion. The Act provides that the incorporation of banks by Royal Charter shall be as effectual within New Zealand as Acts of the General Assembly. The number of directors is prescribed, and authority given to any bank to increase its capital on a resolution of the shareholders. Transfers of shares on which there is any liability must be approved by the directors, or their duly appointed attorney or attorneys. Every bank trading in the Dominion is required to furnish quarterly statements of its business, for publication in the Gazette. A sworn copy of an entry in the books of a bank shall in all legal proceedings be evidence of such entry, and a bank is not required in any legal proceedings to which it is not a party to produce its books before a Court, unless ordered by a Judge for special cause. Provision is made for bank holidays, and for the destruction of cheques, drafts, bills of exchange, or promissory notes after the expiration of ten years from the date or due date of such documents.
Part II of the Bills of Exchange Act, 1908, consolidates the law relating to cheques on a bank.
The Companies Act, 1908, with the exception of Part IX (as to companies incorporated outside New Zealand), and also of the provisions relating to branch registers, does not apply to companies formed within and carrying on business within the Dominion, but the whole Act applies to companies incorporated outside the Dominion.
There are six banks of issue trading in New Zealand, two of these institutions, the Bank of New Zealand and the National Bank of New Zealand, being incorporated by special Acts of the General Assembly of the Dominion. The Bank of New Zealand (special reference to which is made later on in this section) has branches in London, Australia, Fiji, and Samoa, while its branches and agencies within the Dominion number 212, the other five banks having between them 216 such establishments, a total of 428, being an average of one bank to every 2,575 inhabitants, excluding Maoris.
The paid-up capital of the above banks, their reserve funds, and the rate and amount of their last dividend as on the 31st December, 1914, were as follows:—
| Bank. | Paid-up Capital. | Rate per Cent. per Annum of Last Dividend and Bonus. | Amount of Last Half-yearly Dividend and Bonus. | Reserve Fund. |
|---|---|---|---|---|
| Bank of New Zealand— | £ | Per Cent. | £ | £ |
| 4-per-cent. stock guaranteed by New Zealand Government | 526,405 | .. | .. | .. |
| “A” preference shares issued to the Crown (Act of 1903) | 500,000 | 10 (on “A” shares) | 50,000 | .. |
| “B” preference shares issued to the Crown (Act of 1913) | 250,000 | .. | .. | .. |
| Ordinary shares | 960,222 | 12 and bonus of 3 per cent. | 75,000 | 1,601,608 |
| Union Bank of Australia (Limited) | 2,000,000 | 10 and bonus of 4 per cent. | 140,000 | 2,145,510 |
| Bank of New South Wales | 3,500,000 | 10 | 175,000 | 2,500,000 |
| Bank of Australasia | 2,000,000 | 14 and bonus of 12/- per share | 170,000 | 2,784,000 |
| National Bank of New Zealand (Limited) | 750,000 | 12 and bonus of 2 per cent. | 52,500 | 765,817 |
| Commercial Bank of Australia (Limited)— | ||||
| Ordinary | 95,659 | .. | .. | .. |
| Preference | 2,117,350 | 4 (preference only) | 42,347 | 9,876 |
The development of banking in New Zealand since the year 1857 has been very great. Taking for each year the average of the four quarters' returns made up by the banks of issue, the figures for 1857, 1870, 1880, 1890, 1900, and each of the past five years are,—
| Year. | Deposits. | Advances. | Assets. | Liabilities. |
|---|---|---|---|---|
| £ | £ | £ | £ | |
| 1857 | 343,316 | .. | 419,860 | 432,494 |
| 1870 | 3,127,769 | 4,547,217 | 6,315,354 | 3,819,670 |
| 1880 | 8,538,935 | 11,300,404 | 14,220,275 | 9,550,177 |
| 1890 | 12,368,610 | 14,096,446 | 17,735,259 | 13,356,598 |
| 1900 | 15,570,610 | 12,084,744 | 17,314,535 | 16,964,582 |
| 1910 | 24,968,761 | 19,772,656 | 26,398,927 | 26,742,081 |
| 1911 | 26,765,122 | 22,601,863 | 29,433,614 | 28,625,803 |
| 1912 | 25,622,083 | 24,268,634 | 31,196,400 | 27,508,348 |
| 1913 | 25,733,187 | 24,005,038 | 30,708,932 | 27,591,099 |
| 1914 | 27,640,507 | 25,222,127 | 32,502,312 | 29,808,349 |
In 1880 the deposits of these banks were £18 per head of the mean population; in 1890 they were £19.92 per head; in 1900 they were £20.39; in 1910, £25.15; and in 1911, £26.37. In 1912, however, the average fell to £24.66, and in 1913 (the strike year) a further fall is recorded, the rate per head being £24.08. The year 1914 shows a recovery, the rate rising to £25.35. The ratio of advances to deposits, which was 132.34 per cent. in 1880, reached its maximum in 1883, when it stood at 173.35 per cent. The proportion since that year fell, till in 1903 it was only 75.96 per cent. In 1904 the ratio stood at 82.10 per cent., in 1908 at 103.08 per cent., in 1913 at 93.28 per cent., and in 1914 all 91.25 per cent.
In 1886 the average amount of advances made by the banks was 115,853,420, equal to £27.23 per head of the mean population. The advances gradually declined in amount and proportion to population until 1891, when they were in value £11,549,145, or £18.34 per head. In 1897 advances stood at £10,892,111, or £15.09 per head, which is the lowest average since the year 1872. There was then a continuous rise both in amounts of advances and in rates per head of population until 1908, for which year the figures were £22,495,576, or £23.80 per head. In 1910 there was a drop to £19,772,656, which represents £19.92 per head. The figures for 1913 are £24,005,038, or £22.46 per head, and for 1914 £25,222,127, or £23.13 per head. The total amount for the latter year is the highest yet reached. The rate per head has, however, been often exceeded, that of 1878 (£30.53) being so far the high-water mark. The discounts in 1908 amounted to £2,235,209, or £2.37 per head of mean population; in 1910 to £1,741,984, or £1.75 per head; in 1913 to £1,951,665, or £1.83 per head; and in 1914 to £1,843,217, or £1.69 per head. The largest amount of discounts in any year was £6,061,959 in 1879, a rate of £13.53 per head. From 1879 there was a fall, year by year, until 1896, when the sum was £1,756,791, or £2.49 per head, since when the ratio has fluctuated between £2.45 and £1.69 per head, the last six years showing the lowest figures, the rate per head being less 'than £2 in each of the six.
The liabilities of the banks of issue for the last ten years are shown in the table following, the figures given referring to New Zealand business only. The liabilities shown represent the average of the four quarters of the year, with the exception that in the figures for 1912 only the last quarter is taken in respect of the Commercial Bank of Australia, as this institution did not commence operations in the Dominion until fairly late in that year.
| Year. | Notes in Circulation. | Bills in Circulation. | Balances due to other Banks. | Deposits. | Total Liabilities. |
|---|---|---|---|---|---|
| £ | £ | £ | £ | £ | |
| 1905 | 1,468,977 | 77,055 | 52,533 | 20,545,601 | 22,144,166 |
| 1906 | 1,574,254 | 91,969 | 54,542 | 22,422,243 | 24,143,008 |
| 1907 | 1,644,645 | 97,727 | 74,865 | 23,517,111 | 25,334,348 |
| 1908 | 1,615,109 | 93,300 | 81,741 | 21,821,753 | 23,611,903 |
| 1909 | 1,577,558 | 93,582 | 60,565 | 21,996,621 | 23,728,326 |
| 1910 | 1,626,094 | 93,603 | 53,622 | 24,968,761 | 26,742,080 |
| 1911 | 1,677,842 | 113,582 | 69,257 | 26,765,122 | 28,625,803 |
| 1912 | 1,714,667 | 111,877 | 59,721 | 25,622,083 | 27,508,348 |
| 1913 | 1,674,333 | 108,518 | 75,061 | 25,733,187 | 27,591,099 |
| 1914 | 1,998,386 | 96,012 | 73,444 | 27,640,507 | 29,808,349 |
The average assets, as shown below, for the periods corresponding to those above include Colonial Government securities, which in 1914 amounted to £926,387.
| Year. | Coin and Bullion. | Motes and Kills discounted. | Debts due, exclusive of Bad Debts. | All other Assets. | Total Assets. |
|---|---|---|---|---|---|
| £ | £ | £ | £ | £ | |
| 1905 | 4,006,108 | 2,125,511 | 13,370,885 | 2,268,021 | 21,770,525 |
| 1906 | 4,593,954 | 2,068,404 | 14,580,925 | 2,586,650 | 23,829,933 |
| 1907 | 4,836,718 | 2,014,848 | 16,499,197 | 3,233,476 | 26,584,239 |
| 1908 | 4,840,942 | 2,235,209 | 18,937,599 | 3,084,817 | 29,098,567 |
| 1909 | 4,947,096 | 1,928,178 | 17,149,854 | 2,912,137 | 26,937,265 |
| 1910 | 5,035,764 | 1,741,984 | 16,698,015 | 2,923,164 | 26,398,927 |
| 1911 | 5,195,333 | 1,792,261 | 19,467,467 | 2,978,553 | 29,433,614 |
| 1912 | 5,338,295 | 1,847,016 | 21,062,101 | 2,948,988 | 31,196,400 |
| 1913 | 5,204,266 | 1,951,665 | 20,950,633 | 2,602,368 | 30,708,932 |
| 1914 | 5,712,751 | 1,843,217 | 22,407,029 | 2,539,315 | 32,502,312 |
The total amount of deposits, the amount per head of population, the total advances, and the ratio of advances to deposits, taking the average of the four quarters for each of the past ten years, are as follows:—
| Deposits. | Advances. | Year. | Total Amount. | Per Head of Population. | Total Amount. | Ratio to Deposits. |
|---|---|---|---|---|---|---|
| £ | £ | s. | d. | £ | Percent. | |
| 1905 | 20,545,601 | 23 | 12 | 5 | 16,595,156 | 80.77 |
| 1906 | 22,422,243 | 25 | 0 | 10 | 17,833,640 | 79.54 |
| 1907 | 23,517,111 | 25 | 11 | 10 | 19,838,799 | 84.35 |
| 1908 | 21,821,753 | 23 | 1 | 10 | 22,495,576 | 103.08 |
| 1909 | 21,996,621 | 22 | 10 | 2 | 20,386,367 | 92.68 |
| 1910 | 24,968,761 | 25 | 3 | 0 | 19,772,656 | 79.19 |
| 1911 | 26,765,122 | 26 | 7 | 5 | 22,601,863 | 84.45 |
| 1912 | 25,622,083 | 24 | 13 | 2 | 24,268,634 | 94.72 |
| 1913 | 25,733,187 | 24 | 1 | 7 | 24,005,038 | 93.28 |
| 1914 | 27,640,507 | 25 | 7 | 0 | 25,222,127 | 91.25 |
Deposits per head of population in banks of issue in each of the Australian States during the past five years are shown. Figures for New Zealand are also given by way of comparison.
| DEPOSITS PER HEAD IN BANKS OF ISSUE IN AUSTRALASIA. 1910–14. | |||||||||||||||
|---|---|---|---|---|---|---|---|---|---|---|---|---|---|---|---|
| State. | 1910. | 1911. | 1912. | 1913. | 1914. | ||||||||||
| £ | s. | d. | £ | s. | d. | £ | s. | d. | £ | s. | d. | £ | s. | d. | |
| Queensland | 29 | 11 | 6 | 32 | 2 | 2 | 32 | 13 | 0 | 33 | 1 | 3 | 36 | 14 | 11 |
| New South Wales | 30 | 13 | 5 | 33 | 9 | 1 | 34 | 15 | 5 | 31 | 14 | 9 | 34 | 18 | 10 |
| Victoria | 32 | 14 | 9 | 35 | 1 | 10 | 35 | 11 | 1 | 34 | 6 | 10 | 37 | 5 | 4 |
| South Australia | 27 | 1 | 2 | 27 | 3 | 7 | 27 | 14 | 10 | 27 | 1 | 8 | 28 | 17 | 2 |
| Western Australia | 22 | 14 | 10 | 25 | 11 | 0 | 23 | 9 | 2 | 20 | 6 | 11 | 22 | 12 | 6 |
| Tasmania | 19 | 11 | 0 | 19 | 7 | 7 | 21 | 17 | 11 | 26 | 15 | 0 | 28 | 0 | 0 |
| Northern Territory | .. | 17 | 17 | 0 | 22 | 16 | 8 | 26 | 17 | 10 | 36 | 7 | 8 | ||
| Total Commonwealth | 29 | 16 | 5 | 32 | 1 | 8 | 32 | 15 | 10 | 31 | 6 | 1 | 34 | 4 | 7 |
| New Zealand | 25 | 3 | 0 | 26 | 7 | 5 | 24 | 13 | 2 | 24 | 1 | 7 | 25 | 7 | 0 |
The graphs in the following diagram show the amounts of liabilities, assets, and deposits of banks of issue in New Zealand each year from 1857 to 1914.
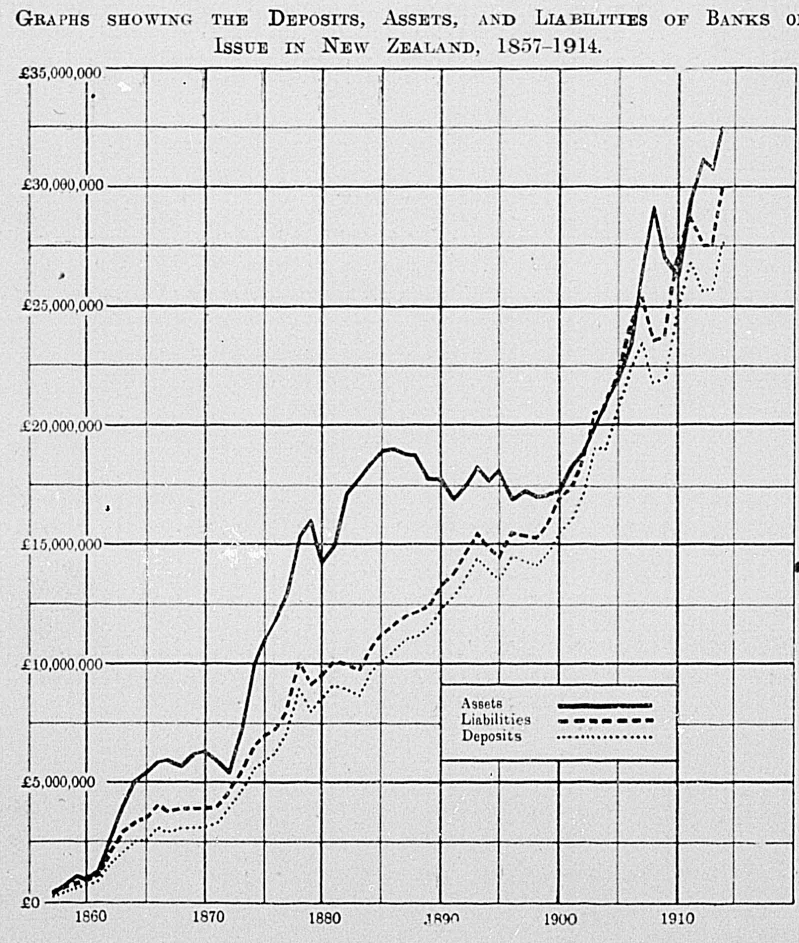
The Banking Act, 1908, deals with the issue of notes generally. The Governor may empower any bank to issue and circulate notes, subject to the provisions and restrictions contained in the charter or letters patent under which such bank is incorporated: all such notes to be payable in gold only at the office of the bank at the place of issue, and to be a first charge on all assets of the bank.
The private Acts of the Bank of New Zealand and the National Bank of New Zealand (Limited) contain the following clause: “That the total amount of promissory notes payable on demand, issued and in circulation within the Dominion, shall not at any time exceed the amount of coin, bullion, and public securities which shall for the time being be held by the same corporation within the Dominion; nor shall the proportion of coin be less than one-third part of the amount of the coin, bullion, and public securities so held by the said corporation within the Dominion.”
On the 5th August, 1914, an amendment to the Banking Act was passed empowering the Governor in Council, from time to time, to make a Proclamation declaring “that the notes payable on demand by any bank therein named, and then issued or thereafter to be issued or reissued within New Zealand under any lawful authority in that behalf, shall during the period limited by the Proclamation be everywhere within New Zealand a good and legal tender of money to the amount therein expressed to be payable.” Conditions governing the issue of such Proclamation are laid down, and the bank may be required to give adequate security that it will redeem the notes in gold on the expiration of the period covered by the Proclamation. Provision is also made for payment by the State Treasury in case of default by the bank. During the period any such Proclamation is in force, gold must not be exported except with the consent of the Minister of Finance, and any gold exported or attempted to be exported in breach of this provision is to be forfeited.
Immediately on the passing of the amendment referred to, Great Britain being then at war with Germany, a Proclamation was gazetted declaring notes of all six banks of issue doing business in New Zealand to be legal tender from the 6th August to the 6th September, 1914. Further extensions of time have since been made.
In 1894 an Act was passed whereby a special issue of shares by the Bank of New Zealand, amounting to £2,000,000, was guaranteed by the New Zealand Government. One-half of this sum was to be at the disposal of the bank for use in its ordinary business, and the remainder was to be invested as the Colonial Treasurer, representing the State, might approve. Until the calling-in or cancellation of the guaranteed shares, no dividend could be paid to ordinary shareholders without the consent of the Treasurer, who was empowered to satisfy himself that any proposed dividend would not unduly affect the security of the State in respect of the guarantee. The Treasurer could require the directors of the bank to call up £500,000, being one-third of the reserve capital, within twelve months, and this was accordingly done. The Government appointed a president and two auditors.
In 1895 a further Act dealing with the Bank of New Zealand was passed. This Act provided for writing off the paid-up capital of the bank (£900,000), together with the proceeds (estimated at £450,000) of the first call of £3 6s. 8d. on the reserve liability of £10 per share. New capital amounting to £500,000, bearing interest at 3½ per cent., was raised by preferred shares, and issued to the State in exchange for Government securities. The bank was given the right to repurchase at par within six years, and this provision was taken advantage of. Further share capital was created by a second call of the reserve liability (£3 6s. 8d.) per share, and it was provided that the remaining third might be called up at any time after the 31st December, 1898. The sum of £1,000,000, which under the Act of 1894 was required to be invested as the Colonial Treasurer might approve, was released for employment in the ordinary business of the bank.
An Assets Realization Board, consisting of two members appointed by the Government and one chosen by the directors of the bank, was established to purchase all the assets of the Bank of New Zealand Estates Company (Limited) and of the Auckland Agricultural Company, for the sum of £2,731,706, being the estimated value of the properties on the 31st March, 1895, subject, however, to an adjustment of station accounts: the purchase-money to be paid in debentures issued by the Board, having a nine years' currency and bearing interest at 3½ per cent., any deficiency to be guaranteed by the Government. The Colonial Treasurer was empowered, in the event of such deficiency, to appoint a receiver in respect of the securities.
The Bank of New Zealand and Banking Act, 1898, provided for a Board of Directors consisting of six persons, instead of five as formerly, four of the directors to be appointed by the Governor in Council and two to be elected by the shareholders.
The Bank of New Zealand Act, 1903, was passed in anticipation of the guaranteed shares issued under the authority of the Act of 1894 reaching maturity on the 19th of July of the year 1904, and of the expiry of the term of currency of the debentures issued by the Assets Realization Board (31st March, 1904). It also made pro visions under which the remaining liability of the proprietors of the bank, under section 21 of the Banking Act, 1861, ranked as ordinary uncalled capital, and for the issue of fresh shares to the Government in lieu of the preferred shares originally issued to the Crown but afterwards repurchased by the bank. Besides the above, the Act dealt with other matters affecting the business of the bank and the Assets Realization Board.
Under this Act every ordinary share in the bank was deemed to be of the nominal value of £6 13s. 4d. paid up to the extent only of the amount actually paid on account of instalments of the call in respect of such share, leaving a liability of the balance of instalments, and the further liability of £3 6s. 8d. per share but no more. The guaranteed stock issued under the Share Guarantee Act, 1894, to the extent of two million pounds, matured on the 19th July, 1904, and was redeemed by the bank, and another issue of guaranteed stock, representing the sum of one million pounds sterling, having a currency not exceeding ten years, was made in lieu thereof. This stock was declared by an Act passed in the following year to have priority as to both capital and dividend over all existing shares of the bank, whether preference or ordinary. The preferred shares, representing £500,000 new capital, issued under the authority of the Bank of New Zealand and Banking Act, 1895, and subsequently repurchased by the bank, were cancelled, and in lieu thereof the Government purchased 75,000 preference shares of the bank, fully paid, representing £500,000 new capital. These shares rank for dividend purposes in priority to ordinary shares to the extent of 5 per cent. per annum (non-cumulative), and for dividends in excess of 5 per cent. they are entitled to only half the rate payable on ordinary shares; so that where, for example, the dividend on the ordinary shares is at the rate of 6 per cent. the dividend on the preference shares is at the rate of 5½ per cent. The maximum rate of dividend payable on preference shares is 10 per cent., while that payable on ordinary shares is not limited. Otherwise the preference shares confer the same rights and privileges as ordinary shares. The Act of 1903 empowered the Assets Board, for the purpose of redeeming such of its debentures as might be outstanding at maturity, to issue fresh debentures, with a currency of five years, for a sum not exceeding in all the face value of the residue of the outstanding debt, and bearing interest at a rate not higher than 3½ per cent. per annum.
The properties vested in the Assets Board were to be valued at appointed times, and the actual deficiency between such value and the amount of outstanding debentures ascertained. When the assets were found to be sufficient to meet liabilities the Governor by Order in Council declared that the Board should cease to exist, its properties being handed over to the bank, which thereupon was empowered to redeem all the outstanding debentures of the Board.
A Proclamation by the Governor in Council was published in a supplement to the New Zealand Gazette, dated the 7th December, 1906, to the effect that valuations in the terms of the above provisions having been duly made and confirmed by the Valuer-General, the assets were found to be sufficient to meet the outstanding liabilities, and the Assets Realization Board, from the 17th December, 1906, ceased to exist.
The guaranteed stock issued under the Act of 1903 matured on the 19th July, 1914, and a further Act was passed in 1913 whereby the bank was empowered to cover the redemption of this by the issue of stock to the extent of £1,000,000, having a currency not exceeding twenty years, and carrying a dividend not exceeding 4 per cent. per annum, payable half-yearly. As in the former case, this stock is to have priority as to both capital and dividend as against the assets of the bank over all other shares.
Power was also given by the Act of 1913, for the raising of additional capital for the bank. An amount not exceeding £3,000,000 has been authorized to be raised by the creation and issue of 150,000 shares, to be called “B” preference shares, of £6 13s. 4d. each, and 300,000 new ordinary shares of the same value. The Government is to have the first option of purchasing the “B” preference shares, which in respect of capital are to rank next after the former or “A” preference shares and in priority to all other shares, and in other respects to be equal to the ordinary shares. For each two ordinary shares to be issued under the Act of 1913, one “B” preference share must also be issued at the same time. The number of shares that may be held by any one shareholder has now been fixed at 6,000 instead of 3,000 as formerly. Up to the 31st March, 1915, the sum of £350,000 had been paid to the bank by the Government as purchase-money for “B” preference shares.
In connection with the Post Office in New Zealand a savings-bank is conducted. The minimum deposit receivable, except in certain specified cases, is 1s., and no interest is given on any sum less than £1 or in excess of £1,000. Prior to the 1st January, 1914, the maximum amount on which interest was payable was £600. Interest on sums up to £300 must not exceed 5 per cent. per annum, and on sums between £300 and £1,000 4 per cent. is the maximum allowable.
The number of post-offices open for the transaction of savings-bank business at the end of 1914 was 766.
There were 78,519 new accounts opened in 1914, and 53,851 accounts were closed during the year. The total number of open accounts at the end of 1914 was 483,262, or one in every 2.27 of the population, excluding Maoris.
The deposits received during the year amounted to £11,904,323, and the withdrawals to £10,603,018, the excess of deposits over withdrawals having thus been £301,305. The total sum standing at credit of all accounts on the 31st December, 1914, was £19,048,029, which gave an average of £39 8s. 4d. to the credit of each open account. Information for each of the past ten years is given.
| POST OFFICE SAVINGS-BANK. | |||||
|---|---|---|---|---|---|
| Year. | Number of Depositors at End of Year. | Total Amount of Deposits during Year. | Total Amount of Withdrawals during Year. | Excess of Deposits over Withdrawals. | Total Amount to Credit of Depositors at End of Year. |
| £ | £ | £ | £ | ||
| 1905 | 276,066 | 6,625,744 | 5,984,185 | 641,559 | 8,662,023 |
| 1906 | 298,746 | 7,907,155 | 6,907,104 | 1,000,051 | 9,953,266 |
| 1907 | 319,778 | 9,351,664 | 8,125,123 | 1,226,541 | 11,523,231 |
| 1908 | 342,077 | 9,674,075 | 9,417,820 | 256,255 | 12,159,294 |
| 1909 | 359,714 | 9,611,120 | 9,499,320 | 111,800 | 12,666,898 |
| 1910 | 380,585 | 10,708,939 | 9,695,515 | 1,013,424 | 14,104,990 |
| 1911 | 405,566 | 11,627,368 | 10,662,046 | 965,322 | 15,543,187 |
| 1912 | 432,199 | 11,725,183 | 11,449,711 | 275,472 | 16,330,257 |
| 1913 | 458,594 | 11,286,702 | 11,041,454 | 245,248 | 17,131,414 |
| 1914 | 483,262 | 11,904,323 | 10,603,018 | 301,305 | 19,048,029 |
The Post Office Savings-bank commenced operations on the 1st February, 1867, and the progress of the establishment since that date is shown below in graphical representation, the curves representing number of open accounts, total amount to credit, and average amount to credit respectively.
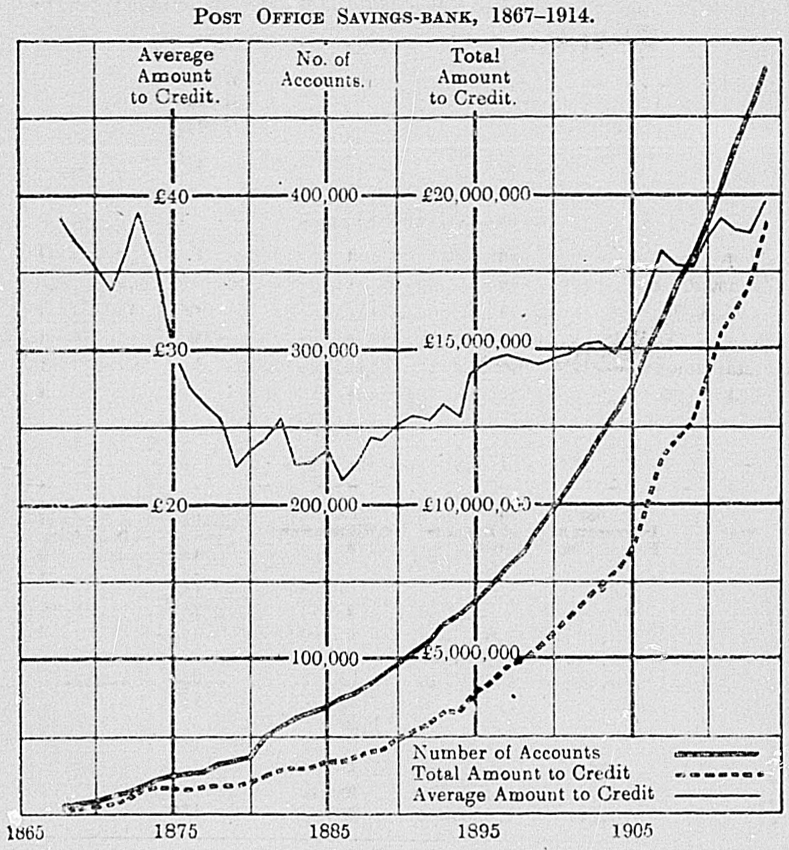
The number of open accounts (as on the 31st December) for five years, classified according to amounts at credit, is as follows:—
| Amount. | 1910. | 1911. | 1912. | 1913. | 1914. |
|---|---|---|---|---|---|
| Not exceeding £20 | 270,812 | 290,157 | 311,389 | 329,669 | 347,464 |
| Exceeding £20 and up to £50 | 40,931 | 42,266 | 43,952 | 47,387 | 47,722 |
| ” £50 and up to £100 | 26,966 | 28,061 | 29,602 | 31,196 | 33,354 |
| ” £100 “ £200 | 22,070 | 23,162 | 24,195 | 26,109 | 27,499 |
| ” £200 “ £300 | 9,536 | 10,277 | 10,832 | 11,406 | 12,011 |
| ” £300 “ £400 | 4,761 | 5,274 | 5,667 | 5,989 | 6,707 |
| ” £400 “ £500 | 2,544 | 2,750 | 2,850 | 3,107 | 3,534 |
| ” £500 “ £600 | 1,651 | 1,980 | 2,020 | 1,986 | 2,239 |
| ” £600 | 1,314 | 1,639 | 1,692 | 1,745 | 2,732 |
| Totals | 380,585 | 405,566 | 432,199 | 458,594 | 483,262 |
The securities standing in the name of the Postmaster-General on account of the Post Office Savings-bank Fund on the 31st December, 1914, represented a nominal value of £18,830,380 11s. 2d. Most of this fund is invested in securities of the New Zealand General Government. A summary of the investments is as follows:—
| £ | s. | d. | |
|---|---|---|---|
| In New Zealand Government securities | 17,737,741 | 11 | 1 |
| In local bodies' securities | 1,021,250 | 0 | 0 |
| In other securities | 71,389 | 0 | 1 |
| Total | £18,830,380 | 11 | 2 |
There are five savings-banks not connected with the Post Office. The total amount deposited in them during the year ended the 31st March, 1915, was £1,358,876, of which the deposits by Maoris comprised £403. The withdrawals reached the sum of £1,340,760, or £18,116 less than the deposits. The total amount to the credit of the depositors at the 31st March, 1915, was £1,876,725, of which sum £383 belonged to Maoris. Figures for ten years are as follows:—
| PRIVATE SAVINGS-BANKS. 1905–14. | |||||
|---|---|---|---|---|---|
| Year. | Number of Depositors at End of Year. | Total Amount of Deposits during Year. | Total Amount of Withdrawals dining Year. | Excess of Deposits over Withdrawals. | Total Amount to Credit of Depositors at End of Year. |
* Fifteen months ended 31st March following. † Twelve months ended 31st March following. | |||||
| £ | £ | £ | £ | ||
| 1905 | 40,310 | 902,166 | 904,918 | –2,752 | 1,111,931 |
| 1906 | 42,368 | 1,013,571 | 947,988 | 65,583 | 1,216,759 |
| 1907 | 44,649 | 1,036,568 | 993,841 | 42,727 | 1,301,832 |
| 1908 | 46,868 | 1,124,510 | 1,121,285 | 3,225 | 1,352,972 |
| 1909 | 49,056 | 1,168,735 | 1,169,654 | –919 | 1,398,512 |
| 1910 | 51,534 | 1,338,336 | 1,269,973 | 68,363 | 1,515,525 |
| 1911 | 54,036 | 1,420,321 | 1,337,586 | 82,735 | 1,651,275 |
| 1912* | 71,728 | 1,824,606 | 1,833,390 | –8,784 | 1,713,283 |
| 1913† | 74,120 | 1,478,309 | 1,461,510 | 16,799 | 1,792,108 |
| 1914† | 75,941 | 1,358,876 | 1,340,760 | 18,116 | 1,876,725 |
| The minus sign (–) represents excess of withdrawals over deposits. | |||||
The deposits in the savings-banks of the Commonwealth on the 31st December, 1914, and of New Zealand on the 31st December, 1914 (Post Office), and on the 31st March, 1915 (private), are shown in the table following. The Australian figures are taken from the Monthly Summary of Australian Statistics issued by the Commonwealth Statistician. In calculating the deposits per head of population in New Zealand Maoris were omitted from the population, although the total amount on deposit includes deposits by them. The amount deposited by Maoris is very small in proportion to the number of Maoris in the Dominion. Their inclusion would lower the rate per head to £18 5s. 3d.
| State. | Number of Depositors. | Amount on Deposit at End of Year. | Average Amount per Depositor at End of Year. | Deposits to Credit per Head of Population. | ||||
|---|---|---|---|---|---|---|---|---|
| £ | £ | s. | d. | £ | s. | d. | ||
| New South Wales | 731,640 | 33,734,455 | 46 | 2 | 2 | 18 | 2 | 2 |
| Victoria | 762,495 | 25,389,167 | 33 | 5 | 11 | 17 | 13 | 8 |
| Queensland | 215,626 | 11,061,619 | 51 | 6 | 0 | 16 | 17 | 9 |
| South Australia | 273,374 | 9,345,390 | 34 | 3 | 8 | 21 | 6 | 6 |
| Western Australia | 137,937 | 4,937,680 | 35 | 15 | 11 | 15 | 6 | 3 |
| Tasmania | 78,036 | 2,202,426 | 28 | 4 | 6 | 10 | 18 | 10 |
| Commonwealth | 2,199,108 | 86,670,737 | 39 | 8 | 3 | 17 | 11 | 3 |
| New Zealand | 559,203 | 20,924,754 | 37 | 8 | 4 | 19 | 1 | 10 |
If the total deposits in the banks of issue at the end of the year be assumed to be equal to the average deposits for the four quarters of the year, then it may be affirmed that, exclusive of Government moneys, the deposits in the said banks of issue and in the two classes of savings-banks amounted at the end of 1914 to £45,659,944. In addition, there are the deposits with the building societies, which in 1914 were £676,579, and it is known that there were also deposits with financial companies of which no particulars have been collected. The ascertained deposits reach an average of £42 5s. 7d. per head of the population, or, including Maoris, £40 8s. 9d.
Table of Contents
At the close of the year 1914 the following life-assurance offices were represented in New Zealand:—
The Australian Temperance and General Mutual Life Assurance Society (Limited).
The Australian Mutual Provident Society.
The Colonial Mutual Life Assurance Society (Limited).
The Equitable Life Assurance Society of the United States.
The Mutual Life and Citizens' Assurance Company (Limited).
The National Mutual Life Association of Australasia (Limited).
The New York Life Insurance Company.
The Norwich Union Life Insurance Company.
The Provident Life Assurance Company.
The Yorkshire Insurance Company.
The Life Insurance Department of the New Zealand Government.
The New Zealand Government and the Provident are the only purely New Zealand institutions, five of the societies having their head offices in Australia, two in England, and two in the United States of America.
The Provident Life Assurance Company and four of the Australian offices transact both ordinary life and industrial business. Several of the companies, including the New Zealand Government Office, have branches for assurance against accident.
The following table shows the total ordinary life-assurance business in force in the Dominion at the end of each of the ten years from 1905 to 1914:—
| ORDINARY LIFE ASSURANCE.—NEW ZEALAND BUSINESS, 1905–14. | ||||
|---|---|---|---|---|
| Year. | Number of Policies in Force, including Annuities. | Amount insured. | Annuities per Annum. | Annual Premium Income, including Annuities. |
| £ | £ | £ | ||
| 1905 | 114,553 | 28,087,349 | 60,583 | 908,349 |
| 1906 | 118,265 | 29,036,047 | 65,754 | 935,068 |
| 1907 | 122,924 | 30,207,134 | 71,291 | 970,216 |
| 1908 | 127,721 | 31,447,101 | 32,759 | 1,005,984 |
| 1909 | 133,558 | 32,629,734 | 34,369 | 1,040,303 |
| 1910 | 137,514 | 33,816,736 | 34,686 | 1,073,010 |
| 1911 | 143,652 | 35,323,742 | 37,009 | 1,116,772 |
| 1912 | 150,079 | 37,162,918 | 45,975 | 1,164,699 |
| 1913 | 153,654 | 38,566,688 | 44,636 | 1,199,047 |
| 1914 | 156,218 | 39,654,784 | 46,939 | 1,229,398 |
Similar information to the above is given respecting the industrial business of the companies operating in New Zealand.
| INDUSTRIAL ASSURANCE.—NEW ZEALAND BUSINESS, 1905–14. | ||||
|---|---|---|---|---|
| Year. | Number of Policies in Force, including Annuities. | Amount insured. | Annuities per Annum. | Annual Premium Income, including Annuities. |
| £ | £ | £ | ||
| 1905 | 36,502 | 877,871 | .. | 46,096 |
| 1906 | 40,613 | 981,086 | .. | 53,382 |
| 1907 | 43,889 | 1,053,874 | .. | 59,258 |
| 1908 | 49,435 | 1,188,920 | 888 | 69,822 |
| 1909 | 56,269 | 1,366,985 | .. | 81,999 |
| 1910 | 64,119 | 1,608,793 | 16 | 96,394 |
| 1911 | 72,194 | 1,887,111 | 16 | 113,421 |
| 1912 | 80,419 | 2,158,273 | .. | 130,691 |
| 1913 | 87,603 | 2,422,161 | .. | 148,928 |
| 1914 | 93,488 | 2,598,905 | .. | 163,164 |
The number of ordinary life policies in force in 1904 was 110,227, so that the increase in number during the ten years was 41.72 per cent., while in the industrial business the number of policies increased by 172.21 per cent. in the period, the number in force in 1904 having been 34,364. Taking both classes of life assurance together, the policies increased in number by 72.70 per cent. in the decennium, as compared with an increase in the total population of 27.81 per cent. daring the same period. A statement of the income and outgo of all the companies operating in the Dominion further illustrates the large increase in the business for the ten years.
| ORDINARY LIFE ASSURANCE.—NEW ZEALAND BUSINESS.—INCOME AND OUTGO. | ||||||
|---|---|---|---|---|---|---|
| Year. | Receipts and Expenditure. | Expenses of Management. | ||||
| Total Receipts, excluding Transfers. | Total Expenditure, excluding Transfers. | Excess of Receipts. | Total. | Proportion to Premium Receipts. | Proportion to Gross Receipts. | |
| £ | £ | £ | £ | Per Cent. | Per Cent. | |
| 1905 | 1,329,378 | 789,906 | 539,472 | 168,389 | 18.78 | 12.67 |
| 1906 | 1,382,262 | 846,218 | 536,044 | 165,967 | 18.02 | 12.01 |
| 1907 | 1,427,033 | 866,789 | 560,244 | 160,808 | 16.84 | 11.27 |
| 1908 | 1,488,975 | 933,066 | 555,909 | 167,188 | 16.77 | 11.23 |
| 1909 | 1,556,282 | 970,808 | 585,474 | 172,325 | 16.83 | 11.07 |
| 1910 | 1,717,820 | 961,198 | 756,622 | 166,367 | 15.78 | 9.68 |
| 1911 | 1,679,576 | 1,100,297 | 579,279 | 177,078 | 16.06 | 10.54 |
| 1912 | 1,756,183 | 1,127,743 | 628,440 | 184,108 | 15.90 | 10.48 |
| 1913 | 1,794,353 | 1,101,013 | 698,340 | 182,666 | 15.41 | 10.18 |
| 1914 | 1,91,446 | 1,311,661 | 599,785 | 179,261 | 14.80 | 9.38 |
The general expense rate, which in 1910 fell for the first time below 10 per cent., shows throughout the ten years the general decrease which might be expected to accompany the growing volume of the business, and in the premium-expense rate there is even a more marked decline, the rate having decreased from 18.78 per cent. in 1905 to 14.80 per cent. in 1914. Results under similar headings are given in the next table for industrial assurance.
| INDUSTRIAL ASSURANCE.—NEW ZEALAND BUSINESS.—INCOME AND OUTGO. | ||||||
|---|---|---|---|---|---|---|
| Year. | Receipts and Expenditure. | Expenses of Management. | ||||
| Total Receipts, excluding Transfers. | Total Expenditure, excluding Transfers. | Excess of Receipts. | Total. | Proportion to Premium Receipts. | Proportion to Gross Receipts. | |
| £ | £ | £ | £ | Per Cent. | Per Cent. | |
| 1905 | 44,385 | 30,908 | 13,477 | 22,676 | 56.15 | 51.09 |
| 1906 | 49,146 | 34,850 | 14,296 | 26,904 | 58.41 | 54.74 |
| 1907 | 55,461 | 37,379 | 18,082 | 28,903 | 54.21 | 52.11 |
| 1908 | 77,894 | 46,734 | 31,160 | 34,455 | 56.28 | 41.23 |
| 1909 | 76,763 | 55,185 | 21,578 | 40,121 | 55.57 | 52.26 |
| 1910 | 93,971 | 60,871 | 33,100 | 43,554 | 51.62 | 46.35 |
| 1911 | 107,238 | 70,224 | 37,014 | 52,508 | 51.88 | 48.96 |
| 1912 | 126,897 | 79,505 | 47,392 | 59,357 | 49.42 | 46.78 |
| 1913 | 145,283 | 103,587 | 41,696 | 62,277 | 45.22 | 42.87 |
| 1914 | 158,974 | 94,553 | 64,421 | 65,513 | 43.05 | 41.21 |
This class of business has only recently attained any magnitude in the Dominion. The expense rate is exceedingly high, as is common with industrial assurance.
The New Zealand liabilities of all the institutions in respect of their ordinary life business at the end of 1914 were as follows:—
| £ | |
|---|---|
| Life assurance and annuity funds | 13,514,935 |
| Depreciation, reserve, and other special funds | 204,217 |
| Other liabilities | 216,514 |
| Total | £13,935,666 |
At the same date the liabilities of the industrial branch of the Provident Life Assurance Company and the Colonial Mutual Life Assurance Society were,—
| £ | |
|---|---|
| Capital | 21,000 |
| Funds | 73,371 |
| Other liabilities | 2,836 |
| Total | £97,207 |
The three other companies transacting both ordinary life and industrial assurance business did not show separate returns for their industrial branches.
The assets balance the liabilities in every case, and are stated as follows:—
| Ordinary Assurance. | Industrial Assurance. | |
|---|---|---|
| £ | £ | |
| Mortgages on property | 8,037,623 | 26,412 |
| Loans on policies | 2,290,014 | 898 |
| Government securities | 793,153 | .. |
| Other investments | 1,351,383 | 40,645 |
| Cash | 173,459 | 3,471 |
| Other assets | 1,290,034 | 25,781 |
| Total | £13,935,666 | £97,207 |
The Life Insurance Department of the New Zealand Government had at the end of 1914 policies in force to the number of 52,273, including 399 annuities. The total sum assured is £12,550,465, to which should be added reversionary bonuses amounting to £1,246,610, making the total business £13,797,075. The policies in force represent an annual premium income of £370,882.
The total income for 1914 was £609,241, of which £364,776 was premium income, £17,712 annuity purchase-money, and £226,749 interest (less land and income tax), the balance, £4, being returned as fees.
During the year 519 policies became void by the deaths of policyholders, the claims amounting to £187,560; and 614 policies matured for £148,149. The total sum which has been paid in respect of claims by death and survival since the foundation of the Department forty-live years ago has amounted to £5,330,457.
The total assurance, annuity, and endowment funds, apart from a special investment reserve of £189,121, now stand at £5,033,884.
On the 31st December, 1914, the total assets amounted to £5,267,991, and were invested as shown in the following statement, which also gives the distribution of the assets at the end of the previous year for purposes of comparison:—
| Class of Investment. | At 31st December, 1913. | At 31st December, 1914. | ||
|---|---|---|---|---|
| Amount. | Percentage of Total Assets. | Amount. | Percentage of Total Assets. | |
| £ | £ | |||
| Mortgages on freehold property | 3,154,213 | 61.4 | 3,219,661 | 61.1 |
| Loans on policies | 842,132 | 16.4 | 852,549 | 16.2 |
| Government securities | 665,900 | 13.0 | 665,900 | 12.6 |
| Local bodies' debentures | 174,236 | 3.4 | 191,097 | 3.6 |
| Landed and house property | 136,529 | 2.7 | 134,996 | 2.6 |
| Miscellaneous assets | 119,374 | 2.3 | 122,169 | 2.3 |
| Cash in hand and on current account | 43,445 | 0.8 | 81,619 | 1.6 |
| Total | 5,135,829 | 100.0 | 5,267,991 | 100.0 |
A detailed statement of the liabilities and assets as at 31st December, 1914, is also given.
| BALANCE-SHEET OFTHE GOVERNMENT LIFE INSURANCE DEPARTMENT ON 31ST DECEMBER, 1914. | |
|---|---|
| Liabilities. | £ |
| Total Assurance, Annuity, and Endowment Funds (as per Revenue Account) | 5,033,884 |
| Claims admitted, proofs not yet completed | 40,348 |
| Annuities | 133 |
| Commission | 123 |
| Medical fees | 409 |
| Premium and other deposits. | 3,054 |
| Sundry accounts owing | 919 |
| Investment Fluctuation Reserve | 189,121 |
| £5,267,991 | |
| Assets. | |
| Loans on policies | 852,549 |
| Government securities— | £ |
| Consolidated stock | 625,900 |
| Debentures issued under the District Railways Purchasing Act 1885 Extension and Amendment Act, 1886 | 40,000 |
| 665,900 | |
| Municipal Corporation dentures | 114,910 |
| County securities | 3,737 |
| Harbour Board debenture | 37,900 |
| Town Hoard debentures | 18,950 |
| Road Hoard debentures | 15,000 |
| Drainage Board debentures. | 600 |
| Landed and house property | 133,121 |
| Landed and house property (leasehold) | 1,875 |
| Office furniture (Head Office and agencies) | 270 |
| Mortgages on property | 3,219,661 |
| Properties acquired by foreclosure | 2,849 |
| Overdue premiums on policies in force | 7,138 |
| Outstanding premiums due but not overdue | 36,660 |
| 43,798 | |
| Overdue interest | 2,464 |
| Outstanding interest due but not overdue | 7,056 |
| Interest accrued but not due | 63,265 |
| 72,785 | |
| Agents' balances | 2,467 |
| Cash in hand and on current account | 81,619 |
| £5,267,991 | |
The triennial valuation of the liabilities was made as for the 31st December, 1914. After adding a further sum of £75,458 to the Investment Fluctuation Reserve, there remained a surplus of £222,065, of which £213,008 was divided among the policyholders by way of bonus, and the balance of £9,057 carried forward. As on former occasions, the surplus divided was allotted as a compound reversionary bonus on the sum assured and bonuses in force, thus giving bonuses increasing with the duration of the policies to those policyholders who had not surrendered their previous bonuses. The bonuses allotted range from 21s. to 33s. per cent. per annum on the sum assured.
The cash surplus divided, £213,008, represents additions to the policies payable at death or on maturity of £338,760. Since the inception of the Department in 1870 £1,811,385 in cash has been distributed by way of bonus, the corresponding addition to the sums assured being £3,246,289.
The progress of the Department during the last three years, when compared with the three previous trienniums in respect of total business in force, is as follows:—
| Triennium. | Number of Policies. | Sums assured. | Reversionary Bonuses. | Annual Premiums. |
|---|---|---|---|---|
| £ | £ | £ | ||
| 1903–1905 | 45,137 | 10,468,316 | 954,751 | 319,221 |
| 1906–1908 | 47,033 | 10,955,749 | 1,068,950 | 331,830 |
| 1909–1911 | 49,376 | 11,514,657 | 1,168,620 | 348,285 |
| 1912–1914 | 52,273 | 12,550,465 | 1,246,610 | 370,882 |
The new business undertaken during the same periods also shows an increase in each succeeding triennium.
| NEW BUSINESS OF TRIENNIUM. | |||
|---|---|---|---|
| Triennium. | Number of Policies. | Sums assured. | Annual Premiums. |
| £ | £ | ||
| 1903–1905 | 9,526 | 2,112,927 | 70,428 |
| 1906–1908 | 9,739 | 2,261,767 | 72,803 |
| 1909–1911 | 10,476 | 2,487,472 | 77,477 |
| 1912–1914 | 11,721 | 3,197,694 | 89,715 |
At the close of the year 1914 there were twenty-seven insurance offices doing accident business in the Dominion. Returns of receipts and expenditure have been submitted by each office, and the figures are given in the next table. The table relates only to the accident business transacted by the various offices within the Dominion.
| ACCIDENT INSURANCE.—RECEIPTS AND EXPENDITURE, 1914. | ||||||||||||||||||
|---|---|---|---|---|---|---|---|---|---|---|---|---|---|---|---|---|---|---|
| Office. | Receipts. | Expenditure. | ||||||||||||||||
| Premiums. | Other reciepts. | Total. | Claims paid. | Other Payments. | Total. | |||||||||||||
| £ | s. | d. | £ | s. | d. | £ | s. | d. | £ | s. | d. | £ | s. | d. | £ | s. | d. | |
| Alliance | 3,497 | 7 | 11 | .. | .. | .. | 3,497 | 7 | 11 | 599 | 14 | 5 | 1,739 | 3 | 7 | 2,338 | 18 | 0 |
| Atlas | 2,469 | 4 | 8 | .. | .. | .. | 2,469 | 4 | 8 | 704 | 1 | 8 | 925 | 3 | 5 | 1,629 | 5 | 1 |
| Colonial Mutual | 2,891 | 14 | 2 | 649 | 13 | 9 | 3,541 | 7 | 11 | 1,297 | 5 | 11 | 1,179 | 4 | 6 | 2,476 | 10 | 5 |
| Commercial Union | 14,292 | 2 | 9 | .. | 14,292 | 2 | 9 | 7,897 | 17 | 5 | 5,112 | 6 | 4 | 13,010 | 3 | 9 | ||
| Farmers' Co-operative | 1,346 | 3 | 5 | .. | 1,346 | 3 | 5 | 280 | 5 | 10 | 498 | 18 | 6 | 779 | 4 | 4 | ||
| Guardian | 4,684 | 8 | 0 | .. | 4,684 | 8 | 0 | 2,610 | 1 | 3 | 2,573 | 19 | 8 | 5,184 | 0 | 11 | ||
| Liverpool and London and Globe | 6,801 | 4 | 2 | 6,801 | 4 | 2 | 1,952 | 14 | 6 | 2,779 | 8 | 2 | 4,732 | 2 | 8 | |||
| London and Lancashire | 8,155 | 15 | 0 | 324 | 3 | 2 | 8,479 | 18 | 2 | 3,566 | 1 | 3 | 3,781 | 12 | 10 | 7,347 | 14 | 1 |
| Mutual Life and Citizens | 15,438 | 16 | 1 | .. | 15,438 | 16 | 1 | 5,755 | 14 | 0 | 1,543 | 17 | 7 | 7,299 | 11 | 7 | ||
| National | 15,751 | 0 | 7 | .. | 15,751 | 0 | 7 | 7,408 | 2 | 2 | 5,827 | 17 | 5 | 13,235 | 19 | 7 | ||
| New Zealand | 72,120 | 14 | 8 | .. | 72,120 | 14 | 8 | 41,391 | 7 | 3 | 21,644 | 19 | 8 | 63,036 | 6 | 11 | ||
| Northern | 2,409 | 10 | 3 | 364 | 0 | 0 | 2,773 | 10 | 3 | 702 | 13 | 10 | 1,052 | 15 | 1 | 1,755 | 8 | 11 |
| Norwich and London | 13,866 | 12 | 5 | 258 | 15 | 0 | 14,125 | 7 | 5 | 6,236 | 3 | 2 | 5,496 | 6 | 8 | 11,732 | 9 | 10 |
| Ocean | 29,184 | 18 | 0 | .. | 29,184 | 18 | 0 | 13,911 | 11 | 7 | 12,477 | 11 | 10 | 26,389 | 3 | 5 | ||
| Phœnix | 1,248 | 9 | 6 | .. | 1,248 | 9 | 6 | 236 | 8 | 10 | 719 | 7 | 0 | 955 | 15 | 10 | ||
| Provident Life | 231 | 6 | 4 | .. | 231 | 6 | 4 | 79 | 3 | 10 | 14 | 16 | 8 | 94 | 0 | 6 | ||
| Queensland | 6,897 | 16 | 8 | 375 | 0 | 0 | 7,272 | 16 | 8 | 2,967 | 11 | 0 | 3,167 | 14 | 6 | 6,135 | 5 | 6 |
| Royal | 11,882 | 2 | 9 | 733 | 18 | 7 | 12,616 | 1 | 4 | 8,362 | 4 | 0 | 4,253 | 17 | 4 | 12,616 | 1 | 4 |
| Royal Exchange | 9,776 | 1 | 4 | .. | 9,776 | 1 | 4 | 4,637 | 13 | 1 | 3,654 | 18 | 6 | 8,292 | 11 | 7 | ||
| Sawmillers' Mutual | 2,090 | 17 | 7 | 204 | 13 | 5 | 2,295 | 11 | 0 | 1,062 | 7 | 7 | 167 | 10 | 10 | 1,229 | 18 | 5 |
| South British | 52,465 | 2 | 0 | .. | 52,465 | 2 | 0 | 24,994 | 18 | 9 | 18,421 | 10 | 10 | 43,416 | 9 | 7 | ||
| Standard | 20,111 | 2 | 2 | .. | 20,111 | 2 | 2 | 10,622 | 18 | 3 | 7,640 | 12 | 9 | 18,263 | 11 | 0 | ||
| Union | 4,902 | 19 | 7 | .. | 4,902 | 19 | 7 | 1,871 | 4 | 5 | 1,237 | 7 | 0 | 3,108 | 11 | 5 | ||
| United | 3,307 | 16 | 1 | .. | 3,307 | 16 | 1 | 876 | 16 | 2 | 1,484 | 19 | 3 | 2,361 | 15 | 5 | ||
| Victoria | 6,872 | 7 | 0 | .. | 6,872 | 7 | 0 | 2,383 | 19 | 0 | 2,694 | 7 | 11 | 5,078 | 6 | 11 | ||
| Yorkshire | 2,404 | 3 | 3 | .. | 2,404 | 3 | 3 | 665 | 8 | 6 | 401 | 18 | 5 | 1,067 | 6 | 11 | ||
| Insurance Department of New Zealand Government | 22,090 | 9 | 0 | 3,352 | 8 | 7 | 25,442 | 17 | 7 | 9,633 | 2 | 10 | 6,570 | 15 | 10 | 16,203 | 18 | 8 |
| Totals | 337,190 | 5 | 4 | 6,262 | 12 | 6 | 343,452 | 17 | 10 | 162,707 | 10 | 6 | 117,063 | 2 | 1 | 279,770 | 12 | 7 |
The Accident Branch of the Government Insurance Department was opened in 1901. General accident business is undertaken, but the branch was opened more especially with a view to relieve employers of labour of the liability imposed upon them by the Workers' Compensation for Accidents Act. 1900. This Act greatly extended the liability of employers, and gave to a workman the right of compensation for all injuries arising out of, and in the course of, his employment. Under the Act of 1900 no compensation was payable in respect of any accident attributable to the serious misconduct of the worker him elf, but an amendment passed in 1911 did away with this provision in cases where the accident resulted in death or in serious and permanent disablement.
This liability has been more or less extended by subsequent Acts, and under the Workers' Compensation Act, 1908 (which came into operation on the 1st January, 1909), and its amendments, the scale of compensation is as follows:—
Where death results from the injury and the workman leaves dependants wholly dependent upon his earnings, the compensation is one hundred and fifty-six times his average weekly earnings, but not to be less than £200 nor to exceed £500.
If the dependants are only partially dependent upon the workman's earnings the compensation is to be such sum as is reasonable and proportionate to the injury to such dependants, not exceeding the amount payable under paragraph (a).
In either of the above cases the employer is also liable for medical and burial expenses not exceeding £50, and an amount not exceeding this sum can be claimed where there are no dependants.
Where a workman is totally incapacitated for work, he is entitled to a weekly payment of one-half his average weekly earnings, not exceeding the sum of £2 10s. per week; but the weekly compensation is not to be less than £1 in cases where the worker's earnings at the time of the accident are not less than £1 10s. per week.
Where the workman is partially incapacitated only, the compensation is one-half the loss of wages.
In addition to the weekly allowance, medical or surgical expenses, not exceeding £1, may be claimed.
The compensation is payable from the date of the accident where the incapacity lasts for fourteen days or more, but if the duration of the incapacity is less than fourteen days no payment is made for the first week.
Weekly payments are not to extend over a longer period than six years, and the aggregate amount is not to exceed £500.
Special provision is made in the case of wharf labourers, and also for increased compensation to persons under the age of twenty-one, who are permanently incapacitated.
Certain diseases due to the nature of the trade, such as anthrax, lead poisoning, mercury poisoning, &c., are regarded as accidents.
If the accident occurs in the course of employment in or about a mine, building, factory, or ship, the compensation becomes a charge on the employer's interest in the property. In nearly all cases this charge takes precedence of all existing or subsequent charges or encumbrances howsoever created.
The Department's policies cover the full liability of an employer to his workmen under the Workers' Compensation Act, and the liability under common law to the extent of £500 per man.
Personal-accident policies are also issued securing amounts for accidental death and permanent total or partial disablement, and weekly allowances during temporary disablement.
The premium income and claims of the Accident Branch since the commencement of business have been as follows:—
| Year. | Premium Income. | Claims. |
|---|---|---|
* From 7th June to 31st December. | ||
| £ | £ | |
| 1901* | 11,856 | 2,428 |
| 1902 | 14,100 | 7,364 |
| 1903 | 24,381 | 13,230 |
| 1904 | 23,768 | 12,105 |
| 1905 | 23,970 | 11,242 |
| 1906 | 20,815 | 13,720 |
| 1907 | 21,477 | 11,288 |
| 1908 | 20,898 | 11,926 |
| 1909 | 26,337 | 12,805 |
| 1910 | 21,364 | 12,522 |
| 1911 | 20,756 | 10,497 |
| 1912 | 23,513 | 12,016 |
| 1913 | 23,677 | 11,492 |
| 1914 | 22,284 | 9,633 |
The funds, assets, and liabilities of the Government Insurance Department belonging to its Accident Insurance Branch are kept separate and distinct from the main life-insurance business, and powers are vested in the Governor to make regulations in regard to tables fixing rates of premium and other details for the conduct of the Accident Insurance Branch.
The funds at the end of 1914 amounted to £23,561, an increase of £8,239 during the year, while the Reserve Fund, constituted under section 20 of the Government Accident Insurance Act, 1908, amounted to £39,036. The total assets at the end of the year amounted to £86,237.
The assets and liabilities on the 31st December, 1914, were as follows:—
| Liabilities. | £ | s. | d. |
|---|---|---|---|
| Accident Funds as per Revenue Account | 23,560 | 13 | 8 |
| Claims admitted (proofs not yet completed) | 10,500 | 0 | 0 |
| Commission | 182 | 16 | 0 |
| Premium and other deposits | 16 | 6 | 6 |
| Reserve for unearned premiums | 9,941 | 0 | 0 |
| Investment Fluctuation Reserve | 3,000 | 0 | 0 |
| Reserve Fund constituted under section 20 of the Government Accident Insurance Act, 1908 | 39,035 | 16 | 6 |
| £86,236 | 12 | 8 | |
| Assets. | |||
| Mortgages on property | 83,100 | 0 | 0 |
| Overdue interest | £48 | 0 | 0 |
| Outstanding interest due but not overdue | 77 | 1 | 3 |
| Interest accrued but not due | 1,014 | 18 | 0 |
| 1,139 | 19 | 3 | |
| Agents' balances | 730 | 18 | 3 |
| Sundry accounts owing | 555 | 17 | 1 |
| Cash in hand and on current account | 769 | 18 | 1 |
| £86,236 | 12 | 8 |
At the end of the year 1914 twenty-seven companies and four associations, besides the New Zealand State Fire Insurance Office, were carrying on the business of fire insurance in the Dominion, seven of the companies, as well as all four of the associations, being New Zealand institutions. The full list is as follows:—
Alliance Assurance Company (Limited).
Atlas Assurance Company (Limited).
Australian Alliance Assurance Company.
British Crown Assurance Corporation (Limited).
British Dominions General Insurance Company (Limited).
Commercial Union Assurance Company (Limited).
Excess Insurance Company (Limited).
Farmers' Co-operative Fire and Marine Insurance Association of New Zealand (Limited).
Guardian Assurance Company (Limited).
Liverpool and London and Globe Insurance Company (Limited).
London and Lancashire Fire Insurance Company (Limited).
National Insurance Company of New Zealand (Limited).
New Zealand Insurance Company (Limited).
North British and Mercantile Insurance Company.
Northern Assurance Company (Limited).
Norwich Union Fire Insurance Society (Limited).
Ocean Accident and Guarantee Corporation (Limited).
Phœnix Assurance Company (Limited).
Queensland Insurance Company (Limited).
Royal Exchange Assurance Corporation of London.
Royal Insurance Company (Limited).
South British Insurance Company (Limited).
Standard Fire and Marine Insurance Company of New Zealand (Limited).
State Fire Insurance Office.
Sun Insurance Office.
Union Assurance Society (Limited).
United Insurance Company (Limited).
Yorkshire Insurance Company (Limited).
Hawke's Bay Farmers' Mutual Fire Insurance Association.
Otago Farmers' Union Mutual Fire Insurance Association.
Taranaki Farmers' Mutual Fire Insurance Association.
Wellington Farmers' Union Mutual Fire Insurance Association.
In the year 1903 an Act was passed “to establish a State Fire Insurance Office and to make other provisions for the insurance and protection of insurable property in New Zealand against loss or damage by fire.”
On the 4th January, 1905, the State Fire Insurance Office opened for public business, and at the end of ten years' working the General Manager is able to report as follows:—
“The Office has now accumulated very substantial reserve funds, and, although it may not show a profit every year, it is sufficiently strong to withstand any conflagration of a class hitherto experienced in this country without imperilling its financial stability, and without necessitating the calling-up of any of its authorized capital. To be able to make such a statement with confidence, after ten years' operations, in my opinion, augurs well for the future of the State fire-insurance business.”
As a consequence of the operations of the State Fire Office, the rates on trade risks and the like have been reduced by 10 per cent., and those on dwellings, offices, and similar risks by 33⅓ per cent.
The premium income, after deducting premiums on reinsurances during the ten years 1905–14, was as follows:—
| Year. | Amount of Premium Income. |
|---|---|
| £ | |
| 1905 | 13,128 |
| 1906 | 20,962 |
| 1907 | 23,195 |
| 1908 | 26,657 |
| 1909 | 33,281 |
| 1910 | 40,552 |
| 1911 | 47,745 |
| 1912 | 54,380 |
| 1913 | 59,418 |
| 1914 | 64,646 |
The premium rates have remained unaltered during the above years. Debentures to the amount of £2,000 were raised under the authority of the Act governing the Office, but have now been redeemed. The Office has the sum of £68,996 invested in Government securities, and has accumulated funds amounting to £87,423.
The net profits for the year 1914, after appropriating a sum of £2,091 to reserve for unearned increments and £1,000 to a special Investments Fluctuation Reserve, were £18,660, as against £15,444 for 1913. The total accumulated profit at the 31st December, 1914, amounted to £60,565.
Every foreign company—i.e., a company registered or established out of New Zealand, and including a local company whose chief office is situate out of the Dominion—which proposes to commence in New Zealand the business of life insurance, whether conjointly or not with any other class of business, must deposit with the Public Trustee a sum of not less than £5,000 nor more than £50,000 in cash or approved securities. The amount of deposit is calculated on the total amount assured by current policies at the rate of £5,000 deposit for every £100,000 assured until the maximum deposit is reached.
A foreign company proposing to carry on fire and marine insurance business in the Dominion must first obtain from the Public Trustee a certificate in the form prescribed authorizing the company to transact its business for a period of twelve months from the date of the certificate. The certificate is renewable annually, provided the Public Trustee is satisfied that the company is financially sound.
Accident insurance or insurance business of any class not previously mentioned may be transacted in New Zealand by a foreign company, provided the company deposit with the Public Trustee the sum of £10,000 in cash or approved securities. If the company carries on a life-assurance business as well as accident insurance the last-mentioned deposit must be made in addition to that described in the first paragraph.
All cash deposited with the Public Trustee as deposit shall bear interest, which is payable to the company making the deposit.
Table of Contents
THE various Acts relating to the custody and administration of the public moneys and securities are now consolidated in the Public Revenues Act, 1908. All public moneys, excepting those payable to or received by the Post Office, the Government Insurance Office, the Public Trust Office, the Commissioners of the Public Debt Sinking Funds, the New Zealand State Advances Office, the State Fire Insurance Office, and the deposits under the New Zealand Consols Act, are paid into one account at the bank called the “Public Account,” and are carried to one or other of the following accounts or funds in the books of the Treasury—
The Consolidated Fund.
The Public Works Fund.
Separate accounts or funds created under any special Act.
The main Consolidated Fund Account records the ordinary public revenue and expenditure. There are certain subsidiary accounts to this fund which come under the third head in the above category. The Public Works Fund Account contains receipts from loans or aids from the Consolidated Fund and the expenditure on public works, immigration, or special services legally chargeable to that account.
The financial year commences on the 1st day of April and ends on the 31st day of March. The revenue of any financial year is the money received into the Public Account at the bank at Wellington within the year; the expenditure is the money paid at the Treasury within the year, and the money paid by imprestees, of which accounts are received at the Treasury within the year. Imprests not accounted for at the end of a financial year are included in the accounts of the following year.
At the end of each financial year the Appropriation Acts lapse, but the Minister of Finance is authorized for a period of three months from the commencement of the next financial year to pay money in respect of any service, provided the amount does not exceed the unexpended balance voted for that purpose in the previous year, together with an amount equal to one-fourth of such vote.
The usual practice is for Parliament to meet at the end of June in each year, and vote supplies from month to month until the estimated expenditure for the year has been approved and the annual Appropriation Act is passed.
In the audit of expenditure both the pre-audit and post-audit systems are in operation. Pre-audit is applied to vouchers in respect of payments on account of salaries of new appointees, temporary officers, and officers claiming more than one month's salary at any time; interest, loan transactions, and return of deposits; on account of unauthorized expenditure; or chargeable against the accounts of local bodies. Post-audit is applied to all other payments.
Vouchers must be certified as correct by the proper officer, and forwarded by him to the Head of his Department for approval. Vouchers subject to pro-audit are then forwarded to the Audit Office, and on being found correct are sent on to the Treasury to be entered on requisitions for payment. Vouchers subject to post-audit are transmitted by the Head of the Department direct to the Treasury. Payment is made by the Treasury, and the claim is afterwards submitted for audit.
The total revenue and expenditure of the Consolidated Fund Account for the financial years ended the 31st March, 1906 to 1915, is shown in the following table, together with the excess of revenue for each year and the amount of such excess transferred to the Public Works Fund in the succeeding year:—
| Year ended 31st March. | Revenue. | Expenditure. | Excess of Revenue over Expenditure. | Amount of Excess transferred to the Public Works Fund. |
|---|---|---|---|---|
| £ | £ | £ | £ | |
| 1906 | 7,650,098 | 7,122,340 | 527,758 | 500,000 |
| 1907 | 8,478,956 | 7,774,926 | 704,030 | 775,000 |
| 1908 | 9,063,989 | 8,213,965 | 850,024 | 800,000 |
| 1909 | 9,001,986 | 8,785,513 | 216,473 | 800,000 |
| 1910 | 9,238,917 | 8,990,922 | 247,995 | .. |
| 1911 | 10,297,273 | 9,343,106 | 954,167 | 800,000 |
| 1912 | 11,061,161 | 10,340,368 | 720,793 | 500,000 |
| 1913 | 11,734,271 | 11,082,038 | 652,233 | 750,000 |
| 1914 | 12,229,661 | 11,825,864 | 403,797 | 675,000 |
| 1915 | 12,451,945 | 12,379,803 | 72,142 | 350,000 |
| Totals, 10 years | 101,208,257 | 95,858,845 | 5,349,412 | 5,950,000 |
To the amount of excess revenue for the ten years must be added the sum of £761,035 brought forward from the financial year ended the 31st March, 1905, making a total of £6,110,448. Deducting the total amount transferred to the Public Works Fund, and a sum of £11,400 for redumption of debentures (in 1913–14), there remains a balance of £149,047, which has been carried forward to the current year's account.
The total amount of excess revenue transferred to the Public Works Fund during the twenty-four financial years ended the 31st March, 1915, was £10,305,000.
An analysis of the revenue received during each of ten financial years is made in the next table.
| CONSOLIDATED FUND.—REVENUE, 1905–6 TO 1914–15. | |||||
|---|---|---|---|---|---|
| Year ended 31st March. | Revenue derived from | Total Revenue. | |||
| Taxation. | Services. | Crown Lands. | Other Sources. | ||
| £ | £ | £ | £ | £ | |
| 1906 | 3,841,596 | 3,195,849 | 260,789 | 351,864 | 7,650,098 |
| 1907 | 4,264,555 | 3,558,616 | 250,900 | 404,885 | 8,478,956 |
| 1908 | 4,645,754 | 3,793,356 | 289,603 | 335,276 | 9,063,989 |
| 1909 | 4,377,761 | 4,047,034 | 222,857 | 354,334 | 9,001,986 |
| 1910 | 4,180,516 | 4,420,096 | 269,730 | 368,575 | 9,238,917 |
| 1911 | 4,837,322 | 4,743,056 | 310,894 | 406,001 | 10,297,273 |
| 1912 | 5,296,590 | 4,987,088 | 311,156 | 466,327 | 11,061,161 |
| 1913 | 5,606,829 | 5,379,966 | 313,923 | 433,553 | 11,734,271 |
| 1914 | 5,918,034 | 5,551,913 | 262,846 | 496,868 | 12,229,661 |
| 1915 | 5,880,811 | 5,706,929 | 318,393 | 545,812 | 12,451,945 |
| Totals, 10 years | 48,849,768 | 45,383,903 | 2,811,091 | 4,163,495 | 101,208,257 |
Revenue under the head of “Taxation” includes Customs and excise duties, land-tax, income-tax, death duties, a tax on bank-note issue, and totalizator taxes. Revenue from “Services” consists of Railway, Post, Telegraph, and Telephone receipts, and certain fees paid in return for special services. Revenue from “Crown Lands” includes proceeds of sales up to and including 1912–13, but not for subsequent years. The other items in Crown Lands Revenue are rents and National Endowment Revenue. The amounts shown under “Other Sources” include miscellaneous revenue and sundry amounts recovered in respect of expenditure of previous years.
The total revenue per head of population, and the amounts per head derived from taxation and from other sources, during the past ten years are shown in the following table:—
| REVENUE PER HEAD OF POPULATION, TEN YEARS. | |||||||||
|---|---|---|---|---|---|---|---|---|---|
| Year ended 31st March. | Revenue per Head derived from | Total revenue per Head. | |||||||
| Taxation. | Other Sources. | ||||||||
| £ | s. | d. | £ | s. | d. | £ | s. | d. | |
| 1906 | 4 | 7 | 7 | 4 | 6 | 9 | 8 | 14 | 4 |
| 1907 | 4 | 14 | 7 | 4 | 13 | 5 | 9 | 8 | 0 |
| 1908 | 5 | 0 | 4 | 4 | 15 | 6 | 9 | 15 | 10 |
| 1909 | 4 | 11 | 11 | 4 | 17 | 0 | 9 | 8 | 11 |
| 1910 | 4 | 5 | 6 | 5 | 3 | 5 | 9 | 8 | 11 |
| 1911 | 4 | 16 | 11 | 5 | 9 | 5 | 10 | 6 | 4 |
| 1912 | 5 | 3 | 10 | 5 | 13 | 1 | 10 | 16 | 11 |
| 1913 | 5 | 7 | 2 | 5 | 17 | 1 | 11 | 4 | 3 |
| 1914 | 5 | 10 | 0 | 5 | 17 | 4 | 11 | 7 | 4 |
| 1915 | 5 | 7 | 5 | 6 | 0 | 0 | 11 | 7 | 5 |
Expenditure out of the Consolidated Fund is grouped under two main headings by the Treasury. “Permanent” and “Annual.” Permanent appropriations, as the name implies, are those fixed by special Acts of the Legislature. Annual appropriations are voted each year by resolution of Parliament, and include the cost of the business undertakings of the State. In the following table this grouping has not been adopted, as it is considered more desirable to show the growth of the main items of expenditure during the last ten financial years:—
| Year ended 31st March. | Amount expended on | Total Expenditure. | ||||
|---|---|---|---|---|---|---|
| Working Railways. | Post and Telegraph. | Education. | Interest, &c., on Public Debt. | Other Expenses. | ||
| £ | £ | £ | £ | £ | £ | |
| 1906 | 1,594,954 | 577,115 | 714,071 | 2,087,204 | 2,148,996 | 7,122,340 |
| 1907 | 1,850,047 | 617,270 | 813,580 | 2,172,092 | 2,321,937 | 7,774,926 |
| 1908 | 1,963,428 | 707,146 | 843,311 | 2,187,419 | 2,512,661 | 8,213,965 |
| 1909 | 2,120,987 | 806,293 | 874,818 | 2,258,365 | 2,725,050 | 8,785,513 |
| 1910 | 2,168,189 | 855,862 | 936,875 | 2,397,462 | 2,632,534 | 8,990,922 |
| 1911 | 2,270,851 | 911,529 | 984,854 | 2,458,452 | 2,717,420 | 9,343,106 |
| 1912 | 2,467,718 | 986,527 | 1,072,992 | 2,656,344 | 3,156,787 | 10,340,368 |
| 1913 | 2,817,141 | 1,066,922 | 1,148,897 | 2,717,013 | 3,332,065 | 11,082,038 |
| 1914 | 3,004,181 | 1,170,883 | 1,206,678 | 2,887,981 | 3,556,141 | 11,825,864 |
| 1915 | 2,881,087 | 1,245,224 | 1,288,795 | 3,071,448 | 3,893,239 | 12,379,803 |
| Totals, 10 years | 23,138,583 | 8,944,781 | 9,884,871 | 24,893,780 | 28,996,830 | 95,858,845 |
The “Other Expenses” group includes old-age pensions, which amounted to £258,720 in 1905–6 and to £460,396 in 1914–15. The charges of the public debt are found to have absorbed 27.42 per cent. of the revenue in 1905–6 (excluding amounts received by alienation of Crown lands) and 24.67 per cent. in 1914–15.
The total receipts of the Consolidated Fund for the financial year 1914–15, including a balance of £426,905 brought forward from the previous year, were £12,878,850, and the total expenditure for the same period was £12,379,803, excluding £350,000 transferred to the Public Works Fund, leaving a balance of £149,047 to carry forward.
| CONSOLIDATED FUND.—RECEIPTS, 1914–15. | |||
|---|---|---|---|
| From taxation— | £ | £ | £ |
| Customs | .. | 3,167,283 | |
| Excise | .. | 127,660 | |
| Land— | |||
| Ordinary | 547,959 | ||
| Graduated | 249,193 | ||
| Absentee | 2,489 | ||
| 799,641 | |||
| Income-tax | .. | 540,318 | |
| Death duties | .. | 796,232 | |
| Bank-note-issue tax | .. | 59,952 | |
| Totalizator tax | .. | 110,733 | |
| Other taxes | .. | 278,992 | |
| 5,880,811 | |||
| From services — | £ | £ | £ |
| Railways | 4,106,675 | ||
| Postal | 698,898 | ||
| Telegraph | 356,306 | ||
| Telephone | 303,856 | ||
| Other services | 241,194 | 5,706,929 | |
| Land revenue— | |||
| Rents, Crown lands | 239,623 | ||
| Net revenue from national-endowment lands (1913–14) | 78,770 | 318,393 | |
| Miscellaneous | .. | 545,812 | |
| Total | .. | £12,451,945 | |
Taxation represented 47.23 per cent. of the total revenue for the year 1914–15, and services contributed 45.83 per cent. For the previous financial year the proportions were 48.39 per cent. and 45.40 per cent. respectively.
The amount shown as net revenue from national-endowment lands represents the money received from that source during the previous financial year. The method adopted is to place the amount received under this head each year to a separate account, and, after deducting necessary expenses, to transfer the balance to the Consolidated Fund Account. Of this balance 70 per cent. is expended on education, and 30 per cent. on old-age pensions.
| CONSOLIDATED FUND —EXPENDITURE, 1914–15. | ||
|---|---|---|
| £ | £ | |
| Charges of the public debt (excluding interest and sinking fund charges paid out of separate accounts) | .. | 3,071,448 |
| Pensions and allowances— | ||
| Old-age pensions | 460,396 | |
| Widows' pensions | 31,610 | |
| Military pensions | 51,457 | |
| Civil pensions and allowances | 33,580 | |
| Civil Service, Railway, and Teachers' Superannuation Funds | 90,000 | |
| 667,043 | ||
| Payment to local bodies— | ||
| Subsidies | 147,778 | |
| Endowments revenue | 95,175 | |
| Under the Land Act | 51,685 | |
| Other payments | 646 | |
| 295,284 | ||
| Public instruction— | ||
| Elementary | 754,189 | |
| Secondary and higher | 115,740 | |
| Manual and technical | 88,133 | |
| Training of teachers | 42,210 | |
| Native schools | 32,837 | |
| Industrial schools | 39,303 | |
| School buildings | 118,101 | |
| Departmental and miscellaneous | 43,143 | |
| National-endowment revenue not included above | 55,139 | |
| 1,288,795 | ||
| Judicial and legal— | ||
| Administration of justice | 143,004 | |
| Police | 235,884 | |
| Prisons | 52,448 | 431,336 |
| Railways working-expenses | .. | 2,881,087 |
| Postal and Telegraph services | .. | 1,245,224 |
| Defence (including naval defence) | .. | 568,123 |
| Other expenditure— | ||
| Departmental | 1,798,153 | |
| Miscellaneous | 133,310 | |
| 1,931,463 | ||
| Total | .. | £12,379,803 |
A comparison of the revenue of the Consolidated Fund for the year 1914–15 with that of the previous year, the percentage of each item to the totals and the increase or decrease, as the case may be, are given in the following table:—
| CONSOLIDATED FUND.—REVENUE FOR 1914–15, COMPARED WITH 1913–14. | ||||||
|---|---|---|---|---|---|---|
| Head of Revenue. | Revenue of Consolidated Fund. | Increase for 1914–15. | ||||
| 1913–14. | Per Cent. of Total. | 1914–15. | Per Cent. of Total. | Numerical. | Per Cent. | |
* Decrease. | ||||||
| Taxation— | £ | £ | £ | |||
| Customs and Excise | 3,553,785 | 29.06 | 3,294,943 | 26.46 | –258,842* | –7.28* |
| Land | 767,451 | 6.28 | 799,641 | 6.42 | 32,190 | 4.19 |
| Income | 554,271 | 4.53 | 540,318 | 4.34 | –13,953* | –2.52* |
| Death duties | 613,751 | 5.02 | 796,232 | 6.39 | 182,481 | 29.73 |
| Other taxes | 428,776 | 3.51 | 449,677 | 3.61 | 20,901 | 4.87 |
| Services— | ||||||
| Railways | 4,028,739 | 32.94 | 4,106,675 | 32.98 | 77,936 | 1.94 |
| Postal | 695,136 | 5.68 | 698,898 | 5.62 | 3,762 | 0.54 |
| Telegraph | 342,595 | 2.80 | 356,306 | 2.86 | 13,711 | 4.09 |
| Telephone | 232,191 | 1.90 | 303,856 | 2.44 | 71,665 | 30.86 |
| Other services | 253,252 | 2.07 | 241,194 | 1.94 | –12,058* | –4.76* |
| Land revenue | 262,846 | 2.15 | 318,393 | 2.56 | 55,547 | 21.13 |
| Miscellaneous | 496,868 | 4.06 | 545,812 | 4.38 | 48,944 | 9.85 |
| Totals | 12,229,661 | 100.00 | 12,451,945 | 100.00 | 222,284 | 1.82 |
The expenditure of the Consolidated Fund Account for the last two financial years is presented in the next table in similar form to the above.
| CONSOLIDATED FUND.—EXPENDITURE FOR 1914–15, COMPARED WITH 1913–14. | ||||||
|---|---|---|---|---|---|---|
| Head of Expenditure. | Expenditure of Consolidated Fund. | Increase for 1914-15. | ||||
| 1913-14. | Per cent Of Total. | 1914-15. | Per Cent of Total. | Numerical. | Per Cent. | |
* Decrease. | ||||||
| £ | £ | £ | ||||
| Charges of the public debt | 2,887,981 | 24.42 | 3,071,448 | 24.81 | 183,467 | 6.35 |
| Pensions and allowances | 603,821 | 5.11 | 667,043 | 5.39 | 63,222 | 10.47 |
| Payment to local bodies | 272,046 | 2.30 | 295,284 | 2.38 | 23,238 | 8.54 |
| Public instruction | 1,206,678 | 10.20 | 1,288,795 | 10.41 | 82,117 | 6.80 |
| Judicial and legal | 399,088 | 3.38 | 431,336 | 3.50 | 32,248 | 8.08 |
| Railways working-expenses | 3,004,181 | 25.40 | 2,881,087 | 23.27 | –123,094 | –4.10* |
| Postal and Telegraph services | 1,170,883 | 9.90 | 1,245,224 | 10.05 | 74,341 | 6.35 |
| Defence (including naval) | 538,611 | 4.55 | 568,123 | 4.59 | 29,512 | 5.48 |
| Other expenditure | 1,742,575 | 14.74 | 1,931,463 | 15.60 | 188,888 | 10.84 |
| Totals | 11,825,864 | 100.00 | 12,379,803 | 100.00 | 553,939 | 4.68 |
The receipts of this account mainly consist of the proceeds of loans raised for the construction of public works. From time to time the fund has been aided by substantial transfers of surplus revenue from the Consolidated Fund Account. The receipts for the last ten years are shown in the next table.
| PUBLIC WORKS FUND.—RECEIPTS. TEN YEARS. | ||||
|---|---|---|---|---|
| Year ended 31st March. | Amounts recieved. | Total Receipts. | ||
| From Loans. | Transfers from Consolidated Fund. | Other Sources. | ||
| £ | £ | £ | £ | |
| 1906 | 1,052,574 | 500,000 | 3,194 | 1,555,768 |
| 1907 | 1,125,686 | 775,000 | 17,395 | 1,918,081 |
| 1908 | 1,029,600 | 800,000 | 16,454 | 1,846,054 |
| 1909 | 2,813,790 | 800,000 | 14,480 | 3,628,270 |
| 1910 | 2,091,090 | .. | 2,607 | 2,093,697 |
| 1911 | 2,590,140 | 800,000 | 6,508 | 3,396,648 |
| 1912 | 744,307 | 500,000 | 12,149 | 1,256,456 |
| 1913 | 2,420,685 | 750,000 | 130,044 | 3,300,729 |
| 1914 | 2,763,884 | 675,000 | 39,867 | 3,478,751 |
| 1915 | 1,857,742 | 350,000 | 16,749 | 2,224,491 |
Included in amounts received from “Other Sources” in 1912–13 is the sum of £25,000 which was formerly hold in the Deposit Account for the purchase of permanent-way material; also £86,970, receipts under section 16 of the Reserves and other Lands Disposal and Public Bodies' Empowering Act, 1912. This column for 1913–14 includes a further amount of £21,890, receipts under the Act mentioned.
During the year 1908–9 the Wellington-Manawatu Railway was taken over by the State, and a loan of £1,000,000 was raised for that purpose. In addition to the amount shown above, the sum of £4,355,000 was transferred during the years 1891–92 to 1904–5 from the” Consolidated Fund Account to the Public Works Fund. The next table shows the expenditure at intervals of five years from 1884–85 to 1904–5, and for each year since 1904–5 upon services which are charged to the fund. As will be seen further on the whole of what may be termed public works are not included in this account.
| EXPENDITURE ON SERVICES PROVIDED FOR BY THE PUBLIC WORKS FUND. | |||||||||
|---|---|---|---|---|---|---|---|---|---|
| Year ended 31st March. | Immigration. | Railways. | Roads. | Development of Goldfields. | Telegraph Extension. | Public Buildings. | Lighthouses, &c. | Other Services. | Totals. |
| £ | £ | £ | £ | £ | £ | £ | £ | £ | |
| 1885 | 57,148 | 663,063 | 317,043 | 8,029 | 25,799 | 117,361 | 34,033 | 114,251 | 1,336,727 |
| 1890 | 867 | 289,572 | 84,126 | 284 | 16,346 | 35,473 | 9,434 | 46,362 | 482,464 |
| 1895 | 101 | 247,545 | 164,833 | 5,865 | 19,229 | 54,190 | 3,145 | 9,578 | 504,486 |
| 1900 | 385 | 417,937 | 285,532 | 21,815 | 26,771 | 115,427 | 9,026 | 116,330 | 993,223 |
| 1905 | 6,482 | 811,994 | 230,012 | 6,258 | 79,298 | 116,678 | 5,990 | 97,446 | 1,354,158 |
| 1906 | 8,753 | 1,077,978 | 360,766 | 18,533 | 77,186 | 160,214 | 4,946 | 103,443 | 1,811,819 |
| 1907 | 14,353 | 1,326,792 | 366,581 | 11,064 | 114,068 | 226,918 | 4,504 | 104,614 | 2,168,894 |
| 1908 | 9,131 | 1,272,828 | 331,107 | 8,632 | 155,491 | 226,035 | 6,863 | 99,797 | 2,109,882 |
| 1909 | 15,077 | 2,278,327 | 481,976 | 32,859 | 163,033 | 285,521 | 19,217 | 87,885 | 3,363,895 |
| 1910 | 17,002 | 1,279,807 | 367,230 | 18,598 | 123,422 | 276,949 | 16,683 | 116,706 | 2,216,397 |
| 1911 | 9,441 | 1,184,083 | 270,648 | 10,845 | 111,868 | 325,613 | 8,427 | 137,766 | 2,058,691 |
| 1912 | 11,681 | 1,178,969 | 430,647 | 21,245 | 147,692 | 349,655 | 12,576 | 187,915 | 2,340,380 |
| 1913 | 14,694 | 1,179,554 | 376,078 | 10,644 | 251,375 | 445,142 | 16,785 | 254,646 | 2,548,918 |
| 1914 | 33,914 | 1,144,756 | 382,097 | 4,889 | 392,648 | 369,600 | 9,059 | 423,835 | 2,760,798 |
| 1915 | 33,219 | 1,156,073 | 514,798 | 2,384 | 288,395 | 417,000 | 17,131 | 308,364 | 2,737,364 |
The receipts and expenditure of the fund, including the renewal of loans maturing, during the financial year ended 31st March, 1915, were as under:—
| PUBLIC WORKS FUND.—RECEIPTS AND EXPENDITURE, 1914–15. | ||
|---|---|---|
| Receipts— | £ | £ |
| Balance, 31st March, 1914 | .. | 1,308,632 |
| Instalments received in respect of loans authorized | 226,528 | |
| Inscribed stock created | 26,114 | |
| Proceeds of debentures and scrip issued under Aid to Public Works and Land Settlement Act, 1914 | 1,525,000 | |
| Proceeds of debentures issued under the Government Railways Amendment Act, 1910 | 5,000 | |
| Proceeds of debentures issued under the Aid to Water-power Works Act, 1910 | 40,000 | |
| Proceeds of debentures issued under the Irrigation and Water-supply Act, 1913 | 35,100 | |
| 1,857,742 | ||
| Recoveries on account of expenditure of previous years | 13,456 | |
| Receipts under the Waihou and Ohinemuri Rivers Improvement Act, 1910 | 1,776 | |
| Other receipts | 1,517 | 16,749 |
| Transfer from Consolidated Fund | .. | 350,000 |
| Temporary transfer from War Expenses Fund | .. | 50,000 |
| Total | .. | £3,583,123 |
| Expenditure— | ||
| Railways | 1,156,073 | |
| Roads | 514,798 | |
| Public buildings | 417,000 | |
| Telegraph extension | 288,395 | |
| Contingent Defence | 15,222 | |
| Immigration | 33,219 | * |
| Development of goldfields | 2,384 | |
| Lighthouses, harbour-works, and harbour defences | 17,131 | |
| Tourist and Health Resorts | 8,232 | |
| Lands improvement | 13,810 | |
| Development of water-power | 74,291 | |
| Irrigation and water-supply | 32,088 | |
| Waihou and Ohinemuri Rivers improvement | 13,504 | |
| Reclaimed land (payment to Wellington Harbour Board) | 15,000 | |
| Departmental | 100,719 | |
| Charges and expenses of raising and renewing loans | 35,498 | |
| 2,737,364 | ||
| Debentures redeemed and renewed | .. | 11,800 |
| Temporary transfer from War Expenses Fund restored | .. | 50,000 |
| Balance, 31st March, 1914 | .. | 783,959 |
| Total | .. | £3,583,123 |
The expenditure on roads out of the Public Works Fund does not comprise all of the moneys spent under that head by the General Government. Between 1896–97 and 1910–11 the sum of £469,236 was expended on construction of roads to open up Crown lands out of the moneys raised for loans to local bodies.
Further expenditure on the construction of roads to open up Crown lands includes amounts of £45,690 in 1910–11, £49,739 in 1911–12, £47,951 in 1912–13, £63,245 in 1913–14, and £92,975 in 1914–15. During the four years 1910–11 to 1913–14 these payments were made from a separate account entitled the Opening-up Crown Lands for Settlement Account. This account was abolished during 1914–15, and the balance transferred to the Land for Settlements Account, out of which the amount shown above for 1914–15 was paid.
Roads to open national-endowment lands are paid for out of the National Endowment Account, the amount paid in 1914–15 being £9,151.
The roading of lands purchased for closer settlement is made a charge upon the Land for Settlements Account., and is included in the value upon which the rentals of those lands are based. The reclamation by drainage and opening up by means of roads of an area of the Hauraki Plains is provided for out of moneys borrowed for that purpose and shown in a separate account.
The accounts included under this heading in some cases comprise revenue of different kinds mixed up with loan-money, while others are merely records of transactions which of their nature cannot be considered as properly belonging to the Public Account. Among the former may be counted the State Forests and State Coal-mines Accounts, and among the latter the accounts of local bodies, which consist of revenue collected on behalf of and paid over to local authorities, and the Deposit Accounts, consisting partly of moneys held in trust and partly of moneys held in suspense for various reasons. The transactions of these accounts or funds are shown in the tables following.
| TREASURY BILLS ACCOUNT. | |
|---|---|
| Dr. | £ |
| Treasury Bills issued during year | 1,630,000 |
| Renewed during year | 1,050,000 |
| Total | £2,680,000 |
| Cr. | £ |
| Treasury Bills renewed during year | 1,050,000 |
| Paid off during year | 1,630,000 |
| Total | £2,680,000 |
| STATE FORESTS ACCOUNT. | |
|---|---|
| Receipts. | £ |
| Bents from lands set apart | 14,371 |
| Fees | 2 |
| Contribution from Consolidated Fund | 6,000 |
| Total | £20,373 |
| Expenditure. | £ |
| Expenses of nurseries, tree-planting and forest conservation | 30,318 |
| Total | £30,318 |
| STATE COAL-MINES ACCOUNT. | |
|---|---|
| Receipts. | £ |
| Proceeds of sale of coal | 213,066 |
| Recoveries on account of expenditure of previous years | 1,600 |
| Total | £214,666 |
| Expenditure. | £ |
| Working-expenses and development | 209,642 |
| Interest on debentures | 10,605 |
| Total | £220,247 |
| SCENERY PRESERVATION ACCOUNT. | |
|---|---|
| Receipts. | £ |
| Debentures issued | 10,000 |
| Rents | 62 |
| Total | £10,062 |
| Expenditure. | £ |
| Scenery preservation | 7,887 |
| Total | £7,887 |
| NAVAL DEFENCE ACT ACCOUNT. | |
|---|---|
| Receipts. | £ |
| Naval Defence Act, 1909— | |
| Proceeds of sale of 4 - per -cent. Inscribed Stock | 2,100 |
| Total | £2,100 |
| Expenditure. | £ |
| Expenditure under the Act | 9,000 |
| The Naval Defence Act, 1909— | |
| Charges and expenses | 26 |
| Total | £9,026 |
| LOCAL BODIES ACCOUNT. | |
|---|---|
| Receipts. | £ |
| Revenue received on account of local bodies— | |
| Fees, fines, &c. | 5,659 |
| Endowments of land, &c. | 1,409 |
| Goldfields revenue | 13,470 |
| Gold duty | 7,818 |
| Counties separate account | 99 |
| Advance Account— | |
| Amounts repaid by local bodies | 20,095 |
| Total | £48,550 |
| Expenditure. | £ |
| Revenue paid over to local bodies— | |
| Fees, fines &c. | 7,021 |
| Endowments of land, &c. | 2,327 |
| Goldfields revenue | 13,795 |
| Gold duty | 9,770 |
| Counties separate account | 98 |
| Advance Account— | |
| Sundry payments made on behalf of local bodies | 20,106 |
| Total | £53,117 |
This account deals with revenue collected for and paid over to local authorities, also sundry payments made on behalf of such authorities and refunded by them.
| DEPOSIT ACCOUNTS. | |
|---|---|
| Receipts. | £ |
| Lodgments | 1,271,234 |
| Total | £1,271,234 |
| Expenditure. | £ |
| Withdrawals | 1,112,004 |
| Total | £1,112,004 |
This account consists of moneys to be applied to specific purposes under various Acts, collections on behalf of local institutions, and miscellaneous items in suspense.
| CHEVIOT ESTATE ACCOUNT. | |
|---|---|
| Receipts. | £ |
| Rents from land | 13,612 |
| Sales | 40 |
| Interest on securities | 1,567 |
| Total | £15,219 |
| Expenditure. | £ |
| Interest on loan | 13,299 |
| Total | £13,299 |
The operations of this account during each of the five financial years ended 31st March, 1911–15, and the total transactions to the latter date, are shown in the table following.
| Head. | Year ended 31st March. | Total to 31st March, 1915. | ||||
|---|---|---|---|---|---|---|
| 1911. | 1912. | 1913. | 1914. | 1915. | ||
| Receipts — | £ | £ | £ | £ | £ | £ |
| Loans raised | .. | .. | 34,000 | 306,588 | 136,078 | 6,354,578 |
| Advances made by New Zealand State Advances Office | 33,000 | 407,500 | 399,497 | 163,878 | .. | 1,003,875 |
| Sale of lands | 3,603 | 139,566 | 293,867 | 437,036 | ||
| Rents, &c. | 285,543 | 293,869 | 323,242 | 342,278 | 312,827 | 3,548,764 |
| Total Receipts | 318,543 | 701,369 | 760,342 | 952,310 | 742,772 | 11,344,253 |
| Expenditure— | ||||||
| Land purchases | 158,796 | 381,483 | 428,045 | 560,497 | 356,686 | 7,293,299 |
| Transfer to Opening up Crown Lands for Settlement Account | .. | .. | .. | 34,171 | 51,000 | 85,171 |
| Interest on loans | 224,144 | 223,149 | 243,625 | 266,205 | 287,225 | 2,793,492 |
| Payment to sinking fund | 59,079 | 63,154 | 66,857 | 48,910 | 41,937 | 501,309 |
| Incidental expenses | 25,623 | 24,140 | 36,983 | 25,902 | 36,142 | 636,903 |
| Total expenditure | 467,642 | 691,926 | 775,510 | 935,685 | 772,990 | 11,310,174 |
The whole of the annual contributions to the sinking fund were formerly paid to the Public Trustee for investment. By section 26 of the State Advances Act, 1913, however, it was provided that future contributions should be paid to the Public Trustee only in respect of loans not obtained from any Department of the Public Service. For loans from the State Advances and other Departments the sinking fund contributions are to be paid to the Consolidated Fund in terms of the Public Debt Extinction Act, 1910.
For some years there was a special account for the opening up of Crown lands for settlement. This has now been abolished, and the money in the account transferred to the Land for Settlements Act. The money is still to be devoted to the same purposes, and is kept in a separate account, subsidiary to the Land for Settlements Account. The operations of the new account for the year 1914–15 are:—
| Receipts. | £ |
|---|---|
| Transfer of balance at credit of Opening-up Crown Land for Settlements Account | 45,285 |
| Amount set aside under section 63 of Land for Settlements Act | 51,000 |
| Transfer from State Advances Office under section 3 of State Advances Amendment Act, 1914 | 5,134 |
| Revenue under section 63 of Land Laws Amendment Act, 1913 | 8,999 |
| £110,418 | |
| Expenditure. | |
| Roads to open up lands for settlement | 92,975 |
| Refund of advance | 1,254 |
| £94,229 |
| NATIVE LAND SETTLEMENT ACCOUNT. | |
|---|---|
| Receipts. | £ |
| Instalments of Loan | 136,092 |
| Amount received for surveys | 26,512 |
| Land sales | 199 |
| Rents, &c. | 13,744 |
| Repayment of advances by Maori Land Boards | 2,241 |
| Total | £178,788 |
| Expenditure. | |
| Native-land purchases | 1,549 |
| Expenditure under the Act | 258,408 |
| Interest | 20,790 |
| Charges and expenses under Native Land Amendment Act, 1913 | 4,982 |
| Compensation for land declared Crown land in Thermal Springs District | 1,856 |
| Total | £287,585 |
| CONVERSION ACCOUNT. | |
|---|---|
| Receipts. | £ |
| 4-per-cent. Inscribed Stock— | |
| Issued for conversion of debentures | 1,906,030 |
| Issued for expenses of conversion | 35,349 |
| Total | £1,941,379 |
| Expenditure. | |
| Scrip and Debentures converted into 4-per-cent. Inscribed Stock— | |
| Amount converted | 1,862,200 |
| Premiums | 43,380 |
| Expenses Account— | |
| Brokerage and commission | 89 |
| Stamp duty | 33,152 |
| Discount | 133 |
| Rent and office expenses | 529 |
| Total | £1,939,933 |
In order to moot the extraordinary expenditure occasioned by the war, authority was given the Minister of Finance to raise £2,000,000 during the financial year 1914–15. This amount was duly raised and the funds of the account were augmented by private contributions amounting to £159,137. Temporary advances were obtained totalling £1,400,000, of which £1,100,000 was repaid during the year. The expenditure for the year was £2,171,836, leaving a balance of £287,302 at 31st March, 1915.
| Receipts. | £ |
|---|---|
| Treasury bills issued | 2,000,000 |
| Advances on security of Re serve Fund securities | 300,000 |
| Advances on security and proceeds of Treasury bills | 1,100,000 |
| Contributions towards War Expenses Fund | 159,137 |
| Total | £3,559,137 |
| Expenditure. | £ |
| War expenses | 2,171,836 |
| Treasury bills redeemed | 400,000 |
| Advances repaid | 700,000 |
| Total | £3,271,836 |
An Act of the General Assembly, passed in 1908, authorizes the construction of works necessary for the drainage, reclamation, and opening up for settlement of a block of swampy land, part of the Hauraki Plains. The Act provides for borrowing the funds required to carry out the work, and lays down that the future revenues of the land recovered shall be applied to the repayment of the moneys so raised. The transactions for each of the last five years and the total to date are given in the following table:—
| Head. | Year ended 31st March. | Total to 31st March, 1915. | ||||
|---|---|---|---|---|---|---|
| 1911 | 1912 | 1913 | 1914 | 1915 | ||
| Receipts— | £ | £ | £ | £ | £ | £ |
| Land sales, leases, &c. | 6,014 | 4,660 | 6,865 | 8,135 | 10,449 | 36,123 |
| Transfers from Local Bodies Account | .. | .. | .. | .. | .. | 31,000 |
| Advances made by New Zealand State Advances Office | 40,000 | 20,000 | 15,000 | 10,000 | 95,000 | |
| Transfer from State Advances Office under section 3 of State Advances Amendment Act. 1914 | .. | .. | .. | .. | 771 | 771 |
| Debentures issued | .. | .. | .. | 5,000 | 9,000 | 14,000 |
| Totals | 46,014 | 24,660 | 21,865 | 23,135 | 20,220 | 176,894 |
| Expenditure— | ||||||
| Reclamation, drainage, and road-construction | 29,607 | 37,142 | 22,695 | 18,993 | 16,609 | 158,953 |
| Payment of principal and interest | 834 | 2,662 | 3,913 | 2,475 | 3,791 | 13,675 |
| Totals | 30,441 | 39,804 | 26,608 | 21,468 | 20,400 | 172,628 |
Under the Land Act, 1908, the net revenues from certain areas of Crown lands are applied to educational purposes and to payment of old-age pensions in the proportion of 70 per cent. and 30 per cent. in each case respectively. From the gross revenue is deducted any expenditure which may be incurred in the construction of roads, and also any sums which by law have been appropriated to local authorities out of the rents. The method adopted in dealing with the funds is to keep a separate account of all receipts and disbursements during the financial year, and at the end of that period to allocate the balance to the purposes stated above. The transactions during the year ended 31st March, 1915, wore,—
| Receipts. | £ |
| Rents, &c. | 105,639 |
| Total | £105,639 |
| Expenditure. | |
| Construction of roads | 9,151 |
| Payment to local authorities, &c. | 84,320 |
| Total | £93,471 |
| WORKERS' DWELLINGS ACCOUNT. | |
|---|---|
| Receipts. | £ |
| Sale of dwellings under section 16 of Act | 3,278 |
| Total | £3,278 |
| Expenditure. | |
| Nil. | |
| Total | Nil. |
This account has now been separated from the State Advances Account proper (section 4 of the Mining Amendment Act, 1913). The operations of the account for the year 1914–15 are shown.
| RANGITAIKI LAND DRAINAGE ACCOUNT. | |
|---|---|
| Receipts. | £ |
| Debentures issued | 8,000 |
| Interest on advances | 500 |
| Total | £8,500 |
| Expenditure. | |
| Advances to mining companies | 8,792 |
| Payment to Sinking Fund | 100 |
| Interest | 82 |
| Total | £8,974 |
| Receipts. | £ |
| Receipts under the Rangitaiki Land Drainage Act, 1910 | 80 |
| Transfer from State Advances Office | 105 |
| Debentures issued | 17,000 |
| Total | £17,185 |
| Expenditure. | |
| Expenditure under the Rangitaiki Land Drainage Act, 1910 | 15,572 |
| Interest | 418 |
| Total | £15,990 |
| BANK OF NEW ZEALAND ACT 1903 ACCOUNT | . |
| Dr. | £ |
| Investment Account | 875,000 |
| Total | £875,000 |
| Cr. | |
| Preference shares of the Bank of New Zealand | 875,000 |
| Total | £875,000 |
Shares representing £375,000 were added to this account during the year 1914–15 in accordance with section 6 of the Bank of New Zealand Act, 1913.
| RESERVE FUND ACCOUNT. | |
|---|---|
| Dr. | £ |
| Investment Account | 800,000 |
| Total | £800,000 |
| Cr. | |
| Securities | 800,000 |
| Total | £800,000 |
| NEW ZEALAND CONSOLS ACCOUNT. | |
|---|---|
| Dr. | £ |
| Cash in Deposit Account | 107 |
| Investment Account | 475,885 |
| Total | £475,992 |
| Cr. | |
| Cash in Deposit Account | 107 |
| Investment Account | 475,885 |
| Total | £475,992 |
The Kauri-gum Industry Amendment Act, 1914, authorizes the Minister of Lands to act as agent for the disposal of kauri-gum on behalf of the gum-diggers, thus affording a measure of relief for the industry during the war period. The Minister may advance to diggers up to one-half of the estimated value of the gum, the balance, less deductions for insurance, storage, &c., being paid over when the Minister sells the gum.
| Receipts. | £ |
| Debentures issued | 14,000 |
| Total | £14,000 |
| Expenditure. | |
| Expenditure under the Act | 4,993 |
| Total | £4,993 |
| Receipts. | £ |
| Debentures issued | 11,500 |
| Total | £11,500 |
| Expenditure. | |
| Advances | 10,000 |
| Total | 10,000 |
The cash balances and investments of the foregoing accounts, as on 31st March, 1915, are shown in the following table:—
| Account. | Cash. | Investments. | Total |
|---|---|---|---|
| Cr. | £ | £ | £ |
| Consolidated Fund (ordinary revenue) | 149,047 | .. | 149,047 |
| State Forests | 3,910 | .. | 3,910 |
| State Coal-mines | 25,636 | .. | 25,636 |
| Scenery-preservation | 3,603 | .. | 3,603 |
| Naval Defence | 118 | .. | 118 |
| Local Bodies | 7,251 | .. | 7,251 |
| Deposit Accounts | 331,561 | .. | 331,561 |
| Public Works Fund (proper) | 695,762 | .. | 695,762 |
| Wellington–Hutt Railway and Road Improvement | 1,791 | .. | 1,791 |
| Railways Improvements | 5,257 | 5,257 | |
| Waihou and Ohinemuri Rivers Improvement | 13,559 | 60,000 | 73,559 |
| Aid to Water-power Works | 2,871 | .. | 2,871 |
| Irrigation and Water-supply | 4,719 | .. | 4,719 |
| Cheviot Estate | 34,067 | 55,000 | 89,067 |
| Land for Settlements | 34,079 | .. | 34,079 |
| Land for Settlements (opening up Crown lands for settlement) | 16,189 | .. | 16,189 |
| Account. | Cash. | Investments | Total. |
|---|---|---|---|
| Cr. | £ | £ | £ |
| Native-land Settlement | 15,297 | .. | 15,297 |
| Conversion Account | 9,347 | .. | 9,347 |
| War Expenses | 287,302 | .. | 287,302 |
| Hauraki Plains Settlement | 4,266 | .. | 4,266 |
| National Endowment | 65,855 | 26,800 | 92,655 |
| Workers' Dwellings | 9,909 | .. | 9,909 |
| Mining Advances | 436 | .. | 436 |
| Rangitaiki Land Drainage | 3,031 | .. | 3,031 |
| Bank of New Zealand (preference shares) | .. | 875,000 | 875,000 |
| Reserve Fund | .. | 800,000 | 800,000 |
| New Zealand Consols | 107 | 475,885 | 475,992 |
| Kauri-gum Industry | 9,007 | .. | 9,007 |
| Fruit-preserving Industry Advances | 1,500 | .. | 1,500 |
| Totals | 1,735,477 | 2,292,685 | 4,028,162 |
The State Advances Account, which is administered directly by the Advances Board, is not included in the above statement, nor is the Loans Redemption Account. In addition there are the funds of the Government Life Insurance Department, the State Fire Insurance Department, and the Public Trust Office, which are administered by the Departments concerned. Reference to the working of these Departments will be found elsewhere in this book.
All revenue collected by means of taxation is applied to general purposes. Customs duties on imported goods, excise duties on beer, and also on a few minor items, constitute the indirect taxation, land and income taxes, death duties, a tax on bank-note issues, duty on cheques and receipts for payments being the main source of revenue by direct taxation. Particulars of the collections during the past ten years, under the main headings, are shown in the following table:—
| Year ended 31st March. | Amount of Taxation derived from | Total. | ||||
|---|---|---|---|---|---|---|
| Customer and Excise Duties. | Land-tax. | Income-tax. | Death Duties. | Other Taxes. | ||
| £ | £ | £ | £ | £ | £ | |
| 1906 | 2,795,546 | 385,756 | 261,816 | 127,174 | 271,304 | 3,841,596 |
| 1907 | 3,048,622 | 447,342 | 277,867 | 191,509 | 299,215 | 4,264,555 |
| 1908 | 3,217,538 | 537,846 | 304,905 | 246,032 | 339,433 | 4,645,754 |
| 1909 | 2,917,462 | 604,901 | 321,044 | 260,238 | 274,116 | 4,377,761 |
| 1910 | 2,786,490 | 642,270 | 316,835 | 192,014 | 242,907 | 4,180,516 |
| 1911 | 3,145,929 | 628,723 | 407,235 | 323,783 | 331,652 | 4,837,322 |
| 1912 | 3,398,143 | 647,015 | 448,935 | 361,186 | 441,311 | 5,296,590 |
| 1913 | 3,531,761 | 728,636 | 462,994 | 458,265 | 425,173 | 5,606,829 |
| 1914 | 3,553,785 | 767,451 | 554,271 | 613,751 | 428,776 | 5,918,034 |
| 1915 | 3,294,943 | 799,641 | 540,318 | 796,232 | 449,677 | 5,880,811 |
The percentage under each heading to the total amount collected for each year is as under:—
| Year ended 31st March. | Proportion per Cent deived from | ||||
|---|---|---|---|---|---|
| Customs and Excise Duties. | Land tax. | Income-tax. | Death Duties. | Other Direct Taxes. | |
| Per Cent. | Per Cent. | Per Cent. | Per Cent. | Per Cent. | |
| 1906 | 72.77 | 10.04 | 6.82 | 3.31 | 7.06 |
| 1907 | 71.49 | 10.49 | 6.51 | 4.49 | 7.02 |
| 1908 | 69.26 | 11.58 | 6.56 | 5.29 | 7.31 |
| 1909 | 66.64 | 13.82 | 7.33 | 5.95 | 6.26 |
| 1910 | 65.63 | 15.13 | 7.46 | 4.52 | 7.26 |
| 1911 | 65.03 | 13.00 | 8.42 | 6.69 | 6.86 |
| 1912 | 64.16 | 12.21 | 8.48 | 6.82 | 8.33 |
| 1913 | 62.99 | 13.00 | 8.26 | 8.17 | 7.58 |
| 1914 | 60.05 | 12.97 | 9.37 | 10.37 | 7.24 |
| 1915 | 56.03 | 13.60 | 9.19 | 13.54 | 7.64 |
The revenue from taxation per head of mean population during the past ten years is shown in the next table.
| REVENUE FROM TAXATION PER HEAD OF MEAN POPULATION. 1905–6 TO 1914–15. | ||||||
|---|---|---|---|---|---|---|
| Year ended 31st March. | Including Maoris. | Excluding Maoris. | ||||
| £ | s. | d. | £ | s. | d. | |
| 1906 | 4 | 3 | 5 | 4 | 7 | 7 |
| 1907 | 4 | 9 | 10 | 4 | 14 | 7 |
| 1908 | 4 | 15 | 5 | 5 | 0 | 4 |
| 1909 | 4 | 7 | 5 | 4 | 11 | 11 |
| 1910 | 4 | 1 | 6 | 4 | 5 | 6 |
| 1911 | 4 | 12 | 4 | 4 | 16 | 11 |
| 1912 | 4 | 19 | 0 | 5 | 3 | 10 |
| 1913 | 5 | 2 | 3 | 5 | 7 | 2 |
| 1914 | 5 | 5 | 2 | 5 | 10 | 0 |
| 1915 | 5 | 2 | 9 | 5 | 7 | 5 |
For the purpose of raising additional revenue to meet the deficiencies due to the war and of providing for interest and sinking fund payments on the new loans raised on account of the extraordinary expenditure of the war, extra taxation has been imposed covering a fairly wide range of items, with a view to making the direct effect as little oppressive as possible.
The minimum for exemption from income-tax has not been reduced, but an additional 33⅓ per cent. has been added to the former rates, and the incidence of income-tax has been extended to cover income derived from land and mortgages of land formerly assessed for land-tax, but not for income-tax. Under the new rates, land-tax is still payable on mortgages, and income-tax will have deducted from it whatever has been paid as land-tax. The intention is that the increased taxation will fall on those making increased profits from the sale of wool, meat, and dairy-produce. The land-tax on mortgages has been increased from ¾d. to 1d. in the pound on the capital value, and the graduated land-tax is increased by 50 per cent.
Additional Customs duties have been placed on a number of items of import, including spirits, wines, and flavouring essences; bicycles, motorcycles, carriages, &c., and their fittings; and electric machinery, gas-, oil-, and hot-air-engines, &c. A primage duty of 1 per cent. of the value of goods imported (with certain exceptions) is also imposed.
In place of the former system of assessing and collecting beer duty a new system has been brought in, with a new scale of fees. The duty is to be calculated according to the specific gravity of the worts used in the production of the beer. For a specific gravity not exceeding 1047 (reckoned in relation to water at 60° Fahrenheit, taken as 1000) the duty is fixed at 3¾d. per gallon; from 1047 to 1055 the rate is increased by 1/16d. for every unit above 1047; and when the specific gravity is more than 1055 the rate is increased by a further 1/8d. for every unit above 1055. The former duty was a uniform one of 3d. per gallon. The graduated scale has been introduced partly with a view to encouraging the brewing of light beer.
Numerous new and additional stamp duties have also been imposed. Contracts for the sale of land are charged with the same duty as if they were actual conveyances. Mortgages and transfers of mortgages, formerly exempt from stamp duty, are now dutiable to the extent of 5s. for every £100 or part of £100, and 10s. is payable on the discharge of a mortgage. The duty on a deed of assignment becomes £3 instead of £2 10s. as formerly, the duty on receipts, cheques, bills of exchange, and promissory notes is increased from 1d. to 2d., and the general schedule of stamp duties has been revised and many duties increased by amounts standing generally at 3d. in the shilling, 6d. in the half-crown. 1s. in 5s., and 2s. 6d. in 10s. The tax on the bank-note issue is increased from 10s. to 15s. per £100. One per cent. of stakes won in respect of horse-racing is payable to the Commissioner of Stamps, and totalizator dividends must bear a tax of 6d. in the pound, in addition to the former percentage payable on totalizator investments and gate receipts.
The various amendments to the Death Duties Act are not in the direction of imposing any extra taxation in the aggregate, involving only alterations in respect of exemptions.
In addition to the war taxation referred to above, the charges for certain public services have also been increased with a view to counteracting the effect of anticipated deficiencies in revenue. The scale of ordinary passenger fares on the railways is increased by 1d. in the shilling; second-class excursion fares have been raised to approximately l⅓d. per mile return, as against 1d. under the former scale. An extra 2d. is charged on every ticket for excursion fares, whether first or second class. An increase of 10 per cent. has been made in all rates chargeable on goods, parcels, luggage, horses, &c., and on charges in respect of railway wharves and Lake Wakatipu steamers. Postage charges have been increased by ½d. on all articles posted, except newspapers. The extra charges are not imposed on letters. &c., addressed to countries to which the rates are the maximum rates chargeable under the International Postal Convention. The minimum charge for telegrams has been fixed at 8d. (formerly 6d.), and an extra 2d. is payable on all telegrams, and as an additional inland charge on cablegrams.
During the year ended 31st March, 1915, the sum of £3,167,283 was collected, after deduction of drawbacks, for duty on imported goods, and £127,660 for excise duties, a total of £3,294,943. The amount of revenue derived from these sources for each of the past ten years is shown below.
| Year ended 31st March. | Customs Duties. | Excise Duties. | Total. |
|---|---|---|---|
| £ | £ | £ | |
| 1906 | 2,697,411 | 98,135 | 2,795,546 |
| 1907 | 2,941,040 | 107,582 | 3,048,622 |
| 1908 | 3,103,565 | 113,973 | 3,217,538 |
| 1909 | 2,801,248 | 116,214 | 2,917,462 |
| 1910 | 2,671,121 | 115,369 | 2,786,490 |
| 1911 | 3,027,829 | 118,100 | 3,145,929 |
| 1912 | 3,279,012 | 119,131 | 3,398,143 |
| 1913 | 3,407,538 | 124,223 | 3,531,761 |
| 1914 | 3,426,744 | 127,041 | 3,553,785 |
| 1915 | 3,167,283 | 127,660 | 3,294,943 |
The revenue from Customs and excise duties in 1904–5 was £2,728,193, and the increase for the ten years is £566,750 or 20.77 per cent. In the ten calendar years corresponding to the same period the value of imports increased from £13,291,694 to £21,856,096, or at the rate of 64.43 per cent. The increased volume of trade has been accompanied by considerable decreases and remissions in rates of duty levied, and the increase in the total duties collected is thus entirely due to the increased prosperity of the country as reflected in its trade. The decrease in imports in 1914 as compared with 1913, it will be seen, has brought a corresponding decrease in Customs duties collected.
For a fuller discussion of Customs taxation than can be given here the reader is referred to the section of this book dealing with Commerce.
Land-tax in New Zealand is assessed on the unimproved value of the land, after deduction of registered mortgages, in respect of which land-tax, assessed on the capital value, is payable by the mortgagee. The ordinary land-tax is 1d. in the pound, and land-tax payable on mortgages is now also 1d. in the pound, having been increased ¼d. in the pound for the year 1915–16. An owner of land the value of which, apart from improvements, together with mortgages owing to him, does not exceed £1,500 (after deducting mortgages owing by him) is allowed an exemption of £500, but where such value exceeds £1,500 the exemption diminishes by £1 for every £2 that such value increases, so that no exemption is allowable when £2,500 is reached. In certain specified cases, where the payment of the tax would entail hardship, the Commissioner of Taxes has discretionary powers to grant relief.
When the unimproved value of land owned by a single individual or company exceeds £5,000, a graduated land-tax has for some years been payable, ranging up to 5⅚d. in the pound for land with an unimproved value in excess of £200,000. per annum. The graduated tax is increased by 50 per cent. in the case of absentees, but the additional absentee tax does not apply to companies. As part of the war taxation the graduated tax has now been increased by 50 per cent. of these duties.
Income-tax in the case of persons and firms is payable on all incomes, with certain exemptions, in excess of £300 per annum. In the case of registered companies the whole of the income is assessable, but dividends paid by such companies to shareholders are not assessable to the latter. Among the incomes formerly exempt from income-tax are those derived directly from land, but income-tax is now payable on such incomes, including that derived from mortgages on land. In case of mortgages, however, the income-tax is reduced by whatever has been paid as land-tax, provided the land-tax paid does not exceed the total amount of income-tax.
Income-tax ranges from 6d. to 1s. 4d. in the pound in the case of persons and firms, and from 1s. to 1s. 4d. in the case of registered companies, with an increase of 33⅓ per cent. throughout for the year 1915–16. The full rates are as follows:—
| Income. | Rate of Tax per £1. | For each £1 in excess of Lower Amount shown in First Column, Rate increased by |
|---|---|---|
| (a.) Registered Companies. | ||
| £ | Pence. | Pence. |
| –1,200 | 12 | .. |
| 1,200–1,600 | 12 | 1/200 |
| 1,600–2,400 | 14 | 1/400 |
| 2,400 and over | 16 | .. |
| (b.) Persons and Firms. | ||
| 300–400 | 6 | .. |
| 400–1,400 | 6 | 3/400 |
| 1,400–2,400 | 13½ | 1/400 |
| 2,400 and over | 16 | .. |
| NOTE.—All rates increased by 33½ per cent. for 1915–16. |
Full information concerning the land- and income-tax assessment appears in the 1913 issue of this book (pp. 884–895).
The income-tax for the year ended the 31st March, 1915, amounted to £540,318, and the land-tax to £799,641. The number of income-tax payers was 13,967. Land-tax payers numbered 44,270, and the net assessed taxable unimproved value of land and value of mortgages, after allowing all exemptions, was £149,683,776. The total number of payers of the graduated land-tax in 1914–15 was 6,738, as against 6,148 in the previous year, the taxable value of the land being £87,279,699 in 1914–15, and £81,185,276 in 1913–14.
The total number of land- and income-tax payers for each of the past ten years was,—
| NUMBER OF TAXPAYERS. | ||
|---|---|---|
| Year ended 31st March. | Land-tax. | Income-tax. |
| 1906 | 24,246 | 8,993 |
| 1907 | 27,659 | 9,540 |
| 1908 | 28,991 | 10,420 |
| 1909 | 30,855 | 10,839 |
| 1910 | 33,162 | 11,175 |
| 5,911 | 33,516 | 11,303 |
| 1912 | 35,273 | 12,207 |
| 1913 | 38,232 | 13,167 |
| 1914 | 40,889 | 14,277 |
| 1915 | 44,270 | 13,967 |
The land-tax payers increased from 23,895 in 1904–5 to 44,270 in 1914–15, the increase during the ten years being at the rate of 91.20 per cent. Payers of income-tax increased by 56.34 per cent. during the ten years. The decrease in the number of income-tax payers and in the amount of tax collected in 1914–15 as compared with 1913–14 is set down as being due mainly to the strike of 1913, which affected incomes for 1913–14, on which the tax for 1914–15 was collected. The totals for 1914–15 would also be slightly affected by an additional exemption having been granted in respect of children under sixteen years of age.
The revenue derived from land-tax (ordinary, graduated, and absentee) and income-tax during each of the past ten years is as shown below.
| LAND AND INCOME TAX, 1905–6 to 1914–15. | ||||
|---|---|---|---|---|
| Year ended 31st March. | Land-tax. | Income-tax. | ||
| Ordinary. | Graduated. | Absentee. | ||
| £ | £ | £ | £ | |
| 1906 | 277,144 | 104,949 | 3,663 | 261,816 |
| 1907 | 317,176 | 125,929 | 4,237 | 277,867 |
| 1908 | 346,166 | 186,000 | 5,680 | 304,905 |
| 1909 | 389,844 | 209,248 | 5,809 | 321,014 |
| 1910 | 417,668 | 220,044 | 4,558 | 316,835 |
| 1911 | 416,426 | 209,493 | 2,804 | 407,235 |
| 1912 | 439,398 | 205,114 | 2,503 | 448,935 |
| 1913 | 475,281 | 251,275 | 2,080 | 462,994 |
| 1914 | 506,407 | 258,135 | 2,909 | 554,271 |
| 1915 | 547,959 | 249,193 | 2,489 | 540,318 |
Under the Death Duties Act, 1909, an estate duty is levied upon the final balance of all property of a deceased person which is situated in New Zealand at his death in excess of the value of £500. In the case of any estate the final balance of which does not exceed £10,000, any interest acquired by the wife of the deceased up to the value of £5,000 is exempt from estate duty but the rate of duty on the whole estate must be determined before the deduction is made. The following is the scale of duties:—
| Net Value of Estate. | Rate of Duty |
|---|---|
| ££ | Per Cent. |
| 500 to 1,000 | 1 |
| 1,000 “ 2,000 | 2 |
| 2,000 “ 3,000 | 2½ |
| 3,000 “ 4,000 | 3 |
| 4,000 “ 5,000 | 3⅓ |
| 5,000 “ 6,000 | 3⅔ |
| 6,000 “ 7,000 | 4 |
| 7,000 “ 8,000 | 4⅓ |
| 8,000 to 9,000 | 4⅔ |
| 9,000 “ 10,000 | 5 |
| 10,000 “ 12,000 | 5⅓ |
| 12,000 “ 14,000 | 5⅔ |
| 14,000 “ 16,000 | 6 |
| 16,000 “ 18,000 | 6⅓ |
| 18,000 “ 20,000 | 6⅔ |
| 20,000 “ 25,000 | 7 |
On estates exceeding £25,000 the rate of duty progresses by one-third of 1 per cent. for each successive £5,000, but the maximum rate must not exceed 15 per cent.
Succession duty is payable by any person who acquires a beneficial interest in the estate of a deceased person either by will or by intestacy according to the following scale:—
| Per Cent. | |
|---|---|
| Wife of deceased | 2 |
| Husband | 2 |
| Child, grandchild, or other descendant | 2 |
| Relatives in degree not more remote than fourth | 5 |
| Others | 10 |
No duty is payable by the wife of deceased where the succession does not exceed £20,000, nor by a child grandchild, or other descendant where the amount is not more than £5,000. -Where duty is payable it is levied on the full amount of the succession, but must not be greater than the amount by which the succession exceeds £20,000 or £5,000, as the case may be.
In all other cases duty is not payable in respect of any succession the value of which does not exceed £200, and the duty payable on any succession in excess of that sum is not to be greater than the amount by which the succession exceeds £200.
Excepting in the case of wife, or of children, grandchildren, or other descendants, if the value of the succession exceeds £20,000 any such excess is charged with double the rate of the ordinary duty. Charitable trusts are exempt from succession duty.
The wife or lineal descendant of a soldier who has met his death on account of the war is allowed an exemption to the extent of £5,000, in addition to the exemptions mentioned above, duty to be payable on the residue only. A lineal ancestor is also exempt up to £5,000, but in this case, where the succession exceeds £5,000, the duty is payable on the full amount, but must not be more than the amount by which the succession exceeds £5,000.
A gift means any disposition of property which is made otherwise than by will, whether with or without an instrument in writing, without fully adequate consideration in money or its equivalent. The duty payable is as follows:—
On a gift which together with the value of all other gifts made at the same time, or within twelve months previously or subsequently by the same donor to the same or any other beneficiary, otherwise than by way of a charitable trust, does not exceed the value of £1,000, no duty shall be charged.
On gifts exceeding the value of £1,000, 5 per cent. Antenuptial marriage settlements and charitable gifts are exempt from duty.
Death duties are due and payable to the Commissioner of Stamps within six months from the death of the deceased, and gift duties at the time the gift is made.
The revenue received from death duties during each of the past ten years was,—
| Year ended 31st March. | Amount. £ |
|---|---|
| 1906 | 127,174 |
| 1907 | 191,509 |
| 1908 | 246,032 |
| 1909 | 260,238 |
| 1910 | 192,014 |
| 1911 | 323,783 |
| 1912 | 361,186 |
| 1913 | 458,265 |
| 1914 | 613,751 |
| 1915 | 796,232 |
Full information concerning the law as to the use of the totalizator in New Zealand is given in the section of this book dealing with Law and Crime. The Government tax on totalizator investments is 2½ per cent. of the gross amount passed through the machines. Prior to the 1st March, 1910, the percentage was 1½.
A tax of 1 per cent. has from the 1st November, 1915, been imposed on the total value of all stakes, and 6d. in the pound or part of a pound on totalizator dividends, in addition to the tax on totalizator investments.
The following table shows for each of the last twenty years the number of totalizator licenses issued, the amount of investments by the public, and the amount paid to the Treasury as a percentage of such investments. The amounts shown as “Percentage paid to Treasury” represent the amounts paid in respect of the race meetings held during the year as shown, but do not in all cases coincide with the amount of totalizator revenue received during the financial year, for the reason that the percentage in respect of race meetings held late in March may not be paid to the Treasury until after the end of the financial year:—
| Financial Year. | Number of Totalizator Licenses issued for Meetings held during Financial Year. | Days. | Percentage paid to Treasury. | Total Amount invested by the Public. |
|---|---|---|---|---|
| £ | £ | |||
| 1895–96 | 170 | 256 | 11,156 | 743,763 |
| 1896–97 | 158 | 250 | 11,911 | 794,096 |
| 1897–98 | 155 | 268 | 13,297 | 886,567 |
| 1898–99 | 144 | 250 | 13,695 | 912,969 |
| 1899–1900 | 154 | 278 | 15,983 | 1,065,580 |
| 1900–1 | 153 | 278 | 17,541 | 1,168,732 |
| 1901–2 | 165 | 309 | 19,040 | 1,275,813 |
| 1902–3 | 148 | 276 | 19,734 | 1,274,102 |
| 1903–4 | 151 | 282 | 20,486 | 1,357,263 |
| 1904–5 | 156 | 294 | 21,571 | 1,437,431 |
| 1905–6 | 158 | 298 | 22,898 | 1,555,638 |
| 1906–7 | 159 | 303 | 27,651 | 1,837,095 |
| 1907–8 | 152 | 292 | 29,996 | 1,999,757 |
| 1908–9 | 157 | 307 | 27,964 | 1,834,333 |
| 1909–10 | 167 | 323 | 29,645 | 2,030,426 |
| 1910–11 | 144 | 287 | 48,338 | 1,933,534 |
| 1911–12 | 142 | 264 | 72,184 | 2,887,371 |
| 1912–13 | 148 | 265 | 86,095 | 3,600,465 |
| 1913–14 | 126 | 231 | 92,260 | 3,690,390 |
| 1914–15 | 141 | 255 | 110,733 | 4,429,320 |
The racing year ends on the 31st July, and the position as regards the last four years is better shown in the next table, which gives figures for July years. Information as to gate-money, licenses, &c., is also given. Figures for racing prior to 1911–12 are not obtainable.
| Racing Year. | Number of Totalizator Licenses issued. | Days. | Amount invested on Totalizator by the Public. | Amount of Gate-money, Licenses, &c. | Amounts paid to Treasury. | |
|---|---|---|---|---|---|---|
| As Tax on Investments. | From Gate-money, Licenses, &c. | |||||
| 1911–12 | 138 | 250 | 2,898,596 | 90,921 | 72,465 | 2,273 |
| 1912–13 | 138 | 250 | 3,538,188 | 102,686 | 88,455 | 2,567 |
| 1913–14 | 138 | 250 | 4,188,594 | 123,932 | 104,714 | 3,099 |
| 1914–15 | 151 | 262 | 4,450,331 | 129,388 | 111,258 | 3,235 |
Local governing authorities have power, under various Acts of the legislature, to impose taxes for general or special purposes. These powers are fully set out in another section of this book. The amount of revenue collected for local purposes during ten years is shown below.
| Year ended 31st March. | Local Revenue derived from | Total. | ||
|---|---|---|---|---|
| General Rates. | Special and Separate Rates. | Licenses and other Taxes. | ||
| £ | £ | £ | £ | |
| 1905 | 704,315 | 315,116 | 101,947 | 1,121,378 |
| 1906 | 817,443 | 333,777 | 106,905 | 1,258,125 |
| 1907 | 889,711 | 343,337 | 105,488 | 1,338,536 |
| 1908 | 949,139 | 407,119 | 110,340 | 1,466,598 |
| 1909 | 970,225 | 420,473 | 111,195 | 1,501,893 |
| 1910 | 1,058,447 | 467,860 | 108,470 | 1,634,777 |
| 1911 | 1,118,112 | 474,489 | 108,234 | 1,700,835 |
| 1912 | 1,156,718 | 521,159 | 113,106 | 1,790,983 |
| 1913 | 1,252,717 | 546,582 | 169,468 | 1,968,767 |
| 1914 | 1,359,776 | 645,862 | 181,896 | 2,187,534 |
Of recent years there has been great activity in local enterprise, the necessary funds being provided partly out of general rates, but mainly by borrowing, interest on loans and payments to sinking funds being secured in most cases by special rates. The increase in the amount of general rates collected during the ten years 1903–4 to 1913–14 was £719,401 or 112.32 per cent., special and separate rates increased by £336,187 or 108.56 per cent., and total rates by £1,055,588 or 111.10 per cent. Licenses and other taxes show an increase for the ten years of £81,110 or 80.48 per cent.
A table is given setting out in greater detail the taxation by local authorities during the year ended the 31st March, 1914.
| REVENUE FROM LOCAL TAXATION, 1913–14. | |||||||||||||||
|---|---|---|---|---|---|---|---|---|---|---|---|---|---|---|---|
| Local Districts. | Rates. | Licenses. | Other Taxes. | Total. | |||||||||||
| General. | Special and Separate. | ||||||||||||||
| £ | s. | d. | £ | s | d. | £ | s. | d. | £ | s. | d. | £ | s. | d. | |
| Counties | 648,464 | 12 | 3 | 106,320 | 4 | 9 | 17,646 | 7 | 0 | 19,269 | 0 | 8 | 791,700 | 4 | 8 |
| Boroughs | 487,734 | 5 | 11 | 486,446 | 13 | 10 | 64,627 | 6 | 9 | 72,157 | 11 | 10 | 1,110,965 | 18 | 4 |
| Town districts | 24,595 | 13 | 8 | 8,514 | 4 | 11 | 3,804 | 13 | 11 | 1,382 | 19 | 11 | 38,297 | 12 | 5 |
| Native Township | 216 | 2 | 9 | 132 | 1 | 10 | 7 | 0 | 6 | 57 | 9 | 0 | 412 | 14 | 1 |
| Road districts | 78,778 | 1 | 10 | 20,204 | 4 | 11 | 1,191 | 0 | 8 | 1,453 | 15 | 2 | 101,627 | 2 | 7 |
| River districts | 10,365 | 16 | 2 | 2,941 | 12 | 7 | … | ... | ... | 284 | 10 | 11 | 13,591 | 19 | 8 |
| Land-drainage districts | 13,160 | 9 | 4 | 5,546 | 5 | 9 | … | … | ... | ... | ... | ... | 18,706 | 15 | 1 |
| Harbour districts | 37,097 | 6 | 11 | ... | ... | ... | ... | ... | ... | … | … | … | 37,097 | 6 | 11 |
| City and Suburban drainage districts | 55,869 | 10 | 2 | 9,211 | 12 | 4 | … | … | ... | ... | ... | ... | 65,081 | 2 | 6 |
| Tramway districts | 3,494 | 0 | 2 | … | … | … | ... | ... | ... | ... | ... | ... | 3,494 | 0 | 2 |
| Water-supply districts | … | ... | ... | 6,544 | 11 | 7 | … | ... | ... | 14 | 7 | 0 | 66,558 | 18 | 7 |
| Totals | 1,359,775 | 19 | 2 | 645,861 | 12 | 6 | 87,276 | 8 | 10 | 94,619 | 14 | 2 | 2,187,533 | 15 | 0 |
Early in the history of the settlement of New Zealand the necessity for financial assistance to open up the forest-clad, rugged country was made apparent. In the year 1856 the first Loan Act was passed by the General Assembly, and under that authority £500,000 was raised. In addition to the requirements for necessary initial public works, the opposition to settlement by the Maoris, resulting in active hostilities, compelled considerable borrowing. At the conclusion of the Maori war the work of road and railway construction was mainly carried on under the administration of Provincial Councils, who exercised control over expenditure within their respective districts, the General Government being responsible for undertakings of a national character. Under this system of divided responsibility no general and comprehensive scheme of public works could be carried out.
Up to the end of the year 1870 the General Government had borrowed £4,543,316, while the debt of the Provincial Councils amounted to £3,298,575. In that year the General Government brought forward a public works and immigration policy, by which it was proposed to raise a loan of ten millions for the construction of main trunk railways, roads, and other public works of importance to the country as a whole, as well as for the promotion of settlement on a large scale, the expenditure to be spread over a period of ten years. This policy was accepted by the Legislature, and embodied in the Immigration and Public Works Act, 1870. The necessity for local railways and other works soon caused the original proposals to be exceeded and to a far greater amount than was at first contemplated. Broadly stated, the system of opening up the lands in advance of settlement was adopted, the State retaining the ownership and control of facilities for transport and communication.
In 1892 the General Government began the repurchase of lands already alienated. The money required, for this purpose has been borrowed, but the rentals obtained by the leasing of the lands are sufficient for the payment of interest and sinking fund on the amount raised. In 1894 the Advances to Settlers Act was passed, authorizing the raising of loans for advances on the security of real estate. This was followed by the Advances to Workers Act in 1906. A considerable amount has been borrowed for these purposes, but both interest and sinking funds are derived from the special revenues, and thus are not a charge upon the Consolidated Fund. In order to assist local governing bodies to obtain money at low rates of interest the General Government has borrowed over six millions. Under this scheme the advances are repaid to the State by instalments.
The money composing the debt has been borrowed on the security of the public revenues. No portion of the public estate is pledged for payment of either principal or interest.
The Minister of Finance may raise loans when authorized by Parliament so to do, by the issue of debentures, or scrip, or stock, in New Zealand or elsewhere at his discretion, and may prescribe the mode and conditions of repayment of loans, the rates of interest (not exceeding the maximum rate fixed by the authorizing Act), and the times and places of the payment of principal and interest respectively. Power is given to convert debentures or scrip into consolidated stock, and the Minister may specify the terms of conversion at the time when a loan is raised, or arrange that terms shall be subsequently agreed upon. For the purpose of paying off or renewing at maturity any debenture, scrip, or other security, new debentures or other securities may be issued and disposed of if necessary.
The gross and net indebtedness of the General Government, the amount of sinking fund accrued, and the rate of indebtedness per head of population, for each of the past twenty years, is given in the following table:—
| As at 31st March. | Estimated or Census Population. | Amount of Debentures and Stock in Circulation. | Gross Indebtedness per Head of European Population. | Amount of Sinking Fund accrued. | Net Indebtedness. | Net Indebtedness per Head of European Population. | ||||
|---|---|---|---|---|---|---|---|---|---|---|
| £ | £ | s. | d. | £ | £ | £ | s. | d. | ||
| 1896 | 703,187 | 43,050,780 | 61 | 4 | 5 | 778,891 | 42,271,889 | 60 | 2 | 4 |
| 1897 | 717,649 | 44,366,618 | 61 | 16 | 5 | 814,294 | 43,552,324 | 60 | 13 | 9 |
| 1898 | 731,713 | 44,963,424 | 61 | 9 | 0 | 881,903 | 44,081,521 | 60 | 4 | 11 |
| 1899 | 746,673 | 46,938,006 | 62 | 17 | 3 | 857,279 | 46,080,727 | 61 | 14 | 4 |
| 1900 | 758,616 | 47,874,452 | 63 | 2 | 2 | 944,375 | 46,930,077 | 61 | 17 | 3 |
| 1901 | 772,719 | 49,591,245 | 64 | 3 | 7 | 1,033,494 | 48,557,751 | 62 | 16 | 10 |
| 1902 | 789,994 | 52,966,447 | 67 | 0 | 11 | 1,128,816 | 51,837,631 | 65 | 12 | 4 |
| 1903 | 814,842 | 55,899,019 | 68 | 12 | 0 | 1,357,739 | 54,541,280 | 66 | 18 | 8 |
| 1904 | 838,954 | 57,522,215 | 68 | 11 | 4 | 1,500,687 | 56,021,528 | 66 | 15 | 6 |
| 1905 | 864,971 | 59,912,000 | 69 | 5 | 4 | 1,650,718 | 58,201,282 | 67 | 7 | 2 |
| 1906 | 889,968 | 62,191,040 | 69 | 17 | 7 | 1,661,519 | 60,529,521 | 68 | 0 | 3 |
| 1907 | 913,873 | 64,179,040 | 70 | 4 | 7 | 2,042,068 | 62,136,972 | 67 | 19 | 10 |
| 1908 | 937,587 | 66,453,897 | 70 | 17 | 6 | 1,268,361 | 65,185,536 | 69 | 10 | 6 |
| 1909 | 968,313 | 70,938,534 | 73 | 5 | 2 | 1,479,224 | 69,159,310 | 71 | 14 | 8 |
| 1910 | 987,481 | 74,890,645 | 75 | 16 | 10 | 1,503,225 | 73,387,420 | 74 | 6 | 4 |
| 1911 | 1,008,468 | 81,078,122 | 80 | 7 | 11 | 1,754,486 | 79,323,636 | 78 | 13 | 2 |
| 1912 | 1,031,500 | 84,353,913 | 81 | 15 | 7 | 2,160,603 | 82,193,310 | 79 | 13 | 8 |
| 1913 | 1,061,748 | 90,060,763 | 84 | 16 | 5 | 2,603,642 | 87,457,121 | 82 | 7 | 5 |
| 1914 | 1,089,827 | 99,730,427 | 91 | 10 | 2 | 3,063,992 | 91,689,835 | 84 | 2 | 8 |
| 1915 | 1,100,586 | 100,059,910 | 90 | 18 | 4 | 3,178,055 | 96,644,455 | 87 | 16 | 3 |
The gross indebtedness at the 31st March, 1914, includes the sum of £4,976,600 raised at the end of the year 1913–14 for redemption of debentures falling due early in 1914–15; and the sum of £237,400 raised on the 30th March, 1915, for redemptions on the 1st April, 1915, is included in the figure for 1914–15. The net indebtedness does not include these amounts.
In issues of the Year-book prior to 1912, in addition to the customary deduction made for sinking funds accrued, the gross debt was further reduced for the years 1903 to 1911 by taking off the amount of Government securities in which the New Zealand Consols deposits are invested, as well as the value of the preference shares held by the Government in the Bank of New Zealand, which was £500,000 up to 1914, but has now been increased by the sum of £375,000, representing 4 per cent. Inscribed Stock created and issued to the bank under the authority of section 6 of the Bank of New Zealand Act, 1913. For the years 1908 to 1911, the cost-price of securities (£800,000) purchased for a reserve to meet any unexpected financial contingency was also similarly deducted from the gross debt. In 1912, however, the Government decided that as these items are not strictly sinking funds proper they should not be included in official statements of the Dominion's sinking funds, and they are now accordingly omitted. In order that the above table may show a proper comparison of the growth of the accrued sinking fund, the total net indebtedness, and the net indebtedness per head of population, the last three columns have been recast for the years 1903 to 1911, the figures for all the years shown being thus put on the same basis.
In regard to the investments of New Zealand Consols deposits in Government securities, it may be stated that the amounts so invested during the ten years 1905–6 to 1914–15 were as follows:—
| Year ended | Amount. |
|---|---|
| 31st March, | £ |
| 1906 | 359,050 |
| 1907 | 360,425 |
| 1908 | 360,575 |
| 1909 | 377,765 |
| 1910 | 308,840 |
| 1911 | 335,240 |
| 1912 | 347,180 |
| 1913 | 348,960 |
| 1914 | 348,960 |
| 1915 | 425,485 |
These sums represent the amount of the public debt held by the New Zealand Government itself for those years.
As stated above, the gross public debt for the years ended the 31st March, 1914 and 1915, includes in each case amounts raised late in the financial year for redemption of debentures falling due early in the following financial year. Were these amounts excluded, the debt at the 31st March, 1914, would have been £94,753,827, and at the 31st March, 1915, £99,822,510, giving an increase of £5,068,683. If, however, the actual indebtedness at the dates mentioned be taken, the increase for the year is only £329,483. Probably the best plan is to exclude from the indebtedness at the 31st March, 1914, the large sum (£4,976,600) raised for redemptions in 1914–15, but to include the small amount (£237,400) similarly raised at the end of 1914–15 in the total for the latter year, thus taking the gross debt at its actual amount for the purpose of comparison with back years. It has often happened that the amount of the gross debt at the end of a year has included money to be used immediately afterwards for redemption purposes, but 1913–14 is the only year in which the amount has been a large one. The increase in indebtedness during the year may therefore be taken as £5,306,083. The allocation of the increase is as set out in the following table:—
| ALLOCATION OF LOANS RAISEDDURING 1914–15. | ||
|---|---|---|
* Excess of redemptions. | ||
| (a.) Directly reproductive undertakings,— | £ | £ |
| Railways | 707,005 | |
| Telegraphs and telephones | 176,546 | |
| Lighthouses and harbours | 10,487 | |
| Tourist and health resorts | 5,039 | |
| State Coal-mines | 2,601 | |
| Water-power development | 40,000 | 941,678 |
| (b.) Investments,— | ||
| Advances to Settlers | 677,990 | |
| Advances to Workers | –29,164* | |
| Land for Settlements | 87,221 | |
| Advances to Local Authorities | 207,461 | |
| Native Land Settlement | 103,731 | |
| Opening-up Crown Lands | 51,000 | |
| Hauraki Plains Settlement | 9,000 | |
| Rangitaiki Drainage | 17,000 | |
| Guaranteed Mining Advances | 8,000 | |
| Kauri-gum Industry Advances | 14,000 | |
| Fruit-preserving Industry Advances | 11,500 | |
| Bank of New Zealand shares | 375,000 | 1,532,739 |
| (c.) Indirectly productive works,— | ||
| Roads and bridges and lands improvement | 358,653 | |
| Immigration | 20,336 | |
| Development of goldfields and coal-mines | 1,459 | 380,448 |
| (d.) Unproductive,— | ||
| Public buildings | 264,457 | |
| War of 1914–15 | 2,000,000 | |
| Defence, other than war expenditure | 11,418 | |
| Scenery-preservation | 10,000 | |
| Cost of loan flotations and conversions | 165,343 | |
| 2,451,218 | ||
| £5,306,083 | ||
It will be seen that the war of 1914–15 was responsible for an increase of £2,000,000 in the indebtedness of the Dominion up to the 31st March, 1915. The unproductive portion of the public debt, which has of recent years been decreasing in its proportion to the total, shows a considerable increase as a result.
The purposes for which loans have been raised are generally classed under the four heads shown in the preceding table, viz.:—
Directly reproductive undertakings of the State, (b.) Investments,
Indirectly productive public utilities, and
Unproductive.
In considering the increase of the public debt the financial year 1890–91 is generally selected as the basis of comparison, because that year marks the beginning of a period during which the functions of the State have been widely extended, most notably as regards financial assistance to settlers, workers, and local bodies, the repurchase of alienated lands, the working of coal-mines, and the establishment of State fire and accident insurance offices. In every department these new activities, as well as the old, have been directly successful, while the indirect benefits, though admittedly great, are incapable of measurement. A considerable portion of the annual interest on the debt, although paid out of the Consolidated Fund, does not fall upon the whole taxpaying community, the revenue derived from several of the more important undertakings being sufficient to meet the interest on the money borrowed in respect of them.
The increase of the gross public debt since the 31st March, 1891, amounts to £61,229,560. The largest item in the increase is £9,355,315 raised for advances to settlers, which represents investments by the Government bearing interest and lent on continually improving security, the principal being repaid by instalments. Other considerable items which may be considered as interest-bearing investments are those under the heads “Land for settlements,” “Native-land purchases,” “Loans to local bodies,” “Lands improvement,” “New Zealand Consols,” “Advances to workers,” “Bank of New Zealand shares,” and “Reserve Fund securities.”
| EXPENDITURE OF PUBLIC DEBT. | |||
|---|---|---|---|
| Up to 31st March, 1891. | Since 31st March, 1891. | Total to 31st March, 1915. | |
| (a.) Directly reproductive undertakings,— | £ | £ | £ |
| Railways | 14,580,000 | 14,548,309 | 29,128,309 |
| Telegraphs and telephones | 769,000 | 1,616,430 | 2,385,430 |
| Lighthouses and harbours | 484,000 | 139,458 | 623,458 |
| Tourist and health resorts | .. | 174,034 | 174,034 |
| State coal-mines | .. | 227,601 | 227,601 |
| Development of water-power | .. | 258,920 | 258,920 |
| Totals | 15,833,000 | 16,964,752 | 32,797,752 |
| (b.) Investments,— | .. | ||
| Advances to Settlers | .. | 9,355,315 | 9,355,315 |
| Advances to Workers | .. | 2,507,763 | 2,507,763 |
| Advances to Local Authorities | .. | 2,775,528 | 2,775,528 |
| Land for Settlements | .. | 7,317,314 | 7,317,314 |
| Native Land Settlement | .. | 1,033,331 | 1,033,331 |
| Guaranteed Mining Advances | .. | 23,000 | 23,000 |
| Kauri-gum Industry Advances | .. | 14,000 | 14,000 |
| Fruit-preserving Industry Advances | .. | 11,500 | 11,500 |
| Opening up Crown Lands | .. | 302,911 | 302,911 |
| Hauraki Plains Settlement | .. | 109,000 | 109,000 |
| Rangitaiki Drainage | .. | 62,000 | 62,000 |
| Purchase of Native lands | 1,546,000 | 1,169,217 | 2,715,217 |
| Loans to local bodies | 325,000 | 3,182,000 | 3,507,000 |
| Investment of New Zealand consols | .. | 475,991 | 475,991 |
| Bank of New Zealand shares | .. | 875,000 | 875,000 |
| Reserve Fund securities | .. | 800,000 | 800,000 |
| Totals | 1,871,000 | 30,013,870 | 31,884,870 |
| (c.) Indirectly productive,— | |||
| Roads, bridges, and land-improvement | 5,106,000 | 3,327,987 | 8,433,987 |
| Immigration | 2,459,000 | 83,214 | 2,542,214 |
| Development of goldfields and coalmines | 571,000 | 327,451 | 898,451 |
| Totals | 8,136,000 | 3,738,652 | 11,874,652 |
| (d.) Unproductive,— | |||
| Public buildings | 1,800,000 | 4,908,013 | 6,708,013 |
| Maori war | 2,357,000 | 2,357,000 | |
| War of 1914–15 | .. | 2,000,000 | 2,000,000 |
| Defence | 1,638,000 | 2,093,429 | 3,731,429 |
| Scenery-preservation | .. | 84,000 | 84,000 |
| Deficiencies in revenue, charges, and expenses of raising loans, increase by conversion, &c., provincial liabilities, and miscellaneous | 7,195,350 | 1,426,844 | 8,622,194 |
| Totals | 12,990,350 | 10,512,286 | 23,502,636 |
| Grand totals | 38,830,350 | 61,229,560 | 100,059,910 |
Only a portion of the expenditure of the Old Provincial Councils on railways became public debt. The estimated total expenditure on railway-construction by the Provincial and General Governments to the 31st March, 1915, was £36,133,155, which includes £1,104,281 spent by the Provincial Councils, £82,259 being for the Dunedin and Port Chalmers line.
In the table given above any unexpended balances have been allocated to those purposes for which the loans were raised or to those purposes on which the money will be most probably expended. The proportion per cent. of each class to the total debt is as follows:—
| Class. | Percentage of Indebtedness. | ||
|---|---|---|---|
| Prior to 31st March, 1891. | Since 31st March, 1891. | Total. | |
| (a.) Reproductive expenditure | 40.78 | 27.71 | 32.78 |
| (b.) Investments | 4.82 | 49.02 | 31.86 |
| (c.) Indirectly productive expenditure | 20.95 | 6.10 | 11.87 |
| (d.) Unproductive expenditure | 33.45 | 17.17 | 23.49 |
| Totals | 100.00 | 100.00 | 100.00 |
The directly interest-earning portion amounts to 64.64 per cent. of the total debt, and is represented by assets which are of much greater value than the amount of borrowed money spent upon them, a considerable amount of surplus ordinary revenue having been expended from time to time on railways and other public services, as well as other moneys of the nature of special receipts.
The proportion of the debt allocated to directly interest-earning investments has greatly increased since 1890–91, being 76.73 per cent. of the total indebtedness incurred since that year as against 45.60 per cent. before the 31st March, 1891.
The £2,000,000 borrowed during last year on account of the extraordinary expenses of the war has had the effect of greatly increasing the proportion of unproductive expenditure. The proportion of debt incurred for unproductive purposes to the total debt incurred during the twenty-three years ended the 31st March, 1914, was 14.41 per cent., but the addition of the 1914–15 figures, which include the £2,000,000 referred to, has raised the proportion to 17.17 per cent. Even now the unproductive expenditure for the period since 1891 is, proportionately to the total, much less than for the period prior to 1891.
The whole of the public debt as stated in the foregoing tables comprises inscribed stocks and debentures with varying periods of currency. Treasury bills issued in anticipation of revenue have not been included in the total. The following table shows the relative increase of the different classes of securities during the past ten financial years:—
| Year ended 31st March. | Inscribed Stock. | Debentures. | Total. | Treasury Hills outstanding, not previously included. |
|---|---|---|---|---|
| £ | £ | £ | £ | |
| 1906 | 47,306,029 | 14,885,011 | 62,191,040 | 700,000 |
| 1907 | 48,235,514 | 15,943,526 | 64,179,040 | 550,000 |
| 1908 | 48,869,405 | 17,584,492 | 66,453,897 | 400,000 |
| 1909 | 50,109,257 | 20,829,277 | 70,938,534 | 250,000 |
| 1910 | 51,364,868 | 23,525,777 | 74,890,645 | 100,000 |
| 1911 | 54,832,570 | 26,245,552 | 81,078,122 | .. |
| 1912 | 55,626,235 | 28,727,678 | 84,353,913 | .. |
| 1913 | 59,960,105 | 30,100,658 | 90,060,763 | .. |
| 1914 | 66,076,250 | 33,654,177 | 99,730,427 | .. |
| 1915 | 68,008,389 | 32,051,521 | 100,059,910 | .. |
Until comparatively recent years the large proportion of the productive power of the Dominion diverted to the construction of railways, roads, &c., and engaged in the preparation of land for farming, necessitated the borrowing of capital from abroad; but of late the accumulation of savings, chiefly of small sums deposited in the savings-banks, has enabled the Government to raise considerable amounts from time to time locally. Australian investors greatly increased their investments in New Zealand securities during the five years ended the 31st March, 1911. The following table shows the amount raised in London, Australia, and New Zealand for each of the past ten years:—
| PUBLIC DEBT, WHERE RAISED. | ||||||
|---|---|---|---|---|---|---|
| Year ended 31st March. | Inscribed Stock. | Debentrues. | Total. | |||
| London. | New Zealand. | London. | Australia. | New Zealand | ||
| £ | £ | £ | £ | £ | £ | |
| 1906 | 46,829,178 | 476,851 | 4,081,814 | 2,586,450 | 8,216,747 | 62,191,040 |
| 1907 | 47,757,279 | 478,235 | 3,830,514 | 3,087,850 | 9,025,162 | 64,179,040 |
| 1908 | 48,390,956 | 478,449 | 2,767,714 | 3,554,700 | 11,262,078 | 66,453,897 |
| 1909 | 49,630,684 | 478,573 | 5,000,414 | 3,869,800 | 11,959,063 | 70,938,531 |
| 1910 | 50,954,744 | 410,124 | 6,778,914 | 4,113,985 | 12,632,878 | 74,890,645 |
| 1911 | 54,370,404 | 462,166 | 7,851,414 | 4,213,985 | 14,180,153 | 81,078,122 |
| 1912 | 55,152,124 | 474,111 | 8,852,750 | 4,213,985 | 15,660,943 | 84,353,913 |
| 1913 | 59,484,214 | 475,891 | 9,445,250 | 4,213,985 | 16,441,423 | 90,060,763 |
| 1914 | 65,600,259 | 475,991 | 13,024,050 | 4,286,800 | 16,343,327 | 99,730,427 |
| 1915 | 67,532,398 | 475,991 | 8,877,603 | 3,979,000 | 19,194,918 | 100,059,910 |
The percentage of the total debt raised in each of the markets in 1904–5 and 1914–15 was,—
| 1904–5. | 1914–15. | |
|---|---|---|
| Market. | Per Cent. | Per Cent. |
| London | 82.42 | 76.36 |
| New Zealand | 15.56 | 19.66 |
| Australia | 2.02 | 3.98 |
| 100.00 | 100.00 |
A summary of the loans outstanding on the 31st March, 1915, showing the amounts falling due in each financial year, is given.
| Due Date: Year ending 31st March. | Amount. £ |
|---|---|
*Overdue. | |
| 1915 | 713,700* |
| 1916 | 9,443,874 |
| 1917 | 1,885,240 |
| 1918 | 3,406,556 |
| 1919 | 1,811,915 |
| 1920 | 3,825,445 |
| 1921 | 1,448,000 |
| 1922 | 2,037,450 |
| 1923 | 1,220,450 |
| 1924 | 2,280,800 |
| 1925 | 552,991 |
| 1930 | 29,900,402 |
| 1940 | 17,568,932 |
| 1946 | 9,659,980 |
| 1948 | 895,000 |
| 1949 | 1,423,600 |
| 1950 | 1,106,500 |
| 1963 | 10,879,075 |
| £100,059,910 | |
The amounts that have matured or will mature during the current financial year, with their due dates, are as follows:—
| £ | Due Date. |
|---|---|
* Overdue. | |
| 2,500* | 15th July, 1914. |
| 1,200* | 1st Feb., 1915. |
| 710,000* | 31st March, ” |
| 237,400 | 1st April, ” |
| 237,400 | 19th ” ” |
| 180,476 | 1st May, ” |
| 130,000 | 1st June, ” |
| 80,000 | 5th ” ” |
| 190,000 | 30th ” ” |
| 200,000 | 1st July, ” |
| 8,000 | 22nd ” ” |
| 94,200 | 1st Aug., ” |
| 400,000 | 30th Sept., 1915. |
| 300,000 | 16th Dec., ” |
| 400,000 | 28th ” ” |
| 100,000 | 31st ” ” |
| 1,490,725 | 1st Jan., 1916. |
| 300,000 | 16th ” ” |
| 369,620 | 1st Feb., ” |
| 300,000 | 16th Feb., ” |
| 995,000 | 1st March, ” |
| 3,431,053 | 31st ” ” |
| £10,157,574 | |
Of the total amount of public debt outstanding at the end of March, 1915, fifty-four millions bore interest at the rate of 4 per cent., thirty millions at 3½ per cent., and ten millions at 3 per cent. The following are the rates of interest payable on the whole public debt:—
| Rates of Interest. | Amount at each Rate. |
|---|---|
| £ | |
| 6 per cent. | 12,200 |
| 5 per cent. | 2,500 |
| 4½ per cent. | 203,000 |
| 4¼ per cent. | 147,100 |
| 4 per cent. | 54,217,318 |
| 3¾ per cent. | 3,667,566 |
| 313/19 per cent. | 2,000,000 |
| 3½ per cent. | 29,773,120 |
| 3 per cent. | 10,037,106 |
| Total | £100,059,910 |
The total amount of interest payable to bondholders on the full amount of the public debt as quoted above is £3,739,327, which gives an average rate of £3 14s. 9d. per £100. On the total public debt outstanding on the 31st March, 1891, the average interest charge was £4 10s. 3d. per £100. During the period 1890–91 to 1914–15, therefore, the average rate is found to have declined by 13s. 6d. per £100. There was, however, an increase of 4d. per £100 in 1914–15 as compared with 1913–14.
If the interest payable on that part of the debt which matured on the 31st March, 1915, be excluded, the interest charge is found to be £3,731,602.
The foregoing refers to interest payable to bondholders only, and has nothing to do with sinking-fund requirements, which are included in the whole annual charge of the public debt.
The actual payments during the past twenty years for interest and sinking fund out of the Consolidated Fund are shown in the following table, together with the rate per head of population and the percentage of ordinary and territorial revenue absorbed by the public-debt charges:—
| Year ended 31st March. | Amounts actually paid for Interest and Sinking Fund out of the Consolidated Fund. | Rate per head of Mean Population. | Percentage of Revenue absorbed by Public debt Charges. | ||||||
|---|---|---|---|---|---|---|---|---|---|
| Public Debt. | Treasury Bills. | Total. | |||||||
| Interest. | Sinking Fund. | Total. | Interest. | ||||||
| £ | £ | £ | £ | £ | £ | s. | d. | ||
| 1896 | 1,602,933 | 41,183 | 1,644,116 | 39,659 | 1,683,775 | 2 | 8 | 4 | 36.96 |
| 1897 | 1,630,577 | 41,858 | 1,672,435 | 37,034 | 1,709,469 | 2 | 8 | 2 | 35.62 |
| 1898 | 1,668,697 | 43,380 | 1,712,077 | 29,336 | 1,741,413 | 2 | 8 | 1 | 34.28 |
| 1899 | 1,689,749 | 44,651 | 1,734,400 | 33,068 | 1,767,468 | 2 | 7 | 10 | 33.61 |
| 1900 | 1,674,618 | 46,073 | 1,720,691 | 28,703 | 1,749,394 | 2 | 6 | 6 | 31.07 |
| 1901 | 1,671,552 | 46,364 | 1,717,916 | 27,700 | 1,745,616 | 2 | 5 | 6 | 29.83 |
| 1902 | 1,722,819 | 47,724 | 1,770,543 | 33,396 | 1,803,939 | 2 | 6 | 2 | 29.80 |
| 1903 | 1,817,701 | 50,464 | 1,868,165 | 32,814 | 1,900,979 | 2 | 7 | 5 | 29.77 |
| 1904 | 1,875,376 | 53,408 | 1,928,784 | 29,179 | 1,957,963 | 2 | 7 | 4 | 27.89 |
| 1905 | 1,914,296 | 54,933 | 1,969,229 | 24,500 | 1,993,729 | 2 | 6 | 10 | 27.38 |
| 1906 | 2,006,537 | 56,167 | 2,062,704 | 24,500 | 2,087,204 | 2 | 7 | 7 | 27.52 |
| 1907 | 2,048,990 | 97,351 | 2,146,341 | 25,751 | 2,172,092 | 2 | 8 | 2 | 25.86 |
| 1908 | 2,085,018 | 81,842 | 2,166,860 | 20,559 | 2,187,419 | 2 | 7 | 3 | 24.15 |
| 1909 | 2,149,739 | 91,438 | 2,241,177 | 17,188 | 2,258,365 | 2 | 7 | 5 | 25.09 |
| 1910 | 2,282,182 | 95,124 | 2,377,306 | 20,156 | 2,397,462 | 2 | 9 | 0 | 25.95 |
| 1911 | 2,381,000 | 54,104 | 2,435,104 | 23,348 | 2,458,452 | 2 | 9 | 3 | 23.87 |
| 1912 | 2,446,493 | 198,388 | 2,644,881 | 11,459 | 2,656,340 | 2 | 12 | 1 | 24.02 |
| 1913 | 2,506,025 | 202,757 | 2,708,782 | 8,231 | 2,717,013 | 2 | 11 | 11 | 23.15 |
| 1914 | 2,649,796 | 221,726 | 2,871,512 | 16,468 | 2,887,980 | 2 | 13 | 8 | 23.61 |
| 1915 | 2,788,513 | 247,570 | 3,036,083 | 35,365 | 3,071,448 | 2 | 16 | 1 | 24.67 |
The above amounts shown as interest and sinking fund do not comprise the whole of the interest and sinking fund paid in respect of moneys raised by way of loans. For loans raised for the purposes of State advances to settlers, workers, local authorities, &c., and under the Land for Settlements Acts, the interest, although made a charge upon the Consolidated Fund, is recovered from the receipts derived from the leasing of the lands or from instalments paid by borrowers. Other loan-money coming within the same category is that raised for Native-land settlement, the purchase of the Cheviot Estate, the Rangitaiki land drainage, the Hauraki Plains settlement, and the Waihou and Ohinemuri Rivers improvement.
The amount of interest charged and recovered during last year in respect of the loan-money raised for the purposes stated was £846,570. The details are as follows:—
| £ | |
|---|---|
| Land for settlements | 287,225 |
| Advances to settlers | 323,888 |
| Advances to workers | 106,189 |
| Advances to local authorities | 101,858 |
| Mining advances | 82 |
| Native-land settlement | 19,735 |
| Cheviot Estate | 4,433 |
| Waihou and Ohinemuri Rivers improvement | 2,389 |
| Rangitaiki land drainage | 418 |
| Hauraki Plains settlement | 353 |
| £846,570 |
The amount actually paid for interest and sinking fund out of the Consolidated Fund during 1914–15 was £183,468 more than that for the previous year, and the rate of charge per head of population shows an increase of 2s. 5d.
From time to time in the earlier financial history of the Dominion sinking funds were created in respect of various loans. These loans have now all matured and been paid off with the exception of two Email amounts. One of these is a sum of £12,200, representing part of a loan raised under the Canterbury Loan Ordinance, 1862. This loan matures in 1916, and is almost doubly covered by a sinking fund amounting at the 31st March, 1915, to £23,149, of which £19,206 was invested in securities of the New Zealand Government and £3,870 in debentures of local governing bodies, £73 being held as a cash balance. The other loan referred to is an item of £2,500, which matured on the 15th July, 1914, as part of a loan of £266,300 raised under the New Zealand Loan Act, 1863, but which has not yet been paid off. It is covered by a sinking fund of £2,575, represented by deposits at call in the London County and Westminster Bank.
More recently provision was made for sinking funds for the repayment of loans raised for local bodies and for war and defence loans. A sinking fund was also provided for in the case of the loans raised under the Naval Defence Act, 1909. All of these funds are invested with the Public Trustee.
Another class of sinking fund which has come into existence in later years may more correctly be termed an “internal reserve fund,” because the accummulations are immediately converted into capital, although kept apart in the accounts. Part of the surplus revenue of the various accounts of the State Advances Department, equal to 1 per cent. of the loan liabilities at the end of each financial year, is set apart as a sinking fund. Some of these accounts have now been transferred from the State Advances Account, but the contributions to the various sinking funds are still made.
The whole of the public debt for which no special sinking fund exists has now been provided for by the Public Debt Extinction Act, 1910, referred to in detail below.
On the 31st March, 1915, the accrued sinking funds amounted to £3,178,055, made up as follows:—
| £ | |
|---|---|
| Canterbury Loan Ordinance, 1862 | 23,150 |
| New Zealand Loan Act, 1863 | 2,575 |
| Government loans to local bodies | 799,601 |
| War and defence loans | 192,691 |
| Naval Defence Act, 1909 | 256,471 |
| State advances loans | 646,760 |
| Land for settlements | 584,800 |
| Native-land settlement | 11,977 |
| Guaranteed mining advances | 417 |
| Hauraki Plains settlement | 2,176 |
| Opening up Crown lands for settlement | 3,417 |
| Rangitaiki land drainage | 904 |
| Public Debt Extinction Act, 1910 | 653,116 |
| £3,178,055 |
A scheme making provision to repay the existing public debt, with application to future borrowings, was embodied in the Public Debt Extinction Act, 1910. This Act provides for the setting-apart each year, on the certificate of the Controller and Auditor-General, out of the Consolidated Fund an amount equal to the sum which, if invested at compound interest at 4 per cent. per annum for seventy-five years, would repay the whole of the public debt as at the preceding 31st March. In this manner, for every loan raised in the future an additional proportional amount will be contributed to the fund to enable such new loan to be extinguished at the expiry of seventy-five years from the date of issue.
After the 31st March, 1915, the interest, instead of being calculated at 4 per cent., is to be the actual average net interest earned by the funds invested under the Act during the previous three years.
The annual payment will be increased—(a) for every new loan, by an amount needed to extinguish it in seventy-five years; (b) in case the fund at any time fails to earn 4 per cent., by an amount which will supply the deficiency.
The fund is administered by a Board constituted under the Act, and must be invested in loans to settlers, to workers, and to local authorities. It is expressly forbidden to invest any of the moneys in New Zealand Government securities. If at any time the funds cannot be invested as above stated the Board may purchase at or below par, and cancel, any New Zealand Government stock or debentures charged upon the consolidated revenue. In order to preserve the continuity of the fund it is provided that in the event of any stock or debentures being redeemed before the expiry of the seventy-five years there shall be paid annually out of the Consolidated Fund into the Sinking Fund Account a sum sufficient to compensate for the loss of earnings of the money so expended. There is also a provision that if the earnings of the fund should fall below 4 per cent. any deficiency must be made good out of the Consolidated Fund Account.
The most prominent features of the scheme are the mode of investment, which is intended to prevent any improper use being made of the accumulations; the provision for preserving the continuity of the fund by the adjustment of the annual contributions; and the automatic action of the fund whereby the total debt will be extinguished in seventy-five years from any date on which the liability exists.
No further payments are to be made to the Public Trustee on account of the sinking funds of the war and defence and local bodies' loans, but the accumulated capital of these funds remains invested with him as at the date of the passing of the Act, the interest being paid by him to the Consolidated Fund each year.
The contributions to the fund to the 31st March, 1915, amounted to £615,204, interest, &c., bringing the amount at credit of the fund to £653,116. The payments to the fund in each of the four years which have elapsed since the passing of the Act were;—
| Year ended 31st March, | £ |
|---|---|
| 1912 | 144,885 |
| 1913 | 149,343 |
| 1914 | 151,572 |
| 1915 | 169,404 |
The amount required to be set aside during the financial year 1915–16 is £161,870.
The decrease in the amount to be set aside in 1915–16, as compared with 1914–15, is due to the fact that in terms of section 10 of the Act the interest used in the calculation for 1915–16 has been taken as the actual average net rate of interest earned during the preceding three years (£4 4s. 3d. per cent.), as against 4 per cent. in previous years.
The sum of £181,237 was at the 31st March last invested in mortgages to settlers and £210,785 to local authorities. The former amount bears interest at 5 per cent., reducible to 4½ per cent. if instalments are paid within fourteen days of due date. Of the £210,785 advanced to local authorities, £97,426 bears interest at 4½ per cent., and £113,359 at 4½ per cent.
The highest and lowest London prices for the New Zealand 4, 3½, and 3 per cent. stock, taken over a range of twenty years, are quoted,—
| QUOTATIONS, NEW ZEALAND STOCK. | ||||||||
|---|---|---|---|---|---|---|---|---|
| 4-per-cents. (1943–63.) | 4-per-cents. (1929.) | 3½-per-cents. (1940.) | 3-per-cents. (1945.) | |||||
| Year. | Highest. | Lowest. | Highest. | Lowest. | Highest. | Lowest. | Highest. | Lowest |
| 1895 | 113½ | 105⅝ | 107½ | 100 | 95¾ | 91 | ||
| 1896 | 118¼ | 106½ | 110⅜ | 101½ | 103½ | 90 | ||
| 1897 | 117 | 112⅜ | 111 | 104¾ | 102 | 99½ | ||
| 1898 | 116⅞ | 108 | 109⅞ | 103 | 101½ | 96½ | ||
| 1899 | 116½ | 105½ | 109 | 102 | 99¼ | 94¼ | ||
| 1900 | 113¼ | 109 | 106¾ | 103⅜ | 98½ | 95¼ | ||
| 1901 | 115⅜ | 110¾ | 109¾ | 104 1/8 | 99½ | 93 1/8 | ||
| 1902 | 113¼ | 109 | 109½ | 102 1/8 | 97 | 93⅝ | ||
| 1903 | 110 1/8 | 105 | 104¾ | 99½ | 96 | 88 | ||
| 1904 | 107½ | 104½ | 101½ | 96¾ | 90 | 86¼ | ||
| 1905 | 110½ | 105¼ | 100 1/8 | 97⅝ | 89⅞ | 89½ | ||
| 1906 | 110¾ | 104⅝ | 102½ | 98⅜ | 91¼ | 87¼ | ||
| 1907 | 108¾ | 103¼ | 101 | 98 | 89¾ | 84 | ||
| 1908 | 109⅝ | 105 1/8 | 101 | 98¼ | 90½ | 85¾ | ||
| 1909 | 108⅜ | 104¾ | 99¾ | 97⅜ | 88⅜ | 85⅝ | ||
| 1910 | 106¾ | 103 | 99 | 94¼ | 88⅜ | 84¾ | ||
| 1911 | 106¾ | 102 1/8 | 98½ | 95¼ | 87¾ | 85 | ||
| 1912 | 105 | 100 | 97¾ | 90⅜ | 87¾ | 79½ | ||
| 1913 | 101 | 96⅜ | 102½ | 95½ | 91⅞ | 87¾ | 80¾ | 76¼ |
| 1914* | 100⅜ | 96¼ | 103 1/8 | 98 | 92¾ | 87 | 83½ | 77 |
| *January to July. | ||||||||
The following figures show the gross public debt of each State of the Australian Commonwealth on the 30th June, 1914, and of New Zealand on the 31st March, 1915:—
| State. | Fixed Debt. | Floating Debt. | Total Public Debt. | Amount per Head of Population. | |||
|---|---|---|---|---|---|---|---|
| Debentures. | Inscribed Stock. | ||||||
*There was also a Commonwealth public debt amounting to £19,182,333, or £3 17s. 11d. per head. | |||||||
| £ | £ | £ | £ | £ | a. | d. | |
| New South Wales | 6,636,450 | 106,808,581 | 3,250,000 | 116,695,031 | 62 | 17 | 9 |
| Victoria | 13,922,007 | 45,475,359 | 6,733,360 | 66,130,726 | 46 | 10 | 1 |
| Queensland | 14,575,989 | 38,822,067 | 1,125,450 | 54,523,506 | 80 | 6 | 4 |
| South Australia | 498,266 | 29,909,934 | 3,156,132 | 33,564,332 | 76 | 12 | 0 |
| Western Australia | 372,700 | 33,614,411 | 433,070 | 34,420,181 | 106 | 5 | 0 |
| Tasmania | 1,154,733 | 11,103,779 | 6,500 | 12,265,012 | 62 | 6 | 9 |
| Total, Australian States* | 37,160,145 | 265,734,131 | 14,704,512 | 317,598,788 | 64 | 10 | 5 |
| New Zealand | 32,051,521 | 68,008,389 | .. | 100,059,910 | 90 | 18 | 4 |
Each of the Australian States and New Zealand had accumulated sinking funds to set against the gross debt shown above, making in some cases an appreciable difference in the amount per head. The net indebtedness per head of population is as follows:—
| £ | s. | d. | |
|---|---|---|---|
| New South Wales | 62 | 13 | 9 |
| Victoria | 45 | 9 | 10 |
| Queensland | 80 | 3 | 4 |
| South Australia | 72 | 18 | 2 |
| Western Australia | 94 | 17 | 2 |
| Tasmania | 59 | 10 | 5 |
| Total, Australian States | 62 | 18 | 11 |
| New Zealand | 87 | 16 | 3 |
New Zealand has thus a greater net liability per head of population than any of the Australian States, with the exception of Western Australia.
Table of Contents
FOR purposes of local government New Zealand is divided into counties and boroughs, the counties being, for administrative purposes, in some cases subdivided into road and town districts. Certain of the latter, having a population of over five hundred, possess powers independent of county control.
Counties are constituted by special Act, but two or more existing counties may, by Proclamation, be united to form one county. Boroughs are constituted by Proclamation, and must possess a population of not less than one thousand, but must not exceed in area more than nine square miles, nor must any point be distant farther than six miles from another. Any locality not exceeding two square miles in area, outside a borough, and wherein there are not less than fifty householders, may be proclaimed a town district. A road district may comprise any portion of the area of the county within which it lies, and may be created by special order of the council of such county. Harbour Boards are formed by special Act, and in some cases possess rating-powers over areas already included within counties and boroughs. Special districts, with limited powers, may be constituted for specific purposes such as river protection, drainage, water-supply, &c., within the areas wherein such services are required.
Although the boroughs, of which there were 116 on the 31st March, 1914, lie geographically within the counties, yet by the law they are not considered as part of thorn. On the 31st March, 1914, the counties numbered 125. The number is increased from time to time as need is found by the subdivision of existing districts. In the year 1878 there were only 63 counties. There were 130 road districts (one without a Board) in existence in March, 1914, and 60 town districts. One of these latter is the special Town District of Rotorua, the affairs of which are administered by officers of the General Government, and another the Native Township of Otorohanga. Besides the above there were 39 river protective districts (excluding Inch-Clutha, in Bruce County, which is also a road district), 3 city and suburban drainage districts (Christchurch, Dunedin, and Auckland), 8 water-supply districts (5 without Boards), 47 land drainage districts under the Land Drainage Act (2 without Boards), and 2 tramway districts. The Harbour Boards numbered 35, excluding Coromandel, Kawhia, Tokomaru Bay, Port Robinson, Kaikoura, Fortrose, and Half-moon Bay, for which the County Councils of Coromandel, Kawhia, Waiapu, Cheviot, Kaikoura, Southland, and Stewart island act as the Harbour Boards; also New River and Port Molyneux, for which the Invercargill Borough Council and the Clutha Paver Board act as Harbour Boards.
The receipts of local governing bodies are made up of revenue proper (which includes rates, licenses, rents, fees, &c., and payments from the General Government), and receipts which cannot properly be termed revenue (mainly loans).
Local governing bodies levied rates in the financial year 1913–14 to the amount of £2,005,638, of which £1,359,776 consisted of general rates, and £645,862 special and separate rates. The sum of £87,276 was raised by licenses, and £94,620 by other taxes, making £2 187,534 altogether, which sum is equivalent to £2 0s. 8d. per head of the mean European population. In the year 1912–13 the local taxation was £1 17s. 7d. per head, or 3s. 1d. less than in 1913–14.
Revenue derived from rates increased from £551,412 in 1893–94 to £2,005,638 in 1913–14. Revenue from Government has increased in the same period from £134,271 to £234,219. Receipts other than “revenue” were £623,038 in 1893–94, and £2,411,575 in 1913–14; but these figures vary from year to year according to circumstances, such as large operations by way of construction of works, for which money has to be specially raised.
The receipts of local governing bodies, divided into the various groups shown above, are given for each of the past twenty years.
| Financial Year. | Revenue from | Receipts not Revenue. | Total Receipts. | |||
|---|---|---|---|---|---|---|
| Rates. | Licenses, Fees, Bents, and other Sources. | Government. | Total Revenue. | |||
| £ | £ | £ | £ | £ | £ | |
| 1894–95 | 581,868 | 545,629 | 138,228 | 1,265,725 | 328,798 | 1,594,523 |
| 1895–96 | 592,903 | 581,966 | 156,180 | 1,331,049 | 269,145 | 1,600,194 |
| 1896–97 | 598,526 | 586,599 | 178,448 | 1,363,573 | 246,919 | 1,610,492 |
| 1897–98 | 644,552 | 608,436 | 182,166 | 1,435,154 | 304,645 | 1,739,799 |
| 1898–99 | 685,769 | 642,289 | 178,438 | 1,506,496 | 385,368 | 1,891,864 |
| 1899–1900 | 714,151 | 695,988 | 152,044 | 1,562,183 | 372,028 | 1,934,211 |
| 1900–1 | 734,023 | 751,046 | 168,785 | 1,653,854 | 825,039 | 2,478,893 |
| 1901–2 | 800,471 | 848,983 | 170,041 | 1,819,495 | 775,432 | 2,594,927 |
| 1902–3 | 846,716 | 897,328 | 156,254 | 1,900,298 | 966,087 | 2,866,385 |
| 1903–4 | 950,150 | 1,029,550 | 176,519 | 2,156,219 | 1,142,595 | 3,298,814 |
| 1904–5 | 1,019,431 | 1,088,587 | 166,635 | 2,274,653 | 1,350,631 | 3,625,284 |
| 1905–6 | 1,151,219 | 1,223,138 | 169,010 | 2,543,367 | 1,326,597 | 3,869,964 |
| 1906–7 | 1,233,049 | 1,386,459 | 192,932 | 2,812,440 | 1,227,473 | 4,039,913 |
| 1907–8 | 1,356,257 | 1,548,479 | 202,186 | 3,106,922 | 1,410,994 | 4,517,916 |
| 1908–9 | 1,390,698 | 1,710,712 | 223,410 | 3,324,820 | 1,440,746 | 4,765,566 |
| 1909–10 | 1,526,307 | 1,738,410 | 195,624 | 3,460,341. | 2,362,171 | 5,822,512 |
| 1910–11 | 1,592,601 | 1,941,655 | 230,070 | 3,764,326 | 1,776,958 | 5,541,284 |
| 1911–12 | 1,677,877 | 2,075,126 | 223,808 | 3,976,811 | 2,425,258 | 6,402,069 |
| 1912–13 | 1,799,299 | 2,306,424 | 225,262 | 4,330,985 | 2,383,123 | 6,714,108 |
| 1913–14 | 2,005,638 | 2,484,893 | 234,219 | 4,724,750 | 2,411,575 | 7,136,325 |
The figures given in this and following tables are for the year ended 31st March, except in the case of certain Harbour Boards whose own financial year is taken in each case. The financial year of the Wellington Harbour Board ends on the 30th September (six months before the usual financial year); for the Coromandel, Fortrose, Half-moon Bay and Horseshoe Bay, Kaikoura, Kawhia, New River, Port Molyneux, Riverton, Tokomaru Bay, and Whangateau-Omaha Harbour Boards the year ends on the 31st March, but in all other cases the Harbour Board year ends on the 31st December, or three months previous to the financial year.
A summary of receipts for the year 1913–14 is given below. The total revenue of the local bodies for the financial year was £4,724,750, and they further received a sum of £2,411,575 which could not properly be termed “revenue,” making altogether a grind total of receipts amounting to £7,136,325. The rates formed 42.45 per cent. of the revenue proper; licenses, rents, and other sources yielded 52.51 per cent.; and 4.96 per cent. was granted by the General Government. Payments by County Councils to Road Boards constitute the remaining 0.08 per cent.
While the revenue proper of the counties amounted to £1,018,450, of which £754,785 was raised by way of rates, the Road Boards' revenue was only £134,342, of which £98,982 represented the result of their rating. The boroughs had the far larger revenue of £2,334,009, including £974,181 of rates, and their receipts under the heading of licenses, rents, and other sources amounted to the considerable sum of £1,319,370.
| LOCAL GOVERNING BODIES.—RECEIPTS, 1913–14. | ||||||
|---|---|---|---|---|---|---|
| Revenue from | Revenue from | Receipts not Revenue. | Total Receipts. | |||
| Rates. | Licenses, Rents, &c. | Government. | county. | |||
| £ | £ | £ | £ | £ | £ | |
| Counties | 754,785 | 91,184 | 172,481 | … | 440,853 | 1,459,303 |
| Boroughs | 974,181 | 1,319,370 | 40,458 | … | 1,097,052 | 3,431,061 |
| Town districts | 33,110 | 14,695 | 3,500 | … | 78,005 | 129,310 |
| Native township | 348 | 89 | … | … | 221 | 658 |
| Road districts | 98,982 | 14,041 | 17,442 | 3,877 | 83,912 | 218,254 |
| River districts | 13,308 | 8,951 | 246 | … | 5,586 | 28,091 |
| Land drains-go districts | 18,707 | 961 | 5 | … | 19,328 | 39,001 |
| Water-supply districts | 6,545 | 930 | … | … | 636 | 8,111 |
| Tramway districts | 3,494 | 141,743 | … | … | 382 | 145,619 |
| City and suburban drainage districts | 65,081 | 2,705 | 87 | … | 108,678 | 176,551 |
| Harbour districts | 37,097 | 886,347 | … | … | 576,922 | 1,500,366 |
| Totals | 2,005,638 | 2,481,016 | 234,219 | 3,877 | 2,411,575 | 7,136,325 |
As stated above, rates contributed in 1913–14 the sum of £2,005,638 to the revenue of local governing bodies. General rates levied brought in £1,359,777, and special and separate rates £645,862. Of the latter, £486,447 was received by boroughs, and £106,320 by counties. The whole of the rates in harbour and tramway districts were general rates, while all those collected by the Boards of water-supply districts came under the heading of “special and separate.”
A table is given showing revenue collected by way of “general” and “special and separate” rates in each of the past ten years. Throughout the period the proportions have remained fairly constant, general rates bringing in a little more than two-thirds of the total revenue from rates.
| RATES LEVIEDBY LOCAL GOVERNING BODIES. 1904–5 TO 1913–14. | |||
|---|---|---|---|
| Financial Year. | General. | Special and Separate. | Total. |
| £ | £ | £ | |
| 1904–5 | 704,315 | 315,116 | 1,019,431 |
| 1905–6 | 817,442 | 333,777 | 1,151,219 |
| 1906–7 | 889,712 | 343,337 | 1,233,049 |
| 1907–8 | 949,139 | 407,118 | 1,356,257 |
| 1908–9 | 970,225 | 420,473 | 1,390,698 |
| 1909–10 | 1,058,447 | 467,860 | 1,526,307 |
| 1910–11 | 1,118,112 | 474,489 | 1,592,601 |
| 1911–12 | 1,156,718 | 521,159 | 1,677,877 |
| 1912–13 | 1,252,717 | 546,582 | 1,799,299 |
| 1913–14 | 1,359,776 | 645,862 | 2,005,638 |
Separate rates are of two classes—“general” and “particular.” General separate rates are levied for the construction, maintenance, &c., of any public work, for the acquisition of land or buildings, or for engaging in any undertaking for the benefit of whole or part of a local district. Particular separate rates are levied in respect of water-supply, lighting, sanitation, and of library. Special rates are those levied as security for the repayment loans.
Full particulars concerning the rating-powers of local bodies is given in the 1914 issue of the Year-book, together with information concerning the system of rating on unimproved value. Local districts in which a poll on the question of rating on unimproved value has been taken since the 31st March, 1914, are as shown below. The result of all polls to that date are given on pages 876–79 of the Year-book for 1914.
| Local District. | Date of Poll. | Result of Poll. | Votes recorded | ||
|---|---|---|---|---|---|
| For. | Against | Informal. | |||
* For reversion to system of rating on capital value. | |||||
| Christchurch City* | 4 Mar., 1915 | Rating on U.V. remains | 1,914 | 2,086 | .. |
| Featherston County | 16 Feb., 1915 | Carried | 315 | 164 | 2 |
| Mangapapa Town District | 13 Oct., 1915 | Rejected | 109 | 164 | 14 |
| Onehunga Borough | 9 Mar., 1915 | Carried | 563 | 391 | 7 |
| Otorohanga Native Township | 30 Oct., 1914 | Carried | 43 | 5 | |
| Whangarei County | 11 Nov., 1914 | Carried | 736 | 236 | 22 |
Rates are not the only form of local taxation. Local authorities derive a certain amount of revenue from publicans' licenses, auctioneers' and hawkers' licenses, abattoir fees, dog-taxes, pound-taxes, tolls, &c. Sources of revenue not classed as taxation are—Rents; fines and penalties; market dues; sales of material; sale of light and power from gasworks and electric-supply works; tramway receipts; interest on deposits; wharf dues, &c.
Revenue received from the Government comprise—Rates on Crown and Native lands; timber and Max royalties; goldfields revenue and gold duty; fees and fines; subsidy on rates; one-third of receipts from lands sold on deferred payment and from perpetual leases; one-fourth of rents from small grazing-runs; other, in addition there are special grants from the General Government for various local works of a public or semi-public character. These are not considered revenue, and are included with “Receipts not revenue.”
A further class of receipts from Government is provided by loans under the various Loans to Local Bodies' Acts and from the New Zealand State Advances Office.
A statement of all receipts by controlling bodies of local districts from the Government during the financial year 1913–14 is given in the next table.
| LOCAL GOVERNING BODIES.—RECEIPTS FROM GOVERNMENT, 1913–14. | ||||||||||||||||||||||||||||||
|---|---|---|---|---|---|---|---|---|---|---|---|---|---|---|---|---|---|---|---|---|---|---|---|---|---|---|---|---|---|---|
| Counties. | Boroughs. | Town Boards. | Road Boards. | River Boards (excluding Inch-Clutha, also Road Board). | Land Drainage Boards. | Harbour Boards. | City and Sub-urban Drainage Boards. | Water-supply Boards. | Totals. | |||||||||||||||||||||
| £ | s. | d. | £ | s. | d. | £ | s. | d. | £ | s. | d. | £ | s. | d. | £ | s. | d. | £ | s. | d. | £ | s. | d. | £ | s. | d. | £ | s. | d. | |
| Rates on Crown and Native lands | 178 | 2 | 7 | 27 | 3 | 2 | 1 | 1 | 5 | .. | .. | .. | .. | .. | .. | 206 | 7 | 2 | ||||||||||||
| One-third receipts from land sold on deferred payment and from perpetual lease | 34,288 | 15 | 4 | 791 | 14 | 5 | 287 | 18 | 6 | 3,190 | 11 | 4 | 240 | 6 | 3 | .. | .. | .. | .. | 38,799 | 5 | 10 | ||||||||
| One-fourth of rents from small grazing-runs | 4,222 | 7 | 5 | .. | .. | 485 | 17 | 3 | .. | .. | .. | .. | .. | 4,708 | 4 | 8 | ||||||||||||||
| Timber and flax royalties | 8,798 | 5 | 4 | .. | .. | 344 | 9 | 0 | 5 | 17 | 9 | .. | .. | .. | .. | 9,148 | 12 | 1 | ||||||||||||
| Gold finds revenue and cold duty | 20,658 | 15 | 2 | 11,188 | 18 | 2 | 0 | 16 | 1 | 75 | 6 | 3 | .. | .. | .. | .. | .. | 31,923 | 15 | 8 | ||||||||||
| Subsidies on rates | 98,884 | 4 | 5 | 22,661 | 19 | 1 | 3,167 | 6 | 5 | 13,314 | 12 | 6 | .. | .. | .. | .. | .. | .. | 138,028 | 2 | 5 | |||||||||
| Fees and fines | 4,202 | 9 | 9 | 1,439 | 5 | 8 | 34 | 18 | 11 | 19 | 9 | 0 | .. | 4 | 15 | 1 | .. | .. | .. | 5,700 | 18 | 5 | ||||||||
| Other receipts | 1,248 | 0 | 6 | 4,349 | 3 | 3 | 8 | 2 | 6 | 11 | 9 | 5 | .. | .. | .. | .. | 87 | 10 | 0 | .. | 5,704 | 5 | 8 | |||||||
| Total Revenue Account | 172,481 | 0 | 6 | 40,458 | 3 | 9 | 3,500 | 3 | 10 | 17,441 | 14 | 9 | 246 | 4 | 0 | 4 | 15 | 1 | .. | .. | 87 | 10 | 0 | .. | 234,219 | 11 | 11 | |||
| Loans from Government under Loans to Local Bodies Acts and from New Zealand State Advances Office | 113,041 | 7 | 8 | 84,900 | 19 | 3 | 25,938 | 9 | 9 | 45,486 | 0 | 5 | 1,000 | 0 | 0 | 7,030 | 0 | 0 | .. | .. | 277,396 | 17 | 1 | |||||||
| Grants for special works, &c. | 196,770 | 2 | 0 | 8,375 | 17 | 9 | 932 | 2 | 6 | 8,107 | 6 | 4 | 4,136 | 15 | 0 | 3,712 | 1 | 9 | 6,069 | 11 | 0 | .. | 312 | 0 | 9 | 228,415 | 17 | 1 | ||
| Total receipts from Government | 482,292 | 10 | 2 | 133,735 | 0 | 9 | 30,370 | 16 | 1 | 71,035 | 1 | 6 | 5,382 | 19 | 0 | 10,746 | 16 | 10 | 6,069 | 11 | 0 | 87 | 10 | 0 | 312 | 0 | 9 | 740,032 | 6 | 1 |
The expenditure of local governing bodies during each of the past twenty years is as follows:—
| Financial Year. | Expenditure. | Financial Year. | Expenditure |
|---|---|---|---|
| £ | £ | ||
| 1894–95 | 1,584,518 | 1904–5 | 3,497,321 |
| 1895–96 | 1,627,079 | 1905–6 | 3,601,506 |
| 1896–97 | 1,636,716 | 1906–7 | 3,897,515 |
| 1897–98 | 1,733,016 | 1907–8 | 4,491,113 |
| 1898–99 | 1,778,574 | 1908–9 | 4,800,711 |
| 1899–1900 | 1,960,073 | 1909–10 | 4,898,482 |
| 1900–1 | 2,250,572 | 1910–11 | 5,360,261 |
| 1901–2 | 2,528,092 | 1911–12 | 6,074,372 |
| 1902–3 | 2,867,506 | 1912–13 | 6,537,769 |
| 1903–4 | 3,230,712 | 1913–14 | 6,796,314 |
The expenditure of the various classes of local governing bodies during 1913–14 is shown in more detail.
| LOCAL GOVERNING BODIES.—EXPENDITURE, 1913–14. | ||||||
|---|---|---|---|---|---|---|
| Public Works. | Hospitals and Charitable Aid. | Management. | Interest on Loans and Overdraft. | Other. | Total. | |
* Included in Public Works. | ||||||
| £ | £ | £ | £ | £ | £ | |
| Counties | 1,173,299 | 88,308 | 118,098 | 107,509 | 30,510 | 1,517,724 |
| Boroughs | 2,396,243 | 69,246 | 162,358 | 506,560 | 89,409 | 3,223,816 |
| Town districts | 102,896 | 2,110 | 8,236 | 6,529 | 1,670 | 121,441 |
| Native township | 362 | 7 | 224 | 79 | 672 | |
| Road districts | 185,332 | 7,040 | 16,385 | 14,644 | 4,359 | 227,760 |
| River districts | 18,899 | .. | 3,598 | 4,980 | 272 | 27,749 |
| Land drainage districts | 32,308 | .. | 2,800 | 5,448 | 171 | 40,727 |
| Water-supply districts | 6,612 | .. | 1,658 | 1,337 | 11 | 9,618 |
| Tramway districts | 81,783 | .. | * | 30,577 | .. | 112,360 |
| City and suburban drainage districts | 167,409 | .. | 8,832 | 43,548 | 2,029 | 221,818 |
| Harbour districts | 734,160 | .. | 34,464 | 299,483 | 224,522 | 1,292,629 |
| Totals | 4,899,303 | 166,711 | 356,653 | 1,020,694 | 352,953 | 6,796,314 |
It is seen that during the year the total expenditure was £6,796,314, of which £4,899,303 was expended on public works and £1,020,694 on debt charges. The item “management expenses” does not rank very high in the aggregate, though the table following shows that in some classes of local bodies the expenses of management account for a fair percentage of the revenue.
| Management Expenses as Percentage of | |||
|---|---|---|---|
| Local Districts. | Revenue. | Total Receipts. | Expenditure |
| Counties | 11.60 | 8.09 | 7.78 |
| Boroughs | 6.96 | 5.04 | 5.04 |
| Town districts | 16.05 | 6.37 | 6.78 |
| Native township | 51.26 | 34.04 | 33.33 |
| Road districts | 12.20 | 7.51 | 7.19 |
| River districts | 15.99 | 12.81 | 12.97 |
| Land drainage districts | 14.23 | 7.18 | 6.88 |
| Water-supply districts | 22.18 | 20.44 | 17.24 |
| City and suburban drainage districts | 13.01 | 5.00 | 3.98 |
| Harbour districts | 3.73 | 2.30 | 2.67 |
| All districts | 7.55 | 5.00 | 5.25 |
The table following gives, in respect of boroughs only, the expenditure out of loan-money during the past ten years, classified under various heads.
| EXPENDITURE OUTOF LOANS.—BOROUGHS ONLY. 1904–5 TO 1913–14. | |||||||||
|---|---|---|---|---|---|---|---|---|---|
| Year ended 31st March. | Streets, Footways, and Bridges. | Drainage and Sanitation. | Waterworks. | Tramways. | Abattoirs, Slaughterhouses and Pounds. | Lighting and Power Services. | Other Public Works. | Management, Interest, and Sundries. | Total. |
| £ | £ | £ | £ | £ | £ | £ | £ | ||
| 1905 | 87,139 | 65,998 | 144,178 | 208,684 | 11,462 | 29,972 | 47,269 | 16,403 | 611,105 |
| 1906 | 43,826 | 68,040 | 76,935 | 122,090 | 4,655 | 76,704 | 39,153 | 13,361 | 444,764 |
| 1907 | 63,790 | 71,651 | 210,567 | 118,696 | 6,135 | 122,236 | 39,719 | 15,338 | 651,132 |
| 1908 | 91,688 | 59,921 | 165,664 | 137,188 | 14,505 | 244,126 | 44,243 | 25,957 | 783,292 |
| 1909 | 111,295 | 111,336 | 150,592 | 43,336 | 23,671 | 139,502 | 16,686 | 17,849 | 614,267 |
| 1910 | 87,819 | 129,994 | 160,662 | 81 | 15,120 | 106,452 | 44,786 | 10,098 | 555,012 |
| 1911 | 113,216 | 132,037 | 143,717 | 52,195 | 1,922 | 139,409 | 53,153 | 22,841 | 658,490 |
| 1912 | 149,057 | 206,393 | 246,485 | 114,653 | 3,626 | 137,599 | 98,176 | 14,651 | 970,640 |
| 1913 | 182,251 | 205,373 | 169,447 | 61,224 | 15,596 | 134,873 | 103,985 | 16,433 | 889,182 |
| 1914 | 244,619 | 131,547 | 129,601 | 47,427 | 3,074 | 199,757 | 58,368 | 20,491 | 834,884 |
The assets and liabilities of local governing bodies at the end of the financial year 1913–14 are as shown in the table following. The figures shown in the column “other assets” are taken from the respective balance-sheets, but are far from complete. In quite a number of cases no assets whatever are shown, while in the majority of the others nothing is included for the reserves held. These totals can only be taken as a very approximate indication of the property held in addition to the actual cash assets.
| Assets. | Liabilities. | |||
|---|---|---|---|---|
| Cash Assets. | Other Assets (as estimated in Published Balance-sheets). | Loans (excluding Government Loans, other than those from the State Advances Office). | Liabilities other than the Loans included In preceding Column (Bank Overdrafts, Outstanding Accounts, &c.). | |
| £ | £ | £ | £ | |
| Counties | 394,313 | 413,171 | 183,936 | 384,094 |
| Boroughs | 1,882,893 | 11,185,675 | 10,083,810 | 972,755 |
| Town districts | 29,576 | 157,105 | 125,296 | 29,252 |
| Native township | 467 | 125 | .. | .. |
| Road districts | 75,221 | 77,931 | 58,300 | 44,507 |
| River districts | 18,731 | 35,815 | 27,600 | 14,180 |
| Land drainage districts | 17,894 | 3,522 | 12,940 | 10,287 |
| City and suburban drainage districts | 157,557 | 33,076 | 1,198,000 | 46,401 |
| Tramway districts | 56,148 | 653,164 | 611,900 | 116,362 |
| Water-supply districts | 6,613 | 32,315 | 13,000 | 264 |
| Harbour districts | 1,471,700 | 8,185,261 | 6,608,700 | 576,379 |
| Totals | 4,111,113 | 20,777,160 | 18,923,482 | 2,194,482 |
The indebtedness of local governing bodies on account of outstanding loans has increased in the twenty years 1893–94 to 1913–14 from £6,614,824 to £18,923,482, exclusive of moneys borrowed from Government, which represented a further indebtedness of £3,639,762 at the end of March, 1914 (Roads and Bridges Construction Act, the Government Loans to Local Bodies' Act, and the Loans to Local Bodies' Act, £1,631,965, and loans from the New Zealand State Advances Office, £2,007,797).
The outstanding loans of local bodies at the end of each of the past twenty years are as shown in the following table:—
| LOANS OF LOCAL BODIES, 1894–95 TO 1913–14. | |||||
|---|---|---|---|---|---|
| Financial Year. | Outstanding Loans (excluding Government Loans). | Government Loans to Local Bodies. | |||
| Outstanding Debentures under the Roads and Bridges Construction Act. | Loans from New Zealand State Advances Office outstanding on 31st March. | Net Indebtedness in February of each Year under Local Bodies' Loans Acts (including Debentures under the Roads and Bridges Construction Act, converted). | Total Cross Indebtedness at End of Year. | ||
| £ | £ | £ | £ | £ | |
| 1894–95 | 6,685,510 | 2,015 | .. | 621,903 | 7,309,428 |
| 1895–96 | 6,737,578 | 1,442 | .. | 667,451 | 7,406,471 |
| 1896–97 | 6,793,398 | 1,077 | .. | 709,282 | 7,503,757 |
| 1897–98 | 6,834,361 | 712 | .. | 742,530 | 7,577,603 |
| 1898–99 | 6,963,254 | 347 | .. | 789,618 | 7,753,219 |
| 1899–1900 | 7,057,350 | .. | 810,192 | 7,867,542 | |
| 1900–1 | 7,563,069 | .. | 902,769 | 8,465,838 | |
| 1901–2 | 7,839,695 | .. | 1,046,645 | 8,886,340 | |
| 1902–3 | 8,217,196 | .. | 1,266,002 | 9,483,198 | |
| 1903–4 | 8,898,910 | .. | 1,401,752 | 10,300,662 | |
| 1904–5 | 10,018,242 | .. | 1,526,353 | 10,644,595 | |
| 1905–6 | 10,718,051 | .. | 1,580,494 | 12,298,545 | |
| 1906–7 | 11,616,048 | .. | 1,647,273 | 13,263,321 | |
| 1907–8 | 12,532,334 | .. | 1,691,083 | 14,223,417 | |
| 1908–9 | 13,303,622 | .. | 1,839,017 | 15,142,639 | |
| 1909–10 | 14,937,685 | .. | 1,925,606 | 16,863,291 | |
| 1910–11 | 15,727,613 | 404,163 | 2,025,663 | 17,157,439 | |
| 1911–12 | 16,590,877 | 1,186,611 | 1,948,852 | 19,726,340 | |
| 1912–13 | 17,483,332 | 1,711,797 | 1,761,409 | 20,956,538 | |
| 1913–14 | 18,923,482 | 2,007,797 | 1,631,965 | 22,563,244 | |
A further table is given showing the amount of the debt raised in New Zealand and elsewhere, other than loans from the General Government. Columns are added showing the interest payable, and the average rate of interest per cent. It will be noticed that the amount of outstanding loans shown to have been raised in New Zealand was only a small percentage of the total at the end of the first of the twenty financial years shown, but increased gradually at first, and rapidly later, till at the end of the year 1912–13 it was nearly £3,000,000 in excess of the amount raised abroad. During 1913–14, however, the New Zealand amount decreased slightly, while the loans raised abroad showed a large increase, the respective amounts at the end of the year being—New Zealand, £10,106,082; abroad, £8,817,400.
| INDEBTEDNESS AND INTEREST CHARGES. | |||||
|---|---|---|---|---|---|
| Financial Year. | liaised in New Zealand. | Raised Abroad. | Total Indebtedness. | Interest. | Average Rate per cent. |
| £ | £ | £ | £ | £ | |
| 1894–95 | 1,261,960 | 5,423,550 | 6,685,510 | 358,292 | 5.36 |
| 1895–96 | 1,276,503 | 5,461,075 | 6,737,578 | 361,306 | 5.36 |
| 1896–97 | 1,336,698 | 5,456,700 | 6,793,398 | 363,352 | 5.35 |
| 1897–98 | 1,343,161 | 5,491,200 | 6,834,361 | 363,569 | 5.32 |
| 1898–99 | 1,478,154 | 5,485,100 | 6,963,254 | 363,915 | 5.23 |
| 1899–1900 | 1,579,050 | 5,478,300 | 7,057,350 | 367,019 | 5.20 |
| 1900–1 | 2,052,269 | 5,510,800 | 7,563,069 | 385,959 | 5.10 |
| 1901–2 | 2,287,595 | 5,552,100 | 7,839,695 | 396,460 | 5.06 |
| 1902–3 | 2,880,596 | 5,336,600 | 8,217,196 | 409,238 | 4.91 |
| 1903–4 | 3,369,410 | 5,529,500 | 8,898,910 | 439,879 | 4.94 |
| 1904–5 | 3,479,642 | 5,638,600 | 10,018,242 | 487,145 | 4.86 |
| 1905–6 | 5,250,551 | 5,467,500 | 10,718,051 | 515,188 | 4.81 |
| 1906–7 | 6,145,548 | 5,470,500 | 11,616,048 | 548,387 | 4.72 |
| 1907–8 | 7,246,834 | 5,285,500 | 12,532,334 | 587,564 | 4.69 |
| 1908–9 | 7,785,922 | 5,517,700 | 13,303,622 | 616,330 | 4.63 |
| 1909–10 | 7,967,385 | 6,970,300 | 14,937,685 | 684,630 | 4.58 |
| 1910–11 | 8,254,313 | 7,473,300 | 15,727,613 | 715,289 | 4.55 |
| 1911–12 | 9,574,527 | 7,016,350 | 16,590,877 | 748,805 | 4.51 |
| 1912–13 | 10,134,782 | 7,348,550 | 17,483,332 | 787,827 | 4.51 |
| 1913–14 | 10,106,082 | 8,817,400 | 18,923,482 | 855,063 | 4.52 |
The average rate of interest shows a steady fall throughout the period The loans outstanding, other than Government loans, at the end of the financial year 1913–14 are shown below, classified according to various rates of interest:—
| Rate of Interest: Per cent. | Raised in New Zealand. | Raised Abroad. | Total. |
|---|---|---|---|
| £ | £ | £ | |
| Nil | 25,500 | .. | 25,500 |
| 3½ | 26,220 | .. | 26,220 |
| 3¾ | 60,000 | .. | 60,000 |
| 4 | 3,103,743 | 2,358,500 | 5,462,243 |
| 4¼ | 1,019,930 | 1,018,700 | 2,038,630 |
| 4⅜ | 37,000 | .. | 37,000 |
| 4½ | 4,269,216 | 1,764,550 | 6,033,766 |
| 4¾ | 153,500 | 11,250 | 164,750 |
| 5 | 1,232,578 | 2,597,300 | 3,829,878 |
| 5¼ | 3,500 | .. | 3,500 |
| 5½ | 16,470 | 35,000 | 51,470 |
| 5¾ | 3,000 | .. | 3,000 |
| 6 | 153,425 | 1,032,100 | 1,185,525 |
| 7 | 2,000 | .. | 2,000 |
| Totals | 10,106,082 | 8,817,400 | 18,923,482 |
The total indebtedness at the end of 1913–14, excluding loans from the State Advances Office and the inscribed debt under the Loans to Local Bodies' Acts (the latter including stock exchanged for debentures under the Roads and Bridges Construction Act), was £18,923,482, as shown above. Against this were sinking funds amounting to £1,720,718, leaving the net indebtedness, other than to the State, £17,202,764. The annual charge for interest was £855,063 and for sinking fund £127,148. The net indebtedness to the State Advances Office was £2,007,797, representing loans originally amounting to £2,063,005. The instalments of principal and interest on this amounted to an annual charge of £102,935.
The debt under the Loans to Local Bodies' Acts, including inscribed stock exchanged for debentures under the Roads and Bridges Construction Act, 1882, was £1,631,965 at the end of the year. This debt is decreasing yearly, and will be extinguished in course of time. The amount outstanding is repayable by annual instalments of £110,142, representing 4½ per cent. on £1,014,395, 4 per cent. on £104,444, and 3½ per cent. on £1,723,311, the amount inscribed to the 1st February, 1914. Repayments on the amount inscribed would be £3,793,482, including interest. The actual repayments have been £1,573,241, leaving £2,220,241 still to be paid by way of interest and sinking fund on a present indebtedness of £1,631,965.
Full information concerning the law governing local bodies' loans is given in the 1914 issue of this book. The section of this book dealing with State aid to settlers and workers contains information regarding State advances to local authorities.
Detailed tables showing the statistics of individual local bodies will be found in Vol. IV of the “Statistics of New Zealand.”
Table of Contents
THE system of separately assessing the value of the land itself and the value of the buildings and improvements effected thereon was first put into practice in New Zealand for the purposes of State taxation on the passing of the Land-tax Act, 1878, under which a tax was levied on land-values, the impost being ½d. in the pound on the capital value of real estate, less the assessed value of the improvements.
The Land-tax Act, 1878, was superseded by the Property-tax Act, 1879, which provided for the levy of a uniform tax of 1d. in the pound on the capital value of all property—real and personal—above the amount of £500 in value.
The Property-tax Act, 1879, was in its turn superseded by the Land and Income Assessment Act, 1891. Under this enactment a land-tax was imposed on land and mortgages of land, with an exemption of improvements on land up to £3,000: An exemption from income-tax was also allowed on all incomes derived from land and mortgages of land.
Two years later, under the provisions of the Land and Income Assessment Act Amendment Act, 1893, all improvements on land were entirely exempted.
An endeavour to extend the principle of general exclusion of improvements to local taxation resulted in the passing of the Rating on Unimproved Value Act, 1896, which gave local authorities the option of deciding that equivalent rates on the unimproved values of lands in their jurisdiction should be substituted for the rates levied on the full capital values, or on the annual values.
The valuing of land up to the year 1896 was not conducted on a uniform basis. Each State Department and each local authority worked quite independently, and employed as valuers whom it thought fit. The Land-tax Department periodically employed a small army of temporary valuers when it required a new valuation of lands for taxation purposes, and each local authority had its own particular method of making up its roll for the levying of rates. Estimates of values arrived at by various authorities varied to a dangerous degree. Some values were very high, being based on speculative prices, while many were extremely low. Frequently the same property had several values assigned to it.
In order to overcome as far as possible the obvious defects of the old system, it was decided to establish a new system of valuation, by which all valuations required by State Departments—whether for loan, taxation, or other purposes—and by local authorities that rate on the capital or unimproved value, should be made by valuers employed by the State at fixed salaries and responsible to the Government alone.
The Government Valuation of Land Act, 1896, was in due course introduced and passed. This Act provided for the setting-up of a separate Department of State, altogether independent of the Land and Income Tax Department, charged with the duty of estimating the values of real estate in the Dominion for taxation and other purposes of the general government and for local rating purposes.
It may be pointed out here that land is valued—not assessed—under the Valuation of Land Act, a valuation being the process of determining what a particular piece of land might be worth for the best use to which it is adapted, whereas an assessment is the process of determining what the same land might be worth for the use to which it is applied.
Having regard to the want of knowledge on the part of the public respecting the provisions of the Valuation of Land Act, and to the initiatory difficulties which had to be overcome in making valuations from information which, although not entirely new, was yet defective by reason of the un-evenness of the old land-values, it may be affirmed that the objects of the Act have been fairly attained with comparatively little friction. Of course, inaccuracies and mistakes have occurred, and will occur, but these are inevitable in any system of valuation. They will, however, diminish gradually. Each successive revision of values furnishes a safer basis for a further advance towards greater accuracy in values at a greatly reduced cost.
The whole of the existing law relating to the valuation of land in New Zealand is contained in the Valuation of Land Act, 1908 (which is a consolidation of the Government Valuation of Land Act, 1896, and the Acts amending the same), the Valuation of Land Amendment Act, 1908, and the Valuation of Land Amendment Act, 1912, and the regulations made under these Acts.
Full information concerning the working of the Act is given in the 1914 issue of this book (pages 896–910).
General valuations of land for the whole of New Zealand were made periodically up to the year 1897–98. Since that year no general valuations for the whole Dominion have been made, but portions have been revalued from time to time. The figures in the following table showing valuations over a number of years therefore represent general valuations up to 1897 only, while for subsequent years the figures have been revised to include the latest valuations of small divisions.
| CAPITAL AND UNIMPROVED VALUES, 1878–1914. | ||
|---|---|---|
| Year. | Capital Value (Land and Improvements). | Unimproved Value of Land (included in previous Column). |
| £ | £ | |
| 1878 | 99,566,679 | 62,573,868 |
| 1882 | 101,000,000 | .. |
| 1885 | 113,270,649 | .. |
| 1888 | 111,137,714 | 75,497,379 |
| 1891 | 122,225,029 | 75,832,465 |
| 1897 | 138,591,347 | 84,401,244 |
| 1902 | 154,816,132 | 94,847,727 |
| 1904 | 182,796,241 | 112,629,412 |
| 1905 | 197,684,475 | 122,937,126 |
| 1906 | 218,422,552 | 137,168,548 |
| 1907 | 236,644,536 | 149,682,689 |
| 1908 | 253,440,172 | 161,324,763 |
| 1909 | 271,516,022 | 172,759,948 |
| 1910 | 277,630,083 | 175,289,861 |
| 1911 | 293,117,065 | 184,062,798 |
| 1912 | 315,503,213 | 199,184,261 |
| 1913 | 340,559,728 | 212,963,468 |
| 1914 | 365,342,237 | 228,493,376 |
Information as to capital and unimproved values in the North and South Islands is given in the following table, which well illustrates the great strides the North Island has made as compared with the South.
| CAPITAL AND UNIMPROVED VALUES, NORTH AND SOUTH ISLANDS. | ||||
|---|---|---|---|---|
| Year. | NORTH ISLAND. | SOUTH ISLAND. | ||
| Capital Value (Land and Improvements). | Unimproved Value of Land (included in previous Column). | Capital Value (Land and Improvements). | Unimproved Value of Land (included in previous Column). | |
| £ | £ | £ | £ | |
| 1878 | 34,262,479 | 20,323,840 | 65,304,200 | 42,250,028 |
| 1882 | .. | .. | .. | .. |
| 1885 | 48,699,698 | .. | 64,570,951 | .. |
| 1888 | 49,607,873 | 32,088,913 | 61,529,841 | 43,408,466 |
| 1891 | 57,441,115 | 34,340,500 | 64,783,914 | 41,447,395 |
| 1897 | 71,680,952 | .. | 66,910,395 | .. |
| 1902 | 83,439,974 | 49,622,887 | 71,376,158 | 45,224,840 |
| 1904 | 101,924,877 | 61,855,053 | 80,871,364 | 50,774,359 |
| 1905 | 110,810,384 | 67,834,587 | 86,874,091 | 55,102,539 |
| 1906 | 124,751,914 | 77,784,340 | 93,670,638 | 59,384,208 |
| 1907 | 137,998,395 | 87,469,010 | 98,646,141 | 62,213,679 |
| 1908 | 149,783,914 | 95,005,640 | 103,656,258 | 66,319,123 |
| 1909 | 160,917,161 | 101,907,555 | 110,598,861 | 70,852,393 |
| 1910 | 165,014,036 | 103,790,934 | 112,616,047 | 71,498,927 |
| 1911 | 175,485,540 | 109,366,048 | 117,631,525 | 74,696,750 |
| 1912 | 193,506,090 | 121,776,349 | 121,997,123 | 77,407,912 |
| 1913 | 210,292,824 | 130,380,779 | 130,266,904 | 82,582,689 |
| 1914 | 224,992,419 | 139,315,611 | 140,349,818 | 89,177,765 |
The next table shows the capital value of land with improvements and the unimproved value of land in counties, boroughs, and independent town districts in New Zealand from 1878 to 1914.
| TABLE SHOWING CAPITAL AND UNIMPROVED VALUES, COUNTIES, BOROUGHS, AND INDEPENDENT TOWN DISTRICTS IN NEW ZEALAND. 1678–1914. | |||||||
|---|---|---|---|---|---|---|---|
| Year. | Counties | Boroughs and Town Districts. | |||||
| Number. | Capital Value (Land and Improvements). | Unimproved Value of Land (included in previous Column). | Number. | Capital Value (Land and Improvements). | Unimproved Value of Land (included in previous Column). | ||
*Boroughs. † Town Districts. | |||||||
| £ | £ | £ | £ | ||||
| 1878 | 63 | 72,608,163 | 48,212,290 | 61 | 26,958,516 | 14,361,578 | |
| 1888 | 76 | 76,340,577 | 57,201,387 | 85 | 34,797,137 | 18,295,992 | |
| 1891 | 78 | 85,818,167 | 57,880,233 | 90 | 36,406,862 | 17,907,662 | |
| 1897 | 81 | 95,710,266 | 63,732,516 | 98 | 42,881,081 | 20,668,728 | |
| 1902 | 89 | 106,550,772 | 71,747,758 | 102 | 48,265,360 | 23,099,969 | |
| 1904 | 95 | 121,966,152 | 82,513,630 | 100 | 60,830,089 | 30,115,782 | |
| 1905 | 96 | 131,929,078 | 90,440,275 | 191 | 65,755,397 | 32,496,851 | |
| 1906 | 97 | 144,003,158 | 99,236,462 | 104 | 74,419,394 | 37,932,086 | |
| 1907 | 98 | 152,695,969 | 106,373,461 | *106†18 | 83,948,567 | 43,309,228 | |
| 1903 | 102 | 162,289,950 | 114,301,726 | *109†23 | 91,150,222 | 47,023,037 | |
| 1909 | 107 | 175,601,263 | 123,339,350 | *110†24 | 95,914,759 | 49,420,598 | |
| 1910 | 111 | 177,701,619 | 124,560,720 | *107†23 | 99,928,464 | 50,729,141 | |
| 1911 | 118 | 185,042,337 | 129,990,593 | *110†26 | 108,074,728 | 54,072,205 | |
| 1912 | 123 | 198,114,138 | 138,813,886 | *113†26 | 117,389,075 | 60,370,375 | |
| 1913 | 124 | 218,282,038 | 152,273,929 | *115†25 | 122,277,690 | 60,689,539 | |
| 1914 | 125 | 229,851,005 | 159,846,169 | *116†34 | 135,491,232 | 68,647,207 | |
Similar information for North and South Islands is given in the following table:—
| TABLE SHOWING CAPITAL AND UNIMPROVED VALUES, COUNTIES, BOROUGHS, AND INDEPENDENT TOWN DISTRICTS IN NORTH AND SOUTH ISLANDS, 1878–1914. | |||||||
|---|---|---|---|---|---|---|---|
| Year. | Counties. | Boroughs and Town Districts, | |||||
| Number. | Capital Value (Land and Improvements). | Unimproved Value of Land (included in previous Column). | Number. | Capital Value (Land and Improvements). | Unimproved Value of Land (included in previous Column). | ||
* Boroughs. † Town Districts. | |||||||
| (a.) North Island. | |||||||
| £ | £ | £ | £ | ||||
| 1878 | 31 | 24,255,180 | 14,434,762 | 13 | 10,007,299 | 5,889,078 | |
| 1888 | 43 | 32,752,002 | 22,907,939 | 29 | 16,855,871 | 9,180,974 | |
| 1891 | 45 | 39,256,818 | 24,716,598 | 32 | 18,184,297 | 9,623,902 | |
| 1897 | 47 | 48,436,977 | 29,346,497 | 36 | 23,243,975 | 12,474,262 | |
| 1902 | 55 | 56,543,535 | 35,344,738 | 38 | 26,896,439 | 14,278,149 | |
| 1904 | 59 | 66,968,046 | 42,476,621 | 39 | 34,956,831 | 19,378,432 | |
| 1905 | 60 | 72,301,289 | 46,620,552 | 41 | 38,509,095 | 21,214,035 | |
| 1906 | 61 | 79,532,180 | 52,044,276 | 44 | 45,219,734 | 25,740,064 | |
| 1907 | 62 | 86,208,889 | 57,764,425 | *46†13 | 51,789,506 | 29,704,585 | |
| 1908 | 66 | 93,347,352 | 63,088,267 | *49†17 | 56,436,562 | 31,917,373 | |
| 1909 | 69 | 100,530,234 | 68,177,049 | *50†18 | 59,514,721 | 33,730,506 | |
| 1910 | 70 | 103,042,636 | 69,217,402 | *51†17 | 61,971,400 | 34,573,532 | |
| 1911 | 71 | 107,734,511 | 72,375,111 | *54†20 | 67,751,029 | 36,990,937 | |
| 1912 | 72 | 117,194,751 | 78,630,607 | *56†20 | 76,311,339 | 43,145,742 | |
| 1913 | 72 | 131,042,439 | 87,417,493 | *58†19 | 79,250,385 | 42,963,286 | |
| 1914 | 73 | 136,238,469 | 90,417,715 | *59†28 | 88,753,950 | 48,897,896 | |
| (b.) South Island. | |||||||
| 1878 | 32 | 48,352,983 | 33,777,528 | 48 | 16,951,217 | 8,472,500 | |
| 1888 | 33 | 43,588,575 | 34,293,448 | 56 | 17,941,266 | 9,115,018 | |
| 1891 | 33 | 46,561,349 | 33,163,635 | 58 | 18,222,565 | 8,283,760 | |
| 1897 | 34 | 47,273,289 | 34,386,019 | 62 | 19,637,106 | 8,194,466 | |
| 1902 | 34 | 50,007,237 | 36,403,020 | 64 | 21,368,921 | 8,821,820 | |
| 1904 | 36 | 54,998,106 | 40,037,009 | 61 | 25,873,258 | 10,737,350 | |
| 1905 | 36 | 59,627,789 | 43,819,723 | 60 | 27,246,302 | 11,282,816 | |
| 1906 | 36 | 64,470,978 | 47,192,186 | 60 | 29,199,660 | 12,192,022 | |
| 1907 | 36 | 66,487,080 | 48,609,036 | *60†5 | 32,159,061 | 13,604,643 | |
| 1908 | 36 | 68,942,598 | 51,213,459 | *60†6 | 34,713,660 | 15,105,664 | |
| 1909 | 38 | 75,071,029 | 55,162,301 | *60†6 | 36,400,038 | 15,690,092 | |
| 1910 | 41 | 74,658,983 | 55,343,318 | *56†6 | 37,957,064 | 16,155,609 | |
| 1911 | 47 | 77,307,826 | 57,615,482 | *56†6 | 40,323,699 | 17,081,268 | |
| 1912 | 51 | 80,919,387 | 60,183,279 | *57†6 | 41,077,736 | 17,224,633 | |
| 1913 | 52 | 87,239,599 | 64,856,436 | *57†6 | 43,027,305 | 17,726,253 | |
| 1914 | 52 | 93,612,536 | 69,428,454 | *57†6 | 46,737,282 | 19,749,311 | |
The total valuations are given for counties and boroughs, and for town districts not forming parts of counties. The particulars for component parts of counties, being road districts, town districts forming parts of counties and portions of outlying country, will be found in the Statistical Volume for 1913.
| TABLE SHOWING CAPITAL VALUE OF LAND WITH IMPROVEMENTS (AND DISTINGUISHINGTHE UNIMPROVED VALUE OF LAND) FOR ALL LANDS ANDFOR RATEABLE PROPERTIES INEACH COUNTY IN NEW ZEALAND, AS ATTHE 31ST MARCH, 1914, WITH THE AREA, POPULATION, NUMBER OF ASSESSMENTS ON VALUATION ROLL, AND THE YEAR INWHICH THE VALUES WERELAST REVISED. | |||||||||
|---|---|---|---|---|---|---|---|---|---|
| County. | Area in Square Miles (including Interior Boroughs, &c.). | Estimated Population, 1st April, 1914. | Number of Assessments on Valuation Roll. | Gross Values. | System of Rating. | Rateable Values. | Values last revised as at 31st March, in † | ||
| Capital Value (Land and Improvements). | Unimproved Value of Land (included in previous Column). | Capital Value (Land and Improvements). | Unimproved Value of Land (included in previous Column). | ||||||
* Counties Act not wholly in force. † In cases where more than one year is shown in this column the revision of the county was carried out in sections, certain riflings, road districts, or town districts being revised in the years stated. * Counties Act, not wholly in force. † In cases where more than one year is shown In this column the revision of the county was carried out in sections; certain ridings, road districts, or town districts being revised in the years stated. * Counties Act not wholly in force. † In cases where more than one year is shown in this column the revision of the county was carried out in sections, certain ridings, road districts, or town districts being revised in the years stated. | |||||||||
| £ | £ | £ | £ | ||||||
| Mangonui | 875 | 3,339 | 1,750 | 437,733 | 259,901 | C.V. | 350,547 | 188,309 | 1910 |
| Whangaroa | 175 | 833 | 547 | 135,329 | 85,896 | ″ | 121,987 | 75,245 | 1912 |
| Bay of Islands | 848 | 3,384 | 2,629 | 1,034,648 | 731,782 | ″ | 855,293 | 568,866 | 1912 |
| Hokianga | 958 | 3,270 | 2,621 | 950,806 | 695,299 | U.V. | 682,222 | 439,357 | 1911 |
| Whangarei | 894 | 7,700 | 4,085 | 1,999,851 | 1,138,847 | C.V. | 1,869,559 | 1,036,598 | 1912, 1914 |
| Hobson | 626 | 4,385 | 1,558 | 1,221,234 | 758,014 | U.V. | 1,163,028 | 712,621 | 1913 |
| Otamatea | 443 | 3,815 | 1,805 | 982,592 | 604,648 | C.V. | 941,473 | 571,249 | 1912 |
| Rodney | 493 | 3,828 | 1,680 | 1,002,646 | 607,111 | ″ | 967,617 | 579,140 | 1912 |
| Waitemata | 630 | 6,423 | 3,448 | 1,935,439 | 1,303,194 | ″ | 1,842,164 | 1,230,473 | 1910, 1911, 1912, 1913, 1914 |
| Eden | 35 | 22,071 | 8,972 | 7,431,397 | 4,425,697 | * | 7,003,272 | 4,221,106 | 1911, 1913, 1914 |
| Manukau | 197 | 5,067 | 1,957 | 2,639,813 | 1,859,775 | C.V. | 2,578,029 | 1,825,007 | 1911, 1912, 1913, 1914 |
| Franklin | 620 | 8,344 | 3,724 | 2,804,341 | 1,726,483 | ″ | 2,734,828 | 1,691,560 | 1911, 1912, 1913, 1914 |
| Great Barrier | 108 | 441 | 193 | 132,806 | 107,478 | .. | 127,725 | 102,702 | 1914 |
| Islands— | |||||||||
| Little Barrier, Waiheke, &c. | .. | 496 | 264 | 325,458 | 210,250 | Nil | 263,423 | 170,400 | 1913 |
| Waikato | 613 | 5,836 | 1,737 | 2,667,825 | 1,840,719 | C.V. | 2,552,083 | 1,758,379 | 1912 |
| Raglan | 855 | 3,207 | 2,007 | 1,770,129 | 1,119,324 | U.V. | 1,728,868 | 1,086,501 | 1911 |
| Waipa | 284 | 5,223 | 2,065 | 2,926,958 | 2,020,047 | C.V. | 2,856,816 | 1,993,715 | 1913 |
| Kawhia | 351 | 965 | 826 | 549,591 | 352,474 | U.V. | 516,017 | 321,798 | 1913 |
| Awakino | 416 | 667 | 439 | 646,173 | 425,149 | * | 607,371 | 387,105 | 1911 |
| Waitomo | 1,115 | 3,966 | 2,748 | 2,202,163 | 1,461,358 | C.V. | 2,090,366 | 1,360,612 | 1913, 1914 |
| Ohura | 527 | 1,584 | 974 | 1,010,824 | 654,209 | U.V. | 913,072 | 561,562 | 1913 |
| Coromandel | 440 | 2,937 | 1,585 | 430,183 | 278,120 | C.V. | 363,969 | 227,228 | 1913 |
| Thames | 498 | 4,717 | 2,088 | 791,005 | 483,082 | U.V. | 721,030 | 425,110 | 1913 |
| Ohinemuri | 497 | 6,499 | 2,705 | 1,283,825 | 795,409 | C.V. | 1,111,055 | 677,409 | 1913 |
| Tauranga | 651 | 2,582 | 2,342 | 1,227,203 | 806,343 | U.V. | 1,115,930 | 705,590 | 1912 |
| Piako | 404 | 3,531 | 1,282 | 1,494,678 | 928,636 | ″ | 1,438,574 | 889,230 | 1911, 1913 |
| Matamata | 938 | 3,250 | 1,030 | 1,249,877 | 757,506 | C.V. | 1,156,264 | 675,573 | 1911 |
| Rotorua | 995 | 1,272 | 1,095 | 612,796 | 477,506 | * | 483,217 | 380,040 | 1912 |
| Whakatane | 1,550 | 1,828 | 1,313 | 1,175,138 | 816,911 | C.V. | 1,006,571 | 664,384 | 1908 |
| Opotiki | 1,509 | 1,593 | 1,138 | 1,245,937 | 781,244 | U.V. | 1,123,908 | 664,332 | 1913 |
| East Taupo | 2,470 | 582 | 936 | 490,454 | 325,755 | Nil | 380,943 | 221,394 | 1914 |
| West Taupo | 1,432 | 1,074 | 586 | 453,032 | 398,032 | ″ | 270,383 | 226,784 | 1906 |
| Islands— | |||||||||
| Mayor and Motiti | .. | .. | .. | 5,700 | 3,616 | ″ | 2,262 | 1,018 | 1897 |
| Waiapu | 1,102 | 1,863 | 917 | 2,711,385 | 1,661,780 | C.V. | 2,495,268 | 1,491,949 | 1913 |
| Waikohu | 896 | 3,186 | 945 | 2,626,075 | 1,581,833 | U.V. | 2,538,843 | 1,499,279 | 1912 |
| Cook | 1,088 | 6,903 | 3,919 | 5,323,212 | 3,518,246 | C.V. | 5,221,876 | 3,485,702 | 1911, '12, '13, '14 |
| Wairoa | 1,887 | 2,036 | 1,560 | 3,004,353 | 1,899,019 | ″ | 2,896,497 | 1,808,919 | 1913 |
| Hawke's Bay | 1,985 | 8,546 | 3,900 | 7,669,485 | 5,914,262 | ″ | 7,588,453 | 5,877,614 | 1911, '12, '13, '14 |
| Waipawa | 440 | 3,300 | 1,069 | 2,227,039 | 1,574,684 | U.V. | 2,186,957 | 1,542,858 | 1908 |
| Waipukurau | 85 | 584 | 244 | 478,176 | 369,539 | ″ | 475,922 | 368,360 | 1908 |
| Dannevirke | 398 | 5,084 | 1,550 | 2,053,484 | 1,368,807 | ″ | 2,016,322 | 1,344,973 | 1908 |
| Woodville | 170 | 2,040 | 817 | 1,467,251 | 1,011,908 | U.V. | 1,454,933 | 1,004,552 | 1914 |
| Patangata | 718 | 2,101 | 874 | 3,376,148 | 2,674,742 | C.V. | 3,358,989 | 2,664,298 | 1909, 1912 |
| Weber | 108 | 571 | 200 | 483,749 | 279,883 | U.V. | 480,652 | 278,555 | 1909 |
| Clifton | 615 | 2,470 | 1,349 | 1,007,345 | 567,636 | C.V. | 974,681 | 539,347 | 1911 |
| Taranaki | 386 | 8,152 | 2,923 | 2,249,980 | 1,261,532 | ″ | 2,215,394 | 1,242,380 | 1912, 1913 |
| Egmont | 197 | 3,668 | 1,605 | 1,944,292 | 1,049,632 | ″ | 1,894,687 | 1,021,454 | 1914 |
| Stratford | 391 | 5,973 | 1,653 | 2,082,620 | 1,216,808 | U.V. | 2,044,621 | 1,097,943 | 1909 |
| Whangamomona | 378 | 1,914 | 621 | 511,317 | 290,323 | ″ | 482,767 | 266,060 | 1909 |
| Waimate West | 75 | 2,046 | 499 | 1,414,785 | 1,121,517 | C.V. | 1,411,123 | 1,120,455 | 1913 |
| Hawera | 195 | 4,113 | 1,580 | 2,541,181 | 1,922,600 | ″ | 2,514,013 | 1,907,164 | 1907, 1910, 1913 |
| Eltham | 201 | 3,752 | 887 | 1,998,077 | 1,358,321 | ″ | 1,971,869 | 1,344,097 | 1914 |
| Patea | 626 | 3,304 | 1,443 | 2,257,628 | 1,547,597 | 2,189,424 | 1,499,085 | 1908 | |
| Waitotara | 447 | 2,590 | 914 | 1,718,351 | 1,207,857 | ″ | 1,675,893 | 1,167,937 | 1909, 1914 |
| Waimarino | 945 | 2,763 | 1,837 | 1,571,862 | 1,106,325 | U.V. | 1,351,829 | 899,679 | 1908, 1913 |
| Wanganui | 627 | 4,157 | 1,467 | 2,404,712 | 1,539,787 | C.V. | 2,359,657 | 1,504,242 | 1911, 1913 |
| Rangitikei | 852 | 8,630 | 3,094 | 5,780,932 | 3,760,304 | ″ | 5,732,243 | 3,728,726 | 1908, 1909, 1912, 1914 |
| Kiwitea | 336 | 3,218 | 1,496 | 2,016,309 | 1,351,935 | ″ | 1,984,194 | 1,331,327 | 1910, 1911 |
| Pohangina | 295 | 2,079 | 986 | 1,221,181 | 810,728 | ″ | 1,184,543 | 779,399 | 1911 |
| Kaitieke | 575 | 1,598 | 787 | 910,242 | 744,966 | ″ | 667,348 | 504,124 | 1912 |
| Manawatu | 267 | 5,161 | 1,538 | 2,374,380 | 1,693,091 | ″ | 2,352,777 | 1,684,976 | 1911, 1912 |
| Oroua | 213 | 4,151 | 1,491 | 2,009,580 | 1,476,527 | ″ | 1,997,565 | 1,472,850 | 1909, 1913 |
| Kairanga | 186 | 4,486 | 1,145 | 2,980,443 | 2,177,467 | U.V. | 2,934,477 | 2,161,766 | 1912 |
| Horowhenua | 498 | 6,189 | 2,442 | 3,541,287 | 2,531,777 | C.V. | 3,414,854 | 2,462,243 | 1913, 1914 |
| Islands— | |||||||||
| Kapiti, Mana, and Somes | .. | 10 | 17 | 17,984 | 13,378 | Nil | 10,484 | 9,378 | 1898 |
| Chatham Islands | 375 | 267 | 27 | 95,557 | 55,838 | Nil | 92,446 | 53,614 | 1898 |
| Pahiatua | 301 | 3,646 | 2,241 | 1,733,270 | 1,039,205 | U.V. | 1,704,109 | 1,019,364 | 1907 |
| Akitio | 326 | 1,524 | 691 | 1,187,167 | 609,743 | ″ | 1,168,058 | 597,805 | 1914 |
| Castlepoint | 250 | 665 | 167 | 840,780 | 543,467 | C.V. | 836,883 | 542,724 | 1913 |
| Eketahuna | 166 | 2,053 | 922 | 708,017 | 417,790 | U.V. | 694,272 | 408,268 | 1908 |
| Mauriceville | 136 | 1,019 | 441 | 546,899 | 309,279 | C.V. | 525,517 | 291,763 | 1914 |
| Masterton | 733 | 4,314 | 1,550 | 3,359,481 | 2,164,702 | ″ | 3,318,181 | 2,147,122 | 1909, 1910 |
| Wairarapa South | 452 | 2,945 | 1,032 | 2,171,482 | 1,354,777 | U.V. | 2,138,407 | 1,336,006 | 1913 |
| Featherston | 961 | 2,780 | 1,002 | 3,298,983 | 2,293,662 | C.V. | 3,229,904 | 2,233,695 | 1912 |
| Hutt | 483 | 4,790 | 2,526 | 2,118,796 | 1,296,114 | C.V. | 1,869,258 | 1,189,137 | 1913, 1914 |
| Makara | 101 | 3,127 | 1,253 | 935,608 | 488,512 | ″ | 795,064 | 461,198 | 1908, 1909 |
| Collingwood | 719 | 1,326 | 878 | 248,156 | 147,213 | U.V. | 204,118 | 110,555 | 1909 |
| Takaka | 454 | 2,002 | 781 | 432,958 | 200,509 | 380,932 | 154,699 | 1909 | |
| Waimea | 1,662 | 9,496 | 3,743 | 2,150,009 | 1,276,853 | C.V. | 2,001,155 | 1,176,333 | 1909 |
| Sounds | 473 | 1,254 | 867 | 789,445 | 477,650 | Nil | 753,242 | 444,002 | 1914 |
| Marlborough | 1,931 | 6,928 | 2,615 | 3,161,935 | 2,406,088 | * | 3,049,140 | 2,320,821 | 1909, 1911, 1912, 1913, 1914 |
| Awatere | 1,267 | 1,631 | 518 | 1,607,662 | 1,251,899 | U.V. | 1,592,958 | 1,243,961 | 1913 |
| Kaikoura | 703 | 2,046 | 749 | 1,226,424 | 909,158 | C.V. | 1,195,168 | 903,094 | 1913 |
| Buller | 1,818 | 7,354 | 3,055 | 1,407,185 | 732,517 | U.V. | 1,014,704 | 411,706 | 1913 |
| Murchison | 1,640 | 1,115 | 757 | 565,911 | 425,638 | ″ | 250,113 | 117,204 | 1910 |
| Inangahua | 741 | 4,956 | 1,718 | 577,638 | 290,683 | ″ | 380,907 | 116,781 | 1912 |
| Grey | 1,452 | 6,205 | 2,450 | 964,482 | 622,514 | C.V. | 557,935 | 273,642 | 1912 |
| Westland | 4,420 | 4,490 | 3,217 | 1,040,498 | 752,181 | ″ | 583,787 | 320,774 | 1914 |
| Cheviot | 322 | 1,521 | 640 | 1,472,980 | 1,085,007 | U.V. | 1,459,382 | 1,178,219 | 1913 |
| Amuri | 2,362 | 1,865 | 615 | 1,981,671 | 1,621,991 | C.V. | 1,942,351 | 1,597,179 | 1911, 1912 |
| Waipara | 901 | 2,098 | 713 | 3,136,525 | 2,676,245 | ″ | 3,119,005 | 2,688,515 | 1914 |
| Ashley | 311 | 757 | 325 | 599,118 | 493,821 | ″ | 577,997 | 474,942 | 1909 |
| Kowai | 160 | 2,218 | 911 | 1,188,533 | 938,627 | ″ | 1,171,045 | 934,026 | 1914 |
| Oxford | 324 | 1,993 | 932 | 861,335 | 686,025 | ″ | 828,462 | 660,595 | 1912 |
| Rangiora | 95 | 3,082 | 1,168 | 1,369,416 | 1,063,063 | ″ | 1,352,544 | 1,057,120 | 1913, 1914 |
| Eyre | 175 | 1,998 | 713 | 1,162,834 | 959,652 | ″ | 1,154,007 | 956,430 | 1914 |
| Waimairi | 74 | 11,413 | 4,589 | 2,863,611 | 1,720,105 | ″ | 2,401,487 | 1,453,541 | 1909, 1911 |
| Paparua | 136 | 4,366 | 1,498 | 4,656,591 | 1,186,326 | ″ | 1,616,334 | 1,176,358 | 1909, 1910 |
| Malvern | 248 | 3,691 | 1,286 | 1,920,134 | 1,516,456 | ″ | 1,888,124 | 1,506,483 | 1914 |
| Tawera | 932 | 1,325 | 326 | 342,409 | 268,436 | ″ | 330,214 | 264,965 | 1907, 1909, 1910 |
| Heathcote | 21 | 4,434 | 1,971 | 1,068,799 | 554,978 | ″ | 1,023,239 | 540,458 | 1909, 1910 |
| Halswell | 42 | 2,025 | 423 | 711,400 | 541,566 | ″ | 681,730 | 532,301 | 1910, 1913 |
| Selwyn | 977 | 1,352 | 567 | 1,153,132 | 952,947 | ″ | 1,145,996 | 948,191 | 1908 |
| Springs | 89 | 2,018 | 616 | 1,047,512 | 826,857 | ″ | 1,004,339 | 823,704 | 1913 |
| Ellesmere | 183 | 4,025 | 1,198 | 2,225,482 | 1,819,021 | ″ | 2,200,126 | 1,814,491 | 1906, 1911 |
| Mount Herbert | 59 | 494 | 175 | 384,685 | 306,317 | ″ | 377,655 | 304,102 | 1909 |
| Wairewa | 165 | 953 | 496 | 881,046 | 731,088 | ″ | 869,546 | 722,013 | 1909 |
| Akaroa | 163 | 2,402 | 805 | 1,511,612 | 1,202,192 | ″ | 1,499,497 | 1,199,137 | 1909 |
| Ashburton | 2,542 | 10,977 | 4,039 | 8,616,327 | 7,114,422 | ″ | 8,500,856 | 7,045,621 | 1906, 1907, 1911, 1912, 1914 |
| Geraldine | 949 | 5,838 | 2,278 | 2,918,972 | 2,346,853 | ″ | 2,889,263 | 2,329,837 | 1911, 1912 |
| Levels | 273 | 5,150 | 2,040 | 3,020,503 | 2,433,315 | ″ | 3,000,331 | 2,427,141 | 1914 |
| Mackenzie | 2,537 | 2,498 | 1,096 | 2,076,386 | 1,660,098 | ″ | 2,048,353 | 1,648,235 | 1911, 1912, 1913 |
| Waimate | 1,343 | 7,182 | 2,500 | 5,365,183 | 4,379,038 | U.V. | 5,325,686 | 4,364,854 | 1913, 1914 |
| Waitaki | 2,333 | 10,215 | 3,773 | 3,958,951 | 3,064,203 | C.V. | 3,891,333 | 3,045,217 | 1909 |
| Maniototo | 1,239 | 2,952 | 1,755 | 924,050 | 643,822 | ″ | 897,863 | 632,328 | 1912, 1913 |
| Waihemo | 336 | 1,728 | 807 | 570,862 | 414,088 | ″ | 565,352 | 412,429 | 1908 |
| Waikouaiti | 318 | 4,530 | 1,912 | 895,167 | 513,933 | ″ | 777,492 | 496,959 | 1908 |
| Peninsula | 37 | 1,988 | 1,462 | 534,779 | 307,941 | * | 498,076 | 301,717 | 1908, 1911 |
| Taieri | 930 | 6,508 | 2,779 | 1,699,437 | 1,203,841 | C.V. | 1,646,253 | 1,184,803 | 1906. 1907, 1909 |
| Tuapeka | 1,365 | 6,015 | 2,619 | 1,880,663 | 1,339,895 | ″ | 1,823,530 | 1,317,036 | 1911. 1912 |
| Bruce | 503 | 5,074 | 2,248 | 1,333,054 | 954,448 | ″ | 1,313,280 | 948,027 | 1906, '07, '08, '09 |
| Clutha | 946 | 7,624 | 3,282 | 2,421,042 | 1,564,001 | ″ | 2,339,400 | 1,519,047 | 1908, 1909. 1913. |
| Islands— | |||||||||
| Quarantine and Goat | .. | .. | .. | 3,454 | 900 | Nil | .. | .. | .. |
| Vincent | 2,684 | 3,919 | 1,896 | 951,295 | 634,291 | C.V. | 916,633 | 620,741 | 1914 |
| Lake | 3,712 | 2,055 | 1,394 | 471,375 | 345,747 | ″ | 427,997 | 311,584 | 1897, 1902, 1905, 1906, 1909, 1914 |
| Fiord | 3,059 | 45 | 90 | 144,340 | 137,560 | Nil | 15,898 | 15,118 | 1897 |
| Wallace | 3,696 | 9,348 | 3,900 | 3,504,908 | 2,451,639 | C.V. | 3,317,912 | 2,287,100 | 1912, 1913. 1914 |
| Southland | 3,754 | 27,794 | 10,710 | 10,432,089 | 7,131,669 | U.V. | 10,147,701 | 7,007,291 | 1911, 1912, 1913, 1914 |
| Stewart Island | 665 | 349 | 295 | 164,691 | 129,307 | C.V. | 39,555 | 18,330 | 1904 |
| Islands— | |||||||||
| Antipodes, &c. | .. | .. | 7 | 13,880 | 13,880 | Nil | 12,000 | 12,000 | 1897 |
TABLE SHOWING CAPITAL VALVE OF LANDWITH IMPROVEMENTS (AND DISTINGUISHINGTHE UNIMPROVED VALUE OF LAND) FOR ALL LANDS ANDFOR RATEABLE PROPERTIES INEACH BOROUGH IN NEW ZEALAND, AS ATTHE 31ST MARCH. 1914, WITH THE AREA, POPULATION, NUMBER OF ASSESSMENTS ON VALUATION ROLL, AND THE YEARIN WHICHTHE VALUES WERELAST REVISED.
| Gross Values. | Rateable Values | |||||||||
|---|---|---|---|---|---|---|---|---|---|---|
| Roll No. | Borough | Area in Acres. | Estimated Population, 1st April, 1914. | Number of Assessments on Valuation Roll. | Capital Value (Land and Improvements). | Unimproved Value of Land (included in previous Column). | System of Rating. | Capital Value (Land and Improvements). | Unimproved Value of Land (included in previous Column). | Values last revised as at 31st March in |
| £ | £ | £ | £ | |||||||
| 1 | Whangarei | 2,038 | 2,865 | 869 | 631,979 | 344,221 | U.V. | 591,704 | 325,021 | 1911 |
| 41C | Dargaville | 2,788 | 1,388 | 423 | 235,587 | 134,176 | C.V. | 228,892 | 130,781 | 1911 |
| 55 | Birkenhead | 3,100 | 2,139 | 724 | 586,020 | 319,415 | U.V. | 563,325 | 303,700 | 1914 |
| 56 | Devonport | 745 | 7,770 | 1,934 | 1,528,891 | 654,573 | ″ | 1,226,788 | 519,567 | 1911 |
| 57 | Auckland | 2,591 | 50,482 | 8,245 | 18,417,009 | 11,429,684 | A.V. | 15,835,429 | 9,723,064 | 1912 |
| 64 | Newmarket | 180 | 3,201 | 774 | 666,129 | 370,569 | ″ | 638,744 | 351,574 | 1914 |
| 65 | Grey Lynn | 930 | 8,672 | 2,160 | 1,222,423 | 511,038 | U.V. | 1,186,533 | 491,378 | 1911 |
| 66 | Onehunga | 1,339 | 5,002 | 1,730 | 1,011,265 | 514,137 | A.V. | 955,805 | 484,562 | 1914 |
| 90 | Northcote | 1,200 | 1,737 | 532 | 326,163 | 183,008 | ″ | 316,118 | 176,178 | 1913 |
| 96 | Mount Albert | 2,437 | 8,912 | 3,453 | 1,526,260 | 791,660 | C.V. | 1,479,165 | 764,515 | 1914 |
| 99 | Mount Eden | 1,422 | 11,140 | 2,701 | 1,921,731 | 752,359 | A.V. | 1,811,974 | 719,164 | 1910 |
| 88A | Takapuna | 2,775 | 1,544 | 2,254 | 1,040,677 | 759,730 | C.V. | 1,013,947 | 748,660 | 1914 |
| 140 | Hamilton | 2,276 | 3,908 | 1,779 | 1,712,165 | 1,107,360 | U.V. | 1,523,835 | 969,730 | 1914 |
| 141 | Cambridge | 1,083 | 1,614 | 623 | 440,665 | 256,070 | A.V. | 385,410 | 225,175 | 1914 |
| 158A | Frankton | 926 | 1,228 | 530 | 360,576 | 241,210 | C.V. | 344,429 | 229,413 | 1912 |
| 166 | Thames | 2,680 | 3,732 | 954 | 431,530 | 182,270 | A.V. | 363,675 | 156,475 | 1914 |
| 167 | Tauranga | 875 | 1,448 | 687 | 273,741 | 140,493 | ″ | 254,411 | 128,765 | 1912 |
| 177B | Waihi | 3,130 | 5,475 | 1,691 | 423,598 | 150,063 | ″ | 392,670 | 140,805 | 1908 |
| 187 | Te Aroha | 950 | 1,431 | 339 | 88,972 | 35,649 | ″ | 73,328 | 28,745 | 1907 |
| 129A | Pukekohe | 5,082 | 1,324 | 406 | 405,250 | 243,876 | C.V. | 388,895 | 237,696 | 1912 |
| 230 | Te Kuiti | 2,143 | 1,397 | 738 | 370,844 | 188,871 | ″ | 345,178 | 175,877 | 1913 |
| 201A | Taumarunui | 1,925 | 1,244 | 579 | 280,258 | 160,570 | U.V. | 249,118 | 138,495 | 1914 |
| 117 | Otahuhu | 1,408 | 1,986 | 930 | 491,905 | 287,840 | C.V. | 466,605 | 272,410 | 1914 |
| 199 | Opotiki | 770 | 1,006 | 438 | 254,397 | 152,821 | U.V. | 230,069 | 138,971 | 1913 |
| 1 | Gisborne | 2,335 | 9,683 | 2,275 | 2,562,047 | 1,428,720 | ″ | 2,372,503 | 1,314,170 | 1912 |
| 22 | Wairoa | 1,562 | 1,190 | 834 | 266,814 | 148,208 | ″ | 253,606 | 141,708 | 1910 |
| 25 | Napier | 910 | 11,083 | 2,457 | 2,862,610 | 1,496,121 | U.V. | 2,507,342 | 1,340,947 | 1914 |
| 26 | Hastings | 2,601 | 6,824 | 3,618 | 1,637,520 | 927,499 | ″ | 1,568,540 | 896,454 | 1911 |
| 27 | Dannevirke | 1,270 | 3,656 | 1,192 | 769,376 | 381,859 | ″ | 710,612 | 361,082 | 1911 |
| 28 | Woodville | 1,240 | 1,264 | 1,041 | 159,675 | 59,614 | ″ | 136,953 | 53,785 | 1913 |
| 41 | Waipawa | 4,810 | 1,174 | 534 | 262,472 | 142,134 | ″ | 240,642 | 134,224 | 1914 |
| 44A, 44C | Waipukurau | 1,046 | 1,132 | 471 | 208,706 | 133,633 | ″ | 194,152 | 127,995 | 1908 |
| 61 | New Plymouth | 4,088 | 7,983 | 3,170 | 2,204m815 | 1,332,112 | A.V. | 1,980,832 | 1,192,442 | 1914 |
| 62 | Hawera | 750 | 3,017 | 1,126 | 660,455 | 321,051 | U.V. | 610,028 | 293,619 | 1912 |
| 63 | Patea | 1,430 | 1,031 | 390 | 138,788 | 57,425 | A.V. | 115,248 | 51,320 | 1914 |
| 70 | Waitara | 1,336 | 1,631 | 748 | 201,642 | 84,001 | C.V. | 192,609 | 80,201 | 1910 |
| 74 | Inglewood | 703 | 1,430 | 514 | 189,995 | 83,877 | ″ | 170,376 | 72,199 | 1914 |
| 91 | Stratford | 1,920 | 3,015 | 1,882 | 531,507 | 239,383 | U.V. | 489,861 | 216,165 | 1912 |
| 97A | Eltham | 1,590 | 1,951 | 641 | 386,670 | 193,326 | C.V. | 364,054 | 184,270 | 1914 |
| 116 | Wanganui | 4,944 | 13,751 | 3,845 | 2,792,472 | 1,686,113 | A.V. | 2,536,234 | 1,530,515 | 1911 |
| 117 | Marton | 1,423 | 1,663 | 815 | 320,982 | 144,386 | U.V. | 294,721 | 132,775 | 1913 |
| 118H | Ohakune | 3,224 | 1,333 | 491 | 100,436 | 41,915 | ″ | 87,275 | 31,644 | 1912 |
| 125A | Taihape | 1,230 | 1,874 | 584 | 328,330 | 174,449 | C.V. | 275,446 | 146,149 | 1914 |
| 1 | Feilding | 2,450 | 3,658 | 1,707 | 919,979 | 504,206 | U.V. | 845,036 | 451,215 | 1909 |
| 2 | Palmerston North | 4,595 | 12,042 | 3,809 | 2,926,248 | 1,653,845 | ″ | 2,743,616 | 1,551,351 | 1914 |
| 3 | Foxton | 1,240 | 1,894 | 602 | 249,674 | 113,662 | ″ | 221,866 | 100,969 | 1911 |
| 4 | Onslow | 2,000 | 2,019 | 1,199 | 542,003 | 270,022 | ″ | 517,469 | 258,632 | 1914 |
| 5 | Karori | 2,240 | 1,626 | 1,332 | 515,365 | 318,645 | ″ | 478,317 | 293,045 | 1913 |
| WELLINGTON— | ||||||||||
| 4A | Onslow portion | 9,500 | 67,708 | 486 | 327,680 | 206,961 | ″ | 304,123 | 186,355 | 1913 |
| 5A | Karori portion | 872 | 509,168 | 221,190 | ″ | 436,328 | 200,005 | 1913 | ||
| 7 | City portion | 11,585 | 17,505,472 | 9,528,698 | ″ | 16,006,125 | 9,380,767 | 1914 | ||
| 8 | Kilbirnie portion | 3,070 | 1,440,194 | 679,484 | ″ | 1,409,758 | 657,408 | 1913 | ||
| 9 | Inland Bay portion | 1,925 | 648,725 | 323,955 | ″ | 611,340 | 308,797 | 1913 | ||
| 10 | Ohiro portion | 2,554 | 1,121,354 | 478,153 | ″ | 1,086,697 | 456,918 | 1913 | ||
| 24A | Levin | 1,330 | 1,860 | 1,024 | 304,020 | 147,990 | C.V | 280,203 | 133,802 | 1914 |
| 29 | Pahiatua | 720 | 1,456 | 570 | 233,369 | 101,223 | U.V. | 220,342 | 97,815 | 1906 |
| 30 | Masterton | 2,350 | 5,781 | 1,840 | 1,253,370 | 572,750 | ″ | 1,133,808 | 535,398 | 1907 |
| 31 | Carterton | 1,920 | 1,658 | 762 | 281,233 | 118,648 | C.V. | 261,760 | 112,240 | 1908 |
| 32 | Greytown | 3,907 | 1,117 | 464 | 200,729 | 84,353 | A.V. | 185,556 | 82,614 | 1911 |
| 33 | Lower Hutt | 3,255 | 4,906 | 3,124 | 1,431,943 | 862,406 | U.V. | 1,362,778 | 811,950 | 1911 |
| 34 | Petone | 1,060 | 7,263 | 2,099 | 1,389,190 | 688,609 | ″ | 1,258,335 | 601,009 | 1911 |
| 42B | Eketahuna | 960 | 865 | 448 | 154,033 | 68,415 | ″ | 141,615 | 63,800 | 1912 |
| 64A | Eastbourne | 1,380 | 620 | 786 | 186,582 | 102,179 | ″ | 178,232 | 96,504 | 1914 |
| 66 | Miramar | 2,250 | 1,780 | 1,822 | 817,969 | 514,648 | ″ | 732,888 | 455,969 | 1914 |
| 67 | Richmond | 2,300 | 772 | 247 | 142,108 | 76,050 | C.V. | 135,320 | 73,367 | 1910 |
| 68 | Nelson | 4,966 | 8,522 | 2,541 | 1,744,943 | 845,223 | A.V. | 1,617,742 | 788,666 | 1914 |
| 69 | Picton | 920 | 1,445 | 825 | 290,621 | 153,547 | U.V. | 256,749 | 131,329 | 1909 |
| 70 | Blenheim | 1,613 | 4,010 | 1,628 | 924,378 | 473,342 | ″ | 846,521 | 432,864 | 1914 |
| 77 | Motueka | 5,960 | 1,352 | 426 | 188,557 | 89,793 | C.V. | 180,855 | 87,797 | 1909 |
| 98 | Westport | 760 | 5,205 | 1,340 | 747,547 | 385,913 | U.V. | 632,352 | 310,548 | 1910 |
| 99 | Greymouth | 2,130 | 5,729 | 1,590 | 828,256 | 270,534 | ″ | 706,170 | 227,979 | 1911 |
| 100 | Brunner | 5,670 | 1,108 | 524 | 71,011 | 11,980 | A.V. | 20,461 | 9,029 | 1898 |
| 101 | Kumara | 842 | 820 | 459 | 34,009 | 6,030 | C.V. | 23,866 | 3,965 | 1904 |
| 102 | Hokitika | 2,000 | 2,363 | 1,110 | 247,133 | 81,303 | U.V. | 202,820 | 65,273 | 1907 |
| 103 | Ross | 3,955 | 672 | 340 | 23,613 | 5,891 | C.V. | 19,173 | 4,779 | 1909 |
| 115A | Runanga | 1,101 | 1,722 | 410 | 58,728 | 20,106 | ″ | 46,783 | 11,961 | 1912 |
| 1 | Rangiora | 1,040 | 1,957 | 682 | 311,472 | 130,267 | U.V. | 283,222 | 122,587 | 1914 |
| 2 | Kaiapoi | 1,020 | 1,945 | 602 | 188,451 | 59,411 | A.V. | 171,461 | 56,646 | 1907 |
| CCHRISTCHURCH— | ||||||||||
| 25 | St. Albans Ward | 5,360 | 56,510 | 4,364 | 2,360,575 | 923,205 | U.V. | 2,326,000 | 908,980 | 1914 |
| 26–30 | Central Ward | 3,984 | 7,647,807 | 4,037,292 | ″ | 6,742,264 | 3,684,146 | 1914 | ||
| 31 | Sydenham Ward | 3,624 | 2,940,653 | 747,553 | ″ | 1,849,258 | 620,512 | 1914 | ||
| 33, 22 A | Linwood Ward | 2,670 | 1,242,381 | 437,564 | ″ | 1,209,951 | 427,144 | 1914 | ||
| 33 | Woolston | 1,276 | 3,804 | 1,180 | 476,579 | 172,641 | ″ | 453,564 | 165,821 | 1908 |
| 34 | New Brighton | 1,500 | 2,106 | 1,829 | 354,154 | 167,585 | ″ | 343,524 | 163,535 | 1913 |
| 35 | Sumner | 4,876 | 2,004 | 1,301 | 528,677 | 272,690 | ″ | 496,417 | 259,660 | 1913 |
| 36 | Lyttelton | 2,014 | 4,151 | 921 | 958,957 | 265,510 | A.V. | 333,842 | 94,450 | 1908 |
| 37 | Akaroa | 228 | 662 | 190 | 106,931 | 44,484 | C.V. | 97,221 | 40,701 | 1911 |
| 39E | Riccarton | 566 | 3,080 | 920 | 531,329 | 180,547 | U.V. | 482,704 | 162,482 | 1909 |
| 48 | Spreydon | 1,295 | 3,819 | 1,616 | 577,430 | 235,360 | ″ | 560,350 | 229,035 | 1914 |
| 63 | Ashburton | 680 | 2,851 | 964 | 472,023 | 203,630 | A.V. | 408,462 | 163,054 | 1905 |
| 64, 64A | Timaru | 2,330 | 12,702 | 3,304 | 2,233,290 | 1,120,531 | ″ | 2,087,780 | 1,047,166 | 1908 |
| 78 | Geraldine | 718 | 1,008 | 384 | 129,602 | 43,745 | C.V. | 115,706 | 39,215 | 1912 |
| 80, 80A | Temuka | 945 | 1,858 | 741 | 234,133 | 66,604 | ″ | 201,221 | 56,609 | 1909 |
| 89 | Waimate | 649 | 1,880 | 640 | 298,881 | 98,639 | U.V. | 265,236 | 90,873 | 1910 |
| DUNEDIN— | ||||||||||
| 46 | Valley Ward | 9,502 | 49,621 | 10,735 | 606,018 | 212,067 | A.V. | 575,006 | 202,020 | 1907 |
| 48 | Roslyn Ward | 986,517 | 347,956 | ″ | 962,657 | 340,641 | 1908 | |||
| 50, 51 | Leith Ward | 3,247,004 | 1,437,365 | ″ | 2,774,047 | 1,230,790 | 1909 | |||
| 52, 53 | Central Ward | 4,045,931 | 1,762,505 | ″ | 3,543,279 | 1,526,555 | 1909 | |||
| 54, 55 | Caversham Ward | 1,551,127 | 449,168 | ″ | 1,389,136 | 398,488 | 1907 | |||
| 2 | Oamaru | 1,111 | 5,499 | 1,638 | 833,333 | 290,531 | ″ | 735,375 | 258,249 | 1910 |
| 3 | Hampden | 640 | 362 | 393 | 27,010 | 9,682 | C.V. | 22,744 | 8,112 | 1907 |
| 23 | Naseby | 113 | 325 | 184 | 21,008 | 2,573 | A.V. | 13,953 | 1,908 | 1912 |
| 24 | Palmerston | 900 | 830 | 462 | 87,337 | 23,901 | C.V. | 74,873 | 21,795 | 1913 |
| 25 | Waikouaiti | 1,952 | 722 | 602 | 74,919 | 27,947 | ″ | 66,884 | 26,665 | 1908 |
| 44 | Port Chalmers | 335 | 2,204 | 529 | 313,050 | 104,990 | A.V. | 231,675 | 88,165 | 1907 |
| 45 | West Harbour | 1,670 | 2,083 | 807 | 204,305 | 74,788 | U.V. | 188,125 | 66,578 | 1907 |
| 47 | Maori Hill | 3,700 | 2,313 | 694 | 428,642 | 184,000 | ″ | 358,762 | 129,415 | 1914 |
| 49 | Mornington | 654 | 5,361 | 1,350 | 594,909 | 190,541 | A.V. | 574,354 | 184,776 | 1907 |
| 56 | St. Kilda | 463 | 4,990 | 1,647 | 849,630 | 305,045 | U.V. | 806,630 | 289,570 | 1913 |
| 65 | Green Island | 780 | 2,116 | 676 | 234,676 | 60,925 | A.V. | 225,031 | 58,815 | 1909 |
| 66 | Mosgiel | 967 | 1,675 | 668 | 256,835 | 97,803 | U.V. | 232,455 | 93,383 | 1912 |
| 67 | Roxburgh | 400 | 462 | 220 | 37,615 | 5,904 | A.V. | 32,570 | 4,784 | 1912 |
| 68 | Lawrence | 640 | 955 | 553 | 114,690 | 31,000 | ″ | 92,445 | 25,730 | 1905 |
| 69 | Tapanui | 124 | 348 | 145 | 32,120 | 9,075 | ″ | 28,850 | 8,535 | 1909 |
| 70 | Milton | 297 | 1,413 | 431 | 182,773 | 56,126 | ″ | 164,253 | 52,726 | 1907 |
| 71 | Balclutha | 568 | 1,323 | 501 | 211,903 | 82,283 | U.V. | 195,328 | 75,713 | 1911 |
| 72 | Kaitangata | 1,158 | 1,644 | 736 | 108,376 | 31,340 | A.V. | 97,430 | 28,830 | 1905 |
| 114 | Cromwell | 640 | 615 | 499 | 44,802 | 10,210 | ″ | 37,905 | 8,256 | 1906 |
| 115 | Alexandra | 860 | 809 | 461 | 53,454 | 10,098 | ″ | 47,696 | 8,903 | 1906 |
| 1 | Arrowtown | 390 | 425 | 180 | 20,909 | 3,325 | ″ | 14,854 | 2,827 | 1905 |
| 2 | Queenstown | 923 | 730 | 267 | 64,915 | 14,544 | ″ | 51,801 | 12,244 | 1905 |
| 20 | Gore | 1,150 | 3,510 | 1,217 | 614,953 | 248,026 | U.V. | 556,768 | 218,716 | 1911 |
| 21 | Mataura | 1,530 | 1,291 | 447 | 200,530 | 74,327 | ″ | 190,879 | 69,837 | 1912 |
| 22 | Winton | 160 | 607 | 227 | 87,832 | 27,935 | ″ | 78,702 | 25,469 | 1911 |
| 27A | Invercargill | 2,549 | 14,526 | 4,116 | 3,068,084 | 1,274,361 | ″ | 2,745,229 | 1,121,847 | 1911 |
| 28 | Invercargill South | 2,280 | 1,654 | 788 | 259,100 | 136,394 | ″ | 251,950 | 132,674 | 1914 |
| 29 | Riverton | 718 | 1,007 | 521 | 131,030 | 44,840 | ″ | 113,196 | 42,288 | 1913 |
| 30 | Campbelltown | 2,000 | 1,919 | 680 | 280,457 | 98,570 | ″ | 263,213 | 91,635 | 1909 |
TABLE SHOWING CAPITAL VALUE OF LANDWITH IMPROVEMENTS (AND DISTINGUISHINGTHE UNIMPROVED VALUE OF LAND) FOR ALL LANDS ANDFOR RATEABLE PROPERTIES INEACH TOWN DISTRICT (OUTSIDE THE JURISDICTION OFANY COUNTY) IN NEW ZEALAND, AS ATTHE 31ST MARCH, 1914, WITH THE POPULATION, NUMBER OF ASSESSMENTS ON VALUATION ROLL, AND THE YEARIN WHICHTHE VALUES WERELAST REVISED.
| Roll No. | Town District, Independent of County (outside County Jurisdiction). | Estimated Population, 1st April, 1914. | Number of Assessments on Valuation Roll. | Gross Values. | System of Rating. | Rateable Values. | Values last revised as at 31st March, in | ||
|---|---|---|---|---|---|---|---|---|---|
| Capital Value (Land and Improvements). | Unimproved Value of Land (included in previous Column). | Capital Value (Land and Improvements). | Unimproved Value of Land (included in previous Column). | ||||||
| £ | £ | £ | £ | ||||||
| 24A | Hikurangi | 744 | 291 | 72,570 | 40,195 | U.V. | 69,525 | 38,950 | 1913 |
| 84 | Helensville | 720 | 261 | 105,785 | 35,225 | A.V. | 96,125 | 32,360 | 1911 |
| 79B | Warkworth | 740 | 194 | 82,967 | 26,570 | C.V. | 76,917 | 25,180 | 1912 |
| 105A | Ellerslie | 1,018 | 299 | 231,013 | 106,590 | ″ | 214,238 | 97,855 | 1909 |
| 92B | New Lynn | 636 | 268 | 144,285 | 79,515 | ″ | 142,350 | 77,860 | 1912 |
| 125 | Papakura | 678 | 288 | 111,259 | 67,839 | ″ | 101,594 | 60,679 | 1912 |
| 143A | Huntly | 1,455 | 290 | 168,640 | 92,505 | ″ | 163,620 | 90,885 | 1911 |
| 157 | Ngaruawahia | 527 | 301 | 127,188 | 63,873 | ″ | 106,154 | 50,039 | 1913 |
| 163 | Te Awamutu | 711 | 314 | 265,665 | 155,981 | ″ | 247,470 | 145,586 | 1913 |
| 184B | Te Puke | 570 | 127 | 69,488 | 37,836 | U.V. | 64,040 | 35,333 | 1912 |
| 192 | Rotorua | 2,636 | 706 | 753,935 | 469,932 | C.V. | 503,002 | 285,287 | 1911 |
| 32 | Taradale | 970 | 297 | 148,995 | 91,860 | ″ | 145,215 | 90,875 | 1908 |
| 33A | Napier South | 746 | 324 | 192,299 | 100,978 | U.V. | 189,364 | 98,133 | 1912 |
| 38A | Havelock North | 686 | 278 | 185,856 | 91,034 | C.V. | 177,928 | 87,454 | 1914 |
| 94 | Manaia | 603 | 374 | 74,650 | 23,386 | ″ | 67,613 | 21,951 | 1907 |
| 111 | Waverley | 703 | 257 | 97,250 | 43,316 | U.V. | 85,850 | 39,396 | 1912 |
| 115A | Gonville | 1,801 | 789 | 443,490 | 218,247 | ″ | 410,542 | 202,847 | 1912 |
| 115B | Castlecliff | 716 | 464 | 123,357 | 56,106 | C.V. | 115,977 | 50,736 | 1913 |
| 154 | Manunui | 570 | 149 | 49,886 | 23,043 | A.V. | 45,218 | 20,072 | 1912 |
| 118J | Rangataua | 957 | 171 | 35,284 | 10,343 | U.V. | 28,208 | 6,622 | 1913 |
| 125B | Mangaweka | 591 | 259 | 56,951 | 21,973 | C.V. | 48,802 | 18,103 | 1914 |
| 126 | Hunterville | 760 | 273 | 93,619 | 37,330 | ″ | 83,633 | 33,343 | 1914 |
| 136 | Bull's | 600 | 177 | 56,759 | 23,716 | A.V. | 50,721 | 21,875 | 1908 |
| 25A | Otaki | 827 | 515 | 196,081 | 111,492 | C.V. | 181,187 | 105,714 | 1908 |
| 52B | Martinborough | 676 | 451 | 150,072 | 53,549 | U.V. | 137,216 | 51,899 | 1914 |
| 54 | Featherston | 797 | 335 | 101,192 | 32,344 | ″ | 90,748 | 30,438 | 1909 |
| 59 | Johnsonville | 1,075 | 677 | 192,556 | 104,989 | ″ | 180,235 | 96,824 | 1914 |
| 62A | Upper Hutt | 1,216 | 1,160 | 231,211 | 130,598 | ″ | 213,903 | 125,268 | 1914 |
| 71 | Hampstead | 1,590 | 472 | 158,391 | 65,875 | C.V. | 147,071 | 64,781 | 1908 |
| 75 | Tinwald | 574 | 247 | 84,043 | 45,302 | ″ | 81,060 | 44,697 | 1905 |
| 83 | Pleasant Point | 525 | 235 | 76,122 | 36,582 | ″ | 65,417 | 32,652 | 1914 |
| 64A | Bay | 1,092 | 698 | 308,277 | 133,004 | ″ | 301,557 | 131,199 | 1911 |
| 35 | Otauta...... | 801 | 327 | 124,480 | 50,258 | U.V. | 114,901 | 47,193 | 1912 |
| 52 | Wyndham | 713 | 275 | 110,946 | 50,275 | A.V. | 97,619 | 44,235 | 1912 |
Table of Contents
PREVIOUS issues of this book contain a schedule of the Acts in force coming within the definition of “labour laws,” together with those statutes now repealed and incorporated in existing laws. Detailed references to the principal labour laws are also given. Considerations of space prevent the repetition of the descriptive letterpress in this issue of the Year-book.
The business dealt with by the Arbitration Court and Conciliation Councils during the year ended 31st March, 1915, may be summarized as follows:—
| Number of Cases. | |
|---|---|
| Industrial agreements | 34 |
| Recommendations of Conciliation Councils | 93 |
| Awards of Arbitration Court | 71 |
| Enforcement of awards (cases conducted by Labour Department) | 4 |
| Cases under the Workers' Compensation Act | 65 |
The following is the number of cases brought before Magistrates during the year ended the 31st March, 1915:—
| Cause. | Number of Cases. |
|---|---|
| Enforcement of awards | 330 |
Of 334 cases (including four in the Arbitration Court) in which proceedings were taken by the Labour Department for breaches of award of provisions of the Industrial Conciliation and Arbitration Act, 317 were decided in favour of the Department and seventeen dismissed. In six cases conducted by unions, four convictions were recorded and two cases were dismissed.
During the year ended the 31st March, 1915, the number of industrial disputes brought under the notice of the Commissioners was 101. Sixty-one disputes were settled by mutual agreement, twenty-three were partly settled, and seventeen were wholly referred to the Arbitration Court.
INDUSTRIAL DISPUTES DEALTWITH BY CONCILIATION COMMISSIONERS AND COUNCILS DURINGTOE YEAR ENDEDTHE 31ST MARCH, 1915.
| Number of Disputes. | ||||
|---|---|---|---|---|
| District. | Total Number of Disputes dealt with. | Fully settled. | Partially settled. | Wholly referred to the Arbitration Court. |
| Northern and Taranaki | 27 | 12 | 7 | 8 |
| Wellington, Marlborough, Nelson, and Westland | 47 | 33 | 9 | 5 |
| Canterbury, Otago, and Southland | 27 | 16 | 7 | 4 |
| Totals | 101 | 61 | 23 | 17 |
Partial settlements represent cases in which there was failure to agree on one or more of the points in dispute, and these undecided questions were referred to the Arbitration Court for judgment. The cases wholly referred to the Court are those in which substantially no agreement could be arrived at.
The cost of administration of the Act by the Arbitration Court and Councils of Conciliation during the year 1914–15 was £7,962. Of this amount £4,234 is allocated to the Arbitration Court and £3,728 to Conciliation Councils. The total for the previous year was £7,756.
Returns of the number and membership of industrial unions of employers and workers are compiled for the calendar year. The number under each heading on the 31st December of each year from 1905 to 1914 inclusive is shown in the following table:—
NUMBER OF UNIONS, AND MEMBERSHIP, 1905–14.
| Employers. | Workers. | |||
|---|---|---|---|---|
| Year. | Unions, | Membership. | Unions. | Membership. |
| 1905 | 118 | 3,276 | 261 | 29,869 |
| 1906 | 109 | 3,337 | 274 | 34,978 |
| 1907 | 121 | 3,630 | 310 | 45,614 |
| 1908 | 122 | 3,918 | 325 | 49,347 |
| 1909 | 120 | 3,702 | 308 | 54,519 |
| 1910 | 118 | 4,262 | 308 | 57,091 |
| 1911 | 118 | 4,251 | 307 | 55,629 |
| 1912 | 123 | 4,410 | 322 | 60,622 |
| 1913 | 134 | 4,700 | 372 | 71,544 |
| 1914 | 149 | 5,819 | 403 | 73,991 |
It will be soon that during the year 1914 there has been an increase of fifteen employers' unions, the total membership of which has increased by 1,119; and an increase of thirty-one workers' unions, the total membership of which shows a gain of 2,447. The extraordinary increase of 10,922 the previous year has not only been maintained but there has also been an additional increase of 2,447.
The following is a summary of strikes in New Zealand from the inception of the Industrial Conciliation and Arbitration Act (1894) to the 31st March, 1915:—
* Of this total thirty-one strikes were of slaughtermen, consisting of two separate sympathetic disputes, one in 1906–7 and the other in 1912–13, spread over practically the whole of the Dominion. Six were within the scope of the Act, and twenty-five outside it. † In three other cases the employers were not involved. | ||
|---|---|---|
| Number of strikes coming within the scope of the Act | 53 | |
| Number of strikes outside the Act | 95 | |
| Total number of strikes | *148 | |
| Number of disputes included in total which may be classed as trivial or unimportant | 52 | |
| Men fully successful in (cases) | 27 | |
| Employers successful in ″ | 85 | |
| Compromise effected in ″ | †33 | |
| Average duration of all strikes (trivial cases not included), (days) | 32 | |
| Total number of strikers (trivial cases not included) | 17,317 | |
| Total amount of fines inflicted on strikers | £1,933 | |
| Total amount collected to date | £1,549 | |
Particulars re strikes which occurred prior to the 31st March, 1914, will be found in issues of the Year-book for 1914 and preceding years. Information re strikes occurring during the year ended the 31st March, 1915, is given in the pages following, the information being as extracted from the Annual Report of the Labour Department.
Sixteen men struck work on account of the employment of certain tradesmen (on the same job) who had refused to cease work in sympathy with the waterside workers' strike of 1913. After a few days' idleness the strikers' places were filled by other tradesmen, who formed a second union in the trade and registered the same under the Act. As the strikers were bound by an award of the Arbitration Court, proceedings were instituted under the Industrial Conciliation and Arbitration Act for the offence, but were withdrawn, the men expressing regret for the occurrence, and claiming that they had been sufficiently punished by the registration of a separate union.
In this case there were five men engaged in working six vats of cheese, when one of them was called away by the management to other work. The men contended that it required their full complement to work the vats, and did not start work at the prescribed hour the following morning, but upon an additional hand being put on work was resumed. The men were not bound by any award or industrial agreement, and did not therefore commit a breach of the Industrial Conciliation and Arbitration Act. No proceedings were taken under the Labour Disputes Investigation Act, the offence being trivial.
Fourteen men refused to work, demanding an increase from 1s. 3d. per hour for all time worked by them to 1s. 3d. per hour, together with payment for overtime, at the rate of time and a half, for time worked after 5 p.m. On account of the rise of tide it was claimed that the trench periodically became waterlogged, necessitating the temporary stoppage of work so that at times it was necessary to commence work before 8 a.m. and continue after 5 p.m. After a few days' idleness the men resumed work under the former conditions pending an agreement being arrived at between them and the employers. Owing to the employment being casual only (at per hour) it was not considered that the contract of service had been broken, and proceedings were therefore not taken under the Labour Disputes Investigation Act.
In this instance the whole of the stokehole crew refused to work just prior to the departure of the steamer from Lyttelton, demanding the dismissal of the third engineer, with whom they had an alleged grievance regarding their treatment while at work. The men were subsequently paid off by the company, and applications were thereupon called for others. After the ship had been laid up for fourteen days, a full complement was obtained and her running resumed. Although some of these men gave the requisite twenty-four hours' notice of termination of engagement, and the company agreed to the discharge of all the men, such notice should have been given at Wellington, instead of Lyttelton, and a breach of the Industrial Conciliation and Arbitration Act was therefore committed, the men being bound by an industrial agreement under that Act. It was not, however, deemed necessary to take action.
The following are cases of lockouts to date under sections 4 and 5 of the Industrial Conciliation and Arbitration Amendment Act, 1908. They are all of a trivial nature.
1907.—A Reefton gold-mining company was proceeded against for an alleged lockout. The dispute arose on the “eight-hours bank-to-bank” question and the arrangement of overtime payment. The Court held that the company had not closed down the work of the mine in order to lock out its men so as to compel them to meet the company on the above matter, but to make the necessary connection with another shaft in a neighbouring mine so as to reduce the time taken by the miners to reach the face.
1908.—In connection with the Blackball strike, the Blackball Coal-miners' Union proceeded against the Blackball Company for an alleged lockout in dismissing the men, which action caused a strike. The Court held that, as only seven men out of eighty were dismissed, and the company was willing and anxious to carry on operations with the remaining seventy-three, it was clear no lockout had occurred.
1910.—A case under the Wellington Shearers' award was taken against a Dannevirke sheepowner. The men refused to shear, alleging that the sheep were wet, and in consequence the employer dismissed them. Action was taken by the Department, and the case was dismissed by the Magistrate, who held that on the evidence the sheep were dry, and therefore no offence had been committed.
A case under the Hawke's Bay Fishermen's industrial agreement was taken against a Napier trawling company. A trawler had been running at a loss, and the owners asked for a conference with the crew in reference to a proposed charter and partnership scheme. Ostensibly to allow of this conference being hold the boat was laid up for two days, and it was alleged that this was done with the intention of compelling the crow to agree to the proposed scheme. The Magistrate held that the evidence was insufficiently convincing to impute such an intention to the defendant company, and dismissed the case.
1913.—There was one alleged lockout during the year. A sheepowner was reported to have locked out a number of shearers who had refused to shear certain sheep which they considered to be wet. In legal proceedings instituted by the Department of Labour the Court held that the wetness was due not to rain but to perspiration, and dismissed the case.
The labour dispute in connection with the gold-mining industry, which occurred at Reefton on 18th May, 1912, and lasted until 16th November, 1912, was neither a “strike” nor a “lockout” within the meaning of the Industrial Conciliation and Arbitration Act. The trouble arose over the company's decision to work the Waugh drill machines, commonly known as “poppers,” single-handed, instead of continuing to employ two men on each machine. When the men were asked to work the poppers single-handed they refused to do so, and were paid off. Work was thus brought practically to a standstill, and, as a consequence, 519 men were rendered idle. The deadlock continued for nearly six months, after which an industrial agreement was arrived at providing for the working of the poppers by men in pairs, for the non-victimization of members of the union who had taken part in the dispute, and for the re-engagement of all men employed at the mines when the dispute commenced if they applied for work within fourteen days of the date of the agreement. Both the company and the workers were bound by the provisions of the Industrial Conciliation and Arbitration Act, but there was not sufficient evidence to show that the company had locked out the men, on account of the men refusing to work under the proposed new conditions. Had the men not refused to work, it may have been necessary for the company to enforce its demands by means of a lockout. Regarding the men's action the cessation of work was not effected with the intention of compelling the employers to agree to new terms of employment or to comply with demands made by the workers. The latter made no demands, and therefore no strike within the meaning of the Act was deemed to have occurred.
The co-operative system of carrying out public works as applied to railway and road formation was adopted by the Government in 1891, and is still continued. During the period 1891 to 1912 the principal works of this class undertaken by the State were carried out almost entirely by this means. The system worked very well, but latterly altered conditions and the attitude of a section of the workmen rendered it advisable to reintroduce to some extent the direct contract system, and both systems of carrying out work are now in force.
The co-operative contract system is somewhat as follows When a length of railway or road is to be constructed on the co-operative principle the formation-work is divided into sections the size of which depends upon the difficulty of the work. Plans and a simple specification of the work are prepared, also an estimate of the cost, based on the rate of wages ruling in the district for similar work. The work, at a price reckoned at so much per unit of quantity or measurement, is offered to a party of men, who, if they accept, become the contractors. The work done by the men is measured periodically, and full payment made to the party, who divide the money amongst themselves according to the time worked by each workman. The engineer in charge of the work has a certain amount of discretion and control in respect of the character of the men employed, the progress of the work, hours of labour, &c.
The constitution of the party is left very much to the men themselves, and they have power, subject to approval of the engineer, to ballot but any member who proves himself undesirable or inefficient. The Department supplies the men with materials, explosives, &c., at cost price.
When the work is let by direct contract tenders are publicly invited, but the sections of work included in each contract are more extensive than under the co-operative system, yet not too large to enable parties of working contractors to tender.
The number of labourers employed under the co-operative system during each month of the year ended the 31st March, 1915, was as follows:—
| Month. | Roads. | Railways. | Total. |
|---|---|---|---|
| April, 1914 | 1,779 | 1,886 | 3,665 |
| May, ” | 1,809 | 1,973 | 3,782 |
| June. ” | 2,291 | 1,944 | 4,235 |
| July, ” | 2,369 | 2,095 | 4,464 |
| August, ” | 2,447 | 2,246 | 4,793 |
| September, ” | 2,552 | 2,247 | 4,809 |
| October ” | 2,658 | 2,264 | 4,922 |
| November, ” | 2,616 | 2,873 | 5,489 |
| December, ” | 2,555 | 2,983 | 5,538 |
| January, 1915 | 3,140 | 2,215 | 5,355 |
| February, ” | 2,712 | 2,678 | 5,390 |
| March, ” | 3,003 | 2,480 | 5,483 |
The (monthly) average number of men employed in each year since 1891–92 was as follows:—
| Year. | Roads. | Railways, Buildings, &c. | Total. |
|---|---|---|---|
| 1891–92 | 261 | 527 | 788 |
| 1892–93 | 280 | 842 | 1,122 |
| 1893–94 | 933 | 1,015 | 1,948 |
| 1894–95 | 1,103 | 962 | 2,065 |
| 1895–96 | 1,572 | 764 | 2,336 |
| 1896–97 | 1,459 | 854 | 2,313 |
| 1897–98 | 1,552 | 890 | 2,442 |
| 1898–99 | 1,613 | 1,194 | 2,807 |
| 1899–1900 | 1,825 | 1,243 | 3,068 |
| 1900–1 | 1,820 | 2,090 | 3,910 |
| 1901–2 | 1,894 | 2,673 | 4,567 |
| 1902–3 | 1,319 | 1,733 | 3,052 |
| 1903–4 | 1,493 | 2,305 | 3,798 |
| 1904–5 | 1,407 | 2,119 | 3,526 |
| 1905–6 | 3,440 | 2,345 | 5,785 |
| 1906–7 | 2,393 | 4,614 | 7,007 |
| 1907–8 | 2,132 | 3,000 | 5,132 |
| 1908–9 | 3,482 | 4,031 | 7,513 |
| 1909–10 | 1,762 | 3,929 | 5,691 |
| 1910–11 | 1,920 | 3,450 | 5,370 |
| 1911–12 | 3,128 | 3,418 | 6,546 |
| 1912–13 | 2,730 | 3,098 | 5,828 |
| 1913–14 | 1,964 | 1,944 | 3,908 |
| 1914–15 | 2,494 | 2,234 | 4,728 |
The total number of men for whom employment has been found by the Department of Labour up to the end of March, 1915, is given below. The statement also shows the number of persons dependent upon the men assisted:—
| Year ended 31st March. | Men. | Dependants. |
|---|---|---|
* 10 months only | ||
| 1892* | 2,593 | 4,729 |
| 1893 | 3,874 | 7,802 |
| 1894 | 3,341 | 7,942 |
| 1895 | 3,030 | 8,883 |
| 1896 | 2,871 | 8,424 |
| 1897 | 1,718 | 4,719 |
| 1898 | 2,035 | 4,928 |
| 1899 | 2,115 | 4,759 |
| 1900 | 2,147 | 4,471 |
| 1901 | 3,124 | 5,432 |
| 1902 | 1,830 | 2,747 |
| 1903 | 3,704 | 5,934 |
| 1904 | 2,860 | 3,085 |
| 1905 | 3,130 | 3,425 |
| 1906 | 6,712 | 7,351 |
| 1907 | 7,393 | 4,187 |
| 1908 | 6,305 | 4,408 |
| 1909 | 10,391 | 7,510 |
| 1910 | 8,506 | 10,164 |
| 1911 | 7,102 | 8,454 |
| 1912 | 5,735 | 4,233 |
| 1913 | 5,848 | 5,122 |
| 1914 | 5,645 | 4,295 |
| 1915 | 7,515 | 8,342 |
| 109,524 | 141,346 | |
In each of the four chief centres of population—Auckland, Wellington, Christchurch, and Dunedin—women's employment branches of the Labour Department were established in June, 1908. In January, 1909, a branch was opened at Nelson, and in October, 1910, a branch was established at Masterton. Each branch is in charge of an experienced female officer, and every assistance is given, free of charge, to women seeking employment. During the year ended the 31st March, 1915, work was found for 2,165 women; making a total of 16,656 women assisted since the initiation of the system. In most cases the employment was domestic service.
Table of Contents
THE investigation of price-changes was undertaken by the Statistical Office of New Zealand early in 1914, and the section of the inquiry dealing with retail prices has been completed as regards past years, and put on a sure footing for future years. At the same time, data was collected of wholesale prices in hack years; but this section of the inquiry, together with that dealing with import and export values, has had to be postponed until a more favourable period. The section on exports in this issue of the Year-book, however, contains a discussion of export values and the effect of prices on exports in New Zealand.
Retail prices were collected and tabulated for each year since 1891 for each of the four large centres of the Dominion. The commodities considered numbered fifty-nine, and considerable care was taken to ensure that they were representative of the commodities in general use, and were weighted in proportion to their importance. A full discussion of the method adopted (the aggregate-expenditure method devised by Mr. G. H. Knibbs. C.M.G., Commonwealth Statistician), together with the full results of the inquiry, and complete tables of the actual prices on which the index numbers were based will be found in the “Report on the Cost of Living in New Zealand. 1891–1914.” The following section is merely a short summary of some of the results given in that report. The commodities treated were divided into five groups, as under:—
Groceries.—Bread, flour, oatmeal, rice, sago, tapioca, tea, coffee, cocoa, sugar, salt, pepper, jam, honey, golden syrup, treacle, raisins, currants; apricots, poaches, and pears, tinned; prunes and apricots, dried; potatoes, onions; salmon and herrings, tinned: starch, blue, soap, tobacco.
Dairy-produce.—Milk, butter, cheese, eggs; bacon, shoulder and middle cut; ham.
Meal.—Beef—sirloin, brisket, prime ribs, rump-steak, top-side, stewing steak, corned round, corned roll, corned brisket; mutton—leg, shoulder, loin, neck, chops; pork—leg, loin, belly, chops; sausages—beef and pork; tripe.
House-rent of houses from three to nine rooms and over.
Fuel and Light.—Coal, coke, firewood, kerosene, gas, electricity, and candles.
The main tables of the index numbers are shown on the following pages.
| INDEX NUMBERS FOR AUCKLAND, WELLINGTON, CHRISTCHURCH, DUNEDIN, AND FOR AVERAGE OF FOUR CENTRES FOREACH YEAR 1891–1914. | |||||
|---|---|---|---|---|---|
| Year. | Auckland. | Wellington. | Christchurch. | Dunedin. | Average of Four Centres. |
* No data available for Christchurch for these years. | |||||
| (Base: Average aggregate annual expenditure four chief centres. 1909–13 = 1,000.) | |||||
| 1891 | 1,002 | 1,030 | * | 1,036 | * |
| 1892 | 957 | 999 | * | 1,022 | * |
| 1893 | 1,010 | 1,044 | * | 1,009 | * |
| 1894 | 968 | 998 | * | 967 | * |
| 1895 | 924 | 984 | * | 931 | * |
| 1896 | 949 | 962 | * | 963 | * |
| 1897 | 981 | 973 | * | 992 | * |
| 1898 | 1,009 | 1,073 | * | 1,054 | * |
| 1899 | 913 | 941 | 929 | 893 | 919 |
| 1900 | 946 | 961 | 968 | 916 | 948 |
| 1901 | 969 | 967 | 982 | 967 | 971 |
| 1902 | 1,003 | 1,057 | 982 | 1,022 | 1,016 |
| 1903 | 981 | 1,006 | 944 | 999 | 983 |
| 1904 | 957 | 999 | 953 | 938 | 962 |
| 1905 | 1,088 | 1,059 | 1,035 | 1,066 | 1,062 |
| 1906 | 1,085 | 1,100 | 1,027 | 1,078 | 1,072 |
| 1907 | 1,060 | 1,016 | 979 | 1,010 | 1,016 |
| 1908 | 1,024 | 1,017 | 971 | 985 | 999 |
| 1909 | 1,007 | 985 | 927 | 972 | 973 |
| 1910 | 1,036 | 1,017 | 964 | 1,039 | 1,014 |
| 1911 | 981 | 989 | 934 | 968 | 968 |
| 1912 | 1,050 | 1,013 | 986 | 1,039 | 1,022 |
| 1913 | 1,064 | 1,029 | 964 | 1,036 | 1,023 |
| 1914 | 1,041 | 1,122 | 1,055 | 1,085 | 1,076 |
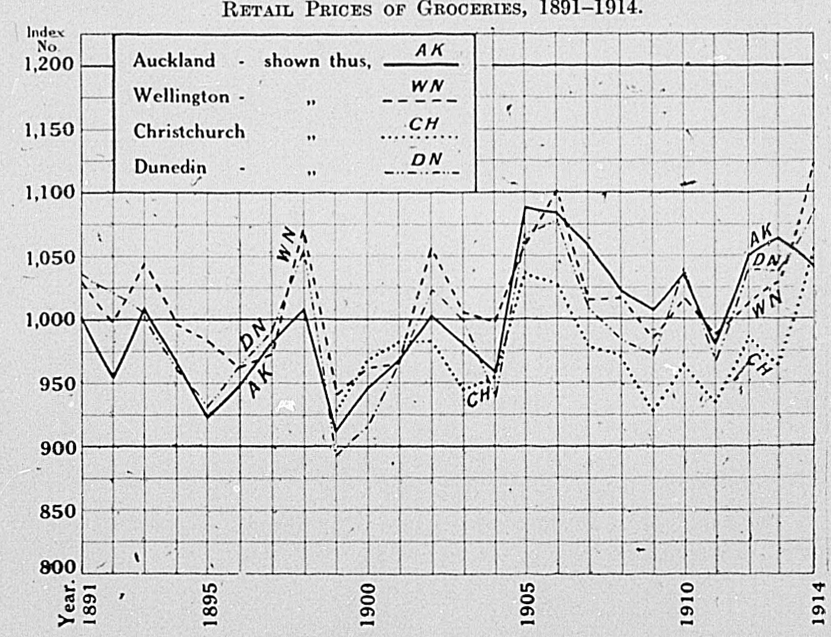
The items grouped under the heading “Groceries,” however, are varied in nature, and it was found advisable to subdivide this group into three, as under:—
Group 1A: Groceries, excluding bread, flour, oatmeal, potatoes, onions, and sugar.
Group 1B: Bread, flour, oatmeal, potatoes, and onions.
Group 1C: Sugar.
The fundamental distinction is that the items comprising Group 1A are almost wholly imported from overseas, while the other two groups are both produced and consumed in the country. Sugar is not strictly a product of New Zealand, the raw material is imported and refined in the Dominion, but it is such an important commodity that it has been deemed advisable to treat it separately. The prices of the first two subgroups follow quite different courses, as may be seen from the following table and graph. It is evident that the five home products not only fluctuate more, but have risen considerably in the last twenty-five years. A cyclical movement may also be traced in the prices of the five home products.
TABLE COMPARINGTHE ANNUAL AND QUINQUENNIAL INDEX NUMBERS OF RETAIL PRICES OFTHE GROUPS 1A (GENERAL GROCERIES) AND 1B (BREAD, FLOUR, OATMEAL, POTATOES, AND ONIONS) AVERAGED OVERTHE FOUR CHIEF CENTRES OF NEW ZEALAND FROM 1891 TO 1914.
| Annual Index Numbers. | Quinquennial Index Numbers. | |||
|---|---|---|---|---|
| Year. | General Groceries. | Bread, Flour, Oatmeal, Potatoes, and Onions. | General Groceries. | Bread, Flour, Oatmeal, Potatoes, and Onions. |
| NOTE.—For the years 1891–98 the average has been compiled from the figures for Auckland, Wellington, and Dunedin only. | ||||
| 1891 | 1,101 | 810 | .. | .. |
| 1892 | 1,076 | 774 | .. | .. |
| 1893 | 1,060 | 868 | 1,061 | 807 |
| 1894 | 1,043 | 795 | 1,045 | 808 |
| 1895 | 1,025 | 786 | 1,036 | 828 |
| 1896 | 1,023 | 817 | 1,033 | 858 |
| 1897 | 1,031 | 872 | 1,029 | 845 |
| 1898 | 1,041 | 1,018 | 1,029 | 842 |
| 1899 | 1,027 | 731 | 1,027 | 848 |
| 1900 | 1,025 | 771 | 1,023 | 868 |
| 1901 | 1,003 | 848 | 1,018 | 844 |
| 1902 | 1,021 | 972 | 1,014 | 867 |
| 1903 | 1,014 | 899 | 1,009 | 927 |
| 1904 | 1,009 | 845 | 1,013 | 977 |
| 1905 | 997 | 1,072 | 1,011 | 984 |
| 1906 | 1,022 | 1,095 | 1,008 | 1,010 |
| 1907 | 1,014 | 1,009 | 1,004 | 1,037 |
| 1908 | 1,000 | 1,029 | 1,002 | 1,033 |
| 1909 | 986 | 981 | 996 | 1,002 |
| 1910 | 990 | 1,053 | 994 | 1,005 |
| 1911 | 992 | 937 | 1,000 | 1,000 |
| 1912 | 1,002 | 1,027 | 1,015 | 1,023 |
| 1913 | 1,029 | 1,001 | .. | .. |
| 1914 | 1,063 | 1,098 | .. | .. |

The price of sugar has been greatly affected by the influence of the Customs tariff, and this influence is especially noticeable after the new tariff of 1907. Prices immediately dropped in all the four centres owing to the removal of the last ½d. per pound duty on sugar; but there has been a distinct tendency for them to rise again.
INDEX NUMBERS SHOWINGTHE VARIATIONS INTHE RETAIL PRICES OF SUGARIN THE FOUR CHIEF CENTRES OF NEW ZEALAND, 1891–1914.
| Year. | Auckland. | Wellington. | Christchurch. | Dunedin. | Average of Four Centres. |
|---|---|---|---|---|---|
| 1891 | 1,312 | 1,383 | .. | 1,454 | .. |
| 1892 | 1,266 | 1,357 | .. | 1,448 | .. |
| 1893 | 1,260 | 1,332 | .. | 1,407 | .. |
| 1894 | 1,227 | 1,297 | .. | 1,370 | .. |
| 1895 | 1,104 | 1,091 | .. | 1,270 | .. |
| 1896 | 1,117 | 1,143 | .. | 1,203 | .. |
| 1897 | 1,078 | 1,169 | .. | 1,203 | .. |
| 1898 | 1,078 | 1,123 | .. | 1,203 | .. |
| 1899 | 1,078 | 1,123 | 1,086 | 1,203 | 1,122 |
| 1900 | 1,143 | 1,212 | 1,284 | 1,208 | 1,212 |
| 1901 | 1,133 | 1,169 | 1,273 | 1,314 | 1,222 |
| 1902 | 1,075 | 1,143 | 1,091 | 1,203 | 1,128 |
| 1903 | 1,084 | 1,123 | 1,091 | 1,199 | 1,124 |
| 1904 | 1,087 | 1,136 | 1,182 | 1,177 | 1,145 |
| 1905 | 1,201 | 1,260 | 1,197 | 1,284 | 1,235 |
| 1906 | 1,117 | 1,195 | 1,169 | 1,175 | 1,179 |
| 1907 | 1,019 | 1,009 | 1,091 | 1,065 | 1,046 |
| 1908 | 851 | 944 | 974 | 870 | 910 |
| 1909 | 881 | 913 | 961 | 883 | 910 |
| 1910 | 946 | 987 | 1,003 | 974 | 978 |
| 1911 | 941 | 965 | 1,045 | 972 | 981 |
| 1912 | 1,045 | 1,029 | 1,115 | 1,078 | 1,092 |
| 1913 | 1,117 | 980 | 1,071 | 1,094 | 1,065 |
| 1914 | 983 | 1,055 | 1,145 | 1,025 | 1,052 |
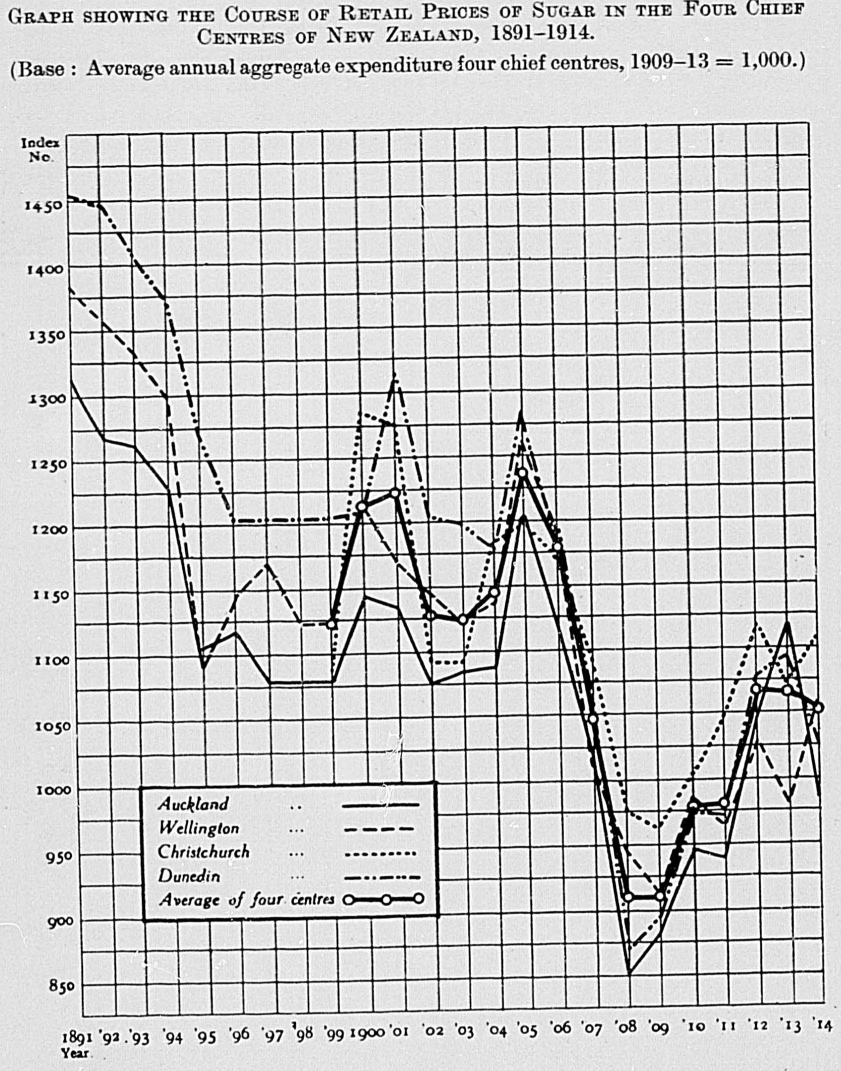
Since the great bulk of the groceries consumed in New Zealand, apart from the five home products, is brought from overseas, it is obvious that the prices of groceries must be greatly influenced by tariff changes. These changes have been important in the period under consideration, since the revisions of 1895, 1900, 1903, and 1907 have all tended to reduce the duties on foodstuffs.
In 1895 the duty on tea was reduced from 6d. to 4d. per pound, while the duty of 10s. per ton levied on salt was removed. In 1900 considerable remissions were made, the duty on tea being reduced from 4d. to 2d., on coffee from 5d to 3d., on dried fruits from 2d. to 1d., while rice and raw coffee were made free. In 1903 the principle of preference was introduced, and British tea was made free of duty. In 1907, the last revision, the duty was taken off sugar and unground spices, reduced on ground spices, removed from golden syrup, treacle, raisins and currants, prunes, and reduced on blue. A fuller discussion of these tariff changes will be found in Section XID of this issue.
The great reductions of duty made on grocery items naturally operated in the direction of checking the rise in prices, and it was found that the level of prices was always tending to rise; but successive tariff revisions lowered the level again.
The second group is smaller and more homogeneous, but very important, comprising as it does two such important commodities as butter and milk. It is especially interesting also from the fact that it includes commodities which, unlike the grocery items, are produced almost wholly in the country and primarily for export. The same tendency for prices to rise is observable here; but there is no clearly defined cyclical movement as in the first group.
INDEX NUMBERS FOR AUCKLAND, WELLINGTON, CHRISTCHURCH, DUNEDIN, AND FOR AVERAGE OF FOUR CENTRES FOREACH YEAR 1891–1914.
(Base: Average aggregate annual expenditure four chief centres, 1909–13 = 1,000.)
| Year. | Auckland. | Wellington. | Christchurch. | Dunedin. | Average of Four Centres |
|---|---|---|---|---|---|
| 1891 | 732 | 795 | 819 | 879 | 806 |
| 1892 | 764 | 822 | 847 | 905 | 835 |
| 1893 | 769 | 822 | 824 | 898 | 828 |
| 1894 | 752 | 803 | 834 | 878 | 817 |
| 1895 | 743 | 882 | 867 | 877 | 842 |
| 1896 | 755 | 829 | 849 | 865 | 825 |
| 1897 | 776 | 799 | 861 | 885 | 830 |
| 1898 | 781 | 831 | 873 | 901 | 847 |
| 1899 | 796 | 829 | 863 | 870 | 840 |
| 1900 | 778 | 824 | 864 | 884 | 838 |
| 1901 | 787 | 935 | 859 | 923 | 876 |
| 1902 | 858 | 893 | 887 | 930 | 892 |
| 1903 | 860 | 873 | 904 | 949 | 897 |
| 1904 | 892 | 872 | 860 | 905 | 882 |
| 1905 | 859 | 869 | 868 | 916 | 878 |
| 1906 | 868 | 936 | 899 | 951 | 914 |
| 1907 | 902 | 961 | 973 | 984 | 955 |
| 1908 | 993 | 1,057 | 991 | 1,038 | 1,020 |
| 1909 | 974 | 975 | 912 | 972 | 958 |
| 1910 | 965 | 996 | 920 | 997 | 970 |
| 1911 | 986 | 1,018 | 948 | 1,021 | 993 |
| 1912 | 998 | 1,076 | 992 | 1,052 | 1,029 |
| 1913 | 1,028 | 1,124 | 1,003 | 1,044 | 1,050 |
| 1914 | 1,026 | 1,117 | 1,010 | 1,064 | 1,054 |
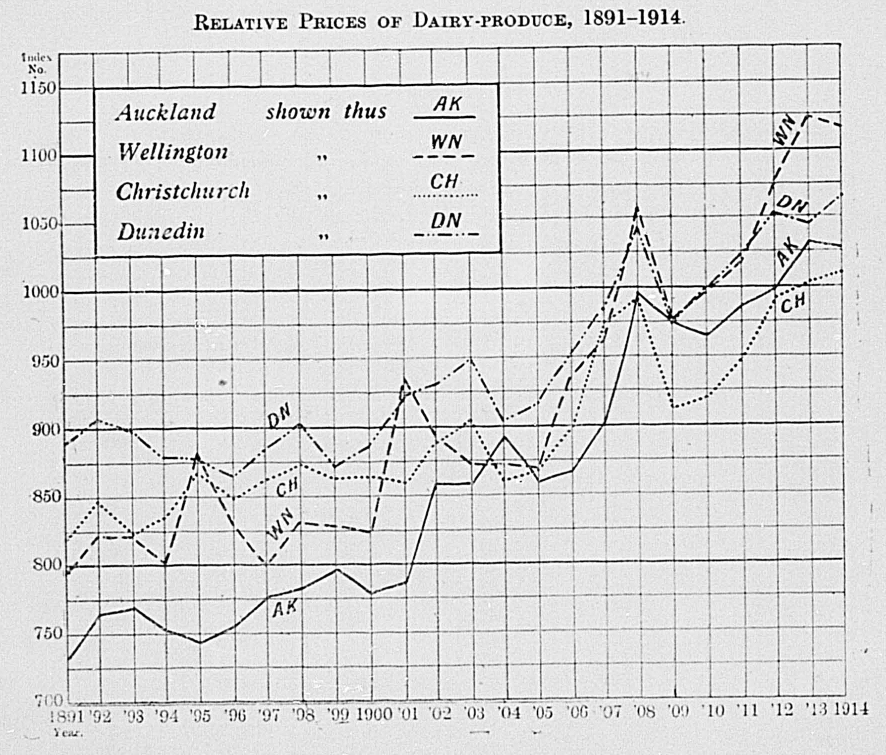
Though New Zealand is primarily a sheep-growing country, investigations which were made prior to this inquiry being undertaken went to show that rather more beef than mutton was consumed in the country itself. The weights were determined, as they were throughout this inquiry, by the estimated annual consumption of each article, so that each commodity was given its correct value in the index number.
The most striking feature of the table is the great local divergence that is apparent between the four centres. Auckland prices are consistently higher and Dunedin prices consistently lower than the central towns, and local influences seem to predominate.
Since 1912 the rise in prices has been very great in each of the four cities In two years retail prices of meat rose more than in the twenty years previously. In twenty-two years from 1891 to 1912 average retail prices of meat rose from 864 to 1,001, an increase of nearly 16 per cent.; by 1914 the index number had reached 1,158, representing an increase since 1891 of nearly 34 per cent.
INDEX NUMBERS FOR AUCKLAND. WELLINGTON, CHRISTCHURCH, DUNEDIN, AND FORAVERAGE OFFOUR CENTRESFOR EACHYEAR, 1891–1914.
(Base: Average aggregate annual expenditure, four chief centres, 1909–13 = 1,000.)
| Year. | Auckland. | Wellington. | Christchurch. | Dunedin. | Average of Four Centres. |
|---|---|---|---|---|---|
| 1891 | 960 | 879 | 901 | 715 | 864 |
| 1892 | 1,029 | 881 | 838 | 715 | 866 |
| 1893 | 1,050 | 894 | 889 | 749 | 896 |
| 1894 | 1,179 | 941 | 888 | 749 | 939 |
| 1895 | 1,044 | 910 | 889 | 749 | 898 |
| 1896 | 1,036 | 901 | 880 | 749 | 892 |
| 1897 | 929 | 862 | 879 | 749 | 855 |
| 1898 | 1,106 | 928 | 884 | 775 | 923 |
| 1899 | 1,046 | 919 | 879 | 775 | 905 |
| 1900 | 989 | 903 | 879 | 825 | 899 |
| 1901 | 966 | 878 | 966 | 825 | 909 |
| 1902 | 966 | 893 | 987 | 830 | 919 |
| 1903 | 961 | 921 | 1,019 | 830 | 933 |
| 1904 | 970 | 928 | 1,012 | 831 | 935 |
| 1905 | 1,083 | 963 | 1,024 | 831 | 975 |
| 1906 | 1,086 | 963 | 1,027 | 831 | 977 |
| 1907 | 1,083 | 1,030 | 1,013 | 831 | 989 |
| 1908 | 1,064 | 973 | 1,031 | 817 | 971 |
| 1909 | 1,084 | 1,026 | 984 | 824 | 980 |
| 1910 | 1,047 | 1,029 | 980 | 851 | 977 |
| 1911 | 1,052 | 1,034 | 995 | 900 | 995 |
| 1912 | 1,033 | 1,024 | 1,034 | 915 | 1,001 |
| 1913 | 1,104 | 1,139 | 1,027 | 917 | 1,047 |
| 1914 | 1,266 | 1,116 | 1,121 | 1,127 | 1,158 |
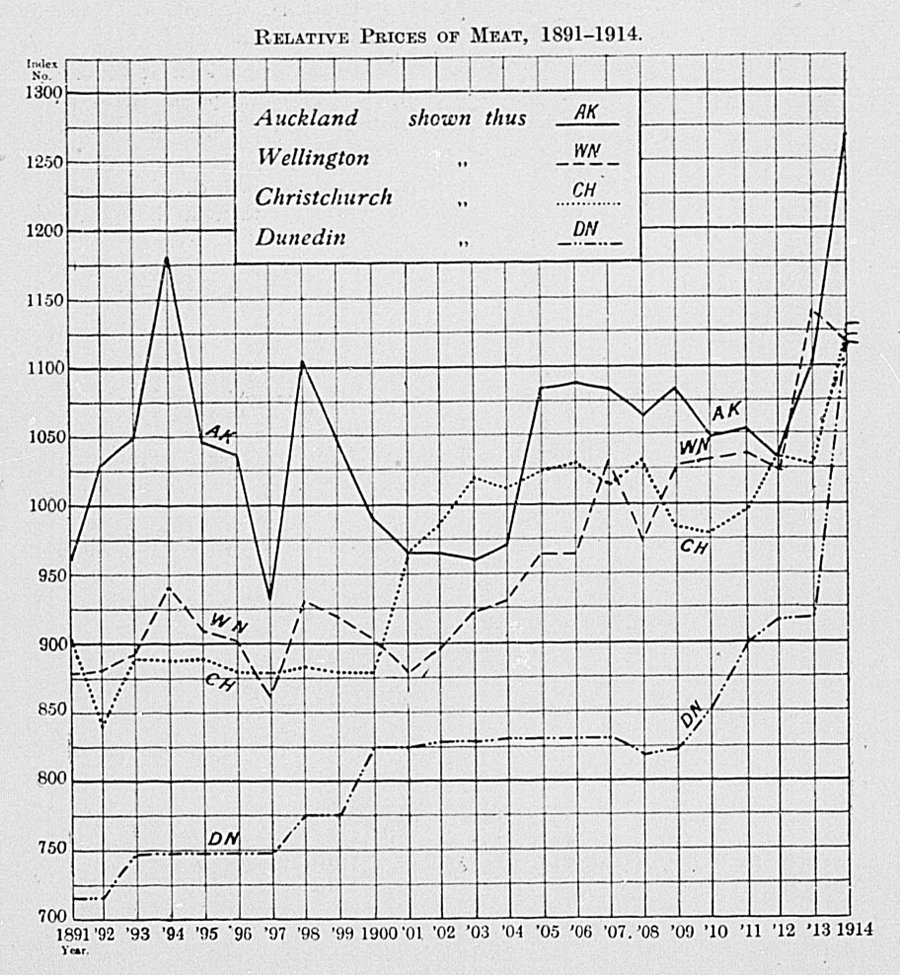
Statistics of house-rent were collected from house agents in the four centres for each year from 1891 to 1914. As in every inquiry into retail prices, difficulty was experienced in the collection of reliable data; but the information obtained has been sufficient to establish a definite tendency over the whole period, though comparisons of short periods may not be so reliable.
The item of house-rent in family expenditure is so important that no investigation which omits it can be considered as approaching a complete treatment of the subject of the cost of living. But house accommodation is by no means as easy of measurement as are definite commodities, such as the grocery items, and any measurement must be an average.
To start with the kind of house, the number of rooms must be stated, and the various classes of houses in this respect, from three to nine rooms, have been separated. The question of convenience arises, too: is the house to have a bathroom and a scullery? Variations of rent between city and suburban houses, and according to advantages of site, to the possession or lack of a garden—these variations are infinite and impossible to measure. In one town there seems to be two definite classes of houses—old buildings, and new houses in a recently settled suburb. The high rents of Wellington, and Napier, too, are paid for houses with less ground attached, a fact which emphasizes the disparity in house-rents between these and other towns
Then, too, in New Zealand a great and increasing number of all classes of people own their own homes, and this tendency is helped on by State action in lending money at low rates of interest and on easy terms through the State Advances Department, as well as by the provision of workers' dwellings. To a great and growing proportion of the population house-rent is resolved rather into the cost of upkeep, rates, and interest on mortgages owing, and the reduction of liabilities in connection with ownership of their own homes.
Very many tenants, again, do not bargain for weekly rents, but lease their homes for a year or a term of years at a fixed rent, which, though paid weekly or monthly, does not change over the period of the lease Both these factors of ownership and leasehold tend to make the effect of temporary changes in rent less direct.
Even among these who rent their homes on a weekly tenancy the influence of custom tends to keep the movement of rent conservative and slow. There is a big customary element, and rents are adjusted rather on the changes of tenancy than during occupation.
But over a long period of years such as is considered here such temporary influences are largely eliminated, and it may fairly be claimed that, by taking average rents of average houses in the method previously explained, a reliable indication may be gained of the general tendency of house-rent over the period. The figures obtained in this inquiry are given below:—
INDEX NUMBERS FOR AUCKLAND, WELLINGTON, CHRISTCHURCH, DUNEDIN, AND FOR AVERAGE OF FOUR CENTRES FOREACH YEAR, 1891–1914.
(Base: Average aggregate annual expenditure, four chief centres, 1909–13 = 1,000.)
| Year. | Auckland. | Wellington. | Christchurch. | Dunedin. | Average of Four Centres |
|---|---|---|---|---|---|
| 1891 | 417 | 844 | 760 | 771 | 698 |
| 1892 | 452 | 846 | 770 | 771 | 710 |
| 1893 | 571 | 857 | 780 | 771 | 745 |
| 1894 | 608 | 857 | 797 | 771 | 758 |
| 1895 | 660 | 862 | 803 | 795 | 780 |
| 1896 | 692 | 877 | 807 | 797 | 793 |
| 1897 | 741 | 893 | 825 | 805 | 816 |
| 1898 | 758 | 917 | 841 | 811 | 832 |
| 1899 | 772 | 935 | 848 | 814 | 842 |
| 1900 | 772 | 1,001 | 908 | 832 | 878 |
| 1901 | 831 | 1,058 | 910 | 836 | 909 |
| 1902 | 838 | 1,077 | 925 | 847 | 922 |
| 1903 | 837 | 1,106 | 918 | 852 | 928 |
| 1904 | 846 | 1,137 | 921 | 875 | 945 |
| 1905 | 876 | 1,184 | 958 | 879 | 974 |
| 1906 | 885 | 1,198 | 1,018 | 883 | 996 |
| 1907 | 885 | 1,206 | 976 | 884 | 988 |
| 1908 | 901 | 1,208 | 949 | 899 | 989 |
| 1909 | 914 | 1,186 | 937 | 899 | 984 |
| 1910 | 933 | 1,185 | 926 | 907 | 988 |
| 1911 | 948 | 1,167 | 917 | 911 | 986 |
| 1912 | 1,020 | 1,172 | 914 | 922 | 1,007 |
| 1913 | 1,032 | 1,254 | 924 | 933 | 1,036 |
| 1914 | 1,032 | 1,272 | 947 | 940 | 1,048 |
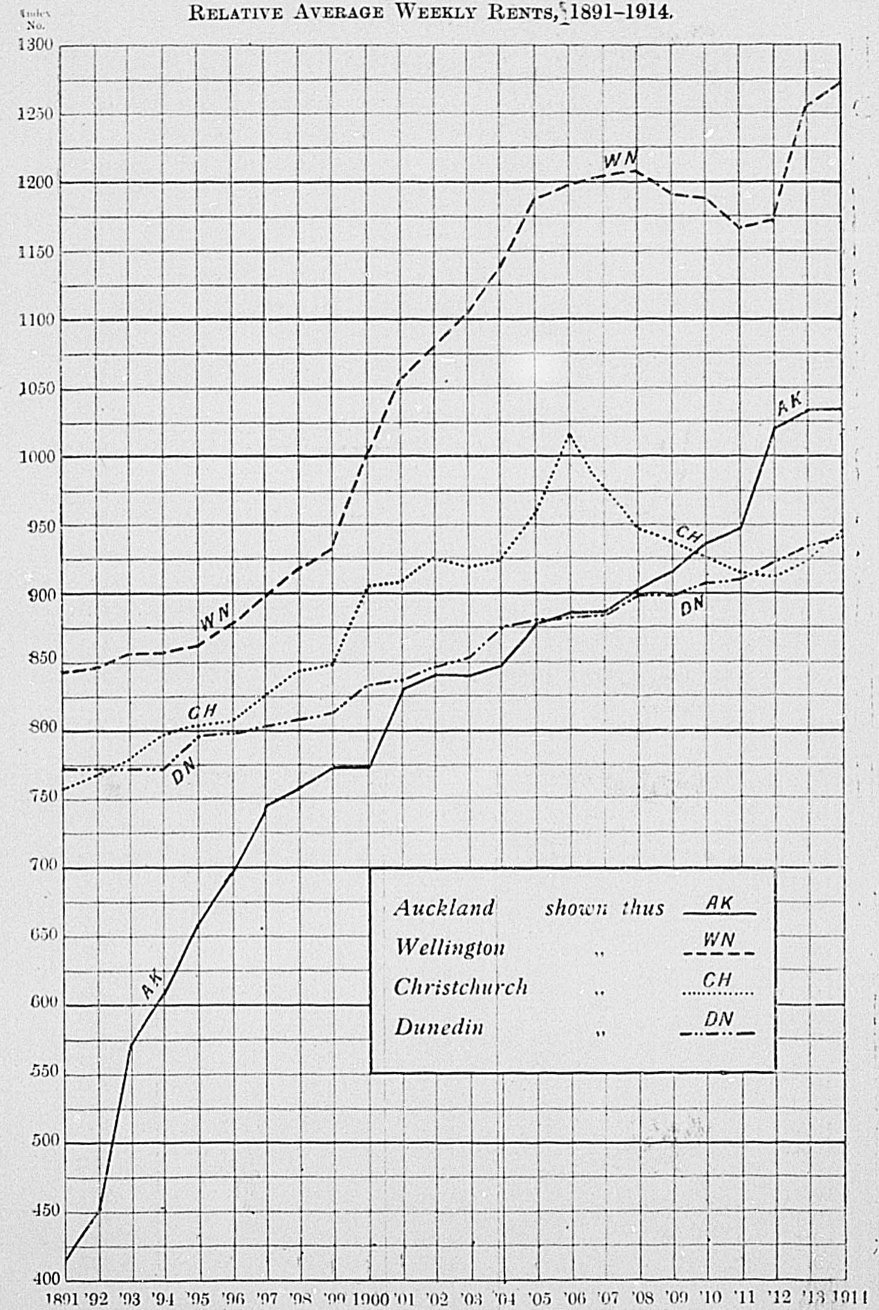
It has boon impossible to settle on any group of commodities covering the expenditure on fuel and light which were used during this period in the four towns in anything approaching comparable proportions. In Wellington electric light has been largely used for a number of years, in other towns its use is still restricted. Similarly, the comparative usages of gas, kerosene, and candles vary greatly even in the four centres, and the variation is greater between town and country.
However, a small group of seven items—coal, coke, firewood, kerosene, gas for lighting, electricity for lighting, and candles—has been considered, and prices collected for as many past years as possible. Complete index numbers have been compiled since 1907, and these have been used in computing the final index number of the cost of living.
It is possible to gain complete data of coal-prices throughout the whole period, and these are shown in the table and graph below. Though coal is largely used all over the Dominion, the varieties of coal in different localities vary greatly. Following the method used throughout this investigation, the retail prices considered have boon the predominant or most frequent prices of the quality or grade most usually sold. It will be very noticeable that Auckland and Dunedin prices of coal are considerably lower than those of Christchurch and Wellington, and this is due to the use of local brown coals—Taupiri in Auckland, and Kaitangata and Green Island, in Dunedin.
INDEX NUMBERS OF RETAIL PRICES OF COALIN THE FOUR CENTRES OF NEW ZEALAND, 1891–1914.
(Base: Average annual aggregate expenditure, four chief centres, 1909–13 = 1,000.)
| Year. | Auckland. | Wellington. | Christchurch. | Dunedin. | Average of Four Centres. |
|---|---|---|---|---|---|
| 1891 | 639 | 999 | 888 | 666 | 798 |
| 1892 | 639 | 999 | 888 | 666 | 798 |
| 1893 | 639 | 999 | 888 | 666 | 798 |
| 1894 | 666 | 999 | 944 | 666 | 819 |
| 1895 | 666 | 999 | 944 | 666 | 819 |
| 1896 | 694 | 999 | 944 | 666 | 826 |
| 1897 | 694 | 999 | 944 | 666 | 826 |
| 1898 | 694 | 999 | 944 | 666 | 826 |
| 1899 | 694 | 999 | 999 | 666 | 826 |
| 1900 | 722 | 999 | 999 | 680 | 850 |
| 1901 | 722 | 999 | 999 | 708 | 857 |
| 1902 | 750 | 1,083 | 999 | 722 | 889 |
| 1903 | 750 | 1,083 | 999 | 729 | 890 |
| 1904 | 750 | 1,083 | 999 | 770 | 900 |
| 1905 | 750 | 1,083 | 999 | 777 | 902 |
| 1906 | 777 | 1,083 | 999 | 791 | 912 |
| 1907 | 805 | 1,083 | 999 | 805 | 923 |
| 1908 | 861 | 1,083 | 999 | 805 | 937 |
| 1909 | 888 | 1,062 | 1,055 | 805 | 952 |
| 1910 | 888 | 999 | 1,055 | 805 | 937 |
| 1911 | 888 | 999 | 1,055 | 805 | 937 |
| 1912 | 916 | 1,048 | 1,111 | 840 | 979 |
| 1913 | 930 | 1,055 | 1,152 | 888 | 1,006 |
| 1914 | 999 | 1,166 | 1,166 | 833 | 1,041 |
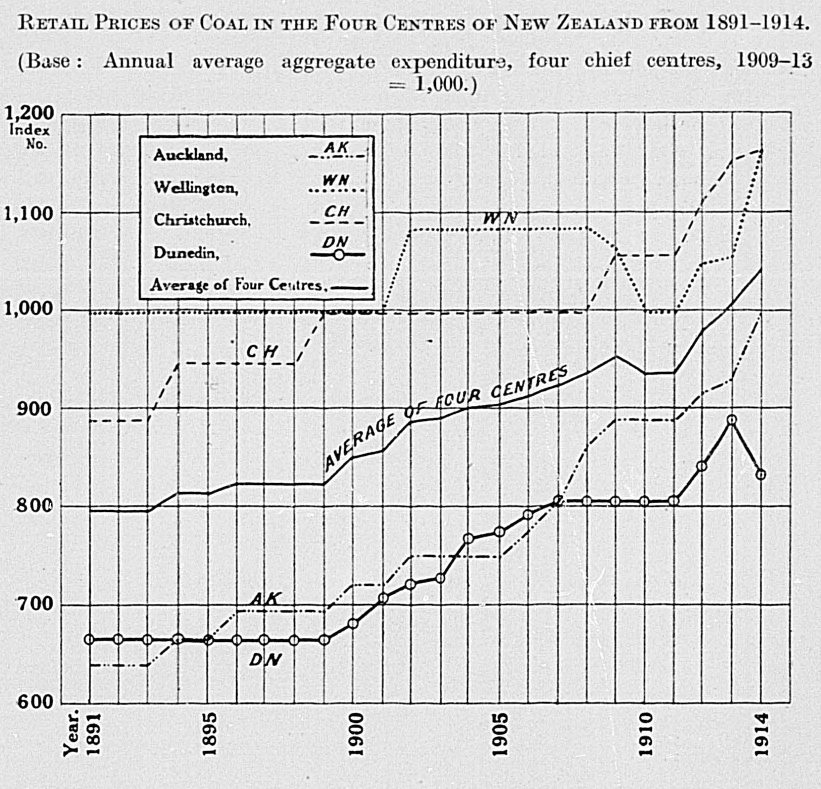
In order to gain a “cost of living” index number as far as the commodities treated above represent the cost of living, the three food groups and rent have been compiled for the whole period, and in a separate table fuel and light has been added.
It is not contended that the items treated in this inquiry cover the whole expenditure of every family—such a task would not be practicable in any inquiry. Neither does the investigation cover all classes of commodities; but it is representative of the main essential groups.
The most serious defect is the unavoidable omission of articles of clothing and boots. It is impossible to got predominant prices, because changes of consumption are so rapid and so variable that it is impossible for a retailer to say at any time that any quality is predominant, or even that there is a predominant price. The omission of this class was rendered inevitable by the multiplicity of varieties and qualities and by the rapid changes in consumption.
But a large proportion of the expenditure on clothing is more in the nature of luxury than necessity, and the expenditure on necessary clothing does not vary greatly from year to year.
With the exception of clothing all the main classes of necessary expenditure are included, and the commodities treated cover more than 50 per cent. (and with fuel and light 60 per cent.) of the expenditure of an average family. Clothing amounts to loss than 15 per cent., while the remaining 25 per cent. does not fall within any particular class, but is expended on luxuries and personal expenditure and miscellaneous-expenses.
Moreover, the commodities treated, covering as they do the most necessary expenditure, grow more important as the income decreases, since the expenditure on food is always relatively greatest where the income is smallest.
It is with some confidence, therefore, that the following index numbers, covering 50 to 60 per cent. of normal household expenditure—and that the most necessary part—are presented as an indication of the changes in the cost of living in New Zealand from 1891 to 1914.
Index Numbers for Auckland, Wellington, Christchurch, Dunedin, and for Average of Four Centres for each Year, 1891–1914.
(Base: Average aggregate annual expenditure, four chief centres, 1909–13 = 1,000.)
| Year. | Auckland. | Wellington. | Christchurch. | Dunedin. | Average of Four Centres. |
|---|---|---|---|---|---|
*Groceries figures not available for Christchurch prior to 1899 | |||||
| 1891 | 730 | 893 | * | 844 | * |
| 1892 | 751 | 890 | * | 844 | * |
| 1893 | 816 | 909 | * | 847 | * |
| 1894 | 843 | 904 | * | 833 | * |
| 1895 | 822 | 907 | * | 833 | * |
| 1896 | 841 | 897 | * | 840 | * |
| 1897 | 849 | 894 | * | 854 | * |
| 1898 | 901 | 948 | * | 880 | * |
| 1899 | 870 | 918 | 878 | 835 | 875 |
| 1900 | 864 | 945 | 911 | 860 | 895 |
| 1901 | 889 | 979 | 933 | 881 | 920 |
| 1902 | 911 | 1,007 | 948 | 901 | 942 |
| 1903 | 904 | 1,008 | 944 | 900 | 939 |
| 1904 | 908 | 1,019 | 940 | 887 | 939 |
| 1905 | 973 | 1,060 | 979 | 923 | 984 |
| 1906 | 978 | 1,085 | 1,005 | 933 | 1,000 |
| 1907 | 975 | 1,084 | 984 | 919 | 991 |
| 1908 | 981 | 1,086 | 978 | 924 | 992 |
| 1909 | 983 | 1,069 | 941 | 913 | 977 |
| 1910 | 989 | 1,081 | 947 | 943 | 990 |
| 1911 | 984 | 1,071 | 942 | 939 | 984 |
| 1912 | 1,027 | 1,085 | 969 | 970 | 1,013 |
| 1913 | 1,055 | 1,152 | 968 | 973 | 1,037 |
| 1914 | 1,083 | 1,177 | 1,021 | 1,035 | 1,079 |
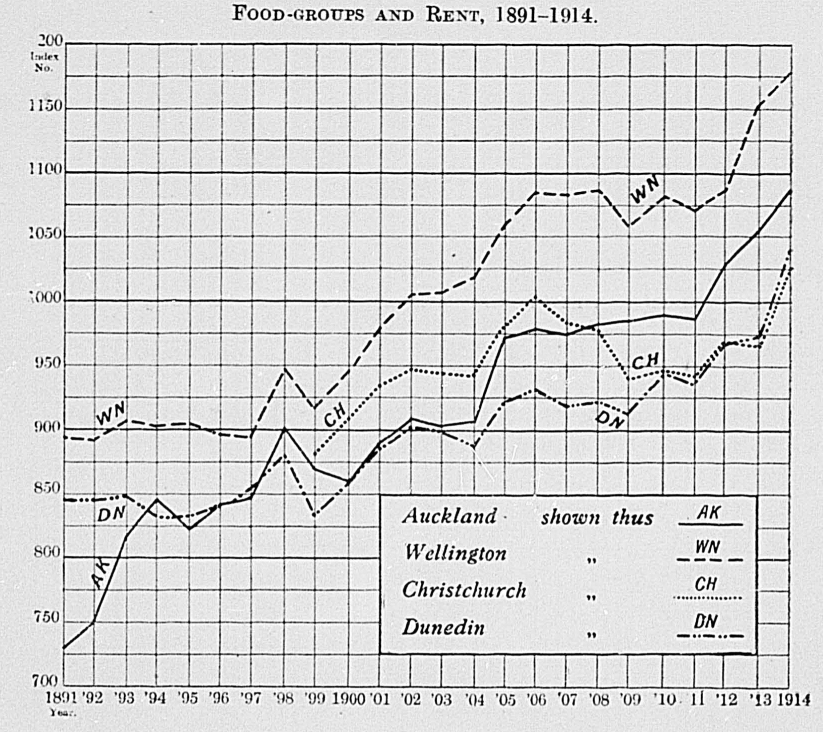
The inclusion of the fifth group—fuel and light—which is possible from 1907, renders the index number of the cost of living more complete and the following table is given as showing the course of predominant retail prices of all groups combined since 1907.
INDEX NUMBERS OF RETAIL PRICES OFALL GROUPS (GROCERIES, DAIRY-PRODUCE, MEAT, HOUSE-RENT, AND FUEL AND LIGHT) IN THE FOUR CHIEF CENTRES OF NEW ZEALAND, 1907–1914.
(Base: Annual average aggregate expenditure, four chief centres, 1909–13 = 1,000.)
| — | Auckland. | Wellington. | Christchurch. | Dunedin. | Average of Four Centres. |
|---|---|---|---|---|---|
| 1907 | 961 | 1,086 | 992 | 917 | 989 |
| 1908 | 970 | 1,089 | 986 | 923 | 992 |
| 1909 | 974 | 1,072 | 955 | 911 | 978 |
| 1910 | 980 | 1,078 | 960 | 938 | 989 |
| 1911 | 975 | 1,069 | 956 | 934 | 983 |
| 1912 | 1,016 | 1,086 | 984 | 965 | 1,013 |
| 1913 | 1,042 | 1,147 | 986 | 971 | 1,036 |
| 1914 | 1,071 | 1,176 | 1,040 | 1,022 | 1,077 |
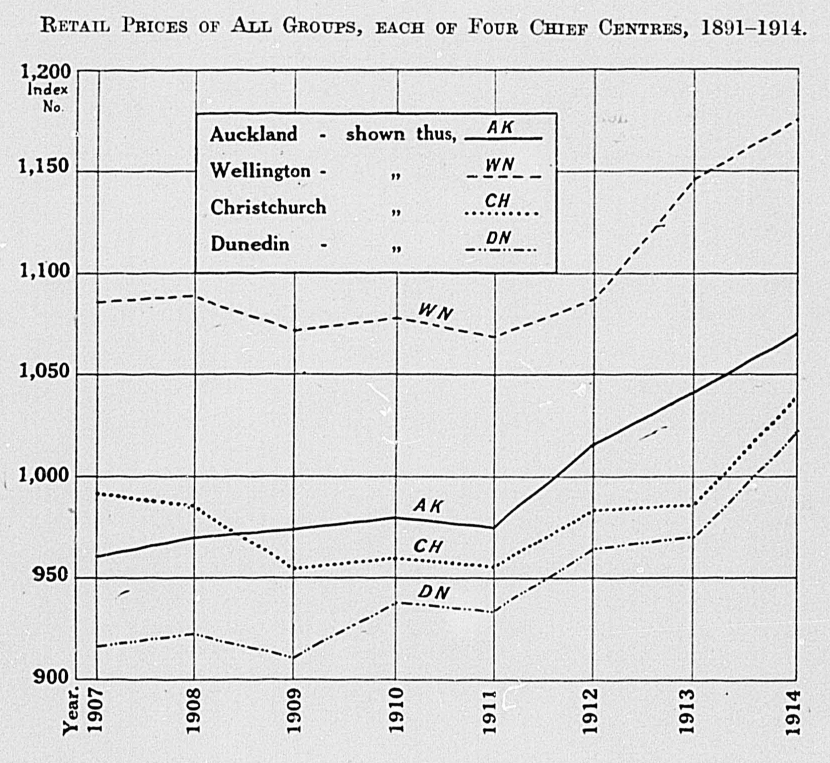
It is convenient at this stage to summarize the results so far obtained by the following table giving the index numbers for the average of the four centres, for each group and all groups combined, as far as it is possible to calculate them. The average of the four centres is the best approximation which can be made to a Dominion index number of the cost of living, and though it necessarily leaves out of account the distinction between town and country, this, it has been proved by experiment, makes little difference in the index numbers except in the case of rent. In any case, over a third of the population of the Dominion lives in these four centres.
No attempt has been made at weighting for population, but the four centres are sufficiently alike to make weighting unnecessary. It has been proved by experiment that systems of weighting make only an infinitesimal difference in the index numbers.
INDEX NUMBERS OF RETAIL PRICES OF ALL GROUPS OF COMMODITIES INTHE AVERAGE OFTHE FOUR CHIEF CENTRES, 1891 TO 1914.
(Base: Annual average aggregate expenditure, four chief centres, 1909–13 = 1,000.)
| Year. | Group I: Groceries. | Group II: Dairy-products | Group III: Meat. | Groups I-III: Food Groups. | Group IV: House-rent. | Groups I-IV: Food and Rent. | Group V: Fuel and Light. | Groups I-V: All Groups. |
|---|---|---|---|---|---|---|---|---|
| 1891 | .. | 806 | 864 | .. | 698 | .. | .. | .. |
| 1892 | .. | 835 | 866 | .. | 710 | .. | .. | .. |
| 1893 | .. | 828 | 896 | .. | 745 | .. | .. | .. |
| 1894 | .. | 817 | 939 | .. | 758 | .. | .. | .. |
| 1895 | .. | 842 | 898 | .. | 780 | .. | .. | .. |
| 1896 | .. | 825 | 892 | .. | 793 | .. | .. | .. |
| 1897 | .. | 830 | 855 | .. | 816 | .. | .. | .. |
| 1898 | .. | 847 | 923 | .. | 832 | .. | .. | .. |
| 1899 | 919 | 840 | 905 | 896 | 842 | 875 | .. | .. |
| 1900 | 948 | 838 | 899 | 906 | 878 | 895 | .. | .. |
| 1901 | 971 | 876 | 909 | 928 | 909 | 920 | .. | .. |
| 1902 | 1,016 | 892 | 919 | 954 | 922 | 942 | .. | .. |
| 1903 | 983 | 897 | 933 | 946 | 928 | 939 | .. | .. |
| 1904 | 962 | 882 | 935 | 935 | 945 | 939 | .. | .. |
| 1905 | 1,062 | 878 | 975 | 990 | 974 | 984 | .. | .. |
| 1906 | 1,072 | 914 | 977 | 1,003 | 996 | 1,000 | .. | .. |
| 1907 | 1,016 | 955 | 989 | 993 | 988 | 991 | 975 | 989 |
| 1908 | 999 | 1,020 | 971 | 994 | 989 | 992 | 988 | 992 |
| 1909 | 973 | 958 | 980 | 972 | 984 | 977 | 993 | 978 |
| 1910 | 1,014 | 970 | 977 | 991 | 988 | 990 | 981 | 989 |
| 1911 | 968 | 993 | 995 | 983 | 986 | 984 | 980 | 983 |
| 1912 | 1,022 | 1,029 | 1,001 | 1,017 | 1,007 | 1,013 | 1,012 | 1,013 |
| 1913 | 1,023 | 1,050 | 1,047 | 1,037 | 1,036 | 1,037 | 1,035 | 1,036 |
| 1914 | 1,076 | 1,054 | 1,158 | 1,098 | 1,048 | 1,079 | 1,052 | 1,077 |
| NOTE.—This table is comparable vertically but not horizontally, since the different groups have different bases. | ||||||||
This table and the graph following summarize the information contained in the general tables previously given.
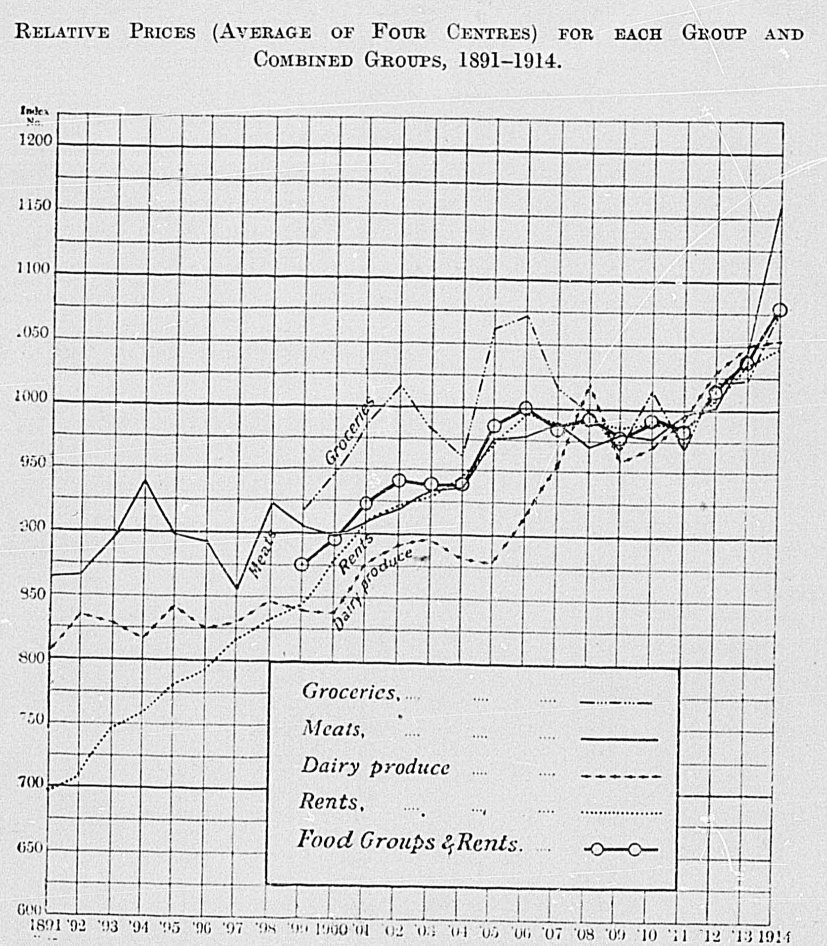
The phrase “purchasing-power of money” has a definite technical meaning in economics as the inverse of the general level of prices; but expressing as it does, in scientific terms, a fact of everyday life, the phrase is used more loosely in a popular sense simply to direct attention to the fact that the value of money in relation to goods is a variable quantity. It is a commonplace that a sovereign to-day is not worth as much as it was worth fifteen or twenty years ago; but the sovereign contains just as much and just as fine gold. What has changed is the amount of commodities which the sovereign will purchase. This popular expression that a sovereign is worth less to-day than formerly, though not strictly scientific and accurate, yet is commonly used and contains some truth. The table which follows is intended to represent the change indicated by this popular expression.
The value of any article is fixed jointly by demand and supply, and is merely the ratio of its power in exchange compared with the power of other commodities. For instance, a sack of wheat may be worth two and a half sacks of oats at a particular time, and a year later may be worth more or less. But no one, except in primitive places, quotes wheat in terms of oats, or vice versa; it has been more convenient to fix on a definite article which shall be the standard of value, and, together with this use, shall also perform the services of a medium of exchange. By process of evolution gold is now the definite standard of value over the civilized world, and all goods are bought and sold in terms of gold.
But gold has an intrinsic value apart from its use as currency, and in former days much inconvenience was caused by changes in the ratio between the value of gold as coin and as bullion. In England the difficulty was met in 1816 by the Coinage Act, which definitely settled tin's ratio once for all by enacting that 20 lb. of standard gold should be coined into 934½ sovereigns; or, in other words, that an ounce of standard bullion should be the equivalent of £3 17s. 10½d. in coins. In this way the relation of coined to uncoined gold is fixed by Act of Parliament. But it is inevitable that the value of gold in relation to other commodities must change from time to time, either from variations on the side of gold or from variations in commodities.
In the previous paragraph attention has been focussed on gold; but similar reasoning applies to all money, which, moreover, is in the last resort based on gold. The relation of coins and of other forms of money to specie being fixed in this way, the only means of expressing a change in the value of commodities is through prices, which are merely the money-values of the different articles.
So that, though the price of gold is fixed, its value changes in relation to other commodities, and this change can be expressed only by the prices of those commodities increasing or decreasing. As prices rise the sovereign commands less goods, and vice versa.
The popular saying carries some weight, and the table given below is intended to give some definite data on which to base such a statement, though the foregoing caution must not be forgotten. When prices rise the popular idea is that the value of the sovereign has fallen; when prices fall it has risen. In the following table these figures are for convenience shown in terms of shillings and pence, so that a figure may be obtained which will give expression to the statement which is being illustrated.
A TABLE TOSHOW THE RELATIVE WORTH IN TERMS OF GENERAL COMMODITIES (BUTSTATED FOR CONVENIENCE IN TERMS OF MONEY) REPRESENTED BYA SOVEREIGN DURINGTHE YEARS 1891–1914, TAKING THE AVERAGE “WORTH” IN THE YEARS 1909–13 AS BASE = 20s.
| Year. | I. | II. | III. | I-III. | IV. | I-IV. | ||||||
|---|---|---|---|---|---|---|---|---|---|---|---|---|
| Groceries. | Dairy-produce. | Meats. | Food Groups. | Rents. | All Groups. | |||||||
| s. | d. | s. | d. | s. | d. | s. | d. | s. | d. | s. | d. | |
| 1891 | 24 | 9¾ | 23 | 13 | .. | 28 | 7¾ | .. | ||||
| 1892 | 23 | 11½ | 23 | 1¼ | 28 | 2 | .. | 28 | 2 | |||
| 1893 | 24 | 1¾ | 22 | 3¾ | .. | 26 | 10¼ | .. | ||||
| 1894 | 24 | 5¾ | 21 | 3½ | .. | 26 | 4½ | .. | ||||
| 1895 | 23 | 9 | 22 | 3¼ | .. | 25 | 7¾ | .. | ||||
| 1896 | 24 | 3 | 22 | 5 | .. | 25 | 2¾ | .. | ||||
| 1897 | 24 | 1¼ | 23 | 4¼ | .. | 24 | 6 | .. | ||||
| 1898 | 23 | 7¼ | 21 | 8 | .. | 24 | 0½ | .. | ||||
| 1899 | 21 | 9¼ | 23 | 9¾ | 22 | 1¼ | 22 | 3¾ | 23 | 9 | 22 | 10¼ |
| 1900 | 21 | 1¼ | 23 | 10½ | 22 | 3 | 22 | 1 | 22 | 9¼ | 22 | 4¼ |
| 1901 | 20 | 3¾ | 22 | 10 | 22 | 0 | 21 | 5 | 22 | 0 | 21 | 7¾ |
| 1902 | 19 | 8¼ | 22 | 5 | 21 | 9¼ | 20 | 11½ | 21 | 8¼ | 21 | 2¾ |
| 1903 | 20 | 4¼ | 22 | 3½ | 21 | 5¼ | 21 | 1¾ | 21 | 6½ | 21 | 3½ |
| 1904 | 20 | 9½ | 22 | 8 | 21 | 4¾ | 21 | 4¾ | 21 | 2 | 21 | 3½ |
| 1905 | 18 | 10 | 22 | 9¼ | 20 | 6¼ | 20 | 2½ | 20 | 6½ | 20 | 4 |
| 1906 | 18 | 8 | 21 | 10½ | 20 | 5¾ | 19 | 11¼ | 20 | 1 | 20 | 0 |
| 1907 | 20 | 0½ | 20 | 11¼ | 20 | 2¾ | 20 | 3¾ | 20 | 3 | 20 | 3½ |
| 1908 | 20 | 0¼ | 19 | 7¼ | 20 | 7¼ | 20 | 1½ | 20 | 2¾ | 20 | 2 |
| 1909 | 20 | 6¾ | 20 | 10½ | 20 | 5 | 20 | 7 | 20 | 4 | 20 | 5¾ |
| 1910 | 19 | 8¾ | 20 | 7½ | 20 | 5¾ | 20 | 2¼ | 20 | 3 | 20 | 2½ |
| 1911 | 20 | 8 | 20 | 1¾ | 20 | 1¼ | 20 | 4½ | 20 | 3½ | 20 | 4 |
| 1912 | 19 | 6¾ | 19 | 5¼ | 19 | 11¾ | 19 | 8 | 19 | 10¼ | 19 | 9 |
| 1913 | 19 | 6½ | 19 | 0½ | 19 | 1¼ | 19 | 3½ | 19 | 3¾ | 19 | 3¼ |
| 1914 | 18 | 7 | 18 | 11¾ | 17 | 3¼ | 18 | 2½ | 19 | 1 | 18 | 6½ |
| NOTE.—These figures are comparable vertically but not horizontally. | ||||||||||||
It will be seen from the foregoing table that great changes have taken place in the worth of a sovereign since 1891. In that year a sovereign would buy a quantity of dairy-produce which at the average prices of the years 1909–13 would have cost 24s. 9¾d. Taking the same products in 1914, a sovereign would buy only as much as 18s. 11¾d. would have bought if prices had remained at the average of the base years 1909–13.
The figures of the table therefore represent goods (but for convenience are turned into money at the prices of 1909–13). It will be noticed that they are exactly reversed from the tables given previously—a small index number (i.e., low prices) obviously represents a high purchasing-power of money. As prices rise and the index numbers become bigger the purchasing-power falls.
It is advisable to illustrate the changing level of prices in the opposite way from the last section by focussing attention on the amount of money required to purchase a given quantity of goods, instead of on the quantity of goods which can be purchased with a stated amount of money, in this case a sovereign.
The table below, therefore, is opposite in movement to the one last-given and similar to the early tables of index numbers. Indeed, the table is computed directly from the table of index numbers: instead of equating the average annual aggregate expenditure of the four centres during 1909–13 to the figure 1,000 it is equated to 20s., and the figures thus computed show the amounts that would have to be paid in each year to purchase what would have cost 20s. in the base years 1909–13 (in the average of the four centres). In the same way the average weekly rent for the base period 1909 to 1913 is taken fits equal to 20s.
TABLE SHOWINGTHE AMOUNT NECESSARYON THE AVERAGE TOPURCHASE THESAME QUANTITY OF FOODSTUFFS AND HOUSE ACCOMMODATION INTHE AVERAGE OFTHE FOUR CENTRESFOR EACH YEAR, 1891–1914.
(Base of table: Average annual aggregate expenditure, four chief centres, 1909–13 = 20s.)
| Year. | Group I. Groceries. | Group II. Dairy-produce. | Group III. Meat. | Groups I-III. Food Groups. | Group IV. House-rent. | Groups I-IV. Food and Rent. | ||||||
|---|---|---|---|---|---|---|---|---|---|---|---|---|
| s. | d. | s. | d. | s. | d. | s. | d. | s. | d. | s. | d. | |
| 1891 | 16 | 1½ | 17 | 3¼ | .. | 13 | 11½ | .. | ||||
| 1892 | 16 | 8½ | 17 | 3¾ | .. | 14 | 2½ | .. | ||||
| 1893 | 16 | 6¾ | 17 | 11 | .. | 14 | 10¾ | .. | ||||
| 1894 | 16 | 4 | 18 | 9¼ | .. | 15 | 2 | .. | ||||
| 1895 | 16 | 10 | 17 | 11½ | .. | 15 | 7¼ | .. | ||||
| 1896 | 16 | 6 | 17 | 10 | .. | 15 | 10¼ | .. | ||||
| 1897 | 16 | 7¼ | 17 | 1¼ | .. | 16 | 3¾ | .. | ||||
| 1898 | 16 | 11¼ | 18 | 5½ | .. | 16 | 7¾ | .. | ||||
| 1899 | 18 | 4½ | 16 | 9½ | 18 | 1¼ | 17 | 11 | 16 | 10 | 17 | 6 |
| 1900 | 18 | 11½ | 16 | 9 | 17 | 11¾ | 18 | 1½ | 17 | 6¾ | 17 | 10¾ |
| 1901 | 19 | 8½ | 17 | 6¼ | 18 | 2¼ | 18 | 8¼ | 18 | 2¼ | 18 | 5¾ |
| 1902 | 20 | 3¾ | 17 | 10 | 18 | 4½ | 19 | 1 | 18 | 5¼ | 18 | 10 |
| 1903 | 19 | 8 | 17 | 11¼ | 18 | 8 | 18 | 11 | 18 | 6¾ | 18 | 9¼ |
| 1904 | 19 | 3 | 17 | 7¾ | 18 | 8½ | 18 | 8½ | 18 | 10¾ | 18 | 9¼ |
| 1905 | 21 | 3 | 17 | 6¾ | 19 | 6 | 19 | 9½ | 19 | 5¾ | 19 | 8¼ |
| 1906 | 21 | 5¼ | 18 | 3¼ | 19 | 6½ | 20 | 0¾ | 19 | 11 | 20 | 0 |
| 1907 | 19 | 11½ | 19 | 1¼ | 19 | 9¼ | 19 | 8½ | 19 | 9 | 19 | 8¾ |
| 1908 | 19 | 11¾ | 18 | 4¾ | 19 | 5 | 19 | 10½ | 19 | 9¼ | 19 | 10 |
| 1909 | 19 | 5½ | 19 | 2 | 19 | 7¼ | 19 | 5¼ | 19 | 8¼ | 19 | 6½ |
| 1910 | 20 | 3¼ | 18 | 10¾ | 19 | 6½ | 19 | 9¾ | 19 | 9 | 19 | 9½ |
| 1911 | 19 | 4¼ | 19 | 10¼ | 19 | 10¾ | 19 | 8 | 19 | 8¾ | 19 | 8¼ |
| 1912 | 20 | 5¼ | 20 | 7 | 20 | 0¼ | 20 | 4 | 20 | 1¾ | 20 | 3 |
| 1913 | 20 | 5¼ | 21 | 0 | 20 | 11¼ | 20 | 9 | 20 | 8¾ | 20 | 9 |
| 1914 | 21 | 6¼ | 21 | 1 | 23 | 2 | 21 | 11½ | 20 | 11½ | 21 | 7 |
| NOTE.—These figures are comparable vertically but not horizontally. | ||||||||||||
The general level of prices, or the purchasing-power of money, is an abstraction which in itself is mainly of academic interest. What touches every one is the cost of living, in which the purchasing-power of money is but one factor, though in present conditions the most important. The usual method adopted to measure the cost of living for any group of persons is to obtain a typical budget of expenditure and then to measure the effects of changes in the price-level upon that budget. A true measure of changes in the cost of living would take account not only of changes in price, but also of changes in the budget—roughly, the standard of living. But for the present, as explained in the previous article, it is best for our purpose, which is merely the illustration of the rise in prices, to adopt a certain fixed budget and apply to the articles therein contained the variations in prices as disclosed by the investigation just made.
In Australia, and in the older countries, investigations into the question of budget expenditure have been carried out with a great deal of detail and success; but New Zealand has so far seen no comprehensive investigation into this question. The only guide available has been an inquiry conducted by the Labour Department in 1910–11, which, however, was not sufficiently extensive to enable a strictly typical New Zealand budget to be made up.
Now that the New Zealand Statistical Office in co-operation with the Department of Labour has taken up the systematic record and investigation of price-movements as a branch of its regular work, it is hoped that an expenditure inquiry may shortly be undertaken from which a typical actual budget for New Zealand may be evolved. Inquiries into household expenditure form part of the regular work of the Statistical Offices in the United Kingdom, United States, Germany, and Australia. Apart from their own special interest and value they are particularly useful in work such as is being undertaken in connection with prices; but satisfactory results can be obtained only with the active sympathy and assistance of householders.
In the construction of a budget, therefore, the work has been somewhat hampered by lack of a typical statistical example ready to hand. For our present purpose there was adopted an artificial, arbitrary budget, which bears no direct relation to any particular weekly expenditure. This budget is not intended to represent the weekly expenditure of any particular family or group of people at any particular time.
The commodities selected are representative as far as can be ascertained, and the relative amounts of expenditure have been carefully considered. It was deemed advisable in the first place to limit the total expenditure, which covers only groceries, dairy-produce, meat, and rent, to a sum rather loss than £2 per week, since allowance must be made for clothing, boots, recreation, luxuries, &c. Then the proportions to be devoted to each group were settled by consideration of many factors. The rent of a four-roomed house offered little difficulty; but it was harder to decide just how much relatively was expended on groceries, on dairy-produce, and on meat. The results of the Labour Department's investigation, and the relative annual consumptions of the articles selected (as used for the weights in the general index number) were used to settle the quantities and to bring them as near actual life as possible. The selection of the commodities themselves was largely artificial; but often a typical commodity represents a group—as, for instance, rice stands for the similar commodities of sago and tapioca. In this, as in other ways, the budget, it must be emphasized once more, is not an attempt to depict any actual family consumption, but an illustration of the action of prices on those articles which bulk largely in the household expenditure of the average man. Read in this way the table is a useful and striking method of representing price-variations; but it must not be construed as an attempt to fix a typical expenditure.
WEEKLY BUDGETS.—TABLE SHOWINGTHE COMPARATIVE COSTS OFAN ASSUMED WEEKLY HOUSEHOLD CONSUMPTION OF CERTAIN FOODSTUFFS, AND THE RENTOF A FOUR-ROOMED HOUSE.
| (Based on the average of the four chief centres.) | |||||||||||||||||||
|---|---|---|---|---|---|---|---|---|---|---|---|---|---|---|---|---|---|---|---|
| Commodity. | Quantity. | Average Cost, 1891. | Average Cost, 1896. | Average Cost, 1901. | Average Cost, 1906. | Average Cost, 1911. | Average Cost, 1914. | ||||||||||||
| Groceries— | £ | s. | d. | £ | s. | d. | £ | s. | d. | £ | s. | d. | £ | s. | d. | £ | s. | d. | |
| Bread | 7 2 lb. loaves | 0 | 1 | 10½ | 0 | 1 | 8¼ | 0 | 1 | 9½ | 0 | 1 | 9¾ | 0 | 1 | 11 | 0 | 2 | 3 1/8 |
| Flour | 3 lb. | 0 | 0 | 5 | 0 | 0 | 4¼ | 0 | 0 | 3½ | 0 | 0 | 4 | 0 | 0 | 4 | 0 | 0 | 5 |
| Oatmeal | 1 lb. | 0 | 0 | 1½ | 0 | 0 | 1½ | 0 | 0 | 1½ | 0 | 0 | 1¾ | 0 | 0 | 2 | 0 | 0 | 2 |
| Rice | 1 lb. | 0 | 0 | 3 | 0 | 0 | 2½ | 0 | 0 | 2½ | 0 | 0 | 2¼ | 0 | 0 | 2½ | 0 | 0 | 2½ |
| Tea | ½ lb. | 0 | 1 | 0½ | 0 | 0 | 11¾ | 0 | 0 | 10½ | 0 | 0 | 9¾ | 0 | 0 | 9 | 0 | 0 | 9½ |
| Cocoa | 1/8 lb. | 0 | 0 | 5 | 0 | 0 | 5¼ | 0 | 0 | 5 | 0 | 0 | 5 | 0 | 0 | 5 | 0 | 0 | 5½ |
| Sugar | 3 lb. | 0 | 0 | 3½ | 0 | 0 | 7¼ | 0 | 0 | 7½ | 0 | 0 | 7¼ | 0 | 0 | 6 | 0 | 0 | 6½ |
| Jam | 2 lb. | 0 | 0 | 10 | 0 | 0 | 9¾ | 0 | 0 | 10 | 0 | 0 | 10 | 0 | 0 | 9½ | 0 | 0 | 11 |
| Raisins | ½ lb. | 0 | 0 | 4½ | 0 | 0 | 3 | 0 | 0 | 3½ | 0 | 0 | 3 | 0 | 0 | 3 | 0 | 0 | 8 |
| Potatoes | 14 lb. | 0 | 0 | 7 | 0 | 0 | 81 | 0 | 0 | 9 | 0 | 1 | 7¼ | 0 | 0 | 10½ | 0 | 0 | 11 |
| Totals | .. | 0 | 6 | 7½ | 0 | 6 | 1¾ | 0 | 6 | 2½ | 0 | 7 | 0 | 0 | 6 | 2½ | 0 | 6 | 11¾ |
| Increase per cent. over 1891 | .. | .. | –7.23 | – | 6.29 | 5.66 | –6.29 | 5.35 | |||||||||||
| Dairy-produce— | |||||||||||||||||||
| Milk | 7 pts. | 0 | 0 | 11½ | 0 | 0 | 11½ | 0 | 0 | 11½ | 0 | 1 | 0 | 0 | 1 | 1 | 0 | 1 | 2 |
| Butter | 3 lb. | 0 | 2 | 8 | 0 | 2 | 10 | 0 | 3 | 2½ | 0 | 3 | 31 | 0 | 8 | 71 | 0 | 3 | 6½ |
| Cheese | ¼ b. | 0 | 0 | 2 | 0 | 0 | 1¾ | 0 | 0 | 2 | 0 | 0 | 2 | 0 | 0 | 2 | 0 | 0 | 2 |
| Bacon | 1 lb. | 0 | 0 | 9 | 0 | 0 | 8¼ | 0 | 0 | 8 | 0 | 0 | 9 | 0 | 0 | 10 | 0 | 0 | 11½ |
| Totals | .. | 0 | 4 | 6½ | 0 | 4 | 7½ | 0 | 5 | 0 | 0 | 5 | 2¼ | 0 | 5 | 8½ | 0 | 5 | 10 |
| Increase per cent. over 1891 | .. | .. | 1.83 | 10.09 | 14.22 | 25.69 | 28.44 | ||||||||||||
| Meat— | |||||||||||||||||||
| Beef— | |||||||||||||||||||
| Sirloin | 8 lb. | 0 | 1 | 4 | 0 | 1 | 4½ | 0 | 1 | 5½ | 0 | 1 | 6¾ | 0 | 1 | 7 | 0 | 1 | 9 |
| Stewing-steak | 2 lb. | 0 | 0 | 9 | 0 | 0 | 9¾ | 0 | 0 | 9 | 0 | 0 | 9½ | 0 | 0 | 10 | 0 | 1 | 0 |
| Corned roll | 1 lb. | 0 | 0 | 4 | 0 | 0 | 4 | 0 | 0 | 4 | 0 | 0 | 4½ | 0 | 0 | 4½ | 0 | 0 | 5½ |
| Sausages | 2 lb. | 0 | 0 | 7½ | 0 | 0 | 7¼ | 0 | 0 | 7½ | 0 | 0 | 7½ | 0 | 0 | 8 | 0 | 0 | 10 |
| Mutton— | |||||||||||||||||||
| Leg | 3 lb. | 0 | 1 | 0½ | 0 | 1 | 0½ | 0 | 1 | 2 | 0 | 1 | 3¼ | 0 | 1 | 4½ | 0 | 1 | 5 |
| Shoulder | 2 lb. | 0 | 0 | 6½ | 0 | 0 | 7¼ | 0 | 0 | 7½ | 0 | 0 | 8½ | 0 | 0 | 8½ | 0 | 0 | 9½ |
| Chops | 2 lb. | 0 | 0 | 9½ | 0 | 0 | 10¼ | 0 | 0 | 10½ | 0 | 0 | 11 | 0 | 1 | 0 | 0 | 1 | 1½ |
| Totals | .. | 0 | 5 | 5 | 0 | 5 | 7½ | 0 | 5 | 10 | 0 | 6 | 3 | 0 | 6 | 6½ | 0 | 7 | 5½ |
| Increase per cent over 1891 | .. | .. | .. | .. | 3.85 | 7.69 | 15.38 | 20.77 | 7.69 | ||||||||||
| Rent | 4 rooms | 0 | 7 | 11 | 0 | 8 | 9 | 0 | 10 | 10 | 0 | 12 | 5 | 0 | 12 | 4 | 0 | 13 | 0 |
| Increase per cent. over 1891 | .. | .. | .. | .. | 10.53 | 36.84 | 56.84 | 55.79 | 64.21 | ||||||||||
| Totals of budget | .. | 1 | 3 | 11 | 1 | 5 | 1¾ | 1 | 7 | 10½ | 1 | 10 | 10¼ | 1 | 10 | 3½ | 1 | 12 | 5¼ |
| Increase per cent. over 1891 | .. | .. | 5.14 | 16.55 | 29.01 | 26.67 | 35.63 | ||||||||||||
| The minus sign (–) signifies a decrease. | |||||||||||||||||||
A great rise in prices is at once evident from a scrutiny of the budget figures. The biggest increase is in rent, which over the period increased about 64 per cent. The increase of the budget total (about 30 per cent. in twenty-five years) is largely made up of the increase in rent, though each group has increased, groceries by 5 per cent., dairy-produce by 28 per cent., and meat by 38 per cent. Most of the increase in the groceries group is due to the foods of New Zealand origin—bread, flour, oatmeal, potatoes, and onions—as demonstrated previously in this article, and with these items eliminated a fall would probably be evident, mainly due to tariff reductions—e.g., in tea and sugar.
The effect of these tariff reductions is very evident from the budget. From 1891–95 prices fell, and the tariff was also reduced in 1895, so that it is not surprising to find that prices of groceries fell over 7 per cent. by 1896. In 1901 they had risen again slightly, and by 1906 they were nearly 6 per cent. ahead of the prices in 1891, though this is due mainly to an abnormally high price for potatoes. In 1907 a further revision of the tariff took effect, and this, together with a considerable fall in potatoes, again lowered prices. The last year, 1914, again shows a rise, turning a decrease into an increase. Prices were higher in bread, flour, tea, cocoa, sugar, jam, and potatoes.
In the second group, prices have advanced steadily over the whole period, slightly till 1896 and greatly thereafter. Increases are evident in every item.
Meat, too, shows much the same course, except that the increase is sharply accentuated in 1914. The price of meat advanced very greatly indeed in the years 1912–13–14, and the increase in those three years was almost as great as the increase for the twenty years previous.
The rent of a four-roomed house shows the greatest increase of all. A fair rise from 1891–96 was succeeded by two very great increases till the figure for 1996 was nearly 57 per cent. greater than that for 1891. In 1906, however, rents were at a very high level, especially in Christchurch, and the next period shows a slight decline, only to be succeeded by another increase.
The decreased price of groceries and the slight set-back in rent in 1911 caused a temporary reduction in the cost of living in that year; but this is the only reduction that is evident. The constant tendency to higher prices is very well brought out by the total expenditure in this household budget.
The report of the Cost of Living Commission of 1912 placed the increase in the cost of living over this period at 16 per cent., allowing for changes in the standard of comfort, in such items as rent. This result was based on index numbers prepared by various witnesses and on general evidence tendered.
It has been interesting to find, after the weekly budget was worked out, that among this evidence is a budget of household expenditure, as estimated in Auckland by Professor Segar, which, though based on different commodities and weighted differently, is in striking agreement with the budget just given, showing the increase from 1894–96 to 1908–10 as 24.6 per cent., while the budget just considered shows 26.67 per cent. increase from 1891 to 1911. Especially noticeable are the figures for rent, given by Professor Segar as 7s. 11½d. and 12s. and in the returns used in this investigation as 7s. 11d. and 12s. 4d.
In this present investigation no account could be taken of changes in the standard of comfort or living. The method used assumes a fixed consumption of the articles mentioned. The prices used, however, are the actual predominant retail prices of these commodities.
Since the Commission's report in 1912, prices of commodities in general have increased rapidly, so that the estimate of 16 per cent. increase will no longer hold good. The figure indicated by the household budget, 36 per cent. increase in 1914 over 1891, represents the actual increase in the retail prices of the commodities most commonly used. Some part of this increase represents changes in the quality demanded — especially is this the case in house-rent; but a great deal of it represents a real increase in the cost of living.
The war, too, as will be shown later, has resulted in increasing the cost of living still further in almost every respect.
From the beginning of the year 1914 particulars of retail prices have been obtained for each month in twenty-five different towns of New Zealand. The twenty-five towns were selected as representative of New Zealand as a whole; they cover both Islands from Whangarei to Invercargill, and represent coastal and inland districts and large and small centres. The data on which the index numbers are based is collected each month by the local Inspectors of Factories from representative retailers, and the index numbers are computed in the office of the Government Statistician. The average prices for each town are published each month, and index numbers each quarter, in the Labour Journal.
The index numbers given below as quarterly are based on the average prices of the three months in the quarter, so that they differ materially from the prices current at the end of the quarters.
In order to make the index numbers for these towns comparable in every respect, and also comparable with the index numbers previously given for the four big towns since 1891, the same base has been retained—viz., the average annual aggregate expenditure in the four chief centres in the five years 1909–13.
The following tables are comparable both horizontally and vertically, since each column has the same base. Horizontally they show variations in time, vertically variations according to locality.
In comparing different quarters, regard must be had to the influence of seasonal fluctuations in price and consumption of some commodities, including such important articles as milk, butter, potatoes, eggs.
| GROUP I.—GROCERIES.—TWENTY-FIVE REPRESENTATIVE TOWNS. | ||||||
|---|---|---|---|---|---|---|
| Index Numbers for each Quarter of 1914 and for the First Two Quarters of 1915 for Twenty-five Representative Towns in New Zealand. | ||||||
| Town. | First Quarter, 1914. | Second Quarter, 1914. | Third Quarter, 1914. | Fourth Quarter, 1914. | First Quarter, 1915. | Second Quarter 1915. |
| (Base: Average aggregate annual expenditure four chief centres, 1909–13 = 1,000.) | ||||||
| Auckland | 1,006 | 1,019 | 1,028 | 1,111 | 1,153 | 1,160 |
| Wellington | 1,041 | 1,058 | 1,114 | 1,275 | 1,219 | 1,226 |
| Christchurch | 1,015 | 1,024 | 1,090 | 1,093 | 1,201 | 1,190 |
| Dunedin | 1,055 | 1,039 | 1,056 | 1,189 | 1,245 | 1,207 |
| Whangarei | 1,025 | 1,029 | 1,089 | 1,086 | 1,214 | 1,212 |
| Hamilton | 1,092 | 1,098 | 1,096 | 1,190 | 1,218 | 1,238 |
| Rotorua | 1,128 | 1,128 | 1,165 | 1,299 | 1,299 | 1,260 |
| Waihi | 1,096 | 1,074 | 1,068 | 1,292 | 1,199 | 1,229 |
| Gisborne | 1,088 | 1,080 | 1,135 | 1,257 | 1,274 | 1,269 |
| Napier | 1,125 | 1,061 | 1,116 | 1,233 | 1,358 | 1,338 |
| Dannevirke | 1,081 | 1,081 | 1,097 | 1,224 | 1,264 | 1,256 |
| New Plymouth | 1,139 | 1,084 | 1,071 | 1,265 | 1,180 | 1,194 |
| Wanganui | 1,002 | 1,005 | 1,025 | 1,184 | 1,124 | 1,148 |
| Taihape | 1,162 | 1,147 | 1,180 | 1,441 | 1,386 | 1,398 |
| Palmerston North | 1,079 | 1,079 | 1,079 | 1,248 | 1,217 | 1,190 |
| Masterton | 1,059 | 1,051 | 1,075 | 1,229 | 1,336 | 1,325 |
| Blenheim | 1,057 | 1,070 | 1,158 | 1,361 | 1,304 | 1,261 |
| Nelson | 1,116 | 1,092 | 1,113 | 1,227 | 1,210 | 1,239 |
| Greymouth | 1,051 | 1,049 | 1,058 | 1,114 | 1,248 | 1,223 |
| Ashburton | 944 | 944 | 1,016 | 1,099 | 1,174 | 1,186 |
| Timaru | 996 | 988 | 1,039 | 1,197 | 1,202 | 1,173 |
| Oamaru | 1,019 | 1,023 | 1,109 | 1,446 | 1,281 | 1,199 |
| Alexandra | 1,141 | 1,141 | 1,156 | 1,325 | 1,392 | 1,306 |
| Gore | 1,007 | 1,014 | 1,014 | 1,243 | 1,302 | 1,233 |
| Invercargill | 1,108 | 1,034 | 1,053 | 1,148 | 1,236 | 1,192 |
A general tendency to increase is observable over the six quarters; but certain facts point to the belief that the increase in the first quarter of 1915 is abnormal and due to the circumstances of war-time. Certain products, such as potatoes and onions, tend to decrease in price, and in some towns this decrease has led to a drop in the index number, though on the whole groceries have tended to rise. The drop in these towns is sometimes exaggerated by the fact that the high price of potatoes in the last quarter of 1914 included new potatoes, which are not strictly comparable with the price of old potatoes, so that the drop is somewhat artificial. A better comparison is obtained from the first quarter of each year, and in this way a good idea may be gained of the rise in prices in the twelve months.
The proper comparison of June quarter, 1914, with June quarter, 1915, Also shows a decided rise in prices in all the towns without exception.
The comparison of the second quarter of 1915 with the first quarter of the year shows in some towns a decrease, in others an increase; and an inspection of the data shows that there are two conflicting causes at work. In practically every town the price of potatoes decreased during June quarter, since the price was naturally high in the first quarter of the year. It is noticeable, too, that in towns where the higher price of potatoes was ruling in the last quarter of 1914 there is no drop between the first and second quarters of 1915. This fall in potatoes, which operated generally over all the towns, was responsible especially for the big drop in the index numbers for a group of southern towns—Invercargill. Gore, Alexandra, Oamaru. Timaru, Dunedin. In all these towns the price of potatoes dropped greatly, and similar falls took place in Palmerston North, Masterton. Blenheim, and Greymouth. In Rotorua there was also a decline in the price of sugar.
These changes demonstrate the seasonal nature of certain fluctuations, particularly in the price of foodstuffs. It is natural to expect the price of potatoes to rise in the first and last quarters of each year, and to decrease in the second and third quarters, and in normal times there would probably be a complete cycle of such changes observable each year. The commodities affected are so important, and consequently are weighted so heavily, that even a slight change in their prices is immediately reflected in the index number.
As was pointed out before, an element of artificiality is introduced by the fact that the weights are calculated on an annual average consumption; but the consumption varies with price. When prices are high it is, in normal circumstances, a prima facie indication that supplies are short and therefore that consumption is lessened, and when prices fall it is usually through an increase in supply. So that the high price of potatoes in December and March quartets tends to have an undue influence on the index numbers for those periods.
The proper comparison, it must be emphasized again, is between corresponding quarters; but the changes in different prices are always worthy of notice.
The price of sugar, however, is a genuine advance, not merely a seasonal fluctuation; and similarly there has been a general tendency towards a rise in the price of bread. Practically all the increases shown are due to this cause— as, for instance, in Waihi, Hamilton, New Plymouth, Wanganui, Taihape, Nelson. In Gisborne a rise in bread was counteracted by a fall in potatoes, and in every town those two movements were conflicting.
It will be noticed that the three commodities mentioned belong to the subgroup of New Zealand products which were analysed previously and found to be responsible for most of the fluctuations in this group. Those articles which were called “general groceries” are much more stable, and have changed in price very little compared with bread and potatoes especially, and flour, oatmeal, onions, and sugar in a loss degree. Put whatever change there has been in general groceries has been upward.
The most expensive town in June quarter was Taihape, followed by Napier, Masterton, and Alexandra, while the least expensive towns were Wanganui and Auckland.
| GROUP II.—DAIRY-PRODUCE.—TWENTY-FIVE REPRESENTATIVE TOWNS. | ||||||
|---|---|---|---|---|---|---|
| Index Numbers for each Quarter of 1914 and for the First Two Quarters of 1915 for Twenty-five Representative Towns in New Zealand. | ||||||
| Town. | First Quarter, 1914. | Second Quarter, 1914. | Third Quarter, 1914. | Fourth Quarter, 1914. | First Quarter, 1915. | Second Quarter, 1915. |
| (Base: Average aggregate annual expenditure, four chief centres, 1909–13 = 1,000.) | ||||||
| Auckland | 1,011 | 1,019 | 1,015 | 1,028 | 1,101 | 1,177 |
| Wellington | 1,109 | 1,186 | 1,094 | 1,079 | 1,119 | 1,295 |
| Christchurch | 1,030 | 1,082 | 1,012 | 915 | 1,077 | 1,166 |
| Dunedin | 1,053 | 1,119 | 1,045 | 1,040 | 1,091 | 1,203 |
| Whangarei | 984 | 1,057 | 1,002 | 1,050 | 1,094 | 1,187 |
| Hamilton | 1,022 | 1,016 | 1,026 | 1,006 | 1,090 | 1,198 |
| Rotorua | 1,107 | 1,141 | 1,061 | 1,094 | 1,207 | 1,346 |
| Waihi | 1,013 | 1,050 | 992 | 1,030 | 1,128 | 1,261 |
| Gisborne | 1,102 | 1,104 | 1,051 | 1,066 | 1,131 | 1,287 |
| Napier | 1,095 | 1,127 | 1,092 | 1,111 | 1,151 | 1,217 |
| Dannevirke | 1,018 | 1,018 | 1,025 | 1,047 | 1,084 | 1,192 |
| New Plymouth | 1,042 | 1,096 | 974 | 910 | 1,024 | 1,151 |
| Wanganui | 1,042 | 1,043 | 991 | 1,008 | 1,144 | 1,279 |
| Taihape | 1,105 | 1,117 | 1,154 | 1,104 | 1,188 | 1,356 |
| Palmerston North | 916 | 916 | 916 | 1,017 | 1,080 | 1,155 |
| Masterton | 1,028 | 1,092 | 1,018 | 920 | 1,030 | 1,179 |
| Blenheim | 1,056 | 1,096 | 1,038 | 1,055 | 1,154 | 1,291 |
| Nelson | 1,080 | 1,111 | 1,010 | 998 | 1,173 | 1,265 |
| Greymouth | 1,082 | 1,123 | 1,068 | 1,040 | 1,112 | 1,230 |
| Ashburton | 1,029 | 1,029 | 1,029 | 1,013 | 1,080 | 1,179 |
| Timaru | 1,036 | 1,048 | 1,014 | 1,039 | 1,080 | 1,187 |
| Oamaru | 919 | 1,009 | 1,012 | 1,044 | 1,094 | 1,257 |
| Alexandra | 1,055 | 1,140 | 1,147 | 1,052 | 1,138 | 1,345 |
| Gore | 1,054 | 1,088 | 1,052 | 1,049 | 1,095 | 1,201 |
| Invercargill | 996 | 1,049 | 1,029 | 996 | 1,084 | 1,247 |
The index numbers of retail prices of dairy-produce also show a very decided increase in 1915 over the corresponding quarters of 1914. The two main commodities in this group, milk and butter, vary greatly in supply and price at different periods of the year, and this difference is shown by a general fall in the index number for the spring quarter, September.
But a great rise in the price-level is evident when the corresponding quarters of 1915 and 1914 are compared. This increase is not confined to one or two towns, but is apparent over the whole Dominion.
The very high figures for June quarter, 1915, reflect the great rise in the price of butter which was general in that period. Eggs also rose in price and contributed to increase the index numbers. In a normal year June quarter stands out as the highest peak in the year, since prices of dairy-products are then at their high winter level. Naturally, as the season develops in September quarter prices drop.
June quarter, 1915, also saw higher winter prices of milk, and this factor accounted for the very big increases in the index numbers for Wellington, Rotorua, Waihi, Wanganui, Taihape, Masterton, Blenheim, Oamaru, Alexandra, and Invercargill.
The towns which show the highest prices of dairy-produce are Taihape and Rotorua, while the least expensive are New Plymouth and Palmerston North.
| GROUP III.—MEAT.—TWENTY-FIVE REPRESENTATIVE TOWNS. | ||||||
|---|---|---|---|---|---|---|
| Index Numbers for each Quarter of 1914 and for the First Two Quarters of 1915 for Twenty-five Representative Towns in New Zealand. | ||||||
| Town. | First Quarter, 1914. | Second Quarter, 1914. | Third Quarter, 1914. | Fourth Quarter, 1914. | First Quarter, 1915. | Second Quarter, 1915. |
| (Base: Average annual aggregate expenditure, four chief centres, 1909–13–1,000.) | ||||||
| Auckland | 1,258 | 1,258 | 1,258 | 1,290 | 1,274 | 1,233 |
| Wellington | 1,103 | 1,103 | 1,103 | 1,157 | 1,178 | 1,173 |
| Christchurch | 1,002 | 1,002 | 1,241 | 1,241 | 1,169 | 1,050 |
| Dunedin | 1,056 | 1,056 | 1,197 | 1,127 | 1,197 | 1,139 |
| Whangarei | 1,102 | 1,164 | 1,164 | 1,303 | 1,290 | 1,266 |
| Hamilton | 1,115 | 1,115 | 1,115 | 1,277 | 1,273 | 1,271 |
| Rotorua | 1,168 | 1,168 | 1,129 | 1,190 | 1,219 | 1,240 |
| Waihi | 1,137 | 1,137 | 1,137 | 1,139 | 1,068 | 1,245 |
| Gisborne | 938 | 1,055 | 1,055 | 1,217 | 1,234 | 1,180 |
| Napier | 1,043 | 1,043 | 1,095 | 1,195 | 1,208 | 1,208 |
| Dannevirke | 1,003 | 1,003 | 1,055 | 1,129 | 1,129 | 1,146 |
| New Plymouth | 1,203 | 1,203 | 1,203 | 1,330 | 1,343 | 1,350 |
| Wanganui | 1,014 | 1,156 | 1,003 | 1,030 | 1,055 | 1,090 |
| Taihape | 1,114 | 1,114 | 1,114 | 1,114 | 1,136 | 1,130 |
| Palmerston North | 981 | 981 | 981 | 1,133 | 1,129 | 1,188 |
| Masterton | 1,064 | 1,064 | 1,070 | 1,127 | 1,128 | 1,167 |
| Blenheim | 1,045 | 1,045 | 1,045 | 1,166 | 1,066 | 1,076 |
| Nelson | 1,126 | 1,126 | 1,126 | 1,154 | 1,201 | 1,127 |
| Greymouth | 1,104 | 1,326 | 1,364 | 1,414 | 1,377 | 1,365 |
| Ashburton | 1,142 | 1,142 | 1,162 | 1,216 | 1,249 | 1,251 |
| Timaru | 1,115 | 1,115 | 1,094 | 1,314 | 1,304 | 1,156 |
| Oamaru | 1,132 | 1,132 | 1,191 | 1,287 | 1,309 | 1,281 |
| Alexandra | 1,134 | 1,134 | 1,231 | 1,207 | 1,201 | 1,194 |
| Gore | 1,226 | 1,240 | 1,237 | 1,357 | 1,373 | 1,368 |
| Invercargill | 1,118 | 1,118 | 1,156 | 1,195 | 1,302 | 1,280 |
The price of meat, which had been rising continuously from 1891, jumped ahead very rapidly from 1912, till in 1914 it was at a very high level. The increase was general, but in Auckland it was especially noticeable. Consequently when the war came in the middle of 1914 meat prices were at a high level. Like practically all other New Zealand products, meat immediately commenced to rise in price; but a shortage of shipping-space disorganized the trade and prices fell again, notably in Auckland and Christchurch. The tendency to fall continued till the second quarter of 1915; but was succeeded by a sharp upward movement. The fall in prices, moreover, was only a temporary set-back, and prices have never on the Dominion average fallen to a level lower than obtained before the war.
This development is illustrated by the table just given. The decline referred to did not manifest itself in every town, but rather in one or two of the bigger centres. For instance, in the first quarter of 1915 nine towns, including Auckland and Christchurch, show lower prices, and the majority of the towns show but slight increases.
In June quarter fifteen towns showed decreases, the greatest being in Timaru. Christchurch, and Nelson: one town is unchanged, and only nine show increases. The increases are greatest in Waihi, Palmerston North, and Masterton.
There are a few towns which show consistently high prices for meat. Auckland and Whangarei are fairly expensive; but the most expensive are New Plymouth, Greymouth, and Gore. The cheapest towns are Wanganui, Blenheim, and Christchurch.
| THREE FOOD GROUPS.—TWENTY-FIVE REPRESENTATIVE TOWNS. | ||||||
|---|---|---|---|---|---|---|
| Index Numbers for each Quarter of 1914 and for the Two First Quarters of 1915 for Twenty-five Representative Towns in New Zealand. | ||||||
| Town. | First Quarter, 1914. | Second Quarter, 1914. | Third Quarter, 1914. | Fourth Quarter, 1914. | First Quarter, 1915. | Second Quarter, 1915. |
| (Base: Average annual aggregate expenditure, four chief centres, 1909–13 = 1,000.) | ||||||
| Auckland | 1,093 | 1,107 | 1,103 | 1,153 | 1,182 | 1,189 |
| Wellington | 1,078 | 1,103 | 1,106 | 1,189 | 1,182 | 1,224 |
| Christchurch | 1,014 | 1,030 | 1,124 | 1,102 | 1,161 | 1,136 |
| Dunedin | 1,055 | 1,064 | 1,101 | 1,157 | 1,193 | 1,183 |
| Whangarei | 1,042 | 1,082 | 1,094 | 1,152 | 1,212 | 1,225 |
| Hamilton | 1,084 | 1,092 | 1,086 | 1,177 | 1,207 | 1,240 |
| Rotorua | 1,136 | 1,144 | 1,129 | 1,214 | 1,250 | 1,273 |
| Waihi | 1,091 | 1,090 | 1,074 | 1,179 | 1,138 | 1,242 |
| Gisborne | 1,040 | 1,077 | 1,088 | 1,199 | 1,227 | 1,243 |
| Napier | 1,090 | 1,070 | 1,103 | 1,192 | 1,259 | 1,266 |
| Dannevirke | 1,040 | 1,040 | 1,066 | 1,150 | 1,176 | 1,204 |
| New Plymouth | 1,138 | 1,127 | 1,093 | 1,205 | 1,199 | 1,237 |
| Wanganui | 1,016 | 1,065 | 1,010 | 1,091 | 1,105 | 1,159 |
| Taihape | 1,132 | 1,129 | 1,151 | 1,251 | 1,255 | 1,297 |
| Palmerston North | 1,008 | 1,008 | 1,008 | 1,155 | 1,155 | 1,181 |
| Masterton | 1,054 | 1,065 | 1,060 | 1,123 | 1,194 | 1,237 |
| Blenheim | 1,053 | 1,068 | 1,092 | 1,223 | 1,188 | 1,205 |
| Nelson | 1,111 | 1,108 | 1,093 | 1,147 | 1,198 | 1,207 |
| Greymouth | 1,076 | 1,161 | 1,164 | 1,199 | 1,260 | 1,273 |
| Ashburton | 1,031 | 1,031 | 1,069 | 1,199 | 1,177 | 1,206 |
| Timaru | 1,046 | 1,045 | 1,052 | 1,200 | 1,209 | 1,170 |
| Oamaru | 1,034 | 1,057 | 1,114 | 1,298 | 1,247 | 1,241 |
| Alexandra | 1,119 | 1,138 | 1,179 | 1,222 | 1,268 | 1,277 |
| Gore | 1,119 | 1,108 | 1,099 | 1,237 | 1,278 | 1,272 |
| Invercargill | 1,085 | 1,066 | 1,083 | 1,129 | 1,223 | 1,235 |
By combining the food groups an index number representing the cost of foodstuffs is obtained, and, being a weighted average of the three groups, this index number gives the mean of their variations. It will be remembered that while the prices both of groceries and dairy-produce have increased considerably since the first quarter of 1914, meat has not increased nearly as much, so that the index number for foodstuffs is reduced.
General increases are observable over all the towns throughout the whole period. The extent of this increase is more evident when the quarters of 1915 are compared with the corresponding quarters of the previous year.
Wanganui and Christchurch divide the honour of being the cheapest towns in respect of food-prices. Timaru. Palmerston North. Dunedin, and Auckland are also cheap, and Waihi only lost its position in the second quarter of 1915 owing to an exceptionally great rise in meat-prices.
At the other end of the scale come a group of smaller towns—it is noticeable that the larger towns show prices relatively low compared with the smaller contres. Taihape, Alexandra. Greymouth, Rotorua. Gore, and Napier are more expensive than the average.
The data for rent is not collected monthly as is the other data, but half-yearly, so that the figures quoted for March quarter, 1915, must stand for June quarter too. Changes in rent, as was stated previously, are relatively infrequent, and there is danger in trying to measure changes over short periods, from the fact that for many tenants the rent remains the same, though changes may take place in the value of houses. Leases, infrequent changes of residence, the difficulty of departing from customary rents, all militate against any effort to measure changes over short periods. There was only one collection of returns of rentals during 1914.
| HOUSE-RENT.—TWENTY-FIVE REPRESENTATIVE TOWNS. | |||
|---|---|---|---|
| Index Numbers for 1914 and 1915 for House-rent in Twenty-five Towns of New Zealand. | |||
| 1914. | February, 1915. | August, 1915. | |
| (Base: Average annual aggregate expenditure four chief centres, 1909–13 = 1,000.) | |||
| Auckland | 1,032 | 920 | 963 |
| Wellington | 1,272 | 1,274 | 1,292 |
| Christchurch | 947 | 930 | 928 |
| Dunedin | 940 | 857 | 894 |
| Whangarei | 825 | 817 | 851 |
| Hamilton | 893 | 832 | 853 |
| Rotorua | 917 | 934 | 957 |
| Waihi | 570 | 598 | 606 |
| Gisborne | 947 | 962 | 943 |
| Napier | 983 | 983 | 839 |
| Dannevirke | 640 | 656 | 685 |
| New Plymouth | 858 | 883 | 1,102 |
| Wanganui | 888 | 850 | 850 |
| Taihape | 864 | 864 | 974 |
| Palmerston North | 734 | 877 | 856 |
| Masterton | 750 | 743 | 745 |
| Blenheim | 748 | 748 | 759 |
| Nelson | 892 | 946 | 1,016 |
| Greymouth | 700 | 753 | 718 |
| Ashburton | 698 | 818 | 734 |
| Timaru | 894 | 822 | 840 |
| Oamaru | 793 | 788 | 839 |
| Alexandra | 486 | 486 | 480 |
| Gore | 727 | 700 | 694 |
| Invercargill | 993 | 1,000 | 937 |
The results disclosed by the table are somewhat doubtful, but the main feature disclosed is the great variation between different towns. Rents in Alexandra are only two-fifths the level of Wellington rents, and even in the large centres Wellington is 33⅓ per cent. higher than Christchurch or Dunedin.
The same variation is shown in the movements of rent, which seem to be governed almost wholly by local causes. In February, 1915, ten towns, including Auckland and Christchurch, showed decreases, the greatest being in Auckland, Timaru, and Hamilton; four towns were stationary; and eleven towns, including Wellington and Dunedin, showed increases, which were greatest in Palmerston North. Nelson, Greymouth, and Ashburton. Owing, however, to the very great drop in the largest town, Auckland, the general tendency of rents was downward.
In August seven towns which showed decreases in February had recovered somewhat, but seven which had shown increases dropped again. Six towns, including Wellington, continued their upward movement, and four, including Christchurch, continued to fall.
On the whole, the general tendency in February was to fall; but a recovery had set in by August.
The following table shows the positions of the towns in August compared with 1914:—
| Risen since 1914. | Fallen since 1914 |
|---|---|
| Wellington. | Auckland. |
| Whangarei. | Christchurch. |
| Rotorua. | Dunedin. |
| Waihi. | Hamilton. |
| Dannevirke. | Gisborne. |
| New Plymouth. | Napier. |
| Taihape. | Wanganui. |
| Palmerston North. | Masterton. |
| Blenheim. | Timaru. |
| Nelson. | Alexandra. |
| Greymouth. | Gore. |
| Ashburton. | Invercargill. |
| Oamaru. |
It will be seen that Wellington is the only one of the four big centres in which rents have risen, a fact which is perhaps due to the military activity of the Dominion being centred in the vicinity of Wellington; while Palmerston North, the only other large town to rise, has also benefited from this cause.
The other towns showing rising rents are mainly the smaller country towns already on the up-grade, to which the war has added prosperity.
Practically every trading town, including the three other big centres and Gisborne, Napier, Wanganui, Timaru, and Invercargill, shows a decrease.
| FOOD GROUPS AND RENT.—TWENTY-FIVE REPRESENTATIVE TOWNS. | ||||||
|---|---|---|---|---|---|---|
| Index Numbers for each Quarter of 1914 and for the Two First Quarters of 1915 for Twenty-five Representative Towns in New Zealand. | ||||||
| Town. | First Quarter, 1914. | Second Quarter, 1914. | Third Quarter, 1914. | Fourth Quarter, 1914. | First Quarter, 1915. | Second Quarter, 1915. |
| (Base: Average aggregate annual expenditure, four chief centres. 1909–13 = 1,000.) | ||||||
| Auckland | 1,070 | 1,078 | 1,076 | 1,107 | 1,082 | 1,086 |
| Wellington | 1,152 | 1,168 | 1,169 | 1,221 | 1,217 | 1,243 |
| Christchurch | 988 | 998 | 1,056 | 1,043 | 1,073 | 1,057 |
| Dunedin | 1,011 | 1,016 | 1,040 | 1,074 | 1,103 | 1,096 |
| Whangarei | 959 | 983 | 991 | 1,027 | 1,061 | 1,069 |
| Hamilton | 1,011 | 1,016 | 1,012 | 1,068 | 1,063 | 1,084 |
| Rotorua | 1,052 | 1,057 | 1,048 | 1,101 | 1,122 | 1,136 |
| Waihi | 891 | 890 | 881 | 946 | 931 | 995 |
| Gisborne | 987 | 1,010 | 1,051 | 1,120 | 1,126 | 1,135 |
| Napier | 1,049 | 1,035 | 1,057 | 1,112 | 1,153 | 1,157 |
| Dannevirke | 887 | 887 | 903 | 955 | 977 | 994 |
| New Plymouth | 1,031 | 1,024 | 1,003 | 1,072 | 1,078 | 1,101 |
| Wanganui | 967 | 997 | 963 | 1,011 | 1,008 | 1,041 |
| Taihape | 1,030 | 1,027 | 1,041 | 1,103 | 1,105 | 1,131 |
| Palmerston North | 903 | 903 | 903 | 994 | 1,048 | 1,065 |
| Masterton | 937 | 944 | 941 | 980 | 1,021 | 1,048 |
| Blenheim | 936 | 945 | 960 | 1,058 | 1,019 | 1,029 |
| Nelson | 1,027 | 1,025 | 1,016 | 1,049 | 1,101 | 1,107 |
| Greymouth | 925 | 977 | 994 | 1,015 | 1,066 | 1,073 |
| Ashburton | 904 | 904 | 927 | 958 | 1,040 | 1,058 |
| Timaru | 996 | 996 | 983 | 1,075 | 1,060 | 1,037 |
| Oamaru | 942 | 956 | 991 | 1,105 | 1,071 | 1,067 |
| Alexandra | 876 | 888 | 914 | 940 | 968 | 974 |
| Gore | 969 | 962 | 956 | 1,042 | 1,057 | 1,053 |
| Invercargill | 1,050 | 1,038 | 1,048 | 1,077 | 1,138 | 1,145 |
The inclusion of rent materially alters the relative positions of a great many towns, especially taking away the advantage held by the bigger centres in the three food groups.
The most expensive town in New Zealand, when rent is taken into consideration, is Wellington, while Napier and Invercargill come close up. The lowest index number is shown by Alexandra, Dannevirke, and Waihi, and in all of these cases it is rent which determines the position on the scale. Auckland is tenth in June quarter, 1915, Dunedin ninth, and Christchurch seventeenth, in order of expense. The relative position of the twenty-five towns is shown on the thermometers given farther on in this section.
The changes in the cost-of-living index numbers were simply a combination of the changes previously analysed.
The following is included simply as an illustration of the different levels of prices in each of the twenty-five towns considered. Similar figures may easily be compiled for the various quarters by working from the index numbers and equating 1,000 to 20s. The purchasing-power of money in the average of the five years 1909–13 in the four centres is taken as the base and equated to 20s., the indices being worked out proportionately. The amounts displayed in the table may be compared vertically but not horizontally, since the various groups have different bases.
AMOUNT REQUIREDTO PURCHASE, IN TWENTY-FIVE REPRESENTATIVE TOWNS, IN JUNE QUARTER, 1915, WHAT WOULDHAVE COST 20s. IN THE AVERAGE OFTHE FOUR CHIEF CENTRES, 1909–13.
| Towns | Group I. Groceries. | Group II, Dairy-produce. | Group III. Meat. | Groups I-III. Food Groups. | House-rent. | All Groups. | ||||||
|---|---|---|---|---|---|---|---|---|---|---|---|---|
| s. | d. | s. | d. | s. | d. | s. | d. | s. | d. | s. | d. | |
| Auckland | 23 | 2½ | 23 | 6½ | 24 | 8 | 23 | 9¼ | 18 | 4¾ | 21 | 8¾ |
| Wellington | 24 | 6¼ | 25 | 10¾ | 23 | 5½ | 24 | 5¾ | 25 | 5¾ | 24 | 10¼ |
| Christchurch | 23 | 9½ | 23 | 3¾ | 21 | 0 | 22 | 8¾ | 18 | 7¼ | 21 | 1¾ |
| Dunedin | 24 | 1¾ | 24 | 0¾ | 22 | 9¼ | 23 | 8 | 19 | 1¾ | 21 | 11 |
| Whangarei | 24 | 3 | 23 | 9 | 25 | 3¾ | 24 | 6 | 16 | 4 | 21 | 4½ |
| Hamilton | 24 | 9 | 23 | 11½ | 25 | 5 | 24 | 9½ | 16 | 7¾ | 21 | 8¼ |
| Rotorua | 25 | 2½ | 26 | 11 | 24 | 9½ | 25 | 5½ | 18 | 3¼ | 22 | 8¾ |
| Waihi | 24 | 7 | 25 | 2¾ | 24 | 10¾ | 24 | 10 | 11 | 11½ | 19 | 10¾ |
| Gisborne | 25 | 4½ | 25 | 9 | 23 | 7¼ | 24 | 10¼ | 19 | 3 | 21 | 8½ |
| Napier | 26 | 9 | 24 | 4 | 24 | 2 | 25 | 3¾ | 19 | 8 | 23 | 1¾ |
| Dannevirke | 25 | 1½ | 23 | 10 | 22 | 11 | 24 | 1 | 13 | 1½ | 19 | 10½ |
| New Plymouth | 23 | 10½ | 23 | 0¼ | 27 | 0 | 24 | 9 | 17 | 8 | 22 | 0¼ |
| Wanganui | 22 | 11½ | 25 | 7 | 21 | 9½ | 23 | 2¼ | 17 | 0 | 20 | 9¾ |
| Taihape | 27 | 11½ | 27 | 1½ | 22 | 7¼ | 25 | 11¼ | 17 | 3¼ | 22 | 7½ |
| Palmerston North | 23 | 9½ | 23 | 1¼ | 23 | 9 | 23 | 7½ | 17 | 6½ | 21 | 3½ |
| Masterton | 26 | 6 | 23 | 7 | 23 | 4 | 24 | 9½ | 14 | 10¼ | 20 | 11½ |
| Blenheim | 25 | 2¾ | 25 | 9¾ | 21 | 6¼ | 24 | 1¼ | 14 | 11½ | 20 | 7 |
| Nelson | 24 | 9¼ | 25 | 3½ | 22 | 6½ | 24 | 1¾ | 18 | 11 | 22 | 1¾ |
| Greymouth | 24 | 5½ | 24 | 7¼ | 27 | 3½ | 25 | 5½ | 15 | 0¾ | 21 | 5½ |
| Ashburton | 23 | 8¾ | 23 | 7 | 25 | 0¼ | 24 | 1½ | 16 | 4¼ | 21 | 2 |
| Timaru | 23 | 5½ | 23 | 9 | 23 | 1½ | 23 | 4¾ | 16 | 5¼ | 20 | 9 |
| Oamaru | 23 | 11¾ | 25 | 1¾ | 25 | 7½ | 24 | 9¾ | 15 | 9 | 21 | 4 |
| Alexandra | 26 | 1½ | 26 | 10¾ | 23 | 10½ | 25 | 6½ | 9 | 8¾ | 19 | 5¾ |
| Gore | 24 | 8 | 24 | 0¼ | 27 | 4¼ | 25 | 5¼ | 14 | 0 | 21 | 0¾ |
| Invercargill | 23 | 10 | 24 | 11¼ | 25 | 7¼ | 24 | 8½ | 20 | 0 | 22 | 10¾ |
| NOTE.—Figures are comparable vertically but not horizontally. | ||||||||||||
In all the foregoing tables giving information concerning prices in twenty-five towns the four chief centres are shown at the top of the list, the other towns following in geographical order. To see at a glance the positions occupied by the various towns in order of “cost of living,” a diagram (see following page) is now given in the form of what may be called “cost-of-living” thermometers, whereon each town is shown opposite a point corresponding to its index number in the table referring to expenditure on all groups, for the last two quarters of 1914 and the first two quarters of 1915. The thermometers not only show the relative positions of the towns from the point of view of higher or lower “cost of living,” but also give a good indication of the increases or decreases in any town throughout the year.
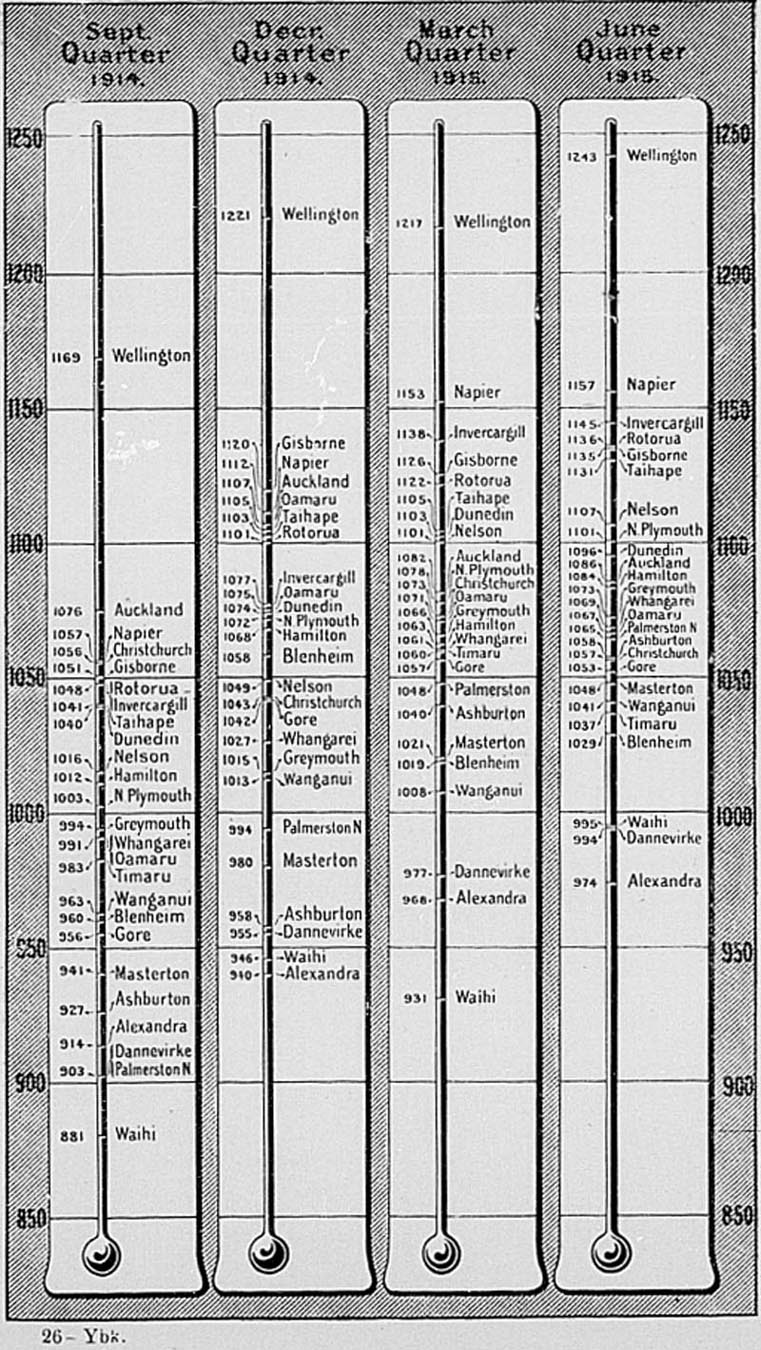
To obtain a general estimate of the course of prices for the whole Dominion it has been necessary to obtain a weighted average of the index numbers for each town. It is obvious that it would not be strictly correct to obtain a simple average of the prices in Alexandra, with a population of 800, and in Auckland, with a population of nearly 120,000. So each town has been weighted according to its population, and a composite index number has been obtained, which, though artificial, represents the average level of prices in the Dominion.
The twenty-five towns considered have a total population of approximately half the population of New Zealand, so that they are representative of the Dominion. The four centres, which include a third of the Dominion's population, account for about 70 per cent. of the population of the twenty-five towns, so that their influence in the Dominion index number is naturally preponderating. This, however, is actually the case, because the centres not only comprise a great part of the people of the Dominion, but the standard set in them is followed by the whole countryside.
">The Dominion-weighted index number obtained is shown in the table below:—
| — | First Quarter, 1914. | Second Quarter, 1914. | Third Quarter 1914. | Fourth Quarter, 1914. | First Quarter, 1915. | Second Quarter, 1915. |
|---|---|---|---|---|---|---|
| Groceries | 1,039 | 1,038 | 1,071 | 1,078 | 1,210 | 1,201 |
| Dairy-produce | 1,042 | 1,089 | 1,032 | 1,017 | 1,100 | 1,212 |
| Meat | 1,107 | 1,117 | 1,177 | 1,221 | 1,213 | 1,171 |
| Three food groups | 1,063 | 1,077 | 1,098 | 1,155 | 1,186 | 1,194 |
| House-rent | 986 | 986 | 985 | 985 | 963 | 963 |
| Food and rent | 1,033 | 1,042 | 1,056 | 1,091 | 1,100 | 1,105 |
These figures show clearly a great rise in prices over the whole Dominion; but it must be remembered that they are quarterly figures, and therefore that seasonal fluctuations largely account for some of the movements that are evident.
In groceries an almost negligible change was converted by the war into a formidable rise in price, and the proper comparison of the first two quarters of 1914 and 1915 shows up this rise clearly. There are many commodities of a seasonal nature in this group, so that the comparison with other quarters is hardly desirable.
In dairy-produce the seasonal change is even more marked. In the year's interval a big rise is apparent, but this makes a rise and a sharp decline followed by a further rise. The explanation is that in the second quarter prices are always higher for milk and butter, the two main commodities in this group. The third and fourth quarters saw a tendency to fall, which has been since converted by abnormal circumstances into a rise.
June quarter, 1915, saw an exceptionally heavy rise in prices of butter, and this was reflected in a 10-per-cent. increase in the index number for dairy-produce.
The prices of meat have been affected by outside circumstances, and the checking of the rise in prices lately has been due, no doubt, to the difficulties of export.
Taking the three food commodities together the temporary and special fluctuations are largely eliminated, and the figures show a steady rise.
House-rent, for which only one collection of data was made in 1914, shows a tendency to fall in the first quarter of the present year. This result has been averaged from conflicting tendencies over the different towns, some showing rising, some falling, rents; but the evidence particularly of Auckland has turned the scale.
Taking all groups together, the rise is again steady and continuous, being greatest between the third and fourth quarters of 1914. The slight check to the rate of increase that is apparent since then is due to the influence of rent.
For the period 1891–1914 it was possible to got returns only from the four chief centres, so that any comparison of a Dominion index number with the index number previously published is not strictly accurate. It is possible only to compare the average of the four chief centres, which, especially in rent, differ materially from the Dominion average. A table of comparison is given below:—
| JUNE QUARTER, 1915. | |||
|---|---|---|---|
| Group | Average of Four Centres. | Weighted Average of Twenty-five towns. | Difference. |
| Groceries | 1,196 | 1,201 | + 5 |
| Dairy-produce | 1,210 | 1,212 | + 2 |
| Meat | 1,149 | 1,171 | + 22 |
| Three food groups | 1,183 | 1,194 | + 11 |
| House-rent | 1,020 | 963 | — 57 |
| Food and rent | 1,120 | 1,105 | – 15 |
From this table it may be seen that groceries, dairy-produce, and meat are all more expensive in the smaller towns than in the centres, though the difference is not usually very great. In meat, however, the divergence is greater in this quarter than in any other quarter since the beginning of 1914, due to an abrupt rise in some of the smaller towns.
In rent, the four centres, mainly because of the influence of Wellington, are far more expensive than the smaller towns, and rent outweighs the opposing tendency of the other groups.
The following tables give the average retail prices of the commodities considered in the previous pages, for the year 1914.
| AVERAGE RETAIL PRICES IN 1914. | |||||||
|---|---|---|---|---|---|---|---|
| Town. | Bread. | Flour. | Oatmeal. | Rice. | Sago. | Tapioca. | Tea. |
| Per 2 lb. loaf. | Per 25 lb. bag. | Per lb. | Per lb. | Per lb. | Per lb. | Per lb. | |
| d. | d. | d. | d. | d. | d. | d. | |
| Auckland | 4.12 | 43.77 | 2.27 | 2.46 | 2.21 | 2.49 | 17.75 |
| Wellington | 4.12 | 44.00 | 2.12 | 2.21 | 2.33 | 2.33 | 20.12 |
| Christchurch | 4.00 | 41.31 | 2.25 | 2.62 | 2.62 | 2.69 | 18.00 |
| Dunedin | 4.12 | 43.56 | 2.00 | 2.25 | 2.25 | 2.25 | 20.31 |
| Whangarei | 4.12 | 44.06 | 2.31 | 2.62 | 2.50 | 2.50 | 18.00 |
| Hamilton | 4.12 | 47.19 | 2.31 | 2.75 | 2.62 | 2.62 | 17.06 |
| Rotorua | 4.37 | 46.44 | 2.00 | 2.87 | 2.87 | 2.87 | 19.69 |
| Waihi | 4.12 | 45.12 | 2.31 | 2.75 | 2.75 | 2.75 | 18.00 |
| Gisborne | 4.25 | 44.94 | 2.31 | 2.75 | 2.75 | 2.87 | 19.31 |
| Napier | 4.13 | 44.81 | 2.19 | 2.85 | 2.87 | 2.87 | 22.67 |
| Dannevirke | 4.00 | 45.81 | 2.31 | 3.00 | 2.69 | 3.00 | 21.50 |
| New Plymouth | 4.12 | 45.37 | 2.25 | 2.50 | 2.50 | 2.50 | 19.00 |
| Wanganui | 3.62 | 44.00 | 2.12 | 2.87 | 2.37 | 2.44 | 18.19 |
| Taihape | 4.12 | 49.25 | 3.00 | 3.00 | 3.00 | 3.00 | 24.00 |
| Palmerston North | 3.75 | 51.44 | 2.75 | 2.94 | 3.00 | 300 | 19.87 |
| Masterton | 3.75 | 47.87 | 2.12 | 2.69 | 2.69 | 2.62 | 23.50 |
| Blenheim | 3.88 | 51.00 | 3.00 | 3.00 | 3.00 | 3.00 | 20.00 |
| Nelson | 4.12 | 46.62 | 2.12 | 3.00 | 2.87 | 3.00 | 19.56 |
| Greymouth | 4.06 | 45.25 | 2.06 | 3.00 | 3.06 | 3.06 | 17.75 |
| Ashburton | 3.50 | 41.69 | 2.19 | 2.56 | 2.25 | 2.25 | 18.75 |
| Timaru | 3.75 | 42.00 | 1.87 | 2.37 | 2.25 | 2.25 | 17.50 |
| Oamaru | 3.50 | 42.75 | 2.19 | 2.69 | 2.75 | 2.25 | 20.00 |
| Alexandra | 4.50 | 45.62 | 2.75 | 2.81 | 3.37 | 3.37 | 20.00 |
| Gore | 3.56 | 49.50 | 2.50 | 2.94 | 3.00 | 3.00 | 18.69 |
| Invercargill | 3.75 | 47.44 | 2.31 | 2.62 | 2.62 | 2.62 | 18.81 |
| AVERAGE RETAIL PRICES IN 1914. | |||||||
|---|---|---|---|---|---|---|---|
| Town. | Coffee. | Cocoa. | Sugar. | Salt, | Pepper. | Jam. | Honey. |
| Per 1 lb. | Per ¼ lb. tin. | Per 56 lb. bag. | Per 1 lb. | Per ¼ lb. | Per 1 lb. | Per 1 lb. | |
| d. | d. | d. | d. | d. | d. | d. | |
| Auckland | 19.91 | 9.50 | 113.12 | 0.56 | 4.11 | 5.00 | 4.94 |
| Wellington | 18.87 | 11.06 | 117.85 | 1.00 | 5.44 | 5.06 | 6.69 |
| Christchurch | 19.00 | 11.12 | 131.50 | 1.00 | 4.50 | 5.50 | 6.00 |
| Dunedin | 20.06 | 10.94 | 118.38 | 1.00 | 4.12 | 6.56 | 6.06 |
| Whangarei | 20.06 | 11.06 | 115.87 | 1.00 | 4.69 | 5.69 | 6.69 |
| Hamilton | 17.00 | 10.69 | 120.75 | 1.00 | 4.19 | 5.75 | 6.19 |
| Rotorua | 19.81 | 11.31 | 141.44 | 1.00 | 4.75 | 5.37 | 8.00 |
| Waihi | 19.50 | 11.00 | 118.75 | 1.00 | 4.12 | 5.75 | 6.50 |
| Gisborne | 21.69 | 10.94 | 121.50 | 1.00 | 4.87 | 5.50 | 7.06 |
| Napier | 21.75 | 11.00 | 127.46 | 1.00 | 5.69 | 6.00 | 6.00 |
| Dannevirke | 22.00 | 10.75 | 125.75 | 1.00 | 4.12 | 5.12 | 6.00 |
| New Plymouth | 20.06 | 10.87 | 117.37 | 1.00 | 4.75 | 5.94 | 6.00 |
| Wanganui | 20.19 | 10.81 | 117.50 | 1.00 | 4.37 | 5.44 | 6.19 |
| Taihape | 24.00 | 12.00 | 139.00 | 1.00 | 6.00 | 6.00 | 6.25 |
| Palmerston North | 22.00 | 11.56 | 124.62 | 1.00 | 5.25 | 5.56 | 6.00 |
| Masterton | 20.56 | 11.19 | 130.50 | 1.00 | 5.00 | 5.56 | 6.31 |
| Blenheim | 21.50 | 11.25 | 130.12 | 1.00 | 7.50 | 6.00 | 6.00 |
| Nelson | 20.56 | 10.50 | 131.12 | 1.00 | 5.56 | 6.00 | 6.25 |
| Greymouth | 19.00 | 11.75 | 125.87 | 1.00 | 6.00 | 5.06 | 5.50 |
| Ashburton | 21.31 | 11.87 | 120.69 | 1.00 | 4.06 | 5.00 | 4.61 |
| Timaru | 20.69 | 11.50 | 125.25 | 1.00 | 5.06 | 6.00 | 5.37 |
| Oamaru | 21.12 | 11.00 | 129.75 | 1.00 | 5.00 | 6.00 | 5.37 |
| Alexandra | 24.00 | 11.00 | 137.62 | 1.25 | 4.56 | 5.75 | 6.50 |
| Gore | 20.56 | 10.19 | 131.37 | 1.00 | 5.00 | 6.75 | 5.87 |
| Invercargill | 20.75 | 11.00 | 120.37 | 1.00 | 4.87 | 5.25 | 6.00 |
| AVERAGE RETAIL PRICES IN 1914. | |||||||
|---|---|---|---|---|---|---|---|
| Town. | Golden Syrup. | Treacle. | Raisins. | Currants. | Apricots. | Pears. | Peaches. |
| Per 2 lb. tin. | Per 2 lb. tin. | Per 1 lb. | Per 1 lb. | Per 2½ lb. tin. | Per 2½ lb. tin. | Per 2½ lb. tin. | |
| d. | d. | d. | d. | d. | d. | d. | |
| Auckland | 5.50 | 5.00 | 4.58 | 4.77 | 11.08 | 12.33 | 11.08 |
| Wellington | 6.00 | 6.00 | 5.92 | 4.87 | 11.62 | 11.62 | 11.62 |
| Christchurch | 6.00 | 6.00 | 6.19 | 5.44 | 12.00 | 12.00 | 12.00 |
| Dunedin | 5.94 | 5.00 | 5.31 | 4.62 | 11.06 | 11.31 | 11.06 |
| Whangarei | 6.00 | 5.00 | 5.75 | 5.50 | 10.81 | 11.81 | 11.19 |
| Hamilton | 6.00 | 5.50 | 5.81 | 5.12 | 10.50 | 11.44 | 10.50 |
| Rotorua | 6.19 | 6.00 | 6.00 | 5.81 | 12.00 | 13.00 | 12.00 |
| Waihi | 5.62 | 5.19 | 6.00 | 5.50 | 11.75 | 12.00 | 11.87 |
| Gisborne | 6.75 | 6.00 | 5.81 | 5.19 | 12.06 | 12.06 | 11.81 |
| Napier | 6.75 | 6.25 | 6.52 | 5.83 | 12.00 | 12.98 | 12.00 |
| Dannevirke | 6.25 | 5.75 | 5.37 | 5.44 | 11.50 | 11.87 | 12.00 |
| New Plymouth | 6.00 | 6.00 | 5.00 | 5.12 | 10.25 | 12.00 | 10.25 |
| Wanganui | 6.00 | 6.00 | 5.25 | 5.31 | 11.50 | 12.81 | 11.62 |
| Taihape | 7.00 | 6.00 | 6.50 | 6.00 | 12.00 | 14.00 | 12.00 |
| Palmerston North | 6.06 | 6.00 | 6.19 | 5.44 | 11.44 | 12.19 | 11.62 |
| Masterton | 6.87 | 6.83 | 4.94 | 4.69 | 12.00 | 12.00 | 12.00 |
| Blenheim | 7.00 | 6.87 | 6.12 | 5.25 | 12.00 | 12.00 | 12.00 |
| Nelson | 6.94 | 6.44 | 5.25 | 5.12 | 11.94 | 11.75 | 12.00 |
| Grey mouth | 6.69 | 6.44 | 5.94 | 5.62 | 10.94 | 11.62 | 11.06 |
| Ash burton | 6.69 | 6.00 | 5.69 | 4.62 | 11.87 | 11.87 | 11.87 |
| Timaru | 6.25 | 5.87 | 4.87 | 4.69 | 11.75 | 12.25 | 11.69 |
| Oamaru | 6.75 | 6.00 | 6.50 | 5.37 | 12.00 | 12.00 | 12.00 |
| Alexandra | 7.00 | 6.00 | 6.37 | 6.12 | 12.00 | 12.62 | 12.00 |
| Gore | 6.94 | 5.94 | 6.25 | 5.06 | 11.62 | 11.87 | 11.75 |
| Invercargill | 6.00 | 6.00 | 5.12 | 4.62 | 12.00 | 12.00 | 12.00 |
| AVERAGE RETAIL PRICES IN 1914. | |||||||
|---|---|---|---|---|---|---|---|
| Town. | Prunes, (dried). | Apricots (dried). | Potatoes. | Onions. | Salmon. | Herrings. | Starch. |
| Per 1 lb. | Per 1 lb. | Per 14 lb. | Per 1 lb. | Per 1 lb. tin. | Per 1 lb. tin. | Per 1 lb. | |
| d. | d. | d. | d. | d. | d. | d. | |
| Auckland | 5.35 | 10.50 | 10.67 | 1.74 | 11.62 | 6.90 | 5.42 |
| Wellington | 6.17 | 9.73 | 11.37 | 2.21 | 11.81 | 7.19 | 6.00 |
| Christchurch | 6.31 | 11.44 | 8.31 | 1.44 | 14.00 | 7.37 | 6.06 |
| Dunedin | 6.12 | 11.00 | 10.75 | 1.62 | 12.12 | 7.69 | 6.12 |
| Whangarei | 5.81 | 10.94 | 12.19 | 2.25 | 12.25 | 7.25 | 6.06 |
| Hamilton | 5.56 | 10.75 | 13.69 | 2.31 | 10.75 | 7.62 | 6.00 |
| Rotorua | 5.75 | 12.12 | 14.31 | 2.37 | 12.62 | 9.00 | 6.00 |
| Waihi | 5.49 | 11.37 | 14.94 | 2.19 | 10.69 | 6.62 | 5.75 |
| Gisborne | 6.00 | 11.37 | 14.12 | 2.31 | 13.06 | 8.75 | 6.06 |
| Napier | 6.91 | 11.87 | 12.73 | 2.39 | 13.35 | 8.87 | 6.10 |
| Dannevirke | 6.50 | 12.19 | 14.25 | 2.00 | 11.25 | 8.75 | 6.19 |
| New Plymouth | 4.50 | 10.00 | 16.37 | 2.12 | 10.25 | 8.00 | 6.00 |
| Wanganui | 4.81 | 11.56 | 13.50 | 2.00 | 11.87 | 8.19 | 6.00 |
| Taihape | 6.75 | 14.00 | 16.25 | 2.25 | 12.00 | 10.50 | 6.00 |
| Palmerston North | 7.00 | 11.25 | 14.37 | 2.06 | 12.00 | 7.87 | 6.00 |
| Masterton | 5.69 | 11.56 | 13.00 | 2.25 | 12.12 | 8.12 | 6.00 |
| Blenheim | 7.25 | 10.25 | 14.75 | 1.94 | 12.50 | 8.50 | 6.00 |
| Nelson | 6.50 | 11.06 | 13.50 | 1.50 | 12.56 | 9.12 | 6.44 |
| Greymouth | 7.06 | 10.44 | 12.06 | 2.00 | 12.00 | 8.31 | 6.25 |
| Ashburton | 6.81 | 10.31 | 8.50 | 1.56 | 12.19 | 7.00 | 6.06 |
| Timaru | 6.62 | 11.50 | 13.44 | 1.69 | 13.00 | 7.44 | 6.00 |
| Oamaru | 7.00 | 12.00 | 17.50 | 3.00 | 14.00 | 9.12 | 6.00 |
| Alexandra | 8.50 | 12.00 | 15.00 | 2.50 | 15.25 | 9.25 | 7.37 |
| Gore | 7.00 | 11.75 | 14.19 | 2.25 | 14.00 | 8.87 | 6.25 |
| Invercargill | 6.44 | 11.94 | 14.75 | 1.50 | 13.50 | 7.81 | 6.19 |
| AVERAGE RETAIL PRICES IN 1914. | |||||||
|---|---|---|---|---|---|---|---|
| Town. | Blue. | Soap. | Tobacco. | Milk. | Butter. | Cheese. | Eggs. |
| Per 1 lb. | Per bar (36 to cwt.) | Per 1 lb. | Per quart. | Per 1 lb. | Per 1 lb. | Per doz. | |
| d. | d. | s. | d. | d. | d. | d. | |
| Auckland | 9.00 | 8.89 | 69.12 | 4.00 | 13.50 | 8.98 | 17.56 |
| Wellington | 9.06 | 10.50 | 75.50 | 4.12 | 14.87 | 9.00 | 20.69 |
| Christchurch | 9.44 | 9.00 | 72.00 | 3.75 | 14.19 | 9.00 | 16.44 |
| Dunedin | 9.00 | 10.31 | 73.19 | 4.00 | 14.12 | 9.12 | 19.00 |
| Whangarei | 9.87 | 8.44 | 71.31 | 3.87 | 14.37 | 8.69 | 15.81 |
| Hamilton | 10.00 | 10.94 | 68.62 | 3.94 | 14.77 | 8,62 | 14.73 |
| Rotorua | 10.00 | 9.56 | 70.56 | 4.00 | 14.69 | 9.00 | 20.19 |
| Waihi | 9.87 | 11.00 | 70.62 | 4.00 | 14.25 | 7.75 | 16.25 |
| Gisborne | 11.12 | 10.19 | 72.00 | 4.00 | 14.87 | 8.94 | 19.00 |
| Napier | 10.50 | 9.54 | 73.50 | 4.00 | 15.00 | 9.00 | 20.23 |
| Dannevirke | 9.50 | 8.81 | 71.75 | 4.00 | 14.25 | 7.87 | 12.87 |
| New Plymouth | 10.00 | 9.87 | 68.50 | 3.75 | 14.50 | 8.12 | 18.25 |
| Wanganui | 10.00 | 8.37 | 69.50 | 4.00 | 13.75 | 7.94 | 18.25 |
| Taihape | 12.00 | 9.00 | 78.00 | 4.25 | 15.00 | 900 | 19.75 |
| Palmerston North | 9.81 | 9.00 | 72.69 | 3.25 | 13.44 | 8.25 | 14.00 |
| Masterton | 10.75 | 7.69 | 73.38 | 3.75 | 14.00 | 8.02 | 17.85 |
| Blenheim | 12.00 | 10.00 | 78.00 | 4.00 | 14.87 | 8.79 | 15.12 |
| Nelson | 10.12 | 10.06 | 71.50 | 3.87 | 14.19 | 9.00 | 17.19 |
| Greymouth | 11.19 | 7.00 | 71.56 | 4.00 | 14.19 | 8.62 | 22.60 |
| Ashburton | 10.25 | 9.00 | 70.25 | 4.00 | 14.56 | 8.75 | 11.10 |
| Timaru | 9.19 | 8.19 | 68.00 | 4.00 | 14.69 | 8.31 | 14.19 |
| Oamaru | 10.25 | 10.87 | 72.00 | 3.75 | 14.00 | 8.75 | 12.25 |
| Alexandra | 9.50 | 11.00 | 72.00 | 4.50 | 14.44 | 9.62 | 15.75 |
| Gore | 10.19 | 8.31 | 72.56 | 4.00 | 15.06 | 8.56 | 14.94 |
| Invercargill | 9.19 | 10.56 | 69.37 | 3.94 | 13.94 | 9.00 | 15.75 |
| AVERAGE RETAIL PRICES IN 1914. | ||||||||
|---|---|---|---|---|---|---|---|---|
| Town. | Bacon (sh'ld'r) | Bacon (middle-cut). | Ham. | Beef (sirloin). | Beef (brisket) | Beef (prime ribs). | Beef (rump steak). | Beef (top side). |
| Per 1 lb. | Per 1 lb. | Per 1 lb. | Per 1 lb. | Per 1 lb. | Per 1 lb. | Per 1 lb. | Per 1 lb. | |
| d. | d. | d. | d. | d. | d. | d. | d. | |
| Auckland | 7.09 | 11.86 | 11.48 | 7.08 | 3.62 | 6.00 | 11.00 | 6.25 |
| Wellington | 8.50 | 11.94 | 12.00 | 7.44 | 3.81 | 5.62 | 9.44 | 5.62 |
| Christchurch | 7.56 | 11.00 | 12.94 | 6.75 | 4.00 | 6.25 | 9.00 | 5.75 |
| Dunedin | 11.94 | 11.87 | 12.50 | 6.94 | 4.25 | 5.94 | 8.81 | 6.81 |
| Whangarei | 8.75 | 11.81 | 12.00 | 6.75 | 3.87 | 6.12 | 9.25 | 6.12 |
| Hamilton | 6.94 | 11.89 | 13.04 | 7.12 | 3.87 | 6.12 | 8.88 | 5.75 |
| Rotorua | 11.44 | 13.50 | 13.44 | 7.25 | 4.06 | 6.00 | 9.25 | 5.00 |
| Waihi | 7.75 | 11.00 | 12.00 | 6.00 | 4.00 | 5.00 | 9.00 | 5.62 |
| Gisborne | 9.12 | 12.94 | 13.12 | 6.12 | 5.00 | 5.12 | 8.25 | 5.56 |
| Napier | 7.98 | 13.77 | 14.77 | 7.13 | 4.33 | 6.33 | 8.00 | 5.33 |
| Dannevirke | 10.62 | 13.00 | 11.94 | 6.37 | 4.25 | 5.69 | 7.38 | 6.19 |
| New Plymouth | 7.75 | 10.62 | 10.00 | 7.25 | 4.25 | 6.25 | 9.25 | 6.62 |
| Wanganui | 8.06 | 11.00 | 11.69 | 5.81 | 4.37 | 5.25 | 8.25 | 5.12 |
| Taihape | 10.00 | 12.00 | 14.00 | 6.00 | 5.00 | 6.00 | 8.00 | 6.00 |
| Palmerston North | 9.06 | 12.00 | 13.44 | 6.25 | 4.25 | 5.25 | 7.69 | 5.25 |
| Masterton | 7.31 | 12.23 | 13.44 | 6.12 | 4.25 | 5.12 | 7.56 | 6.00 |
| Blenheim | 7.83 | 13.79 | 13.79 | 6.19 | 4.87 | 5.88 | 7.37 | 6.00 |
| Nelson | 8.87 | 12.81 | 13.19 | 7.12 | 5.50 | 6.31 | 8.62 | 6.37 |
| Greymouth | 10.00 | 11.44 | 12.75 | 7.37 | 5.75 | 6.75 | 8.94 | 7.00 |
| Ashburton | 11.25 | 12.50 | 11.75 | 6.87 | 5.12 | 6.06 | 9.44 | 7.00 |
| Timaru | 9.62 | 11.75 | 12.00 | 7.25 | 4.31 | 6.25 | 9.00 | 6.50 |
| Oamaru | 12.00 | 12.00 | 12.12 | 7.44 | 4.62 | 6.88 | 8.50 | 7.00 |
| Alexandra | 11.87 | 12.25 | 12.75 | 7.00 | 5.50 | 6.50 | 8.00 | 6.50 |
| Gore | 12.25 | 12.25 | 12.37 | 7.25 | 4.81 | 6.25 | 9.25 | 7.19 |
| Invercargill | 11.00 | 11.21 | 12.00 | 6.19 | 4.25 | 5.94 | 9.00 | 6.19 |
| AVERAGE RETAIL PRICES IN 1914. | ||||||||
|---|---|---|---|---|---|---|---|---|
| Town. | Beef (Stewing Steak). | Beef (Corned Round). | Beef (Corned Roll). | Beef (Corned Brisket) | Mutton (Leg). | Mutton (Sh'ld'r) | Mutton (Loin). | Mutton (Neck). |
| Per 1 lb. | Per 1 lb. | Per 1 lb. | Per 1 lb. | Per 1 lb. | Per 1 lb. | Per 1 lb. | Per 1 lb. | |
| d. | d. | d. | d. | d. | d. | d. | d. | |
| Auckland | 7.25 | 6.13 | 5.12 | 3.63 | 6.46 | 5.50 | 6.50 | 4.50 |
| Wellington | 5.19 | 5.62 | 4.81 | 4.00 | 5.62 | 4.81 | 5.81 | 4.00 |
| Christchurch | 6.00 | 6.25 | 5.75 | 5.75 | 6.00 | 4.50 | 5.50 | 3.50 |
| Dunedin | 6.13 | 6,75 | 5.75 | 4.25 | 5.63 | 4.50 | 5.50 | 4.37 |
| Whangarei | 6.25 | 6.13 | 5.88 | 3.88 | 6.62 | 5.50 | 5.50 | 4.50 |
| Hamilton | 4.02 | 6.13 | 5.62 | 5.63 | 6.63 | 5.62 | 5.87 | 4.63 |
| Rotorua | 4.13 | 5.81 | 5.81 | 4.31 | 7.31 | 5.00 | 6.38 | 5.00 |
| Waihi | 5.00 | 5.00 | 4.50 | 4.00 | 7.00 | 6.00 | 6.00 | 5.00 |
| Gisborne | 5.88 | 5.12 | 5.13 | 5.12 | 6.00 | 4.62 | 5.25 | 5.37 |
| Napier | 5.17 | 5.67 | 5.33 | 4.50 | 5.33 | 4.67 | 5.25 | 4.08 |
| Dannevirke | 4.25 | 5.69 | 5.31 | 4.56 | 5.69 | 4.69 | 5.37 | 4.19 |
| New Plymouth | 5.25 | 6.25 | 6.13 | 5.25 | 7.25 | 6.00 | 6.25 | 4.63 |
| Wanganui | 5.25 | 5.50 | 4.69 | 4.69 | 5.62 | 4.37 | 5.13 | 4.19 |
| Taihape | 5.00 | 6.00 | 6.00 | 5.00 | 6.00 | 5.00 | 6.00 | 4.50 |
| Palmerston North | 5.25 | 5.25 | 5.25 | 5.25 | 5.44 | 4.19 | 5.94 | 4.06 |
| Masterton | 5.81 | 5.81 | 4.88 | 4.44 | 6.06 | 4.44 | 6.00 | 4.69 |
| Blenheim | 5.37 | 6.00 | 5.88 | 4.31 | 5.38 | 4.69 | 5.69 | 4.63 |
| Nelson | 5.69 | 6.31 | 6.13 | 5.63 | 5.62 | 5.00 | 5.63 | 4.50 |
| Greymouth | 6.06 | 6.56 | 6.69 | 5.75 | 6.37 | 6.44 | 7.00 | 5.69 |
| Ashburton | 6.25 | 6.81 | 6.81 | 5.13 | 5.63 | 5.00 | 5.06 | 3.81 |
| Timaru | 7.81 | 7.25 | 6.25 | 5.63 | 6.00 | 4.88 | 5.25 | 3.69 |
| Oamaru | 6.62 | 6.25 | 5.75 | 5.25 | 5.75 | 4.81 | 5.56 | 4.63 |
| Alexandra | 6.00 | 6.50 | 5.75 | 5.50 | 6.00 | 5.50 | 5.75 | 5.25 |
| Gore | 6.50 | 7.25 | 6.25 | 4.75 | 6.56 | 5.75 | 6.06 | 5.31 |
| Invercargill | 6.00 | 6.19 | 5.25 | 4.25 | 6.19 | 5.13 | 5.37 | 4.88 |
| AVERAGE RETAIL PRICES IN 1914. | ||||||||
|---|---|---|---|---|---|---|---|---|
| Town. | Mutton (Chops). | Pork (Leg). | Pork (Loin). | Pork (Belly). | Pork (Chops). | Tripe. | Saus'ges (Beef). | Saus'ges (Pork). |
| Per 1 lb. | Per 1 lb. | Per 1 lb. | Per 1 lb. | Per 1 lb. | Per 1 lb. | Per 1 lb. | Per 1 lb. | |
| d. | d. | d. | d. | d. | d. | d. | d. | |
| Auckland | 7.98 | 7.75 | 8.75 | 8.75 | 9.75 | 7.17 | 6.00 | 7.17 |
| Wellington | 7.00 | 8.31 | 8.63 | 8.69 | 9.69 | 5.62 | 4.81 | 7.25 |
| Christchurch | 6.00 | 8.00 | 8.50 | 8.50 | 9.00 | 6.25 | 4.00 | 6.50 |
| Dunedin | 5.50 | 8.25 | 8.38 | 8.25 | 8.75 | 5.63 | 4.13 | 5.62 |
| Whangarei | 6.50 | 7.00 | 7.00 | 7.00 | 7.00 | 6.25 | 5.25 | 6.75 |
| Hamilton | 6.88 | 7.19 | 7.19 | 7.19 | 8.19 | 6.62 | 5.25 | 7.25 |
| Rotorua | 6.50 | 6.12 | 7.12 | 7.37 | 7.56 | 6.00 | 6.44 | 7.56 |
| Waihi | 7.00 | 7.00 | 7.00 | 7.00 | 7.50 | 6.00 | 5.37 | 7.00 |
| Gisborne | 5.75 | 8.00 | 8.00 | 7.50 | 8.50 | 6.00 | 5.00 | 7.37 |
| Napier | 6.33 | 8.67 | 8.33 | 8.00 | 8.67 | 6.00 | 5.75 | 9.33 |
| Dannevirke | 6.38 | 6.81 | 6.56 | 6.88 | 7.44 | 6.00 | 5.00 | 8.00 |
| New Plymouth | 8.00 | 7.32 | 8.00 | 8.00 | 8.00 | 6.09 | 5.00 | 8.00 |
| Wanganui | 6.25 | 8.25 | 8.25 | 8.25 | 8.25 | 6.00 | 5.25 | 8.25 |
| Taihape | 6.00 | 8.00 | 8.00 | 8.00 | 8.00 | 6.00 | 6.00 | 9.00 |
| Palmerston North | 5.50 | 7.00 | 8.62 | 7.63 | 8.00 | 5.81 | 4.38 | 6.00 |
| Masterton | 6.19 | 5.06 | 6.75 | 7.38 | 7.44 | 5.75 | 6.69 | 6.81 |
| Blenheim | 6.13 | 7.13 | 7.13 | 7.12 | 7.63 | 6.38 | 4.25 | 6.00 |
| Nelson | 6.00 | 7.50 | 7.50 | 7.31 | 8.12 | 6.00 | 5.50 | 6.88 |
| Greymouth | 7.25 | 8.00 | 8.00 | 7.56 | 8.63 | 6.25 | 6.12 | 8.00 |
| Ashburton | 6.13 | 7.81 | 8.00 | 7.81 | 8.25 | 7.00 | 5.31 | 6.87 |
| Timaru | 6.25 | 7.94 | 8.00 | 7.69 | 8.00 | 6.00 | 4.62 | 6.25 |
| Oamaru | 6.19 | 7.75 | 7.62 | 7.00 | 8.12 | 6.00 | 6.00 | 8.00 |
| Alexandra | 6.00 | 7.00 | 7.00 | 7.25 | 7.50 | 7.25 | 6.00 | 6.00 |
| Gore | 6.94 | 8.00 | 8.00 | 8.00 | 8.69 | 6.75 | 6.00 | 8.00 |
| Invercargill | 6.69 | 7.94 | 7.81 | 7.19 | 8.00 | 6.44 | 6.19 | 6.94 |
| HOUSE-RENT IN 1914. | ||||||||
|---|---|---|---|---|---|---|---|---|
| Town. | 3 Rooms or under. | 4 Rooms. | 5 Rooms. | 6 Rooms. | 7 Rooms. | 8 Rooms. | 9 Rooms and over. | |
| d. | d. | d. | d. | d. | d. | d. | ||
| Auckland | 90 | 156 | 180 | 210 | 300 | 330 | 480 | |
| Wellington | 144 | 194 | 238 | 288 | 334 | 405 | 476 | |
| Christchurch | 102 | 154.5 | 193.5 | 217.5 | 264 | 303 | 360 | |
| Dunedin | 90 | 120 | 174 | 252 | 306 | 312 | 390 | |
| Whangarei | 87 | 126 | 153 | 180 | 228 | 240 | 270 | |
| Hamilton | 108 | 132 | 168 | 216 | 252 | 300 | 360 | |
| Rotorua | 108 | 150 | 186 | 224 | 261 | 285 | .. | |
| Waihi | 54 | 84 | 105 | 144 | 174 | 186 | 240 | |
| Gisborne | 105 | 159 | 192 | 228 | 254.5 | 284.5 | 318 | |
| Napier | 60 | 168 | 228 | 252 | 300 | 324 | 360 | |
| Dannevirke | 72 | 96 | 120 | 144 | 168 | 210 | 270 | |
| New Plymouth | 90 | 132 | 177 | 180 | 228 | 270 | 300 | |
| Wanganui | 84 | 120 | 168 | 192 | 240 | 270 | 330 | |
| Taihape | 120 | 168 | 204 | 240 | .. | .. | .. | |
| Palmerston North | 94 | 128 | 152 | 160 | 210 | 270 | 310 | |
| Masterton | 74 | 110 | 131 | 166 | 204 | 228 | 300 | |
| Blenheim | 72 | 96 | 126 | 171 | 195 | 240 | 276 | |
| Nelson | 87 | 112 | 150 | 191 | 218 | 252 | 300 | |
| Greymouth | 77 | 102.5 | 120 | 149 | 185 | 216 | 255 | |
| Ashburton | 93 | 111 | 141 | 150 | 174 | 204 | 240 | |
| Timaru | 101 | 152 | 177 | 220 | 245 | 272 | 302 | |
| Oamaru | 54 | 117 | 168 | 204 | 240 | 255 | 300 | |
| Alexandra | 72 | 90 | 126 | 138 | 120 | .. | .. | |
| Gore | 90 | 102 | 138 | 164 | 210 | 240 | 300 | |
| Invercargill | 90 | 135 | 177 | 222 | 300 | 330 | 360 | |
Returns have been received since 1914 of prices of live-stock in various districts of New Zealand. The following table summarises the information for the districts from which returns have been received. These returns have been supplied by live-stock auctioneers in most of the important districts.
| LIVE-STOCK, HIDES, AND SKINS. | ||||||||||||||||||
|---|---|---|---|---|---|---|---|---|---|---|---|---|---|---|---|---|---|---|
| WHOLESALE PRICES OF LIVE-STOCK, HIDES AND SKINS, IN CERTAIN DISTRICTS OF NEW ZEALAND IN DECEMBER, 1914. | ||||||||||||||||||
| Item. | Waikato. | Poverty Bay. | Taranaki. | Wairarapa. | Canterbury. | Southland. | ||||||||||||
| Horses (each). | £ | s. | d. | £ | s. | d. | £ | s. | d. | £ | s. | d. | £ | s. | d. | £ | s. | d. |
| Draught, heavy | 37 | 0 | 0 | .. | 32 | 10 | 0 | .. | .. | 20 | 0 | 0 | ||||||
| ” light | 30 | 0 | 0 | .. | 20 | 0 | 0 | .. | .. | 14 | 10 | 0 | ||||||
| Express | 25 | 0 | 0 | .. | 10 | 10 | 0 | .. | .. | 10 | 0 | 0 | ||||||
| Remount and good harness | 18 | 0 | 0 | .. | .. | .. | .. | .. | ||||||||||
| Light hack and harness | 15 | 0 | 0 | .. | 12 | 0 | 0 | .. | .. | .. | ||||||||
| Ponies, 14 to 14.2 hands | 5 | 0 | 0 | .. | .. | .. | .. | .. | ||||||||||
| Cattle (each). | ||||||||||||||||||
| Fat— | £ | s. | d. | £ | s. | d. | £ | s. | d. | £ | s. | d. | £ | s. | d. | £ | s. | d. |
| Bullocks, prime heavy | 15 | 0 | 0 | 13 | 0 | 0 | 14 | 10 | 0 | .. | 13 | 15 | 0 | 15 | 10 | 0 | ||
| ” medium | 13 | 10 | 0 | 10 | 5 | 0 | 11 | 10 | 0 | 10 | 10 | 0 | 12 | 10 | 0 | 12 | 10 | 0 |
| ” light | 10 | 10 | 0 | 7 | 3 | 9 | 10 | 0 | 0 | .. | 10 | 5 | 0 | 10 | 10 | 0 | ||
| Cows, good | 9 | 0 | 0 | 7 | 18 | 0 | 8 | 10 | 0 | .. | 10 | 0 | 0 | 11 | 0 | 0 | ||
| ” light | 7 | 10 | 0 | 6 | 0 | 0 | 7 | 0 | 0 | 5 | 6 | 6 | 8 | 5 | 0 | 8 | 0 | 0 |
| Store— | ||||||||||||||||||
| Bullocks, 2 years | 4 | 15 | 0 | 5 | 5 | 0 | 5 | 2 | 6 | 5 | 7 | 0 | 5 | 5 | 0 | 6 | 0 | 0 |
| ” 3 years | 7 | 15 | 0 | 7 | 5 | 0 | 8 | 10 | 0 | 8 | 9 | 0 | 7 | 0 | 0 | 8 | 0 | 0 |
| Cows, fresh forward | 5 | 0 | 0 | 4 | 15 | 0 | 6 | 10 | 0 | 4 | 10 | 0 | 5 | 0 | 0 | 5 | 0 | 0 |
| ” other | 4 | 0 | 0 | .. | 5 | 0 | 0 | 4 | 2 | 6 | 3 | 2 | 0 | 4 | 5 | 0 | ||
| Young— | ||||||||||||||||||
| Heifers, yearling | 2 | 10 | 0 | 3 | 7 | 6 | 2 | 5 | 0 | 2 | 15 | 0 | 2 | 15 | 0 | 3 | 10 | 0 |
| ” weaner | 1 | 5 | 0 | 1 | 15 | 0 | .. | .. | 1 | 10 | 0 | 1 | 15 | 0 | ||||
| Steers, yearling | 3 | 15 | 0 | .. | 3 | 10 | 0 | 3 | 2 | 6 | 3 | 5 | 0 | 3 | 15 | 6 | ||
| ” weaners | 2 | 0 | 0 | .. | .. | .. | 1 | 15 | 0 | 2 | 0 | 0 | ||||||
| Vears | .. | .. | 2 | 7 | 6 | 1 | 0 | 0 | 2 | 0 | 0 | .. | ||||||
| Dairy— | ||||||||||||||||||
| Best, close to profit | .. | 6 | 0 | 0 | 9 | 0 | 0 | 9 | 0 | 0 | 10 | 0 | 0 | 9 | 10 | 0 | ||
| Good, close to profit | 7 | 10 | 0 | 4 | 5 | 0 | 7 | 0 | 0 | 6 | 11 | 6 | 8 | 0 | 0 | 8 | 0 | 0 |
| Inferior | .. | 2 | 15 | 0 | 4 | 10 | 0 | 4 | 4 | 0 | 5 | 0 | 0 | 5 | 10 | 0 | ||
| Good, backward calves | .. | .. | 5 | 10 | 0 | .. | 6 | 0 | 0 | 8 | 15 | 0 | ||||||
| Ordy, backward calves | .. | .. | .. | .. | 4 | 15 | 0 | 6 | 15 | 0 | ||||||||
| Springing heifers | 6 | 0 | 0 | 5 | 5 | 0 | 6 | 0 | 0 | .. | 6 | 12 | 6 | 5 | 10 | 0 | ||
| Good hard bulls | .. | 2 | 15 | 0 | 10 | 10 | 0 | .. | 10 | 10 | 0 | 10 | 10 | 0 | ||||
| Sheep (each). | ||||||||||||||||||
| Fat— | ||||||||||||||||||
| Wethers, extra prime | 1 | 5 | 0 | .. | 1 | 5 | 0 | .. | 1 | 4 | 6 | 1 | 9 | 6 | ||||
| ” prime | 1 | 2 | 0 | .. | 1 | 3 | 0 | 1 | 4 | 0 | 1 | 4 | 3 | 1 | 6 | 6 | ||
| ” light | 18 | 0 | 0 | .. | 1 | 1 | 0 | .. | 1 | 0 | 6 | 1 | 3 | 6 | ||||
| Ewes, prime | 0 | 19 | 0 | .. | 1 | 3 | 0 | .. | 1 | 3 | 0 | 1 | 7 | 6 | ||||
| ” medium | 0 | 16 | 0 | 1 | 1 | 6 | 1 | 1 | 0 | 1 | 0 | 0 | 1 | 1 | 3 | 1 | 0 | 6 |
| ” aged and light | 0 | 13 | 0 | 0 | 17 | 3 | .. | .. | 0 | 16 | 3 | 0 | 18 | 0 | ||||
| Lambs, extra prime | 0 | 17 | 0 | .. | .. | .. | 1 | 1 | 0 | .. | ||||||||
| ” prime | 0 | 16 | 6 | .. | .. | .. | 0 | 19 | 0 | .. | ||||||||
| ” average weights | 0 | 16 | 6 | 0 | 13 | 6 | .. | .. | 0 | 17 | 6 | .. | ||||||
| ” light | 0 | 13 | 0 | .. | .. | 0 | 15 | 0 | .. | |||||||||
| Store— | ||||||||||||||||||
| Wethers, forward 4 and 6 tooth | 0 | 18 | 0 | .. | 1 | 0 | 0 | 1 | 0 | 0 | 0 | 18 | 6 | 1 | 1 | 6 | ||
| Wethers, light | 0 | 16 | 0 | 0 | 17 | 6 | .. | 0 | 17 | 0 | 0 | 16 | 3 | 0 | 19 | 0 | ||
| ” 2-tooth | 0 | 15 | 0 | 0 | 13 | 6 | 0 | 15 | 0 | 0 | 15 | 6 | 0 | 14 | 0 | 0 | 17 | 0 |
| Ewes, 2-tooth | 0 | 17 | 6 | 0 | 14 | 0 | .. | 0 | 10 | 0 | 0 | 19 | 0 | 1 | 2 | 6 | ||
| ” 4 and 6 tooth. | 0 | 17 | 0 | 0 | 16 | 3 | .. | 0 | 17 | 0 | 0 | 16 | 9 | 0 | 18 | 6 | ||
| ” full sound mouth | 0 | 14 | 0 | 0 | 16 | 3 | .. | 0 | 14 | 6 | 0 | 15 | 0 | 0 | 17 | 6 | ||
| ” failing mouth | 0 | 9 | 0 | 0 | 8 | 0 | .. | 0 | 9 | 0 | 0 | 11 | 6 | 0 | 15 | 0 | ||
| Skins (per lb.). | ||||||||||||||||||
| Fine crossbread and half-bred | 0 | 0 | 7 | .. | .. | .. | 0 | 0 | 8¼ | 0 | 0 | 7¾ | ||||||
| Crossbred, medium to coarse | 0 | 0 | 6½ | .. | 0 | 0 | 7½ | .. | 0 | 0 | 7½ | 0 | 0 | 6¾ | ||||
| Crossbred, short to half-wool | 0 | 0 | 4½ | .. | 0 | 0 | 6½ | .. | 0 | 0 | 6¼ | .. | ||||||
| Dead and damaged | 0 | 0 | 3 | .. | 0 | 0 | 5¼ | .. | 0 | 0 | 6 | 0 | 0 | 5 | ||||
| Damp, salted and green | 0 | 0 | 6½ | .. | .. | .. | .. | .. | ||||||||||
| Lamb | 0 | 0 | 5½ | .. | 0 | 0 | 6¾ | .. | 0 | 0 | 7½ | 0 | 0 | 3¾ | ||||
| Rabbit | 0 | 0 | 10 | .. | .. | .. | .. | .. | ||||||||||
| Hides (per lb.). | ||||||||||||||||||
| Ox, heavy | 0 | 0 | 8 | .. | 0 | 0 | 7 | .. | 0 | 0 | 8½ | .. | ||||||
| ” medium | 0 | 0 | 7½ | .. | 0 | 0 | 8¾ | .. | 0 | 0 | 8¼ | 0 | 0 | 7¾ | ||||
| ” light | 0 | 0 | ¾ | .. | 0 | 0 | 8¼ | .. | 0 | 0 | 7¾ | .. | ||||||
| Cow, heavy | 0 | 0 | 7¾ | .. | 0 | 0 | 6¼ | .. | 0 | 0 | 7½ | .. | ||||||
| ” medium | 0 | 0 | 7 | .. | 0 | 0 | 8¼ | .. | 0 | 0 | 7¾ | 0 | 0 | 6¾ | ||||
| ” light | 0 | 0 | 6½ | .. | 0 | 0 | 7 | .. | 0 | 0 | 7¼ | |||||||
| Bull | 0 | 0 | 5 | .. | 0 | 0 | 6 | .. | .. | .. | ||||||||
| Yearling | 0 | 0 | 7 | .. | 0 | 0 | 7 | .. | 0 | 0 | 8½ | 0 | 0 | 6¾ | ||||
| Calves | 0 | 0 | 8 | .. | 0 | 0 | 8½ | .. | 0 | 0 | 9½ | 0 | 0 | 8 | ||||
From information furnished by the High Commissioner for New Zealand in London it has been found possible to compile a table of wholesale prices of New Zealand meat in the London market, which, in the absence of reliable statistics of wholesale meat prices in New Zealand, is published here as indicating the great advance all round in the various months of 1914, compared with the corresponding months of 1913.
| LONDON PRICES OF NEW ZEALAND MEAT. | ||||||||||
|---|---|---|---|---|---|---|---|---|---|---|
| Month. | Lamb, per lb. | Mutton, per lb. | Beef, per lb. (Hind-quarters*). | |||||||
| Canterbury. | North Island. | Canterbury. | North Island. | |||||||
| 1913. | 1914. | 1913. | 1914. | 1913. | 1914. | 1913. | 1914 | 1913. | 1914. | |
* Forequarters average ¾d. per lb. loss than hindquarters. | ||||||||||
| d. | d. | d. | d. | d. | d. | d. | d. | d. | d. | |
| January | 6 1/8 | 65/16 | 5⅝ | 71/16 | 4½ | .. | 4 1/8 | 5 | 4 | 4½ |
| February | 5⅞ | .. | 5⅜ | 67/16 | .. | .. | 4 | 4⅝ | 4½ | 4½ |
| March | 5⅝ | 6¼ | 5 1/8 | 63/16 | 4 1/8 | 4 7/4 | 3½ | 4½ | 4 | 4½ |
| April | 5¾ | 61/16 | 5⅜ | 6 | 4 1/8 | 4¾ | 4 | 4⅜ | 4¼ | 4⅜ |
| May | 6 1/8 | 6¼ | 5⅞ | 6 | 4⅜ | 4⅝ | 3⅞ | 43/16 | 4½ | 4⅜ |
| June | 6¾ | 65/16 | 6¼ | 6¼ | 4⅜ | 4⅝ | 4 | 4⅜ | 4½ | 4⅜ |
| July | 6 1/8 | 63/16 | 5⅞ | 6 1/8 | 4 1/8 | 4⅝ | 4 | 4⅜ | 4¼ | 4⅝ |
| August | 5⅞ | 6¾ | 5½ | 8½ | 4⅜ | 51/16 | 4¼ | 4⅞ | 3⅞ | 6½ |
| September | 5¾ | 6⅞ | 5½ | 6⅝ | 4⅝ | 5⅝ | 4½ | 5½ | 3⅞ | 613/16 |
| October | 6⅝ | 613/16 | 5⅜ | 6⅝ | 4⅝ | 5⅞ | 4½ | 5¾ | 3⅝ | 6½ |
| November | 5⅝ | 6⅝ | 5⅜ | 6½ | 4⅝ | 515/16 | 4⅜ | 313/16 | 3⅜ | 6¼ |
| December | 5¾ | 69/16 | 5⅝ | 6⅜ | 4⅞ | 59/16 | 4¾ | 5½ | 3¾ | 55/16 |
The great increase in beef prices consequent on the outbreak of war is especially noticeable.
For butter and cheese prices also recourse has been had to the periodic reports of the High Commissioner, giving prices of the principal New Zealand commodities on the London market. The wholesale prices of New Zealand butter and cheese in London are given for each month of 1913 and 1914 in the next table. Here again the effect of the war is very noticeable.
| LONDON PRICES OF NEW ZEALAND BUTTERAND CHEESE. | ||||||||
|---|---|---|---|---|---|---|---|---|
| Month. | Butter, per cwt. | Cheese, per cwt. | ||||||
| 1913. | 1914. | 1913. | 1914. | |||||
| s. | d. | s. | d. | s. | d. | s. | d. | |
| January | 132 | 0 | 116 | 6 | 73 | 0 | 66 | 0 |
| February | 132 | 0 | 114 | 9 | 72 | 0 | 64 | 9 |
| March | 127 | 0 | 112 | 6 | 73 | 6 | 63 | 9 |
| April | 117 | 0 | 110 | 0 | 72 | 0 | 62 | 6 |
| May | 112 | 0 | 109 | 3 | 71 | 6 | 62 | 3 |
| June | 114 | 0 | 110 | 3 | 73 | 0 | 64 | 6 |
| July | 114 | 0 | 117 | 3 | 66 | 6 | 64 | 3 |
| August | 110 | 0 | 132 | 3 | 65 | 0 | 72 | 6 |
| September | 121 | 0 | 126 | 6 | 67 | 0 | 73 | 0 |
| October | 129 | 0 | .. | .. | ||||
| November | 119 | 0 | 128 | 9 | 61 | 0 | 75 | 6 |
| December | 123 | 0 | 136 | 0 | 01 | 0 | 76 | 6 |
The following table shows the variations of the prices of wheat, flour, and the by-products bran and pollard, during 1914. The prices quoted are all f.o.b. south; but for the last three months of 1914 the price of wheat and flour was fixed by a Government Proclamation.
| Month. | Wheat, per Bushel. | Flour, per Ton. | Bran, per Ton. | Pollard, per Ton. | |||||||
|---|---|---|---|---|---|---|---|---|---|---|---|
* Government Proclamation: Price of flour fixed at £11 15s. on 29th September, 1914, and £13 on 20th October, 1914, and of wheat at 4s. 9d. and 5s. 3d. | |||||||||||
| s. | d. | £ | s. | d. | £ | s. | d. | £ | s. | d. | |
| January | 3 | 11 | 9 | 0 | 0 | 4 | 0 | 0 | 6 | 0 | 0 |
| February | 3 | 4 | 9 | 0 | 0 | 4 | 0 | 0 | 6 | 0 | 0 |
| March | 3 | 6 | 9 | 10 | 0 | 4 | 0 | 0 | 6 | 0 | 0 |
| April | 3 | 8 | 10 | 0 | 0 | 4 | 0 | 0 | 6 | 0 | 0 |
| May | 3 | 8 | 10 | 0 | 0 | 4 | 0 | 0 | 6 | 0 | 0 |
| June | 3 | 8 | 10 | 0 | 0 | 4 | 0 | 0 | 6 | 0 | 0 |
| July | 3 | 8 | 11 | 0 | 0 | 4 | 0 | 0 | 6 | 10 | 0 |
| August | 4 | 3 | 12 | 0 | 0 | 4 | 0 | 0 | 6 | 10 | 0 |
| September | 4 | 9* | 13 | 0 | 0* | 4 | 0 | 0 | 6 | 10 | 0 |
| October | 4 | 9* | 13 | 0 | 0* | 4 | 10 | 0 | 6 | 10 | 0 |
| November | 5 | 3* | 13 | 0 | 0* | 5 | 5 | 0 | 6 | 10 | 0 |
| December | 5 | 3* | 13 | 0 | 0* | 6 | 10 | 0 | 7 | 5 | 0 |
The price of wheat and oats during 1914 was unduly affected by the war, and the tables given below will show the degree to which this influence has operated. The prices quoted were derived from the Yearbook of the International Institute of Agriculture, issued from Rome, and the grades of grain considered are shown in each case. The prices for Melbourne were supplied by the Commonwealth Statistician, and Christchurch prices were obtained from the commercial columns of the newspapers.
| AVERAGE MONTHLY PRICES OF WHEAT INVARIOUS MARKETS OFTHE WORLD DURING 1914. | ||||||||||||||||||||||||||
|---|---|---|---|---|---|---|---|---|---|---|---|---|---|---|---|---|---|---|---|---|---|---|---|---|---|---|
| Month. | Berlin. | Hamburg. | Vienna. | Antwerp. | Paris. | Liverpool. | London. | Odessa. | Winnipeg. | Chicago. | Melborne. | Christchurch. | ||||||||||||||
| Native. | No. 2 Hard Winter. | Slovakischer Schuttler. | No 2. Harf Winter. | Native. | No.2 Northern Manitoba | No 2. Northern Manitoba. | Red Winter. | No. 2 Northern Manitoba. | No. 2 Hard Winter. | Fair Average Quality. | Hunters. | |||||||||||||||
* Nominal price fixed by Proclamation at 4s. 9d. on 29th September, 1914, and 5s. 3d. on 20th October, 1914. | ||||||||||||||||||||||||||
| Per bushel | Per bushel. | Per bushel. | Per bushel | Per bushel. | Per bushel. | Per bushel. | Per bushel. | Per bushel. | Per bushel. | Per bushel. | Per bushel. | |||||||||||||||
| s. | d. | s | d. | s. | d. | s. | d. | s. | d. | s | d. | s. | d. | s. | d. | s. | d. | s. | d. | s. | d. | s. | d. | |||
| January | 5 | 0 | 4 | 4 | 5 | 3 | 4 | 4 | 5 | 7 | 4 | 3 | 4 | 3 | 3 | 10 | 3 | 5 | 3 | 8 | 3 | 6 | 3 | 11 | ||
| February | 5 | 0 | 4 | 5 | 5 | 7 | 4 | 5 | 5 | 9 | 4 | 5 | 4 | 5 | 4 | 1 | 3 | 7 | 3 | 10 | 3 | 8 | 3 | 4 | ||
| March | 5 | 1 | 4 | 5 | 5 | 10 | 4 | 5 | 5 | 11 | 4 | 5 | 4 | 5 | 3 | 11 | 3 | 8 | 3 | 10 | 3 | 10 | 3 | 6 | ||
| April | 5 | 1 | 4 | 5 | 5 | 11 | 4 | 4 | 5 | 10 | 4 | 4 | 4 | 4 | 3 | 11 | 3 | 8 | 3 | 9 | 3 | 9 | 3 | 8 | ||
| May | 5 | 5 | 4 | 6 | 6 | 4 | 4 | 6 | 6 | 1 | 4 | 6 | 4 | 5 | 3 | 11 | 3 | 9 | 3 | 11 | 3 | 10 | 3 | 8 | ||
| June | 5 | 7 | 4 | 5 | 6 | 6 | 4 | 6 | 6 | 1 | 4 | 5 | 4 | 5 | 4 | 1 | 3 | 9 | 3 | 9 | 3 | 11 | 3 | 8 | ||
| July | 5 | 6 | 4 | 2 | 6 | 3 | 4 | 4 | 5 | 10 | 4 | 6 | 4 | 5 | 4 | 0 | 3 | 8 | 3 | 4 | 3 | 11 | 3 | 8 | ||
| August | 6 | 0 | .. | 7 | 2 | .. | 6 | 1 | 5 | 3 | 5 | 7 | .. | 4 | 5 | 4 | 0 | 4 | 5 | 4 | 3 | |||||
| September | 6 | 4 | .. | 7 | 7 | .. | .. | 5 | 10 | 5 | 10 | .. | 4 | 6 | 4 | 7 | 4 | 11 | 4 | 9* | .. | |||||
| October | 6 | 10 | .. | 8 | 9 | .. | 6 | 1 | 5 | 5 | 5 | 6 | .. | 4 | 6 | 4 | 7 | 4 | 9 | 4 | 9* | |||||
| November | .. | .. | 9 | 7 | .. | 6 | 2 | 5 | 11 | 5 | 10 | .. | 4 | 9 | 4 | 9 | 5 | 1 | 5 | 3* | ||||||
| December | .. | 9 | 10 | .. | 6 | 3 | 6 | 1 | 6 | 1 | .. | 4 | 9 | 4 | 11 | 5 | 7 | 5 | 3* | .. | ||||||
| AVERAGE MONTHLY PRICES OF OATS INTHE VARIOUS WORLD-MARKETS DURING 1914. | ||||||||||||||||||||||
|---|---|---|---|---|---|---|---|---|---|---|---|---|---|---|---|---|---|---|---|---|---|---|
| Month. | Hamburg. | Antwerp. | Paris. | Budapest. | Liverpool. | London. | Odessa. | Winnipeg. | Chicago. | Melbourne. | Christch. | |||||||||||
| Holsteiner, Mecklen burger, Schlesischer. | La Plata (Bahia Blanca). | Black. | First Quality. | Canadian. | Canadian. | Dispoinble. | No.2 White Oats. | Standard. | Algerians. | Garton`s A Grade. | ||||||||||||
| Per bushel. | Per bushel. | Per bushel. | Per bushel. | Per bushel. | Per bushel. | Per bushel. | Per bushel. | Per bushel. | Per bushel. | Per bushel. | ||||||||||||
| s. | d. | s. | d. | s. | d. | s. | d. | s. | d. | s. | d. | s. | d. | s. | d. | s. | d. | s. | d. | s. | d. | |
| January | 2 | 11 | .. | 2 | 9 | 2 | 4 | 2 | 4 | 9 | 4 | 1 | 10 | 1 | 7 | 2 | 0 | 1 | 9 | 1 | 9 | |
| February | 2 | 11 | 2 | 0 | 2 | 8 | 2 | 4 | 2 | 3 | 2 | 3 | 1 | 9 | 1 | 7 | 2 | 0 | 1 | 10 | 1 | 0 |
| March | 2 | 10 | 2 | 0 | 2 | 8 | 2 | 4 | 2 | 3 | 2 | 3 | 1 | 9 | 1 | 8 | 2 | 0 | 1 | 11 | 1 | 6 |
| April | 2 | 9 | .. | 2 | 11 | 2 | 5 | 2 | 3 | 2 | 3 | 1 | 9 | 1 | 8 | 2 | 0 | 1 | 10 | 1 | 7 | |
| May | 3 | 0 | 2 | 1 | 3 | 2 | 2 | 0 | 2 | 4 | 2 | 4 | 1 | 10 | 1 | 9 | 2 | 1 | 1 | 11 | 1 | 7 |
| June | 3 | 1 | 2 | 1 | 3 | 3 | 2 | 5 | 2 | 4 | 2 | 5 | 2 | 0 | 1 | 10 | 2 | 0 | 2 | 2 | 1 | 7 |
| July | 3 | 1 | 2 | 1 | 3 | 0 | 2 | 5 | 2 | 5 | 2 | 6 | 1 | 11 | 1 | 10 | 1 | 11 | 2 | 3 | 1 | 7 |
| August | 3 | 9 | .. | 3 | 3 | 3 | 2 | 3 | 7 | 4 | 1 | .. | 2 | 3 | 2 | 1 | 2 | 11 | 2 | 2 | ||
| September | 3 | 9 | .. | .. | 3 | 1 | 3 | 7 | 3 | 10 | .. | 2 | 5 | 2 | 5 | 3 | 0 | 2 | 3 | |||
| October | 3 | 11 | .. | 3 | 2 | 3 | 4 | 3 | 8 | 3 | 8 | .. | 2 | 6 | 2 | 5 | 3 | 5 | 2 | 4 | ||
| November | .. | .. | 3 | 3 | 3 | 4 | 3 | 7 | 3 | 7 | 2 | 4 | 2 | 7 | 2 | 6 | 3 | 7 | 2 | 6 | ||
| December | 3 | 10 | .. | 3 | 3 | 3 | 9 | 3 | 8 | 3 | 7 | 2 | 7 | 2 | 6 | 2 | 5 | 3 | 11 | 2 | 8 | |
The following tables have been obtained from the Inspectors of Factories in the various districts of New Zealand, and show the range of wages for the various classes of labour considered.
| RANGE OF AVERAGE RATES OF WAGES INEACH PROVINCIAL DISTRICT OF NEW ZEALAND DURINGTHE YEAR 1914. | ||||||||||
|---|---|---|---|---|---|---|---|---|---|---|
| Description of Labour. | Auckland. | Taranaki. | Hawke's Bay. | Wellington. | Marlborough. | Nelson. | Westland (Goldfield). | Canterbury. | Otago (Part Goldfield). | Southland. |
| I. Agricultural Labour. | ||||||||||
| Farm labourers, with board, per week | 25/ to 30/ | 25/ | 20/ to 30/ | 25/ to 35/ | 30/ | 20/ to 25/ | 25/ to 30/ | 25/ to 30/ | 25/ to 30/ | 20/ to 30/ |
| ” without board, per day | 8/ | 9/ | .. | .. | 8/ | 7/ to 8/ | 9/ to 10/ | .. | 8/ to 10/ | 8/ to 10/ |
| Ploughmen, with board, per week | 30/ to 35/ | 30/ | 30/ to 35/ | 25/ to 35/ | 30/ to 35/ | 25/ | 25/ to 30/ | 27/6 to 32/6 | 30/ to 35/ | 25/ to 35/ |
| ” without board, per day | 8/ to 9/ | 10/ | .. | .. | 7/6 to 8/4 | 8/ | 9/ to 10/ | .. | 9/ to 10/ | 8/ |
| Harvesters, with board, per week | 30/ | 35/ | .. | .. | .. | .. | .. | .. | 40/ | 40/ |
| ” without board, per hour | 1/ | 1/6 | 1/3 | 1/3 to 1/6 | 1/3 to 1/6 | .. | .. | .. | 1/3 | 1/ |
| Men cooks on farms, with board, per week | 25/ | 30/ | 25/ to 35/ | 25/ to 35/ | 30/ | 25/ | .. | 25/ to 30/ | 25/ to 35/ | 25/ to 30/ |
| Female farm servants with board, per week | 15/ | 15/ to 18/ | 20/ to 30/ | 15/ to 17/6 | 20/ | 15/ to 20/ | 15/ | 22/6 to 25/ | 15/ to 20/ | 12/6 to 20/ |
| II. Pastoral Labour. | ||||||||||
| Shepherds, with board, per annum | £80 to £90 | £95 | £110 | £70 to £90 | £80 to £85 | £52 | .. | £52 to £78 | £70 to £80 | £70 to £90 |
| Stockmen, with beard, per annum | £60 to £80 | £80 | £110 | 20/ to 25/ | .. | .. | .. | £78 | £65 to £80 | £70 to £90 |
| Station labourers, with board, per week | 20/ to 25/ | 25/ | 30/ to 35/ | 25/ to 30/ | 25/ | 25/ to 30/ | .. | 25/ to 30/ | 25/ to 30/ | 20/ to 30/ |
| Shearers, with board, per 100 sheep shorn | 20/ | 20/ | .. | 20/ | 20/ | 20/ | .. | 20/ | 20/ to 22/6 | 20/ |
| Men cooks on stations, with board, per week | 20/ to 25/ | 35/ | 30/ | 35/ to 45/ | 30/ to 50/ | 35/ | .. | 25/ to 30/ | 25/ to 35/ | 25/ to 35/ |
| III. Artisan Labour (per day, without board). | ||||||||||
| Masons | 12/8 | .. | .. | 13/4 | .. | 12/ | 13/ | 12/ | 13/ | 12/ to 14/ |
| Plasterers | 12/ | 14/ to 10/ | 12/ | 13/ | 12/ to 14/ | 14/ | 14/ | 12/ | 12/ | 12/ to 14/ |
| Bricklayers | 12/ | 14/ | 12/ | 13/ | 12/ | 12/ | 14/ | 12/ | 12/ | 12/ to 14/ |
| Cabinetmakers | 10/4 | 11/ | 12/ | 11/ | 10/ | 10/ | 10/ | 11/ | 11/ | 11/ |
| Carpenters | 12/ | 11/ | 12/ | 12/ | 11/ | 10/ | 10/ to 12/ | 12/ | 12/ | 12/ |
| Boilermakers | 10/ to 11/ | .. | 10/ to 12/ | 10/ to 11/ | 11/ | 9/ | 11/ | 10/ to 11/ | 11/ | 11/ to 12/ |
| Blacksmiths | 9/ to 10/8 | 11/6 | 10/ | 11/ | 11/ | 9/ | 11/ | 11/ | 11/4 | 10/ to 11/ |
| Tinsmiths | 10/8 | 10/ | 10/8 | 10/ to 11/ | 11/ to 12/ | 10/ | 11/ | 11/4 | 10/8 | 11/ |
| Wheelwrights | 11/ | 11/ | 11/ | 11/ | 9/ to 11/ | 9/ | 11/ | 11/ | 11/ | 11/ |
| Shipwrights | 10/8 | .. | 12/ | 12/ | .. | 12/ | 12/ | 10/8 | 12/8 | 12/ |
| Plumbers | 11/4 to 12/ | 11/4 to 12/ | 12/ | 12/ | 11/ | 10/ | 11/ | 11/4 to 12/ | 11/4 to 12/ | 12/ |
| Painters | 11/ | 10/ | 10/ | 11/ | 10/ | 10/ | 11/ | 11/ | 11/ | 11/ |
| Saddlers | 9/4 | 9/8 | 8/10 | 9/4 to 10/ | 8/ to 10/ | 9/ | 8/4 | 8/8 | 9/4 | 10/ |
| Shoemakers | 9/4 | 9/4 | 8/10 | 8/4 to 10/ | 8/ to 10/ | 9/2 | 10/2 | 9/4 | 9/4 | 9/ to 10/ |
| Coopers | 9/9 | 9/ | 10/ | 10/ | .. | .. | .. | 11/ | 10/ | 10/ |
| Watchmakers | 10/ | 11/6 | 11/6 | 8/4 to 10/ | 9/ to 11/ | 10/ | 10/ to 13/ | 10/ | 10/8 | 10/ |
| IV. Servants. | ||||||||||
| Married couples, without family, with board, per annum | £80 to £100 | £110 to £125 | £110 | £90 to £100 | £100 to £110 | £75 to £100 | .. | £90 to £110 | £80 to £100 | £85 to £100 |
| Married couples, with family, with board, per annum | £80 to £100 | £100 to £115 | £100 | .. | .. | .. | .. | £80 to £100 | £75 to £95 | £75 to £90 |
| Grooms, with board, per week | 20/ | 30/ | 30/ | 25/ | 25/ to 30/ | .. | .. | 20/ to 22/6 | 30/ to 35 | 20/ to 25/ |
| Gardeners, with board, per week | 25/ | 30/ | 30/ | 35/ to 37/0 | 25/ to 30/ | .. | .. | 33/ | 30/ to 35/ | 25/ to 30/ |
| Gardeners, without board, per day | 8/ to 9/ | 9/ | 6/ | 10/ | 8/ to 10/ | 8/ | 10/ | 8/ | 9/ to 10/ | 8/ to 10/ |
| Cooks, with board, per week | 20/ to 30/ | 25/ | 25/ to 30/ | 30/ to 35/ | 20/ | 25/ | 30/ to 40/ | 20/ to 25/ | 30/ to 40/ | 20/ to 35/ |
| Laundresses with board, per week | 25/ to 85/ | 25/ | 20/ to 30/ | 20/ | 17/6 | 20/ to 22/ | 30/ | 20/ to 25/ | 27/6 | 20/ to 30/ |
| General house-servants, with board, per week | 15/ to 20/ | 15/ to 20/ | 20/ | 15/ to 20/ | 17/6 to 20/ | 15/ to 20/ | 12/6 to 15/ | 15/ to 20/ | 15/ to 20/ | 12/0 to 20/ |
| Housemaids, with board, per week | 15/ to 20/ | 20/ | 20/ | 16/ to 20/ | 15/ to 20/ | 20/ | 20/ | 15/ to 17/6 | 20/ | 12/0 to 20/ |
| Nursemaids, with board, per week | 10/ to 20/ | 10/ | 20/ | 10/ to 15/ | 10/ to 12/6 | 12/ to 15/ | 10/ | 7/6 to 10/ | 12/6 to 15/ | 10/ to 12/6 |
| Needlewomen, with board, per week | 20/ to 25/ | .. | .. | 15/ | .. | .. | 30/ | 25/ to 30/ | 20/ to 25/ | 20/ to 30/ |
| Needlewomen, without board, per day (lunch always provided) | 5/ | 4/ | 5/ | 4/ | 6/ | 6/ | 5/ to 6/ | 4/ to 6/ | 5/ to 6/0 | 3/6 to 5/ |
| V. Miscellaneous. | ||||||||||
| General labourers, per day, without board | 0/4 to 10/ | 9/ | 9/ | 9/4 | 9/ to 10/ | 9/ | 10/ | 9/4 | 9/4 to 10/ | 8/ to 9/ |
| Stonebreakers, per cubic yard | 3/0 | 3/0 | .. | .. | .. | .. | .. | .. | 3/6 | .. |
| Seamen, per month, with board | £8 | £8 | £8 | £8 | .. | £8 | £8 | £5 to £12 | £8 to £9 | £7 10 to £8 |
| Miners, per day, without board | 9/0 to 11/0 | .. | .. | 10/ to 11/ | 10/ to 12/ | 12/ | 12/ | 11/ to 12/ | 10/ | 10/ to 12/ |
| Engine-drivers, per day, without board | 9/ to 10/ | 12/ | 9/ to 10/6 | 9/ to 10/6 | 10/ to 12/ | 10/ to 11/ | 10/9 to 11/4 | 8/ to 10/6 | 10/ | 9/ to 12/ |
| Tailors ” ” | 10/ | 9/ | 9/ | 9/2 to 10/10 | 10/ to 15/ | 9/2 | 10/ | 9/2 | 9/4 to 10/ | 9/ to 11/ |
| Tailoresses ” ” | 30/ | 27/0 | 30/ | 30/ to 35/ | 25/ to 30/ | 25/ | 25/ to 30/ | 25/ to 30/ | 30/ | 27/6 to 35/ |
| Dressmakers ” ” | 25/ | 22/6 to 30/ | 25/ | 22/6 | 7/6 to 80/ | 25/ to 40/ | 35/ | 5/ to 20/ | 20/ to 40/ | 20/ to 40/ |
| (Aver. 25/) | ||||||||||
| Milliners ” ” | 25/ | 35/ | 40/ | 20/ | 5/ to 60/ | 30/ | 40/ to 60/ | 40/ to 65/ | 25/ to 40/ | 20/ to 30/ |
| (Aver. 40/) | ||||||||||
| Machinists (sewing) ” ” | 25/ | 20/ to 30/ | 30/ | 27/6 | 15/ to 25/ | .. | 25/ to 30/ | 27/6 | 27/6 to 30/ | 17/6 to 25/ |
| Storekeepers ” ” | 40/ to 70/ | 55/ | .. | .. | 40/ to 50/ | .. | 80/ | .. | 60/ to 80/ | .. |
| (Aver. 60/) | ||||||||||
| Storekeepers' Assistants ” ” | 25/ to 50/ | 40/ | .. | 45/ to 50/ | 30/ to 40/ | 50/ to 60/ | 50/ | 50/ | 40/ to 50/ | 30/ to 50/ |
| Drapers' Assistants ” ” | 30/ to 80/ | 50/ to 60/ | 40/ | 55/ | 40/ to 80/ | 25/ to 60/ | 60/ to 90/ | 55/ | 55/ to 70/ | 30/ to 60/ |
| (Aver. 50/) | (Aver. 55/) | (Aver. 45/) | (Aver. 55/) | |||||||
| Grocers' Assistants ” ” | 50/ | 40/ to 60/ | 55/ | 50/ | 30/ to 60/ | 25/ to 60/ | 50/ to 75/ | 50/ | 50/ to 70/ | 40/ to 70/ |
| (Aver. 45/) | (Aver. 40/) | (Aver. 55/) | ||||||||
| Butchers ” ” | 50/ to 70/ | 50/ | 50/ to 60/ | 56/ | 40/ to 60/ | 50/ | 60/ | 55/ | 65/ to 75/ | 56/ to 75/ |
| Bakers ” ” | 55/ | 55/ | 55/ | .. | 50/ to 60/ | 60/ | 60/ | 55/ to 65/ | 55/ to 70/ | 55/ to 70/ |
| Storemen ” ” | 30/ to 60/ | 45/ to 60/ | 50/ | 50/ | 40/ to 50/ | 60/ | 60/ | 40/ to 50/ | 52/6 to 65/ | 50/ to 65/ |
| (Aver. 48/) | ||||||||||
| Compositors ” ” | 55/ to 65/ | 65/ to 70/ | 55/ to 60/ | 65/ | 50/ to 65/ | 60/ to 65/ | 65/ | 65/ | 65/ to 75/ | .. |
| Sawmill hands ” ” | 54/ to 60/ | 50/ to 60/ | 57/ to 61/ | 52/6 to 60/ | 40/ to 50/ | 54/ to 60/ | 60/ | 47/8 to 58/8 | 60/ to 70/ | 50/ to 70/ |
| Flax-null hands ” ” | 32/ to 60/ | .. | .. | .. | 40/ to 45/ | 48/ to 54 | 60/ | 36/ to 50/ | 55/ to 60/ | 54/ to 60/ |
| (Aver. 48/) | ||||||||||
Table of Contents
The 1914 issue of this book contains a fairly detailed account of the Public Trust Office, dealing with its constitution, the powers and duties of the Public Trustee, and the various classes of business undertaken by the Office.
The Public Trust Office has been in operation since 1873. At the end of that year the number of estates administered by the Office was 257, of a total value of £17,500. By the 31st March, 1890, the number had risen to 1,678, of a value of £1,240,097, and at 31st March, 1915, was 8,026, of a value of £7,942,158.
The figures for each year are as follows:—
| Calendar Year ended 31st December. | Number. | Value. |
|---|---|---|
| £ | ||
| 1873 | 257 | 17,500 |
| 1874 | 293 | 28,930 |
| 1875 | 347 | 42,163 |
| 1876 | 412 | 59,720 |
| 1877 | 575 | 67,675 |
| 1878 | 627 | 73,940 |
| 1879 | 713 | 96,315 |
| 1880 | 770 | 117,980 |
| 1881 | 836 | 150,750 |
| 1882 | 911 | 204,545 |
| 1883 | 1,024 | 317,680 |
| 1884 | 1,082 | 392,315 |
| 1885 | 1,190 | 457,620 |
| 1880 | 1,293 | 576,010 |
| 1887 | 1,304 | 715,860 |
| 1888 | 1,483 | 954,675 |
| 1889 | 1,561 | 1,130,960 |
| 1890 | 1,678 | 1,240,097 |
| 1891 | 1,825 | 1,252,625 |
| 1892 | 1,912 | 1,284,745 |
| 1893 | 2,022 | 1,450,918 |
| 1895 | 2,086 | 1,562,269 |
| 1896 | 2,236 | 1,806,953 |
| 1897 | 2,334 | 1,898,163 |
| 1898 | 2,413 | 1,950,314 |
| 1899 | 2,491 | 2,110,316 |
| 1900 | 2,667 | 2,192,594 |
| 1901 | 2,898 | 2,326,954 |
| 1902 | 3,049 | 2,467,614 |
| 1903 | 3,314 | 2,706,785 |
| 1904 | 3,470 | 3,152,882 |
| 1905 | 3,685 | 3,577,355 |
| 1906 | 3,977 | 4,009,992 |
| 1907 | 4,276 | 4,590,157 |
| 1908 | 4,718 | 4,065,989 |
| 1909 | 4,946 | 4,644,795 |
| 1910 | 5,466 | 5,184,840 |
| 1911 | 5,966 | 5,477,675 |
| 1912 | 6,456 | 5,951,231 |
| 1913 | 7,225 | 6,782,532 |
| 1914 | 7,538 | 7,288,447 |
| 1915 | 8,026 | 7,942,158 |
Up to 1893 the end of the Public Trust Office year was reckoned as the 31st December, but since then the end of the financial year has been adopted.
The above table does not include the following classes of accounts and funds: Investment agencies; sinking funds; pension funds; Maori Land Board funds; funds under the Land Settlement Finance Act, 1909; Office funds; miscellaneous funds; miscellaneous Native accounts; Office premises, furniture, &c.
The following was the total number of estates, accounts, &c., in the Public Trust Office on the 31st March, 1911 to 1915:—
| Number of Estates and Accounts. | |||||
|---|---|---|---|---|---|
| Class. | On 31st March, 1911. | On 31st March, 1912. | On 31st March, 1913. | On 31st March, 1914. | On 31st March, 1915. |
| Wills and trusts | 1,810 | 2,217 | 2,455 | 2,921 | 3,354 |
| Investment agencies | .. | .. | 221 | 284 | 394 |
| Intestates' estates | 1,788 | 1,747 | 1,828 | 1,747 | 1,818 |
| Mental patients' estates | 1,422 | 1,520 | 1,953 | 1,877 | 1,900 |
| Convicts' estates | .. | 12 | 17 | 19 | 16 |
| Native reserves | 94 | 94 | 94 | 94 | 94 |
| West Coast settlement reserves | 460 | 460 | 460 | 460 | 460 |
| Unclaimed lands and property | 392 | 406 | 418 | 420 | 385 |
| Sinking funds | 143 | 190 | 242 | 408 | 506 |
| Pension funds | 3 | 6 | 8 | 11 | 12 |
| Land Settlement Finance Act, 1909 | .. | 22 | 35 | 38 | 44 |
| Miscellaneous | .. | 20 | 99 | 105 | 154 |
| Miscellaneous Native accounts | .. | .. | 666 | 839 | 893 |
| Totals | 6,112 | 6,694 | 8,496 | 9,223 | 10,029 |
The value of these estates and accounts was as shown in the next table:—
| Value of Estates and Accounts. | |||||
|---|---|---|---|---|---|
| Class. | On 31st March, 1911. | On 31st March, 1912. | On 31st March, 1913. | On 31st March, 1914. | On 31st March, 1915. |
| £ | £ | £ | £ | £ | |
| Wills and trusts | 3,257,297 | 3,619,753 | 4,366,450 | 4,771,855 | 5,271,616 |
| Investment agencies | .. | .. | 162,362 | 199,984 | 250,064 |
| Intestates' estates | 385,090 | 457,366 | 474,072 | 590,456 | 698,674 |
| Mental patients' estates | 429,958 | 462,149 | 524,095 | 509,442 | 570,561 |
| Convicts' estates | .. | 4,295 | 8,450 | 6,485 | 7,239 |
| Native reserves | 430,000 | 430,000 | 430,000 | 430,000 | 430,000 |
| West Coast settlement reserves | 940,000 | 940,000 | 940,000 | 940,000 | 940,000 |
| Miscellaneous Native accounts | .. | 171,074 | 213,027 | 233,449 | 248,075 |
| Unclaimed lands and property | 35,330 | 37,668 | 39,465 | 40,209 | 24,068 |
| Sinking funds | 1,711,060 | 1,991,451 | 2,300,603 | 2,408,337 | 2,508,574 |
| Pension funds | 675,489 | 812,976 | 997,284 | 1,208,825 | 1,442,772 |
| Land Settlement Finance Act, 1909 | .. | 215,493 | 465,516 | 501,493 | 566,046 |
| Maori Land Board funds | 46,491 | 79,765 | 75,347 | 117,850 | 185,134 |
| Miscellaneous funds | 78,785 | 93,228 | 94,963 | 118,935 | 198,359 |
| Office funds | 63,123 | 84,595 | 94,604 | 120,125 | 151,161 |
| Office premises, furniture, &c. | 59,719 | 64,149 | 82,073 | 85,438 | 88,593 |
| Totals | 8,112,342 | 9,493,959 | 11,268,311 | 12,282,883 | 13,580,936 |
The capital funds of the Public Trust Office invested amounted, on the 31st March, 1915, to £6,651,047. The investments are as follows:—
| £ | |
|---|---|
| New Zealand Government securities | 236,040 |
| Land Settlement Finance Act Debentures | 77,342 |
| Local Bodies' debentures | 625,302 |
| Mortgages of real estates | 5,482,326 |
| Freehold property and furniture | 88,593 |
| Advances to estates and accounts | 141,346 |
| Fixed deposits | 98 |
| £6,651,047 |
The net profits of the office during each of the past ten years are shown:—
| Year. | Net Profits. |
|---|---|
| £ | |
| 1906 | 11,990 |
| 1907 | 11,653 |
| 1908 | 9,640 |
| 1909 | 10,850 |
| 1910 | 11,738 |
| 1911 | 11,241 |
| 1912 | 25,919 |
| 1913 | 27,551 |
| 1914 | 29,222 |
| 1915 | 32,508 |
There were 106 registered building societies in operation on the 31st March, 1915. Of these, 69 were terminable societies, and 37 were permanent.
The dates upon which these societies close their accounts vary considerably within the year, but the figures given below may be taken as corresponding to the periods stated. The liabilities and assets of all the societies at the close of each of the past five financial years were as follows:—
| LIABILITIES OF BUILDING AND INVESTMENT SOCIETIES, 1910–11 TO 1914–15. | ||||
|---|---|---|---|---|
| Year | To Shareholders (including Reserve Funds and Undivided Profits) | Deposits. | To Bankers and other Creditors. | Total Liabilities. |
| £ | £ | £ | £ | |
| 1910—11 | 1,895,425 | 475,830 | 132,461 | 2,503,716 |
| 1911—12 | 2,020,614 | 497,063 | 131,939 | 2,649,616 |
| 1912—13 | 2,105,837 | 540,768 | 132,544 | 2,779,149 |
| 1913—14 | 2,151,098 | 612,170 | 105,476 | 2,868,744 |
| 1914—15 | 2,205,326 | 644,230 | 111,621 | 2,961,177 |
| ASSETS OF BUILDING AND INVESTMENT SOCIETIES, 1910–11 TO 1914–15. | ||||
|---|---|---|---|---|
| Year. | Advances on Mortgage. | Other Investments. | Cash in Hand and on Deposit. | Total Assets. |
| £ | £ | £ | £ | |
| 1910—11 | 2,327,299 | 60,001 | 116,416 | 2,503,716 |
| 1911—12 | 2,473,766 | 65,898 | 109,952 | 2,649,616 |
| 1912—13 | 2,614,849 | 63,825 | 100,475 | 2,779,149 |
| 1913—14 | 2,715,771 | 67,739 | 85,234 | 2,868,744 |
| 1914—15 | 2,772,569 | 75,066 | 113,542 | 2,961,177 |
During the year ended 31st December, 1914, 226 joint-stuck companies were registered, with a total nominal capital of £4,987,526, including 87 private companies, with a nominal capital of £599,225.
The following table gives the total number of companies and the aggregate nominal capital registered during each of the five years 1910–14:—
| JOINT-STOCK COMPANIES REGISTERED, 1910–14. | ||
|---|---|---|
| Year. | Number of Companies registered. | Aggregate Nominal Capital. |
| £ | ||
| 1910 | 283 | 2,663,968 |
| 1911 | 327 | 3,673,759 |
| 1912 | 316 | 3,591,362 |
| 1913 | 282 | 6,658,722 |
| 1914 | 226 | 4,987,526 |
The Registrar of Friendly Societies received returns for the year 1914 from 717 lodges, courts, tents. &c., having a membership at the end of the year of 74,074. The number of members of these 717 lodges, &c., at the beginning of the year was 74,643. A decrease in membership of 569 is thus recorded, largely the result of the enlisting in the Expeditionary Force of many young men who would otherwise have become members.
The total value of the assets of these societies was £1,744,456, of which the value of the sick and funeral benefit funds was £1,548,417.
The receipts during the year on account of the sick and funeral funds amounted to £230,664, and the expenditure to £139,873, of which the sick-pay to members reached the sum of £77,812. In addition to the sick-pay, the sum of £70,416 was paid out of the medical and management expenses fund for attendance given and medicine supplied to the members and their families.
The total membership and funds of the 717 lodges, courts. &c., and of the various orders at 31st December, 1914, was,—
| FRIENDLY SOCIETIES.—MEMBERSHIP AND FUNDS, 1914. | ||
|---|---|---|
| Name of Order. | Number of Members. | Total Worth of Funds. |
| £ | ||
| Independent Order of Odd Fellows, M.U. | 23,789 | 784,046 |
| Independent Order of Odd Fellows of N.Z. | 6,704 | 116,238 |
| National Independent Order of Odd Fellows | 439 | 5,570 |
| British United Order of Odd Fellows | 156 | 3,360 |
| Ancient Order of Foresters | 16,359 | 411,868 |
| Ancient Order of Shepherds | 53 | 1,183 |
| United Ancient Order of Druids | 17,357 | 255,082 |
| Independent Order of Rechabites | 4,053 | 81,992 |
| Sons and Daughters of Temperance | 669 | 21,341 |
| Hibernian Australasian Catholic Benefit Society | 3,529 | 38,474 |
| Protestant Alliance Friendly Society of Australasia | 928 | 22,839 |
| Eden Temperance Benefit Friendly Society | 38 | 2,463 |
| Totals | 74,074 | 1,744,456 |
The next table shows the progress of the friendly societies of New Zealand during ten years:—
| FRIENDLY SOCIETIES.—MEMBERSHIP AND FUNDS, 1905–14. | ||||||
|---|---|---|---|---|---|---|
| Year | Number of Lodges tabulated. | Number of Members. | Total Funds. | Average Capital. | ||
| £ | £ | s. | d. | |||
| 1905 | 501 | 51,103 | 996,224 | 19 | 9 | 11 |
| 1906 | 500 | 53,759 | 1,057,821 | 19 | 13 | 6 |
| 1907 | 516 | 56,817 | 1,118,217 | 19 | 13 | 7 |
| 1908 | 505 | 58,517 | 1,123,886 | 19 | 4 | 1 |
| 1909 | 567 | 64,428 | 1,266,297 | 19 | 13 | 1 |
| 1910 | 609 | 68,006 | 1,367,282 | 20 | 2 | 1 |
| 1911 | 658 | 71,771 | 1,441,353 | 20 | 1 | 8 |
| 1912 | 664 | 73,243 | 1,553,339 | 21 | 4 | 2 |
| 1913 | 681 | 73,691 | 1,643,177 | 22 | 6 | 0 |
| 1914 | 717 | 74,074 | 1,744,456 | 23 | 11 | 0 |
The value of the various funds and the way in which they are invested will be seen by reference to the following table. The funds include those of the central bodies: —
| FRIENDLY SOCIETIES.—FUNDS AND ASSETS ON 31ST DECEMBER, 1914. | |
|---|---|
| Funds | - |
| Funds. | — |
| £ | |
| Sick and Funeral Funds | 1,548,417 |
| Surplus Appropriation Funds, &c. | 56,478 |
| Management Funds, goods, &c. | 90,332 |
| Widow and Orphans' Funds | 13,866 |
| Distress, Benevolent Funds, &c. | 35,363 |
| Total | 1,744,456 |
| Assets. | — |
| £ | |
| Investments at interest | 1,479,775 |
| Value of land and buildings | 184,217 |
| Cash not bearing interest | 51,522 |
| Value of goods | 14,018 |
| Other assets | 12,997 |
| Owing by Management Fund | 1,927 |
| Total | 1,744,456 |
Interest-bearing investments form 85 per cent. of the total assets. The net income from investments credited to the Sick and Funeral Funds during the year 1914 was £73,789, the average rate of interest earned being £5 0s. 8d. per cent., as compared with £4 19s. in 1913.
Particulars are given of the number of members, the amount of accumulated capital, and the average capital per member of the friendly societies in the States of Australasia arranged in order of membership.
| FRIENDLY SOCIETIES IN AUSTRALASIA.—MEMBERSHIP AND FUNDS. | |||||||
|---|---|---|---|---|---|---|---|
| State. | At End of Year. | Number of Lodges. | Number of Members. | Amount of Funds. | Capital per Member. | ||
| £ | £ | s. | d. | ||||
| New South Wales | 1913 | 1,965 | 190,725 | 1,720,394 | 9 | 0 | 5 |
| Victoria | 1913 | 1,501 | 157,280 | 2,490,957 | 15 | 16 | 9 |
| New Zealand | 1914 | 717 | 74,074 | 1,744,456 | 23 | 11 | 0 |
| Queensland | 1913 | 535 | 50,461 | 685,401 | 13 | 11 | 8 |
| South Australia | 1909 | 529 | 58,292 | 863,998 | 14 | 16 | 5 |
| Tasmania | 1912 | 187 | 22,480 | 216,334 | 9 | 12 | 6 |
| Western Australia | 1913 | 287 | 19,616 | 218,832 | 11 | 3 | 1 |
A preliminary count at the end of April, 1915, showed that over two thousand members of friendly societies had joined the Expeditionary Forces. This number is by no means complete, and is increasing rapidly.
Section 101 of the Friendly Societies Act, 1909, provides that none of these members shall lose or forfeit any interest he may have in any such society or suffer any fine for non-attendance at meetings occasioned by the performance of his military duties. This threw a heavy burden upon the societies, especially since the Act did not permit rules to be adopted dealing with the matter as widely as became necessary. In November, 1914, a short Act was passed enabling rules to be registered providing for the postponement or waiver of payment of contributions by (a) any member who is or hereafter becomes a member of the Defence Forces of New Zealand on active service, of (b) any other member during any period of unemployment occasioned by the present war. The Government also stated its willingness to contribute one-half of the premium cost of reinsuring the funeral benefits of these members who joined the contingents. A system for subsidizing friendly societies had previously been circulated, and is now engaging the attention of the societies.
Issues of the Year-book up to 1908 contained estimates of the private wealth of the Dominion based on the assumption that the wealth of the living is proportionately equal to that left by the dead. In making these estimates no consideration was taken of the ages of the deceased or of the age constitution of the living. This was seen to be a serious defect, as the younger (and more numerous) section of the population do not possess the same amount of accumulated wealth as those at the more advanced ages. Accordingly, the old system of estimating the private wealth of the community was abandoned, and steps were taken for the adoption of a better method by ascertaining the ages of deceased persons leaving estates.
In lieu of obtaining merely the total amounts of estates certified for stamp duty, arrangements were made for obtaining the name and date of death of each deceased person whose estate was dealt with by the Stamp Office. Where it is possible, the age also is now supplied; in other cases it is ascertained by reference to the death registers. By a system of cards tables have now been prepared for the seven years 1908–14, giving for quinquennial age-groups the number and value of estates, the average wealth per person dying, and the total estimated private wealth. From the following table compiled from the estates and deaths of the seven years it will be seen that the estimated private wealth of the Dominion amounted on 31st December last to £285,485,829, or an average of £260 per head of population, excluding Maoris. Estates left by Maoris are excluded from the calculation.
The average wealth of persons of twenty years of age and over (practically the adult population) is found to be £433.
| ESTIMATED PRIVATE WEALTH, 1914. | ||||||
|---|---|---|---|---|---|---|
| Age in Years. | Number of Estates certified (1908–14.) | Total Amount, including Allowance for Unrecorded Estates. | Number of Deaths (1908–1914.) | Average Wealth per Person dying. | Estimated Population 31st Dec., 1914. | Estimated Private Wealth. |
| £ | £ | £ | ||||
| Under 5 | 22 | 1,700 | 14,321 | 0.1187 | 128,316 | 15,231 |
| 5 and under 10 | 11 | 1,763 | 1,317 | 1.3386 | 115,364 | 154,426 |
| 10 “ 15 | 17 | 2,957 | 909 | 3.2530 | 99,483 | 323,618 |
| 15 “ 20 | 67 | 11,343 | 1,382 | 8.2077 | 96,266 | 790,122 |
| 20 “ 25 | 229 | 129,473 | 2,097 | 61.7420 | 104,273 | 6,438,023 |
| 25 “ 30 | 410 | 195,359 | 2,647 | 73.8039 | 111,236 | 8,209,651 |
| 30 “ 35 | 651 | 549,755 | 2,772 | 198.1243 | 100,255 | 19,883,003 |
| 35 “ 40 | 761 | 722,622 | 2,885 | 250.4756 | 79,329 | 19,869,979 |
| 40 “ 45 | 805 | 1,100,173 | 2,585 | 425.5988 | 63,617 | 27,075,319 |
| 45 “ 50 | 1,029 | 2,062,813 | 2,691 | 744.2635 | 48,873 | 36,374,390 |
| 50 “ 55 | 1,124 | 2,325,91 | 2,961 | 785.2722 | 40,118 | 31,503,550 |
| 55 “ 60 | 1,439 | 3,578,291 | 3,382 | 1,058.0399 | 31,881 | 33,731,370 |
| 60 “ 65 | 1,656 | 3,815,179 | 3,737 | 1,01.7043 | 25,074 | 25,868,954 |
| 65 “ 70 | 2,149 | 8,844,832 | 5,232 | 1,690–5259 | 21,375 | 36,134,991 |
| 70 “ 75 | 2,526 | 7,497,120 | 6,096 | 1,229.8424 | 16,020 | 19,702,075 |
| 75 “ 80 | 2,206 | 7,382,590 | 5,645 | 1,307.8104 | 9,220 | 12,058,012 |
| 80 “ 85 | 1,402 | 4,609,405 | 3,736 | 1,233.7808 | 3,790 | 4,676,029 |
| 85 “ 90 | 610 | 3,165,205 | 1,665 | 1,901.0240 | 1,167 | 2,218,495 |
| 90 “ 95 | 165 | 782,544 | 549 | 1,425.3989 | 283 | 403,388 |
| 95 and over | 34 | 150,275 | 147 | 1,022.2789 | 54 | 55,203 |
| Totals | 17,316 | 46,908,890 | 66,756 | 702.6917 | 1,095,994 | 285,485,829 |
Private wealth per head of population, excluding Maoris, equals £260.
The table well illustrates the defect of the old system. The average value of estates of persons under 20 years of age, who comprise 40 per cent. of the living population, is only £2.9, while at the group 75 to 80 the average is £1,308 and at 85 to 90, £1,901.
The number of estates dealt with during the seven years 1908–14 is equal to only about 26 per cent. of the deaths registered during that period; and as most persons leave some estate, however small, it is necessary to make an allowance for estates which have not passed through the Stamp Office. In this connection it should be noted that estates below £200 in value are exempt from stamp and succession duty, though in many cases estates of a lower value than £200 are dealt with, being passed for probate and for the granting of letters of administration. The allowance made for unrecorded estates in the calculations shown above is 10 per cent., which is probably somewhere near the mark. Comparatively little estate is disposed of before death by settlement or deed of gift, and on such as is so disposed of gift duty is payable.
It should be noted that the estimate is that of the private wealth in the Dominion, whether owned by residents of the Dominion or by others, and does not, moreover, include estates belonging to New-Zealanders, but situated in other countries.
A table is given showing the number of estates finally passed during 1913 and 1914, classified according to amount. Estates of Maoris are included.
| Number of Estates. | Aggregate Net Value. | |||
|---|---|---|---|---|
| Amount. | 1914. | 1913. | 1914. | 1913. |
| £ | £ | £ | ||
| Under 500 | 1,213 | 1,357 | 261,231 | 284,197 |
| £500 and under 1,000 | 534 | 477 | 381,358 | 343,088 |
| £1,000 “ 2,000 | 448 | 409 | 642,500 | 586,560 |
| £2,000 “ 3,000 | 176 | 190 | 430,815 | 460,008 |
| £3,000 “ 4,000 | 102 | 113 | 354,371 | 399,082 |
| £4,000 “ 5,000 | 84 | 80 | 375,234 | 356,088 |
| £5,000 “ 7,500 | 85 | 96 | 524,393 | 579,257 |
| £7,500 “ 10,000 | 54 | 54 | 459,907 | 463,906 |
| £10,000 “ 15,000 | 47 | 49 | 589,465 | 607,918 |
| 15,000 “ 20,000 | 32 | 27 | 553,076 | 451,276 |
| £20,000 and over | 50 | 46 | 2,736,940 | 3,097,082 |
| Totals | 2,825 | 2,898 | 7,309,290 | 7,628,462 |
The total number of income-tax payers in 1914–15 was 13,967, and the net assessed income of these, including exemptions, was £13,850,261. Information as to the numbers and incomes of taxpayers coming within various categories, and in receipt of incomes of various amounts, is given in the two tables which follow. Salaried persons to the number of 4,033 had income to the amount of £2,039,004. Traders, manufacturers, and business men numbered 6,958, or just under one-half of the total taxpayers, but their income (£9,605,468) represents 70 per cent. of the total. The balance of the taxpayers were professional men (1,705), with incomes totalling £1,320,742, and 1,271 classed as various, with incomes amounting to £885,047.
| NUMBER OF INCOME-TAX PAYERS, 1914–15. | |||||||
|---|---|---|---|---|---|---|---|
| Net Income. | Salaried Persons. | Traders, Manufacturers, and Business Men. | Professional Men. | Various. | Total. | ||
| Persons and Firms. | Registered Companies. | Non-Resident Traders. | |||||
| £ | |||||||
| 0–100 | .. | .. | 275 | 50 | .. | .. | 325 |
| 100–200 | .. | .. | 156 | 32 | .. | .. | 188 |
| 200–300 | .. | .. | 109 | 30 | .. | .. | 139 |
| 300–400 | 1,727 | 1,215 | 81 | 13 | 337 | 415 | 3,788 |
| 400–500 | 1,015 | 1,131 | 59 | 14 | 358 | 271 | 2,848 |
| 500–600 | 494 | 730 | 69 | 14 | 230 | 166 | 1,703 |
| 600–700 | 300 | 470 | 54 | 8 | 188 | 90 | 1,110 |
| 700–800 | 160 | 336 | 35 | 7 | 110 | 67 | 715 |
| 800–900 | 91 | 255 | 36 | 7 | 101 | 45 | 535 |
| 900–1,000 | 74 | 156 | 34 | 6 | 64 | 38 | 372 |
| 1,000–1,250 | 84 | 333 | 105 | 8 | 112 | 62 | 704 |
| 1,250–1,500 | 29 | 159 | 53 | 8 | 63 | 35 | 347 |
| 1,500–1,750 | 21 | 91 | 53 | 5 | 37 | 19 | 226 |
| 1,750–2,000 | 18 | 60 | 30 | 1 | 28 | 12 | 149 |
| 2,000–3,000 | 16 | 107 | 108 | 11 | 40 | 32 | 314 |
| 3,000–4,000 | 4 | 40 | 76 | 3 | 17 | 7 | 147 |
| 4,000–5,000 | .. | 21 | 45 | .. | 9 | 5 | 80 |
| 5,000–7,000 | .. | 19 | 54 | 2 | 8 | 5 | 88 |
| 7,000–10,000 | .. | 11 | 38 | .. | 3 | .. | 52 |
| 10,000 and over | .. | 15 | 120 | .. | .. | 2 | 137 |
| Totals | 4,033 | 5,149 | 1,590 | 219 | 1,705 | 1,271 | 13,967 |
| INCOMES OF INCOME-TAX PAYERS 1914–15. | |||||||
|---|---|---|---|---|---|---|---|
| Net Income. | Salaried Persons. | Traders, Manufacturers, and Business Men. | Professional Men. | Various. | Total. | ||
| Persons and Finns. | Registered Companies. | Non-Resident Traders. | |||||
| £ | £ | £ | £ | £ | £ | £ | £ |
| 0–100 | .. | .. | 12,285 | 2,342 | .. | .. | 14,627 |
| 100–200 | .. | .. | 21,945 | 4,008 | .. | .. | 26,613 |
| 200–300 | .. | .. | 26,856 | 7,555 | .. | .. | 34,411 |
| 300–400 | 613,667 | 436,204 | 26,699 | 4,620 | 120,377 | 147,846 | 1,349,413 |
| 400–500 | 451,555 | 501,232 | 26,318 | 6,299 | 147,548 | 121,287 | 1,254,239 |
| 500–600 | 261,900 | 394,758 | 37,268 | 7,677 | 125,648 | 90,588 | 917,839 |
| 600–700 | 193,310 | 300,796 | 34,887 | 5,144 | 121,131 | 58,236 | 713,504 |
| 700–800 | 118,700 | 247,245 | 26,178 | 5,137 | 81,721 | 49,837 | 528,818 |
| 800–900 | 77,036 | 214,897 | 32,343 | 5,991 | 85,136 | 37,531 | 452,934 |
| 900–1,000 | 70,553 | 147,581 | 32,426 | 5,548 | 60,289 | 35,354 | 351,751 |
| 1,000–1,250 | 91,218 | 370,899 | 116,828 | 8,784 | 124,343 | 68,369 | 780,441 |
| 1,250–1,500 | 40,533 | 216,233 | 82,068 | 10,758 | 85,860 | 47,648 | 483,100 |
| 1,500–1,750 | 34,137 | 146,747 | 85,903 | 7,825 | 59,635 | 30,259 | 364,506 |
| 1,750–2,000 | 33,457 | 111,328 | 55,382 | 1,816 | 51,993 | 22,665 | 276,641 |
| 2,000–3,000 | 38,649 | 253,192 | 262,786 | 25,638 | 95,612 | 74,916 | 750,793 |
| 3,000–4,000 | 14,289 | 139,247 | 263,230 | 11,681 | 53,325 | 24,848 | 506,620 |
| 4,000–5,000 | .. | 91,543 | 202,203 | .. | 40,239 | 21,922 | 355,907 |
| 5,000–7,000 | .. | 108,212 | 322,732 | 11,598 | 44,182 | 20,051 | 515,775 |
| 7,000–10,000 | .. | 90,803 | 308,162 | .. | 23,703 | .. | 422,668 |
| 10,000 and over | .. | 215,169 | 3,509,802 | .. | .. | 24,690 | 3,749,661 |
| Totals | 2,039,004 | 3,986,086 | 5,486,301 | 133,081 | 1,320,742 | 885,047 | 13,850,261 |
Similar information has also been obtained for the financial years 1907–8, 1910–11, and 1912–13. The number of taxpayers shown for the first of the years mentioned is somewhat less than the actual number of taxpayers in that year (10,420), but the difference affects only the comparison with other years, and does not destroy the relative value of the various items in the year itself. The number of taxpayers classified according to amount of income is shown for each of the four years in the next table, together with information as to total amount of income for each group. Both numbers and amounts show a steady increase in successive years, and the proportions in the various groups do not vary greatly.
| TOTAL NUMBER OF INCOME-TAX PAYERSAND AMOUNT OF INCOME, CLASSIFIED ACCORDINGTO INCOME. | ||||||||
|---|---|---|---|---|---|---|---|---|
| Net Income. | 1907–08. | 1910–11. | 1912–13. | 1914–15. | ||||
| No. | Net Assessable Income. | No. | Net Assessable Income. | No. | Net Assessable Income. | No. | Net Assessable Income. | |
| £ | £ | £ | £ | £ | ||||
| 0–100 | 225 | 10,190 | 300 | 12,693 | 307 | 10,409 | 325 | 14,627 |
| 100–200 | 107 | 15,758 | 138 | 20,877 | 160 | 22,406 | 188 | 26,613 |
| 200–300 | 75 | 18,465 | 94 | 22,927 | 106 | 26,684 | 139 | 34,411 |
| 300–400 | 2,842 | 1,014,035 | 3,495 | 1,245,828 | 3,984 | 1,409,107 | 3,788 | 1,349,413 |
| 400–500 | 2,149 | 936,252 | 2,381 | 1,052,167 | 2,689 | 1,187,634 | 2,848 | 1,254,239 |
| 500–600 | 1,197 | 645,657 | 1,249 | 678,927 | 1,495 | 813,644 | 1,703 | 917,839 |
| 600–700 | 684 | 439,417 | 788 | 506,838 | 904 | 582,419 | 1,110 | 713,504 |
| 700–800 | 474 | 353,232 | 538 | 398,545 | 700 | 512,526 | 715 | 528,818 |
| 800–900 | 337 | 284,226 | 382 | 321,714 | 446 | 376,102 | 535 | 452,934 |
| 900–1,000 | 268 | 253,237 | 288 | 272,562 | 376 | 357,001 | 372 | 351,751 |
| 1,000–1,250 | 452 | 502,341 | 447 | 497,356 | 573 | 636,264 | 704 | 780,441 |
| 1,250–1,500 | 252 | 353,442 | 270 | 355,264 | 306 | 418,374 | 347 | 483,100 |
| 1,500–1,750 | 185 | 301,359 | 180 | 301,122 | 202 | 327,630 | 226 | 364,506 |
| 1,750–2,000 | 108 | 202,557 | 107 | 200,466 | 153 | 286,715 | 149 | 276,641 |
| 2,000–3,000 | 215 | 508,081 | 246 | 590,128 | 286 | 694,184 | 314 | 750,793 |
| 3,000–4,000 | 132 | 454,752 | 105 | 362,649 | 140 | 476,908 | 147 | 506,620 |
| 4,000–5,000 | 68 | 300,532 | 58 | 257,913 | 78 | 350,331 | 80 | 355,907 |
| 5,000–7,000 | 119 | 818,415 | 76 | 435,766 | 70 | 403,590 | 88 | 515,775 |
| 7,000–10,000 | 53 | 432,436 | 74 | 611,643 | 52 | 422,668 | ||
| 10,000 and over | 101 | 2,813,398 | 108 | 3,100,443 | 118 | 3,435,708 | 137 | 3,749,661 |
| Totals | 9,990 | 10,225,346 | 11,303 | 11,066,621 | 13,167 | 12,939,339 | 13,967 | 13,850,261 |
Taking those classified as salaried persons, it is found that in each of the four years nearly one-half of those paying income-tax had salaries of from £300 to £400, and another fourth between £400 and £500. Incomes of £1,000 or over in this class are comparatively rare, and none exceeded the £4,000 mark in 1914–15. The figures for each year are given.
| SALARIED PERSONS PAYING INCOME-TAX. | ||||||||
|---|---|---|---|---|---|---|---|---|
| Net Income. | 1907–08. | 1910–11. | 1912–13. | 1914–15. | ||||
| No. | Net Assessable Income. | No. | Net Assessable Income. | No. | Net Assessable Income. | No. | Net Assessable Income. | |
| £ | £ | £ | £ | £ | ||||
| 300–400 | 1,200 | 427,135 | 1,561 | 555,567 | 1,828 | 635,383 | 1,727 | 613,667 |
| 400–500 | 662 | 279,361 | 813 | 355,724 | 977 | 429,830 | 1,015 | 451,555 |
| 500–600 | 297 | 161,034 | 378 | 205,802 | 431 | 234,341 | 494 | 261,900 |
| 600–700 | 147 | 94,708 | 163 | 104,768 | 223 | 144,077 | 300 | 193,310 |
| 700–800 | 93 | 68,150 | 108 | 80,274 | 146 | 108,972 | 160 | 118,700 |
| 800–900 | 51 | 43,425 | 72 | 60,857 | 84 | 70,303 | 91 | 77,036 |
| 900–1,000 | 38 | 30,066 | 48 | 45,731 | 64 | 60,397 | 74 | 70,553 |
| 1,000–1,250 | 53 | 58,388 | 58 | 65,330 | 79 | 87,406 | 84 | 91,218 |
| 1,250–1,500 | 22 | 30,158 | 43 | 59,318 | 40 | 55,535 | 29 | 40,533 |
| 1,500–1,750 | 14 | 22,231 | 10 | 16,217 | 20 | 32,479 | 21 | 34,137 |
| 1,750–2,000 | 16 | 30,039 | 11 | 20,464 | 10 | 20,089 | 18 | 33,457 |
| 2,000–3,000 | 7 | 15,184 | 20 | 44,234 | 16 | 36,220 | 16 | 38,649 |
| 3,000–4,000 | 3 | 9,951 | 3 | 10,504 | 4 | 13,366 | 4 | 14,289 |
| 4,000–5,000 | 1 | 4,813 | 1 | 4,702 | 2 | 9,566 | .. | .. |
| Totals | 2,604 | 1,280,643 | 3,289 | 1,629,492 | 3,924 | 1,937,964 | 4,033 | 2,039,004 |
Professional men, though much fewer in number than the salaried persons, nevertheless fall little below them in point of total income. They also show a higher proportion at the larger rates of income than do the salaried class. A similar table to that given for the “salaried” class is given for professional men.
| PROFESSIONAL MEN. | ||||||||
|---|---|---|---|---|---|---|---|---|
| Net Income. | 1907–08. | 1910–11. | 1912–13. | 1914–15. | ||||
| No. | Net Assessable Income. | No. | Net Assessable Income. | No. | Net Assessable Income. | No. | Net Assessable Income. | |
| £ | £ | £ | £ | £ | ||||
| 300–400 | 234 | 84,263 | 338 | 120,235 | 356 | 127,929 | 337 | 120,377 |
| 400–500 | 213 | 94,307 | 270 | 121,162 | 316 | 140,791 | 358 | 147,548 |
| 500–600 | 169 | 91,217 | 162 | 88,304 | 213 | 116,891 | 230 | 125,648 |
| 600–700 | 93 | 59,915 | 134 | 86,670 | 147 | 94,865 | 188 | 121,131 |
| 700–800 | 76 | 56,823 | 89 | 63,186 | 116 | 86,380 | 110 | 81,721 |
| 800–900 | 61 | 51,672 | 65 | 50,910 | 65 | 55,177 | 101 | 85,136 |
| 900–1,000 | 45 | 42,398 | 44 | 41,550 | 54 | 51,836 | 64 | 60,289 |
| 1,000–1,250 | 67 | 74,730 | 90 | 99,176 | 103 | 115,526 | 112 | 124,343 |
| 1,250–1,500 | 32 | 44,447 | 34 | 46,674 | 64 | 87,964 | 63 | 85,860 |
| 1,500–1,750 | 24 | 38,549 | 23 | 37,110 | 34 | 55,004 | 37 | 59,635 |
| 1,750–2,000 | 14 | 26,488 | 11 | 20,467 | 25 | 46,278 | 28 | 51,993 |
| 2,000–3,000 | 26 | 61,118 | 31 | 75,715 | 41 | 99,838 | 40 | 95,612 |
| 3,000–4,000 | 8 | 26,048 | 11 | 39,435 | 12 | 40,640 | 17 | 53,325 |
| 4,000–5,000 | 4 | 16,880 | 1 | 4,064 | 2 | 8,469 | 9 | 40,239 |
| 5,000–7,000 | 3 | 20,723 | 2 | 10,468 | 2 | 11,025 | 8 | 44,182 |
| 7,000–10,000 | 3 | 2 | 13,800 | .. | .. | 3 | 23,703 | |
| Totals | 1,069 | 789,587 | 1,302 | 918,926 | 1,550 | 1,138,613 | 1,705 | 1,320,742 |
As stated above, traders, manufacturers, and business men comprise the most important class of income-tax payers. They are further divided for taxation purposes into persons and firms, registered companies, and non-resident traders. Individual persons and firms are exempt from taxation up to £300, but registered companies and non-resident traders are assessed for the full amount of their income. Persons and firms represent nearly three-fourths of the trailers, manufacturers, and business men, but their incomes amount to considerably less than those of registered companies. The non-resident traders comprise only a small proportion of the total as regards both numbers and incomes, but are shown separately as being a distinct class by themselves in that they are charged income-tax on the profits arising from the business secured by their agents in New Zealand without being themselves resident in the Dominion. Tables are given in respect of each of the three classes coming under the general heading of “Traders, Manufacturers, and Business Men.”
| TRADERS, MANUFACTURERS, AND BUSINESS MEN. | ||||||||
|---|---|---|---|---|---|---|---|---|
| (a.) Persons and Firms. | ||||||||
| Net Income. | 1907–08. | 1910–11. | 1912–13. | 1914–15. | ||||
| No. | Net Assessable Income. | No. | Net Assessable Income. | No. | Net Assessable Income. | No. | Net Assessable Income. | |
| £ | £ | £ | £ | £ | ||||
| 300–400 | 1,195 | 427,427 | 1,296 | 464,614 | 1,427 | 514,097 | 1,215 | 436,204 |
| 400–500 | 1,148 | 506,509 | 1,133 | 500,185 | 1,193 | 527,204 | 1,131 | 501,232 |
| 500–600 | 650 | 349,147 | 597 | 323,967 | 724 | 393,434 | 730 | 394,758 |
| 600–700 | 389 | 250,004 | 424 | 272,194 | 450 | 289,205 | 470 | 300,796 |
| 700–800 | 262 | 195,983 | 277 | 206,983 | 363 | 260,557 | 336 | 247,245 |
| 800–900 | 187 | 157,136 | 197 | 164,878 | 247 | 208,210 | 255 | 214,897 |
| 900–1,000 | 148 | 139,825 | 151 | 142,496 | 202 | 191,749 | 156 | 147,581 |
| 1,000–1,250 | 251 | 279,768 | 232 | 257,840 | 291 | 321,604 | 333 | 370,899 |
| 1,250–1,500 | 152 | 207,157 | 150 | 190,487 | 148 | 200,902 | 159 | 216,233 |
| 1,500–1,750 | 111 | 182,372 | 93 | 160,937 | 80 | 129,837 | 91 | 146,747 |
| 1,750–2,000 | 55 | 103,560 | 49 | 92,031 | 67 | 125,145 | 60 | 111,328 |
| 2,000–3,000 | 115 | 268,103 | 110 | 265,334 | 112 | 267,404 | 107 | 253,192 |
| 3,000–4,000 | 65 | 222,304 | 45 | 150,569 | 47 | 157,549 | 40 | 139,247 |
| 4,000–5,000 | 25 | 109,637 | 30 | 133,879 | 23 | 103,282 | 21 | 91,543 |
| 5,000–7,000 | 46 | 291,733 | 17 | 96,581 | 22 | 123,371 | 19 | 108,212 |
| 7,000–10,000 | 14 | 114,437 | 16 | 127,484 | 11 | 90,803 | ||
| 10,000 and over | 17 | 333,789 | 16 | 230,866 | 10 | 159,273 | 15 | 215,169 |
| Totals | 4,816 | 4,024,454 | 4,831 | 3,768,278 | 5,422 | 4,100,307 | 5,149 | 3,986,086 |
| TRADERS, MANUFACTURERS, AND BUSINESS MEN. -continued. | ||||||||
|---|---|---|---|---|---|---|---|---|
| (b.) Registered Companies. | ||||||||
| Net Income. | 1907–08. | 1910–11. | 1912–13. | 1914–15. | ||||
| No. | Net Assessable Income. | No. | Net Assessable Income. | No. | Net Assessable Income. | No. | Net Assessable Income. | |
| £ | £ | £ | £ | £ | ||||
| 0–100 | 174 | 7,886 | 233 | 9,873 | 257 | 8,657 | 275 | 12,285 |
| 100–200 | 83 | 11,994 | 104 | 15,842 | 124 | 17,254 | 156 | 21,945 |
| 200–300 | 60 | 14,687 | 69 | 16,684 | 87 | 21,946 | 109 | 26,856 |
| 300–400 | 48 | 16,564 | 57 | 19,941 | 64 | 22,398 | 81 | 26,699 |
| 400–500 | 31 | 13,772 | 44 | 19,675 | 56 | 24,874 | 59 | 26,318 |
| 500–600 | 26 | 14,254 | 46 | 24,767 | 39 | 21,044 | 69 | 37,268 |
| 600–700 | 24 | 15,370 | 33 | 21,354 | 35 | 22,685 | 54 | 34,887 |
| 700–800 | 23 | 17,186 | 43 | 32,333 | 35 | 26,540 | 35 | 26,178 |
| 800–900 | 24 | 19,991 | 36 | 30,494 | 27 | 22,839 | 36 | 32,343 |
| 900–1,000 | 20 | 24,412 | 29 | 27,332 | 44 | 41,729 | 34 | 32,426 |
| 1,000–1,250 | 52 | 57,766 | 49 | 54,741 | 72 | 80,911 | 105 | 116,828 |
| 1,250–1,500 | 33 | 54,125 | 28 | 37,921 | 41 | 55,868 | 53 | 82,068 |
| 1,500–1,750 | 26 | 42,022 | 40 | 64,436 | 50 | 81,090 | 53 | 85,903 |
| 1,750–2,000 | 16 | 29,606 | 34 | 63,720 | 41 | 76,727 | 30 | 55,382 |
| 2,000–3,000 | 55 | 135,152 | 78 | 187,957 | 103 | 255,228 | 108 | 262,786 |
| 3,000–4,000 | 49 | 171,839 | 37 | 131,619 | 66 | 227,102 | 76 | 263,230 |
| 4,000–5,000 | 34 | 150,539 | 26 | 115,268 | 49 | 220,515 | 45 | 202,203 |
| 5,000–7,000 | 66 | 479,340 | 55 | 318,062 | 43 | 252,59 | 54 | 322,732 |
| 7,000–10,000 | 36 | 296,681 | 56 | 469,586 | 38 | 308,162 | ||
| 10,000 and over | 82 | 2,456,816 | 92 | 2,869,577 | 107 | 3,265,422 | 120 | 8,509,802 |
| Totals | 932 | 3,733,321 | 1,169 | 4,358,277 | 1,396 | 5,214,674 | 1,590 | 5,486,301 |
| TRADERS, MANUFACTURERS, AND BUSINESS MEN. -continued. | ||||||||
|---|---|---|---|---|---|---|---|---|
| (c.) Non-resident Traders. | ||||||||
| Net Income. | 1907–08. | 1910–11. | 1912–13. | 1914–15. | ||||
| No. | Net Assessable Income. | No. | Net Assessable Income. | No. | Net Assessable Income. | No. | Net Assessable Income. | |
| £ | £ | £ | £ | £ | ||||
| 0–100 | 51 | 2,304 | 67 | 2,820 | 50 | 1,812 | 50 | 2,342 |
| 100–200 | 24 | 3,764 | 34 | 5,035 | 36 | 5,152 | 32 | 4,668 |
| 200–300 | 15 | 3,778 | 25 | 6,243 | 19 | 4,738 | 30 | 7,555 |
| 300–100 | 9 | 3,019 | 10 | 3,605 | 19 | 6,748 | 13 | 4,620 |
| 400–500 | 7 | 3,129 | 9 | 3,974 | 10 | 4,525 | 14 | 6,299 |
| 500–600 | 10 | 5,489 | 8 | 4,375 | 12 | 6,472 | 14 | 7,677 |
| 600–700 | 4 | 2,573 | 7 | 4,533 | 10 | 6,539 | 8 | 5,114 |
| 700–800 | 3 | 2,307 | 4 | 2,967 | 7 | 5,238 | 7 | 5,137 |
| 800–900 | 5 | 4,313 | 4 | 3,391 | 2 | 1,689 | 7 | 5,991 |
| 900–1,000 | 1 | 945 | 6 | 5,905 | 3 | 2,844 | 6 | 5,548 |
| 1,000–1,250 | 11 | 12,163 | 8 | 9,228 | 7 | 7,762 | 8 | 8,784 |
| 1,250–1,500 | 7 | 9,499 | 5 | 7,155 | 1 | 1,384 | 8 | 10,758 |
| 1,500–1,750 | 7 | 11,141 | 7 | 11,494 | 5 | 8,056 | 5 | 7,825 |
| 1,750–2,000 | 5 | 9,276 | 2 | 3,784 | 4 | 7,827 | 1 | 1,816 |
| 2,000–3,000 | 4 | 10,041 | 4 | 9,463 | 8 | 20,212 | 11 | 25,638 |
| 3,000–4,000 | 3 | 17,203 | 4 | 13,458 | 4 | 13,749 | 3 | 11,681 |
| 4,000–5,000 | 3 | 14,041 | .. | .. | .. | .. | .. | .. |
| 5,000–7,000 | 2 | 13,991 | 1 | 5,654 | 1 | 5,200 | 2 | 11,598 |
| 7,000–10,000 | .. | .. | 1 | 7,220 | .. | .. | ||
| Totals | 173 | 128,976 | 205 | 103,084 | 199 | 116,667 | 219 | 133,081 |
A statement prepared by the Valuer-General shows the value of public lands and improvements thereon, including public buildings, but excluding lessees' interests, as at 31st March, 1911.
The following table gives this information together with similar figures as at 31st March, 1908. The value of Government railways and other public works (taken at cost) is also shown.
| TABLE SHOWING VALUE OF PUBLIC PROPERTY ASAT 31ST MARCH, 1908 AND 1911. | ||
|---|---|---|
| 31st March, 1908. | 31st March, 1911. | |
| £ | £ | |
| Crown lands | 21,511,653 | 25,432,145 |
| Local authorities' lands | 7,163,722 | 7,901,969 |
| Educational lands | 5,038,615 | 3,685,819 |
| Church and other lands | 3,555,271 | 4,623,214 |
| 37,269,261 | 41,643,147 | |
| Government railways open and under construction | 26,735,140 | 31,509,960 |
| Other public works—viz., telegraphs, lighthouses, harbours, and water-supply on goldfields | 5,428,000 | 5,750,000 |
| Totals | £69,432,401 | £78,903,107 |
A total increase of £9,470,706 is shown for the three years. The decrease in educational lands is due to the abolition of the School Commissioners and the vesting of their lands in the Crown, which also accounts for a considerable portion of the increase of nearly £4,000,000 in the value of Crown lands.
In addition to the items enumerated above there must be taken into account the value of such public undertakings by local authorities as water-supply, lighting and power, tramways, and harbours. Excluding buildings, these works, apart from streets, footways, or bridges, have cost approximately £9,000,000.
The value of Native lands and improvements, exclusive of the value of lessees' interests, on 31st March, 1908, was £11,413,545, and on 31st March. 1911, £10,860,815. The decrease is due to purchase of Native lands by private individuals and by the Crown.
The value of the total production of New Zealand has been estimated for the year 1910–11, and the result is given together with figures for 1907–8. In regard to the last item for each year, the amount has been arrived at by an indirect though recognized method, but may be regarded as a fair approximation.
| 1907–8. | 1910–11. | |
|---|---|---|
* 1905–6. | ||
| £ | £ | |
| Agricultural produce | 4,020,449 | 4,150,789 |
| Pastoral produce | 19,787,710 | 25,416,830 |
| Mining produce | 3,775,835 | 3,774,898 |
| Manufactures | 7,240,913 | 7,640,640 |
| Miscellaneous (including fisheries and forestry) | 1,766,815 | 2,079,866 |
| £36,591,722 | £43,063,023 | |
| Value of building trade, industries not included in manufactories, and general labour | 7,038,380* | 8,287,260 |
| Total | £43,630,102 | £51,350,283 |
The most noticeable point in the table is the large increase in the output of pastoral produce during the four years. Agricultural produce shows but a small increase, while mining produce shows a slight decrease.
The present Act dealing with these subjects was passed in 1911 and came into force on the 1st July, 1912. An amending Act passed in 1914 enables the Governor in Council to order the avoidance or suspension of patents or trade-marks of subjects of a State at war with His Majesty. No applications by such enemy subjects are accepted or patents issued; but a special license permits the payment of renewal fees. Extension of time for filing documents or paying fees may be granted to any person who has been prevented from doing so by circumstances arising from the present war.
Application for a patent may be made by any number of persons, providing that one of them is the true inventor of the invention, manufacture, or process for which the patent is applied. An application must contain a declaration to the above effect, and must be accompanied by a specification, either complete or provisional. In the former case a fee of £1 is payable, in the latter one of 10s. A complete specification must be left within nine months of the date of application, and if it is not accepted within a year of such date the application is void.
Should a specification be accepted, the acceptance is advertised and the particulars are open to public inspection. Notice of opposition may be given within two months of the advertisement. From the Registrar's decision in such circumstances there is an appeal to the Supreme Court.
A fee of £2 is charged on the sealing of a patent. Except in special cases, a patent must be sealed within fifteen months after the date of application.
The date of a patent is the date of application, and the rights exist for fourteen years. An extension of seven (in very exceptional cases, fourteen) years may be obtained, the procedure being by petition to the Supreme Court.
After a patent has been in existence for three years any party interested may petition the Court, alleging that the reasonable requirements of the public in respect of the patent are not being satisfied. If such statement be proved, then compulsory licenses to manufacture may be issued or the patent may be revoked.
Only persons registered as such may practise as patent agents or attorneys. Applicants for registration are examined, and, if successful, are registered, registration being subject to an annual fee of one guinea.
The following table shows for the years 1901–10 the number of applications and specifications received, the patents sealed, and those patents kept alive by payment of renewal fees. For part of the table later figures cannot be given, but the total number of applications was in 1911, 1,740; in 1912, 1,737; in 1913, 1,775; and in 1914, 1,574.
| PATENTS, 1901–10. | ||||||
|---|---|---|---|---|---|---|
| Year. | Applications, received. | Complete Specifications received. | Patents sealed. | Applications lapsed or refused. | Patents on which Second Term Fee paid. | Patents on which Final Fee paid. |
| 1901 | 1,114 | 699 | 580 | 534 | 200 | 91 |
| 1902 | 1,431 | 859 | 655 | 776 | 209 | 104 |
| 1903 | 1,604 | 865 | 687 | 917 | 229 | 95 |
| 1904 | 1,483 | 793 | 629 | 854 | 209 | 89 |
| 1905 | 3,601 | 878 | 676 | 925 | 231 | 108 |
| 1906 | 1,745 | 962 | 727 | 1,018 | 238 | 96 |
| 1907 | 1,618 | 925 | 725 | 893 | 231 | 122 |
| 1908 | 1,527 | 876 | 679 | 848 | 222 | .. |
| 1909 | 1,705 | 936 | 735 | 970 | 252 | .. |
| 1910 | 1,831 | 1,022 | 844 | 1,050 | 385 | .. |
In the next table are shown the various countries residents of which applied for patents in New Zealand during the year 1914. Owing to applications being received from joint applicants resident in different countries, also from applicants giving two addresses, the figures total more than the actual number of applications received.
| APPLICATIONS FOR PATENTS IN NEW ZEALAND. 1914. | |
|---|---|
| Country. | Number. |
| New Zealand | 1,045 |
| Great Britain | 150 |
| Australia | 221 |
| Canada | 12 |
| South Africa | 4 |
| Belgium | 3 |
| Denmark | 2 |
| France | 4 |
| Germany | 13 |
| Holland | 7 |
| Italy | 1 |
| Russia | 1 |
| Spain | 1 |
| Sweden | 8 |
| United States | 106 |
| Argentina | 1 |
| Egypt | 1 |
Reciprocal protection has been established with Great Britain (see Gazette, 1890, p. 566) and with the Commonwealth of Australia (see Gazette, 1905, p. 663).
New Zealand is also a party to the International Convention, the number of applications received under the Convention in 1914 being 137 as compared with 139 in 1913.
Any person claiming to be the proprietor of a new and original design may, upon payment of a fee of 5s., apply to have such design registered. If registered, the design is copyright for a term of five years. Two extensions of five years each may be had on application and payment of prescribed fees. Registered designs are not open to public inspection.
Fifty-five applications were received in 1914, and 46 designs registered. The corresponding figures for 1913 were 65 and 58 respectively. This form of protection is intended chiefly for use in manufacturing countries, and is not gaining in favour.
A trade-mark must be registered in respect of particular goods or classes of goods. Section 64 of the Patents, &c., Act, 1911, sots forth the essentials of a registrable trade-mark. The procedure for obtaining registration is largely the same as that for obtaining a patent. A fee of 10s. is payable on application, and one of £1 on registration.
Registration is effective for a period of fourteen years; but, on payment of prescribed fees, may be renewed for like periods indefinitely. No action for infringement can be taken in respect of an unregistered trade-mark.
All assignments and transmissions of a registered trade-mark must be entered on the register. Such trade-marks, in general, pass only with the goodwill of the business concerned.
The table below which covers the period 1895 to 1914, shows for each year the number of applications for registration of designs and trade-marks:—
| DESIGNS AND TRADE-MARKS.—APPLICATIONS FOR REGISTRATION, 1895–1914. | ||
|---|---|---|
| Year. | Designs. | Trademarks. |
| 1895 | 14 | 254 |
| 1896 | 27 | 279 |
| 1897 | 13 | 361 |
| 1898 | 10 | 343 |
| 1899 | 12 | 328 |
| 1900 | 15 | 348 |
| 1901 | 18 | 379 |
| 1902 | 28 | 412 |
| 1903 | 26 | 447 |
| 1904 | 24 | 592 |
| 1905 | 54 | 607 |
| 1906 | 36 | 702 |
| 1907 | 57 | 684 |
| 1908 | 79 | 685 |
| 1909 | 51 | 703 |
| 1910 | 46 | 818 |
| 1911 | 21 | 861 |
| 1912 | 44 | 779 |
| 1913 | 65 | 787 |
| 1914 | 55 | 687 |
The total number of applications during 1914 in respect of trade-marks was 687, and the fees received totalled £1,277.
Of the 687 applications, 270 were made by residents of New Zealand, 199 came from Great Britain. 75 from the United States, and 94 from Australia.
Applications were received for the suspension or avoidance of registration of two trade-marks of German proprietary. Both were granted, subject to conditions.
The total applications during 1914 in respect of patents, designs, and trade-marks numbered 2,316, as compared with 2,627 in the previous year. The revenue, £7,572, exceeded that for 1913 by £459, while the expenditure amounted to £3,537. The total amount received in fees since the foundation of the Patent Office is approximately £89,785, while the amount received over that expended since the 1st January, 1890, is £67,327.
The Inspection 'of Machinery Act makes provision for the inspection of all steam boilers and digesters, hydraulic, electric, and other lifts, and of any prime mover such as gas, oil, and air engines used to drive machinery on land, also of machinery used on vessels afloat that are not self-propelled.
It also provides for the issue of certificates to those who pass the prescribed examination for land engineers and engine-drivers in charge of boilers and machinery, for winding-engine drivers for mining purposes, for drivers employed on locomotives working on railway-lines not under the control of the Government Working Railways Department, and for the drivers of traction-engines on roads. Certificates are also issued to electric-tram drivers as provided by the Tramways Amendment Act, 1910. The issue of these certificates is controlled by a Board of Examiners set up by the Act, the Chairman being the Chief Inspector of Machinery.
During the year ended 31st March, 1915, the following certificates were issued:—
| Boiler certificates | 7,398 |
| Machinery certificates | 11,053 |
| 18,451 | |
| Extra first-class engineers' certificates | 1 |
| First-class station try-engine drivers' certificates | 54 |
| Second-class stationary-engine drivers' certificates | 224 |
| Locomotive and traction-engine drivers' certificates | 144 |
| Winding-engine drivers' certificates | 21 |
| Electric-tram drivers' certificates | 81 |
| 525 | |
| 18,976 | |
AN attempt has been made to compile statistics as to employees of the State and of local governing bodies. The results, which are not claimed to represent the full number of employees, but which nevertheless cover all State Departments (with the exception of the military side of the Defence Department and the temporary employees of the Railway Department), and so far as possible all local authorities, are given in this section.
The permanent employees of the State, with a few exceptions, are divided into two divisions—viz., those officers under the control of the Public Service Commissioner and those under the General Manager of Railways. The first-mentioned division is usually further subdivided into Post and Telegraph Department and “Other Departments.” In addition to the permanent employees of the various Departments there is a floating staff of temporary and casual employees, many of whom are under the direct jurisdiction of the Public Service Commissioner, while in certain Departments casual and temporary employees on other than clerical work are outside of the control of the Commissioner. The Railway Department has also a large staff of temporary employees, but no information as to their number or the amount of wages paid to them is available.
The first table gives particulars of the permanent officers of those Departments under the control of the Public Service Commissioner, with their classified salaries for the year 1915–16:—
| Department. | Officers. | Salaries. |
|---|---|---|
| £ | ||
| Agriculture | 441 | 102,011 |
| Audit | 72 | 18,605 |
| Cook Islands | 2 | 425 |
| Crown Law | 9 | 3,967 |
| Customs | 236 | 49,367 |
| Defence | 91 | 18,141 |
| Dominion Laboratory | 11 | 2,900 |
| Dominion Museum | 4 | 1,203 |
| Education | 238 | 42,449 |
| Native-school teachers (year 1914–15) | 256 | 34,875 |
| Inspectors of Schools | 40 | 20,581 |
| Friendly Societies | 26 | 4,921 |
| Government Life Insurance | 134 | 28,386 |
| Immigration | 7 | 1,375 |
| Internal Affairs | 256 | 35,334 |
| Relieving Staff | 67 | 6,631 |
| Justice | 214 | 42,614 |
| Labour | 77 | 14,046 |
| Land and Deeds | 100 | 20,206 |
| Land and Income Tax | 70 | 13,990 |
| Land Settlement | 3 | 1,195 |
| Lands and Survey | 480 | 115,191 |
| Marine and Machinery | 175 | 38,940 |
| Mental Hospitals | 670 | 94,081 |
| Mines | 99 | 22,156 |
| Native | 62 | 12,127 |
| Patents | 11 | 2,368 |
| Pensions | 28 | 4,950 |
| Police (not including Police Force) | 6 | 1,275 |
| Printing and Stationery | 340 | 58,562 |
| Prisons | 165 | 31,745 |
| Private Secretaries | 8 | 2,810 |
| Public Health | 66 | 15,809 |
| Public Service Commissioner | 14 | 2,582 |
| Public Service Superannuation | 6 | 1,199 |
| Public Trust | 235 | 38,600 |
| Public Works | 657 | 133,664 |
| Registrar-General | 32 | 6,589 |
| Stamps | 31 | 6,490 |
| State Advances | 55 | 10,952 |
| State Fire | 64 | 10,133 |
| Tourist | 148 | 23,316 |
| Treasury | 55 | 11,962 |
| Valuation | 108 | 25,112 |
| 5,869 | 1,133,835 | |
| Administrative officers of above Departments | 29 | 21,975 |
| Vacant positions in Education Department | 46 | .. |
| Piecework officers of Printing and Stationery Department | 2 | .. |
| Post and Telegraph Department | 5,958 | 824,242 |
| Totals | 11,904 | 1,980,052 |
The forty-six vacant positions shown for the Education Department are not the only positions vacant at the 1st April, 1915, but in all other cases salaries attached to vacant positions are shown in the classification lists, and both numbers and salaries are included in the first sub-total given. The average salary for the forty-six positions referred to may be taken at £100 per annum approximately, and if each of the two employees on piecework in the Government Printing Office be assumed to earn a similar amount the total salaries of the 11,904 permanent officers under the control of the Pubic Service Commissioner may be set down at £1,984,852.
In addition to the permanent officers of the Departments shown above, there was at the 31st March, 1915, a total of 1,573 temporary or casual officers under the direct control of the Commissioner. The wages paid to temporary employees during the financial year ended the 31st March, 1915, amounted to £169,452. The usual rate of pay to temporary employees on clerical work is 10s. per diem, and as in some cases the remuneration is in excess of this, and in cases where the work is other than clerical the rate of pay is either 10s. per diem or a little less, the average may be taken at £155 per annum. The average number of temporary employees throughout the year, at this rate of pay, would be 1,093, or only about two-thirds of the number actually employed at the end of the year.
Officers on the permanent staff of the Railway Department on the 31st March, 1915, numbered 14,614, made up as follows:—
| Branch. | No. of Officers. |
|---|---|
| General | 632 |
| Traffic | 4,753 |
| Maintenance | 4,065 |
| Locomotive | 5,164 |
It has been found impossible to obtain information as to casual and temporary employees of the Railway Department, but it is known that the Department has a considerable staff of casual hands and engages a good deal of temporary labour at different times. No attempt has been made to arrive at the total classified salaries and wages of the Department, but the total expenditure on wages and services during the year 1914–15 is given as £1,959,487. This total probably includes a little that does not come under the heading of “salaries and wages,” but it will be observed that the classified salaries and wages of a less number of officers in the Commissioner-controlled Departments of the Public Service are in excess of the total expenditure of the Railway Department on the items mentioned, so that the proportion not due to wages must be small indeed.
The Police Force of the Dominion at the 31st March, 1915, numbered 941, and the expenditure on salaries and wages during the preceding twelve months amounted to £176,060.
The Public Works Department is under the control of the Public Service Commissioner as regards its permanent staff and certain of its temporary employees. For many of the undertakings of the Department, however, a large number of temporary hands are engaged either by the day or under the co-operative system. The figures for the year ended the 31st March, 1915, are as follows:—
| Day-labour Employees. | Co-operative Employees. | |
|---|---|---|
| Number at 31st March, 1915 | 2,689 | 3,419 |
| Average number during 1914–15 | 2,520 | 2,555 |
| Total wages paid during 1914–15 | £330,767 | £334,888 |
The Government Printer has, in addition to his permanent staff, a large staff of what may be termed permanent casuals—that is, employees who, not being permanent officers, are put off when there is insufficient work in hand, but who are actually engaged for a considerable part of every year. It becomes necessary, at times, to temporarily engage further assistance outside of the usual casual employees. At the 31st March, 1915, 235 casual and temporary employees were on the pay-sheets of the Printing and Stationery Department. The average number employed during the preceding twelve months was 233, and the wages paid to casual and temporary employees during the year amounted to £20,237.
Officers of Parliament and of the Legislative Department comprise another class not under the control of the Public Service Commissioner. The permanent employees under the jurisdiction of the Clerk of Parliaments, the Clerk of the House of Representatives, and the Parliamentary Librarian at the 31st March, 1915, numbered seventy-eight, and their annual salaries amounted to £20,878. A number of casual employees are engaged during session-time, amounting to 105 during the session of 1914.
No information concerning the military employees of the Defence Department, nor naval officers and men, is available.
Judges and Magistrates are also outside of the jurisdiction of the Public Service Commissioner There are eight Judges, including the Chief Justice, and £14,433 was the total of the salaries paid to them during 1914–15. The number of Stipendiary Magistrates at the end of the year was twenty-nine, and their average salary would be about £600.
Other officers and employees of the State who have not been included above are: the Controller and Auditor-General; the Solicitor-General; the Private Secretary to the Prime Minister; the Secretary to Cabinet; the official Secretary to His Excellency the Governor; the High Commissioner and his staff; the Resident Commissioners in the Cook Islands and Niue, with their staffs; officers of the Agriculture Department outside New Zealand; learners at experimental farms; certain Sanitary Inspectors of the Health Department (eleven in number); canvassers of the State Insurance Offices; and the officers (other than masters) and crews of Government steamers.
No account is taken of part-time officers of State Departments who are allowed to perform work for remuneration outside the Government. Crown Solicitors, Registrars of Births, &c., and non-permanent Postmasters and Postmistresses come into this category.
Before dealing with the local authorities proper, there are the employees of Education Boards to be taken into account. The total number of teachers under the control of Education Boards in December, 1914, was 5,468, and their aggregate salaries amounted to £742,432, not including house allowance, &c. In addition, the clerical and inspecting staffs, &c., of the Education Boards have to be taken into consideration. These numbered 159 at the 31st December, 1914, and their salaries amounted to £43,822. No information is available as to temporary employees of Education Boards.
Dealing now with local authorities, it is found that the number of employees is considerable, involving a large annual expenditure on salaries and wages. Information has been obtained from each local authority as to the number of permanent employees and casual and temporary employees, and the summarized results are given in the table following. Details for each authority with the exception of Hospital and Charitable Aid Boards are given in Volume IV of Statistics, 1914.
| LOCAL AUTHORITIES.—EMPLOYEES AND WAGES, 1914–15. | |||||
|---|---|---|---|---|---|
| Governing Authorities for | Permanent Employees. | Temporary Employees. | |||
| Number. | Salaries and Wages. | Number at End of Year. | Average Number for Year. | Wages paid during Year. | |
| £ | £ | ||||
| Counties | 1,365 | 209,054 | 2,562 | 1,720 | 218,324 |
| Boroughs | 5,122 | 785,996 | 1,529 | 1,341 | 165,877 |
| Independent Town Districts | 103 | 10,866 | 80 | 76 | 8,805 |
| Town Districts under county jurisdiction | 48 | 2,675 | 16 | 8 | 1,180 |
| Native Township | 1 | 40 | .. | .. | .. |
| Road Districts | 255 | 20,299 | 224 | 182 | 23,324 |
| River Protective Districts | 65 | 6,179 | 47 | 29 | 4,253 |
| Land Drainage Districts | 44 | 1,852 | 79 | 34 | 4,586 |
| Water-supply Districts | 16 | 2,583 | 6 | 5 | 575 |
| City and Suburban Drainage Districts | 69 | 10,673 | 115 | 144 | 18,235 |
| Tramway Districts | 349 | 59,130 | 72 | 44 | 4,982 |
| Harbour Districts | 890 | 169,177 | 1,830 | 1,880 | 258,463 |
| Hospital and Charitable Aid Districts | 2,086 | 141,604 | 48 | 72 | 4,235 |
| Totals | 10,413 | 1,420,128 | 6,608 | 5,535 | 712,839 |
Of those shown as permanent employees, 519 were officers whose full time was not devoted to the service of the local authority, the number of full-time permanent employees being thus 9,894.
In preparing a summary covering all employees of the State and of local bodies various points mentioned above have to be taken into account. There is little difficulty in arriving at an approximately correct total of permanent employees, excluding the military side of the Defence Department; similarly, a total of temporary employees can be given, excluding those of the Railway Department and Education Boards. Again, information concerning salaries and wages of the principal classes of public and semi-public servants is obtainable, but there are a few minor cases where this is lacking, and there is nothing to show definitely how much of the wages-sheet of the Railway Department is on account of casual and temporary employees.
Taking permanent hands first, and omitting all part-time officers, the number as at the 31st March, 1915, excluding military employees of the Defence Department, is found to have been 43,195, made up as follows: —
| Number of Officers. | |
|---|---|
| Public Service Departments under Commissioner | 11,904 |
| Railway Department | 14,614 |
| Police Force | 941 |
| Legislative Departments | 78 |
| Judges and Magistrates | 37 |
| Others not under Commissioner (say) | 100 |
| 27,674 | |
| Education Boards | 5,627 |
| Local authorities | 9,894 |
| Total | 43,195 |
Temporary and casual employees, excluding the Railway Department and Education Boards, numbered 14,524, this number consisting of the following:—
| Number. | |
|---|---|
| Public Service Departments under Commissioner | 1,573 |
| Government Printing Office | 235 |
| Public Works Department— | |
| Day labourers | 2,689 |
| Co-operative labourers | 3,419 |
| 7,916 | |
| Local authorities | 6,608 |
| Total | 14,524 |
The average number of temporary and casual employees for the year 1914–15 was 11,988. If temporary employees of the Railway Department and of Education Boards, military employees of the Defence Department, and part-time officers of the State and of local bodies be taken as approximately totalling 2,000, the total persons drawing salary or wages as employees of the general and local governments is found to be nearly 60,000, or one-eighth of the total breadwinners in the country.
The total expenditure of the State and local bodies on salaries and wages for the year 1914–15 may be set down at the huge total of eight millions sterling. The exact amount cannot be given for reasons stated above, but this total is approximately correct, and is made up as follows:—
| Public Service (under Commissioner):— | £ |
|---|---|
| Permanent employees | 1,980,052 |
| ” (48 with salaries not shown) | 4,800 |
| Temporary employees | 169,452 |
| Railway Departments | 1,959,487 |
| Police Force | 176,060 |
| Public Works—Temporary employees | 330,767 |
| ” Co-operative employees | 334,888 |
| Government Printing Office — Temporary employees | 20,237 |
| Permanent officers of Parliament, &c. | 20,878 |
| Casual officers of Parliament (say) | 8,000 |
| Judges | 14,433 |
| Magistrates (say) | 17,000 |
| Other permanent employees (say) | 20,000 |
| Part-time employees (say) | 25,000 |
| Total for Public Service | 5,081,054 |
| Education Boards | 786,254 |
| Local bodies | 2,132,967 |
| Total | £8,000,275 |
Table of Contents
MOST of the statistical information given elsewhere in this book relates only to the three principal islands of the Dominion, with their adjacent islands and islets. There are, however, a number of outlying islands included within the boundaries of the Dominion, and brief descriptions of these are now given.
The outlying group of the CHATHAM ISLANDS, lying between the parallels of 43° 30′ and 44° 30′ south latitude, and the meridians of 175° 40′ and 177° 15′ west longitude, 480 statute miles east-south-east from Wellington, and 536 miles eastward of Lyttelton, consists of two principal islands and several unimportant islets. They were discovered by Lieutenant Broughton and named by him in honour of the Earl of Chatham. The largest island (Chatham Island) contains about 222,490 acres, of which an irregularly-shaped lake or lagoon absorbs 45,960 acres. About one-quarter of the surface of the land is covered with forest, the rest with fern or grass. The hills nowhere rise to a great height. Pitt Island is the next in size; the area is 15,330 acres. The greater portion of both islands is used for grazing sheep.
The KERMADEC GROUP of islands is situated between 29° 10′ and 31° 30′ south latitude, and between 177° 45′ and 179° west longitude. They are named the Raoul or Sunday Island, Macaulay Island, Curtis Islands, and L'Espérance or French Rock. The principal island, Sunday, is 600 miles distant from Auckland, and lies a little more than half-way to Tonga, but 100 miles to the eastward of the direct steam route to that place. It is 300 miles eastward of the steam route to Fiji, and 150 miles westward of the steam route from Auckland to Rarotonga. Macaulay Island (named after the father of Lord Macaulay) and Curtis Islands were discovered in May, 1788, by Lieutenant Watts, in the “Penrhyn,” a transport ship. The remainder of the group was discovered in 1793, by Admiral Bruni d'Entrecasteaux. The Admiral gave the name of “Kermadec” to the whole group of islands, after the captain of his consort ship “ L'Espérance.” and the name of the Admiral's ship “La Recherche” was given to the largest island. The same so given was not continued, but that of “Raoul” has taken its place, which would appear to have been given after the sailing master of the “La Recherche,” whose name was Joseph Raoul. The name of “Sunday” may also have become attached to the island from the fact that it was discovered on a Sunday. The islands are volcanic, and in two of them signs of activity are still to be seen. The rainfall is plentiful, but not excessive. The climate is mild and equable, and slightly warmer than the north of New Zealand. The following are the areas of the islands and islets of the group: Sunday Island, 7,200 acres; Herald group of islets, 85 acres; Macaulay Island, 764 acres; Curtis Islands, 128 acres and 19 acres; L'Espérance, 12 acres: total, 8,208 acres. Sunday Island is twenty miles in circumference, roughly triangular in shape, and at the highest point 1,723 ft. above the sea-level. It is rugged and broken over a very large extent of its surface, and, except in a few places, covered with forest. The soil everywhere on the island is very rich, being formed by the decomposition of a dark-coloured pumiceous tuff and a black andesitic lava, with which is closely mixed a fine vegetable mould. The great luxuriance and richness of the vegetation bear witness to the excellence of the soil, which is everywhere—except where destroyed by eruptions, and on the steep cliffs—the same rich loam. Want of water is one of the drawbacks. Three of the four lakes on the island are fresh, but so difficult of approach as to be practically useless.
The AUCKLAND ISLANDS were discovered during a whaling voyage on 18th August, 1806, by Captain Abraham Bristow, in the ship “Ocean.” The discoverer named the group after Lord Auckland, again visited the islands in 1807, and then took formal possession of them. They lie about 290 miles south of Bluff Harbour, their accepted position being given as latitude 50° 32′ south, and longitude 166° 13′ east. They have several good harbours. Port Ross, at the north end of the principal island, was described by the eminent French commander D'Urville as one of the best harbours of refuge in the known world. At the southern end of the island there is a through passage extending from the east to the west coast. It has boon variously named Adams Strait and Carnley Harbour, and forms a splendid sheet of water. The largest of the islands is about 27 miles long by about 15 miles broad, and is very mountainous, the highest part being about 2,000 ft. above the sea. The west coast is bold and precipitous, but the east coast has several inlets. The wood on the island is, owing to the strong prevailing wind, scrubby in character. The New Zealand Government maintains at this island a depot of provisions and clothing for the use of shipwrecked mariners.
The ANTIPODES, an isolated group, consisting of several detached rocky islands lying nearly north and south over a space of four to five miles; accepted position, 49° 41′ 15′ south, and longitude 178° 43′ east.
The BOUNTY ISLANDS, a little cluster of islets, thirteen in number and without verdure, discovered in 1788 by Captain Bligh, R.N., of H.M.S. “Bounty.” Position verified by observation, 47° 43′ south, longitude 179° 0½′ east.
CAMPBELL ISLAND was discovered in 1810 by Frederick Hazel burgh, master of the brig “Perseverance,” owned by Mr. Robert Campbell, of Sydney. It is mountainous, and of a circumference of about thirty miles. There are several good harbours.
The COOK ISLANDS, with others now included within the extended boundaries of the Dominion, are as under:—
RAROTONGA: A magnificent island, rising to a height of 3,000 ft., clothed to the tops of the mountains with splendid vegetation. It has abundant streams, considerable tracts of sloping land, and rich alluvial valleys. The two harbours are poor.
MANGAIA, the south-easternmost of the Cook Group, is of volcanic origin, and about thirty miles in circumference. The productions, which are numerous and cheap, are obtained by assiduous labour.
ATIU resembles Mangaia in appearance and extent. It is a mere bank of coral, 10 ft. or 12 ft. high, steep and rugged, except where there are small sandy beaches and some clefts, where the ascent is gradual.
AITUTAKI presents a most fruitful appearance, its shores being bordered by flat land, on which are innumerable coconut and other trees, the higher ground being beautifully interspersed with lawns. It is eighteen miles in circuit.
MAUKE or Parry Island is a low-lying island; it is about two miles in diameter; well wooded, and inhabited.
MITIARO is a low-lying island, from three to four miles long and one mile wide.
HERVEY ISLANDS: This group consists of two islands, surrounded by a reef, which may be 10½ miles in circumference.
NIUE, or Savage Island, lying east of the Friendly Islands, is a coral island, thirty-six miles in circumference, rising to a height of 200 ft. It has the usual tropical productions.
PALMERSTON ISLAND, lying about 500 miles east of Niue and about 220 from the nearest island of the Cook Group (Aitutaki), is remarkable as the “San Pablo” of Magellan, the first island discovered in the South Sea. It has no harbour. The soil is fairly fertile, and there is some good hardwood timber.
PENRHYN ISLAND (Tongareva) lies about 300 miles north-east of Manahiki: It is one of the most famous pearl islands in the Pacific, and there is a splendid harbour, a lagoon with two entrances, fit for ships of any size.
MANAHIKI, lying about 400 miles eastward of Danger Island, is an atoll, about thirty miles in circumference, valuable from the extent of the coconut groves. The interior lagoon contains a vast deposit of pearl-shell.
RAKAANGA is an atoll, three miles in length and of equal breadth.
DANGER ISLAND (Pukapuka): Next to the 10th parallel, but rather north of the latitude of the Navigators, and east of them are a number of small atolls. Of these, the nearest to the Samoan Group—about 500 miles—is Danger Island, bearing north-west of Suwarrow about 250 miles.
SUWARROW ISLAND has one of the best harbours in the Pacific. It lies about 500 miles east of Apia, the capital of the Samoan Group. It is a coral atoll, of a triangular form, fifty miles in circumference, the reef having an average width of half a mile across, enclosing a land-locked lagoon twelve miles by eight, which forms an excellent harbour. The entrance is half a mile wide, and the accommodation permits of ships riding in safety in all weathers, with depths of from three to thirty fathoms. It is out of the track of hurricanes, uninhabited, but capable by its fertility of supporting a small population. As a depot for the collection of trade from the various islands it should in time be very valuable.
ISLANDS ANNEXED IN 1901.
The Pacific islands annexed to New Zealand in pursuance of resolutions passed by the House of Representatives in September and October, 1900, were Rarotonga, Mangaia, Mauke, Atiu, Aitutaki, Mitiaro, Hervey Islands, Palmerston, Niue, Danger, Rakaanga, Manahiki, Penrhyn, and Suwarrow (see above); Takutea and Nassau, not mentioned in the resolutions, also lie within the boundary-lines prescribed by the Imperial Order in Council and the New Zealand Proclamation dealing with the annexation.
The Constitution and laws of the Cook Islands and Niue have been remodelled by the Cook Islands Act of 1915.
The system of government prior to annexation consisted of various Arikis' Courts and Native Councils, loosely united by a Federal Parliament. Acts passed in 1901 and 1904 changed the names to “Federal Council” and “Island Councils.” The Arikis' Courts in all islands in which there was a European Resident Agent were abolished, and the constitution of the Island Councils altered, the Resident Agent and Arikis being ex officio members while the remainder of the nine were elected by the adult Natives.
The Act of 1915 establishes the office of Secretary for the Cook Islands. Subject to the control of the Minister, this officer is to be responsible for the administration of the islands.
Island Councils are to be continued or established, as the case may be, in Rarotonga, Niue, or any of the Cook Islands which the Governor in Council decides upon. These Councils may consist cither wholly or partly of ex officio, elected, or nominated members. The number of members, their qualifications, tenure of office, and remuneration are subject to alteration at any time by regulations made by the Governor in Council. Generally European officials and Arikis or Native chiefs will be Councillors ex officio, and nominated members will hold office during the pleasure of the Governor or for a fixed period not exceeding five years. Women are eligible both as members and as electors of Island Councils.
Each Council is empowered to make laws for the good government of the island, with the proviso that such laws must not be repugnant to Acts or regulations made thereunder of the New Zealand Parliament. The maximum penalties imposed by the Ordinance of an Island Council must not exceed three months' imprisonment or a fine of £50. The Council has no power to deal with Customs duties, to borrow money, to establish Courts of Justice, or to appropriate expenditure of revenue other than that raised under authority of their Ordinance. No Ordinance has effect until it has received the assent of the Resident Commissioner or the Governor. The Governor may, by notice in the Gazette, disallow any Ordinance within one year after the Commissioner has given his assent.
Laws are enforced through the High Court, which has all jurisdiction, civil or criminal, necessary for the administration of justice. Judges and Commissioners of the High Court are appointed by the Governor; the Chief Judge to reside at Rarotonga, a second at Niue. A Commissioner may, with some exceptions, exorcise the full powers and functions of a Judge, but rules of Court may allow appeal from his decision to that of a Judge.
A judgment obtained in a civil proceeding in the High Court may be enforced in the Supreme Court of New Zealand. From any decision in the former Court an appeal lies to the Supreme Court in the Dominion.
The manufacture or importation of intoxicating liquor is prohibited absolutely, except that the Resident Commissioner may import liquor for sale or for public purposes. Liquor imported through the Commissioner must not find its way into the hands of a Native. Attempts are made by the Natives to evade the law by illicitly manufacturing “bush beer,” some twenty persons being charged with such in the High Court during 1914, as compared with sixty-five in the previous year.
At the census of 1911 the population of the Cook and other islands annexed in 1901 was found to be 12,598. Fuller information is given on page 123 of this book.
The educational requirements of the islands up to the present time have been largely met by missionary effort. The London Missionary Society has a number of village schools in the various islands, while the Roman Catholic Mission and the Seventh-day Adventists are also maintaining schools, though to a less extent.
The education provided in this manner is necessarily inadequate, and a system is being inaugurated by which schools will be established on the lines of the Native schools in New Zealand.
In Niue the Tufu School has been established for some time. At this institution the New Zealand syllabus has been adopted with gratifying results. The school is for boys only, boarding-accommodation being provided for the pupils. Special interest is shown in the technical branch, and additional technical classes are given after school hours. The leading pupils are being trained with a view to taking charge of the village schools which it is hoped may soon be established at Avatele and other districts of Niue.
The Araura School at Aitutaki, hitherto carried on as a boarding-school by the London Missionary Society, assisted by contributions from the parents of the pupils, has been taken over by the Education Department. The average number of pupils in this institution, which provides a more advanced teaching than the village schools, is ninety-five.
Means have been provided by the New Zealand Government for starting three schools at Rarotonga. Two of these have already been opened, one at Arorangi and the second at Ngatangiia.
The Natives throughout the group are enthusiastic on the question of obtaining education for their children, and give the authorities every assistance within their means. The average attendance at the schools already established is very good, that of the Tufu School being 90.2 per cent. The devastation of plantations by the hurricane in January, 1914, and the impoverished condition of the Natives consequent thereon reflected seriously upon the attendance of pupils.
Various restrictions are placed on the alienation of land by Natives. They may not alienate their holdings by way of freehold or by way of security, nor may customary land be dealt with in any such manner. No will of any Native is of effect as regards his interest in land, nor may a lease be granted for a term of more than sixty years.
Considerable areas have been leased, especially in Rarotonga, to European settlers. It is recognized that the prosperity of the islands depends in great measure upon the settlement of the spare lands by a good class of white planters. It is hoped that before long additional areas in many islands will be available.
Difficulties have been experienced in obtaining leases from the Natives, largely owing to the insecurity of title. The old Land Titles Court has now been replaced by a Native Land Court, whose functions are to deal with the titles, partitioning, succession, and numerous other matters affecting land. The irregularity in sitting of the former Court caused great inconvenience; in hundreds of cases progress was at a standstill until titles could be properly investigated.
An important obstacle in the path of Native settlement of the land is the lack of roads. Much of the accessible banana land is being worked out, but the Natives are reluctant to move further inland to the richer soils owing to greater difficulty in transport.
Any person desirous of settling in the islands should have a capital equal to at least £10 for each acre he purposes taking up. The coconut-palm takes from eight to ten years to reach bearing-point, and during that time the planter must maintain himself by growing bananas or securing some outside employment. When the palms are in full bearing, however, the annual value of the crop may be estimated at not less than £6 per acre, and this may be regarded as a practically assured income for sixty years or more.
Cook and Northern Islands.—For the financial year ended the 31st March, 1915, the revenue of the Cook Islands, not including the balance from the previous year, was £10,118, and the expenditure £10,617. There is now a credit balance of £3,092. The following is a comparative statement of revenue and expenditure for the past ten years:—
| Year. | Revenue. | Expenditure. | ||||
|---|---|---|---|---|---|---|
| £ | s. | d. | £ | s. | d. | |
| 1905—6 | 7,157 | 1 | 0 | 5,455 | 10 | 11 |
| 1906—7 | 5,046 | 14 | 11 | 6,416 | 6 | 6 |
| 1907—8 | 6,349 | 6 | 1 | 6,189 | 14 | 1 |
| 1908—9 | 7,146 | 9 | 1 | 5,718 | 3 | 7 |
| 1909—10 | 7,655 | 12 | 8 | 8,230 | 2 | 11 |
| 1910—11 | 8,267 | 0 | 0 | 8,047 | 0 | 0 |
| 1911—12 | 8,923 | 18 | 11 | 9,430 | 2 | 8 |
| 1912—13 | 9,420 | 0 | 0 | 11,508 | 4 | 0 |
| 1913—14 | 11,722 | 18 | 5 | 10,194 | 2 | 0 |
| 1914—15 | 10,117 | 15 | 3 | 10,617 | 2 | 6 |
| Niue.—The revenue of Niue for the year ended the 31st March, 1915 (excluding balance from previous year), was £1,957 13s. 8d., and the expenditure £2,323 8s. 6d, The total funds to the credit of the Niue Government on the 31st March amounted to £907 1s. 4d. | ||||||
Cook and Northern Islands.—The value of exports for the year 1914, excluding specie (£8,642), was £68,870; while the imports, excluding specie (£6,400), amounted to £84,732. The principal items exported were as follows:—
| £ | |
|---|---|
| Bananas, 85,184 cases, 1,348 bunches | 28,939 |
| Coconuts, 651,600 number | 2,779 |
| Coffee, 31,600 lb. | 877 |
| Copra, 922 tons | 14,630 |
| Oranges, 114,336 cases | 18,579 |
| Pearl-shell, 27 tons | 1,350 |
| Pineapples, 3,691 cases | 460 |
| Tomatoes, 1,201 boxes | 600 |
The following shows the countries to which the exports were sent:—
| £ | |
|---|---|
| New Zealand | 60,820 |
| United Kingdom | 8,875 |
| United States of America | 7,495 |
| Tahiti | 307 |
| Niue | 15 |
| Total | 77,512 |
he amount of the imports is made up as follows:—
| Imports from— | £ |
|---|---|
| New Zealand | 64,852 |
| United Kingdom | 10,994 |
| United States | 10,586 |
| Australia | 1,976 |
| Tahiti | 1,490 |
| Canada | 721 |
| Japan | 245 |
| Sweden | 157 |
| Germany | 65 |
| France | 43 |
| Fiji | 2 |
| South Africa | 1 |
| Total | £91,132 |
Niue.—The exports for 1914 amounted to £9,503, to which total goods re-exported contributed £347, and the imports (excluding specie, £1,400) to £9,800, the principal items of export wore,—
| £ | |
|---|---|
| Copra, 394¾ tons | 6,982 |
| Hats, 3,272 dozen | 2,023 |
The exports were shipped to the following countries:—
| £ | |
|---|---|
| New Zealand | 9,256 |
| American Samoa | 155 |
| Australia | 92 |
| Total | £9,503 |
The imports represented (excluding specie, £1,400)—
| Imports from— | £ |
|---|---|
| New Zealand | 8,867 |
| Australia | 815 |
| United Kingdom | 408 |
| Maiden Island | 104 |
| Germany | 26 |
| United States | 25 |
| Cook Islands | 23 |
| German Samoa | 19 |
| Fiji | 13 |
| Total | £9,800 |
Table of Contents
| Year. | Population (exclusive of Maoris and for Annexed Pacific Islands) on 31st December. | Births. | Deaths. | Marriages. | ||
|---|---|---|---|---|---|---|
| Males. | Females. | Totals. | ||||
| 1865 | 117,376 | 73,231 | 190,607 | 7,490 | 2,757 | 1,908 |
| 1866 | 125,080 | 79,034 | 204,114 | 8,466 | 2,540 | 2,038 |
| 1867 | 131,929 | 86,739 | 218,668 | 8,918 | 2,702 | 2,050 |
| 1868 | 134,621 | 91,997 | 226,618 | 9,391 | 2,662 | 2,085 |
| 1860 | 140,112 | 97,137 | 237,249 | 9,718 | 2,721 | 1,931 |
| 1870 | 145,732 | 102,668 | 248,400 | 10,277 | 2,703 | 1,851 |
| 1871 | 156,431 | 110,555 | 266,986 | 10,592 | 2,642 | 1,864 |
| 1872 | 162,404 | 117,156 | 279,560 | 10,795 | 3,192 | 1,873 |
| 1873 | 170,406 | 125,540 | 295,946 | 11,222 | 3,645 | 2,276 |
| 1874 | 194,349 | 147,511 | 341,860 | 12,844 | 4,161 | 2,828 |
| 1875 | 213,294 | 162,562 | 375,856 | 14,438 | 5,712 | 3,209 |
| 1876 | 225,580 | 173,495 | 399,075 | 16,168 | 4,904 | 3,196 |
| 1877 | 227,681 | 180,937 | 408,618 | 16,856 | 4,685 | 3,114 |
| 1878 | 240,627 | 191,892 | 432,519 | 17,770 | 4,645 | 3,377 |
| 1879 | 257,894 | 205,835 | 463,729 | 18,070 | 5,583 | 3,352 |
| 1880 | 268,364 | 216,500 | 484,864 | 19,341 | 5,437 | 3,181 |
| 1881 | 274,986 | 225,924 | 500,910 | 18,732 | 5,491 | 3,277 |
| 1882 | 283,303 | 234,404 | 517,707 | 19,009 | 5,701 | 3,600 |
| 1883 | 294,665 | 246,212 | 540,877 | 19,202 | 6,061 | 3,612 |
| 1884 | 306,667 | 257,637 | 564,304 | 19,846 | 5,740 | 3,800 |
| 1885 | 312,125 | 263,101 | 575,226 | 19,693 | 6,081 | 3,813 |
| 1886 | 317,646 | 271,740 | 589,386 | 19,299 | 6,135 | 3,488 |
| 1887 | 324,558 | 278,803 | 603,361 | 19,135 | 6,137 | 3,563 |
| 1888 | 324,948 | 282,432 | 607,380 | 18,902 | 5,708 | 3,617 |
| 1889 | 328,588 | 287,464 | 616,052 | 18,457 | 5,772 | 3,632 |
| 1890 | 332,557 | 292,951 | 625,508 | 18,278 | 5,994 | 3,797 |
| 1891 | 336,174 | 297,884 | 634,058 | 18,273 | 6,518 | 3,805 |
| 1892 | 345,146 | 305,287 | 650,433 | 17,876 | 6,459 | 4,002 |
| 1893 | 357,635 | 314,630 | 672,265 | 18,187 | 6,767 | 4,115 |
| 1894 | 363,763 | 322,365 | 686,128 | 18,528 | 6,918 | 4,178 |
| 1895 | 369,725 | 328,981 | 698,706 | 18,546 | 6,863 | 4,110 |
| 1896 | 376,987 | 337,175 | 714,162 | 18,612 | 6,432 | 4,843 |
| 1897 | 384,703 | 344,353 | 729,056 | 18,737 | 6,595 | 4,928 |
| 1898 | 392,124 | 351,339 | 743,463 | 18,955 | 7,244 | 5,091 |
| 1899 | 398,679 | 357,826 | 756,505 | 18,835 | 7,680 | 5,461 |
| 1900 | 403,628 | 364,650 | 768,278 | 19,546 | 7,200 | 5,860 |
| 1901 | 414,223 | 373,434 | 787,657 | 20,491 | 7,634 | 6,095 |
| 1902 | 425,908 | 382,021 | 807,929 | 20,655 | 8,375 | 6,394 |
| 1903 | 439,674 | 392,831 | 832,505 | 21,829 | 8,528 | 6,748 |
| 1904 | 453,992 | 403,547 | 857,539 | 22,766 | 8,087 | 6,983 |
| 1905 | 467,366 | 415,096 | 882,462 | 23,682 | 8,061 | 7,200 |
| 1906 | 481,651 | 427,075 | 908,726 | 24,252 | 8,339 | 7,592 |
| 1907 | 492,649 | 436,835 | 929,484 | 25,094 | 10,066 | 8,192 |
| 1908 | 510,329 | 450,313 | 960,662 | 25,940 | 9,043 | 8,339 |
| 1909 | 520,406 | 462,520 | 982,926 | 26,524 | 8,959 | 8,094 |
| 1910 | 529,928 | 472,751 | 1,002,679 | 25,984 | 9,639 | 8,236 |
| 1911 | 539,729 | 485,677 | 1,025,406 | 26,354 | 9,534 | 8,825 |
| 1912 | 553,212 | 499,415 | 1,052,627 | 27,508 | 9,214 | 9,149 |
| 1913 | 569,109 | 515,553 | 1,084,662 | 27,935 | 10,119 | 8,813 |
| 1914 | 568,161 | 527,833 | 1,095,994 | 28,338 | 10,148 | 9,280 |
| NOTE.—Maori population excluded from above was 49,844 in 1911, and that of Cook and other Islands 12,598 persons. | ||||||
| II.—PRODUCTION. | |||||||
|---|---|---|---|---|---|---|---|
| Year. | Occupied and Cultivated Holdings over One Acre in Extent. | Land (including Sown Grasses) under Cultivation. | Live-stock. | Coal-mines, Output from. | |||
| Horses. | Horned Cattle. | Sheep. | Pigs. | ||||
| Number. | Acres. | Tons. | |||||
| 1865 | .. | .. | .. | .. | .. | .. | Prior to 1878, 709,931 |
| 1866 | .. | .. | .. | .. | .. | .. | |
| 1867 | .. | 676,909 | 65,715 | 312,835 | 8,418,579 | 115,104 | |
| 1868 | .. | .. | .. | .. | .. | .. | |
| 1869 | 11,932 | 783,435 | .. | .. | .. | .. | |
| 1870 | 13,476 | 997,477 | .. | .. | .. | .. | |
| 1871 | 10,211 | 1,140,279 | 81,028 | 436,592 | 9,700,629 | 151,460 | |
| 1872 | 14,874 | 1,226,222 | .. | .. | .. | .. | |
| 1873 | 15,304 | 1,416,933 | .. | .. | .. | .. | |
| 1874 | 15,883 | 1,651,712 | 99,859 | 494,917 | 11,704,853 | 123,921 | |
| 1875 | 16,092 | 1,943,653 | .. | .. | .. | .. | |
| 1876 | 17,250 | 2,377,402 | .. | .. | .. | .. | |
| 1877 | 18,750 | 2,940,711 | .. | .. | .. | .. | |
| 1878 | 20,519 | 3,523,277 | 137,768 | 578,430 | 13,069,338 | 207,337 | 162,218 |
| 1879 | 21,054 | 3,982,866 | .. | .. | .. | .. | 231,218 |
| 1880 | 23,129 | 4,506,889 | .. | .. | .. | .. | 299,923 |
| 1881 | 24,147 | 4,768,192 | 161,736 | 698,637 | 12,985,085 | 200,083 | 337,262 |
| 1882 | 26,298 | 5,189,104 | .. | .. | .. | .. | 378,272 |
| 1883 | 27,352 | 5,651,255 | .. | .. | .. | .. | 421,764 |
| 1884 | 28,587 | 6,072,949 | .. | .. | .. | .. | 480,831 |
| 1885 | 29,814 | 6,550,399 | .. | .. | .. | .. | 511,063 |
| 1886 | 31,763 | 6,668,920 | 187,382 | 853,358 | 16,564,595 | 277,901 | 534,353 |
| 1887 | 33,332 | 6,845,177 | .. | .. | .. | .. | 558,620 |
| 1888 | 34,743 | 7,284,752 | .. | .. | .. | .. | 613,895 |
| 1889 | 35,747 | 7,670,167 | .. | .. | .. | .. | 586,445 |
| 1890 | 38,178 | 8,015,426 | .. | .. | .. | .. | 637,397 |
| 1891 | 38,083 | 8,462,495 | 211,040 | 788,919 | 17,865,423 | 222,553 | 668,794 |
| 1892 | 41,224 | 8,893,225 | .. | .. | 18,570,752 | .. | 673,315 |
| 1893 | 42,768 | 9,713,745 | .. | .. | 19,380,369 | .. | 691,548 |
| 1894 | 45,290 | 10,063,051 | .. | 885,305 | 20,230,829 | .. | 719,546 |
| 1895 | 46,676 | 10,128,076 | .. | 964,034 | 19,826,604 | .. | 726,654 |
| 1896 | .. | 10,698,869 | 237,418 | 1,047,901 | 19,138,493 | 239,776 | 792,851 |
| 1897 | 58,940 | 11,550,075 | 249,813 | 1,138,067 | 19,687,954 | 209,834 | 840,713 |
| 1898 | 60,759 | 11,444,563 | 252,834 | 1,209,165 | 19,673,725 | 186,027 | 907,033 |
| 1899 | 61,639 | 11,984,606 | 258,115 | 1,203,024 | 19,348,506 | 193,512 | 975,234 |
| 1900 | 62,485 | 12,474,511 | 261,931 | 1,222,130 | 19,355,195 | 249,751 | 1,093,990 |
| 1901 | 62,786 | 12,636,035 | 266,245 | 1,256,680 | 20,233,099 | 250,975 | 1,227,638 |
| 1902 | 63,982 | 13,083,971 | 279,672 | 1,361,784 | 20,342,727 | 224,024 | 1,362,702 |
| 1903 | 65,034 | 13,357,700 | 286,955 | 1,460,663 | 18,954,553 | 193,740 | 1,420,193 |
| 1904 | 66,092 | 13,504,004 | 298,714 | 1,593,547 | 18,280,806 | 226,591 | 1,537,838 |
| 1905 | 68,680 | 13,868,074 | 314,322 | 1,736,850 | 19,130,875 | 255,320 | 1,585,756 |
| 1906 | 69,942 | 14,114,925 | 326,537 | 1,810,936 | 20,108,471 | 249,727 | 1,729,536 |
| 1907 | 72,338 | 14,382,787 | 342,608 | 1,951,750 | 20,983,772 | 242,273 | 1,831,009 |
| 1908 | 73,367 | 14,884,617 | 352,832 | 1,816,299 | 22,449,053 | 241,128 | 1,860,975 |
| 1909 | 75,152 | 15,566,308 | 363,259 | 1,873,326 | 23,480,707 | 245,092 | 1,911,247 |
| 1910 | .. | .. | .. | .. | 24,269,620 | .. | 2,197,362 |
| 1911 | 75,876 | 16,154,218 | 404,284 | 2,020,171 | 23,996,126 | 348,754 | 2,066,073 |
| 1912 | .. | .. | .. | .. | 23,750,153 | .. | 2,177,615 |
| 1913 | .. | .. | .. | .. | 24,191,810 | .. | 1,888,005 |
| 1914 | .. | .. | .. | .. | 24,798,763 | .. | 2,275,593 |
III.—TRADE
| Exports (the Produce of New Zealand). | ||||||
|---|---|---|---|---|---|---|
| Year. | Wool. | Grain. | Frozen Meat. | |||
| Quantity. | Value. | Quantity. | Value. | Quantity. | Value. | |
| lb. | £ | Bushels. | £ | Cwt | £ | |
| 1865 | 19,180,500 | 1,141,761 | 25,447 | 6,076 | .. | .. |
| 1866 | 22,810,776 | 1,354,152 | 32,610 | 7,297 | .. | .. |
| 1867 | 27,152,966 | 1,580,608 | 158,811 | 26,986 | .. | .. |
| 1868 | 28,875,163 | 1,516,548 | 632,556 | 114,125 | .. | .. |
| 1869 | 27,765,636 | 1,371,230 | 520,556 | 96,441 | .. | .. |
| 1870 | 37,039,763 | 1,703,944 | 854,399 | 141,135 | .. | .. |
| 1871 | 37,793,734 | 1,606,144 | 1,032,902 | 164,087 | .. | .. |
| 1872 | 41,886,997 | 2,537,919 | 1,058,480 | 178,886 | .. | .. |
| 1873 | 41,535,185 | 2,702,471 | 598,431 | 136,832 | .. | .. |
| 1874 | 46,848,735 | 2,834,695 | 1,162,782 | 291,103 | .. | .. |
| 1875 | 54,401,540 | 3,398,155 | 1,276,927 | 231,417 | .. | .. |
| 1876 | 59,853,454 | 3,395,816 | 2,172,098 | 337,878 | .. | .. |
| 1877 | 64,481,324 | 3,658,938 | 1,323,910 | 276,452 | .. | .. |
| 1878 | 59,270,256 | 3,292,807 | 2,112,214 | 508,767 | .. | .. |
| 1879 | 62,220,810 | 3,126,439 | 3,470,344 | 660,557 | .. | .. |
| 1880 | 66,860,150 | 3,169,300 | 5,540,445 | 898,997 | .. | .. |
| 1881 | 59,415,940 | 2,909,760 | 5,815,960 | 986,072 | .. | .. |
| 1882 | 65,322,707 | 3,118,554 | 4,310,984 | 907,961 | 15,244 | 19,339 |
| 1883 | 68,149,430 | 3,014,211 | 6,723,303 | 1,286,724 | 87,975 | 118,328 |
| 1884 | 81,139,028 | 3,267,527 | 5,489,635 | 766,824 | 254,069 | 345,090 |
| 1885 | 86,507,431 | 3,205,275 | 4,597,645 | 513,697 | 296,473 | 373,857 |
| 1886 | 90,853,744 | 3,072,971 | 3,523,324 | 463,549 | 346,055 | 427,193 |
| 1887 | 88,824,382 | 3,321,074 | 4,126,836 | 443,780 | 402,107 | 455,870 |
| 1888 | 83,225,733 | 3,115,008 | 5,101,167 | 662,859 | 552,298 | 628,800 |
| 1889 | 102,227,354 | 3,976,375 | 6,120,202 | 985,224 | 656,822 | 783,371 |
| 1890 | 102,817,077 | 4,150,599 | 8,287,024 | 1,030,415 | 898,894 | 1,087,617 |
| 1891 | 106,187,114 | 4,129,686 | 5,877,059 | 676,338 | 1,000,307 | 1,194,724 |
| 1892 | 118,180,912 | 4,313,307 | 6,625,525 | 816,272 | 869,600 | 1,033,377 |
| 1893 | 109,710,684 | 3,774,738 | 4,855,368 | 583,397 | 903,836 | 1,085,167 |
| 1894 | 144,295,154 | 4,827,016 | 2,434,295 | 226,183 | 1,025,243 | 1,194,545 |
| 1895 | 116,015,170 | 3,662,131 | 2,381,837 | 215,783 | 1,134,097 | 1,262,711 |
| 1896 | 129,151,624 | 4,391,848 | 2,941,821 | 346,197 | 1,103,362 | 1,251,993 |
| 1897 | 135,835,117 | 4,443,144 | 1,919,887 | 235,429 | 1,407,921 | 1,566,286 |
| 1898 | 149,385,815 | 4,645,804 | 1,045,980 | 136,120 | 1,551,773 | 1,698,750 |
| 1899 | 147,169,497 | 4,324,627 | 6,985,999 | 721,817 | 1,865,827 | 2,088,856 |
| 1900 | 140,706,486 | 4,749,196 | 9,529,847 | 1,034,014 | 1,844,831 | 2,123,881 |
| 1901 | 146,820,079 | 3,699,103 | 13,373,515 | 1,285,811 | 1,857,547 | 2,253,262 |
| 1902 | 160,419,023 | 3,354,563 | 5,865,562 | 786,548 | 2,138,557 | 2,718,763 |
| 1903 | 155,128,381 | 4,041,274 | 5,362,748 | 533,865 | 2,378,650 | 3,197,043 |
| 1904 | 144,647,376 | 4,673,826 | 3,775,978 | 392,346 | 1,912,979 | 2,793,599 |
| 1905 | 139,912,737 | 5,381,333 | 2,282,853 | 294,574 | 1,690,684 | 2,694,432 |
| 1906 | 154,384,568 | 6,765,655 | 1,006,825 | 139,474 | 2,025,507 | 2,877,031 |
| 1907 | 171,635,595 | 7,657,278 | 229,593 | 53,205 | 2,354,808 | 3,420,664 |
| 1908 | 162,518,481 | 5,332,781 | 1,114,332 | 143,223 | 2,120,303 | 3,188,515 |
| 1909 | 189,683,703 | 6,305,888 | 6,951,926 | 823,149 | 2,572,604 | 3,601,093 |
| 1910 | 204,368,957 | 8,308,410 | 1,985,616 | 319,073 | 2,654,196 | 3,850,777 |
| 1911 | 169,424,811 | 6,491,707 | 1,763,509 | 330,186 | 2,250,565 | 3,503,406 |
| 1912 | 188,361,790 | 7,105,483 | 5,326,963 | 741,600 | 2,573,238 | 3,909,569 |
| 1913 | 186,533,036 | 8,057,620 | 650,790 | 131,203 | 2,578,693 | 4,449,933 |
| 1914 | 220,472,898 | 9,318,114 | 1,701,674 | 269,975 | 3,229,969 | 5,863,062 |
| Year. | Butter. | Cheese. | Phormium Fibre. | |||
|---|---|---|---|---|---|---|
| Quantity. | Value. | Quantity. | Value. | Quantity. | Value. | |
*Not recorded separately. | ||||||
| Cwt. | £ | Cwt. | £ | Tons. | £ | |
| 1865 | * | * | * | * | 3 | 75 |
| 1866 | 232 | 1,590 | 13 | 65 | 45 | 996 |
| 1867 | 38 | 192 | 90 | 362 | 126 | 4,256 |
| 1868 | 138 | 532 | 335 | 1,240 | 534 | 8,137 |
| 1869 | 2,705 | 14,679 | 2,331 | 8,040 | 2,028 | 45,245 |
| 1870 | 3,435 | 12,995 | 2,735 | 9,327 | 5,471 | 132,578 |
| 1871 | 4,342 | 12,426 | 1,619 | 4,023 | 4,248 | 90,611 |
| 1872 | 1,629 | 4,462 | 1,362 | 4,379 | 3,985 | 99,405 |
| 1873 | 722 | 2,342 | 1,993 | 6,625 | 6,454 | 143,799 |
| 1874 | 357 | 1,168 | 1,326 | 4,408 | 2,038 | 37,690 |
| 1875 | 104 | 660 | 442 | 1,862 | 639 | 11,742 |
| 1876 | 871 | 3,910 | 885 | 3,488 | 897 | 18,285 |
| 1877 | 5,206 | 23,458 | 4,999 | 16,713 | 1,053 | 18,826 |
| 1878 | 3,106 | 12,111 | 3,019 | 9,368 | 622 | 10,666 |
| 1879 | 339 | 1,631 | 172 | 628 | 445 | 7,874 |
| 1880 | 2,717 | 8,350 | 717 | 1,983 | 894 | 15,617 |
| 1881 | 2,426 | 8,496 | 3,056 | 6,112 | 1,308 | 26,285 |
| 1882 | 11,264 | 52,088 | 3,553 | 10,130 | 2,040 | 41,955 |
| 1883 | 8,869 | 42,020 | 2,519 | 6,892 | 2,013 | 36,761 |
| 1884 | 15,766 | 66,593 | 10,342 | 25,074 | 1,525 | 23,475 |
| 1885 | 24,923 | 102,387 | 15,245 | 35,742 | 1,063 | 16,316 |
| 1886 | 23,175 | 105,537 | 16,429 | 45,657 | 1,112 | 15,922 |
| 1887 | 17,018 | 54,921 | 23,913 | 54,562 | 1,578 | 25,094 |
| 1888 | 29,995 | 118,252 | 36,682 | 78,918 | 4,042 | 75,269 |
| 1889 | 37,955 | 146,840 | 26,558 | 67,105 | 17,084 | 361,182 |
| 1890 | 34,816 | 122,701 | 40,451 | 84,986 | 21,158 | 381,789 |
| 1891 | 39,430 | 150,258 | 39,770 | 86,675 | 15,809 | 281,514 |
| 1892 | 53,930 | 227,162 | 41,493 | 91,042 | 12,793 | 214,542 |
| 1893 | 58,149 | 254,645 | 46,201 | 99,626 | 12,587 | 219,375 |
| 1894 | 60,771 | 251,280 | 55,655 | 115,203 | 4,677 | 66,256 |
| 1895 | 57,964 | 227,601 | 76,743 | 150,909 | 1,806 | 21,040 |
| 1896 | 71,353 | 281,716 | 71,372 | 130,166 | 2,968 | 32,985 |
| 1897 | 99,002 | 402,605 | 77,683 | 150,517 | 2,769 | 30,674 |
| 1898 | 96,801 | 403,690 | 68,711 | 135,776 | 4,850 | 74,556 |
| 1899 | 136,086 | 571,799 | 69,440 | 141,818 | 10,371 | 184,411 |
| 1900 | 172,583 | 740,620 | 102,849 | 229,111 | 15,906 | 332,182 |
| 1901 | 201,591 | 882,406 | 104,294 | 238,685 | 10,171 | 195,728 |
| 1902 | 253,998 | 1,205,802 | 74,746 | 163,539 | 20,852 | 534,031 |
| 1903 | 285,106 | 1,318,067 | 74,780 | 194,998 | 22,652 | 595,684 |
| 1904 | 314,360 | 1,380,460 | 84,526 | 185,486 | 26,936 | 710,281 |
| 1905 | 305,722 | 1,408,557 | 88,562 | 205,171 | 27,877 | 696,467 |
| 1906 | 320,225 | 1,560,235 | 131,206 | 341,002 | 27,779 | 776,106 |
| 1907 | 328,441 | 1,615,345 | 236,833 | 662,355 | 28,547 | 832,068 |
| 1908 | 229,971 | 1,171,182 | 280,798 | 783,419 | 17,403 | 396,288 |
| 1909 | 321,108 | 1,639,380 | 400,607 | 1,105,390 | 14,318 | 306,973 |
| 1910 | 350,535 | 1,811,975 | 451,915 | 1,195,373 | 20,645 | 448,414 |
| 1911 | 302,387 | 1,576,917 | 439,174 | 1,192,057 | 17,366 | 300,209 |
| 1912 | 378,117 | 2,088,809 | 577,070 | 1,680,393 | 18,641 | 376,264 |
| 1913 | 372,258 | 2,061,651 | 611,663 | 1,770,297 | 28,092 | 721,924 |
| 1914 | 434,067 | 2,338,576 | 863,776 | 2,564,125 | 19,702 | 455,214 |
| Year. | Gold. | Gum (Kauri). | Provisions, Tallow, Timber. &c. | |||
|---|---|---|---|---|---|---|
| Quantity. | Value. | Quantity. | Value. | Value. | Total New Zealand Produce Exported. | |
| Oz. | £ | Tons. | £ | £ | ||
| 1865 | 574,574 | 2,226,474 | 1,867 | 46,060 | 82,729 | 3,503,421 |
| 1866 | 735,376 | 2,844,517 | 2,535 | 70,572 | 116,901 | 4,396,090 |
| 1867 | 686,753 | 2,700,275 | 2,685 | 77,491 | 89,294 | 4,479,464 |
| 1868 | 637,474 | 2,504,326 | 2,690 | 72,493 | 51,361 | 4,268,762 |
| 1869 | 614,281 | 2,362,995 | 2,850 | 111,307 | 80,197 | 4,090,134 |
| 1870 | 544,880 | 2,157,585 | 4,391 | 175,074 | 212,044 | 4,544,682 |
| 1871 | 730,029 | 2,787,520 | 5,054 | 167,958 | 338,335 | 5,171,104 |
| 1872 | 445,370 | 1,730,992 | 4,811 | 154,167 | 396,976 | 5,107,186 |
| 1873 | 505,337 | 1,987,425 | 2,833 | 85,816 | 412,660 | 5,477,970 |
| 1874 | 376,388 | 1,505,331 | 2,568 | 79,986 | 397,762 | 5,152,143 |
| 1875 | 355,322 | 1,407,770 | 3,230 | 138,523 | 285,715 | 5,475,844 |
| 1876 | 318,367 | 1,268,559 | 2,888 | 109,234 | 351,731 | 5,488,901 |
| 1877 | 366,955 | 1,476,312 | 3,632 | 118,348 | 469,670 | 6,058,717 |
| 1878 | 311,437 | 1,244,190 | 3,445 | 132,975 | 573,735 | 5,784,619 |
| 1879 | 284,100 | 1,134,641 | 3,228 | 147,535 | 484,150 | 5,563,455 |
| 1880 | 303,215 | 1,220,263 | 4,725 | 242,817 | 544,973 | 6,102,300 |
| 1881 | 250,683 | 996,867 | 5,460 | 253,778 | 574,880 | 5,762,250 |
| 1882 | 230,893 | 921,664 | 5,533 | 260,369 | 921,290 | 6,253,350 |
| 1883 | 222,899 | 892,445 | 6,518 | 336,606 | 1,121,257 | 6,855,244 |
| 1884 | 246,392 | 988,953 | 6,393 | 342,151 | 1,116,799 | 6,942,486 |
| 1885 | 222,732 | 890,056 | 5,876 | 299,762 | 1,154,819 | 6,591,911 |
| 1886 | 235,578 | 939,648 | 4,920 | 257,653 | 1,058,552 | 6,386,682 |
| 1887 | 187,938 | 747,878 | 6,790 | 362,434 | 1,085,468 | 6,551,081 |
| 1888 | 229,608 | 914,309 | 8,482 | 380,933 | 1,274,780 | 7,255,128 |
| 1889 | 197,492 | 785,490 | 7,519 | 329,590 | 1,606,828 | 9,042,008 |
| 1890 | 187,641 | 751,360 | 7,438 | 378,563 | 1,440,731 | 9,428,761 |
| 1891 | 251,161 | 1,007,172 | 8,388 | 437,056 | 1,436,671 | 9,400,094 |
| 1892 | 237,393 | 951,963 | 8,705 | 517,678 | 1,200,525 | 9,365,868 |
| 1893 | 227,502 | 915,921 | 8,317 | 510,775 | 1,113,799 | 8,557,443 |
| 1894 | 221,614 | 887,865 | 8,338 | 404,567 | 1,112,233 | 9,085,148 |
| 1895 | 293,493 | 1,162,181 | 7,425 | 418,766 | 1,269,031 | 8,390,153 |
| 1896 | 263,694 | 1,041,428 | 7,126 | 431,323 | 1,269,680 | 9,177,336 |
| 1897 | 251,647 | 980,204 | 6,641 | 398,010 | 1,389,398 | 9,596,267 |
| 1898 | 280,175 | 1,080,691 | 9,905 | 586,767 | 1,562,834 | 10,324,988 |
| 1899 | 389,570 | 1,513,180 | 11,116 | 607,919 | 1,645,313 | 11,799,740 |
| 1900 | 373,614 | 1,439,602 | 10,159 | 622,293 | 1,784,350 | 13,055,249 |
| 1901 | 455,558 | 1,753,784 | 7,541 | 446,114 | 1,935,567 | 12,690,460 |
| 1902 | 507,852 | 1,951,426 | 7,430 | 450,223 | 2,333,704 | 13,498,599 |
| 1903 | 533,314 | 2,037,832 | 9,357 | 631,102 | 2,288,327 | 14,838,192 |
| 1904 | 520,323 | 1,987,501 | 9,203 | 501,817 | 1,976,471 | 14,601,787 |
| 1905 | 520,485 | 2,093,936 | 10,883 | 561,444 | 2,167,616 | 15,503,530 |
| 1906 | 563,843 | 2,270,904 | 9,154 | 522,486 | 2,587,453 | 17,840,346 |
| 1907 | 508,210 | 2,027,490 | 8,708 | 579,888 | 2,934,845 | 19,783,138 |
| 1908 | 506,381 | 2,004,799 | 5,530 | 372,798 | 2,501,525 | 15,894,530 |
| 1909 | 506,371 | 2,006,900 | 8,250 | 552,698 | 3,112,465 | 19,462,936 |
| 1910 | 478,286 | 1,896,318 | 8,693 | 465,044 | 3,648,779 | 21,944,163 |
| 1911 | 454,837 | 1,815,251 | 7,587 | 395,707 | 3,176,458 | 18,781,898 |
| 1912 | 343,163 | 1,345,131 | 7,908 | 401,305 | 3,623,851 | 21,272,405 |
| 1913 | 376,161 | 1,459,499 | 8,780 | 549,106 | 3,376,657 | 22,577,890 |
| 1914 | 227,954 | 895,367 | 8,473 | 497,444 | 3,782,840 | 25,984,717 |
| Imports. | ||||||
|---|---|---|---|---|---|---|
| Year. | Total Exports. | Total. | From United Kingdom. | From Australia | From United States. | Total Trade. |
| £ | £ | £ | £ | £ | £ | |
| 1865 | 3,713,218 | 5,594,977 | 2,606,994 | 2,565,285 | 45,084 | 9,308,195 |
| 1866 | 4,520,074 | 5,894,863 | 2,737,702 | 2,780,966 | 129,300 | 10,414,937 |
| 1867 | 4,644,678 | 5,344,607 | 2,779,463 | 2,182,995 | 92,590 | 9,989,285 |
| 1858 | 4,429,198 | 4,985,748 | 2,299,689 | 2,261,485 | 117,326 | 9,414,946 |
| 1869 | 4,224,860 | 4,976,126 | 2,458,579 | 2,106,859 | 69,109 | 9,200,986 |
| 1870 | 4,822,756 | 4,639,015 | 2,685,736 | 1,655,086 | 60,497 | 9,461,771 |
| 1871 | 5,282,084 | 4,078,193 | 1,808,636 | 1,969,914 | 59,345 | 9,360,277 |
| 1872 | 5,190,665 | 5,142,951 | 2,685,160 | 2,097,508 | 90,657 | 10,333,616 |
| 1873 | 5,610,371 | 6,464,687 | 3,781,130 | 2,198,849 | 143,273 | 12,075,058 |
| 1874 | 5,251,269 | 8,121,812 | 5,481,036 | 2,076,626 | 191,529 | 13,373,081 |
| 1875 | 5,828,627 | 8,029,172 | 5,103,610 | 2,355,988 | 213,492 | 13,857,799 |
| 1876 | 5,673,465 | 6,905,171 | 4,451,269 | 1,942,590 | 192,287 | 12,578,636 |
| 1877 | 6,327,472 | 6,973,418 | 4,115,544 | 2,288,253 | 269,656 | 13,300,890 |
| 1878 | 6,015,700 | 8,755,663 | 5,333,170 | 2,393,863 | 432,572 | 14,771,363 |
| 1879 | 5,743,126 | 8,374,585 | 5,302,823 | 2,197,452 | 438,399 | 14,117,711 |
| 1880 | 6,352,692 | 6,162,011 | 3,479,217 | 1,930,408 | 238,011 | 12,514,703 |
| 1881 | 6,060,866 | 7,457,045 | 4,530,316 | 1,952,767 | 343,645 | 13,517,911 |
| 1882 | 6,658,008 | 8,609,270 | 5,553,324 | 1,863,865 | 463,493 | 15,267,278 |
| 1883 | 7,095,999 | 7,974,038 | 5,241,847 | 1,576,183 | 419,250 | 15,070,037 |
| 1884 | 7,091,667 | 7,663,888 | 4,934,493 | 1,635,762 | 348,557 | 14,755,555 |
| 1885 | 6,819,939 | 7,479,921 | 5,227,551 | 1,254,908 | 401,532 | 14,299,860 |
| 1886 | 6,672,791 | 6,759,013 | 4,481,101 | 1,317,376 | 337,322 | 13,431,804 |
| 1887 | 6,866,169 | 6,245,515 | 4,173,497 | 1,030,094 | 298,736 | 13,111,684 |
| 1888 | 7,767,325 | 5,941,900 | 3,725,624 | 1,218,593 | 323,069 | 13,709,225 |
| 1889 | 9,341,864 | 6,308,863 | 4,138,077 | 1,107,132 | 342,436 | 15,650,727 |
| 1890 | 9,811,720 | 6,260,525 | 4,221,270 | 1,087,593 | 355,395 | 16,072,245 |
| 1891 | 9,566,397 | 6,503,849 | 4,369,633 | 1,013,549 | 361,795 | 16,070,246 |
| 1892 | 9,534,85 | 6,943,056 | 4,767,369 | 1,112,099 | 381,627 | 16,477,907 |
| 1893 | 8,985,364 | 6,911,515 | 4,481,955 | 1,411,465 | 379,378 | 15,896,879 |
| 1894 | 9,231,047 | 6,788,020 | 3,949,770 | 1,740,965 | 394,691 | 16,019,067 |
| 1895 | 8,550,224 | 6,400,129 | 3,992,359 | 1,261,125 | 394,233 | 14,950,353 |
| 1896 | 9,321,105 | 7,137,320 | 4,714,476 | 1,090,374 | 492,840 | 16,458,425 |
| 1897 | 10,016,993 | 8,055,223 | 5,310,675 | 1,001,003 | 628,044 | 18,072,216 |
| 1898 | 10,517,955 | 8,230,600 | 5,148,833 | 1,158,865 | 800,411 | 18,748,555 |
| 1899 | 11,938,335 | 8,739,633 | 5,526,645 | 1,336,828 | 775,309 | 20,677,968 |
| 1900 | 13,246,161 | 10,646,096 | 6,504,484 | 1,776,978 | 1,061,873 | 23,892,257 |
| 1901 | 12,881,424 | 11,817,915 | 6,885,831 | 1,979,320 | 1,415,260 | 24,699,339 |
| 1902 | 13,644,977 | 11,326,723 | 6,851,452 | 1,715,295 | 1,318,937 | 24,971,700 |
| 1903 | 15,010,378 | 12,788,675 | 7,512,668 | 2,154,966 | 1,441,358 | 27,799,053 |
| 1904 | 14,748,348 | 13,291,694 | 7,982,340 | 1,893,036 | 1,527,915 | 28,040,042 |
| 1905 | 15,655,947 | 12,828,857 | 7,795,284 | 1,815,717 | 1,438,501 | 28,484,804 |
| 1906 | 18,095,137 | 15,211,403 | 9,003,229 | 2,775,312 | 1,405,781 | 33,306,540 |
| 1907 | 20,068,957 | 17,302,861 | 10,278,019 | 3,127,553 | 1,425,596 | 37,371,818 |
| 1908 | 16,317,494 | 17,471,284 | 10,441,837 | 2,841,426 | 1,643,937 | 33,788,778 |
| 1909 | 19,661,996 | 15,674,719 | 9,287,786 | 2,764,210 | 1,166,063 | 35,336,715 |
| 1910 | 22,180,209 | 17,051,583 | 10,498,771 | 2,359,393 | 1,399,737 | 39,231,792 |
| 1911 | 19,028,490 | 19,545,879 | 11,787,300 | 2,944,991 | 1,682,129 | 38,574,369 |
| 1912 | 21,770,581 | 20,976,574 | 12,499,787 | 2,583,887 | 2,049,618 | 42,747,155 |
| 1913 | 22,986,722 | 22,288,302 | 13,312,193 | 2,914,848 | 2,107,990 | 45,275,024 |
| 1914 | 26,261,447 | 21,856,095 | 11,985,946 | 3,376,371 | 2,282,966 | 48,117,542 |
IV.—TRANSPORT AND COMMUNICATION.
| Year. | Oversea Shipping. | ||||
|---|---|---|---|---|---|
| Inwards. | Outwards. | Registered Vessels belonging to New Zealand. | |||
| Vessels. | Tonnage. | Vessels. | Tonnage. | Gross Tonnage. | |
| 1865 | 862 | 295,625 | 783 | 283,020 | 24,484 |
| 1866 | 1,019 | 330,303 | 986 | 306,979 | 26,787 |
| 1867 | 944 | 309,568 | 950 | 308,169 | 23,240 |
| 1868 | 851 | 277,105 | 873 | 287,710 | 24,539 |
| 1869 | 764 | 250,731 | 771 | 247,764 | 25,990 |
| 1870 | 756 | 273,151 | 766 | 265,407 | 26,743 |
| 1871 | 729 | 274,643 | 709 | 265,618 | 27,107 |
| 1872 | 775 | 300,302 | 743 | 285,366 | 23,963 |
| 1873 | 739 | 289,297 | 704 | 281,847 | 30,035 |
| 1874 | 856 | 399,296 | 822 | 385,533 | 38,935 |
| 1875 | 926 | 416,727 | 940 | 417,820 | 42,025 |
| 1876 | 878 | 393,180 | 866 | 393,334 | 44,401 |
| 1877 | 812 | 388,568 | 848 | 400,609 | 42,479 |
| 1878 | 926 | 456,490 | 886 | 428,493 | 46,965 |
| 1879 | 894 | 473,940 | 908 | 475,752 | 64,457 |
| 1880 | 730 | 395,675 | 786 | 424,041 | 66,316 |
| 1881 | 765 | 420,134 | 762 | 413,487 | 72,387 |
| 1882 | 795 | 461,285 | 769 | 438,551 | 76,196 |
| 1883 | 805 | 494,926 | 851 | 507,565 | 84,903 |
| 1884 | 852 | 529,188 | 872 | 534,242 | 92,696 |
| 1885 | 786 | 519,700 | 780 | 513,000 | 95,887 |
| 1886 | 725 | 502,572 | 707 | 488,331 | 94,196 |
| 1887 | 653 | 489,754 | 675 | 493,583 | 94,027 |
| 1888 | 683 | 526,435 | 701 | 531,478 | 86,132 |
| 1889 | 781 | 602,634 | 762 | 593,252 | 87,411 |
| 1890 | 744 | 662,769 | 745 | 649,705 | 98,907 |
| 1891 | 737 | 618,515 | 744 | 625,807 | 102,068 |
| 1892 | 686 | 675,223 | 689 | 656,100 | 101,156 |
| 1893 | 617 | 615,604 | 635 | 642,466 | 100,388 |
| 1894 | 609 | 631,100 | 614 | 631,250 | 99,588 |
| 1895 | 611 | 672,951 | 597 | 648,946 | 100,988 |
| 1896 | 589 | 614,097 | 592 | 627,659 | 105,553 |
| 1897 | 600 | 686,899 | 587 | 675,333 | 119,713 |
| 1898 | 620 | 765,255 | 622 | 765,793 | 126,113 |
| 1899 | 609 | 811,183 | 604 | 807,866 | 129,583 |
| 1900 | 616 | 854,632 | 613 | 825,275 | 137,767 |
| 1901 | 688 | 1,063,274 | 691 | 1,075,906 | 143,183 |
| 1902 | 638 | 1,089,179 | 611 | 1,048,770 | 147,822 |
| 1903 | 617 | 1,102,064 | 608 | 1,113,165 | 150,909 |
| 1904 | 629 | 1,154,569 | 620 | 1,144,764 | 157,334 |
| 1905 | 627 | 1,139,410 | 627 | 1,141,552 | 170,957 |
| 1906 | 629 | 1,243,652 | 631 | 1,238,214 | 180,124 |
| 1907 | 645 | 1,254,266 | 615 | 1,225,382 | 197,001 |
| 1908 | 658 | 1,361,04, | 656 | 1,331,305 | 228,399. |
| 1909 | 605 | 1,263,935 | 596 | 1,253,878 | 230,614 |
| 1910 | 609 | 1,389,031 | 588 | 1,367,207 | 233,531 |
| 1911 | 621 | 1,482,378 | 624 | 1,467,402 | 234,084 |
| 1912 | 677 | 1,672,092 | 666 | 1,668,630 | 245,445 |
| 1913 | 645 | 1,738,985 | 635 | 1,699,807 | 254,117 |
| 1914 | 646 | 1,724,849 | 657 | 1,781,981 | 168,552 |
| Government Railways. (Figures to 31st March following.) | Electric Telegraph. (From 1895, figures for 31st March following.) | |||||
|---|---|---|---|---|---|---|
| Year. | Miles open for Traffic. | Miles under Construction. | Railway Receipts. | Miles of Line. | Number of Messages. | Cash and Cash Values, including Telephones. |
| £ | £ | |||||
| 1865 | .. | .. | .. | .. | .. | .. |
| 1866 | .. | .. | .. | 699 | 48,231 | 9,114 |
| 1867 | .. | .. | .. | 714 | 87,436 | 14,295 |
| 1868 | .. | .. | .. | 1,471 | 134,647 | 26,224 |
| 1869 | .. | .. | .. | 1,611 | 173,746 | 32,649 |
| 1870 | .. | .. | .. | 1,887 | 238,195 | 27,422 |
| 1871 | .. | .. | .. | 2,015 | 369,085 | 37,203 |
| 1872 | .. | .. | .. | 2,312 | 491,205 | 44,669 |
| 1873 | 145 | 434 | .. | 2,389 | 637,941 | 55,195 |
| 1874 | 209 | 621 | 21,198 | 2,632 | 844,301 | 62,322 |
| 1875 | 542 | 46-I | 72,073 | 3,156 | 993,323 | 74,420 |
| 1876 | 718 | 427 | 469,051 | 3,170 | 1,100,599 | 80,841 |
| 1877 | 1,052 | 251 | 569,898 | 3,307 | 1,182,955 | 85,589 |
| 1878 | 1,089 | 142 | 758,096 | 3,434 | 1,260,324 | 92,433 |
| 1879 | 1,171 | 284 | 762,572 | 3,512 | 1,448,943 | 112,351 |
| 1880 | 1,288 | 192 | 836,077 | 3,758 | 1,304,712 | 100,023 |
| 1881 | 1,333 | 187 | 892,026 | 3,824 | 1,438,772 | 101,566 |
| 1882 | 1,371 | 171 | 953,347 | 3,974 | 1,570,189 | 102,378 |
| 1883 | 1,404 | 224 | 961,304 | 4,074 | 1,599,400 | 102,958 |
| 1884 | 1,479 | 158 | 1,045,712 | 4,264 | 1,654,305 | 101,482 |
| 1885 | 1,613 | 179 | 1,047,418 | 4,463 | 1,774,273 | 112,778 |
| 1886 | 1,721 | 171 | 998,768 | 4,546 | 1,836,266 | 115,666 |
| 1887 | 1,753 | 169 | 994,843 | 4,646 | 1,835,394 | 116,211 |
| 1888 | 1,777 | 163 | 997,615 | 4,790 | 1,765,860 | 104,116 |
| 1889 | 1,809 | 176 | 1,095,569 | 4,874 | 1,802,987 | 106,462 |
| 1890 | 1,842 | 132 | 1,121,701 | 5,060 | 1,961,161 | 110,697 |
| 1891 | 1,869 | 170 | 1,115,432 | 5,349 | 1,968,264 | 117,634 |
| 1892 | 1,886 | 188 | 1,181,522 | 5,479 | 1,904,143 | 103,813 |
| 1893 | 1,948 | 148 | 1,172,792 | 5,513 | 2,069,791 | 112,466 |
| 1894 | 1,993 | 127 | 1,150,851 | 5,823 | 2,046,839 | 114,510 |
| 1895 | 2,014 | 114 | 1,183,041 | 6,245 | 2,124,211 | 123,112 |
| 1896 | 2,018 | 124 | 1,286,158 | 6,285 | 2,520,169 | 129,635 |
| 1897 | 2,055 | 92 | 1,376,008 | 6,484 | 2,696,233 | 136,221 |
| 1898 | 2,090 | 113 | 1,469,665 | 6,736 | 2,960,738 | 145,295 |
| 1899 | 2,104 | 111 | 1,623,891 | 6,910 | 3,469,631 | 162,945 |
| 1900 | 2,212 | 208 | 1,727,236 | 7,249 | 3,898,128 | 186,978 |
| 1901 | 2,235 | 212 | 1,874,586 | 7,469 | 4,167,981 | 207,476 |
| 1902 | 2,291 | 194 | 1,974,038 | 7,749 | 4,559,304 | 222,495 |
| 1903 | 2,328 | 175 | 2,180,641 | 7,779 | 4,965,197 | 237,064 |
| 1904 | 2,374 | 173 | 2,209,231 | 7,944 | 5,159,745 | 250,063 |
| 1905 | 2,407 | 222 | 2,349,704 | 8,355 | 5,640,219 | 273,911 |
| 1906 | 2,458 | 208 | 2,624,600 | 8,953 | 6,396,332 | 307,521 |
| 1907 | 2,474 | 255 | 2,761,938 | 9,656 | 7,042,923 | 344,251 |
| 1908 | 2,674 | 188 | 2,929,526 | 10,404 | 7,425,693 | 369,353 |
| 1909 | 2,717 | 184 | 3,249,790 | 10,901 | 7,846,890 | 394,510 |
| 1910 | 2,753 | 192 | 3,494,182 | 11,316 | 8,360,647 | 434,116 |
| 1911 | 2,798 | 205 | 3,676,509 | 11,805 | 9,063,133 | 474,458 |
| 1912 | 2,851 | 192 | 3,971,002 | 12,508 | 9,944,272 | 523,189 |
| 1913 | 2,854 | 223 | 4,043,328 | 13,044 | 10,694,032 | 574,786 |
| 1914 | 2,945 | 211 | 4,105,457 | 13,434 | 10,716,613 | 660,162 |
| FINANCE. | |||||||
|---|---|---|---|---|---|---|---|
| Year. | Banks of Issue. (Average of Four Quarters.) | Savings-Banks (Post Office and private). | Post Office Money Orders issued. | ||||
| Deposits. | Assets. | Liabilities. | Number of Depositors. | Balance to credit at End of Year. | Number. | Amount. | |
| £ | £ | £ | £ | £ | |||
| 1865 | 2,638,414 | 5,455,289 | 3,522,146 | 4,304 | 87,400 | 17,236 | 78,576 |
| 1866 | 3,097,473 | 5,891,532 | 4,010,110 | 4,513 | 91,863 | 22,710 | 108,779 |
| 1867 | 2,904,594 | 5,947,160 | 3,737,695 | 6,579 | 156,855 | 24,473 | 115,610 |
| 1868 | 3,102,727 | 5,734,745 | 3,838,220 | 8,121 | 243,615 | 25,854 | 118,211 |
| 1869 | 3,174,831 | 6,231,416 | 3,863,006 | 10,103 | 320,383 | 28,427 | 127,218 |
| 1870 | 3,127,769 | 6,315,354 | 3,819,670 | 12,137 | 388,804 | 31,864 | 140,454 |
| 1871 | 3,334,672 | 5,871,888 | 3,988,400 | 14,275 | 454,966 | 36,291 | 157,397 |
| 1872 | 3,919,838 | 5,429,747 | 4,628,819 | 17,289 | 597,002 | 44,660 | 191,009 |
| 1873 | 4,713,806 | 7,267,720 | 5,538,030 | 21,807 | 812,144 | 52,351 | 219,258 |
| 1874 | 5,564,434 | 9,954,216 | 6,490,504 | 27,215 | 943,753 | 62,712 | 263,164 |
| 1875 | 5,967,205 | 10,987,178 | 6,987,318 | 30,310 | 897,326 | 73,027 | 293,481 |
| 1876 | 6,238,471 | 11,776,070 | 7,221,399 | 32,577 | 905,146 | 80,255 | 310,268 |
| 1877 | 7,185,106 | 12,992,104 | 8,152,230 | 35,709 | 964,430 | 90,672 | 334,973 |
| 1878 | 8,960,369 | 15,393,630 | 10,031,009 | 39,926 | 1,043,204 | 101,017 | 368,255 |
| 1879 | 8,021,073 | 16,054,295 | 9,057,463 | 42,679 | 990,337 | 117,999 | 428,673 |
| 1880 | 8,538,935 | 14,220,275 | 9,550,177 | 47,462 | 1,148,992 | 135,648 | 465,405 |
| 1881 | 9,069,377 | 14,863,645 | 10,083,188 | 61,054 | 1,549,515 | 135,556 | 452,182 |
| 1882 | 8,945,346 | 17,162,234 | 10,015,273 | 68,358 | 1,832,047 | 148,162 | 499,368 |
| 1883 | 8,659,477 | 17,794,761 | 9,706,700 | 73,546 | 1,784,631 | 172,556 | 541,133 |
| 1884 | 9,643,214 | 18,442,139 | 10,691,599 | 79,514 | 1,926,759 | 186,052 | 572,666 |
| 1885 | 10,083,296 | 18,811,567 | 11,130,244 | 85,769 | 2,142,560 | 188,622 | 581,395 |
| 1886 | 10,579,711 | 19,041,827 | 11,603,194 | 91,296 | 2,133,861 | 155,680 | 547,755 |
| 1887 | 11,031,614 | 18,799,847 | 11,995,495 | 97,496 | 2,407,776 | 159,579 | 555,744 |
| 1888 | 11,155,778 | 18,709,444 | 12,108,353 | 103,046 | 2,691,693 | 162,387 | 555,996 |
| 1889 | 11,528,424 | 17,652,915 | 12,486,717 | 110,566 | 2,858,644 | 172,076 | 589,545 |
| 1890 | 12,368,610 | 17,735,259 | 13,356,598 | 118,344 | 3,137,023 | 176,427 | 602,077 |
| 1891 | 12,796,098 | 16,814,518 | 13,820,458 | 126,886 | 3,406,949 | 195,239 | 651,990 |
| 1892 | 13,587,062 | 17,558,168 | 14,623,335 | 135,827 | 3,580,544 | 199,438 | 694,847 |
| 1893 | 14,433,777 | 18,255,534 | 15,489,633 | 147,199 | 3,966,849 | 210,957 | 750,929 |
| 1894 | 13,927,217 | 17,746,421 | 14,930,791 | 154,405 | 4,066,594 | 222,678 | 776,783 |
| 1895 | 13,544,415 | 18,159,781 | 14,491,627 | 163,513 | 4,620,696 | 243,497 | 812,604 |
| 1896 | 14,490,827 | 16,900,199 | 15,520,431 | 175,173 | 5,065,864 | 269,566 | 902,160 |
| 1897 | 14,290,512 | 17,276,771 | 15,380,248 | 187,954 | 5,520,080 | 293,659 | 970,831 |
| 1898 | 14,143,229 | 17,013,404 | 15,299,058 | 199,464 | 5,746,887 | 318,370 | 1,029,241 |
| 1899 | 14,591,223 | 17,190,433 | 15,834,858 | 213,172 | 6,128,297 | 344,664 | 1,118,808 |
| 1900 | 15,570,610 | 17,314,535 | 16,964,582 | 228,883 | 6,665,344 | 369,834 | 1,214,853 |
| 1901 | 16,034,848 | 18,422,274 | 17,490,035 | 245,024 | 7,268,103 | 405,967 | 1,286,508 |
| 1902 | 17,231,767 | 18,999,180 | 18,701,063 | 261,948 | 7,876,877 | 367,207 | 1,277,059 |
| 1903 | 19,011,114 | 19,913,546 | 20,563,879 | 280,011 | 8,432,958 | 396,312 | 1,416,224 |
| 1904 | 19,074,960 | 20,893,096 | 20,643,359 | 297,569 | 8,839,307 | 407,783 | 1,476,887 |
| 1905 | 20,545,601 | 21,770,525 | 22,144,166 | 316,376 | 9,773,954 | 417,441 | 1,551,712 |
| 1906 | 22,422,243 | 23,829,933 | 24,143,008 | 341,114 | 11,170,025 | 439,020 | 1,686,232 |
| 1907 | 23,517,111 | 26,584,239 | 25,334,348 | 364,422 | 12,825,063 | 441,487 | 1,773,591 |
| 1908 | 21,821,753 | 29,098,567 | 23,611,903 | 388,945 | 13,512,266 | 488,084 | 2,050,684 |
| 1909 | 21,996,621 | 26,937,265 | 23,728,326 | 408,770 | 14,065,410 | 538,740 | 2,307,593 |
| 1910 | 24,968,761 | 26,398,927 | 26,742,081 | 432,119 | 15,620,515 | 569,657 | 2,457,523 |
| 1911 | 26,765,122 | 29,433,614 | 28,625,803 | 459,602 | 17,194,461 | 607,764 | 2,759,393 |
| 1912 | 25,622,083 | 31,196,400 | 27,508,348 | 503,927 | 18,043,540 | 666,425 | 3,231,350 |
| 1913 | 25,733,187 | 30,708,932 | 27,591,099 | 532,682 | 18,923,522 | 690,745 | 3,357,774 |
| 1914 | 27,640,507 | 32,502,312 | 29,808,349 | 559,203 | 20,924,754 | 691,518 | 3,427,505 |
| Year | Insurances in Force in the Government Life Insurance Department at End of Year. | Old-age Pensions, 31st March of following Year. | Friendly Societies from which Returns received. | Public Trust Office. | ||||
|---|---|---|---|---|---|---|---|---|
| No. of Policies. | Sums Assured and Bonuses. | No. of Pensions in Force. | Amount represented. | No. of Lodges, &c. | No. of Members. | Number of Estates. | Value of. Estates. | |
* From here figures are for year ended 31st March following. | ||||||||
| £ | £ | £ | ||||||
| 1865 | .. | .. | .. | .. | .. | .. | .. | .. |
| 1866 | .. | .. | .. | .. | .. | .. | .. | .. |
| 1867 | .. | .. | .. | .. | .. | .. | .. | .. |
| 1868 | .. | .. | .. | .. | .. | .. | .. | .. |
| 1869 | .. | .. | .. | .. | .. | .. | .. | .. |
| 1870 | 59 | 30,250 | .. | .. | .. | .. | .. | .. |
| 1871 | 454 | 200,611 | .. | .. | .. | .. | .. | .. |
| 1872 | 1,689 | 625,421 | .. | .. | .. | .. | .. | .. |
| 1873 | 2,634 | 995,986 | .. | .. | .. | .. | 257 | 17,500 |
| 1874 | 3,953 | 1,453,496 | .. | .. | .. | .. | 293 | 28,930 |
| 1875 | 4,989 | 1,836,859 | .. | .. | .. | .. | 347 | 42,163 |
| 1876 | 6,153 | 2,282,129 | .. | .. | 89 | 8,560 | 412 | 59,720 |
| 1877 | 7,149 | 2,716,907 | .. | .. | 88 | 8,828 | 575 | 67,675 |
| 1878 | 8,711 | 3,251,220 | .. | .. | 110 | 9,759 | 627 | 73,940 |
| 1879 | 10,223 | 3,726,330 | .. | .. | 138 | 13,165 | 713 | 96,315 |
| 1880 | 11,656 | 4,171,504 | .. | .. | 179 | 14,484 | 770 | 117,980 |
| 1881 | 12,411 | 4,471,182 | .. | .. | 272 | 18,634 | 836 | 150,750 |
| 1882 | 15,892 | 5,273,164 | .. | .. | 273 | 18,700 | 911 | 204,545 |
| 1883 | 19,917 | 5,992,111 | .. | .. | 275 | 18,848 | 1,024 | 317,680 |
| 1884 | 21,003 | 6,224,571 | .. | .. | 281 | 21,144 | 1,082 | 392,315 |
| 1885 | 23,218 | 6,552,242 | .. | .. | 302 | 22,794 | 1,190 | 457,620 |
| 1886 | 24,715 | 7,053,276 | .. | .. | 290 | 21,679 | 1,293 | 576,010 |
| 1887 | 25,439 | 7,136,944 | .. | .. | 347 | 24,928 | 1,304 | 715,860 |
| 1888 | 26,168 | 7,362,488 | .. | .. | 353 | 24,938 | 1,483 | 954,675 |
| 1889 | 27,218 | 7,600,537 | .. | .. | 365 | 26,013 | 1,561 | 1,130,960 |
| 1890 | 28,102 | 7,807,792 | .. | .. | 357 | 26,379 | 1,678 | 1,240,097 |
| 1891 | 29,226 | 8,390,803 | .. | .. | 364 | 27,372 | 1,825 | 1,252,625 |
| 1892 | 30,316 | 8,580,817 | .. | .. | 379 | 28,754 | 1,912 | 1,284,745 |
| 1893 | 31,709 | 8,821,255 | .. | .. | 372 | 29,763 | 2,022 | 1,450,918 |
| 1894 | 32,907 | 9,232,543 | .. | .. | 369 | 29,963 | 2,086* | 1,562,269* |
| 1895 | 33,968 | 9,345,229 | .. | .. | 376 | 30,905 | 2,236 | 1,806,953 |
| 1896 | 34,772 | 9,415,693 | .. | .. | 392 | 31,825 | 2,334 | 1,898,163 |
| 1897 | 36,174 | 9,857,010 | .. | .. | 388 | 32,670 | 2,413 | 1,950,314 |
| 1898 | 37,848 | 10,124,227 | 7,443 | 128,082 | 410 | 34,501 | 2,491 | 2,110,316 |
| 1899 | 39,366 | 10,341,702 | 11,285 | 193,718 | 433 | 38,202 | 2,667 | 2,192,594 |
| 1900 | 40,368 | 10,639,978 | 12,405 | 211,965 | 443 | 40,257 | 2,898 | 2,326,954 |
| 1901 | 41,291 | 10,627,263 | 12,776 | 217,192 | 445 | 41,236 | 3,049 | 2,467,614 |
| 1902 | 42,406 | 11,024,734 | 12,481 | 211,595 | 462 | 43,408 | 3,314 | 2,706,785 |
| 1903 | 43,116 | 11,111,807 | 11,926 | 200,915 | 465 | 45,255 | 3,470 | 3,152,882 |
| 1904 | 44,194 | 11,261,080 | 11,770 | 199,081 | 479 | 47,302 | 3,685 | 3,577,355 |
| 1905 | 45,137 | 11,725,977 | 12,582 | 313,018 | 501 | 51,103 | 3,977 | 4,009,992 |
| 1906 | 45,981 | 11,851,491 | 13,257 | 326,084 | 535 | 53,759 | 4,276 | 4,590,157 |
| 1907 | 46,945 | 11,980,123 | 13,569 | 333,340 | 552 | 56,817 | 4,718 | 4,065,989 |
| 1908 | 47,033 | 12,024,699 | 14,396 | 353,343 | 539 | 58,517 | 4,946 | 4,644,795 |
| 1909 | 48,016 | 12,447,748 | 15,320 | 374,699 | 567 | 64,428 | 5,466 | 5,184,840 |
| 1910 | 48,932 | 12,586,756 | 16,020 | 403,020 | 609 | 68,006 | 5,966 | 5,477,675 |
| 1911 | 49,376 | 12,683,277 | 16,649 | 416,530 | 658 | 71,771 | 6,456 | 5,951,233 |
| 1912 | 50,458 | 13,271,699 | 16,509 | 412,408 | 664 | 73,243 | 7,225 | 6,782,532 |
| 1913 | 51,343 | 13,539,467 | 18,050 | 447,765 | 681 | 73,691 | 7,538 | 7,288,447 |
| 1914 | 52,273 | 13,797,075 | 19,352 | 475,970 | 717 | 74,074 | 8,026 | 7,942,158 |
| VI.—EDUCATION. | ||||
|---|---|---|---|---|
| Year. | Scholars at Primary Schools.* | Scholars at Secondary or High Schools.† | Scholars at Private Schools. | New Zealand University Graduates (Direct Degrees). |
* Excluding children attending Native Schools and Industrial Schools. The numbers for 1914 were 5,072 and 997 respectively. † Including in later years secondary pupils attending Day Technical Schools (1,839 in 1914). NOTE.—Statistics of schools and scholars not being complete for years prior to 1874, no figures are entered for those years. | ||||
| 1865 | .. | .. | .. | .. |
| 1866 | .. | .. | .. | .. |
| 1867 | .. | .. | .. | .. |
| 1868 | .. | .. | .. | .. |
| 1869 | .. | .. | .. | .. |
| 1870 | .. | .. | .. | .. |
| 1871 | .. | .. | .. | .. |
| 1872 | .. | .. | .. | .. |
| 1873 | .. | .. | .. | .. |
| 1874 | 38,215 | .. | 8,237 | .. |
| 1875 | 45,562 | .. | 7,316 | .. |
| 1876 | 51,964 | 654 | 9,357 | .. |
| 1877 | 56,239 | 716 | 9,992 | .. |
| 1878 | 65,040 | 868 | 9,206 | .. |
| 1879 | 75,556 | 1,417 | 10,234 | .. |
| 1880 | 82,401 | 1,631 | 11,238 | .. |
| 1881 | 83,560 | 1,819 | 9,987 | .. |
| 1882 | 87,179 | 1,899 | 10,002 | .. |
| 1883 | 92,476 | 2,384 | 11,255 | .. |
| 1884 | 97,238 | 2,642 | 12,203 | .. |
| 1885 | 102,407 | 2,659 | 11,989 | 103 |
| 1886 | 106,328 | 2,358 | 12,497 | 117 |
| 1887 | 110,919 | 2,242 | 13,417 | 145 |
| 1888 | 112,685 | 2,120 | 13,893 | 168 |
| 1889 | 115,456 | 2,147 | 13,458 | 199 |
| 1890 | 117,912 | 2,117 | 13,626 | 230 |
| 1891 | 119,523 | 2,205 | 14,142 | 279 |
| 1892 | 122,620 | 2,262 | 14,456 | 323 |
| 1893 | 124,690 | 2,251 | 14,922 | 366 |
| 1894 | 127,300 | 2,454 | 14,627 | 410 |
| 1895 | 129,856 | 2,525 | 14,659 | 464 |
| 1896 | 131,037 | 2,614 | 13,947 | 501 |
| 1897 | 132,197 | 2,709 | 14,447 | 546 |
| 1898 | 131,621 | 2,706 | 14,782 | 603 |
| 1899 | 131,315 | 2,723 | 15,295 | 641 |
| 1900 | 130,724 | 2,792 | 15,555 | 699 |
| 1901 | 131,351 | 2,899 | 15,344 | 757 |
| 1902 | 132,262 | 3,072 | 15,624 | 814 |
| 1903 | 133,568 | 3,722 | 15,609 | 869 |
| 1904 | 135,475 | 4,038 | 16,37s | 929 |
| 1905 | 137,623 | 4,060 | 16,639 | 992 |
| 1906 | 139,302 | 4,270 | 17,131 | 1,083 |
| 1907 | 141,071 | 4,196 | 18,088 | 1,157 |
| 1908 | 147,428 | 6,327 | 18,367 | 1,252 |
| 1909 | 152,416 | 7,063 | 17,930 | 1,327 |
| 1910 | 156,324 | 7,970 | 18,981 | 1,424 |
| 1911 | 161,648 | 6,806 | 19,868 | 1,515 |
| 1912 | 166,264 | 7,357 | 20,238 | 1,631 |
| 1913 | 172,168 | 7,818 | 21,115 | 1,758 |
| 1914 | 178,509 | 8,257 | 22,080 | 1,880 |
Table of Contents
J. B. CONDLIFFE, M.A., P.R.E.S.
Statistical Office, Wellington.
(The following essay was presented as a thesis for the degree of Master of Arts, in Economics, in the University of New Zealand.)
First Settlement—Systematic Colonization from 1840.
NEW ZEALAND was discovered by Tasman in 1642, but, although it was charted on some Dutch maps, no attempt at settlement was made. In 1769–70 the Islands were visited by Captain Cook, who charted the coast fairly correctly, and, landing in several places, gained a good idea of the country. For some decades the Maoris were left undisturbed, but gradually there drifted across from Australia some adventurous, if unprincipled, pioneers. The settlements in the Bay of Islands comprised whalers, refugees from New South Wales, and a few adventurous traders. The shrewd Maori found his barter of flax for firearms greatly facilitated by the possession of a pakeha-Maori; ships began to call in for cargoes of flax and for spars of kauri and white-pine. The Maori chief Hongi visited England in 1820, changed all his presents into firearms at Sydney, and then proceeded to make himself master of the rival tribes. So every tribe must have arms, and the export of flax to Sydney grew apace, till in 1830 it reached 500 tons, valued at £12,513, for the period 1st January to 14th August. In the same period seal-skins were exported valued at £4,480, and the total export reached £18,426. In return, during these seven and a half months, New Zealand took from Sydney imports valued at £9,591 15s., of which the main items were 2,120 muskets, £2,938; gunpowder, £862; flour, £787; hardware, £639; slops, £458; rum and whisky, £424. The figures, which are taken from Dr. McNab's “Historical Records of New Zealand,” Volume I, are an interesting commentary on the economic life of those early days. The Imperial Government steadily ignored New Zealand, but the lawlessness of the settlers, the constant intertribal warfare, the shameless land-grabbing, and an infamous trade in the curiously tattooed Native heads, forced the Islands upon its notice. In 1823, therefore, the Home Parliament passed an Act extending the sovereignty of the Governors of New South Wales over all British subjects resident in New Zealand. The pleas of the missionaries for complete control were, in the “thirties,” reinforced by a
more effective pressure in the Homeland itself. Wakefield, fresh from his colonizing experiment in South Australia, turned to form an association for the colonization of New Zealand. In season and out of season he pressed his views upon the Cabinet, and as one result of this, and also of fears of French annexation, Captain Hobson was sent out to obtain the cession of the country and to act as Lieutenant-Governor. He arrived in 1839, and early in 1840 was negotiated the Treaty of Waitangi, by which the Maoris recognized the sovereignty of Queen Victoria, and, in return, were secured in the ownership of their lands. The New Zealand Company colonized Wellington in. 1840. Taranaki in 1841, and Nelson in 1842, and separate associations settled Otago in 1848, and Canterbury in 1850. By 1854 there was a straggling population of 32,554 scattered over the Islands. From 1840 to 1841 New Zealand was a dependency of New South Wales, and from 1841 to 1853 it formed a separate Crown colony. Land troubles and quarrels with the Maoris reduced the settlements almost to ruin, and Sir George Grey was hurriedly sent from South Australia to take control of New Zealand. In 1852 the Imperial. Government passed the Constitution Act, which gave New Zealand a representative National Assembly.
Before 1853 the foreign trade statistics were kept, more or less completely, by the local governing authorities, but the trade was so very small that its interest is for the historian rather than the economist. With the constitution of a national Parliament, depending for its revenue mainly on Customs duties, a colonial Department of Customs took over the collection of the revenue, and incidentally the compilation of the statistics. From 1853, then, there are complete statistics of New Zealand's foreign trade, and therefore this year forms a good starting-point for an investigation of this kind.
There seems never to have been any systematic investigation of the nature and changes of New Zealand trade, and there is a wealth of information, yet untouched, lying' in the blue-books.
The main objects of the following thesis are four:—
To trace the growth of the foreign trade for the sixty-two years 1853–1914, and to correlate it with the outstanding features of New Zealand's industrial and political history.
To ascertain and sot out clearly the character of the trade, the nature of its imports and exports, and, if possible, to trace any tendencies to change in their nature.
To examine the distribution of the trade over the various countries participating in it, and to discuss the question of markets.
To examine how far the foreign trade of New Zealand is an index of prosperity.
It will be evident that very big issues are raised. For instance, in the third object set out, the question at once crops up, what has been the influence of the preferential tariffs? It would need a far more detailed investigation than this can hope to be to answer that question at all adequately, and the consideration of this and other questions must be postponed for another occasion.
Sources of Information.—Influence of Tariff.—Method of Entry.—Accuracy of Statistics.
All the data used is found in the Statistics of “Trade and Interchange” compiled by the Department of Trade and Customs, and published annually in the “Statistics of New Zealand.” From 1853 this Department has been under the control of the Colonial Government, and the methods of compiling the returns have changed very little. The information is obtained locally from importers and exporters, and up till the beginning of 1914 was tabulated in the local offices, each of which sent its finished return to Wellington to be combined with the rest into the statistics of the colony.
The returns from 1853–56 were compiled in 1858 from the local returns, and in presenting them the Registrar-General claimed they were accurate. From 1858 till the present date the blue-books have appeared annually, and are supplemented by various progress and partial returns published at intervals. The form of the returns is practically unchanged since 1859, but previous to that year the totals for New Zealand have laboriously to be added from the figures for each port. From 1853–56 no information is given as to the distribution of the trade over the various countries, except the rough classification between United Kingdom, British colonies, and foreign countries; but for all practical purposes we may assume the trade to be confined to the United Kingdom and Australia.
The exports remain essentially unchanged from earliest times. They are the natural products of a country rich in mineral, agricultural, and, above all, pastoral wealth: i.e., they consist mainly of raw materials and foodstuffs. There has been, of course, some shifting of relative importance, and one great export—frozen meat—does not appear till the late “eighties”: some other new exports, principally by-products of the meat industry, have also appeared: but in 1914, as in 1853, the exports are products of the soil. Such products are easy of classification, and are fairly homogeneous, and therefore there has been little change in export headings. The length of the export returns nowadays is a result of the inclusion of numbers of items of re-exports of little relative importance.
The import trade presents greater difficulties, owing to the greater variety of articles, to their nature, and to the fact that the revenue question supervenes. New Zealand imports practically all kinds of manufactured articles from building-materials to soaps, and some raw materials, such as pig iron, oils, and even timber. From the Customs revenue is derived a great deal of the money needed to support New Zealand's ever-increasing governmental activities. Naturally, in the early days of New Zealand's history, Customs and excise duties provided almost the whole of the revenue. Even in 1899–1900 direct taxation amounted only to 25 per cent. of the total taxation. Now, of course, New Zealand provides many governmental services, such as advances to settlers and workers, life and fire insurance, &c., which are made to pay for themselves: but, even excluding them, the proportion of revenue derived from the Customs is now only 64 per cent. of the tax revenue, leaving about 36 per cent. derived from direct taxation. The import statistics are naturally enumerated under their tariff headings, and the number of these headings grows apace. Under the latest tariff (1907)' the number exceeds five hundred. The tariffs have been frequently changed: there were fifteen different Acts before 1895, and the five years 1878–82 show annual alterations. In 1893 the Liberal-Labour party came into power pledged to its programme of experiments in State socialism, as they have been called, including compulsory arbitration, land-settlement by progressive taxation and compulsory purchase, advances to settlers, old-age pensions, and even State trading in coal and fire insurance. This programme involved the necessity for high protection, but also for a greater revenue. Money was urgently needed to foot the hill for the establishment of State enterprises, while at the same time the Arbitration Courts were meant to go hand in hand with protection to local industry. The result of the conflicting claims of protection and revenue has been a moderate protection and increased revenue duties. A Tariff Commission was appointed in 1895 to gain information and recommend alterations in the tariff. The result was the big tariff of 1895, widened in 1900, and made more complex by the introduction of British preference in 1903. Finally, in 1907, the preferential system was extended and protection increased, while the revenue duties were also increased.
The great effect of these changing tariffs on the returns has been to cause greater subdivision of headings. Always the number of headings gets bigger and bigger. Trade grows and naturally becomes more complex, individual or group interests work for exemption or protection, information is required on special subjects, and every succeeding list of headings contains more items. The list just issued (1914) contains 903.
In 1853 the imports into New Zealand were valued at £600,000; in 1912 they were valued at more than £20,000,000. Such an enormous increase necessarily means the introduction of new commodities and variation of quality and species of commodities formerly imported. Where in 1853 the import trade was comparatively simple, it is now exceedingly complex. Such goods as pneumatic rubber tires, motor-cars, electrical machinery and appliances are the production only of very recent years, and this cause has contributed largely to the greater number of headings. Comparisons of trade, which has widened so much, can properly be made only over short periods.
A comparison of the modern returns with those of 1853 seems at first sight absurd. The modest list of general headings in the early days hardly seems to provide the germ of the so-greatly increased and varied trade of 1912. But the change in continuous, and comparisons are made year by year rather than over long periods, and therefore the difficulty is not as great as at first appears.
Introduction.—Turning now to study in more detail the method used, it is advisable still to separate imports and exports. As stated before, the collection of the revenue has great influence on the import statistics. Primarily, the Customs Department exists to collect duties, and the preparation of the statistics is left, naturally, to junior clerks, who are in process of training to qualify themselves for what is regarded as the more important work. The New Zealand Customs tariff is marked by the variety of articles over which it spreads its revenue net and by the liberal use of ad valorem duties. Moreover, the different classes of goods are often distinguished by purely arbitrary lines—for instance, tea, if British, is free of duty when packed in boxes over 5 lb., and liable to a duty of 2d. per pound when in smaller packages; and added to this is a preferential surtax of 2d. per pound for tea in bulk, and ⅖d. per pound for tea in small packages. Similarly, chocolate confectionery pays 20 per cent. if it is “in small packages for retail sale,” and 3d. per pound if “in plain trade packages,” while there is a preferential surtax of one-fifth in each case; and the distinction between slippers and shoes, between dairying machinery or woollen-mill machinery and other machinery involves differential rates of duty, and therefore arbitrary distinctions must be drawn. If the spots on certain cloths are woven by a second operation the cloths are dutiable; if woven simultaneously with the cloth, they are free. Enough has been said to show that it is absolutely necessary that all imports should be fully and accurately described. The Department insists on this, even to a slavish imitation of the exact wording of the tariff headings.
Goods may be imported only at a port of entry, of which there are twenty in New Zealand, and in any case the ships can go only to the bigger and better developed harbours. The ship furnishes a manifest made up from the bills of lading, each item of which has to be accounted for by an entry from the importers. Those entries must be supported by the original manufacturer's invoice for all goods, free or dutiable. The production of this invoice serves four purposes. It (1) checks the importer's description of the goods; (2) gives the value for ad valorem rates of duty: (3) provides the preferential certificate; (4) gives accuracy to the statistics.
Values.—All goods imported must be shown at the fair market value in New Zealand—that is, the value is shown c.i.f.e., except in the case of goods liable to ad valorem duty, which, for the sake of uniformity, are assessed at the f.o.b. price plus 10 per cent. to cover insurance, freight, &c. Thus the imports are reckoned at their value landed in New Zealand. There still remains the definition of that value. Any one familiar with mercantile invoices will recognize that on one invoice there may be several values, owing to the system of discounts. In assessing the value for duty some discounts are allowed, and some—broadly, all special discounts below the ordinary market rate—are disallowed. The Customs Law Act, 1913,
allows the deduction of the usual 2½ per cent. cash discount, and this alone may make a difference of ½ per cent. in the total value of imports.
Particular care is shown in getting correct values, especially for ad valorem goods. Besides insisting on the production of invoices the Customs Department provides a careful check, both locally and in Wellington, on all commodities for which quantities are stated as well as values. The margin of error is therefore very small indeed, and in certain cases, such as boots and shoes, where there are fixed rates of duty in addition to ad valorem rates, both the quantities and values are as accurate as care can make them.
Classification.—In a trade spread over so many and so diverse items the problem of classification and tabulation becomes acute. On the one hand there is always a demand for greater subdivision and elaboration of the classes, on the other the labour and loss of accuracy involved in diffusion. The result must always be a compromise, more or less satisfactory. So in the statistics of New Zealand we have, broadly, three main types of headings:—
Definite commercial terms, such as “building-cement,” “kerosene,” “salt.”
Generic terms, such as “apparel,” “fancy goods,” “hardware.” (3.) Subdivided items, such as machinery divided into its various classes—e.g., “dairying,” “agricultural,” “woollen-milling”; and then into sub-classes—e.g., “agricultural” into “harrows, disc and other kinds,” “ploughs,” “binders,” &c.
Partly owing to the necessities of the tariff, and partly because of requests either from Parliament or from merchants for more detailed information, the tendency is always in the direction of greater subdivision. This tendency is of practical use to persons interested in special items; but it greatly increases the work of tabulation, and also obscures the main classes of imports. The practical importance of this subdivision is that it may throw light on some nascent trade. For instance, a growing import of corsets from Canada was lost in the big heading of “apparel,” and the imports of rubber heels from the United States of America were merged into the general heading of “grindery.” Of course, there is room for much cross-classification—for instance, between hosiery and apparel. Speaking generally, we may conclude that the statistical headings are well adapted for providing detailed information about the several items, but the general tendencies of the trade may easily be overlooked.
Quantities.—Very many items in the statistics show quantities as well as values, and this information is valuable because of the check it yields on the values and the information it affords about changes in price. But if the heading is not homogeneous, or if the commodity is not usually sold by the unit of quantity supplied, the information may become useless. Where leather is sold by the foot it is absurd to ask for the quantity in pounds. Instances may be given of quantities rendered valueless because they do not represent homogeneous commodities. Iron pipes and fittings require the weight, but the heading includes plain large pipes and elaborate fittings; hats and caps range from cloth caps to expensive panamas, yet the number of dozens is required; firearms may include sporting rifles each valued at £50 or more, or revolvers costing only a few shillings; anchors may be little kedge anchors or big ships' anchors; iron tanks, usually worth £3 to £5 each, include brewers' tanks valued up to £400 each; sowing-machines may be household machines or elaborate affairs for boot-factories. Some of these cases call for subdivision, but in some the provision of quantities is causing both merchants and officials unnecessary work and annoyance.
Ports of Shipment and Country of Origin.—There is always a real difficulty in assigning imports to any definite exporting country. Not only are goods often bought in a country different from that of their origin, but more often than not an article is the product of more countries than one.
Up till 1914 it was the practice to credit imports to the country whence they were shipped originally. The rule was to credit transhipments to the country where the through bill of lading was taken out; but in practice these transhipments were very often missed. Then, too, trading countries like Belgium and Holland gained much of the credit for German, Swiss, and Austrian transhipments. A great quantity of goods coming to New Zealand from the East, or from the United Kingdom and Europe via Suez, and shipped finally from Australia, was put down as imported from Australia. American goods coming via Vancouver, and Canadian goods coming via New York, also caused' trouble.
Since the beginning of 1914 importers have supplied both the country of origin and the country of shipment, and the system of tabulation has been changed to that extent. This has caused a break in the continuity of the statistics, and great care will have to be used in comparisons with previous years. For instance, in 1914 our imports from Germany by direct shipment were £620,400; but the new statistic of the country of origin showed £1,016,016 produced in that country.
Method of Recording.—The exports of New Zealand are very different from the imports, and the problems of tabulation are also quite different. The commodities are fewer, are homogeneous, and are handled in bulk. The classification has changed little from the earliest times—and, indeed, the main commodities are capable of little alteration. There have been some new exports evolved, notably frozen meat, but there has been little development of manufactures in New Zealand, and the exports still are distinct commodities like wool, butter, cheese. In theory the statistics of exports are compiled in the same way as those of imports. Each ship furnishes a manifest of cargo, the ports collect the entries locally, check and partially tabulate the information given, and send forward their returns to Wellington. But there can be no production of invoices, owing to the special nature of the goods, and, since no revenue is derivable from exports, there is a tendency among officials to consider the export statistics of little importance.
Quantities.—The quantities of the main exports are very valuable statistically, especially when, as we shall see, a check is needed upon the values. These quantities are reliable, and are usually stated exactly from railway weights or from tallies at the ship's side. But even here there are sometimes given useless figures—e.g., the number of dozens of rabbit-skins. This number is usually obtained by averaging so many to the pound weight.
Values.—Exports are required to be shown at their value when leaving New Zealand—that is, f.o.b.—but peculiar difficulties at once arise. Most of the exports are shipped on consignment, to be sold in London in six weeks' time for what they will fetch, and therefore their values must be estimated. This statement applies to practically all frozen meat (very little of which is supplied on standing orders), to most of the dairy -produce, and, according to Dalgety and Co.'s estimate, to nearly GO per cent. (58 per cent.) of the wool. These three—wool, frozen meat, and dairy-produce—are the three largest items of exports, and therefore it is evident that this question is important.
There are very obvious dangers of wrong estimation. Cases have been known where goods were estimated at ruling London prices—i.e., c.i.f.e. instead of f.o.b. Many firms have a routine standard to which they rigidly adhere: one big firm of wool-exporters admitted having, for the last five years, averaged all their wool, of whatever kind, at 10d. per pound; a big steamship company averages all its coal at £1 per ton; some firms put in all their cheese at a uniform rate of 6d. per pound. A curious instance of this occurs in the export of horses. It is usual for a large number of New Zealand racehorses to compete each year at the big race meetings in Australia, and besides there is a fairly constant export of working-horses. Under the mercantile law a horse can be insured for £15 only, and as it is usual for the shipping companies to furnish these export entries most of the horses are valued at £15 each, whereas a good carthorse is worth £50, and some of the racehorses are valued at thousands of guineas.
There is always a danger of misconception of value required. For instance, two big meat companies were working in the same province, on identical materials, and supplying the same markets, and yet one priced mutton at 3¾d. per pound, and lamb at 5¼d., while the other priced them at 3d. and 4½d. The divergence was explained by one company's clerk admitting that he thought the Customs required an absolutely bedrock price below which the actual price would not fall.
Even if the entries were correctly and perfectly compiled there remains the risk of miscalculation due to interim changes in the London market. Speaking at Wellington on the 27th May, 1914, the president of the Wellington Chamber of Commerce said, “Another source of misunderstanding lies in the fact that, while the value of our imports may be more or less accurately arrived at by means of Customs invoices, the values given to our exports are largely a matter of guesswork. What they actually realize at Home may be considerably higher or lower than the value given in the export entry here. In wool alone this difference may run into a million or so, and there is no doubt that for the year 1912–13 the wool sent Home for sale did realize much more than it was valued at here.”
It must be admitted, then, that the export values are not as reliable as import values nor as export quantities. The Department takes every precaution to check the values by customary prices, by ruling prices, or by average quotations from leading merchants. For some time a copy of the returns was sent for checking to the local Chambers of Commerce, and at the present time some of the principal firms have agreed to furnish quotations from time to time. There is a regulation that requires the signature of a responsible officer of the firm on export entries for staple commodities, and this points to the real remedy. Once the merchants recognize that the statistics are compiled for their benefit mainly a great stop forward will have been made. Some firms and some Chambers of Commerce take a keen interest in the work, and give the Customs Department valuable help, but others resent any effort made for greater accuracy. The influence of the Customs clerk in keeping a careful check on values varies with the individual, but often exports are relegated to very junior clerks, who are content with book-accuracy.
It is usual to argue in cases of this kind that errors will not be biassed in any one direction, because the underestimates will just about balance the overestimates; but the words I have quoted from the president of the Wellington Chamber of Commerce suggest that it is quite possible for a miscalculation to bias a whole year's return. This refers, of course, to a change in the prices in the Home markets. Except in special cases, such as the value of horses, we may fairly assume that the clerical errors counterbalance one another, and, as the statistics are compiled in the same way each year, it is only abnormal conditions such as those quoted which vitiate comparisons. A better index of the volume of trade, though not, of course, of the prosperity it brings, is gained by tabulating the quantities exported. This method ignores the influence of prices as well as miscalculations.
In Chaper III an index number of exports is given, taking the actual quantities at the price of a base year.
Destination of Exports.—New Zealand sends most of its exports to the United Kingdom—in 1912, 77 per cent. Comparatively little goes direct to the Continent, to the United States of America, or to Canada, though no doubt much wool is distributed to the Continent from the London wool-sales. The old difficulty of the commercial ports, like Antwerp and Dunkirk, crops up again, but is of little importance here. The opening of the Panama Canal, the lowering of the United States tariff, and the prospect of Continental markets being opened up, together with the introduction of new lines of steamships, would seem to promise a wider distribution of trade in the future, but in the meantime the question is not of first importance.
The previous chapter will have shown that the imports of New Zealand are radically different from her exports. All countries are forced to import exotic products or any articles which cannot be as cheaply and easily produced as in other lands (taking the principle of comparative cost as standard). Thus New Zealand imports articles, such as tea, tobacco, and tropical fruits, which it is not possible to produce in the country itself; but she also imports a great quantity of raw materials which could be produced here, but which can be more easily imported from other countries. Though there are promising oilfields in Taranaki, the Standard Oil Company floods New Zealand with petroleum oils and by-products at a price which forbids native competition. Enormous quantities of preserved fish are imported, while the waters of New Zealand teem with fish, and the fishing industry remains undeveloped. The west coast of the South Island provides the very finest steam-coal; but it pays New Zealand to import the cheaper coals from New South Wales. A sample of New Zealand timber sent to England recently was found to be quite suitable for the manufacture of paper, yet all the paper used in New Zealand is brought from England and Canada. The importations of timber come under a different heading: New Zealand exports white-pine for butter-boxes and kauri for furniture, but imports Oregon pine for building, and hardwoods, mainly jarrah, for building and for railways. But sooner or later there is bound to come a demand for high protection to develop the untouched resources of New Zealand. It is conditions such as I have stated which make the statesmen, and even the economists—witness Carey and List—in new countries loan towards protection.
Leaving these special cases, we come to the broad distinction between imports and exports. Broadly we may say that New Zealand exports raw materials and foodstuffs, and imports manufactures and luxuries. It has been shown before how the imports are divided up into a great number of headings; but it is possible to divide out some main groups, and the following are representative:—
Clothing and textiles: Including apparel, cottons, boots, drapery, haberdashery, hats, hosiery, linens, millinery, silks, and woollens.
Metals, hardware, and machinery: All metals, but mainly iron and stool, raw and manufactured; all kinds of machines and tools, hardware, and manufactures of metals.
Paper, books, and stationery.
Luxuries: Liquors, tobacco, fancy goods, toilet preparations, dried fruits.
Exotics: Oils, timbers, fish, paper, salt, tea, sugar, and spices.
An attempt has been made to trace out the imports of certain articles which yield interesting information, and there has been taken first the three big headings—(1) Clothing and textiles; (2) motels and hardware; (3) paper and books: and then some luxuries and exotics—tea, sugar, liquors (which are specially interesting in view of New Zealand's licensing legislation), tobacco, and oils. Coal is also included.
The exports are, from their nature, easier to handle. If we exclude a comparatively small proportion of manufactures sent to the islands and the re-exports of unsold and worn-out stocks, all the exports of New Zealand are “special.” A table of goods “not the produce of New Zealand” exported during the period is included. All the main exports are the produce of New Zealand.
In the Statistics the exports were, till 1914, classified according to the following plan; but in 1914 the fourth heading was altered to “Pastoral Products,” and the sixth to “Miscellaneous.”
the mine: Gold, coal, silver, &c.
the fisheries.
the forest: Fungus, kauri-gum, and timber, &c.
Animals and animal-products: Moats, butter and cheese, hides, livestock, casings, skins and tallow, wool, &c.
Agricultural: Bran, chaff, flour, grains, hops, potatoes, seeds, &c.
Manufactures: Mainly leather and phormium—neither of which can properly be termed a manufacture. The fibre of the native flax. (Phormium tenax) is stripped and partly dressed, and sent Home to be manufactured into rope, &c.: the article as it leaves New Zealand is still a raw product.
In analysing the exports typical commodities are taken from the classes summarised above—(1) Coal and gold; (3) timber and kauri-gum; (4) wool, butter, cheese, frozen meats, tallow, rabbit-skins, while casings, skins, hides, have been grouped in one heading; (5) flour and grains (6) phormium. In all these items, only the combined item of by-products cannot be quoted in quantities, and the quantities of all the others have been tabulated, for two reasons —to show the changes in price, and because of the doubtful reliability of the values. (See Chapter II, “Export Values.”)
The question at once arises, why should New Zealand export her products and then very often reimport them manufactured? This query is very often raised, and there is much popular misunderstanding of the subject. The answer is, of course, that it pays New Zealand to do so, and, as will be shown later, pays her handsomely. New Zealand would, at the present time, actually lose rather than gain by manufacturing her own products. Division of labour has been carried very far in modern business, and specialism reaches its highest point in territorial division of labour. We see England drawing her wheat from Russia, United States of America, Canada, &c.; beef from Argentine; cotton from the United States and Egypt; wool and mutton from Australia and New Zealand; and in return sending her manufactures all over the world Yet England can grow perhaps better mutton and wool, beef, and wheat, and make better butter, than she imports; but she cannot make such profits from them as from her ironworks and her manufactures.
Thus the general nature of New Zealand's foreign trade is a striking inductive proof of the comparative-cost theory. Manufactures in New Zealand are restrained by a variety of hindrances, prominent among them being the lack of capital, the high scarcity price of labour, the scarcity of some raw materials, especially iron, and the inaccessibility of others, such as coal. But the greatest drawback of all is indirect. No amount of protection, no growing feeling of nationalism, counts for very much against the solid fact that the primary industries yield higher profits than manufactures.
After the great borrowings of Vogel in the early “seventies” and a long period of falling prices. New Zealand fell into a slough of depression, from which she was rescued by two main factors—refrigeration, and rising prices of farm products. The first cargoes of frozen meats were sent to England in 1882, and in 1895 the prices of raw materials and foodstuffs, as collected by Dr. McIlraith, show a decided rise. Moreover, his prices of non-farm products show a fall, and in both ways these changing prices help New Zealand by giving greater purchasing-power to her exports and reducing the price of her imports. New Zealand's prosperity depends vitally on the price of wool and of her other big exports.
In the Statistical Journal for December, 1911, Hooker has compared prices for several countries, and shows that in each case prices rose from 1850 to 1873 and fell from 1873 to 1895, and have risen since. He notes the distinction between the secular movements of prices and the fluctuations about the trend, and in both cases his index numbers show approximately the same movements as Dr. McIlraith's index for New Zealand. Sauerbeck's index number of raw materials rises from 94 in 1895 to 127 in 1916. The Board of Trade shows the same rise—92 to 133. In foodstuffs Sauerbeck shows a rise from 93 to 108; the Board of Trade index reached its lowest level in 1896 at 90, and had risen by 1910 to 105. There is no doubt of the substantial rise in the prices of raw materials and foodstuffs from 1895 onwards, and it is equally certain that much of New Zealand's prosperity since that time has been the result of these rising prices.
So it is folly to complain of rising prices in New Zealand, unless, indeed, it can be shown that the benefit goes exclusively to one particular class, and this is improbable, if not impossible. The days when mutton was almost given away were the days of the public soup-kitchens and retrenchment in public and private expenditure. Increased export has meant higher prices in New Zealand, but it has also meant unexampled prosperity.
The report of the Royal Commission on the Cost of Living in New Zealand (1912) contains much interesting information concerning the relation of the standard of comfort to the cost of living in New Zealand during the last twenty years. Various tests are made to ascertain whether the standard of comfort has risen in New Zealand since 1895, and each test seems to prove a great increase. The per capita consumption of tea has increased 25 per cent., and that of sugar nearly 50 per cent: Dr. McIlraith in his evidence worked out a table of prosperity, judged by the volume of goods consumed, and the index for 1906–10 stands at 188 compared with 98 in 1887–91. Moreover, Dr. McIlraith stated that he considered this advance in prosperity was directly due to “the extraordinary rise in the price of exported farm-products,” and this opinion is endorsed by the Commission.
Other tables show all the usual accompaniments of prosperity to be apparent—a rising marriage-rate, a falling birth-rate, and a falling bankruptcy rate. In addition, the evidence throughout shows that people are demanding better-quality goods, and the Commission reports definitely a great increase in the standard of comfort since 1895.
The mercantilist theory of trade is palpably false when applied to New Zealand. Here statesmen and financiers are uneasy if the imports exceed exports. Usually an excess of exports amounting to about £3,000,000 per year is regarded as normal, and this represents part of the interest payable on New Zealand's debts, public and private.
For a country dependent, as New Zealand is, upon foreign trade for the marketing of its products, imports and exports are no moan index of prosperity. Almost universally, exports are regarded as the better criterion; but it has been shown that they must be interpreted carefully because of the doubtful values. The quotation in Chapter II from the president of the Wellington Chamber of Commerce shows the need for careful interpretation. But popular judgment is right in regarding exports as a more reliable guide than imports. The third graph following Table A strikingly shows the relations between imports and exports. In the early years, when New Zealand may be said to have been in leading-strings, changes in exports follow changes in imports, a year later; but since 1895 changes in exports precede changes in imports, and this was shown clearly in the set-backs 1900–1, 1904–5, 1908–9. The obvious explanation is that the imports depend largely on the quantities and prices of the last season's exports, and this is borne out by a survey of the facts. The farmer gets the result of his season's output and distributes it to merchants, either directly or indirectly, through the banks: on the amount of capital thus distributed largely depends that important commercial conception “the state of credit,” and this determines the trader's estimate of his next year's imports.
I am aware that current economic opinion is that imports form a better index of general prosperity than do exports, but I cannot help thinking that this judgment has been formed by the environment of older countries. For instance, Mr. J. A. Hobson, in his “International Trade,” argues that increased export may mean a restriction of the home market. But the argument may be turned round: increased imports may mean a failure of the home harvest. Mr. Hobson seems to be arguing from the position of the United Kingdom; but the doctrine cannot be easily transferred to a new country such as New Zealand, where conditions are quite different. In New Zealand, practically the whole of the production of the staple commodities is for the home market, and on the prices received for the season's wool and meat and butter depends New Zealand's economic position. It will be shown in Chapter IV how the good years of exports are followed by high prices, and vice versa, and Dr. McIlraith has shown the intimate connection between the price of farm-products and the general prosperity of the country.
It is relevant here to refer to a statement often made, that New Zealand meat, butter, &c., is often sold in London at lower prices than in New Zealand. As a matter of fact the statement is wrong: the retail price in London is well above the retail price here, except in abnormal times. But people have been known to compare wholesale prices in London with retail in New Zealand, and,' moreover, to compare prices at different seasons and for different qualities of the commodity. Closely allied to this misstatement comes the proposal often made to put an export tax on meat to bring down the price, or on wool to cause it to be manufactured in New Zealand. The folly of these proposals is apparent; but they seem to gain a certain credence. It cannot be emphasized too often that the high price of living in New Zealand is simply a corollary of the high export values, and that on these export values depends the prosperity of New Zealand.
In a preceding chapter the methods of compiling the returns have been analysed. The data is collected and tabulated at the local offices, and finally tabulated in Wellington at the Head Office of the Department of Trade and Customs, and published in the “Statistics of New Zealand.” Questions of definitions must be settled before we proceed to study the changes in New Zealand's trade. The Dominion of New Zealand consists of a number of islands besides the three comprising the main group, and, while some of the outlying islands are barren rocks, others are fertile and support a fairly numerous population: such, for instance, are the Cook Islands and the Chatham Islands. The great bulk of New Zealand's foreign trade comes from the two main Islands, and the Chatham Islands as well as Stewart Island are forced, from lack of steamer accommodation, to send their trade through the big ports of the mainland. The wool of the Chathams is gathered by small steamers, working surf-boats, and shipped from Lyttelton or Wellington, the case of the Cook Islands is different. Up to and including 1901, the date of their incorporation in the Colony of New Zealand, the Cook Islands were treated, like the other Pacific islands, as countries foreign to the Dominion, but since then they have been honoured with a special return to themselves. Their imports are supplied by New Zealand merchants, and the island trade is the only entrepôt trade possible to New Zealand. The main export is fruit, practically all of which is absorbed by New Zealand: some copra appears in the Dominion's export returns as well as in the imports from Cook Islands. The figures shown in the annual statistics, therefore, represent the trade mainly of the two bigger Islands, inclusive of the Chathams, but exclusive of the Cook Islands.
Having settled the question, What is New Zealand? we must decide the definition of New Zealand's trade. The “total” trade has been taken as including specie, because it would have required a good deal of work to separate specie in the early years; and in any case the flow of specie, though not a very big item, is an essential part of the real trade account. New Zealand is hardly affected by foreign drains of specie or bullion bars, as older and larger countries are. So the figures quoted represent all the imports into New Zealand, and all the exports, special and other, from New Zealand.
Necessarily the first step was the tabulation of the trade. Then it has been analysed in various ways. The figures for the total trade, imports and exports, are shown in all the later blue-books as from 1870, and a statistical summary of New Zealand for each year since 1853 is published annually, giving sonic of the special exports and the total imports.
It has been necessary to obtain the export totals previous to 1870 directly from the blue-books. The tabulation of the actual figures of the Dominion's trade is in itself instructive, and the course of trade is easily connected with the well-known facts of New Zealand's history.
In 1853 the population of New Zealand, exclusive of Maoris, was 32,000; in 1914 it was 1,100,000; and we must bear this increase of population continually in mind when considering the growth of trade. The population return has been put side by side with the figures for trade, and a rough calculation of the trade, corrected for population as well as for prices, has been made.
This brings us to the fact that New Zealand trade is vitally dependent upon the course of prices. The general level of prices is the name for the economic conception of the purchasing -power of money, and this purchasing-power is constantly changing. Its changes are due to the many factors which are comprised in Professor Fisher's equation of exchange, including the indirect influences at work on M, M', V. V, and T. If the changes in the ratio were uniform and calculable the variation of price-levels would not affect the world's trade. But they are neither uniform nor exactly calculable. When gold, and consequently money, which is based on and expressed in terms of gold, appreciates in value the prices of commodities do not fall equally, but some lag behind others. Changes in price-levels come broadly from two sources—changes in the supply of the money commodity or its substitutes, and changes in trade (the demand for it). Then there may be a general movement in the local price-level, resulting from changes in the world's price level, and also local changes. It is pointed out later how the changing price-levels have affected New Zealand's foreign trade. Account has therefore been taken continually of changes in the population, in the general price-levels, and in particular, price-changes.
The course of trade from year to year is naturally fluctuating, and this tends to obscure the general trend. Much of New Zealand's trade is seasonal, and the seasons overlap the calendar years. For instance, frozen meat is exported from December to July, wool from October to February; the summer drapery comes in about September, the winter drapery about March. One effect of this seasonal trade is seen in the migratory labour—men begin shearing in Australia in early spring, cross over to New Zealand and work from north to south, perhaps take a turn at slaughtering, and then cross again to Australia for the shearing in the next spring. It is obvious that, with the wool season overlapping the calendar years, not too much reliance should be placed on the statistics for any particular year. Shearing or harvest may be delayed by bad weather, or be very early in a good season. The movements of ships, the promptitude or slackness shown in presenting the entries from which the statistics are compiled, considerations of price causing changes in the amount of a commodity offered or held back—all these causes may inflate one calendar year at the expense of another. Tile device of moving averages has therefore been used to show the general trend of the changes.
Investigations begun by Professor W. S. Jevons, and developed by his son, point to a cyclical movement of trade. The cycles have been found to vary about a period of three years and a half, and it is advisable in forming moving averages to take some multiple of 3½. Commercial crises usually occur at intervals of about ten years, and the period of a decade is fairly close to a multiple of three years and a half; and so decade averages have been largely used in this paper.
The data lends itself easily to graphical treatment, and graphs have been introduced freely. These will, it is hoped, help to illustrate the points made in the discussion of the tables, as well as convey a better impression of the course of New Zealand's trade than columns of figures are apt to do.
The following tables and graphs have been prepared to illustrate the growth and the changes of trade:—
Actual figures (to the nearest £00,000) of the value of the total trade, imports, exports, and balance of trade.
Moving averages, quinquennial and decade, from the data of the previous table. Curves of the total trade, imports and exports, compared with the curve of population, and smoothed curves of the average trade.
Index numbers of trade based on the decade 1890–99.
An index number of the total trade, corrected for changes in the general level of prices and in population, illustrated by a curve based on the table.
Imports corrected for prices of non-farm products, accompanied by a graph.
An index number of imports taking the quantities of each item at the average prices of the decade 1890–99.
A table showing the proportions of special (i.e., produce of New Zealand) exports and re-exports of foreign goods.
The percentage increases, annual and decade, of the total import and export trade, illustrated by graphs of these figures. A logarithmic curve of the total trade.
| TABLE A.—EXTERNAL TRADE OF NEW ZEALAND (INCLUSIVE OF SPECIE). | ||||||
|---|---|---|---|---|---|---|
| Year. | Total. (£00,000 omitted.) | Imports. (£00,000 omitted.) | Exports. (£00,000 omitted.). | Balance. | Population. (00,000 omitted.) | |
| Imports. (£00,000 omitted.) | Exports. (£00,000 omitted.) | |||||
| £ | £ | £ | £ | £ | ||
| 1853 | 9 | 6 | 3 | 3 | .. | 3 |
| 1854 | 12 | 9 | 3 | 6 | .. | 3 |
| 1855 | 12 | 8 | 4 | 4 | .. | 4 |
| 1856 | 10 | 7 | 3 | 4 | .. | 5 |
| 1857 | 14 | 10 | 4 | 6 | .. | 5 |
| 1858 | 16 | 11 | 5 | 6 | .. | 6 |
| 1859 | 22 | 16 | 6 | 10 | .. | 7 |
| 1860 | 21 | 15 | 6 | 9 | .. | 8 |
| 1861 | 39 | 25 | 14 | 11 | .. | 10 |
| 1862 | 70 | 46 | 24 | 22 | .. | 13 |
| 1863 | 104 | 70 | 35 | 35 | .. | 17 |
| 1864 | 104 | 70 | 34 | 36 | .. | 17 |
| 1865 | 93 | 56 | 37 | 19 | .. | 19 |
| 1866 | 104 | 59 | 45 | 14 | .. | 20 |
| 1867 | 100 | 53 | 46 | 7 | .. | 22 |
| 1868 | 94 | 50 | 44 | 6 | .. | 23 |
| 1869 | 92 | 50 | 42 | 8 | .. | 24 |
| 1870 | 95 | 46 | 48 | .. | 2 | 25 |
| 1871 | 94 | 41 | 53 | .. | 12 | 27 |
| 1872 | 103 | 51 | 52 | .. | 1 | 28 |
| 1873 | 121 | 65 | 56 | 9 | .. | 30 |
| 1874 | 134 | 81 | 53 | 28 | .. | 34 |
| 1875 | 138 | 80 | 58 | 22 | .. | 38 |
| 1876 | 126 | 69 | 57 | 12 | .. | 40 |
| 1877 | 133 | 70 | 63 | 7 | .. | 41 |
| 1878 | 148 | 88 | 60 | 28 | .. | 43 |
| 1879 | 141 | 84 | 57 | 27 | .. | 46 |
| 1880 | 125 | 62 | 64 | .. | 2 | 48 |
| 1881 | 135 | 75 | 61 | 14 | .. | 50 |
| 1882 | 153 | 86 | 67 | 19 | .. | 52 |
| 1883 | 151 | 80 | 71 | 8 | .. | 54 |
| 1884 | 148 | 77 | 71 | 6 | .. | 56 |
| 1885 | 143 | 75 | 68 | 7 | .. | 58 |
| 1886 | 134 | 68 | 67 | 1 | .. | 59 |
| 1887 | 131 | 62 | 69 | .. | 7 | 60 |
| 1888 | 137 | 59 | 78 | .. | 19 | 61 |
| 1889 | 157 | 63 | 93 | .. | 30 | 62 |
| 1890 | 161 | 63 | 98 | .. | 35 | 63 |
| 1891 | 161 | 65 | 96 | .. | 31 | 63 |
| 1892 | 165 | 69 | 95 | .. | 26 | 65 |
| 1893 | 159 | 69 | 90 | .. | 21 | 67 |
| 1894 | 160 | 68 | 92 | .. | 24 | 69 |
| 1895 | 150 | 64 | 86 | .. | 22 | 70 |
| 1896 | 165 | 71 | 93 | .. | 22 | 71 |
| 1897 | 181 | 81 | 100 | .. | 19 | 73 |
| 1898 | 187 | 82 | 105 | .. | 23 | 74 |
| 1899 | 207 | 87 | 119 | .. | 32 | 76 |
| 1900 | 239 | 106 | 132 | .. | 26 | 77 |
| 1901 | 247 | 118 | 129 | .. | 11 | 79 |
| 1902 | 250 | 113 | 136 | .. | 23 | 81 |
| 1903 | 278 | 128 | 150 | .. | 22 | 83 |
| 1904 | 280 | 133 | 147 | .. | 14 | 86 |
| 1905 | 285 | 128 | 157 | .. | 29 | 88 |
| 1906 | 333 | 152 | 181 | .. | 29 | 91 |
| 1907 | 374 | 173 | 201 | .. | 28 | 93 |
| 1908 | 338 | 175 | 163 | 12 | .. | 96 |
| 1909 | 353 | 157 | 197 | .. | 40 | 98 |
| 1910 | 392 | 171 | 222 | .. | 51 | 100 |
| 1911 | 386 | 195 | 190 | 5 | .. | 103 |
| 1912 | 427 | 210 | 218 | .. | 8 | 105 |
| 1913 | 453 | 223 | 230 | .. | 7 | 108 |
| 1914 | 481 | 219 | 263 | .. | 44 | 110 |
| TABLE B.—MOVING AVERAGES OF EXTERNAL TRADE OF NEW ZEALAND (INCLUSIVE OF SPECIE). | |||||||||||
|---|---|---|---|---|---|---|---|---|---|---|---|
| (00,000 omitted). | |||||||||||
| Period. | Quinquennial. | Period. | Decade. | ||||||||
| Total. | Imports. | Exports. | Excess. | Total. | Imports. | Exports. | Excess. | ||||
| Imports. | Exports. | Imports. | Exports. | ||||||||
| £ | £ | £ | £ | £ | £ | £ | £ | £ | £ | ||
| 1853–57 | 11 | 8 | 3 | 5 | .. | 1853–62 | 23 | 15 | 7 | 8 | .. |
| 1854–58 | 13 | 9 | 4 | 5 | .. | 1854–63 | 32 | 22 | 10 | 11 | .. |
| 1855–59 | 15 | 10 | 4 | 6 | .. | 1855–64 | 41 | 28 | 14 | 14 | .. |
| 1856–60 | 17 | 12 | 5 | 7 | .. | 1856–65 | 49 | 33 | 17 | 16 | .. |
| 1857–61 | 22 | 15 | 7 | 8 | .. | 1857–66 | 59 | 38 | 21 | 17 | .. |
| 1858–62 | 34 | 23 | 11 | 12 | .. | 1858–67 | 67 | 42 | 25 | 17 | .. |
| 1859–63 | 51 | 34 | 17 | 17 | .. | 1859–68 | 75 | 46 | 29 | 17 | .. |
| 1860–64 | 68 | 45 | 23 | 23 | .. | 1860–69 | 82 | 49 | 33 | 17 | .. |
| 1861–65 | 82 | 53 | 29 | 25 | .. | ||||||
| 1862–66 | 95 | 60 | 35 | 25 | .. | 1861–70 | 90 | 53 | 37 | 16 | .. |
| 1863–67 | 101 | 62 | 39 | 22 | .. | 1862–71 | 95 | 54 | 41 | 13 | .. |
| 1864–68 | 99 | 58 | 41 | 16 | .. | 1863–72 | 98 | 55 | 44 | 11 | .. |
| 1865–69 | 97 | 54 | 43 | 11 | .. | 1864–73 | 100 | 54 | 46 | 8 | .. |
| 1866–70 | 97 | 52 | 45 | 7 | .. | 1865–74 | 103 | 55 | 48 | 8 | .. |
| 1867–71 | 95 | 48 | 47 | 1 | .. | 1866–75 | 108 | 58 | 50 | 8 | .. |
| 1868–72 | 96 | 48 | 48 | .. | .. | 1867–76 | 110 | 59 | 51 | 8 | .. |
| 1869–73 | 101 | 51 | 50 | 4 | .. | 1868–77 | 113 | 60 | 53 | 8 | .. |
| 1870–74 | 109 | 57 | 52 | 5 | .. | 1869–78 | 118 | 64 | 54 | 10 | .. |
| 1871–75 | 118 | 64 | 54 | 9 | .. | 1870–79 | 123 | 67 | 56 | 12 | .. |
| 1872–76 | 124 | 69 | 55 | 14 | .. | ||||||
| 1873–77 | 130 | 73 | 57 | 16 | .. | 1871–80 | 126 | 69 | 57 | 12 | .. |
| 1874–78 | 136 | 78 | 58 | 19 | .. | 1872–81 | 130 | 72 | 58 | 14 | .. |
| 1875–79 | 137 | 78 | 59 | 19 | .. | 1873–82 | 135 | 76 | 60 | 16 | .. |
| 1876–80 | 135 | 75 | 60 | 14 | .. | 1874–83 | 138 | 77 | 61 | 16 | .. |
| 1877–81 | 136 | 76 | 61 | 15 | .. | 1875–84 | 140 | 77 | 63 | 14 | .. |
| 1878–82 | 140 | 79 | 62 | 17 | .. | 1876–85 | 140 | 77 | 64 | 13 | .. |
| 1879–83 | 141 | 77 | 64 | 13 | .. | 1877–86 | 141 | 77 | 65 | 12 | .. |
| 1880–84 | 142 | 76 | 67 | 9 | .. | 1878–87 | 141 | 76 | 66 | 10 | .. |
| 1881–85 | 146 | 79 | 68 | 11 | .. | 1879–88 | 140 | 73 | 67 | 5 | .. |
| 1882–86 | 146 | 77 | 69 | 8 | .. | 1880–89 | 141 | 71 | 71 | .. | 1 |
| 1883–87 | 141 | 72 | 69 | 3 | .. | ||||||
| 1884–88 | 139 | 68 | 71 | .. | 2 | 1881–90 | 145 | 71 | 74 | .. | 4 |
| 1885–89 | 140 | 65 | 75 | .. | 10 | 1882–91 | 148 | 70 | 78 | .. | 8 |
| 1886–90 | 144 | 63 | 81 | .. | 18 | 1883–92 | 149 | 68 | 81 | .. | 13 |
| 1887–91 | 149 | 62 | 87 | .. | 24 | 1884–93 | 150 | 67 | 83 | .. | 16 |
| 1888–92 | 156 | 64 | 92 | .. | 28 | 1885–94 | 151 | 66 | 85 | .. | 19 |
| 1889–93 | 161 | 66 | 94 | .. | 29 | 1886–95 | 152 | 65 | 86 | .. | 21 |
| 1890–94 | 161 | 67 | 94 | .. | 27 | 1887–96 | 155 | 65 | 89 | .. | 24 |
| 1891–95 | 159 | 67 | 92 | .. | 25 | 1888–97 | 160 | 67 | 92 | .. | 25 |
| 1892–96 | 160 | 68 | 91 | .. | 23 | 1889–98 | 165 | 70 | 95 | .. | 25 |
| 1893–97 | 163 | 71 | 92 | .. | 22 | 1890–99 | 170 | 72 | 97 | .. | 26 |
| 1894–9 | 169 | 73 | 95 | .. | 22 | ||||||
| 1895–99 | 178 | 77 | 101 | .. | 24 | 1891–1900 | 177 | 77 | 101 | .. | 25 |
| 1896–1900 | 196 | 85 | 110 | .. | 24 | 1892–1901 | 186 | 82 | 104 | .. | 23 |
| 1897–1901 | 212 | 95 | 117 | .. | 22 | 1893–1902 | 195 | 86 | 108 | .. | 22 |
| 1898–1902 | 226 | 101 | 124 | .. | 23 | 1894–1903 | 206 | 92 | 114 | .. | 22 |
| 1899–1903 | 244 | 110 | 133 | .. | 23 | 1895–1904 | 218 | 98 | 120 | .. | 21 |
| 1900–4 | 259 | 120 | 139 | .. | 19 | 1896–1905 | 232 | 105 | 127 | .. | 22 |
| 1901–5 | 268 | 124 | 144 | .. | 20 | 1897–1906 | 249 | 113 | 136 | .. | 23 |
| 1902–6 | 285 | 131 | 154 | .. | 23 | 1898–1907 | 268 | 122 | 146 | .. | 24 |
| 1903–7 | 310 | 143 | 167 | .. | 24 | 1899–1908 | 283 | 131 | 152 | .. | 20 |
| 1904–8 | 322 | 152 | 170 | .. | 18 | 1900–1909 | 298 | 138 | 159 | .. | 20 |
| 1905–9 | 337 | 157 | 180 | .. | 23 | ||||||
| 1906–10 | 358 | 166 | 193 | .. | 27 | 1901–10 | 313 | 145 | 168 | .. | 24 |
| 1907–11 | 369 | 174 | 195 | .. | 20 | 1902–11 | 327 | 153 | 174 | .. | 22 |
| 1908–12 | 379 | 182 | 198 | .. | 16 | 1903–12 | 345 | 162 | 183 | .. | 20 |
| 1909–13 | 402 | 191 | 211 | .. | 20 | 1904–13 | 362 | 172 | 191 | .. | 19 |
| 1910–14 | 428 | 204 | 224 | .. | 21 | 1905–14 | 382 | 180 | 202 | .. | 22 |
The first outstanding feature of the Tables A and B is the enormous growth of trade that is represented therein. A total trade of about £900,000 in 1858 grew to £10,400,000 in ten years, and to nearly £50,000,000 in 1914. Such wonderful growth speaks volumes for the resources of a country so young and so small. Nor is its development likely to decrease; indeed, the later years show a continuous and rapid increase; the trade has doubled since 1899, and trebled since 1895. A trade valued at £900,000 was enormous for 32,000 settlers in a young country; but a great part of that trade represented borrowed capital imported to sustain the settlers; and to develop the country. The trade of 1914—£48,100,000—for just over a million people is oven more wonderful, because now the Dominion is paying back the interest for its loans, and still producing greater and greater surpluses of products, which swell first the export and then the import returns.
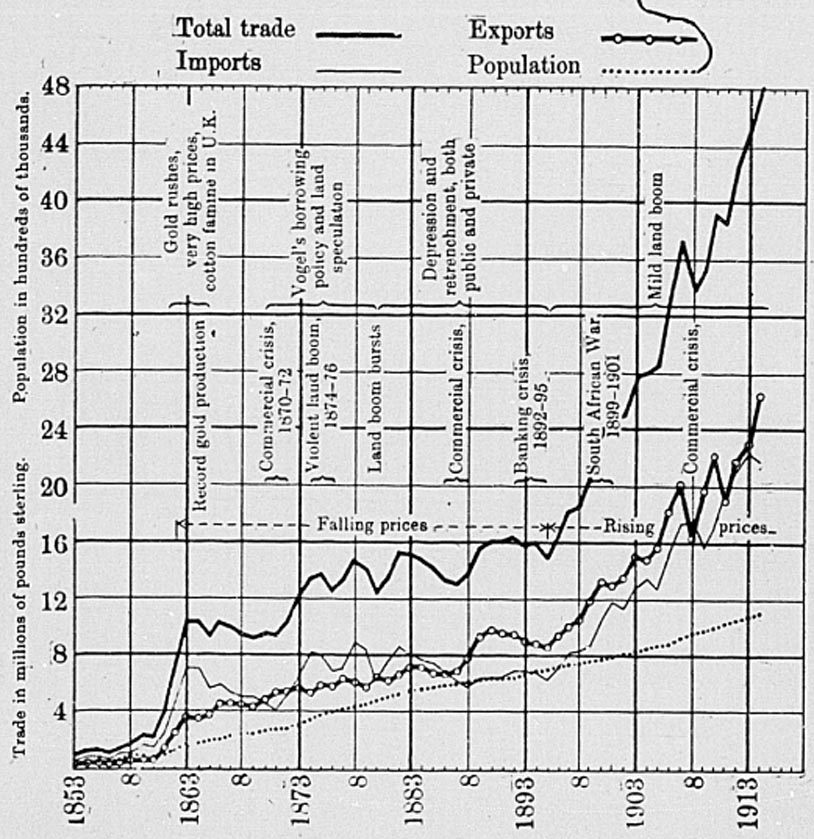
The increase has not been uniform—rather, there seem to have been four periods in New Zealand's trade history: (1) A time of fluctuating but increasing trade, from 1853 to 1860: (2) a rapid increase in the early “sixties.” followed by a slight decline; (3) another increase in the early “seventies,” followed by fluctuating, and but slowly increasing trade till 1895; (4) and, finally, a rapid and continuous increase till 1914, broken only by declines in 1908 and 1911.
The graph of the total trade brings out these periods well—the low-level fluctuations prior to 1860; the sharp rise and partial decline in the “sixties”; the rise of the “seventies,” and the fluctuations thereafter till 1895; and the continuous increase since. The curve of the quinquennial average shows the same periods, but the decade average shows almost unbroken progress.
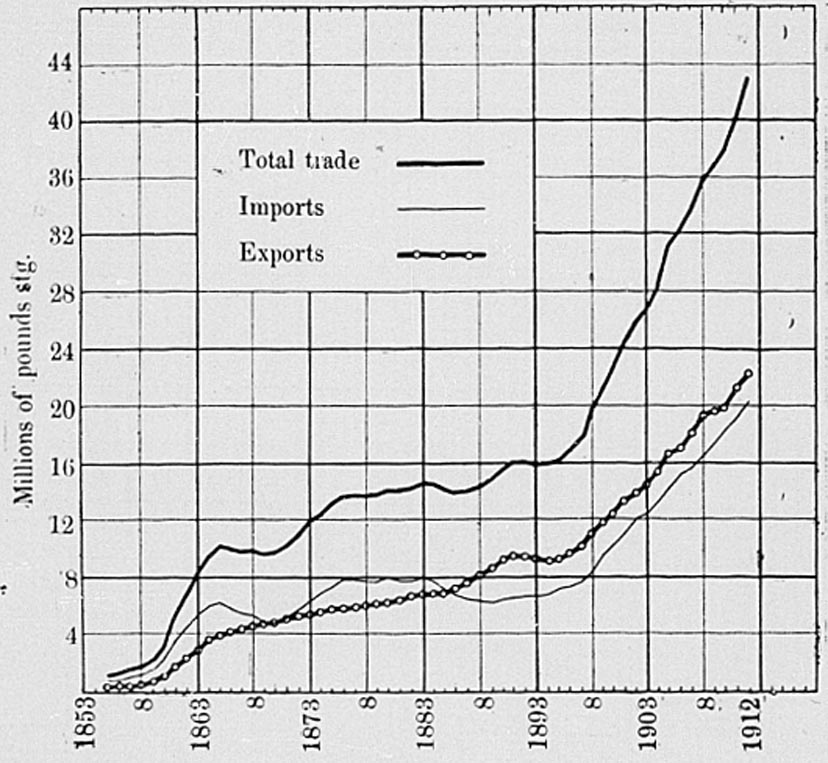
The moving averages reveal a tendency to continuous progress. The quinquennial average, while reducing the fluctuations for individual years, does not obscure the periods of declining trade; but probably the decade average makes too little of the fluctuations, showing as it does only one decade—1879–88— in which there was a decline in the average trade. But even in the decade average the rapid increases in the early “sixties,” and from 1895 to 1912, and the comparative stagnation of the period 1874–89 are shown very clearly. The average for the decade 1863–72 is more than four times the average of the decade 1853–62; between the decades 1874–83 and 1880–89 the increase is only 141: 138; while the period 1903–12 shows an increase of more than five to two on 1880–89.
To sum up by a reference to the graph of total trade attached to Table A, the trade fluctuated at a low level till an abrupt rise came in 1861–63, and then declined slightly till another rise came in 1871–75. Violent fluctuations succeed, and the curve rises but slightly till, in 1895, it turns to rise and continues upward in an almost unbroken line, with a check only in 1908 and 1911.
The relations between the imports and exports are discussed later in Chapter VI; but it may be observed here that in the early days imports were in excess of exports, until about 1870–72, when they became approximately equal. Then the imports rose again, and continued in excess of the exports till 1886, and since that time exports are almost invariably greater than the imports
Lest a change in relationship give a false impression it is necessary to state clearly that there is always a close connection between imports and exports. To prove this I have taken the indices for imports and exports for the whole sixty years, and have worked out a coefficient of correlation between the two series. The formula followed was that of Professor Pearson, r = Σ(xy)/n σ1 σ2, and the resultant figure was .946 with a probable error of .001. Perfect direct correlation is denoted by unity, and therefore the figure .946 shows first that imports and exports vary directly, and secondly that the connection between them is very intimate indeed. This result agrees well with the economic theorem that exports must pay for imports, since it shows that in the case of New Zealand at least any change in New Zealand exports over the last sixty years is almost invariably accompanied by a similar change in the imports, and vice versa.
The population figures show practically a continuous increase, greatest in the period 1871–75 and least in 1889–90. The relation of the home trade to the external trade is discussed later in Chapter VIII, but one aspect of the question is important here. With increasing population there should, in a new country, come a more than proportionate increase of trade, internal and external. Increased settlement means railways and roads and better ports, a more abundant labour-supply, and bettor and cheaper communication with the outside world—the law of increasing returns acts sharply. This increase of trade-power has been well illustrated generally by the experience of New Zealand, and the lesson is enforced by the contrast afforded by one period, 1870–95. During these years the curves of population and trade run almost in parallel lines, and I shall show later that these years were a disastrous time for New Zealand.
It only remains to review the changes in prices during the period. The only statistics of prices available for early years are found in Dr. McIlraith's “The Course of Prices in New Zealand from 1861 to 1910.” His index number of general prices shows that prices were abnormally high in the early “sixties,” thence suffered an almost uninterrupted fall till 1895, and have since tended slightly to rise. The fall from 1866–95 was broken by a sharp rise in 1871–73 and slightly checked in 1877, 1880, and 1888–89. This course of prices is in general agreement with the English prices of Sauerbeck, the main exceptions being that the high prices in the days of the gold rushes are not reproduced in the English prices, and that the rising prices since 1895 have been far greater in England than in New Zealand.
Dr. McIlraith has divided his commodities into two main groups, farm products and non-farm products, and, as he says (page 92), “this division corresponds roughly with that of raw materials and finished products; but more approximately with imports and exports.” Now, the price-levels of these divisions tend to diverge, and later it will be shown that this diverence is of vital importance to New Zealand. Roughly we may say that the non-farm products follow the course of English prices; but farm products since 1895 have tended to rise, while non-farm products are falling.
The next two tables (C and D) are devoted to index numbers of the trade. The device of index numbers is used for convenience of comparison: the mind seems to grip the notion of percentages more easily than it compares unusual figures. The index numbers are easily obtained by equating the average of the base period to 100 and reducing all the figures in proportion.
A difficulty arose from the great difference between the early and the later years. In order that the later years should not be unduly exaggerated it was necessary to choose a base period, fairly late; but this, of course, reduces the early years almost to insignificance. For instance, the index of the total trade for 1853 is 5, and of the exports 3. When we consider that these are correct to the nearest whole number and that the 3 might be anything between 2½ and 3½, it will be obvious that too much reliance cannot be placed on index numbers of these early years.
The decade 1890–99 has been taken as base, partly because Dr. McIlraith used it in his inquiry into prices, but mainly because it is the most suitable base for our purpose, embracing as it does times of falling and rising prices, of stagnant and increasing trade. Mr. Hooker in the article quoted above (Chapter III) take 1890–99 as his base period, giving as his reason the fact that it covered a complete cycle of prices, and every index number discussed showed a trough and a crest between 1890 and 1899. Dr. McIlraith's index numbers of prices and population, 1861–1910, have been included in the table of index numbers.
Then a rough attempt has been made at an index number of trade corrected for prices and for population. The method was to take the data for the base period 1890–99 as equal to 100, and to reduce the trade index number in proportion to the population and to the general level of prices. The index of general prices is used for the total trade, of non-farm products for the imports, and of farm products for the exports; but in the case of the imports and exports population changes have not been taken into account. The results are shown in Tables D and E, and graphically in the two drawings attached thereto.
In addition, an index number of exports is given, taking the quantities for each year at the prices of the base period 1890–99. The price taken was the average price over the decade, as shown by the ratio between quantities and values, in the statistics. An artificial value for each commodity was then calculated at this price; but where the value was small, all commodities save the chief ones were calculated pro rata at Dr. McIlraith's prices for farm products. The artificial values for the commodities were then combined, and an index number calculated from the total. This is shown in Table F.
| TABLE C.—INDEX NUMBERS OF TRADE. (Base 1890–99.) | |||||
|---|---|---|---|---|---|
| Year. | Total. 60,000 £169 = 100. | Imports. 10,000. £72 = 100. | Exports. 50,000. £97 = 100. | Prices. | Population. |
| 1853 | 5 | 8 | 3 | .. | .. |
| 1854 | 7 | 12 | 3 | .. | .. |
| 1855 | 7 | 11 | 4 | .. | .. |
| 1856 | 6 | 10 | 3 | .. | .. |
| 1857 | 8 | 14 | 4 | .. | .. |
| 1858 | 9 | 15 | 5 | .. | .. |
| 1859 | 13 | 22 | 6 | .. | .. |
| 1860 | 12 | 21 | 6 | .. | .. |
| 1861 | 23 | 35 | 14 | 184 | 14 |
| 1862 | 41 | 64 | 25 | 186 | 18 |
| 1863 | 61 | 97 | 35 | 193 | 24 |
| 1864 | 61 | 97 | 35 | 195 | 25 |
| 1865 | 55 | 78 | 38 | 189 | 28 |
| 1866 | 61 | 82 | 46 | 200 | 30 |
| 1867 | 59 | 74 | 47 | 187 | 32 |
| 1868 | 56 | 70 | 45 | 184 | 33 |
| 1869 | 55 | 70 | 43 | 164 | 34 |
| 1870 | 56 | 64 | 49 | 154 | 36 |
| 1871 | 56 | 57 | 54 | 150 | 34 |
| 1872 | 61 | 71 | 53 | 154 | 41 |
| 1873 | 72 | 90 | 57 | 164 | 43 |
| 1874 | 79 | 113 | 54 | 161 | 50 |
| 1875 | 81 | 111 | 59 | 148 | 54 |
| 1876 | 74 | 96 | 58 | 140 | 58 |
| 1877 | 78 | 97 | 65 | 144 | 59 |
| 1878 | 87 | 122 | 62 | 135 | 63 |
| 1879 | 83 | 117 | 58 | 127 | 67 |
| 1880 | 74 | 86 | 66 | 130 | 70 |
| 1881 | 80 | 104 | 63 | 125 | 73 |
| 1882 | 89 | 120 | 69 | 122 | 75 |
| 1883 | 89 | 111 | 73 | 118 | 79 |
| 1884 | 87 | 107 | 73 | 115 | 82 |
| 1885 | 84 | 104 | 70 | 111 | 83 |
| 1886 | 79 | 95 | 69 | 108 | 85 |
| 1887 | 77 | 86 | 71 | 103 | 87 |
| 1888 | 82 | 83 | 80 | 103 | 88 |
| 1889 | 92 | 88 | 95 | 111 | 89 |
| 1890 | 95 | 88 | 101 | 107 | 91 |
| 1891 | 95 | 90 | 98 | 108 | 92 |
| 1892 | 98 | 97 | 97 | 104 | 94 |
| 1893 | 93 | 97 | 92 | 100 | 97 |
| 1894 | 95 | 95 | 94 | 98 | 99 |
| 1895 | 87 | 89 | 88 | 93 | 100 |
| 1896 | 98 | 99 | 95 | 96 | 103 |
| 1897 | 106 | 112 | 103 | 97 | 106 |
| 1898 | 111 | 114 | 108 | 97 | 108 |
| 1899 | 123 | 121 | 123 | 98 | 110 |
| 1900 | 142 | 148 | 135 | 101 | 111 |
| 1901 | 146 | 164 | 132 | 98 | 114 |
| 1902 | 148 | 157 | 139 | 100 | 117 |
| 1903 | 164 | 178 | 154 | 100 | 122 |
| 1904 | 165 | 185 | 151 | 95 | 124 |
| 1905 | 167 | 178 | 161 | 98 | 128 |
| 1906 | 197 | 211 | 186 | 101 | 132 |
| 1907 | 220 | 240 | 206 | 107 | 135 |
| 1908 | 200 | 243 | 167 | 104 | 139 |
| 1909 | 208 | 218 | 202 | 101 | 141 |
| 1910 | 231 | 238 | 228 | 103 | 144 |
| 1911 | 228 | 271 | 195 | .. | .. |
| 1912 | 251 | 292 | 223 | .. | .. |
| 1913 | 267 | 309 | 236 | .. | .. |
| 1914 | 284 | 304 | 270 | .. | .. |
| TABLE D.—ANNUAL AND QUINQUENNIAL FIGURES OF TOTAL TRADE CORRECTED FOR POPULATION AND PRICES. | |||
|---|---|---|---|
| Annual. | Quinquennial | ||
| Year. | Index. | Year. | Index. |
| 1861 | 89 | 1861–65 | 114 |
| 1862 | 122 | 1862–66 | 117 |
| 1863 | 131 | 1863–67 | 112 |
| 1864 | 124 | 1864–68 | 104 |
| 1865 | 104 | 1865–69 | 97 |
| 1866 | 102 | 1866–70 | 99 |
| 1867 | 99 | 1867–71 | 100 |
| 1868 | 92 | 1868–72 | 100 |
| 1869 | 99 | 1869–73 | 102 |
| 1870 | 101 | 1870–74 | 101 |
| 1871 | 109 | 1871–75 | 101 |
| 1872 | 97 | 1872–76 | 98 |
| 1873 | 102 | 1873–77 | 97 |
| 1874 | 98 | 1874–78 | 97 |
| 1875 | 101 | 1875–79 | 97 |
| 1876 | 91 | 1876–80 | 93 |
| 1877 | 92 | 1877–81 | 92 |
| 1878 | 102 | 1878–82 | 93 |
| 1879 | 97 | 1879–83 | 92 |
| 1880 | 81 | 1880–84 | 91 |
| 1881 | 88 | 1881–85 | 93 |
| 1882 | 97 | 1882–86 | 92 |
| 1883 | 95 | 1883–87 | 90 |
| 1884 | 93 | 1884–88 | 89 |
| 1885 | 91 | 1885–89 | 89 |
| 1886 | 86 | 1886–90 | 91 |
| 1887 | 86 | 1887–91 | 93 |
| 1888 | 90 | 1888–92 | 95 |
| 1889 | 93 | 1889–93 | 97 |
| 1890 | 98 | 1890–94 | 98 |
| 1891 | 96 | 1891–95 | 97 |
| 1892 | 100 | 1892–96 | 97 |
| 1893 | 96 | 1893–97 | 98 |
| 1894 | 98 | 1894–98 | 100 |
| 1895 | 93 | 1895–99 | 103 |
| 1896 | 99 | 1896–1900 | 110 |
| 1897 | 103 | 1897–1901 | 116 |
| 1898 | 106 | 1898–1902 | 121 |
| 1899 | 114 | 1899–1903 | 126 |
| 1900 | 127 | 1900–4 | 132 |
| 1901 | 131 | 1901–5 | 133 |
| 1902 | 126 | 1902–6 | 136 |
| 1903 | 134 | 1903–7 | 141 |
| 1904 | 140 | 1904–8 | 142 |
| 1905 | 133 | 1905–9 | 144 |
| 1906 | 148 | 1906–10 | 148 |
| 1907 | 152 | .. | .. |
| 1908 | 138 | .. | .. |
| 1909 | 147 | .. | .. |
| 1910 | 156 | .. | .. |
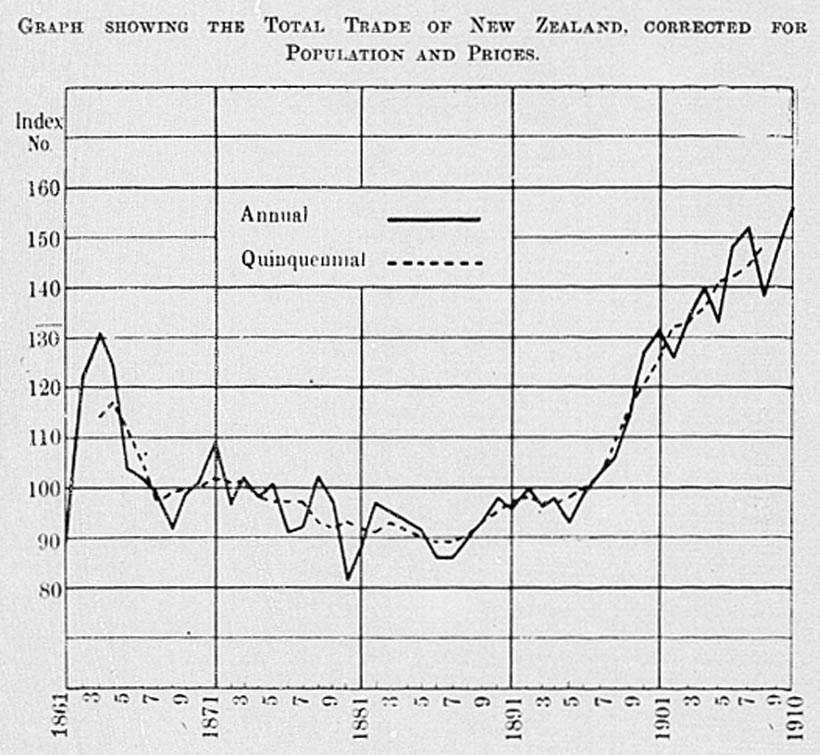
| TABLE E.—IMPORTS AND EXPORTS CORRECTEDFOR PRICES OF NON-FARM AND FARM PRODUCTS. | |||||
|---|---|---|---|---|---|
| Year. | Indices. | Years. | Quinquennial Average. | ||
| Imports. | Exports. | Imports | Exports | ||
| 1861 | 14 | 7 | 1861–65 | 29 | 14 |
| 1862 | 25 | 13 | 1862–66 | 32 | 16 |
| 1863 | 38 | 15 | 1863–67 | 33 | 19 |
| 1864 | 37 | 16 | 1864–68 | 31 | 20 |
| 1865 | 30 | 18 | 1865–69 | 29 | 23 |
| 1866 | 31 | 20 | 1866–70 | 29 | 27 |
| 1867 | 28 | 25 | 1867–71 | 28 | 31 |
| 1868 | 28 | 23 | 1868–72 | 29 | 34 |
| 1869 | 30 | 28 | 1869–73 | 31 | 37 |
| 1870 | 28 | 37 | 1870–74 | 35 | 38 |
| 1871 | 26 | 43 | 1871–75 | 40 | 38 |
| 1872 | 31 | 41 | 1872–76 | 45 | 38 |
| 1873 | 39 | 36 | 1873–77 | 48 | 38 |
| 1874 | 51 | 32 | 1874–78 | 54 | 39 |
| 1875 | 54 | 39 | 1875–79 | 58 | 40 |
| 1876 | 49 | 41 | 1876–80 | 57 | 43 |
| 1877 | 49 | 41 | 1877–81 | 56 | 45 |
| 1878 | 68 | 41 | 1878–82 | 60 | 47 |
| 1879 | 69 | 40 | 1879–83 | 60 | 50 |
| 1880 | 51 | 51 | 1880–84 | 60 | 55 |
| 1881 | 43 | 50 | 1881–85 | 63 | 57 |
| 1882 | 71 | 51 | 1882–86 | 67 | 60 |
| 1883 | 68 | 59 | 1883–87 | 65 | 63 |
| 1884 | 65 | 63 | 1884–88 | 62 | 68 |
| 1885 | 67 | 64 | 1885–89 | 61 | 71 |
| 1886 | 63 | 62 | 1886–90 | 59 | 76 |
| 1887 | 60 | 69 | 1887–91 | 58 | 86 |
| 1888 | 57 | 81 | 1888–92 | 59 | 94 |
| 1889 | 58 | 79 | 1889–93 | 62 | 96 |
| 1890 | 57 | 98 | 1890–94 | 64 | 99 |
| 1891 | 57 | 105 | 1891–95 | 66 | 98 |
| 1892 | 67 | 107 | 1892–96 | 70 | 96 |
| 1893 | 70 | 90 | 1893–97 | 73 | 95 |
| 1894 | 69 | 94 | 1894–98 | 76 | 97 |
| 1895 | 68 | 95 | 1895–99 | 80 | 102 |
| 1896 | 75 | 95 | 1896–1900 | 88 | 109 |
| 1897 | 83 | 100 | 1897–1901 | 97 | 116 |
| 1898 | 85 | 102 | 1898–1902 | 104 | 119 |
| 1899 | 91 | 118 | 1899–1903 | 115 | 124 |
| 1900 | 106 | 131 | 1900–4 | 127 | 127 |
| 1901 | 120 | 129 | 1901–5 | 135 | 127 |
| 1902 | 120 | 116 | 1902–6 | 144 | 131 |
| 1903 | 140 | 124 | 1903–7 | 155 | 139 |
| 1904 | 150 | 133 | 1904–8 | 162 | 139 |
| 1905 | 144 | 132 | 1905–9 | 169 | 145 |
| 1906 | 166 | 148 | 1906–10 | 181 | 154 |
| 1907 *X | 177 | 160 | .. | .. | .. |
| 1908 | 172 | 122 | .. | .. | .. |
| 1909 | 184 | 163 | .. | .. | .. |
| 1910 | 208 | 175 | .. | .. | .. |
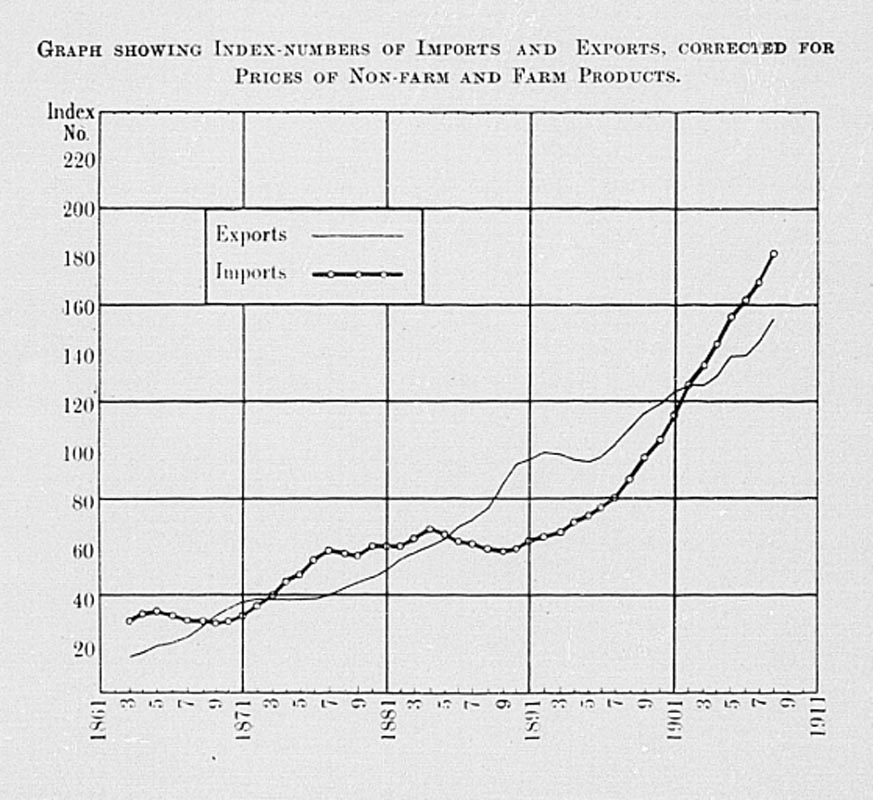
| TABLE F.—INDEX NUMBERS OF EXPORTS, CALCULATED AT PRICES OF 1890–99. | ||||||||
|---|---|---|---|---|---|---|---|---|
| Year. | Annual. | Period. | Quinquennial. | |||||
| Values. | Index Numbers. | Index Numbers. | ||||||
| Recorded. (000 omitted.) | At Pries 1890–09. | Recorded | At Prices 1890–99 | Recorded | At Prices 1890–99. | |||
| £ | £ | |||||||
| 1861 | 1,370 | 1,105 | 14 | 11 | 1861–65 | 29 | 27 | |
| 1862 | 2,423 | 3,003 | 25 | 31 | 1862–66 | 36 | 33 | |
| 1863 | 3,485 | 3,032 | 35 | 31 | 1863–67 | 40 | 35 | |
| 1864 | 3,402 | 2,830 | 35 | 29 | 1864–68 | 42 | 36 | |
| 1865 | 3,713 | 3,137 | 38 | 33 | 1865–69 | 44 | 38 | |
| 1866 | 4,520 | 3,837 | 46 | 40 | 1866–70 | 46 | 40 | |
| 1867 | 4,645 | 3,932 | 47 | 40 | 1867–71 | 48 | 42 | |
| 1868 | 4,429 | 3,822 | 45 | 40 | 1868–72 | 49 | 43 | |
| 1869 | 4,225 | 3,717 | 43 | 38 | 1869–73 | 51 | 43 | |
| 1870 | 4,823 | 4,247 | 49 | 44 | 1870–74 | 53 | 43 | |
| 1871 | 5,283 | 4,839 | 54 | 50 | 1871–75 | 55 | 43 | |
| 1872 | 5,191 | 4,042 | 53 | 42 | 1872–76 | 56 | 41 | |
| 1873 | 5,601 | 4,066 | 57 | 42 | 1873–77 | 59 | 40 | |
| 1874 | 5,251 | 3,698 | 54 | 38 | 1874–78 | 60 | 40 | |
| 1875 | 5,829 | 4,030 | 59 | 42 | 1875–79 | 60 | 41 | |
| 1876 | 5,673 | 4,109 | 58 | 42 | 1876–80 | 62 | 43 | |
| 1877 | 6,327 | 3,538 | 65 | 36 | 1877–81 | 63 | 45 | |
| 1878 | 6,016 | 4,259 | 62 | 43 | 1878–82 | 64 | 47 | |
| 1879 | 5,743 | 4,291 | 58 | 44 | 1879–83 | 66 | 51 | |
| 1880 | 6,353 | 5,047 | 66 | 52 | 1880–84 | 69 | 55 | |
| 1881 | 6,061 | 4,722 | 63 | 49 | 1881–85 | 70 | 58 | |
| 1882 | 6,658 | 4,990 | 69 | 52 | 1882–86 | 71 | 61 | |
| 1883 | 7,096 | 5,531 | 73 | 57 | 1883–87 | 71 | 65 | |
| 1884 | 7,092 | 6,156 | 73 | 63 | 1884–88 | 73 | 69 | |
| 1885 | 6,820 | 6,394 | 70 | 66 | 1885–89 | 77 | 74 | |
| 1886 | 6,673 | 6,544 | 69 | 67 | 1886–90 | 83 | 78 | |
| 1887 | 6,866 | 6,627 | 71 | 68 | 1887–91 | 89 | 83 | |
| 1888 | 7,767 | 7,544 | 80 | 78 | 1888–92 | 94 | 88 | |
| 1889 | 9,342 | 8,364 | 95 | 87 | 1889–93 | 97 | 91 | |
| 1890 | 9,812 | 8,500 | 101 | 88 | 1890–94 | 96 | 93 | |
| 1891 | 9,566 | 9,023 | 98 | 93 | 1891–95 | 94 | 94 | |
| 1892 | 9,535 | 9,040 | 97 | 93 | 1892–96 | 93 | 94 | |
| 1893 | 8,985 | 8,701 | 92 | 90 | 1893–97 | 94 | 97 | |
| 1894 | 9,231 | 9,408 | 94 | 97 | 1894–98 | 98 | 101 | |
| 1895 | 8,550 | 9,038 | 88 | 93 | 1895–99 | 103 | 108 | |
| 1896 | 9,321 | 9,228 | 95 | 95 | 1896–1900 | 113 | 116 | |
| 1897 | 10,107 | 10,237 | 103 | 105 | 1897–1901 | 120 | 126 | |
| 1898 | 10,518 | 11,056 | 108 | 114 | 1898–1902 | 127 | 135 | |
| 1899 | 11,938 | 12,670 | 123 | 131 | 1899–1903 | 137 | 143 | |
| 1900 | 13,246 | 13,068 | 135 | 135 | 1900–4 | 142 | 145 | |
| 1901 | 12,881 | 13,985 | 132 | 144 | 1901–5 | 147 | 146 | |
| 1902 | 13,645 | 14,518 | 139 | 150 | 1902–6 | 158 | 148 | |
| 1903 | 15,010 | 14,833 | 154 | 153 | 1903–7 | 172 | 150 | |
| 1904 | 14,748 | 13,649 | 151 | 140 | 1904–8 | 174 | 151 | |
| 1905 | 15,656 | 13,539 | 161 | 139 | 1905–9 | 184 | 160 | |
| 1906 | 18,095 | 14,872 | 186 | 154 | 1906–10 | 198 | 168 | |
| 1907 | 20,069 | 15,942 | 206 | 164 | .. | .. | .. | |
| 1908 | 16,317 | 15,214 | 167 | 157 | .. | .. | .. | |
| 1909 | 19,662 | 17,650 | 202 | 182 | .. | .. | .. | |
| 1910 | 22,180 | 18,261 | 228 | 180 | .. | .. | .. | |
| TABLE F1.—VALUES OF EXPORTS AT PRICES OF 1890–99. (000 omitted). | ||||||||||||
|---|---|---|---|---|---|---|---|---|---|---|---|---|
| Year. | Wool. | Meat. | Butter. | Cheese. | Grain. | Gold. | Flax. | Tallow. | Kauri-gum. | Timber. | Other. | Total. |
| £ | £ | £ | £ | £ | £ | £ | £ | £ | £ | £ | £ | |
| 1861 | 259 | .. | .. | .. | .. | 753 | .. | .. | 50 | .. | 43 | 1,105 |
| 1862 | 271 | .. | .. | .. | .. | 1,591 | .. | .. | 62 | .. | 79 | 3,003 |
| 1863 | 427 | .. | .. | .. | .. | 2,432 | .. | .. | 84 | .. | 89 | 3,032 |
| 1864 | 566 | .. | .. | .. | .. | 1,858 | .. | .. | 124 | .. | 282 | 2,830 |
| 1865 | 651 | .. | .. | .. | 3 | 2,226 | .. | .. | 107 | .. | 150 | 3,137 |
| 1866 | 773 | .. | .. | .. | 3 | 2,845 | .. | .. | 141 | .. | 109 | 3,837 |
| 1867 | 922 | .. | .. | .. | 18 | 2,700 | .. | .. | 152 | .. | 140 | 3,932 |
| 1868 | 980 | .. | .. | .. | 71 | 2,504 | .. | .. | 152 | .. | 115 | 3,822 |
| 1869 | 942 | .. | .. | .. | 58 | 2,363 | .. | .. | 163 | .. | 191 | 3,717 |
| 1870 | 1,254 | .. | .. | .. | 95 | 2,158 | .. | .. | 248 | .. | 492 | 4,247 |
| 1871 | 1,275 | .. | .. | .. | 115 | 2,788 | .. | .. | 287 | .. | 374 | 4,839 |
| 1872 | 1,453 | .. | .. | .. | 119 | 1,731 | .. | .. | 270 | .. | 469 | 4,042 |
| 1873 | 1,407 | .. | .. | .. | 67 | 1,987 | .. | .. | 158 | .. | 447 | 4,066 |
| 1874 | 1,587 | .. | .. | .. | 130 | 1,505 | .. | .. | 146 | .. | 330 | 3,698 |
| 1875 | 1,844 | .. | .. | .. | 143 | 1,408 | .. | .. | 180 | .. | 455 | 4,030 |
| 1876 | 2,031 | .. | .. | .. | 243 | 1,269 | .. | .. | 163 | .. | 401 | 4,109 |
| 1877 | 2,187 | .. | .. | .. | 148 | 1,476 | .. | .. | 203 | .. | 524 | 3,538 |
| 1878 | 2,010 | .. | .. | .. | 236 | 1,244 | .. | .. | 191 | .. | 578 | 4,259 |
| 1879 | 2,109 | .. | .. | .. | 389 | 1,135 | .. | .. | 180 | .. | 478 | 4,291 |
| 1880 | 2,268 | .. | .. | .. | 620 | 1,220 | .. | .. | 265 | .. | 674 | 5,047 |
| 1881 | 2,014 | .. | .. | .. | 652 | 997 | .. | .. | 310 | .. | 749 | 4,722 |
| 1882 | 2,214 | 17 | 45 | 7 | 483 | 922 | 17 | 102 | 310 | 63 | 810 | 4,990 |
| 1883 | 2,309 | 100 | 37 | 5 | 753 | 892 | 17 | 133 | 366 | 95 | 829 | 5,531 |
| 1884 | 2,749 | 290 | 65 | 20 | 615 | 989 | 25 | 142 | 360 | 99 | 802 | 6,156 |
| 1885 | 2,932 | 339 | 102 | 30 | 515 | 890 | 17 | 131 | 332 | 111 | 995 | 6,394 |
| 1886 | 3,078 | 397 | 94 | 32 | 394 | 940 | 17 | 122 | 276 | 115 | 1,079 | 6,544 |
| 1887 | 3,010 | 460 | 70 | 48 | 463 | 748 | 25 | 146 | 383 | 122 | 1,126 | 6,627 |
| 1888 | 2,820 | 651 | 123 | 75 | 571 | 914 | 67 | 128 | 479 | 170 | 1,546 | 7,544 |
| 1889 | 3,465 | 862 | 154 | 55 | 685 | 785 | 285 | 149 | 422 | 170 | 1,332 | 8,364 |
| 1890 | 3,485 | 1,029 | 143 | 81 | 928 | 751 | 352 | 163 | 422 | 166 | 980 | 8,500 |
| 1891 | 3,600 | 1,145 | 160 | 81 | 659 | 1,007 | 268 | 165 | 473 | 170 | 1,235 | 9,023 |
| 1892 | 4,007 | 996 | 221 | 83 | 743 | 952 | 218 | 155 | 490 | 91 | 1,084 | 9,040 |
| 1893 | 3,718 | 1,035 | 237 | 93 | 544 | 916 | 218 | 160 | 467 | 107 | 1,206 | 8,701 |
| 1894 | 4,892 | 1,174 | 249 | 113 | 272 | 888 | 84 | 186 | 467 | 126 | 957 | 9,408 |
| 1895 | 3,932 | 1,298 | 237 | 156 | 267 | 1,162 | 34 | 248 | 417 | 150 | 1,137 | 9,038 |
| 1896 | 4,380 | 1,163 | 290 | 143 | 329 | 1,041 | 50 | 210 | 400 | 138 | 1,093 | 9,228 |
| 1897 | 4,604 | 1,612 | 405 | 158 | 215 | 980 | 50 | 291 | 372 | 154 | 1,396 | 10,237 |
| 1898 | 5,065 | 1,877 | 397 | 139 | 118 | 1,081 | 84 | 336 | 557 | 162 | 1,250 | 11,056 |
| 1899 | 4,990 | 2,137 | 548 | 139 | 783 | 1,513 | 168 | 319 | 625 | 197 | 1,240 | 12,670 |
| 1900 | 4,770 | 2,113 | 708 | 208 | 1,067 | 1,440 | 268 | 346 | 574 | 229 | 1,348 | 13,068 |
| 1901 | 4,867 | 2,127 | 826 | 210 | 1,537 | 1,754 | 168 | 314 | 422 | 285 | 1,473 | 13,985 |
| 1902 | 5,438 | 2,449 | 1,039 | 151 | 657 | 1,951 | 352 | 398 | 417 | 194 | 1,472 | 14,518 |
| 1903 | 5,258 | 2,724 | 1,166 | 151 | 600 | 2,038 | 386 | 373 | 530 | 201 | 1,406 | 14,833 |
| 1904 | 4,901 | 2,190 | 1,284 | 172 | 422 | 1,988 | 453 | 363 | 518 | 237 | 1,181 | 13,649 |
| 1905 | 4,743 | 1,935 | 1,252 | 180 | 253 | 2,094 | 470 | 300 | 614 | 307 | 1,391 | 13,539 |
| 1906 | 5,234 | 2,320 | 1,309 | 265 | 112 | 2,271 | 470 | 355 | 518 | 311 | 1,707 | 14,872 |
| 1907 | 5,817 | 2,696 | 1,342 | 479 | 26 | 2,027 | 487 | 390 | 490 | 285 | 1,863 | 15,942 |
| 1908 | 5,509 | 2,427 | 941 | 568 | 131 | 2,005 | 285 | 361 | 310 | 336 | 1,641 | 15,214 |
| 1909 | 6,431 | 2,946 | 1,313 | 810 | 778 | 2,007 | 235 | 455 | 467 | 285 | 1,923 | 17,650 |
| 1910 | 6,929 | 3,039 | 1,460 | 913 | 222 | 1,896 | 352 | 489 | 490 | 325 | 2,143 | 18,261 |
| 1911 | 5,743 | 2,577 | 1,235 | 887 | 197 | 1,815 | 285 | 388 | 428 | 340 | .. | .. |
| 1912 | 6,387 | 2,966 | 1,546 | 1,166 | 597 | 1,345 | 319 | 443 | 445 | 371 | .. | .. |
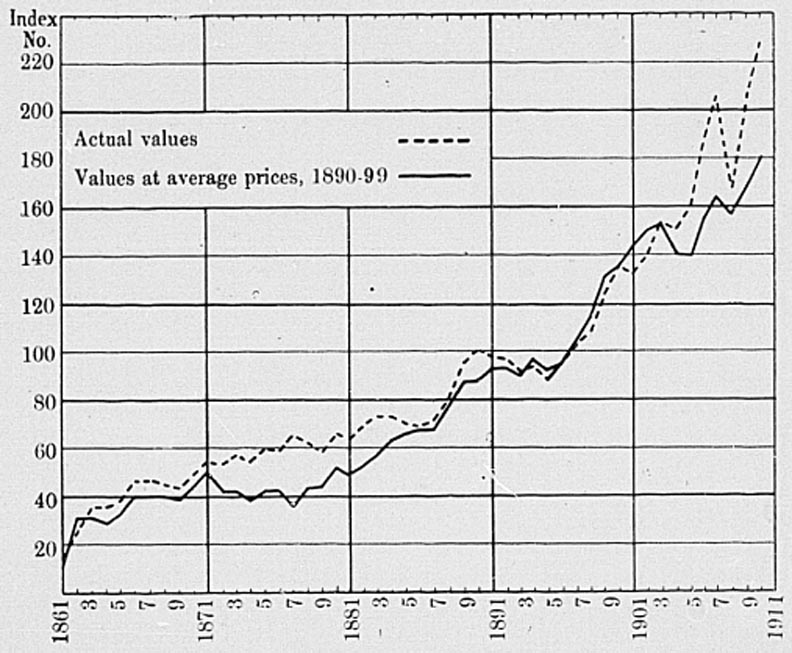
The Table C is merely a repetition of the first table; but it is valuable in affording a means of ready comparison. The period 1890–99, as stated before, is used as base. Owing to the base being chosen towards the end of the series, the later figures are reduced; but, even then, in 1914 the index of total trade reaches 284, surely a strong testimony that the increase has been very great of recent years. Both tables show clearly the same periods as were observed in the preceding tables—the sudden doubling in 1861, the slow increase 1870–95, and the rapid and continuous development since.
In this table, too, are shown Dr. McIlraith's indices of prices and of population 1861–1910, and a consideration of these is important. Population, of course, has advanced very rapidly, though, on the whole, not in proportion to the trade, and the advance has been very uniform. Prices tell a different tale. It will at once be noticed that they are excessively high in the first decade taken, 1861–70; from 1866 to 1895 they have fallen practically continuously, and from 1895 have risen steadily. Sauerbeck's figures for the United Kingdom show prices rising 1850–73, falling 1873–95, and rising since; and this is in accordance with New Zealand's experience. The abnormally high level of 1861–70 is explained by the dislocation of industry caused by the gold-rushes in the early “sixties.”
The striking fact is that the period of falling prices coincides with he period of stagnant trade, and the rising prices since 1895 are accompanied by a great increase in trade. This points, first, to the fact that the value of the trade is dependent to a great extent upon the price-level—high prices mean an increase in the value even if the volume remains unchanged; and, similarly, falling prices may offset the gain from an increasing volume of trade.
In Table E is shown a rough index of what might be called the trade-power of the community, allowance being made for prices and population—the base period being again 1890–99. Even allowing for the increase in population and the very high prices of the early years, there is a wonderful increase in trade, culminating in 1863. The index drops almost to its old level by 1868, but rises again till 1871, and then fluctuates with a downward tendency till 1895, when it suddenly rises and continues to rise. Very bad years are 1868, 1876, 1880, 1886–87, 1895, and 1908; and good years are 1863, 1871, 1878, and 1907.
Now, Dr. McIlraith gives the following years as showing low prices —1869, 1878, 1887, 1895, 1904; and these as showing high prices—1864, 1873, 1880, 1889, 1900, and 1907. The resemblance is marked, and it will be observed that a year of high trade is followed by high prices, and low trade by low prices. This, I think, emphasizes the fact that New Zealand's foreign trade is a very good index of her prosperity: it is almost an axiom with us that trade prospects depend on the success or failure of the season's wool-clip.
The graph of the corrected total trade shows the periods of trade more clearly than the previous graph attached to Table A. The trough of the curve corresponds broadly with the curves of prices supplied by Hooker in the Statistical Journal for December, 1911. The high peak of 1863 is of course a freak, due to the gold discoveries; but the trade from 1870 on is fluctuating and, even if we make allowance for falling prices, is falling in volume per head of population. From 1895 the rise is enormous.
The correction of imports and exports for prices, but not for population, is very interesting. Generally the prices run together till 1895, since when the farm products have risen in price to a much greater extent than the non-farm products, which indeed have mainly fallen. This means, of course, that export values are inflated, and when exports are rising and imports falling in price New Zealand gains the advantage both ways. If, as in Table E, the actual trade figures are corrected for prices, the curves show, except for a sudden dip of imports in 1881, much the same progress, generally an excess of imports, till 1885. In the graph attached to Table A exports continue generally in excess of imports until the present time; but if we take account of prices exports fall below imports in 1902 and continue before the import level. This means, of course, that New Zealand is exporting a smaller volume of commodities than she imports, and yet she must pay interest on her debts to the extent of five or six millions per year. The explanation is that changing prices since 1895 have been all in New Zealand's favour: her products continually rise in price, while the price of her imports is almost stationary, if not falling.
This conclusion is borne out, too, by the index number of exports that has been prepared (Table F). If we turn to Table F1 and compare it with the table of individual exports in Chapter V. the rise in values comes out clearly. For the year 1912 wool is shown at £7,105,000: at the prices of 1890–99 it is £6,387,000. Similarly, meat, instead of £3,910,000, is only £2,966,000; and so on with all the other commodities, except gold and kauri-gum. This increase has been magnified in recent years as a reference to the subsection on exports in the 1914 issue of the Year-book will indicate. Gold is of course fixed in price, and the value given in the index number is the actual value exported. At the prices of 1890–99 the index of the trade of 1910 is 180, as against 228 of the trade uncorrected for prices. This shows the great influence the rise in prices has had.
But it is very satisfactory to note that, independent of any increase in prices, the trade has increased enormously since 1895, and indeed through the whole period. The index number shows exports to have almost doubled in volume between 1895 and 1910, and, even allowing for an increase in population, there has been a wonderful increase in New Zealand's trade of late years. Higher prices for her exports have helped to give added prosperity; but most of the increase is built on the solid rock of greater productivity.
A table is here given showing how great a proportion of New Zealand's exports are commodities of native production—i.e., are special exports. Practically all New Zealand's transhipped trade goes to the islands, and this, though important to merchants in Auckland, is of inconsiderable importance to the country at large. Then there is always a small amount of returned foreign produce, which helps to swell the total of “other” exports. But it will be observed that the exports “other than New Zealand produce” fluctuate greatly, and this is due to the appearance of specie exports. For instance, the big years 1893, 1897, and 1908 are explained by this fact, the specie exports of those years being £306,000, £276,000, £242,000. Thus it would seem that the lower level in Table G is the true level of New Zealand's re-export trade, and this is quite insignificant in the total exports.
| TABLE G.—EXPORTS, SPECIAL ANDOTHER. | |||
|---|---|---|---|
| (000 omitted.) | |||
| Year. | Produce of New Zealand. | Other. | Total. |
| £ | £ | £ | |
| 1853 | 303 | .. | 303 |
| 1854 | 321 | .. | 321 |
| 1855 | 366 | .. | 366 |
| 1856 | 318 | .. | 318 |
| 1857 | 369 | .. | 369 |
| 1858 | 434 | 24 | 458 |
| 1859 | 521 | 30 | 551 |
| 1860 | 549 | 40 | 589 |
| 1861 | 1,339 | 31 | 1,370 |
| 1862 | 2,358 | 65 | 2,423 |
| 1863 | 3,343 | 142 | 3,485 |
| 1864 | 3,051 | 351 | 3,402 |
| 1865 | 3,503 | 210 | 3,713 |
| 1866 | 4,396 | 124 | 4,520 |
| 1867 | 4,479 | 166 | 4,645 |
| 1868 | 4,269 | 160 | 4,429 |
| 1869 | 4,090 | 135 | 4,225 |
| 1870 | 4,545 | 278 | 4,823 |
| 1871 | 5,171 | 111 | 5,282 |
| 1872 | 5,107 | 84 | 5,191 |
| 1873 | 5,478 | 132 | 5,610 |
| 1874 | 5,152 | 99 | 5,251 |
| 1875 | 5,476 | 353 | 5,829 |
| 1876 | 5,489 | 184 | 5,673 |
| 1877 | 6,059 | 268 | 6,327 |
| 1878 | 5,785 | 231 | 6,016 |
| 1879 | 5,563 | 180 | 5,743 |
| 1880 | 6,102 | 251 | 6,353 |
| 1881 | 5,762 | 299 | 6,061 |
| 1882 | 6,253 | 405 | 6,658 |
| 1883 | 6,855 | 241 | 7,096 |
| 1884 | 6,942 | 150 | 7,092 |
| 1885 | 6,592 | 228 | 6,820 |
| 1886 | 6,387 | 286 | 6,673 |
| 1887 | 6,551 | 315 | 6,866 |
| 1888 | 7,255 | 512 | 7,767 |
| 1889 | 9,042 | 300 | 9,342 |
| 1890 | 9,429 | 383 | 9,812 |
| 1891 | 9,400 | 166 | 9,566 |
| 1892 | 9,366 | 169 | 9,535 |
| 1893 | 8,557 | 428 | 8,985 |
| 1894 | 9,085 | 146 | 9,231 |
| 1895 | 8,390 | 160 | 8,550 |
| 1896 | 9,177 | 144 | 9,321 |
| 1897 | 9,596 | 421 | 10,017 |
| 1898 | 10,324 | 194 | 10,518 |
| 1899 | 11,800 | 138 | 11,938 |
| 1900 | 13,055 | 191 | 13,246 |
| 1901 | 12,690 | 191 | 12,881 |
| 1902 | 13,499 | 146 | 13,645 |
| 1903 | 14,838 | 172 | 15,010 |
| 1904 | 14,602 | 146 | 14,748 |
| 1905 | 15,504 | 152 | 15,656 |
| 1906 | 17,840 | 255 | 18,095 |
| 1907 | 19,783 | 286 | 20,069 |
| 1908 | 15,895 | 422 | 16,317 |
| 1909 | 19,463 | 199 | 19,662 |
| 1910 | 21,944 | 236 | 22,180 |
| 1911 | 18,782 | 246 | 19,028 |
| 1912 | 21,272 | 499 | 21,771 |
| TABLE H.—PERCENTAGE INCREASES OFTHE TOTAL TRADE. | |||||||
|---|---|---|---|---|---|---|---|
| Year. | Total. | Imports. | Exports. | Decade Average. | |||
| Year. | Total | Imports. | Exports. | ||||
| Per Cent. | Per Cent. | Per Cent. | Per Cent. | Per Cent. | Per Cent. | ||
| 1853 | .. | .. | .. | 1853–62 | .. | .. | .. |
| 1854 | 33 | 50 | .. | 1854–63 | 50 | 46 | 43 |
| 1855 | .. | –11 | 32 | 1855–64 | 24 | 27 | 30 |
| 1856 | 16 | –12 | 25 | 1856–65 | 19 | 18 | 25 |
| 1857 | 40 | 43 | 33 | 1857–66 | 20 | 15 | 25 |
| 1858 | 14 | 10 | 25 | 1858–67 | 14 | 11 | 20 |
| 1859 | 38 | 45 | 20 | 1859–68 | 12 | 10 | 15 |
| 1860 | –4 | –6 | .. | 1860–69 | 9 | 7 | 12 |
| 1861 | 86 | 67 | 23 | 1861–70 | 8 | 6 | 13 |
| 1862 | 79 | 84 | 71 | 1862–71 | 7 | 4 | 11 |
| 1863 | 49 | 52 | 42 | 1863–72 | 3 | 2 | 7 |
| 1864 | .. | .. | .. | 1864–73 | 2 | –2 | 5 |
| 1865 | –11 | –20 | 9 | 1865–74 | 3 | 2 | 4 |
| 1866 | 12 | 5 | 22 | 1866–75 | 5 | 5 | 5 |
| 1867 | –5 | –10 | 2 | 1867–76 | 1 | 2 | 2 |
| 1868 | –5 | 6 | –4 | 1868–77 | 4 | 2 | 3 |
| 1869 | –2 | .. | –5 | 1869–78 | 4 | 7 | 3 |
| 1870 | 2 | –8 | 14 | 1870–79 | 4 | 5 | 3 |
| 1871 | .. | –11 | 10 | 1871–80 | 2 | 3 | 4 |
| 1872 | 10 | 24 | –2 | 1872–81 | 3 | 4 | 2 |
| 1873 | 18 | 27 | 8 | 1873–82 | 4 | 5 | 2 |
| 1574 | 11 | 25 | –5 | 1874–83 | 2 | 1 | 2 |
| 1875 | 3 | 1 | 10 | 1875–84 | 1 | .. | 3 |
| 1876 | –9 | –14 | –2 | 1876–85 | .. | .. | 2 |
| 1877 | 5 | 1 | 10 | 1877–86 | 1 | 3 | 2 |
| 1878 | 11 | 26 | –5 | 1878–87 | .. | .. | 1 |
| 1879 | –6 | 5 | –5 | 1879–88 | –1 | –4 | 2 |
| 1880 | –11 | –26 | 12 | 1880–89 | 1 | –3 | 5 |
| 1881 | 8 | 21 | –5 | 1881–90 | 3 | .. | 5 |
| 1882 | 13 | 15 | 10 | 1882–91 | 2 | –3 | 6 |
| 1883 | –1 | –7 | 6 | 1883–92 | 1 | –3 | 5 |
| 1884 | –2 | –4 | .. | 1884–93 | 1 | –1 | 2 |
| 1885 | –3 | –3 | –4 | 1885–94 | 1 | –1 | 2 |
| 1886 | –6 | –10 | –1 | 1886–95 | .. | –1 | 2 |
| 1887 | –2 | –9 | 3 | 1887–96 | 3 | .. | 3 |
| 1888 | 5 | –5 | 15 | 1888–97 | 3 | 3 | 3 |
| 1889 | 15 | 5 | 19 | 1889–98 | 3 | 4 | 3 |
| 1890 | 3 | .. | 5 | 1890–99 | 3 | 3 | 2 |
| 1891 | .. | 3 | –2 | 1891–1900 | 4 | 4 | 3 |
| 1892 | 3 | 8 | –1 | 1892–1901 | 5 | 8 | 3 |
| 1893 | –3 | .. | –5 | 1893–1902 | 4 | 5 | 4 |
| 1894 | 1 | –3 | 2 | 1894–1903 | 6 | 7 | 6 |
| 1895 | –1 | –6 | –7 | 1895–1904 | 6 | 6 | 5 |
| 1896 | 10 | 11 | 8 | 1896–1905 | 6 | 7 | 6 |
| 1897 | 10 | 14 | 7 | 1897–1906 | 7 | 8 | 7 |
| 1898 | 3 | 1 | 5 | 1898–1907 | 8 | 8 | 7 |
| 1899 | 11 | 6 | 14 | 1899–1908 | 6 | 7 | 4 |
| 1900 | 15 | 22 | 10 | 1900–9 | 5 | 5 | 5 |
| 1901 | 3 | 11 | –2 | 1901–10 | 5 | 5 | 6 |
| 1902 | 1 | –4 | 5 | 1902–11 | 4 | 5 | 4 |
| 1903 | 11 | 12 | 10 | 1903–12 | 5 | 7 | 5 |
| 1904 | 1 | 4 | –2 | 1904–13 | 6 | 6 | 5 |
| 1905 | 1 | –4 | 7 | 1905–14 | 6 | 6 | 7 |
| 1906 | 17 | 19 | 15 | .. | .. | .. | .. |
| 1907 | 12 | 14 | 11 | .. | .. | .. | .. |
| 1908 | –10 | 1 | –18 | .. | .. | .. | .. |
| 1909 | 4 | –10 | 21 | .. | .. | .. | .. |
| 1910 | 11 | 9 | 13 | .. | .. | .. | .. |
| 1911 | 2 | 14 | –15 | .. | .. | .. | .. |
| 1912 | 11 | 8 | 15 | .. | .. | .. | .. |
| 1913 | 6 | 6 | 6 | .. | .. | .. | .. |
| 1914 | 6 | –2 | 14 | .. | .. | .. | .. |
The last tables of this chapter are intended to set out the increases of the trade from year to year; and to do this there have been compiled tables of the percentage increase from year to year, and from decade to decade, and graphs to illustrate these figures, also a logarithmic curve of the index numbers of the trade.
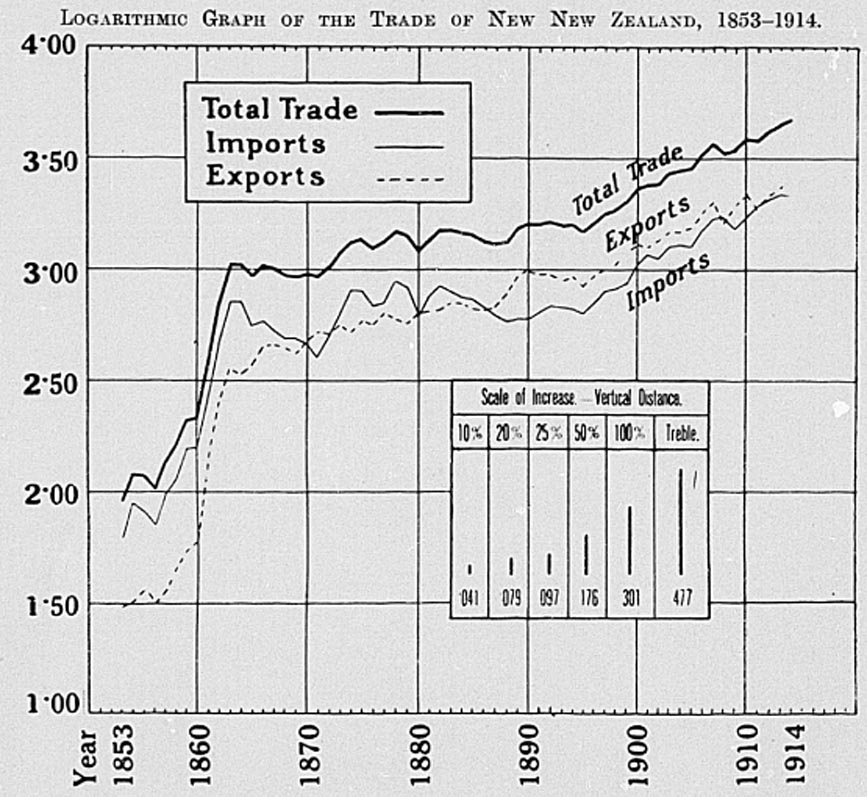
The first impression of the Table H is one of dismay, the fluctuations are so great, minuses alternating with increases. It must be borne in mind that successive increases are cumulative, and successive decreases also. Thus the steady increase from 1896 to 1914 is broken only by one decrease in 1908, and represents a very big net increase, much bigger than would appear from the bare figures.
The striking facts of the table are the enormous increases in the early “sixties,” mainly in the imports, the fluctuations between 1870 and 1895, especially the continued fall between 1883–87, and the almost unbroken increase since 1895. The average increase since 1895 has been 8 per cent., a very high rate when we remember that it is cumulative—is compound rather than simple interest.
The decade averages show a much smoother outline. Exports never show a decrease. It is true the rate of increase falls from the high level of the “sixties,” but never once does the curve drop below the zero line. Imports dip once, in 1869; but under the inflation of the “seventies” rise suddenly, only to fall again; and from 1883 to 1892—or, rather, the periods of which these years are the centres—the curve lies below the line: i.e., the imports decreased continuously. At the same time exports greatly increased; and the explanation seems to be that the influence of falling prices, added to the burdens New Zealand encountered in the “seventies,” caused greater export and restricted import. It is a matter of history that this period was a time of close retrenchment, when New Zealand was faced with a very big burden of debt.
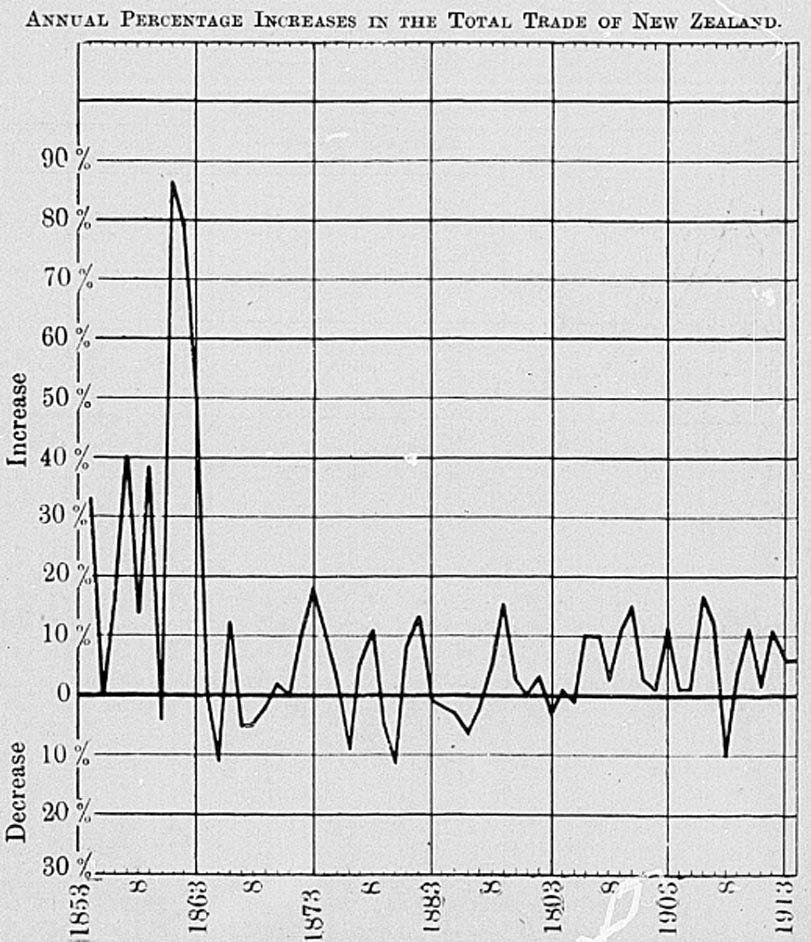
After 1893 the average increase of imports has been above that of exports, and this may mean one of two things—either that the imports were at an abnormally low level previously, or that New Zealand is overdrawing its account at the present time. During this period great loans have been contracted for public works and for State enterprises. It would seem that the tendency of very late years for imports to approach exports is directly due to the effect of large borrowings. But such loans, as long as they are spout wisely, on productive and necessary undertakings, will tend to increase exports in the future, and so redress the balance. They are analagous to the capital which no business man hesitates to borrow when he can extend his business and money is cheap. Further evidence to support this view is given in the next chapter, where it is shown that the greater part of the increase in imports since 1895 has been in metals, tools, machinery, &c.—all instrumental goods.
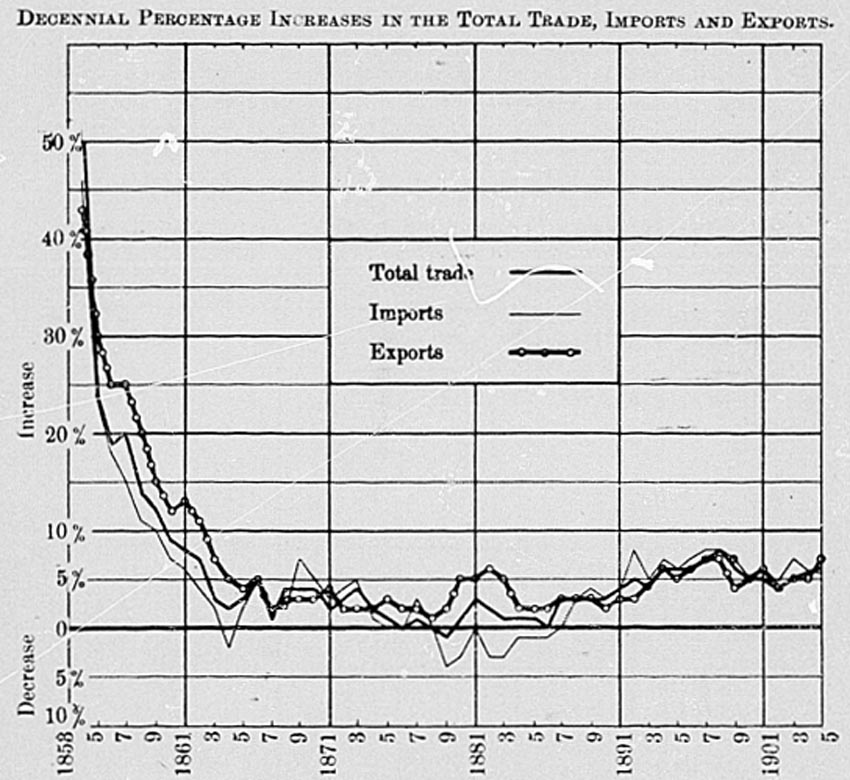
The logarithmic curve shows clearly the fluctuations of the early years 1853–60, and the enormous increases of the early “sixties,” the rise in the years just after 1870, and then the fluctuations and slow increases till 1895. From 1895 to 1914 a sharp rise is apparent, equivalent to a threefold increase.
It is interesting to notice that in the first decade the curve is concave, from 1863 to 1895 tends to be convex, and from 1895 increases almost in a straight line. This means that just before 1863 the trade was increasing faster than in 1893; that the rate of increase then fell off, but revived about 1895, and has been constant ever since.
In 1853 the Colony of New Zealand consisted of a few scattered settlements on the most accessible parts of the coast. Trade was small, except for the import of capital to sustain the settlers and develop their lands; and hardly a beginning had been made to develop the great resources of the country. The main items of export were timber, wool, potatoes, whale-oil, kauri-gum, and grain; the amount of each exported in 1853 being —timber, £93,000; wool, £67,000; potatoes, £30,000; whale-oil, £22,000; gum, £16,000; grain, £19,000. Just at this time the gold rushes of Australia were at their height, and New Zealand soon began to develop an export of flour and grain to the Australian States. The Registrar-General, writing in 1858, calls attention to the great fluctuations in trade in the “fifties,” and explains them by the abnormal conditions of trade due to the Australian gold-fever. The fluctuations were great, as will be seen from the tables in Chapter IV—great in relative magnitude, not absolutely. It must be remembered that, as the curve of the total trade ascends, bigger fluctuations must be considered as relative to the higher level of trade. The small ups and downs at the lower levels are quite as important relatively, and their effect is well shown in the logarithmic curve of trade.
In the “sixties” New Zealand gained a much greater impetus by gold rushes within her own Islands. Payable gold had been discovered in Nelson in 1857; but the first rush occurred at Gabriel's Gully in 1861. Coromandel followed in 1862, Westland in 1864, and Thames in 1867. The production of gold from these rushes was very great, as the tables show; but from 1871 the production of alluvial gold fell off, and the increased production since has been due to the extension of quartz-mining and dredging, not to any further alluvial discoveries. When the great discoveries of the “sixties” had attracted a considerable population, New Zealand's trade went up with a jump. The abrupt rise is well shown in the graph following Table A.
It is apparent that the increased population not only required more imported clothing and tools, &c., but absorbed a great quantity of the surplus foodstuffs which were usually exported. Further, as in every gold rush, men left their usual occupations in the search after gold, and so the productive powers of the country were for a while curtailed. There was practically no export of grain from 1861 to 1865, and every other article of export except wool shows a great shrinkage: except only gold, which, of course, rose greatly—from 5,000 oz. in 1860 to 628,000 oz. in 1863. As the alluvial gold began to work out, trade began to be normal again; exports again resumed their steady increase, and imports decreased, while the total trade also showed a tendency to decrease. Much of the great increase of exports was due to the high prices induced by the gold-fever. These prices reached their apex in 1864, and thereafter steadily declined; so that the apparent tendency of the total trade to decrease is partly the result of falling prices. The graphs attached to Table A show that the volume of goods increased slightly.
In 1870 Sir Julius Vogel initiated his borrowing policy, by which a young country containing only 300,000 people borrowed ton millions in ten years. The money was to be spent partly in subsidizing immigration, partly in opening up the country. The extensive public-works policy inaugurated led to great private recklessness. The development of the country, though often misdirected and premature, was yet a matter of necessity. The real trouble lay in the land speculation which was encouraged. The years 1874–76 saw a land boom of the very worst type, and it was because of the subsequent collapse of this boom that New Zealand had to fight the long depression. First the settlers failed, and then the mortgagees had to take up the burden, till finally it recoiled on the banks. The principal holder of these mortgages, the Bank of New Zealand, at last had to come to the Government for assistance; but, fortunately, the tide turned in 1895. The period is well described in Mr. Reeves's book, “The Long White Cloud.” As a matter of fact, it was almost the worst time New Zealand could have chosen to borrow: the production of gold was falling off, prices were falling rapidly, and the country was already saddled with a fairly large debt. It is noteworthy that India, another debtor country, was seriously harassed by falling prices between 1873 and 1895, though the special circumstances of a silver currency intensified the evil there. It will be seen that exports rose steadily all through the period, but imports fluctuated greatly and rose very little.
The borrowings of Vogel and the subsequent speculation put a heavy burden on the country, for which it got no adequate benefit. Practically all New Zealand's exports consisted of wool and gold: a surplus of grain or flour or butter might find its way to Australia, and some timber, kauri-gum, and flax always went to the United Kingdom; but in 1870 the two big exports accounted for 82 per cent. of the total. And the production of gold was decreasing, while the price of wool fell. So we must conclude that this was the worst time possible for contracting fresh loans, and the country did suffer greatly from this mistake being added to a combination of untoward circumstances.
The fluctuations of the imports show up the crises of the trade; and in this, as in other respects, corroborate Dr. McIlraith's figures for prices.
The high level of prices in 1864 was followed by depression in 1865. Another rise in 1869 is again reflected. The boom years 1874–75 show a big increase, but are followed by a collapse in 1876. Prices rise in 1877, and again are followed by trade. Similarly, the fall in 1880, the rise in 1882, the very low level of 1888, the depression again in 1895 correspond. The moving averages of the trade during this period show how the evil was finally met, by retrenchment and increased production. Retrenchment was the order of the day in public and private life: Civil servants lost 10 per cent of their salaries at one stroke, public works were almost stopped, while the exports slowly increased.
The beginning of better times came in 1882 with the first shipment of frozen meat to London. Refrigeration meant not only that the surplus sheep could be exported, so that a sheep was now valued for more than its wool and skin and tallow: it extended to the dairying industry, too. Its influence was widespread, not the least being that sheepowners were able to cull their flocks, instead of keeping decrepit ewes for their wool. With the frozen meat went increased exports of tallow, hides, skins, casings, &c., all wealth for the farmer and work for the labourer. Since 1882 the export of tallow has increased fourfold, and that of other by-products fifteenfold.
The frozen-meat industry now fills a very big place in the industrial life of New Zealand. It is controlled by local joint-stock companies, which have extensive works in every centre. The sheep may be bought by the company, or may merely be killed at the works, the company acting as agent. Following the meat-packers of America, hardly anything is wasted: wool is stripped from the pelts and hair from the hides; horns and hoofs and hides and skins are exported; sausage-casings are manufactured; manures are made from the offal; tinned meats and extracts, kidneys and sweetbreads are exported. Altogether the meat companies are a prominent and satisfactory feature of New Zealand's industrial life.
The effect of refrigeration on dairying was not apparent all at once, and it was not till the late “nineties” that the very rapid increase set in. Indeed, even with refrigeration, exports increased very slowly while prices continued to fall.
All over the world, prices turned about 1895. This is the testimony of all the leading index numbers. In New Zealand, too, prices began to rise, and trade at once responded and increased by leaps and bounds. It is beyond all doubt that the progress of the last twenty years is due primarily to rising prices of farm-products, and other causes have merely helped or hindered the good work. It has been shown that the rise is not a mere paper rise; that, apart from the rise in prices, there has been an enormous development of trade, both import and export. It seems, undoubted that the increase is due to increased production of exports, stimulated by high and rising prices, and still further stimulated by the diverging price-levels of exports and imports. That the rise in the price of her farm-products is much greater than the rise in price of her imports is a very happy fact for New Zealand. The increase in exports is seen mainly in meat, dairy-produce, and wool—all primary products.
The increase has been fairly uniform, imports following the previous year's exports; but the sequence is broken by commercial crises in 1903 and 1908. There was a slight crisis in 1903; but the effects on New Zealand were overwhelmed by the cumulative influence of rising prices. Even the severe crisis of 1907, originating in America and affecting the whole world, did not cause more than temporary distress in New Zealand. But its effect is very plainly apparent by an excess of imports in 1908 and hesitating trade for a year or so afterwards. Finally, in 1912–13 there was another tendency to depression all over the world, and the effects for New Zealand were accentuated by increased borrowings.
The loans contracted by a new country generally come in the shape of increased imports, and since New Zealand is a fairly large borrower this factor in trade must be borne in mind. It will be discussed later in Chapter VI, on the “Balance of Indebtedness” but it may be noted here that the increase in imports after 1870 is an indication of the loans, public and private, contracted then, and the fluctuations of the late years 1907–14 are probably due in great part to this cause also.
So far we have been considering the import and export trades as units; but it is very interesting to trace the changes that have taken place within the units, to see where the increases or decreases have taken place and to discover changes in relative proportions. It is comparatively easy to do this for exports, since the items are clear and well defined, and since the main items account for so large a percentage of the total. The selection of the export commodities gave little difficulty, and the data was easily obtained. But it is harder to analyse imports because of the multiplicity of headings and because no group of imports contributes a very large percentage of the total. So it was necessary to take some wide headings and include also some special commodities, such as tea and sugar, which are interesting either as illustrating special points or supplying a partial test of prosperity.
In almost every case it was possible to get quantities as well as values of exports, the only exceptions being rabbit-skins, the quantities of which were disregarded from a strong doubt as to their accuracy; and hides, skins, and casings, which have been lumped together as by-products of the meat industry; so that, though the quantities of each are given, the whole does not form a homogeneous total. These quantities have been valuable in showing the increase of the volume of trade as distinct from the value, and it was from them that the index number of exports in the previous chapter was compiled. The number of bushels of grain has been supplied, though it is hardly a homogeneous total. Under “grain and pulse” have been added wheat, oats, barley, rye, beans, and peas; and it is obvious that a bushel of wheat is different from a bushel of oats in weight and in value—so that occasionally it is evident that a big increase in oats has raised the number of bushels considerably, while the value is not raised nearly as much. A case in point is the increase from 1900–1—bushels from 9,530,000 to 13,370,000 and value from £1,034,000 to £1,286,000: here the increase in quantity is 40 per cent and in value only 24 per cent. In 1901 there was a great increase in the quantity of oats exported owing to the war in South Africa and the consequent demand for horse-feed. The only other commodity which needs explanation is timber. In the tables, the number of million superficial feet is taken where possible; but in the early returns the quantity was often shown as loads, spars, rickers, &c., so that the quantities had to be neglected there. Most of this timber is sawn undressed white-pine for butter-boxes, and kauri for cabinetmaking and building.
The quantities of imports are not so readily obtained. Obviously there can be no quantities given for the big headings, and in the case of some commodities where quantities are possible no information is given in the summaries of the trade returns: to obtain them it would have been necessary to dig in the body of the returns for each year. This applies only to tea and coal. Liquors, comprising beer, wines, and spirits, &c., do not give a homogeneous total, nor do sugars (molasses, treacle, glucose, sugar raw and refined), nor tobaccos (cigars, snuff, cigarettes, and tobacco).
For a similar reason imports have not been analysed before 1882, as no summaries were given before that date, and it was not possible in the time available to extract the information from the detailed returns. But the movements have been so regular and the proportions so evenly maintained that the extra work would hardly be repaid.
| TABLE J.—QUANTITIES AND VALUES OF PRINCIPAL COMMODITIES EXPORTED. | ||||||||||||
|---|---|---|---|---|---|---|---|---|---|---|---|---|
| Year. | Wool. | Frozen Meat. | Butter. | Cheese. | Gold. | Grain. | ||||||
| 00,000 omitted. | 000 omitted. | 000 omitted. | 000 omitted. | 000 omitted. | 000 omitted. | 000 omitted. | 000 omitted. | 000 omitted. | 000 omitted. | 0,000 omitted. | 000 omitted. | |
| NOTE.—Where figures are shown in brackets they represent actual quantities or values. | ||||||||||||
| lb. | £ | cwt. | £ | cwt. | £ | cwt. | £ | oz. | £ | Bushels. | £ | |
| 1853 | 11 | 67 | .. | .. | (1,039) | (7,507) | (808) | (4,092) | .. | .. | 6 | 19 |
| 1854 | 13 | 70 | .. | .. | (807) | (7,399) | (169) | (975) | .. | .. | 9 | 41 |
| 1855 | 18 | 93 | .. | .. | (785) | (5,780) | (406) | (2,163) | .. | .. | 15 | 82 |
| 1856 | 26 | 146 | .. | .. | (647) | (3,837) | (290) | (1,414) | .. | .. | 7 | 24 |
| 1857 | 26 | 177 | .. | .. | (382) | (2,102) | (549) | (1,818) | 10 | 40 | 8 | 30 |
| 1858 | 38 | 254 | .. | .. | (532) | (2,838) | (934) | (3,995) | 14 | 52 | 7 | 21 |
| 1859 | 51 | 340 | .. | .. | (859) | (5,588) | (1,067) | (4,296) | 7 | 28 | 12 | 39 |
| 1860 | 67 | 444 | .. | .. | (1,026) | (6,623) | (810) | (3,535) | 5 | 18 | 6 | 13 |
| 1861 | 79 | 524 | .. | .. | (25) | (126) | (404) | (1,844) | 194 | 753 | (8,118) | (2,518) |
| 1862 | 98 | 674 | .. | .. | Butter and cheese 1862–5, not given separately: Total, 617 cwt., £2,976. | 411 | 1,591 | (6,602) | (1,821) | |||
| 1863 | 126 | 830 | .. | .. | 2,432 | (3,238) | (1,160) | |||||
| 1864 | 167 | 1,071 | .. | .. | 1,858 | (3,580) | (722) | |||||
| 1865 | 192 | 1,142 | .. | .. | 2,226 | 3 | 6 | |||||
| 1866 | 228 | 1,354 | .. | .. | (232) | (1,590) | (13) | (65) | 735 | 2,845 | 3 | 7 |
| 1867 | 272 | 1,581 | .. | .. | (38) | (192) | (90) | (362) | 687 | 2,700 | 16 | 27 |
| 1868 | 289 | 1,517 | .. | .. | (138) | (532) | (335) | (1,240) | 637 | 2,504 | 63 | 114 |
| 1869 | 278 | 1,371 | .. | .. | (2,705) | (14,679) | (2,331) | (8,040) | 614 | 2,363 | 52 | 96 |
| 1870 | 370 | 1,704 | .. | .. | (3,435) | (12,995) | (2,735) | (9,327) | 545 | 2,158 | 85 | 141 |
| 1871 | 378 | 1,606 | .. | .. | (4,342) | (12,426) | (1,619) | (4,023) | 730 | 2,788 | 103 | 164 |
| 1872 | 419 | 2,538 | .. | .. | (1,629) | (4,462) | (1,362) | (4,379) | 445 | 1,731 | 106 | 179 |
| 1873 | 415 | 2,702 | .. | .. | (722) | (2,342) | (1,993) | (6,625) | 505 | 1,987 | 59 | 136 |
| 1874 | 468 | 2,835 | .. | .. | (357) | (1,168) | (1,326) | (4,408) | 376 | 1,505 | 116 | 291 |
| 1875 | 544 | 3,398 | .. | .. | (104) | (660) | (442) | (1,862) | 355 | 1,408 | 128 | 231 |
| 1876 | 599 | 3,396 | .. | .. | (871) | (3,910) | (885) | (3,488) | 318 | 1,269 | 217 | 338 |
| 1877 | 645 | 3,659 | .. | .. | (5,206) | (23,458) | (4,999) | (16,713) | 367 | 1,476 | 132 | 276 |
| 1878 | 593 | 3,293 | .. | .. | (3,106) | (12,111) | (3,019) | (9,368) | 311 | 1,244 | 211 | 509 |
| 1879 | 622 | 3,126 | .. | .. | (339) | (1,631) | (172) | (628) | 284 | 1,135 | 347 | 661 |
| 1880 | 669 | 3,169 | .. | .. | (2,717) | (8,350) | (717) | (1,983) | 303 | 1,220 | 554 | 899 |
| 1881 | 594 | 2,910 | .. | .. | (2,426) | (8,496) | (3,056) | (6,112) | 251 | 997 | 582 | 986 |
| 1882 | 653 | 3,119 | 15 | 19 | 11 | 52 | (3,553) | (10,130) | 231 | 922 | 431 | 908 |
| 1883 | 681 | 3,014 | 88 | 118 | 9 | 42 | (2,519) | (6,892) | 223 | 892 | 672 | 1,287 |
| 1884 | 811 | 3,268 | 254 | 345 | 16 | 67 | 10 | 25 | 246 | 989 | 536 | 744 |
| 1885 | 865 | 3,205 | 296 | 374 | 25 | 102 | 15 | 36 | 223 | 890 | 448 | 496 |
| 1886 | 909 | 3,073 | 346 | 427 | 23 | 106 | 16 | 46 | 236 | 940 | 344 | 449 |
| 1887 | 888 | 3,321 | 402 | 456 | 17 | 55 | 24 | 55 | 188 | 748 | 399 | 420 |
| 1888 | 832 | 3,115 | 552 | 629 | 30 | 118 | 37 | 79 | 230 | 914 | 500 | 653 |
| 1889 | 1,022 | 3,976 | 657 | 783 | 38 | 147 | 27 | 67 | 197 | 785 | 603 | 971 |
| 1890 | 1,028 | 4,151 | 899 | 1,088 | 35 | 123 | 40 | 85 | 188 | 751 | 800 | 1,074 |
| 1891 | 1,062 | 4,130 | 1,000 | 1,195 | 39 | 150 | 40 | 87 | 251 | 1,007 | 588 | 676 |
| 1892 | 1,182 | 4,313 | 870 | 1,033 | 54 | 227 | 41 | 91 | 237 | 952 | 663 | 816 |
| 1893 | 1,097 | 3,775 | 904 | 1,085 | 58 | 255 | 46 | 100 | 228 | 916 | 485 | 583 |
| 1894 | 1,443 | 4,827 | 1,025 | 1,195 | 61 | 251 | 56 | 115 | 222 | 888 | 243 | 226 |
| 1895 | 1,160 | 3,662 | 1,134 | 1,263 | 58 | 228 | 77 | 151 | 293 | 1,162 | 238 | 216 |
| 1896 | 1,292 | 4,392 | 1,103 | 1,252 | 71 | 282 | 71 | 130 | 264 | 1,041 | 294 | 346 |
| 1897 | 1,358 | 4,443 | 1,408 | 1,566 | 99 | 403 | 78 | 151 | 252 | 980 | 192 | 235 |
| 1898 | 1,494 | 4,646 | 1,552 | 1,699 | 97 | 404 | 69 | 136 | 280 | 1,081 | 105 | 136 |
| 1899 | 1,472 | 4,325 | 1,866 | 2,089 | 136 | 572 | 69 | 142 | 390 | 1,513 | 698 | 722 |
| 1900 | 1,407 | 4,749 | 1,845 | 2,124 | 173 | 741 | 103 | 229 | 374 | 1,440 | 953 | 1,032 |
| 1901 | 1,468 | 3,699 | 1,858 | 2,253 | 202 | 882 | 104 | 239 | 456 | 1,754 | 1,337 | 1,285 |
| 1902 | 1,604 | 3,355 | 2,139 | 2,719 | 254 | 1,206 | 75 | 164 | 508 | 1,951 | 586 | 786 |
| 1903 | 1,551 | 4,041 | 2,379 | 3,197 | 285 | 1,318 | 75 | 195 | 533 | 2,038 | 536 | 534 |
| 1904 | 1,446 | 4,674 | 1,913 | 2,794 | 314 | 1,380 | 85 | 185 | 520 | 1,988 | 377 | 392 |
| 1905 | 1,399 | 5,381 | 1,691 | 2,694 | 306 | 1,409 | 89 | 205 | 520 | 2,094 | 227 | 294 |
| 1906 | 1,544 | 6,766 | 2,026 | 2,877 | 320 | 1,560 | 131 | 341 | 564 | 2,271 | 100 | 139 |
| 1907 | 1,716 | 7,657 | 2,355 | 3,421 | 328 | 1,615 | 237 | 662 | 508 | 2,027 | 23 | 53 |
| 1908 | 1,625 | 5,333 | 2,120 | 3,189 | 230 | 1,171 | 281 | 783 | 506 | 2,005 | 111 | 143 |
| 1909 | 1,897 | 6,306 | 2,573 | 3,601 | 321 | 1,639 | 401 | 1,105 | 506 | 2,007 | 695 | 831 |
| 1910 | 2,044 | 8,308 | 2,654 | 3,851 | 357 | 1,812 | 452 | 1,195 | 478 | 1,896 | 198 | 318 |
| 1911 | 1,694 | 6,492 | 2,251 | 3,503 | 302 | 1,577 | 439 | 1,192 | 455 | 1,815 | 176 | 331 |
| 1912 | 1,884 | 7,105 | 2,573 | 3,910 | 378 | 2,089 | 577 | 1,680 | 343 | 1,345 | 532 | 741 |
| 1913 | 1,865 | 8,058 | 2,579 | 4,450 | 372 | 2,062 | 612 | 1,770 | 376 | 1,495 | 65 | 130 |
| 1914 | 2,205 | 9,318 | 3,230 | 5,863 | 434 | 2,339 | 864 | 2,564 | 228 | 895 | 170 | 261 |
| TABLE J.—QUANTITIES AND VALUES OF PRINCIPAL COMMODITIES EXPORTED. - continued | ||||||||||||||
|---|---|---|---|---|---|---|---|---|---|---|---|---|---|---|
| Year. | Tallow. | Kauri-gum. | Phormium. | Timber. | Coal. | Flour. | Rabbit-skins. | By-products of Meat. | ||||||
| 000 omitted. | 000 omitted. | 000 omitted. | 000 omitted. | — | 000 omitted. | 000,000 omitted. | 000 omitted. | 000 omitted. | 000 omitted. | — | 000 omitted. | 000 omitted. | 000 omitted. | |
| NOTE.—Where figures are shown in brackets they represent actual quantities or values. | ||||||||||||||
| cwt. | £ | Tons. | £ | Tons. | £ | Sup. ft. | £ | Tons. | £ | Tons. | £ | £ | £ | |
| 1853 | .. | .. | 8 | 16 | 46 | (1,046) | .. | 93 | .. | .. | 66 | 1 | .. | .. |
| 1854 | .. | .. | 17 | 29 | 48 | (1,563) | .. | 46 | .. | .. | 57 | 1 | .. | .. |
| 1855 | .. | .. | 4 | 5 | 150 | (4,674) | .. | 9 | .. | .. | 138 | 5 | .. | .. |
| 1856 | .. | .. | 14 | 19 | 22 | (552) | .. | 23 | .. | .. | 193 | 4 | .. | .. |
| 1857 | .. | .. | 25 | 35 | 38 | (710) | .. | 12 | .. | .. | 119 | 2 | .. | .. |
| 1858 | .. | .. | 18 | 20 | 64 | (1,516) | .. | 17 | .. | .. | 68 | 1 | .. | .. |
| 1859 | .. | .. | 20 | 21 | 77 | (1,593) | .. | 34 | .. | .. | 102 | 2 | .. | .. |
| 1860 | .. | .. | 10 | 10 | 61 | (1,240) | .. | 14 | .. | .. | 18 | (378) | .. | .. |
| 1861 | .. | .. | 9 | 10 | 2 | (43) | .. | 19 | .. | .. | 4 | (89) | .. | .. |
| 1862 | .. | .. | 11 | 11 | 13 | (261) | .. | 16 | .. | .. | .. | .. | .. | .. |
| 1863 | .. | .. | 14 | 27 | 13 | (251) | .. | 18 | .. | .. | .. | .. | .. | 12 |
| 1864 | 1 | 2 | 22 | 61 | 7 | (170) | .. | 25 | .. | .. | .. | .. | .. | 17 |
| 1865 | 2 | 2 | 19 | 46 | 3 | (75) | 3 | 13 | .. | .. | .. | .. | .. | 17 |
| 1866 | 1 | 3 | 25 | 71 | 45 | (996) | 4 | 24 | (261) | (400) | .. | .. | .. | 18 |
| 1867 | 1 | 2 | 27 | 77 | 126 | 4 | 3 | 16 | (973) | (1,228) | 971 | 9 | .. | 17 |
| 1868 | 2 | 3 | 27 | 72 | 534 | 8 | 2 | 16 | (1,027) | (1,210) | 154 | 3 | .. | 12 |
| 1869 | 9 | 14 | 29 | 111 | 2,028 | 45 | 3 | 22 | (750) | (800) | 449 | 6 | .. | 15 |
| 1870 | 42 | 76 | 44 | 175 | 5,471 | 133 | 2 | 19 | (1,672) | (1,508) | 737 | 8 | .. | 29 |
| 1871 | 40 | 67 | 51 | 168 | 4,248 | 91 | 3 | 20 | (1,696) | (1,612) | 926 | 12 | .. | 50 |
| 1872 | 39 | 69 | 48 | 154 | 3,985 | 99 | 5 | 27 | (990) | (855) | 502 | 8 | .. | 49 |
| 1873 | 40 | 67 | 28 | 86 | 6,454 | 144 | 6 | 44 | (724) | (655) | 935 | 12 | 1 | 49 |
| 1874 | 43 | 65 | 26 | 80 | 2,038 | 38 | 7 | 44 | (1,463) | (1,363) | 2,210 | 27 | 2 | 50 |
| 1875 | 36 | 56 | 32 | 139 | 639 | 12 | 5 | 40 | 3 | 3 | 636 | 8 | 4 | 67 |
| 1876 | 62 | 110 | 29 | 109 | 897 | 18 | 7 | 50 | 2 | 2 | 497 | 7 | 4 | 39 |
| 1877 | 93 | 157 | 36 | 118 | 1,053 | 19 | 8 | 51 | 3 | 2 | 960 | 14 | 9 | 46 |
| 1878 | 100 | 179 | 34 | 133 | 622 | 11 | 4 | 39 | 6 | 5 | 4,031 | 48 | 33 | 26 |
| 1879 | 93 | 146 | 32 | 148 | 445 | 8 | 5 | 36 | 7 | 6 | 1,278 | 13 | 47 | 40 |
| 1880 | 101 | 147 | 47 | 243 | 894 | 16 | 8 | 51 | 7 | 6 | 553 | 6 | 67 | 50 |
| 1881 | 83 | 121 | 55 | 254 | 1,308 | 26 | 13 | 71 | 7 | 6 | 3,220 | 35 | 85 | 52 |
| 1882 | 109 | 166 | 55 | 260 | 2,040 | 42 | 16 | 115 | 3 | 2 | 10,932 | 120 | 89 | 77 |
| 1883 | 141 | 234 | 65 | 337 | 2,013 | 37 | 24 | 125 | 7 | 5 | 6,119 | 65 | 101 | 69 |
| 1884 | 151 | 235 | 64 | 342 | 1,525 | 23 | 25 | 129 | 6 | 4 | 3,666 | 33 | 108 | 93 |
| 1885 | 139 | 177 | 59 | 300 | 1,063 | 16 | 28 | 141 | 44 | 51 | 5,244 | 41 | 86 | 102 |
| 1886 | 130 | 120 | 49 | 258 | 1,112 | 16 | 29 | 128 | 46 | 52 | 8,698 | 87 | 66 | 97 |
| 1887 | 155 | 147 | 68 | 362 | 1,578 | 25 | 31 | 127 | 44 | 44 | 1,575 | 16 | 111 | 120 |
| 1888 | 136 | 125 | 85 | 381 | 4,042 | 75 | 43 | 178 | 64 | 61 | 4,847 | 48 | 92 | 131 |
| 1889 | 159 | 159 | 75 | 330 | 17,084 | 361 | 43 | 177 | 79 | 76 | 16,183 | 158 | 96 | 165 |
| 1890 | 173 | 162 | 74 | 379 | 21,158 | 382 | 42 | 182 | 70 | 67 | 9,937 | 87 | 112 | 181 |
| 1891 | 176 | 173 | 84 | 437 | 15,809 | 282 | 43 | 182 | 92 | 91 | 3,588 | 40 | 126 | 223 |
| 1892 | 165 | 166 | 87 | 518 | 12,793 | 215 | 23 | 88 | 79 | 80 | 4,568 | 44 | 122 | 199 |
| 1893 | 170 | 184 | 83 | 511 | 12,587 | 219 | 27 | 101 | 69 | 73 | 2,068 | 14 | 139 | 210 |
| 1894 | 199 | 204 | 83 | 405 | 4,677 | 66 | 32 | 116 | 75 | 73 | 1,061 | 6 | 88 | 201 |
| 1895 | 264 | 261 | 74 | 419 | 1,806 | 21 | 38 | 142 | 86 | 83 | 575 | 3 | 85 | 233 |
| 1896 | 223 | 209 | 71 | 431 | 2,698 | 33 | 35 | 134 | 80 | 72 | 6,574 | 62 | 66 | 214 |
| 1897 | 310 | 260 | 66 | 398 | 2,769 | 31 | 39 | 154 | 76 | 70 | 9,816 | 101 | 47 | 246 |
| 1898 | 347 | 302 | 99 | 587 | 4,850 | 75 | 41 | 165 | 56 | 50 | 655 | 6 | 52 | 317 |
| 1899 | 339 | 312 | 111 | 608 | 10,371 | 184 | 50 | 197 | 89 | 83 | 1,643 | 10 | 81 | 347 |
| 1900 | 368 | 368 | 102 | 622 | 15,906 | 332 | 58 | 232 | 113 | 98 | 2,613 | 17 | 42 | 355 |
| 1901 | 335 | 352 | 75 | 446 | 10,171 | 196 | 72 | 295 | 160 | 142 | 1,305 | 8 | 57 | 247 |
| 1902 | 424 | 550 | 74 | 450 | 20,852 | 534 | 49 | 208 | 189 | 155 | 370 | 4 | 53 | 484 |
| 1903 | 397 | 518 | 94 | 631 | 22,652 | 596 | 57 | 241 | 152 | 129 | 249 | (2,736) | 41 | 590 |
| 1904 | 322 | 358 | 92 | 502 | 26,936 | 710 | 60 | 254 | 165 | 140 | 387 | (3,079) | 41 | 512 |
| 1905 | 319 | 348 | 109 | 561 | 27,877 | 696 | 75 | 319 | 123 | 107 | 448 | (3,635) | 67 | 647 |
| 1906 | 378 | 455 | 92 | 522 | 27,779 | 776 | 76 | 305 | 142 | 123 | 279 | (2,239) | 51 | 883 |
| 1907 | 415 | 561 | 87 | 580 | 28,547 | 832 | 72 | 312 | 129 | 115 | 183 | (1,574) | 54 | 1,053 |
| 1908 | 373 | 481 | 55 | 373 | 17,403 | 396 | 85 | 375 | 101 | 86 | 90 | (862) | 67 | 748 |
| 1909 | 484 | 648 | 83 | 553 | 14,318 | 307 | 72 | 338 | 202 | 184 | 294 | (3,253) | 90 | 970 |
| 1910 | 520 | 757 | 87 | 465 | 20,645 | 448 | 82 | 408 | 277 | 260 | 127 | (1,419) | 133 | 1,050 |
| 1911 | 413 | 607 | 76 | 396 | 17,366 | 300 | 86 | 439 | 223 | 204 | 118 | (1,019) | 77 | 876 |
| 1912 | 471 | 685 | 79 | 401 | 18,641 | 376 | 94 | 491 | 229 | 216 | 307 | (2,861) | 118 | 1,021 |
| 1913 | 455 | 663 | 88 | 549 | 34,391 | 787 | 63 | 319 | 212 | 205 | 206 | (1,685) | 87 | 1,155 |
| 1914 | 490 | 694 | 85 | 497 | 23,928 | 492 | 83 | 423 | 303 | 282 | 62 | (701) | 48 | 1,354 |
| TABLE J1.—RELATIVE PROPORTIONS OFTHE PRINCIPAL EXPORTS EXPRESSEDAS PERCENTAGE OF TOTAL EXPORTS. | |||||||||||||
|---|---|---|---|---|---|---|---|---|---|---|---|---|---|
| Year. | Wool. | Frozen Moat. | Butter. | Cheese. | Gold. | Grain. | Tallow. | Kauri-gum. | Phormium. | Timber. | Coal. | Byproducts. | Other Articles. |
| Per Cent. | Per Cent. | Per Cent. | Per Cent. | Per Cent. | Per Cent. | Per Cent. | Per Cent. | Per Cent. | Per Cent. | Per Cent. | Per Cent. | Per Cent. | |
| 1853 | 22 | .. | .. | .. | .. | 6 | .. | 5 | .. | 31 | .. | .. | 36 |
| 1854 | 22 | .. | .. | .. | .. | 13 | .. | 9 | .. | 15 | .. | .. | 55 |
| 1855 | 25 | .. | .. | .. | .. | 22 | .. | 1 | .. | 2 | .. | .. | 49 |
| 1856 | 46 | .. | .. | .. | .. | 8 | .. | 6 | .. | 7 | .. | .. | 33 |
| 1857 | 48 | .. | .. | .. | 11 | 5 | .. | 9 | .. | 4 | .. | .. | 20 |
| 1858 | 55 | .. | .. | .. | 11 | 7 | .. | 4 | .. | 5 | .. | .. | 20 |
| 1859 | 62 | .. | .. | .. | 5 | 2 | .. | 4 | .. | 7 | .. | .. | 15 |
| 1860 | 76 | .. | .. | .. | 3 | .. | .. | 2 | .. | 2 | .. | .. | 15 |
| 1861 | 38 | .. | .. | .. | 56 | .. | .. | 1 | .. | 1 | .. | .. | 5 |
| 1862 | 28 | .. | .. | .. | 66 | .. | .. | .. | .. | 1 | .. | 1 | 4 |
| 1863 | 24 | .. | .. | .. | 70 | .. | .. | 1 | .. | 1 | .. | 1 | 3 |
| 1864 | 31 | .. | .. | .. | 55 | .. | .. | 2 | .. | 1 | .. | 1 | 10 |
| 1865 | 31 | .. | .. | .. | 60 | .. | .. | 1 | .. | .. | .. | .. | 8 |
| 1866 | 30 | .. | .. | .. | 63 | .. | .. | 2 | .. | .. | .. | .. | 5 |
| 1867 | 34 | .. | .. | .. | 58 | 1 | .. | 2 | .. | .. | .. | .. | 5 |
| 1868 | 34 | .. | .. | .. | 57 | 3 | .. | 2 | .. | .. | .. | .. | 4 |
| 1869 | 32 | .. | .. | .. | 56 | 2 | .. | 3 | 1 | .. | .. | .. | 5 |
| 1870 | 35 | .. | .. | .. | 47 | 3 | 2 | 3 | 3 | .. | .. | 1 | 6 |
| 1871 | 31 | .. | .. | .. | 53 | 3 | 1 | 3 | 2 | .. | .. | 1 | 6 |
| 1872 | 50 | .. | .. | .. | 33 | 3 | 1 | 3 | 2 | 1 | .. | 1 | 6 |
| 1873 | 48 | .. | .. | .. | 35 | 2 | 1 | 2 | 3 | 1 | .. | 1 | 7 |
| 1874 | 54 | .. | .. | .. | 29 | 6 | 1 | 2 | 1 | 1 | .. | 1 | 5 |
| 1875 | 58 | .. | .. | .. | 24 | 4 | 1 | 2 | .. | 1 | .. | 1 | 9 |
| 1876 | 59 | .. | .. | .. | 22 | 6 | 2 | 2 | .. | 1 | .. | 1 | 7 |
| 1877 | 58 | .. | .. | .. | 23 | 4 | 3 | 2 | .. | 1 | .. | 1 | 8 |
| 1878 | 54 | .. | .. | .. | 20 | 8 | 3 | 2 | .. | 1 | .. | 1 | 12 |
| 1879 | 55 | .. | .. | .. | 19 | 11 | 2 | 3 | .. | 1 | .. | 1 | 8 |
| 1880 | 49 | .. | .. | .. | 19 | 14 | 2 | 4 | .. | 1 | .. | 1 | 10 |
| 1881 | 48 | .. | .. | .. | 16 | 16 | 2 | 4 | .. | 1 | .. | 1 | 12 |
| 1882 | 46 | .. | 1 | .. | 14 | 14 | 2 | 4 | 1 | 1 | .. | 1 | 16 |
| 1883 | 43 | 2 | 1 | .. | 11 | 18 | 3 | 5 | 1 | 2 | .. | 1 | 13 |
| 1884 | 46 | 5 | 1 | .. | 14 | 11 | 3 | 5 | .. | 2 | .. | 1 | 12 |
| 1885 | 47 | 5 | 1 | 1 | 13 | 8 | 3 | 4 | .. | 2 | 1 | 1 | 14 |
| 1886 | 46 | 6 | 2 | 1 | 14 | 7 | 2 | 4 | .. | 2 | 1 | 2 | 14 |
| 1887 | 48 | 7 | 1 | 1 | 11 | 6 | 2 | 5 | .. | 2 | 1 | 2 | 14 |
| 1888 | 40 | 8 | 2 | 1 | 12 | 8 | 2 | 5 | 1 | 2 | 1 | 2 | 16 |
| 1889 | 42 | 8 | 2 | 1 | 8 | 11 | 2 | 4 | 4 | 2 | 1 | 2 | 13 |
| 1890 | 42 | 11 | 1 | 1 | 8 | 11 | 2 | 4 | 4 | 2 | 1 | 2 | 11 |
| 1891 | 43 | 12 | 2 | 1 | 11 | 7 | 2 | 5 | 3 | 2 | 1 | 2 | 9 |
| 1892 | 45 | 11 | 2 | 1 | 10 | 9 | 2 | 5 | 2 | 1 | 1 | 2 | 9 |
| 1893 | 42 | 12 | 3 | 1 | 10 | 6 | 2 | 6 | 2 | 1 | 1 | 2 | 12 |
| 1894 | 54 | 13 | 3 | 1 | 10 | 2 | 2 | 4 | 1 | 1 | 1 | 2 | 6 |
| 1895 | 43 | 15 | 3 | 2 | 14 | 3 | 3 | 5 | .. | 2 | 1 | 3 | 6 |
| 1896 | 47 | 13 | 3 | 1 | 11 | 4 | 2 | 5 | .. | 1 | 1 | 2 | 10 |
| 1897 | 44 | 16 | 4 | 2 | 10 | 2 | 3 | 4 | .. | 2 | 1 | 2 | 10 |
| 1898 | 44 | 16 | 4 | 1 | 10 | 1 | 3 | 5 | 1 | 2 | 1 | 3 | 9 |
| 1899 | 36 | 18 | 5 | 1 | 13 | 6 | 3 | 5 | 2 | 2 | 1 | 3 | 5 |
| 1900 | 36 | 16 | 6 | 2 | 11 | 8 | 3 | 5 | 3 | 2 | 1 | 3 | 4 |
| 1901 | 29 | 18 | 7 | 2 | 14 | 10 | 3 | 3 | 2 | 2 | 1 | 3 | 6 |
| 1902 | 25 | 20 | 9 | 1 | 14 | 6 | 4 | 3 | 4 | 2 | 1 | 4 | 7 |
| 1903 | 27 | 21 | 9 | 1 | 14 | 4 | 3 | 4 | 4 | 2 | 1 | 4 | 6 |
| 1904 | 32 | 19 | 9 | 1 | 13 | 3 | 3 | 4 | 5 | 2 | 1 | 3 | 5 |
| 1905 | 34 | 17 | 9 | 1 | 13 | 2 | 2 | 3 | 4 | 2 | 1 | 4 | 8 |
| 1906 | 38 | 16 | 9 | 2 | 13 | 1 | 3 | 3 | 4 | 2 | 1 | 5 | 3 |
| 1907 | 38 | 17 | 8 | 3 | 10 | .. | 3 | 3 | 4 | 2 | 1 | 5 | 6 |
| 1908 | 33 | 20 | 7 | 4 | 12 | 1 | 3 | 2 | 3 | 2 | 1 | 5 | 7 |
| 1909 | 33 | 18 | 8 | 6 | 11 | 4 | 3 | 3 | 2 | 2 | 1 | 5 | 4 |
| 1910 | 37 | 17 | 7 | 5 | 9 | 1 | 3 | 2 | 2 | 2 | 1 | 5 | 9 |
| 1911 | 34 | 18 | 8 | 6 | 10 | 2 | 3 | 2 | 2 | 2 | 1 | 5 | 7 |
| 1912 | 33 | 18 | 10 | 8 | 6 | 3 | 3 | 2 | 2 | 2 | 1 | 5 | 7 |
| 1913 | 35 | 19 | 9 | 8 | 7 | 1 | 3 | 2 | 3 | 1 | 1 | 5 | 6 |
| 1914 | 35 | 22 | 9 | 10 | 3 | 1 | 3 | 2 | 2 | 2 | 1 | 5 | 5 |
It is at once apparent from a perusal of the principal exports that New Zealand's wealth lies in her pastoral, mineral, and agricultural products. Most of the great exports appear in the very earliest days: wool especially has always been a chief article of export, though overshadowed for a short time by gold. Even in the gold rushes of the “sixties” the export of wool steadily increased, both in value and quantity. The first check to the quantity exported came in 1869; but the position was recovered the next year. This case would seem to be due to the calendar years splitting the wool seasons, as it interrupts a very regular rise. The next chock (1872–73) seems to be similar, and probably part of the big increase of 1874 should be credited to 1873.
The decline in 1878 is more serious, since it took two years to attain again to the previous level, and the price-level was falling at the same time. Reactions came again in 1881 and in 1887–88: these were the bad years when New Zealand was feeling the burden of her debts, and production was increasing too slowly to shake them off. Inevitably crises came and were disastrous to the overburdened colony. A slight temporary check in 1893 was probably due again to the splitting of the season; but in 1895 came a big fall, due mainly to the financial troubles of 1893–94 when banks failed in Australia and the Government had to come to the rescue of the Bank of New Zealand.
Since then there have been temporary checks in 1900, 1904–5, 1908, and 1911–12; but New Zealand's eggs are not now all in one basket, and, besides, the effect of a check in quantity has been moderated by increasing prices.
Values follow quantities very closely in the early years, showing a check in 1869 and in 1871, but not in 1873. The values of 1878–86 show how falling prices were crippling a debtor country by nullifying the effect of increased production. There was a temporary rise in price in 1887–89, but after that prices again fell till the boom year 1894. The value of 1900–2 probably reflects the effect of the South African War, and the great fall in 1908 brings out sharply the year of crisis following the United States crisis of 1907.
But on the whole both the quantities and value of wool show great increases. The quantity has trebled in the last thirty years. The wool exported is practically the whole production of wool in New Zealand, very little being used in New Zealand manufactures. For the twelve months ended 30th September, 1914, the highest amount yet reached, the quantity used locally was only 6,846,960 lb. as against 196,499,896 lb. exported.
The first trial cargoes of frozen meat were sent Home in 1882, and proved a great success. There seems to be a prejudice against frozen meat in England, but the import from New Zealand goes on increasing. The trade has met some difficulties, principally lack of accommodation at the Home ports. Great resentment was caused by revelations about the barges used to convoy the frozen carcases from the ship's side to the cool chambers and the time taken in doing so. In New Zealand itself great care is taken: all carcases are examined by Government officers, and kept closely in cool chambers till shipment. Of late years a move has boon made to ship to other ports besides London—to supply Yorkshire through Hull and Goole, and Lancashire through Liverpool. This should result in improved conditions of unshipment, as well as better marketing facilities.
So far the only market has been the United Kingdom, and it has been impossible to enter the markets of Europe and the United States because of high tariffs and lack of shipping facilities. There scorned a tendency before the war to lower the barrier against imported foodstuffs since the cost of living is rising so much, and this would have benefited New Zealand. Then, more and more, steamers were trading to and from both coasts of the United States, and a new Gorman line had just entered the New Zealand trade. When once New Zealand mutton and lamb became settled in favour in England, there were not wanting unscrupulous dealers to sell Argentine meat as “prime Canterbury,” and successive High Commissioners have had to try and check the imposture. But with all the drawbacks the trade has increased by leaps and bounds, till now it is second in importance only to wool.
The export has shown ups and downs, some due to overrunning the increase in flocks, some to strike troubles (which seem to afflict the slaughtering trade often), and some due simply to reaction from a crisis. But the tendency to increase is very constant, and decreases show mainly the same features as in the case of wool. The rising prices since 1895 are very evident: the export of 1,134,000 cwt. for £1,263,000 is much less than in 1914–3,229,973 cwt. for £5,863,062. The figures for 1914 are abnormally high both in quantity and price, on account of the whole meat-supply of the Dominion being requisitioned by the Imperial Government.
It is unnecessary to distinguish between quantities and values in the case of gold, since the ratio is constant. All the gold produced in New Zealand, practically without exception, is exported, and so the export figures represent the gold-production of New Zealand. It was in 1857 that the first payable goldfield was worked, at Collingwood, in the Province of Nelson, though it had been known before that New Zealand contained gold. The year 1861 set Otago alive with gold-seekers rushing to Gabriel's Gully, and the production of alluvial gold rose rapidly to £2,432,000 in 1863. Further rushes occurred in Westland in 1865, and the production of gold reached nearer three millions than two. But alluvial gold is soon worked out, and, despite the opening of quartz-mines in the Auckland District in the early “seventies,” after 1871 the production of gold declined greatly. It was a most unfortunate time for New Zealand, and the decline was a very real calamity, as it continued, touching low-water mark only in 1887, at about three-quarters of a million.
In later years the introduction of the cyanide process, the development of capitalistic quartz-mining, and dredging in Otago, resulted in a greatly increased production, reaching two millions and a quarter in 1906. Since then the production is falling steadily, though a very low figure for 1912 is the result of a big strike at Waihi, which closed down the mines for months, and restriction of exports in 1914, combined with buying for the Bank of England, lowered exports still further. There is an export duty on gold of 2s. 3d. per ounce in the North Island, and 3d. per ounce in the South, the proceeds of which are paid to the Gold-miners' Relief Fund.
Butter and cheese appear in the first return, though the quantity exported was small. In the years of the gold rushes the export was so negligible that they were lumped together in the returns, and in four years (1862–65) the combined export was worth less than £3,000. The export then resumed its normal trend till the introduction of refrigeration in 1882. Up till that year the export represented only a small surplus over local production, which was sent to Australia and was dependent on the seasons in Australia as much as here. And very often the butter, as Scholefield says in his book “New Zealand in Evolution,” attained queer flavours on the voyage over, so that the trade never grew very much.
Refrigeration in 1882 changed the whole aspect. Export responded at once, and a new industry sprang up. New Zealand is very proud of her co-operative system of butter and cheese factories, owned and supplied by the small dairy-farmers themselves. The Government helps by a system of compulsory grading for export and by rigid inspection of factories and stock, and it has been drilled into the New Zealand producers that it pays to produce only the best quality.
In another way, too, the dairying industry has been helped by the subdivision of land, which has been promoted by progressive taxation, by lending cheap money to settlers, and even by compulsory sale at the Government valuation. The dairying industry is essentially an industry for the smaller and more intensive farms, and it has profited most from this legislation. Popular feeling in New Zealand encourages subdivision because of the greater amount of labour needed in dairying as compared with pastoral industries, and because small farmers patronize local industry more.
The increased export of butter dates from 1882; but the more rapid increase, as usual, is only from 1895, while prices have again increased. Cheese increased but slowly till 1905, since when it has increased from £205,000 to £2,564,125.
The export of grain was at one time much more important than now, when it is quite overshadowed by the products mentioned above. In 1855 it contributed 22 per cent. of the exports, and again in the early “eighties” it became important. But the export has fluctuated greatly, the reason probably being that a good deal of the grain is produced for home consumption and only a surplus is exported. Naturally this surplus will vary with seasons, both in New Zealand and elsewhere.
A fairly considerable export in the “fifties” was almost killed by the gold rushes, but revived again about 1867 and increased steadily till 1883, when it dropped in 1887 to a little over a third of the value of 1883. This drop is accounted for by the advent of the meat industry, the impetus given to dairying, and also by falling prices. The principle of substitution is in operation, the land being transferred to the more profitable pursuits. There was a temporary revival in 1889–90 and again in 1899–1902, this latter being caused by the export to South Africa. Other temporary revivals came in 1909 and 1912, and in nearly every case increased export of grain has followed a commercial crisis.
Kauri-gum is a product peculiar to New Zealand, and is always quoted as a typical New Zealand export, though its value is almost negligible compared with wool, meat, gold, and dairy-produce. It is the dried resin of the kauri-tree, and is found only in the swamps north of Auckland, where once great forests existed. Its use is as a substitute for shellac in making varnishes and polishes. The industry is carried on by nomadic workers, for a great part foreigners, who spear for the gum and dig out their finds: though latterly the high price of the gum has caused the ground to be worked more and more thoroughly. The very nature of the industry makes the export fluctuate greatly, but it has climbed up to the level of about half a million pounds in value, and fluctuates about that. The highest figure yet recorded is £631,000 in 1903.
Another peculiar export is the native flax or Phormium tenax. The plant grows naturally in swampy soil, and the Maoris used it to make mats and clothing and baskets, dressing it roughly by tearing the gum from the fibre with sharp shells. The chief difficulty has been to find a means of dressing the flax, and the Government has offered a bonus for the discovery. Though phormium was till recently classed in the statistics as a manufacture, it is nothing but raw fibre. The export has fluctuated alarmingly, and a high price would cause all the flax in sight to be cut; but then the inclusion of inferior fibre and oven of raupo (native rushes) would cause a reaction. New Zealand flax has to compete in the world markets with other kindred commodities—manila, sisal, hemp, &c. When the supply of manila runs short the price of phormium rises greatly and production is stimulated. It is only of late years that it has been found that flax repays cultivation, and, moreover, grows better and firmer on good ground than on swamps.
The export suddenly rose in 1889, but by 1895 was down again to the old level. In 1899 another rise came, which continued with fluctuations to 1914, reaching its apex, £832,000, in 1906.
Tallow and hides and skins are natural exports in a pastoral country, and have steadily increased all through the period. It is quite evident that the frozen-meat industry is responsible for the great increase of by-products and has helped to increase tallow. To hides and skins has been added in later years the item sausage-casings.
It has been noted before that the meat industry in New Zealand furnishes a fine example of the production of joint products. Before refrigeration, sheep were bred solely for the wool they produced, and there was the danger of the flocks being tainted with decrepitude. Since 1882 pastoralists have been breeding to produce a sheep which will yield the maximum both of wool and of good meat, and special breeds have been evolved suitable to the different types of country.
Further, several new products have risen greatly in importance, and special reference to this aspect was made in Chapter IV. The export of hides, skins, and sausage-casings has greatly increased since refrigeration was introduced, and these again are joint products with wool and meat.
The export of coal has crept steadily up from small beginnings in the “seventies.” The Government improved the coal po in the “eighties” by setting aside certain revenues as an endowment, and since then the production has greatly increased, though still hampered by the bar harbours. A good deal of coal is consumed locally: the State owns two coal-mines, whose whole produce is used in New Zealand; and similarly most of the other mines produce for the home market. New Zealand coal got a fine advertisement from the Calliope's achievement in 1889. Most of the export is bunker-coal for the steamers trading to New Zealand.
The export of rabbit-skins is an interesting reminder of the scourge that threatened to overrun New Zealand at one time. In the new countries the rabbit, introduced for sport, spread marvellously and soon began to eat out the grass from the sheep-runs. A regular war had to be waged with gun and trap and poison and wire-netting fences before the danger was averted, and the increased export from 1878 to 1895 is a reflection of this. Lately there has been a revival, partly owing to the demand for coney-furs and partly owing to the more stringent administration of the law directed against the pest.
Flour was for long exported to Australia whenever a surplus was produced, and the export reached £158,000 in 1888. Sometimes' conditions were reversed and New Zealand imported flour and wheat from Australia, but only in abnormal years. Even now, though there is a tariff banner of £1 per ton, the fine hard milling wheat of South Australia is regularly imported, though only in small quantities. Being a surplus export, it naturally fluctuated widely, but maintained on the average a fair level of about £40,000 till 1900. The great bulk of the trade had gone to Australia, but the new Federal Parliament in 1901 was distinctly protective, and the import of flour from New Zealand was quickly killed.
The first ships that used to visit New Zealand took away kauri spars, and ever since there has been an export of timber. At first the forests were ruthlessly cut down, but as the danger became apparent more care was exercised by the Government. The export of timber now consists for the most part of white-pine (kahikatea) for making butter-boxes and some kauri and rimu for cabinetmaking. The export has steadily increased in quantity and in value till in 1912 the highest figure yet reached, ninety-four million superficial feet, valued at nearly half a million pounds, was exported. There is an export duty imposed, not for revenue, but to check the destruction of the forests.
In the very early days the main exports were those most easily produced—timber, grain, wool, potatoes, kauri-gum, and a survival of the pre-settlement days, whale-oil. In 1855 the percentages were—wool 25, grain 22, potatoes 25. Then wool increased greatly, rising to 76 per cent. in 1860, and meanwhile gold was introduced.
In the days of the gold rushes the export of gold was so great that all other commodities except wool faded into insignificance. In 1861 these two, wool and gold, account for 93 per cent. of the total exports, and this proportion was kept up fairly well for a decade. Gold alone in 1863 represented 70 per cent. of the total; but since then it has fallen relatively, unevenly while the rushes lasted, but evenly since, till in 1911 it was only 10 per cent. The figure for 1912, 6 per cent., is unduly low, owing to the strike at Waihi, while the figure for 1914 is also abnormal owing to the restriction of exports.
In the “seventies” wool began to increase its relative share again, and in 1876 accounted for 59 per cent., the highest since 1860. Since then there has, on the whole, been a decrease, broken only by a peculiar rise in 1894. Some other exports, notably grain and kauri-gum, dropped suddenly in that year, the grain crops being affected by a drought; but this cannot explain all the difference. There was a great increase in the production of wool following on the high prices which ruled prior to the world crisis, which was felt in New Zealand chiefly in the threatened failure of the Bank of New Zealand. When the boom prices had fallen the production of wool fell again, though not, of course, to its old level. The unevenness of the percentages in the primary exports from year to year is most remarkable, and from them we are able to trace gradual growth.
From a percentage of 0.003 in 1882, frozen meat has attained to an average of nearly 20 per cent., though it seems to have lost ground a little of late years, to dairy-produce apparently, until the war, demand greatly stimulated exports. Butter shows a tendency to increase, and since 1905 cheese has jumped from 1 per cent. to 10 per cent.
Grain is the most unsatisfactory of the percentages, it fluctuates so greatly; but it shows a decided tendency to decrease in importance. The by-products of meat tend to increase since refrigeration was introduced, and now account for about 5 per cent. of the total, while tallow remains approximately 3 per cent. Flax fluctuates greatly, rising to 5 per cent. in 1904, but falling again to 2 per cent. Since 1883 timber has been nearly constant at 2 per cent., and coal at 1 per cent. Kauri-gum fluctuates a good deal, but has not risen beyond 5 per cent. since the first years.
It must, of course, be remembered that these figures are correct to the nearest whole number, so that 1 per cent. might be between ½ and 1½ per cent.
These percentages bring out clearly how greatly New Zealand is dependent upon her primary resources. The proportions of exports contributed by the principal industries were as under:—
| Year. | Dairying. | Other Pastoral. | Agricultural. | Mining. | Forest. | Other. |
|---|---|---|---|---|---|---|
| Per Cent. | Per Cent. | Per Cent. | Per Cent. | Per Cent. | Per Cent. | |
| 1880 | .. | .. | 15 | 20 | 5 | 6 |
| 1890 | 2 | 60 | 13 | 9 | 6 | 10 |
| 1900 | 7 | 59 | 9 | 12 | 7 | 6 |
| 1910 | 13 | 63 | 2 | 10 | 4 | 8 |
| 1914 | 19 | 67 | 2 | 5 | 4 | 3 |
In 1880 gold contributed 10 per cent.; and in 1870, wool 35 per cent. and gold 47 per cent. were the only large items.
It has not been possible to gain as complete information about imports as about exports, for, while the column for other commodities in the export table is generally 10 per cent. of the total, the similar column for imports is nearer 40 per cent. The imports are divided into so many and so various commodities that they are not easily summarized. The first three headings, which have been called “clothing,” “metals,” and “paper,” are very wide, and their contents are—
Apparel and slops, boots and shoes, cottons, linens, silks, woollens, drapery, haberdashery, hosiery, millinery, hats and caps:
Agricultural implements, cutlery, hardware and ironmongery, rails and railway-bolts, iron and steel of all kinds, machinery of all kinds, wire, nails, railway plant, tools:
Stationery of all kinds, papers, books.
Sugar includes molasses, treacle, golden syrup, and glucose. Tea is well defined. Liquors consist of wines, spirits, and beer. Tobacco includes cigars, cigarettes, and snuff. Motor-cars include accessories.
| TABLE K.—VALUES OF PRINCIPAL IMPORTS, 1882–1914. (000 omitted.) | ||||||||||
|---|---|---|---|---|---|---|---|---|---|---|
| Year. | Clothing, Textiles, &c. | Metals, Tools, &c. | Stationery, Paper, &c. | Sugars. | Tea. | Liquors. | Tobacco. | Coal. | Motor-cars, &c. | Oils. |
| £ | £ | £ | £ | £ | £ | £ | £ | £ | £ | |
| 1882 | 2,196 | 1,285 | 394 | 502 | 279 | 458 | 108 | 166 | .. | 119 |
| 1883 | 2,014 | 1,342 | 326 | 638 | 230 | 402 | 116 | 157 | .. | 103 |
| 1884 | 1,820 | 1,256 | 326 | 706 | 180 | 386 | 97 | 198 | .. | 104 |
| 1885 | 2,084 | 1,029 | 333 | 338 | 217 | 391 | 125 | 147 | .. | 142 |
| 1886 | 1,776 | 862 | 301 | 354 | 198 | 300 | 138 | 123 | .. | 129 |
| 1887 | 1,574 | 873 | 303 | 438 | 233 | 307 | 82 | 108 | .. | 92 |
| 1888 | 1,510 | 698 | 248 | 351 | 186 | 245 | 106 | 98 | .. | 121 |
| 1889 | 1,593 | 902 | 285 | 399 | 138 | 284 | 105 | 114 | .. | 121 |
| 1890 | 1,573 | 915 | 284 | 384 | 154 | 249 | 103 | 102 | .. | 112 |
| 1891 | 1,674 | 856 | 301 | 381 | 160 | 270 | 128 | 120 | .. | 147 |
| 1892 | 1,872 | 1,001 | 306 | 408 | 140 | 270 | 122 | 117 | .. | 120 |
| 1893 | 1,809 | 921 | 295 | 301 | 164 | 282 | 125 | 112 | .. | 105 |
| 1894 | 1,560 | 837 | 294 | 460 | 137 | 233 | 125 | 105 | .. | 112 |
| 1895 | 1,623 | 782 | 290 | 390 | 173 | 249 | 124 | 98 | .. | 135 |
| 1896 | 1,890 | 1,095 | 316 | 422 | 167 | 237 | 150 | 94 | .. | 128 |
| 1897 | 1,929 | 1,406 | 337 | 373 | 178 | 268 | 165 | 98 | .. | 164 |
| 1898 | 1,935 | 1,503 | 342 | 425 | 184 | 273 | 162 | 105 | .. | 163 |
| 1899 | 2,123 | 1,579 | 369 | 355 | 184 | 306 | 184 | 93 | .. | 127 |
| 1900 | 2,420 | 2,113 | 407 | 452 | 200 | 288 | 199 | 120 | .. | 207 |
| 1901 | 2,475 | 2,462 | 439 | 490 | 219 | 343 | 222 | 151 | .. | 238 |
| 1902 | 2,605 | 2,130 | 443 | 402 | 197 | 339 | 213 | 126 | .. | 251 |
| 1903 | 3,030 | 2,615 | 523 | 442 | 204 | 343 | 260 | 158 | 18 | 249 |
| 1904 | 3,117 | 2,938 | 584 | 505 | 238 | 337 | 257 | 138 | 29 | 278 |
| 1905 | 3,064 | 2,629 | 582 | 425 | 226 | 334 | 282 | 156 | 53 | 255 |
| 1906 | 3,372 | 3,254 | 598 | 451 | 229 | 405 | 330 | 195 | 80 | 291 |
| 1907 | 3,791 | 3,584 | 650 | 569 | 269 | 433 | 372 | 213 | 191 | 311 |
| 1908 | 3,867 | 3,671 | 719 | 593 | 252 | 447 | 362 | 275 | 250 | 411 |
| 1909 | 3,492 | 2,900 | 630 | 614 | 280 | 409 | 354 | 253 | 182 | 329 |
| 1910 | 3,832 | 3,354 | 711 | 624 | 294 | 464 | 447 | 231 | 293 | 415 |
| 1911 | 4,250 | 3,882 | 796 | 676 | 331 | 458 | 434 | 186 | 567 | 472 |
| 1912 | 4,349 | 4,321 | 871 | 814 | 320 | 530 | 488 | 365 | 777 | 557 |
| 1913 | 4,677 | 4,530 | 859 | 813 | 297 | 533 | 466 | 466 | 1,022 | 570 |
| 1914 | 4,559 | 4,112 | 855 | 699 | 430 | 555 | 614 | 559 | 1,158 | 772 |
| TABLE K1.—RELATIVE PROPORTIONS OF PRINCIPAL IMPORTS EXPRESSEDAS PERCENTAGES OF TOTAL IMPORTS. | |||||||||||
|---|---|---|---|---|---|---|---|---|---|---|---|
| Year. | clothing Textiles. | Metals, Tools, &c. | Stationery, Paper, &c. | Sugars. | Tea. | Liquors. | Tobaccos. | Coal. | Motor-cars, &c. | Oils. | Other Articles. |
| Per Cent. | Per Cent. | Per Cent. | Per Cent. | Per Cent. | Per Cent. | Per Cent. | Per Cent. | Per Cent. | Per Cent. | Per Cent. | |
| 1882 | 25 | 15 | 5 | 6 | 3 | 5 | 1 | 2 | .. | 1 | 37 |
| 1883 | 26 | 17 | 4 | 8 | 3 | 5 | 1 | 2 | .. | 1 | 34 |
| 1884 | 24 | 16 | 4 | 9 | 2 | 5 | 1 | 3 | .. | 1 | 35 |
| 1885 | 28 | 14 | 4 | 4 | 3 | 5 | 2 | 2 | .. | 2 | 36 |
| 1886 | 26 | 13 | 5 | 5 | 3 | 4 | 2 | 2 | .. | 2 | 38 |
| 1887 | 25 | 14 | 5 | 7 | 4 | 5 | 1 | 2 | .. | 2 | 35 |
| 1888 | 25 | 12 | 4 | 6 | 3 | 4 | 2 | 2 | .. | 2 | 40 |
| 1889 | 25 | 14 | 4 | 6 | 2 | 5 | 2 | 2 | .. | 2 | 38 |
| 1890 | 25 | 14 | 4 | 6 | 2 | 4 | 2 | 2 | .. | 2 | 39 |
| 1891 | 26 | 13 | 5 | 6 | 2 | 4 | 2 | 2 | .. | 2 | 38 |
| 1892 | 27 | 15 | 4 | 6 | 2 | 4 | 2 | 2 | .. | 2 | 36 |
| 1893 | 26 | 13 | 4 | 4 | 2 | 4 | 2 | 2 | .. | 2 | 41 |
| 1894 | 23 | 12 | 4 | 7 | 2 | 4 | 2 | 2 | .. | 2 | 42 |
| 1895 | 25 | 13 | 5 | 6 | 3 | 4 | 2 | 2 | .. | 2 | 38 |
| 1896 | 26 | 15 | 4 | 6 | 2 | 4 | 2 | 1 | .. | 2 | 38 |
| 1897 | 24 | 17 | 4 | 5 | 2 | 3 | 2 | 1 | .. | 2 | 40 |
| 1898 | 23 | 18 | 4 | 5 | 2 | 3 | 2 | 1 | .. | 2 | 40 |
| 1899 | 25 | 18 | 4 | 4 | 2 | 3 | 2 | 1 | .. | 1 | 40 |
| 1900 | 23 | 20 | 4 | 4 | 2 | 3 | 2 | 1 | .. | 2 | 39 |
| 1901 | 21 | 21 | 4 | 4 | 2 | 3 | 2 | 1 | .. | 1 | 41 |
| 1902 | 23 | 19 | 4 | 4 | 2 | 3 | 2 | 1 | .. | 2 | 40 |
| 1903 | 23 | 20 | 4 | 3 | 2 | 3 | 2 | 1 | .. | 2 | 40 |
| 1904 | 23 | 22 | 4 | 4 | 2 | 3 | 2 | 1 | .. | 2 | 38 |
| 1905 | 24 | 20 | 4 | 3 | 2 | 3 | 2 | 1 | 1 | 2 | 39 |
| 1906 | 22 | 21 | 4 | 3 | 2 | 3 | 2 | 1 | 1 | 2 | 38 |
| 1907 | 22 | 21 | 4 | 3 | 2 | 3 | 2 | 1 | 1 | 2 | 39 |
| 1908 | 22 | 21 | 4 | 3 | 1 | 3 | 2 | 2 | 1 | 2 | 37 |
| 1909 | 22 | 18 | 4 | 4 | 2 | 3 | 2 | 2 | 1 | 2 | 40 |
| 1910 | 23 | 20 | 4 | 4 | 2 | 3 | 3 | 1 | 2 | 2 | 36 |
| 1911 | 22 | 20 | 4 | 3 | 2 | 2 | 2 | 1 | 3 | 2 | 38 |
| 1912 | 21 | 21 | 4 | 4 | 2 | 3 | 2 | 2 | 4 | 3 | 34 |
| 1913 | 21 | 20 | 4 | 4 | 1 | 2 | 2 | 2 | 5 | 3 | 36 |
| 1914 | 21 | 19 | 4 | 3 | 2 | 3 | 3 | 3 | 5 | 4 | 33 |
The imports of clothing and textiles decreased in the “eighties,” touching their lowest point in 1888 at £1,510,000, but since then have steadily increased. It would be pleasant to think that the decrease was due to a development of the home trade, but history is against such an idea. The unpleasant fact is that the time was one of severe retrenchment, which is shown in each class of imports.
Since 1894 there has been a steady increase, broken only in 1909, and the net result is that the imports of this item have increased almost threefold. The increase is not sudden, but continuous, and is the result of the corresponding increase in exports.
The heading “metals” might almost be changed to “tools.” as this heading includes machinery, tools, and materials for tools, all for the development of the country. That the imports of these headings decreased shows the evil effects of that long period of falling prices. The lowest level was reached in 1895, and since then there has been a rapid increase, the most serious check being in 1909. It is satisfactory to note that the imports of metals have increased fivefold since 1895, a greater increase than any other item. This greater comparative increase of metals, machinery, and tools also supports the opinion, expressed above, that the rapid increase of imports in late years is due in great part to the borrowing policy. Such loans would naturally come in mainly as imports of this kind.
Paper also fell till 1895, and has risen threefold since, checked only in 1909. The similarity of these changes is very remarkable, and is emphasized by the percentage table following.
The import of sugar has been subject to many influences, principally tariff changes. There was a sudden drop in 1885, due to the introduction of boot-sugar in the world's market. The cheaper methods of production caused a sudden, drop in value, and this effect is intensified in New Zealand by retrenchment. The imports of cane-sugar from Mauritius gradually dwindled away; but the local refining industry draws its supplies from Fiji, so that the beet-sugars have not much hold here. The value imported crept up again to the higher level about the end of the century, but this represents a much greater quantity imported since the price fell so greatly. Imports then continued at a low level till about 1900, and since that year have increased greatly. There is a large sugar industry in New Zealand, which grew up under protection, but has more than held its own since the last ½d. per pound of duty was abolished in 1907.
The imports of tea show the same retrenchment during the bad years, the lowest figure being £137,000 for 1894. Since then the imports have more than doubled, and this is no mean test of the prosperity of the Dominion. The preferential tariff of 1903 removed the duty of 2d. per pound from British though not from foreign tea. The consumption of liquors is usually taken as a test of prosperity, but the importation of liquors cannot be taken altogether as indicating the consumption. The import duty on beer is far greater than the corresponding excise duty, with the result that New Zealand boasts many flourishing breweries which thrive under the protection thus granted. So care must be taken not to quote the imports of liquors as the consumption, or oven as an accurate index of it. But it is probable that they show a rough index, and the figures may be used to corroborate the evidence of the other imports as to the great increase in prosperity since 1895. Tobacco tells the same tale even more emphatically, since the shrinkage is greater in the bad years and the increase greater since.
Coal is imported into New Zealand mainly from Newcastle, New South Wales, though New Zealand produces so much herself. The imported coal is cheaper and not as good as the best native coal, but the bar harbours and the expense of transport from the comparatively inaccessible mines assure a market for the inferior article, owing to the scarcity and high price of the best New Zealand coal. About 1902 the exports for a year or two exceeded the imports; but the balance turned again, and imports increase greatly from year to year.
Motor-cars are quite a modern import, since their value was not worth separate mention before 1903; but since then the imports have grown in ten years from £180,000 to over a million. This great increase is yet another proof of the unexampled prosperity of late years: not only have taxicabs superseded the hansoms, and motor-wagons the delivery-carts, but the number of privately owned motor-cars has increased by leaps and bounds. To the introduction of motor-cars and petrol-engines of all kinds is due the very great increase in the import of oils during the last ten years, while the previous rise was due to the abolition of the duty on kerosene.
Turning now to consider the relative proportions of the imports, one is struck with the great uniformity shown by the table. The proportions seem almost absolutely fixed. The first item, clothing and textiles, tends to decrease steadily, while the metals and machinery and tools have increased greatly. These facts seem to be very satisfactory as proving that instrumental goods are gaining at the expense of consumers' goods. New Zealand must import the greater quantity of both items, and this shifting of importance seems in the best interests of the country.
Paper, &c., is practically stationary. Sugar, tea, and liquors all tend to decrease, but by far the greatest decrease is in liquors. Tobacco tends, if anything, to increase; and we have already noticed the increase in motor-cars and oils.
Ever since the time when statistics was regarded as a descriptive science furnishing not numerical data alone, but all kinds of information about the State, the foreign trade, and in particular the balance between imports and exports, has been considered as of very great importance. The advance of economic theory has resulted in a truer understanding of the advantages of foreign trade, and many misconceptions have been swept away. But fallacies die hard, and there may even yet be found some traces of mercantilism in the popular mind. The seventeenth-century mercantilists in England and the disciples of Colbertism in France attached very great importance to what they termed a favourable balance of trade. This meant to them an excess of imports over exports, generally in the shape of treasure, and by this balance they measured the benefit which a country received from its foreign trade. For the mutual benefit which each trading country gains from the sum total of exchange they had little regard, concentrating their attention mainly on the balance of trade. The reason seems to be that the mediæval notions of trade had not quite disappeared and the modern doctrine of mutual benefit was not grasped. Towards the end of the eighteenth century Adam Smith vigorously attacked mercantilist ideas and built up the foundation of the modern science of economics. Ricardo elaborated the theory of foreign trade, and his work is taken as a text-book by most subsequent writers on that subject. His treatment of the subject is a fine example of the abstract method, starting from a consideration of the trade between two islands and gradually introducing the complications of actual life. From his work follows the well - known theorem that “in the long run exports and imports must balance,” which, however, needs to be qualified and explained before it has application to practical affairs. “Imports” and “exports” in ordinary language are taken to mean only those material commodities which are included in Customhouse returns as being brought into or sent out from the country in question. Obviously this is not a complete account of all the trade, since it does not include what are known as invisible imports and exports—services such as the carrying of goods, the loan of capital, protection from war-risks, &c. These services constitute a big item in the actual trade of a country. Then we must continually bear in mind that the economic law is qualified by the phrase “in the long-run.” This very indefinite phrase means that sufficient time must be allowed for the adjustment of economic phenomena to the new conditions; but actually other new conditions constantly supervene, so that very often the law has no apparent result, but remains only a tendency. If these remarks hold good of imports and exports taken as a whole, still less can it be expected that the imports and exports from and to any particular country will at any time balance. The development of international banking has made one world market for bills of exchange, and balances between various countries can be squared up through a big banking centre. So that the trade between any two countries cannot be separated off from their trade with other lands.
Theory tells us that if in the long-run imports and exports do not balance, the difference must be met by a movement of specie; but this is an expensive operation, and is avoided wherever possible. The business world adopts various expedients to avoid shipment of specie, and the keen competition of the money-market can be trusted to seek out the cheapest device. A balance of indebtedness may temporarily be met by borrowing, by a falling price-level, by the transference of securities, by bills in futuro. Gold may oven be restricted from export by the pressure exerted by Governments or banks, as when the Bank of England raises its rate of discount or the Bank of France puts a slight premium on gold. But it is obvious that all these are merely temporary devices to meet the conditions of abnormal times, and it remains true that in the long-run, if imports and exports do not balance, the difference must be made up by a movement of specie. A country cannot, however, go on exporting or importing specie for long, for two main reasons: First, the stock of specie in any country is so small compared with the value of the trade that it would take only a very short time either to denude the country of specie altogether or to flood it with overwhelming quantities of gold. For instance, New Zealand has roughly £7,000,000 of coin in circulation and bank reserves, while her trade balance amounts to between £2,000,000 and £3,000,000 yearly. Suppose £2,000,000 or £3,000,000 per year added to the stock of gold in New Zealand and the absurdity becomes manifest. The other and more important reason is that the shipment of specie, by its effect on prices, tends to restore equilibrium again. If New Zealand has a temporary excess of exports, and gold flows into the Dominion, prices will rise; the country will become a good market to sell in, a dear market to buy from; imports will be stimulated and exports depressed till a normal position is reached. So we come back to the original statement that in the long-run imports must balance exports: that is, of course, real imports and real exports. Now, the Customs returns far from balance, and this chapter is an attempt to explain the discrepancy.
First we must note that imports and exports are compiled in different ways: this fact has been brought out in Chapter II. There is some doubt as to the accuracy of the export values; but import values are known accurately and may be taken with great confidence. But it would not be wise to take the exact differences from year to year as absolutely correct, because, as was emphasized in Chapter II, mistakes in estimation of exports may affect seriously individual years.
Then, it must not be forgotten that both imports and exports are calculated at their value in New Zealand—i.e., imports are shown c.i.f.e. and exports f.o.b. Freight is a considerable item in international commerce: Bowley estimates it to average 9 per cent. In New Zealand, to ensure uniformity, imports subject to ad valorem duty are calculated at the invoice (f.o.b.) prices plus 10 per cent. to cover freight, insurance, exchange, &c. The charges for sea carriage, both inward and outward, go for the most part to shareholders in the United Kingdom; the service of inward carriage is shown in the 10 per cent. added to imports, but outward carriage does not appear in the returns at all. This, however, balances the trade returns, by taking both exports and imports at New Zealand values.
Apart from differences in calculation, there is a big trade balance in favour of exports which is explained by important items of invisible imports. The first great invisible import consists of the service rendered to New Zealand by the large loans of capital which have helped to develop the country. New Zealand, like all the colonies, is a debtor country. Borrowing began in New Zealand with colonization, and it is plain from the early figures of trade, which give so large a surplus of imports, that the small community was living mainly on imported capital. The Provincial Governments early began borrowing on the public account, but in 1870 Sir Julius Vogel brought down his comprehensive scheme of borrowing for national public works and immigration. Though the population of New Zealand at that time numbered only 300,000 people, he carried his proposal to borrow £10,000,000 in ton years. It was an unlucky time he chose, and New Zealand paid the penalty; but after the period of retrenchment and depression which was ended by 1895 it became the settled policy of the country to float big loans for land-settlement, for public works, and for State enterprises. At the end of the financial year 1914–15 the gross public debt of New Zealand amounted to over £100,000,000, equivalent to £90 18s. 4d. per head. Against this amount there were accrued sinking funds to the value of £3,178,055. The Official Year-book classifies the public debt into four divisions:—
Directly reproductive: Railways, telephones, &c., amounting to £32,797,752 or 33 per cent. of the total.
Investments: Advances to settlers, advances to workers, loans to local bodies, land purchased for settlement, &c., amounting to £31,884,870 or 32 per cent. of the total.
Indirectly productive: Public works, immigration, &c., amounting to £11,874,652 or 12 per cent of the total.
Unproductive: Public buildings, Maori War debt, War of 1914–15, defence charges, for loans, provincial liabilities, &c., £23,502,636 or 23 per cent. of the total.
During the period 1904–5 only 15½ per cent. of the debt was subscribed in New Zealand; but during 1914–15 20 per cent. of the debt was held in the country. Of the total net debt in 1915 about twenty millions were held in New Zealand, while the remaining eighty millions were held mainly in England.
In addition to the public debt there are the borrowings of local bodies, but since the State borrows and lends again to local bodies, these debts must not be counted in twice. The system of borrowing is widespread in New Zealand—loans are raised for municipal gasworks, for water-supply, tramways, drainage, road-building. Town Halls, or libraries. All the local bodies—City and Borough and County Councils, Drainage, Harbour, Road. River, and Tramway Boards resort to borrowing for development. The total net indebtedness of local bodies in New Zealand amounted on the 31st March. 1914, to £22,563,244, of which £3,639,762 has been borrowed from the Government. Only £8,817,400, however, was raised abroad, and the rest was borrowed in New Zealand.
Finally, there remains the private debt of New Zealand's population. The great growth of capital in other lands, especially the United Kingdom, has been readily attracted to the promising fields of investment offered by the colonies and backward countries. In New Zealand, as in Australia, the State undertakes many enterprises, such as railways, which are in older countries loft to private enterprise. Even with this restriction of the field of investment the amount of capital invested in New Zealand must be considerable. Sir George Paish, in the “Journal of the Royal Statistical Society,” Vol. lxxiv. page 180, estimated the amount of British capital invested in New Zealand in 1910 as £78,529,000. In 1910 the public debt of New Zealand held abroad was £61,000,000 and the local debt £7,000,000, and these estimates agree well.
So there is a big sum amounting to over £100,000,000 of British capital for which New Zealand must pay interest year by year. These loans, in the first place, generally enter New Zealand as imports of material goods, machinery, metals, &c. The imports are swollen greatly in the times of heavy borrowing: this is especially noticeable in the period just after 1870, and again within the last decade. Since 1895 there has been practically continuous borrowing, but it is hard to determine exactly how far the increase of imports is due to borrowing and how far to increased power of export. The effects of recent heavy loans, however, are quite evident in greatly increased imports.
During the last twenty-two years the public debt has increased as shown in the following table:—
| Year. | Gross Public Debt (000,000 omitted). | Gross Debt per Head. | ||
|---|---|---|---|---|
| £ | £ | s. | d. | |
| 1894 | 40 | 58 | 17 | 0 |
| 1895 | 40 | 58 | 11 | 6 |
| 1896 | 43 | 61 | 4 | 5 |
| 1897 | 44 | 61 | 16 | 5 |
| 1898 | 45 | 61 | 9 | 0 |
| 1899 | 47 | 62 | 17 | 3 |
| 1900 | 48 | 63 | 2 | 2 |
| 1901 | 50 | 64 | 3 | 7 |
| 1902 | 53 | 67 | 0 | 11 |
| 1903 | 56 | 68 | 12 | 0 |
| 1904 | 58 | 68 | 11 | 4 |
| 1905 | 60 | 69 | 5 | 4 |
| 1906 | 62 | 69 | 17 | 7 |
| 1907 | 64 | 70 | 4 | 7 |
| 1908 | 66 | 70 | 17 | 6 |
| 1909 | 71 | 73 | 5 | 2 |
| 1910 | 75 | 75 | 16 | 10 |
| 1911 | 81 | 80 | 7 | 11 |
| 1912 | 84 | 81 | 15 | 7 |
| 1913 | 90 | 84 | 16 | 5 |
| 1914 | 100 | 91 | 10 | 2 |
| 1915 | 100 | 90 | 18 | 4 |
Of course, some proportion of our loans never reaches New Zealand as imports, being swallowed up by the expense of flotation. Interest on the debt, national, local, and private, must be paid for by increased export, a fact which largely explains the continued excess of exports over imports of late years. About three millions annually must be paid as interest on the public debt held by persons abroad, and the interest on the local bodies' and private debt, increase the total interest payable. It is evident that this item alone is sufficient to account for the bulk of the balance of trade. The balance in favour of exports would probably be more if it were not for continual borrowing swelling the imports.
Finally, it should be emphasized again that time must be allowed for economic phenomena to work out their true relations. In the meantime fresh complications are continually being introduced, so that the underlying tendencies are obscured. In this case there is a constant tendency for the excess of exports to increase; but the constant influx of fresh loans, as in late years, overrides this tendency.
There is quite a respectable mercantile marine in New Zealand, which, however, is engaged mainly in the trade between New Zealand and Australia and the coasting trade; but it is showing great promise of increasing rapidly in the future. Local companies have the largest share of the intercolonial trade and do control the coastal trade. In addition there are local lines running to India, to the Pacific islands, to San Francisco. Vancouver, and to Montreal. All these, however, are either small or new markets, and the great bulk of the trade is carried in British-owned ships. While there is bright promise that in the future New Zealand's mercantile fleet will bring more and more freight to the country, at present most of the freight is earned by English lines. The import trade from the United Kingdom is about 60 per cent. of the total and the exports nearly 80 per cent., and all the lines trading between New Zealand and the United Kingdom are owned mainly in the Home-land. One line is nominally owned in New Zealand, but only about 20 per cent. of the shares are held here: all the other lines are owned in Britain. The custom is that the freight on imports shall be prepaid, and that on most of the exports shall be paid at the destination. Frozen meat and dairy-produce are contracted for and paid in New Zealand, and this forms the only considerable exception to the general rule. Thus practically all the freight charges, both import and export, are paid in England, only an amount sufficient to cover expenses of working being retained in New Zealand. This is, of course, to facilitate the payment of dividends to shareholders. Any average rate of freight must be fictitious, since there are so many various rates for different articles and at different times. In the case of exports even, confined as they are to a few main classes of produce, there is great difficulty in estimating an average rate. Freight may be charged forward or paid at the port of shipment; generally the rule seems to be that freight on perishable produce is paid at the time of shipment, but other freights are usually paid at destination. There are comparatively few shipping lines running to England, and rates of freight are practically uniform, in some instances being fixed by conference. The export trade—e.g., in frozen meat, wool, or dairy-produce—is in the hands mainly of big companies, which are able to bargain directly with the shipping companies, so that the freight rates are fixed by contract for a term of years. This applies to frozen meat and dairy-produce more particularly; but the rates for wool vary very little. Freights for grain, however, vary greatly according to the state of the market: grains are surplus exports from year to year, and the exports are a smaller proportion of the home consumption than is the case with the bigger exports.
Having obtained the average rates, one is faced with the difficulty of obtaining average values of the commodities, and this can be done only by more or less accurate guessing. But quotations have been obtained from exporters and checked by trade returns, so that the estimates are substantially accurate. It is estimated, then, that the average rates of freight for the main commodities, allowing for insurance and charges, are—Wool, 7½ per cent.; frozen meat, 15 per cent.; dairy-produce, 10 per cent.; tallow, 9 per cent.; oats, 20 per cent.; sheep-skins, 10 per cent. Weighting these according to their importance in the exports of 1912 we have—
| Rate per Cent. | Weight. | ||
|---|---|---|---|
| Wool | 7½ | 71 | = 532 |
| Frozen meat | 15 | 39 | = 585 |
| Dairy-produce | 10 | 38 | = 380 |
| Sheep-skins | 10 | 8 | = 80 |
| Tallow | 9 | 7 | = 63 |
| Oats | 20 | 5 | = 100 |
| 168 | 1,740 | ||
thus giving an average rate of freight, &c., for exports of just over 10 per cent. This, as we should expect, is slightly higher than the rate for the United Kingdom, as estimated by Bowley.
Imports are different in nature from exports, and the difference is all against obtaining accurate statistics of freight. Drapery, &c., is charged at per cubic foot, and consequently freight varies with skill in packing and with the nature of the goods. An average rate of import freight would be even more fictitious than in the case of exports. Moreover, there is difficulty in getting adequate statistics to estimate the wide variations; but the estimate made by the Customs authorities on which to base ad valorem duties—viz., 10 per cent.—must be fairly near the mark.
Thus the balance of trade is adjusted by adding 10 per cent. to the values of the imports; while the enhanced value created by the carriage of exports is not credited to New Zealand. There are, however, other small items which enter into one side or other of the account. From 1887 the New Zealand Government paid annually a sum of £20,000 as a naval subsidy to the Imperial Government. In 1903 this amount was doubled, and further increased in 1908 to £100,000. The subsidy, of course, would be paid for by increased export, as would the interest on the loan for the gift of the battle-cruiser “New Zealand” in 1909. Losses in transit are normally not of great importance, but in war-time may become inconvenient. Smuggling cannot account for much of the discrepancy. Against the expenditure of tourists in New Zealand must be set the expenditure of New Zealand tourists abroad. The amount spent by tourists in New Zealand has been estimated at half a million yearly, and it is probable that the amount spent by New Zealanders abroad is at least as much. There is probably but a slight balance to be made up on either side. Similarly, the expense of maintaining branches and representatives in other countries and gifts sent abroad offset to a great extent the similar expenses and gifts in New Zealand.
The early trade returns proved unsatisfactory in regard to shipment of specie; the imports were always shown, but exports were shown only sometimes. Often the exports of New Zealand produce were detailed, and then there was added a big heading “Exports not the produce of New Zealand.” This heading varied so much in amount from year to year that specie must sometimes have been included, but to how great an extent it is almost impossible to say. Since 1870 care has been taken to separate imports and exports of specie. In the curves of the trade the figures, inclusive of specie, have been used, but for comparison the trade excluding specie has been included in the tables. It will be evident that the shipments of specie move in the opposite direction from the balance of trade. In two years, 1886 and 1911, this has had the effect of turning the balance in favour of exports. Public opinion in New Zealand dreads a balance of imports, and it is interesting to notice that in 1911 every one quoted the balance, excluding specie, which gave an export balance; whereas when specie is included imports are half a million in excess of exports.
A separate table shows the imports and exports of specie as far as they are available, and a curve is incorporated in the graph of the balance of indebtedness.
| TABLE L.—TABLE SHOWING CHANGES INTHE BALANCE OF INDEBTEDNESS. (000 omitted.) | ||||||||
|---|---|---|---|---|---|---|---|---|
| Year. | Inclusive of Specie. | Exclusive of Specie. | ||||||
| Imports. | Exports. | Balance. | Imports. | Exports. | Balance. | |||
| Imports. | Exports. | Imports. | Exports | |||||
| £ | £ | £ | £ | £ | £ | £ | £ | |
| 1870 | 4,639 | 4,823 | .. | 184 | 4,526 | 4,717 | .. | 190 |
| 1871 | 4,078 | 5,282 | .. | 1,204 | 3,875 | 5,282 | .. | 1,407 |
| 1872 | 5,143 | 5,191 | .. | 48 | 4,902 | 5,189 | .. | 287 |
| 1873 | 6,465 | 5,610 | 855 | .. | 6,184 | 5,598 | 585 | .. |
| 1874 | 8,122 | 5,251 | 2,871 | .. | 7,969 | 5,250 | 2,719 | .. |
| 1875 | 8,029 | 5,829 | 2,200 | .. | 7,763 | 5,597 | 2,166 | .. |
| 1876 | 6,905 | 5,673 | 1,232 | .. | 6,799 | 5,612 | 1,187 | .. |
| 1877 | 6,973 | 6,327 | 646 | .. | 6,547 | 6,169 | 378 | .. |
| 1878 | 8,756 | 6,016 | 2,740 | .. | 8,423 | 5,906 | 2,516 | .. |
| 1879 | 8,376 | 5,743 | 2,633 | .. | 8,024 | 5,667 | 2,356 | .. |
| 1880 | 6,162 | 6,353 | .. | 191 | 5,997 | 6,232 | .. | 235 |
| 1881 | 7,457 | 6,061 | 1,396 | .. | 7,302 | 5,895 | 1,407 | .. |
| 1882 | 8,609 | 6,658 | 1,951 | .. | 8,344 | 6,395 | 1,948 | .. |
| 1883 | 7,974 | 7,096 | 878 | .. | 7,774 | 7,012 | 762 | .. |
| 1884 | 7,664 | 7,092 | 572 | .. | 7,326 | 7,090 | 236 | .. |
| 1885 | 7,480 | 6,820 | 660 | .. | 7,278 | 6,739 | 539 | .. |
| 1886 | 6,759 | 6,673 | 86 | .. | 6,319 | 6,535 | .. | 215 |
| 1887 | 6,246 | 6,866 | .. | 620 | 6,064 | 6,681 | .. | 616 |
| 1888 | 5,942 | 7,767 | .. | 1,825 | 5,430 | 7,403 | .. | 1,972 |
| 1889 | 6,309 | 9,342 | .. | 3,033 | 5,981 | 9,184 | .. | 3,203 |
| 1890 | 6,261 | 9,812 | .. | 3,551 | 5,929 | 9,569 | .. | 3,640 |
| 1891 | 6,504 | 9,566 | .. | 3,062 | 6,431 | 9,561 | .. | 3,130 |
| 1892 | 6,943 | 9,535 | .. | 2,592 | 6,743 | 9,491 | .. | 2,748 |
| 1893 | 6,912 | 8,985 | .. | 2,073 | 6,494 | 8,681 | .. | 2,187 |
| 1894 | 6,788 | 9,231 | .. | 2,543 | 5,990 | 9,222 | .. | 3,231 |
| 1895 | 6,400 | 8,550 | .. | 2,150 | 6,116 | 8,518 | .. | 2,402 |
| 1896 | 7,137 | 9,321 | .. | 2,184 | 7,035 | 9,300 | .. | 2,265 |
| 1897 | 8,055 | 10,017 | .. | 1,962 | 7,994 | 9,741 | .. | 1,747 |
| 1898 | 8,231 | 10,518 | .. | 2,287 | 8,211 | 10,450 | .. | 2,238 |
| 1899 | 8,740 | 11,938 | .. | 3,198 | 8,614 | 11,923 | .. | 3,310 |
| 1900 | 10,646 | 13,246 | .. | 2,600 | 10,207 | 13,223 | .. | 3,016 |
| 1901 | 11,818 | 12,881 | .. | 1,063 | 11,353 | 12,870 | .. | 1,516 |
| 1902 | 11,327 | 13,645 | .. | 2,318 | 10,958 | 13,635 | .. | 2,677 |
| 1903 | 12,789 | 15,010 | .. | 2,221 | 12,076 | 14,972 | .. | 2,896 |
| 1904 | 13,292 | 14,748 | .. | 1,456 | 12,900 | 14,739 | .. | 1,839 |
| 1905 | 12,829 | 15,656 | .. | 2,827 | 12,481 | 15,642 | .. | 3,161 |
| 1906 | 15,211 | 18,095 | .. | 2,884 | 14,303 | 17,992 | .. | 3,689 |
| 1907 | 17,303 | 20,069 | .. | 2,766 | 16,540 | 20,062 | .. | 3,522 |
| 1908 | 17,471 | 16,317 | 1,154 | .. | 17,247 | 16,075 | 1,172 | .. |
| 1909 | 15,675 | 19,662 | .. | 3,987 | 14,817 | 19,636 | .. | 4,819 |
| 1910 | 17,052 | 22,180 | .. | 5,128 | 16,748 | 22,152 | .. | 5,404 |
| 1911 | 19,546 | 19,028 | 518 | .. | 18,783 | 18,980 | .. | 198 |
| 1912 | 20,977 | 21,771 | .. | 796 | 20,577 | 21,512 | .. | 935 |
| 1913 | 22,288 | 22,987 | .. | 699 | 21,654 | 22,810 | .. | 1,157 |
| 1914 | 21,856 | 26,261 | .. | 4,405 | 21,144 | 26,254 | .. | 5,110 |
| TABLE L1.—DECADE AVERAGES OFTHE BALANCE OF INDEBTEDNESS. (000 omitted.) | ||||
|---|---|---|---|---|
| Decade. | Balance, including Specie. | Balance, excluding Specie. | ||
| Import. | Export. | Import. | Export. | |
| £ | £ | £ | £ | |
| 1870–79 | 1,174 | .. | 1,002 | .. |
| 1871–80 | 1,173 | .. | 998 | .. |
| 1872–81 | 1,433 | .. | 1,279 | .. |
| 1873–82 | 1,633 | .. | 1,503 | .. |
| 1874–83 | 1,636 | .. | 1,520 | .. |
| 1875–84 | 1,406 | .. | 1,272 | .. |
| 1876–85 | 1,252 | .. | 1,184 | .. |
| 1877–86 | 1,137 | .. | 969 | .. |
| 1878–87 | 1,010 | .. | 870 | .. |
| 1879–88 | 554 | .. | 421 | .. |
| 1880–89 | .. | 12 | .. | 135 |
| 1881–90 | .. | 348 | .. | 475 |
| 1882–91 | .. | 794 | .. | 929 |
| 1883–92 | .. | 1,248 | .. | 1,399 |
| 1884–93 | .. | 1,543 | .. | 1,694 |
| 1885–94 | .. | 1,855 | .. | 2,040 |
| 1886–95 | .. | 2,136 | .. | 2,334 |
| 1887–96 | .. | 2,363 | .. | 2,539 |
| 1888–97 | .. | 2,497 | .. | 2,652 |
| 1889–98 | .. | 2,543 | .. | 2,679 |
| 1890–99 | .. | 2,560 | .. | 2,690 |
| 1891–1900 | .. | 2,465 | .. | 2,627 |
| 1892–1901 | .. | 2,265 | .. | 2,466 |
| 1893–1902 | .. | 2,238 | .. | 2,459 |
| 1894–1903 | .. | 2,253 | .. | 2,530 |
| 1895–1904 | .. | 2,144 | .. | 2,391 |
| 1896–1905 | .. | 2,212 | .. | 2,466 |
| 1897–1906 | .. | 2,282 | .. | 2,609 |
| 1898–1907 | .. | 2,362 | .. | 2,786 |
| 1899–1908 | .. | 2,017 | .. | 2,445 |
| 1900–1909 | .. | 2,097 | .. | 2,596 |
| 1901–10 | .. | 2,350 | .. | 2,835 |
| 1902–11 | .. | 2,191 | .. | 2,703 |
| 1903–12 | .. | 2,039 | .. | 2,529 |
| 1904–13 | .. | 1,887 | .. | 2,355 |
| 1905–14 | .. | 2,182 | .. | 2,682 |
| TABLE L2.—SPECIE IMPORTEDAND EXPORTED. (000 omitted.) | ||||
|---|---|---|---|---|
| Year. | Imports. | Exports | Balance. | |
| In. | Out. | |||
| £ | £ | £ | £ | |
| 1853 | 38 | 3 | 35 | .. |
| 1854 | 5 | 20 | .. | 15 |
| 1855 | 11 | 30 | .. | 19 |
| 1856 | .. | 30 | .. | 30 |
| 1857 | 45 | Not given | Not given | |
| 1858 | 32 | ″ | ″ | |
| 1859 | 6 | ″ | ″ | |
| 1860 | 75 | ″ | ″ | |
| 1861 | 81 | ″ | ″ | |
| 1862 | 231 | ″ | ″ | |
| 1863 | 3 | 97 | .. | 94 |
| 1864 | 357 | 224 | 133 | .. |
| 1865 | 317 | 40 | 277 | .. |
| 1866 | 140 | 27 | 113 | .. |
| 1867 | 31 | .. | Not given | |
| 1868 | 347 | 25 | 322 | .. |
| 1869 | 139 | .. | Not given | |
| 1870 | 113 | 106 | 7 | .. |
| 1871 | 203 | .. | 203 | .. |
| 1872 | 241 | .. | 239 | .. |
| 1873 | 281 | 12 | 269 | .. |
| 1874 | 153 | 1 | 152 | .. |
| 1875 | 266 | 231 | 35 | .. |
| 1876 | 106 | 62 | 44 | .. |
| 1877 | 427 | 158 | 269 | .. |
| 1878 | 333 | 110 | 223 | .. |
| 1879 | 351 | 76 | 276 | .. |
| 1880 | 165 | 120 | 45 | .. |
| 1881 | 155 | 166 | 89 | .. |
| 1882 | 265 | 263 | 2 | .. |
| 1883 | 200 | 84 | 112 | .. |
| 1884 | 338 | 1 | 337 | .. |
| 1885 | 202 | 81 | 121 | .. |
| 1886 | 440 | 138 | 302 | .. |
| 1887 | 181 | 185 | .. | 4 |
| 1888 | 512 | 364 | 148 | .. |
| 1889 | 328 | 158 | 170 | .. |
| 1890 | 332 | 242 | 90 | .. |
| 1891 | 73 | 6 | 67 | .. |
| 1892 | 201 | 44 | 157 | .. |
| 1893 | 417 | 305 | 111 | .. |
| 1894 | 798 | 9 | 789 | .. |
| 1895 | 284 | 32 | 252 | .. |
| 1896 | 102 | 21 | 81 | .. |
| 1897 | 61 | 276 | .. | 215 |
| 1898 | 19 | 68 | .. | 49 |
| 1899 | 126 | 15 | 111 | .. |
| 1900 | 439 | 23 | 416 | .. |
| 1901 | 464 | 12 | 452 | .. |
| 1902 | 369 | 10 | 359 | .. |
| 1903 | 713 | 38 | 675 | .. |
| 1904 | 392 | 10 | 382 | .. |
| 1905 | 348 | 14 | 334 | .. |
| 1906 | 908 | 103 | 805 | .. |
| 1907 | 763 | 7 | 756 | .. |
| 1908 | 224 | 242 | .. | 18 |
| 1909 | 857 | 26 | 831 | .. |
| 1910 | 303 | 28 | 275 | .. |
| 1911 | 763 | 48 | 715 | .. |
| 1912 | 400 | 259 | 141 | .. |
| 1913 | 635 | 176 | 459 | .. |
| 1914 | 712 | 7 | 705 | .. |
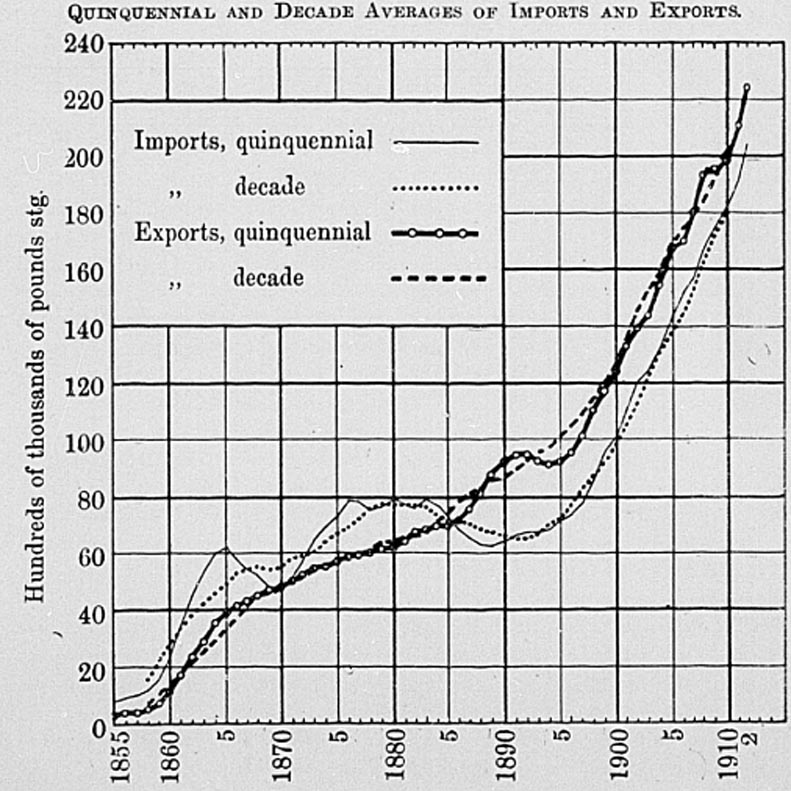
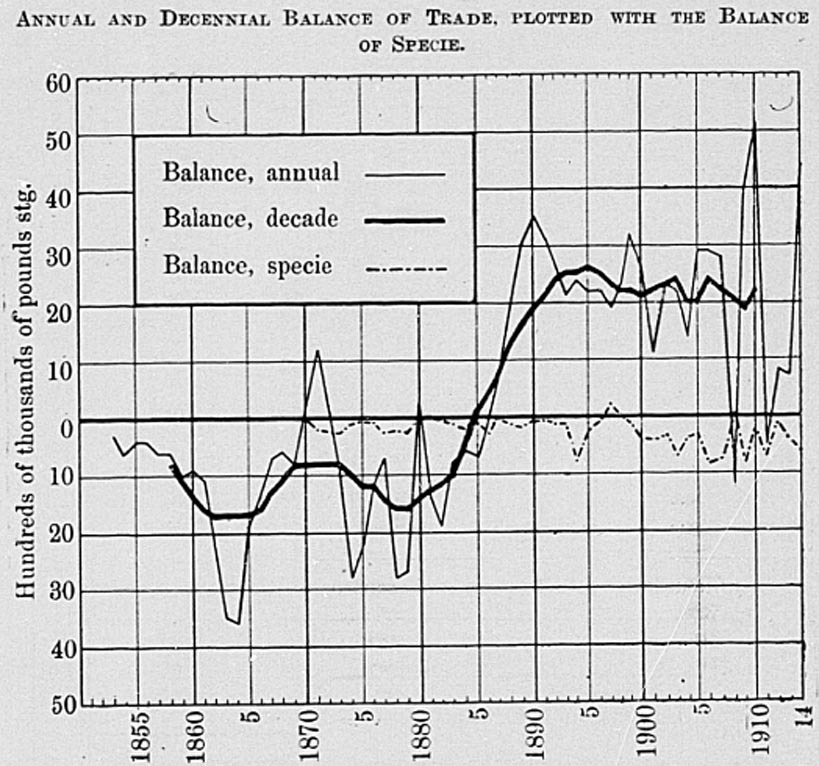
We have seen before that the young colony was in very difficult straits in the “fifties.” During its short existence it had been harassed by many troubles: the great distance from Europe rendered New Zealand dependent on Australia, and in the “fifties” Australian commerce was interrupted by the gold rushes. Dealings with the Maoris were made difficult through ignorance of Native customs, and an unfortunate lack of sympathy between the Governors and the New Zealand Land Company, so that settlement was constantly retarded. Then, too, the provinces threw over a vital part of Wakefield's colonization scheme, the provision that land should be sold at a uniform and sufficient price. Land was reduced from £3 to 10s. an acre, with the result that the country was soon in the grip of the squatters, and settlement was restricted more than ever. It is small wonder, then, that the resources of the country were but little developed, and that for a long while imports continued to be double the value of exports: the colonists were drawing on their capital.
In 1861 came the first important discoveries of gold, and the trade at once increased greatly. Exports increased, mainly because of a great increase in the export of gold; but imports increased still more, so that the balance in favour of imports rose still higher. Though exports rose most relatively, they were at such a low level before that, absolutely, the increase was loss than the increase of imports. The main reasons have been noted before—the necessity for maintaining a greatly increased population by a diversion of exports to home consumption, and by greater imports, and the restriction of industry due to the allurements of the goldfields. This effect was intensified by a commercial crisis throughout the world, which raised prices greatly.
When trade recovered it seemed as if foreign commerce was about to assume its normal relationship of recent years, and the years 1870, 1871, and 1872 actually show an excess of exports. But just then the loans of the Vogel period began to flow in, and until 1886 imports continued greater than exports. During this period population increased fast; but the production of the staple exports did not expand as it should have done. The wet blanket of falling prices smothered all attempts to revive the trade. Too many of the new immigrants were townspeople, and this helped to bring about the slow increase of exports. Meanwhile loans kept pouring in, so that for a while imports increased, and speculation also had the same effect. From 1870 till 1886 imports continued in excess of exports, though the tendency for exports to assort themselves was showing in the later years.
When the bubble burst, New Zealand was faced with the necessity for retrenchment, and the figures for the balance of trade show how, finally, the depression was met: Exports increased greatly, while the imports either fell off or increased slowly; so that the balance of exports mounted rapidly to its modern size. This shows plainly that the danger was staved off, first by economy, and then by increased production aided by rising prices.
Since 1886 the exports have been continually in excess of imports except for the crisis year, 1908. But the curves of imports and exports tend to converge, showing that borrowing is still swelling the import returns and obscuring the tendency of the interest to make for a great excess of exports. Especially within the last decade the imports tend to approach nearer the level of exports. The balance from year to year fluctuates violently; but it is dangerous to take the figures for any single year.
Decade averages of the balances show remarkably smooth outlines. For instance, the curves of imports and exports show where imports and exports cross in 1886; and after the temporary great increase of exports the curves run in lines which are almost parallel, but which tend to converge rather than widen. The quinquennial averages of the imports and exports are more interesting, showing the excess of imports in the early years, the sudden rise in the “sixties,” and then the decline till 1870. Just at this time the curves meet and coincide for two periods, and one is tempted to produce an imaginary import line below exports from 1870 to 1886 and present the resultant figure as the sum of the loans received during this period. The great divergence just after 1886, the parallel trend from then on to late years, and finally the fluctuations lately, are all clearly shown. The curve of the balance of trade shows great fluctuations from year to year; but the moving averages smooth these out. Only once since 1895—in 1908—does the curve drop below the line and show a balance of imports.
Though New Zealand is not a financial centre like the older countries, and consequently is not subject to a drain of specie, the movements of species are not without interest. There is no mint in New Zealand, so that we are dependent on the mints of Sydney and Melbourne for our coin. The shipments of specie are therefore simply the ebb and flow of the coin necessary for New Zealand's internal commerce. As the country develops it is natural that a greater amount of specie should be needed; and so the import of specie is usually in excess of the export. This means that New Zealand absorbs a fair amount of specie from year to year.
The statistics of movements of specie before 1870 are incomplete; but the information after that date shows some interesting examples of the place of money in international trade. First it is evident that the balance of specie is opposite from the balance of trade. When trade is increasing in New Zealand exports keep greatly ahead of imports; but greater imports of specie are necessary for use in the increasing domestic trade. In the periodical commercial crises this opposition is even more marked. As the external commerce of New Zealand expands, the balance of exports becomes greater and greater. On this (to New Zealand) favourable balance is built an increase in the home trade, which yields a basis for inflation of credit and speculation. As this inflation becomes more marked specie flows in at a more rapid rate to cope with the increased money-work. Then the bubble bursts, usually as the result of some outside failure, as the European and American crisis 1907–8 reflected in New Zealand in 1908, or the banking crisis of Australia in 1893–94 reflected here almost immediately. When the boom is over prices fall rapidly, and usually exports are diminished. So there comes a temporary excess of imports, or, at least, a tendency in that direction. Meanwhile the currency contracts in sympathy with the contraction of trade, but in greater proportion, so that specie may actually be exported. Crises of this nature occurred in 1894, 1903, and 1908, and in each of these cases the movement of specie is markedly opposite to that of the general trade. Especially interesting are the movements of specie in the banking crisis about 1894. For a year or two previously imports of coin increased greatly, but when the restriction of trade came there was an actual export of specie in 1897. Finally, in 1912 there seemed a tendency to a slight crisis, which actually was fulfilled in 1912–13.
It seems obvious from an inspection of the tables and of the graphs that there is some connection between an excess of imports and an outflow of specie, and therefore a coefficient of correlation has been calculated between the balance of trade in specie and in the trade excluding specie. The result is the rather low figure of 0.385. This does not show a very high degree of correlation, but establishes the fact that there is some connection between an import balance of specie and an export balance of trade excluding specie. It would seem that the explanation of the low figure of correlation lies in the effect of loans on the import trade. A year of big loans means that imports are increased greatly and tend to approach, if not exceed, the amount of exports. But this does not signify a contraction of trade, but the reverse: not loss money, but more, is needed to cope with increased business, and species tends to flow in. This tendency, of course, opposes the tendency for money to flow out when there is an unfavourable (for New Zealand) balance of trade—that is, an excess of imports. It must be borne in mind that the larger fluctuations of recent years are relative to a higher level of trade. As time goes on both curves should tend on the whole to diverge from the base line, and the curve of specie actually does so. But we have noted before that the tendency for the balance of trade to become greater is to a large extent overborne by the effect of continual loans swelling the imports. The figures should be used only in relation to the amount of the total trade, and not dogmatically from individual years.
The imports from and exports to the several countries were not shown separately in the trade returns till 1857; but the trade was small before that year, and was probably confined, as for some time afterwards, mainly to the United Kingdom and Australia. After 1857 there is an annual return showing imports from and exports to the different countries, but the form of the return changes from time to time. In the first years the countries given were few, and were often described very vaguely; moreover, the grouping is changed often. Sometimes British Columbia is separated from Canada, sometimes not: one year may show a big heading “South America,” and in the next Chile may be separated from the other countries. The scope of the returns gradually gets wider as the trade develops; new countries are brought in, and there is subdivision of headings. Later on care is taken to separate British possessions from foreign countries, and so the returns get more detailed, and are arranged in a definite order.
It is always a difficult task to apportion to each country its proper share of the trade, and questions of definition must be settled arbitrarily. The course pursued till 1914 was to credit the goods, as far as possible, to the first country of shipment and to the ultimate destination. No notice whatever was taken, as far as statistics were concerned, of the country of production or origin. There were many difficulties in the way of getting accurate statistics of the country of shipment, and it is probable that the United Kingdom was credited with more than its share of imports and exports. Transhipments from the Continent and the United States would often be missed, and similarly Australia would be credited with shipments which really came originally from the United Kingdom, from India, or the East. Belgium also, owing to the forwarding trade of Antwerp, would gain much of the credit for German and Swiss goods.
Since the beginning of 1914 importers have been compelled to show the country of origin as well as of shipment, and this will be found to have two good effects. Administered strictly, the new system will reveal the proportion of special exports and other exports which we receive from trading countries such as the United Kingdom and Belgium, and it will give a valuable check on the country of shipment. For instance, under the old system a shipment of goods from London would be credited to the United Kingdom with little inquiry. But if the entry shows “Made in Germany,” inquiry is at once made about transhipments. This result of the new system will probably be important. But comparisons before and after 1914 will need careful handling in view of this change.
Economic theory has progressed very far since the mercantilist school taught that the net advantage gained from foreign trade was measured by the balance of specie which a country could import. The true nature of international exchange was first clearly formulated by Ricardo, and his deductive reasonings were elaborated by the later classical economists. In comparatively recent times the theory of international trade was restated and brought more up to date by Bastable, and now any elementary text-book gives definitely the fundamental laws which govern exchange of commodities between countries.
The distinction between foreign trade and domestic trade does not rise from distance or cost of transport, as may be supposed. All foreign trade is not necessarily carried great distances: it may be merely a matter of crossing a frontier. The distinction springs from the fact that States are the units of organization in its broadest form. Within the boundaries of a State generally the same laws, customs, and habits rule, intercourse is free, language and systems of coinage and counting are uniform, and, usually, there is community of race. Outside are many hindrances to trade, governmental restrictions, perhaps a different language, almost certainly different laws, and measures, and coinages. Within the country, therefore, there is keen competition; capital and labour flow freely to the localities and industries which promise greater returns; but capital, and still less labour, do not flow freely past the barriers of nationalism. Capitalists fear often to place their money where they cannot watch it so closely, and where different laws and customs prevail; but this difficulty has been to a great extent overcome by the development of the international money-market. Bonds and securities of national Governments find ready acceptance on the stock exchanges of the financial centres, providing at once a sure investment for surplus capital and a fund for development of foreign lands. But labour, even allowing for immigration policies, remains essentially immobile. The economic element in welfare cannot altogether overpower the very human affections that keep men of all nations and races firmly bound to their own countries. Race, religion, language, law, past tradition, and present friends are poorly set off by social gain and adventure. Certainly persecution, injustice, or misery may drive men from their homes; but ordinarily we may say that labour, comparatively immobile at all times, is doubly hard to move between nations. And it is just this immobility of labour, and in a less degree of capital, which marks off foreign trade from home trade.
Then the question arises, what governs the trade between two countries isolated from each other by distance or by the barrier of nationalism? What law expresses the tendencies which govern what commodities a country shall import and what it shall export? Ricardo first gave the clue to the solution of this question. He imagined the simplest possible case, of two islands trading as units producing only two commodities, trading by barter and with no check to free competition. From these elementary facts was deduced the law of comparative costs or comparative values. Briefly stated, this law is that a country will export those commodities which she can produce more cheaply relatively to other commodities than can the country she trades with. Thus, if for any reason at all New Zealand can produce, say, wool at a fair price, but has hardly any iron that can be cheaply worked, while England can produce wool at about the same cost as New Zealand, but has any amount of iron, then the tendency will be for New Zealand to export wool and for England to export iron. Any country, therefore, will tend to export those commodities in the production of which it has a relative advantage. This advantage may arise in an innumerable number of ways; it may be due to climate, as in the classic instance of the Lancashire cotton industry; there may be huge undeveloped resources of raw material, as in the New Zealand forests. Sometimes the possession of wide open fertile lands yielding increasing returns puts a country at an advantage in the production of some commodity, as wheat in Canada, wool and meat in Australasia, and, till lately, wheat in the United States. Professor Taussig points out that as long as the wheat lands rendered increasing returns to the labour and capital expended on them the United States could export wheat; but when the pressure of population caused resort to inferior land or to more intense cultivation, marginal costs rose, the country had not the advantage in the production of wheat, and consequently exports fell off. Perhaps the cause of advantage in production may be the more effective labour-power in a country. Whether the effectiveness comes from low wages, as in Saxony and in the East, or from the efficiency of highly paid labour, the result is the same. Here educational and social influences are important as raising the standard of efficiency and so rendering labour more effective.
Whatever the cause—climate, fortunate resource, or efficient labour—any advantage in the production of a commodity is registered in its price. Prices, it has been well said, are the indicator of the economic machine. Price is simply the expression, in terms of the money commodity, of the value or purchasing-power of the article in question. This value is determined jointly by utility through demand, and by cost of production through supply. So that any advantage in cost of production tends to lower the price. Now, with the improvement of transport, and more especially of communication, there have developed world markets for the main commodities, and similarly the market for most commodities has widened greatly. Any difference in price, therefore, is soon noted by speculators and merchants, and goods are transferred to where they have most utility, as indicated by prices. There is continual export, therefore, of the commodities in the production of which the exporting country has some advantage.
This reasoning explains the fact, so irritating to superficial observers, that frequently a country prefers to import some article which it could vary well produce for itself. Take the case of woollen clothing in New Zealand: many people have advocated an export tax on New Zealand's wool with the idea that the material should be made up in New Zealand, thus saving carriage both ways. But the fact is that, even allowing for carriage, duty, &c., it pays New Zealand to devote all her time to the production of primary commodities and to draw from older countries the manufactures which they can produce so cheaply and well. Perhaps there will come a time when, as New Zealand fills up and population presses on the land, increasing cost of production of wool will wipe out our advantage, and then we may consider turning our attention to manufactures.
The argument of this chapter so far has presupposed free competition, a hypothesis necessary for deduction, but foreign to the conditions of actual life. We must notice, therefore, that the restrictions on competition, artificial and natural, make necessary some modification of our conclusions. First there come incomplete knowledge of the market, mistakes in forecasting trade movements, and all the other defects of organization which are inevitable over large markets. Perfect competition cannot be possible while there is imperfect communication, and while fallible men must forecast intricate movements of trade. Next after communication comes the problem of transport, particularly pertinent to New Zealand's trade. A surplus of goods here may yet be prevented from realizing higher prices elsewhere by the cost of transference, and this explains why freights for surplus commodities, such as grain in New Zealand, are so dependent upon the market. A most important element, too, is time, especially in the case of perishable goods. For many years New Zealand had a glut of meat, and the flocks deteriorated because of the presence of decrepit ewes, while there was the widest divergence between New Zealand and English prices. Refrigeration changed all that.
Besides these natural hindrances to the play of competition are added artificial barriers, mainly in the shape of tariffs. Of all the big countries of the Old World, the only one which admits New Zealand produce free is the United Kingdom. But the other countries—Germany, France, Austria, United States—need New Zealand's raw materials and food, perhaps not as much as the United Kingdom, but still greatly. In all, prices are rising, while import is restricted by protective duties. In the United States prices have risen so greatly that the inevitable reaction has come, and the duties on some raw materials, notably wool, have been reduced or abolished. Finally, we' must note that the influence of nationality, noticed before in this chapter, acts curiously in the case of New Zealand. For us Britain is not a foreign country, though, because it is a separate “economic nation,” we include trade with the Mother-land in the statistics of foreign trade. The same influences—community of race, of language, common law, of currency and systems of notation, of customs, institutions, habits, traditions—make trade easier with Britain than with other lands. Similarly, the movement of capital and of labour is facilitated, binding us still closer to the Home-land. These influences find a very practical expression not only in the preferential tariff, which indeed takes the form of an extra tax on certain foreign goods, but in a popular preference for British goods.
| TABLE M.—DISTRIBUTION OFTHE TRADE OVERTHE PRINCIPAL COUNTRIES.—IMPORTS. (0,000 omitted.) | ||||||||||||
|---|---|---|---|---|---|---|---|---|---|---|---|---|
| Year. | United Kingdom. | Australia. | India, Burmah. | Ceylon. | Canada. | Mauritius. | Pacific Islands. | United States. | Germany. | China. | Japan. | South America. |
| £ | £ | £ | £ | £ | £ | £ | £ | £ | £ | £ | £ | |
| 1857 | 46 | 53 | .. | .. | .. | .. | .. | 1 | .. | .. | .. | .. |
| 1858 | 53 | 60 | .. | .. | .. | .. | .. | 1 | .. | .. | .. | .. |
| 1859 | 84 | 69 | .. | .. | .. | 1 | .. | 1 | .. | .. | .. | .. |
| 1860 | 87 | 65 | .. | .. | .. | .. | .. | 2 | .. | 1 | .. | .. |
| 1861 | 101 | 142 | .. | .. | .. | .. | .. | 3 | 2 | .. | .. | .. |
| 1862 | 165 | 279 | .. | .. | .. | 7 | 1 | 9 | 1 | .. | .. | .. |
| 1863 | 269 | 412 | .. | .. | .. | 4 | 1 | 11 | 1 | .. | .. | .. |
| 1864 | 326 | 343 | .. | .. | .. | 7 | 1 | 11 | 1 | .. | .. | 8 |
| 1865 | 261 | 257 | .. | .. | .. | 6 | 1 | 5 | .. | .. | .. | 30 |
| 1866 | 274 | 278 | .. | .. | .. | 11 | .. | 13 | .. | .. | .. | 11 |
| 1867 | 278 | 218 | .. | .. | .. | 15 | 4 | 10 | .. | 6 | .. | 2 |
| 1868 | 230 | 226 | .. | .. | .. | 9 | 5 | 13 | .. | 8 | .. | 2 |
| 1869 | 246 | 211 | .. | .. | .. | 17 | 8 | 7 | .. | 5 | .. | .. |
| 1870 | 269 | 166 | .. | .. | .. | 9 | 10 | 6 | .. | 1 | .. | .. |
| 1871 | 181 | 197 | .. | .. | .. | 10 | 6 | 6 | .. | 3 | .. | .. |
| 1872 | 269 | 210 | .. | .. | .. | 16 | 4 | 9 | .. | 5 | .. | .. |
| 1873 | 378 | 220 | .. | .. | .. | 20 | 6 | 14 | .. | 6 | .. | .. |
| 1874 | 548 | 208 | .. | .. | .. | 21 | 6 | 19 | .. | 6 | .. | .. |
| 1875 | 510 | 236 | .. | .. | .. | 11 | 7 | 21 | .. | 15 | .. | .. |
| 1876 | 445 | 195 | .. | .. | .. | 16 | 5 | 19 | .. | 7 | .. | .. |
| 1877 | 412 | 229 | .. | .. | .. | 16 | 4 | 27 | .. | 6 | .. | .. |
| 1878 | 533 | 239 | .. | .. | .. | 21 | 4 | 43 | .. | 17 | .. | .. |
| 1879 | 530 | 220 | .. | .. | .. | 16 | 5 | 44 | .. | 8 | .. | .. |
| 1880 | 348 | 193 | .. | .. | .. | 20 | 8 | 24 | .. | 12 | .. | .. |
| 1881 | 453 | 195 | 12 | .. | .. | 24 | 9 | 34 | .. | 15 | .. | .. |
| 1882 | 555 | 186 | 23 | .. | .. | 21 | 7 | 46 | .. | 17 | .. | .. |
| 1883 | 524 | 157 | 13 | .. | .. | 33 | 8 | 42 | 1 | 10 | .. | .. |
| 1884 | 493 | 166 | 7 | .. | .. | 26 | 10 | 35 | 1 | 7 | .. | .. |
| 1885 | 523 | 135 | 13 | .. | .. | 14 | 9 | 40 | 2 | 13 | .. | .. |
| 1886 | 448 | 131 | 12 | .. | .. | 12 | 9 | 34 | 4 | 13 | .. | .. |
| 1887 | 417 | 103 | 10 | .. | .. | 10 | 14 | 30 | 7 | 16 | 1 | .. |
| 1888 | 373 | 122 | 17 | .. | .. | 9 | 14 | 32 | 2 | 13 | 1 | .. |
| 1889 | 413 | 111 | 19 | 1 | .. | 13 | 16 | 34 | 2 | 9 | 1 | .. |
| 1890 | 422 | 109 | 11 | 2 | .. | 9 | 18 | 36 | 5 | 4 | 1 | .. |
| 1891 | 437 | 101 | 25 | 2 | .. | 7 | 25 | 36 | 7 | 2 | 1 | .. |
| 1892 | 479 | 111 | 14 | 3 | .. | 6 | 21 | 38 | 9 | 2 | 1 | .. |
| 1893 | 448 | 141 | 21 | 6 | .. | .. | 20 | 38 | 7 | 1 | 1 | .. |
| 1894 | 395 | 174 | 14 | 5 | 2 | 3 | 28 | 39 | 7 | 1 | 2 | .. |
| 1895 | 399 | 126 | 15 | 8 | 1 | .. | 28 | 39 | 8 | 1 | 2 | .. |
| 1896 | 471 | 109 | 12 | 10 | 2 | .. | 30 | 49 | 10 | 2 | 3 | .. |
| 1897 | 539 | 100 | 19 | 11 | 6 | .. | 28 | 63 | 16 | 2 | 3 | .. |
| 1898 | 515 | 110 | 20 | 11 | 7 | .. | 38 | 80 | 15 | 1 | 4 | .. |
| 1899 | 553 | 134 | 22 | 12 | 6 | .. | 32 | 78 | 16 | .. | 4 | .. |
| 1900 | 650 | 178 | 26 | 12 | 4 | .. | 44 | 106 | 18 | .. | 4 | .. |
| 1901 | 689 | 198 | 34 | 13 | 4 | .. | 45 | 142 | 20 | .. | 5 | .. |
| 1902 | 085 | 172 | 29 | 13 | 5 | .. | 39 | 132 | 21 | .. | 6 | .. |
| 1903 | 751 | 215 | 26 | 14 | 7 | .. | 49 | 144 | 27 | .. | 9 | .. |
| 1904 | 798 | 190 | 29 | 17 | 11 | .. | 55 | 153 | 31 | .. | 8 | .. |
| 1905 | 780 | 182 | 31 | 18 | 10 | .. | 51 | 144 | 28 | .. | 8 | .. |
| 1906 | 900 | 278 | 31 | 19 | 16 | .. | 44 | 141 | 34 | .. | 10 | .. |
| 1907 | 1,028 | 305 | 38 | 22 | 22 | .. | 70 | 143 | 35 | .. | 9 | .. |
| 1908 | 1,044 | 284 | 36 | 21 | 27 | .. | 62 | 164 | 39 | .. | 9 | .. |
| 1909 | 929 | 276 | 38 | 23 | 20 | .. | 66 | 117 | 33 | .. | 9 | .. |
| 1910 | 1,050 | 236 | 41 | 25 | 26 | .. | 67 | 140 | 39 | 1 | 10 | .. |
| 1911 | 1,179 | 294 | 35 | 28 | 28 | .. | 81 | 168 | 48 | 2 | 12 | .. |
| 1912 | 1,250 | 258 | 41 | 29 | 39 | .. | 83 | 205 | 65 | 3 | 15 | .. |
| 1913 | 1,331 | 291 | 44 | 28 | 45 | .. | 90 | 211 | 69 | 2 | 15 | .. |
| 1914 | 1,199 | 338 | 52 | 39 | 48 | .. | 79 | 228 | 62 | 3 | 19 | .. |
| TABLE M1.—PERCENTAGES OF IMPORTS SUPPLIEDBY THE PRINCIPAL COUNTRIES. | ||||||||||||
|---|---|---|---|---|---|---|---|---|---|---|---|---|
| Year. | United Kingdom. | Australia. | India, Burmah. | Ceylon. | Canada. | Mauritius. | Pacific Islands. | United. States. | Germany. | China. | Japan. | Other. |
| Per Cent. | Per Cent. | Per Cent. | Per Cent. | Per Cent. | Per Cent. | Per Cent. | Per cent. | Per. Cent. | Per Cent. | Per Cent. | Per Cent. | |
| 1857 | 46 | 53 | .. | .. | .. | .. | .. | 1 | .. | .. | .. | .. |
| 1858 | 46 | 53 | .. | .. | .. | .. | .. | 1 | .. | .. | .. | .. |
| 1859 | 54 | 45 | .. | .. | .. | .. | .. | 1 | .. | .. | .. | .. |
| 1860 | 56 | 42 | .. | .. | .. | .. | .. | 1 | .. | .. | .. | .. |
| 1861 | 41 | 57 | .. | .. | .. | .. | .. | 1 | 1 | .. | .. | .. |
| 1862 | 36 | 60 | .. | .. | .. | .. | .. | 2 | .. | .. | .. | .. |
| 1863 | 38 | 59 | .. | .. | .. | 1 | .. | 1 | .. | .. | .. | 1 |
| 1864 | 47 | 49 | .. | .. | .. | 1 | .. | 1 | .. | .. | .. | 1 |
| 1865 | 47 | 46 | .. | .. | .. | 1 | .. | 1 | .. | .. | .. | 5 |
| 1866 | 47 | 47 | .. | .. | .. | 2 | .. | 2 | .. | .. | .. | 2 |
| 1867 | 52 | 41 | .. | .. | .. | 3 | 1 | 2 | .. | .. | .. | 1 |
| 1868 | 46 | 45 | .. | .. | .. | 2 | 1 | 3 | .. | 2 | .. | 1 |
| 1869 | 49 | 42 | .. | .. | .. | 3 | 2 | 2 | .. | 1 | .. | 1 |
| 1870 | 58 | 36 | .. | .. | .. | 2 | 2 | 1 | .. | .. | .. | .. |
| 1871 | 44 | 48 | .. | .. | .. | 2 | 1 | 1 | .. | 1 | .. | 3 |
| 1872 | 52 | 41 | .. | .. | .. | 3 | 1 | 2 | .. | 1 | .. | .. |
| 1873 | 58 | 34 | .. | .. | .. | 3 | 1 | 2 | .. | 1 | .. | 1 |
| 1874 | 67 | 26 | .. | .. | .. | 3 | 1 | 2 | .. | 1 | .. | .. |
| 1875 | 64 | 29 | .. | .. | .. | 1 | 1 | 3 | .. | 2 | .. | .. |
| 1876 | 65 | 28 | .. | .. | .. | 2 | 1 | 3 | .. | 1 | .. | .. |
| 1877 | 59 | 33 | .. | .. | .. | 2 | 1 | 4 | .. | 1 | .. | .. |
| 1878 | 62 | 27 | .. | .. | .. | 2 | .. | 5 | .. | 2 | .. | 2 |
| 1879 | 63 | 26 | .. | .. | .. | 2 | 1 | 5 | .. | 1 | .. | 2 |
| 1880 | 56 | 31 | .. | .. | .. | 3 | 1 | 4 | .. | 2 | .. | 3 |
| 1881 | 61 | 26 | 2 | .. | .. | 3 | 1 | 5 | .. | 2 | .. | .. |
| 1882 | 65 | 22 | 3 | .. | .. | 2 | 1 | 5 | .. | 2 | .. | .. |
| 1883 | 66 | 20 | 2 | .. | .. | 4 | 1 | 5 | .. | 1 | .. | 1 |
| 1884 | 64 | 22 | 1 | .. | .. | 3 | 1 | 5 | .. | 1 | .. | 3 |
| 1885 | 70 | 18 | 2 | .. | .. | 2 | 1 | 5 | .. | 2 | .. | .. |
| 1886 | 66 | 19 | 2 | .. | .. | 2 | 1 | 5 | 1 | 2 | .. | 2 |
| 1887 | 67 | 16 | 2 | .. | .. | 2 | 2 | 5 | 1 | 3 | .. | 2 |
| 1888 | 67 | 20 | 3 | .. | .. | 1 | 2 | 5 | .. | 2 | .. | .. |
| 1889 | 65 | 18 | 3 | .. | .. | 2 | 3 | 5 | .. | 1 | .. | 3 |
| 1890 | 67 | 17 | 2 | .. | .. | 1 | 3 | 6 | 1 | 1 | .. | 2 |
| 1891 | 67 | 16 | 4 | .. | .. | 1 | 4 | 6 | 1 | .. | .. | 1 |
| 1892 | 69 | 16 | 2 | .. | .. | 1 | 3 | 5 | 1 | .. | .. | 3 |
| 1893 | 65 | 20 | 3 | 1 | .. | .. | 3 | 5 | 1 | .. | .. | 2 |
| 1894 | 59 | 26 | 2 | 1 | .. | .. | 4 | 6 | 1 | .. | .. | 1 |
| 1895 | 63 | 20 | 1 | .. | .. | 4 | 6 | 1 | .. | .. | 3 | |
| 1896 | 66 | 15 | 1 | .. | .. | 4 | 7 | 1 | .. | .. | 5 | |
| 1897 | 67 | 12 | 2 | 1 | 1 | .. | 3 | 8 | 2 | .. | .. | 4 |
| 1898 | 63 | 14 | 2 | 1 | 1 | .. | 5 | 10 | 2 | .. | .. | 2 |
| 1899 | 63 | 15 | 3 | 1 | 1 | .. | 4 | 9 | 2 | .. | .. | 2 |
| 1900 | 61 | 17 | 3 | 1 | .. | .. | 4 | 10 | 2 | .. | .. | 2 |
| 1901 | 59 | 17 | 3 | 1 | .. | .. | 4 | 12 | 2 | .. | .. | 2 |
| 1902 | 61 | 15 | 3 | 1 | .. | .. | 3 | 12 | 2 | .. | 1 | 2 |
| 1903 | 59 | 17 | 2 | 1 | 1 | .. | 4 | 11 | 2 | .. | 1 | 2 |
| 1904 | 60 | 14 | 2 | 1 | 1 | .. | 4 | 11 | 2 | .. | 1 | 4 |
| 1905 | 61 | 14 | 2 | 1 | 1 | .. | 4 | 11 | 2 | .. | 1 | 3 |
| 1906 | 59 | 18 | 2 | 1 | 1 | .. | 3 | 9 | 2 | .. | 1 | 4 |
| 1907 | 59 | 18 | 2 | 1 | 1 | .. | 4 | 8 | 2 | .. | 1 | 4 |
| 1908 | 60 | 16 | 2 | 1 | 2 | .. | 4 | 9 | 2 | .. | 1 | 3 |
| 1909 | 59 | 18 | 2 | 2 | 1 | .. | 4 | 7 | 2 | .. | 1 | 4 |
| 1910 | 62 | 14 | 2 | 1 | 2 | .. | 4 | 8 | 2 | .. | 1 | 4 |
| 1911 | 60 | 15 | 2 | 1 | 1 | .. | 4 | 9 | 2 | .. | 1 | 5 |
| 1912 | 60 | 12 | 2 | 1 | 2 | .. | 4 | 10 | 3 | .. | 1 | 5 |
| 1913 | 60 | 13 | 2 | 1 | 2 | .. | 4 | 9 | 3 | .. | 1 | 5 |
| 1914 | 55 | 15 | 2 | 2 | 2 | .. | 4 | 10 | 3 | .. | 1 | 6 |
Though the import returns show so many and various countries of origin, an analysis of the figures shows that New Zealand draws practically all her imports from a very few countries: in 1914 87 per cent. came from the five biggest exporters to New Zealand—United Kingdom, Australia, United States, Pacific Islands, and Germany—and more than half the remaining 13 per cent. was sent by four countries. The column for “other countries” never contributes more than 5 per cent. of the total, and even in the main countries there are big gaps, so that really only three—United Kingdom, Australia, and the United States—have been continuous exporters to New Zealand. But it is satisfactory to note that of late years the trade shows a tendency to widen, as shown by the development of imports from Canada, United States, Germany, and Japan.
The very big percentage of imports which came from Australia in the early days, rising to 60 per cent. in 1862. is rather a reflection of the industrial state of the period than of Australia's development. The Australian Colonies were on a firm footing by the middle of the century, and already Sydney and Melbourne were large commercial towns. New Zealand's first trade was a barter of flax for firearms, imported mainly from Sydney; but the advent of the first colonists in the “forties” changed that. Most of the trade was carried in sailing-ships which called at Australia first, and New Zealand then must have depended greatly on the warehouses of Sydney and Melbourne for her supplies. The big percentage of imports from Australia consisted mainly of British goods from the warehouses of the older and bigger towns. This percentage increased in the days of the gold rushes, but since then has fallen steadily till it reached only 15 per cent. in 1914. It is probable still that a great part even of the 15 per cent. will be found, under the new system, not to be the produce of Australia, but of Ceylon, Straits Settlements, United Kingdom, &c., though in certain cases—e.g., the dressing of rice, and blending of tea—Australia is already more than a more port of call. It is worthy of note that in times of stress the proportion of goods coming from Australia increases relatively to that from the United Kingdom—this is specially noticeable in 1875, 1877, 1880, and 1894. The steady decrease of the relative imports from Australia is an indication of New Zealand's power to stand alone, to conduct her own shipping lines, and buy direct from Europe instead of through Australia.
The trade from India consists mainly of woolpacks, cornsacks, and some tea, while the imports from Ceylon consist almost wholly of tea. It is probable that Australia has gained much of the credit for both countries through transhipments going unnoticed, and through warehousing in Sydney and Melbourne. Just before the wool season in each year special steamers are run from Calcutta to New Zealand to bring the woolpacks, and this no doubt has much to do with the development of the trade. The China trade should be correlated with that of Ceylon, since Ceylon tea, mainly by the aid of preference, has quite supplanted the Chinese article. The figures for China are not quite satisfactory, since there is more than a suspicion that much of the trade has been credited to Hong Kong, which is regarded as a separate country.
The Canadian trade is the growth of very recent years: it was not possible till Canada began to be a manufacturing country. Now she sends to New Zealand wood-pulp paper, preserved fish, iron pipes, agricultural machines, corsets, motor-vehicles.
The introduction of preference helped Canadian trade greatly; but a bigger impetus was given by the inauguration of a direct steamer service between Montreal and New Zealand, and by catering for the Vancouver trade with faster and more up-to-date steamers. The very great increase of the trade seems directly due to the provision of better shipping facilities just recently. An indirect result of the war now in progress will probably be an extension of New Zealand's trade with Canada. In the case of wood-pulp paper especially Canadian manufactures will gain an impetus, because of the hindrance to the trade in United Kingdom, as a result of the stoppage of supplies of raw material from Europe.
The imports from Mauritius are a reminder of the time when all our sugar had to be imported thence. Now, of course, the sugar-refining industry in New Zealand supplies the home market easily, and draws its supplies of raw material from Fiji. Assisted at first by protection, it is now able to stand alone.
Included in the term “Pacific islands” are practically all the islands of the North and South Pacific. Since 1002 the Cook Islands are not included. The greater bulk of the imports come from the South Pacific islands, and consist of fruits, sugar, and copra; some manure comes from the outlying islands, such as Malden Island. The trade has steadily increased, and the proportion keeps about 4 per cent., so that the islands seem just to keep pace with New Zealand requirements.
Imports from the United States appeared very early in the Dominion's trade returns, but did not supply a very great percentage of the total till comparatively recent years, though ranking always third in importance. The United States is a competitor with England in supplying manufactures to New Zealand, but so far has had little success in that line. It was not till the provision of direct lines of steamships, quite recently, that the trade grew to any considerable extent; but circumstances have combined to give an impetus to American trade. The direct line of steamers from Montreal has benefited United States trade greatly, and the 'Frisco service is being improved. There has been for some time a direct service from the east coast of the United States. The handicap imposed by preferential tariff treatment seems fairly effective, and a very great part of the imports from the United States consists of duty-free articles, or those on which no preference is given, such as iron wire, motor-cars, kerosene, other oils, timber, tobacco, tools. The development of motor traction in the last ten years has stimulated the import of motor-cars and of oils, and the United States has gained a big share of the increase. The opening of the Panama Canal promises an alternative route from the United States; but the canal dues are likely to be high.
The most promising feature, however, is the attitude of the United States towards our exports. With the duties taken off wool and meat there is bound to come a big development of imports as well as exports, because of the business connections developed and the desirability of return freights. It seems reasonable to assume a continued expansion of New Zealand's trade with the United States.
The imports from Germany, too, show a distinct tendency to increase, both relatively and absolutely, and it has been found that the new system of giving the country of origin has revealed a still greater proportion of German goods coining into New Zealand. Germany can supply many imports more cheaply than Britain can, especially drugs, and, though hindered by the high tariffs, has claimed a growing percentage of the New Zealand trade. It was hoped that in the near future most of the Continental countries might follow the example of the United States in lowering their tariffs, and so broaden New Zealand trade. Such an action would have undoubtedly resulted in greatly increased imports from the Continent. Germany is by far the biggest Continental trader to New Zealand, and sends great quantities of manufactures; next comes France, then Belgium; while the Scandinavian countries export special lines, such as paper, fish, carbide of calcium, dairying machinery; and Switzerland sends confectionery and tobacco.
Japanese trade, though still small, keeps steadily increasing. The prospects of trade with Japan do not seem too bright: she has no use for meat or butter, and takes little wool, while she exports to us only special lines, such as silks, fancy goods, and manures. Japanese manufactures do not seem sufficiently advanced to compete with Britain, United States, and Germany.
So we come back again to the imports for the United Kingdom, which vary about 60 per cent. of the total. It is a striking testimony to the commercial strength of the Home-land that it still dominates this little market twelve thousand miles away. It is true that Britain has many advantages in dealing with such a colony as New Zealand, which, though built up by emigrants from Britain itself, is industrially quite different. It appears one of the main motives to colonization that the development of international competition should stimulate the search at once for new markets and for new sources of raw materials. Only by this reason can the partition of Africa and the scramble for China be explained. Since the industrial revolution and the subsequent increase of productive power there has been insistent scarab for undeveloped lands to colonize, superseding the adventurous treasure-hunts of earlier colonization. New Zealand is the antipodes of Britain in many particulars; she needs British manufactures, and can supply Britain with food; her lands are not yet fully occupied, her labour-supply is as yet scanty, and she lacks capital, fixed and fluid. Further, her seasons alternate with those of the Northern Hemisphere, and New Zealand butter and cheese and meat come on to the market just as the produce of Denmark, &c., and of Britain is getting scarce.
Perhaps the greatest power behind this search for markets is the enormous development of capital, and this development has been a primary cause of colonization, besides helping to develop the home trade. The case of Britain is again typical. The amount of capital invested directly in colonial enterprises is enormous, and bears heavy interest directly in increased exports from the debtor lands, and indirectly in improved trade connections.
Still another strong influence, bound up mainly with the influence of capital, arises from the control of shipping lines. No doubt trade, or prospective trade, directs the movements of shipping; but new markets may go begging for lack of shipping lines. For many years the only shipping in New Zealand went to the United Kingdom, and it is only of late years that there has been a tendency to develop new routes. But while there have been new lines to the United States, Canada, and Germany, there has been a corresponding development of the English trade. London is not now the sole port of call: Hull and Goole, Liverpool, Manchester, Bristol, Avonmouth, Glasgow, all have direct communication with New Zealand.
But no amount of bolstering up could keep the trade British were Britain not fully holding her own in the world markets. In most cases the colonial's preference for British goods is founded as much on their reliability and worth as on his patriotism.
In the modern world no country can hope to maintain an absolute monopoly of any market, and the continued increase of imports into New Zealand from the United States and other countries is only natural. It has often been pointed out that in the nineteenth century Britain enjoyed a species of quasi-rent from her industrial development in advance of oilier nations, and now that these other nations are developing, and even outstripping Britain in some lines, it is obvious that trade must be distributed more evenly. At first glance these countries seem to have gained their footing in the New Zealand trade at the expense of Australia; but, as we have shown before, Australia formerly was a half-way house for English goods. Even though Britain, too, has apparently gained from Australia, the position is really that the United States, Germany (as the type of the Continental countries), Japan, Canada, &c., have gained, mainly in special lines of goods, at the relative expense of the United Kingdom.
Finally, we may summarize the other changes by balancing the increased import from Pacific islands, mainly Fiji, against the disappearance of sugar imports from Mauritius; China tea has yielded place to Ceylonese, and cornsacks from India are nearer and cheaper than those from Dundee.
| TABLE N.—DISTRIBUTION OF TRADE OVER PRINCIPAL COUNTRIES.—EXPORTS. (00,000 omitted.) | |||||||||
|---|---|---|---|---|---|---|---|---|---|
| Year. | United Kingdom. | Australia. | Canada. | British South Africa. | Pacific Islands. | Ceylon. | Germany. | France. | United States. |
| £ | £ | £ | £ | £ | £ | £ | £ | £ | |
| 1857 | 13 | 23 | .. | .. | .. | .. | .. | .. | .. |
| 1858 | 24 | 21 | .. | .. | .. | .. | .. | .. | .. |
| 1859 | 32 | 22 | .. | .. | .. | .. | .. | .. | .. |
| 1860 | 41 | 16 | .. | .. | .. | .. | .. | .. | .. |
| 1861 | 51 | 83 | .. | .. | .. | .. | .. | .. | 1 |
| 1862 | 74 | 167 | .. | .. | .. | .. | .. | .. | .. |
| 1863 | 151 | 196 | .. | .. | .. | .. | .. | .. | .. |
| 1864 | 138 | 198 | .. | .. | .. | .. | .. | .. | 2 |
| 1865 | 119 | 260 | .. | .. | 1 | .. | .. | .. | 2 |
| 1866 | 171 | 276 | .. | .. | 1 | .. | .. | .. | 2 |
| 1867 | 198 | 261 | .. | .. | 4 | .. | .. | .. | .. |
| 1868 | 202 | 237 | .. | .. | 3 | .. | .. | .. | .. |
| 1869 | 214 | 203 | .. | .. | 4 | .. | .. | .. | 1 |
| 1870 | 249 | 221 | .. | .. | 7 | .. | .. | .. | 4 |
| 1871 | 277 | 234 | .. | .. | 5 | .. | .. | .. | 10 |
| 1872 | 326 | 151 | .. | .. | 4 | .. | .. | .. | 34 |
| 1873 | 370 | 153 | .. | .. | 7 | .. | .. | .. | 26 |
| 1874 | 377 | 129 | .. | .. | 5 | .. | .. | .. | 9 |
| 1875 | 423 | 136 | .. | .. | 9 | .. | .. | .. | 9 |
| 1876 | 453 | 95 | .. | .. | 9 | .. | .. | .. | 7 |
| 1877 | 532 | 86 | .. | .. | 8 | .. | .. | .. | 3 |
| 1878 | 473 | 107 | .. | .. | 8 | .. | .. | .. | 4 |
| 1879 | 417 | 139 | .. | .. | 7 | .. | .. | .. | 6 |
| 1880 | 477 | 133 | .. | .. | 8 | .. | .. | .. | 11 |
| 1881 | 448 | 104 | .. | .. | 7 | .. | .. | .. | 36 |
| 1882 | 471 | 132 | .. | 4 | 7 | .. | .. | 3 | 43 |
| 1883 | 535 | 111 | .. | .. | 12 | .. | .. | .. | 43 |
| 1884 | 516 | 156 | .. | .. | 9 | .. | .. | .. | 21 |
| 1885 | 491 | 135 | .. | .. | 11 | .. | .. | .. | 40 |
| 1886 | 459 | 171 | .. | .. | 11 | .. | .. | .. | 25 |
| 1887 | 485 | 146 | .. | .. | 9 | .. | .. | .. | 41 |
| 1888 | 571 | 156 | .. | .. | 12 | .. | .. | .. | 32 |
| 1889 | 660 | 215 | .. | .. | 14 | .. | .. | .. | 34 |
| 1890 | 740 | 152 | .. | .. | 14 | .. | .. | .. | 58 |
| 1891 | 714 | 172 | .. | .. | 15 | .. | .. | 2 | 52 |
| 1892 | 748 | 136 | .. | .. | 14 | .. | 1 | .. | 52 |
| 1893 | 704 | 127 | .. | .. | 14 | .. | 1 | .. | 50 |
| 1894 | 790 | 87 | .. | .. | 15 | .. | 1 | .. | 29 |
| 1895 | 705 | 104 | .. | 1 | 13 | .. | .. | .. | 31 |
| 1896 | 754 | 128 | .. | 1 | 13 | .. | 1 | .. | 30 |
| 1897 | 817 | 132 | .. | 1 | 12 | .. | 1 | .. | 38 |
| 1898 | 827 | 148 | .. | .. | 11 | .. | 2 | .. | 62 |
| 1899 | 943 | 170 | 1 | 9 | 13 | .. | 3 | .. | 43 |
| 1900 | 1,026 | 186 | .. | 41 | 18 | .. | 2 | 2 | 46 |
| 1901 | 929 | 199 | .. | 82 | 16 | .. | 1 | .. | 52 |
| 1902 | 945 | 268 | .. | 75 | 16 | .. | 1 | .. | 49 |
| 1903 | 1,135 | 223 | .. | 46 | 16 | .. | 2 | 1 | 67 |
| 1904 | 1,188 | 181 | 1 | 15 | 17 | .. | 2 | 3 | 60 |
| 1905 | 1,209 | 229 | 5 | 18 | 17 | .. | 4 | 5 | 72 |
| 1906 | 1,405 | 288 | 3 | 9 | 19 | 6 | 5 | 5 | 64 |
| 1907 | 1,653 | 222 | 8 | 6 | 19 | 11 | 7 | 3 | 71 |
| 1908 | 1,314 | 210 | 24 | 9 | 20 | 11 | 4 | 1 | 33 |
| 1909 | 1,619 | 192 | 18 | 12 | 26 | 13 | 8 | 5 | 69 |
| 1910 | 1,863 | 201 | 16 | 5 | 30 | 13 | 21 | 5 | 55 |
| 1911 | 1,513 | 252 | 20 | 4 | 34 | 10 | 17 | 4 | 43 |
| 1912 | 1,686 | 285 | 54 | 8 | 32 | 4 | 25 | 9 | 62 |
| 1913 | 1,813 | 232 | 61 | 6 | 31 | 4 | 34 | 18 | 91 |
| 1914 | 2,138 | 193 | 60 | 6 | 33 | 4 | 46 | 23 | 103 |
| TABLE N1.—PERCENTAGES OF EXPORTS TAKENBY THE PRINCIPAL COUNTRIES. | ||||||||||
|---|---|---|---|---|---|---|---|---|---|---|
| Year. | United Kingdom. | Australia. | Canada | British South Africa. | Pacific Islands. | Ceylon. | Germany. | France. | United States. | Other Countries. |
| Per Cent. | Per Cent. | Per Cent. | Per Cent. | Per Cent. | Per Cent. | Per Cent. | Per Cent. | Per Cent. | Per Cent | |
| 1857 | 35 | 62 | .. | .. | .. | .. | .. | .. | .. | 3 |
| 1858 | 52 | 47 | .. | .. | .. | .. | .. | .. | .. | 1 |
| 1859 | 58 | 40 | .. | .. | .. | .. | .. | .. | .. | 2 |
| 1860 | 70 | 27 | .. | .. | .. | .. | .. | .. | .. | 3 |
| 1861 | 37 | 61 | .. | .. | .. | .. | .. | .. | .. | 2 |
| 1862 | 30 | 69 | .. | .. | .. | .. | .. | .. | .. | 1 |
| 1863 | 43 | 56 | .. | .. | .. | .. | .. | .. | .. | 1 |
| 1864 | 41 | 58 | .. | .. | .. | .. | .. | .. | 1 | .. |
| 1865 | 32 | 70 | .. | .. | .. | .. | .. | .. | 1 | .. |
| 1866 | 38 | 61 | .. | .. | .. | .. | .. | .. | .. | 1 |
| 1867 | 43 | 55 | .. | .. | 1 | .. | .. | .. | .. | 1 |
| 1868 | 46 | 53 | .. | .. | 1 | .. | .. | .. | .. | .. |
| 1869 | 51 | 48 | .. | .. | 1 | .. | .. | .. | .. | .. |
| 1870 | 52 | 46 | .. | .. | 1 | .. | .. | .. | 1 | .. |
| 1871 | 52 | 44 | .. | .. | 1 | .. | .. | .. | 2 | 1 |
| 1872 | 63 | 29 | .. | .. | 1 | .. | .. | .. | 7 | .. |
| 1873 | 66 | 27 | .. | .. | 1 | .. | .. | .. | 5 | 1 |
| 1874 | 72 | 25 | .. | .. | 1 | .. | .. | .. | 2 | .. |
| 1875 | 72 | 23 | .. | .. | 2 | .. | .. | .. | 2 | 1 |
| 1876 | 80 | 17 | .. | .. | 1 | .. | .. | .. | 1 | 1 |
| 1877 | 84 | 14 | .. | .. | 1 | .. | .. | .. | .. | 1 |
| 1878 | 77 | 18 | .. | .. | 1 | .. | .. | .. | 1 | 3 |
| 1879 | 73 | 24 | .. | .. | 1 | .. | .. | .. | 1 | 1 |
| 1880 | 75 | 21 | .. | .. | 1 | .. | .. | .. | 2 | 1 |
| 1881 | 74 | 17 | .. | .. | 1 | .. | .. | .. | 6 | 2 |
| 1882 | 71 | 20 | .. | .. | 1 | .. | .. | .. | 7 | .. |
| 1883 | 75 | 16 | .. | .. | 2 | .. | .. | .. | 6 | 1 |
| 1884 | 73 | 22 | .. | .. | 1 | .. | .. | .. | 3 | 1 |
| 1885 | 72 | 20 | .. | .. | 2 | .. | .. | .. | 6 | .. |
| 1886 | 69 | 26 | .. | .. | 1 | .. | .. | .. | 3 | 1 |
| 1887 | 70 | 21 | .. | .. | 1 | .. | .. | .. | 6 | 2 |
| 1888 | 73 | 20 | .. | .. | 2 | .. | .. | .. | 4 | 1 |
| 1889 | 71 | 23 | .. | .. | 1 | .. | .. | .. | 4 | 1 |
| 1890 | 75 | 15 | .. | .. | 1 | .. | .. | .. | 6 | 3 |
| 1891 | 75 | 18 | .. | .. | 2 | .. | .. | .. | 5 | .. |
| 1892 | 77 | 14 | .. | .. | 1 | .. | .. | .. | 5 | 3 |
| 1893 | 79 | 14 | .. | .. | 2 | .. | .. | .. | 5 | .. |
| 1894 | 86 | 9 | .. | .. | 2 | .. | .. | .. | 3 | .. |
| 1895 | 83 | 12 | .. | .. | 2 | .. | .. | .. | 2 | 1 |
| 1896 | 81 | 14 | .. | .. | 1 | .. | .. | .. | 3 | 1 |
| 1897 | 82 | 13 | .. | .. | 1 | .. | .. | .. | 4 | 1 |
| 1898 | 79 | 14 | .. | .. | 1 | .. | .. | .. | 6 | .. |
| 1899 | 79 | 14 | .. | 1 | 1 | .. | .. | .. | 4 | 1 |
| 1900 | 77 | 14 | .. | 3 | 1 | .. | .. | .. | 4 | 1 |
| 1901 | 72 | 15 | .. | 6 | 1 | .. | .. | .. | 4 | 2 |
| 1902 | 69 | 20 | .. | 6 | 1 | .. | .. | .. | 4 | 3 |
| 1903 | 76 | 15 | .. | 3 | 1 | .. | .. | .. | 5 | 2 |
| 1904 | 80 | 12 | .. | 1 | 1 | .. | .. | .. | 4 | 2 |
| 1905 | 77 | 15 | .. | 1 | 1 | .. | .. | .. | 5 | 1 |
| 1906 | 77 | 16 | .. | 1 | 1 | .. | .. | .. | 4 | 1 |
| 1907 | 82 | 11 | .. | .. | 1 | 1 | .. | .. | 4 | 1 |
| 1908 | 80 | 13 | 1 | 1 | 1 | .. | .. | .. | 2 | 2 |
| 1909 | 82 | 10 | 1 | 1 | 1 | 1 | .. | .. | 4 | .. |
| 1910 | 84 | 9 | 1 | .. | 1 | 1 | 1 | .. | 3 | .. |
| 1911 | 79 | 13 | 1 | .. | 2 | 1 | 1 | .. | 3 | .. |
| 1912 | 77 | 13 | 2 | .. | 2 | .. | 1 | .. | 3 | 2 |
| 1913 | 79 | 10 | 3 | .. | 1 | .. | 1 | 1 | 4 | 1 |
| 1914 | 81 | 7 | 2 | .. | 1 | .. | 2 | 1 | 4 | 2 |
Even more striking than in the case of imports is the limitation of New Zealand's exports to so few countries. In the first years the exports to the United Kingdom and Australia comprised practically the whole total, and even in 1012 accounted for 90 per cent. For the last forty years the exports to the United Kingdom alone have fluctuated between 70 and 80 per cent. of the total, reaching 84 per cent. in 1877, 86 per cent. in 1894, and 84 per cent. again in 1910. Canada could not claim more than ½ per cent. till 1908. A temporary export to South Africa in 1882, and again about 1900, soon fell off again. The island trade fluctuates between 1 and 2 per cent. Ceylon appears in the percentages in 1907, Germany in 1910, and France in 1913; while the United States can claim only from 3 to 5 per cent. Other countries vary from 0 to 3 per cent. Practically. New Zealand depends on the Home market for her exports.
Here again we must notice that Australia in the early years served as the half-way house to England, and, except for an increase in the days of the gold rushes, her percentage of exports has steadily declined. Much of the gold from the early rushes was sent to the Melbourne Mint, and a greater proportion of New Zealand's exports went then to feed Australia, which broadly occupied the same relationship to New Zealand as we do now to the islands. It was noticed that in times of economic crisis New Zealand drew a greater percentage of her imports from Australia; but exactly the opposite is the case with exports, as is shown. by the figures 1876–77, 1894, 1907, and 1909–10. The explanation seems to be that production must increase for the European market, and importers buy in smaller quantities from Australia rather than risk big orders from Home. New Zealand sends now to Australia horses, gold for minting, grain, potatoes, white-pine timber for butter-boxes, and hides.
The exports to Canada are very small, and not nearly as promising as the imports. Canada seems hardly developed enough to require supplies of raw material for manufactures, but she takes small quantities of butter, hides, skins, and wool. The export to South Africa has depended largely on the wars, as will be seen from the dates 1882 and 1900. After the extraordinary demand for foodstuffs and horse-feed, encouraged by the war, had died down, a small trade in tinned meats and dairy-produce continued. The islands take from us clothing, foodstuffs, and manufactures, in return for their fruit and sugar. New Zealand is their wholesale warehouse, and the trade, though steady, is not of great importance.
Exports to Germany, as to all Continental countries, are barred by high tariffs, for which those countries pay by high prices of foodstuffs and raw materials. The great rise in the cost of living of recent years encouraged the hope that these countries would be forced to open their ports to New Zealand meat and wool, and a great development of Continental trade was confidently hoped for. What will happen now is very doubtful: the agrarian interests may be strengthened as a result of the war. A widening of markets could only mean benefit to New Zealand by giving her trade a broader basis. But meanwhile the exports to Germany and the rest of the Continent are quite insignificant, comprising only wool and a little kauri-gum and scheelite.
The quantity taken by the United States has increased very little comparatively in the last thirty years, though in the meantime the country has evolved into the foremost manufacturing country in the world, and seems no longer able to feed and clothe itself. Rising prices at last compelled a lowering of the tariff wall. Even with a big duty imposed some wool was always exported to the United States, and very much more will go from henceforth, especially if the European War should cripple for a time England's resources. Kauri-gum in 1912 amounted to more than the export of wool. Trial shipments of frozen mutton have been sent to New York, and it is possible that in the very homes of the meat-packers New Zealand competition may be felt. But a new element has been introduced by the fear of competition of the meat trusts in Australasia itself. The people of Australia and New Zealand are fully alive to the danger of the trusts acquiring control of the meat-supply here, and any such attempt will raise an immediate outcry for Governmental intervention.
During the whole period under review, and especially since 1882, the United Kingdom has been the ultimate destination of the great bulk of New Zealand's exports, and so far there seems no tendency for the proportion to decrease. There has been no irruption of competitors as yet, and the United Kingdom and Australia still take 90 per cent. of the exports. The fact is that the Home-land is the only market where New Zealand products are given fair play: everywhere else they have been met by the handicap of an exclusive tariff. Given free competition, as in the United Kingdom, New Zealand's butter, and meat, and wool can hold their own, even when they must be carried so far. Other influences, of course, as in the case of imports, help to give England a dominating position, mainly her investment of capital here and the subsequent necessity for paying the interest.
It is not easy to get such a true perspective of the home trade as is possible with the definite and detailed statistics of foreign trade, and recourse must be had to more or less vague generalizations. There are no statistics of our domestic trade which may be made a basis of comparison over a period, but statistical inquiry would prove of the utmost benefit. This present attempt must, however, be regarded as purely preliminary.
The vaguest ideas prevail as to the nature and extent of the domestic trade of the Dominion, and it is quite possible that wrong policies may be developed in the absence of proper information. At present the official statistics are lacking in such information, giving only such facts as come under the routine of Government Departments. All foreign trade must go through the Customhouse; but domestic trade is more varied and more widely scattered, including the work of the smallest retail shop as well as that of the largest factory.
There is some difficulty in getting a good point of outlook over the Dominion's industrial life, but it will help greatly if we consider the proportions of the people living in rural and in urban districts. During the last thirty years the proportions, as given by the census, have changed steadily in favour of the towns; but in 1911, as in 1881, the country claims a fair share of the people. In 1911 the proportions were almost exactly equal. The Official Year-book gives the following table of the distribution of the population:—
| Counties. Per Cent. | Boroughs. Per Cent. | |
|---|---|---|
| 1881 | 59 | 40 |
| 1886 | 57 | 42 |
| 1891 | 56 | 43 |
| 1896 | 56 | 44 |
| 1901 | 54 | 45 |
| 1906 | 52 | 48 |
| 1911 | 49 | 50 |
It would be almost absurd to contend that counties correspond to rural districts, and boroughs to towns. Up till 1900 there was no statutory limit to be attained before a borough could be formed, and since 1900 the limit is only 1,000 people It is obvious that a country borough such, for instance, as Hampden, with a population of 361 in 1913, is not an urban centre. So it is only just to point out that these figures do not represent at all fairly the relation between the town and country population of New Zealand. Outside the four big centres there is no question as to the extent to which the towns depend on the countryside—the dependence is vitally close in the townships. But in the centres there is just a tendency to forget temporarily the mutual obligations between town and country.
The table shows a constant tendency for the population to shift to the towns. This is partly explained by the appearance of small boroughs: but there is, no doubt, a greater rate of increase in the towns. While this rural depopulation is not so prominent as in older lands, it is a movement of the same class. Mr. W. T. Layton, in his work on “Capital and Labour,” shows clearly that the evils of rural depopulation are grossly exaggerated; in fact, he says the trouble is that it does not go on fast enough. The question arises in dealing with the influence on wages of the number of labourers in proportion to the amount of capital in any industry; and the writer shows that wages are highest where the amount of capital employed per labourer is highest; that this condition is, under present conditions, best obtained in the towns, and that therefore, by checking the migration to the towns, not only are the workers deprived of high wages, but the national dividend suffers. We must expect that, with progress, fewer and fewer workers will be needed to produce the essential food-supply, while more are set free to produce the less necessary luxuries and amenities of civilized life.*
At the end of March. 1915, the population of the four larger centres was estimated as—
| Including Suburbs. | City. | |
|---|---|---|
| Auckland | 118,000 | 65,000 |
| Christchurch | 88,000 | 58,000 |
| Wellington | 75,000 | 67,000 |
| Dunedin | 69,000 | 49,000 |
giving a total, including suburbs, of 350,000—roughly, just about one-third of the population of the country. The next town, Invercargill, contained only 18,000; then there were five more towns above 10,000, and one about 9,000. Compared with the Australian States these figures seem very satisfactory. Instead of the overwhelming dominance of Sydney, or Melbourne, or Adelaide, our four largest towns taken together can muster only a third of the total population; and even if we include all our little country townships only half the population live in towns—the rest are scattered around the country or in centres too small yet to be called boroughs.
The census divides the occupations of the people other than dependents, into six main classes, and in 1911 the proportions were given as under:—
| Per Cent. | |
|---|---|
| Professional | 7 |
| Domestic | 10 |
| Commercial | 15 |
| Transport | 8 |
| Industrial | 29 |
| Primary producers | 29 |
| Indefinite | 2 |
One cannot help thinking how dangerous these figures are—apparently the industrial life of the Dominion is as important as the rural life. But the table needs to be explained, and the terms to be defined. The country blacksmith and wheelwright, together with every little tradesman in the towns, is included in the industrial class, and the result is too often a vision of big factories, and the need for or the efficiency of our system of protection.
* See also Professor J. S. Nicholson's “Rents, Profits, and Wages in Agriculture, Chapter IV.
To view New Zealand rightly one must begin with the man on the land, whether he be clearing away the heavy bush in the back country, sheep-farming on the downs, growing wheat on the plains, or dairy-farming on the richer soils. Then there are miners of gold and of coal, gum-diggers, sawmillers, and flax-millers, all primary producers. Each year a small army of migrant workers tours the country—shearing, harvesting, grass-seeding, and slaughtering—and these help to produce the primary wealth of New Zealand. Next come the secondary industries—the meat-abattoirs, dairy factories, and wool-sheds. Then come the transport workers to carry, and store, and ship the goods, for practically all this produce is exported. Finally the townspeople who act as middlemen, collecting the products of the country, and distributing tools, and clothing, and luxuries, and foods—grocers, drapers, machinists. By the very concentration in towns comes added importance, and perhaps the town demand for commodities seems greater than it would otherwise appear to be, because of its concentration. There is a big repair trade in all classes of goods, which helps to swell the census total of persons employed in manufactures; and, lastly, there are some genuine manufactures, such as certain kinds of clothing, sugar-refining, boots, agricultural implements.
It is important to note here that the home trade, if it could be measured, would be found greatly in excess of the foreign trade. Such a measurement of the trade of the United States has been made by Professor Irving Fisher, in “The Purchasing-power of Money,” pages 290–91, 478–86, and the result is to place the amount of the domestic trade in 1909 at the enormous figure of 396,000,000,000 dollars yearly, while the external trade amounts only to 3,000,000,000 per year.* That is, the exchanges and production of goods within the country entirely overwhelm the exchanges with other nations. The fact is, of course, indisputable in any country; but more particularly so in a highly developed industrial country, such as the United States. Even in New Zealand the home trade is far greater than the external trade, though we have no great factories and no huge cities. The distribution of commodities seems to engage a growing proportion of the population as time goes on.
All this is admitted; but still it holds true that New Zealand's prosperity depends mainly on the export of the primary products of the soil. Not only do the rural workers depend directly on them, but indirectly the whole structure of our economic life is built upon their basis. There is practically no market in the Dominion itself for these staple products, and, except for the small quantity required to supply local needs, the whole produce is exported. Similarly, New Zealand does not manufacture for its own market, and will not, while the profits from our primary industries remain the greater. The report of the Cost of Living Commission (1912). in dealing with the question of protection, emphasized the fact that less than 5 per cent. of the population were engaged in protected industries, and that the whole community was paying, in higher prices, for this protection.
* Professor Fisher's “Equation of Exchange for 1913″ places the total volume of trade us 455,000,000,000 dollars.
Enough has been said to prove that the primary products are the basis of the country's wealth; but it is interesting to glance at some of the main industries.
Wool gives little employment except at shearing-time. A sheep-run is usually a huge tract of downs or hillside, and all through the year a very few shepherds and station hands are sufficient to carry on the ordinary work of the run. But the wool must be sheared, sorted, pressed, carried, and stored before being shipped Home. Perhaps some wool may be washed, or sliped, or scoured here, but very little remains in New Zealand. In 1914 the exports amounted to 220,000,000 lb., while the quantity used locally was less than 7,000,000 lb. The census of 1911 gives the following statistics relating to woollen-mills, of which there are eleven. They employ 1,410 hands, and pay in wages £137,161 per annum, and their annual production is valued at £377,713. This industry was established in New Zealand in the “seventies”; but, though it has developed some specialties—e.g., rugs—and always turns out a good article, it has not been able to conquer the import of clothing, or even of woollen piece-goods.
The meat-freezing industry is easily the most important in the country, judged by the value of its product. In 1911 there were sixty-four works, employing 4,095 hands, and paying £459,650 in wages. Not only does the industry require highly skilled labour, but a great amount of capital is required. Buildings were valued at £845,159 and machinery at £774,944. Its products, besides frozen lamb, mutton, beef, and rabbits, comprise preserved meats, tallow, bonedust, and other manures, neatsfoot-oil, casings, horns, hoofs, bones, &c., with the total annual value of £5,884,931.
Next in order comes the dairying industry. There are 338 butter and cheese factories in the Dominion. This industry is primarily one for the small man and closer settlement, and New-Zealanders view its extension complacently. It settles many families on the subdivided sheep-run, small co-operative factories spring up, and a little township soon grows around the “creamery.” Closer settlement is the embodiment of progress to the popular mind. These 338 works in 1911 employed 1,504 men, and produced butter and cheese worth nearly £4,000,000.
Tanning, fellmongering, and wool-scouring establishments employ 1,372 hands and pay £136,875 yearly in wages, while their total production in 1910 was just over £2,000,000. Then, sawmills, &c., produced in 1910 goods worth £2,699,888, and employed the greatest number of hands of all industries (6,877). Printing-works and grain-mills produce more than the first industry which may properly be termed a manufacture. This industry is shown in the Official Year-book as clothing and boot and shoe factories. The protection granted to the boot industry in New Zealand is very heavy, an ad valorem duty of 15 per cent., plus a fixed duty ranging from 1s. 6d. per pair on men's boots to 6d. per pair on girls' shoes. Yet the industry has never appeared to thrive, and the local production suffers great competition from imports. In 1910, goods worth £619,873 were produced by seventy-four factories, employing 2,060 hands and paying nearly £200,000 in wages. In the same year boots and shoes were imported to the value of £271,984; but it must be remembered that this value is the import value, and does not include duty, &c.
A great many of the industries shown in the Official Year-book are merely repair trades, or industries which must be located close to their market. The great bulk of the trade in iron and machinery and foundry shops is repair work. Then, reading down the list of industries, ranged in order of their output, we find, after the industries mentioned above, tailoring, breweries, gasworks, dressmaking and millinery, tramways, furniture, coachbuilding—all of them industries which must be located close to the market.
Of manufactures properly so called there are few in New Zealand. The greatest are, first, the clothing and boot and shoe factories, and then the woollen-mills. Next come soap and candle works, with an output of £268,635 in 1910; sugar-boiling and confectionery, output £259,498; agricultural-implement factories. £222,040; saddlery and harness works, £220,364; lime and cement works, £184,686; biscuit-factories, £168,122. All of these industries are protected more or less, most of them very highly. The making of agricultural implements was begun early in New Zealand, four companies being in operation in the “sixties.” The new conditions of agriculture, the special requirements of the local farmers (e.g., the curved mouldboard in the plough, which the Americans do not make), and the expense of transporting unwieldy machines, give natural protection, and for long the industry was able to hold its own without any assistance from the tariff. It even exports some machines to South America. But there has been growing competition from Canadian and American specialized firms, and of late years the local manufacturers have been appealing for an increase in the slight protection granted recently. In 1910 the total output was £222,040, including repairs, while in the same year one American firm sold machines and parts worth approximately £60,000. There are two big American firms which seem to have a firm footing in this market, and also several smaller English firms.
On the other hand, the sugar-refining industry started under protection, but was soon able to dispense with it. There are several other industries on a small scale which started from some accident of natural protection, such, for instance, as the budding of small ships in Auckland, or of gold-dredges in Otago.
But all these industries are of only secondary importance, and the slightness of their hold is shown by the high tariffs protecting most of them. If, as the Cost of Living Commission reported, “New Zealand's prosperity depends essentially on the production of the great primary products,” and if, as has been shown, the great bulk of these products are exported, it is evident that the course of foreign trade is of great interest in view of its intimate connection with the country's prosperity. The division between imports and exports has been noticed: imports—manufactures, luxuries, and exotics; exports—foodstuffs and raw materials. In the long-run imports and exports must balance; but for short periods exports give a good view of the Dominion's progress. But they must be used cautiously and with due inquiry into the underlying facts. Imports and exports, compared and interpreted properly, form a good index of the prosperity of New Zealand. This chapter has been devoted to an analysis of the reasons for the reliance that people in New Zealand place on their foreign trade, and the conclusion was reached that on the export of the staple commodities depend the industrial activities of the Dominion; but no one test of prosperity is adequate, and all need to be supplemented by the evidence of other tests, and therefore the following table of index numbers of various tests of prosperity has been prepared.
| TABLE O.—INDEX NUMBERS OF VARIOUS TESTS OF PROSPERITY. | ||||||
|---|---|---|---|---|---|---|
| Year. | Trade. | Population. | Bankruptcy-rate. | Marriage-rate. | Savings-bank Accumulations. | |
| Total. | Export per Head. | |||||
| 1861 | 23 | 100 | 14 | .. | 139 | 3 |
| 1862 | 41 | 139 | 18 | .. | 133 | 4 |
| 1863 | 61 | 140 | 24 | .. | 139 | 4 |
| 1864 | 61 | 140 | 25 | .. | 162 | 8 |
| 1865 | 55 | 136 | 28 | .. | 153 | 7 |
| 1866 | 61 | 153 | 30 | 657 | 153 | 7 |
| 1867 | 59 | 147 | 32 | 877 | 147 | 11 |
| 1868 | 56 | 136 | 33 | 235 | 139 | 16 |
| 1869 | 55 | 129 | 34 | 342 | 124 | 21 |
| 1870 | 56 | 136 | 36 | 411 | 116 | 24 |
| 1871 | 56 | 159 | 34 | 260 | 108 | 26 |
| 1872 | 61 | 129 | 41 | 211 | 101 | 32 |
| 1873 | 72 | 133 | 43 | 201 | 120 | 42 |
| 1874 | 79 | 108 | 50 | 151 | 124 | 42 |
| 1875 | 81 | 109 | 54 | 199 | 135 | 37 |
| 1876 | 74 | 100 | 58 | 190 | 124 | 33 |
| 1877 | 78 | 110 | 59 | 338 | 116 | 36 |
| 1878 | 87 | 100 | 63 | 330 | 120 | 37 |
| 1879 | 83 | 87 | 67 | 548 | 108 | 33 |
| 1880 | 74 | 94 | 70 | 411 | 104 | 37 |
| 1881 | 80 | 86 | 73 | 396 | 103 | 47 |
| 1882 | 89 | 92 | 75 | 356 | 109 | 53 |
| 1883 | 89 | 92 | 79 | 412 | 106 | 51 |
| 1884 | 87 | 89 | 82 | 205 | 106 | 53 |
| 1885 | 84 | 84 | 83 | 233 | 103 | 57 |
| 1886 | 79 | 81 | 85 | 246 | 93 | 56 |
| 1887 | 77 | 82 | 87 | 236 | 93 | 61 |
| 1888 | 82 | 91 | 88 | 195 | 93 | 68 |
| 1889 | 92 | 107 | 89 | 165 | 92 | 71 |
| 1890 | 95 | 111 | 91 | 142 | 95 | 77 |
| 1891 | 95 | 107 | 92 | 130 | 94 | 83 |
| 1892 | 98 | 104 | 94 | 107 | 96 | 85 |
| 1893 | 93 | 95 | 97 | 100 | 96 | 91 |
| 1894 | 95 | 95 | 99 | 129 | 95 | 92 |
| 1895 | 87 | 88 | 100 | 96 | 92 | 102 |
| 1896 | 98 | 92 | 103 | 80 | 106 | 109 |
| 1897 | 106 | 97 | 106 | 79 | 106 | 117 |
| 1898 | 111 | 100 | 108 | 74 | 107 | 119 |
| 1899 | 123 | 112 | 110 | 70 | 113 | 125 |
| 1900 | 142 | 122 | 111 | 56 | 119 | 135 |
| 1901 | 146 | 116 | 114 | 39 | 121 | 142 |
| 1902 | 148 | 119 | 117 | 34 | 124 | 150 |
| 1903 | 164 | 126 | 122 | 31 | 127 | 156 |
| 1904 | 165 | 122 | 124 | 41 | 128 | 159 |
| 1905 | 167 | 126 | 128 | 47 | 128 | 171 |
| 1906 | 197 | 141 | 132 | 52 | 131 | 189 |
| 1907 | 220 | 153 | 135 | 53 | 138 | 212 |
| 1908 | 200 | 120 | 139 | 61 | 137 | 216 |
| 1909 | 208 | 143 | 141 | 71 | 129 | 220 |
| 1910 | 231 | 158 | 144 | .. | .. | 240 |
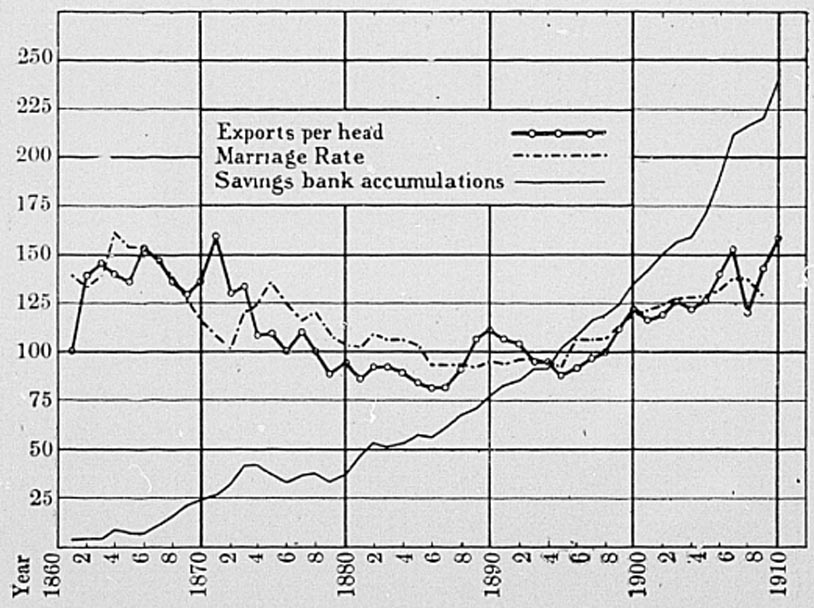
The table given above is a comparison of various tests of prosperity, which are often quoted singly for various purposes. In a country such as New Zealand prosperity is accompanied by expansion of foreign trade, increased population, a decreasing bankruptcy-rate, a rising marriage-rate, and an increase in the savings-bank deposits. That, on the whole, the country has been prosperous rather than the reverse is at once evident; but the chief interest for us lies in picking out the times when the country was less properous than normally.
Population increases all through the period, yet we know that prosperity has not always been the rule. It is true, however, that just before the turn of rising prices in 1895 population increased very slowly, and that after 1870 it increased rapidly; but the increase has generally been uniform. The bankruptcy-rate shows a general tendency to decrease, but in times of crisis an increase is always apparent. The later years, however, show a striking contrast to the years about 1880. The accumulations of the savings-banks, especially after 1885, show a rapid and apparently continuous increase. Before that date the critical years can be traced fairly easily; but since then they can be gauged only by the checking of the rate of increase.
The marriage-rate is the last test given by the table, and in many ways the most satisfactory. It does not show unbroken progress by any means; but the fluctuations are not so great as in the bankruptcy-rate, nor is the trend so uniform as in the case of the population and the savings-bank accumulations. The marriage-rate is naturally adjusted for increases in population, and before any comparison may be made with the trade it is necessary that the figures of trade should be corrected similarly. An index of exports corrected for changes in population shows such a marked resemblance to the index of the marriage-rate that a connection is undoubted. It has been noted before that Dr. McIlraith connected the prices of farm-products—i.e., exports—with the marriage-rate, and that the prices of exports show the same variations as the amounts exported. It is no surprise, therefore, to find that the exports of New Zealand have a real connection with the marriage-rate. As might be expected, the variations are not concurrent; but the marriage-rate is influenced by the exports of the preceding year. Allowing a lag of one year, the coefficient of correlation between the series is found to be plus 0.679, with a probable error of 0.007. The correlation is fairly high, and shows indisputable connection between the two series. This result seems to give support to the claim that exports are a good index of New Zealand's prosperity.
The review of the external trade was divided into four periods:—
The decade before the gold rushes, marked by low-level fluctuations of trade: 1853–60.
The period of the discovery of gold, marked by a huge increase in both the imports and exports: 1860–70.
A period of falling prices, accompanied by heavy borrowing, followed by depression and diminished production, especially of gold; the first portion of the period is marked by increased imports, which afterwards fell below their old level: 1870–95.
A period of rising prices and increased production; great and continuous increase of foreign trade: both import and export: 1895 to date.
These periods correspond to well-defined periods in the history of New Zealand, and it is easy to show that the course of foreign trade has been accompanied by corresponding changes in the home trade Before the gold-rushes brought increased population to the country its fortunes were very precarious. Mention has already been made of Sir George Grey's hasty summons to the struggling colony; and he had to fight a hard battle against land-monopoly and the Maoris, but harder still against the restricted outlook of trade. Industries were then in their infancy, and the Australian market for surplus produce was of the greatest importance.
With the discovery of gold the country was turned upside down. Prospectors who had come from California to Australia left the older fields of Bendigo and Ballarat to join in the rush. Population increased at an enormous rate. At first the conservative colonists of Otago did not look too favourably on the newcomers; but the fever did not take long to spread throughout New Zealand. It does not seem to have been carried to such an excess as in Melbourne; but still it resulted in much dislocation of trade. Sailors, farm hands, and artisans joined with the immigrants in the rush.
When the production of alluvial gold began to fall off there was a return to more orthodox conditions of life. The temporary depression which followed was, in the early “seventies,” met by Vogel's ambitious development schemes, which at once plunged the country into the excitement of land speculation. In the few years aft or 1870 the population increased by leaps and bounds; but unfortunately the great bulk of the increase went to the cities. Trade was busy, railways and roads and bridges were being made, and land continually increased in price. Mr. Reeves, in his “The Long White Cloud,” gives a graphic description of the boom, and points out that the depression which followed was the result of private speculation rather than of public borrowing. As railways were pushed on, and new tracts of land were thus opened up, the speculation in land rose to a violent boom. With the legitimate competition of land-hungry farmers was mingled the feverish buying of speculators who bought for a rise. Every one was touched with the mania, and the banks unfortunately assisted by giving extraordinary facilities for credit. In a new country the banks have almost complete control of the country's capital; all financial business—lending for investment and enterprise, bill-broking, discounting, and exchange—is done through them. Conant, in “History of Modern Banks of Issue,” remarks that the Australian and New Zealand banks were during this period, which culminated in the bank smashes of the early “nineties,” administered in a way quite foreign to the traditional conservatism of English banking. In the land crisis of 1874–76 and the subsequent depression the banks found themselves burdened with an unrealizable asset. They had lent money on inflated land till their commitments exceeded by far their liquid assets. Then, when the boom burst, and the banks found their assets all tied up in land, the crisis struck at the heart of the credit system of the colony, and this largely explains its harsh and prolonged effect.
When the artificial nature of the prosperity under the boom became apparent, New Zealand, after some attempts to borrow, set herself to endure her trouble. Then followed the gloomiest period of the country's history: all but absolutely necessary expenditure was checked, development was suspended, public soup-kitchens were found necessary, Civil servants had their salaries retrenched 10 per cent. all round. Scholefield, in “The Evolution of New Zealand,” talks of unemployment, sweating, lowered wages, and general stagnation of industry. There is no doubt that after the boom burst there was a considerable proportion of the population concentrated in the towns and out of employment. A Sweating Commission found evidence of unhealthy crowding, and of overwork of women and girls; and from its recommendations sprang New Zealand's stringent code of factory laws. The unstable condition of industry led to much distress. Prices were low and kept on falling, and the price of labour fell more than in proportion. Not only were money wages falling faster than prices, but employment was scarce and insecure. Scholefield gives instances of many trades where men were largely supplanted by apprentices or women. It was not merely a local crisis, however, but rather a world-wide depression of trade, aggravated in New Zealand by widespread speculation. It took time to work itself out; but gradually increased production and careful control of expenditure began to reverse the conditions. The burden of falling price fell first on the farmers, the primary producers, and from them it was diffused throughout the country. In the end workers and employers too suffered from the discouragement offered to the production of the staple exports. The whole economic structure of the colony was shaken. The trouble finally recoiled on the mortgagees, the financial houses, and the banks; and in the crisis of the early “nineties” the Bank of New Zealand, which was the principal mortgagee, had to be propped up by the Government. The Colonial Bank failed altogether, as did several banks in Australia.
Refrigeration in 1882, and rising prices since 1895, helped the increase of production, and so effected the remarkable recovery of our last period. Since 1895 there has been a great increase of production, more especially in the dairying and frozen-meat industries. Every effort has been made to assist commerce, by Government inspection and grading, by land-settlement, by public works and railways. The increase in the domestic trade is so apparent that no one any longer thinks it worth while to comment on it. While prices continue to rise, and there is some grumbling at the increased cost of living, the increase of prosperity is unchallenged. All trades show great increases, and the expenditure on amusements and luxuries is enormous. During this period, too, New Zealand has been able to carry out many social reforms and to initiate many experiments. The evils of sweating were met by stringent legislation; compulsory arbitration recognized the unions and minimized industrial conflict; there is a Public Trustee, a State fire insurance, a Government life insurance, old-age and widows' pensions, and a National Provident Fund; the Government builds homos for workers, or lends money to workers, or settlers, or local bodies. Most of these activities of the Government are of recent origin, and have accompanied the great increase of prosperity since 1895.
It is claimed, then, that a view of the domestic trade, either statically or dynamically, supports the contention that the foreign trade of New Zealand is a good index of prosperity, and indeed that the export trade in particular is the foundation of our wealth. One is of course aware that, in the long-run, imports must balance exports; but over short periods exports, correctly interpreted, from a valuable index of the country's progress. Not only are the conditions of the time reflected by the state of the external trade but an analysis of the economic life of the Dominion shows that a great proportion of the population is dependent directly on the production of the staple exports, and that practically all depend on them indirectly.
This is also the real view of those engaged in industry, whatever opinions many classes of them may express in times of peace or prosperity, when they seek each to enlarge his own particular share of the national dividend. No further proof is needed than the anxiety shown on all sides, during the first few days of the present war, regarding the safety of the oversea trade-routes. No sacrifice was too much, no effort too great, if only the seas were kept free. New Zealand depends very really on the power of the Navy to control the sea-routes.
The progress of the foreign trade of New Zealand has been traced from small beginnings to its present development, and now it remains only to glance at the probable course of trade in the future. Professor Pigou's pamphlet, “Economic Science in relation to Practice,” emphasizes the fact that economics deals with real life, not with abstractions; that it is, or should be, essentially a practical study. He goes on to classify the sciences as “light-bearing” and “fruit-bearing,” and, contrasting economics with astronomy, claims that its main object is “fruit-bearing.” There is no doubt that, while theoretical economists confine themselves to analysis and explanation of the facts of economic life, the ultimate purpose of their work is to accumulate a sure and proved foundation of scientific experience upon which to base efforts for future improvement. Professor Segar, of Columbia University, in an address delivered recently, also stated this view most emphatically; but added that economists were not yet ready to give authoritative pronouncements, although great strides were being made in the practical applications of the science. Similarly, Professor Moore argues that the main body of economic theory is universally accepted now, and that the time has arrived when economists should set themselves the task of solving the problems of real life by statistical and mathematical methods supplementing theoretical analysis. Such, in fact, is the tendency of modern economists, as shown for instance in Moore's “Laws of Wages,” and Pigou's “Wealth and Welfare.”
So this paper has been written on a small section of the economic field in the hope that, by throwing the events of the trade history of New Zealand into a continuous and consistent review, some knowledge will be gleaned that may assist, be it ever so little, in preparing for future progress. There is great need for work of this kind in many provinces of New Zealand life. Mr. Reeves has pointed out that, from her peculiar situation, the temper of the people, and the richness of her resources, New Zealand is well fitted to become the social laboratory of the world. Already she has committed herself to big experiments in State enterprises, money-lending, industrial regulation, and popular control of the liquor traffic: all these have been entered upon during the last twenty years, with the approval of the people. The results of all are of great interest to the outside world, yet little attempt has been made to investigate them. One thing will be at once evident, that practically all these enterprises were begun since prices turned again to rise in 1895, and have therefore had the backing of a rapid and continuous increase of prosperity.
All through this paper care has been taken to emphasize the influence that the price-level has exerted upon the trade of this country. Rising prices not only stimulate the production of the staple products, but their values are inflated too; falling prices are disastrous to New Zealand. The fact that an appreciating currency always causes hardship to debtors, while a depreciating currency is almost equivalent to lowering the rate of interest, is of vital importance to a debtor country like New Zealand. Perhaps it is as well to state more clearly how rising prices are beneficial to New Zealand. A rising level of prices does not mean that all prices rise uniformly, but there is a tendency for all to rise. Some, however, lag behind others. Fortunately for us the price of capital, as expressed by the rate of interest, though rising in sympathy with general prices, lags behind the general rate. This is well shown by Mr. Macdonald in the Statistical Journal for March, 1912.* The net result is, therefore, that a borrower gets the benefit of rising prices, and yet does not have to pay correspondingly high prices for the loan of the capital he works with—that is, he reaps a quasi-rent from the “conjuncture” of rising prices. A further and even more important benefit from rising prices is derived from the fact that the interest represents so much less purchasing power now than in the days when the loans were contracted—that is, New Zealand has to export loss produce to pay for the loan of her capital, because the interest is paid not in the depreciating currency but in commodities. Finally, the sharp line of division between imports and exports in New Zealand derives much of its interest from the fact that, while the prices of exports rise, the prices of imports tend, on the whole, to fall; so that we gain both ways.
But will prices continue to rise? With increased prosperity New Zealand has increased her borrowing. Between March. 1911, and March, 1913, the gross public debt was increased from £81,000,000 to £90,000,000; there were still further increases amounting to £9,000,000 in 1914, though much of this was caused by the necessity of meeting short-dated loans, and was not therefore an addition to the net debt. All the loans of recent years are for reproductive purposes, and many of them more than repay their cost under present conditions. But will present conditions continue?
* Compare also Professor Irving Fisher's “Purchasing-power of Money,” Chapter IV.
The report of the Cost of Living Commission, 1912, emphasized the fact that the prices of New Zealand produce were not local, but world prices, and that they depended primarily on the supply of gold. For many years after the early “nineties” the world-production of gold has been increasing greatly, and at present it shows no signs of falling off. Further, it will take some years for a fall in the production of gold to make itself felt, since the annual production has to be added to the great stock of gold already existing, and so the effect of the fall is reduced. Of recent years there is a rapidly growing tendency to keep gold apart, for an international money, and to conserve its use by the extension of credit. This economy of gold is equivalent to production, and tends to raise prices. Dr. J. M. Keynes, in his work on “Indian Currency and Finance,” shows how great a quantity of gold is hoarded in India, the “sink” for the world's surplus gold, as Jevons called her. It would seem that falling prices would tempt gold from these hoards again, and in any case the spread of education in India is resulting in the spread of banking, and the subsequent liberation of gold.
Professor Irving Fisher has discussed this question of the probable course of prices, and his forecast of the future has the weight of authority behind it.* After quoting reports from the Director of the United States Mint, and discussing various aspects of the mining question, he is of opinion that the production of gold may in a few years reach its maximum, and then gradually decline. But prices will not necessarily fall, because, though the production of gold might be diminishing, it might still be in excess of the world's needs; and in any case the annual production is but a fraction of the world's stock. As an illustration he compares the supply of money to a lake which continues to rise oven after the rain has ceased to fall. But metallic money forms but a fraction of the world's media of exchange. There has been, and will continue to be, an enormous development of banking and credit and paper money. The volume of trade continually increases, but the amount of money and substitutes for money increases in greater proportion. Taking long views, there has been a continual rise of prices, though periods of rising and of falling prices alternate.
Professor Fisher takes the factors of the equation of exchange separately, and grants that M, the supply of metallic money, is problematical. But V, the velocity of its circulation, must rise, mainly because of the decrease of hoarding of all kinds. Gold will be liberated more freely from India, Egypt, and the East, although these countries will still continue
* See especially, “Will the Present Upward Trend of Prices Continue?” in the American Economic Review, 1912, and his subsequent annual article on the “Equation of Exchange,” in the same journal. to act as a drag on prices. Similarly, Government hoards for war, and banking hoards for reserves, will tend to be economized as the world gets more civilized. The next factor, M′, or money-substitutes, is bound to increase rapidly. The growth of deposit banking is enormous, even in countries like the United States and Britain, where it has been in operation for many decades. But as its use extends more over the European countries, and finally all over the world, the volume of deposits forms an ever-increasing addition to the world's currency. Similarly the rapidity of its circulation increases with confidence and familiarity. So all the tendencies are for the quantity of money and the velocity of its circulation to increase. Against this must be set the probable increase in trade; but Professor Fisher has calculated the probable rates of increase of all the factors concerned, and comes to the conclusion that the increase of money will outstrip the need for it, and therefore that prices will rise. He estimates that a rise of 2 per cent. per year is a perfectly safe minimum to prophesy, though of course there will be fluctuations of prices.
So it seems reasonable to expect that prices will continue to rise for a time at least, though they cannot rise for ever. As soon as the inconvenience of rising prices exceeds the margin the world must automatically, as Kinley (“Money,” Chapter VII, section 3) has shown, choose the cheaper alternative. But it is probable that the change will not come suddenly, and will bring its own warning, so that New Zealand will have no excuse for perpetrating again the error of the “seventies.” It is devoutly to be hoped that the country will not resort to loans to stave off temporary depression, and plunge again into heavy borrowing at an untimely moment. Meanwhile, of course, New Zealand enjoys unexampled prosperity from the fortuitous aid of the price-level, and is developing her resources as fast as possible. It was very pleasing to be able to note in Chapter IV that the greater part of the increased prosperity since 1895 was due to increased production, and, even after the good fortune of rising prices has left New Zealand, there will remain hard work, by which her prosperity may increase.
The present danger is that in these times of favourable circumstances she may mortgage her resources so deeply that should a reverse come the burden of debt will be oppressive, especially since the bulk of the national debt is held in other countries.
Leaving the subject of prices, we must consider the probable course of imports and exports. We have seen that, in the main, imports follow exports, but that the heavy borrowings of the later years have swelled imports very greatly. Exports must soon regain their ascendancy, increasing faster than imports, unless borrowing continues on a large scale. The normal position, as we have seen, is that exports should be in excess by an amount sufficient to pay interest on our debts and freight for the carriage of our goods; and though this relation has been disturbed by recent loans and crises, it must be restored either by a great increase of exports, or, less happily, by a restriction of imports.
The war which has so convulsed the whole world struck hardest at the credit system, and no one is able to forecast the ultimate result. The immediate result has been to raise prices still higher, because of a very evident shortage of commodities; but it is conceivable that at the close of the war the burden of debt may be heavy enough to cause a collapse of credit and so result in falling prices.
In the meantime New Zealand is enjoying to the full the very real advantages of a rising price-level. For the first few weeks the prospects seemed doubtful—before a decisive blow was struck the delicate credit mechanism was injured, stock exchanges closed, banks imposed restrictions on specie payments, and moratoriums were passed. Though the command of the sea was never really in doubt, raiding cruisers threatened to interfere with our commerce. Fortunately it was the slack season for all our main exports, meat and wool and dairy-produce, and before the busy season set in the Navy had asserted itself.
It was soon evident that the distress of Europe was profitable to the Dominion. There was a keen demand for all our main products, and prices rose very sharply and continue to rise. The wool-sales of November, 1914, saw very high prices; but the wool was rushed on to the market so quickly that prices dropped slightly again, though the early sales of 1915 saw still higher prices. Again, the first sales of the 1915–16 season have seen record prices—from 2d. to 3d, per pound above the record of last season—so that there is ample assurance of continued prosperity for the Dominion. Similarly, frozen meat has been in great demand, and indeed the whole supply was commandeered by the Imperial Government, so that the amount exported and the price realized were both far in excess of any previous figures. Exports of all the main items have increased with the exception of gold. Butter shows a steady rise, but cheese has jumped almost 50 per cent. The export of gold was less in 1914, because the export of bullion was restricted and the Dominion Government bought gold in New Zealand on behalf of the Bank of England. The total exports showed an increase of 14¼ per cent., and the value, over £26,000,000, is an easy record.
On the other hand, imports have decreased slightly, owing to the extreme difficulty experienced in getting orders executed in the Home-land. The great diversion of industry to war work, and for a time the congestion of shipping, rendered it difficult to obtain goods that were urgently needed. It is true that for a time New Zealand buyers hesitated; but the very high prices of exports had a reassuring effect, and the desire to buy is as strong as in peace.
The present year, 1915, has but seen an accentuation of the tendencies already outlined: prices rise, exports increase greatly, and imports fall off slightly. For the ten months ending October the total exports were £25,634,414. as against £21,489,250 in the corresponding period of 1914; while imports were only £17,814,009, as against £18,816,437 in 1914. Wool shows an increase of over a million pounds sterling, while the increase in the exports of frozen meat is much greater. There seems no reason to anticipate any change in these tendencies while the war lasts, whatever may happen afterwards.
The reflection of high prices abroad is always seen in New Zealand in an increased cost of living. All prices of foodstuffs have risen sharply, and the increased pressure has been severely felt by some sections of the community. The gain from rising prices of exports is made at the expense of the consumers, and is paid by the poorer people of the Old World; but some of the goods which have risen most in price, such as wheat and flour, are not exported, so that the rising prices have been paid by the consumers in New Zealand. It seems obvious that the distress of Europe will, heartless as it seems, be profitable to New Zealand. With the destruction of the harvest, and the dislocation of trade, prices of foodstuffs and raw materials must rise greatly. The reflection will be seen here in increased prices both of locally grown foodstuffs and of imported manufactures; but the gain from rising prices of exports always overwhelms the loss from the rise in the cost of living. Already a strong demand for wool for khaki is making itself felt, and the local mills are also feeling the stimulus to production. The price of wool, which is of such importance to this country, seems likely to rise rather than fall.
Turning to consider the imports and exports in more detail, it seems probable that, with the shock to credit, borrowing must be restricted awhile; and so the imports of metals and machinery will fall again relatively as they have fallen in 1914. But it seems a bright feature in the outlook for Britain that she will find the colonial and American markets but slightly affected, even though her best market—Germany—be shattered for a time. New Zealand will continue to demand her share of clothing, machinery, paper, and luxuries, the bulk of which must come from Britain.
There does not seem to be any prospect of change in the essential nature of the trade; exports must remain for a long period yet the primary products of the soil. Wool is still the biggest source of wealth, and rising prices assure its dominance. It has been further strengthened in its position by the importance of its joint product—frozen meat. Dairy-produce too must progress, even faster than the others, as settlement becomes more dense and closer subdivision of land is continually demanded. These three, together with gold, contribute the great bulk of our exports; and the production of gold seems likely, with rising prices, to continue at least stationary, so that more and more New Zealand must rely on her pastoral products. It is not likely that any great extension of manufactures will take place, at least as long as rising prices of farm-products rule.
The question of the distribution of the trade over the various countries will also be affected not so much by the direct result as by the indirect results of the war. It was pointed out in Chapter VIII that the import trade was necessarily being spread out more over the different countries, though the United Kingdom still held the bulk of it. Imports from Canada, the United States, Germany, and the other European countries have tended to increase, and would have tended to increase more in the future. The German steamship-owners recognized the prospects of the trade, and were initiating a direct service from Hamburg, but the first vessel had news of the war just before reaching New Zealand, and was diverted to Java. The growth of New Zealand's trade with Continental countries has been mainly in special lines of manufactures, where England has been undersold or has not catered for the trade. With the dislocation of the trade in Europe it seems likely that the United Kingdom will get back again a good deal of this trade. Britain itself will, however, also be harassed, though not as much as the Continental countries, by the abnormal conditions of war. Not only the shock to credit but rising prices of raw materials will cause much dislocation of industry. Cases in point are the manufacture of linen goods, since flax comes mainly from Russia and from Belgium; and the manufacture of wood-pulp paper, which is in much the same quandary.
Further, the United Kingdom will suffer competition from the other great manufacturing nation, the United States. Everything seems favourable for a great expansion of imports from Canada and the United States. The opening of the Panama Canal will bring the east coast ports much nearer to Australia and New Zealand, and, moreover, will provide an alternative route. All depends on the effect of the Canal dues; but if they are reasonable the canal should give the United States a good help towards gaining a better footing in the Australasian trade. Just now, when that country has opened its ports to our wool and mutton, it is very probable that a big increase of trade will result.
The outlook for exports is very similar. The United Kingdom is in an even more dominant position than in the import trade, and her only possible competitor now seems to be the United States. It is not very likely that the tariffs of the Continent will be reduced, though prices of foodstuffs must rise high. New Zealand has little cause for apprehension, seeing that her big market will still be open, and there is prospect of another big manufacturing nation beginning to compete for her products.
A review of the trade of New Zealand makes pleasant reading, and there seems no ground for misgiving as to the future. Care has been taken always to ascribe due credit to the influence which a rising price-level has exerted upon the prosperity of the country; but it is only just to point out that the main cause of that great increase of prosperity in recent years has been greater productivity. New Zealand's strength lies in her rich resources, and, most important of all, in her well-governed and highly efficient, if small, population.
R. SPEIGHT, M.Sc., F.G.S.,
Curator of the Canterbury Museum.
LAKES are features of the landscape which are usually attributable to the filling-up of hollows formed by faulting or warping, or by volcanic explosions, or by the irregular accumulation of material round volcanic vents, or to the interference with river-valleys by glaciers. Seeing that all these agencies have operated on an extensive scale in New Zealand in comparatively recent geological times it is not surprising that its lake systems are well developed. The remarkable group of lakes lying in the middle of the North Island, as well as isolated enclosed sheets of water in other parts of the Auckland Province, are due to volcanic action in its various forms, while those in the South Island are to be credited to the operations of glaciers. We have therefore two distinct types of lake scenery, one for each Island. The relief of the land near the volcanic lakes is not by any means marked, and they therefore rarely have bold and precipitous shores, and their scenic interest depends partly on the patches of subtropical bush which grows luxuriantly in places on the weathered igneous material, and partly on their desolate and forbidding surroundings, everywhere reminiscent of volcanic action, where the softening hand of time has not reduced the outpourings of the eruptive centres to a condition favourable for the establishment of vegetation. The thermal activity which is manifested in numerous places on their shores adds to their interest. In the South Island the lakes lie in the midst of splendid mountain scenery, with amphitheatres of noble peaks at their heads, crowned with perpetual snow, and clad at lower levels with dark primeval beech forest, which affords an appropriate setting for the waters at their base, rendered milky-white at times with the finest of sediment worn from solid rocks by powerful glaciers, and swept down to the quiet waters of the lake by turbulent glacial torrents.
The largest sheet of fresh water in New Zealand is Lake Taupo, which is situated in the very heart of the North Island, at an elevation of 1,211 ft. above the sea. Its greatest length in a S.W.- N.E. direction is 25 miles and its greatest breadth is about 17 miles, but its shape is somewhat irregular owing to a large indentation on its western side. Its area is 238 square miles, its greatest depth 534 ft., and it has a catchment area of about 995 square miles. About 60 per cent. of its water-supply conies from the Upper Waikato River, which drains the northern and eastern flanks of the central volcanoes as well as the western slopes of the Kaimanawa Range and its northern extensions. The lake discharges at its north-eastern corner and forms the main Waikato River, which falls within a short distance over the Huka Falls, where the volume of water which passes over is estimated to reach an average of 5,000 cubic feet per second. The surroundings of the lake are picturesque, on the western side especially. Here it is bounded by cliffs of volcanic rock, generally between 100 ft. and 800 ft. in height, but at the Karangahape Bluffs they rise to over 1,000 ft. sheer. The northern shore is bold with promontories terminated with bluffs and intervening bays with gentler slope. The south side is generally fringed with alluvial flats, while the east is bordered in places with pumice cliffs, and is somewhat uninteresting, but relieved from absolute monotony by the graceful extinct cone of Tauhara. About 20 miles to the south rise the great volcanic peaks of Tongariro, Ngauruhoe, and Ruapehu, with their bush-clad foothills, forming a splendid panorama when seen from the northern shore of the lake.
To the south-east of the middle of the lake lies the island of Motutaiko, in all probability the summit of a volcanic cone on the line of igneous activity which stretches north-east from the central volcanoes towards Tarawera, White Island, Tonga, and Samoa. The formation of the lake itself is attributable either to a great subsidence after volcanic activity waned, or to a great explosion which tore a vast cavity in the earth's crust and scattered the fragments far and wide over the middle of the Island, and evidence of declining igneous action is furnished by hot springs in the lake itself and near its shore, especially at the north-east corner near Wairakei and on the southern shore near Tokaanu. Earth-movements have in all probability continued down to recent times, for an old shore platform or wave-cut terrace surrounds the lake, indicating that its waters were formerly at a higher level.
The lake forms an enormous reservoir of power conveniently placed for exploitation; it is estimated that the Huka Falls would develop up to 38,000 horse-power, and its central position renders it peculiarly suitable for supplying a wide district. Although the immediate vicinity does not hold out much hope for its utilization, the rich agricultural districts which lie at some distance will no doubt rely on it in the near future as a convenient source of mechanical energy.
To the south of Taupo, nestling in the hills between the great lake and the northern slopes of Tongariro, lies Roto - Aira, a beautiful sheet of water, 3 miles in length and with an area of 5 square miles. It discharges by the Poutu River into the Upper Waikato. The other lakes of this region are small in size and usually occupy small explosion craters on the line of igneous activity mentioned above.
A most interesting group of lakes lies in the midst of the thermal region to the north-east of Taupo. These comprise the following: Rotorua, Roto-iti, Roto-ehu, and Rotoma, which belong to a system lying to the north-west of the area, and Tarawera, Rotokakahi, Tikitapu, Okareka, Rotomahana, Okataina, Rotomakariri, and Herewhakaitu, which lie to the south-east. The former group is connected either directly or indirectly with the Kaituna River basin, and the latter with the Tarawera River basin, both of which discharge their waters into the Bay of Plenty. All these lakes occupy either explosion craters or depressions due to subsidences of the crust or hollows formed by irregular volcanic accumulations. They lie at an elevation of about 1,000 ft. above the sea. The largest is Rotorua, which is nearly circular in shape, except for a marked indentation on the southern shore. It is 32 square miles in area, 84 ft. deep, with flat shores; but in the middle, rather towards the eastern side, rises to a height of 400 ft. the picturesque and historical island of Mokoia. The lake discharges at its north-eastern corner by the Ohau Creek into Lake Roto-iti, a shallow and irregular depression, which runs in turn into the Okere River. To the north-east lies the small lake of Roto-ehu, separated from it by low ground, and further on lies the picturesque Rotoma, of still smaller size.
The largest lake of the south-eastern group is Tarawera, lying to the north and west of the mountain of the same name; discharging directly into it are Rotokakahi, Okareka, and Okataina, the last two by subterranean channels, while Tikitapu and Rotomahana are separated from it by comparatively narrow ridges.
All these lakes owe their interest to the thermal manifestations which occur in their vicinity, and to the remnants of beautiful bush which have survived the eruption of Tarawera in 1886. They are also noted for their fishing, being well stocked with trout. Their water is available for power purposes to a limited extent, and a small installation is placed near the low fall where the Okere River discharges from Lake Roto-iti.
Two small lakes of volcanic origin are situated on the peninsula north of Auckland: these are Takapuna and Omapere. The former lies close to the City of Auckland and occupies a small explosion crater near the sea; while Omapere is between the Bay of Islands and Hokianga, in a shallow depression, winch owes its origin to the obstruction of the Waitangi River by a lava flow. It is 3 miles long by 2 wide, and is placed at a height of 790 ft. above the sea.
About 40 miles from the east coast, in the Hawke's Bay district, lies the most important lake of Waikare-moana, 12 miles in length by about 6¼ in breadth at its widest part, but with an extremely irregular outline; it has an area of 21 square miles. Its surface is 2,015 ft. above the sea, and it has a maximum depth of 846 ft. It discharges by the Wairoa River to the northern shore of Hawke Bay. This lake is most favourably situated for the development of water-power, and it is estimated that it would generate owing to its admirable position as much as 134,000 horsepower. A few miles to the north-east lies the small lake called Waikare-iti which discharges into the large lake.
The only other inland lakes of any importance in this island are those situated in the lower course of the Waikato River, the most noteworthy being Waikare and Whangape. The former has an area of nearly 11 square miles and has a depth of 12 ft.; the latter is smaller, with an area of only 4 square miles and a depth of 9 ft. These owe their origin to flooding of low-lying land alongside the river, in all probability attributable to a slight lowering of the land in this part of the country, with the consequent inability of the river to discharge its surplus water without a proper channel being maintained.
Along the coast-line, especially behind the fringe of dunes, numerous small lakes are found, such as Rotokawa, near Kaipara, and Horowhenua, near Levin; and a large sheet of water occurs near the mouth of the Wairarapa Valley, called the Wairarapa Lake. The lake is very shallow, and liable to remarkable variations in size owing to heavy floods from the neighbouring ranges. Between it and the sea is a considerable area of swampy ground in which are several small lakes, the largest of which, Lake Onoke, is separated from Palliser Bay by a narrow shingle-spit.
By far the great majority of the lakes of the South Island are dependent for their formation either directly or indirectly on the action of glaciers. They may be either small tarns high on the mountains of large lakes occupying considerable lengths of old stream-valleys which have been overdeepened by the excavating-power of ice during the Pleistocene glaciation, or lakes formed by the filling of hollows in the irregular heaps of debris laid down on a plain at the base of the mountains or in a wide open valley. Accumulations of debris may also assist the first two causes in the formation of lakes.
Included in the first class are numerous sheets of water from the size of small ponds upwards, found in all parts of the mountain region, but especially in the high plateau regions of western Otago, and to a limited extent in north-west Nelson. To the second group belong the large lakes of the eastern watershed of the Alps and a small number which drain west, such as Rotoroa and Rotoiti in the Buller Basin, while to the last must be assigned the majority of the lakes of Westland, but Brunner and Kanieri should perhaps be assigned to the second class.
Seeing that glaciation was not so intense in the northern portion of the Island, it is not surprising that the lakes of that region are small and few in number. Attention has, however, been drawn to Boulder Lake, in the valley of the Aorere River, since it might be used for power purposes in connection with the great deposit of iron-ore at Parapara. It is only 151 acres in extent, but it lies at an elevation of 3,224 ft. and is conveniently placed for the establishment of an electric-power plant. Further south, near the head of the Buller, are two larger lakes, Rotoroa and Rotoiti, occupying ice-eroded valleys dammed at their lower ends by moraine. The former has an area of 8 square miles and the latter 2¾ square miles; their heights above the sea being respectively 1,470 ft. and 1,997 ft., and the latter being 228 ft. deep.
In the valley of the Grey River are two lakes of considerable size—viz., Brunner and Poerua. These are shrunken and separated parts of a former extensive sheet of water which was ponded back behind a great glacier moraine. Lake Brunner is 5 miles long by 4 broad, has an area of 15.9 square miles, is 280 ft. above sea-level, and 357 ft. deep. It is surrounded on two sides by high wooded granite peaks and on the other two by low ground. It discharges by the Arnold River to the Grey, but a very slight change in level would turn it into the Teremakau.
Lake Kanieri, which lies in the basin of the Hokitika River at the base of Mount Tuhua, is a beautiful sheet of water. It is 5 miles long by 1¾ wide, has an area of 8 square miles, is 422 ft. above sea-level, and 646 ft. deep. It owes its origin partly to the hollow formed behind an immense morainic dam, and partly to the erosive action of a valley glacier. Further south on the coastal plain of Westland are numerous small and picturesque lakes, wooded to the water's edge, lying behind heaps of glacial debris or in ice-eroded basins. The most notable of these are Ianthe and Mapourika, both of small size, the former with an area of only 2 square miles, at a height of 80 ft. above sea-level and with a depth of 105 ft., and the latter remarkable for the fine panorama of mountain scenery, with Mount Cook in the background, which can be obtained from the shore of the lake. Along this strip of coast-line there are numerous lagoon-like expanses of the water, cut off from the sea by dune areas or by moraine, the chief of which is Mahinapua, which lies close to the town of Hokitika. This is but 6 ft. above tide water, and has an area of 1½ square miles. The creek discharging from it is noted for the perfect reflections to be seen in the dark, peat-stained water.
On the eastern side of the main divide lie the great valley lakes which belong to the following river-basins: Hurunui—Lake Sumner; Rakaia—Lakes Coleridge and Heron; Waitaki—Lakes Tekapo, Pukaki, and Ohau; Clutha—Lakes Wanaka, Hawea, Wakatipu: Waiau—Lakes Te Anau, Manapouri, and Monowai; Wairaurahiri—Lake Hauroko; Waitutu—Lake Poteriteri. These are all formed on the same plan; great glaciers have excavated the floor of a river-valley and have piled the debris across its lower portion, leaving a great hollow which was filled with water when the ice retreated. Even in those river-basins where no lakes now exist the traces of their former presence are evident; especially is this the case with the Waimakariri, Rakaia, and Rangitata Valleys. Besides these large lakes each valley has its quota of small ones, usually hidden away among the piles of moraine or ponded back behind shingle-fans. Among these small lakes should be noted the following: Tennyson, in the valley of the Clarence; Taylor, Sheppard, Katrine, and Mason, in the Hurunui; Lakes Pearson, Grassmere, and Letitia, in the valley of the Waimakariri; Evelyn, Selfe, Catherine, Ida, and Lyndon, in that of the Rakaia; Clearwater (or Tripp), Howard, and Acland, in the Ashburton; Alexandrina, in the Waitaki; Lochnagar, Hayes, and Moke, in the Clutha. In the valley of the Waiau there are numerous lakes of small size hidden away in bush-clad valleys, the chief of which is the Mavora, which discharges into the main Waiau by way of its large tributary, the Mararoa. On the west coast of this region are also many insignificant lakes as far as size is concerned, such as Lake Ada, a well-known beauty-spot on the Milford Sound track, while further north the McKerrow, a lake of larger size, discharges into Martin's Bay.
The only other lakes in this island that are worthy of mention are Waihola, which occupies the lower portion of the Taieri Plain, and drains to the sea by a deep winding gorge cut through a ridge of moraine-covered hills, the gorge being tidal for the greater part of its length; while on the coast immediately south of Banks Peninsula lie Lakes Forsyth and Ellesmere, both ponded back behind a great shingle-spit formed by the drift of material brought down the rivers and carried north under the influence of a strong shore current. Both are very shallow and liable at times to be invaded by the sea. Ellesmere is 16 miles long by about 10 broad, and Forsyth is about 6 miles long by 1 in breadth.
Among all these lakes three stand pre-eminent for their scenic interest —Wakatipu, Te Anau, and Manapouri. The first-named is walled in on both sides by steep mountains which rise at the head of the lake to over 8,000 ft. in the Humboldt Range, and to over 9,000 ft. in Mount Earnslaw. Te Anau has an uninteresting eastern shore, but its western shore is broken into three great arms, whose impressive scenery is strongly reminiscent of that of Milford Sound and George Sound; while Manapouri, with its many bush-clad islets, and indented shore-line with innumerable sheltered coves and pebbly beaches, belongs to the same type as Dusky Sound, the most beautiful of all in the Fiord region.
The lakes of Canterbury lie in a treeless area and owe their scenic interest principally to the background of snowy peaks, while Wanaka and Hawea are intermediate in character between them and the more southern lakes of Otago.
These lakes are enormous reserves of energy awaiting development. Estimates of the amount available are somewhat uncertain in their upward limits, seeing that modifications of proposed schemes may increase the possible power to a marked extent. The only one, however, which has been utilized in an adequate manner up to the present is Lake Coleridge. This is estimated to yield 10,000 horse-power, and if the scheme be developed to its full capacity the amount will probably reach 90,000. Lake Tekapo would furnish at least 400,000 horse-power; Pukaki, 70,000; Ohau, 100,000; Hawea, 90,000; Wakatipu, 100,000; Te Anau, 90,000; Manapouri, 420,000; and Hauroko, 80,000; and there are many lakes which could very easily be adapted for smaller installations. Especially is this the case in the Fiord region country, where the heavy and well-distributed rainfall produces an unfailing supply of water, where lakes are placed in ideal situations as reservoirs, and deep water and secure harbours provide ample facilities for the transport of manufactured products. When these are properly utilized the now wild and deserted region will become the home of industry in the Dominion, and one of the main centres of manufacture in the Southern Hemisphere.
| The following is a summary of the statistics of the chief lakes of New Zealand:— | |||||||
|---|---|---|---|---|---|---|---|
| Lake. | Length, in Miles. | Greatest Breadth, in Miles. | Area, in Square Miles. | Drainage Area, in Square Miles. | Approximate Volume of Discharge, in Cubic Feet per Second. | Height above Sea-level, in Feet. | Greatest Depth, in Feet. |
| North Island. | |||||||
| Taupo | 25 | 17 | 238 | 995 | 5,000 | 1,211 | 534 |
| Rotorua | 7½ | 6 | 32 | 158 | 420 | 915 | 84 |
| Rotoiti | 10¾ | 2¼ | 14 | 26 | 500 | 913 | 230 |
| Tarawera | 6½ | 6½ | 15 | 75 | .. | 1,032 | 285 |
| Waikaremoana | 12 | 6¼ | 21 | 128 | 772 | 2,015 | 846 |
| Wairarapa | 10 | 4 | 27 | 1,250 | .. | .. | .. |
| South Island. | |||||||
| Rotoiti | 5 | 2 | 2¾ | 86 | .. | 1,997 | 228 |
| Rotoroa | 7 | 2½ | 8 | 146 | .. | 1,470 | .. |
| Brunner | 5 | 4 | 16 | 145 | .. | 280 | 357 |
| Kanieri | 5 | 1¾ | 8 | 11 | .. | 422 | 646 |
| Coleridge | 11 | 3 | 18 | 70 | .. | 1,667 | 680 |
| Tekapo | 12 | 4 | 32 | 580 | 5,000 | 2,323 | .. |
| Pukaki | 10 | 5 | 31 | 515 | 6,000 | 1,588 | .. |
| Ohau | 10 | 3 | 23 | 424 | 5,000 | 1,720 | .. |
| Hawea | 20 | 5 | 48 | 518 | 5,700 | 1,062 | .. |
| Wanaka | 30 | 4 | 75 | 960 | .. | 922 | .. |
| Wakatipu | 52 | 3 | 112 | 1,162 | 13,000 | 1,016 | 1,242 |
| Te Anau | 33 | 6 | 132 | 1,320 | 12,660 | 694 | 906 |
| Manapouri | 12 | 6 | 56 | 416 | .. | 596 | 1,458 |
| Monowai | 12 | 1 | 12 | 51 | 700 | 600 | .. |
| Hauroko | 20 | 3 | 25 | 195 | 1,800 | 611 | .. |
| Poteriteri | 17 | 2 | 17 | 162 | .. | 96 | .. |
| Waihola | 4½ | 1 1/8 | 3⅓ | 2,200 | .. | (Tidal) | .. |
| Ellesmere | 16 | 10 | 107½ | 745 | .. | (Tidal) | .. |
Table of Contents
DATES OKSOME OFTHE PRINCIPAL EVENTS INTHE HISTORY OF NEW ZEALAND.
1642. Dec. 13. Discovery of New Zealand by Abel Jansen Tasman.
1769. Oct. 8. Captain Cook landed at Poverty Bay on his first visit.
1788. June 30. Macaulay and Curtis Islands, of the Kermadec Group, discovered by Captain Sever, of H.M. transport “Lady Penrhyn.”
Sept. 19. Discovery of the Bounty Islands by Captain Blyth, in the “Bounty.”
1791. Nov. 23. Snares Islands discovered by Vancouver, in the “Discovery.”
Nov. 29. Chatham Islands discovered by Lieutenant Broughton, in H.M.S. “Chatham.”
1792. Dec. 1. First sealing gang left on New Zealand coast—at Dusky Sound.
1793. Feb. 25. Malaspina's expedition visited Doubtful Sound.
Nov. 17. Captain d'Entrecasteaux, with the “La Recherche" and “L'Espérance,” discovered Raoul or Sunday Island. (The latter name was given by Captain Raven, of the transport “Britannia,” who visited the island 6th Nov., 1796.)
Nov. Lieutenant-Governor King's (of Norfolk Island) visit to Doubtless Bay.
1795. Oct. 27. The ship “Endeavour,” Captain Bampton, sunk at Facile Harbour, Dusky Sound.
1800. March 3. Antipodes Island discovered by Captain Waterhouse, on board H.M.S. “Reliance.”
1806. Aug. 18. Auckland Isles discovered by Captain Bristow, ship “Ocean,” one of Enderby's whalers.
Ship “Venus” visited East Coast of New Zealand. She was taken by convicts at Port Dalrymple, Tasmania. Their visits gave rise to the Nga-Puhi southern expedition.
1807. .. Defeat of Hongi and Nga-Puhi Tribe at Moremonui, ten miles south of Maunganui Bluff, Kaipara.
1809. .. The taking and burning of the transport “Boyd" at Whangaroa.
1810. .. Campbell and Macquarie Islands discovered by Captain F. Haselburg, of brig “Perseverance.”
1814. .. First arrival of the Rev. Mr. Marsden at Bay of Islands, and introduction of Christianity. Horses, oxen, sheep, and poultry first brought to New Zealand.
1815. Aug. Attempted capture of the “Trial" and “Brothers" at Kennedy Bay.
1818. .. Hongi's and Te Morenga's groat expedition to East Cape.
1819-20. .. Patuone, Nene, and Te Rauparaha's raid on Taranaki and Port Nicholson.
1820. .. Hongi visited England; returned to New Zealand July, 1821.
Rev. S. Marsden travelled from Waitemata, via Kaipara, to the Bay of Islands—the first white man to do so.
1820. May. Bellingshausen called at Queen Charlotte's Sound with a Russian Antarctic Expedition.
Aug. The “Prince Regent" entered Auckland Harbour—the first vessel to do so.
1821. Nov. Fall of Mauinaina Pa, Auckland Isthmus, to Hongi.
Nov. Ngati-Toa migration from Kawhia to Otaki under Te Rauparaha.
Dec. Fall of Te Totara Pa, Thames, to Hongi.
1822. May. Fall of Matakitaki Pa, Waikato, to Hongi.
1823. May. Fall of Mokoia Pa, Rotorua Lake, to Hongi.
1823-28. .. Acts passed by the Imperial Parliament extending the jurisdiction of the Courts of justice in New South Wales to all the British subjects in New Zealand.
1824. .. Fall of Te Whetumatarau Pa, near East Cape, to Pomare.
1825. .. First attempt at colonization by an expedition under the command of Captain Herd, who bought two islands in the Hauraki Gulf.
Feb. Great defeat of Ngati Whatua at Te Ikaaranganui, Kaipara, by Hongi.
1827. .. Destruction of mission-station at Whangaroa by Hongi's forces.
Feb. Admiral (then Captain) Dumont D'Urville anchored in Auckland Harbour.
1828. .. Hongi died at Whangaroa, from wounds received at Hokianga.
The “Maquarie,” Captain Kent, the first vessel to enter Kawhia.
1829. March. Brig “Hawes" captured at Whakatane by Maoris.
1830. .. Battle of Taumata-wiwi, near Cambridge.
Fall of Kaiapohia Pa, Canterbury, to Te Rauparaha.
March6. Battle of Kororareka, between two Nga-Puhi Tribes.
Dec. Death of Tama-i-hara-nui at the hands of Te Rauparaha's people. He was brought from Port Cooper by Captain Steward, brig “Elizabeth.”
1831. .. Tory Channel whaling-station established.
Application of thirteen chiefs for the protection of King William the Fourth.
Dec. Pukerangiora Pa, Waitara, fell to Waikato.
1832. Feb. Repulse of Waikato at Nga-motu Pa, under Dicky Barrett.
1833. .. Mr. Busby appointed British Resident, to live at the Bay of Islands.
1834. .. Battle of Haowhenua and Pakakutu, near Otaki.
Bishop Williams's first visit to East Cape.
April29. “Harriet" wrecked at Cape Egmont.
Oct. 1. H.M.S. “Alligator" shelled and took Waimate Pa, near Opunake. First occasion of H.M. troops being employed in New Zealand.
1835. .. Declaration of independence of the whole of New Zealand as one nation, with the title of “The United Tribes of New Zealand.”
Nov. and Dec. Ngati-Awa Tribes migrated to and conquered the Chatham Islands.
1836. March 28. Maketu Pa, Bay of Plenty, fell to Waikato.
May9. Te Tumu Pa, Bay of Plenty, fell to Te Arawa.
Aug. 5. Battle at Matai-puku, Rotorua—Waikato beat Te Arawa.
Oct. Siege of Toka-a-kuku, Te Kaha, Bay of Plenty.
1838. .. The Roman Catholic Bishop Pompallier, with several priests, arrived at Hokianga.
Sept. 1. H.M.S. “Pelorus" discovers Pelorus Sound.
1839. April. Taking of the French whaler “Jean Bart" at Chatham-Islands by Maoris.
May12. Departure of the preliminary expedition of the New Zealand Company from England.
June. Issue of Letters Patent authorizing the Governor of New South Wales to include within the limits of that colony any territory that might be acquired in sovereignty by Her Majesty in New Zealand.
Sept. 16. First body of New Zealand Company's emigrants sailed from Gravesend.
Sept. 20. Arrival in Port Nicholson of the preliminary expedition of the New Zealand Company under Colonel Wakefield.
Oct. 16. Battle of Te Kuititanga, Otaki.
1840. Jan. 20. First steamer arrived in New Zealand.
Jan. 22. Arrival of first body of New Zealand Company's immigrants at Port Nicholson.
Jan. 29. Captain Hobson, R.N., arrived at the Bay of Islands. On the following day (Jan. 30) he hoisted the Union flag, and read the commission, under the Great Seal of the United Kingdom, which extended the boundaries of the Colony of New South Wales so as to embrace and comprehend the Islands of New Zealand; also his own commission as Lieutenant-Governor over territory that might be acquired in sovereignty.
Feb. 6. Treaty of Waitangi signed.
May21. Date of Proclamations of sovereignty over the Islands of New Zealand.
June17. The Queen's sovereignty over the South Island formally proclaimed at Cloudy Bay, by Major Bunbury, H.M. 80th Regiment, and Captain Nias, R.N.
Aug. 11. The British flag hoisted at Akaroa by Captain Stanley, R.N., and British authority exercised for the first time in the South Island by the holding of a Court. The French frigate “L'Aube” arrived there on the 13th August, and the vessel “Comte de Paris,” with fifty-seven immigrants, on the 16th August, in order to establish a French colony.
Sept. 18. The British flag hoisted at Auckland. The Lieutenant-Governor's residence established there.
Formation of Wanganui settlement under the name of “Petre.”
1841. Feb. 12. Issue of charter of incorporation to the New Zealand Company.
Mar. 31. Arrival of first New Plymouth settlers.
May3. New Zealand proclaimed to be independent of New South Wales.
Oct. Selection of site for settlement at Nelson.
1842. Feb. 1. Settlement founded at Nelson.
May29. Arrival of Bishop Selwyn in New Zealand.
Sept. 10. Death of Governor Hobson.
1843. June. Affray with Natives at the Wairau, and massacre by Rangihaeata of Captain Wakefield, R.N., agent at Nelson of the New Zealand Company, and others, who had surrendered.
1844. July 8. The Royal flagstaff at Kororareka cut down by Heke.
1845. March 10. Attack on and destruction of Town of Kororareka by Hoke.
Nov. 14. Arrival of Captain Grey, as Lieutenant-Governor of New Zealand, from South Australia.
1846. Jan. 11. Capture of pa at Ruapekapeka, Bay of Islands, and termination of Heke's war.
March3. Commencement of Native hostilities in the Hutt Valley, near Wellington.
May16. Attack by Natives on a military outpost in the Hutt Valley.
July23. Capture of Te Rauparaha at Porirua, near Wellington. He was detained for a year as a prisoner on board a ship of war.
Aug. Hostile Natives, under Te Rangihaeata, expelled from Matai taua Pa at Paua taha nui, and retire up the coast.
Aug. 28. The New Zealand Government Act passed by the Imperial Parliament, under which a charter was issued dividing New Zealand into two provinces, New Munster and New Ulster, and granting representative institutions.
1847. May 10. Attack by Natives on settlement of Wanganui.
1848. Jan. 1. Captain Grey sworn in as Governor-in-Chief over the Islands of New Zealand, also as Governor of the Province of New Ulster and Governor of the Province of New Munster.
Jan. 3. Major-General Pitt appointed by Governor Grey to be Lieutenant-Governor of the Province of New Ulster.
Jan. 28. Assumption by Lieutenant-Governor E. J. Eyre, at Wellington, of the administration of the Government of the Province of New Munster.
Feb. 21. Peace ratified at Wanganui.
March7. Suspension by Imperial statute of that part of the New Zealand Government Act which had conferred representative institutions.
March. Otago founded by a Scotch company under the auspices of the Free Church of Scotland.
Oct. Severe earthquake at Wellington.
1850. July. Surrender of the New Zealand Company's charter, all its interests reverting to the Imperial Government.
Dec. Canterbury founded by the Canterbury Association in connection with the Church of England.
1851. Jan. 8. Death of Major-General Pitt, Lieutenant-Governor of the Province of New Ulster.
April14. Lieutenant-Colonel Wynyard appointed Lieutenant-Governor of the Province of New Ulster.
1852. .. Discovery of gold at Coromandel by Mr. Charles Ring.
June30. The Constitution Act passed by the Imperial Parliament, granting representative institutions to New Zealand, and subdividing it into six provinces — Auckland Taranaki, Wellington, Nelson, Canterbury, and Otago.
1853. Jan. Promulgation of the Constitution Act.
March7. Assumption by Sir George Grey, K.C.B., of the duties of Governor of New Zealand, in terms of the appointment after the passing of the New Zealand Constitution Act, and cessation of the duties of the Lieutenant-Governors of New Ulster and New Munster.
Dec. 31. Departure of Governor Sir George Grey.
1854. Jan. 3. Lieutenant-Colonel Wynyard assumed the administration of the Government.
May27. Opening at Auckland of the first session of the General Assembly by Lieutenant-Colonel Wynyard, Administrator of the Government.
1855. Jan. Very severe earthquake on each side of Cook Strait.
Nov. 12. First members elected to House of Representatives under system of Responsible Government.
1856. May 7. Appointment of the first Ministry under the system of Responsible Government, under Mr. Sewell, Colonial Secretary.
May14. Defeat of Mr. Sewell's Ministry.
May20. Appointment of a Ministry under presidency of Mr. W. Fox, as Attorney-General.
May28. Defeat of Mr. Fox's Ministry, by a majority of one, on a direct vote of want of confidence.
June2. Appointment of a Ministry under the presidency of Mr. E. W. Stafford.
1857. .. First payable goldfield in New Zealand opened at Collingwood, in the Nelson Province.
1858. Aug. 21. New Provinces Act passed.
Nov. 1. Establishment of the Province of Hawke's Bay.
Dec. 22. The Austrian exploring frigate “Novara" arrived in Auckland Harbour. Dr. Ferdinand von Hochstetter, at the request of the New Zealand Government, was commissioned to make geological surveys of the greater part of Auckland and Nelson Provinces.
1859. March. Te Teira offered land at Waitara for sale to the Government.
Nov. 1. Establishment of the Province of Marlborough.
1860. March. Commencement of hostilities against Wiremu Kingi te Rangitake at Waitara.
March18. Capture of Maori pa at Waitara.
March28. Engagement at Waireka.
June27. Engagement of Puketakauere at Waitara.
Nov. 6. Defeat at Mahoetahi, with heavy loss, of a force of Waikato Natives, who had crossed the Waitara River to join Wiremu Kingi.
Dec. 31. Capture of the Matarikoriko Pa, and defeat of a large body of Waikato Natives.
1861. Jan. 23. The Natives made a determined attack on the redoubt at Huirangi occupied by Imperial troops, and were repulsed with heavy loss.
April1. Establishment of Province of Southland.
May21. A truce agreed to.
May. Discovery of gold at Gabriel's Gully, Otago.
July5. Defeat of Mr. Stafford's Ministry, by a majority of one on a vote of want of confidence.
July12. Appointment of a Ministry under the premiership of Mr. Fox.
July29. Incorporation of the Bank of New Zealand.
Sept. 26. Arrival of Sir George Grey, K.C.B., at Auckland, from Cape Colony, to succeed Governor Gore Browne. Sir George Grey was sworn in as Governor on the 3rd October.
1862. June 28. Coromandel proclaimed a goldfield.
June29. Wreck of s.s. “White Swan" on East Coast (with loss of many public records, in transit from Auckland).
July28. Defeat of Mr. Fox's Ministry by the casting-vote of the Speaker, on a proposed resolution in favour of placing the ordinary conduct of Native affairs under the administration of the Responsible Ministers.
Aug. 6. Appointment of a Ministry under the leadership of Mr. Alfred Domett.
1863. Feb. 7. Wreck of H.M.S. “Orpheus" on Manukau Bar; 181 lives lost.
Feb. 26. Definite relinquishment by the Imperial Government of control over administration of Native affairs.
1863. May Treacherous assault near Tataraimaka by Natives on a military escort. Murder of Lieutenant Tragett, Dr. Hope, and five soldiers of the 57th Regiment.
June4. Defeat of Natives at Katikara, by a force under Lieut.- General Cameron.
July17. Action at Koheroa, in the Auckland Province. Commencement of the Waikato War.
Oat. 27. Resignation of the Domett Ministry, in consequence of difficulties experienced in connection with arrangements for finding a fitting representative of the Government in the Legislative Council.
Oct. 30. Appointment of the Ministry formed by Mr. Fox, under the premiership of Mr. F. Whitaker.
Nov. Acceptance by the General Assembly of colonial responsibility in Native affairs.
Nov. 20. Battle of Rangiriri. Defeat of Natives and unconditional surrender of 183.
Dec. 1. The first railway in New Zealand opened for traffic by Mr. Samuel Bealey, Superintendent of Canterbury. The line was from Christchurch to Ferrymead Junction.
Dec. 3. The New Zealand Settlements Act passed, giving the Governor power to confiscate the lands of insurgent Natives.
Dec. 8. Occupation of Ngaruawahia. The British flag hoisted on the Maori king's flagstaff.
1864. Feb. 11. Engagement with Natives on Mangapiko River. Major (then Captain) Heaphy, of the New Zealand Forces, won the Victoria Cross for distinguished bravery on this occasion.
Feb. 22. Defeat of Natives at Rangiaohia.
April2. Attack on and capture of pa at Orakau, Waikato.
April21. Engagement near Maketu, Bay of Plenty. Tribes of the Rawhiti defeated by Arawa Natives, under Captain McDonnell.
April29. Assault on Gate Pa, Tauranga, Bay of Plenty, and repulse of large British force by the Maoris. The pa was abandoned by the Natives during the following night.
April30. Repulse of attack by rebel Hauhau Natives on redoubt at Sentry Hill, Taranaki.
May14. Battle of Moutoa, an island in the Wanganui River, between friendly and rebel Hauhau Natives. Complete defeat of rebels.
June21. Engagement at Te Ranga, near Tauranga, by Lieut.-Colonel Greer, 68th Regiment. Severe defeat of the Natives.
Discovery of gold on the west coast of the South Island.
Oct. 3. Wellington chosen as the seat of Government.
Nov. 24. Appointment of a Ministry under the premiership of Mr. F. A. Weld, the Whitaker-Fox Ministry having resigned during the recess.
Dec. 17. Confiscation of Native lands in Waikato by Sir George Grey.
1865. Feb. Removal of the seat of Government to Wellington.
March2. Barbarous murder of the Rev. Mr. Volkner, a Church of England missionary, at Opotiki, by Hauhau fanatics, under Kereopa.
June8. Submission of the Maori Chief Wiremu Tamihana te Waharoa (William Thompson).
June17. Murder of Mr. Fulloon, a Government officer, and his companions, at Whakatane, by Hauhau fanatics.
1865. July 22. Capture of the Wereroa Pa, near Wanganui.
Aug. 2. Assault and capture of the Pa Kairomiromi, at Waiapu, by Colonial Forces under Captain Fraser, and Native Contingent under the chief Te Mokena. Eighty-seven rebels killed.
Sept. 2. Proclamation of peace issued by Governor Sir George Grey, announcing that the war, which commenced at Oakura, was at an end.
Sept. 30. Murder by Hauhaus, at Kakaramea, of Mr. Broughton, when sent as friendly messenger to them by Brigadier-General Waddy.
Oct. 12. Resignation of Mr. Weld's Ministry, on account of a resolution adverse to the Government policy, having been defeated only by the casting-vote of the Speaker.
Oct. 16. Appointment of a Ministry under the premiership of Mr. E. W. Stafford.
Dec. 25. Defeat of rebel Natives at Wairoa, Hawke's Bay, by Colonial Forces and Native Contingent.
1866. Jan. 4. Defeat of Natives at Okotuku Pa, on the west coast of the North Island, by force under Major-General Chute.
Jan. 7. Assault on and capture of Putahi Pa, by force under Major-General Chute.
Jan. 13. Assault on and capture of Otapawa Pa, by force under Major-General Chute.
Jan. 17-25. Period of Major-General Chute's march through the bush to New Plymouth.
March29. Submission of the rebel chiefs Te Heuheu and Here-kiekie, of Taupo district.
June15. Commencement of Panama steam mail-service.
Aug. 26. The Cook Strait submarine telegraph cable laid.
Oct. 2. Engagement with rebel Natives at Pungarehu, West Coast, by Colonial Forces, under Major McDonnell.
Oct. 8. First Act passed to impose stamp duties.
Oct. 12. Defeats of rebel Natives at Omarunui and at Petane, Hawke's Bay, by Colonial Forces.
1867. July. Opening of Thames Goldfield.
Oct. 10. An Act passed to establish an institute for the promotion of science and art.
Oct. 10. An Act passed for the division of New Zealand into four Maori electorates, and the admission of four Maori members to the House of Representatives.
1869. Jan. Establishment of the Province of Westland.
July4. Seizure by Maori prisoners, under the leadership of Te Kooti, of the schooner “Rifleman,” and their escape from the Chatham Islands.
July12. Night attack by Natives on redoubt at Turuturu Mokai. Sub-Inspector Ross and seven Europeans killed. Natives driven off by the arrival of a force under Major Von Tempsky.
Aug. 8. Pursuit by Lieut.-Colonel Whitmore of escaped Chatham Island prisoners, and indecisive engagement in the gorge of the Ruake Ture.
Aug. 21. Attack on Ngutu-o-te-Manu by force under Lieut.-Colonel McDonnell. Defeat of Natives; four Europeans killed and eight wounded.
Sept. 7. Engagement in bush at Ngutu-o-te-Manu. Major Von Tempsky, Captains Buck and Palmer, Lieutenants Hunter and Hastings, and fourteen men killed.
Oct. 19. Bishop Selwyn left New Zealand.
1868. Nov. 7. Attack on Moturoa and repulse of Colonial Forces, with severe loss.
Nov. 10. Massacre of thirty-two Europeans at Poverty Bay by Te Kooti's band of Natives, who had escaped from the Chatham Islands.
Nov. 24; Dec. 3-5 Engagements between friendly Natives and rebels under Te Kooti, at Patutahi, Poverty Bay district.
1869. Jan. 5. Assault on and capture of Ngatapa Pa, Poverty Bay district, after a siege of six days, by the Colonial Forces of Europeans and friendly Natives under Colonel Whitmore and Major Ropata. Dispersion and pursuit of To Kooti's band. More than 136 rebel Natives were killed.
Feb. 13. Treacherous murder of the Rev. John Whitely and seven other Europeans at the White Cliffs, Taranaki.
Feb. 18. Attack by rebel Natives on a foraging-party at Karaka Flat; one sergeant and six men killed.
March3. Termination of Panama mail-service.
March13. Attack on and defeat of Titokowaru's force at Otauto.
April10. Native pa at Mohaka taken by Te Kooti, who killed forty friendly Natives and several Europeans in the neighbourhood.
April12. First arrival of H.R.H. the Duke of Edinburgh in Wellington, in H.M.S. “Galatea.”
May6. Surprise and capture of Harema Pa at Ahikereru, and Oamaru Teangi Pa, Urewera country. Defeat of Te Kooti.
June13. Surrender to Major Noake and Mr. Booth, R.M., of the chief Tairua, with 122 men, women, and children of the Pakakohe Tribe, near Wanganui.
June24. Defeat of Mr. Stafford's Ministry on a want-of-confidence motion.
June28. Appointment of a Ministry under the premiership of Mr. W. Pox.
Sept. 3. Act passed providing Government life insurance and annuities.
Oct. Seventy-four prisoners from the bands of Te Kooti and Titokowaru sentenced to death, after trial, for treason, but the sentences of seventy three were afterwards commuted to penal servitude for various terms.
Oct. 4. Pourere Pa stormed and taken by Lieut.-Colonel McDonnell, with a mixed force of Europeans and Natives.
1870. Jan. Three hundred friendly Natives under Topia, and three hundred under Major Keepa (known as Kemp), started up the Wanganui River in pursuit of Te Kooti, who retreated into the Urewera country.
Jan. 25. Capture of Tapapa Pa, occupied by Te Kooti.
Feb. 24. The last detachment of the Imperial troops left New Zealand.
March25. Major Keepa, with Native force, captured the position held by Te Kooti at Maraetahi, in Urewera country; nineteen rebels killed and seventy three of Te Kooti's men taken prisoners; but Te Kooti escaped with twenty followers.
March26. Commencement of San Francisco mail-service.
June28. Enunciation in the House of Representatives of the public-works policy by the Colonial Treasurer, Mr. Vogel.
1870. July 9. Bounty Island taken possession of by Captain George Palmer, H.M.S. “Rosario.”
Aug. 27. Arrival in Wellington of H.R.H. the Duke of Edinburgh in H.M.S. “Galatea." Second visit.
Sept. 12. An Act passed to establish the New Zealand University.
Sept. 12. The Land Transfer Act passed, to simplify the title to land and dealings with real estates.
Oct. 6. Southland Province reunited with Otago.
Dec. 5. Honiani to Puni, the chief of the Ngatiawas, a staunch friend of the Europeans, died at Petone, near Wellington, aged ninety years.
1871. March. Commencement of railway - construction under the public-works policy.
Aug. 4. Death of Tamati Waka Nene, the great Ngapuhi chief and friend of the Europeans.
Nov. Capture of the notorious rebel Kereopa, the murderer of the Rev. Mr. Volkner, by the Ngatiporous.
1872. Jan. 5. Execution of Kereopa at Napier.
Jan. Remission of sentences on fifty-eight Native prisoners then undergoing imprisonment for rebellion.
Feb. 22. Visit of William King, the Maori chief of Waitara, to New Plymouth, and resumption of amicable relations with the Europeans.
Sept. 6. Defeat and resignation of Mr. Fox's Ministry.
Sept. 10. Appointment of a Ministry under the premiership of the Hon. E. W. Stafford.
Oct. 4. Defeat of the Stafford Ministry on a vote of want of confidence moved by Mr. Vogel.
Oct. 11. Appointment of a Ministry under the premiership of the Hon. G. M. Waterhouse, M.L.C.
Oct. 11. First appointment of Maori chiefs (two) to be members of the Legislative Council.
Oct. 25. The Public Trust Office Act passed.
1873. Jan. Establishment of the New Zealand Shipping Company.
March3. The Hon. W. Fox appointed Premier on the resignation of that office by the Hon. G. M. Waterhouse, the other members of the Ministry being confirmed in their offices.
April8. Resignation of the premiership by the Hon. W. Fox, on the return of the Hon. J. Vogel, C.M.G., from Australia, and appointment of Mr. Vogel as Premier, the other Ministers being confirmed in their offices.
1874. Aug. 22. The Imprisonment for Debt Abolition Act passed.
31,774 immigrants were introduced this year under the immigration and public-works policy.
1875. Jan. 3. Visit of Sir Donald McLean to the Maori king; resumption of amicable relations.
July6. Resignation of the Ministry, in consequence of the absence of Sir J. Vogel, K.C.M.G., in England, and his being unable to attend the session of Parliament. Re-constitution thereof, under the premiership of the Hon. Dr. Pollen, M.L.C.
July. Establishment of the Union Steam Shipping Company of New Zealand.
18,324 immigrants were introduced this year under the immigration and public-works policy.
Oct. 12. The Abolition of Provinces Act passed.
1876. Feb. 15. Resignation of the Hon. Dr. Pollen's Ministry, and re-constitution under the premiership of Sir J. Vogel, K.C.M.G.
1876. Feb. 18. Completion of the work of laying the telegraph cable between New Zealand and New South Wales.
June. Death of Dr. Isaac Earl Featherston, while acting as Agent-General for New Zealand in England. He was the first to hold that office, and had previously been Superintendent of the Province of Wellington from the time of the first establishment of provincial representative institutions.
Sept. 1. Resignation of Sir J. Vogel's Ministry in view of the appointment of Sir J. Vogel as Agent-General, and formation of a Ministry under the premiership of Major Atkinson.
Sept. 13. Resignation of Major Atkinson's Ministry in consequence of doubts being entertained as to the constitutional position thereof. Reconstruction of the Ministry under the premiership of Major Atkinson.
Nov. 1. The Abolition of Provinces Act, 1875, came into full operation; complete abolition of provincial institutions; New Zealand subdivided into counties and municipal boroughs.
1877. Oct. 8. Defeat of the Atkinson Ministry on a vote of want of confidence moved by Mr. Larnach.
Oct. 15. Appointment of a Ministry under the premiership of Sir George Grey, K.C.B.
Nov. 29. The Education Act, providing for the free and compulsory education of children, passed.
1878. April 11. Bishop Selwyn died, in England.
Oct. 29. Sir George Grey's first land-tax passed.
1879. March. Removal of surveyors from the Waimate Plains by Natives acting under Te Whiti's orders.
May25. The Natives from Parihaka, by order of Te Whiti, began ploughing up lands occupied by Europeans.
June. Arrest and imprisonment of 180 of these Natives for causing disturbances.
July29. Defeat of the Grey Ministry on an amendment to the Address in Reply, moved by Sir William Fox, followed by a dissolution of Parliament.
Oct. 3. Defeat and subsequent resignation of Sir George Grey's Ministry.
Oct. 8. Appointment of a Ministry under the premiership of the Hon. John Hall.
Dec. 19. An Act passed to assess property for the purpose of taxation.
Dec. 19. The Triennial Parliament Act passed.
Dec. 19. An Act passed to qualify every resident male of twenty-one years of age and upwards to vote.
1880. June. First portion of the Parihaka Maori prisoners released by the Government.
Oct. Release of the last portion of the Parihaka Maori prisoners.
Oct. 26. Sir Francis Dillon Bell appointed Agent-General.
1881. April 29. “Tararua,” steamer, wrecked; 130 lives lost.
June26. Severe earthquakes in Wellington.
Nov. 5. March of force of Constabulary and Volunteers on Parihaka, and arrest of Te Whiti and Tohu, without bloodshed.
1882. Feb. 15. First shipment of frozen meat made from Port Chalmers. (See Year-book, 1893, p. 192.)
April21. Resignation (during the recess) of the Hon. J. Hall's Ministry, and its reconstruction under the premiership of the Hon. F. Whitaker, M.L.C.
1883. Jan. 26. A direct line of steam-communication between England and New Zealand inaugurated by the New Zealand Shipping Company.
Feb. 13. Proclamation of amnesty to Maori political offenders.
Feb. 19. Liberation of Te Whiti and Tohu.
Sept. 25. Resignation of the office of Premier and his seat in the Ministry by the Hon. P. Whitaker, and the appointment of the Hon. Major H. A. Atkinson to be Premier, the members of Mr. Whitaker's Ministry being confirmed in their offices.
1884. June 11. Defeat of Major Atkinson's Government.
Aug. 16. Resignation of Major Atkinson's Ministry in consequenoe of the result of the general election and formation of a Ministry under the premiership of Mr. Robert Stout.
Aug. 20. Defeat of Mr. Stout's Ministry by an amendment, expressive of want of confidence, to the Address in Reply being carried.
Aug. 28. Appointment of a Ministry under the premiership of Major Atkinson.
Aug. 29. Defeat of Major Atkinson's Ministry on a vote of want of confidence.
Sept. 3. Appointment of a Ministry under the premiership of Mr. Robert Stout.
Nov. 8. An Act passed to enable certain loans of the New Zealand Government to be converted into inscribed stock and the accrued sinking funds released.
1885. Aug. 1. The New Zealand Industrial Exhibition opened at Wellington.
1886. June 10. Volcanic eruptions at Tarawera, and destruction of the famed Pink and White Terraces; 101 lives lost.
1887. May 28. Defeat of Sir Robert Stout's Ministry.
July21. A Proclamation issued declaring the Kermadec Islands to be annexed to and form part of New Zealand.
Aug. 17. Kermadec Group annexed to New Zealand; flag hoisted and proclamation read at Sunday Island.
Oct. 8. Appointment of a Ministry under the premiership of Major H. A. Atkinson, Sir Robert Stout's Ministry having resigned in consequence of the result of the election.
Dec. 19. An Act passed to reduce the number of members of the House of Representatives, after the expiration of the General Assembly then sitting, to seventy-four, including four Maori representatives.
Dec. 23. The Australian Naval Defence Act, being an Act to provide for the establishment of an additional naval force on the Australian Station, at the joint charge of the Imperial and the several Colonial Governments, was passed by the New Zealand Legislature.
1888. Oct. 27. Formal Proclamation of British Protectorate of Cook Group of Islands, by Captain Bourke, R.N., of H.M.S. “Hyacinth.”
1889. Sept. 2. Electors prohibited by statute from voting in respect of more than one electorate at any election for the House of Representatives.
Nov. 26. Opening of South Seas Exhibition, Dunedin.
1890. Dec. 5. First election of members of the House of Representatives under a practical manhood suffrage, and on the one-man-one-vote principle.
Aug. to Nov. Great maritime strike.
1891. Jan. 24. Resignation (during the recess) of the Hon. Sir H. A. Atkinson's Ministry and appointment of a Ministry under the premiership of the Hon. John Ballance.
April22. Proclamation by Governor of New Zealand to inhabitants at Rarotonga of appointment of British Resident for the Protectorate of the Cook Islands.
May25. Adhesion of Australia to Postal Union.
Aug. 29. Passing of Truck Act, to prohibit payment of wages in goods or otherwise than in money.
Sept. 8. Passing of Land and Income Assessment Act for purposes of taxation, and repeal of property-tax.
Sept. 21. Passing of an Act for supervising and regulating factories and workrooms. [Repealed by Act of 1894.]
1892. June 28. Death of Sir H. A. Atkinson, K.C.M.G., Speaker of the Legislative Council, and previously four times Premier.
Oct. 1. Passing of Contractors' and Workmen's Lien Act.
Oct. 8. Passing of Dairy Industry Act. [Repealed by Act of 1894.]
Oct. 8. Land for Settlements Act, 1892, authorizing purchase of lands from individuals for purposes of subdivision. [Repealed by Act of 1894. See post.]
Oct. 11. Land Act, 1892: Lease in perpetuity without revaluation system introduced; occupation with right of purchase; optional method of selection; small-farms associations.
1893. April 19. Cheviot Estate taken over by Government under the Land and Income Assessment Act.
April27. Death of Hon. John Ballance, Premier of New Zealand.
May1. Resignation of the Ministry in consequence of the death of the Hon. John Ballance, and appointment of a new Ministry under the premiership of the Hon. R. J. Seddon.
June23. Death of Sir William Fox, K.C.M.G., four times Premier of New Zealand.
Sept. 2. Passing of Bank-note Issue Act, to make bank-notes a first charge on assets and to enable the Government to declare them to be a legal tender, &c.
Sept. 19. The Electoral Act, 1893, extending franchise to women.
Oct. 2. Alcoholic Liquors Sale Control Act passed. New licenses to be granted subject to the votes of the electors; reduction or abolition of licenses if desired.
Oct. 6. Passing of Criminal Code Act, 1893.
Oct. 6. Passing of Workmen's Wages Act, 1893.
Oct. 6. Native Land Purchase and Acquisition Act.
Nov. 28. A general election took place, being the first occasion on which women exercised the franchise.
1894. June 30. Bank of New Zealand Share Guarantee Act, 1894, to guarantee special issue of shares to amount of £2,000,000, and purchase of Assets Estates Company by Assets Board. [Amended on July 20.]
Aug. 31. Passing of an Act to encourage the formation of industrial unions and associations, and to facilitate the settlement of industrial disputes by conciliation and arbitration.
Oct. 18. New Zealand Consols Act, 1894.
Oct. 18. Government Advances to Settlers Act, 1894, for relief of settlers burdened by high charges of interest, &c.
Oct. 18. Passing of Land for Settlements Act, 1894, authorizing acquisition of private lands for purposes of settlement, with compulsory powers, and repealing Act of 1892; also Lands Improvement and Native Lands Acquisition Act, 1894.
1894. Oct. 18. Passing of Shops and Shop-assistants Act, 1694, for limiting hours of business in shops.
Oct. 23. Dairy Industry Act, to regulate manufacture of butter and cheese, with inspection and grading for export, and to provide for purity of milk.
Oct. 28. Wreck of s.s. “Wairarapa" at Great Barrier Island; 135 lives lost.
1895. May 27. Government assumed management of the Midland Railway.
Aug. 20. Trustees of cemeteries authorized to provide for cremation of dead.
Sept. 20. Passing of an Act to regulate attachment of wages.
Sept. 20. Family Homes Protection Act, 1895, to secure homes for the people and to prevent them from mortgage or sale for debt.
1896. Jan. 10. Hon. W. P. Reeves appointed Agent-General in London.
March26. Brunner Mine explosion; sixty-seven deaths.
Oct. 16. Land for Settlements Act amended: Special provision made for disposal of highly improved lands acquired; preference given to landless people; Boards may select applicants, &c.
Oct. 17. Alteration of franchise by abolition of non-residential or property qualification.
Oct. 17. Government Valuation of Land Act passed.
1897. July 29. Wreck of s.s. “Tasmania" at Mahia Peninsula; ten lives lost.
Dec. 22. Act to establish at Wellington the Victoria College, in connection with the New Zealand University.
1898. Oct. 15. The Municipal Franchise Reform Act passed.
The Divorce Bill passed both Houses. Her Majesty's assent thereto gazetted 13th April, 1899.
Nov. 1. An Act to provide for old-age pensions passed. Death of Sir George Grey, K.C.B.
1899. March 13. Sir Julius Vogel, K.C.M.G., died.
April. Victoria University College opened in Wellington.
Oct. 19. Act passed constituting Labour Day.
Oct. 21. N.Z. Contingent (the first) consisting of 215 officers and men, left in s.s. “Waiwera" for Algoa Bay to assist the British in the Transvaal war.
1900. Jan. 21. The Second N.Z. Contingent (258 officers and men) left for South Africa in s.s. “Waiwera.”
Feb. 17. The Third N.Z. Contingent (264 officers and men) left for South Africa in s.s. “Knight Templar.”
March24 and 31. The Fourth and Fifth Contingents (1,060 officers and men) left for South Africa in s.ss. “Monowai,” “Gymeric,” “Waimate,” and “Maori.”
Aug. 8. Immigration Restriction Act, 1899, assented to by Her Majesty in Council, came into operation.
Oct. 13. Public Health Act passed.
Oct. 18. The Maori Councils Act passed.
Oct. 20. The Representation Act, 1900, passed, increasing number of European representatives to seventy-six.
1901. Jan. 1. Universal penny postage adopted by New Zealand.
Jan. 28. Accession of King Edward VII proclaimed in New Zealand.
Jan. 30. Sixth N.Z. Contingent (578 officers and men) sailed for South Africa in s.s. “Cornwall.”
Feb. 14. Death (in England) of Sir Edward Stafford, G.C.M.G., formerly three times Premier of New Zealand.
1901. April 6. Seventh N.Z. Contingent (600 officers and men, rough-riders) sailed for South Africa, per s.s. “Gulf of Taranto.”
May22. Deceased Husband's Brother Marriage Act came into operation after Royal assent.
June. 10. Duke and Duchess of Cornwall and York arrived in New Zealand.
June10. Boundaries of New Zealand extended to include Cook and other Pacific Islands.
Nov. 7. State Coal-mines Act passed.
1902. Feb. 1. North Island division of the Eighth N.Z. Contingent sailed from Auckland for South Africa per s.s. “Surrey.”
Feb. 8. South Island division of the Eighth Contingent sailed from Lyttelton per s.s. “Cornwall.”
March12. South Island division of the Ninth N.Z. Contingent sailed from Port Chalmers for South Africa per s.s. “Kent.”
March19. North Island division of the Ninth Contingent sailed from Auckland per s.s. “Devon.”
March24. End of Pacific cable landed in Doubtless Bay, Mangonui.
April14. North Island division of the Tenth N.Z. Contingent sailed from Auckland for South Africa per s.s. “Drayton Grange.”
April14. Right Hon. R. J. Seddon sailed for London to attend Conference of Colonial Premiers, and to represent New Zealand at His Majesty the King's Coronation.
April19. South Island division of the Tenth Contingent sailed for South Africa per s.s. “Norfolk.”
Aug. 9. Celebration in New Zealand on the occasion of the Coronation of His Majesty King Edward VII.
August. Return of N.Z. troopers from South Africa (Eighth Contingent left Durban 5th July; Ninth, 9th July; Tenth, 15th July).
Nov. 9. Wreck of s.s. “Elingamite" on Three King's.
Dec. 8. Pacific (all red) Cable service opened for international business.
1903. May 22. Mahuta Tawhiao Potatau te Wherowhero (formerly known as the Maori King) summoned to the Legislative Council, and sworn in as a member of the Executive Council.
May24. Empire Day proclaimed in New Zealand (anniversary of birth of late Queen Victoria).
Nov. 18. State Fire Insurance Act passed.
Nov. 24. Preferential and Reciprocal Trade Act passed.
1904. July. A team of riflemen, chosen from the Defence Force of New Zealand to represent New Zealand, was sent to England under the command of Lieut.-Colonel R. J. Collins, V.D., to compete at Bisley for the “Kolapore Imperial Challenge Cup,” and succeeded in bringing the trophy to New Zealand.
1905. June 14. Hon. W. P. Reeves appointed first High Commissioner of New Zealand at London.
July29. Old-age Pensions Act, 1905, passed, increasing amount of annual pension to £26.
Oct. 30. Workers' Dwellings Act passed.
1906. June 10. Death of the Right Hon. R. J. Seddon, P.C., Premier of New Zealand.
June21. Resignation of Ministry in consequence of the death of the Right Hon. R. J. Seddon, and appointment of a new Ministry under the Premiership of the Hon. W. Hall-Jones.
1906. Aug. 6. Resignation of Ministry under the Premiership of the Hon. W. Hall-Jones, and appointment of a new Ministry under the Premiership of the Hon. Sir J. G. Ward, K.C.M.G.
Oct. 29. Government Advances to Workers Act passed to assist workers in providing homes for themselves.
Nov. 1. Opening of the New Zealand International Exhibition at Christchurch.
1907. April 15. Opening of Conference of Premiers at London. New Zealand represented by Hon. Sir Joseph Ward, K.C.M.G.
June25. Death of Sir John Hall, K.C.M.G., formerly Premier of New Zealand.
Sept. 26. Style and designation of the “Colony of New Zealand” changed to “Dominion of New Zealand,” by Royal Proclamation of 10th September, 1907.
Oct. 26. Land and Income Assessment Act Amendment passed; graduated land-tax increased.
Nov. 20. Land Laws Amendment Act passed; lease in perpetuity abolished and renewable lease with periodical revaluation established.
Dec. 11. Parliament Buildings destroyed by fire.
1908. Aug. 4. Consolidated Statutes Enactment Act passed.
Aug. 7. First through train Wellington to Auckland.
Aug. 9. American fleet of battleships visited Auckland.
Oct. 6. New Zealand's subsidy to British Navy increased to £100,000 per annum.
Oct. 6. Second Ballot Act passed.
Oct. 10. Industrial Conciliation and Arbitration Amendment Act, 1908, passed. Boards of Conciliation abolished and Councils of Conciliation established.
Dec. 7. Purchase of Wellington-Manawatu Railway by General Government.
1909. Feb. 12. S.S. Penguin wrecked near Wellington. 75 lives lost.
March22. New Zealand Government offers to the British Government at least one (and, if necessary, two) first-class battleships of the readnought or latest types. Offer confirmed by Parliament on 14th June, 1909.
June18. Right Hon. Sir J. G. Ward, Prime Minister, sailed for London to attend Imperial Defence Conference.
Dec. 24. Passing of Defence Act, 1909, introducing system of compulsory military training.
Dec. 24. Land Settlement Finance Ant passed. To assist associations of private buyers in the purchase of freehold lands.
1910. Feb. Visit of Field Marshal Lord Kitchener to report and advise on the defences of the Dominion.
May10. Accession of King George V proclaimed in New Zealand.
Sept. 28. Public Debt Extinction Act passed. To authorize the creation of sinking funds for the extinction of the whole of the New Zealand public debt; in seventy-five years.
Nov. 21. National Provident Fund Act passed. To encourage the making of provision against destitution arising from old age, sickness, widowhood, and orphanage,
Nov. 21. Commercial Trusts Act passed. For the repression of monopolies in trade and commerce.
Dec. 3. Inalienable Life Annuities Act passed. To provide for the creation and issue of inalienable life annuities.
Dec. 3. Workers' Dwellings Act passed. To make better provision for the erection, &c., of workers' dwellings.
1911. March 6. Departure of the Right Hon. Sir J.G. Ward, K.C.M.G., to attend the Imperial Conference and the Coronation of King George.
1911. April 2. General census of New Zealand taken for Sunday night. Population of Dominion, exclusive of Maoris, over one million.
June22. Celebration in New Zealand on the occasion of the Coronation of His Majesty King George V.
July26. Wireless telegraphy installed in New Zealand.
Aug. 26. Armorial bearings of Dominion authorized by Royal warrant.
Oct. 28. Act passed granting pensions to widows, with allowance for each child under fourteen years of age.
Dec. 7. First poll on national prohibition question taken in conjunction with local option poll and general election.
1912. March 23. Foundation-stone of new Parliament Buildings laid.
March28. Resignation of Ward Ministry during recess, and formation of Ministry under leadership of Hon. T. Mackenzie.
May. Beginning of gold-miners' strike at Waihi, leading to disturbances in the town, resulting in the serious wounding of a policeman and the death of a striker.
July10. Resignation of Mackenzie Ministry after defeat on vote of no confidence, and assumption of office by Ministry under leadership of Hon. W. F. Massey.
Aug. 22. Hon. T. Mackenzie appointed High Commissioner as from 23rd August, 1912.
Oct. 26. Amendment passed to Justices of the Peace Act, providing for legal assistance to indigent persons accused of indictable offences.
Nov. 7. Public Service Act passed, placing the Public Service (except Railways Department) under control of a Commissioner.
Nov. 7. Land Laws Amendment Act passed, empowering Crown to subdivide and dispose of European and Native freehold properties on behalf of owners; also authorizing sale of settlement lands in freehold and enabling holders of renewable leases thereof to acquire freehold, besides giving leases-in-perpetuity the right to acquire freehold on more favourable terms.
Nov. 7. Amendment passed to Births and Deaths Registration Act, providing for registration of births and deaths of Maoris.
Nov. 7. Public Revenues Amendment Act passed, setting aside £10,000 per annum as a fund for rebuilding and restoring public buildings destroyed or damaged by fire.
Nov. 7. Amendment passed to Native Land Act, providing that in certain cases a Native may be deemed a European.
Dec. 18. Arrival at Auckland of the Earl of Liverpool, M.V.O., K.C.M.G., Governor of New Zealand.
1913. Feb. 14. Arrival at Oamaru of the Scott Antarctic Expedition with news of the death of Captain R. F. Scott, R.N., and his four companions on their return journey from the South Pole, which they reached on 18th January, 1912, thirty-five days after Amundsen.
Feb. 24. Arrival at Bluff of Dominions Royal Commission, set up to inquire into the question of the trade relations, &c., of the British self-governing Dominions.
April12. Arrival at Wellington of H.M.S. New Zealand, the Dreadnought presented by the Dominion to the Imperial Navy.
Oct. 2. The “Britannia" aeroplane, presented to New Zealand as the first unit of the proposed Imperial Air Fleet, landed at Wellington.
1913. Oct. 18. Wellington shipwrights ceased work, followed next day by a strike of the Wellington Waterside Workers, from which eventuated a series of strikes throughout the Dominion, extending over two months.
Dec. 1. Opening of Auckland Exhibition.
1914. March 29. Explosion during course of a fire at Upper Hutt. Eight lives lost.
May27. Railway accident at Whangamarino, three passengers being killed and a number injured.
June25. Opening of Parliament (fourth session of eighteenth).
Aug. 5. His Excellency the Governor publicly notified that war had been declared between Great Britain and Germany.
Aug. 15. New Zealand Advance Expeditionary Force left Wellington.
Aug. 29. New Zealand Advance Expeditionary Force landed at Apia, Samoa, unopposed.
Sept. 10. Probable date of White Island disaster. Eleven lives lost.
Sept. 12. Huntly coal-mine explosion, whereby 43 lives were lost.
Sept. 26. S.S. Kairaki foundered near Greymouth. Sixteen lives lost.
Oct. 16. New Zealand Main Expeditionary Force left Wellington.
1915 April 25. Australian and New Zealand Infantry effect a landing on Gallipoli.
Aug. 12. National Cabinet formed.
The following list contains the names of some of the principal works dealing with New Zealand, but it does not purport to be a complete list of all the important works on the Dominion. The year of publication is given in each case, and the list is arranged as far as possible in chronological order of issue.
1807. New Zealand. By Dr. Savage. London—J. Murray.
1817. Voyage to New Zealand. By John L. Nicholas. London—Black.
1823. Journal of Ten Months' Residence in New Zealand. By Captain Cruise. London—Longmans.
1830. The New Zealanders (Library of Entertaining Knowledge). London—Chas. Knight.
1832. Nine Months' Residence in New Zealand. By Augustus Earle. London—Longmans.
1836. Two Visits to New Zealand. By Dr. Marshall. London—Nisbet and Co.
1840. Manners and Customs of the New Zealanders. By J. S. Polack. London—Madden and Co.
1843. Travels in New Zealand. By E. Diffenbach. London—Murray.
1855. Te-Ika-a-Maui, or New Zealand and its Inhabitants. By Rev. Richard Taylor. London—Wertheim and Macintosh.
1856. Traditions and Superstitions of the New Zealanders. By Edward Short-land. London—Longmans.
1859. Story of New Zealand. By Dr. Thompson. London—John Murray.
1863. Old New Zealand. By Judge Mailing. Auckland—Creighton and Scales.
1874. Life of Henry Williams. By Hugh Carleton. Auckland—Upton.
1879. Reminiscences of the War in New Zealand. By T. W. Gudgeon. London—Sampson Low.
1879. George Augustus Selwyn. By Rev. H. W. Tucker. London—W. W. Gardner.
1890. Early History of New Zealand. By R. A. Sherrin and J. H. Wallace. (Brett's Historical Series.) Auckland—Brett.
1893. Captain Cook's Journal during his First Voyage round the World. Edited by Captain W. J. L. Wharton. R.N. London—Elliot Stock.
1895. History of New Zealand. By G. W. Rusden. Melbourne—Melville, Mullen, and Slade.
1896. The Art Workmanship of the Maori Race in New Zealand. By Augustus Hamilton. Dunedin—Fergusson and Mitchell.
1896. Journal of Sir Joseph Banks. Edited by Sir Joseph D. Hooker. London—Macmillan and Co.
1898. Abel Janszoon Tasman's Journal of His Discovery of Van Diemen's Land and New Zealand in 1642, &c. By J. E. Heeres. Amsterdam—F. Mueller and Co.
1898. The Long White Cloud, Aotearoa. By W. P. Reeves. London—Horace Marshall and Sons.
1898. New Zealand (Story of the Empire Series). By W. P. Reeves. London—Marshall and Sons.
1900. Old Marlborough. By T. L. Buick, Palmerston North—Hart and Keeling.
1902. State Experiments in Australia and New Zealand. By W. P. Reeves. London—Grant Richards.
1903. Old Manawatu. By T. L. Buick. Palmerston North—Buick and Young.
1905. The Maori Race. By E. Tregear. Wanganui—A. D. Willis.
1905. The Animals of New Zealand. An Account of the Colony's Air-breathing Vertebrates. By Captain F. W. Hutton and James Drummond. Third Edition, 1907. Christchurch—Whitcombe and Tombs (Limited).
1907. The Plants of New Zealand. By R. M. Laing and E. W. Blackwell. Second and Revised Edition. Christchurch—Whitcombe and Tombs (Limited).
1907. Our Feathered Immigrants. Evidence for and against Introduced Birds in New Zealand, together with Notes on Native Avifauna. Illustrated. By J. Drummond. Wellington—Government Printer.
1908. New Zealand. By F. W. Wright and W. P. Reeves. London—Black.
1908. New Zealand. (Romance of Empire Series.) By Reginald Horsley. London—T. C. and E. C. Jack.
1908. Adventures in New Zealand. By E. J. Wakefield. New Edition. Wellington—Whitcombe and Tombs (Limited).
1908. Historical Records of New Zealand. Vol. i (1770–1839). By Robert McNab. Wellington—Government Printer. (Another volume is in preparation.)
1909. New Zealand in Evolution, Industrial, Economic, and Political. By G. H. Scholefield, with an introduction by W. P. Reeves. London—T. F. Unwin.
1909. Murihiku. A History of the South Island of New Zealand and the Islands Adjacent and Lying to the South, from 1642 to 1835. By Robert McNab, Wellington—Whitcombe and Tombs (Limited).
1910. The Maoris of New Zealand. By J. Cowan. Wellington—Whitcombe and Tombs (Limited).
1910. The Geology of New Zealand. By James Park. Christchurch—Whitcombe and Tombs (Limited).
1910. New Zealand Plants and their Story. By L. Cockayne, Ph.D. F.L.S. Wellington—Government Printer.
1911. Hawaiki: The Original Home of the Maori. By S. Percy Smith. 3rd Edition. Christchurch—Whitcombe and Tombs (Limited).
1911. The Course of Prices in New Zealand. By James W. McIlwraith, LL.B., Litt.D. Wellington—Government Printer.
1911. State Socialism in New Zealand. By J. E. Le Rossignol and W. Downie Stewart. London—G. G. Harrop and Co.
1911. New Zealand. By the Hon. Sir Robert Stout, K.C.M.G., LL.D., and J. Logan Stout, LL.B. Cambridge—University Press.
1913. The Lore of the Whare Wananga, 3rd Volume of Memoirs of Polynesian Society. On Maori Religion, Myths. Cosmogony, &c.
1914. The Constitutional History and Law of New Zealand. By J. Hight, Litt.D., and H. D. Bamford, LL.D. Christchurch—Whitcombe and Tombs.
1915. Report on the Cost of Living in New Zealand, 1891–1914. By Malcolm Fraser, Government Statistician. Wellington—Government Printer.
| (c.) LIST OF ARTICLES ON SPECIAL SUBJECTS APPEARING IN PREVIOUS ISSUES OF THE YEAR-BOOK. | ||
|---|---|---|
| Article on | Appeared for the Last or Only Time in Year-book of | |
| Year | Page | |
| Acclimatization | 1894 | 430 |
| Agriculture in New Zealand (by M. Murphy, F.L.S.). | 1912 | 809 |
| Building-stones | 1892 | 194 |
| Chatham Islands, the | 1900 | 531 |
| Cheviot Estate, the | 1895 | 264 |
| Christchurch to West Coast, journey from | 1899 | 548 |
| Coal-deposits of New Zealand, the | 1900 | 479 |
| Cook Islands, the laws of | 1902 | 573 |
| Co-operative system of constructing public works | 1894 | 234 |
| Fauna of New Zealand | 1914 | 957 |
| Exotic trees in Canterbury | 1904 | 569 |
| Forest trees and the timber industry | 1899 | 470 |
| Frozen-meat trade, the | 1894 | 311 |
| Geology of New Zealand | 1914 | 943 |
| Gold-dredging industry, the | 1899 | 509 |
| Government Training-ship “Amokura” | 1913 | 942 |
| Hanmer Thermal Springs | 1905 | 631 |
| Hemp industry, the | 1900 | 477 |
| H.M.S. “New Zealand” | 1913 | 932 |
| Kauri-gum | 1900 | 489 |
| Labour in New Zealand | 1894 | 362 |
| Land- and Income-tax Assessment | 1913 | 884 |
| Laws of England and New Zealand, difference between | 1896 | 281 |
| Maori, ancient, his amusements, games, &c. | 1907 | 707 |
| ” ancient, his clothing | 1908 | 734 |
| ” chant (tangi) | 1907 | 711 |
| ” colour-sense of the | 1905 | 637 |
| ” marriage customs | 1906 | 638 |
| ” mythology | 1900 | 536 |
| ” neolithic, the | 1902 | 578 |
| ” religion | 1901 | 530 |
| ” sociology | 1903 | 641 |
| ” songs | 1908 | 739 |
| Marlborough Sounds, the | 1901 | 517 |
| Midland Railway, the | 1894 | 386 |
| Mineral Waters of New Zealand | 1913 | 896 |
| Moa, heir of the | 1899 | 517 |
| Mount Cook, a night on | 1900 | 525 |
| ” district, the | 1899 | 554 |
| ” its glaciers, and the Hermitage | 1898 | 552 |
| Mount Sefton, ascent of | 1900 | 519 |
| New Zealand Contingents for South Africa | 1900 | 449 |
| ” International Exhibition | 1907 | 701 |
| Otago lakes, the | 1901 | 523 |
| Patents, designs, and trade marks | 1893 | 350 |
| Pumice-stone deposits of New Zealand | 1900 | 486 |
| Railways in New Zealand, their history and progress | 1894 | 377 |
| Rivers of New Zealand | 1914 | 948 |
| Scenic wonderland, a | 1898 | 565 |
| Sheep, crossbreeding of | 1894 | 308 |
| Sheep-farming | 1894 | 302 |
| Shipping Companies— | ||
| New Zealand Shipping Company | 1895 | 392 |
| Shaw, Savill, and Albion Company | 1895 | 393 |
| Union Company of New Zealand | 1895 | 389 |
| Southern Alps, the | 1894 | 474 |
| State farms | 1894 | 243 |
| Sydney Pageant, the | 1901 | 527 |
| Thermal Springs District | 1905 | 614 |
| Timber trees of the world | 1903 | 605 |
| Tokaanu to Raetihi | 1899 | 539 |
| Tree-planting | 1906 | 611 |
| Tuhoeland | 1899 | 546 |
| Varieties of soil | 1892 | 193 |
| Waihi Gold-mining Company | 1897 | 432 |
| Waikato district and through to Wanganui | 1899 | 520 |
| Waiouru to Mangaonoho | 1899 | 543 |
| Wanganui River, up the, to Tokaanu | 1900 | 509 |
| Wattle-growing in the Auckland Provincial District | 1897 | 430 |
| Wellington-Manawatu Railway, the | 1895 | 381 |
| West Coast Sounds, the | 1894 | 472 |
| White Island, a day on | 1906 | 637 |
- Accidental Deaths, 182.
- Accident Insurance, 685.
- Government Office, 687.
- Accidents, Mining, 621.
- Accidents, Railway, 483.
- Acclimatization of Fishes, 600.
- Acreage and Yield of Crops, 561.
- Adenoids, Hospital Cases, 212.
- Adjacent Islands, Population of, 120.
- Administration of Land Laws, 495.
- Advances Board, Members of, 56.
- Advances by Banks, 671.
- Advances to Local Authorities, 639–641.
- Advances to Settlers, 632–636.
- Advances to Workers, 636–639.
- Advertising Office, Official List, 46.
- Afforestation, 595–596.
- Official List, 52.
- After-life time, Average, 193.
- Age, Mean, at Death, 156.
- Age, Mean, at Marriage, 148.
- Agents-General, successive, 29.
- Ages, 109.
- At Death, 156.
- Of Issue left, 165.
- Of Parents, 133.
- Of Persons arrested and convicted, 309.
- Of Persons married, 147.
- Of Prisoners. 320, 323.
- Of Public-school Pupils, 244.
- Aggregations of Land, 507.
- Agricultural College, Lincoln, 262.
- Agriculture and Live-stock, 554–594.
- Agriculture—
- Board of, 559.
- Department of, 557.
- Journal of, 593.
- Members of Board of, 53.
- Official List of Department, 53.
- Aid, State to Settlers and Workers, 632–644.
- To Mining, 622.
- To Water-power, 627.
- Aitutaki, Island of, 842.
- Alcoholic Liquors, Consumption of, 316, 424.
- Alienation of Native Lands, 537.
- Alien Immigrants, 104.
- Aliens, Naturalized, 105.
- Allocation of Public Debt and of Increase, 721.
- Alluvial Gold-mining, 607.
- Anæmia, Deaths from, 180.
- Anglican Church, 32.
- Angora Goats, 591.
- Animals, Domestic, 572–594.
- Antipodes Islands, 841.
- Apiculture, 592.
- Apoplexy, Deaths from, 180.
- Appeal Board. Public Service, 38.
- Members of, 39.
- Appeal Board, Railway Members of, 42.
- Appeal Court, 300.
- Appendicitis, 181, 213.
- Applicants for Crown Land, 496.
- Arbitration Court, 758.
- Area of New Zealand, 1.
- Area under Cultivation, 561.
- Armament of Defence Forces, 296.
- Arrested Persons—
- Birthplaces and Ages, 309.
- Convictions, 308.
- Offences and Ages, 309.
- Now-Zealand-born, 309.
- Offences and Birthplaces, 309.
- Arrests for Drunkenness, 313.
- Arrivals, 98.
- Race Aliens, 104.
- Art and Science, Board of, 46.
- Arteriosclerosis, Deaths from, 180.
- Articles on Special Subjects, 858–969.
- Appearing in Previous Issues, 988–9.
- Assembly, General, 24.
- Asses and Mules, 572.
- Assessment of Land and Income Tax, 711.
- Assets of Banks, 671.
- Assisted Immigrants, 101.
- Assurance of Life, 680.
- Atiu, Island of, 841.
- Auckland Fish-market, 601.
- Auckland Islands, 841.
- Auckland Land District, 522.
- Audit of Expenditure, 692.
- Audit Office, Official List, 46.
- Australasia—
- Birth-rates of, 130.
- Death-rates of, 156.
- Capital Cities, 163.
- Debt of, 731.
- Deposits in Banks of Issue in, 672.
- Friendly Societies in, 821.
- Gold-production of, 609.
- Illegitimacy Rates of, 140.
- Index of Mortality of, 158.
- Live-stock in, 574.
- Marriage-rates of, 145.
- Mineral Production of, 606.
- Oat-crop of, 566.
- Potato-crop of, 568.
- Railway Revenue of, 481.
- Railway Rolling-stock in, 478.
- Savings-banks Deposits in, 678.
- Sheep in, 579.
- Vital Statistics of Capitals, 164.
- Wool shipped from, 582.
- Wheat-crop of, 565.
- Bachelors and Spinsters in Dominion, 146.
- Bacteriological Laboratory, Official List, 48.
- Balance of Trade, 360.
- Balances of Accounts, 706.
- Ballot, Repeal of Second, 334.
- Banking, 668–679.
- Bank-notes, Issue of, 673.
- Tax on, 708.
- Bank of New Zealand, 673.
- Account, 705.
- Bankruptcy, 299.
- Banks of Issue, 668–676.
- Banks, Savings—
- Post-office, 676.
- Private, 678.
- Baptist Union, 33.
- Barley, 567.
- Barmaids, Employment of, 349.
- Battle-cruiser “New Zealand,” 296.
- Beans and Peas, 567.
- Export of, 390, 568.
- Bee-farming, 592.
- Beef consumed and exported, 587.
- Beer, Consumption of, 316, 424.
- Bellingshausen's Visit, 5.
- Bertillon Classification of Causes of Death, 174.
- Bibliography, 986.
- Birthplaces, 107.
- Of Deceased Persons, 159.
- Of Old-age Pensioners, 650.
- Of Persons arrested and convicted, 309.
- Of Prisoners, 320.
- Of Widow Pensioners. 652.
- Births. 124–142.
- Premature, 181.
- Still. 141.
- Blind, Jubilee Institute for, 259.
- Boards. Government, 38–56.
- Bones, Diseases of the, treated in Hospitals, 216.
- Boroughs—
- Finances of, 732
- Population of, 116.
- Rates collected. 734.
- Receipts from Government, 735.
- Value of Land and Improvements, 745, 746, 752–755.
- Boundaries and Area of Dominion, 1.
- Bounty Islands, 841.
- Breeding-ewes, 576.
- Bridegrooms, Occupations of, 150.
- Brides and Grooms—
- Ages of, 147.
- Condition of, 146.
- Mark Signatures of, 150.
- Blight's Disease, Deaths from, 181.
- British Sovereignty, Proclamation of, 8.
- Bronchitis, 180, 212.
- Bronchopneumonia, Deaths from, 180.
- Building Societies, 818.
- Building-stones, 620.
- Bullion, Movement of, 362.
- Bursaries, 282.
- Home Science, 263, 283.
- Bush and Swamp Lands, Settlement of, 506.
- Butter—
- Export of, 389, 406, 589.
- Factories, 589.
- Production and Consumption of, 589.
- Wholesale Prices, 811.
- By-elections, 342.
- Cable, Pacific, 492.
- Cadets, Senior, 293.
- Campbell Island, 841.
- Canadian Trade Commissioner, 30.
- Cancer, 178, 208.
- Canterbury Agricultural College, 262.
- Canterbury Land District 531.
- Capital City, 10.
- Capital of Banks of Issue, 668.
- Capital Value of Land, 744–757.
- Castaways, Depots for, 476.
- Cattle, 585
- Slaughtered for Food, 587.
- Causes of Death, 174–182.
- Causes of Insanity, 230.
- Census, 1911. (See Population.)
- Census and Statistics Office, Official List, 47.
- Cereals, 560–568.
- Cerebral Haemorrhage, Deaths from, 180.
- Character of Stock, 724.
- Charges before Magistrates, 306.
- Charitable Aid, Expenditure on, 224.
- Charitable Institutions, 226.
- Chatham Islands, 840.
- Wireless-station at, 492.
- Cheese—
- Exported, 389, 407, 589.
- Factories, 589.
- Produced and consumed, 589.
- Wholesale Prices, 811.
- Cheviot Estate Account, 701.
- Chief Centres—
- Births and Birth-rates, 129.
- Deaths and Death-rates, 163.
- Infantile Mortality, 170.
- Population, 117.
- Vital Statistics, Comparison with Australian Capitals, 164.
- Childbirth, Deaths in, 181.
- Children born, Sexes of, 132.
- Children to a Marriage, 134.
- Children's Homos, 229.
- Chinese in New Zealand, 105.
- Chlorosis, Deaths from, 180.
- Church of Christ, 34.
- Church of England, 32.
- Cinnabar, 612.
- Circulatory System, Diseases of the, Treated in Hospitals, 213.
- Cirrhosis of Liver, Deaths from, 181.
- Cities—
- Births and Birth-rates, 129.
- Deaths and Death-rates, 163.
- Infantile Mortality, 170.
- Population, 117.
- Vital Statistics, Comparison with Australian Capitals, 164.
- Civil Law Cases, 298.
- Civil Marriages, 151.
- Class-books, School, 241.
- Classification of Lands, 496.
- Classification, Public Service, 38.
- Climate, 72–94.
- General effects of, 84.
- Clover-seeds, 391.
- Coal exported, 391.
- Coal, Retail Prices of, 778.
- Coal-mines Account, 700.
- Coal-mining, 613–616.
- Accidents, 622.
- Coastwise Shipping, 470.
- Cocksfoot, 571.
- Coin-in-slot Telephones, 490.
- Coleridge, Lake, Water-power, 627
- Colleges and University, 281.
- Colonial Office, the, 30.
- Colonies, Crown Agents for, 30.
- Colonization of New Zealand, 5.
- Commerce—
- Customs Revenue and Tariff, 447–465.
- Exports, 368–415.
- Imports, 416–446.
- Total Trade, 354–367.
- Companies, Registered, Capital of, 818.
- Composition of Defence Forces, 291.
- Compulsory Training, 288.
- Conciliation Councils, 758.
- Confinement, Deaths in, 181.
- Congenital Debility, 181.
- Congregational Union, 33.
- Conjugal Condition, 110.
- Of Parties Marrying, 146.
- Of Pensioners, 650.
- Consolidated Fund, 692–697.
- Consols Account, 705.
- Constitution of New Zealand, 9.
- Consuls, Foreign, 30.
- Construction of Railways, Cost of, 479.
- Consumption, 424.
- Of Alcoholic Liquors, 316, 424.
- Of Beef, 587.
- Of Butter and Cheese, 589.
- Of Mutton and Lamb, 578.
- Of Pork, &c., 591.
- Conversion Account, 703.
- Conveyance of Children to School, 240.
- Convictions—
- For Drunkenness, 312.
- In Superior Courts, 311.
- Of Juveniles, 311.
- Of Maoris, 317.
- Of Persons arrested, 308.
- Summary, 306.
- Convulsions, Deaths of Children from, 180.
- Cook and other Pacific Islands, 840–846.
- Population of, 123, 844.
- Trade of, 410, 446, 846.
- Cook Islands Administration Department, Official List, 45.
- Cook's Visits to New Zealand, 4.
- Co-operative Public Works, 762.
- Copper, 612.
- Corn-crops, Acreage and Yield of, 561–567.
- Cost of Living, 765.
- Report of Royal Commission, 790.
- Statistician's Report on, 765.
- Thermometers, 801.
- Council, Executive (1841–56), 13.
- Council, Executive (1915), 23.
- Council, Legislative (1841–53), 15.
- Council, Legislative, 24.
- Officers of, 39.
- Roll of Members, 25.
- Successive Speakers, 21.
- Counties—
- Finances of, 734.
- Population of, 114.
- Receipts from Government, 735.
- Value of Land and Improvements in, 745–751.
- Courts—
- Appeal, 300.
- Arbitration, 758.
- Bankruptcy, 299.
- Divorce, 301.
- Magistrates', 298, 306.
- Native Land, 536.
- Supreme, 299, 311.
- Cow-testing, 586.
- Creameries, 589.
- Crime, Law and, 298–330.
- Criminal Cases before Courts, 306, 311.
- Criminals, Habitual, 323.
- Crops, Principal, 562.
- Crown Agents for the Colonies, 30.
- Crown Lands, 493–535.
- Crown Law Office, Official List, 44.
- Customs Department, Official List, 49.
- Customs Revenue, 451.
- Customs, Taxation through, 450, 710.
- Cystitis, Deaths from, 181.
- Dairy Industry, 585–590.
- Dairy-produce, 588.
- Export of, 588.
- Grading of, 558.
- Retail Prices, 771, 794.
- Danger Island, 842.
- Dates of Maturity of Loans, 725.
- Dates of Principal Events, 970.
- Day Technical Schools, 267.
- Deaf, School for the, 259.
- Death Duties, 713.
- Deaths, 153–182.
- Debility, Congenital, Deaths from, 181.
- Debt of Local Bodies, 740.
- Debt, Public, 718–731.
- Deceased Husband's Brother, Marriage with, 143.
- Deceased Males, Occupations of, 160.
- Deceased Persons. Birthplaces of, 159.
- Deceased Wife's Sister, Marriage with, 143.
- Deeds Registration, 541–548.
- Defence. 288–297.
- Naval Defence Account, 701.
- Official List of Department, 48.
- Denominational Schools, 251.
- Density of Population, 110.
- Dentists, Registration of, 220.
- Departures, 98.
- Deposit Accounts, 701.
- Deposits in Banks, 671, 678.
- Depots for Shipwrecked Mariners. 476.
- Destination of New Zealand Exports, 378.
- Do Surville's Visit, 4.
- Detention, Reformative, 324.
- Development of Export Trade 368.
- Import Trade, 448.
- Diabetes, Deaths from, 180.
- Diamond Drills, 623.
- Diarrhœa, 181, 213.
- Digest of Land Laws, 495–506.
- Diphtheria, Deaths from, 175.
- Diplomas in Public Health, 218.
- Discharged Soldiers' Settlement Act, 1915, 513.
- Discovery of New Zealand, 3.
- Diseases treated in Public Hospitals 205
- Diseases, Various, Deaths from, 174.
- Distribution of Wealth, 821.
- District High Schools, 280.
- Divorce and Separation, 301.
- Domestic Servants granted Reduced Passages, 101.
- Dominion Laboratory, Official List, 46.
- Dominion Museum, Official List, 46.
- Dominion, New Zealand created a, 10.
- Dominion Observatory, Official List, 46.
- Dominion Rifle Association, 297.
- Drainage Boards, Finances of, 734.
- Dredging, Gold-, 608.
- Drags, Sale of, 221.
- Drunkenness, 312.
- Du Fresne's Visit, 4.
- Dunedin Medical School, 228.
- Dunedin Wool Sales, Prices current at, 585.
- Duration of Marriage and Number of Children, 133.
- Dutiable Imports, 456.
- Duties, Customs and Excise, 451–709.
- Duties, Death, 713.
- Dwellings, Workers', 513, 641–644
- Early Progress, 7.
- Early Settlement, 3.
- Ears, Diseases of the, treated in Hospitals, 212.
- Ecclesiastical, 31.
- Education, 236–287.
- Official List of Department, 54.
- Educational Association, Workers', 284.
- Educational Endowments, 513.
- Education Boards—
- List of, showing Secretaries, 54.
- Receipts and Expenditure of, 247.
- Scholarships, 277.
- Egg-production, 591.
- Election, General (1914), 336.
- Electoral, 331–345.
- Official List of Department, 46.
- Electric Telegraph, 488.
- Embolism, Deaths from, 180.
- Emigration, 98.
- Employees, Railway, 482.
- State and Local Bodies, 833.
- Employment Branches of Labour Department, 764.
- Employment of Barmaids, 349.
- Endowments, Educational, 513.
- Endowments, National, 514.
- Account, 704.
- Engineering, School of, 281.
- Enteritis, 181, 213.
- Entrepôt Trade, 365.
- Epidemic General Diseases, 206.
- Epilepsy, Deaths from, 180.
- Equipment of Defence Forces, 296.
- Estate Duty, 713.
- Estates acquired for Settlement, 509.
- Estates passed for Probate, 822.
- Estimated Population, 95.
- Ewes, Breeding, 576.
- Examinations, Annua Education, 285.
- Examiners of Engine-drivers, Board of, 50.
- Examiners under Coal - mines Act, Board of, 45, 624.
- Examiners under Mining Act, Board of, 45, 624.
- Excise Duties, 455.
- Taxation by means of, 709, 710.
- Executive Council (1841–56), 13.
- Executive Council (1915), 23.
- Exophthalmic Goitre, Deaths from, 180.
- Expectation of Life, 193.
- Expeditionary Forces Voting Acts, 334.
- Expenditure, Revenue and, 691–707
- Experimental Farms, 558.
- Exports, 368–415.
- Prohibited, 463.
- Values, 400.
- Exports, Destination of, 379.
- Effect of Prices on, 393.
- For Years ending 30th June, 396.
- External Migration, 98.
- Extinction of Public Debt, 729.
- Eyes, Diseases of the, treated in Hospitals, 211.
- Factories, &c., 629–631.
- Factories, Butter and Cheese, 589.
- Farmers, Reduced Passages for, 101.
- Fathers—
- Ages of, 133.
- Occupations of, 135.
- Fauna, 3.
- Feeble-minded, School for, 260.
- Fibre, Phormium, 392, 569.
- Fifty Years' Progress, 847–857.
- Finance, Department of, 39.
- Finance, Public, 691–731.
- Fire Inquests, 328.
- Fire Insurance, 689.
- First Issue of Marriage, 135.
- First Offenders' Probation, 323.
- Fisheries, 597–604.
- Fish-hatchery, Marine, 598.
- Fishing-boats Licensed, 602.
- Fish-market, Municipal, 601.
- Flax Leases, 505.
- Flocks of Sheep, 577.
- Flora, 3.
- Flotation of Loans, 724.
- Food and Drugs, Sale of, 221.
- Food Groups and Rent, Index Numbers, 779, 799.
- Foreigners Naturalized, 105.
- Foreign Insurance Companies, 690.
- Foreign Nations, Consuls of, 30.
- Forestry Commission (1913), 596.
- Forests Account, State, 700.
- Foundation Scholarships, 277.
- Fractures, Hospital Cases, 217.
- Franchise, 332.
- Free and Dutiable Imports, 456.
- Freeholders, Number of, 552.
- Freehold Tenure, 498.
- Free Secondary Education, 274.
- Free University Education, 282.
- Friendly Societies, 820.
- Official List of Department, 40.
- Frozen Meat exported, 389, 406, 578, 587.
- Fruit Industry, the, 569.
- Fruit-preserving Industries Advances Account, 706.
- Fuel and Light, Retail Prices, 778.
- Gaming and Lotteries, 328.
- Gaols, Prisoners in, 318, 319.
- Gardens and Plantations, Acreage in, 569.
- Gastritis, Deaths from, 180.
- General Assembly, the, 24.
- General Election (1914), 336.
- Genital Organs, Diseases of the, treated in Hospitals, 214.
- Geological Survey Office, Official List, 45.
- Geology of New Zealand, 1.
- Germany, Imports from, 442, 461.
- Gift Duty, 714.
- Goats, Angora, 591.
- Goitre, Exophthalmic, Deaths from, 180.
- Gold, Discovery of, 7.
- Gold-dredging, 608.
- Gold, Export Duty on, 448.
- Gold exported, 391.
- Gold-miners' Relief Fund, 448.
- Gold-mining, 606.
- Goods carried on Railways, 478.
- Government, 9.
- Government Advances—
- To Local Bodies, 640.
- To Settlers, 632.
- To Workers, 636.
- Government Departments and Boards, Official List, 39.
- Government Insurance Office, 883, 687, 689.
- Official List, 55.
- Government Schools, Attendance at, 243.
- Government, Seat of, 10.
- Government Valuation of Land, &c., 743–751.
- Governor of New Zealand, 22.
- Governors, Successive, 11.
- Grading of Dairy-produce, 558.
- Graduated Land-tax, 711.
- Grain exported, 566.
- Grass Lands, Acres of, 571.
- Grass-seed, 391, 571.
- Grazing-runs, Small, 502.
- Greasy Wool exported, 581.
- Greenstone, 619.
- Groceries, Index Numbers, 766, 792.
- Gross Indebtedness, 719.
- Grounds for Divorce, 301.
- Growth of Population, 96.
- Growth of Trade, 354.
- Gum-lands, Settlement of, 505.
- Habitual Criminals, 323.
- Habitual Drunkards, 315.
- Hail, 81.
- Half-castes, 130.
- Hanson's Visit, 5.
- Harbours—
- Finances of Boards, 734.
- Hauraki Plains Settlement Account, 703.
- Hawke's Bay Land District, 523.
- Health, Public, 218–222.
- Official List of Department, 47.
- Heart Disease, Deaths from, 180.
- Hebrew Church, 34.
- Hernia, Hospital Cases, 213.
- Hervey Islands, 842.
- Hides exported, 389.
- High Commissioner's Office, Official List, 46.
- High Commissioners, Successive, 29.
- High Schools, 269–280.
- District, 280.
- Historic and Official Section, 1–56.
- Hobson's Proclamation, 8.
- Holdings, Number of Occupied, 550.
- H.M.S. “New Zealand,” 296.
- H.M.S. “Philomel,” 297.
- Home Produce exported, 370.
- Value affected by Prices, 393.
- Home Science Bursaries, 263, 283.
- Honey, 592.
- Honorary Territorials, 293.
- Honourable, Holders of Title of, 36.
- Honours held, 34.
- Hops, 568.
- Horses, 590.
- Hospitals, 203–217, 222–235.
- Mental, 229.
- Private, 226.
- Public, 203–217, 225.
- St. Helens, 227.
- Hospitals Department, Official List, 47.
- House of Representatives, 26.
- Occupations of Members, 343.
- Official List of Officers, 39.
- Roll of Members, 27.
- Successive Speakers, 21.
- House-rent (1891–1914), 775, 797.
- Illegitimate Births, 135, 139.
- Immigration, 98.
- Assisted, 101.
- Official List of Department, 47.
- Restriction, 104.
- Imperial Trade Correspondents, 30.
- Imports, 416–446.
- According to Rate of Duty, 458.
- Free and Dutiable, 456.
- Improved Farm Settlements, 495.
- Improvement of Land selected. 490.
- Income-tax, 711.
- Official List of Department, 40.
- Payers, 823.
- Increase in Public Debt, 720.
- Increase of Population, 96.
- Indebtedness of Local Bodies, 741.
- Indebtedness, Public, 718–731.
- Index Numbers, Cost of Living, 765.
- Index of Mortality, 158.
- Industrial Conciliation and Arbitration, 758.
- Industrial Disputes dealt with, 758.
- Industrial Life Assurance, 681.
- Industrial Schools, 256.
- Industrial Unions registered, 759.
- Registration of, 758.
- Infantile Mortality, 168.
- Infant Life Protection, 173, 260.
- Infectious Diseases, Notification of, 201.
- Infectious Diseases, Prevention of, 218.
- Influenza, Deaths from, 175.
- Inland Fisheries, 600
- Inquests, 327.
- Fire, 328.
- Insanity, 229.
- Causes of, 230.
- Inspection of Machinery, 832.
- Official List of Department, 49.
- Institute for the Blind, 259.
- Instruction, Public, 239.
- Insurance, 680–690.
- Interest on Debt of Loca Bodies, 741.
- Interest on Public Debt, 726.
- Internal Affairs Office, Official List, 46.
- Intestinal Obstruction, 181, 213.
- Investment Board of Government Insurance Department, 55.
- Investments on Totalizator, 715.
- Tax on, 715.
- Ironsands and Ores, 610.
- Islands, Adjacent, Population of, 120.
- Islands, Outlying, 840–846.
- Issue Born to Marriage, 134.
- Issue of Deceased Males, 166.
- Under 14 Years of Age, 167.
- Under 21 Years of Age, 167.
- Joint-stock Companies, 818.
- Journal of Agriculture, 593.
- Journal, School, 241.
- Jubilee Institute for the Blind, 259.
- Judges, Supreme Court, 22.
- Entitled “Honourable,” 37.
- Justice Department, Official List, 43.
- Juvenile Offenders, 310.
- Kauri-gum, 617.
- Exported, 391.
- Lands, 505.
- Kauri-gum Industry Account, 706.
- Kermadec Islands, 840.
- Labour Department—
- Employment Branches. 724.
- Official List, 50.
- Labour Journal, 791.
- Labour Laws, 758–764.
- Lake Coleridge Works, 627.
- Lamb, Consumption and Export of, 578.
- Land and Income Tax, 711.
- Official List of Department, 40.
- Land Board, a, 495.
- Maori Land Board, 537.
- Land Districts, 496, 522–535.
- Land Drainage Boards, Finances of, 734.
- Land for Settlements, 507.
- Account, 701.
- Official List of Department, 52.
- Land, Government Valuation of, 743–751.
- Land, Grass-sown, 571.
- Land Laws, Digest of, 495–506.
- Land, Occupation and Ownership of, 549–553.
- Land Offices, Principal, 496.
- Land Purchase Commissioners, 507.
- Board of, 52.
- Land Settlement Finance Associations, 510.
- Land-tax, 711.
- Official List of Department, 40.
- Land Tenure and Settlement, 493–553.
- Land Transfer and Deeds Registration, 541–548.
- Official List of Department, 52.
- Land, Valuation of, 743–751.
- Lands and Survey Department, Official List, 51.
- Law and Crime, 298–330.
- Lease in Perpetuity, 500.
- Lease, Renewable, 498.
- Leases, Flax, 505.
- Leases, Transfers, &c., of, 500.
- Legislation of 1914 Sessions, 57–71.
- Legislation, War, 57.
- Legislative Council (1841–53), 15.
- Legislative Council, 24, 334.
- Offices of, 39.
- Prior to Responsible Government, 15.
- Roll of Members, 25.
- Prior to Responsible Government, 15.
- Successive Speakers, 21.
- Legitimate Birth-rates, 131.
- Legitimation Act, 140.
- Letters posted, 486.
- Liabilities of Banks, 670.
- Liability for Military Service, 288.
- Libraries, School, 241.
- Libraries, Subsidies to, 286.
- Licensed Houses, 346.
- Licenses and Local Option, 346–353.
- Licenses, Fishing-boats, 602.
- Licenses, Local Bodies, Revenue from, 735.
- Licenses, Publicans', 346.
- Licensing Laws, 348.
- Breaches of, 312, 348.
- Lieutenant-Governors of Provinces, 12.
- Life Assurance, 680.
- Life, Expectation of, 193.
- Light, Fuel and, Retail Prices, 778.
- Lighthouses, 472.
- Lincoln Agricultural College, 262.
- List, Official, 39–56.
- Liver, Diseases of the, treated in Hospitals, 213.
- Liverpool, Earl of, 22.
- Live-stock and Agriculture, 554–594.
- Live-stock and Meat Inspection, 557.
- Live-stock Prices, 808.
- Living, Cost of, 765.
- Loan Expenditure of Boroughs, 738.
- Loans, Allocation of (1914–15), 721.
- Loans, Dates of Maturity of, 725.
- Loans, Flotation of, 724.
- Loans of Local Bodies, 739.
- Local Bodies, 732–742.
- Account, 701.
- Advances to, 639–641.
- Superannuation, 664.
- Taxation by, 716.
- Local Mills, Wool used at, 581.
- Local Option, 348.
- Local Taxation, 716.
- Lockouts, 761.
- Lotteries, Gaming and, 328.
- Lower Departments of Secondary Schools, 279.
- Lunacy, 229.
- Machinery Inspection, 832.
- Official List of Department, 49.
- Magistrates' Courts—
- Civil Cases, 298.
- Criminal Cases, 306.
- Mail-services with England, Cost of, 488.
- Maize, 567.
- Malaspina's Visit, 5.
- Male and Female Death-rates, 154.
- Malformations, Hospital Cases, 216.
- Manahiki Island, 842.
- Mangaia Island, 841.
- Manganese-ore, 612.
- Mangolds, 568.
- Manual and Technical Education, 261–268.
- Manufactories and Works, 629–631.
- Maori Councils, 536.
- Official List, 42.
- Maori Land Boards, 536.
- Members of, 42.
- Maori Lands, 536–540.
- Maoris, 120.
- Births of, 142.
- Law re Registration, 124.
- Children attending Schools, 253.
- Crime amongst, 317.
- Deaths of, 182.
- Distribution of, 122.
- Half-castes, 120.
- In Mental Hospitals, 232.
- Marriages of, 151.
- Population, 120.
- Representation, 333, 341.
- Schools for, 253.
- Wars with, 7.
- Marine Department, Official List, 48.
- Marine Fish-hatchery, 598.
- Mariners, Shipwrecked, Depots for, 476.
- Mark Signatures of Persons married, 150.
- Marlborough Land District, 528.
- Marriages, 143, 152.
- Marsden's Arrival in New Zealand, 5.
- Maternity Hospitals, 227.
- Maturity of Loans, Dates of, 725.
- Mauke Island, 842.
- Measles, Deaths from, 175.
- Meat, Frozen, Export of, 389, 406, 582.
- Meat, Inspection of, 557.
- Meat, Retail Prices, 773, 795.
- Wholesale Prices, 810.
- Medical Inspection of School Children, 239.
- Medical Practitioners, Registration of, 219.
- Medicine, School of, Dunedin, 228.
- Members of House of Representatives, 27.
- Occupations of, 343.
- Members of Legislative Council, 25.
- Memorabilia, 970.
- Meningitis, Simple, Deaths from, 180.
- Mental Defectives, 229.
- Mental Hospitals, 229–235.
- Official List of Department, 47.
- Metal Mines, Accidents at, 621.
- Meteorology, 72–94.
- Methodist Church, 33.
- Midwives, Registration of, 228.
- Migration—
- External, 98.
- Increase by, 100.
- Military Forces, 288–297.
- Military Pensions, 652–657.
- Military Service, Liability for, 288.
- Milking-machines, 585.
- Mills, Wool used at, 581.
- Minerals, Export of, 605.
- Mines and Minerals, 605–624.
- Mines. Department, Official List, 45.
- Mining, 605–624.
- Mining Act, Board of Examiners under, 624.
- List of Members, 45.
- Mining Advances, 622.
- Account, 705.
- Ministers, Officiating, of each Denomination, 152.
- Marriages by, 151.
- Ministries, Successive, 20.
- Minors, Marriages of, 149.
- Missionaries, Arrival of, 5.
- Mitiaro Island. 842.
- Money-orders issued and paid, 488.
- Money, Purchasing-power of, 785, 799.
- Morbidity, 201–217.
- Mortality, Index of, 158.
- Mortality, Infantile, 168.
- Mortality Investigation, 183–200.
- Mortgages, 544–548.
- Mothers, Ages of, 133.
- In illegitimate Cases, 139.
- Movement of Specie and Bullion, 362.
- Mules, 590.
- Municipal Fish-markets, 601.
- Museum, Official List of Officers, 46.
- Mutton consumed and exported, 578.
- National Endowment Account, 704.
- National Endowments, 514.
- National Ministry, 23.
- National Prohibition, 349.
- Result of Poll, 349.
- National Provident Fund. 665.
- Members of Board, 40.
- National Reserve, the, 294.
- National Restoration, 349.
- National Scholarships, 276.
- Nationalities of Pensioners, 650, 652.
- Nationality of Vessels, 467.
- Native Department, Official List, 42.
- Native Land Act, 1909, 537.
- Marriages under Section 191 (1) (b), 151.
- Native Land Court, 536, 539.
- Official List of, 42.
- Native Land Purchase Board, 538.
- Native Lands, 536–540.
- Native Land Settlement Account, 703.
- Native Property, Value of, 829.
- Natives Reserves Board, Members of, 55.
- Native Schools, 253.
- Natural Increase of Population, 98, 126.
- Naturalization, 105.
- Naval Defence, 296.
- Account, 701.
- Nelson Land District, 528.
- Nephritis, Deaths from, 181.
- Nervous System, Diseases of, treated in Hospitals, 210.
- Net Indebtedness, 719.
- New Munster Province, 9.
- Executive Council. 14.
- Legislative Councils, 17.
- Lieutenant-Governors, 12.
- Newspapers, Registered, 488.
- Posted, 488.
- New Zealand, Bank of, 763.
- New-Zealand-born, Crime amongst, 309.
- New - Zealand - born, Drunkenness amongst, 314.
- New-Zealand-born Prisoners, 320.
- “New Zealand,” H.M.S., 296.
- New Zealand Institute, Official List, 46.
- New Zealand Produce exported, 370.
- New Zealand University, 281.
- New Ulster Province, 9.
- Executive Council, 14.
- Legislative Councils, 17.
- Lieutenant-Governors, 12.
- Niue, Island of, 842.
- Trade of, 846.
- No - license Districts, Voting in, 351, 352.
- Nomination for Reduced Passages, 101.
- Note Issue of Banks, 763.
- Tax on, 708.
- Notification of Births, 124.
- Notification of Infectious Diseases, 201.
- Noxious Weeds, 558.
- Nurses, Registration of, 228.
- Oats, 566.
- Exported, 390, 566.
- Prices, 813.
- Obstruction, Intestinal, 181, 213.
- Occupation of Land, 549–553.
- Occupation with Right of Purchase, 498.
- Occupations—
- Of Bankrupts, 300.
- Of Bridegrooms, 150.
- Of Deceased Males, 160.
- Of Fathers, 135.
- Of M.P.s, 343.
- Offences by Juveniles, 310.
- Offences of Convicted Persons, 309.
- Offences of Prisoners, 320.
- Office, Colonial, 30.
- Officers of Government Departments, 39–56.
- Official List, 39–56.
- Official Section, 1–56.
- Officiating Ministers, 152.
- Old Age, Deaths from, 181, 216.
- Old-age Pensions, 645–650.
- Opening up Crown Lands for Settlement Account, 702.
- Optional System of selecting Land, 497.
- Orchards, 569.
- Organic Heart - disease, Deaths from, 180.
- Organization of Defence Forces, 291.
- Ornamental Stones, 620.
- Orphanages, 229.
- Orphanhood, 165.
- Otago Land District, 533.
- Otekaike Special School, 260.
- Outlying Islands, 840–846.
- Depots for Castaways on, 476.
- Oversea Shipping, 467.
- Ownership of Land, 551.
- Oyster-picking, 599.
- Pacific Cable, 492.
- Palmerston Island, 842.
- Parapara Iron-ore Deposit, 611.
- Parcels-post, 487.
- Parents, Ages of, 133.
- Parliament Buildings, 11.
- Parliamentary Library, Official List, 39.
- Parliament, Members of, 27.
- Parliaments, Successive, 19.
- Passages at Reduced Rates for Immigrants, 101.
- Passengers, Railway, 478.
- Pastoral Runs, 503.
- Patent Office, Official List, 44.
- Patents, Designs, and Trade-marks, 829.
- Patients in Public Hospitals, Ages of, 205.
- Patients in Mental Hospitals, 229.
- Peas and Beans, 567.
- Export of, 390. 568.
- Pelts, Export of, 390.
- Penrhyn Island, 842.
- Pensions, 645–657.
- Department, Official List, 41.
- Military (Maori War), 652.
- Old-age, 645–650.
- War, 653–657.
- Widows', 650.
- Peritonitis, Deaths from, 181.
- Permanent Forces, 291.
- Petroleum, 616.
- “Philomel,” H.M.S., 297.
- Phormium Tenax, 569.
- Fibre exported, 392, 569.
- Grading of, 558.
- Phosphate Rock, 619.
- Phthisis, Deaths from, 176.
- Physical Instruction, 239.
- Pigs, 591.
- Plantations, &c., Acreage in, 569.
- Plumbers Registration Act, 221.
- Board under, 47.
- Plural Births, 132.
- Ages of Parents, 134.
- Pneumonia, 180, 212.
- Police, 304.
- Official List of Department, 45.
- Population, 95–123.
- Pork consumed, 591.
- Portobello Marine Fish-hatchery, 598.
- Ports, Principal, 409, 423, 472.
- Postal and Telegraphic, 484–492.
- Official List of Department, 40.
- Postal Notes, 488.
- Post-office Savings-bank, 676.
- Postponement of rent of Crown Tenants, 500.
- Potatoes, 390, 568.
- Poultry-farming, 591.
- Pounamu, 619.
- Preferential Tariff, 459.
- Premature Births, 181.
- Premiers of Successive Ministries, 20.
- Presbyterian Church, 32.
- Preservation of Scenery Account, 700.
- Previous Issue of Parents, 133.
- Prices, Average Retail (1014), 804.
- Prices, Effect of, on Exports, 393.
- Prices and Wages, 765.
- Prices of Stock, 730.
- Prices of Live-stock, 808.
- Prime Minister's Office, Official List, 39.
- Prime Ministers, Successive, 20.
- Prince, Visit of Professor, 597.
- Principal Exports, 376.
- Principal Events, Dates of, 970.
- Principal Ports, 409, 423, 472.
- Printing and Stationery Department, Official List, 47.
- Prisoners, 318–327.
- New-Zealand-born, 323.
- Tree-planting by, 325.
- Prisons and Prisoners, 318–327.
- Prisons Board, 325.
- Members of, 45.
- Prisons Department, Official List, 44.
- Private Hospitals, 226, 233.
- Private Land, Aggregation of, 507.
- Required for Settlement, 507.
- Private Savings-banks, 678.
- Private Scholarships, 277.
- Private Schools, 251.
- Private Wealth, 821.
- Probate, Estates passed for, 822.
- Probation Act, First Offenders', 323.
- Production, Value of. 829.
- Progress, Early, 7.
- Progress, Fifty years', 847–857.
- Prohibited Exports, 463.
- Prohibition, National, 349.
- Prospecting Drills, 623.
- Protection of Infant Life, 173, 260.
- Provident Fund, National, 665.
- Provincial Districts, Population of, 114.
- Provincial Councils, 14.
- Publican's Licenses, 346.
- Public Debt, 718–731.
- Extinction Fund, 729.
- Sinking Fund Commissioners, 47.
- Public Finance, 691–731.
- Public Heath, 218–222.
- Diplomas in, 218.
- Official List of Department, 47.
- Public Hospitals—
- Admissions and Discharges, 203.
- Ages of Patients, 205.
- Diseases treated in, 205.
- Public Instruction, 239.
- Public Libraries, Subsidies to, 286.
- Public Property, Value of, 829.
- Public Service, 37.
- Classification, 38.
- Members and Officers of Board, 46.
- Members of Appeal Board, 39.
- Members and Officers of Board, 46.
- Superannuation, 658.
- Members and Officers of Board, 46.
- Public Trust Office, 816–817.
- Members of, 55.
- Official List, 55.
- Public Works Co-operative System, 762.
- Public Works Department, Official List, 56.
- Public Works Fund, 697.
- Public Works Tenders Board, 56.
- Puerperal Accidents and Diseases, 181, 215.
- Papapuka Island, 842.
- Pulse exported, 566.
- Punishments by Superior Courts, 312.
- Pupils at Public Schools, 244.
- Purchase of Estates by Government, 507.
- Purchasing-power of Money, 785, 799.
- Qualifications of M.L.C.s, 24.
- Qualifications of M.P.s, 26.
- Quarantine, 219.
- Quarterly Increases of Population, 98.
- Quartz-mining, 606.
- Quinnat Salmon, 600.
- Quorum, House of Representatives, 27.
- Quotations, New Zealand Stock, 730.
- Rabbit-skins, Export of, 389.
- Race Aliens, 104.
- Race Meetings, 329.
- Radio-telegraph, 490.
- Railways, 477–483.
- Official List of Department, 41.
- Members of Board, 42.
- Superannuation Fund, 663.
- Members of Board, 42.
- Rainfall, 76.
- Figures for 1914, 79, 89, 90, 93, 94.
- Graphs, 86.
- Maps, 77, 78.
- Summary of each month, 84.
- Rakaanga Island, 842.
- Rangitaiki Land Drainage Account, 705.
- Rape and Turnips, Acres under, 568.
- Rarotonga Island, 841.
- Rates collected by Local Bodies, 734.
- Rebate of Rent to Crown Tenants, 500.
- Reception of Immigrants, 103.
- Reciprocity, 448.
- With South Africa, 459.
- Reduced Passages for Immigrants, 101.
- Re-exports, 392.
- Reformative Detention, 324.
- Registered Vessels, 466.
- Registrar-General's Office, Official List, 47.
- Registrars, Marriages before, 151.
- Registration—
- Of Barmaids, 349.
- Of Births, 124.
- Of Deaths, 153.
- Of Deeds, 541.
- Of Dentists, 20.
- Of Marriages, 143.
- Of Medical Practitioners, 219.
- Of Nurses and Midwives, 228.
- Of Plumbers, 221.
- Under Defence Act, 288, 289
- Regulations, War, 463.
- Religious Denominations, 31.
- Marriages by Ministers of, 151.
- Ministers on Marriages List, 152.
- Renewable Leases, 498.
- Rents, House-, 775, 797.
- Rents, Rebate of, for Crown Tenants, 500.
- Representation, 331–345.
- Reserve, Defence Forces, 293.
- Reserve Fund Account, 705.
- Reserve Funds of Banks, 668.
- Reserve, National, 294.
- Residence of Crown Tenants, 499.
- Restoration, National, 349.
- Restoration, Voting on, in No-license Districts, 351.
- Restriction, Immigration, 104.
- Retail Prices, 765.
- Retired Judges of Supreme Court, 22, 37.
- Revenue, Customs, 451.
- Revenue, Public, 691–707.
- Revenue, Railway, 480.
- Rifle Association, Dominion, 297.
- Rifle Clubs, 294.
- River Boards, Finances of, 734.
- Rivers, 2.
- Road Boards, Finances of, 734.
- Roads on Goldfields, Subsidized, 622.
- Roll of M.L.C.s, 25.
- Roll of M.P.s, 271.
- Rolling-stock, 477.
- Roman Catholic Church, 32.
- Roman Catholic Schools, 251.
- Root Crops, 568.
- Ruakura Model Apiary, 594.
- Runs, Pastoral, 503.
- Runs, Small-grazing, 502.
- Rye, 567.
- Rye-grass, 571.
- Sale of Food and Drugs, 221.
- Salmon, Acclimatization of, 600.
- Salvation Army, 34.
- Maternity Homes, 228.
- Samoa (German), exports to, 411.
- Sanitation, 218.
- Sausage-skins, 390.
- Savage or Niue Island, 842.
- Trade of, 846.
- Savings-banks, 676–679.
- Scarlet Fever, Deaths from, 175.
- Scenery Preservation—
- Account, 700.
- Board, List of Members and Officers, 52.
- Scheelite, 609.
- Scholarships, 276, 282.
- School Journal, 241.
- School Libraries and Class-books, 241.
- Schools, 242–280.
- Of Mines, 624.
- Science and Art, Board of, 46.
- Scoured Wool exported, 502.
- Seals, 600.
- Seat of Government, 10.
- Secondary Education, 269–280.
- Free, 274.
- Second Ballot repealed, 334.
- Selection of Land, Optional System, 497.
- Senility, Deaths from, 181.
- Senior Cadets, 293.
- Sentences of Criminals, 312.
- Service under Defence Act, 288.
- Settlement, Early, 3.
- Settlement, Lands for, 507.
- Account, 701.
- Settlers, Advances to, 632–636.
- Sexes—
- Of Children born, 132.
- Of Issue of Deceased Males, 165.
- Of Pensions, 650.
- Of Public-school Children, 244.
- Proportions, 110.
- Sheep, 574.
- Sheepskins and Pelts exported, 390.
- Shipping, 466–476.
- Shipwrecked Mariners, Depots for, 476.
- Shrinking Sovereign, the, 785.
- Signatures, Mark, of Persons married, 150.
- Silver, Production of, 609.
- Sinking Funds, 728.
- Skimming-stations, 589.
- Skin-diseases treated in Hospitals, 216
- Slaughter of Animals for Food—
- Cattle, 587.
- Pigs, 590.
- Sheep and Lambs, 577.
- Sleeping Accommodation at Mental Hospitals, 234.
- Sliped Wool exported, 502.
- Sly-grog Selling, 348.
- Small-farm Associations, 494.
- Small Grazing-runs, 502.
- Smallpox Epidemic (1913), 142.
- Snow, 80.
- Soldiers (Discharged) Settlement Act, 513.
- South Africa, Reciprocity with, 459.
- Southland Land District, 534.
- Sovereign, the Shrinking, 785.
- Sovereignty, British, Proclamation of, 8.
- Sown Grasses, Extent of, 570.
- Speakers, House of Representatives, 21
- Speakers, Legislative Council, 21.
- Special Schools, 255–261.
- Special-settlement Associations, 501.
- Specie, Movement of, 362.
- Spinsters and Bachelors in Dominion 146.
- Spirits, Consumption of, 316, 424.
- Staff, Defence Forces, 289.
- Stamp Department, Official List, 40.
- State Advances, 632–644.
- Members of Board, 56.
- Official List of Department, 56.
- State Afforestation, 595–596.
- Official List of Department, 52.
- State Aid to Mining, 622.
- State Aid to Settlers and Workers, 632–644.
- State Aid to Water-power, 627.
- State Coal-mines, 615.
- Account, 700.
- Official List of Department, 45.
- State Employees, 833.
- State Fire Insurance, 689.
- Board, Members of, 56.
- Department, Official List, 55.
- State Forests Account, 700.
- State Instruction, 257–280.
- State Insurance—
- Accident, 687.
- Fire, 689.
- Life, 683.
- Statement of Balances of Accounts, 706.
- Statistical Office, Official List, 47.
- Statistical View of Fifty Years' Progress, 847–857.
- St. Helens Hospitals, 227.
- Still-births, 141.
- Stipendiary Magistrates' Courts—
- Civil Cases, 298.
- Criminal Cases, 306.
- Stock, Character of, 724.
- Stock, Live-, 572–594.
- Stock, Quotations for, 730.
- Stomach, Diseases, of the, treated in Hospitals, 213.
- Stone, Building, and Ornamental, 620.
- Strikes, Summary of, 760.
- Subdivision of Land, Agreements for, 506.
- Subsidies to Public Libraries, 286.
- Subsidized Roads on Goldfields, 622.
- Succession Duty, 713.
- Sugar imported and consumed, 424.
- Sugar, Index Numbers of Prices, 769.
- Suicide, 182.
- Sulphur, 619.
- Summary Convictions, 306.
- Summary of Legislation. 1914, 57–71.
- Sumner School for Deaf, 259.
- Sunshine, 72.
- Superannuation, 657–665.
- Supreme Court—
- Civil Cases, 299.
- Entitled “Honourable,” 37.
- Criminal Cases, 311.
- Entitled “Honourable,” 37.
- Judges, past and present, 22.
- Entitled “Honourable,” 37.
- Surveyors' Board, Members of, 52.
- Survivors at each Age, 189.
- Suwarrow Island, 842.
- Swamp and Bush Lands, Settlement of, 506
- Takutea Island, 842.
- Tallow exported, 389.
- Taranaki Land District, 525.
- Tariff, Customs, 447.
- Preferential, 459.
- Tasman's Discovery of New Zealand, 3.
- Taxation, 708–717.
- Tax, Land and Income, 711.
- Tax on Totalizator Investments, 715.
- Taxpayers, Number of, 712.
- Teachers, Public-school, 244.
- Superannuation Fund, 661.
- Training of, 246.
- Tea imported and consumed, 424.
- Technical Education, 261–268.
- Telegraphic and Postal, 484–492.
- Official List of Department, 40.
- Telephones, 489.
- Temperature, 73.
- At Various Stations, 90–94.
- Tenure of Crown Lands, Exchange of, 501.
- Tenure of Occupied Lands, 551.
- Territorial Forces, 288–297.
- Territorial Force, the, 292.
- Territorial Reserve, the, 293.
- Territorials, Honorary, 293.
- Thermometer, Cost of Living, 800.
- Thrombosis, Deaths from, 180.
- Thunderstorms, 81.
- Timber—
- Export of, 392.
- Principal Trees, 595.
- Tin, 613.
- Tobacco-culture, 569
- Tobacco imported and consumed, 424.
- Customs and Excise Revenue from, 453.
- Tomato-culture, 570.
- Tongareva Island, 842.
- Tonnage of Vessels entered and cleared, 467–472.
- Tonsils, Hospital Cases, 212.
- Totalizator, 329.
- Taxation, 715.
- Total Trade, 354–367.
- Tourist Department, Official List, 54.
- Tow, 569.
- Town Districts—
- Finances of, 734.
- Population of, 119.
- Receipts from Government, 735.
- Value of Land and Improvements, 756.
- Trade, 354–465.
- Trade Commissioners, 30.
- Trade Correspondents, Imperial, 30.
- Trade-marks, 829.
- Training of Defence Forces, 295.
- Train-miles run, 478.
- Tramway Boards, Finances of, 734.
- Transfers, &c., of Crown Leases, 500.
- Transfers under Land Transfer Act, 541, 544.
- Treasury Bills Account, 700.
- Treasury Department Official List, 39.
- Treaty of Waitangi, 6.
- Tree-planting by Prisoners, 325.
- Trout, Acclimatization of, 600.
- Tuberculosis, 176, 206.
- Turnips, 568.
- Twins and Triplets born, 134.
- Ages of Parents, 134.
- Typhlitis, Deaths from, 181.
- Typhoid-fever, Deaths from, 175.
- Undeveloped Water-power, 628.
- Uniforms of Defence Forces, 296.
- Unimproved Value of Land, 744–757.
- Unions Registered, 759.
- United States, Imports from, 444, 460.
- University of New Zealand, 281.
- Scholarships and Bursaries, 282.
- Urinary System, Diseases of the, treated in Hospitals, 214.
- Vaccination, 142.
- Valuation of Land, 743, 757.
- Official List of Department, 40.
- Value of Exports affected by Prices, 393.
- Vancouver's Visit, 4.
- Venereal Diseases, Hospital Cases, 208.
- Vessels entered and cleared, 467, 470.
- Nationality of, 467.
- Vessels registered, 466.
- Village Settlements, 495, 501.
- Vineyards, 570
- Violence, Deaths from, 181.
- Hospital cases, 216.
- Visits of Explorers, 3.
- Vital Statistics, 124–217.
- Voluntary Inmates of Mental Hospitals, 232.
- Voting Acts, Expeditionary Forces, 334.
- Voting at General Elections, 343.
- Election of 1914, 336.
- Voting at Local Option Polls, 349.
- Poll of 1914, 349.
- Wages and Prices, 765.
- Waipori Power-supply, 626.
- Waitangi, Treaty of, 6.
- Wakari Private Mental Hospital, 234.
- War Expenses Account, 703.
- War Legislation, 57.
- War Organization of Defence Forces, 291.
- War Pensions, 653–657.
- War Regulations, 463.
- War Taxation, 709.
- Washed Wool exported, 502.
- Water-power, 625–628.
- Water-races, 623.
- Water-supply—
- Boards, Finances of, 734.
- Wealth, Private and Public, 821.
- Weather, 83.
- During 1914, 84.
- Weekly Budgets (1891–1914), 788.
- Weekly Rents, Average, 808.
- Wellington Fish-market, 601.
- Wellington, Foundation of, 6.
- Wellington Land District, 526.
- Westland Land District, 529.
- Whaling, 600.
- Wheat, 563.
- Export of, 390, 563.
- Prices, 812.
- Whitefish Ova imported, 600.
- White Island Sulphur, 619.
- Wholesale Prices, 808.
- Whooping-cough, Deaths from, 175.
- Widows left by Married Men, 1914, 167.
- Widows' Pensions, 650.
- Wind-roses, 82.
- Winds, 81.
- Wine, Consumption of, 316, 424.
- Wireless Telegraphy, 490.
- Women, Deaths of, in Childbirth, 181.
- Women's Branch, Labour Department, 764.
- Women's Franchise, 332.
- Wood-pulp Industry, 505.
- Wool, 580.
- Exported, 388, 405, 580.
- Used at Local Mills, 581.
- Woollen-mills, Wool used at, 581.
- Wool Sales, Dunedin, Prices at, 585.
- Workers, Advances to, 636–639.
- Workers' Dwellings, 513, 641–644.
- Account, 705.
- Board, Members of, 51.
- Workers' Educational Association, 284.
- World's Coal-production, 616.
- World's Gold-production, 609.
- World's Sheep-flocks, 580.
- World's Wheat-crop, 566.
- Yields of Crops, 562.